UNITED STATES
SECURITIES AND EXCHANGE COMMISSION
Washington, D.C. 20549
FORM N-CSR
CERTIFIED SHAREHOLDER REPORT OF REGISTERED
MANAGEMENT INVESTMENT COMPANIES
|
| | | | | | |
| Investment Company Act file number | 811-07820 |
| | |
| AMERICAN CENTURY CAPITAL PORTFOLIOS, INC. |
| (Exact name of registrant as specified in charter) |
| | |
| 4500 MAIN STREET, KANSAS CITY, MISSOURI | 64111 |
| (Address of principal executive offices) | (Zip Code) |
| | |
CHARLES A. ETHERINGTON 4500 MAIN STREET, KANSAS CITY, MISSOURI 64111 |
| (Name and address of agent for service) |
| | |
| Registrant’s telephone number, including area code: | 816-531-5575 |
| | |
| Date of fiscal year end: | 10-31 |
| | |
| Date of reporting period: | 10-31-2016 |
ITEM 1. REPORTS TO STOCKHOLDERS.
|
| |
| ANNUAL REPORT | |
| OCTOBER 31, 2016 |
| |
AC Alternatives® Income Fund
|
| | |
| President’s Letter | 2 |
|
| Performance | 3 |
|
| Portfolio Commentary | |
|
| Fund Characteristics | |
|
| Shareholder Fee Example | |
|
| Schedule of Investments | |
|
| Statement of Assets and Liabilities | |
|
| Statement of Operations | |
|
| Statement of Changes in Net Assets | |
|
| Notes to Financial Statements | |
|
| Financial Highlights | |
|
| Report of Independent Registered Public Accounting Firm | |
|
| Management | |
|
| Approval of Management and Subadvisory Agreements | |
|
| Additional Information | |
|
Any opinions expressed in this report reflect those of the author as of the date of the report, and do not necessarily represent the opinions of American Century Investments® or any other person in the American Century Investments organization. Any such opinions are subject to change at any time based upon market or other conditions and American Century Investments disclaims any responsibility to update such opinions. These opinions may not be relied upon as investment advice and, because investment decisions made by American Century Investments funds are based on numerous factors, may not be relied upon as an indication of trading intent on behalf of any American Century Investments fund. Security examples are used for representational purposes only and are not intended as recommendations to purchase or sell securities. Performance information for comparative indices and securities is provided to American Century Investments by third party vendors. To the best of American Century Investments’ knowledge, such information is accurate at the time of printing.
 Jonathan Thomas
Dear Investor:
Thank you for reviewing this annual report for the period ended October 31, 2016. It provides investment performance and portfolio information, plus longer-term historical performance data. Annual reports help convey important information about fund returns, including market factors that affected performance during the reporting period. For additional, updated investment and market insights, we encourage you to visit our website, americancentury.com.
Central Bank Stimulus Boosted the Markets After Big Bouts of Volatility
The mostly positive returns for the full reporting period do not capture the short-term market volatility investors experienced at various times. Most broad stock and bond benchmarks posted gains, despite an interest rate increase by the Federal Reserve (Fed) in December 2015, extreme market volatility in early 2016 from global contagion concerns about China’s economic deceleration and currency devaluations, and more turmoil in June 2016 triggered by the unexpected U.K. vote to exit the European Union (Brexit).
Each big bout of financial market volatility was followed by another shot of monetary policy stimulus from central banks. Or, in the case of the Fed, delays in further interest rate increases. This stabilized the financial markets, and generally boosted their performance. The rising tide of monetary stimulus lifted most investment boats, including both stock and bond vehicles, which was unusual. Illustrating this phenomenon, the S&P 500 Index and the Bloomberg Barclays U.S. Aggregate Bond Index posted nearly equal performance, advancing 4.51% and 4.37%, respectively, for the 12 months. Global bond and real estate investment trust (REIT) indices exceeded that performance, while U.S. growth stock indices lagged; U.S. value equity generally outperformed U.S. growth.
The reporting period ended before the November 2016 U.S. presidential election, which, like Brexit, featured a surprising outcome with potentially far-reaching populist and anti-globalization ramifications that are still unfolding and being assessed. What we do know is that Donald Trump and his policy proposals face a deeply divided nation and add another layer of uncertainty to the global economic and market outlook, which could trigger further bouts of short-term volatility. In this challenging investment environment, we strongly believe in staying the course and remaining focused on longer-term goals, using disciplined, actively managed, diversified, risk-aware strategies. We appreciate your continued trust in us.
Sincerely,
Jonathan Thomas
President and Chief Executive Officer
American Century Investments
|
| | | | |
| Total Returns as of October 31, 2016 |
| | | | Average Annual Returns | |
| | Ticker Symbol | 1 year | Since Inception | Inception
Date |
| Investor Class | ALNNX | 3.03% | 0.41% | 7/31/15 |
| HFRX Fixed Income - Credit Index | — | 0.07% | -1.46% | — |
| Blended Index | — | 4.95% | 4.03% | — |
| Bloomberg Barclays U.S. Universal Bond Index | — | 5.07% | 4.37% | — |
| S&P 500 Index | — | 4.51% | 3.06% | — |
| Institutional Class | ALNIX | 3.19% | 0.62% | 7/31/15 |
| A Class | ALNAX | | | 7/31/15 |
| No sales charge | | 2.80% | 0.23% | |
| With sales charge | | -3.16% | -4.39% | |
| C Class | ALNHX | 2.03% | -0.53% | 7/31/15 |
| R Class | ALNRX | 2.50% | -0.08% | 7/31/15 |
| R6 Class | ALNDX | 3.39% | 0.78% | 7/31/15 |
Although the fund commenced operations on May 29, 2015, the performance inception date reflects the date the fund began investing in accordance with its investment strategy.
Effective January 2016, the fund’s benchmark changed from a blended index (represented by 60% of the Bloomberg Barclays U.S. Universal Bond Index and 40% of the S&P 500 Index) to the HFRX Fixed Income - Credit Index. The fund’s investment advisor believes that the HFRX Fixed Income - Credit Index is more reflective of the fund’s strategy.
Fund returns would have been lower if a portion of the fees had not been waived.
Sales charges include initial sales charges and contingent deferred sales charges (CDSCs), as applicable. A Class shares have a 5.75% maximum initial sales charge and may be subject to a maximum CDSC of 1.00%. C Class shares redeemed within 12 months of purchase are subject to a maximum CDSC of 1.00%. The SEC requires that mutual funds provide performance information net of maximum sales charges in all cases where charges could be applied.
Data presented reflect past performance. Past performance is no guarantee of future results. Current performance may be higher or lower than the performance shown. Total returns for periods less than one year are not annualized. Investment return and principal value will fluctuate, and redemption value may be more or less than original cost. Data assumes reinvestment of dividends and capital gains, and none of the charts reflect the deduction of taxes that a shareholder would pay on fund distributions or the redemption of fund shares. To obtain performance data current to the most recent month end, please call 1-800-345-2021 or visit americancentury.com. For additional information about the fund, please consult the prospectus.
|
|
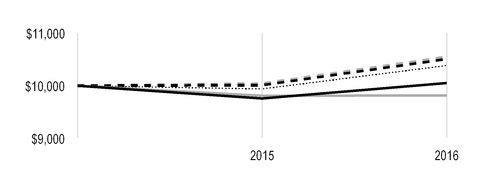
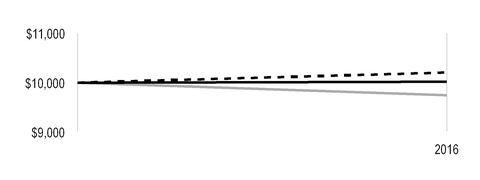
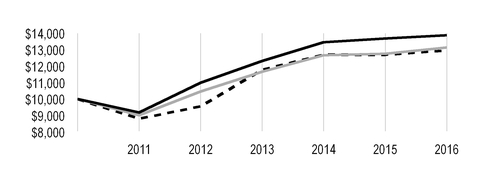
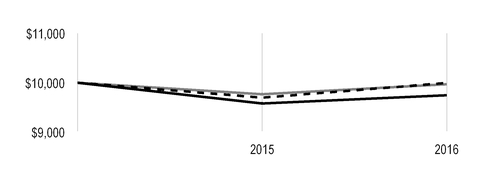
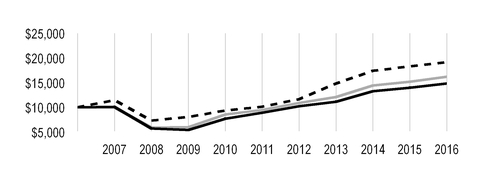
| Growth of $10,000 Over Life of Class |
| $10,000 investment made July 31, 2015 |
| Performance for other share classes will vary due to differences in fee structure. |
|
| |
| Value on October 31, 2016 |
| | Investor Class — $10,052 |
| |
| | HFRX Fixed Income - Credit Index — $9,817 |
| |
| | Blended Index — $10,508 |
| |
| | Bloomberg Barclays U.S. Universal Bond Index — $10,551 |
| |
| | S&P 500 Index — $10,385 |
| |
Ending value of Investor Class would have been lower if a portion of the fees had not been waived.
|
| | | | | |
| Total Annual Fund Operating Expenses |
| Investor Class | Institutional Class | A Class | C Class | R Class | R6 Class |
| 2.07% | 1.87% | 2.32% | 3.07% | 2.57% | 1.72% |
The total annual fund operating expenses shown is as stated in the fund’s prospectus current as of the date of this report. The prospectus may vary from the expense ratio shown elsewhere in this report because it is based on a different time period, includes acquired fund fees and expenses, and, if applicable, does not include fee waivers or expense reimbursements.
Data presented reflect past performance. Past performance is no guarantee of future results. Current performance may be higher or lower than the performance shown. Total returns for periods less than one year are not annualized. Investment return and principal value will fluctuate, and redemption value may be more or less than original cost. Data assumes reinvestment of dividends and capital gains, and none of the charts reflect the deduction of taxes that a shareholder would pay on fund distributions or the redemption of fund shares. To obtain performance data current to the most recent month end, please call 1-800-345-2021 or visit americancentury.com. For additional information about the fund, please consult the prospectus.
Subadvisor: Perella Weinberg Partners Capital Management LP
Portfolio Managers: Chris Bittman, Kent Muckel and Darren Myers
Performance Summary
For the fiscal year ended October 31, 2016, the AC Alternatives Income Fund generated a return of 3.03%.* This compares to a return of 0.07% for the HFRX Fixed Income - Credit Index, 5.07% for the Bloomberg Barclays U.S. Universal Bond Index, and 4.51% for the S&P 500 Index during this same period of time.
Performance Review
The market environment over the last 12 months was filled with challenges leading to sharp declines in certain asset classes in the early part of the period, later followed by equally sharp rallies in other asset classes. The bottom in most markets came in mid-February as the price of oil bottomed and began to recover. This helped to alleviate concerns over a deteriorating economy and potential credit losses stemming from the oil, gas, and consumable fuels sector.
The fund’s allocation to below investment-grade credit, both high-yield bonds and bank loans, was a primary driver of performance during the period. After the asset class underperformed equities in 2015, we believed that it exhibited an attractive risk/reward trade-off, and that view was rewarded. By way of example, the Bloomberg Barclays U.S. Corporate High-Yield Bond Index returned 10.14% during the 12-month period but 15.56% of this return has come during the 2016 calendar year. Other areas of the credit market benefited the fund as well, as securitized credit allocations recovered from weakness in the early months of 2016. The fund’s allocation to high-dividend-paying equities was another strong performer during the period, benefiting from investor flows amidst a low interest-rate environment and the relative safety of high-income equities in an uncertain market environment.
The primary detractor from fund returns during the period was the modest allocation to master limited partnerships (MLPs). The volatility in the sector was elevated over the last 12 months as the Alerian MLP Index declined -38.37% at its February lows only to rally back 59.52% by July. The asset class has since moved in tandem with oil prices to close out the period.
Asset allocation in the fund has turned somewhat more conservative recently, with higher cash balances. This seems prudent to us, given the elevated valuations across many asset classes and a likely increase in near-term downside risks due to the election cycles across the globe. We continue to prefer credit over equities given the better potential for credit returns and are favoring more floating rate assets and lower volatility income sources. We do not foresee a great degree of risk in the corporate credit markets given the cushion provided to investors by coupon payments, but acknowledge that balance sheet fundamentals are not improving and corporate leverage is at peak levels. We believe the fund is positioned for coupon-like returns for the remainder of the year and focused on security level valuations versus market beta. The structured credit market continues to offer good relative value opportunities, in our view, given the non-homogenous (i.e., varied) nature of the securities in the market. The fund continues to traffic in more niche markets requiring nimble capital and deep analysis.
*All fund returns referenced in this commentary are for Investor Class shares. Fund returns would have been lower if a portion of the fees had not been waived. Performance for other share classes will vary due to differences in fee structure; when Investor Class performance exceeds that of the fund's benchmark, other share classes may not. See page 3 for returns for all share classes.
We are currently wary of valuations in certain “bond proxy” equities, where valuations appear rich and fund flows have turned negative. We do believe that global financials can continue to perform well should interest rates trend toward levels seen at the beginning of the year. Lastly, and because cross-asset class diversification has become more difficult, the ability to position portfolios for volatility spikes and uncovering relative value opportunities is critical.
|
| |
| OCTOBER 31, 2016 | |
| Types of Investments in Portfolio | % of net assets |
| Corporate Bonds | 14.9% |
| Bank Loan Obligations | 11.4% |
| Asset-Backed Securities | 11.3% |
| Common Stocks | 9.6% |
| Exchange-Traded Funds | 9.1% |
| Collateralized Loan Obligations | 7.4% |
| Commercial Mortgage-Backed Securities | 6.3% |
| Collateralized Mortgage Obligations | 3.4% |
| U.S. Treasury Securities | 2.7% |
| Exchange-Traded Notes | 2.5% |
| Purchased Options Contracts | —* |
| Corporate Bonds Sold Short | (0.2)% |
| Temporary Cash Investments | 24.6% |
| Other Assets and Liabilities | (3.0)% |
*Category is less than 0.05% of total net assets.
Fund shareholders may incur two types of costs: (1) transaction costs, including sales charges (loads) on purchase payments and redemption/exchange fees; and (2) ongoing costs, including management fees; distribution and service (12b-1) fees; and other fund expenses. This example is intended to help you understand your ongoing costs (in dollars) of investing in your fund and to compare these costs with the ongoing cost of investing in other mutual funds.
The example is based on an investment of $1,000 made at the beginning of the period and held for the entire period from May 1, 2016 to October 31, 2016.
Actual Expenses
The table provides information about actual account values and actual expenses for each class. You may use the information, together with the amount you invested, to estimate the expenses that you paid over the period. First, identify the share class you own. Then simply divide your account value by $1,000 (for example, an $8,600 account value divided by $1,000 = 8.6), then multiply the result by the number under the heading “Expenses Paid During Period” to estimate the expenses you paid on your account during this period.
If you hold Investor Class shares of any American Century Investments fund, or Institutional Class shares of the American Century Diversified Bond Fund, in an American Century Investments account (i.e., not a financial intermediary or retirement plan account), American Century Investments may charge you a $12.50 semiannual account maintenance fee if the value of those shares is less than $10,000. We will redeem shares automatically in one of your accounts to pay the $12.50 fee. In determining your total eligible investment amount, we will include your investments in all personal accounts (including American Century Investments Brokerage accounts) registered under your Social Security number. Personal accounts include individual accounts, joint accounts, UGMA/UTMA accounts, personal trusts, Coverdell Education Savings Accounts and IRAs (including traditional, Roth, Rollover, SEP-, SARSEP- and SIMPLE-IRAs), and certain other retirement accounts. If you have only business, business retirement, employer-sponsored or American Century Investments Brokerage accounts, you are currently not subject to this fee. If you are subject to the Account Maintenance Fee, your account value could be reduced by the fee amount.
Hypothetical Example for Comparison Purposes
The table also provides information about hypothetical account values and hypothetical expenses based on the actual expense ratio of each class of your fund and an assumed rate of return of 5% per year before expenses, which is not the actual return of a fund’s share class. The hypothetical account values and expenses may not be used to estimate the actual ending account balance or expenses you paid for the period. You may use this information to compare the ongoing costs of investing in your fund and other funds. To do so, compare this 5% hypothetical example with the 5% hypothetical examples that appear in the shareholder reports of the other funds.
Please note that the expenses shown in the table are meant to highlight your ongoing costs only and do not reflect any transactional costs, such as sales charges (loads) or redemption/exchange fees. Therefore, the table is useful in comparing ongoing costs only, and will not help you determine the relative total costs of owning different funds. In addition, if these transactional costs were included, your costs would have been higher.
|
| | | | |
| Beginning
Account Value
5/1/16 | Ending
Account Value
10/31/16 | Expenses Paid
During Period(1)
5/1/16 - 10/31/16 |
Annualized
Expense Ratio(1) |
| Actual | | | | |
| Investor Class (after waiver) | $1,000 | $1,039.50 | $10.20 | 1.99% |
| Investor Class (before waiver) | $1,000 | $1,039.50(2) | $10.30 | 2.01% |
| Institutional Class (after waiver) | $1,000 | $1,039.90 | $9.18 | 1.79% |
| Institutional Class (before waiver) | $1,000 | $1,039.90(2) | $9.28 | 1.81% |
| A Class (after waiver) | $1,000 | $1,037.70 | $11.47 | 2.24% |
| A Class (before waiver) | $1,000 | $1,037.70(2) | $11.58 | 2.26% |
| C Class (after waiver) | $1,000 | $1,034.30 | $15.29 | 2.99% |
| C Class (before waiver) | $1,000 | $1,034.30(2) | $15.39 | 3.01% |
| R Class (after waiver) | $1,000 | $1,036.90 | $12.75 | 2.49% |
| R Class (before waiver) | $1,000 | $1,036.90(2) | $12.85 | 2.51% |
| R6 Class (after waiver) | $1,000 | $1,040.00 | $8.41 | 1.64% |
| R6 Class (before waiver) | $1,000 | $1,040.00(2) | $8.51 | 1.66% |
| Hypothetical | | | | |
| Investor Class (after waiver) | $1,000 | $1,015.13 | $10.08 | 1.99% |
| Investor Class (before waiver) | $1,000 | $1,015.03 | $10.18 | 2.01% |
| Institutional Class (after waiver) | $1,000 | $1,016.14 | $9.07 | 1.79% |
| Institutional Class (before waiver) | $1,000 | $1,016.04 | $9.17 | 1.81% |
| A Class (after waiver) | $1,000 | $1,013.88 | $11.34 | 2.24% |
| A Class (before waiver) | $1,000 | $1,013.78 | $11.44 | 2.26% |
| C Class (after waiver) | $1,000 | $1,010.11 | $15.11 | 2.99% |
| C Class (before waiver) | $1,000 | $1,010.00 | $15.21 | 3.01% |
| R Class (after waiver) | $1,000 | $1,012.62 | $12.60 | 2.49% |
| R Class (before waiver) | $1,000 | $1,012.52 | $12.70 | 2.51% |
| R6 Class (after waiver) | $1,000 | $1,016.89 | $8.31 | 1.64% |
| R6 Class (before waiver) | $1,000 | $1,016.79 | $8.42 | 1.66% |
| |
| (1) | Expenses are equal to the class's annualized expense ratio listed in the table above, multiplied by the average account value over the period, multiplied by 184, the number of days in the most recent fiscal half-year, divided by 366, to reflect the one-half year period. |
| |
| (2) | Ending account value assumes the return earned after waiver and would have been lower if a portion of the fees had not been waived. |
OCTOBER 31, 2016
|
| | | | | | | |
| | | Principal Amount/ Shares | Value |
| CORPORATE BONDS — 14.9% | | | |
| Aerospace and Defense — 0.1% | | | |
StandardAero Aviation Holdings, Inc., 10.00%, 7/15/23(1) | | $ | 63,000 |
| $ | 67,095 |
|
| Airlines — 0.5% | | | |
Intrepid Aviation Group Holdings LLC / Intrepid Finance Co., 6.875%, 2/15/19(1) | | 500,000 |
| 455,000 |
|
| Auto Components — 0.2% | | | |
Allison Transmission, Inc., 5.00%, 10/1/24(1) | | 69,000 |
| 70,553 |
|
| Goodyear Tire & Rubber Co. (The), 5.125%, 11/15/23 | | 106,000 |
| 109,975 |
|
| Goodyear Tire & Rubber Co. (The), 5.00%, 5/31/26 | | 20,000 |
| 20,150 |
|
| | | | 200,678 |
|
| Chemicals — 0.7% | | | |
TPC Group, Inc., 8.75%, 12/15/20(1) | | 750,000 |
| 624,375 |
|
| Commercial Services and Supplies — 0.3% | | | |
| ADT Corp. (The), 3.50%, 7/15/22 | | 47,000 |
| 44,744 |
|
Advanced Disposal Services, Inc., 5.625%, 11/15/24(1)(2) | | 45,000 |
| 45,338 |
|
Live Nation Entertainment, Inc., 4.875%, 11/1/24(1) | | 57,000 |
| 57,000 |
|
Prime Security Services Borrower LLC / Prime Finance, Inc., 9.25%, 5/15/23(1) | | 78,000 |
| 82,906 |
|
| | | | 229,988 |
|
| Communications Equipment — 0.4% | | | |
| Zayo Group LLC / Zayo Capital, Inc., 6.00%, 4/1/23 | | 172,000 |
| 181,675 |
|
| Zayo Group LLC / Zayo Capital, Inc., 6.375%, 5/15/25 | | 135,000 |
| 142,425 |
|
| | | | 324,100 |
|
| Construction and Engineering — 0.2% | | | |
| SBA Communications Corp., 4.875%, 7/15/22 | | 126,000 |
| 128,218 |
|
SBA Communications Corp., 4.875%, 9/1/24(1) | | 62,000 |
| 62,232 |
|
| | | | 190,450 |
|
| Construction Materials — 0.3% | | | |
Standard Industries, Inc., 6.00%, 10/15/25(1) | | 44,000 |
| 47,188 |
|
USG Corp., 5.50%, 3/1/25(1) | | 48,000 |
| 51,300 |
|
| Vulcan Materials Co., 4.50%, 4/1/25 | | 126,000 |
| 135,922 |
|
| | | | 234,410 |
|
| Consumer Finance — 0.4% | | | |
| CIT Group, Inc., 5.00%, 8/15/22 | | 200,000 |
| 214,556 |
|
| GLP Capital LP / GLP Financing II, Inc., 4.375%, 4/15/21 | | 23,000 |
| 24,265 |
|
| GLP Capital LP / GLP Financing II, Inc., 5.375%, 4/15/26 | | 115,000 |
| 122,187 |
|
| | | | 361,008 |
|
| Consumer Staples — 0.4% | | | |
Kronos Acquisition Holdings, Inc., 9.00%, 8/15/23(1) | | 182,000 |
| 187,460 |
|
Sabre GLBL, Inc., 5.375%, 4/15/23(1) | | 73,000 |
| 75,282 |
|
Sabre GLBL, Inc., 5.25%, 11/15/23(1) | | 53,000 |
| 54,656 |
|
| | | | 317,398 |
|
|
| | | | | | | |
| | | Principal Amount/ Shares | Value |
| Containers and Packaging — 0.5% | | | |
| Ball Corp., 5.25%, 7/1/25 | | $ | 119,000 |
| $ | 127,181 |
|
| Berry Plastics Corp., 5.50%, 5/15/22 | | 89,000 |
| 93,005 |
|
BWAY Holding Co., 9.125%, 8/15/21(1) | | 50,000 |
| 52,500 |
|
Crown Americas LLC / Crown Americas Capital Corp. V, 4.25%, 9/30/26(1) | | 49,000 |
| 48,081 |
|
Sealed Air Corp., 5.125%, 12/1/24(1) | | 126,000 |
| 134,190 |
|
| | | | 454,957 |
|
| Diversified Financial Services — 0.2% | | | |
| Ally Financial, Inc., 4.25%, 4/15/21 | | 106,000 |
| 107,192 |
|
| Ally Financial, Inc., 4.125%, 2/13/22 | | 33,000 |
| 33,093 |
|
| Ally Financial, Inc., 5.125%, 9/30/24 | | 30,000 |
| 31,500 |
|
| | | | 171,785 |
|
| Diversified Telecommunication Services — 1.0% | | | |
Inmarsat Finance plc, 4.875%, 5/15/22(1) | | 210,000 |
| 199,101 |
|
Intelsat Jackson Holdings SA, 9.50%, 9/30/22(1) | | 176,000 |
| 196,240 |
|
Intelsat Jackson Holdings SA, 8.00%, 2/15/24(1) | | 38,000 |
| 38,684 |
|
| Level 3 Financing, Inc., 5.625%, 2/1/23 | | 400,000 |
| 412,000 |
|
| | | | 846,025 |
|
| Electronic Equipment, Instruments and Components — 0.2% | | |
WESCO Distribution, Inc., 5.375%, 6/15/24(1) | | 163,000 |
| 165,282 |
|
| Energy Equipment and Services — 0.1% | | | |
CHC Helicopter SA, 9.25%, 10/15/20(3)(4) | | 252,000 |
| 125,370 |
|
| Equity Real Estate Investment Trusts (REITs) — 0.1% | | | |
MGM Growth Properties Operating Partnership LP / MGP Finance Co-Issuer, Inc., 4.50%, 9/1/26(1) | | 66,000 |
| 64,907 |
|
| Financial Services — 0.1% | | | |
Iron Mountain, Inc., 4.375%, 6/1/21(1) | | 76,000 |
| 78,660 |
|
| Food and Staples Retailing — 0.4% | | | |
| Aramark Services, Inc., 5.125%, 1/15/24 | | 301,000 |
| 316,050 |
|
| Food Products — 0.7% | | | |
Pinnacle Foods Finance LLC / Pinnacle Foods Finance Corp., 4.875%, 5/1/21(5) | | 400,000 |
| 413,000 |
|
Post Holdings, Inc., 5.00%, 8/15/26(1) | | 141,000 |
| 137,122 |
|
TreeHouse Foods, Inc., 6.00%, 2/15/24(1) | | 84,000 |
| 90,636 |
|
| | | | 640,758 |
|
| Health Care Providers and Services — 1.3% | | | |
Covenant Surgical Partners, Inc., 8.75%, 8/1/19(1) | | 400,000 |
| 392,000 |
|
| DaVita, Inc., 5.125%, 7/15/24 | | 125,000 |
| 122,109 |
|
| HCA, Inc., 5.375%, 2/1/25 | | 250,000 |
| 255,875 |
|
| HCA, Inc., 4.50%, 2/15/27 | | 75,000 |
| 74,250 |
|
Universal Health Services, Inc., 4.75%, 8/1/22(1) | | 28,000 |
| 28,826 |
|
Universal Health Services, Inc., 5.00%, 6/1/26(1) | | 278,000 |
| 289,120 |
|
| | | | 1,162,180 |
|
| Hotels, Restaurants and Leisure — 0.8% | | | |
1011778 BC ULC / New Red Finance, Inc., 4.625%, 1/15/22(1) | | 300,000 |
| 310,500 |
|
|
| | | | | | | |
| | | Principal Amount/ Shares | Value |
| Cedar Fair LP / Canada's Wonderland Co. / Magnum Management Corp., 5.375%, 6/1/24 | | $ | 56,000 |
| $ | 59,360 |
|
Hilton Domestic Operating Co., Inc., 4.25%, 9/1/24(1) | | 91,000 |
| 91,682 |
|
KFC Holding Co. / Pizza Hut Holdings LLC / Taco Bell of America LLC, 5.00%, 6/1/24(1) | | 20,000 |
| 20,600 |
|
KFC Holding Co. / Pizza Hut Holdings LLC / Taco Bell of America LLC, 5.25%, 6/1/26(1) | | 97,000 |
| 101,365 |
|
Six Flags Entertainment Corp., 4.875%, 7/31/24(1) | | 134,000 |
| 134,670 |
|
| | | | 718,177 |
|
| Household Durables — 0.2% | | | |
| Lennar Corp., 4.875%, 12/15/23 | | 63,000 |
| 65,048 |
|
| Tempur Sealy International, Inc., 5.50%, 6/15/26 | | 61,000 |
| 62,983 |
|
| Toll Brothers Finance Corp., 5.625%, 1/15/24 | | 63,000 |
| 66,937 |
|
| | | | 194,968 |
|
| Industrial Conglomerates — 0.2% | | | |
Gates Global LLC / Gates Global Co., 6.00%, 7/15/22(1) | | 213,000 |
| 202,350 |
|
| Insurance — 0.5% | | | |
| AerCap Ireland Capital Ltd. / AerCap Global Aviation Trust, 4.625%, 10/30/20 | | 27,000 |
| 28,485 |
|
| AerCap Ireland Capital Ltd. / AerCap Global Aviation Trust, 5.00%, 10/1/21 | | 250,000 |
| 266,250 |
|
| Aircastle Ltd., 5.50%, 2/15/22 | | 125,000 |
| 134,687 |
|
| | | | 429,422 |
|
| Machinery — 0.1% | | | |
Huntington Ingalls Industries, Inc., 5.00%, 12/15/21(1) | | 29,000 |
| 30,486 |
|
Huntington Ingalls Industries, Inc., 5.00%, 11/15/25(1) | | 102,000 |
| 107,547 |
|
| | | | 138,033 |
|
| Media — 2.7% | | | |
AMC Entertainment Holdings, Inc., 5.875%, 11/15/26(1)(2) | | 22,000 |
| 22,220 |
|
| AMC Entertainment Holdings, Inc., 5.75%, 6/15/25 | | 60,000 |
| 60,375 |
|
| CCO Holdings LLC / CCO Holdings Capital Corp., 5.75%, 1/15/24 | | 387,000 |
| 410,220 |
|
CCO Holdings LLC / CCO Holdings Capital Corp., 5.75%, 2/15/26(1) | | 226,000 |
| 236,029 |
|
| Lamar Media Corp., 5.75%, 2/1/26 | | 131,000 |
| 140,746 |
|
| National CineMedia LLC, 6.00%, 4/15/22 | | 250,000 |
| 261,250 |
|
National CineMedia LLC, 5.75%, 8/15/26(1) | | 33,000 |
| 34,073 |
|
Nielsen Finance LLC / Nielsen Finance Co., 5.00%, 4/15/22(1) | | 94,000 |
| 96,085 |
|
| Regal Entertainment Group, 5.75%, 6/15/23 | | 13,000 |
| 13,423 |
|
| Regal Entertainment Group, 5.75%, 2/1/25 | | 65,000 |
| 65,650 |
|
Sirius XM Radio, Inc., 6.00%, 7/15/24(1) | | 59,000 |
| 62,761 |
|
Sirius XM Radio, Inc., 5.375%, 7/15/26(1) | | 80,000 |
| 81,475 |
|
Unison Ground Lease Funding LLC, 6.27%, 3/15/43(1) | | 171,000 |
| 159,870 |
|
| Unitymedia GmbH, 3.75%, 1/15/27 | EUR | 250,000 |
| 262,100 |
|
Unitymedia Hessen GmbH & Co. KG / Unitymedia NRW GmbH, 5.00%, 1/15/25(1) | | $ | 101,000 |
| 102,894 |
|
Univision Communications, Inc., 6.75%, 9/15/22(1) | | 50,000 |
| 52,877 |
|
Univision Communications, Inc., 5.125%, 5/15/23(1) | | 40,000 |
| 40,800 |
|
|
| | | | | | | |
| | | Principal Amount/ Shares | Value |
Univision Communications, Inc., 5.125%, 2/15/25(1) | | $ | 250,000 |
| $ | 251,562 |
|
| | | | 2,354,410 |
|
| Metals and Mining — 0.2% | | | |
Compass Minerals International, Inc., 4.875%, 7/15/24(1) | | 48,000 |
| 45,900 |
|
| Constellium NV, MTN, 4.625%, 5/15/21 | EUR | 125,000 |
| 125,089 |
|
| | | | 170,989 |
|
| Multiline Retail — 0.1% | | | |
JC Penney Corp., Inc., 5.875%, 7/1/23(1) | | $ | 49,000 |
| 50,544 |
|
| Oil, Gas and Consumable Fuels — 0.5% | | | |
| Alta Mesa Holdings LP / Alta Mesa Finance Services Corp., 9.625%, 10/15/18 | | 98,000 |
| 92,855 |
|
Diamondback Energy, Inc., 4.75%, 11/1/24(1) | | 50,000 |
| 50,063 |
|
Gulfport Energy Corp., 6.00%, 10/15/24(1) | | 70,000 |
| 71,312 |
|
Talos Production LLC / Talos Production Finance, Inc., 9.75%, 2/15/18(1) | | 500,000 |
| 250,625 |
|
| | | | 464,855 |
|
| Pharmaceuticals — 0.1% | | | |
| Valeant Pharmaceuticals International, Inc., 4.50%, 5/15/23 | EUR | 100,000 |
| 84,727 |
|
| Semiconductors and Semiconductor Equipment — 0.1% | | |
NXP BV / NXP Funding LLC, 4.625%, 6/1/23(1) | | $ | 60,000 |
| 65,850 |
|
| Software — 0.2% | | | |
Inception Merger Sub, Inc. / Rackspace Hosting, Inc., 8.625%, 11/15/24(1)(2) | | 63,000 |
| 63,236 |
|
Sophia LP / Sophia Finance, Inc., 9.00%, 9/30/23(1) | | 94,000 |
| 99,170 |
|
| | | | 162,406 |
|
| Specialty Retail — 0.1% | | | |
| Sally Holdings LLC / Sally Capital, Inc., 5.625%, 12/1/25 | | 127,000 |
| 136,208 |
|
| Technology Hardware, Storage and Peripherals — 0.1% | | | |
Diamond 1 Finance Corp. / Diamond 2 Finance Corp., 5.875%, 6/15/21(1) | | 15,000 |
| 15,744 |
|
Diamond 1 Finance Corp. / Diamond 2 Finance Corp., 6.02%, 6/15/26(1) | | 63,000 |
| 68,770 |
|
| | | | 84,514 |
|
| Textiles, Apparel and Luxury Goods — 0.3% | | | |
Hanesbrands, Inc., 4.875%, 5/15/26(1) | | 100,000 |
| 102,250 |
|
| L Brands, Inc., 5.625%, 2/15/22 | | 63,000 |
| 69,064 |
|
| PVH Corp., 4.50%, 12/15/22 | | 61,000 |
| 63,135 |
|
| | | | 234,449 |
|
| Wireless Telecommunication Services — 0.6% | | | |
| T-Mobile USA, Inc., 6.00%, 4/15/24 | | 150,000 |
| 159,937 |
|
T-Mobile USA, Inc., 6.375%, 3/1/25(5) | | 12,000 |
| 12,893 |
|
| T-Mobile USA, Inc., 6.50%, 1/15/26 | | 301,000 |
| 332,605 |
|
| | | | 505,435 |
|
TOTAL CORPORATE BONDS
(Cost $13,185,628) | | | 13,027,813 |
|
BANK LOAN OBLIGATIONS(6) — 11.4% | | | |
| Aerospace and Defense — 0.5% | | | |
| DAE Aviation Holdings, Inc., 1st Lien Term Loan, 5.25%, 7/7/22 | | 265,909 |
| 267,970 |
|
|
| | | | | | | |
| | | Principal Amount/ Shares | Value |
| Sequa Corporation, New Term Loan B, 5.25%, 6/19/17 | | $ | 161,727 |
| $ | 149,429 |
|
| | | | 417,399 |
|
| Air Freight and Logistics — 0.4% | | | |
| XPO Logistics, Inc., Term Loan B2, 4.25%, 10/30/21 | | 347,419 |
| 349,962 |
|
| Chemicals — 0.3% | | | |
| Ascend Performance Materials Operations LLC, Term Loan B, 6.50%, 8/12/22 | | 220,119 |
| 220,348 |
|
| Commercial Services and Supplies — 0.7% | | | |
| ADS Waste Holdings, Inc., Term Loan B2, 3.75%, 10/9/19 | | 262,815 |
| 263,344 |
|
| Fort Dearborn Company, 2016 1st Lien Term Loan, 5.00%, 10/19/23 | | 30,388 |
| 30,597 |
|
| Monitronics International Inc., Term Loan B2, 6.50%, 9/30/22 | | 60,157 |
| 59,866 |
|
Sterling Infosystems, Inc., 1st Lien Term Loan B, 6/20/22(7) | | 150,000 |
| 149,860 |
|
USAGM HoldCo LLC, 2016 Incremental Term Loan, 5.50%, 7/28/22(8) | | 140,881 |
| 141,708 |
|
| | | | 645,375 |
|
| Communications Equipment — 0.1% | | | |
| Polycom, Inc., 1st Lien Term Loan, 7.50%, 9/27/23 | | 129,100 |
| 126,195 |
|
Construction and Engineering† | | | |
| SRS Distribution Inc., 2015 Term Loan B, 5.25%, 8/25/22 | | 33,443 |
| 33,812 |
|
| Construction Materials — 0.3% | | | |
| CPG International Inc., New Term Loan, 4.75%, 9/30/20 | | 240,503 |
| 241,932 |
|
| Consumer Discretionary — 0.8% | | | |
| Jeld-Wen Inc., Term Loan B, 5.25%, 10/15/21 | | 123,741 |
| 124,862 |
|
| National Vision, Inc., 1st Lien Term Loan, 4.00%, 3/12/21 | | 247,462 |
| 246,327 |
|
| William Morris Endeavor Entertainment, LLC, 1st Lien Term Loan, 5.25%, 5/6/21 | | 247,468 |
| 249,263 |
|
| William Morris Endeavor Entertainment, LLC, 2nd Lien Term Loan, 8.25%, 5/6/22 | | 100,000 |
| 100,209 |
|
| | | | 720,661 |
|
| Containers and Packaging — 0.3% | | | |
| BWAY Holding Company, Inc., New Term Loan B, 5.50%, 8/14/20 | | 217,569 |
| 219,404 |
|
| Distributors — 0.4% | | | |
| American Tire Distributors Holdings, Inc., 2015 Term Loan, 5.25%, 9/1/21 | | 94,782 |
| 94,042 |
|
| Spin Holdco Inc., New Term Loan B, 4.25%, 11/14/19 | | 247,481 |
| 246,615 |
|
| | | | 340,657 |
|
| Diversified Financial Services — 0.3% | | | |
| Camelot UK Holdco Limited, Term Loan B, 4.75%, 10/3/23 | | 30,181 |
| 30,266 |
|
| Hub International Limited, Term Loan B, 4.00%, 10/2/20 | | 89,826 |
| 89,919 |
|
| Opal Acquisition, Inc., Term Loan B, 5.00%, 11/27/20 | | 93,729 |
| 86,621 |
|
| UFC Holdings, LLC, 1st Lien Term Loan, 5.00%, 8/18/23 | | 95,268 |
| 96,229 |
|
| | | | 303,035 |
|
|
| | | | | | | |
| | | Principal Amount/ Shares | Value |
| Diversified Telecommunication Services — 0.2% | | | |
| Intelsat Jackson Holdings S.A., Term Loan B2, 3.75%, 6/30/19 | | $ | 218,750 |
| $ | 209,801 |
|
Electric Utilities† | | | |
| Lonestar Generation LLC, Term Loan B, 5.47%, 2/22/21 | | 4,578 |
| 4,006 |
|
| Electronic Equipment, Instruments and Components — 0.2% | | |
| Excelitas Technologies Corp., 1st Lien Term Loan, 6.00%, 10/31/20 | | 203,924 |
| 197,806 |
|
| Energy — 0.2% | | | |
Granite Acquisition Inc., Term Loan B, 12/19/21(7) | | 191,427 |
| 190,072 |
|
Granite Acquisition Inc., Term Loan C, 12/19/21(7) | | 8,573 |
| 8,512 |
|
| | | | 198,584 |
|
| Energy Equipment and Services — 0.3% | | | |
| Murray Energy Corporation, Term Loan B1, 9.25%, 4/16/17 | | 7,290 |
| 7,294 |
|
| Murray Energy Corporation, Term Loan B2, 8.25%, 4/16/20 | | 298,272 |
| 274,503 |
|
| | | | 281,797 |
|
Food and Staples Retailing† | | | |
Genoa, a QoL Healthcare Company, LLC, 2016 1st Lien Term Loan,10/25/23(7) | | 31,221 |
| 31,299 |
|
| Health Care Providers and Services — 0.8% | | | |
| BioClinica, Inc., 1st Lien Term Loan, 5.25%, 10/20/23 | | 71,656 |
| 71,791 |
|
inVentiv Health, Inc., 2016 Term Loan B, 9/28/23(7) | | 69,678 |
| 69,766 |
|
| Jaguar Holding Company II, 2015 Term Loan B, 4.25%, 8/18/22 | | 429,758 |
| 429,833 |
|
| Precyse Acquisition Corp., 2016 1st Lien Term Loan, 6.50%, 10/20/22 | | 111,093 |
| 112,031 |
|
| | | | 683,421 |
|
| Health Care Technology — 0.1% | | | |
| Press Ganey Holdings, Inc., 1st Lien Term Loan, 4.25%, 10/21/23 | | 62,500 |
| 62,578 |
|
| Insurance — 0.2% | | | |
| Alliant Holdings I, Inc., 2015 Term Loan B, 4.75%, 8/12/22 | | 167,847 |
| 168,121 |
|
| Internet Software and Services — 0.7% | | | |
| Ancestry.com, 1st Lien Term Loan, 5.25%, 10/19/23 | | 125,000 |
| 125,449 |
|
| MH Sub I, LLC, 1st Lien Term Loan, 4.75%, 7/8/21 | | 243,838 |
| 244,867 |
|
| MH Sub I, LLC, 2nd Lien Term Loan, 8.50%, 7/8/22 | | 163,447 |
| 162,426 |
|
Rackspace Hosting, Inc., 1st Lien Term Loan, 10/26/23(7) | | 102,893 |
| 103,601 |
|
| | | | 636,343 |
|
| IT Services — 0.7% | | | |
| Alion Science and Technology Corporation, 2015 Term Loan B, 5.50%, 8/19/21 | | 90,293 |
| 88,713 |
|
| First Data Corporation, Extended 2021 Term Loan, 3.52%, 3/24/21 | | 354,093 |
| 354,364 |
|
| Travelport Finance (Luxembourg) S.a.r.l., 2016 Term Loan B, 5.00%, 9/2/21 | | 85,546 |
| 86,177 |
|
| WEX Inc., Term Loan B, 4.25%, 7/1/23 | | 96,113 |
| 97,367 |
|
| | | | 626,621 |
|
| Machinery — 0.1% | | | |
| Silver II US Holdings, LLC, Term Loan, 4.00%, 12/13/19 | | 61,936 |
| 57,136 |
|
|
| | | | | | | |
| | | Principal Amount/ Shares | Value |
| Media — 1.5% | | | |
Advantage Sales & Marketing, Inc., 2014 1st Lien Term Loan, 7/23/21(7) | | $ | 250,000 |
| $ | 247,916 |
|
| CBS Radio Inc., Term Loan B, 4.50%, 10/17/23 | | 19,644 |
| 19,775 |
|
| CDS U.S. Intermediate Holdings, Inc., 1st Lien Term Loan, 5.00%, 7/8/22 | | 118,208 |
| 118,578 |
|
| Checkout Holding Corp., 1st Lien Term Loan, 4.50%, 4/9/21 | | 159,847 |
| 144,795 |
|
| Checkout Holding Corp., 2nd Lien Term Loan, 7.75%, 4/11/22 | | 50,000 |
| 36,250 |
|
| Cumulus Media Holdings Inc., 2013 Term Loan, 4.25%, 12/23/20 | | 170,696 |
| 118,390 |
|
| Deluxe Entertainment Services Group, Inc., Term Loan 2014, 6.50%, 2/28/20 | | 149,812 |
| 146,816 |
|
Entercom Radio, LLC, 2016 Term Loan, 10/25/23(7) | | 62,104 |
| 62,570 |
|
Live Nation Entertainment, Inc., Term Loan B, 10/26/23(7) | | 13,492 |
| 13,525 |
|
Mission Broadcasting, Inc., 2016 Term Loan B2, 9/26/23(7) | | 5,001 |
| 5,027 |
|
Nexstar Broadcasting, Inc., 2016 Term Loan B, 9/21/23(7) | | 56,118 |
| 56,417 |
|
| Trader Corporation, Term Loan, 5.00%, 9/28/23 | | 25,763 |
| 25,957 |
|
Ziggo Secured Finance BV, EUR Term Loan C, 8/31/24(7) | EUR | 250,000 |
| 276,401 |
|
| | | | 1,272,417 |
|
| Metals and Mining — 0.2% | | | |
| TurboCombustor Technology, Inc, New Term Loan B, 5.50%, 12/2/20 | | $ | 126,368 |
| 114,363 |
|
| WireCo WorldGroup, Inc., 1st Lien Term Loan, 6.50%, 9/30/23 | | 69,322 |
| 69,842 |
|
| | | | 184,205 |
|
| Multiline Retail — 0.1% | | | |
| J.C. Penney Corporation, Inc., 2016 Term Loan B, 5.25%, 6/23/23 | | 58,920 |
| 59,421 |
|
| Personal Products — 0.3% | | | |
| KIK Custom Products, Inc., 2015 Term Loan B, 6.00%, 8/26/22 | | 217,437 |
| 217,800 |
|
| Pharmaceuticals — 0.1% | | | |
| PCI Pharma Services, 1st Lien Term Loan, 5.00%, 6/30/23 | | 61,415 |
| 61,569 |
|
| Software — 1.0% | | | |
Dell Software Group, Term Loan B, 9/23/22(7) | | 82,632 |
| 82,756 |
|
| Emdeon Business Services, LLC, Term Loan B2, 3.75%, 11/2/18 | | 187,487 |
| 188,132 |
|
| Epicor Software Corporation, 1st Lien Term Loan, 4.75%, 6/1/22 | | 50,000 |
| 49,547 |
|
| Epicor Software Corporation, 2016 Term Loan, 5.00%, 6/1/22 | | 55,476 |
| 55,545 |
|
| RP Crown Parent, LLC, 2016 Term Loan B, 4.50%, 10/12/23 | | 125,000 |
| 125,234 |
|
| SolarWinds, Inc., 2016 USD Term Loan, 5.50%, 2/5/23 | | 47,527 |
| 47,842 |
|
| Sophia, L.P., 2015 Term Loan B, 4.75%, 9/30/22 | | 175,197 |
| 175,690 |
|
| STG-Fairway Acquisitions, Inc., 2015 1st Lien Term Loan, 6.25%, 6/30/22 | | 149,564 |
| 147,601 |
|
| | | | 872,347 |
|
| Specialty Retail — 0.4% | | | |
| Harbor Freight Tools USA, Inc., 2016 Term Loan B, 4.14%, 8/19/23 | | 77,857 |
| 78,501 |
|
|
| | | | | | | |
| | | Principal Amount/ Shares | Value |
| Outerwall Inc., 1st Lien Term Loan, 5.25%, 9/27/23 | | $ | 34,925 |
| $ | 35,289 |
|
| Petco Animal Supplies, Inc., 2016 Term Loan B1, 5.00%, 1/26/23 | | 173,818 |
| 175,556 |
|
Serta Simmons Holdings, LLC, 1st Lien Term Loan, 10/20/23(7) | | 58,396 |
| 58,480 |
|
| | | | 347,826 |
|
| Textiles, Apparel and Luxury Goods — 0.2% | | | |
| Ascena Retail Group, Inc., 2015 Term Loan B, 5.25%, 8/21/22 | | 161,520 |
| 157,364 |
|
TOTAL BANK LOAN OBLIGATIONS
(Cost $9,786,138) | | | 9,949,242 |
|
ASSET-BACKED SECURITIES(9) — 11.3% | | | |
American Credit Acceptance Receivables Trust, Series 2014-2, Class B, 2.26%, 3/10/20(1) | | 43,633 |
| 43,651 |
|
| AmeriCredit Automobile Receivables, Series 2015-4, Class D, 3.72%, 12/8/21 | | 80,000 |
| 82,914 |
|
| AmeriCredit Automobile Receivables Trust, Series 2013-4, Class D, 3.31%, 10/8/19 | | 365,000 |
| 371,513 |
|
| Bear Stearns Asset Backed Securities Trust, Series 2007-2, Class A2, VRN, 0.85%, 11/25/16 | | 236,135 |
| 229,672 |
|
CAL Funding II Ltd., Series 2012-1A, Class A SEQ, 3.47%, 10/25/27(1) | | 300,000 |
| 293,660 |
|
CAL Funding II Ltd., Series 2013-1A, Class A SEQ, 3.35%, 3/27/28(1) | | 295,167 |
| 288,853 |
|
CLI Funding V LLC, Series 2013-2A, Class NOTE SEQ, 3.22%, 6/18/28(1) | | 286,020 |
| 278,213 |
|
CLI Funding V LLC, Series 2014-1A, Class A SEQ, 3.29%, 6/18/29(1) | | 415,127 |
| 403,276 |
|
CPS Auto Receivables Trust, Series 2012-B, Class D, 7.86%, 9/16/19(1) | | 161,143 |
| 167,101 |
|
CPS Auto Receivables Trust, Series 2013-A, Class E, 6.41%, 6/15/20(1) | | 53,813 |
| 53,924 |
|
CPS Auto Receivables Trust, Series 2015-C, Class D SEQ, 4.63%, 8/16/21(1) | | 207,000 |
| 209,391 |
|
CPS Auto Receivables Trust, Series 2016-A, Class E, 7.65%, 12/15/21(1) | | 250,000 |
| 260,091 |
|
CPS Auto Trust, Series 2016-D, Class D SEQ, 4.53%, 1/17/23(1) | | 250,000 |
| 249,931 |
|
Drive Auto Receivables Trust, Series 2015-AA, Class D, 4.12%, 7/15/22(1) | | 550,000 |
| 564,063 |
|
Drive Auto Receivables Trust, Series 2015-CA, Class D, 4.20%, 9/15/21(1) | | 300,000 |
| 306,321 |
|
DT Auto Owner Trust, Series 2015-2A, Class D, 4.25%, 2/15/22(1) | | 380,000 |
| 386,546 |
|
DT Auto Owner Trust, Series 2016-2A, Class C, 3.67%, 1/18/22(1) | | 295,000 |
| 300,915 |
|
Exeter Automobile Receivables Trust, Series 2015-2A, Class A SEQ, 1.54%, 11/15/19(1) | | 144,225 |
| 144,091 |
|
Exeter Automobile Receivables Trust, Series 2015-2A, Class D, 5.79%, 5/16/22(1) | | 275,000 |
| 277,351 |
|
Flagship Credit Auto Trust, Series 2013-2, Class A SEQ, 1.94%, 1/15/19(1) | | 10,896 |
| 10,897 |
|
Flagship Credit Auto Trust, Series 2014-2, Class B, 2.84%, 11/16/20(1) | | 357,000 |
| 359,236 |
|
Flagship Credit Auto Trust, Series 2014-2, Class C, 3.95%, 12/15/20(1) | | 132,000 |
| 132,853 |
|
|
| | | | | | | |
| | | Principal Amount/ Shares | Value |
Flagship Credit Auto Trust, Series 2015-1, Class C, 3.76%, 6/15/21(1) | | $ | 250,000 |
| $ | 250,671 |
|
Flagship Credit Auto Trust, Series 2015-2, Class C, 4.08%, 12/15/21(1) | | 300,000 |
| 302,858 |
|
Global SC Finance II SRL, Series 2013-1A, Class A SEQ, 2.98%, 4/17/28(1) | | 227,500 |
| 219,768 |
|
Global SC Finance II SRL, Series 2014-1A, Class A2, 3.09%, 7/17/29(1) | | 497,375 |
| 476,152 |
|
OneMain Financial Issuance Trust, Series 2015-2A, Class A SEQ, 2.57%, 7/18/25(1) | | 450,000 |
| 452,056 |
|
OneMain Financial Issuance Trust, Series 2016-3A, Class A SEQ, 3.83%, 6/18/31(1) | | 475,000 |
| 490,251 |
|
Progreso Receivables Funding IV LLC, Series 2015-B, Class A, 3.00%, 7/28/20(1) | | 450,000 |
| 449,092 |
|
| Santander Drive Auto Receivables Trust, Series 2016-1, Class D, 4.02%, 4/15/22 | | 280,000 |
| 293,624 |
|
Sierra Timeshare Receivables Funding LLC, Series 2011-3A, Class C, 9.31%, 7/20/28(1) | | 100,357 |
| 100,672 |
|
Sierra Timeshare Receivables Funding LLC, Series 2014-2A, Class B, 2.40%, 6/20/31(1) | | 144,060 |
| 144,365 |
|
Springleaf Funding Trust, Series 2015-AA, Class B, 3.62%, 11/15/24(1) | | 130,000 |
| 130,426 |
|
TAL Advantage V LLC, Series 2014-1A, Class A, 3.51%, 2/22/39(1) | | 374,000 |
| 366,917 |
|
TAL Advantage V LLC, Series 2014-3A, Class A SEQ, 3.27%, 11/21/39(1) | | 242,500 |
| 235,110 |
|
Vertical Bridge CC LLC, Series 2016-2A, Class A SEQ, 5.19%, 10/15/46(1) | | 500,000 |
| 500,156 |
|
TOTAL ASSET-BACKED SECURITIES
(Cost $9,783,966) | | | 9,826,581 |
|
| COMMON STOCKS — 9.6% | | | |
| Air Freight and Logistics — 0.2% | | | |
| CH Robinson Worldwide, Inc. | | 2,427 |
| 165,327 |
|
| Automobiles — 0.2% | | | |
| General Motors Co. | | 5,363 |
| 169,471 |
|
| Beverages — 0.4% | | | |
| PepsiCo, Inc. | | 3,538 |
| 379,274 |
|
| Biotechnology — 0.3% | | | |
AbbVie, Inc.(5) | | 2,566 |
| 143,131 |
|
| Amgen, Inc. | | 987 |
| 139,325 |
|
| | | | 282,456 |
|
| Chemicals — 0.7% | | | |
| Air Products & Chemicals, Inc. | | 1,131 |
| 150,898 |
|
| Scotts Miracle-Gro Co. (The), Class A | | 5,116 |
| 450,668 |
|
| | | | 601,566 |
|
| Commercial Services and Supplies — 0.4% | | | |
KAR Auction Services, Inc.(5) | | 8,966 |
| 381,772 |
|
| Containers and Packaging — 0.7% | | | |
Packaging Corp. of America(5) | | 2,295 |
| 189,337 |
|
| Sonoco Products Co. | | 7,531 |
| 378,734 |
|
| | | | 568,071 |
|
|
| | | | | | | |
| | | Principal Amount/ Shares | Value |
| Distributors — 0.2% | | | |
| Genuine Parts Co. | | 1,688 |
| $ | 152,916 |
|
| Electric Utilities — 0.4% | | | |
| PG&E Corp. | | 6,020 |
| 373,962 |
|
| Electrical Equipment — 0.4% | | | |
| Hubbell, Inc. | | 3,532 |
| 369,165 |
|
| Electronic Equipment, Instruments and Components — 0.4% | | |
National Instruments Corp.(5) | | 13,440 |
| 377,530 |
|
| Food and Staples Retailing — 0.4% | | | |
Sysco Corp.(5) | | 7,448 |
| 358,398 |
|
| Gas Utilities — 0.4% | | | |
Spire, Inc.(5) | | 5,587 |
| 350,864 |
|
| Health Care Equipment and Supplies — 0.2% | | | |
| Abbott Laboratories | | 3,898 |
| 152,958 |
|
| Hotels, Restaurants and Leisure — 0.4% | | | |
| Carnival Corp. | | 3,574 |
| 175,483 |
|
| Darden Restaurants, Inc. | | 2,754 |
| 178,432 |
|
| | | | 353,915 |
|
| Leisure Products — 0.2% | | | |
| Hasbro, Inc. | | 2,074 |
| 172,992 |
|
| Machinery — 0.4% | | | |
PACCAR, Inc.(5) | | 6,524 |
| 358,298 |
|
| Metals and Mining — 0.2% | | | |
| Nucor Corp. | | 3,213 |
| 156,955 |
|
| Multi-Utilities — 0.2% | | | |
| Black Hills Corp. | | 2,710 |
| 167,614 |
|
| Multiline Retail — 0.2% | | | |
| Target Corp. | | 2,260 |
| 155,330 |
|
| Pharmaceuticals — 0.4% | | | |
Johnson & Johnson(5) | | 3,049 |
| 353,654 |
|
| Road and Rail — 0.2% | | | |
| Union Pacific Corp. | | 1,823 |
| 160,752 |
|
| Semiconductors and Semiconductor Equipment — 0.9% | | |
| Analog Devices, Inc. | | 2,691 |
| 172,493 |
|
| Intel Corp. | | 10,812 |
| 377,015 |
|
| QUALCOMM, Inc. | | 2,699 |
| 185,475 |
|
Versum Materials, Inc.(3) | | 560 |
| 12,712 |
|
| | | | 747,695 |
|
| Software — 0.2% | | | |
| Microsoft Corp. | | 3,033 |
| 181,737 |
|
| Specialty Retail — 0.4% | | | |
Tiffany & Co.(5) | | 2,711 |
| 199,041 |
|
| Williams-Sonoma, Inc. | | 3,172 |
| 146,610 |
|
| | | | 345,651 |
|
| Technology Hardware, Storage and Peripherals — 0.2% | | | |
Western Digital Corp.(5) | | 3,589 |
| 209,741 |
|
|
| | | | | | | |
| | | Principal Amount/ Shares | Value |
| Textiles, Apparel and Luxury Goods — 0.4% | | | |
| Coach, Inc. | | 4,033 |
| $ | 144,744 |
|
| VF Corp. | | 2,812 |
| 152,439 |
|
| | | | 297,183 |
|
TOTAL COMMON STOCKS
(Cost $8,287,797) | | | 8,345,247 |
|
| EXCHANGE-TRADED FUNDS — 9.1% | | | |
| iShares Global Financials ETF | | 38,072 |
| 1,992,308 |
|
iShares iBoxx $ High Yield Corporate Bond ETF(5) | | 7,529 |
| 647,645 |
|
| iShares International Select Dividend ETF | | 100,322 |
| 2,919,370 |
|
| iShares U.S. Preferred Stock ETF | | 34,878 |
| 1,358,498 |
|
| PowerShares Preferred Portfolio ETF | | 65,149 |
| 975,932 |
|
TOTAL EXCHANGE-TRADED FUNDS
(Cost $7,848,396) | | | 7,893,753 |
|
COLLATERALIZED LOAN OBLIGATIONS(9) — 7.4% | | | |
ALM VII Ltd., Series 2013-7R2A, 4/24/24(1)(10) | | $ | 475,000 |
| 256,996 |
|
Babson Collateralized Loan Obligations Ltd., Series 2013-IA, Class D, VRN, 4.38%, 1/20/17(1) | | 300,000 |
| 293,090 |
|
CIFC Funding Ltd., Series 2014-3A, Class E, VRN, 5.63%, 1/23/17(1) | | 500,000 |
| 433,349 |
|
Golub Capital Partners Collateralized Loan Obligations Ltd., Series 2015-22A, Class C, VRN, 4.96%, 11/21/16(1) | | 300,000 |
| 302,581 |
|
Neuberger Berman Collateralized Loan Obligations XVI Ltd., Series 2014-16A, Class D, VRN, 4.23%, 1/17/17(1) | | 1,000,000 |
| 970,532 |
|
OZLM Funding II Ltd., Series 2012-2A, Class CR, VRN, 4.87%, 1/30/17(1) | | 500,000 |
| 495,700 |
|
OZLM VI Ltd., Series 2014-6A, Class D, VRN, 5.63%, 1/17/17(1) | | 535,000 |
| 463,310 |
|
Pinnacle Park Collateralized Loan Obligations Ltd., Series 2014-1A, Class E, VRN, 5.83%, 1/17/17(1) | | 520,000 |
| 458,620 |
|
Sound Point Collateralized Loan Obligations IX Ltd., Series 2015-2A, Class D, VRN, 4.43%, 1/20/17(1) | | 300,000 |
| 290,026 |
|
Sound Point Collateralized Loan Obligations V Ltd., Series 2014-1A, Class D, VRN, 4.28%, 1/18/17(1) | | 300,000 |
| 289,958 |
|
TICP Collateralized Loan Obligations VI 2016-2 Ltd., Series 2016-6A, Class D, VRN, 5.08%, 12/2/16(1)(2) | | 1,000,000 |
| 959,700 |
|
Venture XIV Collateralized Loan Obligations Ltd., Series 2013-14A, Class D, VRN, 4.58%, 11/28/16(1) | | 300,000 |
| 289,454 |
|
Venture XVI Collateralized Loan Obligations Ltd., Series 2014-16A, Class B1L, VRN, 4.33%, 1/17/17(1) | | 1,000,000 |
| 933,341 |
|
TOTAL COLLATERALIZED LOAN OBLIGATIONS
(Cost $6,640,343) | | | 6,436,657 |
|
COMMERCIAL MORTGAGE-BACKED SECURITIES(9) — 6.3% | | |
| Bear Stearns Commercial Mortgage Securities Trust, Series 2007-PW15, Class A1A SEQ, 5.32%, 2/11/44 | | 494,886 |
| 497,837 |
|
CDGJ Commercial Mortgage Trust, Series 2014-BXCH, Class DPB, VRN, 4.38%, 11/15/16(1) | | 222,573 |
| 221,517 |
|
CDGJ Commercial Mortgage Trust, Series 2014-BXCH, Class EPA, VRN, 4.78%, 11/15/16(1) | | 280,672 |
| 279,032 |
|
COMM Mortgage Trust, Series 2007-C9, Class G, VRN, 5.81%, 11/1/16(1) | | 200,000 |
| 189,645 |
|
| GE Commercial Mortgage Corp., Series 2007-C1, Class A1A, VRN, 5.48%, 11/1/16 | | 349,994 |
| 352,457 |
|
|
| | | | | | | |
| | | Principal Amount/ Shares | Value |
Hyatt Hotel Portfolio Trust, Series 2015-HYT, Class E, VRN, 4.33%, 11/15/16(1) | | $ | 1,000,000 |
| $ | 996,470 |
|
JP Morgan Chase Commercial Mortgage Securities Corp., Series 2016-WPT, Class D, VRN, 4.28%, 11/15/16(1)(2) | | 1,000,000 |
| 1,000,938 |
|
JP Morgan Chase Commercial Mortgage Securities Trust, Series 2014-INN, Class E, VRN, 4.14%, 11/15/16(1) | | 400,000 |
| 394,462 |
|
JPMorgan Chase Commercial Mortgage Securities Trust, Series 2014-BXH, Class E, VRN, 4.28%, 11/15/16(1) | | 300,000 |
| 293,932 |
|
JPMorgan Chase Commercial Mortgage Securities Trust, Series 2014-CBM, Class E, VRN, 4.39%, 11/15/16(1) | | 300,000 |
| 288,906 |
|
JPMorgan Chase Commercial Mortgage Securities Trust, Series 2015-CSMO, Class D, VRN, 3.83%, 11/15/16(1) | | 1,000,000 |
| 1,001,885 |
|
TOTAL COMMERCIAL MORTGAGE-BACKED SECURITIES
(Cost $5,526,633) | 5,517,081 |
|
COLLATERALIZED MORTGAGE OBLIGATIONS(9) — 3.4% | | |
| Private Sponsor Collateralized Mortgage Obligations — 1.5% | | |
Credit Suisse Mortgage Trust, Series 2015-SAND, Class E, VRN, 4.38%, 11/15/16(1) | | 300,000 |
| 292,167 |
|
| First Horizon Alternative Mortgage Securities Trust, Series 2004-FA2, Class 1A1 SEQ, 6.00%, 1/25/35 | | 981,520 |
| 977,613 |
|
| | | | 1,269,780 |
|
| U.S. Government Agency Collateralized Mortgage Obligations — 1.9% | |
| GNMA, Series 2012-87, IO, VRN, 0.67%, 11/1/16 | | 6,623,886 |
| 248,649 |
|
| GNMA, Series 2012-99, IO, SEQ, VRN, 0.56%, 11/1/16 | | 4,738,503 |
| 202,565 |
|
| GNMA, Series 2014-126, IO, SEQ, VRN, 0.75%, 11/1/16 | | 5,712,356 |
| 342,699 |
|
| GNMA, Series 2014-126, IO, SEQ, VRN, 0.99%, 11/1/16 | | 7,030,592 |
| 489,803 |
|
| GNMA, Series 2015-85, IO, VRN, 0.69%, 11/1/16 | | 7,040,658 |
| 386,291 |
|
| | | | 1,670,007 |
|
TOTAL COLLATERALIZED MORTGAGE OBLIGATIONS
(Cost $3,113,396) | | | 2,939,787 |
|
| U.S. TREASURY SECURITIES — 2.7% | | | |
U.S. Treasury Notes, 1.625%, 5/15/26
(Cost $2,400,650) | | 2,390,000 |
| 2,348,968 |
|
| EXCHANGE-TRADED NOTES — 2.5% | | | |
| Credit Suisse X-Links Cushing MLP Infrastructure ETN | | 17,114 |
| 357,340 |
|
| ETRACS Alerian MLP Infrastructure Index ETN | | 23,764 |
| 634,974 |
|
| JPMorgan Alerian MLP Index ETN | | 40,932 |
| 1,233,691 |
|
TOTAL EXCHANGE-TRADED NOTES
(Cost $2,137,483) | | | 2,226,005 |
|
PURCHASED OPTIONS CONTRACTS† | | | |
SPDR S&P 500 ETF Trust, Put $188, Expires December 2016 | | 15 |
| 975 |
|
SPDR S&P 500 ETF Trust, Put $189, Expires December 2016 | | 8 |
| 560 |
|
| SPDR S&P 500 ETF Trust, Put $183, Expires March 2017 | | 9 |
| 1,962 |
|
| SPDR S&P 500 ETF Trust, Put $184, Expires March 2017 | | 4 |
| 912 |
|
| SPDR S&P 500 ETF Trust, Put $195, Expires June 2017 | | 3 |
| 1,885 |
|
TOTAL PURCHASED OPTIONS CONTRACTS
(Cost $25,110) | | | 6,294 |
|
|
| | | | | | | |
| | | Principal Amount/ Shares | Value |
| TEMPORARY CASH INVESTMENTS — 24.6% | | | |
State Street Institutional U.S. Government Money Market Fund, Premier Class
(Cost $21,440,619) | | 21,440,619 |
| $ | 21,440,619 |
|
TOTAL INVESTMENT SECURITIES BEFORE SECURITIES SOLD SHORT — 103.2%
(Cost $90,176,159) | 89,958,047 |
|
| CORPORATE BONDS SOLD SHORT — (0.2)% | | | |
| Automobiles — (0.1)% | | | |
| Fiat Chrysler Automobiles NV, 4.50%, 4/15/20 | | $ | (98,000 | ) | (100,695 | ) |
| Chemicals — (0.1)% | | | |
| Tronox Finance LLC, 144A, 7.50%, 3/15/22 | | (60,000 | ) | (54,000 | ) |
TOTAL CORPORATE BONDS SOLD SHORT
(Proceeds $152,064) | | | (154,695 | ) |
| OTHER ASSETS AND LIABILITIES — (3.0)% | | | (2,676,289 | ) |
| TOTAL NET ASSETS — 100.0% | | | $ | 87,127,063 |
|
|
| | | | | | | | | | |
| WRITTEN OPTIONS CONTRACTS |
| Reference Entity | Contracts | Type | Exercise Price | Expiration Date | Premiums Received | Value |
| Abbott Laboratories | 29 | Call | $44.00 | November 2016 | $ | 1,466 |
| $ | (58 | ) |
| AbbVie, Inc. | 19 | Call | $67.50 | November 2016 | 1,182 |
| (19 | ) |
| Air Products & Chemicals, Inc. | 8 | Call | $160.00 | November 2016 | 634 |
| (160 | ) |
| Amgen, Inc. | 7 | Call | $185.00 | November 2016 | 617 |
| (17 | ) |
| Analog Devices, Inc. | 20 | Call | $67.50 | November 2016 | 984 |
| (400 | ) |
| Black Hills Corp. | 20 | Call | $65.00 | November 2016 | 2,084 |
| (600 | ) |
| Carnival Corp. | 26 | Call | $50.00 | November 2016 | 2,449 |
| (1,625 | ) |
| CH Robinson Worldwide, Inc. | 18 | Call | $75.00 | November 2016 | 796 |
| (45 | ) |
| Coach, Inc. | 30 | Call | $38.00 | November 2016 | 2,226 |
| (1,650 | ) |
| Darden Restaurants, Inc. | 20 | Call | $67.50 | November 2016 | 384 |
| (500 | ) |
| General Motors Co. | 40 | Call | $34.00 | November 2016 | 1,248 |
| (200 | ) |
| Genuine Parts Co. | 12 | Call | $105.00 | November 2016 | 1,130 |
| (180 | ) |
| Hasbro, Inc. | 15 | Call | $85.00 | November 2016 | 1,488 |
| (1,237 | ) |
| Intel Corp. | 80 | Call | $38.00 | November 2016 | 5,777 |
| (80 | ) |
| iShares iBoxx $ High Yield Corporate Bond ETF | 115 | Put | $84.00 | December 2016 | 12,997 |
| (8,339 | ) |
| iShares iBoxx $ High Yield Corporate Bond ETF | 115 | Call | $87.00 | December 2016 | 8,189 |
| (4,198 | ) |
| Microsoft Corp. | 22 | Call | $60.00 | November 2016 | 1,941 |
| (1,947 | ) |
| National Instruments Corp. | 100 | Call | $30.00 | November 2016 | 4,921 |
| (1,500 | ) |
| Nucor Corp. | 24 | Call | $52.50 | November 2016 | 1,325 |
| (300 | ) |
| PACCAR, Inc. | 48 | Call | $60.00 | November 2016 | 4,042 |
| (240 | ) |
| PepsiCo, Inc. | 26 | Call | $110.00 | November 2016 | 2,971 |
| (741 | ) |
| QUALCOMM, Inc. | 20 | Call | $67.50 | November 2016 | 1,564 |
| (5,690 | ) |
| Sonoco Products Co. | 56 | Call | $55.00 | November 2016 | 2,756 |
| (1,260 | ) |
| Sysco Corp. | 55 | Call | $50.00 | November 2016 | 4,646 |
| (1,513 | ) |
| Target Corp. | 16 | Call | $70.00 | November 2016 | 2,227 |
| (1,488 | ) |
| Tiffany & Co. | 20 | Call | $75.00 | November 2016 | 2,584 |
| (1,940 | ) |
| Union Pacific Corp. | 13 | Call | $100.00 | November 2016 | 1,459 |
| (26 | ) |
| VF Corp. | 21 | Call | $60.00 | November 2016 | 1,663 |
| (52 | ) |
| Western Digital Corp. | 26 | Call | $60.00 | November 2016 | 7,571 |
| (2,964 | ) |
| Williams-Sonoma, Inc. | 23 | Call | $52.50 | November 2016 | 3,547 |
| (345 | ) |
| | | | $ | 86,868 |
| $ | (39,314 | ) |
|
| | | | | | | | | | |
| FORWARD FOREIGN CURRENCY EXCHANGE CONTRACTS |
| Currency Purchased | Currency Sold | Counterparty | Settlement Date | Unrealized Appreciation
(Depreciation) |
| USD | 602,168 |
| EUR | 550,000 |
| State Street Bank & Trust Co. | 11/25/16 | $ | (2,150 | ) |
| USD | 164,853 |
| EUR | 150,000 |
| State Street Bank & Trust Co. | 11/25/16 | 39 |
|
| | | | | | | $ | (2,111 | ) |
|
| | | | | | | | |
| FUTURES CONTRACTS |
| Contracts Sold | Expiration Date | Underlying Face
Amount at Value | Unrealized Appreciation
(Depreciation) |
| 18 | Euro-Bund 10-Year Bonds | December 2016 | $ | 3,204,399 |
| $ | 58,838 |
|
| 19 | S&P 500 E-Mini | December 2016 | 2,014,095 |
| 24,262 |
|
| | | | $ | 5,218,494 |
| $ | 83,100 |
|
SWAP AGREEMENTS
|
| | | | | | | | | | | | | | |
| CENTRALLY CLEARED CREDIT DEFAULT | | |
| Reference Entity | Notional
Amount | Buy/Sell*
Protection | Interest
Rate | Termination
Date | Implied Credit Spread** | Unrealized Appreciation
(Depreciation) | Value |
| Markit CDX North America High Yield 27 Index | $ | 1,500,000 |
| Sell | 5.00% | 12/20/21 | 4.21 | % | $ | 1,342 |
| $ | 60,166 |
|
| Markit iTraxx Europe Senior Financials 26 | EUR | 1,073,000 |
| Buy | 1.00% | 12/20/21 | 0.97 | % | (5,133 | ) | (3,092 | ) |
Markit iTraxx Europe Series 26 | EUR | 1,073,000 |
| Sell | 1.00% | 12/20/21 | 0.73 | % | 1,831 |
| 17,466 |
|
| | | | | | | | $ | (1,960 | ) | $ | 74,540 |
|
|
| | | | | | | | | | | | | | | |
| CREDIT DEFAULT | | |
Counterparty/
Reference Entity | Notional
Amount | Buy/Sell
Protection | Interest
Rate | Termination
Date | Premiums
Paid (Received) | Unrealized Appreciation
(Depreciation) | Value*** |
| Bank of America N.A./ 21st Century Fox America, Inc. | $ | 190,000 |
| Buy | 1.00% | 12/20/21 | $ | (4,787 | ) | $ | (74 | ) | $ | (4,861 | ) |
| Bank of America N.A./ Comcast Corp. | 114,000 |
| Buy | 1.00% | 12/20/21 | (3,132 | ) | 43 |
| (3,089 | ) |
| Bank of America N.A./ Cox Communications, Inc. | 190,000 |
| Buy | 1.00% | 12/20/21 | 823 |
| (270 | ) | 553 |
|
| Bank of America N.A./ Verizon Communications, Inc. | 190,000 |
| Buy | 1.00% | 12/20/21 | (3,832 | ) | 192 |
| (3,640 | ) |
| | | | | | $ | (10,928 | ) | $ | (109 | ) | $ | (11,037 | ) |
| |
| * | The maximum potential amount the fund could be required to deliver as a seller of credit protection if a credit event occurs as defined under the terms of the agreement is the notional amount. The maximum potential amount may be partially offset by any recovery values of the reference entities and upfront payments received upon entering into the agreement. |
** Implied credit spreads for centrally cleared credit default swap agreements are linked to the weighted average spread across the underlying reference entities included in a particular index. Implied credit spreads serve as an indication of the seller's performance risk related to the likelihood of a credit event occurring as defined in the agreement. Implied credit spreads are used to determine the value of swap agreements and reflect the cost of buying/selling protection, which may include upfront payments made/received upon entering the agreement. Therefore, higher spreads would indicate a greater likelihood that a seller will be obligated to perform under the contract terms. Increasing values, in absolute terms and relative to notional amounts, are also indicative of greater performance risk.
***The value for credit default swap agreements serve as an indicator of the current status of the payment/performance risk and represent the likelihood of an expected liability or profit at the period end. Increasing values in absolute terms when compared to the notional amount of the credit default swap agreement represent a deterioration of the referenced entity's credit soundness and an increased likelihood or risk of a credit event occurring as defined in the agreement.
|
| | |
| NOTES TO SCHEDULE OF INVESTMENTS |
| CDX | - | Credit Derivatives Indexes |
| EUR | - | Euro |
| GNMA | - | Government National Mortgage Association |
| IO | - | Interest Only |
| MTN | - | Medium Term Note |
| SEQ | - | Sequential Payer |
| USD | - | United States Dollar |
| VRN | - | Variable Rate Note. Interest reset date is indicated. Rate shown is effective at the period end. |
| |
| † | Category is less than 0.05% of total net assets. |
| |
| (1) | Security was purchased pursuant to Rule 144A under the Securities Act of 1933 and may be sold in transactions exempt from registration, normally to qualified institutional investors. The aggregate value of these securities at the period end was $27,063,513, which represented 31.1% of total net assets. Of these securities, 1.8% of total net assets were deemed illiquid under policies approved by the Board of Directors. |
| |
| (2) | When-issued security. The issue price and yield are fixed on the date of the commitment, but payment and delivery are scheduled for a future date. |
| |
| (4) | Security is in default. |
| |
| (5) | Security, or a portion thereof, has been pledged at the custodian bank or with a broker for collateral requirements on options contracts and/or securities sold short. At the period end, the aggregate value of securities pledged was $1,569,170. |
| |
| (6) | The interest rate on a bank loan obligation adjusts periodically based on a predetermined schedule. Rate shown is effective at period end. The maturity date on a bank loan obligation may be less than indicated as a result of contractual or optional prepayments. These prepayments cannot be predicted with certainty. Final maturity date is indicated. |
| |
| (7) | The interest rate will be determined upon settlement of the bank loan obligation after period end. |
| |
| (8) | Bank loan obligation includes unfunded delayed draw commitments. The principal amount and value of these unfunded commitments at the period end were $12,493 and $12,567, respectively. |
| |
| (9) | Final maturity date indicated, unless otherwise noted. |
| |
| (10) | Security is a collateralized loan obligation equity. These securities do not have stated interest rate but are entitled to receive excess cash flow generated by the collateralized loan obligation. |
See Notes to Financial Statements.
|
|
| Statement of Assets and Liabilities |
|
| | | |
| OCTOBER 31, 2016 | |
| Assets | |
| Investment securities, at value (cost of $90,176,159) | $ | 89,958,047 |
|
| Cash | 367,670 |
|
| Foreign currency holdings, at value (cost of $117,802) | 112,149 |
|
| Deposits with brokers for securities sold short and derivative instruments | 503,995 |
|
| Receivable for investments sold | 601,534 |
|
| Receivable for capital shares sold | 1,021,419 |
|
| Receivable for variation margin on futures contracts | 3,515 |
|
| Unrealized appreciation on forward foreign currency exchange contracts | 39 |
|
| Swap agreements, at value (including net premiums paid (received) of $823) | 553 |
|
| Interest and dividends receivable | 350,578 |
|
| | 92,919,499 |
|
| | |
| Liabilities | |
| Securities sold short, at value (proceeds of $152,064) | 154,695 |
|
| Written options contracts, at value (premiums of $86,868) | 39,314 |
|
| Payable for investments purchased | 5,432,560 |
|
| Payable for capital shares redeemed | 11,323 |
|
| Unrealized depreciation on forward foreign currency exchange contracts | 2,150 |
|
| Swap agreements, at value (including net premiums paid (received) of $(11,751)) | 11,590 |
|
| Payable for variation margin on swap agreements | 1,164 |
|
| Payable for variation margin on futures contracts | 1,817 |
|
| Accrued management fees | 123,299 |
|
| Distribution and service fees payable | 13,719 |
|
| Interest expense payable on securities sold short | 771 |
|
| Broker fees and charges payable on securities sold short | 34 |
|
| | 5,792,436 |
|
| | |
| Net Assets | $ | 87,127,063 |
|
| | |
| Net Assets Consist of: | |
| Capital (par value and paid-in surplus) | $ | 89,480,686 |
|
| Undistributed net investment income | 274,370 |
|
| Accumulated net realized loss | (2,529,458 | ) |
| Net unrealized depreciation | (98,535 | ) |
| | $ | 87,127,063 |
|
|
| | | | | | |
| | Net Assets | Shares Outstanding | Net Asset Value Per Share |
| Investor Class, $0.01 Par Value |
| $41,447,137 |
| 4,372,206 |
| $9.48 |
| Institutional Class, $0.01 Par Value |
| $7,111,063 |
| 749,918 |
| $9.48 |
| A Class, $0.01 Par Value |
| $20,327,669 |
| 2,144,552 |
| $9.48* |
| C Class, $0.01 Par Value |
| $12,129,031 |
| 1,286,614 |
| $9.43 |
| R Class, $0.01 Par Value |
| $1,955,590 |
| 206,711 |
| $9.46 |
| R6 Class, $0.01 Par Value |
| $4,156,573 |
| 438,297 |
| $9.48 |
*Maximum offering price $10.06 (net asset value divided by 0.9425).
See Notes to Financial Statements.
|
| | | |
| YEAR ENDED OCTOBER 31, 2016 | |
| Investment Income (Loss) | |
| Income: | |
| Interest | $ | 2,143,968 |
|
| Dividends (net of foreign taxes withheld of $175) | 386,507 |
|
| | 2,530,475 |
|
| | |
| Expenses: | |
| Management fees | 1,091,144 |
|
| Distribution and service fees: | |
| A Class | 26,806 |
|
| C Class | 95,175 |
|
| R Class | 8,935 |
|
| Directors' fees and expenses | 1,846 |
|
| Interest expense on securities sold short | 5,025 |
|
| Broker fees and charges on securities sold short | 405 |
|
| Other expenses | 590 |
|
| | 1,229,926 |
|
| Fees waived | (5,213 | ) |
| | 1,224,713 |
|
| | |
| Net investment income (loss) | 1,305,762 |
|
| | |
| Realized and Unrealized Gain (Loss) | |
| Net realized gain (loss) on: | |
| Investment transactions | (938,967 | ) |
| Securities sold short transactions | (1,563 | ) |
| Futures contract transactions | 126,155 |
|
| Swap agreement transactions | (1,179,719 | ) |
| Written options contract transactions | 20,336 |
|
| Foreign currency transactions | 14,831 |
|
| | (1,958,927 | ) |
| | |
| Change in net unrealized appreciation (depreciation) on: | |
| Investments | 1,361,816 |
|
| Securities sold short | (2,381 | ) |
| Futures contracts | 83,100 |
|
| Swap agreements | 753,595 |
|
| Written options contracts | 47,554 |
|
| Translation of assets and liabilities in foreign currencies | (7,736 | ) |
| | 2,235,948 |
|
| | |
| Net realized and unrealized gain (loss) | 277,021 |
|
| | |
| Net Increase (Decrease) in Net Assets Resulting from Operations | $ | 1,582,783 |
|
See Notes to Financial Statements.
|
|
| Statement of Changes in Net Assets |
|
| | | | | | |
| YEAR ENDED OCTOBER 31, 2016 AND PERIOD ENDED OCTOBER 31, 2015 |
| Increase (Decrease) in Net Assets | October 31, 2016 | October 31, 2015(1) |
| Operations | | |
| Net investment income (loss) | $ | 1,305,762 |
| $ | 480,867 |
|
| Net realized gain (loss) | (1,958,927 | ) | (177,692 | ) |
| Change in net unrealized appreciation (depreciation) | 2,235,948 |
| (2,334,483 | ) |
| Net increase (decrease) in net assets resulting from operations | 1,582,783 |
| (2,031,308 | ) |
| | | |
| Distributions to Shareholders | | |
| From net investment income: | | |
| Investor Class | (978,526 | ) | — |
|
| Institutional Class | (234,250 | ) | — |
|
| A Class | (386,150 | ) | — |
|
| C Class | (297,352 | ) | — |
|
| R Class | (60,792 | ) | — |
|
| R6 Class | (77,674 | ) | — |
|
| Decrease in net assets from distributions | (2,034,744 | ) | — |
|
| | | |
| Capital Share Transactions | | |
| Net increase (decrease) in net assets from capital share transactions (Note 5) | 36,711,052 |
| 52,899,280 |
|
| | | |
| Net increase (decrease) in net assets | 36,259,091 |
| 50,867,972 |
|
| | | |
| Net Assets | | |
| Beginning of period | 50,867,972 |
| — |
|
| End of period | $ | 87,127,063 |
| $ | 50,867,972 |
|
| | | |
| Undistributed net investment income | $ | 274,370 |
| $ | 640,013 |
|
| |
| (1) | May 29, 2015 (fund inception) through October 31, 2015. |
See Notes to Financial Statements.
|
|
| Notes to Financial Statements |
OCTOBER 31, 2016
1. Organization
American Century Capital Portfolios, Inc. (the corporation) is registered under the Investment Company Act of 1940, as amended (the 1940 Act), as an open-end management investment company and is organized as a Maryland corporation. AC Alternatives Income Fund (the fund) is one fund in a series issued by the corporation. The fund’s investment objective is to seek to provide diverse sources of income.
The fund offers the Investor Class, the Institutional Class, the A Class, the C Class, the R Class and the R6 Class. The A Class may incur an initial sales charge. The A Class and C Class may be subject to a contingent deferred sales charge. The share classes differ principally in their respective sales charges and distribution and shareholder servicing expenses and arrangements. The Institutional Class and R6 Class shareholders do not require the same level of shareholder and administrative services from American Century Investment Management, Inc. (ACIM) (the investment advisor) as shareholders of other classes. In addition, financial intermediaries do not receive any service, distribution or administrative fees for the R6 Class. As a result, the Institutional Class and R6 Class are charged lower unified management fees. All classes of the fund commenced operations on May 29, 2015, the fund's inception date.
2. Significant Accounting Policies
The following is a summary of significant accounting policies consistently followed by the fund in preparation of its financial statements. The fund is an investment company and follows accounting and reporting guidance in accordance with accounting principles generally accepted in the United States of America. This may require management to make certain estimates and assumptions at the date of the financial statements. Actual results could differ from these estimates. Management evaluated the impact of events or transactions occurring through the date the financial statements were issued that would merit recognition or disclosure.
Investment Valuations — The fund determines the fair value of its investments and computes its net asset value per share at the close of regular trading (usually 4 p.m. Eastern time) on the New York Stock Exchange (NYSE) on each day the NYSE is open. The Board of Directors has adopted valuation policies and procedures to guide the investment advisor in the fund’s investment valuation process and to provide methodologies for the oversight of the fund’s pricing function.
Fixed income securities are valued at the evaluated mean as provided by independent pricing services or at the mean of the most recent bid and asked prices as provided by investment dealers. Corporate bonds, U.S. Treasury and Government Agency securities and bank loan obligations are valued using market models that consider trade data, quotations from dealers and active market makers, relevant yield curve and spread data, creditworthiness, trade data or market information on comparable securities, and other relevant security specific information. Mortgage-related and asset-backed securities are valued based on models that consider trade data, prepayment and default projections, benchmark yield and spread data and estimated cash flows of each tranche of the issuer. Collateralized loan obligations are valued based on discounted cash flow models that consider trade and economic data, prepayment assumptions and default projections. Fixed income securities initially expressed in local currencies are translated into U.S. dollars at the mean of the appropriate currency exchange rate at the close of the NYSE as provided by an independent pricing service.
Exchange-traded notes and equity securities that are listed or traded on a domestic securities exchange are valued at the last reported sales price or at the official closing price as provided by the exchange. Equity securities traded on foreign securities exchanges are generally valued at the closing price of such securities on the exchange where primarily traded or at the close of the NYSE, if that is earlier. If no last sales price is reported, or if local convention or regulation so provides, the mean of the latest bid and asked prices may be used. Securities traded over-the-counter are valued at the mean of the latest bid and asked prices, the last sales price, or the official closing price. Equity securities initially expressed in local currencies are translated into U.S. dollars at the mean of the appropriate currency exchange rate at the close of the NYSE as provided by an independent pricing service.
Open-end management investment companies are valued at the reported net asset value per share. Exchange-traded futures and options contracts are valued based on quoted prices as provided by the appropriate exchange. Swap agreements and over-the-counter options contracts are valued at an evaluated
mean as provided by independent pricing services or independent brokers. Forward foreign currency exchange contracts are valued at the mean of the appropriate forward exchange rate at the close of the NYSE as provided by an independent pricing service. Investments initially expressed in local currencies are translated into U.S. dollars at the mean of the appropriate currency exchange rate at the close of the NYSE as provided by an independent pricing service.
If the fund determines that the market price for an investment is not readily available or the valuation methods mentioned above do not reflect an investment’s fair value, such investment is valued as determined in good faith by the Board of Directors or its delegate, in accordance with policies and procedures adopted by the Board of Directors. In its determination of fair value, the fund may review several factors including, but not limited to, market information regarding the specific investment or comparable investments and correlation with other investment types, futures indices or general market indicators. Circumstances that may cause the fund to use these procedures to value an investment include, but are not limited to: an investment has been declared in default or is distressed; trading in a security has been suspended during the trading day or a security is not actively trading on its principal exchange; prices received from a regular pricing source are deemed unreliable; or there is a foreign market holiday and no trading occurred.
The fund monitors for significant events occurring after the close of an investment’s primary exchange but before the fund’s net asset value per share is determined. Significant events may include, but are not limited to: corporate announcements and transactions; governmental action and political unrest that could impact a specific investment or an investment sector; or armed conflicts, natural disasters and similar events that could affect investments in a specific country or region. The fund also monitors for significant fluctuations between domestic and foreign markets, as evidenced by the U.S. market or such other indicators that the Board of Directors, or its delegate, deems appropriate. If significant fluctuations in foreign markets are identified, the fund may apply a model-derived factor to the closing price of equity securities traded on foreign securities exchanges. The factor is based on observable market data as provided by an independent pricing service.
Security Transactions — Security transactions are accounted for as of the trade date. Net realized gains and losses are determined on the identified cost basis, which is also used for federal income tax purposes.
Investment Income — Interest income is recorded on the accrual basis and includes paydown gain (loss) and accretion of discounts and amortization of premiums. Inflation adjustments related to inflation-linked debt securities are reflected as interest income. Dividend income less foreign taxes withheld, if any, is recorded as of the ex-dividend date. Distributions received on securities that represent a return of capital or long-term capital gain are recorded as a reduction of cost of investments and/or as a realized gain. The fund may estimate the components of distributions received that may be considered nontaxable distributions or long-term capital gain distributions for income tax purposes.
Securities Sold Short — The fund enters into short sales, which is selling securities it does not own, as part of its normal investment activities. Upon selling a security short, the fund will segregate cash, cash equivalents or other appropriate liquid securities in at least an amount equal to the current market value of the securities sold short until the fund replaces the borrowed security. Interest earned on segregated cash for securities sold short is reflected as interest income. The fund is required to pay any dividends or interest due on securities sold short. Such dividends and interest are recorded as an expense. The fund may pay fees or charges to the broker on the assets borrowed for securities sold short. These fees are calculated daily based upon the value of each security sold short and a rate that is dependent on the availability of such security. If the market price of a security increases after the fund borrows the security, the fund may suffer a loss when it replaces the borrowed security at the higher price. Any loss will be increased by the amount of compensation, interest or dividends, and transaction costs the fund must pay to the lender of the borrowed security. Liabilities for securities sold short are valued daily and changes in value are recorded as change in net unrealized appreciation (depreciation) on securities sold short. The fund records realized gain (loss) on a security sold short when it is terminated by the fund and includes as a component of net realized gain (loss) on securities sold short transactions.
Foreign Currency Translations — All assets and liabilities initially expressed in foreign currencies are translated into U.S. dollars at prevailing exchange rates at period end. The fund may enter into spot foreign currency exchange contracts to facilitate transactions denominated in a foreign currency. Purchases and sales of investment securities, dividend and interest income, spot foreign currency exchange contracts, and expenses are translated at the rates of exchange prevailing on the respective dates of such transactions. Net realized and unrealized foreign currency exchange gains or losses related to investment securities are a component of net realized gain (loss) on investment transactions and change in net unrealized appreciation (depreciation) on investments, respectively.
Segregated Assets — In accordance with the 1940 Act, the fund segregates assets on its books and records to cover certain types of investments, including, but not limited to, short sales, futures contracts, options contracts, forward commitments, when-issued securities, swap agreements and certain forward foreign currency exchange contracts. ACIM monitors, on a daily basis, the securities segregated to ensure the fund designates a sufficient amount of liquid assets, marked-to-market daily. The fund may also receive assets or be required to pledge assets at the custodian bank or with a broker for margin requirements on short sales,
futures contracts, options contracts, forward commitments and swap agreements.
Income Tax Status — It is the fund’s policy to distribute substantially all net investment income and net realized gains to shareholders and to otherwise qualify as a regulated investment company under provisions of the Internal Revenue Code. Accordingly, no provision has been made for income taxes. The fund files U.S. federal, state, local and non-U.S. tax returns as applicable. The fund's tax returns are subject to examination by the relevant taxing authority until expiration of the applicable statute of limitations, which is generally three years from the date of filing but can be longer in certain jurisdictions. At this time, management believes there are no uncertain tax positions which, based on their technical merit, would not be sustained upon examination and for which it is reasonably possible that the total amounts of unrecognized tax benefits will significantly change in the next twelve months.
Multiple Class — All shares of the fund represent an equal pro rata interest in the net assets of the class to which such shares belong, and have identical voting, dividend, liquidation and other rights and the same terms and conditions, except for class specific expenses and exclusive rights to vote on matters affecting only individual classes. Income, non-class specific expenses, and realized and unrealized capital gains and losses of the fund are allocated to each class of shares based on their relative net assets.
Distributions to Shareholders — Distributions from net investment income, if any, are generally declared and paid quarterly, but may be paid less frequently. Distributions from net realized gains, if any, are generally declared and paid annually.
Indemnifications — Under the corporation’s organizational documents, its officers and directors are indemnified against certain liabilities arising out of the performance of their duties to the fund. In addition, in the normal course of business, the fund enters into contracts that provide general indemnifications. The maximum exposure under these arrangements is unknown as this would involve future claims that may be made against a fund. The risk of material loss from such claims is considered by management to be remote.
3. Fees and Transactions with Related Parties
Certain officers and directors of the corporation are also officers and/or directors of American Century Companies, Inc. (ACC). The corporation’s investment advisor, ACIM, the corporation's distributor, American Century Investment Services, Inc. (ACIS), and the corporation’s transfer agent, American Century Services, LLC, are wholly owned, directly or indirectly, by ACC. ACIM has engaged Perella Weinberg Partners Capital Management LP (PWP) as a subadvisor for the fund. PWP is responsible for making recommendations with respect to hiring, terminating, or replacing the fund’s underlying subadvisors. The fund’s underlying subadvisors at the period end were Arrowpoint Asset Management, LLC, Bain Capital Credit, LP (formerly Sankaty Advisors, LP), and Good Hill Partners LP. PWP determines the percentage of the fund’s portfolio allocated to each subadvisor, including PWP, in order to seek to achieve the fund’s investment objective. ACIM is responsible for entering into subadvisory agreements and overseeing the activities of each of the subadvisors including monitoring compliance with fund objectives, strategies and restrictions. ACIM pays all costs associated with retaining the subadvisors of the fund. ACIM and the fund’s subadvisors own 59% of the shares of the fund. Related parties do not invest in the fund for the purpose of exercising management or control.
Management Fees — The corporation has entered into a management agreement with ACIM, under which ACIM provides the fund with investment advisory and management services in exchange for a single, unified management fee (the fee) per class. The agreement provides that all expenses of managing and operating the fund, except distribution and service fees, expenses on securities sold short, brokerage expenses, taxes, interest, fees and expenses of the independent directors (including legal counsel fees), and extraordinary expenses, will be paid by ACIM. The fee is computed and accrued daily based on each class's daily net assets and paid monthly in arrears. The annual management fee is 2.00% for the Investor Class, A Class, C Class and R Class, 1.80% for the Institutional Class and 1.65% for the R6 Class. Effective October 1, 2016, the investment advisor agreed to waive 0.08% of the fund’s management fee. The investment advisor expects this waiver to continue until February 28, 2018, and cannot terminate it prior to such date without the approval of the Board of Directors. The total amount of the waiver for each class for the year ended October 31, 2016 was $2,560, $418, $1,199, $738, $120 and $178 for the Investor Class, Institutional Class, A Class, C Class,
R Class and the R6 Class, respectively. The effective annual management fee after waiver for each class for the year ended October 31, 2016 was 1.99% for the Investor Class, A Class, C Class and R Class, 1.79% for the Institutional Class and 1.64% for the R6 Class.
Distribution and Service Fees — The Board of Directors has adopted a separate Master Distribution and Individual Shareholder Services Plan for each of the A Class, C Class and R Class (collectively the plans), pursuant to Rule 12b-1 of the 1940 Act. The plans provide that the A Class will pay ACIS an annual distribution and service fee of 0.25%. The plans provide that the C Class will pay ACIS an annual distribution and service fee of 1.00%, of which 0.25% is paid for individual shareholder services and 0.75% is paid for distribution services. The plans provide that the R Class will pay ACIS an annual distribution and service fee of 0.50%. The fees are computed and accrued daily based on each class’s daily net assets and paid monthly in arrears. The fees are used to pay financial intermediaries for distribution and individual shareholder services. Fees incurred under the plans during the year ended October 31, 2016 are detailed in the Statement of Operations.
Directors' Fees and Expenses — The Board of Directors is responsible for overseeing the investment advisor’s management and operations of the fund. The directors receive detailed information about the fund and its investment advisor regularly throughout the year, and meet at least quarterly with management of the investment advisor to review reports about fund operations. The fund’s officers do not receive compensation from the fund.
Acquired Fund Fees and Expenses — The fund may invest in mutual funds, exchange-traded funds, and business development companies (the acquired funds). The fund will indirectly realize its pro rata share of the fees and expenses of the acquired funds in which it invests. These indirect fees and expenses are not paid out of the fund's assets but are reflected in the return realized by the fund on its investment in the acquired funds.
4. Investment Transactions
Purchases of investment securities and securities sold short, excluding short-term investments, for the year ended October 31, 2016 totaled $71,021,127, of which $3,627,664 represented U.S. Treasury and Government Agency obligations.
Sales of investment securities and securities sold short, excluding short-term investments, for the year ended October 31, 2016 totaled $47,533,402, of which $1,236,759 represented U.S. Treasury and Government Agency obligations.
Transactions in written options contracts during the year ended October 31, 2016 were as follows:
|
| | | | | | | | | | | | | | | | |
| | Outstanding, Beginning of Period |
Written | Closed |
Exercised |
Expired |
Outstanding, End of Period |
| Number of Contracts | — | 2,727 |
| (152 | ) | (1,139 | ) | (392 | ) | 1,044 |
|
| Premiums Received | — | $ | 193,038 |
| $ | (4,195 | ) | $ | (77,133 | ) | $ | (24,842 | ) | $ | 86,868 |
|
5. Capital Share Transactions
Transactions in shares of the fund were as follows:
|
| | | | | | | | | | |
| | Year ended
October 31, 2016 | Period ended October 31, 2015(1) |
| | Shares | Amount | Shares | Amount |
| Investor Class/Shares Authorized | 100,000,000 |
| | 100,000,000 |
| |
| Sold | 3,292,955 |
| $ | 31,071,814 |
| 2,298,236 |
| $ | 22,883,895 |
|
| Issued in reinvestment of distributions | 104,730 |
| 976,510 |
| — |
| — |
|
| Redeemed | (1,304,988 | ) | (12,393,227 | ) | (18,727 | ) | (182,732 | ) |
| | 2,092,697 |
| 19,655,097 |
| 2,279,509 |
| 22,701,163 |
|
| Institutional Class/Shares Authorized | 80,000,000 |
| | 100,000,000 |
| |
| Sold | 223,611 |
| 2,118,179 |
| 600,000 |
| 6,000,000 |
|
| Issued in reinvestment of distributions | 25,141 |
| 234,250 |
| — |
| — |
|
| Redeemed | (98,834 | ) | (946,715 | ) | — |
| — |
|
| | 149,918 |
| 1,405,714 |
| 600,000 |
| 6,000,000 |
|
| A Class/Shares Authorized | 40,000,000 |
| | 40,000,000 |
| |
| Sold | 1,296,924 |
| 12,305,538 |
| 1,007,990 |
| 10,077,617 |
|
| Issued in reinvestment of distributions | 41,367 |
| 385,742 |
| — |
| — |
|
| Redeemed | (201,729 | ) | (1,924,374 | ) | — |
| — |
|
| | 1,136,562 |
| 10,766,906 |
| 1,007,990 |
| 10,077,617 |
|
| C Class/Shares Authorized | 40,000,000 |
| | 40,000,000 |
| |
| Sold | 407,147 |
| 3,836,114 |
| 1,012,561 |
| 10,120,500 |
|
| Issued in reinvestment of distributions | 31,818 |
| 295,025 |
| — |
| — |
|
| Redeemed | (164,912 | ) | (1,564,736 | ) | — |
| — |
|
| | 274,053 |
| 2,566,403 |
| 1,012,561 |
| 10,120,500 |
|
| R Class/Shares Authorized | 20,000,000 |
| | 40,000,000 |
| |
| Sold | 33,029 |
| 312,786 |
| 200,000 |
| 2,000,000 |
|
| Issued in reinvestment of distributions | 6,535 |
| 60,792 |
| — |
| — |
|
| Redeemed | (32,853 | ) | (313,388 | ) | — |
| — |
|
| | 6,711 |
| 60,190 |
| 200,000 |
| 2,000,000 |
|
| R6 Class/Shares Authorized | 30,000,000 |
| | 40,000,000 |
| |
| Sold | 262,927 |
| 2,495,176 |
| 200,000 |
| 2,000,000 |
|
| Issued in reinvestment of distributions | 8,336 |
| 77,674 |
| — |
| — |
|
| Redeemed | (32,966 | ) | (316,108 | ) | — |
| — |
|
| | 238,297 |
| 2,256,742 |
| 200,000 |
| 2,000,000 |
|
| Net increase (decrease) | 3,898,238 |
| $ | 36,711,052 |
| 5,300,060 |
| $ | 52,899,280 |
|
| |
| (1) | May 29, 2015 (fund inception) through October 31, 2015. |
6. Fair Value Measurements
The fund’s investments valuation process is based on several considerations and may use multiple inputs to determine the fair value of the investments held by the fund. In conformity with accounting principles generally accepted in the United States of America, the inputs used to determine a valuation are classified into three broad levels.
| |
| • | Level 1 valuation inputs consist of unadjusted quoted prices in an active market for identical investments. |
| |
| • | Level 2 valuation inputs consist of direct or indirect observable market data (including quoted prices for comparable investments, evaluations of subsequent market events, interest rates, prepayment speeds, credit risk, etc.). These inputs also consist of quoted prices for identical investments initially expressed in local currencies that are adjusted through translation into U.S. dollars. |
| |
| • | Level 3 valuation inputs consist of unobservable data (including a fund’s own assumptions). |
The level classification is based on the lowest level input that is significant to the fair valuation measurement. The valuation inputs are not necessarily an indication of the risks associated with investing in these securities or other financial instruments. There were no significant transfers between levels during the period.
The following is a summary of the level classifications as of period end. The Schedule of Investments provides additional information on the fund’s portfolio holdings.
|
| | | | | | | | |
| | Level 1 | Level 2 | Level 3 |
| Assets | | | |
| Investment Securities | | | |
| Corporate Bonds | — |
| $ | 13,027,813 |
| — |
|
| Bank Loan Obligations | — |
| 9,949,242 |
| — |
|
| Asset-Backed Securities | — |
| 9,826,581 |
| — |
|
| Common Stocks | $ | 8,345,247 |
| — |
| — |
|
| Exchange-Traded Funds | 7,893,753 |
| — |
| — |
|
| Collateralized Loan Obligations | — |
| 6,436,657 |
| — |
|
| Commercial Mortgage-Backed Securities | — |
| 5,517,081 |
| — |
|
| Collateralized Mortgage Obligations | — |
| 2,939,787 |
| — |
|
| U.S. Treasury Securities | — |
| 2,348,968 |
| — |
|
| Exchange-Traded Notes | 2,226,005 |
| — |
| — |
|
| Purchased Options Contracts | 6,294 |
| — |
| — |
|
| Temporary Cash Investments | 21,440,619 |
| — |
| — |
|
| | $ | 39,911,918 |
| $ | 50,046,129 |
| — |
|
| Other Financial Instruments | | | |
| Futures Contracts | $ | 24,262 |
| $ | 58,838 |
| — |
|
| Swap Agreements | — |
| 78,185 |
| — |
|
| Forward Foreign Currency Exchange Contracts | — |
| 39 |
| — |
|
| | $ | 24,262 |
| $ | 137,062 |
| — |
|
| | | | |
| Liabilities | | | |
| Securities Sold Short | | | |
| Corporate Bonds | — |
| $ | 154,695 |
| — |
|
| Other Financial Instruments | | | |
| Swap Agreements | — |
| $ | 14,682 |
| — |
|
| Forward Foreign Currency Exchange Contracts | — |
| 2,150 |
| — |
|
| Written Options Contracts | $ | 39,314 |
| — |
| — |
|
| | $ | 39,314 |
| $ | 16,832 |
| — |
|
7. Derivative Instruments
Credit Risk — The fund is subject to credit risk in the normal course of pursuing its investment objectives. The value of a bond generally declines as the credit quality of its issuer declines. Credit default swap agreements enable a fund to buy/sell protection against a credit event of a specific issuer or index. A fund may attempt to enhance returns by selling protection or attempt to mitigate credit risk by buying protection. The buyer/seller of credit protection against a security or basket of securities may pay/receive an up-front or periodic payment to compensate for/against potential default events. Changes in value, including the periodic amounts of interest to be paid or received on swap agreements, are recorded as unrealized appreciation (depreciation) on swap agreements. Upon entering into a centrally cleared swap, a fund is required to deposit cash or securities (initial margin) with a financial intermediary in an amount equal to a certain percentage of the notional amount. Subsequent payments (variation margin) are made or received daily, in cash, by a fund. The variation margin is equal to the daily change in the value and is a component of unrealized gains and losses. Realized gain or loss is recorded upon receipt or payment of a periodic settlement or termination of swap agreements. Net realized and unrealized gains or losses occurring during the holding period of swap agreements are a component of net realized gain (loss) on swap agreement transactions and change in net unrealized appreciation (depreciation) on swap agreements, respectively. The risks of entering into swap agreements include the possible lack of liquidity, failure of the counterparty to meet its obligations, and that
there may be unfavorable changes in the underlying investments or instruments. The fund's average notional amount held during the period was $2,275,859.
Equity Price Risk — The fund is subject to equity price risk in the normal course of pursuing its investment objectives. A fund may enter into futures contracts, total return swap agreements or option contracts based on an equity index or specific security in order to manage its exposure to changes in market conditions. The risks of entering into equity price risk derivative instruments include the possible lack of liquidity, failure of the counterparty to meet its obligations, and that there may be unfavorable changes in the underlying investments or instruments.
A fund may purchase or write an option contract to protect against declines in market value on the underlying index or security. A purchased option contract provides the fund a right, but not an obligation, to buy (call) or sell (put) an equity-related asset at a specified exercise price within a certain period or on a specific date. A written option contract holds the corresponding obligation to sell (call writing) or buy (put writing) the underlying equity-related asset if the purchaser exercises the option contract. The buyer pays the seller an initial purchase price (premium) for this right. Option contracts purchased by a fund are accounted for in the same manner as marketable portfolio securities. The premium received by a fund for option contracts written is recorded as a liability and valued daily. The proceeds from securities sold through the exercise of option contracts are decreased by the premium paid to purchase the option contracts. A fund may recognize a realized gain or loss when the option contract is closed, exercised or expires. Net realized and unrealized gains or losses occurring during the holding period of purchased options contracts are a component of net realized gain (loss) on investment transactions and change in net unrealized appreciation (depreciation) on investments, respectively. Net realized and unrealized gains or losses occurring during the holding period of written options contracts are a component of net realized gain (loss) on written options contract transactions and change in net unrealized appreciation (depreciation) on written options contracts, respectively. The fund’s average exposure to these equity price risk derivative instruments during the period was 90 purchased options contracts and 920 written options contracts.
A fund may purchase futures contracts to gain exposure to increases in market value or sell futures contracts
to protect against a decline in market value. Upon entering into a futures contract, a fund is required to deposit
either cash or securities in an amount equal to a certain percentage of the contract value (initial margin).
Subsequent payments (variation margin) are made or received daily, in cash, by a fund. The variation margin
is equal to the daily change in the contract value and is recorded as unrealized gains and losses. A fund
recognizes a realized gain or loss when the contract is closed or expires. Net realized and unrealized gains or
losses occurring during the holding period of futures contracts are a component of net realized gain (loss) on
futures contract transactions and change in net unrealized appreciation (depreciation) on futures contracts,
respectively. The fund’s average exposure to these equity price risk derivative instruments during the period was 117 futures contracts.
A fund may enter into total return swap agreements in order to attempt to obtain or preserve a particular return or spread at a lower cost than obtaining a return or spread through purchases and/or sales of instruments in other markets or gain exposure to certain markets in the most economical way possible. A fund will segregate cash, cash equivalents or other appropriate liquid securities on its records in amounts sufficient to meet requirements. Changes in value, including the periodic amounts of interest to be paid or received on swap agreements, are recorded as unrealized appreciation (depreciation) on swap agreements. Realized gain or loss is recorded upon receipt or payment of a periodic settlement or termination of swap agreements. Net realized and unrealized gains or losses occurring during the holding period of swap agreements are a component of net realized gain (loss) on swap agreement transactions and change in net unrealized appreciation (depreciation) on swap agreements, respectively. The fund’s average swap agreement units held during the period was 8,341.
Foreign Currency Risk — The fund is subject to foreign currency exchange rate risk in the normal course of pursuing its investment objectives. The value of foreign investments held by a fund may be significantly affected by changes in foreign currency exchange rates. The dollar value of a foreign security generally decreases when the value of the dollar rises against the foreign currency in which the security is denominated and tends to increase when the value of the dollar declines against such foreign currency. A fund bears the risk of an unfavorable change in the foreign currency exchange rate underlying the forward foreign currency exchange contract or purchased call option contract. Additionally, losses, up to the fair value, may arise if the counterparties do not perform under the contract terms.
A fund may purchase a call option contract for the right to purchase a specific amount of a currency at a specific price on a specific date in the future. Option contracts purchased by a fund are accounted for in the same manner as marketable portfolio securities. The cost of currencies received through the exercise of call
option contracts is increased by the premium paid to purchase the option contracts. A fund recognizes a realized gain or loss when the option contract is closed or expires. Net realized and unrealized gains or losses occurring during the holding period of options contracts are a component of net realized gain (loss) on investment transactions and change in net unrealized appreciation (depreciation) on investments, respectively. The fund’s average exposure to foreign currency option contracts during the period was $350,000.
A fund may enter into forward foreign currency exchange contracts to reduce a fund's exposure to foreign currency exchange rate fluctuations or to gain exposure to the fluctuations in the value of foreign currencies. Forward foreign currency exchange contracts are transactions that require a specific amount of a currency to be delivered at a specific exchange rate on a specific date in the future. The net U.S. dollar value of foreign currency underlying all contractual commitments held by a fund and the resulting unrealized appreciation or depreciation are determined daily. Realized gain or loss is recorded upon the termination of the forward
foreign currency exchange contract. Net realized and unrealized gains or losses occurring during the holding period of forward foreign currency exchange contracts are a component of net realized gain (loss) on foreign currency transactions and change in net unrealized appreciation (depreciation) on translation of assets and liabilities in foreign currencies, respectively. The fund’s average U.S. dollar exposure to forward foreign currency exchange contracts held during the period was $583,400.
Interest Rate Risk — The fund is subject to interest rate risk in the normal course of pursuing its investment
objectives. The value of bonds generally declines as interest rates rise. A fund may enter into futures contracts
based on a bond index or a specific underlying security. A fund may purchase futures contracts to gain
exposure to increases in market value or sell futures contracts to protect against a decline in market value.
Upon entering into a futures contract, a fund will segregate cash, cash equivalents or other appropriate liquid
securities on its records in amounts sufficient to meet requirements. Subsequent payments (variation margin)
are made or received daily, in cash, by a fund. The variation margin is equal to the daily change in the contract
value and is recorded as unrealized gains and losses. A fund recognizes a realized gain or loss when the
futures contract is closed or expires. Net realized and unrealized gains or losses occurring during the holding
period of futures contracts are a component of net realized gain (loss) on futures contract transactions and
change in net unrealized appreciation (depreciation) on futures contracts, respectively. One of the risks of
entering into futures contracts is the possibility that the change in value of the contract may not correlate with
the changes in value of the underlying securities. The fund's average exposure to interest rate risk derivative
instruments held during the period was 16 contracts.
Value of Derivative Instruments as of October 31, 2016
|
| | | | | | | | |
| | Asset Derivatives | Liability Derivatives |
| Type of Risk Exposure | Location on Statement of Assets and Liabilities | Value | Location on Statement of Assets and Liabilities | Value |
| Credit Risk | Receivable for variation margin on swap agreements* | — |
| Payable for variation margin on swap agreements* | $ | 1,164 |
|
| Credit Risk | Swap agreements | $ | 553 |
| Swap agreements | 11,590 |
|
| Equity Price Risk | Investment securities | 6,294 |
| Investment securities | — |
|
| Equity Price Risk | Receivable for variation margin on futures contracts* | 3,515 |
| Payable for variation margin on futures contracts* | — |
|
| Equity Price Risk | Written options contracts | — |
| Written options contracts | 39,314 |
|
| Foreign Currency Risk | Unrealized appreciation on forward foreign currency exchange contracts | 39 |
| Unrealized depreciation on forward foreign currency exchange contracts | 2,150 |
|
| Interest Rate Risk | Receivable for variation margin on futures contracts* | — |
| Payable for variation margin on futures contracts* | 1,817 |
|
| | | $ | 10,401 |
| | $ | 56,035 |
|
* Included in the unrealized appreciation (depreciation) on centrally cleared credit default swap agreements or futures contracts, as applicable, as reported in the Schedule of Investments.
Effect of Derivative Instruments on the Statement of Operations for the Year Ended October 31, 2016
|
| | | | | | | | |
| | Net Realized Gain (Loss) | Change in Net Unrealized Appreciation (Depreciation) |
| Type of Risk Exposure | Location on Statement of Operations | Value | Location on Statement of Operations | Value |
| Credit Risk | Net realized gain (loss) on swap agreement transactions | $ | (26,471 | ) | Change in net unrealized appreciation (depreciation) on swap agreements | $ | (1,744 | ) |
| Equity Price Risk | Net realized gain (loss) on futures contract transactions | 142,191 |
| Change in net unrealized appreciation (depreciation) on futures contracts | 24,262 |
|
| Equity Price Risk | Net realized gain (loss) on investment transactions | (64,399 | ) | Change in net unrealized appreciation (depreciation) on investments | (14,362 | ) |
| Equity Price Risk | Net realized gain (loss) on written options contract transactions | 20,336 |
| Change in net unrealized appreciation (depreciation) on written options contracts | 47,554 |
|
| Equity Price Risk | Net realized gain (loss) on swap agreement transactions | (1,153,248 | ) | Change in net unrealized appreciation (depreciation) on swap agreements | 755,339 |
|
| Foreign Currency Risk | Net realized gain (loss) on investment transactions | (1,785 | ) | Change in net unrealized appreciation (depreciation) on investments | 1,331 |
|
| Foreign Currency Risk | Net realized gain (loss) on foreign currency transactions | 5,373 |
| Change in net unrealized appreciation (depreciation) on translation of assets and liabilities in foreign currencies | (3,398 | ) |
| Interest Rate Risk | Net realized gain (loss) on futures contract transactions | (16,036 | ) | Change in net unrealized appreciation (depreciation) on futures contracts | 58,838 |
|
| | | $ | 1,094,039 |
| | $ | 867,820 |
|
8. Risk Factors
ACIM utilizes multiple subadvisors to manage the fund’s assets, each employing its own particular investment strategy. Multi-manager strategies can increase the fund's portfolio turnover rate, which could result in higher levels of realized capital gains or losses, higher brokerage commissions and other transaction costs.
The fund’s investments in secured and unsecured participations in bank loan obligations and assignments of such loans may create substantial risk. The market for bank loans may not be highly liquid and the fund may have difficulty selling them. The fund’s bank loan investments typically will result in the fund having a contractual relationship only with the lender, not with the borrower. In connection with purchasing loan participations, the fund generally will have no right to enforce compliance by borrowers with loan terms nor any set off rights, and the fund may not benefit directly from any posted collateral. As a result, the fund may be subject to the credit risk of both the borrower and the lender selling the participation.
The fund may invest in collateralized debt obligations, collateralized loan obligations and other related instruments. Collateralized debt obligations are subject to credit, interest rate, valuation, and prepayment and extension risks. These securities also are subject to risk of default on the underlying asset, particularly during periods of economic downturn.
The fund may invest in foreign securities, which are generally riskier than U.S. securities. As a result the fund may be subject to foreign risk, meaning that political events (such as civil unrest, national elections and imposition of exchange controls), social and economic events (such as labor strikes and rising inflation), and natural disasters occurring in a country where the fund invests could cause the fund’s investments in that country to experience losses. For these and other reasons, securities of foreign issuers may be less liquid and more volatile. Investing in securities of companies located in emerging market countries generally is riskier than investing in securities of companies located in foreign developed countries.
Issuers of high-yield securities (also known as “junk bonds”) are more vulnerable to real or perceived economic changes (such as an economic downturn or a prolonged period of rising interest rates), political
changes or adverse developments specific to an issuer. These factors may be more likely to cause an issuer of low quality bonds to default on its obligations.
The fund may also be subject to liquidity risk. During periods of market turbulence or unusually low trading activity, in order to meet redemptions it may be necessary for the fund to sell securities at prices that could have an adverse effect on the fund’s share price.
Mortgage-related and other asset-backed securities are subject to additional risks including prepayment and extension risk. Mortgage-backed securities offered by non-governmental issuers are subject to specific risks, such as the failure of private insurers to meet their obligations and unexpectedly high rates of default on the mortgages backing the securities. Other asset-backed securities are subject to risks similar to those associated with mortgage-backed securities, as well as risks associated with the nature and servicing of the assets underlying the securities. Asset-backed securities may not have the benefit of a security interest in
collateral comparable to that of mortgage assets, resulting in additional credit risk.
9. Federal Tax Information
The tax character of distributions paid during the year ended October 31, 2016 and the period May 29, 2015 (fund inception) through October 31, 2015 were as follows:
|
| | | | | |
| | 2016 | 2015 |
| Distributions Paid From | | |
| Ordinary income | $ | 2,034,744 |
| — |
|
| Long-term capital gains | — |
| — |
|
The book-basis character of distributions made during the year from net investment income or net realized gains may differ from their ultimate characterization for federal income tax purposes. These differences reflect the differing character of certain income items and net realized gains and losses for financial statement and tax purposes, and may result in reclassification among certain capital accounts on the financial statements.
As of October 31, 2016, the federal tax cost of investments and the components of distributable earnings on a tax-basis were as follows:
|
| | | |
| Federal tax cost of investments | $ | 90,196,104 |
|
| Gross tax appreciation of investments | $ | 945,914 |
|
| Gross tax depreciation of investments | (1,183,971 | ) |
| Net tax appreciation (depreciation) of investments | (238,057 | ) |
| Net tax appreciation (depreciation) on securities sold short | 44,924 |
|
| Net tax appreciation (depreciation) on derivatives and translation of assets and liabilities in foreign currencies | (12,218 | ) |
| Net tax appreciation (depreciation) | $ | (205,351 | ) |
| Other book-to-tax adjustments | $ | (11,544 | ) |
| Undistributed ordinary income | $ | 278,142 |
|
| Accumulated short-term capital losses | $ | (2,277,603 | ) |
| Accumulated long-term capital losses | $ | (137,267 | ) |
The difference between book-basis and tax-basis unrealized appreciation (depreciation) is attributable primarily to the realization for tax purposes of unrealized gains (losses) on futures contracts. Other book-to-tax adjustments are attributable primarily to the tax deferral of losses on straddle positions.
Accumulated capital losses represent net capital loss carryovers that may be used to offset future realized capital gains for federal income tax purposes. The capital loss carryovers may be carried forward for an unlimited period. Future capital loss carryover utilization in any given year may be subject to Internal Revenue Code limitations.
|
| | | | | | | | | | | | | | | |
| For a Share Outstanding Throughout the Years Ended October 31 (except as noted) |
| Per-Share Data | Ratios and Supplemental Data |
| | | Income From Investment Operations: | | | | Ratio to Average Net Assets of: | | |
| | Net Asset Value, Beginning of Period | Net Investment Income (Loss)(1) | Net Realized and Unrealized Gain (Loss) | Total From Investment Operations | Distributions From Net
Investment
Income | Net Asset Value, End of Period | Total Return(2) | Operating Expenses(3) | Operating
Expenses
(before
expense
waiver)(3) | Net Investment Income (Loss) | Net
Investment
Income
(Loss)
(before
expense
waiver) | Portfolio Turnover Rate | Net Assets, End of Period (in thousands) |
| Investor Class | | | | | | | | | | | |
| 2016 | $9.61 | 0.24 | 0.04 | 0.28 | (0.41) | $9.48 | 3.03% | 2.00% | 2.01% | 2.57% | 2.56% | 98% |
| $41,447 |
|
2015(4) | $10.00 | 0.10 | (0.49) | (0.39) | — | $9.61 | (3.90)% | 2.00%(5) | 2.00%(5) | 2.55%(5) | 2.55%(5) | 23% |
| $21,898 |
|
| Institutional Class | | | | | | | | | | | |
| 2016 | $9.61 | 0.26 | 0.05 | 0.31 | (0.44) | $9.48 | 3.19% | 1.80% | 1.81% | 2.77% | 2.76% | 98% |
| $7,111 |
|
2015(4) | $10.00 | 0.11 | (0.50) | (0.39) | — | $9.61 | (3.80)% | 1.80%(5) | 1.80%(5) | 2.75%(5) | 2.75%(5) | 23% |
| $5,769 |
|
| A Class | | | | | | | | | | | | | |
| 2016 | $9.60 | 0.22 | 0.04 | 0.26 | (0.38) | $9.48 | 2.80% | 2.25% | 2.26% | 2.32% | 2.31% | 98% |
| $20,328 |
|
2015(4) | $10.00 | 0.09 | (0.49) | (0.40) | — | $9.60 | (4.00)% | 2.25%(5) | 2.25%(5) | 2.30%(5) | 2.30%(5) | 23% |
| $9,673 |
|
| C Class | | | | | | | | | | | | | |
| 2016 | $9.57 | 0.14 | 0.05 | 0.19 | (0.33) | $9.43 | 2.03% | 3.00% | 3.01% | 1.57% | 1.56% | 98% |
| $12,129 |
|
2015(4) | $10.00 | 0.06 | (0.49) | (0.43) | — | $9.57 | (4.30)% | 3.00%(5) | 3.00%(5) | 1.55%(5) | 1.55%(5) | 23% |
| $9,687 |
|
| R Class | | | | | | | | | | | | | |
| 2016 | $9.59 | 0.19 | 0.04 | 0.23 | (0.36) | $9.46 | 2.50% | 2.50% | 2.51% | 2.07% | 2.06% | 98% |
| $1,956 |
|
2015(4) | $10.00 | 0.08 | (0.49) | (0.41) | — | $9.59 | (4.10)% | 2.50%(5) | 2.50%(5) | 2.05%(5) | 2.05%(5) | 23% |
| $1,917 |
|
| R6 Class | | | | | | | | | | | | | |
| 2016 | $9.62 | 0.27 | 0.04 | 0.31 | (0.45) | $9.48 | 3.39% | 1.65% | 1.66% | 2.92% | 2.91% | 98% |
| $4,157 |
|
2015(4) | $10.00 | 0.12 | (0.50) | (0.38) | — | $9.62 | (3.80)% | 1.65%(5) | 1.65%(5) | 2.90%(5) | 2.90%(5) | 23% |
| $1,924 |
|
|
|
| Notes to Financial Highlights |
| |
| (1) | Computed using average shares outstanding throughout the period. |
| |
| (2) | Total returns are calculated based on the net asset value of the last business day and do not reflect applicable sales charges, if any. Total returns for periods less than one year are not annualized. |
| |
| (3) | Ratio of operating expenses to average net assets does not include any fees and expenses of the acquired funds. |
| |
| (4) | May 29, 2015 (fund inception) through October 31, 2015. |
See Notes to Financial Statements.
|
|
| Report of Independent Registered Public Accounting Firm |
To the Board of Directors and Shareholders of American Century Capital Portfolios, Inc.:
We have audited the accompanying statement of assets and liabilities, including the schedule of investments, of AC Alternatives® Income Fund (the “Fund”), one of the funds constituting American Century Capital Portfolios, Inc., as of October 31, 2016, and the related statement of operations for the year then ended, and the statements of changes in net assets and the financial highlights for the year then ended and for the period from May 29, 2015 (commencement date) through October 31, 2015. These financial statements and financial highlights are the responsibility of the Fund’s management. Our responsibility is to express an opinion on these financial statements and financial highlights based on our audits.
We conducted our audits in accordance with the standards of the Public Company Accounting Oversight Board (United States). Those standards require that we plan and perform the audit to obtain reasonable assurance about whether the financial statements and financial highlights are free of material misstatement. The Fund is not required to have, nor were we engaged to perform, an audit of its internal control over financial reporting. Our audits included consideration of internal control over financial reporting as a basis for designing audit procedures that are appropriate in the circumstances, but not for the purpose of expressing an opinion on the effectiveness of the Fund’s internal control over financial reporting. Accordingly, we express no such opinion. An audit also includes examining, on a test basis, evidence supporting the amounts and disclosures in the financial statements, assessing the accounting principles used and significant estimates made by management, as well as evaluating the overall financial statement presentation. Our procedures included confirmation of securities owned as of October 31, 2016, by correspondence with the custodian and brokers; when replies were not received from brokers, we performed other auditing procedures. We believe that our audits provide a reasonable basis for our opinion.
In our opinion, the financial statements and financial highlights referred to above present fairly, in all material respects, the financial position of AC Alternatives® Income Fund of American Century Capital Portfolios, Inc. as of October 31, 2016, the results of its operations for the year then ended, and the changes in its net assets and the financial highlights for the year then ended and for the period from May 29, 2015 (commencement date) through October 31, 2015, in conformity with accounting principles generally accepted in the United States of America.
DELOITTE & TOUCHE LLP
Kansas City, Missouri
December 19, 2016
The Board of Directors
The individuals listed below serve as directors of the funds. Each director will continue to serve in this capacity until death, retirement, resignation or removal from office. The board has adopted a mandatory retirement age for directors who are not “interested persons,” as that term is defined in the Investment Company Act (independent directors). Independent directors shall retire by December 31 of the year in which they reach their 75th birthday.
Mr. Thomas is an “interested person” because he currently serves as President and Chief Executive Officer of American Century Companies, Inc. (ACC), the parent company of American Century Investment Management, Inc. (ACIM or the advisor). The other directors (more than three-fourths of the total number) are independent. They are not employees, directors or officers of, and have no financial interest in, ACC or any of its wholly owned, direct or indirect, subsidiaries, including ACIM, American Century Investment Services, Inc. (ACIS) and American Century Services, LLC (ACS), and they do not have any other affiliations, positions or relationships that would cause them to be considered “interested persons” under the Investment Company Act. The directors serve in this capacity for seven (in the case of Mr. Thomas, 15) registered investment companies in the American Century Investments family of funds.
The following table presents additional information about the directors. The mailing address for each director is 4500 Main Street, Kansas City, Missouri 64111.
|
| | | | | |
Name
(Year of Birth) | Position(s) Held with Funds | Length of Time Served | Principal Occupation(s) During Past 5 Years | Number of American Century Portfolios Overseen by Director | Other Directorships Held During Past 5 Years |
| Independent Directors |
|
|
Barry Fink
(1955) | Director | Since 2012 | Retired; Executive Vice President, ACC (September 2007 to February 2013); President, ACS (October 2007 to February 2013); Chief Operating Officer, ACC (September 2007 to November 2012) | 81 | None |
Andrea C. Hall
(1945) | Director | Since 1997 | Retired | 81 | None |
Jan M. Lewis
(1957) | Director | Since 2011 | Retired; President and Chief Executive Officer, Catholic Charities of Northeast Kansas (human services organization) (2006 to 2013) | 81 | None |
James A. Olson
(1942) | Director and Chairman of the Board | Since 2007 (Chairman since 2014) | Member, Plaza Belmont LLC (private equity fund manager) (1999 to present) | 81 | Saia, Inc. (2002 to 2012) and EPR Properties (2003 to 2013) |
M. Jeannine Strandjord
(1945) | Director | Since 1994 | Retired | 81 | Euronet Worldwide Inc.; MGP Ingredients, Inc.; and DST Systems Inc. (1996 to 2012) |
|
| | | | | |
Name
(Year of Birth) | Position(s) Held with Funds | Length of Time Served | Principal Occupation(s) During Past 5 Years | Number of American Century Portfolios Overseen by Director | Other Directorships Held During Past 5 Years |
| Independent Directors |
|
|
John R. Whitten
(1946) | Director | Since 2008 | Retired | 81 | Rudolph Technologies, Inc. |
Stephen E. Yates
(1948) | Director | Since 2012 | Retired | 81 | None |
| Interested Director |
|
|
Jonathan S. Thomas
(1963) | Director and President | Since 2007 | President and Chief Executive Officer, ACC (March 2007 to present). Also serves as Chief Executive Officer, ACS; Executive Vice President, ACIM; Director, ACC, ACIM and other ACC subsidiaries | 125 | BioMed Valley Discoveries, Inc. |
The Statement of Additional Information has additional information about the fund's directors and is available without charge, upon request, by calling 1-800-345-2021.
Officers
The following table presents certain information about the executive officers of the funds. Each officer serves as an officer for each of the 15 investment companies in the American Century family of funds, unless otherwise noted. No officer is compensated for his or her service as an officer of the funds. The listed officers are interested persons of the funds and are appointed or re-appointed on an annual basis. The mailing address for each officer listed below is 4500 Main Street, Kansas City, Missouri 64111.
|
| | |
Name
(Year of Birth) | Offices with the Funds | Principal Occupation(s) During the Past Five Years |
Jonathan S. Thomas
(1963) | Director and President since 2007 | President and Chief Executive Officer, ACC (March 2007 to present). Also serves as Chief Executive Officer, ACS; Executive Vice President, ACIM; Director, ACC, ACIM and other ACC subsidiaries |
Amy D. Shelton
(1964) | Chief Compliance Officer and Vice President since 2014 | Chief Compliance Officer, American Century funds, (March 2014 to present); Chief Compliance Officer, ACIM (February 2014 to present); Chief Compliance Officer, ACIS (October 2009 to present); Vice President, Client Interactions and Marketing, ACIS (February 2013 to January 2014); Director, Client Interactions and Marketing, ACIS (June 2007 to January 2013). Also serves as Vice President, ACIS |
Charles A. Etherington
(1957) | General Counsel since 2007 and Senior Vice President since 2006 | Attorney, ACC (February 1994 to present); Vice President, ACC (November 2005 to present); General Counsel, ACC (March 2007 to present). Also serves as General Counsel, ACIM, ACS, ACIS and other ACC subsidiaries; and Senior Vice President, ACIM and ACS |
C. Jean Wade
(1964) | Vice President,Treasurer and Chief Financial Officer since 2012 | Vice President, ACS (February 2000 to present) |
Robert J. Leach
(1966) | Vice President since 2006 and Assistant Treasurer since 2012 | Vice President, ACS (February 2000 to present) |
David H. Reinmiller
(1963) | Vice President since 2000 | Attorney, ACC (January 1994 to present); Associate General Counsel, ACC (January 2001 to present). Also serves as Vice President, ACIM and ACS |
Ward D. Stauffer
(1960) | Secretary since 2005 | Attorney, ACC (June 2003 to present) |
|
|
| Approval of Management and Subadvisory Agreements |
At a meeting held on June 29, 2016, the Fund’s Board of Directors (the "Board") unanimously approved the renewal of the management agreement pursuant to which American Century Investment Management, Inc. (the “Advisor”) acts as the investment advisor for the Fund. The Board also unanimously approved the renewal of the Subadvisory Agreement with PWP (the “PWP Agreement”) and each underlying subadvisory agreement between the Advisor and each of the Fund’s underlying subadvisors (collectively, with the PWP Agreement, the “Subadvisory Agreements”). The underlying subadvisors approved by the Board were Arrowpoint Asset Management, LLC; Bain Capital Credit, LP (previously known as Sankaty Advisors, LP); Good Hill Partners LP; and MAST Capital Management, LLC (each a “Subadvisor,” and collectively with PWP, the “Subadvisors”). Under Section 15(c) of the Investment Company Act, contracts for investment advisory services (including subadvisory services) are required to be reviewed, evaluated, and approved by a majority of a fund’s directors (the “Directors”), including a majority of the independent Directors, each year.
The Fund is a multi-manager fund, which means that the Advisor has retained several subadvisors, each employing its own particular investment strategy, to manage and make investment decisions with respect to the Fund’s assets. The Advisor has engaged Perella Weinberg Partners Capital Management LP (“PWP”) to manage a portion of the Fund and to identify and recommend other underlying subadvisors to manage distinct investment strategies. PWP uses a flexible and opportunistic investment strategy that allocates Fund assets among underlying subadvisors with expertise in a particular investment strategy, and supplements those strategies with its own direct investment management and hedging strategies. PWP also provides tactical allocation of assets among the various underlying subadvisors and a framework for the risk management and investment monitoring of the Fund. The Advisor provides oversight of each of these functions.
Prior to its consideration of the renewal of the management agreement and Subadvisory Agreements, the Directors requested and reviewed extensive data and information compiled by the Advisor and certain independent providers of evaluation data concerning the Fund and the services provided to the Fund by the Advisor and each Subadvisor. This review was in addition to the oversight and evaluation undertaken by the Board and its committees on a continuous basis and the information received was supplemental to the extensive information that the Board and its committees receive and consider throughout the year.
In connection with its consideration of the renewal of the management agreement and the Subadvisory Agreements, the Board’s review and evaluation of the services provided by the Advisor included, but was not limited to, the following:
| |
| • | the nature, extent, and quality of investment management, shareholder services, and other services to be provided to the Fund; |
| |
| • | the wide range of other programs and services to be provided to the Fund and its shareholders on a routine and non-routine basis; |
| |
| • | the Fund’s investment performance compared to appropriate benchmarks and/or a peer group of other mutual funds with similar investment objectives and strategies; |
| |
| • | the cost of owning the Fund compared to the cost of owning similar funds; |
| |
| • | the compliance policies, procedures, and regulatory experience of the Fund's service providers; |
| |
| • | financial data showing the cost of services provided to the Fund, the profitability of the Fund to the Advisor, and the overall profitability of the Advisor; |
| |
| • | possible economies of scale associated with the Advisor’s management of the Fund and other accounts under its management; |
| |
| • | data comparing services provided and charges to the Advisor's other investment management clients; |
| |
| • | acquired fund fees and expenses; |
| |
| • | payments by the Fund and the Advisor to financial intermediaries; and |
| |
| • | any collateral benefits derived by the Advisor from the management of the Fund. |
In keeping with their practice, the Directors held two in-person meetings and one telephonic meeting to review and discuss the information provided. The independent Directors also had the benefit of the advice of their independent counsel throughout the process.
Factors Considered
The Directors considered all of the information provided by the Advisor, the independent data providers, and independent counsel in connection with the approval. They determined that the information was sufficient for them to evaluate the management agreement and the Subadvisory Agreements for the Fund. In connection with their review, the Directors did not identify any single factor as being all-important or controlling, and each Director may have attributed different levels of importance to different factors. In deciding to renew the management agreement and Subadvisory Agreements, the Board based its decision on a number of factors, including the following:
Nature, Extent and Quality of Services - Generally. Under the management agreement, the Advisor is responsible for providing or arranging for all services necessary for the operation of the Fund. The Board noted that under the management agreement, the Advisor provides or arranges at its own expense a wide variety of services including:
| |
| • | constructing and designing the Fund |
| |
| • | portfolio research and security selection |
| |
| • | initial capitalization/funding |
| |
| • | daily valuation of the Fund’s portfolio |
| |
| • | shareholder servicing and transfer agency, including shareholder confirmations, recordkeeping, and communications |
| |
| • | legal services (except the independent Directors’ counsel) |
| |
| • | regulatory and portfolio compliance |
| |
| • | marketing and distribution (except Rule 12b-1 plans) |
The Board noted that many of these services have expanded over time both in terms of quantity and complexity in response to shareholder demands, competition in the industry, changing distribution channels, and the changing regulatory environment.
Investment Management Services. The nature of the investment management services provided to the Fund is quite complex and allows Fund shareholders access to professional money management, instant diversification of their investments within an asset class, the opportunity to easily diversify among asset classes by investing in or exchanging among various American Century Investments funds, and liquidity. In evaluating investment performance, the Board expects the Advisor and Subadvisors to manage the Fund in accordance with its investment objectives and approved strategies. Further, the Directors recognize that the Advisor has an obligation to monitor trading activities, and in particular to seek the best execution of fund trades, and to evaluate the use of and payment for research. In providing these services, the Advisor and Subadvisors utilize teams of investment professionals (portfolio managers, analysts, research assistants, and securities traders) who require extensive information technology, research, training, compliance, and other systems to conduct their business. The Board, directly and through its Fund Performance Review Committee, regularly reviews investment performance information for the Fund, together with comparative information for appropriate benchmarks and/or peer groups of similarly-managed funds, over different time horizons. The Directors also review detailed performance information during the management agreement approval process. If performance concerns are identified, the Fund receives special reviews until performance improves, during which the Board discusses with
the Advisor the reasons for such results (e.g., market conditions, security selection) and any efforts being undertaken to improve performance. The Fund had less than one-year of performance history at the time of the Board’s review. The Board found the investment management services provided by the Advisor to the Fund to be satisfactory and consistent with the management agreement and Subadvisory Agreements.
Shareholder and Other Services. Under the management agreement, the Advisor provides the Fund with a comprehensive package of transfer agency, shareholder, and other services. The Board, directly and through various committees of the Board, regularly reviews reports and evaluations of such services at its regular meetings. These reports include, but are not limited to, information regarding the operational efficiency and accuracy of the shareholder and transfer agency services provided, staffing levels, shareholder satisfaction (as measured by external as well as internal sources), technology support, new products and services offered to Fund shareholders, securities trading activities, portfolio valuation services, auditing services, and legal and operational compliance activities. The Board particularly noted the Advisor’s continual efforts to maintain effective business continuity plans and to address cybersecurity threats. Certain aspects of shareholder and transfer agency service level efficiency and the quality of securities trading activities are measured by independent third party providers and are presented in comparison to other fund groups not managed by the Advisor. The Board found the services provided by the Advisor to the Fund under the management agreement to be competitive and of high quality.
Costs of Services and Profitability. The Advisor provides detailed information concerning its cost of providing various services to the Fund, its profitability in managing the Fund (pre- and post-distribution), its overall profitability, and its financial condition. The Directors have reviewed with the Advisor the methodology used to prepare this financial information. This information is considered in evaluating the Advisor’s financial condition, its ability to continue to provide services under the management agreement, and the reasonableness of the current management fee. The Board concluded that the Advisor’s profits were reasonable in light of the services provided to the Fund. The Board did not consider the profitability of the Subadvisors because each Subadvisor is paid from the unified management fee of the Advisor as a result of arms’ length negotiations.
Ethics. The Board generally considers the Advisor’s commitment to providing quality services to shareholders and to conducting its business ethically. They noted that the Advisor’s practices generally meet or exceed industry best practices. With respect to each Subadvisor, as part of their oversight responsibilities, the Board approves each Subadvisor’s code of ethics and any changes thereto. Further, through the Advisor’s compliance group, the Board stays abreast of any violations of a Subadvisor’s code.
Economies of Scale. The Board also reviewed information provided by the Advisor regarding the possible existence of economies of scale in connection with the management of the Fund. The Board concluded that economies of scale are difficult to measure and predict with precision, especially on a fund-by-fund basis. The Board concluded that the Advisor is appropriately sharing economies of scale through its competitive fee structure, offering competitive fees from fund inception, and through reinvestment in its business to provide shareholders additional content and services.
Comparison to Other Funds’ Fees. The management agreement provides that the Fund pays the Advisor a single, all-inclusive (or unified) management fee for providing all services necessary for the management and operation of the Fund, other than brokerage expenses, expenses attributable to short sales, taxes, interest, extraordinary expenses, and the fees and expenses of the Fund’s independent Directors (including their independent legal counsel) and expenses incurred in connection with the provision of shareholder services and distribution services under a plan adopted pursuant to Rule 12b-1 under the 1940 Act. The Board specifically noted that the subadvisory fee paid to each Subadvisor under the Subadvisory Agreements, as well as the terms of the Subadvisory Agreements, were subject to an arms’ length negotiation between the Advisor and each Subadvisor and are paid by the Advisor out of its unified management fee.
Under the unified fee structure, the Advisor is responsible for providing all investment advisory, custody, audit, administrative, compliance, recordkeeping, marketing and shareholder services, or arranging and supervising third parties to provide such services. By contrast, most other funds are charged a variety of fees, including an investment advisory fee, a transfer agency fee, an administrative fee, distribution charges, and other expenses. Other than their investment advisory fees and any applicable Rule 12b-1 distribution fees, all other components of the total fees charged by these other funds may be increased without shareholder approval. The Board believes the unified fee structure is a benefit to Fund shareholders because it clearly discloses to shareholders the cost of owning Fund shares, and, since the unified fee cannot be increased without a vote of Fund shareholders, it shifts to the Advisor the risk of increased costs of operating the Fund and provides a direct incentive to minimize administrative inefficiencies. Part of the Board’s analysis of fee levels involves reviewing certain evaluative data compiled by an independent provider comparing the Fund’s unified fee to the total expense ratios of its peers. The unified fee charged to shareholders of the Fund was above the median of the total expense ratios of the Fund’s peer expense universe and was within the range of its peer expense group. The Board concluded that the management fee paid by the Fund to the Advisor under the management agreement is reasonable in light of the services provided to the Fund.
Comparison to Fees and Services Provided to Other Clients of the Advisor. The Directors also requested and received information from the Advisor concerning the nature of the services, fees, costs and profitability of its advisory services to advisory clients other than the Fund. They observed that these varying types of client accounts require different services and involve different regulatory and entrepreneurial risks than the management of the Fund. The Board analyzed this information and concluded that the fees charged and services provided to the Fund were reasonable by comparison.
Payments to Intermediaries. The Directors also requested and received a description of payments made to intermediaries by the Fund and the Advisor. These payments include various payments made by the Fund or the Advisor to different types of intermediaries and recordkeepers for distribution and service activities provided for the Fund. The Board reviewed such information and found the payments to be reasonable in scope and purpose.
Collateral or “Fall-Out” Benefits Derived by the Advisor. The Board considered the existence of collateral benefits the Advisor may receive as a result of its relationship with the Fund. They concluded that the Advisor’s primary business is managing mutual funds and it generally does not use fund or shareholder information to generate profits in other lines of business, and therefore does not derive any significant collateral benefits from them. The Board noted that additional assets from other clients may offer the Advisor some benefit from increased leverage with service providers and counterparties. Additionally, the Advisor receives proprietary research from broker-dealers that execute fund portfolio transactions, which the Board concluded is likely to benefit other clients of the Advisor as well as Fund shareholders. The Board also determined that the Advisor is able to provide investment management services to certain clients other than the Fund, at least in part, due to its existing infrastructure built to serve the fund complex. The Board concluded that appropriate allocation methodologies had been employed to assign resources and the cost of those resources to these other clients and, where expressly provided, these other client assets may be included with the assets of the Fund to determine breakpoints in the management fee schedule.
Existing Relationship. The Board also considered whether there was any reason for not continuing the existing arrangement with the Advisor. In this regard, the Board was mindful of the potential disruptions of the Fund’s operations and various risks, uncertainties, and other effects that could occur as a result of a decision not to continue such relationship. In particular, the Board recognized that most shareholders have invested in the Fund on the strength of the Advisor’s industry standing and reputation and in the expectation that the Advisor will have a continuing role in providing advisory services to the Fund.
Conclusion of the Directors. As a result of this process, the Board, including all of the independent Directors, taking into account all of the factors discussed above and the information provided by the Advisor and others in connection with its review and throughout the year, determined that the management fee is fair and reasonable in light of the services provided and that the investment management agreement between the Fund and the Advisor, as well as the Subadvisory Agreements with each Subadvisor, should be renewed.
Approval of the Timbercreek Subadvisory Agreement
The Board, in considering the approval of the underlying subadvisory agreement between the Advisor and Timbercreek Asset Management (U.S.) LLC (“Timbercreek”), referred to herein as the “Timbercreek Subadvisory Agreement,” received detailed information regarding the Fund, its investment objective and strategy, characteristics, and key attributes, as well as the experience of those designated to manage the Fund.
The Board received a recommendation from the Advisor and PWP to approve Timbercreek as an underlying subadvisor for the Fund. The information considered and the discussions held with regard to Timbercreek included, but were not limited to:
| |
| • | the nature, extent, and quality of investment management services to be provided by Timbercreek to the Fund; |
| |
| • | Timbercreek’s breadth of experience in managing its particular investment strategy and in managing investments generally; |
| |
| • | the expected composition and liquidity of the securities held in Timbercreek’s portion of the Fund; |
| |
| • | data comparing the performance of Timbercreek’s proposed investment strategies employed in similar accounts to appropriate benchmarks; and |
| |
| • | the compliance policies, procedures, and regulatory experience of Timbercreek, including management of other 1940 Act registered investment companies, if applicable. |
The independent Directors reviewed the proposed fee for Timbercreek, noting that the compensation paid to Timbercreek would be paid by the Advisor out of the Fund’s unified fee. They also noted that the terms of the Timbercreek Subadvisory Agreement were the result of arms’ length negotiations between the Advisor and Timbercreek. The independent Directors considered all of the information provided by the Advisor, Timbercreek, and the independent Directors’ independent counsel in connection with the approval, and concluded that they had sufficient information to evaluate the proposed agreement on behalf of the Fund. In connection with their review, the Directors did not identify any single factor as being all-important or controlling, and each Director may have attributed different levels of importance to different factors. Based on all of the information considered, the independent Directors concluded that the Timbercreek Subadvisory Agreement was fair and reasonable in light of the services to be provided and should be approved.
Retirement Account Information
As required by law, distributions you receive from certain IRAs are subject to federal income tax withholding, unless you elect not to have withholding apply. Tax will be withheld on the total amount withdrawn even though you may be receiving amounts that are not subject to withholding, such as nondeductible contributions. In such case, excess amounts of withholding could occur. You may adjust your withholding election so that a greater or lesser amount will be withheld.
If you don’t want us to withhold on this amount, you must notify us to not withhold the federal income tax. You may notify us in writing or in certain situations by telephone or through other electronic means. For systematic withdrawals, your withholding election will remain in effect until revoked or changed by filing a new election. You have the right to revoke your election at any time.
Remember, even if you elect not to have income tax withheld, you are liable for paying income tax on the taxable portion of your withdrawal. If you elect not to have income tax withheld or you don’t have enough income tax withheld, you may be responsible for payment of estimated tax. You may incur penalties under the estimated tax rules if your withholding and estimated tax payments are not sufficient. You can reduce or defer the income tax on a distribution by directly or indirectly rolling such distribution over to another IRA or eligible plan. You should consult your tax advisor for additional information.
State tax will be withheld if, at the time of your distribution, your address is within one of the mandatory withholding states and you have federal income tax withheld (or as otherwise required by state law). State taxes will be withheld from your distribution in accordance with the respective state rules.
Distributions you receive from 403(b), 457 and qualified plans are subject to special tax and withholding rules. Your plan administrator or plan sponsor is required to provide you with a special tax notice explaining those rules at the time you request a distribution. If applicable, federal and/or state taxes may be withheld from your distribution amount.
Proxy Voting Policies
A description of the policies that the fund's investment advisor uses in exercising the voting rights associated with the securities purchased and/or held by the fund is available without charge, upon request, by calling 1-800-345-2021. It is also available on the "About Us" page of American Century Investments’ website at americancentury.com and on the Securities and Exchange Commission’s website at sec.gov. Information regarding how the investment advisor voted proxies relating to portfolio securities during the most recent 12-month period ended June 30 is available on the "About Us" page at americancentury.com. It is also available at sec.gov.
Quarterly Portfolio Disclosure
The fund files its complete schedule of portfolio holdings with the Securities and Exchange Commission (SEC) for the first and third quarters of each fiscal year on Form N-Q. The fund’s Forms N-Q are available on the SEC’s website at sec.gov, and may be reviewed and copied at the SEC’s Public Reference Room in Washington, DC. Information on the operation of the Public Reference Room may be obtained by calling 1-800-SEC-0330. The fund also makes its complete schedule of portfolio holdings for the most recent quarter of its fiscal year available on its website at americancentury.com and, upon request, by calling 1-800-345-2021.
Other Tax Information
The following information is provided pursuant to provisions of the Internal Revenue Code.
The fund hereby designates up to the maximum amount allowable as qualified dividend income for the fiscal year ended October 31, 2016.
For corporate taxpayers, the fund hereby designates $145,753, or up to the maximum amount allowable, of ordinary income distributions paid during the fiscal year ended October 31, 2016 as qualified for the corporate dividends received deduction.
|
| | |
| |
| | | |
| Contact Us | americancentury.com | |
| Automated Information Line | 1-800-345-8765 | |
| Investor Services Representative | 1-800-345-2021 or 816-531-5575 | |
| Investors Using Advisors | 1-800-378-9878 | |
| Business, Not-For-Profit, Employer-Sponsored Retirement Plans | 1-800-345-3533 | |
| Banks and Trust Companies, Broker-Dealers, Financial Professionals, Insurance Companies | 1-800-345-6488 | |
| Telecommunications Relay Service for the Deaf | 711 | |
| | | |
| American Century Capital Portfolios, Inc. | |
| | | |
Investment Advisor: American Century Investment Management, Inc. Kansas City, Missouri | |
| | | |
| This report and the statements it contains are submitted for the general information of our shareholders. The report is not authorized for distribution to prospective investors unless preceded or accompanied by an effective prospectus. | |
| | | |
©2016 American Century Proprietary Holdings, Inc. All rights reserved.
CL-ANN-90982 1612 | |
|
| |
| ANNUAL REPORT | |
| OCTOBER 31, 2016 |
| |
AC Alternatives® Long Short Fund
|
| | |
| President’s Letter | 2 |
|
| Performance | 3 |
|
| Portfolio Commentary | |
|
| Fund Characteristics | |
|
| Shareholder Fee Example | |
|
| Schedule of Investments | |
|
| Statement of Assets and Liabilities | |
|
| Statement of Operations | |
|
| Statement of Changes in Net Assets | |
|
| Notes to Financial Statements | |
|
| Financial Highlights | |
|
| Report of Independent Registered Public Accounting Firm | |
|
| Management | |
|
| Approval of Management and Subadvisory Agreements | |
|
| Additional Information | |
|
Any opinions expressed in this report reflect those of the author as of the date of the report, and do not necessarily represent the opinions of American Century Investments® or any other person in the American Century Investments organization. Any such opinions are subject to change at any time based upon market or other conditions and American Century Investments disclaims any responsibility to update such opinions. These opinions may not be relied upon as investment advice and, because investment decisions made by American Century Investments funds are based on numerous factors, may not be relied upon as an indication of trading intent on behalf of any American Century Investments fund. Security examples are used for representational purposes only and are not intended as recommendations to purchase or sell securities. Performance information for comparative indices and securities is provided to American Century Investments by third party vendors. To the best of American Century Investments’ knowledge, such information is accurate at the time of printing.
Jonathan Thomas
Dear Investor:
Thank you for reviewing this annual report for the period ended October 31, 2016. It provides investment performance and portfolio information, plus longer-term historical performance data. Annual reports help convey important information about fund returns, including market factors that affected performance during the reporting period. For additional, updated investment and market insights, we encourage you to visit our website, americancentury.com.
Central Bank Stimulus Boosted the Markets After Big Bouts of Volatility
The mostly positive returns for the full reporting period do not capture the short-term market volatility investors experienced at various times. Most broad stock and bond benchmarks posted gains, despite an interest rate increase by the Federal Reserve (Fed) in December 2015, extreme market volatility in early 2016 from global contagion concerns about China’s economic deceleration and currency devaluations, and more turmoil in June 2016 triggered by the unexpected U.K. vote to exit the European Union (Brexit).
Each big bout of financial market volatility was followed by another shot of monetary policy stimulus from central banks. Or, in the case of the Fed, delays in further interest rate increases. This stabilized the financial markets, and generally boosted their performance. The rising tide of monetary stimulus lifted most investment boats, including both stock and bond vehicles, which was unusual. Illustrating this phenomenon, the S&P 500 Index and the Bloomberg Barclays U.S. Aggregate Bond Index posted nearly equal performance, advancing 4.51% and 4.37%, respectively, for the 12 months. Global bond and real estate investment trust (REIT) indices exceeded that performance, while U.S. growth stock indices lagged; U.S. value equity generally outperformed U.S. growth.
The reporting period ended before the November 2016 U.S. presidential election, which, like Brexit, featured a surprising outcome with potentially far-reaching populist and anti-globalization ramifications that are still unfolding and being assessed. What we do know is that Donald Trump and his policy proposals face a deeply divided nation and add another layer of uncertainty to the global economic and market outlook, which could trigger further bouts of short-term volatility. In this challenging investment environment, we strongly believe in staying the course and remaining focused on longer-term goals, using disciplined, actively managed, diversified, risk-aware strategies. We appreciate your continued trust in us.
Sincerely,
Jonathan Thomas
President and Chief Executive Officer
American Century Investments
|
| | | | |
| Total Returns as of October 31, 2016 |
| | | | Average Annual Returns | |
| | Ticker Symbol | 1 year | Since
Inception | Inception
Date |
| Investor Class | ALEVX | 0.18% | 0.18% | 10/30/15 |
| HFRX Equity Hedge Index | — | -2.57% | -2.56% | — |
| MSCI ACWI Index | — | 2.05% | 2.04% | — |
| Institutional Class | ALEJX | 0.22% | 0.22% | 10/30/15 |
| A Class | ALEQX | | | 10/30/15 |
| No sales charge | | -0.17% | -0.17% | |
| With sales charge | | -5.94% | -5.91% | |
| C Class | ALEHX | -0.92% | -0.92% | 10/30/15 |
| R Class | ALEWX | -0.42% | -0.42% | 10/30/15 |
| R6 Class | ALEDX | 0.45% | 0.45% | 10/30/15 |
Sales charges include initial sales charges and contingent deferred sales charges (CDSCs), as applicable. A Class shares have a 5.75% maximum initial sales charge and may be subject to a maximum CDSC of 1.00%. C Class shares redeemed within 12 months of purchase are subject to a maximum CDSC of 1.00%. The SEC requires that mutual funds provide performance information net of maximum sales charges in all cases where charges could be applied.
Data presented reflect past performance. Past performance is no guarantee of future results. Current performance may be higher or lower than the performance shown. Total returns for periods less than one year are not annualized. Investment return and principal value will fluctuate, and redemption value may be more or less than original cost. Data assumes reinvestment of dividends and capital gains, and none of the charts reflect the deduction of taxes that a shareholder would pay on fund distributions or the redemption of fund shares. To obtain performance data current to the most recent month end, please call 1-800-345-2021 or visit americancentury.com. For additional information about the fund, please consult the prospectus.
|
|
| Growth of $10,000 Over Life of Class |
| $10,000 investment made October 30, 2015 |
| Performance for other share classes will vary due to differences in fee structure. |
|
| |
| Value on October 31, 2016 |
| | Investor Class — $10,018 |
| |
| | HFRX Equity Hedge Index — $9,743 |
| |
| | MSCI ACWI Index — $10,205 |
| |
|
| | | | | |
| Total Annual Fund Operating Expenses |
| Investor Class | Institutional Class | A Class | C Class | R Class | R6 Class |
| 3.33% | 3.13% | 3.58% | 4.33% | 3.83% | 2.98% |
The total annual fund operating expenses shown is as stated in the fund’s prospectus current as of the date of this report. The prospectus may vary from the expense ratio shown elsewhere in this report because it is based on a different time period, includes acquired fund fees and expenses, and, if applicable, does not include fee waivers or expense reimbursements.
Data presented reflect past performance. Past performance is no guarantee of future results. Current performance may be higher or lower than the performance shown. Total returns for periods less than one year are not annualized. Investment return and principal value will fluctuate, and redemption value may be more or less than original cost. Data assumes reinvestment of dividends and capital gains, and none of the charts reflect the deduction of taxes that a shareholder would pay on fund distributions or the redemption of fund shares. To obtain performance data current to the most recent month end, please call 1-800-345-2021 or visit americancentury.com. For additional information about the fund, please consult the prospectus.
Subadvisor: Perella Weinberg Partners Capital Management LP
Portfolio Managers: Chris Bittman, Kent Muckel and Darren Myers
Performance Summary
For the fiscal year ended October 31, 2016, AC Alternatives Long Short Fund generated a return of 0.18%*. This compares favorably to a return of -2.57% for the HFRX Equity Hedge Index. The fund generated that outperformance with less volatility, as measured by standard deviation, than the HFRX Equity Hedge Index. In comparison to the broad equity market, the MSCI ACWI Index returned 2.05% for the year.
Performance Review
In its inaugural year, the fund generated outperformance versus its benchmark in what proved to be a volatile market environment. The MSCI ACWI Index, for example, fell -9.12% from November to February before rallying back 12.29% from March to October. Sectors such as utilities and telecommunication services, along with so-called “low volatility” stocks, outperformed during the first part of the year as investors sought income in a low-yield environment before reversing sharply in more recent months. Technology and financials sectors had the opposite dynamic, falling in the early part of the year before regaining traction. Global macroeconomic events, such as the Brexit referendum in June and the uncertainty ahead of the November U.S. presidential election, added to the market’s instability. While the subadvisors were collectively able to generate outperformance relative to the benchmark, the general environment for stock selection was challenging.
Outperformance came from a variety of areas, a testament to the diversification provided through the fund’s multi-manager approach. During the equity market’s drawdown in January and February, for example, the fund was able to minimize losses through defensive positioning and its use of hedges within the overlay strategy (a strategy that attempts to dynamically adjust the risk profile of the fund for the anticipated market environment). This positioning helped to reduce overall net market exposure. Coming out of that market drawdown, exposure to the technology sector increased as the subadvisors found value in some of the names that had performed poorly. As technology rebounded, that exposure proved to be the biggest single contributor to outperformance over the remainder of the year. One detractor for the year was the fund’s exposure to European equities. After generating losses earlier in the year, the European equity markets recouped some of the losses as markets rallied following the Brexit event in June.
The fund benefited from some of its more unique positions. An investment in a group of Argentinean equities, for example, outperformed the market. Equity values increased as political changes in Argentina boosted expectations for future economic growth in the region. Finally, an overlay position that sought to benefit from outperformance of value equities over growth equities contributed favorably to performance. Exposure to merger arbitrage (a strategy to take advantage of short-term price changes in stocks involved in or rumored to be involved in mergers and acquisitions) and activist strategies proved less successful. Both of those strategies finished with negative performance for the year.
*All fund returns referenced in this commentary are for Investor Class shares. Performance for other share classes will vary due to differences in fee structure; when Investor Class performance exceeds that of the fund's benchmark, other share classes may not. See page 3 for returns for all share classes.
Outlook
We believe the fund’s long/short, multi-manager approach is well-suited for the years ahead. The overall environment for hedged strategies, and stock selection more broadly, may have favorable tailwinds going forward should market volatility increase. With equity markets generally showing elevated valuations relative to historic levels, and economic growth continuing to be a cause for concern globally, the ability to go both long and short can be an important tool in the search for alpha in the years ahead.
|
| |
| OCTOBER 31, 2016 | |
| Types of Investments in Portfolio | % of net assets |
| Common Stocks | 75.7% |
| Exchange-Traded Funds | 2.4% |
| Participatory Notes | 1.7% |
| Exchange-Traded Funds Sold Short | (13.1)% |
| Common Stocks Sold Short | (9.6)% |
| Temporary Cash Investments | 16.1% |
| Other Assets and Liabilities | 26.8%* |
*Amount relates primarily to deposits with brokers for securities sold short and derivative instruments.
Fund shareholders may incur two types of costs: (1) transaction costs, including sales charges (loads) on purchase payments and redemption/exchange fees; and (2) ongoing costs, including management fees; distribution and service (12b-1) fees; and other fund expenses. This example is intended to help you understand your ongoing costs (in dollars) of investing in your fund and to compare these costs with the ongoing cost of investing in other mutual funds.
The example is based on an investment of $1,000 made at the beginning of the period and held for the entire period from May 1, 2016 to October 31, 2016.
Actual Expenses
The table provides information about actual account values and actual expenses for each class. You may use the information, together with the amount you invested, to estimate the expenses that you paid over the period. First, identify the share class you own. Then simply divide your account value by $1,000 (for example, an $8,600 account value divided by $1,000 = 8.6), then multiply the result by the number under the heading “Expenses Paid During Period” to estimate the expenses you paid on your account during this period.
If you hold Investor Class shares of any American Century Investments fund, or Institutional Class shares of the American Century Diversified Bond Fund, in an American Century Investments account (i.e., not a financial intermediary or retirement plan account), American Century Investments may charge you a $12.50 semiannual account maintenance fee if the value of those shares is less than $10,000. We will redeem shares automatically in one of your accounts to pay the $12.50 fee. In determining your total eligible investment amount, we will include your investments in all personal accounts (including American Century Investments Brokerage accounts) registered under your Social Security number. Personal accounts include individual accounts, joint accounts, UGMA/UTMA accounts, personal trusts, Coverdell Education Savings Accounts and IRAs (including traditional, Roth, Rollover, SEP-, SARSEP- and SIMPLE-IRAs), and certain other retirement accounts. If you have only business, business retirement, employer-sponsored or American Century Investments Brokerage accounts, you are currently not subject to this fee. If you are subject to the Account Maintenance Fee, your account value could be reduced by the fee amount.
Hypothetical Example for Comparison Purposes
The table also provides information about hypothetical account values and hypothetical expenses based on the actual expense ratio of each class of your fund and an assumed rate of return of 5% per year before expenses, which is not the actual return of a fund’s share class. The hypothetical account values and expenses may not be used to estimate the actual ending account balance or expenses you paid for the period. You may use this information to compare the ongoing costs of investing in your fund and other funds. To do so, compare this 5% hypothetical example with the 5% hypothetical examples that appear in the shareholder reports of the other funds.
Please note that the expenses shown in the table are meant to highlight your ongoing costs only and do not reflect any transactional costs, such as sales charges (loads) or redemption/exchange fees. Therefore, the table is useful in comparing ongoing costs only, and will not help you determine the relative total costs of owning different funds. In addition, if these transactional costs were included, your costs would have been higher.
|
| | | | |
| Beginning
Account Value
5/1/16 | Ending
Account Value
10/31/16 | Expenses Paid
During Period(1)
5/1/16 - 10/31/16 | Annualized
Expense Ratio(1) |
| Actual | | | | |
| Investor Class | $1,000 | $1,030.80 | $15.82 | 3.10% |
| Institutional Class | $1,000 | $1,031.80 | $14.81 | 2.90% |
| A Class | $1,000 | $1,028.70 | $17.08 | 3.35% |
| C Class | $1,000 | $1,024.70 | $20.87 | 4.10% |
| R Class | $1,000 | $1,027.70 | $18.35 | 3.60% |
| R6 Class | $1,000 | $1,032.80 | $14.05 | 2.75% |
| Hypothetical | | | | |
| Investor Class | $1,000 | $1,009.55 | $15.66 | 3.10% |
| Institutional Class | $1,000 | $1,010.56 | $14.66 | 2.90% |
| A Class | $1,000 | $1,008.30 | $16.91 | 3.35% |
| C Class | $1,000 | $1,004.53 | $20.66 | 4.10% |
| R Class | $1,000 | $1,007.04 | $18.16 | 3.60% |
| R6 Class | $1,000 | $1,011.31 | $13.90 | 2.75% |
| |
| (1) | Expenses are equal to the class's annualized expense ratio listed in the table above, multiplied by the average account value over the period, multiplied by 184, the number of days in the most recent fiscal half-year, divided by 366, to reflect the one-half year period. |
OCTOBER 31, 2016
|
| | | | | |
| | Shares | Value |
| COMMON STOCKS — 75.7% | | |
| Aerospace and Defense — 0.9% | | |
| Airbus Group SE | 2,848 |
| $ | 169,294 |
|
| Arconic, Inc. | 149 |
| 4,279 |
|
General Dynamics Corp.(1) | 69 |
| 10,401 |
|
L-3 Communications Holdings, Inc.(1) | 29 |
| 3,971 |
|
Lockheed Martin Corp.(1) | 984 |
| 242,438 |
|
Northrop Grumman Corp.(1) | 45 |
| 10,305 |
|
Textron, Inc.(1) | 74 |
| 2,966 |
|
| United Technologies Corp. | 277 |
| 28,310 |
|
| | | 471,964 |
|
| Air Freight and Logistics — 0.8% | | |
FedEx Corp.(1) | 2,383 |
| 415,405 |
|
| Auto Components — 0.1% | | |
Adient plc(2) | 1,252 |
| 56,978 |
|
Goodyear Tire & Rubber Co. (The)(1) | 90 |
| 2,613 |
|
| | | 59,591 |
|
| Automobiles — 0.5% | | |
| Bayerische Motoren Werke AG | 970 |
| 84,515 |
|
| Daimler AG | 2,336 |
| 166,452 |
|
Ford Motor Co.(1) | 1,302 |
| 15,285 |
|
General Motors Co.(1) | 534 |
| 16,874 |
|
| | | 283,126 |
|
| Banks — 5.2% | | |
| ABN AMRO Group NV CVA | 13,226 |
| 305,259 |
|
Banco Macro SA ADR(1) | 1,511 |
| 115,183 |
|
| Bank of America Corp. | 35,249 |
| 581,608 |
|
| Bank of the Ozarks, Inc. | 5,381 |
| 198,882 |
|
| BB&T Corp. | 265 |
| 10,388 |
|
| BBVA Banco Frances SA ADR | 4,028 |
| 79,070 |
|
| CIT Group, Inc. | 58 |
| 2,107 |
|
Citigroup, Inc.(1) | 1,020 |
| 50,133 |
|
Citizens Financial Group, Inc.(1) | 106 |
| 2,792 |
|
Comerica, Inc.(1) | 60 |
| 3,125 |
|
| Danske Bank A/S | 5,843 |
| 180,400 |
|
| DNB ASA | 16,673 |
| 241,145 |
|
| Erste Group Bank AG | 3,403 |
| 106,877 |
|
Fifth Third Bancorp(1) | 272 |
| 5,919 |
|
First Republic Bank(1) | 48 |
| 3,573 |
|
Grupo Financiero Galicia SA ADR(1) | 3,529 |
| 109,893 |
|
Huntington Bancshares, Inc.(1) | 272 |
| 2,883 |
|
JPMorgan Chase & Co.(1) | 1,256 |
| 86,991 |
|
KBC Group NV(2) | 1,954 |
| 119,069 |
|
KeyCorp(1) | 288 |
| 4,067 |
|
M&T Bank Corp.(1) | 54 |
| 6,627 |
|
| Nordea Bank AB | 29,105 |
| 305,965 |
|
PNC Financial Services Group, Inc. (The)(1) | 175 |
| 16,730 |
|
|
| | | | | |
| | Shares | Value |
Regions Financial Corp.(1) | 451 |
| $ | 4,830 |
|
SunTrust Banks, Inc.(1) | 174 |
| 7,870 |
|
| U.S. Bancorp | 565 |
| 25,289 |
|
Wells Fargo & Co.(1) | 1,590 |
| 73,156 |
|
Western Alliance Bancorp(1)(2) | 2,878 |
| 107,522 |
|
| | | 2,757,353 |
|
| Beverages — 2.1% | | |
Constellation Brands, Inc., Class A(1) | 5,832 |
| 974,644 |
|
| Heineken NV | 1,923 |
| 158,429 |
|
Molson Coors Brewing Co., Class B(1) | 47 |
| 4,879 |
|
| | | 1,137,952 |
|
| Biotechnology — 0.5% | | |
| Actelion Ltd. | 567 |
| 81,937 |
|
Alnylam Pharmaceuticals, Inc.(2) | 733 |
| 26,095 |
|
Biogen, Inc.(2) | 187 |
| 52,393 |
|
Incyte Corp.(2) | 1,243 |
| 108,104 |
|
| | | 268,529 |
|
| Building Products — 1.0% | | |
Johnson Controls International plc(1) | 12,522 |
| 504,887 |
|
| Capital Markets — 2.1% | | |
Affiliated Managers Group, Inc.(1)(2) | 4,208 |
| 558,233 |
|
| Bank of New York Mellon Corp. (The) | 336 |
| 14,539 |
|
| BlackRock, Inc. | 29 |
| 9,896 |
|
Charles Schwab Corp. (The)(1) | 113 |
| 3,582 |
|
| CME Group, Inc. | 109 |
| 10,911 |
|
E*TRADE Financial Corp.(1)(2) | 98 |
| 2,760 |
|
Franklin Resources, Inc.(1) | 130 |
| 4,376 |
|
Goldman Sachs Group, Inc. (The)(1) | 147 |
| 26,201 |
|
Intercontinental Exchange, Inc.(1) | 436 |
| 117,890 |
|
| Invesco Ltd. | 126 |
| 3,539 |
|
Morgan Stanley(1) | 524 |
| 17,591 |
|
Northern Trust Corp.(1) | 79 |
| 5,721 |
|
| OM Asset Management plc | 7,141 |
| 100,474 |
|
Raymond James Financial, Inc.(1) | 44 |
| 2,645 |
|
State Street Corp.(1) | 137 |
| 9,619 |
|
| Thomson Reuters Corp. | 113 |
| 4,453 |
|
| UBS Group AG | 17,146 |
| 242,579 |
|
| | | 1,135,009 |
|
| Chemicals — 3.0% | | |
| Akzo Nobel NV | 1,868 |
| 120,739 |
|
| Albemarle Corp. | 2,020 |
| 168,771 |
|
| BASF SE | 4,322 |
| 380,981 |
|
Celanese Corp.(1) | 48 |
| 3,500 |
|
Dow Chemical Co. (The)(1) | 326 |
| 17,542 |
|
E.I. du Pont de Nemours & Co.(1) | 166 |
| 11,419 |
|
Eastman Chemical Co.(1) | 37 |
| 2,661 |
|
Ingevity Corp.(2) | 13 |
| 538 |
|
| Linde AG | 1,480 |
| 244,188 |
|
Mosaic Co. (The)(1) | 122 |
| 2,871 |
|
Sherwin-Williams Co. (The)(1) | 1,729 |
| 423,363 |
|
Valvoline, Inc.(2) | 2,455 |
| 50,082 |
|
|
| | | | | |
| | Shares | Value |
| Yara International ASA | 4,312 |
| $ | 152,391 |
|
| | | 1,579,046 |
|
| Commercial Services and Supplies — 0.3% | | |
Republic Services, Inc.(1) | 82 |
| 4,315 |
|
| Securitas AB, B Shares | 8,655 |
| 133,771 |
|
| Waste Management, Inc. | 142 |
| 9,324 |
|
| | | 147,410 |
|
| Communications Equipment — 2.3% | | |
Arista Networks, Inc.(1)(2) | 2,100 |
| 177,975 |
|
ARRIS International plc(2) | 4,000 |
| 111,120 |
|
| Brocade Communications Systems, Inc. | 4,600 |
| 48,760 |
|
| Cisco Systems, Inc. | 6,925 |
| 212,459 |
|
CommScope Holding Co., Inc.(2) | 1,293 |
| 39,501 |
|
F5 Networks, Inc.(2) | 900 |
| 124,389 |
|
Finisar Corp.(2) | 1,900 |
| 52,022 |
|
Harris Corp.(1) | 35 |
| 3,122 |
|
Juniper Networks, Inc.(1) | 4,499 |
| 118,504 |
|
Oclaro, Inc.(2) | 14,294 |
| 104,489 |
|
Palo Alto Networks, Inc.(2) | 1,100 |
| 169,213 |
|
Radware Ltd.(2) | 4,876 |
| 65,875 |
|
| | | 1,227,429 |
|
| Construction Materials — 0.6% | | |
Cemex SAB de CV ADR(2) | 20,817 |
| 180,691 |
|
| HeidelbergCement AG | 693 |
| 65,545 |
|
| LafargeHolcim Ltd. | 1,168 |
| 62,381 |
|
Martin Marietta Materials, Inc.(1) | 20 |
| 3,708 |
|
| Vulcan Materials Co. | 39 |
| 4,415 |
|
| | | 316,740 |
|
| Consumer Finance — 0.1% | | |
| Ally Financial, Inc. | 154 |
| 2,783 |
|
| American Express Co. | 239 |
| 15,874 |
|
Capital One Financial Corp.(1) | 188 |
| 13,920 |
|
Discover Financial Services(1) | 151 |
| 8,506 |
|
| | | 41,083 |
|
Containers and Packaging† | | |
| WestRock Co. | 79 |
| 3,649 |
|
| Diversified Consumer Services — 0.4% | | |
LifeLock, Inc.(1)(2) | 13,165 |
| 211,957 |
|
| Diversified Financial Services — 0.2% | | |
Berkshire Hathaway, Inc., Class B(2) | 586 |
| 84,560 |
|
| Voya Financial, Inc. | 77 |
| 2,352 |
|
| | | 86,912 |
|
| Diversified Telecommunication Services — 1.1% | | |
| AT&T, Inc. | 1,761 |
| 64,787 |
|
| Cellnex Telecom SA | 7,982 |
| 131,083 |
|
CenturyLink, Inc.(1) | 193 |
| 5,130 |
|
| Deutsche Telekom AG | 7,405 |
| 120,673 |
|
Level 3 Communications, Inc.(1)(2) | 89 |
| 4,997 |
|
Ooma, Inc.(2) | 3,000 |
| 25,950 |
|
| Sunrise Communications Group AG | 1,906 |
| 130,206 |
|
| Telecom Argentina SA ADR | 4,745 |
| 89,301 |
|
|
| | | | | |
| | Shares | Value |
| Verizon Communications, Inc. | 100 |
| $ | 4,810 |
|
| | | 576,937 |
|
| Electric Utilities — 0.5% | | |
| American Electric Power Co., Inc. | 172 |
| 11,152 |
|
Duke Energy Corp.(1) | 241 |
| 19,285 |
|
Edison International(1) | 114 |
| 8,377 |
|
Entergy Corp.(1) | 63 |
| 4,642 |
|
Eversource Energy(1) | 111 |
| 6,112 |
|
Exelon Corp.(1) | 303 |
| 10,323 |
|
FirstEnergy Corp.(1) | 145 |
| 4,972 |
|
Pampa Energia SA ADR(2) | 3,888 |
| 132,464 |
|
PG&E Corp.(1) | 168 |
| 10,436 |
|
PPL Corp.(1) | 233 |
| 8,001 |
|
Southern Co. (The)(1) | 314 |
| 16,193 |
|
| Xcel Energy, Inc. | 174 |
| 7,230 |
|
| | | 239,187 |
|
| Electrical Equipment — 0.5% | | |
| Eaton Corp. plc | 157 |
| 10,012 |
|
Emerson Electric Co.(1) | 70 |
| 3,547 |
|
| Mabuchi Motor Co. Ltd. | 300 |
| 17,479 |
|
| Prysmian SpA | 4,910 |
| 122,190 |
|
| Vestas Wind Systems A/S | 1,533 |
| 122,965 |
|
| | | 276,193 |
|
| Electronic Equipment, Instruments and Components — 0.7% | | |
Corning, Inc.(1) | 420 |
| 9,538 |
|
Fitbit, Inc.(2) | 3,000 |
| 39,780 |
|
Flex Ltd.(2) | 17,212 |
| 244,239 |
|
Orbotech Ltd.(2) | 2,600 |
| 71,240 |
|
| | | 364,797 |
|
| Energy Equipment and Services — 0.6% | | |
| Baker Hughes, Inc. | 144 |
| 7,978 |
|
Halliburton Co.(1) | 2,902 |
| 133,492 |
|
National Oilwell Varco, Inc.(1) | 132 |
| 4,237 |
|
| Schlumberger Ltd. | 2,035 |
| 159,198 |
|
Weatherford International plc(2) | 263 |
| 1,268 |
|
| | | 306,173 |
|
| Equity Real Estate Investment Trusts (REITs) — 0.4% | | |
| AvalonBay Communities, Inc. | 45 |
| 7,703 |
|
| Crown Castle International Corp. | 1,218 |
| 110,826 |
|
Equity Residential(1) | 124 |
| 7,657 |
|
Essex Property Trust, Inc.(1) | 22 |
| 4,710 |
|
General Growth Properties, Inc.(1) | 198 |
| 4,940 |
|
HCP, Inc.(1) | 157 |
| 5,377 |
|
Host Hotels & Resorts, Inc.(1) | 265 |
| 4,102 |
|
Kimco Realty Corp.(1) | 139 |
| 3,699 |
|
Macerich Co. (The)(1) | 52 |
| 3,681 |
|
Prologis, Inc.(1) | 178 |
| 9,284 |
|
Realty Income Corp.(1) | 83 |
| 4,917 |
|
SL Green Realty Corp.(1) | 33 |
| 3,241 |
|
| UDR, Inc. | 88 |
| 3,077 |
|
| Ventas, Inc. | 113 |
| 7,656 |
|
|
| | | | | |
| | Shares | Value |
| Vornado Realty Trust | 64 |
| $ | 5,938 |
|
| Welltower, Inc. | 67 |
| 4,592 |
|
| Weyerhaeuser Co. | 153 |
| 4,579 |
|
| | | 195,979 |
|
| Food and Staples Retailing — 0.1% | | |
| CVS Health Corp. | 28 |
| 2,355 |
|
| Sysco Corp. | 138 |
| 6,640 |
|
| Wal-Mart Stores, Inc. | 514 |
| 35,990 |
|
| Walgreens Boots Alliance, Inc. | 242 |
| 20,021 |
|
| | | 65,006 |
|
| Food Products — 0.9% | | |
Adecoagro SA(2) | 8,752 |
| 96,272 |
|
| Archer-Daniels-Midland Co. | 218 |
| 9,498 |
|
| Bunge Ltd. | 51 |
| 3,162 |
|
ConAgra Foods, Inc.(1) | 123 |
| 5,926 |
|
J.M. Smucker Co. (The)(1) | 41 |
| 5,384 |
|
Mondelez International, Inc., Class A(1) | 554 |
| 24,897 |
|
| Nestle SA | 4,260 |
| 308,883 |
|
| Tyson Foods, Inc., Class A | 93 |
| 6,589 |
|
| | | 460,611 |
|
| Health Care Equipment and Supplies — 0.6% | | |
| Abbott Laboratories | 501 |
| 19,659 |
|
| Baxter International, Inc. | 66 |
| 3,141 |
|
Becton Dickinson and Co.(1) | 1,211 |
| 203,339 |
|
Boston Scientific Corp.(2) | 423 |
| 9,306 |
|
Danaher Corp.(1) | 162 |
| 12,725 |
|
| Medtronic plc | 481 |
| 39,452 |
|
St. Jude Medical, Inc.(1) | 41 |
| 3,192 |
|
Stryker Corp.(1) | 58 |
| 6,690 |
|
| Zimmer Biomet Holdings, Inc. | 55 |
| 5,797 |
|
| | | 303,301 |
|
| Health Care Providers and Services — 1.0% | | |
Acadia Healthcare Co., Inc.(2) | 1,861 |
| 66,922 |
|
| Aetna, Inc. | 90 |
| 9,661 |
|
| Anthem, Inc. | 71 |
| 8,652 |
|
DaVita, Inc.(1)(2) | 43 |
| 2,521 |
|
Express Scripts Holding Co.(1)(2) | 37 |
| 2,494 |
|
| Fresenius Medical Care AG & Co. KGaA | 1,703 |
| 138,733 |
|
HCA Holdings, Inc.(1)(2) | 1,602 |
| 122,601 |
|
Laboratory Corp. of America Holdings(1)(2) | 22 |
| 2,757 |
|
Quest Diagnostics, Inc.(1) | 48 |
| 3,909 |
|
| Universal Health Services, Inc., Class B | 1,594 |
| 192,412 |
|
| | | 550,662 |
|
| Hotels, Restaurants and Leisure — 0.9% | | |
Arcos Dorados Holdings, Inc., Class A(1)(2) | 30,399 |
| 186,954 |
|
Carnival Corp.(1) | 147 |
| 7,218 |
|
| McDonald's Corp. | 2,522 |
| 283,902 |
|
MGM Resorts International(1)(2) | 143 |
| 3,742 |
|
| Royal Caribbean Cruises Ltd. | 59 |
| 4,535 |
|
| | | 486,351 |
|
|
| | | | | |
| | Shares | Value |
Household Durables† | | |
| Whirlpool Corp. | 24 |
| $ | 3,596 |
|
| Household Products — 0.5% | | |
Colgate-Palmolive Co.(1) | 38 |
| 2,712 |
|
Kimberly-Clark Corp.(1) | 25 |
| 2,860 |
|
| Procter & Gamble Co. (The) | 786 |
| 68,225 |
|
| Svenska Cellulosa AB SCA, B Shares | 6,388 |
| 180,985 |
|
| | | 254,782 |
|
| Industrial Conglomerates — 1.6% | | |
General Electric Co.(1) | 3,453 |
| 100,482 |
|
| Koninklijke Philips NV | 4,079 |
| 122,958 |
|
| Rheinmetall AG | 3,700 |
| 256,332 |
|
Roper Technologies, Inc.(1) | 21 |
| 3,640 |
|
| Siemens AG | 3,366 |
| 382,251 |
|
| | | 865,663 |
|
| Insurance — 1.0% | | |
| Aflac, Inc. | 146 |
| 10,055 |
|
| Ageas | 4,419 |
| 161,416 |
|
Alleghany Corp.(2) | 6 |
| 3,097 |
|
| Allianz SE | 1,082 |
| 168,663 |
|
| Allstate Corp. (The) | 139 |
| 9,438 |
|
| American International Group, Inc. | 448 |
| 27,642 |
|
Arch Capital Group Ltd.(2) | 43 |
| 3,353 |
|
| Chubb Ltd. | 158 |
| 20,066 |
|
Cincinnati Financial Corp.(1) | 55 |
| 3,893 |
|
eHealth, Inc.(2) | 1,000 |
| 7,830 |
|
| Everest Re Group Ltd. | 15 |
| 3,053 |
|
FNF Group(1) | 94 |
| 3,376 |
|
Hartford Financial Services Group, Inc. (The)(1) | 144 |
| 6,352 |
|
Lincoln National Corp.(1) | 86 |
| 4,222 |
|
Loews Corp.(1) | 106 |
| 4,561 |
|
Markel Corp.(1)(2) | 3 |
| 2,632 |
|
Marsh & McLennan Cos., Inc.(1) | 73 |
| 4,627 |
|
MetLife, Inc.(1) | 319 |
| 14,980 |
|
Patriot National, Inc.(2) | 2,200 |
| 13,948 |
|
Principal Financial Group, Inc.(1) | 99 |
| 5,405 |
|
Progressive Corp. (The)(1) | 198 |
| 6,239 |
|
Prudential Financial, Inc.(1) | 153 |
| 12,973 |
|
| Torchmark Corp. | 44 |
| 2,790 |
|
| Travelers Cos., Inc. (The) | 107 |
| 11,575 |
|
| Unum Group | 85 |
| 3,009 |
|
| XL Group Ltd. | 105 |
| 3,643 |
|
| | | 518,838 |
|
| Internet and Direct Marketing Retail — 0.7% | | |
Ctrip.com International Ltd. ADR(2) | 1,300 |
| 57,395 |
|
Priceline Group, Inc. (The)(2) | 35 |
| 51,598 |
|
Yoox Net-A-Porter Group SpA(2) | 8,790 |
| 252,810 |
|
| | | 361,803 |
|
| Internet Software and Services — 4.8% | | |
Alibaba Group Holding Ltd. ADR(2) | 4,735 |
| 481,502 |
|
Alphabet, Inc., Class A(1)(2) | 400 |
| 323,960 |
|
|
| | | | | |
| | Shares | Value |
Alphabet, Inc., Class C(2) | 700 |
| $ | 549,178 |
|
eBay, Inc.(2) | 2,400 |
| 68,424 |
|
Facebook, Inc., Class A(2) | 2,128 |
| 278,747 |
|
MercadoLibre, Inc.(1) | 970 |
| 162,970 |
|
SINA Corp.(2) | 3,055 |
| 220,388 |
|
| Tencent Holdings Ltd. | 12,286 |
| 326,019 |
|
| United Internet AG | 2,510 |
| 103,022 |
|
Yahoo!, Inc.(2) | 324 |
| 13,462 |
|
| | | 2,527,672 |
|
| IT Services — 1.3% | | |
| Amdocs Ltd. | 52 |
| 3,039 |
|
| Automatic Data Processing, Inc. | 32 |
| 2,786 |
|
Cognizant Technology Solutions Corp., Class A(1)(2) | 700 |
| 35,945 |
|
Computer Sciences Corp.(1) | 46 |
| 2,505 |
|
| CSRA, Inc. | 3,555 |
| 89,195 |
|
Fidelity National Information Services, Inc.(1) | 1,054 |
| 77,912 |
|
International Business Machines Corp.(1) | 136 |
| 20,902 |
|
| Leidos Holdings, Inc. | 216 |
| 8,979 |
|
| Total System Services, Inc. | 500 |
| 24,940 |
|
| Travelport Worldwide Ltd. | 9,500 |
| 134,140 |
|
Visa, Inc., Class A(1) | 3,500 |
| 288,785 |
|
| Xerox Corp. | 371 |
| 3,624 |
|
| | | 692,752 |
|
Leisure Products† | | |
Mattel, Inc.(1) | 113 |
| 3,563 |
|
Life Sciences Tools and Services† | | |
| Agilent Technologies, Inc. | 108 |
| 4,705 |
|
| Thermo Fisher Scientific, Inc. | 90 |
| 13,233 |
|
| | | 17,938 |
|
| Machinery — 0.9% | | |
Caterpillar, Inc.(1) | 172 |
| 14,355 |
|
Deere & Co.(1) | 94 |
| 8,300 |
|
Dover Corp.(1) | 54 |
| 3,612 |
|
| Fortive Corp. | 81 |
| 4,135 |
|
| Ingersoll-Rand plc | 84 |
| 5,652 |
|
Parker-Hannifin Corp.(1) | 26 |
| 3,192 |
|
| Pentair plc | 61 |
| 3,363 |
|
| Sandvik AB | 17,701 |
| 201,269 |
|
| SKF AB, B Shares | 14,333 |
| 242,952 |
|
Stanley Black & Decker, Inc.(1) | 47 |
| 5,351 |
|
| | | 492,181 |
|
| Media — 3.5% | | |
Altice NV(2) | 2,851 |
| 52,579 |
|
Comcast Corp., Class A(1) | 69 |
| 4,266 |
|
Discovery Communications, Inc., Class A(2) | 5,022 |
| 131,124 |
|
DISH Network Corp., Class A(2) | 5,852 |
| 342,693 |
|
| JCDecaux SA | 6,827 |
| 208,755 |
|
Liberty Global plc(2) | 12,416 |
| 394,829 |
|
Liberty Media Corp.-Liberty Braves, Class C(2) | 12 |
| 200 |
|
Liberty Media Corp.-Liberty Media, Class C(2) | 16 |
| 438 |
|
Liberty Media Corp.-Liberty SiriusXM, Class C(2) | 68 |
| 2,257 |
|
|
| | | | | |
| | Shares | Value |
| Publicis Groupe SA | 600 |
| $ | 41,166 |
|
| Schibsted ASA | 5,299 |
| 127,050 |
|
Time Warner, Inc.(1) | 5,932 |
| 527,889 |
|
| Twenty-First Century Fox, Inc., Class A | 131 |
| 3,441 |
|
| | | 1,836,687 |
|
| Metals and Mining — 1.2% | | |
AngloGold Ashanti Ltd. ADR(2) | 14,725 |
| 202,321 |
|
| APERAM SA | 1,672 |
| 75,978 |
|
Freeport-McMoRan, Inc.(1) | 401 |
| 4,483 |
|
Newmont Mining Corp.(1) | 6,201 |
| 229,685 |
|
Nucor Corp.(1) | 106 |
| 5,178 |
|
| Silver Wheaton Corp. | 4,542 |
| 109,508 |
|
| | | 627,153 |
|
Mortgage Real Estate Investment Trusts (REITs)† | | |
| Annaly Capital Management, Inc. | 326 |
| 3,377 |
|
| Multi-Utilities — 0.1% | | |
| Ameren Corp. | 85 |
| 4,246 |
|
CenterPoint Energy, Inc.(1) | 149 |
| 3,397 |
|
| CMS Energy Corp. | 96 |
| 4,046 |
|
Consolidated Edison, Inc.(1) | 100 |
| 7,555 |
|
Dominion Resources, Inc.(1) | 197 |
| 14,814 |
|
DTE Energy Co.(1) | 63 |
| 6,049 |
|
Public Service Enterprise Group, Inc.(1) | 178 |
| 7,490 |
|
SCANA Corp.(1) | 50 |
| 3,668 |
|
| Sempra Energy | 85 |
| 9,104 |
|
| WEC Energy Group, Inc. | 109 |
| 6,510 |
|
| | | 66,879 |
|
| Multiline Retail — 0.3% | | |
Dollar Tree, Inc.(2) | 1,850 |
| 139,768 |
|
Kohl's Corp.(1) | 68 |
| 2,975 |
|
Target Corp.(1) | 207 |
| 14,227 |
|
| | | 156,970 |
|
| Oil, Gas and Consumable Fuels — 3.3% | | |
| Anadarko Petroleum Corp. | 2,951 |
| 175,407 |
|
| Apache Corp. | 132 |
| 7,851 |
|
| Cabot Oil & Gas Corp. | 4,671 |
| 97,531 |
|
| California Resources Corp. | 3 |
| 31 |
|
| Canadian Natural Resources Ltd. | 5,487 |
| 173,993 |
|
Cheniere Energy, Inc.(1)(2) | 83 |
| 3,129 |
|
| Chevron Corp. | 641 |
| 67,145 |
|
Cimarex Energy Co.(1) | 32 |
| 4,132 |
|
Concho Resources, Inc.(1)(2) | 2,604 |
| 330,552 |
|
ConocoPhillips(1) | 425 |
| 18,466 |
|
Devon Energy Corp.(1) | 142 |
| 5,380 |
|
| Eni SpA | 12,586 |
| 182,513 |
|
EOG Resources, Inc.(1) | 173 |
| 15,643 |
|
| EQT Corp. | 55 |
| 3,630 |
|
| Exxon Mobil Corp. | 1,442 |
| 120,147 |
|
Hess Corp.(1) | 88 |
| 4,221 |
|
HollyFrontier Corp.(1) | 55 |
| 1,372 |
|
Kinder Morgan, Inc.(1) | 610 |
| 12,462 |
|
|
| | | | | |
| | Shares | Value |
Marathon Oil Corp.(1) | 236 |
| $ | 3,111 |
|
Marathon Petroleum Corp.(1) | 167 |
| 7,280 |
|
Noble Energy, Inc.(1) | 146 |
| 5,033 |
|
| Occidental Petroleum Corp. | 263 |
| 19,175 |
|
Parsley Energy, Inc., Class A(2) | 10,493 |
| 345,220 |
|
Phillips 66(1) | 184 |
| 14,932 |
|
Pioneer Natural Resources Co.(1) | 52 |
| 9,309 |
|
Spectra Energy Corp.(1) | 231 |
| 9,658 |
|
| Tesoro Corp. | 41 |
| 3,484 |
|
| Valero Energy Corp. | 172 |
| 10,189 |
|
| YPF SA ADR | 4,370 |
| 77,611 |
|
| | | 1,728,607 |
|
Personal Products† | | |
| Coty, Inc., Class A | 543 |
| 12,484 |
|
| Pharmaceuticals — 3.2% | | |
Allergan plc(1)(2) | 4,520 |
| 944,409 |
|
| Bristol-Myers Squibb Co. | 1,469 |
| 74,787 |
|
Endo International plc(2) | 48 |
| 900 |
|
| Johnson & Johnson | 821 |
| 95,228 |
|
| Merck & Co., Inc. | 6,485 |
| 380,799 |
|
| Merck KGaA | 1,003 |
| 103,124 |
|
| Perrigo Co. plc | 39 |
| 3,244 |
|
| Pfizer, Inc. | 2,098 |
| 66,527 |
|
| | | 1,669,018 |
|
Road and Rail† | | |
| CSX Corp. | 242 |
| 7,384 |
|
Kansas City Southern(1) | 37 |
| 3,247 |
|
Norfolk Southern Corp.(1) | 100 |
| 9,300 |
|
| | | 19,931 |
|
| Semiconductors and Semiconductor Equipment — 13.8% | | |
Advanced Energy Industries, Inc.(1)(2) | 906 |
| 43,216 |
|
| Applied Materials, Inc. | 2,769 |
| 80,523 |
|
ASML Holding NV New York Shares(1) | 2,156 |
| 227,717 |
|
Broadcom Ltd.(1) | 4,175 |
| 710,919 |
|
Cavium, Inc.(1)(2) | 6,600 |
| 372,570 |
|
| Infineon Technologies AG | 20,829 |
| 373,958 |
|
Integrated Device Technology, Inc.(2) | 5,700 |
| 118,047 |
|
Intel Corp.(1) | 1,466 |
| 51,119 |
|
| Intersil Corp., Class A | 1,100 |
| 24,288 |
|
| KLA-Tencor Corp. | 2,800 |
| 210,308 |
|
| Lam Research Corp. | 10,313 |
| 998,917 |
|
Lattice Semiconductor Corp.(2) | 35,800 |
| 217,306 |
|
Marvell Technology Group Ltd.(1) | 30,915 |
| 402,822 |
|
Maxim Integrated Products, Inc.(1) | 8,627 |
| 341,888 |
|
Mellanox Technologies Ltd.(2) | 6,316 |
| 274,114 |
|
Micron Technology, Inc.(1)(2) | 325 |
| 5,577 |
|
Microsemi Corp.(1)(2) | 3,300 |
| 139,029 |
|
NVIDIA Corp.(1) | 182 |
| 12,951 |
|
NXP Semiconductors NV(2) | 3,400 |
| 340,000 |
|
ON Semiconductor Corp.(2) | 17,500 |
| 204,225 |
|
Qorvo, Inc.(1)(2) | 10,300 |
| 573,195 |
|
|
| | | | | |
| | Shares | Value |
| QUALCOMM, Inc. | 1,819 |
| $ | 125,002 |
|
Rudolph Technologies, Inc.(2) | 1,728 |
| 31,277 |
|
Skyworks Solutions, Inc.(1) | 4,300 |
| 330,842 |
|
Synaptics, Inc.(1)(2) | 6,272 |
| 326,897 |
|
| Taiwan Semiconductor Manufacturing Co. Ltd. ADR | 7,663 |
| 238,319 |
|
Teradyne, Inc.(1) | 16,809 |
| 391,482 |
|
Tower Semiconductor Ltd.(2) | 7,263 |
| 112,940 |
|
| Xilinx, Inc. | 67 |
| 3,408 |
|
| | | 7,282,856 |
|
| Software — 6.6% | | |
| Activision Blizzard, Inc. | 165 |
| 7,123 |
|
| CA, Inc. | 104 |
| 3,197 |
|
Check Point Software Technologies Ltd.(2) | 1,300 |
| 109,928 |
|
CommVault Systems, Inc.(2) | 103 |
| 5,511 |
|
CyberArk Software Ltd.(2) | 1,646 |
| 76,950 |
|
Dell Technologies, Inc. - VMware, Inc., Class V(2) | 68 |
| 3,338 |
|
Fortinet, Inc.(1)(2) | 6,200 |
| 198,772 |
|
| Mentor Graphics Corp. | 1,400 |
| 40,460 |
|
Microsoft Corp.(1) | 9,210 |
| 551,863 |
|
Nuance Communications, Inc.(2) | 12,100 |
| 169,642 |
|
Oracle Corp.(1) | 9,367 |
| 359,880 |
|
PTC, Inc.(2) | 6,424 |
| 304,755 |
|
salesforce.com, Inc.(2) | 1,400 |
| 105,224 |
|
Splunk, Inc.(2) | 700 |
| 42,133 |
|
| Symantec Corp. | 9,767 |
| 244,468 |
|
Synopsys, Inc.(1)(2) | 7,454 |
| 442,097 |
|
Tableau Software, Inc., Class A(2) | 963 |
| 46,272 |
|
TiVo Corp.(1)(2) | 14,059 |
| 279,071 |
|
Verint Systems, Inc.(2) | 5,056 |
| 182,016 |
|
VMware, Inc., Class A(1)(2) | 3,128 |
| 245,861 |
|
Zynga, Inc., Class A(2) | 23,200 |
| 65,192 |
|
| | | 3,483,753 |
|
Specialty Retail† | | |
| Best Buy Co., Inc. | 105 |
| 4,086 |
|
| Staples, Inc. | 233 |
| 1,724 |
|
| | | 5,810 |
|
| Technology Hardware, Storage and Peripherals — 4.0% | | |
Apple, Inc.(1) | 4,600 |
| 522,284 |
|
| CPI Card Group, Inc. | 12,053 |
| 66,291 |
|
Electronics For Imaging, Inc.(1)(2) | 4,100 |
| 174,373 |
|
Hewlett Packard Enterprise Co.(1) | 9,216 |
| 207,084 |
|
| HP, Inc. | 608 |
| 8,810 |
|
NetApp, Inc.(1) | 11,984 |
| 406,737 |
|
Western Digital Corp.(1) | 12,363 |
| 722,494 |
|
| | | 2,108,073 |
|
Textiles, Apparel and Luxury Goods† | | |
PVH Corp.(1) | 28 |
| 2,995 |
|
| Tobacco — 1.0% | | |
| British American Tobacco plc | 7,197 |
| 413,280 |
|
| Philip Morris International, Inc. | 265 |
| 25,557 |
|
|
| | | | | |
| | Shares | Value |
| Swedish Match AB | 3,005 |
| $ | 104,568 |
|
| | | 543,405 |
|
Water Utilities† | | |
| American Water Works Co., Inc. | 62 |
| 4,590 |
|
| Wireless Telecommunication Services — 0.5% | | |
| China Mobile Ltd. | 14,374 |
| 164,673 |
|
T-Mobile US, Inc.(2) | 96 |
| 4,774 |
|
| VimpelCom Ltd. ADR | 20,864 |
| 69,686 |
|
| | | 239,133 |
|
TOTAL COMMON STOCKS
(Cost $38,189,815) | | 40,003,748 |
|
| EXCHANGE-TRADED FUNDS — 2.4% | | |
iShares Global Financials ETF
(Cost $1,273,063) | 24,310 |
| 1,272,142 |
|
| PARTICIPATORY NOTES — 1.7% | | |
| Banks — 0.8% | | |
Alinma Bank (HSBC Bank plc), 1/22/18(3)
| 121,637 |
| 435,524 |
|
| Materials — 0.9% | | |
Saudi Basic Industries Corp. (Merrill Lynch International & Co. C.V.), 3/2/17(3)
| 21,733 |
| 490,881 |
|
TOTAL PARTICIPATORY NOTES (Cost $888,443) | | 926,405 |
|
| TEMPORARY CASH INVESTMENTS — 16.1% | | |
State Street Institutional U.S. Government Money Market Fund, Premier Class
(Cost $8,517,376) | 8,517,376 |
| 8,517,376 |
|
TOTAL INVESTMENT SECURITIES BEFORE SECURITIES SOLD SHORT — 95.9%
(Cost $48,868,697) | 50,719,671 |
|
| SECURITIES SOLD SHORT — (22.7)% | | |
| EXCHANGE-TRADED FUNDS SOLD SHORT — (13.1)% | | |
| Consumer Discretionary Select Sector SPDR Fund | (2,545 | ) | (198,764 | ) |
| Health Care Select Sector SPDR Fund | (1,278 | ) | (86,086 | ) |
| Industrial Select Sector SPDR Fund | (4,036 | ) | (230,900 | ) |
| iShares Russell 1000 Growth ETF | (25,120 | ) | (2,555,709 | ) |
| Materials Select Sector SPDR Fund | (2,466 | ) | (115,285 | ) |
| SPDR S&P 500 ETF Trust | (5,302 | ) | (1,126,940 | ) |
| SPDR S&P Regional Banking ETF | (4,215 | ) | (184,575 | ) |
| Technology Select Sector SPDR Fund | (51,490 | ) | (2,441,656 | ) |
TOTAL EXCHANGE-TRADED FUNDS SOLD SHORT
(Proceeds $6,761,116) | | (6,939,915 | ) |
| COMMON STOCKS SOLD SHORT — (9.6)% | | |
| Aerospace and Defense — (0.1)% | | |
| Boeing Co. (The) | (394 | ) | (56,118 | ) |
| Air Freight and Logistics — (0.3)% | | |
| United Parcel Service, Inc., Class B | (1,312 | ) | (141,381 | ) |
| Auto Components — (0.4)% | | |
| Delphi Automotive plc | (1,643 | ) | (106,910 | ) |
| Dorman Products, Inc. | (1,600 | ) | (102,784 | ) |
| | | (209,694 | ) |
| Automobiles — (1.5)% | | |
| Bayerische Motoren Werke AG | (1,395 | ) | (121,544 | ) |
| Ford Motor Co. | (14,566 | ) | (171,005 | ) |
| Harley-Davidson, Inc. | (2,786 | ) | (158,858 | ) |
|
| | | | | |
| | Shares | Value |
| Tesla Motors, Inc. | (800 | ) | $ | (158,184 | ) |
| Volkswagen AG Preference Shares | (1,338 | ) | (183,892 | ) |
| | | (793,483 | ) |
| Banks — (0.1)% | | |
| Societe Generale SA | (1,730 | ) | (67,532 | ) |
| Diversified Telecommunication Services — (0.7)% | | |
| AT&T, Inc. | (5,039 | ) | (185,385 | ) |
| Verizon Communications, Inc. | (3,298 | ) | (158,634 | ) |
| | | (344,019 | ) |
| Electrical Equipment — (0.3)% | | |
| Acuity Brands, Inc. | (600 | ) | (134,142 | ) |
| Food and Staples Retailing — (0.7)% | | |
| Wal-Mart Stores, Inc. | (1,995 | ) | (139,690 | ) |
| Whole Foods Market, Inc. | (1,894 | ) | (53,581 | ) |
| Woolworths Ltd. | (9,680 | ) | (174,149 | ) |
| | | (367,420 | ) |
| Health Care Equipment and Supplies — (0.2)% | | |
| Becton Dickinson and Co. | (652 | ) | (109,477 | ) |
| Hotels, Restaurants and Leisure — (1.0)% | | |
| Chipotle Mexican Grill, Inc. | (209 | ) | (75,399 | ) |
| Darden Restaurants, Inc. | (1,439 | ) | (93,233 | ) |
| McDonald's Corp. | (1,524 | ) | (171,557 | ) |
| Starbucks Corp. | (3,247 | ) | (172,318 | ) |
| | | (512,507 | ) |
| Household Durables — (0.2)% | | |
| Lennar Corp., Class A | (2,521 | ) | (105,101 | ) |
| Internet and Direct Marketing Retail — (0.4)% | | |
| JD.com, Inc. ADR | (4,493 | ) | (116,593 | ) |
| Netflix, Inc. | (900 | ) | (112,383 | ) |
| | | (228,976 | ) |
| Internet Software and Services — (0.3)% | | |
| Zillow Group, Inc. | (4,400 | ) | (146,784 | ) |
| IT Services — (0.9)% | | |
| Accenture plc, Class A | (1,000 | ) | (116,240 | ) |
| International Business Machines Corp. | (2,500 | ) | (384,225 | ) |
| | | (500,465 | ) |
| Machinery — (0.2)% | | |
| Caterpillar, Inc. | (1,379 | ) | (115,091 | ) |
| Media — (0.3)% | | |
| Walt Disney Co. (The) | (1,893 | ) | (175,462 | ) |
| Multi-Utilities — (0.2)% | | |
| Consolidated Edison, Inc. | (1,475 | ) | (111,436 | ) |
| Software — (1.0)% | | |
| Autodesk, Inc. | (1,300 | ) | (93,964 | ) |
| CA, Inc. | (5,400 | ) | (165,996 | ) |
| Oracle Corp. | (2,984 | ) | (114,645 | ) |
| Workday, Inc., Class A | (1,800 | ) | (156,024 | ) |
| | | (530,629 | ) |
| Textiles, Apparel and Luxury Goods — (0.5)% | | |
| Cie Financiere Richemont SA | (1,923 | ) | (123,692 | ) |
| Swatch Group AG (The) | (397 | ) | (119,435 | ) |
| | | (243,127 | ) |
|
| | | | | |
| | Shares | Value |
| Trading Companies and Distributors — (0.3)% | | |
| Fastenal Co. | (1,403 | ) | $ | (54,689 | ) |
| W.W. Grainger, Inc. | (511 | ) | (106,349 | ) |
| | | (161,038 | ) |
TOTAL COMMON STOCKS SOLD SHORT
(Proceeds $5,119,949) | | (5,053,882 | ) |
TOTAL SECURITIES SOLD SHORT
(Proceeds $11,881,065) | | (11,993,797 | ) |
OTHER ASSETS AND LIABILITIES(4) — 26.8% | | 14,154,859 |
|
| TOTAL NET ASSETS — 100.0% | | $ | 52,880,733 |
|
|
| | | | | | | | | | |
| WRITTEN OPTIONS CONTRACTS |
| Reference Entity | Contracts | Type | Exercise Price | Expiration Date | Premiums Received | Value |
| Arista Networks, Inc. | 12 | Call | $90.00 | December 2016 | $ | 2,496 |
| $ | (3,090 | ) |
| Euronet Worldwide, Inc. | 5 | Call | $90.00 | November 2016 | 895 |
| (75 | ) |
| F5 Networks, Inc. | 6 | Call | $135.00 | January 2017 | 2,544 |
| (4,905 | ) |
| | | | | | $ | 5,935 |
| $ | (8,070 | ) |
|
| | | | | | | | | | |
| FORWARD FOREIGN CURRENCY EXCHANGE CONTRACTS |
| Currency Purchased | Currency Sold | Counterparty | Settlement Date | Unrealized Appreciation
(Depreciation) |
| CHF | 35,000 |
| USD | 35,287 |
| State Street Bank & Trust Co. | 11/16/16 | $ | 107 |
|
| CHF | 418,000 |
| USD | 421,156 |
| State Street Bank & Trust Co. | 11/16/16 | 1,551 |
|
| CHF | 6,000 |
| USD | 6,184 |
| Morgan Stanley | 11/17/16 | (116 | ) |
| USD | 473,925 |
| CHF | 467,000 |
| State Street Bank & Trust Co. | 11/16/16 | 1,666 |
|
| USD | 210,367 |
| CHF | 209,000 |
| State Street Bank & Trust Co. | 11/16/16 | (987 | ) |
| USD | 163,833 |
| CHF | 162,000 |
| State Street Bank & Trust Co. | 11/16/16 | 9 |
|
| USD | 17,112 |
| CHF | 17,000 |
| Morgan Stanley | 11/17/16 | (81 | ) |
| USD | 105,931 |
| CHF | 104,000 |
| Morgan Stanley | 11/17/16 | 754 |
|
| USD | 11,354 |
| CHF | 11,000 |
| Morgan Stanley | 11/17/16 | 229 |
|
| DKK | 97,000 |
| USD | 14,262 |
| State Street Bank & Trust Co. | 11/16/16 | 62 |
|
| DKK | 2,190,000 |
| USD | 321,298 |
| State Street Bank & Trust Co. | 11/16/16 | 2,104 |
|
| USD | 50,870 |
| DKK | 342,000 |
| State Street Bank & Trust Co. | 11/16/16 | 367 |
|
| USD | 52,939 |
| DKK | 362,000 |
| State Street Bank & Trust Co. | 11/16/16 | (518 | ) |
| USD | 94,182 |
| DKK | 638,000 |
| State Street Bank & Trust Co. | 11/16/16 | (33 | ) |
| USD | 446,365 |
| DKK | 3,001,000 |
| State Street Bank & Trust Co. | 11/16/16 | 3,200 |
|
| EUR | 561,000 |
| USD | 612,079 |
| State Street Bank & Trust Co. | 11/16/16 | 4,101 |
|
| EUR | 1,265,000 |
| USD | 1,389,327 |
| State Street Bank & Trust Co. | 11/16/16 | 99 |
|
| EUR | 10,000 |
| USD | 11,275 |
| Morgan Stanley | 11/17/16 | (291 | ) |
| EUR | 21,000 |
| USD | 23,660 |
| Morgan Stanley | 11/17/16 | (594 | ) |
| EUR | 27,000 |
| USD | 30,328 |
| Morgan Stanley | 11/17/16 | (671 | ) |
| EUR | 9,000 |
| USD | 10,072 |
| Morgan Stanley | 11/17/16 | (186 | ) |
| EUR | 9,000 |
| USD | 10,040 |
| Morgan Stanley | 11/17/16 | (155 | ) |
| EUR | 13,000 |
| USD | 14,384 |
| Morgan Stanley | 11/17/16 | (104 | ) |
| EUR | 24,000 |
| USD | 26,414 |
| Morgan Stanley | 11/17/16 | (52 | ) |
| EUR | 9,000 |
| USD | 9,941 |
| Morgan Stanley | 11/17/16 | (55 | ) |
| EUR | 12,000 |
| USD | 13,258 |
| Morgan Stanley | 11/17/16 | (77 | ) |
| EUR | 15,000 |
| USD | 16,815 |
| Morgan Stanley | 11/17/16 | (339 | ) |
| USD | 4,420,963 |
| EUR | 3,996,000 |
| State Street Bank & Trust Co. | 11/16/16 | 31,915 |
|
|
| | | | | | | | | | |
| | | | | | | |
| Currency Purchased | Currency Sold | Counterparty | Settlement Date | Unrealized Appreciation
(Depreciation) |
| USD | 537,733 |
| EUR | 486,000 |
| State Street Bank & Trust Co. | 11/16/16 | $ | 3,930 |
|
| USD | 62,650 |
| EUR | 57,000 |
| State Street Bank & Trust Co. | 11/16/16 | 44 |
|
| USD | 54,680 |
| EUR | 50,000 |
| State Street Bank & Trust Co. | 11/16/16 | (238 | ) |
| USD | 1,047,557 |
| EUR | 963,000 |
| State Street Bank & Trust Co. | 11/16/16 | (10,164 | ) |
| USD | 51,139 |
| EUR | 47,000 |
| Morgan Stanley | 11/17/16 | (486 | ) |
| USD | 53,400 |
| EUR | 49,000 |
| Morgan Stanley | 11/17/16 | (421 | ) |
| USD | 81,257 |
| EUR | 74,000 |
| Morgan Stanley | 11/17/16 | (25 | ) |
| USD | 441,319 |
| EUR | 397,000 |
| Morgan Stanley | 11/17/16 | 5,252 |
|
| USD | 43,731 |
| EUR | 39,000 |
| Morgan Stanley | 11/17/16 | 893 |
|
| USD | 9,057 |
| EUR | 8,000 |
| Morgan Stanley | 11/17/16 | 270 |
|
| GBP | 63,000 |
| USD | 77,215 |
| State Street Bank & Trust Co. | 11/16/16 | (82 | ) |
| NOK | 303,000 |
| USD | 36,668 |
| State Street Bank & Trust Co. | 11/16/16 | 5 |
|
| USD | 45,921 |
| NOK | 376,000 |
| State Street Bank & Trust Co. | 11/16/16 | 413 |
|
| USD | 148,929 |
| NOK | 1,231,000 |
| State Street Bank & Trust Co. | 11/16/16 | (62 | ) |
| USD | 237,639 |
| NOK | 1,963,000 |
| State Street Bank & Trust Co. | 11/16/16 | 52 |
|
| USD | 126,683 |
| NOK | 1,034,000 |
| State Street Bank & Trust Co. | 11/16/16 | 1,535 |
|
| SEK | 3,685,000 |
| USD | 415,642 |
| State Street Bank & Trust Co. | 11/16/16 | (7,401 | ) |
| USD | 875,992 |
| SEK | 7,691,000 |
| State Street Bank & Trust Co. | 11/16/16 | 23,948 |
|
| USD | 48,893 |
| SEK | 436,000 |
| State Street Bank & Trust Co. | 11/16/16 | 591 |
|
| USD | 546,507 |
| SEK | 4,951,000 |
| State Street Bank & Trust Co. | 11/16/16 | (1,987 | ) |
| USD | 92,468 |
| SEK | 835,000 |
| State Street Bank & Trust Co. | 11/16/16 | (38 | ) |
| | | | | | | $ | 57,934 |
|
|
| | | | | | | | |
| FUTURES CONTRACTS |
| Contracts Sold | Expiration Date | Underlying Face
Amount at Value | Unrealized Appreciation
(Depreciation) |
| 3 | Amsterdam Exchange Index | November 2016 | $ | 297,183 |
| $ | 378 |
|
| 24 | Cotation Assistée en Continu 40 Index | November 2016 | 1,187,283 |
| 91 |
|
| 3 | Deutscher Aktienindex Index | December 2016 | 879,051 |
| (13,841 | ) |
| 143 | Euro STOXX 50 Index | December 2016 | 4,792,547 |
| (66,650 | ) |
| 7 | FTSE 100 Index | December 2016 | 593,677 |
| (6,625 | ) |
| 2 | FTSE Milano Italia Borsa Index | December 2016 | 187,803 |
| (8,105 | ) |
| 26 | OMX Stockholm 30 Index | November 2016 | 415,887 |
| 1,874 |
|
| 39 | S&P 500 E-Mini | December 2016 | 4,134,195 |
| 15,107 |
|
| | | | $ | 12,487,626 |
| $ | (77,771 | ) |
|
| | | | | | | | | |
| TOTAL RETURN SWAP AGREEMENTS* |
| Counterparty | Units | Reference Entity | Notional Amount | Value |
| Purchased | | | | | |
| Credit Suisse Capital LLC | 13,339 |
| Credit Suisse Activist Index** | USD | 1,335,384 |
| $ | (54,950 | ) |
| Morgan Stanley Capital Services LLC | 8,714 |
| Aggreko plc | GBP | 73,551 |
| (4,552 | ) |
| Morgan Stanley Capital Services LLC | 1,624 |
| Air Liquide SA | EUR | 150,329 |
| 200 |
|
| Morgan Stanley Capital Services LLC | 9,939 |
| Ashtead Group plc | GBP | 126,035 |
| 1,163 |
|
| Morgan Stanley Capital Services LLC | 61,883 |
| Banco Santander SA | EUR | 277,072 |
| (25 | ) |
| Morgan Stanley Capital Services LLC | 118,490 |
| Barclays plc | GBP | 225,630 |
| (179 | ) |
| Morgan Stanley Capital Services LLC | 5,456 |
| BNP Paribas SA | EUR | 288,318 |
| (37 | ) |
| Morgan Stanley Capital Services LLC | 2,930 |
| British American Tobacco plc | GBP | 135,113 |
| 2,870 |
|
| Morgan Stanley Capital Services LLC | 3,108 |
| Burberry Group plc | GBP | 46,468 |
| (786 | ) |
| Morgan Stanley Capital Services LLC | 3,694 |
| Cie Generale des Etablissements Michelin | EUR | 359,077 |
| 5,764 |
|
| Morgan Stanley Capital Services LLC | 6,124 |
| Gamesa Corp. Tecnologica SA | EUR | 126,293 |
| 3,032 |
|
| Morgan Stanley Capital Services LLC | 14,629 |
| GlaxoSmithKline plc | GBP | 238,545 |
| (2,178 | ) |
| Morgan Stanley Capital Services LLC | 11,985 |
| Hitachi Ltd. | JPY | 5,989,023 |
| 7,317 |
|
| Morgan Stanley Capital Services LLC | 2,317 |
| Imperial Brands plc | GBP | 89,835 |
| 2,128 |
|
| Morgan Stanley Capital Services LLC | 4,839 |
| Industria de Diseno Textil SA | EUR | 159,337 |
| (4,404 | ) |
| Morgan Stanley Capital Services LLC | 3,009 |
| Intertek Group plc | GBP | 105,610 |
| (3,414 | ) |
| Morgan Stanley Capital Services LLC | 1,203 |
| Kering | EUR | 243,086 |
| (21 | ) |
| Morgan Stanley Capital Services LLC | 2,629 |
| Komatsu Ltd. | JPY | 5,960,063 |
| 2,455 |
|
| Morgan Stanley Capital Services LLC | 1,861 |
| LVMH Moet Hennessy Louis Vuitton SE | EUR | 306,043 |
| 2,226 |
|
| Morgan Stanley Capital Services LLC | 7,126 |
| Micro Focus International plc | GBP | 154,431 |
| (2,324 | ) |
| Morgan Stanley Capital Services LLC | 13,198 |
| Mitsubishi Heavy Industries Ltd. | JPY | 5,950,245 |
| 391 |
|
| Morgan Stanley Capital Services LLC | 3,821 |
| National Grid plc | GBP | 40,869 |
| (233 | ) |
| Morgan Stanley Capital Services LLC | 1,318 |
| Nexans SA | EUR | 65,145 |
| 3,401 |
|
| Morgan Stanley Capital Services LLC | 2,349 |
| Pernod Ricard SA | EUR | 258,301 |
| (4,166 | ) |
| Morgan Stanley Capital Services LLC | 4,234 |
| Renault SA | EUR | 336,037 |
| (1,193 | ) |
| Morgan Stanley Capital Services LLC | 6,865 |
| RPC Group plc | GBP | 60,499 |
| 5,584 |
|
| Morgan Stanley Capital Services LLC | 4,074 |
| Sanofi | EUR | 289,114 |
| (25 | ) |
| Morgan Stanley Capital Services LLC | 7,641 |
| Taisei Corp. | JPY | 5,968,436 |
| 938 |
|
| Morgan Stanley Capital Services LLC | 3,836 |
| Technip SA | EUR | 231,964 |
| (212 | ) |
| Morgan Stanley Capital Services LLC | 5,085 |
| TOTAL SA | EUR | 222,334 |
| (26 | ) |
| Morgan Stanley Capital Services LLC | 13,298 |
| Vallourec SA | EUR | 59,772 |
| (281 | ) |
| Morgan Stanley Capital Services LLC | 5,248 |
| Vinci SA | EUR | 345,294 |
| 1,063 |
|
| | | | | | $ | (40,474 | ) |
* The fund will pay or receive a floating rate as determined by the counterparty in accordance with guidelines
outlined in the Master Confirmation Agreement. The floating rate and termination date adjust periodically
and cannot be predicted with certainty.
** The Credit Suisse Activist Index is constructed to gain exposure to U.S. stocks with high ownership from 29
custom activist investors. The index consists of 25 stocks with high ownership (as filed on Form 13F with
the Securities and Exchange Commission) subject to constraints on risk, liquidity and the size of activist
exposure relative to firm value.
|
| | |
| NOTES TO SCHEDULE OF INVESTMENTS |
| ADR | - | American Depositary Receipt |
| CHF | - | Swiss Franc |
| CVA | - | Certificaten Van Aandelen |
| DKK | - | Danish Krone |
| EUR | - | Euro |
| GBP | - | British Pound |
| JPY | - | Japanese Yen |
| NOK | - | Norwegian Krone |
| SEK | - | Swedish Krona |
| USD | - | United States Dollar |
| |
| † | Category is less than 0.05% of total net assets. |
| |
| (1) | Security, or a portion thereof, has been pledged at the custodian bank or with a broker for collateral requirements on securities sold short and options contracts. At the period end, the aggregate value of securities pledged was $7,670,319. |
| |
| (3) | Security was purchased pursuant to Rule 144A under the Securities Act of 1933 and may be sold in transactions exempt from registration, normally to qualified institutional investors. The aggregate value of these securities at the period end was $926,405, which represented 1.7% of total net assets. |
| |
| (4) | Amount relates primarily to deposits with brokers for securities sold short and derivative instruments. |
See Notes to Financial Statements.
|
|
| Statement of Assets and Liabilities |
|
| | | |
| OCTOBER 31, 2016 | |
| Assets | |
| Investment securities, at value (cost of $48,868,697) | $ | 50,719,671 |
|
| Foreign currency holdings, at value (cost of $45,143) | 36,952 |
|
| Deposits with brokers for securities sold short and derivative instruments | 13,740,636 |
|
| Receivable for investments sold | 2,695,250 |
|
| Receivable for variation margin on futures contracts | 66,896 |
|
| Unrealized appreciation on forward foreign currency exchange contracts | 83,097 |
|
| Swap agreements, at value | 38,532 |
|
| Dividends and interest receivable | 73,580 |
|
| | 67,454,614 |
|
| | |
| Liabilities | |
| Securities sold short, at value (proceeds of $11,881,065) | 11,993,797 |
|
| Written options contracts, at value (premiums of $5,935) | 8,070 |
|
| Disbursements in excess of demand deposit cash | 233,100 |
|
| Payable for investments purchased | 2,120,859 |
|
| Unrealized depreciation on forward foreign currency exchange contracts | 25,163 |
|
| Swap agreements, at value | 79,006 |
|
| Accrued management fees | 93,276 |
|
| Distribution and service fees payable | 10,406 |
|
| Dividend expense payable on securities sold short | 9,326 |
|
| Broker fees and charges payable on securities sold short | 878 |
|
| | 14,573,881 |
|
| | |
| Net Assets | $ | 52,880,733 |
|
| | |
| Net Assets Consist of: | |
| Capital (par value and paid-in surplus) | $ | 52,797,150 |
|
| Accumulated net investment loss | (589,934 | ) |
| Accumulated net realized loss | (1,001,255 | ) |
| Net unrealized appreciation | 1,674,772 |
|
| | $ | 52,880,733 |
|
|
| | | | | | |
| | Net Assets | Shares Outstanding | Net Asset Value Per Share |
| Investor Class, $0.01 Par Value |
| $20,168,495 |
| 2,007,709 |
| $10.05 |
| Institutional Class, $0.01 Par Value |
| $6,324,283 |
| 628,479 |
| $10.06 |
| A Class, $0.01 Par Value |
| $10,044,417 |
| 1,002,001 |
| $10.02* |
| C Class, $0.01 Par Value |
| $9,969,413 |
| 1,000,823 |
| $9.96 |
| R Class, $0.01 Par Value |
| $2,004,378 |
| 200,373 |
| $10.00 |
| R6 Class, $0.01 Par Value |
| $4,369,747 |
| 433,678 |
| $10.08 |
*Maximum offering price $10.63 (net asset value divided by 0.9425).
See Notes to Financial Statements.
|
| | | |
| YEAR ENDED OCTOBER 31, 2016 | |
| Investment Income (Loss) | |
| Income: | |
| Dividends (net of foreign taxes withheld of $21,341) | $ | 706,355 |
|
| Interest | 40,411 |
|
| | 746,766 |
|
| | |
| Expenses: | |
| Dividend expense on securities sold short | 276,730 |
|
| Broker fees and charges on securities sold short | 60,108 |
|
| Management fees | 1,111,472 |
|
| Distribution and service fees: | |
| A Class | 23,488 |
|
| C Class | 93,581 |
|
| R Class | 9,383 |
|
| Directors' fees and expenses | 1,622 |
|
| Other expenses | 7,742 |
|
| | 1,584,126 |
|
| | |
| Net investment income (loss) | (837,360 | ) |
| | |
| Realized and Unrealized Gain (Loss) | |
| Net realized gain (loss) on: | |
| Investment transactions | (367,096 | ) |
| Securities sold short transactions | (299,826 | ) |
| Futures contract transactions | (312,103 | ) |
| Swap agreement transactions | 189,408 |
|
| Written options contract transactions | 404 |
|
| Foreign currency transactions | 328,723 |
|
| | (460,490 | ) |
| | |
| Change in net unrealized appreciation (depreciation) on: | |
| Investments | 1,474,266 |
|
| Securities sold short | (119,997 | ) |
| Futures contracts | 50,549 |
|
| Swap agreements | (196,098 | ) |
| Written options contracts | (2,135 | ) |
| Translation of assets and liabilities in foreign currencies | (193,912 | ) |
| | 1,012,673 |
|
| | |
| Net realized and unrealized gain (loss) | 552,183 |
|
| | |
| Net Increase (Decrease) in Net Assets Resulting from Operations | $ | (285,177 | ) |
See Notes to Financial Statements.
|
|
| Statement of Changes in Net Assets |
|
| | | | | | |
| YEAR ENDED OCTOBER 31, 2016 AND PERIOD ENDED OCTOBER 31, 2015 |
| Increase (Decrease) in Net Assets | October 31, 2016 | October 31, 2015(1) |
| Operations | | |
| Net investment income (loss) | $ | (837,360 | ) | $ | (55,220 | ) |
| Net realized gain (loss) | (460,490 | ) | (45,758 | ) |
| Change in net unrealized appreciation (depreciation) | 1,012,673 |
| 662,099 |
|
| Net increase (decrease) in net assets resulting from operations | (285,177 | ) | 561,121 |
|
| | | |
| Distributions to Shareholders | | |
| From net investment income: | | |
| Investor Class | (154,800 | ) | — |
|
| Institutional Class | (48,900 | ) | — |
|
| A Class | (72,200 | ) | — |
|
| C Class | (56,500 | ) | — |
|
| R Class | (13,400 | ) | — |
|
| R6 Class | (16,940 | ) | — |
|
| Decrease in net assets from distributions | (362,740 | ) | — |
|
| | | |
| Capital Share Transactions | | |
| Net increase (decrease) in net assets from capital share transactions (Note 5) | 2,967,529 |
| 50,000,000 |
|
| | | |
| Net increase (decrease) in net assets | 2,319,612 |
| 50,561,121 |
|
| | | |
| Net Assets | | |
| Beginning of period | 50,561,121 |
| — |
|
| End of period | $ | 52,880,733 |
| $ | 50,561,121 |
|
| | | |
| Accumulated net investment loss | $ | (589,934 | ) | $ | (55,594 | ) |
| |
| (1) | October 15, 2015 (fund inception) through October 31, 2015. |
See Notes to Financial Statements.
|
|
| Notes to Financial Statements |
OCTOBER 31, 2016
1. Organization
American Century Capital Portfolios, Inc. (the corporation) is registered under the Investment Company Act of 1940, as amended (the 1940 Act), as an open-end management investment company and is organized as a Maryland corporation. AC Alternatives Long Short Fund (formerly AC Alternatives Equity Fund) (the fund) is one fund in a series issued by the corporation. The fund’s investment objective is to seek to provide capital appreciation.
The fund offers the Investor Class, the Institutional Class, the A Class, the C Class, the R Class and the R6 Class. The A Class may incur an initial sales charge. The A Class and C Class may be subject to a contingent deferred sales charge. The share classes differ principally in their respective sales charges and distribution and shareholder servicing expenses and arrangements. The Institutional Class and R6 Class shareholders do not require the same level of shareholder and administrative services from American Century Investment Management, Inc. (ACIM) (the investment advisor) as shareholders of other classes. In addition, financial intermediaries do not receive any service, distribution or administrative fees for the R6 Class. As a result, the Institutional Class and R6 Class are charged lower unified management fees. All classes of the fund commenced operations on October 15, 2015, the fund's inception date.
2. Significant Accounting Policies
The following is a summary of significant accounting policies consistently followed by the fund in preparation of its financial statements. The fund is an investment company and follows accounting and reporting guidance in accordance with accounting principles generally accepted in the United States of America. This may require management to make certain estimates and assumptions at the date of the financial statements. Actual results could differ from these estimates. Management evaluated the impact of events or transactions occurring through the date the financial statements were issued that would merit recognition or disclosure.
Investment Valuations — The fund determines the fair value of its investments and computes its net asset value per share at the close of regular trading (usually 4 p.m. Eastern time) on the New York Stock Exchange (NYSE) on each day the NYSE is open. The Board of Directors has adopted valuation policies and procedures to guide the investment advisor in the fund’s investment valuation process and to provide methodologies for the oversight of the fund’s pricing function.
Equity securities that are listed or traded on a domestic securities exchange are valued at the last reported sales price or at the official closing price as provided by the exchange. Participatory notes and equity securities traded on foreign securities exchanges are generally valued at the closing price of such securities on the exchange where primarily traded or at the close of the NYSE, if that is earlier. If no last sales price is reported, or if local convention or regulation so provides, the mean of the latest bid and asked prices may be used. Securities traded over-the-counter are valued at the mean of the latest bid and asked prices, the last sales price, or the official closing price. Equity securities initially expressed in local currencies are translated into U.S. dollars at the mean of the appropriate currency exchange rate at the close of the NYSE as provided by an independent pricing service.
Open-end management investment companies are valued at the reported net asset value per share. Exchange-traded futures and options contracts are valued based on quoted prices as provided by the appropriate exchange. Swap agreements are valued at an evaluated mean as provided by independent pricing services or at the closing price of the reference entity on the exchange where primarily traded. Forward foreign currency exchange contracts are valued at the mean of the appropriate forward exchange rate at the close of the NYSE as provided by an independent pricing service. Investments initially expressed in local currencies are translated into U.S. dollars at the mean of the appropriate currency exchange rate at the close of the NYSE as provided by an independent pricing service.
If the fund determines that the market price for an investment is not readily available or the valuation methods mentioned above do not reflect an investment’s fair value, such investment is valued as determined in good faith by the Board of Directors or its delegate, in accordance with policies and procedures adopted by the Board of Directors. In its determination of fair value, the fund may review several factors including, but not
limited to, market information regarding the specific investment or comparable investments and correlation with other investment types, futures indices or general market indicators. Circumstances that may cause the fund to use these procedures to value an investment include, but are not limited to: an investment has been declared in default or is distressed; trading in a security has been suspended during the trading day or a security is not actively trading on its principal exchange; prices received from a regular pricing source are deemed unreliable; or there is a foreign market holiday and no trading occurred.
The fund monitors for significant events occurring after the close of an investment’s primary exchange but before the fund’s net asset value per share is determined. Significant events may include, but are not limited to: corporate announcements and transactions; governmental action and political unrest that could impact a specific investment or an investment sector; or armed conflicts, natural disasters and similar events that could affect investments in a specific country or region. The fund also monitors for significant fluctuations between domestic and foreign markets, as evidenced by the U.S. market or such other indicators that the Board of Directors, or its delegate, deems appropriate. If significant fluctuations in foreign markets are identified, the fund may apply a model-derived factor to the closing price of equity securities traded on foreign securities exchanges. The factor is based on observable market data as provided by an independent pricing service.
Security Transactions — Security transactions are accounted for as of the trade date. Net realized gains and losses are determined on the identified cost basis, which is also used for federal income tax purposes.
Investment Income — Dividend income less foreign taxes withheld, if any, is recorded as of the ex-dividend date. Distributions received on securities that represent a return of capital or long-term capital gain are recorded as a reduction of cost of investments and/or as a realized gain. The fund may estimate the components of distributions received that may be considered nontaxable distributions or long-term capital gain distributions for income tax purposes. Interest income is recorded on the accrual basis and includes accretion of discounts and amortization of premiums.
Securities Sold Short — The fund enters into short sales, which is selling securities it does not own, as part of its normal investment activities. Upon selling a security short, the fund will segregate cash, cash equivalents or other appropriate liquid securities in at least an amount equal to the current market value of the securities sold short until the fund replaces the borrowed security. Interest earned on segregated cash for securities sold short is reflected as interest income. The fund is required to pay any dividends or interest due on securities sold short. Such dividends and interest are recorded as an expense. The fund may pay fees or charges to the broker on the assets borrowed for securities sold short. These fees are calculated daily based upon the value of each security sold short and a rate that is dependent on the availability of such security. If the market price of a security increases after the fund borrows the security, the fund may suffer a loss when it replaces the borrowed security at the higher price. Any loss will be increased by the amount of compensation, interest or dividends, and transaction costs the fund must pay to the lender of the borrowed security. Liabilities for securities sold short are valued daily and changes in value are recorded as change in net unrealized appreciation (depreciation) on securities sold short. The fund records realized gain (loss) on a security sold short when it is terminated by the fund and includes as a component of net realized gain (loss) on securities sold short transactions.
Foreign Currency Translations — All assets and liabilities initially expressed in foreign currencies are translated into U.S. dollars at prevailing exchange rates at period end. The fund may enter into spot foreign currency exchange contracts to facilitate transactions denominated in a foreign currency. Purchases and sales of investment securities, dividend and interest income, spot foreign currency exchange contracts, and expenses are translated at the rates of exchange prevailing on the respective dates of such transactions. Net realized and unrealized foreign currency exchange gains or losses related to investment securities are a component of net realized gain (loss) on investment transactions and change in net unrealized appreciation (depreciation) on investments, respectively. Net realized and unrealized foreign currency exchange gains or losses related to securities sold short are a component of net realized gain (loss) on securities sold short transactions and change in net unrealized appreciation (depreciation) on securities sold short, respectively.
Segregated Assets — In accordance with the 1940 Act, the fund segregates assets on its books and records to cover certain types of investments, including, but not limited to, short sales, futures contracts, options contracts, forward commitments, when-issued securities, swap agreements and certain forward foreign currency exchange contracts. ACIM monitors, on a daily basis, the securities segregated to ensure the fund designates a sufficient amount of liquid assets, marked-to-market daily. The fund may also receive assets or be required to pledge assets at the custodian bank or with a broker for margin requirements on short sales, futures contracts, options contracts, forward commitments and swap agreements.
Income Tax Status — It is the fund’s policy to distribute substantially all net investment income and net realized gains to shareholders and to otherwise qualify as a regulated investment company under provisions of the Internal Revenue Code. Accordingly, no provision has been made for income taxes. The fund files U.S. federal, state, local and non-U.S. tax returns as applicable. The fund's tax returns are subject to examination by the relevant taxing authority until expiration of the applicable statute of limitations, which is generally three years from the date of filing but can be longer in certain jurisdictions. At this time, management believes there are no uncertain tax positions which, based on their technical merit, would not be sustained upon examination and for which it is reasonably possible that the total amounts of unrecognized tax benefits will significantly change in the next twelve months.
Multiple Class — All shares of the fund represent an equal pro rata interest in the net assets of the class to which such shares belong, and have identical voting, dividend, liquidation and other rights and the same terms and conditions, except for class specific expenses and exclusive rights to vote on matters affecting only individual classes. Income, non-class specific expenses, and realized and unrealized capital gains and losses of the fund are allocated to each class of shares based on their relative net assets.
Distributions to Shareholders — Distributions from net investment income and net realized gains, if any, are generally declared and paid annually.
Indemnifications — Under the corporation’s organizational documents, its officers and directors are indemnified against certain liabilities arising out of the performance of their duties to the fund. In addition, in the normal course of business, the fund enters into contracts that provide general indemnifications. The maximum exposure under these arrangements is unknown as this would involve future claims that may be made against a fund. The risk of material loss from such claims is considered by management to be remote.
3. Fees and Transactions with Related Parties
Certain officers and directors of the corporation are also officers and/or directors of American Century Companies, Inc. (ACC). The corporation’s investment advisor, ACIM, the corporation's distributor, American Century Investment Services, Inc. (ACIS), and the corporation’s transfer agent, American Century Services, LLC, are wholly owned, directly or indirectly, by ACC. ACIM has engaged Perella Weinberg Partners Capital Management LP (PWP) as a subadvisor for the fund. PWP is responsible for making recommendations with respect to hiring, terminating, or replacing the fund’s underlying subadvisors. The fund’s underlying
subadvisors at the period end were Passport Capital, LLC, Sirios Capital Management, L.P., Three Bridges Capital, LP and Columbia Management Investment Advisers, LLC. PWP determines the percentage of the fund’s portfolio allocated to each subadvisor, including PWP, in order to seek to achieve the fund’s investment objective. ACIM is responsible for entering into subadvisory agreements and overseeing the activities of each of the subadvisors including monitoring compliance with fund objectives, strategies and restrictions. ACIM pays all costs associated with retaining the subadvisors of the fund. ACIM and the fund’s subadvisors own 99% of the shares of the fund. Related parties do not invest in the fund for the purpose of exercising management or control.
Management Fees — The corporation has entered into a management agreement with ACIM, under which ACIM provides the fund with investment advisory and management services in exchange for a single, unified management fee (the fee) per class. The agreement provides that all expenses of managing and operating the fund, except distribution and service fees, expenses on securities sold short, brokerage expenses, taxes, interest, fees and expenses of the independent directors (including legal counsel fees), and extraordinary expenses, will be paid by ACIM. The fee is computed and accrued daily based on each class's daily net assets and paid monthly in arrears. The annual management fee is 2.40% for the Investor Class, A Class, C Class and R Class, 2.20% for the Institutional Class and 2.05% for the R6 Class.
Distribution and Service Fees — The Board of Directors has adopted a separate Master Distribution and Individual Shareholder Services Plan for each of the A Class, C Class and R Class (collectively the plans), pursuant to Rule 12b-1 of the 1940 Act. The plans provide that the A Class will pay ACIS an annual distribution and service fee of 0.25%. The plans provide that the C Class will pay ACIS an annual distribution and service fee of 1.00%, of which 0.25% is paid for individual shareholder services and 0.75% is paid for distribution services. The plans provide that the R Class will pay ACIS an annual distribution and service fee of 0.50%. The fees are computed and accrued daily based on each class’s daily net assets and paid monthly in arrears. The fees are used to pay financial intermediaries for distribution and individual shareholder services. Fees incurred under the plans during the year ended October 31, 2016 are detailed in the Statement of Operations.
Directors' Fees and Expenses — The Board of Directors is responsible for overseeing the investment advisor’s management and operations of the fund. The directors receive detailed information about the fund and its investment advisor regularly throughout the year, and meet at least quarterly with management of the investment advisor to review reports about fund operations. The fund’s officers do not receive compensation from the fund.
Other Expenses - The fund’s other expenses may include interest charges, clearing exchange fees, proxy solicitation expenses, filing fees for foreign tax reclaims and other miscellaneous expenses. The impact of other expenses to the ratio of operating expenses to average net assets was 0.02% for the year ended October 31, 2016.
Acquired Fund Fees and Expenses — The fund may invest in mutual funds, exchange-traded funds, and business development companies (the acquired funds). The fund will indirectly realize its pro rata share of the fees and expenses of the acquired funds in which it invests. These indirect fees and expenses are not paid out of the fund's assets but are reflected in the return realized by the fund on its investment in the acquired funds.
4. Investment Transactions
Purchases and sales of investment securities and securities sold short, excluding short-term investments, for the year ended October 31, 2016 were $157,324,057 and $148,590,515, respectively.
Transactions in written options contracts during the year ended October 31, 2016 were as follows:
|
| | | | | | | | | | | | | |
| | Outstanding, Beginning of Period |
Written | Closed |
Expired |
Outstanding, End of Period |
| Number of Contracts | — | 235 |
| (47 | ) | (165 | ) | 23 |
|
| Premiums Received | — | $ | 16,498 |
| $ | (2,418 | ) | $ | (8,145 | ) | $ | 5,935 |
|
5. Capital Share Transactions
Transactions in shares of the fund were as follows:
|
| | | | | | | | | | |
| | Year ended
October 31, 2016 | Period ended October 31, 2015(1) |
| | Shares | Amount | Shares | Amount |
| Investor Class/Shares Authorized | 100,000,000 |
| | 100,000,000 |
| |
| Sold | 307,292 |
| $ | 3,097,087 |
| 2,000,000 |
| $ | 20,000,000 |
|
| Issued in reinvestment of distributions | 15,573 |
| 154,800 |
| — |
| — |
|
| Redeemed | (315,156 | ) | (3,088,835 | ) | — |
| — |
|
| | 7,709 |
| 163,052 |
| 2,000,000 |
| 20,000,000 |
|
| Institutional Class/Shares Authorized | 80,000,000 |
| | 100,000,000 |
| |
| Sold | 117,993 |
| 1,192,010 |
| 600,000 |
| 6,000,000 |
|
| Issued in reinvestment of distributions | 4,920 |
| 48,900 |
| — |
| — |
|
| Redeemed | (94,434 | ) | (926,468 | ) | — |
| — |
|
| | 28,479 |
| 314,442 |
| 600,000 |
| 6,000,000 |
|
| A Class/Shares Authorized | 40,000,000 |
| | 40,000,000 |
| |
| Sold | 151,981 |
| 1,528,938 |
| 1,000,000 |
| 10,000,000 |
|
| Issued in reinvestment of distributions | 7,264 |
| 72,200 |
| — |
| — |
|
| Redeemed | (157,244 | ) | (1,539,558 | ) | — |
| — |
|
| | 2,001 |
| 61,580 |
| 1,000,000 |
| 10,000,000 |
|
| C Class/Shares Authorized | 40,000,000 |
| | 40,000,000 |
| |
| Sold | 152,137 |
| 1,521,364 |
| 1,000,000 |
| 10,000,000 |
|
| Issued in reinvestment of distributions | 5,684 |
| 56,500 |
| — |
| — |
|
| Redeemed | (156,998 | ) | (1,532,468 | ) | — |
| — |
|
| | 823 |
| 45,396 |
| 1,000,000 |
| 10,000,000 |
|
| R Class/Shares Authorized | 20,000,000 |
| | 40,000,000 |
| |
| Sold | 30,458 |
| 305,788 |
| 200,000 |
| 2,000,000 |
|
| Issued in reinvestment of distributions | 1,348 |
| 13,400 |
| — |
| — |
|
| Redeemed | (31,433 | ) | (307,440 | ) | — |
| — |
|
| | 373 |
| 11,748 |
| 200,000 |
| 2,000,000 |
|
| R6 Class/Shares Authorized | 30,000,000 |
| | 40,000,000 |
| |
| Sold | 263,462 |
| 2,663,605 |
| 200,000 |
| 2,000,000 |
|
| Issued in reinvestment of distributions | 1,704 |
| 16,940 |
| — |
| — |
|
| Redeemed | (31,488 | ) | (309,234 | ) | — |
| — |
|
| | 233,678 |
| 2,371,311 |
| 200,000 |
| 2,000,000 |
|
| Net increase (decrease) | 273,063 |
| $ | 2,967,529 |
| 5,000,000 |
| $ | 50,000,000 |
|
| |
| (1) | October 15, 2015 (fund inception) through October 31, 2015. |
6. Fair Value Measurements
The fund’s investments valuation process is based on several considerations and may use multiple inputs to determine the fair value of the investments held by the fund. In conformity with accounting principles generally accepted in the United States of America, the inputs used to determine a valuation are classified into three broad levels.
| |
| • | Level 1 valuation inputs consist of unadjusted quoted prices in an active market for identical investments. |
| |
| • | Level 2 valuation inputs consist of direct or indirect observable market data (including quoted prices for comparable investments, evaluations of subsequent market events, interest rates, prepayment speeds, credit risk, etc.). These inputs also consist of quoted prices for identical investments initially expressed in local currencies that are adjusted through translation into U.S. dollars. |
| |
| • | Level 3 valuation inputs consist of unobservable data (including a fund’s own assumptions). |
The level classification is based on the lowest level input that is significant to the fair valuation measurement. The valuation inputs are not necessarily an indication of the risks associated with investing in these securities or other financial instruments. There were no significant transfers between levels during the period.
The following is a summary of the level classifications as of period end. The Schedule of Investments provides additional information on the fund’s portfolio holdings. |
| | | | | | | | |
| | Level 1 | Level 2 | Level 3 |
| Assets | | | |
| Investment Securities | | | |
| Common Stocks | | | |
| Aerospace and Defense | $ | 302,670 |
| $ | 169,294 |
| — |
|
| Automobiles | 32,159 |
| 250,967 |
| — |
|
| Banks | 1,498,638 |
| 1,258,715 |
| — |
|
| Beverages | 979,523 |
| 158,429 |
| — |
|
| Biotechnology | 186,592 |
| 81,937 |
| — |
|
| Capital Markets | 892,430 |
| 242,579 |
| — |
|
| Chemicals | 680,747 |
| 898,299 |
| — |
|
| Commercial Services and Supplies | 13,639 |
| 133,771 |
| — |
|
| Construction Materials | 188,814 |
| 127,926 |
| — |
|
| Diversified Telecommunication Services | 194,975 |
| 381,962 |
| — |
|
| Electrical Equipment | 13,559 |
| 262,634 |
| — |
|
| Food Products | 151,728 |
| 308,883 |
| — |
|
| Health Care Providers and Services | 411,929 |
| 138,733 |
| — |
|
| Household Products | 73,797 |
| 180,985 |
| — |
|
| Industrial Conglomerates | 104,122 |
| 761,541 |
| — |
|
| Insurance | 188,759 |
| 330,079 |
| — |
|
| Internet and Direct Marketing Retail | 108,993 |
| 252,810 |
| — |
|
| Internet Software and Services | 2,098,631 |
| 429,041 |
| — |
|
| Machinery | 47,960 |
| 444,221 |
| — |
|
| Media | 1,407,137 |
| 429,550 |
| — |
|
| Metals and Mining | 551,175 |
| 75,978 |
| — |
|
| Oil, Gas and Consumable Fuels | 1,546,094 |
| 182,513 |
| — |
|
| Pharmaceuticals | 1,565,894 |
| 103,124 |
| — |
|
| Semiconductors and Semiconductor Equipment | 6,908,898 |
| 373,958 |
| — |
|
| Tobacco | 25,557 |
| 517,848 |
| — |
|
| Wireless Telecommunication Services | 74,460 |
| 164,673 |
| — |
|
| Other Industries | 11,094,418 |
| — |
| — |
|
| Exchange-Traded Funds | 1,272,142 |
| — |
| — |
|
| Participatory Notes | — |
| 926,405 |
| — |
|
| Temporary Cash Investments | 8,517,376 |
| — |
| — |
|
| | $ | 41,132,816 |
| $ | 9,586,855 |
| — |
|
| Other Financial Instruments | | | |
| Futures Contracts | $ | 15,107 |
| $ | 2,343 |
| — |
|
| Swap Agreements | — |
| 38,532 |
| — |
|
| Forward Foreign Currency Exchange Contracts | — |
| 83,097 |
| — |
|
| | $ | 15,107 |
| $ | 123,972 |
| — |
|
|
| | | | | | | | |
| | Level 1 | Level 2 | Level 3 |
| Liabilities | | | |
| Securities Sold Short | | | |
| Common Stocks | | | |
| Consumer Discretionary | $ | 1,719,787 |
| $ | 548,563 |
| — |
|
| Consumer Staples | 193,271 |
| 174,149 |
| — |
|
| Financials | — |
| 67,532 |
| — |
|
| Other Industries | 2,350,580 |
| — |
| — |
|
| Exchange-Traded Funds | 6,939,915 |
| — |
| — |
|
| | $ | 11,203,553 |
| $ | 790,244 |
| — |
|
| Other Financial Instruments | | | |
| Futures Contracts | — |
| $ | 95,221 |
| — |
|
| Written Options Contracts | $ | 8,070 |
| — |
| — |
|
| Swap Agreements | — |
| 79,006 |
| — |
|
| Forward Foreign Currency Exchange Contracts | — |
| 25,163 |
| — |
|
| | $ | 8,070 |
| $ | 199,390 |
| — |
|
7. Derivative Instruments
Equity Price Risk — The fund is subject to equity price risk in the normal course of pursuing its investment objectives. A fund may enter into futures contracts, total return swap agreements or options contracts based on an equity index or specific security in order to manage its exposure to changes in market conditions. The risks of entering into equity price risk derivative instruments include the possible lack of liquidity, failure of the counterparty to meet its obligations, and that there may be unfavorable changes in the underlying investments or instruments.
A fund may purchase or write an option contract to protect against declines in market value on the underlying index or security. A purchased option contract provides the fund a right, but not an obligation, to buy (call) or sell (put) an equity-related asset at a specfied excercise price within a certain period or on a specific date. A
written option contract holds the corresponding obligation to sell (call writing) or buy (put writing) the underlying equity-related asset if the purchaser exercises the option contract. The buyer pays the seller an initial purchase price (premium) for this right. Option contracts purchased by a fund are accounted for in the same manner as marketable portfolio securities. The premium received by a fund for option contracts written
is recorded as a liability and valued daily. The proceeds from securities sold through the exercise of option contracts are decreased by the premium paid to purchase the option contracts. A fund may recognize a realized gain or loss when the option contract is closed, exercised or expires. Net realized and unrealized gains or losses occurring during the holding period of purchased options contracts are a component of net realized gain (loss) on investment transactions and change in net unrealized appreciation (depreciation) on investments, respectively. Net realized and unrealized gains or losses occurring during the holding period of written options contracts are a component of net realized gain (loss) on written options contract transactions and change in net unrealized appreciation (depreciation) on written options contracts, respectively. The fund’s average exposure to these equity price risk derivative instruments during the period was 123 purchased options contracts and 67 written options contracts.
A fund may purchase futures contracts to gain exposure to increases in market value or sell futures contracts to protect against a decline in market value. Upon entering into a futures contract, a fund is required to deposit either cash or securities in an amount equal to a certain percentage of the contract value (initial margin). Subsequent payments (variation margin) are made or received daily, in cash, by a fund. The variation margin is equal to the daily change in the contract value and is recorded as unrealized gains and losses. A fund recognizes a realized gain or loss when the contract is closed or expires. Net realized and unrealized gains or losses occurring during the holding period of futures contracts are a component of net realized gain (loss) on futures contract transactions and change in net unrealized appreciation (depreciation) on futures contracts, respectively. The fund's average exposure to these equity price risk derivative instruments during the period was 171 futures contracts.
A fund may enter into total return swap agreements in order to attempt to obtain or preserve a particular return or spread at a lower cost than obtaining a return or spread through purchases and/or sales of instruments in other markets or gain exposure to certain markets in the most economical way possible. A fund will segregate cash, cash equivalents or other appropriate liquid securities on its records in amounts sufficient to meet requirements. Changes in value, including the periodic amounts of interest to be paid or received on swap
agreements, are recorded as unrealized appreciation (depreciation) on swap agreements. Realized gain or loss is recorded upon receipt or payment of a periodic settlement or termination of swap agreements. Net realized and unrealized gains or losses occurring during the holding period of swap agreements are a component of net realized gain (loss) on swap agreement transactions and change in net unrealized appreciation (depreciation) on swap agreements, respectively. The fund's average swap agreement units held during the period was 406,267.
Foreign Currency Risk — The fund is subject to foreign currency exchange rate risk in the normal course of pursuing its investment objectives. The value of foreign investments held by a fund may be significantly affected by changes in foreign currency exchange rates. The dollar value of a foreign security generally decreases when the value of the dollar rises against the foreign currency in which the security is denominated and tends to increase when the value of the dollar declines against such foreign currency. A fund may enter into forward foreign currency exchange contracts to reduce a fund's exposure to foreign currency exchange rate fluctuations or to gain exposure to the fluctuations in the value of foreign currencies. The net U.S. dollar value of foreign currency underlying all contractual commitments held by a fund and the resulting unrealized appreciation or depreciation are determined daily. Realized gain or loss is recorded upon the termination of the contract. Net realized and unrealized gains or losses occurring during the holding period of forward foreign currency exchange contracts are a component of net realized gain (loss) on foreign currency transactions and change in net unrealized appreciation (depreciation) on translation of assets and liabilities in foreign currencies, respectively. A fund bears the risk of an unfavorable change in the foreign currency exchange rate underlying the forward contract. Additionally, losses, up to the fair value, may arise if the counterparties do not perform under the contract terms. The fund's average U.S. dollar exposure to foreign currency risk derivative instruments held during the period was $9,546,339.
Value of Derivative Instruments as of October 31, 2016
|
| | | | | | | | |
| | Asset Derivatives | Liability Derivatives |
| Type of Risk Exposure | Location on Statement of Assets and Liabilities | Value | Location on Statement of Assets and Liabilities | Value |
| Equity Price Risk | Written options contracts | — |
| Written options contracts | $ | 8,070 |
|
| Equity Price Risk | Receivable for variation margin on futures contracts* | $ | 66,896 |
| Payable for variation margin on futures contracts* | — |
|
| Equity Price Risk | Swap agreements | 38,532 |
| Swap agreements | 79,006 |
|
| Foreign Currency Risk | Unrealized appreciation on forward foreign currency exchange contracts | 83,097 |
| Unrealized depreciation on forward foreign currency exchange contracts | 25,163 |
|
| | | $ | 188,525 |
| | $ | 112,239 |
|
| |
| * | Included in the unrealized appreciation (depreciation) on futures contracts as reported in the Schedule of Investments. |
Effect of Derivative Instruments on the Statement of Operations for the Year Ended October 31, 2016
|
| | | | | | | | |
| | Net Realized Gain (Loss) | Change in Net Unrealized Appreciation (Depreciation) |
Type of Risk Exposure | Location on Statement of Operations | Value | Location on Statement of Operations | Value |
| Equity Price Risk | Net realized gain (loss) on investment transactions | $ | (99,756 | ) | Change in net unrealized appreciation (depreciation) on investments | — |
|
| Equity Price Risk | Net realized gain (loss) on written options contract transactions | 404 |
| Change in net unrealized appreciation (depreciation) on written options contracts | $ | (2,135 | ) |
| Equity Price Risk | Net realized gain (loss) on futures contract transactions | (312,103 | ) | Change in net unrealized appreciation (depreciation) on futures contracts | 50,549 |
|
| Equity Price Risk | Net realized gain (loss) on swap agreement transactions | 189,408 |
| Change in net unrealized appreciation (depreciation) on swap agreements | (196,098 | ) |
| Foreign Currency Risk | Net realized gain (loss) on foreign currency transactions | 488,510 |
| Change in net unrealized appreciation (depreciation) on translation of assets and liabilities in foreign currencies | (192,845 | ) |
| | | $ | 266,463 |
| | $ | (340,529 | ) |
8. Risk Factors
ACIM utilizes multiple subadvisors to manage the fund’s assets, each employing its own particular investment strategy. Multi-manager strategies can increase the fund's portfolio turnover rate, which could result in higher levels of realized capital gains or losses, higher brokerage commissions and other transaction costs.
The fund may invest in foreign securities, which are generally riskier than U.S. securities. As a result the fund may be subject to foreign risk, meaning that political events (such as civil unrest, national elections and imposition of exchange controls), social and economic events (such as labor strikes and rising inflation), and natural disasters occurring in a country where the fund invests could cause the fund’s investments in that country to experience losses. For these and other reasons, securities of foreign issuers may be less liquid and more volatile. Investing in securities of companies located in emerging market countries generally is riskier than investing in securities of companies located in foreign developed countries.
The fund is subject to short sales risk. If the market price of a security increases after the fund borrows the security to sell short, the fund may suffer a loss when it replaces the borrowed security at the higher price. Any loss will be increased by the amount of compensation, interest or dividends, and transaction costs the fund must pay to a lender of the security.
9. Federal Tax Information
The tax character of distributions paid during the year ended October 31, 2016 and the period October 15, 2015 (fund inception) through October 31, 2015 were as follows:
|
| | | | | |
| | 2016 | 2015 |
| Distributions Paid From | | |
| Ordinary income | $ | 362,740 |
| — |
|
| Long-term capital gains | — |
| — |
|
The book-basis character of distributions made during the year from net investment income or net realized gains may differ from their ultimate characterization for federal income tax purposes. These differences reflect the differing character of certain income items and net realized gains and losses for financial statement and tax purposes, and may result in reclassification among certain capital accounts on the financial statements.
The reclassifications, which are primarily due to foreign currency gains and losses and net operating losses, were made to capital $(164,434), accumulated net investment loss $665,760, and accumulated net realized loss $(501,326).
As of October 31, 2016, the federal tax cost of investments and the components of distributable earnings on a tax-basis were as follows:
|
| | | |
| Federal tax cost of investments | $ | 49,316,798 |
|
| Gross tax appreciation of investments | $ | 2,429,928 |
|
| Gross tax depreciation of investments | (1,027,055 | ) |
| Net tax appreciation (depreciation) of investments | 1,402,873 |
|
| Net tax appreciation (depreciation) on securities sold short | (112,732 | ) |
| Net tax appreciation (depreciation) on derivatives and translation of assets and liabilities in foreign currencies | (4,921 | ) |
| Net tax appreciation (depreciation) | $ | 1,285,220 |
|
| Other book-to-tax adjustments | $ | (18,903 | ) |
| Undistributed ordinary income | — |
|
| Accumulated short-term capital losses | $ | (453,428 | ) |
| Accumulated long-term capital losses | $ | (152,833 | ) |
| Late-year ordinary loss deferral | $ | (576,473 | ) |
The difference between book-basis and tax-basis unrealized appreciation (depreciation) is attributable primarily to the tax deferral of losses on wash sales. Other book-to-tax adjustments are attributable primarily to the tax deferral of losses on straddle positions.
Accumulated capital losses represent net capital loss carryovers that may be used to offset future realized capital gains for federal income tax purposes. The capital loss carryovers may be carried forward for an unlimited period. Future capital loss carryover utilization in any given year may be subject to Internal Revenue Code limitations.
Loss deferrals represent certain qualified losses that the fund has elected to treat as having been incurred in the following fiscal year for federal income tax purposes.
|
| | | | | | | | | | | | | | |
| For a Share Outstanding Throughout the Years Ended October 31 (except as noted) |
| Per-Share Data | Ratios and Supplemental Data |
| | | Income From Investment Operations: | | | | Ratio to Average Net Assets of: | | |
| | Net Asset Value, Beginning of Period | Net Investment Income (Loss)(1) | Net Realized and Unrealized Gain (Loss) | Total From Investment Operations | Distributions From Net
Investment
Income | Net Asset Value, End of Period | Total Return(2) | Operating Expenses | Operating Expenses (excluding expenses on securities sold short) | Net Investment Income (Loss) | Portfolio Turnover Rate | Net Assets, End of Period (in thousands) |
| Investor Class | | | | | | | | | | |
| 2016 | $10.11 | (0.15) | 0.17 | 0.02 | (0.08) | $10.05 | 0.18% | 3.14% | 2.42% | (1.55)% | 410% |
| $20,168 |
|
2015(3) | $10.00 | (0.01) | 0.12 | 0.11 | — | $10.11 | 1.10% | 2.75%(4) | 2.40%(4) | (2.28)%(4) | 81% |
| $20,227 |
|
| Institutional Class | | | | | | | | | | |
| 2016 | $10.11 | (0.13) | 0.16 | 0.03 | (0.08) | $10.06 | 0.22% | 2.94% | 2.22% | (1.35)% | 410% |
| $6,324 |
|
2015(3) | $10.00 | (0.01) | 0.12 | 0.11 | — | $10.11 | 1.20% | 2.55%(4) | 2.20%(4) | (2.08)%(4) | 81% |
| $6,068 |
|
| A Class | | | | | | | | | | | | |
| 2016 | $10.11 | (0.18) | 0.16 | (0.02) | (0.07) | $10.02 | (0.17)% | 3.39% | 2.67% | (1.80)% | 410% |
| $10,044 |
|
2015(3) | $10.00 | (0.01) | 0.12 | 0.11 | — | $10.11 | 1.10% | 3.00%(4) | 2.65%(4) | (2.53)%(4) | 81% |
| $10,112 |
|
| C Class | | | | | | | | | | | | |
| 2016 | $10.11 | (0.25) | 0.16 | (0.09) | (0.06) | $9.96 | (0.92)% | 4.14% | 3.42% | (2.55)% | 410% |
| $9,969 |
|
2015(3) | $10.00 | (0.01) | 0.12 | 0.11 | — | $10.11 | 1.10% | 3.75%(4) | 3.40%(4) | (3.28)%(4) | 81% |
| $10,109 |
|
| R Class | | | | | | | | | | | | |
| 2016 | $10.11 | (0.20) | 0.16 | (0.04) | (0.07) | $10.00 | (0.42)% | 3.64% | 2.92% | (2.05)% | 410% |
| $2,004 |
|
2015(3) | $10.00 | (0.01) | 0.12 | 0.11 | — | $10.11 | 1.10% | 3.25%(4) | 2.90%(4) | (2.78)%(4) | 81% |
| $2,022 |
|
| R6 Class | | | | | | | | | | | | |
| 2016 | $10.11 | (0.11) | 0.16 | 0.05 | (0.08) | $10.08 | 0.45% | 2.79% | 2.07% | (1.20)% | 410% |
| $4,370 |
|
2015(3) | $10.00 | (0.01) | 0.12 | 0.11 | — | $10.11 | 1.20% | 2.40%(4) | 2.05%(4) | (1.93)%(4) | 81% |
| $2,023 |
|
|
|
| Notes to Financial Highlights |
| |
| (1) | Computed using average shares outstanding throughout the period. |
| |
| (2) | Total returns are calculated based on the net asset value of the last business day and do not reflect applicable sales charges, if any. Total returns for periods less than one year are not annualized. |
| |
| (3) | October 15, 2015 (fund inception) through October 31, 2015. |
See Notes to Financial Statements.
|
|
| Report of Independent Registered Public Accounting Firm |
To the Board of Directors and Shareholders of American Century Capital Portfolios, Inc.:
We have audited the accompanying statement of assets and liabilities, including the schedule of investments, of AC Alternatives® Long Short Fund (formerly, AC AlternativesTM Equity Fund) (the “Fund”), one of the funds constituting American Century Capital Portfolios, Inc., as of October 31, 2016, and the related statement of operations for the year then ended, and the statements of changes in net assets and the financial highlights for the year then ended and for the period from October 15, 2015 (commencement date) through October 31, 2015. These financial statements and financial highlights are the responsibility of the Fund’s management. Our responsibility is to express an opinion on these financial statements and financial highlights based on our audits.
We conducted our audits in accordance with the standards of the Public Company Accounting Oversight Board (United States). Those standards require that we plan and perform the audit to obtain reasonable assurance about whether the financial statements and financial highlights are free of material misstatement. The Fund is not required to have, nor were we engaged to perform, an audit of its internal control over financial reporting. Our audits included consideration of internal control over financial reporting as a basis for designing audit procedures that are appropriate in the circumstances, but not for the purpose of expressing an opinion on the effectiveness of the Fund’s internal control over financial reporting. Accordingly, we express no such opinion. An audit also includes examining, on a test basis, evidence supporting the amounts and disclosures in the financial statements, assessing the accounting principles used and significant estimates made by management, as well as evaluating the overall financial statement presentation. Our procedures included confirmation of securities owned as of October 31, 2016, by correspondence with the custodian and brokers; when replies were not received from brokers, we performed other auditing procedures. We believe that our audits provide a reasonable basis for our opinion.
In our opinion, the financial statements and financial highlights referred to above present fairly, in all material respects, the financial position of AC Alternatives® Long Short Fund of American Century Capital Portfolios, Inc. as of October 31, 2016, the results of its operations for the year then ended, and the changes in its net assets and the financial highlights for the year then ended and for the period from October 15, 2015 (commencement date) through October 31, 2015, in conformity with accounting principles generally accepted in the United States of America.
DELOITTE & TOUCHE LLP
Kansas City, Missouri
December 19, 2016
The Board of Directors
The individuals listed below serve as directors of the funds. Each director will continue to serve in this capacity until death, retirement, resignation or removal from office. The board has adopted a mandatory retirement age for directors who are not “interested persons,” as that term is defined in the Investment Company Act (independent directors). Independent directors shall retire by December 31 of the year in which they reach their 75th birthday.
Mr. Thomas is an “interested person” because he currently serves as President and Chief Executive Officer of American Century Companies, Inc. (ACC), the parent company of American Century Investment Management, Inc. (ACIM or the advisor). The other directors (more than three-fourths of the total number) are independent. They are not employees, directors or officers of, and have no financial interest in, ACC or any of its wholly owned, direct or indirect, subsidiaries, including ACIM, American Century Investment Services, Inc. (ACIS) and American Century Services, LLC (ACS), and they do not have any other affiliations, positions or relationships that would cause them to be considered “interested persons” under the Investment Company Act. The directors serve in this capacity for seven (in the case of Mr. Thomas, 15) registered investment companies in the American Century Investments family of funds.
The following table presents additional information about the directors. The mailing address for each director is 4500 Main Street, Kansas City, Missouri 64111.
|
| | | | | |
Name
(Year of Birth) | Position(s) Held with Funds | Length of Time Served | Principal Occupation(s) During Past 5 Years | Number of American Century Portfolios Overseen by Director | Other Directorships Held During Past 5 Years |
| Independent Directors |
|
|
Barry Fink
(1955) | Director | Since 2012 | Retired; Executive Vice President, ACC (September 2007 to February 2013); President, ACS (October 2007 to February 2013); Chief Operating Officer, ACC (September 2007 to November 2012) | 81 | None |
Andrea C. Hall
(1945) | Director | Since 1997 | Retired | 81 | None |
Jan M. Lewis
(1957) | Director | Since 2011 | Retired; President and Chief Executive Officer, Catholic Charities of Northeast Kansas (human services organization) (2006 to 2013) | 81 | None |
James A. Olson
(1942) | Director and Chairman of the Board | Since 2007 (Chairman since 2014) | Member, Plaza Belmont LLC (private equity fund manager) (1999 to present) | 81 | Saia, Inc. (2002 to 2012) and EPR Properties (2003 to 2013) |
M. Jeannine Strandjord
(1945) | Director | Since 1994 | Retired | 81 | Euronet Worldwide Inc.; MGP Ingredients, Inc.; and DST Systems Inc. (1996 to 2012) |
|
| | | | | |
Name
(Year of Birth) | Position(s) Held with Funds | Length of Time Served | Principal Occupation(s) During Past 5 Years | Number of American Century Portfolios Overseen by Director | Other Directorships Held During Past 5 Years |
| Independent Directors |
|
|
John R. Whitten
(1946) | Director | Since 2008 | Retired | 81 | Rudolph Technologies, Inc. |
Stephen E. Yates
(1948) | Director | Since 2012 | Retired | 81 | None |
| Interested Director |
|
|
Jonathan S. Thomas
(1963) | Director and President | Since 2007 | President and Chief Executive Officer, ACC (March 2007 to present). Also serves as Chief Executive Officer, ACS; Executive Vice President, ACIM; Director, ACC, ACIM and other ACC subsidiaries | 125 | BioMed Valley Discoveries, Inc. |
The Statement of Additional Information has additional information about the fund's directors and is available without charge, upon request, by calling 1-800-345-2021.
Officers
The following table presents certain information about the executive officers of the funds. Each officer serves as an officer for each of the 15 investment companies in the American Century family of funds, unless otherwise noted. No officer is compensated for his or her service as an officer of the funds. The listed officers are interested persons of the funds and are appointed or re-appointed on an annual basis. The mailing address for each officer listed below is 4500 Main Street, Kansas City, Missouri 64111.
|
| | |
Name
(Year of Birth) | Offices with the Funds | Principal Occupation(s) During the Past Five Years |
Jonathan S. Thomas
(1963) | Director and President since 2007 | President and Chief Executive Officer, ACC (March 2007 to present). Also serves as Chief Executive Officer, ACS; Executive Vice President, ACIM; Director, ACC, ACIM and other ACC subsidiaries |
Amy D. Shelton
(1964) | Chief Compliance Officer and Vice President since 2014 | Chief Compliance Officer, American Century funds, (March 2014 to present); Chief Compliance Officer, ACIM (February 2014 to present); Chief Compliance Officer, ACIS (October 2009 to present); Vice President, Client Interactions and Marketing, ACIS (February 2013 to January 2014); Director, Client Interactions and Marketing, ACIS (June 2007 to January 2013). Also serves as Vice President, ACIS |
Charles A. Etherington
(1957) | General Counsel since 2007 and Senior Vice President since 2006 | Attorney, ACC (February 1994 to present); Vice President, ACC (November 2005 to present); General Counsel, ACC (March 2007 to present). Also serves as General Counsel, ACIM, ACS, ACIS and other ACC subsidiaries; and Senior Vice President, ACIM and ACS |
C. Jean Wade
(1964) | Vice President,Treasurer and Chief Financial Officer since 2012 | Vice President, ACS (February 2000 to present) |
Robert J. Leach
(1966) | Vice President since 2006 and Assistant Treasurer since 2012 | Vice President, ACS (February 2000 to present) |
David H. Reinmiller
(1963) | Vice President since 2000 | Attorney, ACC (January 1994 to present); Associate General Counsel, ACC (January 2001 to present). Also serves as Vice President, ACIM and ACS |
Ward D. Stauffer
(1960) | Secretary since 2005 | Attorney, ACC (June 2003 to present) |
|
|
| Approval of Management and Subadvisory Agreements |
At a meeting held on June 29, 2016, the Fund’s Board of Directors (the "Board") unanimously approved the renewal of the management agreement pursuant to which American Century Investment Management, Inc. (the “Advisor”) acts as the investment advisor for the Fund. The Board also unanimously approved the renewal of the Subadvisory Agreement with PWP (the “PWP Agreement”) and each underlying subadvisory agreement between the Advisor and each of the Fund’s underlying subadvisors (collectively, with the PWP Agreement, the “Subadvisory Agreements”). The underlying subadvisors approved by the Board were Levin Capital Strategies, L.P.; Passport Capital, LLC; Seligman Investments, an offering brand of Columbia Management Investment Advisers, LLC; Sirios Capital Management, L.P.; and Three Bridges Capital, LP (each a “Subadvisor,” and collectively with PWP, the “Subadvisors”). Under Section 15(c) of the Investment Company Act, contracts for investment advisory services (including subadvisory services) are required to be reviewed, evaluated, and approved by a majority of a fund’s directors (the “Directors”), including a majority of the independent Directors, each year.
The Fund is a multi-manager fund, which means that the Advisor has retained several subadvisors, each employing its own particular investment strategy, to manage and make investment decisions with respect to the Fund’s assets. The Advisor has engaged Perella Weinberg Partners Capital Management LP (“PWP”) to manage a portion of the Fund and to identify and recommend other underlying subadvisors to manage distinct investment strategies. PWP uses a flexible and opportunistic investment strategy that allocates Fund assets among underlying subadvisors with expertise in a particular investment strategy, and supplements those strategies with its own direct investment management and hedging strategies. PWP also provides tactical allocation of assets among the various underlying subadvisors and a framework for the risk management and investment monitoring of the Fund. The Advisor provides oversight of each of these functions.
Prior to its consideration of the renewal of the management agreement and Subadvisory Agreements, the Directors requested and reviewed extensive data and information compiled by the Advisor and certain independent providers of evaluation data concerning the Fund and the services provided to the Fund by the Advisor and each Subadvisor. This review was in addition to the oversight and evaluation undertaken by the Board and its committees on a continuous basis and the information received was supplemental to the extensive information that the Board and its committees receive and consider throughout the year.
In connection with its consideration of the renewal of the management agreement and the Subadvisory Agreements, the Board’s review and evaluation of the services provided by the Advisor included, but was not limited to, the following:
| |
| • | the nature, extent, and quality of investment management, shareholder services, and other services to be provided to the Fund; |
| |
| • | the wide range of other programs and services to be provided to the Fund and its shareholders on a routine and non-routine basis; |
| |
| • | the Fund’s investment performance compared to appropriate benchmarks and/or a peer group of other mutual funds with similar investment objectives and strategies; |
| |
| • | the cost of owning the Fund compared to the cost of owning similar funds; |
| |
| • | the compliance policies, procedures, and regulatory experience of the Fund's service providers; |
| |
| • | financial data showing the cost of services provided to the Fund, the profitability of the Fund to the Advisor, and the overall profitability of the Advisor; |
| |
| • | possible economies of scale associated with the Advisor’s management of the Fund and other accounts under its management; |
| |
| • | data comparing services provided and charges to the Advisor's other investment management clients; |
| |
| • | acquired fund fees and expenses; |
| |
| • | payments by the Fund and the Advisor to financial intermediaries; and |
| |
| • | any collateral benefits derived by the Advisor from the management of the Fund. |
In keeping with their practice, the Directors held two in-person meetings and one telephonic meeting to review and discuss the information provided. The independent Directors also had the benefit of the advice of their independent counsel throughout the process.
Factors Considered
The Directors considered all of the information provided by the Advisor, the independent data providers, and independent counsel in connection with the approval. They determined that the information was sufficient for them to evaluate the management agreement and the Subadvisory Agreements for the Fund. In connection with their review, the Directors did not identify any single factor as being all-important or controlling, and each Director may have attributed different levels of importance to different factors. In deciding to renew the management agreement and Subadvisory Agreements, the Board based its decision on a number of factors, including the following:
Nature, Extent and Quality of Services - Generally. Under the management agreement, the Advisor is responsible for providing or arranging for all services necessary for the operation of the Fund. The Board noted that under the management agreement, the Advisor provides or arranges at its own expense a wide variety of services including:
| |
| • | constructing and designing the Fund |
| |
| • | portfolio research and security selection |
| |
| • | initial capitalization/funding |
| |
| • | daily valuation of the Fund’s portfolio |
| |
| • | shareholder servicing and transfer agency, including shareholder confirmations, recordkeeping, and communications |
| |
| • | legal services (except the independent Directors’ counsel) |
| |
| • | regulatory and portfolio compliance |
| |
| • | marketing and distribution (except Rule 12b-1 plans) |
The Board noted that many of these services have expanded over time both in terms of quantity and complexity in response to shareholder demands, competition in the industry, changing distribution channels, and the changing regulatory environment.
Investment Management Services. The nature of the investment management services provided to the Fund is quite complex and allows Fund shareholders access to professional money management, instant diversification of their investments within an asset class, the opportunity to easily diversify among asset classes by investing in or exchanging among various American Century Investments funds, and liquidity. In evaluating investment performance, the Board expects the Advisor and Subadvisors to manage the Fund in accordance with its investment objectives and approved strategies. Further, the Directors recognize that the Advisor has an obligation to monitor trading activities, and in particular to seek the best execution of fund trades, and to evaluate the use of and payment for research. In providing these services, the Advisor and Subadvisors utilize teams of investment professionals (portfolio managers, analysts, research assistants, and securities traders) who require extensive information technology, research, training, compliance, and other systems to conduct their business. The Board, directly and through its Fund Performance Review Committee, regularly reviews investment performance information for the Fund, together with comparative information for appropriate benchmarks and/or peer groups of similarly-managed funds, over different time horizons. The Directors also review detailed performance information during the management agreement approval process. If performance concerns are identified, the Fund receives special reviews until performance improves, during which the Board discusses with the Advisor the reasons for such results (e.g., market conditions, security selection) and any efforts
being undertaken to improve performance. The Fund had less than one-year of performance history at the time of the Board’s review. The Board found the investment management services provided by the Advisor to the Fund to be satisfactory and consistent with the management agreement and Subadvisory Agreements.
Shareholder and Other Services. Under the management agreement, the Advisor provides the Fund with a comprehensive package of transfer agency, shareholder, and other services. The Board, directly and through various committees of the Board, regularly reviews reports and evaluations of such services at its regular meetings. These reports include, but are not limited to, information regarding the operational efficiency and accuracy of the shareholder and transfer agency services provided, staffing levels, shareholder satisfaction (as measured by external as well as internal sources), technology support, new products and services offered to Fund shareholders, securities trading activities, portfolio valuation services, auditing services, and legal and operational compliance activities. The Board particularly noted the Advisor’s continual efforts to maintain effective business continuity plans and to address cybersecurity threats. Certain aspects of shareholder and transfer agency service level efficiency and the quality of securities trading activities are measured by independent third party providers and are presented in comparison to other fund groups not managed by the Advisor. The Board found the services provided by the Advisor to the Fund under the management agreement to be competitive and of high quality.
Costs of Services and Profitability. The Advisor provides detailed information concerning its cost of providing various services to the Fund, its profitability in managing the Fund (pre- and post-distribution), its overall profitability, and its financial condition. The Directors have reviewed with the Advisor the methodology used to prepare this financial information. This information is considered in evaluating the Advisor’s financial condition, its ability to continue to provide services under the management agreement, and the reasonableness of the current management fee. The Board concluded that the Advisor’s profits were reasonable in light of the services provided to the Fund. The Board did not consider the profitability of the Subadvisors because each Subadvisor is paid from the unified management fee of the Advisor as a result of arms’ length negotiations.
Ethics. The Board generally considers the Advisor’s commitment to providing quality services to shareholders and to conducting its business ethically. They noted that the Advisor’s practices generally meet or exceed industry best practices. With respect to each Subadvisor, as part of their oversight responsibilities, the Board approves each Subadvisor’s code of ethics and any changes thereto. Further, through the Advisor’s compliance group, the Board stays abreast of any violations of a Subadvisor’s code.
Economies of Scale. The Board also reviewed information provided by the Advisor regarding the possible existence of economies of scale in connection with the management of the Fund. The Board concluded that economies of scale are difficult to measure and predict with precision, especially on a fund-by-fund basis. The Board concluded that the Advisor is appropriately sharing economies of scale through its competitive fee structure, offering competitive fees from fund inception, and through reinvestment in its business to provide shareholders additional content and services.
Comparison to Other Funds’ Fees. The management agreement provides that the Fund pays the Advisor a single, all-inclusive (or unified) management fee for providing all services necessary for the management and operation of the Fund, other than brokerage expenses, expenses attributable to short sales, taxes, interest, extraordinary expenses, and the fees and expenses of the Fund’s independent Directors (including their independent legal counsel) and expenses incurred in connection with the provision of shareholder services and distribution services under a plan adopted pursuant to Rule 12b-1 under the 1940 Act. The Board specifically noted that the subadvisory fee paid to each Subadvisor under the Subadvisory Agreements, as well as the terms of the Subadvisory Agreements, were subject to an arms’ length negotiation between the Advisor and each Subadvisor and are paid by the Advisor out of its unified management fee.
Under the unified fee structure, the Advisor is responsible for providing all investment advisory, custody, audit, administrative, compliance, recordkeeping, marketing and shareholder services, or arranging and supervising third parties to provide such services. By contrast, most other funds are charged a variety of fees, including an investment advisory fee, a transfer agency fee, an administrative fee, distribution charges, and other expenses. Other than their investment advisory fees and any applicable Rule 12b-1 distribution fees, all other components of the total fees charged by these other funds may be increased without shareholder approval. The Board believes the unified fee structure is a benefit to Fund shareholders because it clearly discloses to shareholders the cost of owning Fund shares, and, since the unified fee cannot be increased without a vote of Fund shareholders, it shifts to the Advisor the risk of increased costs of operating the Fund and provides a direct incentive to minimize administrative inefficiencies. Part of the Board’s analysis of fee levels involves reviewing certain evaluative data compiled by an independent provider comparing the Fund’s unified fee to the total expense ratios of its peers. The unified fee charged to shareholders of the Fund was above the median of the total expense ratios of the Fund’s peer universe. The Board concluded that the management fee paid by the Fund to the Advisor under the management agreement is reasonable in light of the services provided to the Fund.
Comparison to Fees and Services Provided to Other Clients of the Advisor. The Directors also requested and received information from the Advisor concerning the nature of the services, fees, costs and profitability of its advisory services to advisory clients other than the Fund. They observed that these varying types of client accounts require different services and involve different regulatory and entrepreneurial risks than the management of the Fund. The Board analyzed this information and concluded that the fees charged and services provided to the Fund were reasonable by comparison.
Payments to Intermediaries. The Directors also requested and received a description of payments made to intermediaries by the Fund and the Advisor. These payments include various payments made by the Fund or the Advisor to different types of intermediaries and recordkeepers for distribution and service activities provided for the Fund. The Board reviewed such information and found the payments to be reasonable in scope and purpose.
Collateral or “Fall-Out” Benefits Derived by the Advisor. The Board considered the existence of collateral benefits the Advisor may receive as a result of its relationship with the Fund. They concluded that the Advisor’s primary business is managing mutual funds and it generally does not use fund or shareholder information to generate profits in other lines of business, and therefore does not derive any significant collateral benefits from them. The Board noted that additional assets from other clients may offer the Advisor some benefit from increased leverage with service providers and counterparties. Additionally, the Advisor receives proprietary research from broker-dealers that execute fund portfolio transactions, which the Board concluded is likely to benefit other clients of the Advisor as well as Fund shareholders. The Board also determined that the Advisor is able to provide investment management services to certain clients other than the Fund, at least in part, due to its existing infrastructure built to serve the fund complex. The Board concluded that appropriate allocation methodologies had been employed to assign resources and the cost of those resources to these other clients and, where expressly provided, these other client assets may be included with the assets of the Fund to determine breakpoints in the management fee schedule.
Existing Relationship. The Board also considered whether there was any reason for not continuing the existing arrangement with the Advisor. In this regard, the Board was mindful of the potential disruptions of the Fund’s operations and various risks, uncertainties, and other effects that could occur as a result of a decision not to continue such relationship. In particular, the Board recognized that most shareholders have invested in the Fund on the strength of the Advisor’s industry standing and reputation and in the expectation that the Advisor will have a continuing role in providing advisory services to the Fund.
Conclusion of the Directors. As a result of this process, the Board, including all of the independent Directors, taking into account all of the factors discussed above and the information provided by the Advisor and others in connection with its review and throughout the year, determined that the management fee is fair and reasonable in light of the services provided and that the investment management agreement between the Fund and the Advisor, as well as the Subadvisory Agreements and each Subadvisor, should be renewed.
Retirement Account Information
As required by law, distributions you receive from certain IRAs are subject to federal income tax withholding, unless you elect not to have withholding apply. Tax will be withheld on the total amount withdrawn even though you may be receiving amounts that are not subject to withholding, such as nondeductible contributions. In such case, excess amounts of withholding could occur. You may adjust your withholding election so that a greater or lesser amount will be withheld.
If you don’t want us to withhold on this amount, you must notify us to not withhold the federal income tax. You may notify us in writing or in certain situations by telephone or through other electronic means. For systematic withdrawals, your withholding election will remain in effect until revoked or changed by filing a new election. You have the right to revoke your election at any time.
Remember, even if you elect not to have income tax withheld, you are liable for paying income tax on the taxable portion of your withdrawal. If you elect not to have income tax withheld or you don’t have enough income tax withheld, you may be responsible for payment of estimated tax. You may incur penalties under the estimated tax rules if your withholding and estimated tax payments are not sufficient. You can reduce or defer the income tax on a distribution by directly or indirectly rolling such distribution over to another IRA or eligible plan. You should consult your tax advisor for additional information.
State tax will be withheld if, at the time of your distribution, your address is within one of the mandatory withholding states and you have federal income tax withheld (or as otherwise required by state law). State taxes will be withheld from your distribution in accordance with the respective state rules.
Distributions you receive from 403(b), 457 and qualified plans are subject to special tax and withholding rules. Your plan administrator or plan sponsor is required to provide you with a special tax notice explaining those rules at the time you request a distribution. If applicable, federal and/or state taxes may be withheld from your distribution amount.
Proxy Voting Policies
A description of the policies that the fund's investment advisor uses in exercising the voting rights associated with the securities purchased and/or held by the fund is available without charge, upon request, by calling 1-800-345-2021. It is also available on the "About Us" page of American Century Investments’ website at americancentury.com and on the Securities and Exchange Commission’s website at sec.gov. Information regarding how the investment advisor voted proxies relating to portfolio securities during the most recent 12-month period ended June 30 is available on the "About Us" page at americancentury.com. It is also available at sec.gov.
Quarterly Portfolio Disclosure
The fund files its complete schedule of portfolio holdings with the Securities and Exchange Commission (SEC) for the first and third quarters of each fiscal year on Form N-Q. The fund’s Forms N-Q are available on the SEC’s website at sec.gov, and may be reviewed and copied at the SEC’s Public Reference Room in Washington, DC. Information on the operation of the Public Reference Room may be obtained by calling 1-800-SEC-0330. The fund also makes its complete schedule of portfolio holdings for the most recent quarter of its fiscal year available on its website at americancentury.com and, upon request, by calling 1-800-345-2021.
Other Tax Information
The following information is provided pursuant to provisions of the Internal Revenue Code.
The fund hereby designates up to the maximum amount allowable as qualified dividend income for the fiscal year ended October 31, 2016.
For corporate taxpayers, the fund hereby designates $730, or up to the maximum amount allowable, of ordinary income distributions paid during the fiscal year ended October 31, 2016 as qualified for the corporate dividends received deduction.
|
| | |
| |
| | | |
| Contact Us | americancentury.com | |
| Automated Information Line | 1-800-345-8765 | |
| Investor Services Representative | 1-800-345-2021 or 816-531-5575 | |
| Investors Using Advisors | 1-800-378-9878 | |
| Business, Not-For-Profit, Employer-Sponsored Retirement Plans | 1-800-345-3533 | |
| Banks and Trust Companies, Broker-Dealers, Financial Professionals, Insurance Companies | 1-800-345-6488 | |
| Telecommunications Relay Service for the Deaf | 711 | |
| | | |
| American Century Capital Portfolios, Inc. | |
| | | |
Investment Advisor: American Century Investment Management, Inc. Kansas City, Missouri | |
| | | |
| This report and the statements it contains are submitted for the general information of our shareholders. The report is not authorized for distribution to prospective investors unless preceded or accompanied by an effective prospectus. | |
| | | |
©2016 American Century Proprietary Holdings, Inc. All rights reserved.
CL-ANN-90981 1612 | |
|
| |
| | |
| | Annual Report |
| | |
| | October 31, 2016 |
| | |
| | Global Real Estate Fund |
|
| | |
| President’s Letter | 2 |
|
| Performance | 3 |
|
| Portfolio Commentary | |
|
| Fund Characteristics | |
|
| Shareholder Fee Example | |
|
| Schedule of Investments | |
|
| Statement of Assets and Liabilities | |
|
| Statement of Operations | |
|
| Statement of Changes in Net Assets | |
|
| Notes to Financial Statements | |
|
| Financial Highlights | |
|
| Report of Independent Registered Public Accounting Firm | |
|
| Management | |
|
| Approval of Management Agreement | |
|
| Additional Information | |
|
Any opinions expressed in this report reflect those of the author as of the date of the report, and do not necessarily represent the opinions of American Century Investments® or any other person in the American Century Investments organization. Any such opinions are subject to change at any time based upon market or other conditions and American Century Investments disclaims any responsibility to update such opinions. These opinions may not be relied upon as investment advice and, because investment decisions made by American Century Investments funds are based on numerous factors, may not be relied upon as an indication of trading intent on behalf of any American Century Investments fund. Security examples are used for representational purposes only and are not intended as recommendations to purchase or sell securities. Performance information for comparative indices and securities is provided to American Century Investments by third party vendors. To the best of American Century Investments’ knowledge, such information is accurate at the time of printing.
Jonathan Thomas
Dear Investor:
Thank you for reviewing this annual report for the period ended October 31, 2016. It provides investment performance and portfolio information, plus longer-term historical performance data. Annual reports help convey important information about fund returns, including market factors that affected performance during the reporting period. For additional, updated investment and market insights, we encourage you to visit our website, americancentury.com.
Central Bank Stimulus Boosted the Markets After Big Bouts of Volatility
The mostly positive returns for the full reporting period do not capture the short-term market volatility investors experienced at various times. Most broad stock and bond benchmarks posted gains, despite an interest rate increase by the Federal Reserve (Fed) in December 2015, extreme market volatility in early 2016 from global contagion concerns about China’s economic deceleration and currency devaluations, and more turmoil in June 2016 triggered by the unexpected U.K. vote to exit the European Union (Brexit).
Each big bout of financial market volatility was followed by another shot of monetary policy stimulus from central banks. Or, in the case of the Fed, delays in further interest rate increases. This stabilized the financial markets, and generally boosted their performance. The rising tide of monetary stimulus lifted most investment boats, including both stock and bond vehicles, which was unusual. Illustrating this phenomenon, the S&P 500 Index and the Bloomberg Barclays U.S. Aggregate Bond Index posted nearly equal performance, advancing 4.51% and 4.37%, respectively, for the 12 months. Global bond and real estate investment trust (REIT) indices exceeded that performance, while U.S. growth stock indices lagged; U.S. value equity generally outperformed U.S. growth.
The reporting period ended before the November 2016 U.S. presidential election, which, like Brexit, featured a surprising outcome with potentially far-reaching populist and anti-globalization ramifications that are still unfolding and being assessed. What we do know is that Donald Trump and his policy proposals face a deeply divided nation and add another layer of uncertainty to the global economic and market outlook, which could trigger further bouts of short-term volatility. In this challenging investment environment, we strongly believe in staying the course and remaining focused on longer-term goals, using disciplined, actively managed, diversified, risk-aware strategies. We appreciate your continued trust in us.
Sincerely,
Jonathan Thomas
President and Chief Executive Officer
American Century Investments
|
| | | | | |
| Total Returns as of October 31, 2016 |
| | | | Average
Annual Returns | |
| | Ticker Symbol | 1 year | 5 years | Since
Inception | Inception
Date |
| Investor Class | ARYVX | 1.50% | 8.62% | 6.14% | 4/29/11 |
| FTSE EPRA/NAREIT Global Index | — | 3.07% | 7.80% | 5.08% | — |
| MSCI ACWI Index | — | 2.05% | 8.02% | 4.81% | — |
| Institutional Class | ARYNX | 1.79% | 8.86% | 6.37% | 4/29/11 |
| A Class | ARYMX | | | | 4/29/11 |
| No sales charge | | 1.33% | 8.38% | 5.88% | |
| With sales charge | | -4.51% | 7.10% | 4.75% | |
| C Class | ARYTX | 0.47% | 7.56% | 5.09% | 4/29/11 |
| R Class | ARYWX | 1.07% | 8.11% | 5.62% | 4/29/11 |
| R6 Class | ARYDX | 1.86% | — | 5.17% | 7/26/13 |
Fund returns would have been lower if a portion of the fees had not been waived.
Sales charges include initial sales charges and contingent deferred sales charges (CDSCs), as applicable. A Class shares have a 5.75% maximum initial sales charge and may be subject to a maximum CDSC of 1.00%. C Class shares redeemed within 12 months of purchase are subject to a maximum CDSC of 1.00%. The SEC requires that mutual funds provide performance information net of maximum sales charges in all cases where charges could be applied.
Data presented reflect past performance. Past performance is no guarantee of future results. Current performance may be higher or lower than the performance shown. Total returns for periods less than one year are not annualized. Investment return and principal value will fluctuate, and redemption value may be more or less than original cost. Data assumes reinvestment of dividends and capital gains, and none of the charts reflect the deduction of taxes that a shareholder would pay on fund distributions or the redemption of fund shares. To obtain performance data current to the most recent month end, please call 1-800-345-2021 or visit americancentury.com. For additional information about the fund, please consult the prospectus.
|
|
| Growth of $10,000 Over Life of Class |
| $10,000 investment made April 29, 2011 |
| Performance for other share classes will vary due to differences in fee structure. |
|
| |
| Value on October 31, 2016 |
| | Investor Class — $13,888 |
| |
| | FTSE EPRA/NAREIT Global Index — $13,144 |
| |
| | MSCI ACWI Index — $12,955 |
| |
Ending value of Investor Class would have been lower if a portion of the fees had not been waived.
|
| | | | | |
| Total Annual Fund Operating Expenses |
| Investor Class | Institutional Class | A Class | C Class | R Class | R6 Class |
| 1.21% | 1.01% | 1.46% | 2.21% | 1.71% | 0.86% |
The total annual fund operating expenses shown is as stated in the fund’s prospectus current as of the date of this report. The prospectus may vary from the expense ratio shown elsewhere in this report because it is based on a different time period, includes acquired fund fees and expenses, and, if applicable, does not include fee waivers or expense reimbursements.
Data presented reflect past performance. Past performance is no guarantee of future results. Current performance may be higher or lower than the performance shown. Total returns for periods less than one year are not annualized. Investment return and principal value will fluctuate, and redemption value may be more or less than original cost. Data assumes reinvestment of dividends and capital gains, and none of the charts reflect the deduction of taxes that a shareholder would pay on fund distributions or the redemption of fund shares. To obtain performance data current to the most recent month end, please call 1-800-345-2021 or visit americancentury.com. For additional information about the fund, please consult the prospectus.
Portfolio Managers: Steven Brown and Steven Rodriguez
Performance Summary
Global Real Estate returned 1.50%* for the fiscal year ended October 31, 2016. By comparison, the FTSE EPRA/NAREIT Global Index (the fund’s benchmark) returned 3.07%, while the MSCI ACWI Index (a broad global stock market measure) returned 2.05%.
Global Real Estate Market Overview
Global real estate stocks advanced modestly for the 12-month period but trailed the performance of the broad global equity indices. For much of the period, global property stocks rose, benefiting from strong fundamentals as demand outpaced supply in many countries and regions. In addition, declining interest rates—especially in the wake of the affirmative vote for “Brexit,” the U.K. referendum to leave the European Union—reduced borrowing costs for commercial real estate companies and made their dividend yields more attractive. Over the last three months of the period, however, real estate stocks reversed course as rising global interest rates and an uncertain global economic environment put downward pressure on the sector.
During the reporting period, real estate stocks were reclassified and elevated within the Global Industry Classification Standard (GICS), one of the leading stock market classification systems. Previously, GICS classified stocks into ten different market sectors; real estate stocks had been included within the financials sector. However, effective August 31, 2016, real estate was broken out from the financials sector and became the eleventh sector in the GICS system. We believe this change affirms real estate as a distinct and relevant asset class and raises the overall visibility of the real estate sector.
Among developed markets, property stocks in the Asia/Pacific region generated the best returns, led by the strong performance of real estate stocks in Hong Kong and Australia. Property stocks in North America also fared well, benefiting from robust earnings growth and favorable fundamentals. European property stocks lagged amid weakness in the U.K. and the Netherlands. Real estate stocks in emerging markets posted solid gains, led by outsized returns in Brazil and Indonesia.
Europe and Emerging Markets Detracted
The fund’s underperformance of its benchmark resulted primarily from holdings in Europe and an underweight position in emerging markets. In Europe, the portfolio’s holdings in the U.K. declined amid uncertainty about the investment landscape in the wake of the Brexit vote. Notable detractors included London-based office landlords Derwent London and Great Portland Estates, which faced deteriorating fundamentals resulting from Brexit fears. We eliminated Derwent from the portfolio and significantly reduced the fund’s position in Great Portland.
Another holding adversely affected by Brexit was Japanese property developer Mitsui Fudosan. The company has several large development projects in the U.K., and Brexit concerns led to uncertainty about Mitsui Fudosan’s ability to fully lease the properties. In addition, concerns about deterioration in the condominium market in Japan weighed on the stock. We eliminated Mitsui Fudosan from the portfolio during the period.
* All fund returns referenced in this commentary are for Investor Class shares. Fund returns would have been lower if a portion of the fees had not been waived. Performance for other share classes will vary due to differences in fee structure; when Investor Class performance exceeds that of the fund’s benchmark, other share classes may not. See page 3 for returns for all share classes.
The most significant detractor among the portfolio’s U.S. holdings was self-storage operator Extra Space Storage. The company faced declining rental demand, which hindered its revenue and earnings growth and put downward pressure on the stock. As a result, we eliminated Extra Space Storage from the portfolio.
U.S. and Japan Added Value
Stock selection in the U.S. and Japan aided relative performance for the 12-month period. In the U.S., data center operators Equinix and Digital Realty Trust were among the fund’s top performance contributors. Both stocks benefited from strong demand for data center leasing space from cloud computing providers to meet their growing capacity needs. We reduced the fund’s exposure to these two stocks after their strong performance, but they remained meaningful positions in the portfolio.
Other notable contributors among the portfolio’s U.S. holdings included industrial property owners Prologis and Duke Realty. Both stocks continued to benefit from increased demand from companies with rapidly growing e-commerce operations.
In Japan, the leading contributor was Japanese developer Daito Trust Construction. The company, which develops rental housing, enjoyed strong growth in new orders resulting from a larger, more efficient sales force.
Outlook
Commercial property market fundamentals remain compelling in many regions of the globe, supported by low interest rates and accommodative central banks. This environment should continue to provide a favorable backdrop for global real estate stocks.
In the U.S., we are focused on several market trends, including strength in non-coastal markets, increased deleveraging, and strategic investment opportunities presented by leadership changes and asset spin-offs. Within this component of the portfolio, we have maintained overweight positions in industrial and residential real estate stocks, along with an underweight position in retail property stocks.
In Europe, we remain wary of potential fallout stemming from Brexit. Although our main emphasis in Europe is on stable property markets on the Continent, the fund has a modest overweight in the U.K., where real estate stocks are trading at significant discounts to their underlying property values. However, the fund has limited exposure to the London office market, where Brexit fears are contributing to deteriorating fundamentals.
The fund remains underweight the Asia/Pacific region because of policy-related headwinds. For example, both China and Singapore have restrictive housing market policies that aim to limit home price increases. However, we favor property stocks in Hong Kong, where the housing market has stabilized thanks to improving demand and low mortgage rates. In Japan, we shifted away from companies with above-average exposure to the condominium market, where prices appear to have peaked after several years of strong appreciation.
We reduced the fund’s underweight position in emerging markets as valuations became more attractive and real estate policies improved in several countries, including Indonesia and Brazil.
|
| |
| OCTOBER 31, 2016 | |
| Top Ten Holdings | % of net assets |
| Prologis, Inc. | 4.2% |
| Simon Property Group, Inc. | 3.4% |
| Mitsubishi Estate Co. Ltd. | 2.9% |
| Apartment Investment & Management Co., Class A | 2.7% |
| HCP, Inc. | 2.7% |
| CubeSmart | 2.5% |
| Vornado Realty Trust | 2.5% |
| Duke Realty Corp. | 2.4% |
| Alexandria Real Estate Equities, Inc. | 2.4% |
| Unibail-Rodamco SE | 2.4% |
| | |
| Types of Investments in Portfolio | % of net assets |
| Domestic Common Stocks | 51.1% |
| Foreign Common Stocks | 47.6% |
| Total Common Stocks | 98.7% |
| Temporary Cash Investments | 1.5% |
| Other Assets and Liabilities | (0.2)% |
| | |
| Investments by Country | % of net assets |
| United States | 51.1% |
| Japan | 10.9% |
| Hong Kong | 7.4% |
| Australia | 5.5% |
| United Kingdom | 4.2% |
| France | 3.4% |
| Germany | 3.3% |
| Canada | 2.5% |
| Singapore | 2.3% |
| Other Countries | 8.1% |
| Cash and Equivalents* | 1.3% |
| *Includes temporary cash investments and other assets and liabilities. | |
Fund shareholders may incur two types of costs: (1) transaction costs, including sales charges (loads) on purchase payments and redemption/exchange fees; and (2) ongoing costs, including management fees; distribution and service (12b-1) fees; and other fund expenses. This example is intended to help you understand your ongoing costs (in dollars) of investing in your fund and to compare these costs with the ongoing cost of investing in other mutual funds.
The example is based on an investment of $1,000 made at the beginning of the period and held for the entire period from May 1, 2016 to October 31, 2016.
Actual Expenses
The table provides information about actual account values and actual expenses for each class. You may use the information, together with the amount you invested, to estimate the expenses that you paid over the period. First, identify the share class you own. Then simply divide your account value by $1,000 (for example, an $8,600 account value divided by $1,000 = 8.6), then multiply the result by the number under the heading “Expenses Paid During Period” to estimate the expenses you paid on your account during this period.
If you hold Investor Class shares of any American Century Investments fund, or Institutional Class shares of the American Century Diversified Bond Fund, in an American Century Investments account (i.e., not a financial intermediary or retirement plan account), American Century Investments may charge you a $12.50 semiannual account maintenance fee if the value of those shares is less than $10,000. We will redeem shares automatically in one of your accounts to pay the $12.50 fee. In determining your total eligible investment amount, we will include your investments in all personal accounts (including American Century Investments Brokerage accounts) registered under your Social Security number. Personal accounts include individual accounts, joint accounts, UGMA/UTMA accounts, personal trusts, Coverdell Education Savings Accounts and IRAs (including traditional, Roth, Rollover, SEP-, SARSEP- and SIMPLE-IRAs), and certain other retirement accounts. If you have only business, business retirement, employer-sponsored or American Century Investments Brokerage accounts, you are currently not subject to this fee. If you are subject to the Account Maintenance Fee, your account value could be reduced by the fee amount.
Hypothetical Example for Comparison Purposes
The table also provides information about hypothetical account values and hypothetical expenses based on the actual expense ratio of each class of your fund and an assumed rate of return of 5% per year before expenses, which is not the actual return of a fund’s share class. The hypothetical account values and expenses may not be used to estimate the actual ending account balance or expenses you paid for the period. You may use this information to compare the ongoing costs of investing in your fund and other funds. To do so, compare this 5% hypothetical example with the 5% hypothetical examples that appear in the shareholder reports of the other funds.
Please note that the expenses shown in the table are meant to highlight your ongoing costs only and do not reflect any transactional costs, such as sales charges (loads) or redemption/exchange fees. Therefore, the table is useful in comparing ongoing costs only, and will not help you determine the relative total costs of owning different funds. In addition, if these transactional costs were included, your costs would have been higher.
|
| | | | |
| Beginning
Account Value
5/1/16 | Ending
Account Value
10/31/16 | Expenses Paid
During Period(1)
5/1/16 - 10/31/16 | Annualized
Expense Ratio(1) |
| Actual | | | | |
| Investor Class (after waiver) | $1,000 | $998.30 | $5.73 | 1.14% |
| Investor Class (before waiver) | $1,000 | $998.30(2) | $6.03 | 1.20% |
| Institutional Class (after waiver) | $1,000 | $1,000.00 | $4.73 | 0.94% |
| Institutional Class (before waiver) | $1,000 | $1,000.00(2) | $5.03 | 1.00% |
| A Class (after waiver) | $1,000 | $997.40 | $6.98 | 1.39% |
| A Class (before waiver) | $1,000 | $997.40(2) | $7.28 | 1.45% |
| C Class (after waiver) | $1,000 | $993.00 | $10.72 | 2.14% |
| C Class (before waiver) | $1,000 | $993.00(2) | $11.02 | 2.20% |
| R Class (after waiver) | $1,000 | $995.60 | $8.23 | 1.64% |
| R Class (before waiver) | $1,000 | $995.60(2) | $8.53 | 1.70% |
| R6 Class (after waiver) | $1,000 | $1,000.00 | $3.97 | 0.79% |
| R6 Class (before waiver) | $1,000 | $1,000.00(2) | $4.27 | 0.85% |
| Hypothetical | | | | |
| Investor Class (after waiver) | $1,000 | $1,019.41 | $5.79 | 1.14% |
| Investor Class (before waiver) | $1,000 | $1,019.10 | $6.09 | 1.20% |
| Institutional Class (after waiver) | $1,000 | $1,020.41 | $4.77 | 0.94% |
| Institutional Class (before waiver) | $1,000 | $1,020.11 | $5.08 | 1.00% |
| A Class (after waiver) | $1,000 | $1,018.15 | $7.05 | 1.39% |
| A Class (before waiver) | $1,000 | $1,017.85 | $7.35 | 1.45% |
| C Class (after waiver) | $1,000 | $1,014.38 | $10.84 | 2.14% |
| C Class (before waiver) | $1,000 | $1,014.08 | $11.14 | 2.20% |
| R Class (after waiver) | $1,000 | $1,016.89 | $8.31 | 1.64% |
| R Class (before waiver) | $1,000 | $1,016.59 | $8.62 | 1.70% |
| R6 Class (after waiver) | $1,000 | $1,021.17 | $4.01 | 0.79% |
| R6 Class (before waiver) | $1,000 | $1,020.86 | $4.32 | 0.85% |
| |
| (1) | Expenses are equal to the class's annualized expense ratio listed in the table above, multiplied by the average account value over the period, multiplied by 184, the number of days in the most recent fiscal half-year, divided by 366, to reflect the one-half year period. |
| |
| (2) | Ending account value assumes the return earned after waiver and would have been lower if a portion of the fees had not been waived. |
OCTOBER 31, 2016
|
| | | | | |
| | Shares | Value |
| COMMON STOCKS — 98.7% | | |
| Australia — 5.5% | | |
| Dexus Property Group | 226,029 |
| $ | 1,537,145 |
|
| Goodman Group | 278,736 |
| 1,439,714 |
|
| Mirvac Group | 550,193 |
| 874,731 |
|
NEXTDC Ltd.(1) | 167,827 |
| 469,811 |
|
| Scentre Group | 284,069 |
| 909,744 |
|
| Westfield Corp. | 57,044 |
| 386,201 |
|
| | | 5,617,346 |
|
| Brazil — 1.3% | | |
BR Malls Participacoes SA(1) | 324,210 |
| 1,296,028 |
|
| Canada — 2.5% | | |
| Canadian Apartment Properties REIT | 22,890 |
| 500,361 |
|
| Chartwell Retirement Residences | 91,717 |
| 1,021,585 |
|
| H&R Real Estate Investment Trust | 58,383 |
| 992,855 |
|
| | | 2,514,801 |
|
| China — 1.4% | | |
| China Overseas Land & Investment Ltd. | 136,000 |
| 419,983 |
|
| China Resources Land Ltd. | 312,888 |
| 780,248 |
|
| Longfor Properties Co. Ltd. | 201,000 |
| 266,945 |
|
| | | 1,467,176 |
|
| Finland — 0.8% | | |
| Sponda Oyj | 171,531 |
| 811,942 |
|
| France — 3.4% | | |
| Gecina SA | 7,298 |
| 1,063,912 |
|
| Unibail-Rodamco SE | 10,312 |
| 2,456,440 |
|
| | | 3,520,352 |
|
| Germany — 3.3% | | |
| Deutsche Wohnen AG | 62,395 |
| 2,035,645 |
|
| Vonovia SE | 39,124 |
| 1,377,999 |
|
| | | 3,413,644 |
|
| Hong Kong — 7.4% | | |
| Cheung Kong Property Holdings Ltd. | 268,500 |
| 1,988,940 |
|
| Link REIT | 291,000 |
| 2,074,940 |
|
| Sun Hung Kai Properties Ltd. | 132,000 |
| 1,970,924 |
|
| Wharf Holdings Ltd. (The) | 204,000 |
| 1,533,508 |
|
| | | 7,568,312 |
|
| Indonesia — 0.7% | | |
| Bumi Serpong Damai Tbk PT | 2,702,000 |
| 449,367 |
|
| Summarecon Agung Tbk PT | 1,775,700 |
| 224,548 |
|
| | | 673,915 |
|
| Japan — 10.9% | | |
| Activia Properties, Inc. | 179 |
| 870,506 |
|
| Advance Residence Investment Corp. | 352 |
| 984,808 |
|
| Daito Trust Construction Co. Ltd. | 7,900 |
| 1,323,949 |
|
| GLP J-REIT | 876 |
| 1,098,446 |
|
| Hulic Co. Ltd. | 202,700 |
| 1,934,802 |
|
|
| | | | | |
| | Shares | Value |
| Hulic Reit, Inc. | 733 |
| $ | 1,284,690 |
|
| Mitsubishi Estate Co. Ltd. | 150,000 |
| 2,977,257 |
|
| Mori Hills REIT Investment Corp. | 489 |
| 689,179 |
|
| | | 11,163,637 |
|
| Mexico — 0.6% | | |
| Corp. Inmobiliaria Vesta SAB de CV | 386,618 |
| 584,396 |
|
| Philippines — 0.5% | | |
| Ayala Land, Inc. | 733,900 |
| 549,437 |
|
| Singapore — 2.3% | | |
| CapitaLand Mall Trust | 560,800 |
| 834,398 |
|
| Mapletree Commercial Trust | 573,838 |
| 631,067 |
|
| Mapletree Industrial Trust | 722,400 |
| 893,102 |
|
| | | 2,358,567 |
|
| South Africa — 0.6% | | |
| Hyprop Investments Ltd. | 73,560 |
| 653,018 |
|
| Spain — 1.1% | | |
| Inmobiliaria Colonial SA | 159,958 |
| 1,129,596 |
|
| Sweden — 1.1% | | |
| Hufvudstaden AB, A Shares | 75,644 |
| 1,170,821 |
|
| United Kingdom — 4.2% | | |
| Great Portland Estates plc | 55,118 |
| 400,739 |
|
| Safestore Holdings plc | 148,391 |
| 650,783 |
|
| Segro plc | 354,170 |
| 1,895,281 |
|
| Shaftesbury plc | 65,213 |
| 731,956 |
|
| UNITE Group plc (The) | 88,800 |
| 601,606 |
|
| | | 4,280,365 |
|
| United States — 51.1% | | |
| Acadia Realty Trust | 27,464 |
| 925,262 |
|
| Alexandria Real Estate Equities, Inc. | 22,802 |
| 2,458,284 |
|
| American Campus Communities, Inc. | 32,313 |
| 1,683,830 |
|
| American Homes 4 Rent | 56,745 |
| 1,197,887 |
|
| American Tower Corp. | 14,369 |
| 1,683,903 |
|
| Apartment Investment & Management Co., Class A | 63,579 |
| 2,801,927 |
|
| AvalonBay Communities, Inc. | 10,627 |
| 1,819,130 |
|
| Brixmor Property Group, Inc. | 79,437 |
| 2,019,289 |
|
| Camden Property Trust | 13,072 |
| 1,064,584 |
|
| Colony Starwood Homes | 44,433 |
| 1,289,001 |
|
| CubeSmart | 98,451 |
| 2,566,618 |
|
| Digital Realty Trust, Inc. | 21,354 |
| 1,995,104 |
|
| Duke Realty Corp. | 95,570 |
| 2,499,155 |
|
| Empire State Realty Trust, Inc. | 71,819 |
| 1,405,498 |
|
| Equinix, Inc. | 6,038 |
| 2,157,257 |
|
| HCP, Inc. | 88,840 |
| 2,781,580 |
|
| Hilton Worldwide Holdings, Inc. | 45,860 |
| 1,036,436 |
|
| Mack-Cali Realty Corp. | 58,416 |
| 1,500,123 |
|
| Medical Properties Trust, Inc. | 56,277 |
| 784,501 |
|
| Physicians Realty Trust | 65,129 |
| 1,287,600 |
|
| Prologis, Inc. | 82,261 |
| 4,290,734 |
|
Quality Care Properties, Inc.(1)(2) | 17,768 |
| 272,739 |
|
| Retail Properties of America, Inc. | 71,825 |
| 1,118,315 |
|
| Simon Property Group, Inc. | 18,929 |
| 3,520,037 |
|
|
| | | | | |
| | Shares | Value |
| Spirit Realty Capital, Inc. | 115,845 |
| $ | 1,379,714 |
|
| STORE Capital Corp. | 48,854 |
| 1,333,226 |
|
| Taubman Centers, Inc. | 16,809 |
| 1,217,980 |
|
| Urban Edge Properties | 27,677 |
| 714,343 |
|
| Ventas, Inc. | 16,388 |
| 1,110,287 |
|
| Vornado Realty Trust | 27,381 |
| 2,540,409 |
|
| | | 52,454,753 |
|
TOTAL COMMON STOCKS
(Cost $96,760,303) | | 101,228,106 |
|
| TEMPORARY CASH INVESTMENTS — 1.5% | | |
| Repurchase Agreement, Fixed Income Clearing Corp., (collateralized by various U.S. Treasury obligations, 3.00%, 11/15/45, valued at $1,622,450), at 0.10%, dated 10/31/16, due 11/1/16 (Delivery value $1,588,004) | | 1,588,000 |
|
| State Street Institutional U.S. Government Money Market Fund, Premier Class | 6,332 |
| 6,332 |
|
TOTAL TEMPORARY CASH INVESTMENTS
(Cost $1,594,332) | | 1,594,332 |
|
TOTAL INVESTMENT SECURITIES — 100.2%
(Cost $98,354,635) | | 102,822,438 |
|
| OTHER ASSETS AND LIABILITIES — (0.2)% | | (222,375 | ) |
| TOTAL NET ASSETS — 100.0% | | $ | 102,600,063 |
|
|
| | |
| SUB-INDUSTRY ALLOCATION | |
| (as a % of net assets) | |
| Retail REITs | 17.7 | % |
| Industrial REITs | 11.9 | % |
| Residential REITs | 11.1 | % |
| Real Estate Operating Companies | 10.7 | % |
| Office REITs | 9.0 | % |
| Diversified REITs | 8.8 | % |
| Specialized REITs | 8.7 | % |
| Diversified Real Estate Activities | 8.1 | % |
| Health Care REITs | 6.1 | % |
| Real Estate Development | 4.1 | % |
| Hotels, Resorts and Cruise Lines | 1.0 | % |
| Health Care Facilities | 1.0 | % |
| Internet Software and Services | 0.5 | % |
| Cash and Equivalents* | 1.3 | % |
*Includes temporary cash investments and other assets and liabilities.
|
| | |
| NOTES TO SCHEDULE OF INVESTMENTS |
| |
| (2) | When-issued security. The issue price and yield are fixed on the date of the commitment, but payment and delivery are scheduled for a future date. |
See Notes to Financial Statements.
|
|
| Statement of Assets and Liabilities |
|
| | | |
| OCTOBER 31, 2016 | |
| Assets | |
| Investment securities, at value (cost of $98,354,635) | $ | 102,822,438 |
|
| Foreign currency holdings, at value (cost of $25,782) | 25,510 |
|
| Receivable for investments sold | 3,136,656 |
|
| Receivable for capital shares sold | 238,160 |
|
| Dividends and interest receivable | 109,213 |
|
| Other assets | 334 |
|
| | 106,332,311 |
|
| | |
| Liabilities | |
| Payable for investments purchased | 3,249,733 |
|
| Payable for capital shares redeemed | 375,929 |
|
| Accrued management fees | 96,581 |
|
| Distribution and service fees payable | 10,005 |
|
| | 3,732,248 |
|
| | |
| Net Assets | $ | 102,600,063 |
|
| | |
| Net Assets Consist of: | |
| Capital (par value and paid-in surplus) | $ | 98,833,111 |
|
| Undistributed net investment income | 2,417,783 |
|
| Accumulated net realized loss | (3,114,666 | ) |
| Net unrealized appreciation | 4,463,835 |
|
| | $ | 102,600,063 |
|
|
| | | | | | |
| | Net Assets | Shares Outstanding | Net Asset Value Per Share |
| Investor Class, $0.01 Par Value |
| $67,797,563 |
| 5,919,236 |
| $11.45 |
| Institutional Class, $0.01 Par Value |
| $2,825,963 |
| 246,479 |
| $11.47 |
| A Class, $0.01 Par Value |
| $16,651,134 |
| 1,455,587 |
| $11.44* |
| C Class, $0.01 Par Value |
| $7,281,593 |
| 639,752 |
| $11.38 |
| R Class, $0.01 Par Value |
| $106,059 |
| 9,277 |
| $11.43 |
| R6 Class, $0.01 Par Value |
| $7,937,751 |
| 691,893 |
| $11.47 |
*Maximum offering price $12.14 (net asset value divided by 0.9425).
See Notes to Financial Statements.
|
| | | |
| YEAR ENDED OCTOBER 31, 2016 | |
| Investment Income (Loss) | |
| Income: | |
| Dividends (net of foreign taxes withheld of $129,630) | $ | 2,703,565 |
|
| Interest | 1,785 |
|
| | 2,705,350 |
|
| | |
| Expenses: | |
| Management fees | 1,279,496 |
|
| Distribution and service fees: | |
| A Class | 49,213 |
|
| C Class | 72,919 |
|
| R Class | 818 |
|
| Directors' fees and expenses | 3,821 |
|
| Other expenses | 994 |
|
| | 1,407,261 |
|
| Fees waived | (54,923 | ) |
| | 1,352,338 |
|
| | |
| Net investment income (loss) | 1,353,012 |
|
| | |
| Realized and Unrealized Gain (Loss) | |
| Net realized gain (loss) on: | |
| Investment transactions | 4,158,379 |
|
| Foreign currency transactions | (10,069 | ) |
| | 4,148,310 |
|
| | |
| Change in net unrealized appreciation (depreciation) on: | |
| Investments | (4,132,213 | ) |
| Translation of assets and liabilities in foreign currencies | (631 | ) |
| | (4,132,844 | ) |
| | |
| Net realized and unrealized gain (loss) | 15,466 |
|
| | |
| Net Increase (Decrease) in Net Assets Resulting from Operations | $ | 1,368,478 |
|
See Notes to Financial Statements.
|
|
| Statement of Changes in Net Assets |
|
| | | | | | |
| YEARS ENDED OCTOBER 31, 2016 AND OCTOBER 31, 2015 |
| Increase (Decrease) in Net Assets | October 31, 2016 | October 31, 2015 |
| Operations | | |
| Net investment income (loss) | $ | 1,353,012 |
| $ | 1,465,472 |
|
| Net realized gain (loss) | 4,148,310 |
| (1,579,776 | ) |
| Change in net unrealized appreciation (depreciation) | (4,132,844 | ) | (78,125 | ) |
| Net increase (decrease) in net assets resulting from operations | 1,368,478 |
| (192,429 | ) |
| | | |
| Distributions to Shareholders | | |
| From net investment income: | | |
| Investor Class | (2,084,369 | ) | (2,431,936 | ) |
| Institutional Class | (129,457 | ) | (256,274 | ) |
| A Class | (553,119 | ) | (595,878 | ) |
| C Class | (140,545 | ) | (150,914 | ) |
| R Class | (5,959 | ) | (18,030 | ) |
| R6 Class | (310,389 | ) | (1,267 | ) |
| From net realized gains: | | |
| Investor Class | — |
| (812,440 | ) |
| Institutional Class | — |
| (81,260 | ) |
| A Class | — |
| (213,379 | ) |
| C Class | — |
| (68,884 | ) |
| R Class | — |
| (6,955 | ) |
| R6 Class | — |
| (387 | ) |
| Decrease in net assets from distributions | (3,223,838 | ) | (4,637,604 | ) |
| | | |
| Capital Share Transactions | | |
| Net increase (decrease) in net assets from capital share transactions (Note 5) | (8,501,328 | ) | 17,291,214 |
|
| | | |
| Net increase (decrease) in net assets | (10,356,688 | ) | 12,461,181 |
|
| | | |
| Net Assets | | |
| Beginning of period | 112,956,751 |
| 100,495,570 |
|
| End of period | $ | 102,600,063 |
| $ | 112,956,751 |
|
| | | |
| Undistributed net investment income | $ | 2,417,783 |
| $ | 1,175,248 |
|
See Notes to Financial Statements.
|
|
| Notes to Financial Statements |
OCTOBER 31, 2016
1. Organization
American Century Capital Portfolios, Inc. (the corporation) is registered under the Investment Company Act of 1940, as amended (the 1940 Act), as an open-end management investment company and is organized as a Maryland corporation. Global Real Estate Fund (the fund) is one fund in a series issued by the corporation. The fund’s investment objective is to seek high total investment return through a combination of capital appreciation and current income.
The fund offers the Investor Class, the Institutional Class, the A Class, the C Class, the R Class and the R6 Class. The A Class may incur an initial sales charge. The A Class and C Class may be subject to a contingent deferred sales charge. The share classes differ principally in their respective sales charges and distribution and shareholder servicing expenses and arrangements. The Institutional Class and R6 Class shareholders do not require the same level of shareholder and administrative services from American Century Investment Management, Inc. (ACIM) (the investment advisor) as shareholders of other classes. In addition, financial intermediaries do not receive any service, distribution or administrative fees for the R6 Class. As a result, the Institutional Class and R6 Class are charged lower unified management fees.
2. Significant Accounting Policies
The following is a summary of significant accounting policies consistently followed by the fund in preparation of its financial statements. The fund is an investment company and follows accounting and reporting guidance in accordance with accounting principles generally accepted in the United States of America. This may require management to make certain estimates and assumptions at the date of the financial statements. Actual results could differ from these estimates. Management evaluated the impact of events or transactions occurring through the date the financial statements were issued that would merit recognition or disclosure.
Investment Valuations — The fund determines the fair value of its investments and computes its net asset value per share at the close of regular trading (usually 4 p.m. Eastern time) on the New York Stock Exchange (NYSE) on each day the NYSE is open. The Board of Directors has adopted valuation policies and procedures to guide the investment advisor in the fund’s investment valuation process and to provide methodologies for the oversight of the fund’s pricing function.
Equity securities that are listed or traded on a domestic securities exchange are valued at the last reported sales price or at the official closing price as provided by the exchange. Equity securities traded on foreign securities exchanges are generally valued at the closing price of such securities on the exchange where primarily traded or at the close of the NYSE, if that is earlier. If no last sales price is reported, or if local convention or regulation so provides, the mean of the latest bid and asked prices may be used. Securities traded over-the-counter are valued at the mean of the latest bid and asked prices, the last sales price, or the official closing price. Equity securities initially expressed in local currencies are translated into U.S. dollars at the mean of the appropriate currency exchange rate at the close of the NYSE as provided by an independent pricing service.
Open-end management investment companies are valued at the reported net asset value per share. Repurchase agreements are valued at cost, which approximates fair value.
If the fund determines that the market price for an investment is not readily available or the valuation methods mentioned above do not reflect an investment’s fair value, such investment is valued as determined in good faith by the Board of Directors or its delegate, in accordance with policies and procedures adopted by the Board of Directors. In its determination of fair value, the fund may review several factors including, but not limited to, market information regarding the specific investment or comparable investments and correlation with other investment types, futures indices or general market indicators. Circumstances that may cause the fund to use these procedures to value an investment include, but are not limited to: an investment has been declared in default or is distressed; trading in a security has been suspended during the trading day or a security is not actively trading on its principal exchange; prices received from a regular pricing source are deemed unreliable; or there is a foreign market holiday and no trading occurred.
The fund monitors for significant events occurring after the close of an investment’s primary exchange but before the fund’s net asset value per share is determined. Significant events may include, but are not limited to: corporate announcements and transactions; governmental action and political unrest that could impact a specific investment or an investment sector; or armed conflicts, natural disasters and similar events that could affect investments in a specific country or region. The fund also monitors for significant fluctuations between domestic and foreign markets, as evidenced by the U.S. market or such other indicators that the Board of Directors, or its delegate, deems appropriate. If significant fluctuations in foreign markets are identified, the fund may apply a model-derived factor to the closing price of equity securities traded on foreign securities exchanges. The factor is based on observable market data as provided by an independent pricing service.
Security Transactions — Security transactions are accounted for as of the trade date. Net realized gains and losses are determined on the identified cost basis, which is also used for federal income tax purposes.
Investment Income — Dividend income less foreign taxes withheld, if any, is recorded as of the ex-dividend date. Distributions received on securities that represent a return of capital or long-term capital gain are recorded as a reduction of cost of investments and/or as a realized gain. The fund may estimate the components of distributions received that may be considered nontaxable distributions or long-term capital gain distributions for income tax purposes. Interest income is recorded on the accrual basis and includes accretion of discounts and amortization of premiums.
Foreign Currency Translations — All assets and liabilities initially expressed in foreign currencies are translated into U.S. dollars at prevailing exchange rates at period end. The fund may enter into spot foreign currency exchange contracts to facilitate transactions denominated in a foreign currency. Purchases and sales of investment securities, dividend and interest income, spot foreign currency exchange contracts, and expenses are translated at the rates of exchange prevailing on the respective dates of such transactions. Net realized and unrealized foreign currency exchange gains or losses related to investment securities are a component of net realized gain (loss) on investment transactions and change in net unrealized appreciation (depreciation) on investments, respectively.
Repurchase Agreements — The fund may enter into repurchase agreements with institutions that ACIM has determined are creditworthy pursuant to criteria adopted by the Board of Directors. The fund requires that the collateral, represented by securities, received in a repurchase transaction be transferred to the custodian in a manner sufficient to enable the fund to obtain those securities in the event of a default under the repurchase agreement. ACIM monitors, on a daily basis, the securities transferred to ensure the value, including accrued interest, of the securities under each repurchase agreement is equal to or greater than amounts owed to the fund under each repurchase agreement.
Joint Trading Account — Pursuant to an Exemptive Order issued by the Securities and Exchange Commission, the fund, along with certain other funds in the American Century Investments family of funds, may transfer uninvested cash balances into a joint trading account. These balances are invested in one or more repurchase agreements that are collateralized by U.S. Treasury or Agency obligations.
Segregated Assets — In accordance with the 1940 Act, the fund segregates assets on its books and records to cover certain types of investments, including, but not limited to, futures contracts and when-issued securities. ACIM monitors, on a daily basis, the securities segregated to ensure the fund designates a sufficient amount of liquid assets, marked-to-market daily. The fund may also receive assets or be required to pledge assets at the custodian bank or with a broker for margin requirements on futures contracts.
Income Tax Status — It is the fund’s policy to distribute substantially all net investment income and net realized gains to shareholders and to otherwise qualify as a regulated investment company under provisions of the Internal Revenue Code. Accordingly, no provision has been made for income taxes. The fund files U.S. federal, state, local and non-U.S. tax returns as applicable. The fund's tax returns are subject to examination by the relevant taxing authority until expiration of the applicable statute of limitations, which is generally three years from the date of filing but can be longer in certain jurisdictions. At this time, management believes there are no uncertain tax positions which, based on their technical merit, would not be sustained upon examination and for which it is reasonably possible that the total amounts of unrecognized tax benefits will significantly change in the next twelve months.
Multiple Class — All shares of the fund represent an equal pro rata interest in the net assets of the class to which such shares belong, and have identical voting, dividend, liquidation and other rights and the same terms and conditions, except for class specific expenses and exclusive rights to vote on matters affecting only individual classes. Income, non-class specific expenses, and realized and unrealized capital gains and losses of the fund are allocated to each class of shares based on their relative net assets.
Distributions to Shareholders — Distributions from net investment income and net realized gains, if any, are generally declared and paid annually.
Indemnifications — Under the corporation’s organizational documents, its officers and directors are indemnified against certain liabilities arising out of the performance of their duties to the fund. In addition, in the normal course of business, the fund enters into contracts that provide general indemnifications. The maximum exposure under these arrangements is unknown as this would involve future claims that may be made against a fund. The risk of material loss from such claims is considered by management to be remote.
3. Fees and Transactions with Related Parties
Certain officers and directors of the corporation are also officers and/or directors of American Century Companies, Inc. (ACC). The corporation’s investment advisor, ACIM, the corporation's distributor, American Century Investment Services, Inc. (ACIS), and the corporation’s transfer agent, American Century Services, LLC, are wholly owned, directly or indirectly, by ACC.
Management Fees — The corporation has entered into a management agreement with ACIM, under which ACIM provides the fund with investment advisory and management services in exchange for a single, unified management fee (the fee) per class. The agreement provides that all expenses of managing and operating the fund, except distribution and service fees, brokerage expenses, taxes, interest, fees and expenses of the independent directors (including legal counsel fees), and extraordinary expenses, will be paid by ACIM. The fee is computed and accrued daily based on each class’s daily net assets and paid monthly in arrears. The annual management fee is 1.20% for the Investor Class, A Class, C Class and R Class, 1.00% for the Institutional Class and 0.85% for the R6 Class. From November 1, 2015 thru July 31, 2016, the investment advisor agreed to waive 0.04% of the fund’s management fee. Effective August 1, 2016, the investment advisor agreed to increase the amount of the waiver from 0.04% to 0.08% of the fund's management fee. The investment advisor expects this waiver to continue until July 31, 2017 and cannot terminate it prior to such date without the approval of the Board of Directors. The total amount of the waiver for each class for the year ended October 31, 2016 was $35,576, $1,814, $9,719, $3,689, $76 and $4,049 for the Investor Class, Institutional Class, A Class, C Class, R Class and the R6 Class, respectively. The effective annual management fee after waiver for each class for the year ended October 31, 2016 was 1.15% for the Investor Class, A Class, C Class and R Class, 0.95% for the Institutional Class and 0.80% for the R6 Class.
Distribution and Service Fees — The Board of Directors has adopted a separate Master Distribution and Individual Shareholder Services Plan for each of the A Class, C Class and R Class (collectively the plans), pursuant to Rule 12b-1 of the 1940 Act. The plans provide that the A Class will pay ACIS an annual distribution and service fee of 0.25%. The plans provide that the C Class will pay ACIS an annual distribution and service fee of 1.00%, of which 0.25% is paid for individual shareholder services and 0.75% is paid for distribution services. The plans provide that the R Class will pay ACIS an annual distribution and service fee of 0.50%. The fees are computed and accrued daily based on each class’s daily net assets and paid monthly in arrears. The fees are used to pay financial intermediaries for distribution and individual shareholder services. Fees incurred under the plans during the year ended October 31, 2016 are detailed in the Statement of Operations.
Directors' Fees and Expenses — The Board of Directors is responsible for overseeing the investment advisor’s management and operations of the fund. The directors receive detailed information about the fund and its investment advisor regularly throughout the year, and meet at least quarterly with management of the investment advisor to review reports about fund operations. The fund’s officers do not receive compensation from the fund.
Interfund Transactions — The fund may enter into security transactions with other American Century Investments funds and other client accounts of the investment advisor, in accordance with the 1940 Act rules and procedures adopted by the Board of Directors. The rules and procedures require, among other things, that these transactions be effected at the independent current market price of the security. During the period, the interfund purchases and sales were $97,925 and $1,015,328, respectively. The effect of interfund transactions on the Statement of Operations was $(40,469) in net realized gain (loss) on investment transactions.
4. Investment Transactions
Purchases and sales of investment securities, excluding short-term investments, for the year ended October 31, 2016 were $271,712,831 and $281,398,742, respectively.
5. Capital Share Transactions
Transactions in shares of the fund were as follows:
|
| | | | | | | | | | |
| | Year ended
October 31, 2016 | Year ended
October 31, 2015 |
| | Shares | Amount | Shares | Amount |
| Investor Class/Shares Authorized | 50,000,000 |
| | 70,000,000 |
| |
| Sold | 2,296,594 |
| $ | 26,402,642 |
| 4,069,897 |
| $ | 48,422,421 |
|
| Issued in reinvestment of distributions | 160,768 |
| 1,789,344 |
| 250,279 |
| 2,853,181 |
|
| Redeemed | (2,801,145 | ) | (31,882,630 | ) | (3,808,028 | ) | (44,360,141 | ) |
| | (343,783 | ) | (3,690,644 | ) | 512,148 |
| 6,915,461 |
|
| Institutional Class/Shares Authorized | 20,000,000 |
| | 20,000,000 |
| |
| Sold | 110,455 |
| 1,284,019 |
| 161,180 |
| 1,923,486 |
|
| Issued in reinvestment of distributions | 11,297 |
| 125,737 |
| 29,062 |
| 331,011 |
|
| Redeemed | (247,167 | ) | (2,855,718 | ) | (552,807 | ) | (6,566,497 | ) |
| | (125,415 | ) | (1,445,962 | ) | (362,565 | ) | (4,312,000 | ) |
| A Class/Shares Authorized | 15,000,000 |
| | 15,000,000 |
| |
| Sold | 326,874 |
| 3,746,570 |
| 827,296 |
| 9,807,640 |
|
| Issued in reinvestment of distributions | 48,559 |
| 540,949 |
| 69,776 |
| 796,148 |
|
| Redeemed | (753,271 | ) | (8,692,908 | ) | (444,969 | ) | (5,229,769 | ) |
| | (377,838 | ) | (4,405,389 | ) | 452,103 |
| 5,374,019 |
|
| C Class/Shares Authorized | 10,000,000 |
| | 10,000,000 |
| |
| Sold | 76,087 |
| 889,900 |
| 219,128 |
| 2,603,059 |
|
| Issued in reinvestment of distributions | 9,381 |
| 104,697 |
| 13,647 |
| 155,849 |
|
| Redeemed | (69,033 | ) | (788,880 | ) | (63,466 | ) | (728,593 | ) |
| | 16,435 |
| 205,717 |
| 169,309 |
| 2,030,315 |
|
| R Class/Shares Authorized | 10,000,000 |
| | 10,000,000 |
| |
| Sold | 4,495 |
| 51,350 |
| 20,657 |
| 244,712 |
|
| Issued in reinvestment of distributions | 534 |
| 5,959 |
| 2,188 |
| 24,985 |
|
| Redeemed | (16,923 | ) | (189,151 | ) | (33,524 | ) | (411,077 | ) |
| | (11,894 | ) | (131,842 | ) | (10,679 | ) | (141,380 | ) |
| R6 Class/Shares Authorized | 20,000,000 |
| | 20,000,000 |
| |
| Sold | 400,300 |
| 4,693,987 |
| 648,641 |
| 7,852,607 |
|
| Issued in reinvestment of distributions | 27,913 |
| 310,389 |
| 145 |
| 1,654 |
|
| Redeemed | (350,240 | ) | (4,037,584 | ) | (37,219 | ) | (429,462 | ) |
| | 77,973 |
| 966,792 |
| 611,567 |
| 7,424,799 |
|
| Net increase (decrease) | (764,522 | ) | $ | (8,501,328 | ) | 1,371,883 |
| $ | 17,291,214 |
|
6. Fair Value Measurements
The fund’s investments valuation process is based on several considerations and may use multiple inputs to determine the fair value of the investments held by the fund. In conformity with accounting principles generally accepted in the United States of America, the inputs used to determine a valuation are classified into three broad levels.
| |
| • | Level 1 valuation inputs consist of unadjusted quoted prices in an active market for identical investments. |
| |
| • | Level 2 valuation inputs consist of direct or indirect observable market data (including quoted prices for comparable investments, evaluations of subsequent market events, interest rates, prepayment speeds, credit risk, etc.). These inputs also consist of quoted prices for identical investments initially expressed in local currencies that are adjusted through translation into U.S. dollars. |
| |
| • | Level 3 valuation inputs consist of unobservable data (including a fund’s own assumptions). |
The level classification is based on the lowest level input that is significant to the fair valuation measurement. The valuation inputs are not necessarily an indication of the risks associated with investing in these securities or other financial instruments. There were no significant transfers between levels during the period.
The following is a summary of the level classifications as of period end. The Schedule of Investments provides additional information on the fund’s portfolio holdings.
|
| | | | | | | | |
| | Level 1 | Level 2 | Level 3 |
| Assets | | | |
| Investment Securities | | | |
| Common Stocks | | | |
| United States | $ | 52,454,753 |
| — |
| — |
|
| Other Countries | — |
| $ | 48,773,353 |
| — |
|
| Temporary Cash Investments | 6,332 |
| 1,588,000 |
| — |
|
| | $ | 52,461,085 |
| $ | 50,361,353 |
| — |
|
7. Risk Factors
The fund concentrates its investments in a narrow segment of the total market. Because of this, the fund is subject to certain additional risks as compared to investing in a more diversified portfolio of investments. The fund may be subject to certain risks similar to those associated with direct investment in real estate including but not limited to: local or regional economic conditions, changes in zoning laws, changes in property values, property tax increases, overbuilding, increased competition, environmental contamination, natural disasters, and interest rate risk.
There are certain risks involved in investing in foreign securities. These risks include those resulting from future adverse political, social and economic developments, fluctuations in currency exchange rates, the possible imposition of exchange controls, and other foreign laws or restrictions. Investing in emerging markets may accentuate these risks.
The fund’s investment process may result in high portfolio turnover, which could mean high transaction costs, affecting both performance and capital gains tax liabilities to investors.
8. Federal Tax Information
The tax character of distributions paid during the years ended October 31, 2016 and October 31, 2015 were as follows:
|
| | | | | | |
| | 2016 | 2015 |
| Distributions Paid From | | |
| Ordinary income | $ | 3,223,838 |
| $ | 4,057,876 |
|
| Long-term capital gains | — |
| $ | 579,728 |
|
The book-basis character of distributions made during the year from net investment income or net realized gains may differ from their ultimate characterization for federal income tax purposes. These differences reflect the differing character of certain income items and net realized gains and losses for financial statement and tax purposes, and may result in reclassification among certain capital accounts on the financial statements.
The reclassifications, which are primarily due to gains on investments in passive foreign investment companies, were made to capital $(1), undistributed net investment income $3,113,361, and accumulated net realized loss $(3,113,360).
As of October 31, 2016, the federal tax cost of investments and the components of distributable earnings on a tax-basis were as follows:
|
| | | |
| Federal tax cost of investments | $ | 100,709,369 |
|
| Gross tax appreciation of investments | $ | 4,420,747 |
|
| Gross tax depreciation of investments | (2,307,678 | ) |
| Net tax appreciation (depreciation) of investments | 2,113,069 |
|
Net tax appreciation (depreciation) on translation of assets and liabilities in foreign currencies | (4,294 | ) |
| Net tax appreciation (depreciation) | $ | 2,108,775 |
|
| Undistributed ordinary income | $ | 3,798,117 |
|
| Accumulated short-term capital losses | $ | (2,139,940 | ) |
The difference between book-basis and tax-basis unrealized appreciation (depreciation) is attributable primarily to the realization to ordinary income for tax purposes of unrealized gains on investments in passive foreign investment companies.
Accumulated capital losses represent net capital loss carryovers that may be used to offset future realized capital gains for federal income tax purposes. The capital loss carryovers may be carried forward for an unlimited period. Future capital loss carryover utilization in any given year may be subject to Internal Revenue Code limitations.
|
| | | | | | | | | | | | | | | | | |
| For a Share Outstanding Throughout the Years Ended October 31 (except as noted) |
| Per-Share Data | Ratios and Supplemental Data |
| | | Income From Investment Operations: | Distributions From: | | | Ratio to Average Net Assets of: | | |
| | Net Asset Value, Beginning of Period | Net Investment Income (Loss)(1) | Net Realized and Unrealized Gain (Loss) | Total From Investment Operations | Net Investment Income | Net Realized Gains | Total Distributions | Net Asset Value, End of Period | Total Return(2) | Operating Expenses | Operating Expenses (before expense waiver) | Net Investment Income (Loss) | Net Investment Income (Loss) (before expense waiver) | Portfolio Turnover Rate | Net Assets, End of Period (in thousands) |
| Investor Class | | | | | | | | | | | | | |
| 2016 | $11.62 | 0.15 | 0.01 | 0.16 | (0.33) | — | (0.33) | $11.45 | 1.50% | 1.16% | 1.21% | 1.31% | 1.26% | 250% |
| $67,798 |
|
| 2015 | $12.03 | 0.17 | 0.02 | 0.19 | (0.45) | (0.15) | (0.60) | $11.62 | 1.70% | 1.20% | 1.21% | 1.39% | 1.38% | 248% |
| $72,769 |
|
| 2014 | $11.54 | 0.13 | 0.88 | 1.01 | (0.37) | (0.15) | (0.52) | $12.03 | 9.29% | 1.20% | 1.20% | 1.15% | 1.15% | 275% |
| $69,207 |
|
| 2013 | $10.90 | 0.13 | 1.12 | 1.25 | (0.36) | (0.25) | (0.61) | $11.54 | 11.99% | 1.20% | 1.20% | 1.15% | 1.15% | 392% |
| $43,927 |
|
2012(3) | $9.75 | 0.07 | 1.08 | 1.15 | — | — | — | $10.90 | 11.68% | 1.20%(4) | 1.20%(4) | 1.15%(4) | 1.15%(4) | 264% |
| $23,143 |
|
2012(5) | $10.00 | 0.14 | (0.32)(6) | (0.18) | (0.07) | — | (0.07) | $9.75 | (1.57)% | 1.21%(4) | 1.21%(4) | 1.63%(4) | 1.63%(4) | 462% |
| $7,322 |
|
| Institutional Class | | | | | | | | | | | | | |
| 2016 | $11.63 | 0.18 | 0.02 | 0.20 | (0.36) | — | (0.36) | $11.47 | 1.79% | 0.96% | 1.01% | 1.51% | 1.46% | 250% |
| $2,826 |
|
| 2015 | $12.05 | 0.19 | 0.02 | 0.21 | (0.48) | (0.15) | (0.63) | $11.63 | 1.83% | 1.00% | 1.01% | 1.59% | 1.58% | 248% |
| $4,325 |
|
| 2014 | $11.56 | 0.15 | 0.88 | 1.03 | (0.39) | (0.15) | (0.54) | $12.05 | 9.50% | 1.00% | 1.00% | 1.35% | 1.35% | 275% |
| $8,848 |
|
| 2013 | $10.91 | 0.15 | 1.13 | 1.28 | (0.38) | (0.25) | (0.63) | $11.56 | 12.30% | 1.00% | 1.00% | 1.35% | 1.35% | 392% |
| $7,916 |
|
2012(3) | $9.75 | 0.08 | 1.08 | 1.16 | — | — | — | $10.91 | 11.90% | 1.00%(4) | 1.00%(4) | 1.35%(4) | 1.35%(4) | 264% |
| $2,711 |
|
2012(5) | $10.00 | 0.17 | (0.33)(6) | (0.16) | (0.09) | — | (0.09) | $9.75 | (1.47)% | 1.01%(4) | 1.01%(4) | 1.83%(4) | 1.83%(4) | 462% |
| $1,210 |
|
|
| | | | | | | | | | | | | | | | | |
| For a Share Outstanding Throughout the Years Ended October 31 (except as noted) |
| Per-Share Data | Ratios and Supplemental Data |
| | | Income From Investment Operations: | Distributions From: | | | Ratio to Average Net Assets of: | | |
| | Net Asset Value, Beginning of Period | Net Investment Income (Loss)(1) | Net Realized and Unrealized Gain (Loss) | Total From Investment Operations | Net Investment Income | Net Realized Gains | Total Distributions | Net Asset Value, End of Period | Total Return(2) | Operating Expenses | Operating Expenses (before expense waiver) | Net Investment Income (Loss) | Net Investment Income (Loss) (before expense waiver) | Portfolio Turnover Rate | Net Assets, End of Period (in thousands) |
| A Class | | | | | | | | | | | | | | |
| 2016 | $11.60 | 0.12 | 0.03 | 0.15 | (0.31) | — | (0.31) | $11.44 | 1.33% | 1.41% | 1.46% | 1.06% | 1.01% | 250% |
| $16,651 |
|
| 2015 | $12.02 | 0.13 | 0.02 | 0.15 | (0.42) | (0.15) | (0.57) | $11.60 | 1.35% | 1.45% | 1.46% | 1.14% | 1.13% | 248% |
| $21,275 |
|
| 2014 | $11.53 | 0.11 | 0.87 | 0.98 | (0.34) | (0.15) | (0.49) | $12.02 | 9.02% | 1.45% | 1.45% | 0.90% | 0.90% | 275% |
| $16,601 |
|
| 2013 | $10.89 | 0.10 | 1.12 | 1.22 | (0.33) | (0.25) | (0.58) | $11.53 | 11.72% | 1.45% | 1.45% | 0.90% | 0.90% | 392% |
| $18,926 |
|
2012(3) | $9.76 | 0.06 | 1.07 | 1.13 | — | — | — | $10.89 | 11.58% | 1.45%(4) | 1.45%(4) | 0.90%(4) | 0.90%(4) | 264% |
| $2,460 |
|
2012(5) | $10.00 | 0.12 | (0.31)(6) | (0.19) | (0.05) | — | (0.05) | $9.76 | (1.82)% | 1.46%(4) | 1.46%(4) | 1.38%(4) | 1.38%(4) | 462% |
| $700 |
|
| C Class | | | | | | | | | | | | | | |
| 2016 | $11.55 | 0.03 | 0.02 | 0.05 | (0.22) | — | (0.22) | $11.38 | 0.47% | 2.16% | 2.21% | 0.31% | 0.26% | 250% |
| $7,282 |
|
| 2015 | $11.96 | 0.05 | 0.02 | 0.07 | (0.33) | (0.15) | (0.48) | $11.55 | 0.73% | 2.20% | 2.21% | 0.39% | 0.38% | 248% |
| $7,197 |
|
| 2014 | $11.47 | 0.02 | 0.88 | 0.90 | (0.26) | (0.15) | (0.41) | $11.96 | 8.12% | 2.20% | 2.20% | 0.15% | 0.15% | 275% |
| $5,428 |
|
| 2013 | $10.83 | —(7) | 1.14 | 1.14 | (0.25) | (0.25) | (0.50) | $11.47 | 10.94% | 2.20% | 2.20% | 0.15% | 0.15% | 392% |
| $2,614 |
|
2012(3) | $9.75 | 0.02 | 1.06 | 1.08 | — | — | — | $10.83 | 11.08% | 2.20%(4) | 2.20%(4) | 0.15%(4) | 0.15%(4) | 264% |
| $610 |
|
2012(5) | $10.00 | 0.05 | (0.30)(6) | (0.25) | — | — | — | $9.75 | (2.50)% | 2.21%(4) | 2.21%(4) | 0.63%(4) | 0.63%(4) | 462% |
| $394 |
|
|
| | | | | | | | | | | | | | | | | |
| For a Share Outstanding Throughout the Years Ended October 31 (except as noted) |
| Per-Share Data | Ratios and Supplemental Data |
| | | Income From Investment Operations: | Distributions From: | | | Ratio to Average Net Assets of: | | |
| | Net Asset Value, Beginning of Period | Net Investment Income (Loss)(1) | Net Realized and Unrealized Gain (Loss) | Total From Investment Operations | Net Investment Income | Net Realized Gains | Total Distributions | Net Asset Value, End of Period | Total Return(2) | Operating Expenses | Operating Expenses (before expense waiver) | Net Investment Income (Loss) | Net Investment Income (Loss) (before expense waiver) | Portfolio Turnover Rate | Net Assets, End of Period (in thousands) |
| R Class | | | | | | | | | | | | | | |
| 2016 | $11.59 | 0.10 | 0.02 | 0.12 | (0.28) | — | (0.28) | $11.43 | 1.07% | 1.66% | 1.71% | 0.81% | 0.76% | 250% |
| $106 |
|
| 2015 | $12.01 | 0.11 | 0.01 | 0.12 | (0.39) | (0.15) | (0.54) | $11.59 | 1.08% | 1.70% | 1.71% | 0.89% | 0.88% | 248% |
| $245 |
|
| 2014 | $11.52 | 0.08 | 0.87 | 0.95 | (0.31) | (0.15) | (0.46) | $12.01 | 8.74% | 1.70% | 1.70% | 0.65% | 0.65% | 275% |
| $382 |
|
| 2013 | $10.87 | 0.08 | 1.12 | 1.20 | (0.30) | (0.25) | (0.55) | $11.52 | 11.55% | 1.70% | 1.70% | 0.65% | 0.65% | 392% |
| $489 |
|
2012(3) | $9.76 | 0.05 | 1.06 | 1.11 | — | — | — | $10.87 | 11.37% | 1.70%(4) | 1.70%(4) | 0.65%(4) | 0.65%(4) | 264% |
| $439 |
|
2012(5) | $10.00 | 0.09 | (0.30)(6) | (0.21) | (0.03) | — | (0.03) | $9.76 | (2.07)% | 1.71%(4) | 1.71%(4) | 1.13%(4) | 1.13%(4) | 462% |
| $393 |
|
| R6 Class | | | | | | | | | | | | | | |
| 2016 | $11.64 | 0.19 | 0.01 | 0.20 | (0.37) | — | (0.37) | $11.47 | 1.86% | 0.81% | 0.86% | 1.66% | 1.61% | 250% |
| $7,938 |
|
| 2015 | $12.06 | 0.18 | 0.04 | 0.22 | (0.49) | (0.15) | (0.64) | $11.64 | 1.99% | 0.85% | 0.86% | 1.74% | 1.73% | 248% |
| $7,145 |
|
| 2014 | $11.57 | 0.17 | 0.88 | 1.05 | (0.41) | (0.15) | (0.56) | $12.06 | 9.67% | 0.85% | 0.85% | 1.50% | 1.50% | 275% |
| $28 |
|
2013(8) | $11.18 | 0.03 | 0.36 | 0.39 | — | — | — | $11.57 | 3.49% | 0.85%(4) | 0.85%(4) | 1.07%(4) | 1.07%(4) | 392%(9) |
| $26 |
|
|
|
| Notes to Financial Highlights |
| |
| (1) | Computed using average shares outstanding throughout the period. |
| |
| (2) | Total returns are calculated based on the net asset value of the last business day and do not reflect applicable sales charges, if any. Total returns for periods less than one year are not annualized. |
| |
| (3) | April 1, 2012 through October 31, 2012. The fund's fiscal year end was changed from March 31 to October 31, resulting in a seven-month annual reporting period. |
| |
| (5) | April 29, 2011 (fund inception) through March 31, 2012. |
| |
| (6) | Per-share amount was not in accord with the net realized and unrealized gain (loss) for the period because of the timing of transactions in shares of the fund and the amount and timing of per-share net realized and unrealized gain (loss) on such shares. |
| |
| (7) | Per-share amount was less than $0.005. |
| |
| (8) | July 26, 2013 (commencement of sale) through October 31, 2013. |
| |
| (9) | Portfolio turnover is calculated at the fund level. Percentage indicated was calculated for the year ended October 31, 2013. |
See Notes to Financial Statements.
|
|
| Report of Independent Registered Public Accounting Firm |
To the Board of Directors and Shareholders of American Century Capital Portfolios, Inc.:
We have audited the accompanying statement of assets and liabilities, including the schedule of investments, of Global Real Estate Fund (the “Fund”), one of the funds constituting American Century Capital Portfolios, Inc., as of October 31, 2016, and the related statement of operations for the year then ended, the statements of changes in net assets for each of the two years in the period then ended, and the financial highlights for each of the periods presented. These financial statements and financial highlights are the responsibility of the Fund’s management. Our responsibility is to express an opinion on these financial statements and financial highlights based on our audits.
We conducted our audits in accordance with the standards of the Public Company Accounting Oversight Board (United States). Those standards require that we plan and perform the audit to obtain reasonable assurance about whether the financial statements and financial highlights are free of material misstatement. The Fund is not required to have, nor were we engaged to perform, an audit of its internal control over financial reporting. Our audits included consideration of internal control over financial reporting as a basis for designing audit procedures that are appropriate in the circumstances, but not for the purpose of expressing an opinion on the effectiveness of the Fund’s internal control over financial reporting. Accordingly, we express no such opinion. An audit also includes examining, on a test basis, evidence supporting the amounts and disclosures in the financial statements, assessing the accounting principles used and significant estimates made by management, as well as evaluating the overall financial statement presentation. Our procedures included confirmation of securities owned as of October 31, 2016, by correspondence with the custodian and brokers; when replies were not received from brokers, we performed other auditing procedures. We believe that our audits provide a reasonable basis for our opinion.
In our opinion, the financial statements and financial highlights referred to above present fairly, in all material respects, the financial position of Global Real Estate Fund of American Century Capital Portfolios, Inc. as of October 31, 2016, the results of its operations for the year then ended, the changes in its net assets for each of the two years in the period then ended, and the financial highlights for each of the periods presented, in conformity with accounting principles generally accepted in the United States of America.
DELOITTE & TOUCHE LLP
Kansas City, Missouri
December 19, 2016
The Board of Directors
The individuals listed below serve as directors of the funds. Each director will continue to serve in this capacity until death, retirement, resignation or removal from office. The board has adopted a mandatory retirement age for directors who are not “interested persons,” as that term is defined in the Investment Company Act (independent directors). Independent directors shall retire by December 31 of the year in which they reach their 75th birthday.
Mr. Thomas is an “interested person” because he currently serves as President and Chief Executive Officer of American Century Companies, Inc. (ACC), the parent company of American Century Investment Management, Inc. (ACIM or the advisor). The other directors (more than three-fourths of the total number) are independent. They are not employees, directors or officers of, and have no financial interest in, ACC or any of its wholly owned, direct or indirect, subsidiaries, including ACIM, American Century Investment Services, Inc. (ACIS) and American Century Services, LLC (ACS), and they do not have any other affiliations, positions or relationships that would cause them to be considered “interested persons” under the Investment Company Act. The directors serve in this capacity for seven (in the case of Mr. Thomas, 15) registered investment companies in the American Century Investments family of funds.
The following table presents additional information about the directors. The mailing address for each director is 4500 Main Street, Kansas City, Missouri 64111.
|
| | | | | |
Name
(Year of Birth) | Position(s) Held with Funds | Length of Time Served | Principal Occupation(s) During Past 5 Years | Number of American Century Portfolios Overseen by Director | Other Directorships Held During Past 5 Years |
| Independent Directors |
|
|
Barry Fink
(1955) | Director | Since 2012 | Retired; Executive Vice President, ACC (September 2007 to February 2013); President, ACS (October 2007 to February 2013); Chief Operating Officer, ACC (September 2007 to November 2012) | 81 | None |
Andrea C. Hall
(1945) | Director | Since 1997 | Retired | 81 | None |
Jan M. Lewis
(1957) | Director | Since 2011 | Retired; President and Chief Executive Officer, Catholic Charities of Northeast Kansas (human services organization) (2006 to 2013) | 81 | None |
James A. Olson
(1942) | Director and Chairman of the Board | Since 2007 (Chairman since 2014) | Member, Plaza Belmont LLC (private equity fund manager) (1999 to present) | 81 | Saia, Inc. (2002 to 2012) and EPR Properties (2003 to 2013) |
M. Jeannine Strandjord
(1945) | Director | Since 1994 | Retired | 81 | Euronet Worldwide Inc.; MGP Ingredients, Inc.; and DST Systems Inc. (1996 to 2012) |
|
| | | | | |
Name
(Year of Birth) | Position(s) Held with Funds | Length of Time Served | Principal Occupation(s) During Past 5 Years | Number of American Century Portfolios Overseen by Director | Other Directorships Held During Past 5 Years |
| Independent Directors |
|
|
John R. Whitten
(1946) | Director | Since 2008 | Retired | 81 | Rudolph Technologies, Inc. |
Stephen E. Yates
(1948) | Director | Since 2012 | Retired | 81 | None |
| Interested Director |
|
|
Jonathan S. Thomas
(1963) | Director and President | Since 2007 | President and Chief Executive Officer, ACC (March 2007 to present). Also serves as Chief Executive Officer, ACS; Executive Vice President, ACIM; Director, ACC, ACIM and other ACC subsidiaries | 125 | BioMed Valley Discoveries, Inc. |
The Statement of Additional Information has additional information about the fund's directors and is available without charge, upon request, by calling 1-800-345-2021.
Officers
The following table presents certain information about the executive officers of the funds. Each officer serves as an officer for each of the 15 investment companies in the American Century family of funds, unless otherwise noted. No officer is compensated for his or her service as an officer of the funds. The listed officers are interested persons of the funds and are appointed or re-appointed on an annual basis. The mailing address for each officer listed below is 4500 Main Street, Kansas City, Missouri 64111.
|
| | |
Name
(Year of Birth) | Offices with the Funds | Principal Occupation(s) During the Past Five Years |
Jonathan S. Thomas
(1963) | Director and President since 2007 | President and Chief Executive Officer, ACC (March 2007 to present). Also serves as Chief Executive Officer, ACS; Executive Vice President, ACIM; Director, ACC, ACIM and other ACC subsidiaries |
Amy D. Shelton
(1964) | Chief Compliance Officer and Vice President since 2014 | Chief Compliance Officer, American Century funds, (March 2014 to present); Chief Compliance Officer, ACIM (February 2014 to present); Chief Compliance Officer, ACIS (October 2009 to present); Vice President, Client Interactions and Marketing, ACIS (February 2013 to January 2014); Director, Client Interactions and Marketing, ACIS (June 2007 to January 2013). Also serves as Vice President, ACIS |
Charles A. Etherington
(1957) | General Counsel since 2007 and Senior Vice President since 2006 | Attorney, ACC (February 1994 to present); Vice President, ACC (November 2005 to present); General Counsel, ACC (March 2007 to present). Also serves as General Counsel, ACIM, ACS, ACIS and other ACC subsidiaries; and Senior Vice President, ACIM and ACS |
C. Jean Wade
(1964) | Vice President,Treasurer and Chief Financial Officer since 2012 | Vice President, ACS (February 2000 to present) |
Robert J. Leach
(1966) | Vice President since 2006 and Assistant Treasurer since 2012 | Vice President, ACS (February 2000 to present) |
David H. Reinmiller
(1963) | Vice President since 2000 | Attorney, ACC (January 1994 to present); Associate General Counsel, ACC (January 2001 to present). Also serves as Vice President, ACIM and ACS |
Ward D. Stauffer
(1960) | Secretary since 2005 | Attorney, ACC (June 2003 to present) |
|
|
| Approval of Management Agreement |
At a meeting held on June 29, 2016, the Fund’s Board of Directors (the "Board") unanimously approved the renewal of the management agreement pursuant to which American Century Investment Management, Inc. (the “Advisor”) acts as the investment advisor for the Fund. Under Section 15(c) of the Investment Company Act, contracts for investment advisory services are required to be reviewed, evaluated, and approved by a majority of a fund’s directors (the “Directors”), including a majority of the independent Directors, each year.
Prior to its consideration of the renewal of the management agreement, the Directors requested and reviewed extensive data and information compiled by the Advisor and certain independent providers of evaluation data concerning the Fund and the services provided to the Fund by the Advisor. This review was in addition to the oversight and evaluation undertaken by the Board and its committees on a continual basis and the information received was supplemental to the extensive information that the Board and its committees receive and consider throughout the year.
In connection with its consideration of the renewal of the management agreement, the Board’s review and evaluation of the services provided by the Advisor included, but was not limited to, the following:
| |
| • | the nature, extent, and quality of investment management, shareholder services, and other services provided and to be provided to the Fund; |
| |
| • | the wide range of other programs and services provided and to be provided to the Fund and its shareholders on a routine and non-routine basis; |
| |
| • | the investment performance of the Fund, including data comparing the Fund's performance to appropriate benchmarks and/or a peer group of other mutual funds with similar investment objectives and strategies; |
| |
| • | the cost of owning the Fund compared to the cost of owning similar funds; |
| |
| • | the compliance policies, procedures, and regulatory experience of the Advisor and the Fund's service providers; |
| |
| • | financial data showing the cost of services provided to the Fund, the profitability of the Fund to the Advisor, and the overall profitability of the Advisor; |
| |
| • | possible economies of scale associated with the Advisor’s management of the Fund and other accounts under its management; |
| |
| • | data comparing services provided and charges to the Advisor's other investment management clients; |
| |
| • | acquired fund fees and expenses; |
| |
| • | payments by the Fund and the Advisor to financial intermediaries and the nature of services provided; and |
| |
| • | any collateral benefits derived by the Advisor from the management of the Fund. |
In keeping with their practice, the Directors held two in-person meetings and one telephonic meeting to review and discuss the information provided. The independent Directors also had the benefit of the advice of their independent counsel throughout the process.
Factors Considered
The Directors considered all of the information provided by the Advisor, the independent data providers, and independent counsel in connection with the approval. They determined that the information was sufficient for them to evaluate the management agreement for the Fund. In connection with their review, the Directors did not identify any single factor as being all-important or controlling, and each Director may have attributed different levels of importance to different factors. In deciding to renew the management agreement, the Board based its decision on a number of factors, including the following:
Nature, Extent and Quality of Services - Generally. Under the management agreement, the Advisor is responsible for providing or arranging for all services necessary for the operation of the Fund. The Board noted that under the management agreement, the Advisor provides or arranges at its own expense a wide variety of services including:
| |
| • | constructing and designing the Fund |
| |
| • | portfolio research and security selection |
| |
| • | initial capitalization/funding |
| |
| • | daily valuation of the Fund’s portfolio |
| |
| • | shareholder servicing and transfer agency, including shareholder confirmations, recordkeeping, and communications |
| |
| • | legal services (except the independent Directors’ counsel) |
| |
| • | regulatory and portfolio compliance |
| |
| • | marketing and distribution (except amounts paid by the Fund under Rule 12b-1 plans) |
The Board noted that many of these services have expanded over time in terms of both quantity and complexity in response to shareholder demands, competition in the industry, changing distribution channels, and the changing regulatory environment. The Board noted specifically the resources the Advisor has committed to enhancing cybersecurity protections for the benefit of shareholders.
Investment Management Services. The nature of the investment management services provided to the Fund is quite complex and allows Fund shareholders access to professional money management, instant diversification of their investments within an asset class, the opportunity to easily diversify among asset classes by investing in or exchanging among various American Century Investments funds, and liquidity. In evaluating investment performance, the Board expects the Advisor to manage the Fund in accordance with its investment objectives and approved strategies. Further, the Directors recognize that the Advisor has an obligation to monitor trading activities, and in particular to seek the best execution of fund trades, and to evaluate the use of and payment for research. In providing these services, the Advisor utilizes teams of investment professionals (portfolio managers, analysts, research assistants, and securities traders) who require extensive information technology, research, training, compliance, and other systems to conduct their business. The Board, directly and through its Fund Performance Review Committee, provides oversight of the investment performance process. It regularly reviews investment performance information for the Fund, together with comparative information for appropriate benchmarks and/or peer groups of similarly-managed funds, over different time horizons. The Directors also review detailed performance information provided by the Advisor during the management agreement approval process. If performance concerns are identified, the Fund receives special reviews until performance improves, during which the Board receives a report from the Advisor regarding the reasons for such results (e.g., market conditions, security selection) and any efforts being undertaken to improve performance. The Fund’s performance was above its benchmark for the one- and three-year periods reviewed by the Board. The Board found the investment management services provided by the Advisor to the Fund to be satisfactory and consistent with the management agreement.
Shareholder and Other Services. Under the management agreement, the Advisor provides the Fund with a comprehensive package of transfer agency, shareholder, and other services. The Board, directly and through various committees of the Board, regularly reviews reports and evaluations of such services at its regular meetings. These reports include, but are not limited to, information regarding the operational efficiency and accuracy of the shareholder and transfer agency services provided, staffing levels, shareholder satisfaction (as measured by external as well as internal sources), technology support, new products and services offered to Fund shareholders,
securities trading activities, portfolio valuation services, auditing services, and legal and operational compliance activities. The Board particularly noted the Advisor’s continual efforts to maintain effective business continuity plans and to address cybersecurity threats. Certain aspects of shareholder and transfer agency service level efficiency and the quality of securities trading activities are measured by independent third party providers and are presented in comparison to other fund groups not managed by the Advisor. The Board found the services provided by the Advisor to the Fund under the management agreement to be competitive and of high quality.
Costs of Services and Profitability. The Advisor provides detailed information concerning its cost of providing various services to the Fund, its profitability in managing the Fund (pre- and post-distribution), its overall profitability, and its financial condition. The Directors have reviewed with the Advisor the methodology used to prepare this financial information. This information is considered in evaluating the Advisor’s financial condition, its ability to continue to provide services under the management agreement, and the reasonableness of the current management fee. The Board concluded that the Advisor’s profits were reasonable in light of the services provided to the Fund.
Ethics. The Board generally considers the Advisor’s commitment to providing quality services to shareholders and to conducting its business ethically. They noted that the Advisor’s practices generally meet or exceed industry best practices.
Economies of Scale. The Board also reviewed information provided by the Advisor regarding the possible existence of economies of scale in connection with the management of the Fund. The Board concluded that economies of scale are difficult to measure and predict with precision, especially on a fund-by-fund basis. The Board concluded that the Advisor is appropriately sharing economies of scale through its competitive fee structure, offering competitive fees from fund inception, and through reinvestment in its business to provide shareholders additional content and services.
Comparison to Other Funds’ Fees. The management agreement provides that the Fund pays the Advisor a single, all-inclusive (or unified) management fee for providing all services necessary for the management and operation of the Fund, other than brokerage expenses, expenses attributable to short sales, taxes, interest, extraordinary expenses, and the fees and expenses of the Fund’s independent Directors (including their independent legal counsel) and expenses incurred in connection with the provision of shareholder services and distribution services under a plan adopted pursuant to Rule 12b-1 under the 1940 Act. Under the unified fee structure, the Advisor is responsible for providing all investment advisory, custody, audit, administrative, compliance, recordkeeping, marketing and shareholder services, or arranging and supervising third parties to provide such services. By contrast, most other funds are charged a variety of fees, including an investment advisory fee, a transfer agency fee, an administrative fee, distribution charges, and other expenses. Other than their investment advisory fees and any applicable Rule 12b-1 distribution fees, all other components of the total fees charged by these other funds may be increased without shareholder approval. The Board believes the unified fee structure is a benefit to Fund shareholders because it clearly discloses to shareholders the cost of owning Fund shares, and, since the unified fee cannot be increased without a vote of Fund shareholders, it shifts to the Advisor the risk of increased costs of operating the Fund and provides a direct incentive to minimize administrative inefficiencies. Part of the Board’s analysis of fee levels involves reviewing certain evaluative data compiled by an independent provider comparing the Fund’s unified fee to the total expense ratios of its peers. The unified fee charged to shareholders of the Fund was above the median of the total expense ratios of the Fund’s peer expense universe. The Board concluded that the management fee paid by the Fund to the Advisor under the management agreement is reasonable in light of the services provided to the Fund.
Comparison to Fees and Services Provided to Other Clients of the Advisor. The Directors also requested and received information from the Advisor concerning the nature of the services, fees, costs, and profitability of its advisory services to advisory clients other than the Fund. They observed that these varying types of client accounts require different services and involve different
regulatory and entrepreneurial risks than the management of the Fund. The Board analyzed this information and concluded that the fees charged and services provided to the Fund were reasonable by comparison.
Payments to Intermediaries. The Directors also requested and received a description of payments made to intermediaries by the Fund and the Advisor. These payments include various payments made by the Fund or the Advisor to different types of intermediaries and recordkeepers for distribution and service activities provided for the Fund. The Board received confirmation from the Advisor that all such payments by the Fund intended for distribution were made pursuant to the Fund's 12b-1 Plan. The Board reviewed such information and found the payments to be reasonable in scope and purpose.
Collateral or “Fall-Out” Benefits Derived by the Advisor. The Board considered the existence of collateral benefits the Advisor may receive as a result of its relationship with the Fund. They concluded that the Advisor’s primary business is managing mutual funds and it generally does not use fund or shareholder information to generate profits in other lines of business, and therefore does not derive any significant collateral benefits from them. The Board noted that additional assets from other clients may offer the Advisor some benefit from increased leverage with service providers and counterparties. Additionally, the Advisor receives proprietary research from broker-dealers that execute fund portfolio transactions, which the Board concluded is likely to benefit other clients of the Advisor, as well as Fund shareholders. The Board also determined that the Advisor is able to provide investment management services to certain clients other than the Fund, at least in part, due to its existing infrastructure built to serve the fund complex. The Board concluded that appropriate allocation methodologies had been employed to assign resources and the cost of those resources to these other clients and, where expressly provided, these other client assets may be included with the assets of the Fund to determine breakpoints in the management fee schedule.
Existing Relationship. The Board also considered whether there was any reason for not continuing the existing arrangement with the Advisor. In this regard, the Board was mindful of the potential disruptions of the Fund’s operations and various risks, uncertainties, and other effects that could occur as a result of a decision not to continue such relationship. In particular, the Board recognized that most shareholders have invested in the Fund on the strength of the Advisor’s industry standing and reputation and in the expectation that the Advisor will have a continuing role in providing advisory services to the Fund.
Conclusion of the Directors. As a result of this process, the Board, including all of the independent Directors, taking into account all of the factors discussed above and the information provided by the Advisor and others in connection with its review and throughout the year, determined that the management fee is fair and reasonable in light of the services provided and that the investment management agreement between the Fund and the Advisor should be renewed.
Retirement Account Information
As required by law, distributions you receive from certain IRAs are subject to federal income tax withholding, unless you elect not to have withholding apply. Tax will be withheld on the total amount withdrawn even though you may be receiving amounts that are not subject to withholding, such as nondeductible contributions. In such case, excess amounts of withholding could occur. You may adjust your withholding election so that a greater or lesser amount will be withheld.
If you don’t want us to withhold on this amount, you must notify us to not withhold the federal income tax. You may notify us in writing or in certain situations by telephone or through other electronic means. For systematic withdrawals, your withholding election will remain in effect until revoked or changed by filing a new election. You have the right to revoke your election at any time.
Remember, even if you elect not to have income tax withheld, you are liable for paying income tax on the taxable portion of your withdrawal. If you elect not to have income tax withheld or you don’t have enough income tax withheld, you may be responsible for payment of estimated tax. You may incur penalties under the estimated tax rules if your withholding and estimated tax payments are not sufficient. You can reduce or defer the income tax on a distribution by directly or indirectly rolling such distribution over to another IRA or eligible plan. You should consult your tax advisor for additional information.
State tax will be withheld if, at the time of your distribution, your address is within one of the mandatory withholding states and you have federal income tax withheld (or as otherwise required by state law). State taxes will be withheld from your distribution in accordance with the respective state rules.
Distributions you receive from 403(b), 457 and qualified plans are subject to special tax and withholding rules. Your plan administrator or plan sponsor is required to provide you with a special tax notice explaining those rules at the time you request a distribution. If applicable, federal and/or state taxes may be withheld from your distribution amount.
Proxy Voting Policies
A description of the policies that the fund's investment advisor uses in exercising the voting rights associated with the securities purchased and/or held by the fund is available without charge, upon request, by calling 1-800-345-2021. It is also available on the "About Us" page of American Century Investments’ website at americancentury.com and on the Securities and Exchange Commission’s website at sec.gov. Information regarding how the investment advisor voted proxies relating to portfolio securities during the most recent 12-month period ended June 30 is available on the "About Us" page at americancentury.com. It is also available at sec.gov.
Quarterly Portfolio Disclosure
The fund files its complete schedule of portfolio holdings with the Securities and Exchange Commission (SEC) for the first and third quarters of each fiscal year on Form N-Q. The fund’s Forms N-Q are available on the SEC’s website at sec.gov, and may be reviewed and copied at the SEC’s Public Reference Room in Washington, DC. Information on the operation of the Public Reference Room may be obtained by calling 1-800-SEC-0330. The fund also makes its complete schedule of portfolio holdings for the most recent quarter of its fiscal year available on its website at americancentury.com and, upon request, by calling 1-800-345-2021.
Other Tax Information
The following information is provided pursuant to provisions of the Internal Revenue Code.
The fund hereby designates up to the maximum amount allowable as qualified dividend income for the fiscal year ended October 31, 2016.
For corporate taxpayers, the fund hereby designates $10,494, or up to the maximum amount allowable, of ordinary income distributions paid during the fiscal year ended October 31, 2016 as qualified for the corporate dividends received deduction.
|
| | |
| |
| | | |
| Contact Us | americancentury.com | |
| Automated Information Line | 1-800-345-8765 | |
| Investor Services Representative | 1-800-345-2021 or 816-531-5575 | |
| Investors Using Advisors | 1-800-378-9878 | |
| Business, Not-For-Profit, Employer-Sponsored Retirement Plans | 1-800-345-3533 | |
| Banks and Trust Companies, Broker-Dealers, Financial Professionals, Insurance Companies | 1-800-345-6488 | |
| Telecommunications Relay Service for the Deaf | 711 | |
| | | |
| American Century Capital Portfolios, Inc. | |
| | | |
Investment Advisor: American Century Investment Management, Inc. Kansas City, Missouri | |
| | | |
| This report and the statements it contains are submitted for the general information of our shareholders. The report is not authorized for distribution to prospective investors unless preceded or accompanied by an effective prospectus. | |
| | | |
©2016 American Century Proprietary Holdings, Inc. All rights reserved.
CL-ANN-90980 1612 | |
|
| |
| | |
| | Annual Report |
| | |
| | October 31, 2016 |
| | |
| | NT Global Real Estate Fund |
|
| | |
| Performance | 2 |
|
| Portfolio Commentary | 3 |
|
| Fund Characteristics | |
|
| Shareholder Fee Example | |
|
| Schedule of Investments | |
|
| Statement of Assets and Liabilities | |
|
| Statement of Operations | |
|
| Statement of Changes in Net Assets | |
|
| Notes to Financial Statements | |
|
| Financial Highlights | |
|
| Report of Independent Registered Public Accounting Firm | |
|
| Management | |
|
| Approval of Management Agreement | |
|
| Additional Information | |
|
Any opinions expressed in this report reflect those of the author as of the date of the report, and do not necessarily represent the opinions of American Century Investments® or any other person in the American Century Investments organization. Any such opinions are subject to change at any time based upon market or other conditions and American Century Investments disclaims any responsibility to update such opinions. These opinions may not be relied upon as investment advice and, because investment decisions made by American Century Investments funds are based on numerous factors, may not be relied upon as an indication of trading intent on behalf of any American Century Investments fund. Security examples are used for representational purposes only and are not intended as recommendations to purchase or sell securities. Performance information for comparative indices and securities is provided to American Century Investments by third party vendors. To the best of American Century Investments’ knowledge, such information is accurate at the time of printing.
|
| | | | |
| Total Returns as of October 31, 2016 |
| | | | Average Annual Returns | |
| | Ticker Symbol | 1 year | Since
Inception | Inception
Date |
| Investor Class | ANREX | 1.58% | -1.73% | 3/19/15 |
| FTSE EPRA/NAREIT Global Index | — | 3.07% | -0.03% | — |
| MSCI ACWI Index | — | 2.05% | -0.20% | — |
| Institutional Class | ANRHX | 1.74% | -1.57% | 3/19/15 |
| R6 Class | ANRDX | 1.86% | -1.43% | 3/19/15 |
Fund returns would have been lower if a portion of the fees had not been waived.
|
|
| Growth of $10,000 Over Life of Class |
| $10,000 investment made March 19, 2015 |
| Performance for other share classes will vary due to differences in fee structure. |
|
| |
| Value on October 31, 2016 |
| | Investor Class — $9,721 |
| |
| | FTSE EPRA/NAREIT Global Index — $9,994 |
| |
| | MSCI ACWI Index — $9,967 |
| |
Ending value of Investor Class would have been lower if a portion of the fees had not been waived.
|
| | |
| Total Annual Fund Operating Expenses |
| Investor Class | Institutional Class | R6 Class |
| 1.20% | 1.00% | 0.85% |
The total annual fund operating expenses shown is as stated in the fund’s prospectus current as of the date of this report. The prospectus may vary from the expense ratio shown elsewhere in this report because it is based on a different time period, includes acquired fund fees and expenses, and, if applicable, does not include fee waivers or expense reimbursements.
Data presented reflect past performance. Past performance is no guarantee of future results. Current performance may be higher or lower than the performance shown. Total returns for periods less than one year are not annualized. Investment return and principal value will fluctuate, and redemption value may be more or less than original cost. Data assumes reinvestment of dividends and capital gains, and none of the charts reflect the deduction of taxes that a shareholder would pay on fund distributions or the redemption of fund shares. To obtain performance data current to the most recent month end, please call 1-800-345-2021 or visit americancentury.com. For additional information about the fund, please consult the prospectus.
Portfolio Managers: Steven Brown and Steven Rodriguez
Performance Summary
NT Global Real Estate returned 1.74%* for the fiscal year ended October 31, 2016. By comparison, the FTSE EPRA/NAREIT Global Index (the fund’s benchmark) returned 3.07%, while the MSCI ACWI Index (a broad global stock market measure) returned 2.05%.
Global Real Estate Market Overview
Global real estate stocks advanced modestly for the 12-month period but trailed the performance of the broad global equity indices. For much of the period, global property stocks rose, benefiting from strong fundamentals as demand outpaced supply in many countries and regions. In addition, declining interest rates—especially in the wake of the affirmative vote for “Brexit,” the U.K. referendum to leave the European Union—reduced borrowing costs for commercial real estate companies and made their dividend yields more attractive. Over the last three months of the period, however, real estate stocks reversed course as rising global interest rates and an uncertain global economic environment put downward pressure on the sector.
During the reporting period, real estate stocks were reclassified and elevated within the Global Industry Classification Standard (GICS), one of the leading stock market classification systems. Previously, GICS classified stocks into ten different market sectors; real estate stocks had been included within the financials sector. However, effective August 31, 2016, real estate was broken out from the financials sector and became the eleventh sector in the GICS system. We believe this change affirms real estate as a distinct and relevant asset class and raises the overall visibility of the real estate sector.
Among developed markets, property stocks in the Asia/Pacific region generated the best returns, led by the strong performance of real estate stocks in Hong Kong and Australia. Property stocks in North America also fared well, benefiting from robust earnings growth and favorable fundamentals. European property stocks lagged amid weakness in the U.K. and the Netherlands. Real estate stocks in emerging markets posted solid gains, led by outsized returns in Brazil and Indonesia.
Europe and Emerging Markets Detracted
The fund’s underperformance of its benchmark resulted primarily from holdings in Europe and an underweight position in emerging markets. In Europe, the portfolio’s holdings in the U.K. declined amid uncertainty about the investment landscape in the wake of the Brexit vote. Notable detractors included London-based office landlords Derwent London and Great Portland Estates, which faced deteriorating fundamentals resulting from Brexit fears. We eliminated Derwent from the portfolio and significantly reduced the fund’s position in Great Portland.
Another holding adversely affected by Brexit was Japanese property developer Mitsui Fudosan. The company has several large development projects in the U.K., and Brexit concerns led to uncertainty about Mitsui Fudosan’s ability to fully lease the properties. In addition, concerns about deterioration in the condominium market in Japan weighed on the stock. We eliminated Mitsui Fudosan from the portfolio during the period.
* All fund returns referenced in this commentary are for Institutional Class shares. Fund returns would have been lower if a portion of the fees had not been waived. Performance for other share classes will vary due to differences in fee structure; when Institutional Class performance exceeds that of the fund’s benchmark, other share classes may not. See page 2 for returns for all share classes.
The most significant detractor among the portfolio’s U.S. holdings was self-storage operator Extra Space Storage. The company faced declining rental demand, which hindered its revenue and earnings growth and put downward pressure on the stock. As a result, we eliminated Extra Space Storage from the portfolio.
U.S. and Japan Added Value
Stock selection in the U.S. and Japan aided relative performance for the 12-month period. In the U.S., data center operators Equinix and Digital Realty Trust were among the fund’s top performance contributors. Both stocks benefited from strong demand for data center leasing space from cloud computing providers to meet their growing capacity needs. We reduced the fund’s exposure to these two stocks after their strong performance, but they remained meaningful positions in the portfolio.
Other notable contributors among the portfolio’s U.S. holdings included industrial property owners Prologis and Duke Realty. Both stocks continued to benefit from increased demand from companies with rapidly growing e-commerce operations.
In Japan, the leading contributor was Japanese developer Daito Trust Construction. The company, which develops rental housing, enjoyed strong growth in new orders resulting from a larger, more efficient sales force.
Outlook
Commercial property market fundamentals remain compelling in many regions of the globe, supported by low interest rates and accommodative central banks. This environment should continue to provide a favorable backdrop for global real estate stocks.
In the U.S., we are focused on several market trends, including strength in non-coastal markets, increased deleveraging, and strategic investment opportunities presented by leadership changes and asset spin-offs. Within this component of the portfolio, we have maintained overweight positions in industrial and residential real estate stocks, along with an underweight position in retail property stocks.
In Europe, we remain wary of potential fallout stemming from Brexit. Although our main emphasis in Europe is on stable property markets on the Continent, the fund has a modest overweight in the U.K., where real estate stocks are trading at significant discounts to their underlying property values. However, the fund has limited exposure to the London office market, where Brexit fears are contributing to deteriorating fundamentals.
The fund remains underweight the Asia/Pacific region because of policy-related headwinds. For example, both China and Singapore have restrictive housing market policies that aim to limit home price increases. However, we favor property stocks in Hong Kong, where the housing market has stabilized thanks to improving demand and low mortgage rates. In Japan, we shifted away from companies with above-average exposure to the condominium market, where prices appear to have peaked after several years of strong appreciation.
We reduced the fund’s underweight position in emerging markets as valuations became more attractive and real estate policies improved in several countries, including Indonesia and Brazil.
|
| |
| OCTOBER 31, 2016 | |
| Top Ten Holdings | % of net assets |
| Prologis, Inc. | 4.2% |
| Simon Property Group, Inc. | 3.4% |
| Mitsubishi Estate Co. Ltd. | 2.9% |
| Apartment Investment & Management Co., Class A | 2.7% |
| HCP, Inc. | 2.7% |
| CubeSmart | 2.5% |
| Vornado Realty Trust | 2.5% |
| Duke Realty Corp. | 2.4% |
| Alexandria Real Estate Equities, Inc. | 2.4% |
| Unibail-Rodamco SE | 2.4% |
| | |
| Types of Investments in Portfolio | % of net assets |
| Domestic Common Stocks | 50.8% |
| Foreign Common Stocks | 47.1% |
| Total Common Stocks | 97.9% |
| Temporary Cash Investments | 2.2% |
| Other Assets and Liabilities | (0.1)% |
| | |
| Investments by Country | % of net assets |
| United States | 50.8% |
| Japan | 10.8% |
| Hong Kong | 7.3% |
| Australia | 5.4% |
| United Kingdom | 4.1% |
| France | 3.4% |
| Germany | 3.3% |
| Canada | 2.4% |
| Singapore | 2.3% |
| Other Countries | 8.1% |
| Cash and Equivalents* | 2.1% |
| *Includes temporary cash investments and other assets and liabilities. | |
Fund shareholders may incur two types of costs: (1) transaction costs, including sales charges (loads) on purchase payments and redemption/exchange fees; and (2) ongoing costs, including management fees; distribution and service (12b-1) fees; and other fund expenses. This example is intended to help you understand your ongoing costs (in dollars) of investing in your fund and to compare these costs with the ongoing cost of investing in other mutual funds.
The example is based on an investment of $1,000 made at the beginning of the period and held for the entire period from May 1, 2016 to October 31, 2016.
Actual Expenses
The table provides information about actual account values and actual expenses for each class. You may use the information, together with the amount you invested, to estimate the expenses that you paid over the period. First, identify the share class you own. Then simply divide your account value by $1,000 (for example, an $8,600 account value divided by $1,000 = 8.6), then multiply the result by the number under the heading “Expenses Paid During Period” to estimate the expenses you paid on your account during this period.
Hypothetical Example for Comparison Purposes
The table also provides information about hypothetical account values and hypothetical expenses based on the actual expense ratio of each class of your fund and an assumed rate of return of 5% per year before expenses, which is not the actual return of a fund’s share class. The hypothetical account values and expenses may not be used to estimate the actual ending account balance or expenses you paid for the period. You may use this information to compare the ongoing costs of investing in your fund and other funds. To do so, compare this 5% hypothetical example with the 5% hypothetical examples that appear in the shareholder reports of the other funds.
Please note that the expenses shown in the table are meant to highlight your ongoing costs only and do not reflect any transactional costs, such as sales charges (loads) or redemption/exchange fees. Therefore, the table is useful in comparing ongoing costs only, and will not help you determine the relative total costs of owning different funds. In addition, if these transactional costs were included, your costs would have been higher.
|
| | | | |
| Beginning
Account Value
5/1/16 | Ending
Account Value
10/31/16 | Expenses Paid
During Period(1)
5/1/16 - 10/31/16 | Annualized
Expense Ratio(1) |
| Actual | | | | |
| Investor Class (after waiver) | $1,000 | $998.90 | $5.78 | 1.15% |
| Investor Class (before waiver) | $1,000 | $998.90(2) | $6.03 | 1.20% |
| Institutional Class (after waiver) | $1,000 | $1,000.00 | $4.78 | 0.95% |
| Institutional Class (before waiver) | $1,000 | $1,000.00(2) | $5.03 | 1.00% |
| R6 Class (after waiver) | $1,000 | $1,000.00 | $4.02 | 0.80% |
| R6 Class (before waiver) | $1,000 | $1,000.00(2) | $4.27 | 0.85% |
| Hypothetical | | | | |
| Investor Class (after waiver) | $1,000 | $1,019.36 | $5.84 | 1.15% |
| Investor Class (before waiver) | $1,000 | $1,019.10 | $6.09 | 1.20% |
| Institutional Class (after waiver) | $1,000 | $1,020.36 | $4.82 | 0.95% |
| Institutional Class (before waiver) | $1,000 | $1,020.11 | $5.08 | 1.00% |
| R6 Class (after waiver) | $1,000 | $1,021.12 | $4.06 | 0.80% |
| R6 Class (before waiver) | $1,000 | $1,020.86 | $4.32 | 0.85% |
| |
| (1) | Expenses are equal to the class's annualized expense ratio listed in the table above, multiplied by the average account value over the period, multiplied by 184, the number of days in the most recent fiscal half-year, divided by 366, to reflect the one-half year period. |
| |
| (2) | Ending account value assumes the return earned after waiver and would have been lower if a portion of the fees had not been waived. |
OCTOBER 31, 2016
|
| | | | | |
| | Shares | Value |
| COMMON STOCKS — 97.9% | | |
| Australia — 5.4% | | |
| Dexus Property Group | 854,762 |
| $ | 5,812,943 |
|
| Goodman Group | 1,054,082 |
| 5,444,494 |
|
| Mirvac Group | 2,080,637 |
| 3,307,927 |
|
NEXTDC Ltd.(1) | 634,663 |
| 1,776,660 |
|
| Scentre Group | 1,070,429 |
| 3,428,098 |
|
| Westfield Corp. | 211,878 |
| 1,434,462 |
|
| | | 21,204,584 |
|
| Brazil — 1.3% | | |
BR Malls Participacoes SA(1) | 1,221,660 |
| 4,883,578 |
|
| Canada — 2.4% | | |
| Canadian Apartment Properties REIT | 86,572 |
| 1,892,411 |
|
| Chartwell Retirement Residences | 345,608 |
| 3,849,537 |
|
| H&R Real Estate Investment Trust | 219,999 |
| 3,741,279 |
|
| | | 9,483,227 |
|
| China — 1.4% | | |
| China Overseas Land & Investment Ltd. | 504,000 |
| 1,556,408 |
|
| China Resources Land Ltd. | 1,160,000 |
| 2,892,690 |
|
| Longfor Properties Co. Ltd. | 760,500 |
| 1,010,005 |
|
| | | 5,459,103 |
|
| Finland — 0.8% | | |
| Sponda Oyj | 638,245 |
| 3,021,132 |
|
| France — 3.4% | | |
| Gecina SA | 27,500 |
| 4,008,984 |
|
| Unibail-Rodamco SE | 38,858 |
| 9,256,434 |
|
| | | 13,265,418 |
|
| Germany — 3.3% | | |
| Deutsche Wohnen AG | 235,117 |
| 7,670,724 |
|
| Vonovia SE | 147,393 |
| 5,191,376 |
|
| | | 12,862,100 |
|
| Hong Kong — 7.3% | | |
| Cheung Kong Property Holdings Ltd. | 1,012,000 |
| 7,496,490 |
|
| Link REIT | 1,096,500 |
| 7,818,459 |
|
| Sun Hung Kai Properties Ltd. | 498,000 |
| 7,435,759 |
|
| Wharf Holdings Ltd. (The) | 768,000 |
| 5,773,207 |
|
| | | 28,523,915 |
|
| Indonesia — 0.7% | | |
| Bumi Serpong Damai Tbk PT | 10,181,600 |
| 1,693,292 |
|
| Summarecon Agung Tbk PT | 6,691,100 |
| 846,131 |
|
| | | 2,539,423 |
|
| Japan — 10.8% | | |
| Activia Properties, Inc. | 675 |
| 3,282,636 |
|
| Advance Residence Investment Corp. | 1,333 |
| 3,729,400 |
|
| Daito Trust Construction Co. Ltd. | 29,700 |
| 4,977,377 |
|
| GLP J-REIT | 3,301 |
| 4,139,234 |
|
| Hulic Co. Ltd. | 763,800 |
| 7,290,586 |
|
|
| | | | | |
| | Shares | Value |
| Hulic Reit, Inc. | 2,762 |
| $ | 4,840,809 |
|
| Mitsubishi Estate Co. Ltd. | 568,000 |
| 11,273,882 |
|
| Mori Hills REIT Investment Corp. | 1,843 |
| 2,597,458 |
|
| | | 42,131,382 |
|
| Mexico — 0.6% | | |
| Corp. Inmobiliaria Vesta SAB de CV | 1,463,409 |
| 2,212,031 |
|
| Philippines — 0.5% | | |
| Ayala Land, Inc. | 2,714,700 |
| 2,032,369 |
|
| Singapore — 2.3% | | |
| CapitaLand Mall Trust | 2,113,200 |
| 3,144,168 |
|
| Mapletree Commercial Trust | 2,162,300 |
| 2,377,947 |
|
| Mapletree Industrial Trust | 2,722,100 |
| 3,365,328 |
|
| | | 8,887,443 |
|
| South Africa — 0.6% | | |
| Hyprop Investments Ltd. | 273,707 |
| 2,429,793 |
|
| Spain — 1.1% | | |
| Inmobiliaria Colonial SA | 602,754 |
| 4,256,545 |
|
| Sweden — 1.1% | | |
| Hufvudstaden AB, A Shares | 285,042 |
| 4,411,892 |
|
| United Kingdom — 4.1% | | |
| Great Portland Estates plc | 204,724 |
| 1,488,459 |
|
| Safestore Holdings plc | 562,028 |
| 2,464,827 |
|
| Segro plc | 1,334,584 |
| 7,141,801 |
|
| Shaftesbury plc | 246,681 |
| 2,768,769 |
|
| UNITE Group plc (The) | 334,616 |
| 2,266,971 |
|
| | | 16,130,827 |
|
| United States — 50.8% | | |
| Acadia Realty Trust | 103,490 |
| 3,486,578 |
|
| Alexandria Real Estate Equities, Inc. | 86,177 |
| 9,290,742 |
|
| American Campus Communities, Inc. | 121,762 |
| 6,345,018 |
|
| American Homes 4 Rent | 215,880 |
| 4,557,227 |
|
| American Tower Corp. | 54,691 |
| 6,409,238 |
|
| Apartment Investment & Management Co., Class A | 240,501 |
| 10,598,879 |
|
| AvalonBay Communities, Inc. | 40,198 |
| 6,881,094 |
|
| Brixmor Property Group, Inc. | 299,335 |
| 7,609,096 |
|
| Camden Property Trust | 49,258 |
| 4,011,572 |
|
| Colony Starwood Homes | 167,433 |
| 4,857,231 |
|
| CubeSmart | 372,393 |
| 9,708,286 |
|
| Digital Realty Trust, Inc. | 80,888 |
| 7,557,366 |
|
| Duke Realty Corp. | 363,062 |
| 9,494,071 |
|
| Empire State Realty Trust, Inc. | 272,120 |
| 5,325,388 |
|
| Equinix, Inc. | 22,840 |
| 8,160,275 |
|
| HCP, Inc. | 334,767 |
| 10,481,555 |
|
| Hilton Worldwide Holdings, Inc. | 174,487 |
| 3,943,406 |
|
| Mack-Cali Realty Corp. | 222,079 |
| 5,702,989 |
|
| Medical Properties Trust, Inc. | 212,063 |
| 2,956,158 |
|
| Physicians Realty Trust | 245,419 |
| 4,851,934 |
|
| Prologis, Inc. | 311,168 |
| 16,230,523 |
|
Quality Care Properties, Inc.(1)(2) | 66,953 |
| 1,027,735 |
|
| Retail Properties of America, Inc. | 270,651 |
| 4,214,036 |
|
| Simon Property Group, Inc. | 71,714 |
| 13,335,935 |
|
|
| | | | | |
| | Shares | Value |
| Spirit Realty Capital, Inc. | 438,079 |
| $ | 5,217,521 |
|
| STORE Capital Corp. | 184,754 |
| 5,041,937 |
|
| Taubman Centers, Inc. | 63,681 |
| 4,614,325 |
|
| Urban Edge Properties | 102,983 |
| 2,657,991 |
|
| Ventas, Inc. | 61,988 |
| 4,199,687 |
|
| Vornado Realty Trust | 103,880 |
| 9,637,986 |
|
| | | 198,405,779 |
|
TOTAL COMMON STOCKS
(Cost $371,280,098) | | 382,140,541 |
|
| TEMPORARY CASH INVESTMENTS — 2.2% | | |
| Repurchase Agreement, Fixed Income Clearing Corp., (collateralized by various U.S. Treasury obligations, 3.00%, 11/15/45, valued at $8,539,788), at 0.10%, dated 10/31/16, due 11/1/16 (Delivery value $8,369,023) | | 8,369,000 |
|
| State Street Institutional U.S. Government Money Market Fund, Premier Class | 30,929 |
| 30,929 |
|
TOTAL TEMPORARY CASH INVESTMENTS
(Cost $8,399,929) | | 8,399,929 |
|
TOTAL INVESTMENT SECURITIES — 100.1%
(Cost $379,680,027) | | 390,540,470 |
|
| OTHER ASSETS AND LIABILITIES — (0.1)% | | (335,997 | ) |
| TOTAL NET ASSETS — 100.0% | | $ | 390,204,473 |
|
|
| | |
| SUB-INDUSTRY ALLOCATION | |
| (as a % of net assets) | |
| Retail REITs | 17.6 | % |
| Industrial REITs | 11.8 | % |
| Residential REITs | 10.9 | % |
| Real Estate Operating Companies | 10.7 | % |
| Office REITs | 9.0 | % |
| Diversified REITs | 8.7 | % |
| Specialized REITs | 8.7 | % |
| Diversified Real Estate Activities | 8.1 | % |
| Health Care REITs | 6.0 | % |
| Real Estate Development | 4.0 | % |
| Hotels, Resorts and Cruise Lines | 1.0 | % |
| Health Care Facilities | 1.0 | % |
| Internet Software and Services | 0.4 | % |
| Cash and Equivalents* | 2.1 | % |
*Includes temporary cash investments and other assets and liabilities.
|
| | |
| NOTES TO SCHEDULE OF INVESTMENTS |
| |
| (2) | When-issued security. The issue price and yield are fixed on the date of the commitment, but payment and delivery are scheduled for a future date. |
See Notes to Financial Statements.
|
|
| Statement of Assets and Liabilities |
|
| | | |
| OCTOBER 31, 2016 | |
| Assets | |
| Investment securities, at value (cost of $379,680,027) | $ | 390,540,470 |
|
| Foreign currency holdings, at value (cost of $94,012) | 92,805 |
|
| Receivable for investments sold | 11,682,482 |
|
| Receivable for capital shares sold | 224,816 |
|
| Dividends and interest receivable | 481,964 |
|
| | 403,022,537 |
|
| | |
| Liabilities | |
| Payable for investments purchased | 12,499,303 |
|
| Accrued management fees | 318,761 |
|
| | 12,818,064 |
|
| | |
| Net Assets | $ | 390,204,473 |
|
| | |
| Net Assets Consist of: | |
| Capital (par value and paid-in surplus) | $ | 405,849,782 |
|
| Undistributed net investment income | 10,777,731 |
|
| Accumulated net realized loss | (37,276,808 | ) |
| Net unrealized appreciation | 10,853,768 |
|
| | $ | 390,204,473 |
|
|
| | | | | | |
| | Net Assets | Shares Outstanding | Net Asset Value Per Share |
| Investor Class, $0.01 Par Value |
| $102,125,234 |
| 10,765,942 |
| $9.49 |
| Institutional Class, $0.01 Par Value |
| $262,612,302 |
| 27,641,138 |
| $9.50 |
| R6 Class, $0.01 Par Value |
| $25,466,937 |
| 2,677,430 |
| $9.51 |
See Notes to Financial Statements.
|
| | | |
| YEAR ENDED OCTOBER 31, 2016 |
| Investment Income (Loss) | |
| Income: | |
| Dividends (net of foreign taxes withheld of $459,650) | $ | 9,410,746 |
|
| Interest | 7,937 |
|
| | 9,418,683 |
|
| | |
| Expenses: | |
| Management fees | 4,028,671 |
|
| Directors' fees and expenses | 13,132 |
|
| Other expenses | 5,510 |
|
| | 4,047,313 |
|
| Fees waived | (193,200 | ) |
| | 3,854,113 |
|
| | |
| Net investment income (loss) | 5,564,570 |
|
| | |
| Realized and Unrealized Gain (Loss) | |
| Net realized gain (loss) on: | |
| Investment transactions | 703,415 |
|
| Foreign currency transactions | (18,503 | ) |
| | 684,912 |
|
| | |
| Change in net unrealized appreciation (depreciation) on: | |
| Investments | 1,960,672 |
|
| Translation of assets and liabilities in foreign currencies | 2,502 |
|
| | 1,963,174 |
|
| | |
| Net realized and unrealized gain (loss) | 2,648,086 |
|
| | |
| Net Increase (Decrease) in Net Assets Resulting from Operations | $ | 8,212,656 |
|
See Notes to Financial Statements.
|
|
| Statement of Changes in Net Assets |
|
| | | | | | |
| YEAR ENDED OCTOBER 31, 2016 AND PERIOD ENDED OCTOBER 31, 2015 |
| Increase (Decrease) in Net Assets | October 31, 2016 | October 31, 2015(1) |
| Operations | | |
| Net investment income (loss) | $ | 5,564,570 |
| $ | 3,500,140 |
|
| Net realized gain (loss) | 684,912 |
| (26,764,584 | ) |
| Change in net unrealized appreciation (depreciation) | 1,963,174 |
| 8,890,594 |
|
| Net increase (decrease) in net assets resulting from operations | 8,212,656 |
| (14,373,850 | ) |
| | | |
| Distributions to Shareholders | | |
| From net investment income: | | |
| Investor Class | (3,011,060 | ) | — |
|
| Institutional Class | (6,093,250 | ) | — |
|
| R6 Class | (379,807 | ) | — |
|
| Decrease in net assets from distributions | (9,484,117 | ) | — |
|
| | | |
| Capital Share Transactions | | |
| Net increase (decrease) in net assets from capital share transactions (Note 5) | 45,378,066 |
| 360,471,718 |
|
| | | |
| Net increase (decrease) in net assets | 44,106,605 |
| 346,097,868 |
|
| | | |
| Net Assets | | |
| Beginning of period | 346,097,868 |
| — |
|
| End of period | $ | 390,204,473 |
| $ | 346,097,868 |
|
| | | |
| Undistributed net investment income | $ | 10,777,731 |
| $ | 3,898,443 |
|
| |
| (1) | March 19, 2015 (fund inception) through October 31, 2015. |
See Notes to Financial Statements.
|
|
| Notes to Financial Statements |
OCTOBER 31, 2016
1. Organization
American Century Capital Portfolios, Inc. (the corporation) is registered under the Investment Company Act of 1940, as amended (the 1940 Act), as an open-end management investment company and is organized as a Maryland corporation. NT Global Real Estate Fund (the fund) is one fund in a series issued by the corporation. The fund’s investment objective is to seek high total investment return through a combination of capital appreciation and current income. The fund is not permitted to invest in securities issued by companies assigned the Global Industry Classification Standard for the tobacco industry.
The fund offers the Investor Class, the Institutional Class and the R6 Class, which have different fees and expenses. The difference in the fee structures between the classes is the result of their separate arrangements for shareholder and distribution services, which may be provided indirectly through another American Century Investments mutual fund. As a result, the investment advisor is able to charge the Institutional Class and R6 Class lower unified management fees. All classes of the fund commenced sale on March 19, 2015, the fund’s inception date.
2. Significant Accounting Policies
The following is a summary of significant accounting policies consistently followed by the fund in preparation of its financial statements. The fund is an investment company and follows accounting and reporting guidance in accordance with accounting principles generally accepted in the United States of America. This may require management to make certain estimates and assumptions at the date of the financial statements. Actual results could differ from these estimates. Management evaluated the impact of events or transactions occurring through the date the financial statements were issued that would merit recognition or disclosure.
Investment Valuations — The fund determines the fair value of its investments and computes its net asset value per share at the close of regular trading (usually 4 p.m. Eastern time) on the New York Stock Exchange (NYSE) on each day the NYSE is open. The Board of Directors has adopted valuation policies and procedures to guide the investment advisor in the fund’s investment valuation process and to provide methodologies for the oversight of the fund’s pricing function.
Equity securities that are listed or traded on a domestic securities exchange are valued at the last reported sales price or at the official closing price as provided by the exchange. Equity securities traded on foreign securities exchanges are generally valued at the closing price of such securities on the exchange where primarily traded or at the close of the NYSE, if that is earlier. If no last sales price is reported, or if local convention or regulation so provides, the mean of the latest bid and asked prices may be used. Securities traded over-the-counter are valued at the mean of the latest bid and asked prices, the last sales price, or the official closing price. Equity securities initially expressed in local currencies are translated into U.S. dollars at the mean of the appropriate currency exchange rate at the close of the NYSE as provided by an independent pricing service.
Open-end management investment companies are valued at the reported net asset value per share. Repurchase agreements are valued at cost, which approximates fair value.
If the fund determines that the market price for an investment is not readily available or the valuation methods mentioned above do not reflect an investment’s fair value, such investment is valued as determined in good faith by the Board of Directors or its delegate, in accordance with policies and procedures adopted by the Board of Directors. In its determination of fair value, the fund may review several factors including, but not limited to, market information regarding the specific investment or comparable investments and correlation with other investment types, futures indices or general market indicators. Circumstances that may cause the fund to use these procedures to value an investment include, but are not limited to: an investment has been declared in default or is distressed; trading in a security has been suspended during the trading day or a security is not actively trading on its principal exchange; prices received from a regular pricing source are deemed unreliable; or there is a foreign market holiday and no trading occurred.
The fund monitors for significant events occurring after the close of an investment’s primary exchange but before the fund’s net asset value per share is determined. Significant events may include, but are not limited
to: corporate announcements and transactions; governmental action and political unrest that could impact a specific investment or an investment sector; or armed conflicts, natural disasters and similar events that could affect investments in a specific country or region. The fund also monitors for significant fluctuations between domestic and foreign markets, as evidenced by the U.S. market or such other indicators that the Board of Directors, or its delegate, deems appropriate. If significant fluctuations in foreign markets are identified, the fund may apply a model-derived factor to the closing price of equity securities traded on foreign securities exchanges. The factor is based on observable market data as provided by an independent pricing service.
Security Transactions — Security transactions are accounted for as of the trade date. Net realized gains and losses are determined on the identified cost basis, which is also used for federal income tax purposes.
Investment Income — Dividend income less foreign taxes withheld, if any, is recorded as of the ex-dividend date. Distributions received on securities that represent a return of capital or long-term capital gain are recorded as a reduction of cost of investments and/or as a realized gain. The fund may estimate the components of distributions received that may be considered nontaxable distributions or long-term capital gain distributions for income tax purposes. Interest income is recorded on the accrual basis and includes accretion of discounts and amortization of premiums.
Foreign Currency Translations — All assets and liabilities initially expressed in foreign currencies are translated into U.S. dollars at prevailing exchange rates at period end. The fund may enter into spot foreign currency exchange contracts to facilitate transactions denominated in a foreign currency. Purchases and sales of investment securities, dividend and interest income, spot foreign currency exchange contracts, and expenses are translated at the rates of exchange prevailing on the respective dates of such transactions. Net realized and unrealized foreign currency exchange gains or losses related to investment securities are a component of net realized gain (loss) on investment transactions and change in net unrealized appreciation (depreciation) on investments, respectively.
Repurchase Agreements — The fund may enter into repurchase agreements with institutions that American Century Investment Management, Inc. (ACIM) (the investment advisor) has determined are creditworthy pursuant to criteria adopted by the Board of Directors. The fund requires that the collateral, represented by securities, received in a repurchase transaction be transferred to the custodian in a manner sufficient to enable the fund to obtain those securities in the event of a default under the repurchase agreement. ACIM monitors, on a daily basis, the securities transferred to ensure the value, including accrued interest, of the securities under each repurchase agreement is equal to or greater than amounts owed to the fund under each repurchase agreement.
Joint Trading Account — Pursuant to an Exemptive Order issued by the Securities and Exchange Commission, the fund, along with certain other funds in the American Century Investments family of funds, may transfer uninvested cash balances into a joint trading account. These balances are invested in one or more repurchase agreements that are collateralized by U.S. Treasury or Agency obligations.
Segregated Assets — In accordance with the 1940 Act, the fund segregates assets on its books and records to cover certain types of investments, including, but not limited to, futures contracts and when-issued securities. ACIM monitors, on a daily basis, the securities segregated to ensure the fund designates a sufficient amount of liquid assets, marked-to-market daily. The fund may also receive assets or be required to pledge assets at the custodian bank or with a broker for margin requirements on futures contracts.
Income Tax Status — It is the fund’s policy to distribute substantially all net investment income and net realized gains to shareholders and to otherwise qualify as a regulated investment company under provisions of the Internal Revenue Code. Accordingly, no provision has been made for income taxes. The fund files U.S. federal, state, local and non-U.S. tax returns as applicable. The fund's tax returns are subject to examination by the relevant taxing authority until expiration of the applicable statute of limitations, which is generally three years from the date of filing but can be longer in certain jurisdictions. At this time, management believes there are no uncertain tax positions which, based on their technical merit, would not be sustained upon examination and for which it is reasonably possible that the total amounts of unrecognized tax benefits will significantly change in the next twelve months.
Multiple Class — All shares of the fund represent an equal pro rata interest in the net assets of the class to which such shares belong, and have identical voting, dividend, liquidation and other rights and the same terms and conditions, except for class specific expenses and exclusive rights to vote on matters affecting only individual classes. Income, non-class specific expenses, and realized and unrealized capital gains and losses of the fund are allocated to each class of shares based on their relative net assets.
Distributions to Shareholders — Distributions from net investment income and net realized gains, if any, are generally declared and paid annually.
Indemnifications — Under the corporation’s organizational documents, its officers and directors are indemnified against certain liabilities arising out of the performance of their duties to the fund. In addition, in the normal course of business, the fund enters into contracts that provide general indemnifications. The maximum exposure under these arrangements is unknown as this would involve future claims that may be made against a fund. The risk of material loss from such claims is considered by management to be remote.
3. Fees and Transactions with Related Parties
Certain officers and directors of the corporation are also officers and/or directors of American Century Companies, Inc. (ACC). The corporation’s investment advisor, ACIM, the corporation's distributor, American Century Investment Services, Inc., and the corporation’s transfer agent, American Century Services, LLC, are wholly owned, directly or indirectly, by ACC. Various funds issued by American Century Asset Allocation Portfolios, Inc. own, in aggregate, 100% of the shares of the fund. Related parties do not invest in the fund for the purpose of exercising management or control.
Management Fees — The corporation has entered into a management agreement with ACIM, under which ACIM provides the fund with investment advisory and management services in exchange for a single, unified management fee (the fee) per class. The agreement provides that all expenses of managing and operating the fund, except distribution and service fees, brokerage expenses, taxes, interest, fees and expenses of the independent directors (including legal counsel fees), and extraordinary expenses, will be paid by ACIM. The fee is computed and accrued daily based on each class’s daily net assets and paid monthly in arrears. The annual management fee is 1.20% for the Investor Class, 1.00% for the Institutional Class and 0.85% for the R6 Class. From November 1, 2015 thru July 31, 2016, the investment advisor agreed to waive 0.04% of the fund’s management fee. Effective August 1, 2016, the investment advisor agreed to increase the amount of the waiver from 0.04% to 0.08% of the fund's management fee. The investment advisor expects this waiver to continue until July 31, 2017 and cannot terminate it prior to such date without the approval of the Board of Directors. The total amount of the waiver for each class for the year ended October 31, 2016 was $54,990, $128,032 and $10,178 for the Investor Class, Institutional Class and R6 Class, respectively. The effective annual management fee after waiver for each class for the year ended October 31, 2016 was 1.15% for the Investor Class, 0.95% for the Institutional Class and 0.80% for the R6 Class.
Directors' Fees and Expenses — The Board of Directors is responsible for overseeing the investment advisor’s management and operations of the fund. The directors receive detailed information about the fund and its investment advisor regularly throughout the year, and meet at least quarterly with management of the investment advisor to review reports about fund operations. The fund’s officers do not receive compensation from the fund.
Interfund Transactions — The fund may enter into security transactions with other American Century Investments funds and other client accounts of the investment advisor, in accordance with the 1940 Act rules and procedures adopted by the Board of Directors. The rules and procedures require, among other things, that these transactions be effected at the independent current market price of the security. During the period, the interfund purchases and sales were $1,732,278 and $3,347,327, respectively. The effect of interfund transactions on the Statement of Operations was $(194,102) in net realized gain (loss) on investment transactions.
4. Investment Transactions
Purchases and sales of investment securities, excluding short-term investments, for the year ended October 31, 2016 were $1,033,533,373 and $993,268,816, respectively.
5. Capital Share Transactions
Transactions in shares of the fund were as follows:
|
| | | | | | | | | | |
| | Year ended
October 31, 2016 | Period ended October 31, 2015(1) |
| | Shares | Amount | Shares | Amount |
| Investor Class/Shares Authorized | 70,000,000 |
| | 70,000,000 |
| |
| Sold | 4,449,284 |
| $ | 42,555,373 |
| 9,664,941 |
| $ | 96,620,631 |
|
| Issued in reinvestment of distributions | 331,980 |
| 3,011,060 |
| — |
| — |
|
| Redeemed | (3,634,715 | ) | (34,804,654 | ) | (45,548 | ) | (431,789 | ) |
| | 1,146,549 |
| 10,761,779 |
| 9,619,393 |
| 96,188,842 |
|
| Institutional Class/Shares Authorized | 160,000,000 |
| | 150,000,000 |
| |
| Sold | 4,226,547 |
| 39,182,288 |
| 26,126,396 |
| 260,420,333 |
|
| Issued in reinvestment of distributions | 671,803 |
| 6,093,250 |
| — |
| — |
|
| Redeemed | (2,373,559 | ) | (22,922,977 | ) | (1,010,049 | ) | (9,865,944 | ) |
| | 2,524,791 |
| 22,352,561 |
| 25,116,347 |
| 250,554,389 |
|
| R6 Class/Shares Authorized | 20,000,000 |
| | 20,000,000 |
| |
| Sold | 1,364,259 |
| 12,978,918 |
| 1,501,440 |
| 14,826,317 |
|
| Issued in reinvestment of distributions | 41,921 |
| 379,807 |
| — |
| — |
|
| Redeemed | (112,101 | ) | (1,094,999 | ) | (118,089 | ) | (1,097,830 | ) |
| | 1,294,079 |
| 12,263,726 |
| 1,383,351 |
| 13,728,487 |
|
| Net increase (decrease) | 4,965,419 |
| $ | 45,378,066 |
| 36,119,091 |
| $ | 360,471,718 |
|
| |
| (1) | March 19, 2015 (fund inception) through October 31, 2015. |
6. Fair Value Measurements
The fund’s investments valuation process is based on several considerations and may use multiple inputs to determine the fair value of the investments held by the fund. In conformity with accounting principles generally accepted in the United States of America, the inputs used to determine a valuation are classified into three broad levels.
| |
| • | Level 1 valuation inputs consist of unadjusted quoted prices in an active market for identical investments. |
| |
| • | Level 2 valuation inputs consist of direct or indirect observable market data (including quoted prices for comparable investments, evaluations of subsequent market events, interest rates, prepayment speeds, credit risk, etc.). These inputs also consist of quoted prices for identical investments initially expressed in local currencies that are adjusted through translation into U.S. dollars. |
| |
| • | Level 3 valuation inputs consist of unobservable data (including a fund’s own assumptions). |
The level classification is based on the lowest level input that is significant to the fair valuation measurement. The valuation inputs are not necessarily an indication of the risks associated with investing in these securities or other financial instruments. There were no significant transfers between levels during the period.
The following is a summary of the level classifications as of period end. The Schedule of Investments provides additional information on the fund’s portfolio holdings.
|
| | | | | | | | |
| | Level 1 | Level 2 | Level 3 |
| Assets | | | |
| Investment Securities | | | |
| Common Stocks | | | |
| United States | $ | 198,405,779 |
| — |
| — |
|
| Other Countries | — |
| $ | 183,734,762 |
| — |
|
| Temporary Cash Investments | 30,929 |
| 8,369,000 |
| — |
|
| | $ | 198,436,708 |
| $ | 192,103,762 |
| — |
|
7. Risk Factors
The fund concentrates its investments in a narrow segment of the total market. Because of this, the fund is subject to certain additional risks as compared to investing in a more diversified portfolio of investments. The fund may be subject to certain risks similar to those associated with direct investment in real estate including but not limited to: local or regional economic conditions, changes in zoning laws, changes in property values, property tax increases, overbuilding, increased competition, environmental contamination, natural disasters, and interest rate risk.
There are certain risks involved in investing in foreign securities. These risks include those resulting from future adverse political, social and economic developments, fluctuations in currency exchange rates, the possible imposition of exchange controls, and other foreign laws or restrictions. Investing in emerging markets may accentuate these risks.
The fund’s investment process may result in high portfolio turnover, which could mean high transaction costs, affecting both performance and capital gains tax liabilities to investors.
8. Federal Tax Information
The tax character of distributions paid during the year ended October 31, 2016 and the period March 19, 2015 (fund inception) through October 31, 2015 were as follows:
|
| | | | | |
| | 2016 | 2015 |
| Distributions Paid From | | |
| Ordinary income | $ | 9,484,117 |
| — |
|
| Long-term capital gains | — |
| — |
|
The book-basis character of distributions made during the year from net investment income or net realized gains may differ from their ultimate characterization for federal income tax purposes. These differences reflect the differing character of certain income items and net realized gains and losses for financial statement and tax purposes, and may result in reclassification among certain capital accounts on the financial statements.
The reclassifications, which are primarily due to gains on investments in passive foreign investment companies, were made to capital $(2), undistributed net investment income $10,798,835, and accumulated net realized loss $(10,798,833).
As of October 31, 2016, the federal tax cost of investments and the components of distributable earnings on a tax-basis were as follows:
|
| | | |
| Federal tax cost of investments | $ | 389,214,602 |
|
| Gross tax appreciation of investments | $ | 11,364,716 |
|
| Gross tax depreciation of investments | (10,038,848 | ) |
| Net tax appreciation (depreciation) of investments | 1,325,868 |
|
| Net tax appreciation (depreciation) on translation of assets and liabilities in foreign currencies | (8,255 | ) |
| Net tax appreciation (depreciation) | $ | 1,317,613 |
|
| Undistributed ordinary income | $ | 15,647,381 |
|
| Accumulated short-term capital losses | $ | (32,610,303 | ) |
The difference between book-basis and tax-basis unrealized appreciation (depreciation) is attributable primarily to the tax deferral of losses on wash sales and the realization for tax purposes of unrealized gains on investments in passive foreign investment companies.
Accumulated capital losses represent net capital loss carryovers that may be used to offset future realized capital gains for federal income tax purposes. The capital loss carryovers may be carried forward for an unlimited period. Future capital loss carryover utilization in any given year may be subject to Internal Revenue Code limitations.
|
| | | | | | | | | | | | | | | |
| For a Share Outstanding Throughout the Years Ended October 31 (except as noted) | | |
| Per-Share Data | Ratios and Supplemental Data |
| | | Income From Investment Operations: | | | | Ratio to Average Net Assets of: | | |
| | Net Asset
Value,
Beginning
of Period | Net
Investment
Income
(Loss)(1) | Net
Realized
and
Unrealized
Gain (Loss) | Total From
Investment
Operations | Distributions From Net
Investment
Income | Net Asset
Value,
End
of Period | Total
Return(2) | Operating
Expenses | Operating
Expenses
(before
expense
waiver) | Net
Investment
Income
(Loss) | Net
Investment
Income
(Loss)
(before
expense
waiver) | Portfolio
Turnover
Rate | Net
Assets,
End of
Period
(in thousands) |
| Investor Class | | | | | | | | | | | |
| 2016 | $9.57 | 0.13 | 0.01 | 0.14 | (0.22) | $9.49 | 1.58% | 1.16% | 1.21% | 1.30% | 1.25% | 264% |
| $102,125 |
|
2015(3) | $10.00 | 0.09 | (0.52) | (0.43) | — | $9.57 | (4.30)% | 1.19%(4) | 1.20%(4) | 1.50%(4) | 1.49%(4) | 151% |
| $92,086 |
|
| Institutional Class | | | | | | | | | | | |
| 2016 | $9.59 | 0.14 | 0.01 | 0.15 | (0.24) | $9.50 | 1.74% | 0.96% | 1.01% | 1.50% | 1.45% | 264% |
| $262,612 |
|
2015(3) | $10.00 | 0.10 | (0.51) | (0.41) | — | $9.59 | (4.20)% | 0.99%(4) | 1.00%(4) | 1.70%(4) | 1.69%(4) | 151% |
| $240,740 |
|
| R6 Class | | | | | | | | | | | | | |
| 2016 | $9.59 | 0.15 | 0.02 | 0.17 | (0.25) | $9.51 | 1.86% | 0.81% | 0.86% | 1.65% | 1.60% | 264% |
| $25,467 |
|
2015(3) | $10.00 | 0.11 | (0.52) | (0.41) | — | $9.59 | (4.10)% | 0.84%(4) | 0.85%(4) | 1.85%(4) | 1.84%(4) | 151% |
| $13,271 |
|
|
|
| Notes to Financial Highlights |
| |
| (1) | Computed using average shares outstanding throughout the period. |
| |
| (2) | Total returns are calculated based on the net asset value of the last business day. Total returns for periods less than one year are not annualized. |
| |
| (3) | March 19, 2015 (fund inception) through October 31, 2015. |
See Notes to Financial Statements.
|
|
| Report of Independent Registered Public Accounting Firm |
To the Board of Directors and Shareholders of American Century Capital Portfolios, Inc.:
We have audited the accompanying statement of assets and liabilities, including the schedule of investments, of NT Global Real Estate Fund (the “Fund”), one of the funds constituting American Century Capital Portfolios, Inc., as of October 31, 2016, and the related statement of operations for the year then ended, and the statements of changes in net assets and the financial highlights for the year then ended and for the period from March 19, 2015 (commencement date) through October 31, 2015. These financial statements and financial highlights are the responsibility of the Fund’s management. Our responsibility is to express an opinion on these financial statements and financial highlights based on our audits.
We conducted our audits in accordance with the standards of the Public Company Accounting Oversight Board (United States). Those standards require that we plan and perform the audit to obtain reasonable assurance about whether the financial statements and financial highlights are free of material misstatement. The Fund is not required to have, nor were we engaged to perform, an audit of its internal control over financial reporting. Our audits included consideration of internal control over financial reporting as a basis for designing audit procedures that are appropriate in the circumstances, but not for the purpose of expressing an opinion on the effectiveness of the Fund’s internal control over financial reporting. Accordingly, we express no such opinion. An audit also includes examining, on a test basis, evidence supporting the amounts and disclosures in the financial statements, assessing the accounting principles used and significant estimates made by management, as well as evaluating the overall financial statement presentation. Our procedures included confirmation of securities owned as of October 31, 2016, by correspondence with the custodian and brokers; when replies were not received from brokers, we performed other auditing procedures. We believe that our audits provide a reasonable basis for our opinion.
In our opinion, the financial statements and financial highlights referred to above present fairly, in all material respects, the financial position of NT Global Real Estate Fund of American Century Capital Portfolios, Inc. as of October 31, 2016, the results of its operations for the year then ended, and the changes in its net assets and the financial highlights for the year then ended and for the period from March 19, 2015 (commencement date) through October 31, 2015, in conformity with accounting principles generally accepted in the United States of America.
DELOITTE & TOUCHE LLP
Kansas City, Missouri
December 19, 2016
The Board of Directors
The individuals listed below serve as directors of the funds. Each director will continue to serve in this capacity until death, retirement, resignation or removal from office. The board has adopted a mandatory retirement age for directors who are not “interested persons,” as that term is defined in the Investment Company Act (independent directors). Independent directors shall retire by December 31 of the year in which they reach their 75th birthday.
Mr. Thomas is an “interested person” because he currently serves as President and Chief Executive Officer of American Century Companies, Inc. (ACC), the parent company of American Century Investment Management, Inc. (ACIM or the advisor). The other directors (more than three-fourths of the total number) are independent. They are not employees, directors or officers of, and have no financial interest in, ACC or any of its wholly owned, direct or indirect, subsidiaries, including ACIM, American Century Investment Services, Inc. (ACIS) and American Century Services, LLC (ACS), and they do not have any other affiliations, positions or relationships that would cause them to be considered “interested persons” under the Investment Company Act. The directors serve in this capacity for seven (in the case of Mr. Thomas, 15) registered investment companies in the American Century Investments family of funds.
The following table presents additional information about the directors. The mailing address for each director is 4500 Main Street, Kansas City, Missouri 64111.
|
| | | | | |
Name
(Year of Birth) | Position(s) Held with Funds | Length of Time Served | Principal Occupation(s) During Past 5 Years | Number of American Century Portfolios Overseen by Director | Other Directorships Held During Past 5 Years |
| Independent Directors |
|
|
Barry Fink
(1955) | Director | Since 2012 | Retired; Executive Vice President, ACC (September 2007 to February 2013); President, ACS (October 2007 to February 2013); Chief Operating Officer, ACC (September 2007 to November 2012) | 81 | None |
Andrea C. Hall
(1945) | Director | Since 1997 | Retired | 81 | None |
Jan M. Lewis
(1957) | Director | Since 2011 | Retired; President and Chief Executive Officer, Catholic Charities of Northeast Kansas (human services organization) (2006 to 2013) | 81 | None |
James A. Olson
(1942) | Director and Chairman of the Board | Since 2007 (Chairman since 2014) | Member, Plaza Belmont LLC (private equity fund manager) (1999 to present) | 81 | Saia, Inc. (2002 to 2012) and EPR Properties (2003 to 2013) |
M. Jeannine Strandjord
(1945) | Director | Since 1994 | Retired | 81 | Euronet Worldwide Inc.; MGP Ingredients, Inc.; and DST Systems Inc. (1996 to 2012) |
|
| | | | | |
Name
(Year of Birth) | Position(s) Held with Funds | Length of Time Served | Principal Occupation(s) During Past 5 Years | Number of American Century Portfolios Overseen by Director | Other Directorships Held During Past 5 Years |
| Independent Directors |
|
|
John R. Whitten
(1946) | Director | Since 2008 | Retired | 81 | Rudolph Technologies, Inc. |
Stephen E. Yates
(1948) | Director | Since 2012 | Retired | 81 | None |
| Interested Director |
|
|
Jonathan S. Thomas
(1963) | Director and President | Since 2007 | President and Chief Executive Officer, ACC (March 2007 to present). Also serves as Chief Executive Officer, ACS; Executive Vice President, ACIM; Director, ACC, ACIM and other ACC subsidiaries | 125 | BioMed Valley Discoveries, Inc. |
The Statement of Additional Information has additional information about the fund's directors and is available without charge, upon request, by calling 1-800-345-2021.
Officers
The following table presents certain information about the executive officers of the funds. Each officer serves as an officer for each of the 15 investment companies in the American Century family of funds, unless otherwise noted. No officer is compensated for his or her service as an officer of the funds. The listed officers are interested persons of the funds and are appointed or re-appointed on an annual basis. The mailing address for each officer listed below is 4500 Main Street, Kansas City, Missouri 64111.
|
| | |
Name
(Year of Birth) | Offices with the Funds | Principal Occupation(s) During the Past Five Years |
Jonathan S. Thomas
(1963) | Director and President since 2007 | President and Chief Executive Officer, ACC (March 2007 to present). Also serves as Chief Executive Officer, ACS; Executive Vice President, ACIM; Director, ACC, ACIM and other ACC subsidiaries |
Amy D. Shelton
(1964) | Chief Compliance Officer and Vice President since 2014 | Chief Compliance Officer, American Century funds, (March 2014 to present); Chief Compliance Officer, ACIM (February 2014 to present); Chief Compliance Officer, ACIS (October 2009 to present); Vice President, Client Interactions and Marketing, ACIS (February 2013 to January 2014); Director, Client Interactions and Marketing, ACIS (June 2007 to January 2013). Also serves as Vice President, ACIS |
Charles A. Etherington
(1957) | General Counsel since 2007 and Senior Vice President since 2006 | Attorney, ACC (February 1994 to present); Vice President, ACC (November 2005 to present); General Counsel, ACC (March 2007 to present). Also serves as General Counsel, ACIM, ACS, ACIS and other ACC subsidiaries; and Senior Vice President, ACIM and ACS |
C. Jean Wade
(1964) | Vice President,Treasurer and Chief Financial Officer since 2012 | Vice President, ACS (February 2000 to present) |
Robert J. Leach
(1966) | Vice President since 2006 and Assistant Treasurer since 2012 | Vice President, ACS (February 2000 to present) |
David H. Reinmiller
(1963) | Vice President since 2000 | Attorney, ACC (January 1994 to present); Associate General Counsel, ACC (January 2001 to present). Also serves as Vice President, ACIM and ACS |
Ward D. Stauffer
(1960) | Secretary since 2005 | Attorney, ACC (June 2003 to present) |
|
|
| Approval of Management Agreement |
At a meeting held on June 29, 2016, the Fund’s Board of Directors (the "Board") unanimously approved the renewal of the management agreement pursuant to which American Century Investment Management, Inc. (the “Advisor”) acts as the investment advisor for the Fund. Under Section 15(c) of the Investment Company Act, contracts for investment advisory services are required to be reviewed, evaluated, and approved by a majority of a fund’s directors (the “Directors”), including a majority of the independent Directors, each year.
Prior to its consideration of the renewal of the management agreement, the Directors requested and reviewed extensive data and information compiled by the Advisor and certain independent providers of evaluation data concerning the Fund and the services provided to the Fund by the Advisor. This review was in addition to the oversight and evaluation undertaken by the Board and its committees on a continual basis and the information received was supplemental to the extensive information that the Board and its committees receive and consider throughout the year.
In connection with its consideration of the renewal of the management agreement, the Board’s review and evaluation of the services provided by the Advisor included, but was not limited to, the following:
| |
| • | the nature, extent, and quality of investment management, shareholder services, and other services provided and to be provided to the Fund; |
| |
| • | the wide range of other programs and services provided and to be provided to the Fund and its shareholders on a routine and non-routine basis; |
| |
| • | the investment performance of the Fund, including data comparing the Fund's performance to appropriate benchmarks and/or a peer group of other mutual funds with similar investment objectives and strategies; |
| |
| • | the cost of owning the Fund compared to the cost of owning similar funds; |
| |
| • | the compliance policies, procedures, and regulatory experience of the Advisor and the Fund's service providers; |
| |
| • | financial data showing the cost of services provided to the Fund, the profitability of the Fund to the Advisor, and the overall profitability of the Advisor; |
| |
| • | possible economies of scale associated with the Advisor’s management of the Fund and other accounts under its management; |
| |
| • | data comparing services provided and charges to the Advisor's other investment management clients; |
| |
| • | acquired fund fees and expenses; |
| |
| • | payments by the Fund and the Advisor to financial intermediaries and the nature of services provided; and |
| |
| • | any collateral benefits derived by the Advisor from the management of the Fund. |
In keeping with their practice, the Directors held two in-person meetings and one telephonic meeting to review and discuss the information provided. The independent Directors also had the benefit of the advice of their independent counsel throughout the process.
Factors Considered
The Directors considered all of the information provided by the Advisor, the independent data providers, and independent counsel in connection with the approval. They determined that the information was sufficient for them to evaluate the management agreement for the Fund. In connection with their review, the Directors did not identify any single factor as being all-important or controlling, and each Director may have attributed different levels of importance to different factors. In deciding to renew the management agreement, the Board based its decision on a number of factors, including the following:
Nature, Extent and Quality of Services - Generally. Under the management agreement, the Advisor is responsible for providing or arranging for all services necessary for the operation of the Fund. The Board noted that under the management agreement, the Advisor provides or arranges at its own expense a wide variety of services including:
| |
| • | constructing and designing the Fund |
| |
| • | portfolio research and security selection |
| |
| • | initial capitalization/funding |
| |
| • | daily valuation of the Fund’s portfolio |
| |
| • | shareholder servicing and transfer agency, including shareholder confirmations, recordkeeping, and communications |
| |
| • | legal services (except the independent Directors’ counsel) |
| |
| • | regulatory and portfolio compliance |
| |
| • | marketing and distribution (except amounts paid by the Fund under Rule 12b-1 plans) |
The Board noted that many of these services have expanded over time in terms of both quantity and complexity in response to shareholder demands, competition in the industry, changing distribution channels, and the changing regulatory environment. The Board noted specifically the resources the Advisor has committed to enhancing cybersecurity protections for the benefit of shareholders.
Investment Management Services. The nature of the investment management services provided to the Fund is quite complex and allows Fund shareholders access to professional money management, instant diversification of their investments within an asset class, the opportunity to easily diversify among asset classes by investing in or exchanging among various American Century Investments funds, and liquidity. In evaluating investment performance, the Board expects the Advisor to manage the Fund in accordance with its investment objectives and approved strategies. Further, the Directors recognize that the Advisor has an obligation to monitor trading activities, and in particular to seek the best execution of fund trades, and to evaluate the use of and payment for research. In providing these services, the Advisor utilizes teams of investment professionals (portfolio managers, analysts, research assistants, and securities traders) who require extensive information technology, research, training, compliance, and other systems to conduct their business. The Board, directly and through its Fund Performance Review Committee, provides oversight of the investment performance process. It regularly reviews investment performance information for the Fund, together with comparative information for appropriate benchmarks and/or peer groups of similarly-managed funds, over different time horizons. The Directors also review detailed performance information provided by the Advisor during the management agreement approval process. If performance concerns are identified, the Fund receives special reviews until performance improves, during which the Board receives a report from the Advisor regarding the reasons for such results (e.g., market conditions, security selection) and any efforts being undertaken to improve performance. The Fund had less than one year of performance history at the time of the Board's review. The Board found the investment management services provided by the Advisor to the Fund to be satisfactory and consistent with the management agreement.
Shareholder and Other Services. Under the management agreement, the Advisor provides the Fund with a comprehensive package of transfer agency, shareholder, and other services. The Board, directly and through various committees of the Board, regularly reviews reports and evaluations of such services at its regular meetings. These reports include, but are not limited to, information regarding the operational efficiency and accuracy of the shareholder and transfer agency services provided, staffing levels, shareholder satisfaction (as measured by external as well as internal sources), technology support, new products and services offered to Fund shareholders,
securities trading activities, portfolio valuation services, auditing services, and legal and operational compliance activities. The Board particularly noted the Advisor’s continual efforts to maintain effective business continuity plans and to address cybersecurity threats. Certain aspects of shareholder and transfer agency service level efficiency and the quality of securities trading activities are measured by independent third party providers and are presented in comparison to other fund groups not managed by the Advisor. The Board found the services provided by the Advisor to the Fund under the management agreement to be competitive and of high quality.
Costs of Services and Profitability. The Advisor provides detailed information concerning its cost of providing various services to the Fund, its profitability in managing the Fund (pre- and post-distribution), its overall profitability, and its financial condition. The Directors have reviewed with the Advisor the methodology used to prepare this financial information. This information is considered in evaluating the Advisor’s financial condition, its ability to continue to provide services under the management agreement, and the reasonableness of the current management fee. The Board concluded that the Advisor’s profits were reasonable in light of the services provided to the Fund.
Ethics. The Board generally considers the Advisor’s commitment to providing quality services to shareholders and to conducting its business ethically. They noted that the Advisor’s practices generally meet or exceed industry best practices.
Economies of Scale. The Board also reviewed information provided by the Advisor regarding the possible existence of economies of scale in connection with the management of the Fund. The Board concluded that economies of scale are difficult to measure and predict with precision, especially on a fund-by-fund basis. The Board concluded that the Advisor is appropriately sharing economies of scale through its competitive fee structure, offering competitive fees from fund inception, and through reinvestment in its business to provide shareholders additional content and services.
Comparison to Other Funds’ Fees. The management agreement provides that the Fund pays the Advisor a single, all-inclusive (or unified) management fee for providing all services necessary for the management and operation of the Fund, other than brokerage expenses, expenses attributable to short sales, taxes, interest, extraordinary expenses, and the fees and expenses of the Fund’s independent Directors (including their independent legal counsel) and expenses incurred in connection with the provision of shareholder services and distribution services under a plan adopted pursuant to Rule 12b-1 under the 1940 Act. Under the unified fee structure, the Advisor is responsible for providing all investment advisory, custody, audit, administrative, compliance, recordkeeping, marketing and shareholder services, or arranging and supervising third parties to provide such services. By contrast, most other funds are charged a variety of fees, including an investment advisory fee, a transfer agency fee, an administrative fee, distribution charges, and other expenses. Other than their investment advisory fees and any applicable Rule 12b-1 distribution fees, all other components of the total fees charged by these other funds may be increased without shareholder approval. The Board believes the unified fee structure is a benefit to Fund shareholders because it clearly discloses to shareholders the cost of owning Fund shares, and, since the unified fee cannot be increased without a vote of Fund shareholders, it shifts to the Advisor the risk of increased costs of operating the Fund and provides a direct incentive to minimize administrative inefficiencies. Part of the Board’s analysis of fee levels involves reviewing certain evaluative data compiled by an independent provider comparing the Fund’s unified fee to the total expense ratios of its peers. The unified fee charged to shareholders of the Fund was above the median of the total expense ratios of the Fund’s peer expense universe. The Board concluded that the management fee paid by the Fund to the Advisor under the management agreement is reasonable in light of the services provided to the Fund.
Comparison to Fees and Services Provided to Other Clients of the Advisor. The Directors also requested and received information from the Advisor concerning the nature of the services, fees, costs, and profitability of its advisory services to advisory clients other than the Fund. They observed that these varying types of client accounts require different services and involve different
regulatory and entrepreneurial risks than the management of the Fund. The Board analyzed this information and concluded that the fees charged and services provided to the Fund were reasonable by comparison.
Payments to Intermediaries. The Directors also requested and received a description of payments made to intermediaries by the Fund and the Advisor. These payments include various payments made by the Fund or the Advisor to different types of intermediaries and recordkeepers for distribution and service activities provided for the Fund. The Board received confirmation from the Advisor that all such payments by the Fund intended for distribution were made pursuant to the Fund's 12b-1 Plan. The Board reviewed such information and found the payments to be reasonable in scope and purpose.
Collateral or “Fall-Out” Benefits Derived by the Advisor. The Board considered the existence of collateral benefits the Advisor may receive as a result of its relationship with the Fund. They concluded that the Advisor’s primary business is managing mutual funds and it generally does not use fund or shareholder information to generate profits in other lines of business, and therefore does not derive any significant collateral benefits from them. The Board noted that additional assets from other clients may offer the Advisor some benefit from increased leverage with service providers and counterparties. Additionally, the Advisor receives proprietary research from broker-dealers that execute fund portfolio transactions, which the Board concluded is likely to benefit other clients of the Advisor, as well as Fund shareholders. The Board also determined that the Advisor is able to provide investment management services to certain clients other than the Fund, at least in part, due to its existing infrastructure built to serve the fund complex. The Board concluded that appropriate allocation methodologies had been employed to assign resources and the cost of those resources to these other clients and, where expressly provided, these other client assets may be included with the assets of the Fund to determine breakpoints in the management fee schedule.
Existing Relationship. The Board also considered whether there was any reason for not continuing the existing arrangement with the Advisor. In this regard, the Board was mindful of the potential disruptions of the Fund’s operations and various risks, uncertainties, and other effects that could occur as a result of a decision not to continue such relationship. In particular, the Board recognized that most shareholders have invested in the Fund on the strength of the Advisor’s industry standing and reputation and in the expectation that the Advisor will have a continuing role in providing advisory services to the Fund.
Conclusion of the Directors. As a result of this process, the Board, including all of the independent Directors, taking into account all of the factors discussed above and the information provided by the Advisor and others in connection with its review and throughout the year, determined that the management fee is fair and reasonable in light of the services provided and that the investment management agreement between the Fund and the Advisor should be renewed.
Retirement Account Information
As required by law, distributions you receive from certain IRAs are subject to federal income tax withholding, unless you elect not to have withholding apply. Tax will be withheld on the total amount withdrawn even though you may be receiving amounts that are not subject to withholding, such as nondeductible contributions. In such case, excess amounts of withholding could occur. You may adjust your withholding election so that a greater or lesser amount will be withheld.
If you don’t want us to withhold on this amount, you must notify us to not withhold the federal income tax. You may notify us in writing or in certain situations by telephone or through other electronic means. For systematic withdrawals, your withholding election will remain in effect until revoked or changed by filing a new election. You have the right to revoke your election at any time.
Remember, even if you elect not to have income tax withheld, you are liable for paying income tax on the taxable portion of your withdrawal. If you elect not to have income tax withheld or you don’t have enough income tax withheld, you may be responsible for payment of estimated tax. You may incur penalties under the estimated tax rules if your withholding and estimated tax payments are not sufficient. You can reduce or defer the income tax on a distribution by directly or indirectly rolling such distribution over to another IRA or eligible plan. You should consult your tax advisor for additional information.
State tax will be withheld if, at the time of your distribution, your address is within one of the mandatory withholding states and you have federal income tax withheld (or as otherwise required by state law). State taxes will be withheld from your distribution in accordance with the respective state rules.
Distributions you receive from 403(b), 457 and qualified plans are subject to special tax and withholding rules. Your plan administrator or plan sponsor is required to provide you with a special tax notice explaining those rules at the time you request a distribution. If applicable, federal and/or state taxes may be withheld from your distribution amount.
Proxy Voting Policies
A description of the policies that the fund's investment advisor uses in exercising the voting rights associated with the securities purchased and/or held by the fund is available without charge, upon request, by calling 1-800-345-2021. It is also available on the "About Us" page of American Century Investments’ website at americancentury.com and on the Securities and Exchange Commission’s website at sec.gov. Information regarding how the investment advisor voted proxies relating to portfolio securities during the most recent 12-month period ended June 30 is available on the "About Us" page at americancentury.com. It is also available at sec.gov.
Quarterly Portfolio Disclosure
The fund files its complete schedule of portfolio holdings with the Securities and Exchange Commission (SEC) for the first and third quarters of each fiscal year on Form N-Q. The fund’s Forms N-Q are available on the SEC’s website at sec.gov, and may be reviewed and copied at the SEC’s Public Reference Room in Washington, DC. Information on the operation of the Public Reference Room may be obtained by calling 1-800-SEC-0330. The fund also makes its complete schedule of portfolio holdings for the most recent quarter of its fiscal year available on its website at americancentury.com and, upon request, by calling 1-800-345-2021.
Other Tax Information
The following information is provided pursuant to provisions of the Internal Revenue Code.
The fund hereby designates up to the maximum amount allowable as qualified dividend income for the fiscal year ended October 31, 2016.
For corporate taxpayers, the fund hereby designates $45,232, or up to the maximum amount allowable, of ordinary income distributions paid during the fiscal year ended October 31, 2016 as qualified for the corporate dividends received deduction.
|
| | |
| |
| | | |
| Contact Us | americancentury.com | |
| Automated Information Line | 1-800-345-8765 | |
| Investor Services Representative | 1-800-345-2021 or 816-531-5575 | |
| Investors Using Advisors | 1-800-378-9878 | |
| Business, Not-For-Profit, Employer-Sponsored Retirement Plans | 1-800-345-3533 | |
| Banks and Trust Companies, Broker-Dealers, Financial Professionals, Insurance Companies | 1-800-345-6488 | |
| Telecommunications Relay Service for the Deaf | 711 | |
| | | |
| American Century Capital Portfolios, Inc. | |
| | | |
Investment Advisor: American Century Investment Management, Inc. Kansas City, Missouri | |
| | | |
| This report and the statements it contains are submitted for the general information of our shareholders. The report is not authorized for distribution to prospective investors unless preceded or accompanied by an effective prospectus. | |
| | | |
©2016 American Century Proprietary Holdings, Inc. All rights reserved.
CL-ANN-90988 1612 | |
|
| |
| | |
| | Annual Report |
| | |
| | October 31, 2016 |
| | |
| | Real Estate Fund |
|
| | |
| President’s Letter | 2 |
|
| Performance | 3 |
|
| Portfolio Commentary | |
|
| Fund Characteristics | |
|
| Shareholder Fee Example | |
|
| Schedule of Investments | |
|
| Statement of Assets and Liabilities | |
|
| Statement of Operations | |
|
| Statement of Changes in Net Assets | |
|
| Notes to Financial Statements | |
|
| Financial Highlights | |
|
| Report of Independent Registered Public Accounting Firm | |
|
| Management | |
|
| Approval of Management Agreement | |
|
| Additional Information | |
|
Any opinions expressed in this report reflect those of the author as of the date of the report, and do not necessarily represent the opinions of American Century Investments® or any other person in the American Century Investments organization. Any such opinions are subject to change at any time based upon market or other conditions and American Century Investments disclaims any responsibility to update such opinions. These opinions may not be relied upon as investment advice and, because investment decisions made by American Century Investments funds are based on numerous factors, may not be relied upon as an indication of trading intent on behalf of any American Century Investments fund. Security examples are used for representational purposes only and are not intended as recommendations to purchase or sell securities. Performance information for comparative indices and securities is provided to American Century Investments by third party vendors. To the best of American Century Investments’ knowledge, such information is accurate at the time of printing.
Jonathan Thomas
Dear Investor:
Thank you for reviewing this annual report for the period ended October 31, 2016. It provides investment performance and portfolio information, plus longer-term historical performance data. Annual reports help convey important information about fund returns, including market factors that affected performance during the reporting period. For additional, updated investment and market insights, we encourage you to visit our website, americancentury.com.
Central Bank Stimulus Boosted the Markets After Big Bouts of Volatility
The mostly positive returns for the full reporting period do not capture the short-term market volatility investors experienced at various times. Most broad stock and bond benchmarks posted gains, despite an interest rate increase by the Federal Reserve (Fed) in December 2015, extreme market volatility in early 2016 from global contagion concerns about China’s economic deceleration and currency devaluations, and more turmoil in June 2016 triggered by the unexpected U.K. vote to exit the European Union (Brexit).
Each big bout of financial market volatility was followed by another shot of monetary policy stimulus from central banks. Or, in the case of the Fed, delays in further interest rate increases. This stabilized the financial markets, and generally boosted their performance. The rising tide of monetary stimulus lifted most investment boats, including both stock and bond vehicles, which was unusual. Illustrating this phenomenon, the S&P 500 Index and the Bloomberg Barclays U.S. Aggregate Bond Index posted nearly equal performance, advancing 4.51% and 4.37%, respectively, for the 12 months. Global bond and real estate investment trust (REIT) indices exceeded that performance, while U.S. growth stock indices lagged; U.S. value equity generally outperformed U.S. growth.
The reporting period ended before the November 2016 U.S. presidential election, which, like Brexit, featured a surprising outcome with potentially far-reaching populist and anti-globalization ramifications that are still unfolding and being assessed. What we do know is that Donald Trump and his policy proposals face a deeply divided nation and add another layer of uncertainty to the global economic and market outlook, which could trigger further bouts of short-term volatility. In this challenging investment environment, we strongly believe in staying the course and remaining focused on longer-term goals, using disciplined, actively managed, diversified, risk-aware strategies. We appreciate your continued trust in us.
Sincerely,
Jonathan Thomas
President and Chief Executive Officer
American Century Investments
|
| | | | | | |
| Total Returns as of October 31, 2016 |
| | | | Average Annual Returns | |
| | Ticker Symbol | 1 year | 5 years | 10 years | Since Inception | Inception Date |
| Investor Class | REACX | 6.19% | 10.82% | 4.03% | — | 9/21/95 |
| MSCI U.S. REIT Index | — | 6.81% | 11.38% | 4.95% | — | — |
| S&P 500 Index | — | 4.51% | 13.55% | 6.69% | — | — |
| Institutional Class | REAIX | 6.40% | 11.04% | 4.24% | — | 6/16/97 |
| A Class | AREEX | | | | | 10/6/98 |
| No sales charge | | 5.92% | 10.54% | 3.77% | — | |
| With sales charge | | -0.17% | 9.24% | 3.16% | — | |
| C Class | ARYCX | 5.10% | 9.71% | — | 3.45% | 9/28/07 |
| R Class | AREWX | 5.64% | 10.27% | — | 3.96% | 9/28/07 |
| R6 Class | AREDX | 6.57% | — | — | 8.92% | 7/26/13 |
Average annual returns since inception are presented when ten years of performance history is not available.
Prior to September 4, 2007, the A Class was referred to as the Advisor Class and did not have a front-end sales charge. Performance prior to that date has been adjusted to reflect this charge.
The Investor Class date is the inception date for RREEF Real Estate Securities Fund, Real Estate's predecessor. That fund merged with Real Estate on June 13, 1997 and Real Estate was first offered to the public on June 16, 1997.
Sales charges include initial sales charges and contingent deferred sales charges (CDSCs), as applicable. A Class shares have a 5.75% maximum initial sales charge and may be subject to a maximum CDSC of 1.00%. C Class shares redeemed within 12 months of purchase are subject to a maximum CDSC of 1.00%. The SEC requires that mutual funds provide performance information net of maximum sales charges in all cases where charges could be applied.
Data presented reflect past performance. Past performance is no guarantee of future results. Current performance may be higher or lower than the performance shown. Total returns for periods less than one year are not annualized. Investment return and principal value will fluctuate, and redemption value may be more or less than original cost. Data assumes reinvestment of dividends and capital gains, and none of the charts reflect the deduction of taxes that a shareholder would pay on fund distributions or the redemption of fund shares. To obtain performance data current to the most recent month end, please call 1-800-345-2021 or visit americancentury.com. For additional information about the fund, please consult the prospectus.
|
|
| Growth of $10,000 Over 10 Years |
| $10,000 investment made October 31, 2006 |
| Performance for other share classes will vary due to differences in fee structure. |
|
| |
| Value on October 31, 2016 |
| | Investor Class — $14,856 |
| |
| | MSCI U.S. REIT Index — $16,222 |
| |
| | S&P 500 Index — $19,124 |
| |
|
| | | | | |
| Total Annual Fund Operating Expenses | |
| Investor Class | Institutional Class | A Class | C Class | R Class | R6 Class |
| 1.14% | 0.94% | 1.39% | 2.14% | 1.64% | 0.79% |
The total annual fund operating expenses shown is as stated in the fund’s prospectus current as of the date of this report. The prospectus may vary from the expense ratio shown elsewhere in this report because it is based on a different time period, includes acquired fund fees and expenses, and, if applicable, does not include fee waivers or expense reimbursements.
Data presented reflect past performance. Past performance is no guarantee of future results. Current performance may be higher or lower than the performance shown. Total returns for periods less than one year are not annualized. Investment return and principal value will fluctuate, and redemption value may be more or less than original cost. Data assumes reinvestment of dividends and capital gains, and none of the charts reflect the deduction of taxes that a shareholder would pay on fund distributions or the redemption of fund shares. To obtain performance data current to the most recent month end, please call 1-800-345-2021 or visit americancentury.com. For additional information about the fund, please consult the prospectus.
Portfolio Managers: Steven Brown and Steven Rodriguez
Performance Summary
Real Estate returned 6.19%* for the fiscal year ended October 31, 2016. By comparison, the MSCI U.S. REIT Index (the fund’s benchmark) returned 6.81%, while the S&P 500 Index (a broad stock market measure) returned 4.51%.
REIT Market Overview
Real estate investment trusts (REITs) advanced for the 12-month period, outpacing the gains of the broad U.S. equity indices. After a brief decline early in the period, REITs rallied sharply through the end of July 2016, benefiting from strong fundamentals as demand outpaced supply in most property sectors. In addition, declining interest rates—especially in the wake of the affirmative vote for “Brexit,” the U.K. referendum to leave the European Union—reduced borrowing costs for REITs and made their dividend yields more attractive. Over the last three months of the period, however, REITs reversed course as expectations of an interest rate increase by the U.S. Federal Reserve (the Fed) before year-end and uncertainty surrounding the outcome of the U.S. presidential election put downward pressure on the REIT sector.
During the reporting period, real estate stocks were reclassified and elevated within the Global Industry Classification Standard (GICS), one of the leading stock market classification systems. Previously, GICS classified stocks into ten different market sectors; real estate stocks had been included within the financials sector. However, effective August 31, 2016, real estate was broken out from the financials sector and became the eleventh sector in the GICS system. We believe this change affirms real estate as a distinct and relevant asset class and raises the overall visibility of the real estate sector.
Overall, REITs returned approximately 7% for the 12-month period. From a sector perspective, industrial REITs generated the strongest returns thanks to robust demand for industrial space. Other top-performing sectors included health care REITs, which benefited from falling interest rates, and diversified REITs, led by technology REITs that enjoyed strong leasing demand for data centers, particularly from cloud computing providers. The only two sectors to decline during the period were self-storage and lodging REITs. Self-storage REITs fell as renter fatigue led to moderating demand for storage facilities, while weak business and leisure travel weighed on lodging and resort REITs.
Health Care and Retail Detracted
The fund’s underperformance of its benchmark for the fiscal year resulted primarily from an underweight position in health care REITs and stock selection among retail REITs. The underweight position in health care reflected our concerns about the interest rate sensitivity of the sector and poor fundamentals, particularly an above-average supply of senior housing. Consequently, the fund benefited less from the rally in health care REITs compared with the benchmark index.
* All fund returns referenced in this commentary are for Investor Class shares. Performance for other share classes will vary due to differences in fee structure; when Investor Class performance exceeds that of the fund’s benchmark, other share classes may not. See page 3 for returns for all share classes.
In the retail sector, several of the fund’s regional mall holdings detracted meaningfully from relative performance, including General Growth Properties and Simon Property Group. Continued weakness in consumer spending weighed on the performance of both stocks, as did concerns about the growth of e-commerce and its impact on brick-and-mortar retailers, particularly in light of declining sales at department stores.
Technology and Industrial/Office REITs Added Value
An overweight position in mixed industrial/office REITs and stock selection among diversified REITs contributed positively to relative performance. The portfolio’s exposure to REITs with logistics expertise—particularly Prologis, Duke Realty, and Liberty Property Trust—added value during the period. All three stocks benefited from increased demand from companies with rapidly growing e-commerce operations.
An emphasis on technology REITs—particularly data center REITs Equinix and Digital Realty
Trust—aided fund performance during the period. Both stocks benefited from strong demand for data center leasing space from cloud computing providers to meet their growing capacity needs. We reduced the fund’s exposure to these two stocks after their strong performance, but they remained among the fund’s top ten holdings as of the end of the reporting period.
Another notable contributor was triple-net-lease REIT STORE Capital, which owns stand-alone, single-tenant properties. Falling interest rates allowed STORE Capital to reduce its cost of capital, leading to accelerating earnings growth during the period.
Outlook
The current U.S. economic environment—with a moderate level of economic growth, low inflation, and low interest rates—is likely to remain in place over the near term, which should continue to provide a tailwind for REIT performance. Although the Fed is expected to raise short-term interest rates by the end of the year, we believe the Fed will continue to normalize interest rates at a measured pace.
Several developing trends have emerged in the REIT market. Geographically, we see more signs of strength in non-coastal markets, such as the Midwest and the Sun Belt. We have also seen increases in REIT leadership changes and asset spin-offs in recent months, both of which present strategic investment opportunities. Finally, many REITs have been strengthening their balance sheets, often by using proceeds from asset sales and/or equity issuance to pay down debt.
Within the portfolio, we are maintaining overweight positions in the industrial/office and residential sectors. The industrial sector remains poised to benefit from the continuation of rapid growth in e-commerce, while the attraction in the residential sector is single-family rental housing, which offers attractive rental rates versus apartments and should benefit from continued strength in the single-family housing market. REITs with an emphasis on technology also remain an overweight position in the portfolio. In contrast, the health care sector remains an underweight position as the sector continues to face a weaker fundamental outlook.
|
| |
| OCTOBER 31, 2016 | |
| Top Ten Holdings | % of net assets |
| Simon Property Group, Inc. | 6.9% |
| Prologis, Inc. | 5.3% |
| Equinix, Inc. | 4.8% |
| Public Storage | 3.7% |
| Vornado Realty Trust | 3.7% |
| AvalonBay Communities, Inc. | 3.2% |
| Digital Realty Trust, Inc. | 3.2% |
| Alexandria Real Estate Equities, Inc. | 3.1% |
| Apartment Investment & Management Co., Class A | 3.1% |
| HCP, Inc. | 3.0% |
| | |
| Sub-Industry Allocation | % of net assets |
| Retail REITs | 19.3% |
| Residential REITs | 17.0% |
| Specialized REITs | 17.0% |
| Office REITs | 12.2% |
| Diversified REITs | 11.7% |
| Health Care REITs | 10.4% |
| Industrial REITs | 8.2% |
| Hotel and Resort REITs | 2.3% |
| Hotels, Resorts and Cruise Lines | 1.1% |
| Cash and Equivalents* | 0.8% |
| *Includes temporary cash investments and other assets and liabilities. | |
| | |
| Types of Investments in Portfolio | % of net assets |
| Common Stocks | 99.2% |
| Temporary Cash Investments | 0.3% |
| Other Assets and Liabilities | 0.5% |
Fund shareholders may incur two types of costs: (1) transaction costs, including sales charges (loads) on purchase payments and redemption/exchange fees; and (2) ongoing costs, including management fees; distribution and service (12b-1) fees; and other fund expenses. This example is intended to help you understand your ongoing costs (in dollars) of investing in your fund and to compare these costs with the ongoing cost of investing in other mutual funds.
The example is based on an investment of $1,000 made at the beginning of the period and held for the entire period from May 1, 2016 to October 31, 2016.
Actual Expenses
The table provides information about actual account values and actual expenses for each class. You may use the information, together with the amount you invested, to estimate the expenses that you paid over the period. First, identify the share class you own. Then simply divide your account value by $1,000 (for example, an $8,600 account value divided by $1,000 = 8.6), then multiply the result by the number under the heading “Expenses Paid During Period” to estimate the expenses you paid on your account during this period.
If you hold Investor Class shares of any American Century Investments fund, or Institutional Class shares of the American Century Diversified Bond Fund, in an American Century Investments account (i.e., not a financial intermediary or retirement plan account), American Century Investments may charge you a $12.50 semiannual account maintenance fee if the value of those shares is less than $10,000. We will redeem shares automatically in one of your accounts to pay the $12.50 fee. In determining your total eligible investment amount, we will include your investments in all personal accounts (including American Century Investments Brokerage accounts) registered under your Social Security number. Personal accounts include individual accounts, joint accounts, UGMA/UTMA accounts, personal trusts, Coverdell Education Savings Accounts and IRAs (including traditional, Roth, Rollover, SEP-, SARSEP- and SIMPLE-IRAs), and certain other retirement accounts. If you have only business, business retirement, employer-sponsored or American Century Investments Brokerage accounts, you are currently not subject to this fee. If you are subject to the Account Maintenance Fee, your account value could be reduced by the fee amount.
Hypothetical Example for Comparison Purposes
The table also provides information about hypothetical account values and hypothetical expenses based on the actual expense ratio of each class of your fund and an assumed rate of return of 5% per year before expenses, which is not the actual return of a fund’s share class. The hypothetical account values and expenses may not be used to estimate the actual ending account balance or expenses you paid for the period. You may use this information to compare the ongoing costs of investing in your fund and other funds. To do so, compare this 5% hypothetical example with the 5% hypothetical examples that appear in the shareholder reports of the other funds.
Please note that the expenses shown in the table are meant to highlight your ongoing costs only and do not reflect any transactional costs, such as sales charges (loads) or redemption/exchange fees. Therefore, the table is useful in comparing ongoing costs only, and will not help you determine the relative total costs of owning different funds. In addition, if these transactional costs were included, your costs would have been higher.
|
| | | | |
| Beginning
Account Value
5/1/16 | Ending
Account Value
10/31/16 | Expenses Paid
During Period(1)
5/1/16 - 10/31/16 |
Annualized
Expense Ratio(1) |
| Actual | | | | |
| Investor Class | $1,000 | $1,021.00 | $5.79 | 1.14% |
| Institutional Class | $1,000 | $1,022.00 | $4.78 | 0.94% |
| A Class | $1,000 | $1,019.70 | $7.06 | 1.39% |
| C Class | $1,000 | $1,015.60 | $10.84 | 2.14% |
| R Class | $1,000 | $1,018.10 | $8.32 | 1.64% |
| R6 Class | $1,000 | $1,022.80 | $4.02 | 0.79% |
| Hypothetical | | | | |
| Investor Class | $1,000 | $1,019.41 | $5.79 | 1.14% |
| Institutional Class | $1,000 | $1,020.41 | $4.77 | 0.94% |
| A Class | $1,000 | $1,018.15 | $7.05 | 1.39% |
| C Class | $1,000 | $1,014.38 | $10.84 | 2.14% |
| R Class | $1,000 | $1,016.89 | $8.31 | 1.64% |
| R6 Class | $1,000 | $1,021.17 | $4.01 | 0.79% |
| |
| (1) | Expenses are equal to the class's annualized expense ratio listed in the table above, multiplied by the average account value over the period, multiplied by 184, the number of days in the most recent fiscal half-year, divided by 366, to reflect the one-half year period. |
OCTOBER 31, 2016
|
| | | | | |
| | Shares | Value |
| COMMON STOCKS — 99.2% | | |
| Diversified REITs — 11.7% | | |
| Empire State Realty Trust, Inc. | 1,119,881 |
| $ | 21,916,071 |
|
| Forest City Realty Trust, Inc. | 677,623 |
| 14,629,881 |
|
| Gramercy Property Trust | 2,074,125 |
| 19,123,433 |
|
| Liberty Property Trust | 672,129 |
| 27,174,175 |
|
| Spirit Realty Capital, Inc. | 2,104,756 |
| 25,067,644 |
|
| STORE Capital Corp. | 1,413,556 |
| 38,575,943 |
|
| VEREIT, Inc. | 2,182,740 |
| 20,517,756 |
|
| | | 167,004,903 |
|
| Health Care REITs — 10.4% | | |
| HCP, Inc. | 1,382,970 |
| 43,300,790 |
|
| Medical Properties Trust, Inc. | 1,114,301 |
| 15,533,356 |
|
| Physicians Realty Trust | 1,328,836 |
| 26,271,088 |
|
Quality Care Properties, Inc.(1)(2) | 276,594 |
| 4,245,718 |
|
| Ventas, Inc. | 530,473 |
| 35,939,546 |
|
| Welltower, Inc. | 339,893 |
| 23,292,867 |
|
| | | 148,583,365 |
|
| Hotel and Resort REITs — 2.3% | | |
| Host Hotels & Resorts, Inc. | 1,438,586 |
| 22,269,311 |
|
| Sunstone Hotel Investors, Inc. | 869,107 |
| 10,915,984 |
|
| | | 33,185,295 |
|
| Hotels, Resorts and Cruise Lines — 1.1% | | |
| Hilton Worldwide Holdings, Inc. | 703,568 |
| 15,900,637 |
|
| Industrial REITs — 8.2% | | |
| Duke Realty Corp. | 1,578,342 |
| 41,273,643 |
|
| Prologis, Inc. | 1,446,234 |
| 75,435,566 |
|
| | | 116,709,209 |
|
| Office REITs — 12.2% | | |
| Alexandria Real Estate Equities, Inc. | 415,171 |
| 44,759,586 |
|
| Boston Properties, Inc. | 176,261 |
| 21,235,925 |
|
| Douglas Emmett, Inc. | 490,642 |
| 17,908,433 |
|
| Hudson Pacific Properties, Inc. | 567,236 |
| 19,070,474 |
|
| Mack-Cali Realty Corp. | 713,052 |
| 18,311,175 |
|
| Vornado Realty Trust | 574,533 |
| 53,305,172 |
|
| | | 174,590,765 |
|
| Residential REITs — 17.0% | | |
| American Campus Communities, Inc. | 372,129 |
| 19,391,642 |
|
| American Homes 4 Rent | 1,192,806 |
| 25,180,135 |
|
| Apartment Investment & Management Co., Class A | 1,003,320 |
| 44,216,312 |
|
| AvalonBay Communities, Inc. | 270,564 |
| 46,315,146 |
|
| Camden Property Trust | 258,160 |
| 21,024,550 |
|
| Colony Starwood Homes | 484,748 |
| 14,062,539 |
|
| Education Realty Trust, Inc. | 295,092 |
| 12,567,968 |
|
| Equity LifeStyle Properties, Inc. | 252,999 |
| 19,187,444 |
|
| Equity Residential | 489,146 |
| 30,204,766 |
|
|
| | | | | |
| | Shares | Value |
| Essex Property Trust, Inc. | 55,385 |
| $ | 11,857,375 |
|
| | | 244,007,877 |
|
| Retail REITs — 19.3% | | |
| Acadia Realty Trust | 595,185 |
| 20,051,783 |
|
| Brixmor Property Group, Inc. | 1,691,540 |
| 42,998,947 |
|
| Equity One, Inc. | 700,297 |
| 19,958,464 |
|
| General Growth Properties, Inc. | 1,294,597 |
| 32,300,195 |
|
| Retail Properties of America, Inc. | 1,717,477 |
| 26,741,117 |
|
| Simon Property Group, Inc. | 534,003 |
| 99,303,198 |
|
| Taubman Centers, Inc. | 214,848 |
| 15,567,886 |
|
| Urban Edge Properties | 747,345 |
| 19,288,974 |
|
| | | 276,210,564 |
|
| Specialized REITs — 17.0% | | |
| American Tower Corp. | 225,081 |
| 26,377,242 |
|
| CubeSmart | 636,368 |
| 16,590,114 |
|
| CyrusOne, Inc. | 365,056 |
| 16,285,148 |
|
| Digital Realty Trust, Inc. | 494,435 |
| 46,195,062 |
|
| Equinix, Inc. | 194,022 |
| 69,320,180 |
|
| Extra Space Storage, Inc. | 212,883 |
| 15,572,392 |
|
| Public Storage | 250,758 |
| 53,592,000 |
|
| | | 243,932,138 |
|
TOTAL COMMON STOCKS
(Cost $1,207,839,879) | | 1,420,124,753 |
|
| TEMPORARY CASH INVESTMENTS — 0.3% | | |
| Repurchase Agreement, Fixed Income Clearing Corp., (collateralized by various U.S. Treasury obligations, 3.00%, 11/15/45, valued at $4,149,306), at 0.10%, dated 10/31/16, due 11/1/16 (Delivery value $4,063,011) | | 4,063,000 |
|
| State Street Institutional U.S. Government Money Market Fund, Premier Class | 15,669 |
| 15,669 |
|
TOTAL TEMPORARY CASH INVESTMENTS
(Cost $4,078,669) | | 4,078,669 |
|
TOTAL INVESTMENT SECURITIES — 99.5%
(Cost $1,211,918,548) | | 1,424,203,422 |
|
| OTHER ASSETS AND LIABILITIES — 0.5% | | 7,143,257 |
|
| TOTAL NET ASSETS — 100.0% | | $ | 1,431,346,679 |
|
|
| | |
| NOTES TO SCHEDULE OF INVESTMENTS |
| |
| (1) | When-issued security. The issue price and yield are fixed on the date of the commitment, but payment and delivery are scheduled for a future date. |
See Notes to Financial Statements.
|
|
| Statement of Assets and Liabilities |
|
| | | |
| OCTOBER 31, 2016 | |
| Assets | |
| Investment securities, at value (cost of $1,211,918,548) | $ | 1,424,203,422 |
|
| Receivable for investments sold | 13,782,412 |
|
| Receivable for capital shares sold | 1,136,364 |
|
| Dividends and interest receivable | 116,065 |
|
| | 1,439,238,263 |
|
| | |
| Liabilities | |
| Payable for investments purchased | 4,133,416 |
|
| Payable for capital shares redeemed | 2,373,307 |
|
| Accrued management fees | 1,328,928 |
|
| Distribution and service fees payable | 55,933 |
|
| | 7,891,584 |
|
| | |
| Net Assets | $ | 1,431,346,679 |
|
| | |
| Net Assets Consist of: | |
| Capital (par value and paid-in surplus) | $ | 1,132,208,947 |
|
| Undistributed net realized gain | 86,852,858 |
|
| Net unrealized appreciation | 212,284,874 |
|
| | $ | 1,431,346,679 |
|
|
| | | | | | |
| | Net Assets | Shares Outstanding | Net Asset Value Per Share |
| Investor Class, $0.01 Par Value |
| $909,920,904 |
| 29,644,422 |
| $30.69 |
| Institutional Class, $0.01 Par Value |
| $183,180,808 |
| 5,954,051 |
| $30.77 |
| A Class, $0.01 Par Value |
| $153,280,635 |
| 4,993,497 |
| $30.70* |
| C Class, $0.01 Par Value |
| $15,985,788 |
| 529,661 |
| $30.18 |
| R Class, $0.01 Par Value |
| $19,112,234 |
| 625,550 |
| $30.55 |
| R6 Class, $0.01 Par Value |
| $149,866,310 |
| 4,872,505 |
| $30.76 |
*Maximum offering price $32.57 (net asset value divided by 0.9425).
See Notes to Financial Statements.
|
| | | |
| YEAR ENDED OCTOBER 31, 2016 | |
| Investment Income (Loss) | |
| Income: | |
| Dividends | $ | 37,000,940 |
|
| Interest | 18,359 |
|
| | 37,019,299 |
|
| | |
| Expenses: | |
| Management fees | 16,047,935 |
|
| Distribution and service fees: | |
| A Class | 431,558 |
|
| C Class | 168,968 |
|
| R Class | 88,489 |
|
| Directors' fees and expenses | 52,282 |
|
| Other expenses | 12,807 |
|
| | 16,802,039 |
|
| | |
| Net investment income (loss) | 20,217,260 |
|
| | |
| Realized and Unrealized Gain (Loss) | |
| Net realized gain (loss) on investment transactions | 286,060,761 |
|
| Change in net unrealized appreciation (depreciation) on investments | (216,694,822 | ) |
| | |
| Net realized and unrealized gain (loss) | 69,365,939 |
|
| | |
| Net Increase (Decrease) in Net Assets Resulting from Operations | $ | 89,583,199 |
|
See Notes to Financial Statements.
|
|
| Statement of Changes in Net Assets |
|
| | | | | | |
| YEARS ENDED OCTOBER 31, 2016 AND OCTOBER 31, 2015 |
| Increase (Decrease) in Net Assets | October 31, 2016 | October 31, 2015 |
| Operations | | |
| Net investment income (loss) | $ | 20,217,260 |
| $ | 22,893,558 |
|
| Net realized gain (loss) | 286,060,761 |
| 140,383,346 |
|
| Change in net unrealized appreciation (depreciation) | (216,694,822) |
| (61,602,845) |
|
| Net increase (decrease) in net assets resulting from operations | 89,583,199 |
| 101,674,059 |
|
| | | |
| Distributions to Shareholders | | |
| From net investment income: | | |
| Investor Class | (25,017,182) |
| (18,881,364) |
|
| Institutional Class | (4,951,723) |
| (5,994,221) |
|
| A Class | (4,192,021) |
| (2,938,676) |
|
| C Class | (301,538) |
| (169,883) |
|
| R Class | (362,169) |
| (151,917) |
|
| R6 Class | (5,556,657) |
| (2,301,700 | ) |
| Decrease in net assets from distributions | (40,381,290) |
| (30,437,761) |
|
| | | |
| Capital Share Transactions | | |
| Net increase (decrease) in net assets from capital share transactions (Note 5) | (85,497,715 | ) | (246,440,506) |
|
| | | |
| Net increase (decrease) in net assets | (36,295,806) |
| (175,204,208) |
|
| | | |
| Net Assets | | |
| Beginning of period | 1,467,642,485 |
| 1,642,846,693 |
|
| End of period | $ | 1,431,346,679 |
| $ | 1,467,642,485 |
|
| | | |
See Notes to Financial Statements.
|
|
| Notes to Financial Statements |
OCTOBER 31, 2016
1. Organization
American Century Capital Portfolios, Inc. (the corporation) is registered under the Investment Company Act of 1940, as amended (the 1940 Act), as an open-end management investment company and is organized as a Maryland corporation. Real Estate Fund (the fund) is one fund in a series issued by the corporation. The fund’s investment objective is to seek high total investment return through a combination of capital appreciation and current income.
The fund offers the Investor Class, the Institutional Class, the A Class, the C Class, the R Class and the R6 Class. The A Class may incur an initial sales charge. The A Class and C Class may be subject to a contingent deferred sales charge. The share classes differ principally in their respective sales charges and distribution and shareholder servicing expenses and arrangements. The Institutional Class and R6 Class shareholders do not require the same level of shareholder and administrative services from American Century Investment Management, Inc. (ACIM) (the investment advisor) as shareholders of other classes. In addition, financial intermediaries do not receive any service, distribution or administrative fees for the R6 Class. As a result, the Institutional Class and R6 Class are charged lower unified management fees.
2. Significant Accounting Policies
The following is a summary of significant accounting policies consistently followed by the fund in preparation of its financial statements. The fund is an investment company and follows accounting and reporting guidance in accordance with accounting principles generally accepted in the United States of America. This may require management to make certain estimates and assumptions at the date of the financial statements. Actual results could differ from these estimates. Management evaluated the impact of events or transactions occurring through the date the financial statements were issued that would merit recognition or disclosure.
Investment Valuations — The fund determines the fair value of its investments and computes its net asset value per share at the close of regular trading (usually 4 p.m. Eastern time) on the New York Stock Exchange (NYSE) on each day the NYSE is open. The Board of Directors has adopted valuation policies and procedures to guide the investment advisor in the fund’s investment valuation process and to provide methodologies for the oversight of the fund’s pricing function.
Equity securities that are listed or traded on a domestic securities exchange are valued at the last reported sales price or at the official closing price as provided by the exchange. Equity securities traded on foreign securities exchanges are generally valued at the closing price of such securities on the exchange where primarily traded or at the close of the NYSE, if that is earlier. If no last sales price is reported, or if local convention or regulation so provides, the mean of the latest bid and asked prices may be used. Securities traded over-the-counter are valued at the mean of the latest bid and asked prices, the last sales price, or the official closing price.
Open-end management investment companies are valued at the reported net asset value per share. Repurchase agreements are valued at cost, which approximates fair value.
If the fund determines that the market price for an investment is not readily available or the valuation methods mentioned above do not reflect an investment’s fair value, such investment is valued as determined in good faith by the Board of Directors or its delegate, in accordance with policies and procedures adopted by the Board of Directors. In its determination of fair value, the fund may review several factors including, but not limited to, market information regarding the specific investment or comparable investments and correlation with other investment types, futures indices or general market indicators. Circumstances that may cause the fund to use these procedures to value an investment include, but are not limited to: an investment has been declared in default or is distressed; trading in a security has been suspended during the trading day or a security is not actively trading on its principal exchange; prices received from a regular pricing source are deemed unreliable; or there is a foreign market holiday and no trading occurred.
The fund monitors for significant events occurring after the close of an investment’s primary exchange but before the fund’s net asset value per share is determined. Significant events may include, but are not limited to: corporate announcements and transactions; governmental action and political unrest that could impact a specific investment or an investment sector; or armed conflicts, natural disasters and similar events that could
affect investments in a specific country or region. The fund also monitors for significant fluctuations between domestic and foreign markets, as evidenced by the U.S. market or such other indicators that the Board of Directors, or its delegate, deems appropriate. If significant fluctuations in foreign markets are identified, the fund may apply a model-derived factor to the closing price of equity securities traded on foreign securities exchanges. The factor is based on observable market data as provided by an independent pricing service.
Security Transactions — Security transactions are accounted for as of the trade date. Net realized gains and losses are determined on the identified cost basis, which is also used for federal income tax purposes.
Investment Income — Dividend income less foreign taxes withheld, if any, is recorded as of the ex-dividend date. Distributions received on securities that represent a return of capital or long-term capital gain are recorded as a reduction of cost of investments and/or as a realized gain. The fund may estimate the components of distributions received that may be considered nontaxable distributions or long-term capital gain distributions for income tax purposes. Interest income is recorded on the accrual basis and includes accretion of discounts and amortization of premiums.
Repurchase Agreements — The fund may enter into repurchase agreements with institutions that ACIM has determined are creditworthy pursuant to criteria adopted by the Board of Directors. The fund requires that the collateral, represented by securities, received in a repurchase transaction be transferred to the custodian in a manner sufficient to enable the fund to obtain those securities in the event of a default under the repurchase agreement. ACIM monitors, on a daily basis, the securities transferred to ensure the value, including accrued interest, of the securities under each repurchase agreement is equal to or greater than amounts owed to the fund under each repurchase agreement.
Joint Trading Account — Pursuant to an Exemptive Order issued by the Securities and Exchange Commission, the fund, along with certain other funds in the American Century Investments family of funds, may transfer uninvested cash balances into a joint trading account. These balances are invested in one or more repurchase agreements that are collateralized by U.S. Treasury or Agency obligations.
Segregated Assets — In accordance with the 1940 Act, the fund segregates assets on its books and records to cover certain types of investments, including, but not limited to, futures contracts and when-issued securities. ACIM monitors, on a daily basis, the securities segregated to ensure the fund designates a sufficient amount of liquid assets, marked-to-market daily. The fund may also receive assets or be required to pledge assets at the custodian bank or with a broker for margin requirements on futures contracts.
Income Tax Status — It is the fund’s policy to distribute substantially all net investment income and net realized gains to shareholders and to otherwise qualify as a regulated investment company under provisions of the Internal Revenue Code. Accordingly, no provision has been made for income taxes. The fund files U.S. federal, state, local and non-U.S. tax returns as applicable. The fund's tax returns are subject to examination by the relevant taxing authority until expiration of the applicable statute of limitations, which is generally three years from the date of filing but can be longer in certain jurisdictions. At this time, management believes there are no uncertain tax positions which, based on their technical merit, would not be sustained upon examination and for which it is reasonably possible that the total amounts of unrecognized tax benefits will significantly change in the next twelve months.
Multiple Class — All shares of the fund represent an equal pro rata interest in the net assets of the class to which such shares belong, and have identical voting, dividend, liquidation and other rights and the same terms and conditions, except for class specific expenses and exclusive rights to vote on matters affecting only individual classes. Income, non-class specific expenses, and realized and unrealized capital gains and losses of the fund are allocated to each class of shares based on their relative net assets.
Distributions to Shareholders — Distributions from net investment income, if any, are generally declared and paid quarterly. Distributions from net realized gains, if any, are generally declared and paid annually. The fund may elect to treat a portion of its payment to a redeeming shareholder, which represents the pro rata share of undistributed net investment income and net realized gains, as a distribution for federal income tax purposes (tax equalization).
Indemnifications — Under the corporation’s organizational documents, its officers and directors are indemnified against certain liabilities arising out of the performance of their duties to the fund. In addition, in the normal course of business, the fund enters into contracts that provide general indemnifications. The maximum exposure under these arrangements is unknown as this would involve future claims that may be made against a fund. The risk of material loss from such claims is considered by management to be remote.
3. Fees and Transactions with Related Parties
Certain officers and directors of the corporation are also officers and/or directors of American Century Companies, Inc. (ACC). The corporation’s investment advisor, ACIM, the corporation's distributor, American Century Investment Services, Inc. (ACIS), and the corporation’s transfer agent, American Century Services, LLC, are wholly owned, directly or indirectly, by ACC.
Management Fees — The corporation has entered into a management agreement with ACIM, under which ACIM provides the fund with investment advisory and management services in exchange for a single, unified management fee (the fee) per class. The agreement provides that all expenses of managing and operating the fund, except distribution and service fees, brokerage expenses, taxes, interest, fees and expenses of the independent directors (including legal counsel fees), and extraordinary expenses, will be paid by ACIM. The fee is computed and accrued daily based on each class’s daily net assets and paid monthly in arrears. The rate of the fee is determined by applying a fee rate calculation formula. This formula takes into account the fund’s assets as well as certain assets, if any, of other clients of the investment advisor outside the American Century Investments family of funds (such as subadvised funds and separate accounts) that have very similar investment teams and investment strategies (strategy assets). The annual management fee schedule ranges from 1.00% to 1.20% for the Investor Class, A Class, C Class and R Class. The annual management fee schedule ranges from 0.80% to 1.00% for the Institutional Class and 0.65% to 0.85% for the R6 Class. The effective annual management fee for each class for the year ended October 31, 2016 was 1.13% for the Investor Class, A Class, C Class and R Class, 0.93% for the Institutional Class and 0.78% for the R6 Class.
Distribution and Service Fees — The Board of Directors has adopted a separate Master Distribution and Individual Shareholder Services Plan for each of the A Class, C Class and R Class (collectively the plans), pursuant to Rule 12b-1 of the 1940 Act. The plans provide that the A Class will pay ACIS an annual distribution and service fee of 0.25%. The plans provide that the C Class will pay ACIS an annual distribution and service fee of 1.00%, of which 0.25% is paid for individual shareholder services and 0.75% is paid for distribution services. The plans provide that the R Class will pay ACIS an annual distribution and service fee of 0.50%. The fees are computed and accrued daily based on each class’s daily net assets and paid monthly in arrears. The fees are used to pay financial intermediaries for distribution and individual shareholder services. Fees incurred under the plans during the year ended October 31, 2016 are detailed in the Statement of Operations.
Directors' Fees and Expenses — The Board of Directors is responsible for overseeing the investment advisor’s management and operations of the fund. The directors receive detailed information about the fund and its investment advisor regularly throughout the year, and meet at least quarterly with management of the investment advisor to review reports about fund operations. The fund’s officers do not receive compensation from the fund.
Interfund Transactions — The fund may enter into security transactions with other American Century Investments funds and other client accounts of the investment advisor, in accordance with the 1940 Act rules and procedures adopted by the Board of Directors. The rules and procedures require, among other things, that these transactions be effected at the independent current market price of the security. During the period, the interfund purchases and sales were $2,264,285 and $13,488,194, respectively. The effect of interfund transactions on the Statement of Operations was $2,232,965 in net realized gain (loss) on investment transactions.
4. Investment Transactions
Purchases and sales of investment securities, excluding short-term investments, for the year ended October 31, 2016 were $2,220,524,943 and $2,295,388,890, respectively.
5. Capital Share Transactions
Transactions in shares of the fund were as follows:
|
| | | | | | | | | | |
| | Year ended
October 31, 2016 | Year ended
October 31, 2015 |
| | Shares | Amount | Shares | Amount |
| Investor Class/Shares Authorized | 200,000,000 |
| | 200,000,000 |
| |
| Sold | 6,600,409 |
| $ | 203,734,155 |
| 12,303,508 |
| $ | 369,568,617 |
|
| Issued in reinvestment of distributions | 801,932 |
| 24,487,641 |
| 635,750 |
| 18,429,857 |
|
| Redeemed | (8,943,608 | ) | (273,782,326 | ) | (17,510,664 | ) | (525,318,867 | ) |
| | (1,541,267 | ) | (45,560,530 | ) | (4,571,406 | ) | (137,320,393 | ) |
| Institutional Class/Shares Authorized | 50,000,000 |
| | 50,000,000 |
| |
| Sold | 2,612,248 |
| 80,355,114 |
| 3,155,595 |
| 95,323,733 |
|
| Issued in reinvestment of distributions | 128,724 |
| 3,946,238 |
| 182,987 |
| 5,397,113 |
|
| Redeemed | (2,153,818 | ) | (65,277,333 | ) | (11,434,924 | ) | (352,919,499 | ) |
| | 587,154 |
| 19,024,019 |
| (8,096,342 | ) | (252,198,653 | ) |
| A Class/Shares Authorized | 50,000,000 |
| | 50,000,000 |
| |
| Sold | 1,453,998 |
| 44,776,351 |
| 2,355,656 |
| 70,464,832 |
|
| Issued in reinvestment of distributions | 131,244 |
| 3,999,428 |
| 98,462 |
| 2,851,154 |
|
| Redeemed | (2,514,089 | ) | (77,540,716 | ) | (2,637,014 | ) | (78,153,884 | ) |
| | (928,847 | ) | (28,764,937 | ) | (182,896 | ) | (4,837,898 | ) |
| C Class/Shares Authorized | 10,000,000 |
| | 10,000,000 |
| |
| Sold | 88,016 |
| 2,682,880 |
| 145,880 |
| 4,310,667 |
|
| Issued in reinvestment of distributions | 7,948 |
| 237,193 |
| 4,541 |
| 129,831 |
|
| Redeemed | (163,187 | ) | (4,908,151 | ) | (154,361 | ) | (4,514,636 | ) |
| | (67,223 | ) | (1,988,078 | ) | (3,940 | ) | (74,138 | ) |
| R Class/Shares Authorized | 10,000,000 |
| | 10,000,000 |
| |
| Sold | 362,221 |
| 11,151,106 |
| 313,203 |
| 9,313,920 |
|
| Issued in reinvestment of distributions | 10,014 |
| 304,389 |
| 4,748 |
| 135,987 |
|
| Redeemed | (235,935 | ) | (7,298,352 | ) | (134,904 | ) | (3,967,197 | ) |
| | 136,300 |
| 4,157,143 |
| 183,047 |
| 5,482,710 |
|
| R6 Class/Shares Authorized | 50,000,000 |
| | 40,000,000 |
| |
| Sold | 1,937,793 |
| 60,134,562 |
| 7,671,347 |
| 225,205,102 |
|
| Issued in reinvestment of distributions | 181,289 |
| 5,556,657 |
| 82,066 |
| 2,301,700 |
|
| Redeemed | (3,103,149 | ) | (98,056,551 | ) | (2,911,026 | ) | (84,998,936 | ) |
| | (984,067 | ) | (32,365,332 | ) | 4,842,387 |
| 142,507,866 |
|
| Net increase (decrease) | (2,797,950) |
| $ | (85,497,715 | ) | (7,829,150 | ) | $ | (246,440,506 | ) |
6. Fair Value Measurements
The fund’s investments valuation process is based on several considerations and may use multiple inputs to determine the fair value of the investments held by the fund. In conformity with accounting principles generally accepted in the United States of America, the inputs used to determine a valuation are classified into three broad levels.
| |
| • | Level 1 valuation inputs consist of unadjusted quoted prices in an active market for identical investments. |
| |
| • | Level 2 valuation inputs consist of direct or indirect observable market data (including quoted prices for comparable investments, evaluations of subsequent market events, interest rates, prepayment speeds, credit risk, etc.). These inputs also consist of quoted prices for identical investments initially expressed in local currencies that are adjusted through translation into U.S. dollars. |
| |
| • | Level 3 valuation inputs consist of unobservable data (including a fund’s own assumptions). |
The level classification is based on the lowest level input that is significant to the fair valuation measurement. The valuation inputs are not necessarily an indication of the risks associated with investing in these securities or other financial instruments. There were no significant transfers between levels during the period.
The following is a summary of the level classifications as of period end. The Schedule of Investments provides additional information on the fund’s portfolio holdings.
|
| | | | | | | | |
| | Level 1 | Level 2 | Level 3 |
| Assets | | | |
| Investment Securities | | | |
| Common Stocks | $ | 1,420,124,753 |
| — |
| — |
|
| Temporary Cash Investments | 15,669 |
| $ | 4,063,000 |
| — |
|
| | $ | 1,420,140,422 |
| $ | 4,063,000 |
| — |
|
7. Risk Factors
The fund concentrates its investments in a narrow segment of the total market. Because of this, the fund is subject to certain additional risks as compared to investing in a more diversified portfolio of investments. The fund may be subject to certain risks similar to those associated with direct investment in real estate including but not limited to: local or regional economic conditions, changes in zoning laws, changes in property values, property tax increases, overbuilding, increased competition, environmental contamination, natural disasters, and interest rate risk.
The fund’s investment process may result in high portfolio turnover, which could mean high transaction costs, affecting both performance and capital gains tax liabilities to investors.
8. Federal Tax Information
The tax character of distributions paid during the years ended October 31, 2016 and October 31, 2015 were as follows:
|
| | | | | | |
| | 2016 | 2015 |
| Distributions Paid From | | |
| Ordinary income | $ | 20,228,049 |
| $ | 30,437,761 |
|
| Long-term capital gains | $ | 20,153,241 |
| — |
|
The book-basis character of distributions made during the year from net investment income or net realized gains may differ from their ultimate characterization for federal income tax purposes. These differences reflect the differing character of certain income items and net realized gains and losses for financial statement and tax purposes, and may result in reclassification among certain capital accounts on the financial statements.
The reclassifications, which are primarily due to tax equalization and dividends redesignations, were made to capital $1,869,291, distributions in excess of net investment income $20,164,030, and undistributed net realized gain $(22,033,321).
As of October 31, 2016, the federal tax cost of investments and the components of distributable earnings on a tax-basis were as follows:
|
| | | |
| Federal tax cost of investments | $ | 1,242,714,761 |
|
| Gross tax appreciation of investments | $ | 208,018,697 |
|
| Gross tax depreciation of investments | (26,530,036 | ) |
| Net tax appreciation (depreciation) of investments | $ | 181,488,661 |
|
| Undistributed ordinary income | — |
|
| Accumulated long-term gains | $ | 117,649,071 |
|
The difference between book-basis and tax-basis unrealized appreciation (depreciation) is attributable primarily to the tax deferral of losses on wash sales.
|
| | | | | | | | | | | | | |
| For a Share Outstanding Throughout the Years Ended October 31 (except as noted) | | | | | | |
| Per-Share Data | | | | Ratios and Supplemental Data | |
| | | Income From Investment Operations: | | Ratio to Average Net Assets of: | | |
| | Net Asset
Value,
Beginning
of Period | Net
Investment
Income
(Loss)(1) | Net
Realized
and
Unrealized
Gain (Loss) | Total From
Investment
Operations | Distributions From Net
Investment
Income | Net Asset
Value,
End
of Period | Total
Return(2) | Operating
Expenses | Net
Investment
Income
(Loss) | Portfolio
Turnover
Rate | Net
Assets,
End of
Period
(in thousands) |
| Investor Class | | | | | | | | | |
| 2016 | $29.69 | 0.41 | 1.41 | 1.82 | (0.82) | $30.69 | 6.19% | 1.14% | 1.32% | 149% |
| $909,921 |
|
| 2015 | $28.69 | 0.42 | 1.13 | 1.55 | (0.55) | $29.69 | 5.51% | 1.14% | 1.42% | 140% |
| $925,934 |
|
| 2014 | $24.56 | 0.30 | 4.29 | 4.59 | (0.46) | $28.69 | 18.89% | 1.14% | 1.16% | 127% |
| $1,025,749 |
|
| 2013 | $23.05 | 0.36 | 1.70 | 2.06 | (0.55) | $24.56 | 9.04% | 1.14% | 1.48% | 170% |
| $847,977 |
|
2012(3) | $22.35 | 0.09 | 0.66 | 0.75 | (0.05) | $23.05 | 3.38% | 1.15%(4) | 0.64%(4) | 86% |
| $759,303 |
|
| 2012 | $19.58 | 0.17 | 2.87 | 3.04 | (0.27) | $22.35 | 15.62% | 1.16% | 0.83% | 168% |
| $696,245 |
|
| Institutional Class | | | | | | | | | |
| 2016 | $29.76 | 0.46 | 1.43 | 1.89 | (0.88) | $30.77 | 6.40% | 0.94% | 1.52% | 149% |
| $183,181 |
|
| 2015 | $28.75 | 0.51 | 1.11 | 1.62 | (0.61) | $29.76 | 5.70% | 0.94% | 1.62% | 140% |
| $159,721 |
|
| 2014 | $24.61 | 0.35 | 4.30 | 4.65 | (0.51) | $28.75 | 19.17% | 0.94% | 1.36% | 127% |
| $387,099 |
|
| 2013 | $23.10 | 0.41 | 1.70 | 2.11 | (0.60) | $24.61 | 9.23% | 0.94% | 1.68% | 170% |
| $413,623 |
|
2012(3) | $22.40 | 0.11 | 0.67 | 0.78 | (0.08) | $23.10 | 3.47% | 0.95%(4) | 0.84%(4) | 86% |
| $324,283 |
|
| 2012 | $19.62 | 0.21 | 2.87 | 3.08 | (0.30) | $22.40 | 15.86% | 0.96% | 1.03% | 168% |
| $290,557 |
|
|
| | | | | | | | | | | | | |
| For a Share Outstanding Throughout the Years Ended October 31 (except as noted) | | | | | | |
| Per-Share Data | | | | Ratios and Supplemental Data | |
| | | Income From Investment Operations: | | Ratio to Average Net Assets of: | | |
| | Net Asset
Value,
Beginning
of Period | Net
Investment
Income
(Loss)(1) | Net
Realized
and
Unrealized
Gain (Loss) | Total From
Investment
Operations | Distributions From Net
Investment
Income | Net Asset
Value,
End
of Period | Total
Return(2) | Operating
Expenses | Net
Investment
Income
(Loss) | Portfolio
Turnover
Rate | Net
Assets,
End of
Period
(in thousands) |
| A Class | | | | | | | | | | | |
| 2016 | $29.69 | 0.34 | 1.41 | 1.75 | (0.74) | $30.70 | 5.92% | 1.39% | 1.07% | 149% |
| $153,281 |
|
| 2015 | $28.69 | 0.34 | 1.14 | 1.48 | (0.48) | $29.69 | 5.24% | 1.39% | 1.17% | 140% |
| $175,833 |
|
| 2014 | $24.55 | 0.24 | 4.30 | 4.54 | (0.40) | $28.69 | 18.59% | 1.39% | 0.91% | 127% |
| $175,133 |
|
| 2013 | $23.05 | 0.30 | 1.69 | 1.99 | (0.49) | $24.55 | 8.77% | 1.39% | 1.23% | 170% |
| $201,660 |
|
2012(3) | $22.35 | 0.05 | 0.67 | 0.72 | (0.02) | $23.05 | 3.21% | 1.40%(4) | 0.39%(4) | 86% |
| $166,497 |
|
| 2012 | $19.60 | 0.11 | 2.87 | 2.98 | (0.23) | $22.35 | 15.33% | 1.41% | 0.58% | 168% |
| $151,198 |
|
| C Class | | | | | | | | | | | |
| 2016 | $29.22 | 0.11 | 1.37 | 1.48 | (0.52) | $30.18 | 5.10% | 2.14% | 0.32% | 149% |
| $15,986 |
|
| 2015 | $28.25 | 0.12 | 1.13 | 1.25 | (0.28) | $29.22 | 4.47% | 2.14% | 0.42% | 140% |
| $17,439 |
|
| 2014 | $24.18 | 0.04 | 4.23 | 4.27 | (0.20) | $28.25 | 17.74% | 2.14% | 0.16% | 127% |
| $16,972 |
|
| 2013 | $22.72 | 0.12 | 1.67 | 1.79 | (0.33) | $24.18 | 7.93% | 2.14% | 0.48% | 170% |
| $17,057 |
|
2012(3) | $22.11 | (0.05) | 0.66 | 0.61 | — | $22.72 | 2.76% | 2.15%(4) | (0.36)%(4) | 86% |
| $5,622 |
|
| 2012 | $19.48 | (0.02) | 2.82 | 2.80 | (0.17) | $22.11 | 14.44% | 2.16% | (0.17)% | 168% |
| $2,574 |
|
| R Class | | | | | | | | | | | |
| 2016 | $29.55 | 0.23 | 1.43 | 1.66 | (0.66) | $30.55 | 5.64% | 1.64% | 0.82% | 149% |
| $19,112 |
|
| 2015 | $28.55 | 0.26 | 1.15 | 1.41 | (0.41) | $29.55 | 4.97% | 1.64% | 0.92% | 140% |
| $14,458 |
|
| 2014 | $24.44 | 0.16 | 4.28 | 4.44 | (0.33) | $28.55 | 18.30% | 1.64% | 0.66% | 127% |
| $8,743 |
|
| 2013 | $22.95 | 0.24 | 1.68 | 1.92 | (0.43) | $24.44 | 8.50% | 1.64% | 0.98% | 170% |
| $5,866 |
|
2012(3) | $22.27 | 0.02 | 0.66 | 0.68 | —(5) | $22.95 | 3.06% | 1.65%(4) | 0.14%(4) | 86% |
| $3,466 |
|
| 2012 | $19.55 | 0.08 | 2.84 | 2.92 | (0.20) | $22.27 | 15.01% | 1.66% | 0.33% | 168% |
| $2,224 |
|
|
| | | | | | | | | | | | | |
| For a Share Outstanding Throughout the Years Ended October 31 (except as noted) | | | | | | |
| Per-Share Data | | | | Ratios and Supplemental Data | |
| | | Income From Investment Operations: | | Ratio to Average Net Assets of: | | |
| | Net Asset
Value,
Beginning
of Period | Net
Investment
Income
(Loss)(1) | Net
Realized
and
Unrealized
Gain (Loss) | Total From
Investment
Operations | Distributions From Net
Investment
Income | Net Asset
Value,
End
of Period | Total
Return(2) | Operating
Expenses | Net
Investment
Income
(Loss) | Portfolio
Turnover
Rate | Net
Assets,
End of
Period
(in thousands) |
| R6 Class | | | | | | | | | | | |
| 2016 | $29.75 | 0.51 | 1.43 | 1.94 | (0.93) | $30.76 | 6.57% | 0.79% | 1.67% | 149% |
| $149,866 |
|
| 2015 | $28.74 | 0.49 | 1.17 | 1.66 | (0.65) | $29.75 | 5.86% | 0.79% | 1.77% | 140% |
| $174,257 |
|
| 2014 | $24.61 | 0.33 | 4.35 | 4.68 | (0.55) | $28.74 | 19.31% | 0.79% | 1.51% | 127% |
| $29,151 |
|
2013(6) | $25.22 | 0.07 | (0.53) | (0.46) | (0.15) | $24.61 | (1.77)% | 0.79%(4) | 1.04%(4) | 170%(7) |
| $1,377 |
|
|
|
| Notes to Financial Highlights |
(2) Total returns are calculated based on the net asset value of the last business day and do not reflect applicable sales charges, if any. Total returns for periods less than one year are not annualized.
(3) April 1, 2012 through October 31, 2012. The fund's fiscal year end was changed from March 31 to October 31, resulting in a seven-month annual reporting period. For the years before October 31, 2012, the fund's fiscal year end was March 31.
(4) Annualized.
(5) Per-share amount was less than $0.005.
(6) July 26, 2013 (commencement of sale) through October 31, 2013.
(7) Portfolio turnover is calculated at the fund level. Percentage indicated was calculated for the year ended October 31, 2013.
See Notes to Financial Statements.
|
|
| Report of Independent Registered Public Accounting Firm |
To the Board of Directors and Shareholders of American Century Capital Portfolios, Inc.:
We have audited the accompanying statement of assets and liabilities, including the schedule of investments, of Real Estate Fund (the “Fund”), one of the funds constituting American Century Capital Portfolios, Inc., as of October 31, 2016, and the related statement of operations for the year then ended, the statements of changes in net assets for each of the two years in the period then ended, and the financial highlights for each of the periods presented. These financial statements and financial highlights are the responsibility of the Fund’s management. Our responsibility is to express an opinion on these financial statements and financial highlights based on our audits.
We conducted our audits in accordance with the standards of the Public Company Accounting Oversight Board (United States). Those standards require that we plan and perform the audit to obtain reasonable assurance about whether the financial statements and financial highlights are free of material misstatement. The Fund is not required to have, nor were we engaged to perform, an audit of its internal control over financial reporting. Our audits included consideration of internal control over financial reporting as a basis for designing audit procedures that are appropriate in the circumstances, but not for the purpose of expressing an opinion on the effectiveness of the Fund’s internal control over financial reporting. Accordingly, we express no such opinion. An audit also includes examining, on a test basis, evidence supporting the amounts and disclosures in the financial statements, assessing the accounting principles used and significant estimates made by management, as well as evaluating the overall financial statement presentation. Our procedures included confirmation of securities owned as of October 31, 2016, by correspondence with the custodian and brokers; when replies were not received from brokers, we performed other auditing procedures. We believe that our audits provide a reasonable basis for our opinion.
In our opinion, the financial statements and financial highlights referred to above present fairly, in all material respects, the financial position of Real Estate Fund of American Century Capital Portfolios, Inc. as of October 31, 2016, the results of its operations for the year then ended, the changes in its net assets for each of the two years in the period then ended, and the financial highlights for each of the periods presented, in conformity with accounting principles generally accepted in the United States of America.
DELOITTE & TOUCHE LLP
Kansas City, Missouri
December 19, 2016
The Board of Directors
The individuals listed below serve as directors of the funds. Each director will continue to serve in this capacity until death, retirement, resignation or removal from office. The board has adopted a mandatory retirement age for directors who are not “interested persons,” as that term is defined in the Investment Company Act (independent directors). Independent directors shall retire by December 31 of the year in which they reach their 75th birthday.
Mr. Thomas is an “interested person” because he currently serves as President and Chief Executive Officer of American Century Companies, Inc. (ACC), the parent company of American Century Investment Management, Inc. (ACIM or the advisor). The other directors (more than three-fourths of the total number) are independent. They are not employees, directors or officers of, and have no financial interest in, ACC or any of its wholly owned, direct or indirect, subsidiaries, including ACIM, American Century Investment Services, Inc. (ACIS) and American Century Services, LLC (ACS), and they do not have any other affiliations, positions or relationships that would cause them to be considered “interested persons” under the Investment Company Act. The directors serve in this capacity for seven (in the case of Mr. Thomas, 15) registered investment companies in the American Century Investments family of funds.
The following table presents additional information about the directors. The mailing address for each director is 4500 Main Street, Kansas City, Missouri 64111.
|
| | | | | |
Name
(Year of Birth) | Position(s) Held with Funds | Length of Time Served | Principal Occupation(s) During Past 5 Years | Number of American Century Portfolios Overseen by Director | Other Directorships Held During Past 5 Years |
| Independent Directors |
|
|
Barry Fink
(1955) | Director | Since 2012 | Retired; Executive Vice President, ACC (September 2007 to February 2013); President, ACS (October 2007 to February 2013); Chief Operating Officer, ACC (September 2007 to November 2012) | 81 | None |
Andrea C. Hall
(1945) | Director | Since 1997 | Retired | 81 | None |
Jan M. Lewis
(1957) | Director | Since 2011 | Retired; President and Chief Executive Officer, Catholic Charities of Northeast Kansas (human services organization) (2006 to 2013) | 81 | None |
James A. Olson
(1942) | Director and Chairman of the Board | Since 2007 (Chairman since 2014) | Member, Plaza Belmont LLC (private equity fund manager) (1999 to present) | 81 | Saia, Inc. (2002 to 2012) and EPR Properties (2003 to 2013) |
M. Jeannine Strandjord
(1945) | Director | Since 1994 | Retired | 81 | Euronet Worldwide Inc.; MGP Ingredients, Inc.; and DST Systems Inc. (1996 to 2012) |
|
| | | | | |
Name
(Year of Birth) | Position(s) Held with Funds | Length of Time Served | Principal Occupation(s) During Past 5 Years | Number of American Century Portfolios Overseen by Director | Other Directorships Held During Past 5 Years |
| Independent Directors |
|
|
John R. Whitten
(1946) | Director | Since 2008 | Retired | 81 | Rudolph Technologies, Inc. |
Stephen E. Yates
(1948) | Director | Since 2012 | Retired | 81 | None |
| Interested Director |
|
|
Jonathan S. Thomas
(1963) | Director and President | Since 2007 | President and Chief Executive Officer, ACC (March 2007 to present). Also serves as Chief Executive Officer, ACS; Executive Vice President, ACIM; Director, ACC, ACIM and other ACC subsidiaries | 125 | BioMed Valley Discoveries, Inc. |
The Statement of Additional Information has additional information about the fund's directors and is available without charge, upon request, by calling 1-800-345-2021.
Officers
The following table presents certain information about the executive officers of the funds. Each officer serves as an officer for each of the 15 investment companies in the American Century family of funds, unless otherwise noted. No officer is compensated for his or her service as an officer of the funds. The listed officers are interested persons of the funds and are appointed or re-appointed on an annual basis. The mailing address for each officer listed below is 4500 Main Street, Kansas City, Missouri 64111.
|
| | |
Name
(Year of Birth) | Offices with the Funds | Principal Occupation(s) During the Past Five Years |
Jonathan S. Thomas
(1963) | Director and President since 2007 | President and Chief Executive Officer, ACC (March 2007 to present). Also serves as Chief Executive Officer, ACS; Executive Vice President, ACIM; Director, ACC, ACIM and other ACC subsidiaries |
Amy D. Shelton
(1964) | Chief Compliance Officer and Vice President since 2014 | Chief Compliance Officer, American Century funds, (March 2014 to present); Chief Compliance Officer, ACIM (February 2014 to present); Chief Compliance Officer, ACIS (October 2009 to present); Vice President, Client Interactions and Marketing, ACIS (February 2013 to January 2014); Director, Client Interactions and Marketing, ACIS (June 2007 to January 2013). Also serves as Vice President, ACIS |
Charles A. Etherington
(1957) | General Counsel since 2007 and Senior Vice President since 2006 | Attorney, ACC (February 1994 to present); Vice President, ACC (November 2005 to present); General Counsel, ACC (March 2007 to present). Also serves as General Counsel, ACIM, ACS, ACIS and other ACC subsidiaries; and Senior Vice President, ACIM and ACS |
C. Jean Wade
(1964) | Vice President,Treasurer and Chief Financial Officer since 2012 | Vice President, ACS (February 2000 to present) |
Robert J. Leach
(1966) | Vice President since 2006 and Assistant Treasurer since 2012 | Vice President, ACS (February 2000 to present) |
David H. Reinmiller
(1963) | Vice President since 2000 | Attorney, ACC (January 1994 to present); Associate General Counsel, ACC (January 2001 to present). Also serves as Vice President, ACIM and ACS |
Ward D. Stauffer
(1960) | Secretary since 2005 | Attorney, ACC (June 2003 to present) |
|
|
| Approval of Management Agreement |
At a meeting held on June 29, 2016, the Fund’s Board of Directors (the "Board") unanimously approved the renewal of the management agreement pursuant to which American Century Investment Management, Inc. (the “Advisor”) acts as the investment advisor for the Fund. Under Section 15(c) of the Investment Company Act, contracts for investment advisory services are required to be reviewed, evaluated, and approved by a majority of a fund’s directors (the “Directors”), including a majority of the independent Directors, each year.
Prior to its consideration of the renewal of the management agreement, the Directors requested and reviewed extensive data and information compiled by the Advisor and certain independent providers of evaluation data concerning the Fund and the services provided to the Fund by the Advisor. This review was in addition to the oversight and evaluation undertaken by the Board and its committees on a continual basis and the information received was supplemental to the extensive information that the Board and its committees receive and consider throughout the year.
In connection with its consideration of the renewal of the management agreement, the Board’s review and evaluation of the services provided by the Advisor included, but was not limited to, the following:
| |
| • | the nature, extent, and quality of investment management, shareholder services, and other services provided and to be provided to the Fund; |
| |
| • | the wide range of other programs and services provided and to be provided to the Fund and its shareholders on a routine and non-routine basis; |
| |
| • | the investment performance of the Fund, including data comparing the Fund's performance to appropriate benchmarks and/or a peer group of other mutual funds with similar investment objectives and strategies; |
| |
| • | the cost of owning the Fund compared to the cost of owning similar funds; |
| |
| • | the compliance policies, procedures, and regulatory experience of the Advisor and the Fund's service providers; |
| |
| • | financial data showing the cost of services provided to the Fund, the profitability of the Fund to the Advisor, and the overall profitability of the Advisor; |
| |
| • | possible economies of scale associated with the Advisor’s management of the Fund and other accounts under its management; |
| |
| • | data comparing services provided and charges to the Advisor's other investment management clients; |
| |
| • | acquired fund fees and expenses; |
| |
| • | payments by the Fund and the Advisor to financial intermediaries and the nature of services provided; and |
| |
| • | any collateral benefits derived by the Advisor from the management of the Fund. |
In keeping with their practice, the Directors held two in-person meetings and one telephonic meeting to review and discuss the information provided. The independent Directors also had the benefit of the advice of their independent counsel throughout the process.
Factors Considered
The Directors considered all of the information provided by the Advisor, the independent data providers, and independent counsel in connection with the approval. They determined that the information was sufficient for them to evaluate the management agreement for the Fund. In connection with their review, the Directors did not identify any single factor as being all-important or controlling, and each Director may have attributed different levels of importance to different factors. In deciding to renew the management agreement, the Board based its decision on a number of factors, including the following:
Nature, Extent and Quality of Services - Generally. Under the management agreement, the Advisor is responsible for providing or arranging for all services necessary for the operation of the Fund. The Board noted that under the management agreement, the Advisor provides or arranges at its own expense a wide variety of services including:
| |
| • | constructing and designing the Fund |
| |
| • | portfolio research and security selection |
| |
| • | initial capitalization/funding |
| |
| • | daily valuation of the Fund’s portfolio |
| |
| • | shareholder servicing and transfer agency, including shareholder confirmations, recordkeeping, and communications |
| |
| • | legal services (except the independent Directors’ counsel) |
| |
| • | regulatory and portfolio compliance |
| |
| • | marketing and distribution (except amounts paid by the Fund under Rule 12b-1 plans) |
The Board noted that many of these services have expanded over time in terms of both quantity and complexity in response to shareholder demands, competition in the industry, changing distribution channels, and the changing regulatory environment. The Board noted specifically the resources the Advisor has committed to enhancing cybersecurity protections for the benefit of shareholders.
Investment Management Services. The nature of the investment management services provided to the Fund is quite complex and allows Fund shareholders access to professional money management, instant diversification of their investments within an asset class, the opportunity to easily diversify among asset classes by investing in or exchanging among various American Century Investments funds, and liquidity. In evaluating investment performance, the Board expects the Advisor to manage the Fund in accordance with its investment objectives and approved strategies. Further, the Directors recognize that the Advisor has an obligation to monitor trading activities, and in particular to seek the best execution of fund trades, and to evaluate the use of and payment for research. In providing these services, the Advisor utilizes teams of investment professionals (portfolio managers, analysts, research assistants, and securities traders) who require extensive information technology, research, training, compliance, and other systems to conduct their business. The Board, directly and through its Fund Performance Review Committee, provides oversight of the investment performance process. It regularly reviews investment performance information for the Fund, together with comparative information for appropriate benchmarks and/or peer groups of similarly-managed funds, over different time horizons. The Directors also review detailed performance information provided by the Advisor during the management agreement approval process. If performance concerns are identified, the Fund receives special reviews until performance improves, during which the Board receives a report from the Advisor regarding the reasons for such results (e.g., market conditions, security selection) and any efforts being undertaken to improve performance. The Fund’s performance was above its benchmark for the one-, three-, five-, and ten-year periods reviewed by the Board. The Board found the investment management services provided by the Advisor to the Fund to be satisfactory and consistent with the management agreement.
Shareholder and Other Services. Under the management agreement, the Advisor provides the Fund with a comprehensive package of transfer agency, shareholder, and other services. The Board, directly and through various committees of the Board, regularly reviews reports and evaluations of such services at its regular meetings. These reports include, but are not limited to, information regarding the operational efficiency and accuracy of the shareholder and transfer agency services provided, staffing levels, shareholder satisfaction (as measured by external as well as internal sources), technology support, new products and services offered to Fund shareholders,
securities trading activities, portfolio valuation services, auditing services, and legal and operational compliance activities. The Board particularly noted the Advisor’s continual efforts to maintain effective business continuity plans and to address cybersecurity threats. Certain aspects of shareholder and transfer agency service level efficiency and the quality of securities trading activities are measured by independent third party providers and are presented in comparison to other fund groups not managed by the Advisor. The Board found the services provided by the Advisor to the Fund under the management agreement to be competitive and of high quality.
Costs of Services and Profitability. The Advisor provides detailed information concerning its cost of providing various services to the Fund, its profitability in managing the Fund (pre- and post-distribution), its overall profitability, and its financial condition. The Directors have reviewed with the Advisor the methodology used to prepare this financial information. This information is considered in evaluating the Advisor’s financial condition, its ability to continue to provide services under the management agreement, and the reasonableness of the current management fee. The Board concluded that the Advisor’s profits were reasonable in light of the services provided to the Fund.
Ethics. The Board generally considers the Advisor’s commitment to providing quality services to shareholders and to conducting its business ethically. They noted that the Advisor’s practices generally meet or exceed industry best practices.
Economies of Scale. The Board also reviewed information provided by the Advisor regarding the possible existence of economies of scale in connection with the management of the Fund. The Board concluded that economies of scale are difficult to measure and predict with precision, especially on a fund-by-fund basis. The Board concluded that the Advisor is appropriately sharing economies of scale through its competitive fee structure, offering competitive fees from fund inception, and through reinvestment in its business to provide shareholders additional content and services. The Board also noted that economies of scale are shared with the Fund and its shareholders through management fee breakpoints that serve to reduce the effective management fee as the assets of the Fund grow.
Comparison to Other Funds’ Fees. The management agreement provides that the Fund pays the Advisor a single, all-inclusive (or unified) management fee for providing all services necessary for the management and operation of the Fund, other than brokerage expenses, expenses attributable to short sales, taxes, interest, extraordinary expenses, and the fees and expenses of the Fund’s independent Directors (including their independent legal counsel) and expenses incurred in connection with the provision of shareholder services and distribution services under a plan adopted pursuant to Rule 12b-1 under the 1940 Act. Under the unified fee structure, the Advisor is responsible for providing all investment advisory, custody, audit, administrative, compliance, recordkeeping, marketing and shareholder services, or arranging and supervising third parties to provide such services. By contrast, most other funds are charged a variety of fees, including an investment advisory fee, a transfer agency fee, an administrative fee, distribution charges, and other expenses. Other than their investment advisory fees and any applicable Rule 12b-1 distribution fees, all other components of the total fees charged by these other funds may be increased without shareholder approval. The Board believes the unified fee structure is a benefit to Fund shareholders because it clearly discloses to shareholders the cost of owning Fund shares, and, since the unified fee cannot be increased without a vote of Fund shareholders, it shifts to the Advisor the risk of increased costs of operating the Fund and provides a direct incentive to minimize administrative inefficiencies. Part of the Board’s analysis of fee levels involves reviewing certain evaluative data compiled by an independent provider comparing the Fund’s unified fee to the total expense ratios of its peers. The unified fee charged to shareholders of the Fund was above the median of the total expense ratios of the Fund’s peer expense universe and was within the range of its peer expense group. The Board concluded that the management fee paid by the Fund to the Advisor under the management agreement is reasonable in light of the services provided to the Fund.
Comparison to Fees and Services Provided to Other Clients of the Advisor. The Directors also requested and received information from the Advisor concerning the nature of the services, fees, costs, and profitability of its advisory services to advisory clients other than the Fund. They observed that these varying types of client accounts require different services and involve different regulatory and entrepreneurial risks than the management of the Fund. The Board analyzed this information and concluded that the fees charged and services provided to the Fund were reasonable by comparison.
Payments to Intermediaries. The Directors also requested and received a description of payments made to intermediaries by the Fund and the Advisor. These payments include various payments made by the Fund or the Advisor to different types of intermediaries and recordkeepers for distribution and service activities provided for the Fund. The Board received confirmation from the Advisor that all such payments by the Fund intended for distribution were made pursuant to the Fund's 12b-1 Plan. The Board reviewed such information and found the payments to be reasonable in scope and purpose.
Collateral or “Fall-Out” Benefits Derived by the Advisor. The Board considered the existence of collateral benefits the Advisor may receive as a result of its relationship with the Fund. They concluded that the Advisor’s primary business is managing mutual funds and it generally does not use fund or shareholder information to generate profits in other lines of business, and therefore does not derive any significant collateral benefits from them. The Board noted that additional assets from other clients may offer the Advisor some benefit from increased leverage with service providers and counterparties. Additionally, the Advisor receives proprietary research from broker-dealers that execute fund portfolio transactions, which the Board concluded is likely to benefit other clients of the Advisor, as well as Fund shareholders. The Board also determined that the Advisor is able to provide investment management services to certain clients other than the Fund, at least in part, due to its existing infrastructure built to serve the fund complex. The Board concluded that appropriate allocation methodologies had been employed to assign resources and the cost of those resources to these other clients and, where expressly provided, these other client assets may be included with the assets of the Fund to determine breakpoints in the management fee schedule.
Existing Relationship. The Board also considered whether there was any reason for not continuing the existing arrangement with the Advisor. In this regard, the Board was mindful of the potential disruptions of the Fund’s operations and various risks, uncertainties, and other effects that could occur as a result of a decision not to continue such relationship. In particular, the Board recognized that most shareholders have invested in the Fund on the strength of the Advisor’s industry standing and reputation and in the expectation that the Advisor will have a continuing role in providing advisory services to the Fund.
Conclusion of the Directors. As a result of this process, the Board, including all of the independent Directors, taking into account all of the factors discussed above and the information provided by the Advisor and others in connection with its review and throughout the year, determined that the management fee is fair and reasonable in light of the services provided and that the investment management agreement between the Fund and the Advisor should be renewed.
Retirement Account Information
As required by law, distributions you receive from certain IRAs are subject to federal income tax withholding, unless you elect not to have withholding apply. Tax will be withheld on the total amount withdrawn even though you may be receiving amounts that are not subject to withholding, such as nondeductible contributions. In such case, excess amounts of withholding could occur. You may adjust your withholding election so that a greater or lesser amount will be withheld.
If you don’t want us to withhold on this amount, you must notify us to not withhold the federal income tax. You may notify us in writing or in certain situations by telephone or through other electronic means. For systematic withdrawals, your withholding election will remain in effect until revoked or changed by filing a new election. You have the right to revoke your election at any time.
Remember, even if you elect not to have income tax withheld, you are liable for paying income tax on the taxable portion of your withdrawal. If you elect not to have income tax withheld or you don’t have enough income tax withheld, you may be responsible for payment of estimated tax. You may incur penalties under the estimated tax rules if your withholding and estimated tax payments are not sufficient. You can reduce or defer the income tax on a distribution by directly or indirectly rolling such distribution over to another IRA or eligible plan. You should consult your tax advisor for additional information.
State tax will be withheld if, at the time of your distribution, your address is within one of the mandatory withholding states and you have federal income tax withheld (or as otherwise required by state law). State taxes will be withheld from your distribution in accordance with the respective state rules.
Distributions you receive from 403(b), 457 and qualified plans are subject to special tax and withholding rules. Your plan administrator or plan sponsor is required to provide you with a special tax notice explaining those rules at the time you request a distribution. If applicable, federal and/or state taxes may be withheld from your distribution amount.
Proxy Voting Policies
A description of the policies that the fund's investment advisor uses in exercising the voting rights associated with the securities purchased and/or held by the fund is available without charge, upon request, by calling 1-800-345-2021. It is also available on the "About Us" page of American Century Investments’ website at americancentury.com and on the Securities and Exchange Commission’s website at sec.gov. Information regarding how the investment advisor voted proxies relating to portfolio securities during the most recent 12-month period ended June 30 is available on the "About Us" page at americancentury.com. It is also available at sec.gov.
Quarterly Portfolio Disclosure
The fund files its complete schedule of portfolio holdings with the Securities and Exchange Commission (SEC) for the first and third quarters of each fiscal year on Form N-Q. The fund’s Forms N-Q are available on the SEC’s website at sec.gov, and may be reviewed and copied at the SEC’s Public Reference Room in Washington, DC. Information on the operation of the Public Reference Room may be obtained by calling 1-800-SEC-0330. The fund also makes its complete schedule of portfolio holdings for the most recent quarter of its fiscal year available on its website at americancentury.com and, upon request, by calling 1-800-345-2021.
Other Tax Information
The following information is provided pursuant to provisions of the Internal Revenue Code.
The fund hereby designates up to the maximum amount allowable as qualified dividend income for the fiscal year ended October 31, 2016.
For corporate taxpayers, the fund hereby designates $189,666, or up to the maximum amount allowable, of ordinary income distributions paid during the fiscal year ended October 31, 2016 as qualified for the corporate dividends received deduction.
The fund hereby designates $25,456,330, or up to the maximum amount allowable, as long-term capital gain distributions (20% rate gain distributions) for the fiscal year ended October 31, 2016.
The fund utilized earnings and profits of $6,081,531 distributed to shareholders on redemption of shares as part of the dividends paid deduction (tax equalization).
|
| | |
| |
| | | |
| Contact Us | americancentury.com | |
| Automated Information Line | 1-800-345-8765 | |
| Investor Services Representative | 1-800-345-2021 or 816-531-5575 | |
| Investors Using Advisors | 1-800-378-9878 | |
| Business, Not-For-Profit, Employer-Sponsored Retirement Plans | 1-800-345-3533 | |
| Banks and Trust Companies, Broker-Dealers, Financial Professionals, Insurance Companies | 1-800-345-6488 | |
| Telecommunications Relay Service for the Deaf | 711 | |
| | | |
| American Century Capital Portfolios, Inc. | |
| | | |
Investment Advisor: American Century Investment Management, Inc. Kansas City, Missouri | |
| | | |
| This report and the statements it contains are submitted for the general information of our shareholders. The report is not authorized for distribution to prospective investors unless preceded or accompanied by an effective prospectus. | |
| | | |
©2016 American Century Proprietary Holdings, Inc. All rights reserved.
CL-ANN-90979 1612 | |
ITEM 2. CODE OF ETHICS.
| |
| (a) | The registrant has adopted a Code of Ethics for Senior Financial Officers that applies to the registrant’s principal executive officer, principal financial officer, principal accounting officer, and persons performing similar functions. |
| |
| (f) | The registrant’s Code of Ethics for Senior Financial Officers was filed as Exhibit 12 (a)(1) to American Century Asset Allocation Portfolios, Inc.’s Annual Certified Shareholder Report on Form N-CSR, File No. 811-21591, on September 29, 2005, and is incorporated herein by reference. |
ITEM 3. AUDIT COMMITTEE FINANCIAL EXPERT.
| |
| (a)(1) | The registrant’s board has determined that the registrant has at least one audit committee financial expert serving on its audit committee. |
| |
| (a)(2) | M. Jeannine Strandjord, Stephen E. Yates and John R. Whitten are the registrant’s designated audit committee financial experts. They are “independent” as defined in Item 3 of Form N-CSR. |
ITEM 4. PRINCIPAL ACCOUNTANT FEES AND SERVICES.
The aggregate fees billed for each of the last two fiscal years for professional services rendered by the principal accountant for the audit of the registrant’s annual financial statements or services that are normally provided by the accountant in connection with statutory and regulatory filings or engagements for those fiscal years were as follows:
FY 2015: $96,912
FY 2016: $144,205
The aggregate fees billed in each of the last two fiscal years for assurance and related services by the principal accountant that are reasonably related to the performance of the audit of the registrant’s financial statements and are not reported under paragraph (a) of this Item were as follows:
For services rendered to the registrant:
FY 2015: $0
FY 2016: $0
Fees required to be approved pursuant to paragraph (c)(7)(ii) of Rule 2-01 of Regulation S-X (relating to certain engagements for non-audit services with the registrant’s investment adviser and its affiliates):
FY 2015: $0
FY 2016: $0
(c)Tax Fees.
The aggregate fees billed in each of the last two fiscal years for professional services rendered by the principal accountant for tax compliance, tax advice, and tax planning were as follows:
For services rendered to the registrant:
FY 2015: $0
FY 2016: $0
Fees required to be approved pursuant to paragraph (c)(7)(ii) of Rule 2-01 of Regulation S-X (relating to certain engagements for non-audit services with the registrant’s investment adviser and its affiliates):
FY 2015: $0
FY 2016: $0
(d)All Other Fees.
The aggregate fees billed in each of the last two fiscal years for products and services provided by the principal accountant, other than the services reported in paragraphs (a) through (c) of this Item were as follows:
For services rendered to the registrant:
FY 2015: $0
FY 2016: $0
Fees required to be approved pursuant to paragraph (c)(7)(ii) of Rule 2-01 of Regulation S-X (relating to certain engagements for non-audit services with the registrant’s investment adviser and its affiliates):
FY 2015: $0
FY 2016: $0
| |
| (e)(1) | In accordance with paragraph (c)(7)(i)(A) of Rule 2-01 of Regulation S-X, before the accountant is engaged by the registrant to render audit or non-audit services, the engagement is approved by the registrant’s audit committee. Pursuant to paragraph (c)(7)(ii) of Rule 2-01 of Regulation S-X, the registrant’s audit committee also pre-approves its accountant’s engagements for non-audit services with the registrant’s investment adviser, its parent company, and any entity controlled by, or under common control with the investment adviser that |
provides ongoing services to the registrant, if the engagement relates directly to the operations and financial reporting of the registrant.
| |
| (e)(2) | All services described in each of paragraphs (b) through (d) of this Item were pre-approved before the engagement by the registrant’s audit committee pursuant to paragraph (c)(7)(i)(A) of Rule 2-01 of Regulation S-X. Consequently, none of such services were required to be approved by the audit committee pursuant to paragraph (c)(7)(i)(C). |
| |
| (f) | The percentage of hours expended on the principal accountant’s engagement to audit the registrant’s financial statements for the most recent fiscal year that were attributed to work performed by persons other than the principal accountant’s full-time, permanent employees was less than 50%. |
| |
| (g) | The aggregate non-audit fees billed by the registrant’s accountant for services rendered to the registrant, and rendered to the registrant’s investment adviser (not including any sub-adviser whose role is primarily portfolio management and is subcontracted with or overseen by another investment adviser), and any entity controlling, controlled by, or under common control with the adviser that provides ongoing services to the registrant for each of the last two fiscal years of the registrant were as follows: |
FY 2015: $86,000
FY 2016: $829,350
| |
| (h) | The registrant’s investment adviser and accountant have notified the registrant’s audit committee of all non-audit services that were rendered by the registrant’s accountant to the registrant’s investment adviser, its parent company, and any entity controlled by, or under common control with the investment adviser that provides services to the registrant, which services were not required to be pre-approved pursuant to paragraph (c)(7)(ii) of Rule 2-01 of Regulation S-X. The notification provided to the registrant’s audit committee included sufficient details regarding such services to allow the registrant’s audit committee to consider the continuing independence of its principal accountant. |
ITEM 5. AUDIT COMMITTEE OF LISTED REGISTRANTS.
Not applicable.
ITEM 6. INVESTMENTS.
| |
| (a) | The schedule of investments is included as part of the report to stockholders filed under Item 1 of this Form. |
ITEM 7. DISCLOSURE OF PROXY VOTING POLICIES AND PROCEDURES FOR CLOSED-END MANAGEMENT INVESTMENT COMPANIES.
Not applicable.
ITEM 8. PORTFOLIO MANAGERS OF CLOSED-END MANAGEMENT INVESTMENT COMPANIES.
Not applicable.
ITEM 9. PURCHASES OF EQUITY SECURITIES BY CLOSED-END MANAGEMENT INVESTMENT COMPANY AND AFFILIATED PURCHASERS.
Not applicable.
ITEM 10. SUBMISSION OF MATTERS TO A VOTE OF SECURITY HOLDERS.
During the reporting period, there were no material changes to the procedures by which shareholders may recommend nominees to the registrant’s board.
ITEM 11. CONTROLS AND PROCEDURES.
| |
| (a) | The registrant's principal executive officer and principal financial officer have concluded that the registrant's disclosure controls and procedures (as defined in Rule 30a-3(c) under the Investment Company Act of 1940) are effective based on their evaluation of these controls and procedures as of a date within 90 days of the filing date of this report. |
| |
| (b) | There were no changes in the registrant's internal control over financial reporting (as defined in Rule 30a-3(d) under the Investment Company Act of 1940) that occurred during the registrant's second fiscal quarter of the period covered by this report that have materially affected, or are reasonably likely to materially affect, the registrant's internal control over financial reporting. |
ITEM 12. EXHIBITS.
| |
| (a)(1) | Registrant’s Code of Ethics for Senior Financial Officers, which is the subject of the disclosure required by Item 2 of Form N-CSR, was filed as Exhibit 12(a)(1) to American Century Asset Allocation Portfolios, Inc.’s Certified Shareholder Report on Form N-CSR, File No. 811-21591, on September 29, 2005. |
| |
| (a)(2) | Separate certifications by the registrant’s principal executive officer and principal financial officer, pursuant to Section 302 of the Sarbanes-Oxley Act of 2002 and Rule 30a-2(a) under the Investment Company Act of 1940, are filed and attached hereto as EX-99.CERT. |
| |
| (b) | A certification by the registrant’s chief executive officer and chief financial officer, pursuant to Section 906 of the Sarbanes-Oxley Act of 2002, is furnished and attached hereto as EX-99.906CERT. |
SIGNATURES
Pursuant to the requirements of the Securities Exchange Act of 1934 and the Investment Company Act of 1940, the registrant has duly caused this report to be signed on its behalf by the undersigned, thereunto duly authorized.
|
| | | |
| Registrant: | American Century Capital Portfolios, Inc. |
| | | |
| By: | /s/ Jonathan S. Thomas |
| | Name: | Jonathan S. Thomas |
| | Title: | President |
| | | |
| Date: | December 29, 2016 |
Pursuant to the requirements of the Securities Exchange Act of 1934 and the Investment Company Act of 1940, this report has been signed below by the following persons on behalf of the registrant and in the capacities and on the dates indicated.
|
| | |
| By: | /s/ Jonathan S. Thomas |
| | Name: | Jonathan S. Thomas |
| | Title: | President |
| | | (principal executive officer) |
| | | |
| Date: | December 29, 2016 |
|
| | |
| By: | /s/ C. Jean Wade |
| | Name: | C. Jean Wade |
| | Title: | Vice President, Treasurer, and |
| | | Chief Financial Officer |
| | | (principal financial officer) |
| | | |
| Date: | December 29, 2016 |