UNITED STATES
SECURITIES AND EXCHANGE COMMISSION
Washington, D.C. 20549
FORM N-CSR
CERTIFIED SHAREHOLDER REPORT OF REGISTERED
MANAGEMENT INVESTMENT COMPANIES
Investment Company Act file number 811-7822
-------------------------------------------
AMERICAN CENTURY INVESTMENT TRUST
- --------------------------------------------------------------------------------
(Exact name of registrant as specified in charter)
4500 MAIN STREET, KANSAS CITY, MISSOURI 64111
- --------------------------------------------------------------------------------
(Address of principal executive offices) (Zip code)
WILLIAM M. LYONS, 4500 MAIN STREET, KANSAS CITY, MISSOURI 64111
- --------------------------------------------------------------------------------
(Name and address of agent for service)
Registrant's telephone number, including area code: 816-531-5575
----------------------------
Date of fiscal year end: 03-31
-------------------------------------------------------
Date of reporting period: 09-30-2006
-------------------------------------------------------
ITEM 1. REPORTS TO STOCKHOLDERS.
AMERICAN CENTURY INVESTMENTS
Semiannual Report
September 30, 2006
[photo of fall trees]
Prime Money Market Fund
[american century investments logo and text logo]
Our Message to You
[photo of James E. Stowers III and James E. Stowers, Jr.]
/s/James E. Stowers, Jr.
James E. Stowers, Jr.
FOUNDER
AMERICAN CENTURY COMPANIES, INC.
/s/James E. Stowers III
James E. Stowers III
CHAIRMAN OF THE BOARD
AMERICAN CENTURY COMPANIES, INC.
We are pleased to provide you with the semiannual report for the American
Century Prime Money Market Fund for the six months ended September 30, 2006. We
hope you find this information helpful in monitoring your investment. Another
useful resource we offer is our website, americancentury.com, where we post
quarterly portfolio commentaries, the views of senior investment officers and
analysts, and other communications about investments, portfolio strategy,
personal finance, and the markets.
In its most recent rankings, Dalbar -- which issues customer satisfaction
ratings and rankings based on website functionality -- ranked
americancentury.com fourth out of the sites provided by the top 25 fund
companies that it believes lead the industry in web-based technology. Our
website earned an "Excellent" rating, Dalbar's highest designation.
For most of 2006, our website has linked visitors to information explaining our
strategic collaboration with Lance Armstrong and the Lance Armstrong Foundation
(LAF). This campaign, featuring Lance, is designed to encourage investors to
take a more active role in planning their financial futures and make every
investment decision count. To learn more about the collaboration and the LAF,
please visit americancentury.com or www.lanceface.com on the Web and click on
the links to related sites.
With the approach of year end and the 2006 tax season, you can also find out
more about December fund distributions and tax information via a link from our
website. We've posted December distribution estimates for over 50 funds, answers
to frequent distribution questions, and online descriptions of all of the tax
information we provide to investors.
If you haven't visited americancentury.com yet, we encourage you to do so . . .
it's there to serve you. And so are we. As always, we deeply appreciate your
commitment to American Century Investments.
Table of Contents
Market Perspective . . . . . . . . . . . . . . . . . . . . . . . . . . . . 2
U.S. Fixed-Income Total Returns . . . . . . . . . . . . . . . . . . . . 2
PRIME MONEY MARKET
Performance . . . . . . . . . . . . . . . . . . . . . . . . . . . . . . . . 3
Portfolio Commentary . . . . . . . . . . . . . . . . . . . . . . . . . . . 5
Shareholder Fee Example . . . . . . . . . . . . . . . . . . . . . . . . . . 6
Schedule of Investments . . . . . . . . . . . . . . . . . . . . . . . . . . 8
FINANCIAL STATEMENTS
Statement of Assets and Liabilities . . . . . . . . . . . . . . . . . . . 14
Statement of Operations . . . . . . . . . . . . . . . . . . . . . . . . . 15
Statement of Changes in Net Assets . . . . . . . . . . . . . . . . . . . . 16
Notes to Financial Statements . . . . . . . . . . . . . . . . . . . . . . 17
Financial Highlights . . . . . . . . . . . . . . . . . . . . . . . . . . . 21
OTHER INFORMATION
Approval of Management Agreement for Prime Money Market . . . . . . . . . 26
Share Class Information . . . . . . . . . . . . . . . . . . . . . . . . . 31
Additional Information . . . . . . . . . . . . . . . . . . . . . . . . . . 32
Index Definitions . . . . . . . . . . . . . . . . . . . . . . . . . . . . 33
The opinions expressed in the Market Perspective and the Portfolio Commentary
reflect those of the portfolio management team as of the date of the report, and
do not necessarily represent the opinions of American Century or any other
person in the American Century organization. Any such opinions are subject to
change at any time based upon market or other conditions and American Century
disclaims any responsibility to update such opinions. These opinions may not be
relied upon as investment advice and, because investment decisions made by
American Century funds are based on numerous factors, may not be relied upon as
an indication of trading intent on behalf of any American Century fund. Security
examples are used for representational purposes only and are not intended as
recommendations to purchase or sell securities. Performance information for
comparative indices and securities is provided to American Century by third
party vendors. To the best of American Century's knowledge, such information is
accurate at the time of printing.
Market Perspective
[photo of David MacEwen]
BY DAVID MACEWEN, CHIEF INVESTMENT OFFICER, FIXED INCOME
A TALE OF TWO QUARTERS
The second and third quarters of 2006 were very different in terms of inflation
and interest rate expectations and market performance. In the second quarter, as
core inflation rates remained above the Federal Reserve's 1-2% "comfort zone"
and threatened to go higher, investors feared the Fed would keep raising
interest rates and tip the economy into recession. Uncertainty about how far the
Fed would go, and how successful it would be in containing inflation, created a
defensive attitude in financial markets that resulted in disappointing returns
for broad stock and bond indices.
A FED PAUSE REFRESHED THE MARKETS
But in the third quarter, a 15% drop in oil prices helped take the heat off
inflation pressures, and cut business and consumer costs. Weakness in the
housing market--though hard on many homeowners--turned into a positive factor
for the markets. As home sales and prices declined, the Fed stopped its interest
rate tightening campaign, stepping back to assess the economy's reaction to
previous rate hikes. This combination of falling energy prices and relief from
rising interest rates helped broad U.S. stock and bond markets rebound from
second-quarter losses to post some of their biggest quarterly gains this decade.
LONG-DURATION AND CORPORATE SECURITIES OUTPERFORMED
The bond market especially welcomed a gloomy housing-market forecast,
speculating that it would reduce economic growth, inflation, and interest rates.
This rekindled demand for longer-term fixed-income securities. As a result, the
Treasury yield curve fell for the six months and "inverted", as the two-year
yield (4.69%) remained higher than the 10-year yield (4.63%), and both fell well
below the Fed's 5.25% overnight interest rate target. Mirroring the stock
market's rally, the corporate sectors led the broad taxable market.
U.S. FIXED-INCOME TOTAL RETURNS
For the six months ended September 30, 2006*
- --------------------------------------------------------------------------------
TREASURY SECURITIES
- --------------------------------------------------------------------------------
3-month T-Bill 2.51%
- --------------------------------------------------------------------------------
2-year T-Note 2.53%
- --------------------------------------------------------------------------------
5-year T-Note 3.20%
- --------------------------------------------------------------------------------
10-year T-Note 3.83%
- --------------------------------------------------------------------------------
30-year T-Bond 4.64%
- --------------------------------------------------------------------------------
LEHMAN BROTHERS U.S. BOND MARKET INDICES
- --------------------------------------------------------------------------------
Corporate High-Yield 4.33%
- --------------------------------------------------------------------------------
Corporate Investment-Grade 4.12%
- --------------------------------------------------------------------------------
Aggregate (multi-sector) 3.73%
- --------------------------------------------------------------------------------
Fixed-Rate Mortgage-Backed 3.64%
- --------------------------------------------------------------------------------
Treasury 3.61%
- --------------------------------------------------------------------------------
Agency 3.45%
- --------------------------------------------------------------------------------
*Total returns for periods less than one year are not annualized.
- ------
2
Prime Money Market - Performance
TOTAL RETURNS AS OF SEPTEMBER 30, 2006
--------------------------------
AVERAGE ANNUAL RETURNS
- -------------------------------------------------------------------------------------------------
SINCE INCEPTION
6 MONTHS(1) 1 YEAR 5 YEARS 10 YEARS INCEPTION DATE
- -------------------------------------------------------------------------------------------------
INVESTOR CLASS(2) 2.34% 4.28% 1.90% 3.51% 3.85% 11/17/93
- -------------------------------------------------------------------------------------------------
90-DAY U.S.
TREASURY BILL INDEX 2.34% 4.38% 2.20% 3.59% 3.89%(3) --
- -------------------------------------------------------------------------------------------------
LIPPER MONEY MARKET
INSTRUMENT FUNDS
AVERAGE RETURN(4) 2.13% 3.83% 1.59% 3.25% 3.61%(3) --
- -------------------------------------------------------------------------------------------------
Fund's Lipper Ranking
among Money Market
Instrument Funds(4) 59 of 357 53 of 355 59 of 294 44 of 186 27 of 131(3) --
- -------------------------------------------------------------------------------------------------
Advisor Class(2) 2.22% 4.02% 1.65% -- 2.86% 8/28/98
- -------------------------------------------------------------------------------------------------
A Class(2) 1/31/03
No sales charge* 2.22% 4.04% -- -- 1.83%
With sales charge* 1.22% 4.04% -- -- 1.83%
- -------------------------------------------------------------------------------------------------
B Class(2) 1/31/03
No sales charge* 1.84% 3.25% -- -- 1.30%
With sales charge* -3.16% -0.75% -- -- 0.50%
- -------------------------------------------------------------------------------------------------
C Class(2) 5/7/02
No sales charge* 1.97% 3.52% -- -- 1.25%
With sales charge* 1.22% 3.52% -- -- 1.25%
- -------------------------------------------------------------------------------------------------
*Sales charges include initial sales charges and contingent deferred sales
charges (CDSCs), as applicable. (Please see the Share Class Information page
for more about the applicable sales charges for each share class.) The SEC
requires that mutual funds provide performance information net of maximum
sales charges in all cases where charges could be applied.
(1) Total returns for periods less than one year are not annualized.
(2) Class returns would have been lower if American Century had not voluntarily
waived a portion of its management fees or its distribution and service
fees, as applicable.
(3) Since 11/30/93, the date nearest the Investor Class's inception for which
data are available.
(4) Data provided by Lipper Inc. - A Reuters Company. (c) 2006 Reuters. All
rights reserved. Any copying, republication or redistribution of Lipper
content, including by caching, framing or similar means, is expressly
prohibited without the prior written consent of Lipper. Lipper shall not be
liable for any errors or delays in the content, or for any actions taken in
reliance thereon.
Lipper Fund Performance -- Performance data is total return, and is
preliminary and subject to revision.
Lipper Rankings -- Rankings are based only on the universe shown and are
based on average annual total returns. This listing might not represent the
complete universe of funds tracked by Lipper.
The data contained herein has been obtained from company reports, financial
reporting services, periodicals and other resources believed to be reliable.
Although carefully verified, data on compilations is not guaranteed by
Lipper and may be incomplete. No offer or solicitations to buy or sell any
of the securities herein is being made by Lipper.
Data presented reflect past performance. Past performance is no guarantee of
future results. Current performance may be higher or lower than the performance
shown. To obtain performance data current to the most recent month end, please
call 1-800-345-2021 or visit americancentury.com.
An investment in the fund is not insured or guaranteed by the Federal Deposit
Insurance Corporation or any other government agency. Although the fund seeks to
preserve the value of your investment at $1.00 per share, it is possible to lose
money by investing in the fund.
The 7-day current yield more closely reflects the current earnings of the fund
than the total return.
(continued)
- ------
3
Prime Money Market - Performance
PORTFOLIO COMPOSITION BY CREDIT RATING
- --------------------------------------------------------------------------------
% OF FUND % OF FUND
INVESTMENTS INVESTMENTS
AS OF AS OF
9/30/06 3/31/06
- --------------------------------------------------------------------------------
A-1+ 71% 63%
- --------------------------------------------------------------------------------
A-1 29% 37%
- --------------------------------------------------------------------------------
Ratings provided by independent research companies. These ratings are listed in
Standard & Poor's format even if they were provided by other sources.
YIELDS AND WEIGHTED AVERAGE MATURITY
- --------------------------------------------------------------------------------
7-DAY CURRENT YIELD AS OF SEPTEMBER 30, 2006*
- --------------------------------------------------------------------------------
Investor Class 4.86%
- --------------------------------------------------------------------------------
Advisor Class 4.61%
- --------------------------------------------------------------------------------
A Class 4.61%
- --------------------------------------------------------------------------------
B Class 3.86%
- --------------------------------------------------------------------------------
C Class 4.11%
- --------------------------------------------------------------------------------
7-DAY EFFECTIVE YIELD AS OF SEPTEMBER 30, 2006*
- --------------------------------------------------------------------------------
Investor Class 4.97%
- --------------------------------------------------------------------------------
Advisor Class 4.71%
- --------------------------------------------------------------------------------
A Class 4.72%
- --------------------------------------------------------------------------------
B Class 3.93%
- --------------------------------------------------------------------------------
C Class 4.19%
- --------------------------------------------------------------------------------
9/30/06 3/31/06
- --------------------------------------------------------------------------------
Weighted Average
Maturity 51 days 41 days
- --------------------------------------------------------------------------------
*The yields presented reflect the waiver of a portion of the fund's management
fees. Without such waiver, the 30-day yields would have been lower.
PORTFOLIO COMPOSITION BY MATURITY
- --------------------------------------------------------------------------------
% OF FUND % OF FUND
INVESTMENTS INVESTMENTS
AS OF AS OF
9/30/06 3/31/06
- --------------------------------------------------------------------------------
1--30 days 49% 56%
- --------------------------------------------------------------------------------
31--90 days 35% 34%
- --------------------------------------------------------------------------------
91--180 days 13% 7%
- --------------------------------------------------------------------------------
More than 180 days 3% 3%
- --------------------------------------------------------------------------------
Data presented reflect past performance. Past performance is no guarantee of
future results. Current performance may be higher or lower than the performance
shown. To obtain performance data current to the most recent month end, please
call 1-800-345-2021 or visit americancentury.com.
An investment in the fund is not insured or guaranteed by the Federal Deposit
Insurance Corporation or any other government agency. Although the fund seeks to
preserve the value of your investment at $1.00 per share, it is possible to lose
money by investing in the fund.
The 7-day current yield more closely reflects the current earnings of the fund
than the total return.
- ------
4
Prime Money Market - Portfolio Commentary
PORTFOLIO MANAGERS: DENISE LATCHFORD AND STEVEN PERMUT
PERFORMANCE SUMMARY
Prime Money Market returned 2.34%* for the six months ended September 30, 2006,
outperforming the 2.13% average return of the 357 funds in Lipper Inc.'s money
market funds category. The fund's six-month return ranked in the top 17% of the
Lipper category, and its longer-term performance rankings were similarly strong
(see page 3).
HIGHER BUT MORE STABLE MONEY MARKET RATES
Money market rates continued to rise over the past six months. Responding to
higher-than-expected inflation figures, the Federal Reserve raised short-term
interest rates in May and June, boosting the federal funds rate to 5.25%, a
level not seen since March 2001. The three-month Treasury bill yield--a common
benchmark for money market rates--tracked the Fed rate hikes, rising from 4.6%
to just over 5% by the end of June.
However, after 17 consecutive rate increases between June 2004 and June 2006,
the Fed chose to keep short-term interest rates steady at its policy meetings in
August and September. The Fed made note of slowing economic activity and
expectations of moderating inflation, borne out by a decline in energy and
commodity prices. With the Fed on hold, money market rates stabilized and
trended slightly lower; the three-month Treasury bill yield ended the period at
4.9%.
PORTFOLIO STRATEGY
Prime Money Market's seven-day current yield increased from 4.22% to 4.86%
during the six-month period. For most of the period, we maintained a relatively
short average maturity of 40 to 45 days, which allowed the fund's yield to
reflect higher rates more quickly. However, we extended the average maturity out
to more than 50 days in September, when it became clear the Fed was taking a
prolonged hiatus from raising interest rates.
Sector weightings in the portfolio changed very little during the period. We
continued to invest a little more than half of the portfolio in commercial
paper, while modestly increasing our position in floating-rate corporate notes.
The yields of these floating-rate notes are tied to rate indexes that are
typically higher than prevailing commercial paper yields, making the
floating-rate notes attractive even in a stable-to-declining interest rate
environment.
LOOKING AHEAD
Based on historical averages, the Fed typically begins cutting short-term rates
about nine months after its final rate hike; the question is whether the Fed's
latest rate hike in June was the final one in the cycle. Economic and inflation
data in the coming months will provide some clues, and we believe money market
rates will remain relatively stable in the meantime.
Keep in mind that a money market fund like Prime Money Market can help preserve
capital and add stability to a diversified portfolio in any market environment.
*All fund returns, rankings and yields referenced in this commentary are for
Investor Class shares. Total returns for periods less than one year are not
annualized.
- ------
5
Shareholder Fee Example (Unaudited)
Fund shareholders may incur two types of costs: (1) transaction costs, including
sales charges (loads) on purchase payments and redemption/exchange fees; and (2)
ongoing costs, including management fees; distribution and service (12b-1) fees;
and other fund expenses. This example is intended to help you understand your
ongoing costs (in dollars) of investing in your fund and to compare these costs
with the ongoing cost of investing in other mutual funds.
The example is based on an investment of $1,000 made at the beginning of the
period and held for the entire period from April 1, 2006 to September 30, 2006.
ACTUAL EXPENSES
The table provides information about actual account values and actual expenses
for each class. You may use the information, together with the amount you
invested, to estimate the expenses that you paid over the period. First,
identify the share class you own. Then simply divide your account value by
$1,000 (for example, an $8,600 account value divided by $1,000 = 8.6), then
multiply the result by the number under the heading "Expenses Paid During
Period" to estimate the expenses you paid on your account during this period.
If you hold Investor Class shares of any American Century fund, or Institutional
Class shares of the American Century Diversified Bond Fund, in an American
Century account (i.e., not a financial intermediary or retirement plan account),
American Century may charge you a $12.50 semiannual account maintenance fee if
the value of those shares is less than $10,000. We will redeem shares
automatically in one of your accounts to pay the $12.50 fee. In determining your
total eligible investment amount, we will include your investments in all
PERSONAL ACCOUNTS (including American Century Brokerage accounts) registered
under your Social Security number. PERSONAL ACCOUNTS include individual
accounts, joint accounts, UGMA/UTMA accounts, personal trusts, Coverdell
Education Savings Accounts and IRAs (including traditional, Roth, Rollover,
SEP-, SARSEP- and SIMPLE-IRAs), and certain other retirement accounts. If you
have only business, business retirement, employer-sponsored or American Century
Brokerage accounts, you are currently not subject to this fee. We will not
charge the fee as long as you choose to manage your accounts exclusively online.
If you are subject to the Account Maintenance Fee, your account value could be
reduced by the fee amount.
HYPOTHETICAL EXAMPLE FOR COMPARISON PURPOSES
The table also provides information about hypothetical account values and
hypothetical expenses based on the actual expense ratio of each class of your
fund and an assumed rate of return of 5% per year before expenses, which is not
the actual return of a fund's share class. The hypothetical account values and
expenses may not be used to estimate the actual ending account balance or
expenses you paid for the period. You may use this information to compare the
ongoing costs of investing in your fund and other funds. To do so, compare this
5% hypothetical example with the 5% hypothetical
(continued)
- ------
6
Shareholder Fee Example (Unaudited)
examples that appear in the shareholder reports of the other funds.
Please note that the expenses shown in the table are meant to highlight your
ongoing costs only and do not reflect any transactional costs, such as sales
charges (loads) or redemption/exchange fees. Therefore, the table is useful in
comparing ongoing costs only, and will not help you determine the relative total
costs of owning different funds. In addition, if these transactional costs were
included, your costs would have been higher.
- -------------------------------------------------------------------------------------------------
EXPENSES PAID
BEGINNING ENDING DURING PERIOD(1) ANNUALIZED
ACCOUNT VALUE ACCOUNT VALUE 4/1/06 - EXPENSE
4/1/06 9/30/06 9/30/06 RATIO(1)
- -------------------------------------------------------------------------------------------------
PRIME MONEY MARKET SHAREHOLDER FEE EXAMPLE
- -------------------------------------------------------------------------------------------------
ACTUAL
- -------------------------------------------------------------------------------------------------
Investor Class (after waiver)(2) $1,000 $1,023.40 $2.79 0.55%
- -------------------------------------------------------------------------------------------------
Investor Class (before waiver) $1,000 $1,023.40(3) $2.99 0.59%
- -------------------------------------------------------------------------------------------------
Advisor Class (after waiver)(2) $1,000 $1,022.20 $4.06 0.80%
- -------------------------------------------------------------------------------------------------
Advisor Class (before waiver) $1,000 $1,022.20(3) $4.26 0.84%
- -------------------------------------------------------------------------------------------------
A Class (after waiver)(2) $1,000 $1,022.20 $4.06 0.80%
- -------------------------------------------------------------------------------------------------
A Class (before waiver) $1,000 $1,022.20(3) $4.26 0.84%
- -------------------------------------------------------------------------------------------------
B Class (after waiver)(2) $1,000 $1,018.40 $7.84 1.55%
- -------------------------------------------------------------------------------------------------
B Class (before waiver) $1,000 $1,018.40(3) $8.05 1.59%
- -------------------------------------------------------------------------------------------------
C Class (after waiver)(2) $1,000 $1,019.70 $6.58 1.30%
- -------------------------------------------------------------------------------------------------
C Class (before waiver) $1,000 $1,019.70(3) $6.78 1.34%
- -------------------------------------------------------------------------------------------------
HYPOTHETICAL
- -------------------------------------------------------------------------------------------------
Investor Class (after waiver)(2) $1,000 $1,022.31 $2.79 0.55%
- -------------------------------------------------------------------------------------------------
Investor Class (before waiver) $1,000 $1,022.11 $2.99 0.59%
- -------------------------------------------------------------------------------------------------
Advisor Class (after waiver)(2) $1,000 $1,021.06 $4.05 0.80%
- -------------------------------------------------------------------------------------------------
Advisor Class (before waiver) $1,000 $1,020.86 $4.26 0.84%
- -------------------------------------------------------------------------------------------------
A Class (after waiver)(2) $1,000 $1,021.06 $4.05 0.80%
- -------------------------------------------------------------------------------------------------
A Class (before waiver) $1,000 $1,020.86 $4.26 0.84%
- -------------------------------------------------------------------------------------------------
B Class (after waiver)(2) $1,000 $1,017.30 $7.84 1.55%
- -------------------------------------------------------------------------------------------------
B Class (before waiver) $1,000 $1,017.10 $8.04 1.59%
- -------------------------------------------------------------------------------------------------
C Class (after waiver)(2) $1,000 $1,018.55 $6.58 1.30%
- -------------------------------------------------------------------------------------------------
C Class (before waiver) $1,000 $1,018.35 $6.78 1.34%
- -------------------------------------------------------------------------------------------------
(1) Expenses are equal to the class's annualized expense ratio listed in the
table above, multiplied by the average account value over the period,
multiplied by 183, the number of days in the most recent fiscal half-year,
divided by 365, to reflect the one-half year period.
(2) During the six months ended September 30, 2006, the class received a
partial waiver of its management fees.
(3) Ending account value assumes the return earned after waiver. The return
would have been lower had fees not been waived and would have resulted in a
lower ending account value.
- ------
7
Prime Money Market - Schedule of Investments
SEPTEMBER 30, 2006 (UNAUDITED)
Principal Amount Value
- --------------------------------------------------------------------------------
COMMERCIAL PAPER(1) -- 51.7%
- --------------------------------------------------------------------------------
$11,500,000 Allied Irish Banks N.A.,
5.32%, 10/23/06
(Acquired 8/4/06,
Cost $11,364,044)(2) $ 11,462,612
- --------------------------------------------------------------------------------
576,000 American Family Financial
Services, 5.40%, 11/22/06 571,507
- --------------------------------------------------------------------------------
12,000,000 American Family Financial
Services, 5.39%, 12/11/06 11,872,437
- --------------------------------------------------------------------------------
35,000,000 Amstel Funding Corp., 5.23%,
1/26/07 (Acquired 9/25/06,
Cost $34,380,257)(2) 34,405,656
- --------------------------------------------------------------------------------
30,000,000 Amstel Funding Corp., 5.27%,
2/21/07 (Acquired 8/23/06,
Cost $29,209,500)(2) 29,371,992
- --------------------------------------------------------------------------------
22,600,000 ANZ Inc., 5.04%, 10/19/06 22,543,048
- --------------------------------------------------------------------------------
30,000,000 Calyon North America Inc.,
5.25%, 10/4/06 29,986,887
- --------------------------------------------------------------------------------
30,000,000 Calyon North America Inc.,
5.41%, 10/19/06 29,918,850
- --------------------------------------------------------------------------------
18,500,000 Canadian Imperial Holdings,
5.25%, 12/11/06 18,308,448
- --------------------------------------------------------------------------------
12,000,000 Cedar Springs Capital Co.,
5.40%, 10/12/06 (Acquired
7/14/06, Cost $11,838,000)(2) 11,980,200
- --------------------------------------------------------------------------------
12,000,000 Cedar Springs Capital Co.,
5.31%, 11/17/06
(Acquired 8/14/06,
Cost $11,831,850)(2) 11,916,810
- --------------------------------------------------------------------------------
10,000,000 Cedar Springs Capital Co.,
5.28%, 12/12/06 (Acquired
9/12/06, Cost $9,866,660)(2) 9,894,500
- --------------------------------------------------------------------------------
30,000,000 Cedar Springs Capital Co.,
5.24%, 3/12/07 (Acquired
9/13/06, Cost $29,214,000)(2) 29,292,600
- --------------------------------------------------------------------------------
50,000,000 CRC Funding LLC, 5.26%,
12/15/06 (Acquired 9/18/06,
Cost $49,357,111)(2) 49,452,083
- --------------------------------------------------------------------------------
35,000,000 Crown Point Capital Co.,
5.37%, 10/5/06 (Acquired
8/3/06, Cost $34,671,088)(2) 34,979,116
- --------------------------------------------------------------------------------
7,203,000 Crown Point Capital Co.,
5.27%, 10/20/06 (Acquired
9/12/06, Cost $7,162,931)(2) 7,182,966
- --------------------------------------------------------------------------------
22,008,000 Crown Point Capital Co.,
5.32%, 11/6/06 (Acquired
8/7/06, Cost $21,712,041)(2) 21,890,917
- --------------------------------------------------------------------------------
19,900,000 Danske Corporation, 5.25%,
12/8/06 (Acquired 9/19/06,
Cost $19,667,833)(2) 19,702,658
- --------------------------------------------------------------------------------
7,850,000 Danske Corporation, 5.26%,
1/18/07 (Acquired 9/15/06,
Cost $7,706,765)(2) 7,725,099
- --------------------------------------------------------------------------------
15,880,000 Danske Corporation, 5.24%,
2/1/07 (Acquired 9/1/06,
Cost $15,526,352)(2) 15,595,695
- --------------------------------------------------------------------------------
40,000,000 Depfa Bank plc, 5.25%,
12/1/06 (Acquired 9/1/06 -
9/5/06, Cost $39,475,813)(2) 39,643,929
- --------------------------------------------------------------------------------
Principal Amount Value
- --------------------------------------------------------------------------------
$13,000,000 Dexia Delaware LLC,
5.27%, 10/10/06 $ 12,982,889
- --------------------------------------------------------------------------------
13,958,000 Emerald Notes of the MBNA,
5.38%, 10/3/06 (Acquired
7/21/06, Cost $13,803,640)(2) 13,953,828
- --------------------------------------------------------------------------------
17,000,000 Emerald Notes of the MBNA,
5.40%, 10/3/06 (Acquired
7/20/06, Cost $16,808,750)(2) 16,994,900
- --------------------------------------------------------------------------------
7,000,000 Emerald Notes of the MBNA,
5.41%, 10/10/06 (Acquired
7/7/06, Cost $6,900,065)(2) 6,990,532
- --------------------------------------------------------------------------------
6,000,000 Emerald Notes of the MBNA,
5.31%, 11/16/06 (Acquired
8/11/06, Cost $5,914,155)(2) 5,959,290
- --------------------------------------------------------------------------------
11,000,000 Emerald Notes of the MBNA,
5.29%, 11/21/06 (Acquired
8/18/06, Cost $10,846,588)(2) 10,917,642
- --------------------------------------------------------------------------------
7,005,000 Govco Incorporated, 5.32%,
10/10/06 (Acquired 8/7/06,
Cost $6,938,748)(2) 6,995,683
- --------------------------------------------------------------------------------
28,000,000 Govco Incorporated, 5.27%,
10/16/06 (Acquired 8/23/06,
Cost $27,778,660)(2) 27,938,517
- --------------------------------------------------------------------------------
17,000,000 Govco Incorporated, 5.27%,
12/18/06 (Acquired 9/18/06,
Cost $16,773,536)(2) 16,805,888
- --------------------------------------------------------------------------------
28,000,000 HBOS Treasury Services plc,
5.36%, 11/3/06 27,862,427
- --------------------------------------------------------------------------------
32,500,000 ING (U.S.) Funding LLC,
5.25%, 12/8/06 32,177,708
- --------------------------------------------------------------------------------
30,000,000 IXIS, 5.30%, 11/6/06
(Acquired 8/7/06,
Cost $29,598,083)(2) 29,841,000
- --------------------------------------------------------------------------------
34,000,000 IXIS, 5.24%, 1/26/07
(Acquired 9/7/06,
Cost $33,302,207)(2) 33,420,980
- --------------------------------------------------------------------------------
25,000,000 Legacy Capital LLC, 5.40%,
10/16/06 (Acquired 7/19/06,
Cost $24,666,250)(2) 24,943,750
- --------------------------------------------------------------------------------
10,135,000 Legacy Capital LLC, 5.26%,
12/4/06 (Acquired 9/5/06,
Cost $10,001,725)(2) 10,040,227
- --------------------------------------------------------------------------------
29,000,000 Legacy Capital LLC, 5.26%,
2/23/07 (Acquired 8/23/06,
Cost $28,220,351)(2) 28,385,603
- --------------------------------------------------------------------------------
16,000,000 Lexington Parker Capital,
5.36%, 10/18/06 (Acquired
7/28/06, Cost $15,804,658)(2) 15,959,502
- --------------------------------------------------------------------------------
23,000,000 Lexington Parker Capital,
5.28%, 11/6/06 (Acquired
8/9/06, Cost $22,699,773)(2) 22,878,560
- --------------------------------------------------------------------------------
20,000,000 Lexington Parker Capital,
5.26%, 1/8/07 (Acquired
9/7/06, Cost $19,640,908)(2) 19,710,975
- --------------------------------------------------------------------------------
3,110,000 Lexington Parker Capital,
5.25%, 2/16/07 (Acquired
9/15/06, Cost $3,040,155)(2) 3,047,411
- --------------------------------------------------------------------------------
8,062,000 Nieuw Amsterdam Rec,
5.375%, 10/2/06 (Acquired
9/29/06, Cost $8,058,389)(2) 8,060,796
- --------------------------------------------------------------------------------
See Notes to Financial Statements. (continued)
- ------
8
Prime Money Market - Schedule of Investments
SEPTEMBER 30, 2006 (UNAUDITED)
Principal Amount Value
- --------------------------------------------------------------------------------
$ 6,000,000 Nieuw Amsterdam Rec,
5.27%, 10/12/06 (Acquired
9/8/06, Cost $5,970,137)(2) $ 5,990,338
- --------------------------------------------------------------------------------
26,000,000 Nieuw Amsterdam Rec,
5.38%, 10/23/06 (Acquired
7/24/06, Cost $25,646,414)(2) 25,914,518
- --------------------------------------------------------------------------------
19,525,000 Nieuw Amsterdam Rec,
5.27%, 10/26/06 (Acquired
9/22/06, Cost $19,427,820)(2) 19,453,544
- --------------------------------------------------------------------------------
19,200,000 Paradigm Funding LLC,
5.26%, 10/23/06 (Acquired
9/22/06, Cost $19,113,035)(2) 19,138,283
- --------------------------------------------------------------------------------
10,000,000 Paradigm Funding LLC,
5.20%, 2/26/07 (Acquired
9/25/06, Cost $9,777,556)(2) 9,786,222
- --------------------------------------------------------------------------------
10,163,000 Ranger Funding Co. LLC,
5.27%, 11/9/06 (Acquired
9/28/06, Cost $10,100,514)(2) 10,104,978
- --------------------------------------------------------------------------------
35,000,000 Societe Generale, 5.31%,
11/7/06 34,809,167
- --------------------------------------------------------------------------------
8,000,000 Spintab AB, 5.37%,
11/3/06 7,960,657
- --------------------------------------------------------------------------------
5,550,000 Spintab AB, 5.30%,
11/13/06 5,514,865
- --------------------------------------------------------------------------------
8,500,000 Spintab AB, 5.27%,
11/27/06 8,429,075
- --------------------------------------------------------------------------------
35,000,000 Spintab AB, 5.25%,
12/19/06 34,596,771
- --------------------------------------------------------------------------------
47,000,000 Stadshypotek Deleware, Inc.,
5.27%, 10/16/06 (Acquired
8/15/06 - 8/17/06, Cost
$46,584,536)(2) 46,896,867
- --------------------------------------------------------------------------------
14,000,000 Stadshypotek Deleware, Inc.,
5.26%, 11/27/06 (Acquired
8/31/06, Cost $13,819,991)(2) 13,883,403
- --------------------------------------------------------------------------------
23,000,000 Thunder Bay Funding LLC,
5.39%, 10/16/06 (Acquired
7/18/06, Cost $22,690,075)(2) 22,948,346
- --------------------------------------------------------------------------------
50,000,000 Toyota Motor Credit Corp.,
5.25%, 11/20/06 49,635,417
- --------------------------------------------------------------------------------
15,000,000 Variable Funding Capital Co.
LLC, VRN, 5.28%, 10/12/06,
resets monthly off the 1-month
LIBOR minus 0.05% with no caps
(Acquired 8/9/06,
Cost $15,000,000)(2) 15,000,000
- --------------------------------------------------------------------------------
6,000,000 Variable Funding Corp.,
5.36%, 10/2/06 (Acquired
9/29/06, Cost $5,997,320)(2) 5,999,107
- --------------------------------------------------------------------------------
6,396,000 Windmill Funding Corp.,
5.37%, 10/2/06 (Acquired
9/29/06, Cost $6,393,138)(2) 6,395,046
- --------------------------------------------------------------------------------
20,000,000 Windmill Funding Corp.,
5.27%, 11/9/06 (Acquired
9/28/06, Cost $19,877,033)(2) 19,885,817
- --------------------------------------------------------------------------------
TOTAL COMMERCIAL PAPER 1,185,908,539
- --------------------------------------------------------------------------------
Principal Amount Value
- --------------------------------------------------------------------------------
CORPORATE BONDS -- 20.5%
- --------------------------------------------------------------------------------
$ 3,260,000 A&M Hospital Convention
Center, VRN, 5.37%,
10/5/06 (LOC: Columbus
Bank & Trust) $ 3,260,000
- --------------------------------------------------------------------------------
1,285,000 A&M Hospitalities LLC,
VRN, 5.37%, 10/5/06 (LOC:
Columbus Bank & Trust) 1,285,000
- --------------------------------------------------------------------------------
5,600,000 AIK Partners LLC, VRN,
5.32%, 10/5/06 (LOC:
Wachovia Bank N.A.) 5,600,000
- --------------------------------------------------------------------------------
25,000,000 American Honda Finance
Corp., VRN, 5.66%, 10/6/06,
resets quarterly off the
3-month LIBOR plus 0.17%
with no caps (Acquired
4/6/06, Cost $25,025,000)(2) 25,000,700
- --------------------------------------------------------------------------------
30,000,000 Bank of America N.A.,
VRN, 5.36%, 11/24/06,
resets quarterly off the
3-month LIBOR minus
0.05% with no caps 30,000,000
- --------------------------------------------------------------------------------
13,450,000 Berkshire Hathaway Finance
Corp., 3.40%, 7/2/07 13,236,864
- --------------------------------------------------------------------------------
5,775,000 Capital Markets Access Co.
LLC, VRN, 5.38%, 10/5/06 5,775,000
- --------------------------------------------------------------------------------
1,950,000 Capital Markets Access Co.
LLC, VRN, 5.38%, 10/5/06 1,950,000
- --------------------------------------------------------------------------------
930,000 Capital Markets Access Co.
LLC, VRN, 5.38%, 10/5/06 930,000
- --------------------------------------------------------------------------------
4,410,000 Chaffee Point Hospitalities
LLC, VRN, 5.37%,
10/5/06 (LOC: Columbus
Bank & Trust) 4,410,000
- --------------------------------------------------------------------------------
11,605,000 Cityscape SCP LLC, VRN,
5.33%, 10/5/06 (LOC:
Columbus Bank & Trust) 11,605,000
- --------------------------------------------------------------------------------
2,400,000 Coastal Area Stores Inc./
Tattnall Foods Inc., VRN,
5.37%, 10/5/06 (LOC:
Columbus Bank & Trust) 2,400,000
- --------------------------------------------------------------------------------
3,550,000 Colorado Natural Gas Inc.,
VRN, 5.38%, 10/5/06
(LOC: Harris Trust &
Savings Bank) 3,550,000
- --------------------------------------------------------------------------------
4,025,000 Colorado Natural Gas Inc.,
VRN, 5.38%, 10/5/06 4,025,000
- --------------------------------------------------------------------------------
5,170,000 Dormitory Partnership
Phase I, VRN, 5.37%,
10/5/06 (LOC: Allied Irish
Bank plc) 5,170,000
- --------------------------------------------------------------------------------
8,245,000 Fiore Capital LLC, VRN,
5.32%, 10/5/06 8,245,000
- --------------------------------------------------------------------------------
22,000,000 Florida Hurricane
Catastrophe Fund, Series
2006 B, VRN, 5.34%, 10/16/06,
resets monthly off the 1-month LIBOR
plus 0.01% with no caps 22,000,000
- --------------------------------------------------------------------------------
See Notes to Financial Statements. (continued)
- ------
9
Prime Money Market - Schedule of Investments
SEPTEMBER 30, 2006 (UNAUDITED)
Principal Amount Value
- --------------------------------------------------------------------------------
$ 2,000,000 Freehold Young Men's
Christian Association
(The), VRN, 5.33%, 10/5/06
(LOC: Wachovia Bank N.A.) $ 2,000,000
- --------------------------------------------------------------------------------
5,000,000 General Electric Capital
Corp., VRN, 5.39%, 12/8/06,
resets quarterly off the
3-month LIBOR with no caps 5,000,470
- --------------------------------------------------------------------------------
21,000,000 Gwinnett Instructional LLC,
VRN, 5.33%, 10/5/06 (LOC:
Allied Irish Bank plc) 21,000,000
- --------------------------------------------------------------------------------
25,000,000 HBOS Treasury Services plc,
VRN, 5.58%, 10/12/06,
resets quarterly off the
3-month LIBOR plus 0.08%
with no caps (Acquired
1/12/06, Cost $25,030,000)(2) 25,008,466
- --------------------------------------------------------------------------------
5,990,000 Herman & Kittle Capital LLC,
VRN, 5.37%, 10/5/06
(LOC: FHLB) 5,990,000
- --------------------------------------------------------------------------------
1,520,000 Herman & Kittle Capital LLC,
VRN, 5.37%, 10/5/06
(LOC: FHLB) 1,520,000
- --------------------------------------------------------------------------------
23,655,000 KMS Fed Ex L.P., VRN,
5.50%, 10/2/06 (LOC:
Union Bank of California) 23,655,000
- --------------------------------------------------------------------------------
6,250,000 McMurry Residence
Partnership I Ltd., VRN,
5.37%, 10/5/06 (LOC:
Wells Fargo Bank N.A. ) 6,250,000
- --------------------------------------------------------------------------------
7,100,000 Mullenix-St Charles
Properties LP, VRN, 5.33%,
10/5/06 (LOC: ABN
AMRO Bank N.V.) 7,100,000
- --------------------------------------------------------------------------------
5,500,000 Oklahoma Christian
University Inc., VRN, 5.37%,
10/5/06 (LOC: FHLB) 5,500,000
- --------------------------------------------------------------------------------
10,530,000 OSS Realty Co., VRN,
5.40%, 10/5/06 (LOC:
SunTrust Bank) 10,530,000
- --------------------------------------------------------------------------------
5,450,000 Roman Catholic Bishop of
San Jose, VRN, 5.32%,
10/5/06 (LOC: Allied
Irish Bank plc) 5,450,000
- --------------------------------------------------------------------------------
7,500,000 Salvation Army, Series
2003, VRN, 5.33%, 10/5/06
(LOC: Bank of New York) 7,500,000
- --------------------------------------------------------------------------------
8,000,000 Salvation Army, Series
2004 A, VRN, 5.33%, 10/5/06
(LOC: Bank of New York) 8,000,000
- --------------------------------------------------------------------------------
16,300,000 Signal International LLC/
Signal International L.P.,
VRN, 5.33%, 10/5/06
(LOC: General Electric
Capital Corporation)
(Acquired 12/29/05,
Cost $16,300,000)(2) 16,300,000
- --------------------------------------------------------------------------------
10,000,000 Toyota Motor Credit Corp.,
VRN, 5.27%, 10/6/06,
resets monthly off the
1-month LIBOR minus
0.06% with no caps 9,999,998
- --------------------------------------------------------------------------------
Principal Amount Value
- --------------------------------------------------------------------------------
$50,000,000 Transamerica Occidental
Life Insurance Co., VRN,
5.60%, 11/1/06, resets
quarterly off the 3-month
LIBOR plus 0.11% with no
caps (Acquired 11/9/99,
Cost $50,000,000)(2) $ 50,000,000
- --------------------------------------------------------------------------------
41,000,000 Travelers Insurance Co.
Group, VRN, 5.54%, 11/7/06,
resets quarterly off the
3-month LIBOR plus 0.08%
with no caps (Acquired
8/7/03, Cost $41,000,000)(2) 41,000,000
- --------------------------------------------------------------------------------
30,000,000 Wal-Mart Stores, Inc., VRN,
5.26%, 12/28/06, resets
quarterly off the 3-month
LIBOR minus 0.10% with no caps 29,994,155
- --------------------------------------------------------------------------------
30,000,000 Wal-Mart Stores, Inc., VRN,
5.88%, 6/1/07 30,101,221
- --------------------------------------------------------------------------------
11,090,000 Woodgrain Millwork,
VRN, 5.35%, 10/5/06
(LOC: General Electric
Capital Corporation) 11,090,000
- --------------------------------------------------------------------------------
TOTAL CORPORATE BONDS 471,431,874
- --------------------------------------------------------------------------------
MUNICIPAL SECURITIES -- 12.5%
- --------------------------------------------------------------------------------
4,645,000 Babylon Industrial
Development Agency Rev.,
Series 2004 A, (Topiderm Inc.),
VRDN, 5.35%, 10/5/06
(LOC: Citibank N.A.) 4,645,000
- --------------------------------------------------------------------------------
5,255,000 Calexico Unified School
District COP, (Refinancing
Project), VRDN, 5.35%, 10/5/06
(XLCA) (SBBPA: Wachovia Bank N.A.) 5,255,000
- --------------------------------------------------------------------------------
8,160,000 California Educational
Facilities Auth. Rev., Series
2005 B, (University La Verne),
VRDN, 5.45%, 10/5/06
(LOC: Allied Irish
Bank plc) 8,160,000
- --------------------------------------------------------------------------------
12,600,000 California Statewide
Communities Development
Auth. Rev., Series 2002 B,
(Biola University), VRDN,
5.31%, 10/5/06 (LOC:
BNP Paribas) 12,600,000
- --------------------------------------------------------------------------------
5,420,000 City of Fairfield Rev., Series
2005 A, VRDN, 5.32%,
10/5/06 (LOC: Landesbank
Hessen-Thuringen
Girozentrale) 5,420,000
- --------------------------------------------------------------------------------
3,270,000 Columbus Development
Auth. Rev., (Woodmont
Properties LLC), VRDN,
5.37%, 10/5/06
(LOC: Columbus Bank & Trust) 3,270,000
- --------------------------------------------------------------------------------
See Notes to Financial Statements. (continued)
- ------
10
Prime Money Market - Schedule of Investments
SEPTEMBER 30, 2006 (UNAUDITED)
Principal Amount Value
- --------------------------------------------------------------------------------
$20,000,000 Concordia College Rev.,
VRDN, 5.32%, 10/2/06
(LOC: Bank of America N.A.) $ 20,000,000
- --------------------------------------------------------------------------------
20,000,000 Cook County GO, Series
2005 D, (Public Improvements),
VRDN, 5.34%, 10/4/06 (SBBPA:
Depfa Bank plc) 20,000,000
- --------------------------------------------------------------------------------
2,880,000 El Monte COP, Series
2003 B, (Community Improvement),
VRDN, 5.38%, 10/5/06 (LOC:
California State Teacher's
Retirement System) 2,880,000
- --------------------------------------------------------------------------------
6,905,000 Gadsden Alabama Airport
Auth. Rev., VRDN, 5.32%,
10/5/06 (LOC: Southtrust
Bank N.A.) 6,905,000
- --------------------------------------------------------------------------------
7,880,000 Georgia Municipal Gas
Auth. Rev., (National Gas
Utility Improvements), VRDN,
5.35%, 10/5/06 (LOC: Wachovia Bank N.A.
and JP Morgan Chase Bank) 7,880,000
- --------------------------------------------------------------------------------
9,000,000 Jackson Energy Auth. Rev.,
Series 2003 B, VRDN, 5.31%,
10/5/06 (FGIC) (SBBPA:
Bank of America N.A.) 9,000,000
- --------------------------------------------------------------------------------
2,500,000 JJB Properties LLC Rev.,
(Rental Property), VRDN,
5.32%, 10/5/06 (LOC:
Arvest Bank and FHLB) 2,500,000
- --------------------------------------------------------------------------------
1,600,000 Las Cruces Industrial Rev.,
(F&A Dairy Products),
VRDN, 5.45%, 12/1/06
(LOC: Wells Fargo Bank N.A.) 1,600,000
- --------------------------------------------------------------------------------
2,945,000 Long Beach Rev., Series
2004 A, (Towne Center Site),
VRDN, 5.37%, 10/5/06
(LOC: Allied Irish Bank plc) 2,945,000
- --------------------------------------------------------------------------------
21,250,000 Louisiana State Agriculture
Finance Auth. Rev., VRDN,
(Lacassine Syrup Mill),
5.37%, 10/5/06 (LOC:
AmSouth Bank) 21,250,000
- --------------------------------------------------------------------------------
8,200,000 Lower Colorado River Auth.
Rev., Series 2006 A, 5.46%,
12/4/06 (Acquired 8/1/06,
Cost $8,200,000)(2) 8,200,000
- --------------------------------------------------------------------------------
6,500,000 Mississippi Business
Finance Corp. Rev., (Medical
Development Properties), VRDN,
5.33%, 10/5/06
(LOC: Bancorpsouth Bank and FHLB) 6,500,000
- --------------------------------------------------------------------------------
11,000,000 Mississippi Business
Finance Corp. Rev.,
(Skyline Steel Pipe), VRDN,
5.33%, 10/5/06 (LOC:
Fortis Bank SA N.V.) 11,000,000
- --------------------------------------------------------------------------------
Principal Amount Value
- --------------------------------------------------------------------------------
$ 7,500,000 Mississippi Business
Finance Corp. Rev., Series 2005,
(Future Pipe Industries,
Inc.) VRDN, 5.33%, 10/5/06
(LOC: Mashreqbank and Bank
of New York) $ 7,500,000
- --------------------------------------------------------------------------------
5,000,000 Mississippi Business
Finance Corp. Rev., Series
2006 R-1, (Brown Bottling Group,
Inc.), VRDN, 5.33%,
10/5/06 (LOC: Trustmark
National Bank and FHLB) 5,000,000
- --------------------------------------------------------------------------------
10,000,000 Mississippi Business
Finance Corporation Industrial
Development Rev., (VC Regional
Assembly), VRDN, 5.33%,
10/4/06 (LOC: JPMorgan
Chase Bank) 10,000,000
- --------------------------------------------------------------------------------
19,280,000 New Orleans Rev., VRDN,
5.55%, 10/5/06 (Ambac)
(SBBPA: Bank One Louisiana) 19,280,000
- --------------------------------------------------------------------------------
4,575,000 Newton Economic Development Rev.,
(Medical Office Plaza), VRDN, 5.31%,
10/5/06 (LOC: Bank of America N.A.) 4,575,000
- --------------------------------------------------------------------------------
1,200,000 Olathe Industrial Rev.,
(Zschoche Family), VRDN,
5.37%, 10/5/06 (LOC:
U.S. Bank N.A.) 1,200,000
- --------------------------------------------------------------------------------
5,000,000 Omaha Special Obligation Rev.,
(Riverfront Redevelopment), VRDN,
5.37%, 10/4/06 (Ambac)
(SBBPA: Dexia Credit Local) 5,000,000
- --------------------------------------------------------------------------------
1,400,000 Orange County Industrial
Development Auth. Rev.,
(Jewish Federation of Greater
Orlando), VRDN, 5.31%, 10/5/06
(LOC: Bank of America N.A.) 1,400,000
- --------------------------------------------------------------------------------
11,000,000 Pasadena COP, (Los
Robles Avenue Parking
Facilities), VRDN, 5.33%,
10/3/06 (LOC: Bank of
New York and California
State Teacher's
Retirement System) 11,000,000
- --------------------------------------------------------------------------------
1,130,000 Plymouth Rev.,
(Carlson Center),
VRDN, 5.37%, 10/5/06
(LOC: U.S. Bank N.A.) 1,130,000
- --------------------------------------------------------------------------------
9,990,000 Putnam County Industrial
Development Agency Rev.,
(Sincerity Facility LLC),
VRDN, 5.33%, 10/5/06
(LOC: Bank of New York) 9,990,000
- --------------------------------------------------------------------------------
5,700,000 Roman Catholic Diocese of
Raleigh Rev., Series 2002 A,
VRDN, 5.37%, 10/5/06
(LOC: Bank of America N.A.) 5,700,000
- --------------------------------------------------------------------------------
See Notes to Financial Statements. (continued)
- ------
11
Prime Money Market - Schedule of Investments
SEPTEMBER 30, 2006 (UNAUDITED)
Principal Amount Value
- --------------------------------------------------------------------------------
$ 4,850,000 Santa Rosa Pension
Obligation Rev., Series 2003 A,
VRDN, 5.32%, 10/5/06 (LOC:
Landesbank Hessen-
Thuringen Girozentrale) $ 4,850,000
- --------------------------------------------------------------------------------
7,140,672 Savannah College of Art &
Design Inc. Rev., Series
2004 BD, VRDN, 5.32%,
10/5/06 (LOC: Bank of
America N.A.) 7,140,672
- --------------------------------------------------------------------------------
9,000,000 South Carolina Public
Service Auth. Rev.,
Series 2002 C, 5.27%,
1/1/07 (FSA) 9,012,487
- --------------------------------------------------------------------------------
11,955,000 Southeast Alabama Gas
District Rev., VRDN, 5.32%,
10/5/06 (XLCA) 11,955,000
- --------------------------------------------------------------------------------
4,245,000 Sterling Tax Allocation Rev.,
(Rock River Redevelopment),
VRDN, 5.38%, 10/4/06
(LOC: Wachovia Bank N.A.) 4,245,000
- --------------------------------------------------------------------------------
8,700,000 Texas Municipal Power
Agency Rev., Series 2005 A,
5.49%, 12/5/06 (Acquired 8/3/06,
Cost $8,700,000)(2) 8,700,000
- --------------------------------------------------------------------------------
TOTAL MUNICIPAL SECURITIES 287,688,159
- --------------------------------------------------------------------------------
CERTIFICATES OF DEPOSIT -- 8.3%
- --------------------------------------------------------------------------------
40,000,000 American Express Centurion
Bank, 5.44%, 10/16/06
(Acquired 7/17/06, Cost
$40,000,000)(2) 40,000,000
- --------------------------------------------------------------------------------
30,000,000 Barclays Bank plc (New
York), 5.35%, 11/17/06
(Acquired 8/17/06,
Cost $30,000,000)(2) 30,000,000
- --------------------------------------------------------------------------------
Principal Amount Value
- --------------------------------------------------------------------------------
$30,000,000 Barclays Bank plc (New
York), 5.35%, 11/22/06
(Acquired 8/22/06,
Cost $30,000,000)(2) $ 30,000,000
- --------------------------------------------------------------------------------
10,000,000 Citibank N.A., 5.33%,
12/14/06 (Acquired
9/11/06, Cost $10,000,000)(2) 10,000,000
- --------------------------------------------------------------------------------
18,000,000 Citizens Bank of
Massachusetts, 5.34%,
12/29/06 18,000,000
- --------------------------------------------------------------------------------
50,000,000 First Tennessee Bank N.A.,
5.28%, 10/2/06 (Acquired
9/1/06, Cost $50,000,000)(2) 50,000,000
- --------------------------------------------------------------------------------
11,600,000 Royal Bank of Scotland
(New York), 4.82%, 1/18/07
(Acquired 12/21/05,
Cost $11,602,532)(2) 11,600,703
- --------------------------------------------------------------------------------
TOTAL CERTIFICATES OF DEPOSIT 189,600,703
- --------------------------------------------------------------------------------
U.S. GOVERNMENT AGENCY SECURITIES -- 3.7%
10,000,000 FHLB, 5.00%, 1/29/07 10,000,000
- --------------------------------------------------------------------------------
15,000,000 FHLB, 4.80%, 2/23/07 15,000,000
- --------------------------------------------------------------------------------
20,000,000 FHLB, 4.89%, 3/5/07 20,000,000
- --------------------------------------------------------------------------------
25,320,000 FHLB, 5.50%, 8/21/07 25,335,053
- --------------------------------------------------------------------------------
15,000,000 FHLB, VRN, 5.50%,
10/27/06(3) 15,000,000
- --------------------------------------------------------------------------------
TOTAL U.S.
GOVERNMENT
AGENCY SECURITIES 85,335,053
- --------------------------------------------------------------------------------
TOTAL INVESTMENT
SECURITIES -- 96.7% 2,219,964,328
- --------------------------------------------------------------------------------
OTHER ASSETS AND LIABILITIES -- 3.3% 76,453,650
- --------------------------------------------------------------------------------
TOTAL NET ASSETS -- 100.0% $2,296,417,978
================================================================================
See Notes to Financial Statements. (continued)
- ------
12
Prime Money Market - Schedule of Investments
SEPTEMBER 30, 2006 (UNAUDITED)
NOTES TO SCHEDULE OF INVESTMENTS
Ambac = Ambac Assurance Corporation
COP = Certificates of Participation
FGIC = Financial Guaranty Insurance Co.
FHLB = Federal Home Loan Bank
FSA = Financial Security Assurance, Inc.
GO = General Obligation
LIBOR = London Interbank Offered Rate
LOC = Letter of Credit
resets = The frequency with which a security's coupon changes, based on current
market conditions or an underlying index. The more frequently a
security resets, the less risk the investor is taking that the coupon
will vary significantly from current market rates.
SBBPA = Standby Bond Purchase Agreement
VRDN = Variable Rate Demand Note. Interest reset date is indicated. Rate shown
is effective September 30, 2006.
VRN = Variable Rate Note. Interest reset date is indicated. Rate shown is
effective September 30, 2006.
XLCA = XL Capital Ltd.
(1) The rate indicated is the yield to maturity at purchase.
(2) Security was purchased under Rule 144A or Section 4(2) of the Securities
Act of 1933 or is a private placement and, unless registered under the Act
or exempted from registration, may only be sold to qualified institutional
investors. The aggregate value of restricted securities at September 30,
2006 was $1,204,548,255, which represented 52.5% of total net assets.
Restricted securities considered illiquid represent 4.0% of total net
assets.
(3) Step-coupon security. Coupon increases quarterly at a predetermined rate.
Rate shown is effective September 30, 2006.
See Notes to Financial Statements.
- ------
13
Statement of Assets and Liabilities
SEPTEMBER 30, 2006
- --------------------------------------------------------------------------------
ASSETS
- --------------------------------------------------------------------------------
Investment securities, at value
(amortized cost and cost for
federal income tax purposes) $2,219,964,328
- -----------------------------------------------------
Cash 64,181,383
- -----------------------------------------------------
Receivable for investments sold 6,000,000
- -----------------------------------------------------
Interest receivable 7,157,739
- -----------------------------------------------------
Prepaid portfolio insurance 123,280
- --------------------------------------------------------------------------------
2,297,426,730
- --------------------------------------------------------------------------------
LIABILITIES
- --------------------------------------------------------------------------------
Payable for capital shares redeemed 115
- -----------------------------------------------------
Accrued management fees 965,053
- -----------------------------------------------------
Distribution fees payable 1,684
- -----------------------------------------------------
Service fees (and distribution
fees - A Class) payable 18,301
- -----------------------------------------------------
Dividends payable 23,599
- --------------------------------------------------------------------------------
1,008,752
- --------------------------------------------------------------------------------
NET ASSETS $2,296,417,978
================================================================================
NET ASSETS CONSIST OF:
- --------------------------------------------------------------------------------
Capital paid in $2,296,459,944
- -----------------------------------------------------
Accumulated net realized loss
on investment transactions (41,966)
- --------------------------------------------------------------------------------
$2,296,417,978
================================================================================
INVESTOR CLASS
- --------------------------------------------------------------------------------
Net assets $2,203,992,143
- -----------------------------------------------------
Shares outstanding 2,204,031,981
- -----------------------------------------------------
Net asset value per share $1.00
- --------------------------------------------------------------------------------
ADVISOR CLASS
- --------------------------------------------------------------------------------
Net assets $3,199,593
- -----------------------------------------------------
Shares outstanding 3,199,064
- -----------------------------------------------------
Net asset value per share $1.00
- --------------------------------------------------------------------------------
A CLASS
- --------------------------------------------------------------------------------
Net assets $87,352,035
- -----------------------------------------------------
Shares outstanding 87,354,535
- -----------------------------------------------------
Net asset value per share $1.00
- --------------------------------------------------------------------------------
B CLASS
- --------------------------------------------------------------------------------
Net assets $1,186,066
- -----------------------------------------------------
Shares outstanding 1,186,347
- -----------------------------------------------------
Net asset value per share $1.00
- --------------------------------------------------------------------------------
C CLASS
- --------------------------------------------------------------------------------
Net assets $688,141
- -----------------------------------------------------
Shares outstanding 688,140
- -----------------------------------------------------
Net asset value per share $1.00
- --------------------------------------------------------------------------------
See Notes to Financial Statements.
- ------
14
Statement of Operations
FOR THE SIX MONTHS ENDED SEPTEMBER 30, 2006 (UNAUDITED)
- --------------------------------------------------------------------------------
INVESTMENT INCOME
- --------------------------------------------------------------------------------
INCOME:
- --------------------------------------------------
Interest $57,131,231
- --------------------------------------------------------------------------------
EXPENSES:
- --------------------------------------------------
Management fees 6,294,423
- --------------------------------------------------
Distribution fees:
- --------------------------------------------------
Advisor Class 3,839
- --------------------------------------------------
B Class 5,298
- --------------------------------------------------
C Class 1,874
- --------------------------------------------------
Service fees:
- --------------------------------------------------
Advisor Class 3,839
- --------------------------------------------------
B Class 1,766
- --------------------------------------------------
C Class 937
- --------------------------------------------------
Distribution and service fees -- A Class 91,394
- --------------------------------------------------
Trustees' fees and expenses 41,837
- --------------------------------------------------
Portfolio insurance 182,865
- --------------------------------------------------------------------------------
6,628,072
Amount waived (470,869)
- --------------------------------------------------------------------------------
6,157,203
- --------------------------------------------------------------------------------
NET INVESTMENT INCOME 50,974,028
- --------------------------------------------------------------------------------
NET REALIZED GAIN (LOSS) ON
INVESTMENT TRANSACTIONS (2,974)
- --------------------------------------------------------------------------------
NET INCREASE (DECREASE)
IN NET ASSETS RESULTING
FROM OPERATIONS $50,971,054
================================================================================
See Notes to Financial Statements.
- ------
15
Statement of Changes in Net Assets
SIX MONTHS ENDED SEPTEMBER 30, 2006 (UNAUDITED) AND YEAR ENDED MARCH 31, 2006
- --------------------------------------------------------------------------------
INCREASE (DECREASE) IN NET ASSETS SEPT. 30, 2006 MARCH 31, 2006
- --------------------------------------------------------------------------------
OPERATIONS
- --------------------------------------------------------------------------------
Net investment income $ 50,974,028 $ 66,266,475
- ----------------------------------------
Net realized gain (loss) (2,974) (19,620)
- -------------------------------------------------------------------------------
Net increase (decrease) in net assets
resulting from operations 50,971,054 66,246,855
- -------------------------------------------------------------------------------
DISTRIBUTIONS TO SHAREHOLDERS
- -------------------------------------------------------------------------------
From net investment income:
- ----------------------------------------
Investor Class (49,245,260) (65,870,629)
- ----------------------------------------
Advisor Class (67,181) (93,086)
- ----------------------------------------
A Class (1,621,186) (288,507)
- ----------------------------------------
B Class (25,760) (2,602)
- ----------------------------------------
C Class (14,641) (11,651)
- -------------------------------------------------------------------------------
Decrease in net assets
from distributions (50,974,028) (66,266,475)
- -------------------------------------------------------------------------------
CAPITAL SHARE TRANSACTIONS
- -------------------------------------------------------------------------------
Net increase (decrease) in net assets
from capital share transactions 265,159,958 63,825,653
- -------------------------------------------------------------------------------
NET INCREASE (DECREASE) IN NET ASSETS 265,156,984 63,806,033
- -------------------------------------------------------------------------------
NET ASSETS
- -------------------------------------------------------------------------------
Beginning of period 2,031,260,994 1,967,454,961
- -------------------------------------------------------------------------------
End of period $2,296,417,978 $2,031,260,994
===============================================================================
See Notes to Financial Statements.
- ------
16
Notes to Financial Statements
SEPTEMBER 30, 2006 (UNAUDITED)
1. ORGANIZATION AND SUMMARY OF SIGNIFICANT ACCOUNTING POLICIES
ORGANIZATION -- American Century Investment Trust (the trust) is registered
under the Investment Company Act of 1940 (the 1940 Act) as an open-end
management investment company. Prime Money Market Fund (the fund) is one fund in
a series issued by the trust. The fund is diversified under the 1940 Act. The
fund's investment objective is to earn the highest level of current income while
preserving the value of your investment. The following is a summary of the
fund's significant accounting policies.
MULTIPLE CLASS -- The fund is authorized to issue the Investor Class, the
Advisor Class, the A Class, the B Class and the C Class. The A Class may incur
an initial sales charge. The A Class, B Class and C Class may be subject to a
contingent deferred sales charge. The share classes differ principally in their
respective sales charges and distribution and shareholder servicing expenses and
arrangements. All shares of the fund represent an equal pro rata interest in the
assets of the class to which such shares belong, and have identical voting,
dividend, liquidation and other rights and the same terms and conditions, except
for class specific expenses and exclusive rights to vote on matters affecting
only individual classes. Income, non-class specific expenses, and realized and
unrealized capital gains and losses of the fund are allocated to each class of
shares based on their relative net assets.
SECURITY VALUATIONS -- Securities are generally valued at amortized cost, which
approximates current market value. When such valuations do not reflect market
value, securities may be valued as determined in accordance with procedures
adopted by the Board of Trustees.
SECURITY TRANSACTIONS -- Security transactions are accounted for as of the trade
date. Net realized gains and losses are determined on the identified cost basis,
which is also used for federal income tax purposes.
INVESTMENT INCOME -- Interest income is recorded on the accrual basis and
includes accretion of discounts and amortization of premiums.
REPURCHASE AGREEMENTS -- The fund may enter into repurchase agreements with
institutions that American Century Investment Management, Inc. (ACIM) (the
investment advisor) has determined are creditworthy pursuant to criteria adopted
by the Board of Trustees. Each repurchase agreement is recorded at cost. The
fund requires that the collateral, represented by securities, received in a
repurchase transaction be transferred to the custodian in a manner sufficient to
enable the fund to obtain those securities in the event of a default under the
repurchase agreement. ACIM monitors, on a daily basis, the securities
transferred to ensure the value, including accrued interest, of the securities
under each repurchase agreement is equal to or greater than amounts owed to the
fund under each repurchase agreement.
JOINT TRADING ACCOUNT -- Pursuant to an Exemptive Order issued by the Securities
and Exchange Commission, the fund, along with other registered investment
companies having management agreements with ACIM or American Century Global
Investment Management, Inc. (ACGIM), may transfer uninvested cash balances into
a joint trading account. These balances are invested in one or more repurchase
agreements that are collateralized by U.S. Treasury or Agency obligations.
WHEN-ISSUED AND FORWARD COMMITMENTS -- The fund may engage in securities
transactions on a when-issued or forward commitment basis. Under these
arrangements, the securities' prices and yields are fixed on the date of the
commitment, but payment and delivery are scheduled for a future date. During
this period, securities are subject to market fluctuations. The fund will
segregate cash, cash equivalents or other appropriate liquid securities on its
records in amounts sufficient to meet the purchase price.
INCOME TAX STATUS -- It is the fund's policy to distribute substantially all net
investment income and net realized gains to shareholders and to otherwise
qualify as a regulated investment company under provisions of the Internal
Revenue Code. Accordingly, no provision has been made for federal or state
income taxes.
DISTRIBUTIONS TO SHAREHOLDERS -- Distributions from net investment income and
short-term capital gains, if any, are declared daily and paid monthly. The fund
does not expect to realize any long-term capital gains, and accordingly, does
not expect to pay any capital gains distributions.
INDEMNIFICATIONS -- Under the trust's organizational documents, its officers and
trustees are indemnified against certain liabilities arising out of the
performance of their duties to the fund. In addition, in the normal course of
business, the fund enters into contracts that provide general indemnifications.
The fund's maximum exposure under these arrangements is unknown as this would
involve future claims that may be made against the fund. The risk of material
loss from such claims is considered by management to be remote.
USE OF ESTIMATES -- The financial statements are prepared in conformity with
accounting principles generally accepted in the United States of America, which
may require management to make certain estimates and assumptions at the date of
the financial statements. Actual results could differ from these estimates.
(continued)
- ------
17
Notes to Financial Statements
SEPTEMBER 30, 2006 (UNAUDITED)
2. FEES AND TRANSACTIONS WITH RELATED PARTIES
MANAGEMENT FEES -- The trust has entered into a Management Agreement with ACIM,
under which ACIM provides the fund with investment advisory and management
services in exchange for a single, unified management fee (the fee) per class.
The Agreement provides that all expenses of the fund, except brokerage
commissions, taxes, portfolio insurance, interest, fees and expenses of those
trustees who are not considered "interested persons" as defined in the 1940 Act
(including counsel fees) and extraordinary expenses, will be paid by ACIM. The
fee is computed and accrued daily based on the daily net assets of the specific
class of shares of the fund and paid monthly in arrears. The fee consists of (1)
an Investment Category Fee based on the daily net assets of the funds and
certain other accounts managed by the investment advisor that are in the same
broad investment category as the fund and (2) a Complex Fee based on the assets
of all the funds in the American Century family of funds. The rates for the
Investment Category Fee range from 0.2370% to 0.3500% and the rates for the
Complex Fee (Investor Class, A Class, B Class and C Class) range from 0.2500% to
0.3100%. The Advisor Class is 0.2500% less at each point within the Complex Fee
range. From July 29, 2005 to July 31, 2006, the investment advisor voluntarily
agreed to waive 0.039% of its management fee. Effective August 1, 2006, the
investment advisor voluntarily agreed to waive 0.050% of its management fee. The
total amount of the waiver for each class of the fund for the six months
ended September 30, 2006 was $453,915, $657, $15,839, $298 and $160 for the
Investor Class, Advisor Class, A Class, B Class and C Class, respectively.
This fee waiver may be revised or terminated at any time without notice. The
effective annual management fee before waiver for each class of the fund for
the six months ended September 30, 2006 was 0.57% for the Investor Class,
A Class, B Class and C Class, and 0.32% for the Advisor Class. The effective
annual management fee after waiver for each class of the fund for the six
months ended September 30, 2006 was 0.53% for the Investor Class, A Class,
B Class and C Class, and 0.28% for the Advisor Class.
DISTRIBUTION AND SERVICE FEES -- The Board of Trustees has adopted a Master
Distribution and Shareholder Services Plan for the Advisor Class (the Advisor
Class plan) and a separate Master Distribution and Individual Shareholder
Services Plan for each of the A Class, B Class and C Class (collectively with
the Advisor Class plan, the plans), pursuant to Rule 12b-1 of the 1940 Act. The
plans provide the Advisor Class, B Class and C Class will pay American Century
Investment Services, Inc. (ACIS) the following annual distribution and service
fees:
- ------------------------------------------------------------------------
ADVISOR B C
- ------------------------------------------------------------------------
Distribution Fee 0.25% 0.75% 0.50%
- ------------------------------------------------------------------------
Service Fee 0.25% 0.25% 0.25%
- ------------------------------------------------------------------------
The plans provide that the A Class will pay ACIS an annual distribution and
service fee of 0.25%. The fees are computed and accrued daily based on each
class's daily net assets and paid monthly in arrears. The distribution fee
provides compensation for expenses incurred in connection with distributing
shares of the classes including, but not limited to, payments to brokers,
dealers, and financial institutions that have entered into sales agreements with
respect to shares of the fund. The service fee provides compensation for
shareholder and administrative services rendered by ACIS, its affiliates or
independent third party providers for Advisor Class shares and for individual
shareholder services rendered by broker/dealers or other independent financial
intermediaries for A Class, B Class and C Class shares. Fees incurred under the
plans during the six months ended September 30, 2006, are detailed in the
Statement of Operations.
MONEY MARKET INSURANCE -- The fund, along with other money market funds managed
by ACIM, has entered into an insurance agreement with Ambac Assurance
Corporation (Ambac). Ambac provides limited coverage for certain loss events
including issuer defaults as to payment of principal or interest and insolvency
of a credit enhancement provider. The fund pays annual premiums to Ambac, which
are amortized daily over one year. For the six months ended September 30, 2006,
the annualized ratio of money market insurance expense to average net assets was
0.02%.
RELATED PARTIES -- Certain officers and trustees of the trust are also officers
and/or directors, and, as a group, controlling stockholders of American Century
Companies, Inc. (ACC), the parent of the trust's investment advisor, ACIM, the
distributor of the trust, ACIS, and the trust's transfer agent, American Century
Services, LLC.
JPMorgan Chase Bank is a custodian of the fund and a wholly owned subsidiary of
J.P. Morgan Chase & Co. (JPM). JPM is an equity investor in ACC.
Notes to Financial Statements
(continued)
- ------
18
SEPTEMBER 30, 2006 (UNAUDITED)
3. CAPITAL SHARE TRANSACTIONS
Transactions in shares of the fund were as follows
(unlimited number of shares authorized):
- --------------------------------------------------------------------------------
SHARES AMOUNT
- --------------------------------------------------------------------------------
INVESTOR CLASS
- --------------------------------------------------------------------------------
SIX MONTHS ENDED SEPTEMBER 30, 2006
- -----------------------------------------
Sold 1,200,948,701 $1,200,948,701
- -----------------------------------------
Issued in reinvestment of distributions 47,370,112 47,370,112
- -----------------------------------------
Redeemed (1,026,288,969) (1,026,288,969)
- --------------------------------------------------------------------------------
Net increase (decrease) 222,029,844 $
222,029,844
================================================================================
YEAR ENDED MARCH 31, 2006
- -----------------------------------------
Sold 2,104,960,382 $2,104,960,382
- -----------------------------------------
Issued in reinvestment of distributions 64,257,188 64,257,188
- -----------------------------------------
Redeemed (2,151,370,189) (2,151,370,189)
- --------------------------------------------------------------------------------
Net increase (decrease) 17,847,381 $ 17,847,381
================================================================================
ADVISOR CLASS
- --------------------------------------------------------------------------------
SIX MONTHS ENDED SEPTEMBER 30, 2006
- -----------------------------------------
Sold 779,074 $779,074
- -----------------------------------------
Issued in reinvestment of distributions 65,481 65,481
- -----------------------------------------
Redeemed (790,277) (790,277)
- --------------------------------------------------------------------------------
Net increase (decrease) 54,278 $ 54,278
================================================================================
YEAR ENDED MARCH 31, 2006
- -----------------------------------------
Sold 2,930,902 $2,930,902
- -----------------------------------------
Issued in reinvestment of distributions 90,750 90,750
- -----------------------------------------
Redeemed (2,436,416) (2,436,416)
- --------------------------------------------------------------------------------
Net increase (decrease) 585,236 $ 585,236
================================================================================
A CLASS
- --------------------------------------------------------------------------------
SIX MONTHS ENDED SEPTEMBER 30, 2006
- -----------------------------------------
Sold 99,498,142 $99,498,142
- -----------------------------------------
Issued in reinvestment of distributions 1,312,625 1,312,625
- -----------------------------------------
Redeemed (58,612,025) (58,612,025)
- --------------------------------------------------------------------------------
Net increase (decrease) 42,198,742 $42,198,742
================================================================================
YEAR ENDED MARCH 31, 2006
- -----------------------------------------
Sold 71,664,328 $71,664,328
- -----------------------------------------
Issued in reinvestment of distributions 231,851 231,851
- -----------------------------------------
Redeemed (26,799,994) (26,799,994)
- --------------------------------------------------------------------------------
Net increase (decrease) 45,096,185 $45,096,185
================================================================================
(continued)
- ------
19
Notes to Financial Statements
SEPTEMBER 30, 2006 (UNAUDITED)
3. CAPITAL SHARE TRANSACTIONS (CONTINUED)
- --------------------------------------------------------------------------------
SHARES AMOUNT
- --------------------------------------------------------------------------------
B CLASS
- --------------------------------------------------------------------------------
SIX MONTHS ENDED SEPTEMBER 30, 2006
- ----------------------------------------
Sold 2,027,345 $2,027,345
- ----------------------------------------
Issued in reinvestment of distributions 24,275 24,275
- ----------------------------------------
Redeemed (999,619) (999,619)
- --------------------------------------------------------------------------------
Net increase (decrease) 1,052,001 $1,052,001
================================================================================
YEAR ENDED MARCH 31, 2006
- ----------------------------------------
Sold 36,592 $36,592
- ----------------------------------------
Issued in reinvestment of distributions 1,074 1,074
- ----------------------------------------
Net increase (decrease) 37,666 $37,666
- ----------------------------------------
C CLASS
- --------------------------------------------------------------------------------
SIX MONTHS ENDED SEPTEMBER 30, 2006
- ----------------------------------------
Sold 684,471 $ 684,471
- ----------------------------------------
Issued in reinvestment of distributions 14,200 14,200
- ----------------------------------------
Redeemed (873,578) (873,578)
- --------------------------------------------------------------------------------
Net increase (decrease) (174,907) $(174,907)
================================================================================
YEAR ENDED MARCH 31, 2006
- ----------------------------------------
Sold 831,364 $831,364
- ----------------------------------------
Issued in reinvestment of distributions 11,443 11,443
- ----------------------------------------
Redeemed (583,622) (583,622)
- --------------------------------------------------------------------------------
Net increase (decrease) 259,185 $259,185
================================================================================
4. FEDERAL TAX INFORMATION
The book-basis character of distributions made during the year from net
investment income or net realized gains may differ from their ultimate
characterization for federal income tax purposes. These differences reflect the
differing character of certain income items and net realized gains and losses
for financial statement and tax purposes, and may result in reclassification
among certain capital accounts on the financial statements.
As of March 31, 2006, the fund had accumulated capital losses of $(27,105),
which represent net capital loss carryovers that may be used to offset future
realized capital gains for federal income tax purposes. The capital loss
carryovers expire as follows:
- --------------------------------------------------------------------------
2010 2011 2012 2013 2014
- --------------------------------------------------------------------------
$(13,456) $(36) $-- $(11,584) $(2,029)
- --------------------------------------------------------------------------
During the five-month period ended March 31, 2006, the fund incurred net capital
losses of $(17,608). The fund has elected to treat such losses as having been
incurred in the following fiscal year for federal income tax purposes.
5. RECENTLY ISSUED ACCOUNTING STANDARDS
In June 2006, the Financial Accounting Standards Board (FASB) issued
Interpretation No. 48, "Accounting for Uncertainty in Income Taxes -- an
Interpretation of FASB Statement No. 109" (FIN 48). FIN 48 establishes a minimum
threshold for financial statement recognition of the benefit of positions taken
in filing tax returns (including whether an entity is taxable in a particular
jurisdiction), and requires certain expanded tax disclosures. FIN 48 is
effective for fiscal years beginning after December 15, 2006, and is to be
applied to all open tax years as of the date of effectiveness. The FASB issued
Statement of Financial Accounting Standards No. 157, "Fair Value Measurements"
(FAS 157), in September 2006, which is effective for fiscal years beginning
after November 15, 2007. FAS 157 defines fair value, establishes a framework for
measuring fair value and expands the required financial statement disclosures
about fair value measurements. Management is currently evaluating the impact of
adopting FIN 48 and FAS 157.
- ------
20
Prime Money Market - Financial Highlights
For a Share Outstanding Throughout the Years Ended March 31 (except as noted)
- -------------------------------------------------------------------------------------------------------------
INVESTOR CLASS
- -------------------------------------------------------------------------------------------------------------
2006(1) 2006 2005 2004 2003 2002(2) 2002
- -------------------------------------------------------------------------------------------------------------
PER-SHARE DATA
- -------------------------------------------------------------------------------------------------------------
Net Asset Value,
Beginning
of Period $1.00 $1.00 $1.00 $1.00 $1.00 $1.00 $1.00
- -------------------------------------------------------------------------------------------------------------
Income From
Investment
Operations
- -------------------------------------------------------------------------------------------------------------
Net Investment
Income (Loss) 0.02 0.03 0.01 0.01 0.01 --(3) 0.03
- -------------------------------------------------------------------------------------------------------------
Distributions
- ---------------
From Net
Investment
Income (0.02) (0.03) (0.01) (0.01) (0.01) --(3) (0.03)
- -------------------------------------------------------------------------------------------------------------
Net Asset Value,
End of Period $1.00 $1.00 $1.00 $1.00 $1.00 $1.00 $1.00
=============================================================================================================
TOTAL RETURN(4) 2.34% 3.28% 1.19% 0.58% 1.19% 0.13% 3.16%
=============================================================================================================
RATIOS/SUPPLEMENTAL DATA
- -------------------------------------------------------------------------------------------------------------
Ratio of
Operating
Expenses
to Average
Net Assets 0.55%(5)(6) 0.57%(5) 0.60% 0.61% 0.61% 0.60%(6) 0.60%
- ---------------
Ratio of
Operating
Expenses to
Average
Net Assets
(Before
Expense Waiver) 0.59%(6) 0.59% 0.60% 0.61% 0.61% 0.60%(6) 0.60%
- ---------------
Ratio of Net
Investment
Income (Loss)
to Average
Net Assets 4.64%(5)(6) 3.24%(5) 1.17% 0.58% 1.19% 1.48%(6) 3.13%
- ---------------
Ratio of Net
Investment
Income (Loss)
to Average
Net Assets
(Before
Expense Waiver) 4.60%(6) 3.22% 1.17% 0.58% 1.19% 1.48%(6) 3.13%
- ---------------
Net Assets,
End of Period
(in thousands) $2,203,992 $1,981,964 $1,964,135 $2,126,433 $2,574,694 $2,756,147 $2,796,914
- -------------------------------------------------------------------------------------------------------------
(1) Six months ended September 30, 2006 (unaudited).
(2) One-month period ended March 31, 2002. The fund's fiscal year end was
changed from February 28 to March 31, resulting in a one-month reporting
period. For years prior, the fund's fiscal year end was February 28.
(3) Per-share amount was less than $0.005.
(4) Total return assumes reinvestment of net investment income and capital
gains distributions, if any. Total returns for periods less than one year
are not annualized.
(5) Effective July 29, 2005, the investment advisor voluntarily agreed to waive
a portion of the management fee.
(6) Annualized.
See Notes to Financial Statements.
- ------
21
Prime Money Market - Financial Highlights
For a Share Outstanding Throughout the Years Ended March 31 (except as noted)
- ----------------------------------------------------------------------------------------------
ADVISOR CLASS
- ----------------------------------------------------------------------------------------------
2006(1) 2006 2005 2004 2003 2002(2) 2002
- ----------------------------------------------------------------------------------------------
PER-SHARE DATA
- ----------------------------------------------------------------------------------------------
Net Asset Value,
Beginning
of Period $1.00 $1.00 $1.00 $1.00 $1.00 $1.00 $1.00
- ----------------------------------------------------------------------------------------------
Income From
Investment
Operations
- ----------------------------------------------------------------------------------------------
Net Investment
Income (Loss) 0.02 0.03 0.01 --(3) 0.01 --(3) 0.03
- ----------------------------------------------------------------------------------------------
Distributions
- ---------------
From Net
Investment
Income (0.02) (0.03) (0.01) --(3) (0.01) --(3) (0.03)
- ----------------------------------------------------------------------------------------------
Net Asset Value,
End of Period $1.00 $1.00 $1.00 $1.00 $1.00 $1.00 $1.00
==============================================================================================
TOTAL RETURN(4) 2.22% 3.02% 0.94% 0.33% 0.93% 0.10% 2.90%
==============================================================================================
RATIOS/SUPPLEMENTAL DATA
- ----------------------------------------------------------------------------------------------
Ratio of
Operating
Expenses
to Average
Net Assets 0.80%(5)(6) 0.82%(5) 0.85% 0.86% 0.86% 0.85%(6) 0.85%
- ---------------
Ratio of
Operating
Expenses
to Average
Net Assets
(Before
Expense Waiver) 0.84%(6) 0.84% 0.85% 0.86% 0.86% 0.85%(6) 0.85%
- ---------------
Ratio of Net
Investment
Income (Loss)
To Average
Net Assets 4.39%(5)(6) 2.99%(5) 0.92% 0.33% 0.94% 1.23%(6) 2.88%
- ---------------
Ratio of Net
Investment
Income (Loss)
to Average
Net Assets
(Before
Expense Waiver) 4.35%(6) 2.97% 0.92% 0.33% 0.94% 1.23%(6) 2.88%
- ---------------
Net Assets,
End of Period
(in thousands) $3,200 $3,145 $2,560 $3,055 $5,431 $14,329 $13,609
- ----------------------------------------------------------------------------------------------
(1) Six months ended September 30, 2006 (unaudited).
(2) One-month period ended March 31, 2002. The fund's fiscal year end was
changed from February 28 to March 31, resulting in a one-month reporting
period. For years prior, the fund's fiscal year end was February 28.
(3) Per-share amount was less than $0.005.
(4) Total return assumes reinvestment of net investment income and capital
gains distributions, if any. Total returns for periods less than one year
are not annualized.
(5) Effective July 29, 2005, the investment advisor voluntarily agreed to waive
a portion of the management fee.
(6) Annualized.
See Notes to Financial Statements.
- ------
22
Prime Money Market - Financial Highlights
For a Share Outstanding Throughout the Years Ended March 31 (except as noted)
- ---------------------------------------------------------------------------------------------
A CLASS
- ---------------------------------------------------------------------------------------------
2006(1) 2006 2005 2004 2003(2)
- ---------------------------------------------------------------------------------------------
PER-SHARE DATA
- ---------------------------------------------------------------------------------------------
Net Asset Value,
Beginning of Period $1.00 $1.00 $1.00 $1.00 $1.00
- ---------------------------------------------------------------------------------------------
Income From
Investment Operations
- ---------------------------------------------------------------------------------------------
Net Investment
Income (Loss) 0.02 0.03 0.01 --(3) --(3)
- ---------------------------------------------------------------------------------------------
Distributions
- ---------------------------
From Net
Investment Income (0.02) (0.03) (0.01) --(3) --(3)
- ---------------------------------------------------------------------------------------------
Net Asset Value,
End of Period $1.00 $1.00 $1.00 $1.00 $1.00
=============================================================================================
TOTAL RETURN(4) 2.22% 3.05% 0.95% 0.38% 0.12%
=============================================================================================
RATIOS/SUPPLEMENTAL DATA
- ---------------------------------------------------------------------------------------------
Ratio of Operating Expenses
to Average Net Assets 0.80%(5)(6) 0.82%(5) 0.85% 0.83%(7) 0.61%(6)(7)
- ---------------------------
Ratio of Operating Expenses
to Average Net Assets
(Before Expense Waiver) 0.84%(6) 0.84% 0.85% 0.86% 0.86%(6)
- ---------------------------
Ratio of Net Investment
Income (Loss)
to Average Net Assets 4.39%(5)(6) 2.99%(5) 0.92% 0.36%(7) 0.76%(6)(7)
- ---------------------------
Ratio of Net Investment
Income (Loss)
to Average Net Assets
(Before Expense Waiver) 4.35%(6) 2.97% 0.92% 0.33% 0.51%(6)
- ---------------------------
Net Assets,
End of Period
(in thousands) $87,352 $45,154 $60 $25 $25
- ---------------------------------------------------------------------------------------------
(1) Six months ended September 30, 2006 (unaudited).
(2) January 31, 2003 (commencement of sale) through March 31, 2003.
(3) Per-share amount was less than $0.005.
(4) Total return assumes reinvestment of net investment income and capital
gains distributions, if any, and does not reflect applicable sales charges.
Total returns for periods less than one year are not annualized.
(5) Effective July 29, 2005, the investment advisor voluntairly agreed to waive
a portion of the management fee.
(6) Annualized.
(7) The distributor voluntarily waived a portion of the distribution and
service fees.
See Notes to Financial Statements.
- ------
23
Prime Money Market - Financial Highlights
For a Share Outstanding Throughout the Years Ended March 31 (except as noted)
- --------------------------------------------------------------------------------------------------------
B CLASS
- --------------------------------------------------------------------------------------------------------
2006(1) 2006 2005 2004 2003(2)
- --------------------------------------------------------------------------------------------------------
PER-SHARE DATA
- --------------------------------------------------------------------------------------------------------
Net Asset Value,
Beginning of Period $1.00 $1.00 $1.00 $1.00 $1.00
- --------------------------------------------------------------------------------------------------------
Income From
Investment Operations
- --------------------------------------------------------------------------------------------------------
Net Investment
Income (Loss) 0.02 0.02 --(3) --(3) --(3)
- --------------------------------------------------------------------------------------------------------
Distributions
- -------------------------
From Net
Investment Income (0.02) (0.02) --(3) --(3) --(3)
- --------------------------------------------------------------------------------------------------------
Net Asset Value,
End of Period $1.00 $1.00 $1.00 $1.00 $1.00
========================================================================================================
TOTAL RETURN(4) 1.84% 2.26% 0.34% 0.22% 0.12%
========================================================================================================
RATIOS/SUPPLEMENTAL DATA
Ratio of Operating
Expenses to
Average Net Assets 1.55%(5)(6) 1.57%(5) 1.48%(7) 0.99%(7) 0.61%(6)(7)
- -------------------------
Ratio of Operating
Expenses to Average
Net Assets
(Before Expense Waiver) 1.59%(6) 1.59% 1.60% 1.61% 1.61%(6)
- -------------------------
Ratio of Net Investment
Income (Loss)
to Average Net Assets 3.64%(5)(6) 2.24%(5) 0.29%(7) 0.20%(7) 0.76%(6)(7)
- -------------------------
Ratio of Net Investment
Income (Loss)
to Average Net Assets
(Before Expense Waiver) 3.60%(6) 2.22% 0.17% (0.42)% (0.24)%(6)
- -------------------------
Net Assets,
End of Period
(in thousands) $1,186 $134 $97 $74 $25
- --------------------------------------------------------------------------------------------------------
(1) Six months ended September 30, 2006 (unaudited).
(2) January 31, 2003 (commencement of sale) through March 31, 2003.
(3) Per-share amount was less than $0.005.
(4) Total return assumes reinvestment of net investment income and capital
gains distributions, if any, and does not reflect applicable sales charges.
Total returns for periods less than one year are not annualized.
(5) Effective July 29, 2005, the investment advisor voluntairly agreed to waive
a portion of the management fee.
(6) Annualized.
(7) The distributor voluntarily waived a portion of the distribution and
service fees.
See Notes to Financial Statements.
- ------
24
Prime Money Market - Financial Highlights
For a Share Outstanding Throughout the Years Ended March 31 (except as noted)
- ---------------------------------------------------------------------------------------------------------
C CLASS
- ---------------------------------------------------------------------------------------------------------
2006(1) 2006 2005 2004 2003(2)
- ---------------------------------------------------------------------------------------------------------
PER-SHARE DATA
- ---------------------------------------------------------------------------------------------------------
Net Asset Value,
Beginning of Period $1.00 $1.00 $1.00 $1.00 $1.00
- ---------------------------------------------------------------------------------------------------------
Income From
Investment Operations
- ---------------------------------------------------------------------------------------------------------
Net Investment
Income (Loss) 0.02 0.02 0.01 --(3) --(3)
- ---------------------------------------------------------------------------------------------------------
Distributions
- -------------------------
From Net Investment
Income (Loss) (0.02) (0.02) (0.01) --(3) --(3)
- ---------------------------------------------------------------------------------------------------------
Net Asset Value,
End of Period $1.00 $1.00 $1.00 $1.00 $1.00
=========================================================================================================
TOTAL RETURN(4) 1.97% 2.51% 0.57% 0.09% 0.40%
- ---------------------------------------------------------------------------------------------------------
RATIOS/SUPPLEMENTAL DATA
- ---------------------------------------------------------------------------------------------------------
Ratio of Operating
Expenses to
Average Net Assets 1.30%(5)(6) 1.32%(5) 1.28%(7) 1.10%(7) 1.34%(6)(7)
- -------------------------
Ratio of Operating
Expenses to
Average Net Assets
(Before Expense Waiver) 1.34%(6) 1.34% 1.35% 1.36% 1.36%(6)
- -------------------------
Ratio of Net Investment
Income (Loss)
to Average Net Assets 3.89%(5)(6) 2.49%(5) 0.49%(7) 0.09%(7) 0.47%(6)(7)
- -------------------------
Ratio of Net Investment
Income (Loss)
to Average Net Assets
(Before Expense Waiver) 3.85%(6) 2.47% 0.42% (0.17)% 0.45%(6)
- -------------------------
Net Assets,
End of Period
(in thousands) $688 $863 $604 $96 $40
- ---------------------------------------------------------------------------------------------------------
(1) Six months ended September 30, 2006 (unaudited).
(2) May 7, 2002 (commencement of sale) through March 31, 2003.
(3) Per-share amount was less than $0.005.
(4) Total return assumes reinvestment of net investment income and capital
gains distributions, if any, and does not reflect applicable sales charges.
Total returns for periods less than one year are not annualized.
(5) Effective July 29, 2005, the investment advisor voluntairly agreed to waive
a portion of the management fee.
(6) Annualized.
(7) The distributor voluntarily waived a portion of the distribution and
service fees.
See Notes to Financial Statements.
- ------
25
Approval of Management Agreement for Prime Money
Market
Under Section 15(c) of the Investment Company Act, contracts for investment
advisory services are required to be reviewed, evaluated and approved by a
majority of a fund's independent directors or trustees (the "Directors") each
year. At American Century, this process is referred to as the "15(c) Process."
As a part of this process, the board reviews fund performance, shareholder
services, audit and compliance information, and a variety of other reports from
the advisor concerning fund operations. In addition to this annual review, the
board of directors oversees and evaluates on a continuous basis at its quarterly
meetings the nature and quality of significant services performed by the
advisor, fund performance, audit and compliance information, and a variety of
other reports relating to fund operations. The board, or committees of the
board, also holds special meetings as needed.
Under a Securities and Exchange Commission rule, each fund is required to
disclose in its annual or semiannual report, as appropriate, the material
factors and conclusions that formed the basis for the board's approval or
renewal of any advisory agreements within the fund's most recently completed
fiscal half-year period.
ANNUAL CONTRACT REVIEW PROCESS
As part of the annual 15(c) Process undertaken during the most recent fiscal
half-year period, the Directors reviewed extensive data and information compiled
by the advisor and certain independent providers of evaluative data (the "15(c)
Providers") concerning Prime Money Market (the "fund") and the services provided
to the fund under the management agreement. The information considered and the
discussions held at the meetings included, but were not limited to:
* the nature, extent and quality of investment management, shareholder services
and other services provided to the fund under the management agreement;
* reports on the advisor's activities relating to the wide range of programs and
services the advisor provides to the fund and its shareholders on a routine
and non-routine basis;
* data comparing the cost of owning the fund to the cost of owning a similar
fund;
* data comparing the fund's performance to appropriate benchmarks and/or a peer
group of other mutual funds with similar investment objectives and strategies;
* financial data showing the profitability of the fund to the advisor and the
overall profitability of the advisor; and
* data comparing services provided and charges to other investment management
clients of the advisor.
In keeping with its practice, the fund's board of directors held two regularly
scheduled meetings and one special meeting to review and discuss the information
provided by the advisor and to complete its negotiations with the advisor
regarding the renewal of the management agreement, including the setting of the
applicable advisory fee. The board also had the benefit of the advice of its
independent counsel throughout the period.
(continued)
- ------
26
Approval of Management Agreement for Prime Money Market
FACTORS CONSIDERED
The Directors considered all of the information provided by the advisor, the
15(c) Providers, and the board's independent counsel, and evaluated such
information for each fund for which the board has responsibility. The Directors
did not identify any single factor as being all-important or controlling, and
each Director may have attributed different levels of importance to different
factors. In deciding to renew the agreement under the terms ultimately
determined by the board to be appropriate, the Directors' decision was based on
the following factors.
NATURE, EXTENT AND QUALITY OF SERVICES -- GENERALLY. Under the management
agreement, the advisor is responsible for providing or arranging for all
services necessary for the operation of the fund. The board noted that under the
management agreement, the advisor provides or arranges at its own expense a wide
variety of services including:
* fund construction and design
* portfolio security selection
* initial capitalization/funding
* securities trading
* custody of fund assets
* daily valuation of the fund's portfolio
* shareholder servicing and transfer agency, including shareholder
confirmations, recordkeeping and communications
* legal services
* regulatory and portfolio compliance
* financial reporting
* marketing and distribution
The Directors noted that many of these services have expanded over time both in
terms of quantity and complexity in response to shareholder demands, competition
in the industry and the changing regulatory environment. In performing their
evaluation, the Directors considered information received in connection with the
annual review, as well as information provided on an ongoing basis at their
regularly scheduled board and committee meetings.
INVESTMENT MANAGEMENT SERVICES. The nature of the investment management services
provided is quite complex and allows fund shareholders access to professional
money management, instant diversification of their investments within an asset
class, the opportunity to easily diversify among asset classes, and liquidity.
In evaluating investment performance, the board expects the advisor to manage
the fund in accordance with its investment objectives and approved strategies.
In providing these services, the advisor utilizes teams of investment
professionals (portfolio managers, analysts, research assistants, and securities
traders) who require extensive information technology, research, training,
compliance and other systems to conduct their business. At each quarterly
meeting the Directors review investment performance information for the fund,
together with comparative information for appropriate benchmarks and peer groups
of funds managed similarly to the fund. The Directors also review detailed
performance information during the 15(c) Process comparing the fund's
performance with that of similar funds not managed by the advisor. If
performance concerns are identified, the Directors (continued)
(continued)
- ------
27
Approval of Management Agreement for Prime Money
Market
discuss with the advisor the reasons for such results (e.g., market conditions,
security selection) and any efforts being undertaken to improve performance. The
fund's performance for both the one and three year periods was above the median
for its peer group.
SHAREHOLDER AND OTHER SERVICES. The advisor provides the fund with a
comprehensive package of transfer agency, shareholder, and other services. The
Directors review reports and evaluations of such services at their regular
quarterly meetings, including the annual meeting concerning contract review, and
reports to the board. These reports include, but are not limited to, information
regarding the operational efficiency and accuracy of the shareholder and
transfer agency services provided, staffing levels, shareholder satisfaction (as
measured by external as well as internal sources), technology support, new
products and services offered to fund shareholders, securities trading
activities, portfolio valuation services, auditing services, and legal and
operational compliance activities. Certain aspects of shareholder and transfer
agency service level efficiency and the quality of securities trading activities
are measured by independent third party providers and are presented in
comparison to other fund groups not managed by the advisor.
COSTS OF SERVICES PROVIDED AND PROFITABILITY TO THE ADVISOR. The advisor
provides detailed information concerning its cost of providing various services
to the fund, its profitability in managing the fund, its overall profitability,
and its financial condition. The Directors have reviewed with the advisor the
methodology used to prepare this financial information. This financial
information regarding the advisor is considered in order to evaluate the
advisor's financial condition, its ability to continue to provide services under
the management agreement, and the reasonableness of the current management fee.
ETHICS OF THE ADVISOR. The Directors generally consider the advisor's commitment
to providing quality services to shareholders and to conducting its business
ethically. They noted that the advisor's practices generally meet or exceed
industry best practices and that the advisor was not implicated in the industry
scandals of 2003 and 2004.
ECONOMIES OF SCALE. The Directors review reports provided by the advisor on
economies of scale for the complex as a whole and the year-over-year changes in
revenue, costs, and profitability. The Directors concluded that economies of
scale are difficult to measure and predict with precision, especially on a
fund-by-fund basis. This analysis is also complicated by the additional services
and content provided by the advisor and its reinvestment in its ability to
provide and expand those services. Accordingly, the Directors also seek to
evaluate economies of scale by reviewing other information, such as
year-over-year profitability of the advisor generally, the profitability of its
management of the fund specifically, the expenses incurred by the advisor in
providing various functions to the fund, and the breakpoint fees of competitive
funds not managed by the advisor. The Directors believe the advisor is
appropriately sharing economies of scale through its competitive fee structure,
fee breakpoints
(continued)
- ------
28
Approval of Management Agreement for Prime Money Market
as the fund complex and the fund increases in size, and through reinvestment in
its business to provide shareholders additional content and services. In
particular, separate breakpoint schedules based on the size of the entire fund
complex and on the size of the fund reflect the complexity of assessing
economies of scale.
COMPARISON TO OTHER FUNDS' FEES. The fund pays the advisor a single,
all-inclusive (or unified) management fee for providing all services necessary
for the management and operation of the fund, other than brokerage expenses,
taxes, interest, extraordinary expenses, and the fees and expenses of the fund's
independent directors (including their independent legal counsel). Under the
unified fee structure, the advisor is responsible for providing all investment
advisory, custody, audit, administrative, compliance, recordkeeping, marketing
and shareholder services, or arranging and supervising third parties to provide
such services. By contrast, most other funds are charged a variety of fees,
including an investment advisory fee, a transfer agency fee, an administrative
fee, distribution charges and other expenses. Other than their investment
advisory fees and Rule 12b-1 distribution fees, all other components of the
total fees charged by these other funds may be increased without shareholder
approval. The board believes the unified fee structure is a benefit to fund
shareholders because it clearly discloses to shareholders the cost of owning
fund shares, and, since the unified fee cannot be increased without a vote of
fund shareholders, it shifts to the advisor the risk of increased costs of
operating the fund and provides a direct incentive to minimize administrative
inefficiencies. Part of the Directors' analysis of fee levels involves reviewing
certain evaluative data compiled by an independent provider and comparing the
fund's unified fee to the total expense ratio of other funds in the fund's peer
group. The unified fee charged to shareholders of the fund was below the median
of the total expense ratios of its peer group.
COMPARISON TO FEES AND SERVICES PROVIDED TO OTHER CLIENTS OF THE ADVISOR. The
Directors also requested and received information from the advisor concerning
the nature of the services, fees, and profitability of its advisory services to
advisory clients other than the fund. They observed that these varying types of
client accounts require different services and involve different regulatory and
entrepreneurial risks than the management of the fund. The Directors analyzed
this information and concluded that the fees charged and services provided to
the fund were reasonable by comparison.
COLLATERAL BENEFITS DERIVED BY THE ADVISOR. The Directors reviewed information
from the advisor concerning collateral benefits it receives as a result of its
relationship with the fund. They concluded that the advisor's primary business
is managing mutual funds and it generally does not use the fund or shareholder
information to generate profits in other lines of business, and therefore does
not derive any significant collateral benefits from them. The Directors noted
that the advisor receives proprietary research from broker dealers that execute
fund portfolio transactions and concluded that this research is likely to
benefit fund shareholders. The Directors also determined that the advisor is
able to provide investment
(continued)
- ------
29
Approval of Management Agreement for Prime Money
Market
management services to certain clients other than the fund, at least in part,
due to its existing infrastructure built to serve the fund complex. The
Directors concluded, however, that the assets of those other clients are not
material to the analysis and, in any event, are included with the assets of the
fund to determine breakpoints in the fund's fee schedule, provided they are
managed using the same investment team and strategy.
CONCLUSIONS OF THE DIRECTORS
As a result of this process, the Directors negotiated a one-year waiver by the
advisor of a portion of the management fee. These changes were proposed by the
Directors based on their review of the fund's percentile rank in its peer group
universe and the fact that the Directors seek as a general rule to have total
expense ratios of fixed income and money market funds in the lowest 25th
percentile of the fees of comparable funds. The advisor accepted the principle
of the fee waiver based on the fact that the lower fee will result in increased
competitiveness of the fund within its peer group universe. The fee waiver,
effective August 1, 2006, will result in a lowering of the management fee of the
fund by 0.05 percentage points below the current management fee. Following these
negotiations with the advisor, the Directors concluded that the investment
management agreement between the fund and the advisor is fair and reasonable in
light of the services provided and should be renewed.
- ------
30
Share Class Information
Five classes of shares are authorized for sale by the fund: Investor Class,
Advisor Class, A Class, B Class, and C Class. The total expense ratios for
Advisor Class, A Class, B Class, and C Class shares are higher than those of
Investor Class shares.
INVESTOR CLASS shares are available for purchase in two ways: 1) directly from
American Century without any commissions or other fees; or 2) through certain
financial intermediaries (such as banks, broker-dealers, insurance companies and
investment advisors), which may require payment of a transaction fee to the
financial intermediary.
ADVISOR CLASS shares are sold primarily through institutions such as investment
advisors, banks, broker-dealers, insurance companies, and financial advisors.
Advisor Class shares are subject to a 0.50% annual Rule 12b-1 distribution and
service fee. The total expense ratio of Advisor Class shares is 0.25% higher
than the total expense ratio of Investor Class shares.
A CLASS shares are sold primarily through employer-sponsored retirement plans
and through institutions such as investment advisors, banks, broker-dealers, and
insurance companies. A Class shares are sold at their net asset value. If you
purchase A Class shares of the fund directly, a sales charge will apply when you
exchange into the A Class shares of another American Century Advisor Fund, in
accordance with the schedule set forth in that fund's prospectus. A Class shares
may be subject to a contingent deferred sales charge (CDSC). There is no CDSC on
shares acquired through reinvestment of dividends or capital gains. The
prospectus contains information regarding reductions and waivers of sales
charges for A Class shares. The unified management fee for A Class shares is the
same as for Investor Class shares. A Class shares also are subject to a 0.25%
annual Rule 12b-1 distribution and service fee.
B CLASS shares are sold primarily through employer-sponsored retirement plans
and through institutions such as investment advisors, banks, broker-dealers, and
insurance companies. B Class shares redeemed within six years of purchase are
subject to a CDSC that declines from 5.00% during the first year after purchase
to 0.00% after the sixth year. There is no CDSC on shares acquired through
reinvestment of dividends or capital gains. The unified management fee for B
Class shares is the same as for Investor Class shares. B Class shares also are
subject to a 1.00% annual Rule 12b-1 distribution and service fee. B Class
shares automatically convert to A Class shares (with lower expenses) eight years
after their purchase date.
C CLASS shares are sold primarily through employer-sponsored retirement plans
and through institutions such as investment advisors, banks, broker-dealers, and
insurance companies. C Class shares redeemed within 12 months of purchase are
subject to a CDSC of 0.75%. There is no CDSC on shares acquired through
reinvestment of dividends or capital gains. The unified management fee for C
Class shares is the same as for Investor Class shares. C Class shares also are
subject to a Rule 12b-1 distribution and service fee of 0.75%.
All classes of shares represent a pro rata interest in the fund and generally
have the same rights and preferences.
- ------
31
Additional Information
RETIREMENT ACCOUNT INFORMATION
As required by law, any distributions you receive from an IRA or certain 403(b),
457 and qualified plans [those not eligible for rollover to an IRA or to another
qualified plan] are subject to federal income tax withholding, unless you elect
not to have withholding apply. Tax will be withheld on the total amount
withdrawn even though you may be receiving amounts that are not subject to
withholding, such as nondeductible contributions. In such case, excess amounts
of withholding could occur. You may adjust your withholding election so that a
greater or lesser amount will be withheld.
If you don't want us to withhold on this amount, you must notify us to not
withhold the federal income tax. Even if you plan to roll over the amount you
withdraw to another tax-deferred account, the withholding rate still applies to
the withdrawn amount unless we have received notice not to withhold federal
income tax prior to the withdrawal. You may notify us in writing or in certain
situations by telephone or through other electronic means. You have the right to
revoke your withholding election at any time and any election you make may
remain in effect until revoked by filing a new election.
Remember, even if you elect not to have income tax withheld, you are liable for
paying income tax on the taxable portion of your withdrawal. If you elect not to
have income tax withheld or you don't have enough income tax withheld, you may
be responsible for payment of estimated tax. You may incur penalties under the
estimated tax rules if your withholding and estimated tax payments are not
sufficient.
State tax will be withheld if, at the time of your distribution, your address is
within one of the mandatory withholding states and you have federal income tax
withheld. State taxes will be withheld from your distribution in accordance with
the respective state rules.
PROXY VOTING GUIDELINES
American Century Investment Management, Inc., the fund's investment advisor, is
responsible for exercising the voting rights associated with the securities
purchased and/or held by the fund. A description of the policies and procedures
the advisor uses in fulfilling this responsibility is available without charge,
upon request, by calling 1-800-345-2021. It is also available on American
Century's website at americancentury.com and on the Securities and Exchange
Commission's website at sec.gov. Information regarding how the investment
advisor voted proxies relating to portfolio securities during the most recent
12-month period ended June 30 is available on the "About Us" page at
americancentury.com. It is also available at sec.gov.
QUARTERLY PORTFOLIO DISCLOSURE
The fund files its complete schedule of portfolio holdings with the Securities
and Exchange Commission (SEC) for the first and third quarters of each fiscal
year on Form N-Q. The fund's Form N-Q is available on the SEC's website at
sec.gov, and may be reviewed and copied at the SEC's Public Reference Room in
Washington, DC. Information on the operation of the Public Reference Room may be
obtained by calling 1-800-SEC-0330. The fund also makes its complete schedule of
portfolio holdings for the most recent quarter of its fiscal year available on
its website at americancentury.com and, upon request, by calling 1-800-345-2021.
- ------
32
Index Definitions
The following indices are used to illustrate investment market, sector, or style
performance or to serve as fund performance comparisons. They are not investment
products available for purchase.
The 90-DAY U.S. TREASURY BILL INDEX is derived from secondary market interest
rates as published by the Federal Reserve Bank and includes three-month,
six-month, and one-year instruments.
The LEHMAN BROTHERS U.S. AGENCY INDEX is composed of those securities included
in the Lehman Brothers U.S. Aggregate Index that are public obligations of U.S.
government agencies, quasi-federal corporations, and corporate or foreign debt
guaranteed by the U.S. government.
The LEHMAN BROTHERS U.S. AGGREGATE INDEX represents securities that are taxable,
registered with the Securities and Exchange Commission, and U.S.
dollar-denominated. The index covers the U.S. investment-grade fixed-rate bond
market, with index components for government and corporate securities, mortgage
pass-through securities, and asset-backed securities.
The LEHMAN BROTHERS U.S. CORPORATE HIGH-YIELD INDEX covers the U.S. dollar-
denominated, non-investment grade, fixed-rate, taxable corporate bond market.
The LEHMAN BROTHERS U.S. CORPORATE INDEX is composed of those securities
included in the Lehman Brothers U.S. Aggregate Index that are U.S.
dollar-denominated, investment-grade, fixed-rate, taxable securities sold by
industrial, utility and financial issuers.
The LEHMAN BROTHERS U.S. FIXED-RATE MORTGAGE-BACKED SECURITIES (MBS) INDEX is
the MBS Fixed-Rate component of the Lehman Brothers U.S. Aggregate Index. It
covers the mortgage-backed pass-through securities of the Government National
Mortgage Association (GNMA), the Federal National Mortgage Association (FNMA),
and the Federal Home Loan Mortgage Corporation (FHLMC).
The LEHMAN BROTHERS U.S. TREASURY INDEX is composed of those securities included
in the Lehman Brothers U.S. Aggregate Index that are public obligations of the
U.S. Treasury with a remaining maturity of one year or more.
- ------
33
Notes
- ------
34
Notes
- ------
35
Notes
- ------
36
CONTACT US
AMERICANCENTURY.COM
AUTOMATED INFORMATION LINE:
1-800-345-8765
INVESTOR SERVICES REPRESENTATIVE:
1-800-345-2021 or 816-531-5575
INVESTORS USING ADVISORS:
1-800-378-9878
BUSINESS, NOT-FOR-PROFIT,
EMPLOYER-SPONSORED RETIREMENT PLANS:
1-800-345-3533
BANKS AND TRUST COMPANIES, BROKER-DEALERS,
FINANCIAL PROFESSIONALS, INSURANCE COMPANIES:
1-800-345-6488
TELECOMMUNICATIONS DEVICE FOR THE DEAF:
1-800-634-4113 or 816-444-3485
AMERICAN CENTURY INVESTMENT TRUST
INVESTMENT ADVISOR:
American Century Investment Management, Inc.
Kansas City, Missouri
THIS REPORT AND THE STATEMENTS IT CONTAINS ARE SUBMITTED FOR THE GENERAL
INFORMATION OF OUR SHAREHOLDERS. THE REPORT IS NOT AUTHORIZED FOR DISTRIBUTION
TO PROSPECTIVE INVESTORS UNLESS PRECEDED OR ACCOMPANIED BY AN EFFECTIVE
PROSPECTUS.
American Century Investments PRSRT STD
P.O. Box 419200 U.S. POSTAGE PAID
Kansas City, MO 64141-6200 AMERICAN CENTURY
COMPANIES
The American Century Investments logo, American Century
and American Century Investments are service marks
of American Century Proprietary Holdings, Inc.
American Century Investment Services, Inc., Distributor
(c)2006 American Century Proprietary Holdings, Inc. All rights reserved.
0611
SH-SAN-51670S
AMERICAN CENTURY INVESTMENTS
Semiannual Report
September 30, 2006
Diversified Bond Fund
High-Yield Fund
[american century investments logo and text logo]
Our Message to You
[photo of James E. Stowers III and James E. Stowers, Jr.]
/s/James E. Stowers, Jr.
James E. Stowers, Jr.
Founder
American Century Companies, Inc.
/s/James E. Stowers III
James E. Stowers III
Chairman of the Board
American Century Companies, Inc.
We are pleased to provide you with the semiannual report for the American
Century Diversified Bond and High-Yield funds for the six months ended September
30, 2006. We hope you find this information helpful in monitoring your
investment. Another useful resource we offer is our website,
americancentury.com, where we post quarterly portfolio commentaries, the views
of senior investment officers and analysts, and other communications about
investments, portfolio strategy, personal finance, and the markets.
In its most recent rankings, Dalbar -- which issues customer satisfaction
ratings and rankings based on website functionality -- ranked
americancentury.com fourth out of the sites provided by the top 25 fund
companies that it believes lead the industry in web-based technology. Our
website earned an "Excellent" rating, Dalbar's highest designation.
For most of 2006, our website has linked visitors to information explaining our
strategic collaboration with Lance Armstrong and the Lance Armstrong Foundation
(LAF). This campaign, featuring Lance, is designed to encourage investors to
take a more active role in planning their financial futures and make every
investment decision count. To learn more about the collaboration and the LAF,
please visit americancentury.com or www.lanceface.com on the Web and click on
the links to related sites.
With the approach of year end and the 2006 tax season, you can also find out
more about December fund distributions and tax information via a link from our
website. We've posted December distribution estimates for over 50 funds, answers
to frequent distribution questions, and online descriptions of all of the tax
information we provide to investors.
If you haven't visited americancentury.com yet, we encourage you to do so...
it's there to serve you. And so are we. As always, we deeply appreciate your
commitment to American Century Investments.
Table of Contents
Market Perspective. . . . . . . . . . . . . . . . . . . . . . . . . . . . . 2
U.S. Fixed Income Total Returns. . . . . . . . . . . . . . . . . . . . . 2
DIVERSIFIED BOND
Performance . . . . . . . . . . . . . . . . . . . . . . . . . . . . . . . . 3
Portfolio Commentary. . . . . . . . . . . . . . . . . . . . . . . . . . . . 5
Portfolio at a Glance. . . . . . . . . . . . . . . . . . . . . . . . . . 5
Yields . . . . . . . . . . . . . . . . . . . . . . . . . . . . . . . . . 5
Types of Investments in Portfolio. . . . . . . . . . . . . . . . . . . . 6
Portfolio Composition by Credit Rating . . . . . . . . . . . . . . . . . 6
Schedule of Investments . . . . . . . . . . . . . . . . . . . . . . . . . . 7
HIGH-YIELD
Performance . . . . . . . . . . . . . . . . . . . . . . . . . . . . . . . .16
Portfolio Commentary. . . . . . . . . . . . . . . . . . . . . . . . . . . .18
Portfolio at a Glance. . . . . . . . . . . . . . . . . . . . . . . . . .18
Yields . . . . . . . . . . . . . . . . . . . . . . . . . . . . . . . . .18
Top Five Industries. . . . . . . . . . . . . . . . . . . . . . . . . . .19
Portfolio Composition by Credit Rating . . . . . . . . . . . . . . . . .19
Schedule of Investments . . . . . . . . . . . . . . . . . . . . . . . . . .20
Shareholder Fee Examples. . . . . . . . . . . . . . . . . . . . . . . . . .25
FINANCIAL STATEMENTS
Statement of Assets and Liabilities . . . . . . . . . . . . . . . . . . . .28
Statement of Operations . . . . . . . . . . . . . . . . . . . . . . . . . .30
Statement of Changes in Net Assets. . . . . . . . . . . . . . . . . . . . .31
Notes to Financial Statements . . . . . . . . . . . . . . . . . . . . . . .32
Financial Highlights. . . . . . . . . . . . . . . . . . . . . . . . . . . .40
OTHER INFORMATION
Approval of Management Agreements for
Diversified Bond and High-Yield . . . . . . . . . . . . . . . . . . . . . .54
Share Class Information . . . . . . . . . . . . . . . . . . . . . . . . . .59
Additional Information. . . . . . . . . . . . . . . . . . . . . . . . . . .61
Index Definitions . . . . . . . . . . . . . . . . . . . . . . . . . . . . .63
The opinions expressed in the Market Perspective and each of the Portfolio
Commentaries reflect those of the portfolio management team as of the date of
the report, and do not necessarily represent the opinions of American Century or
any other person in the American Century organization. Any such opinions are
subject to change at any time based upon market or other conditions and American
Century disclaims any responsibility to update such opinions. These opinions may
not be relied upon as investment advice and, because investment decisions made
by American Century funds are based on numerous factors, may not be relied upon
as an indication of trading intent on behalf of any American Century fund.
Security examples are used for representational purposes only and are not
intended as recommendations to purchase or sell securities. Performance
information for comparative indices and securities is provided to American
Century by third party vendors. To the best of American Century's knowledge,
such information is accurate at the time of printing.
Market Perspective
[photo of David MacEwan]
BY DAVID MACEWEN, CHIEF INVESTMENT OFFICER, FIXED INCOME
A TALE OF TWO QUARTERS
The second and third quarters of 2006 were very different in terms of inflation
and interest rate expectations and market performance. In the second quarter, as
core inflation rates remained above the Federal Reserve's 1-2% "comfort zone"
and threatened to go higher, investors feared the Fed would keep raising
interest rates and tip the economy into recession. Uncertainty about how far the
Fed would go, and how successful it would be in containing inflation, created a
defensive attitude in financial markets that resulted in disappointing returns
for broad stock and bond indices.
A FED PAUSE REFRESHED THE MARKETS
But in the third quarter, a 15% drop in oil prices helped take the heat off
inflation pressures, and cut business and consumer costs. Weakness in the
housing market -- though hard on many homeowners -- turned into a positive
factor for the markets. As home sales and prices declined, the Fed stopped its
interest rate tightening campaign, stepping back to assess the economy's
reaction to previous rate hikes. This combination of falling energy prices and
relief from rising interest rates helped broad U.S. stock and bond markets
rebound from second-quarter losses to post some of their biggest quarterly gains
this decade.
LONG-DURATION AND CORPORATE SECURITIES OUTPERFORMED
The bond market especially welcomed a gloomy housing-market forecast,
speculating that it would reduce economic growth, inflation, and interest rates.
This rekindled demand for longer-term fixed-income securities. As a result, the
Treasury yield curve fell for the six months and "inverted", as the two-year
yield (4.69%) remained higher than the 10-year yield (4.63%), and both fell well
below the Fed's 5.25% overnight interest rate target. Mirroring the stock
market's rally, the corporate sectors led the broad taxable market.
U.S. FIXED-INCOME TOTAL RETURNS*
For the six months ended September 30, 2006
- --------------------------------------------------------------------------------
TREASURY SECURITIES
- --------------------------------------------------------------------------------
3-month bill 2.51%
- --------------------------------------------------------------------------------
2-year note 2.53%
- --------------------------------------------------------------------------------
5-year note 3.20%
- --------------------------------------------------------------------------------
10-year note 3.83%
- --------------------------------------------------------------------------------
30-year bond 4.64%
- --------------------------------------------------------------------------------
LEHMAN BROTHERS U.S. BOND MARKET INDICES
- --------------------------------------------------------------------------------
Corporate High-Yield 4.33%
- --------------------------------------------------------------------------------
Corporate Investment-Grade 4.12%
- --------------------------------------------------------------------------------
Aggregate (multi-sector) 3.73%
- --------------------------------------------------------------------------------
Fixed-Rate Mortagage-Backed 3.64%
- --------------------------------------------------------------------------------
Treasury 3.61%
- --------------------------------------------------------------------------------
Agency 3.45%
- --------------------------------------------------------------------------------
*Total returns for periods less than one year are not annualized.
- ------
2
Diversified Bond - Performance
TOTAL RETURNS AS OF SEPTEMBER 30, 2006
------------------------------
AVERAGE ANNUAL RETURNS
- -----------------------------------------------------------------------------------------------
SINCE INCEPTION
6 MONTHS(1) 1 YEAR 5 YEARS 10 YEARS INCEPTION DATE
- -----------------------------------------------------------------------------------------------
INVESTOR CLASS 3.38% 3.22% -- -- 4.05% 12/3/01
- -----------------------------------------------------------------------------------------------
LEHMAN BROTHERS
U.S. AGGREGATE INDEX(2) 3.73% 3.67% 4.81% 6.42% 4.83%(3) --
- -----------------------------------------------------------------------------------------------
CITIGROUP US BROAD
INVESTMENT-GRADE BOND INDEX 3.73% 3.71% 4.85% 6.45% 4.88%(3) --
- -----------------------------------------------------------------------------------------------
Institutional Class 3.49% 3.42% 4.25% 5.87% 5.73% 4/1/93
- -----------------------------------------------------------------------------------------------
Advisor Class 3.25% 2.96% -- -- 3.79% 12/3/01
- -----------------------------------------------------------------------------------------------
A Class No sales charge* 3.26% 2.96% -- -- 3.07% 1/31/03
With sales charge* -1.43% -1.70% -- -- 1.79%
- -----------------------------------------------------------------------------------------------
B Class No sales charge* 2.87% 2.19% -- -- 2.32%(4) 1/31/03
With sales charge* -2.13% -1.81% -- -- 1.54%(4)
- -----------------------------------------------------------------------------------------------
C Class No sales charge* 2.86% 2.18% -- -- 2.37%(4) 1/31/03
With sales charge* 1.86% 2.18% -- -- 2.37%(4)
- -----------------------------------------------------------------------------------------------
R Class 3.12% 2.70% -- -- 2.37% 7/29/05
- -----------------------------------------------------------------------------------------------
*Sales charges include initial sales charges and contingent deferred sales
charges (CDSCs), as applicable. A Class shares have a 4.50% maximum initial
sales charge for fixed income funds and may be subject to a maximum CDSC of
1.00%. B Class shares redeemed within six years of purchase are subject to a
CDSC that declines from 5.00% during the first year after purchase to 0.00%
the sixth year after purchase. C Class shares redeemed within 12 months of
purchase are subject to a maximum CDSC of 1.00%. Please see the Share Class
Information pages for more about the applicable sales charges for each share
class. The SEC requires that mutual funds provide performance information net
of maximum sales charges in all cases where charges could be applied.
Diversified Bond acquired all of the net assets of the American Century
Intermediate-Term Bond Fund, the American Century Bond Fund, and the American
Century Premium Bond Fund on December 3, 2001, pursuant to a plan of
reorganization approved by the acquired funds' shareholders on November 16,
2001. Financial information prior to December 3, 2001 is that of American
Century Premium Bond Fund and is used in calculating the performance of
Diversified Bond.
(1) Total returns for periods less than one year are not annualized.
(2) Data provided by Lipper Inc. -- A Reuters Company. (c) 2006 Reuters. All
rights reserved. Any copying, republication or redistribution of Lipper
content, including by caching, framing or similar means, is expressly
prohibited without the prior written consent of Lipper. Lipper shall not be
liable for any errors or delays in the content, or for any actions taken in
reliance thereon.
The data contained herein has been obtained from company reports, financial
reporting services, periodicals and other resources believed to be reliable.
Although carefully verified, data on compilations is not guaranteed by
Lipper and may be incomplete. No offer or solicitations to buy or sell any
of the securities herein is being made by Lipper.
(3) Since 11/30/01, the date nearest the Investor Class's inception for which
data are available.
(4) Class returns would have been lower if American Century had not voluntarily
waived a portion of its distribution and service fees.
Data presented reflect past performance. Past performance is no guarantee of
future results. Current performance may be higher or lower than the performance
shown. Investment return and principal value will fluctuate, and redemption
value may be more or less than original cost. To obtain performance data current
to the most recent month end, please call 1-800-345-2021 or visit
americancentury.com. As interest rates rise, bond values will decline.
Unless otherwise indicated, performance reflects Investor Class shares;
performance for other share classes will vary due to differences in fee
structure. For information about other share classes available, please consult
the prospectus. Data assumes reinvestment of dividends and capital gains, and
none of the charts reflect the deduction of taxes that a shareholder would pay
on fund distributions or the redemption of fund shares. Returns for the indices
are provided for comparison. The fund's total returns include operating expenses
(such as transaction costs and management fees) that reduce returns, while the
total returns of the indices do not.
(continued)
- ------
3
Diversified Bond - Performance
GROWTH OF $10,000 OVER LIFE OF CLASS
$10,000 investment made December 3, 2001
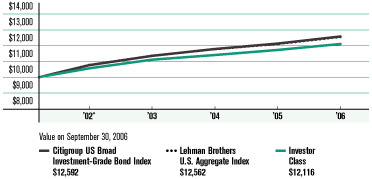
ONE-YEAR RETURNS OVER LIFE OF CLASS
Periods ended September 30
- --------------------------------------------------------------------------------
2002* 2003 2004 2005 2006
- --------------------------------------------------------------------------------
Investor Class 5.72% 5.19% 2.66% 2.82% 3.22%
- --------------------------------------------------------------------------------
Lehman Brothers
U.S. Aggregate Index 7.86% 5.41% 3.68% 2.80% 3.67%
- --------------------------------------------------------------------------------
Citigroup US Broad
Investment-Grade Bond Index 7.72% 5.49% 3.82% 2.92% 3.71%
- --------------------------------------------------------------------------------
*From 12/3/01, the Investor Class's inception date. Index data from 11/30/01,
the date nearest the Investor Class's inception for which data are available.
Not annualized.
Data presented reflect past performance. Past performance is no guarantee of
future results. Current performance may be higher or lower than the performance
shown. Investment return and principal value will fluctuate, and redemption
value may be more or less than original cost. To obtain performance data current
to the most recent month end, please call 1-800-345-2021 or visit
americancentury.com. As interest rates rise, bond values will decline.
Unless otherwise indicated, performance reflects Investor Class shares;
performance for other share classes will vary due to differences in fee
structure. For information about other share classes available, please consult
the prospectus. Data assumes reinvestment of dividends and capital gains, and
none of the charts reflect the deduction of taxes that a shareholder would pay
on fund distributions or the redemption of fund shares. Returns for the indices
are provided for comparison. The fund's total returns include operating expenses
(such as transaction costs and management fees) that reduce returns, while the
total returns of the indices do not.
- ------
4
Diversified Bond - Portfolio Commentary
PORTFOLIO MANAGERS: DAVE MACEWEN, BOB GAHAGAN, JIM KEEGAN, JEFF HOUSTON,
HANDO AGUILAR, BRIAN HOWELL, JOHN WALSH AND DAN SHIFFMAN
PERFORMANCE SUMMARY
Diversified Bond returned 3.38%* for the six months ended September 30, 2006. By
comparison, two broad indices representing the taxable investment-grade U.S.
bond market -- the Citigroup US Broad Investment-Grade Bond Index (BIG), and the
Lehman Brothers U.S. Aggregate Index-- both returned 3.73%. The portfolio's
results reflected operating expenses, while the indices returns did not.
Though the Fed's interest rate pause and one of the strongest quarterly bond
rallies this decade boosted all sectors of the taxable investment-grade U.S.
bond market in the third quarter of 2006 (and for the full six-month period),
they helped some sectors more than others. Relative performance between the
sectors, sector weightings, and maturity and duration positioning helped
determine the returns of Diversified Bond and the comparative indices.
SECTOR COMPOSITION OF THE PORTFOLIO AND THE INDICES
The market represented by the Citigroup BIG and the Lehman Aggregate consists
primarily of three bond sectors: fixed-rate mortgage-backed securities (MBS),
Treasury securities, and corporate bonds. MBS are part of a broader
"securitized" sector that includes asset-backed securities (ABS), which are
backed by payments from credit card debt, auto loans, and home-equity lines of
credit; and commercial mortgage-backed securities (CMBS). This broad securitized
sector represents over 40% of the taxable investment-grade market. Treasury and
corporate securities, by contrast, each represent approximately 20-25% of the
market, depending on what source you use and how you define the sectors.
Diversified Bond's market exposure is based on the Citigroup BIG. In 2006, we've
tended to maintain an overweight position in the securitized sector because it
has higher yields and less volatility than the Treasury sector,and higher credit
quality than the corporate sector.
PORTFOLIO POSITIONING
Our investment approach uses a consistent, repeatable framework that seeks to
identify the best relative value among the bond sectors described above. We
actively apply a multi-step process, which includes yield
PORTFOLIO AT A GLANCE
- --------------------------------------------------------------------------------
AS OF AS OF
9/30/06 3/31/06
- --------------------------------------------------------------------------------
Weighted Average Maturity 4.7 years 6.6 years
- --------------------------------------------------------------------------------
Average Duration (effective) 4.7 years 4.7 years
- --------------------------------------------------------------------------------
YIELDS AS OF SEPTEMBER 30, 2006
- --------------------------------------------------------------------------------
30-DAY SEC YIELD
- --------------------------------------------------------------------------------
Investor Class 4.72%
- --------------------------------------------------------------------------------
Institutional Class 4.92%
- --------------------------------------------------------------------------------
Advisor Class 4.47%
- --------------------------------------------------------------------------------
A Class 4.28%
- --------------------------------------------------------------------------------
B Class 3.72%
- --------------------------------------------------------------------------------
C Class 3.72%
- --------------------------------------------------------------------------------
R Class 4.22%
- --------------------------------------------------------------------------------
*All fund returns referenced in this commentary are
for Investor Class shares. Total returns for periods
less than one year are not annualized. (continued)
- ------
5
Diversified Bond - Portfolio Commentary
curve/duration positioning, security selection, portfolio construction, and
attribution analysis. The weighted average maturity of the portfolio must be
three-and-a-half years or longer.
During the period, longer-duration positions were rewarded. When bonds rallied
in the third quarter of the year, Diversified Bond's duration was slightly
longer than neutral, giving performance a boost. Our strategy to overweight
"spread" products (non-Treasury securities such as corporates, MBS, ABS, and
CMBS) also benefited the fund since these sectors outperformed Treasurys during
the period.
Within Diversified Bond's spread product overweight, we maintained an
underweight corporate position as a means of protecting the fund from so-called
event and "idiosyncratic" risks (such as leveraged buyouts, share buybacks and
special dividends). Though corporates performed well, this underweight position
turned out to be a plus for Diversified Bond, since we reallocated those assets
into CMBS, which offered the highest excess returns in the taxable bond market.
We believe a corporate underweight position is warranted, given changing
economic conditions, the peak in the credit cycle and historically tight
valuations.
PORTFOLIO OBJECTIVE AND STRATEGIES
Diversified Bond is designed to serve as a core portfolio holding. Investors can
benefit from exposure to a broad spectrum of bond sectors and from the fund's
historically negative correlation with the major U.S. stock indices. In
addition, the fund has historically delivered steady monthly income. Dividend
income becomes even more important when there's potential for flat or rising
interest rates -- it can provide return when there's little price action and
help cushion the impact of price declines. And, because of its high overall
credit quality and broad bond market exposure, Diversified Bond has the
potential to perform well during periods of economic weakness and declining
interest rates.
TYPES OF INVESTMENTS IN PORTFOLIO
- --------------------------------------------------------------------------------
% OF FUND % OF FUND
INVESTMENTS INVESTMENTS
AS OF AS OF
9/30/06 3/31/06
- --------------------------------------------------------------------------------
Mortgage-Backed
Securities 25.6% 22.7%
- --------------------------------------------------------------------------------
U.S. Government
Agency Securities 14.1% 17.8%
- --------------------------------------------------------------------------------
Corporate Bonds 13.2% 15.8%
- --------------------------------------------------------------------------------
CMOs 11.8% 14.6%
- --------------------------------------------------------------------------------
U.S. Treasury Securities 10.6% 8.2%
- --------------------------------------------------------------------------------
Asset-Backed Securities 9.1% 7.8%
- --------------------------------------------------------------------------------
Municipal Securities 1.3% 0.2%
- --------------------------------------------------------------------------------
Sovereign Governments
& Agencies 0.4% 0.5%
- --------------------------------------------------------------------------------
Temporary Cash
Investments 4.7% 3.6%
- --------------------------------------------------------------------------------
Collateral Received
for Securities Lending 9.2% 8.8%
- --------------------------------------------------------------------------------
PORTFOLIO COMPOSITION BY CREDIT RATING
- --------------------------------------------------------------------------------
% OF FUND % OF FUND
INVESTMENTS INVESTMENTS
AS OF AS OF
9/30/06 3/31/06
- --------------------------------------------------------------------------------
AAA 82% 80%
- --------------------------------------------------------------------------------
AA 3% 3%
- --------------------------------------------------------------------------------
A 7% 9%
- --------------------------------------------------------------------------------
BBB 8% 7%
- --------------------------------------------------------------------------------
BB -- 1%
- --------------------------------------------------------------------------------
- ------
6
Diversified Bond - Schedule of Investments
SEPTEMBER 30, 2006 (UNAUDITED)
Principal Amount Value
- --------------------------------------------------------------------------------
U.S. GOVERNMENT AGENCY
MORTGAGE-BACKED SECURITIES(1) -- 34.3%
$ 21,426 FHLMC, 6.50%, 2/1/09(2) $ 21,621
- --------------------------------------------------------------------------------
32,731 FHLMC, 6.50%, 12/1/12(2) 33,314
- --------------------------------------------------------------------------------
242,736 FHLMC, 6.00%, 1/1/13(2) 244,859
- --------------------------------------------------------------------------------
44,547 FHLMC, 7.00%, 11/1/13(2) 45,742
- --------------------------------------------------------------------------------
71,870 FHLMC, 7.00%, 6/1/14(2) 73,794
- --------------------------------------------------------------------------------
138,617 FHLMC, 6.50%, 6/1/16(2) 141,601
- --------------------------------------------------------------------------------
229,216 FHLMC, 6.50%, 6/1/16(2) 234,151
- --------------------------------------------------------------------------------
2,913,976 FHLMC, 5.00%, 11/1/17(2) 2,873,136
- --------------------------------------------------------------------------------
4,812,670 FHLMC, 4.50%, 1/1/19(2) 4,651,336
- --------------------------------------------------------------------------------
12,001,569 FHLMC, 5.00%, 1/1/21(2) 11,802,410
- --------------------------------------------------------------------------------
9,044,945 FHLMC, 5.00%, 4/1/21(2) 8,891,210
- --------------------------------------------------------------------------------
25,453 FHLMC, 7.00%, 9/1/27(2) 26,285
- --------------------------------------------------------------------------------
40,454 FHLMC, 6.50%, 1/1/28(2) 41,480
- --------------------------------------------------------------------------------
6,333 FHLMC, 7.00%, 2/1/28(2) 6,540
- --------------------------------------------------------------------------------
236,934 FHLMC, 6.50%, 3/1/29(2) 242,932
- --------------------------------------------------------------------------------
153,671 FHLMC, 6.50%, 6/1/29(2) 157,536
- --------------------------------------------------------------------------------
24,815 FHLMC, 7.00%, 8/1/29(2) 25,593
- --------------------------------------------------------------------------------
68,995 FHLMC, 7.50%, 8/1/29(2) 71,731
- --------------------------------------------------------------------------------
172,413 FHLMC, 6.50%, 5/1/31(2) 176,387
- --------------------------------------------------------------------------------
2,889 FHLMC, 6.50%, 5/1/31(2) 2,956
- --------------------------------------------------------------------------------
3,736 FHLMC, 6.50%, 6/1/31(2) 3,822
- --------------------------------------------------------------------------------
11,028 FHLMC, 6.50%, 6/1/31(2) 11,282
- --------------------------------------------------------------------------------
2,297 FHLMC, 6.50%, 6/1/31(2) 2,350
- --------------------------------------------------------------------------------
81,579 FHLMC, 6.50%, 6/1/31(2) 83,460
- --------------------------------------------------------------------------------
4,894 FHLMC, 6.50%, 6/1/31(2) 5,006
- --------------------------------------------------------------------------------
12,359 FHLMC, 6.50%, 6/1/31(2) 12,644
- --------------------------------------------------------------------------------
2,828,959 FHLMC, 5.50%, 12/1/33(2) 2,798,774
- --------------------------------------------------------------------------------
11,536,300 FNMA, 5.00%, settlement
date 10/12/06(3) 11,089,268
- --------------------------------------------------------------------------------
54,203,000 FNMA, 5.50%, settlement
date 10/12/06(3) 53,406,867
- --------------------------------------------------------------------------------
33,952,438 FNMA, 6.00%, settlement
date 10/12/06(3) 34,111,608
- --------------------------------------------------------------------------------
33,005,000 FNMA, 6.50%, settlement
date 10/12/06(3) 33,613,546
- --------------------------------------------------------------------------------
13,399,028 FNMA, 5.50%, settlement
date 10/17/06(3) 13,394,848
- --------------------------------------------------------------------------------
58,509 FNMA, 6.00%, 2/1/09(2) 58,718
- --------------------------------------------------------------------------------
25,571 FNMA, 6.00%, 5/1/13(2) 25,888
- --------------------------------------------------------------------------------
29,143 FNMA, 6.00%, 5/1/13(2) 29,481
- --------------------------------------------------------------------------------
93,411 FNMA, 6.00%, 7/1/13(2) 94,495
- --------------------------------------------------------------------------------
123,554 FNMA, 6.00%, 12/1/13(2) 124,988
- --------------------------------------------------------------------------------
111,232 FNMA, 6.00%, 1/1/14(2) 112,522
- --------------------------------------------------------------------------------
191,972 FNMA, 6.00%, 2/1/14(2) 194,199
- --------------------------------------------------------------------------------
199,484 FNMA, 6.00%, 4/1/14(2) 201,799
- --------------------------------------------------------------------------------
1,398,788 FNMA, 5.50%, 12/1/16(2) 1,403,214
- --------------------------------------------------------------------------------
735,142 FNMA, 5.50%, 12/1/16(2) 737,468
- --------------------------------------------------------------------------------
Principal Amount Value
- --------------------------------------------------------------------------------
$ 4,802,716 FNMA, 4.50%, 5/1/19(2) $ 4,641,821
- --------------------------------------------------------------------------------
125,975 FNMA, 6.50%, 1/1/26(2) 129,108
- --------------------------------------------------------------------------------
16,706 FNMA, 7.00%, 12/1/27(2) 17,252
- --------------------------------------------------------------------------------
6,551 FNMA, 6.50%, 1/1/28(2) 6,713
- --------------------------------------------------------------------------------
7,469 FNMA, 7.00%, 1/1/28(2) 7,713
- --------------------------------------------------------------------------------
34,642 FNMA, 7.50%, 4/1/28(2) 35,986
- --------------------------------------------------------------------------------
115,786 FNMA, 7.00%, 5/1/28(2) 119,530
- --------------------------------------------------------------------------------
7,484 FNMA, 7.00%, 6/1/28(2) 7,726
- --------------------------------------------------------------------------------
31,744 FNMA, 6.50%, 1/1/29(2) 32,534
- --------------------------------------------------------------------------------
79,850 FNMA, 6.50%, 4/1/29(2) 81,843
- --------------------------------------------------------------------------------
44,040 FNMA, 7.00%, 7/1/29(2) 45,425
- --------------------------------------------------------------------------------
47,609 FNMA, 7.00%, 7/1/29(2) 49,148
- --------------------------------------------------------------------------------
114,809 FNMA, 7.50%, 7/1/29(2) 119,192
- --------------------------------------------------------------------------------
32,673 FNMA, 7.00%, 5/1/30(2) 33,679
- --------------------------------------------------------------------------------
147,182 FNMA, 7.50%, 8/1/30(2) 152,439
- --------------------------------------------------------------------------------
68,633 FNMA, 7.50%, 9/1/30(2) 71,085
- --------------------------------------------------------------------------------
346,257 FNMA, 7.00%, 9/1/31(2) 356,594
- --------------------------------------------------------------------------------
176,434 FNMA, 6.50%, 1/1/32(2) 180,450
- --------------------------------------------------------------------------------
1,729,225 FNMA, 7.00%, 6/1/32(2) 1,780,312
- --------------------------------------------------------------------------------
717,548 FNMA, 6.50%, 8/1/32(2) 733,884
- --------------------------------------------------------------------------------
3,756,468 FNMA, 5.50%, 6/1/33(2) 3,712,483
- --------------------------------------------------------------------------------
18,767,321 FNMA, 5.50%, 7/1/33(2) 18,547,576
- --------------------------------------------------------------------------------
3,103,865 FNMA, 5.50%, 8/1/33(2) 3,067,522
- --------------------------------------------------------------------------------
4,096,233 FNMA, 5.50%, 9/1/33(2) 4,048,270
- --------------------------------------------------------------------------------
10,064,638 FNMA, 5.00%, 11/1/33(2) 9,708,352
- --------------------------------------------------------------------------------
8,231,168 FNMA, 5.50%, 1/1/34(2) 8,134,789
- --------------------------------------------------------------------------------
45,555 GNMA, 7.50%, 8/20/17(2) 46,898
- --------------------------------------------------------------------------------
80,847 GNMA, 7.00%, 11/15/22(2) 83,453
- --------------------------------------------------------------------------------
61,266 GNMA, 8.75%, 3/15/25(2) 65,906
- --------------------------------------------------------------------------------
16,881 GNMA, 7.00%, 4/20/26(2) 17,392
- --------------------------------------------------------------------------------
33,886 GNMA, 7.50%, 8/15/26(2) 35,347
- --------------------------------------------------------------------------------
16,366 GNMA, 8.00%, 8/15/26(2) 17,352
- --------------------------------------------------------------------------------
2,416 GNMA, 7.50%, 4/15/27(2) 2,522
- --------------------------------------------------------------------------------
37,727 GNMA, 7.50%, 5/15/27(2) 39,369
- --------------------------------------------------------------------------------
22,687 GNMA, 8.00%, 6/15/27(2) 24,051
- --------------------------------------------------------------------------------
2,369 GNMA, 7.50%, 11/15/27(2) 2,472
- --------------------------------------------------------------------------------
15,298 GNMA, 7.00%, 2/15/28(2) 15,805
- --------------------------------------------------------------------------------
27,841 GNMA, 7.50%, 2/15/28(2) 29,015
- --------------------------------------------------------------------------------
23,064 GNMA, 6.50%, 3/15/28(2) 23,733
- --------------------------------------------------------------------------------
28,249 GNMA, 7.00%, 4/15/28(2) 29,185
- --------------------------------------------------------------------------------
13,906 GNMA, 6.50%, 5/15/28(2) 14,309
- --------------------------------------------------------------------------------
69,804 GNMA, 6.50%, 5/15/28(2) 71,828
- --------------------------------------------------------------------------------
3,097 GNMA, 6.50%, 5/15/28(2) 3,186
- --------------------------------------------------------------------------------
18,614 GNMA, 7.00%, 12/15/28(2) 19,231
- --------------------------------------------------------------------------------
6,345 GNMA, 8.00%, 12/15/29(2) 6,732
- --------------------------------------------------------------------------------
174,809 GNMA, 7.00%, 5/15/31(2) 180,608
- --------------------------------------------------------------------------------
TOTAL U.S. GOVERNMENT AGENCY
MORTGAGE-BACKED SECURITIES
(Cost $238,312,267) 237,830,681
- --------------------------------------------------------------------------------
See Notes to Financial Statements. (continued)
- ------
7
Diversified Bond - Schedule of Investments
SEPTEMBER 30, 2006 (UNAUDITED)
Principal Amount Value
- --------------------------------------------------------------------------------
U.S. GOVERNMENT AGENCY
SECURITIES -- 18.9%
$ 22,380,000 FHLB, 4.25%, 4/16/07(2) $ 22,259,327
- --------------------------------------------------------------------------------
9,500,000 FHLB, 4.875%, 8/22/07(2) 9,476,858
- --------------------------------------------------------------------------------
7,788,000 FHLB, 4.625%, 2/1/08(2) 7,747,767
- --------------------------------------------------------------------------------
8,990,000 FHLB, 5.125%, 9/29/10(2) 9,040,425
- --------------------------------------------------------------------------------
5,461,000 FHLMC, 5.50%, 3/28/16(2) 5,511,269
- --------------------------------------------------------------------------------
18,070,000 FHLMC, 5.30%, 5/12/20(2) 17,476,925
- --------------------------------------------------------------------------------
25,863,000 FNMA, 4.75%, 8/3/07(2) 25,773,203
- --------------------------------------------------------------------------------
17,922,000 FNMA, 5.00%, 9/14/07(2) 17,896,873
- --------------------------------------------------------------------------------
16,293,000 FNMA, 5.80%, 2/9/26(2) 16,321,920
- --------------------------------------------------------------------------------
TOTAL U.S. GOVERNMENT
AGENCY SECURITIES
(Cost $130,919,323) 131,504,567
- --------------------------------------------------------------------------------
CORPORATE BONDS -- 17.7%
AEROSPACE & DEFENSE -- 0.7%
- --------------------------------------------------------------------------------
1,468,000 Honeywell International Inc.,
5.70%, 3/15/36(2) 1,479,471
- --------------------------------------------------------------------------------
246,000 Lockheed Martin Corp.,
6.19%, 9/1/36 (Acquired 8/30/06,
Cost $247,729)(4) 258,685
- --------------------------------------------------------------------------------
1,683,000 United Technologies Corp.,
4.375%, 5/1/10(2) 1,645,028
- --------------------------------------------------------------------------------
1,450,000 United Technologies Corp.,
6.05%, 6/1/36(2) 1,543,351
- --------------------------------------------------------------------------------
4,926,535
- --------------------------------------------------------------------------------
BEVERAGES -- 0.7%
- --------------------------------------------------------------------------------
1,540,000 Diageo Capital plc,
5.875%, 9/30/36(2) 1,512,286
- --------------------------------------------------------------------------------
1,343,000 Miller Brewing Co., 4.25%,
8/15/08 (Acquired 8/6/03,
Cost $1,338,394)(4) 1,317,174
- --------------------------------------------------------------------------------
2,090,000 SABMiller plc, 6.20%, 7/1/11
(Acquired 6/27/06,
Cost $2,088,516)(4) 2,147,072
- --------------------------------------------------------------------------------
4,976,532
- --------------------------------------------------------------------------------
BIOTECHNOLOGY -- 0.2%
- --------------------------------------------------------------------------------
1,459,000 Genentech, Inc.,
4.75%, 7/15/15(5) 1,403,624
- --------------------------------------------------------------------------------
BUILDING PRODUCTS -- 0.2%
- --------------------------------------------------------------------------------
1,540,000 Masco Corp., 6.125%, 10/3/16 1,532,051
- --------------------------------------------------------------------------------
CAPITAL MARKETS -- 1.3%
- --------------------------------------------------------------------------------
1,567,000 Lehman Brothers Holdings Inc.,
5.00%, 1/14/11(2) 1,553,221
- --------------------------------------------------------------------------------
1,056,000 Merrill Lynch & Co., Inc.,
4.25%, 2/8/10(2) 1,026,519
- --------------------------------------------------------------------------------
1,943,000 Merrill Lynch & Co., Inc.,
4.79%, 8/4/10(2) 1,914,967
- --------------------------------------------------------------------------------
1,670,000 Merrill Lynch & Co., Inc.,
6.05%, 5/16/16(2) 1,730,035
- --------------------------------------------------------------------------------
Principal Amount Value
- --------------------------------------------------------------------------------
$ 895,000 Morgan Stanley,
4.00%, 1/15/10(2) $ 864,359
- --------------------------------------------------------------------------------
806,000 Morgan Stanley,
4.25%, 5/15/10(2) 780,061
- --------------------------------------------------------------------------------
922,000 Morgan Stanley,
5.05%, 1/21/11(2)(5) 914,502
- --------------------------------------------------------------------------------
8,783,664
- --------------------------------------------------------------------------------
CHEMICALS(6)
- --------------------------------------------------------------------------------
246,000 Dow Chemical Co. (The),
7.375%, 11/1/29(2) 288,120
- --------------------------------------------------------------------------------
COMMERCIAL BANKS -- 1.9%
- --------------------------------------------------------------------------------
246,000 Abbey National plc,
7.95%, 10/26/29(2) 310,526
- --------------------------------------------------------------------------------
2,641,000 Bank of America Corp.,
4.375%, 12/1/10(2) 2,568,958
- --------------------------------------------------------------------------------
1,460,000 Capital One Financial Corp.,
5.70%, 9/15/11 1,471,854
- --------------------------------------------------------------------------------
1,432,000 PNC Bank N.A.,
4.875%, 9/21/17(2) 1,361,813
- --------------------------------------------------------------------------------
1,047,000 PNC Funding Corp.,
5.125%, 12/14/10(2)(5) 1,044,886
- --------------------------------------------------------------------------------
1,101,000 SouthTrust Corp.,
5.80%, 6/15/14(2) 1,122,591
- --------------------------------------------------------------------------------
1,191,000 Wachovia Bank N.A.,
4.80%, 11/1/14(2) 1,144,302
- --------------------------------------------------------------------------------
1,862,000 Wachovia Bank N.A.,
4.875%, 2/1/15(2) 1,796,401
- --------------------------------------------------------------------------------
1,647,000 Wells Fargo & Co.,
4.625%, 8/9/10(2) 1,622,601
- --------------------------------------------------------------------------------
12,443,932
- --------------------------------------------------------------------------------
COMMERCIAL SERVICES & SUPPLIES -- 0.2%
- --------------------------------------------------------------------------------
985,000 Waste Management, Inc.,
7.00%, 7/15/28 1,081,477
- --------------------------------------------------------------------------------
CONSUMER FINANCE -- 0.1%
- --------------------------------------------------------------------------------
806,000 American Express Centurion
Bank, 4.375%, 7/30/09(2) 791,698
- --------------------------------------------------------------------------------
DIVERSIFIED FINANCIAL SERVICES -- 1.8%
- --------------------------------------------------------------------------------
1,343,000 American General Finance
Corp., Series 2002 H,
4.50%, 11/15/07(2) 1,332,812
- --------------------------------------------------------------------------------
2,306,000 Citigroup Inc.,
5.00%, 9/15/14(2) 2,250,311
- --------------------------------------------------------------------------------
890,000 Citigroup Inc.,
6.125%, 8/25/36(2) 918,541
- --------------------------------------------------------------------------------
1,083,000 General Electric Capital Corp.,
6.125%, 2/22/11(2) 1,124,709
- --------------------------------------------------------------------------------
2,193,000 HSBC Finance Corp.,
4.75%, 4/15/10(2)(5) 2,165,557
- --------------------------------------------------------------------------------
1,137,000 HSBC Finance Corp.,
4.625%, 9/15/10(2) 1,114,777
- --------------------------------------------------------------------------------
1,388,000 J.P. Morgan Chase & Co.,
6.75%, 2/1/11(2) 1,469,226
- --------------------------------------------------------------------------------
1,647,000 John Deere Capital Corp.,
4.50%, 8/25/08(2) 1,626,185
- --------------------------------------------------------------------------------
12,002,118
- --------------------------------------------------------------------------------
See Notes to Financial Statements. (continued)
- ------
8
Diversified Bond - Schedule of Investments
SEPTEMBER 30, 2006 (UNAUDITED)
Principal Amount Value
- --------------------------------------------------------------------------------
DIVERSIFIED TELECOMMUNICATION SERVICES -- 0.9%
- --------------------------------------------------------------------------------
$ 1,647,000 AT&T Corp.,
7.30%, 11/15/11 $ 1,787,067
- --------------------------------------------------------------------------------
1,150,000 AT&T Inc.,
6.80%, 5/15/36(5) 1,212,064
- --------------------------------------------------------------------------------
246,000 BellSouth Corp.,
6.875%, 10/15/31(2)(5) 256,979
- --------------------------------------------------------------------------------
698,000 Embarq Corp.,
7.08%, 6/1/16 713,267
- --------------------------------------------------------------------------------
1,763,000 Telecom Italia Capital SA,
4.00%, 1/15/10 1,671,719
- --------------------------------------------------------------------------------
590,000 Verizon Communications Inc.,
5.55%, 2/15/16(2) 583,265
- --------------------------------------------------------------------------------
6,224,361
- --------------------------------------------------------------------------------
ELECTRIC UTILITIES -- 1.0%
- --------------------------------------------------------------------------------
1,585,000 Carolina Power & Light Co.,
5.15%, 4/1/15 1,552,167
- --------------------------------------------------------------------------------
770,000 Carolina Power & Light Co.,
5.25%, 12/15/15 758,474
- --------------------------------------------------------------------------------
1,690,000 CenterPoint Energy Resources
Corp., 6.50%, 2/1/08 1,710,198
- --------------------------------------------------------------------------------
819,000 FirstEnergy Corp., 7.375%,
11/15/31 949,795
- --------------------------------------------------------------------------------
850,000 Florida Power Corp., 4.50%,
6/1/10 829,693
- --------------------------------------------------------------------------------
1,101,000 Southern California Edison Co.,
5.625%, 2/1/36 1,072,228
- --------------------------------------------------------------------------------
6,872,555
- --------------------------------------------------------------------------------
FOOD & STAPLES RETAILING -- 0.4%
- --------------------------------------------------------------------------------
1,432,000 Wal-Mart Stores, Inc.,
4.125%, 7/1/10(2) 1,387,721
- --------------------------------------------------------------------------------
246,000 Wal-Mart Stores, Inc.,
7.55%, 2/15/30(2)(5) 303,087
- --------------------------------------------------------------------------------
1,495,000 Wal-Mart Stores, Inc.,
5.25%, 9/1/35 1,403,151
- --------------------------------------------------------------------------------
3,093,959
- --------------------------------------------------------------------------------
FOOD PRODUCTS -- 0.4%
- --------------------------------------------------------------------------------
2,211,000 Cadbury Schweppes U.S.
Finance LLC, 3.875%, 10/1/08
(Acquired 6/14/05 -- 11/28/05,
Cost $2,162,585)(4) 2,151,599
- --------------------------------------------------------------------------------
246,000 Kellogg Co.,
7.45%, 4/1/31 297,807
- --------------------------------------------------------------------------------
246,000 Kraft Foods Inc.,
6.50%, 11/1/31(2) 266,369
- --------------------------------------------------------------------------------
2,715,775
- --------------------------------------------------------------------------------
HEALTH CARE EQUIPMENT & SUPPLIES -- 0.3%
- --------------------------------------------------------------------------------
1,531,000 Baxter Finco BV, 4.75%,
10/15/10(2) 1,505,392
- --------------------------------------------------------------------------------
880,000 Boston Scientific Corp.,
6.40%, 6/15/16 889,059
- --------------------------------------------------------------------------------
2,394,451
- --------------------------------------------------------------------------------
Principal Amount Value
- --------------------------------------------------------------------------------
HEALTH CARE PROVIDERS & SERVICES -- 0.3%
- --------------------------------------------------------------------------------
$ 1,826,000 Laboratory Corp. of
America Holdings,
5.625%, 12/15/15 $ 1,815,486
- --------------------------------------------------------------------------------
HOTELS, RESTAURANTS & LEISURE -- 0.2%
- --------------------------------------------------------------------------------
1,390,000 Royal Caribbean Cruises Ltd.,
7.00%, 6/15/13 1,412,183
- --------------------------------------------------------------------------------
HOUSEHOLD DURABLES -- 0.2%
- --------------------------------------------------------------------------------
1,038,000 D.R. Horton, Inc.,
7.875%, 8/15/11(5) 1,109,706
- --------------------------------------------------------------------------------
INDUSTRIAL CONGLOMERATES -- 0.5%
- --------------------------------------------------------------------------------
3,858,000 General Electric Co.,
5.00%, 2/1/13(2) 3,819,520
- --------------------------------------------------------------------------------
INSURANCE -- 0.8%
- --------------------------------------------------------------------------------
1,790,000 Allstate Financial Global
Funding, 4.25%, 9/10/08
(Acquired 9/3/03,
Cost $1,786,492)(2)(4) 1,759,753
- --------------------------------------------------------------------------------
246,000 AXA SA, 8.60%, 12/15/30(2) 314,979
- --------------------------------------------------------------------------------
850,000 Genworth Financial Inc.,
4.95%, 10/1/15(2) 817,441
- --------------------------------------------------------------------------------
1,969,000 Monumental Global Funding II,
3.85%, 3/3/08
(Acquired 2/5/03,
Cost $1,968,961)(2)(4) 1,928,733
- --------------------------------------------------------------------------------
850,000 Prudential Financial, Inc.,
5.40%, 6/13/35(2)(5) 794,248
- --------------------------------------------------------------------------------
5,615,154
- --------------------------------------------------------------------------------
MEDIA -- 1.1%
- --------------------------------------------------------------------------------
2,337,000 Comcast Corp.,
5.90%, 3/15/16 2,342,270
- --------------------------------------------------------------------------------
2,202,000 Cox Communications, Inc.,
7.125%, 10/1/12 2,349,589
- --------------------------------------------------------------------------------
1,420,000 Knight-Ridder, Inc.,
7.125%, 6/1/11(2) 1,482,469
- --------------------------------------------------------------------------------
895,000 News America Holdings,
7.75%, 1/20/24 992,251
- --------------------------------------------------------------------------------
246,000 Time Warner Inc.,
7.625%, 4/15/31 272,541
- --------------------------------------------------------------------------------
7,439,120
- --------------------------------------------------------------------------------
METALS & MINING -- 0.1%
- --------------------------------------------------------------------------------
878,000 Alcan Inc., 4.50%, 5/15/13 828,713
- --------------------------------------------------------------------------------
MULTI-UTILITIES -- 0.9%
- --------------------------------------------------------------------------------
1,450,000 Consolidated Edison Co. of
New York, 5.50%, 9/15/16(2) 1,456,787
- --------------------------------------------------------------------------------
2,059,000 Dominion Resources Inc.,
4.125%, 2/15/08 2,026,823
- --------------------------------------------------------------------------------
824,000 Dominion Resources Inc.,
4.75%, 12/15/10 804,242
- --------------------------------------------------------------------------------
1,486,000 Nisource Finance Corp.,
5.25%, 9/15/17 1,389,334
- --------------------------------------------------------------------------------
859,000 Pacific Gas & Electric Co.,
6.05%, 3/1/34 866,882
- --------------------------------------------------------------------------------
6,544,068
- --------------------------------------------------------------------------------
See Notes to Financial Statements. (continued)
- ------
9
Diversified Bond - Schedule of Investments
SEPTEMBER 30, 2006 (UNAUDITED)
Principal Amount Value
- --------------------------------------------------------------------------------
MULTILINE RETAIL -- 0.3%
- --------------------------------------------------------------------------------
$ 537,000 May Department Stores
Co. (The), 3.95%, 7/15/07 $ 529,907
- --------------------------------------------------------------------------------
1,432,000 May Department Stores
Co. (The), 4.80%, 7/15/09 1,405,917
- --------------------------------------------------------------------------------
246,000 Target Corp.,
7.00%, 7/15/31(2) 288,398
- --------------------------------------------------------------------------------
2,224,222
- --------------------------------------------------------------------------------
OIL, GAS & CONSUMABLE FUELS -- 1.5%
- --------------------------------------------------------------------------------
1,040,000 Anadarko Petroleum Corp.,
5.95%, 9/15/16 1,054,388
- --------------------------------------------------------------------------------
610,000 Anadarko Petroleum Corp.,
6.45%, 9/15/36 625,157
- --------------------------------------------------------------------------------
246,000 ConocoPhillips Holding Co.,
6.95%, 4/15/29 284,562
- --------------------------------------------------------------------------------
826,000 Devon Financing Corp., ULC,
7.875%, 9/30/31 1,009,730
- --------------------------------------------------------------------------------
2,507,000 Enterprise Products
Operating L.P.,
4.95%, 6/1/10 2,454,260
- --------------------------------------------------------------------------------
833,000 Enterprise Products
Operating L.P.,
6.65%, 10/15/34 836,670
- --------------------------------------------------------------------------------
1,956,000 Premcor Refining
Group Inc. (The),
6.125%, 5/1/11 1,999,877
- --------------------------------------------------------------------------------
1,092,000 XTO Energy Inc.,
5.30%, 6/30/15 1,061,064
- --------------------------------------------------------------------------------
868,000 XTO Energy Inc.,
6.10%, 4/1/36 861,535
- --------------------------------------------------------------------------------
10,187,243
- --------------------------------------------------------------------------------
PHARMACEUTICALS -- 0.3%
- --------------------------------------------------------------------------------
1,441,000 Abbott Laboratories,
5.875%, 5/15/16(2) 1,495,539
- --------------------------------------------------------------------------------
716,000 Schering-Plough Corp.,
5.55%, 12/1/13(2) 719,382
- --------------------------------------------------------------------------------
2,214,921
- --------------------------------------------------------------------------------
REAL ESTATE MANAGEMENT & DEVELOPMENT-- 0.1%
- --------------------------------------------------------------------------------
806,000 ERP Operating L.P.,
5.125%, 3/15/16(5) 780,035
- --------------------------------------------------------------------------------
ROAD & RAIL -- 0.4%
- --------------------------------------------------------------------------------
1,530,000 Burlington Northern Santa Fe
Corp., 6.20%, 8/15/36 1,599,498
- --------------------------------------------------------------------------------
991,000 Norfolk Southern Corp.,
5.64%, 5/17/29 967,273
- --------------------------------------------------------------------------------
2,566,771
- --------------------------------------------------------------------------------
SOFTWARE -- 0.2%
- --------------------------------------------------------------------------------
1,741,000 Oracle Corp., 5.00%, 1/15/11(2) 1,726,008
- --------------------------------------------------------------------------------
SPECIALTY RETAIL -- 0.2%
- --------------------------------------------------------------------------------
1,737,000 Home Depot, Inc. (The),
5.40%, 3/1/16(2) 1,728,687
- --------------------------------------------------------------------------------
THRIFTS & MORTGAGE FINANCE -- 0.2%
- --------------------------------------------------------------------------------
1,325,000 Residential Capital Corp.,
6.50%, 4/17/13 1,347,370
- --------------------------------------------------------------------------------
Principal Amount Value
- --------------------------------------------------------------------------------
WIRELESS TELECOMMUNICATION SERVICES -- 0.3%
- --------------------------------------------------------------------------------
$ 2,417,000 Nextel Communications Inc.,
5.95%, 3/15/14 $ 2,367,500
- --------------------------------------------------------------------------------
TOTAL CORPORATE BONDS
(Cost $123,622,782) 123,257,559
- --------------------------------------------------------------------------------
COLLATERALIZED MORTGAGE
OBLIGATIONS(1) -- 15.7%
20,982,285 Bank of America Commercial
Mortgage Inc. STRIPS -- COUPON,
Series 2004-1, Class XP, VRN,
0.65%, 10/1/06(2) 465,492
- --------------------------------------------------------------------------------
2,921,331 Bank of America Large Loan,
Series 2005 MIB1, Class A1,
VRN, 5.48%, 10/15/06, resets
monthly off the 1-month LIBOR
plus 0.15% with no caps,
(Acquired 11/18/05,
Cost $2,921,330)(2)(4) 2,923,169
- --------------------------------------------------------------------------------
4,650,000 Bear Stearns Commercial
Mortgage Securities, Series 2006
BBA7, Class A1, VRN, 5.44%,
10/16/06, resets monthly off
the 1-month LIBOR plus 0.11%
with no caps (Acquired 6/5/06,
Cost $4,650,000)(2)(4) 4,652,930
- --------------------------------------------------------------------------------
29,182,989 Bear Stearns Commercial
Mortgage Securities STRIPS --
COUPON, Series 2004 T16,
Class X2, VRN, 0.77%, 10/1/06(2) 970,451
- --------------------------------------------------------------------------------
17,398,700 Commercial Mortgage
Acceptance Corp. STRIPS --
COUPON, Series 1998 C2,
Class X, VRN, 1.00%, 10/1/06(2) 481,927
- --------------------------------------------------------------------------------
1,352,674 Commercial Mortgage
Pass-Through Certificates,
Series 2005 F10A, Class A1, VRN,
5.43%, 10/15/06, resets
monthly off the 1-month LIBOR plus
0.10% with no caps (Acquired 3/18/05,
Cost $1,352,674)(2)(4) 1,353,676
- --------------------------------------------------------------------------------
1,597,443 Commercial Mortgage
Pass-Through Certificates,
Series 2005 FL11, Class A1, VRN,
5.48%, 10/16/06, resets
monthly off the 1-month LIBOR plus
0.15% with no caps (Acquired 11/18/05,
Cost $1,597,444)(2)(4) 1,598,675
- --------------------------------------------------------------------------------
6,750,000 FHLMC, Series 2567, Class OD,
5.00%, 8/15/15 6,717,425
- --------------------------------------------------------------------------------
6,296,947 FHLMC, Series 2900, Class PA,
4.50%, 3/15/14 6,236,855
- --------------------------------------------------------------------------------
3,228,245 FHLMC, Series 2937, Class KA,
4.50%, 12/15/14 3,197,818
- --------------------------------------------------------------------------------
39,107 FNMA, Series 1989-35,
Class G SEQ, 9.50%, 7/25/19(2) 41,979
- --------------------------------------------------------------------------------
See Notes to Financial Statements. (continued)
- ------
10
Diversified Bond - Schedule of Investments
SEPTEMBER 30, 2006 (UNAUDITED)
Principal Amount Value
- --------------------------------------------------------------------------------
$ 1,085,000 FNMA, Series 2003-92,
Class PD, 4.50%, 3/25/17 $ 1,055,248
- --------------------------------------------------------------------------------
292,325 GMAC Commercial
Mortgage Securities, Inc.,
Series 2002 C2, Class A1
SEQ, 4.32%, 10/15/38(2) 290,969
- --------------------------------------------------------------------------------
6,804,000 GMAC Commercial
Mortgage Securities, Inc.,
Series 2005 C1, Class A2
SEQ, 4.47%, 5/10/43(2) 6,669,254
- --------------------------------------------------------------------------------
8,791,000 Greenwich Capital Commercial
Funding Corp., Series 2005
GG3, Class A2 SEQ, VRN,
4.31%, 10/1/06(2) 8,593,888
- --------------------------------------------------------------------------------
12,565,000 Greenwich Capital Commercial
Funding Corp., Series 2005
GG5, Class A5, 5.22%,
4/10/37(2)(5) 12,460,622
- --------------------------------------------------------------------------------
5,729,000 LB-UBS Commercial
Mortgage Trust, Series 2005
C3, Class A3 SEQ, 4.65%,
7/30/30(2) 5,596,700
- --------------------------------------------------------------------------------
8,157,400 LB-UBS Commercial
Mortgage Trust, Series 2005
C3, Class A5 SEQ, 4.74%,
7/15/30(2) 7,831,577
- --------------------------------------------------------------------------------
5,814,000 LB-UBS Commercial Mortgage
Trust, Series 2006 C1,
Class A4 SEQ, 5.16%,
2/15/31(2) 5,739,558
- --------------------------------------------------------------------------------
2,069,981 Lehman Brothers Floating
Rate Commercial Mortgage
Trust, Series 2005 LLFA,
Class A1, VRN, 5.43%, 10/15/06,
resets monthly off the 1-month LIBOR
plus 0.10% with no caps
(Acquired 7/25/05,
Cost $2,069,982)(2)(4) 2,071,279
- --------------------------------------------------------------------------------
5,475,222 Lehman Brothers Floating Rate
Commercial Mortgage Trust,
Series 2006 LLFA, Class A1, VRN,
5.41%, 10/16/06, resets monthly off
the 1-month LIBOR plus 0.08% with no caps
(Acquired 8/7/06 -- 9/25/06,
Cost $5,474,923)(2)(4) 5,478,682
- --------------------------------------------------------------------------------
225,217 MASTR Alternative Loans
Trust, Series 2003-8, Class
4A1, 7.00%, 12/25/33(2) 227,810
- --------------------------------------------------------------------------------
3,049,398 Morgan Stanley Capital I,
Series 2006 XLF, Class A1,
VRN, 5.42%, 10/16/06, resets
monthly off the 1-month LIBOR
plus 0.09% with no caps
(Acquired 7/28/06,
Cost $3,049,398)(2)(4) 3,051,325
- --------------------------------------------------------------------------------
3,378,381 Thornburg Mortgage Securities
Trust, Series 2006-5, Class A1,
VRN, 5.45%, 10/25/06, resets
monthly off the 1-month LIBOR
plus 0.12% with no caps 3,378,381
- --------------------------------------------------------------------------------
Principal Amount Value
- --------------------------------------------------------------------------------
$ 11,119,000 Wachovia Bank
Commercial Mortgage Trust,
Series 2006 C23, Class A4,
5.42%, 1/15/45(2) $ 11,166,500
- --------------------------------------------------------------------------------
2,275,000 Washington Mutual, Inc.,
Series 2005 AR4, Class A3,
4.59%, 4/25/35(2) 2,231,807
- --------------------------------------------------------------------------------
4,497,000 Washington Mutual, Inc.,
Series 2005 AR4, Class A4B,
VRN, 4.67%, 10/25/06(2) 4,422,084
- --------------------------------------------------------------------------------
663,187 Washington Mutual, Inc.,
Series 2005 AR11, Class A1C1,
VRN, 5.53%, 10/25/06, resets
monthly off the 1-month LIBOR plus 0.20%
with a cap of 10.50% 663,803
- --------------------------------------------------------------------------------
TOTAL COLLATERALIZED MORTGAGE OBLIGATIONS
(Cost $109,994,900) 109,569,884
- --------------------------------------------------------------------------------
U.S. TREASURY SECURITIES -- 14.2%
2,180,000 U.S. Treasury Bonds,
8.125%, 8/15/21(2)(5) 2,937,892
- --------------------------------------------------------------------------------
11,817,000 U.S. Treasury Bonds,
7.125%, 2/15/23(2)(5) 14,846,962
- --------------------------------------------------------------------------------
1,356,000 U.S. Treasury Bonds,
6.125%, 11/15/27(2)(5) 1,586,414
- --------------------------------------------------------------------------------
2,874,000 U.S. Treasury Bonds,
6.25%, 5/15/30(2)(5) 3,454,864
- --------------------------------------------------------------------------------
14,012,092 U.S. Treasury Inflation
Indexed Notes, 2.00%,
1/15/16(2)(5) 13,694,634
- --------------------------------------------------------------------------------
24,043,000 U.S. Treasury Notes,
4.875%, 4/30/11(2)(5) 24,318,196
- --------------------------------------------------------------------------------
33,600,000 U.S. Treasury Notes,
5.125%, 6/30/11(2)(5) 34,352,069
- --------------------------------------------------------------------------------
3,553,000 U.S. Treasury Notes,
4.875%, 8/15/16(2)(5) 3,621,285
- --------------------------------------------------------------------------------
TOTAL U.S. TREASURY SECURITIES
(Cost $97,461,803) 98,812,316
- --------------------------------------------------------------------------------
ASSET-BACKED SECURITIES(1) -- 12.1%
10,106 ABSC Net Interest Margin,
Series 2004 HE5, Class A1, 5.00%,
8/27/34 (Acquired 6/22/04,
Cost $10,080)(4) 10,088
- --------------------------------------------------------------------------------
2,686,709 Accredited Mortgage Loan
Trust, Series 2006-1,
Class A1, VRN, 5.39%, 10/25/06,
resets monthly off the 1-month LIBOR
plus 0.06% with no caps(2) 2,688,730
- --------------------------------------------------------------------------------
3,822,926 Accredited Mortgage Loan
Trust, Series 2006-2,
Class A1, VRN, 5.37%, 10/25/06,
resets monthly off the 1-month LIBOR
plus 0.04% with no caps 3,825,327
- --------------------------------------------------------------------------------
See Notes to Financial Statements. (continued)
- ------
11
Diversified Bond - Schedule of Investments
SEPTEMBER 30, 2006 (UNAUDITED)
Principal Amount Value
- --------------------------------------------------------------------------------
$ 1,306,314 Ameriquest Mortgage
Securities Inc., Series 2006 R1,
Class A2A, VRN, 5.41%, 10/25/06,
resets monthly off the 1-month
LIBOR plus 0.08% with no caps $ 1,307,372
- --------------------------------------------------------------------------------
2,630 AQ Finance Net Interest
Margin, Series 2004 RN5,
Class A, 5.19%, 6/29/34
(Acquired 6/24/04,
Cost $2,630)(4) 2,623
- --------------------------------------------------------------------------------
2,900,000 Argent Securities Inc.,
Series 2006 M3, Class A2A,
VRN, 5.38%, 10/25/06, resets
monthly off the 1-month LIBOR
plus 0.05% with no caps(2) 2,900,000
- --------------------------------------------------------------------------------
4,566,000 Capital One Prime Auto
Receivables Trust, Series 2004-2,
Class A4, VRN, 5.39%,
10/15/06, resets monthly off
the 1-month LIBOR plus
0.06% with no caps(2) 4,571,187
- --------------------------------------------------------------------------------
4,444,042 Centex Home Equity,
Series 2006 A, Class AV1,
VRN, 5.38%, 10/25/06,
resets monthly off the
1-month LIBOR plus 0.05%
with no caps(2) 4,446,833
- --------------------------------------------------------------------------------
5,030,467 CNH Equipment Trust,
Series 2004 A, Class A3A,
VRN, 5.40%, 10/16/06,
resets monthly off the
1-month LIBOR plus 0.07%
with no caps(2) 5,034,853
- --------------------------------------------------------------------------------
106,186 Countrywide Asset-Backed
Certificates, Series 2005-7,
Class 3AV1, VRN, 5.45%,
10/25/06, resets monthly off
the 1-month LIBOR plus
0.12% with no caps(2) 106,255
- --------------------------------------------------------------------------------
1,031,071 Countrywide Asset-Backed
Certificates, Series 2005-8,
Class 2A1, VRN, 5.46%,
10/25/06, resets monthly off
the 1-month LIBOR plus
0.13% with no caps 1,031,831
- --------------------------------------------------------------------------------
3,520,846 Countrywide Asset-Backed
Certificates, Series 2006-6,
Class 2A1, VRN, 5.40%,
10/25/06, resets monthly off
the 1-month LIBOR plus
0.07% with no caps 3,523,275
- --------------------------------------------------------------------------------
2,264,827 Countrywide Asset-Backed
Certificates, Series 2006 BC2,
Class 2A1, VRN, 5.37%,
10/25/06, resets monthly off
the 1-month LIBOR plus
0.04% with no caps 2,266,249
- --------------------------------------------------------------------------------
Principal Amount Value
- --------------------------------------------------------------------------------
$ 3,795,069 Credit-Based Asset Servicing
and Securitization, Series 2006
CB3, Class AV1, VRN, 5.39%,
10/25/06, resets monthly off the
1-month LIBOR plus
0.06% with no caps(2) $ 3,797,695
- --------------------------------------------------------------------------------
1,164,000 Detroit Edison Securitization
Funding LLC, Series 2001-1,
Class A4 SEQ, 6.19%, 3/1/13(2) 1,207,911
- --------------------------------------------------------------------------------
5,036,037 First Franklin Mortgage Loan
Asset Backed Certificates,
Series 2006 FF11, Class 2A1,
VRN, 5.37%, 10/25/06, resets
monthly off the 1-month LIBOR
plus 0.04% with no caps(2) 5,038,731
- --------------------------------------------------------------------------------
6,517,645 First Franklin Mortgage Loan
Asset Backed Certificates,
Series 2006 FF12, Class A2, VRN,
5.37%, 10/25/06, resets
monthly off the 1-month LIBOR
plus 0.04% with no caps(2) 6,521,237
- --------------------------------------------------------------------------------
1,816,543 IndyMac Residential Asset
Backed Trust, Series 2006 B,
Class 2A1, VRN, 5.39%,
10/25/06, resets monthly off
the 1-month LIBOR plus 0.06%
with no caps 1,818,035
- --------------------------------------------------------------------------------
1,074,149 Long Beach Mortgage Loan
Trust, Series 2006-2, Class 2A1,
VRN, 5.40%, 10/25/06,
resets monthly off the 1-month LIBOR
plus 0.07% with no caps(2) 1,074,984
- --------------------------------------------------------------------------------
5,317,445 Long Beach Mortgage Loan
Trust, Series 2006-6, Class 2A1,
VRN, 5.37%, 10/25/06,
resets monthly off the 1-month LIBOR
plus 0.04% with no caps 5,320,784
- --------------------------------------------------------------------------------
398,135 Nomura Home Equity Loan, Inc.,
Series 2006 HE1, Class A1,
VRN, 5.41%, 10/25/06, resets
monthly off the 1-month LIBOR
plus 0.08% with no caps(2) 398,485
- --------------------------------------------------------------------------------
163,667 Nomura Home Equity Loan, Inc.,
Series 2006 HE2, Class A1,
VRN, 5.39%, 10/25/06, resets
monthly off the 1-month LIBOR
plus 0.06% with no caps(2) 163,781
- --------------------------------------------------------------------------------
7,522,815 NovaStar Home Equity Loan,
Series 2005-4, Class A2A,
VRN, 5.42%, 10/25/06, resets
monthly off the 1-month LIBOR plus 0.09%
with a cap of 11.00% 7,528,615
- --------------------------------------------------------------------------------
528,000 Residential Asset Securities
Corp., Series 2004 KS2,
Class MI1, 4.71%, 3/25/34(2) 514,846
- --------------------------------------------------------------------------------
3,175,000 SLC Student Loan Trust,
Series 2006-2, Class A1, VRN,
5.37%, 12/15/06, resets
quarterly off the 3-month LIBOR
minus 0.02% with no caps 3,175,000
- --------------------------------------------------------------------------------
See Notes to Financial Statements. (continued)
- ------
12
Diversified Bond - Schedule of Investments
SEPTEMBER 30, 2006 (UNAUDITED)
Principal Amount Value
- --------------------------------------------------------------------------------
$ 1,988,810 SLM Student Loan Trust,
Series 2006-2, Class A1,
VRN, 5.36%, 10/25/06, resets
quarterly off the 3-month LIBOR
minus 0.03% with no caps $ 1,989,973
- --------------------------------------------------------------------------------
1,214,727 SLM Student Loan Trust,
Series 2006-4, Class A1, VRN, 5.36%,
10/25/06, resets quarterly off
the 3-month LIBOR minus 0.03%
with no caps 1,215,462
- --------------------------------------------------------------------------------
2,680,000 SLM Student Loan Trust,
Series 2006-5, Class A2, VRN,
5.38%, 10/25/06, resets
quarterly off the 3-month LIBOR
minus 0.01% with no caps(2) 2,678,076
- --------------------------------------------------------------------------------
3,625,000 SLM Student Loan Trust,
Series 2006-7, Class A1,
VRN, 5.35%, 10/25/06, resets
quarterly off the 3-month LIBOR
minus 0.04% with no caps(2) 3,626,982
- --------------------------------------------------------------------------------
5,751,001 Soundview Home Equity
Loan Trust, Series 2006-3,
Class A1, VRN, 5.37%, 10/25/06,
resets monthly off the 1-month LIBOR
plus 0.04% with no caps(2) 5,755,119
- --------------------------------------------------------------------------------
730,319 Structured Asset Securities
Corp., Series 2005 WF2,
Class A1, VRN, 5.41%, 10/25/06,
resets monthly off the 1-month LIBOR
plus 0.08% with no caps(2) 730,723
- --------------------------------------------------------------------------------
TOTAL ASSET-BACKED SECURITIES
(Cost $84,193,208) 84,271,062
- --------------------------------------------------------------------------------
MUNICIPAL SECURITIES -- 1.8%
9,200,000 Commonwealth of
Massachusetts Rev., 5.50%,
1/1/34 (FGIC)(2) 11,053,616
- --------------------------------------------------------------------------------
1,477,000 Illinois GO, (Taxable Pension),
5.10%, 6/1/33(2) 1,418,068
- --------------------------------------------------------------------------------
TOTAL MUNICIPAL SECURITIES
(Cost $11,928,825) 12,471,684
- --------------------------------------------------------------------------------
SOVEREIGN GOVERNMENTS
& AGENCIES -- 0.5%
246,000 Hydro Quebec,
8.40%, 1/15/22(2) 323,588
- --------------------------------------------------------------------------------
1,835,000 Province of Quebec,
5.00%, 7/17/09(2)(5) 1,835,947
- --------------------------------------------------------------------------------
1,692,000 Republic of Italy,
4.00%, 6/16/08(2)(5) 1,666,026
- --------------------------------------------------------------------------------
TOTAL SOVEREIGN GOVERNMENTS & AGENCIES
(Cost $3,855,601) 3,825,561
- --------------------------------------------------------------------------------
TEMPORARY CASH INVESTMENTS -- 6.3%
Repurchase Agreement, Deutsche Bank
Securities, Inc., (collateralized by
various U.S. Treasury obligations, 0.875%, 4/15/10,
valued at $35,341,618), in a joint trading
account at 4.95%, dated 9/29/06, due 10/2/06
(Delivery value $34,656,290)(2) $ 34,642,000
- --------------------------------------------------------------------------------
Repurchase Agreement, Goldman Sachs & Co.,
(collateralized by various U.S. Treasury
obligations, 5.25% -- 6.00%,
2/15/26 -- 2/15/29, valued at $9,575,953),
in a joint trading account at 4.90%,
dated 9/29/06, due 10/2/06
(Delivery value $9,395,835)(2) 9,392,000
- --------------------------------------------------------------------------------
TOTAL TEMPORARY CASH INVESTMENTS
(Cost $44,034,000) 44,034,000
- --------------------------------------------------------------------------------
COLLATERAL RECEIVED
FOR SECURITIES LENDING(7) -- 12.3%
REPURCHASE AGREEMENTS
- --------------------------------------------------------------------------------
Repurchase Agreement, BNP Paribas,
(collateralized by various U.S. Government
Agency obligations in a pooled account
at the lending agent), 5.37%,
dated 9/29/06, due 10/2/06
(Delivery value $55,024,612) 55,000,000
- --------------------------------------------------------------------------------
Repurchase Agreement, UBS AG,
(collateralized by various U.S. Government
Agency obligations in a pooled account
at the lending agent), 5.375%, dated
9/29/06, due 10/2/06
(Delivery value $30,747,541) 30,733,775
- --------------------------------------------------------------------------------
TOTAL COLLATERAL RECEIVED FOR SECURITIES LENDING
(Cost $85,733,775) 85,733,775
- --------------------------------------------------------------------------------
TOTAL INVESTMENT SECURITIES -- 133.8%
(Cost $930,056,484) 931,311,089
- --------------------------------------------------------------------------------
OTHER ASSETS
AND LIABILITIES -- (33.8)% (235,040,795)
- --------------------------------------------------------------------------------
TOTAL NET ASSETS -- 100.0% $696,270,294
================================================================================
See Notes to Financial Statements. (continued)
- ------
13
Diversified Bond - Schedule of Investments
SEPTEMBER 30, 2006 (UNAUDITED)
FUTURES CONTRACTS
Underlying Face
Contracts Purchased Expiration Date Amount at Value Unrealized Gain (Loss)
- ---------------------------------------------------------------------------------------------------------
665 U.S. Treasury 2-Year Notes December 2006 $135,992,500 $174,317
- ---------------------------------------------------------------------------------------------------------
1,232 U.S. Treasury 5-Year Notes December 2006 129,995,250 685,143
- ---------------------------------------------------------------------------------------------------------
$265,987,750 $859,460
==============================================
Underlying Face
Contracts Sold Expiration Date Amount at Value Unrealized Gain (Loss)
- ---------------------------------------------------------------------------------------------------------
70 U.S. Long Bond December 2006 $7,868,438 $(148,908)
- ---------------------------------------------------------------------------------------------------------
977 U.S. Treasury 10-Year Notes December 2006 105,577,063 (956,838)
- ---------------------------------------------------------------------------------------------------------
$113,445,501 $(1,105,746)
==============================================
SWAP AGREEMENTS
Notional Description of Expiration Unrealized
Amount Agreement Date Gain (Loss)
- -------------------------------------------------------------------------------------
CREDIT DEFAULT
- -------------------------------------------------------------------------------------
$10,500,000 Pay quarterly a fixed rate equal to December 2010 $(55,652)
0.85% multiplied by the notional
amount and receive from Barclays
Capital, Inc. upon each default
event of one of the issues of
Dow Jones CDX N.A. Investment
Grade High Volume 5, par value
of the proportional notional amount.
- -------------------------------------------------------------------------------------
20,000,000 Pay quarterly a fixed rate equal June 2011 (31,967)
to 0.40% multiplied by the
notional amount and receive
from Barclays Capital, Inc. upon
each default event of one of the
issues of Dow Jones CDX N.A.
Investment Grade 6, par value
of the proportional notional amount.
- -------------------------------------------------------------------------------------
10,000,000 Pay quarterly a fixed rate equal June 2011 (6,477)
to 0.75% multiplied by the
notional amount and receive
from Deutsche Bank AG upon each
default event of one of the issues
of Dow Jones CDX N.A. Investment
Grade 6, par value of the
proportional notional amount.
- -------------------------------------------------------------------------------------
INTEREST RATE
- -------------------------------------------------------------------------------------
5,736,000 Receive semiannually a fixed rate November 2030 385,240
equal to 5.6965% and pay quarterly
a variable rate based on the
3-month LIBOR with Barclays
Capital, Inc.
- -------------------------------------------------------------------------------------
$291,144
================
See Notes to Financial Statements. (continued)
- ------
14
Diversified Bond - Schedule of Investments
SEPTEMBER 30, 2006 (UNAUDITED)
NOTES TO SCHEDULE OF INVESTMENTS
ABSC = Asset-Backed Securities Corp.
CDX = Credit Derivative Indexes
FGIC = Financial Guaranty Insurance Co.
FHLB = Federal Home Loan Bank
FHLMC = Federal Home Loan Mortgage Corporation
FNMA = Federal National Mortgage Association
GMAC = General Motors Acceptance Corporation
GNMA = Government National Mortgage Association
GO = General Obligation
LB-UBS = Lehman Brothers Inc. -- UBS AG
LIBOR = London Interbank Offered Rate
MASTR = Mortgage Asset Securitization Transactions, Inc.
resets = The frequency with which a security's coupon changes, based on current
market conditions or an underlying index. The more frequently a
security resets, the less risk the investor is taking that the coupon
will vary significantly from current market rates.
SEQ = Sequential Payer
STRIPS = Separate Trading of Registered Interest and Principal of Securities
VRN = Variable Rate Note. Interest reset date is indicated. Rate shown is
effective September 30, 2006.
(1) Final maturity indicated, unless otherwise noted.
(2) Security, or a portion thereof, has been segregated for forward
commitments, futures contracts and/or swap agreements.
(3) Forward commitment.
(4) Security was purchased under Rule 144A of the Securities Act of 1933
or is a private placement and, unless registered under the Act or exempted
from registration, may only be sold to qualified institutional investors.
The aggregate value of restricted securities at September 30, 2006 was
$30,705,463, which represented 4.4% of total net assets.
(5) Security, or a portion thereof, was on loan as of September 30, 2006
(6) Industry is less than 0.05% of total net assets.
(7) Investments represent purchases made by the lending agent with cash
collateral received through securities lending transactions. (See Note 5 in
Notes to Financial Statements.)
See Notes to Financial Statements.
- ------
15
High-Yield - Performance
TOTAL RETURNS AS OF SEPTEMBER 30, 2006
--------------------------
AVERAGE ANNUAL RETURNS
- ----------------------------------------------------------------------------------------------------------
SINCE INCEPTION
6 MONTHS(1) 1 YEAR 5 YEARS INCEPTION DATE
- ----------------------------------------------------------------------------------------------------------
INVESTOR CLASS 2.67%(2) 5.90%(2) 8.61%(2) 3.40%(2) 9/30/97
- ----------------------------------------------------------------------------------------------------------
MERRILL LYNCH US HIGH YIELD
MASTER II CONSTRAINED INDEX(3) 3.71% 7.22% 10.34% 5.71% --
- ----------------------------------------------------------------------------------------------------------
CSFB HIGH YIELD INDEX II 3.94% 7.77% 11.32% 6.19% --
- ----------------------------------------------------------------------------------------------------------
LIPPER HIGH CURRENT YIELD
FUNDS AVERAGE RETURN(4) 3.10% 6.69% 9.11% 4.00% --
- ----------------------------------------------------------------------------------------------------------
Investor Class's Lipper Ranking(4) -- 334 of 458 191 of 321 118 of 162 --
- ----------------------------------------------------------------------------------------------------------
Institutional Class 2.77%(2) 6.11%(2) -- 6.43%(2) 8/2/04
- ----------------------------------------------------------------------------------------------------------
Advisor Class 2.54%(2) 5.64%(2) -- 7.70%(2) 3/8/02
- ----------------------------------------------------------------------------------------------------------
A Class No sales charge* 2.54%(2) 5.64%(2) -- 8.83%(2) 1/31/03
With sales charge* -2.07%(2) 0.91%(2) -- 7.48%(2)
- ----------------------------------------------------------------------------------------------------------
B Class No sales charge* 2.16%(2) 4.85%(2) -- 8.02%(2) 1/31/03
With sales charge* -2.84%(2) 0.85%(2) -- 7.35%(2)
- ----------------------------------------------------------------------------------------------------------
C Class No sales charge* 2.15%(2) 4.85%(2) -- 6.72%(2) 12/10/01
With sales charge* 1.16%(2) 4.85%(2) -- 6.72%(2)
- ----------------------------------------------------------------------------------------------------------
R Class 2.41%(2) 5.37%(2) -- 3.99%(2) 7/29/05
- ----------------------------------------------------------------------------------------------------------
*Sales charges include initial sales charges and contingent deferred sales
charges (CDSCs), as applicable. A Class shares have a 4.50% maximum initial
sales charge for fixed income funds and may be subject to a maximum CDSC of
1.00%. B Class shares redeemed within six years of purchase are subject to a
CDSC that declines from 5.00% during the first year after purchase to 0.00% the
sixth year after purchase. C Class shares redeemed within 12 months of purchase
are subject to a maximum CDSC of 1.00%. Please see the Share Class Information
pages for more about the applicable sales charges for each share class. The SEC
requires that mutual funds provide performance information net of maximum sales
charges in all cases where charges could be applied.
(1) Total returns for periods less than one year are not annualized.
(2) Class returns would have been lower if American Century had not voluntarily
waived a portion of its management fees and reimbursed a portion of its
distribution and service fees, as applicable.
(3) In September of 2006, the fund's benchmark changed from the CSFB High Yield
Index II to the Merrill Lynch US High Yield Master II Constrained Index. The
fund's investment advisor believes this index better represents the fund's
portfolio composition.
(4) Data provided by Lipper Inc. -- A Reuters Company. (c) 2006 Reuters. All
rights reserved. Any copying, republication or redistribution of Lipper
content, including by caching, framing or similar means, is expressly
prohibited without the prior written consent of Lipper. Lipper shall not be
liable for any errors or delays in the content, or for any actions taken in
reliance thereon.
Lipper Fund Performance -- Performance data is total return, and is
preliminary and subject to revision.
Lipper Rankings -- Rankings are based only on the universe shown and are
based on average annual total returns. This listing might not represent the
complete universe of funds tracked by Lipper.
The data contained herein has been obtained from company reports, financial
reporting services, periodicals and other resources believed to be reliable.
Although carefully verified, data on compilations is not guaranteed by
Lipper and may be incomplete. No offer or solicitations to buy or sell any
of the securities herein is being made by Lipper.
Data presented reflect past performance. Past performance is no guarantee of
future results. Current performance may be higher or lower than the performance
shown. Investment return and principal value will fluctuate, and redemption
value may be more or less than original cost. To obtain performance data current
to the most recent month end, please call 1-800-345-2021 or visit
americancentury.com. As interest rates rise, bond values will decline. In
addition, the lower-rated securities in which the fund invests are subject to
greater credit risk, default risk and liquidity risk.
Unless otherwise indicated, performance reflects Investor Class shares;
performance for other share classes will vary due to differences in fee
structure. For information about other share classes available, please consult
the prospectus. Data assumes reinvestment of dividends and capital gains, and
none of the charts reflect the deduction of taxes that a shareholder would pay
on fund distributions or the redemption of fund shares. Returns for the indices
are provided for comparison. The fund's total returns include operating expenses
(such as transaction costs and management fees) that reduce returns, while the
total returns of the indices do not.
(continued)
- ------
16
High-Yield - Performance
GROWTH OF $10,000 OVER LIFE OF CLASS
$10,000 investment made September 30, 1997
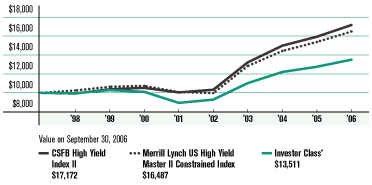
ONE-YEAR RETURNS OVER LIFE OF CLASS
Periods ended September 30
- ----------------------------------------------------------------------------------------------------
1998 1999 2000 2001 2002 2003 2004 2005 2006
- ----------------------------------------------------------------------------------------------------
Investor Class -0.45% 3.37% -1.80% -11.54% 3.86% 18.81% 10.67% 4.51% 5.90%*
- ----------------------------------------------------------------------------------------------------
Merrill Lynch US High Yield
Master II Constrained Index 2.48% 3.86% 0.89% -6.13% -1.08% 28.80% 12.33% 6.59% 7.22%
- ----------------------------------------------------------------------------------------------------
CSFB High Yield Index II -0.71% 4.48% 1.47% -4.59% 2.85% 28.05% 13.32% 6.31% 7.77%
- ----------------------------------------------------------------------------------------------------
*Returns would have been lower, along with the ending value, if a portion of
the class's management fees had not been waived during the period.
Data presented reflect past performance. Past performance is no guarantee of
future results. Current performance may be higher or lower than the performance
shown. Investment return and principal value will fluctuate, and redemption
value may be more or less than original cost. To obtain performance data current
to the most recent month end, please call 1-800-345-2021 or visit
americancentury.com. As interest rates rise, bond values will decline. In
addition, the lower-rated securities in which the fund invests are subject to
greater credit risk, default risk and liquidity risk.
Unless otherwise indicated, performance reflects Investor Class shares;
performance for other share classes will vary due to differences in fee
structure. For information about other share classes available, please consult
the prospectus. Data assumes reinvestment of dividends and capital gains, and
none of the charts reflect the deduction of taxes that a shareholder would pay
on fund distributions or the redemption of fund shares. Returns for the indices
are provided for comparison. The fund's total returns include operating expenses
(such as transaction costs and management fees) that reduce returns, while the
total returns of the indices do not.
- ------
17
High-Yield - Portfolio Commentary
PORTFOLIO MANAGERS: MIKE DIFLEY AND JIM KEEGAN
PERFORMANCE SUMMARY
High-Yield generated a 2.67%* total return for the six months ended September
30, 2006. By comparison, the CSFB High Yield Index II and the Merrill Lynch US
High Yield Master II Constrained Index -- representing the U.S. corporate
high-yield bond market -- returned 3.94% and 3.71%, respectively. The
portfolio's results reflected operating expenses, while the indices' returns did
not. The portfolio's performance relative to the indices can be attributed to
our industry positioning and our emphasis on higher-credit-quality securities.
HIGH-YIELD BOND MARKET PERSPECTIVE
Corporate high-yield bonds -- which tend to behave somewhere between stocks and
bonds -- outperformed most other fixed-income sectors during the reporting
period. That's not surprising, given that lower-quality bonds generally
outperformed higher-quality securities. The third quarter of 2006 also saw the
corporate high-yield sector enjoy its highest quarterly returns since the fourth
quarter of 2004.
The yield pick up (credit spread) between higher- and lower-rated corporate
high-yield bonds remained at historically low levels, reflecting outperformance
by lower-rated securities. According to Merrill Lynch's constrained index, the
riskiest class of bonds -- those rated triple-C or lower -- generated a 6.55%
return. Single-B bonds finished with a 3.58% gain. Bonds rated double-B -- one
credit notch below investment-grade status -- returned 2.98%.
Defaults by corporate high-yield bond issuers remained near all-time lows,
providing a helpful backdrop. Moody's global speculative-grade issuer default
rate finished at 1.46% for the 12 months ended September 30, 2006. That was down
moderately from 1.64% at the end of March and substantially below the
recent-cycle peak of 10.89% reached in January 2002. In addition, slower
refinancing activity tempered new bond issuance, supporting prices.
PORTFOLIO POSITIONING & STRATEGY
Our investment approach uses a consistent, repeatable framework that seeks to
identify the best relative values within the corporate high-yield bond sector.
We actively apply a multi-step process, which includes security selection,
credit-quality emphasis, portfolio construction, and attribution analysis.
PORTFOLIO AT A GLANCE
- --------------------------------------------------------------------------------
AS OF AS OF
9/30/06 3/31/06
- --------------------------------------------------------------------------------
Weighted Average Maturity 4.5 years 6.6 years
- --------------------------------------------------------------------------------
Average Duration
(effective) 4.0 years 3.9 years
- --------------------------------------------------------------------------------
YIELDS AS OF SEPTEMBER 30, 2006*
- --------------------------------------------------------------------------------
30-DAY SEC YIELD
- --------------------------------------------------------------------------------
Investor Class 6.46%
- --------------------------------------------------------------------------------
Institutional Class 6.72%
- --------------------------------------------------------------------------------
Advisor Class 6.26%
- --------------------------------------------------------------------------------
A Class 5.97%
- --------------------------------------------------------------------------------
B Class 5.51%
- --------------------------------------------------------------------------------
C Class 5.50%
- --------------------------------------------------------------------------------
R Class 6.00%
- --------------------------------------------------------------------------------
*The yields presented reflect the waiver of a portion of the fund's management
fees. Without such waiver, the 30-day yields would have been lower.
*All fund returns referenced in this commentary are for
Investor Class shares. Total returns for periods less
than one year are not annualized. (continued)
- ------
18
High-Yield - Portfolio Commentary
In keeping with this investment process, we concentrated the bulk of the
portfolio in single-B credits, while allocating the second-biggest slice to
double-B names. With credit spreads and the yield pick up at historically low
levels, we considered the risk/reward of triple-C and lower credits relatively
unattractive. Consequently, we maintained an underweight position in bottom-tier
credits compared with the Merrill Lynch US High Yield Master II Constrained
Index. This helped to keep the portfolio default-free for the six months, but
fund performance was curtailed given the outperformance of lower-quality
high-yield bonds.
The corporate high-yield market has experienced extremely narrow performance in
2006, with the biggest returns generally concentrated among a handful of
sectors, where we perceived questionable long-term fundamentals in some
instances. In autos, for example, we avoided Ford and General Motors bonds,
instead overweighting the securities of these companies' financial subsidiaries,
which significantly outperformed the indices over the reporting period. Also, in
Cable TV -- one of the market's better-performing industries-- the portfolio
benefited from holdings of CCH I, LLC/CCH I Capital Corp., and CCH II, LLC/CCH
II Capital Corp., affiliates of Charter Communications.
HIGH-YIELD'S PLACE IN A DIVERSIFIED PORTFOLIO
High-Yield is designed to seek some of the highest income opportunities
available for bond funds, though any rewards come in exchange for higher credit
risk. The fund is meant for investors accustomed to volatility who can tolerate
relatively high share price fluctuation for a bond fund and want to diversify
equity-heavy portfolios with fixed-income securities that have a similar
risk/return profile.
High-Yield should serve as a specialty slice of an investor's portfolio rather
than as a "core" bond holding. High-Yield can be an effective diversifier for
government bond-heavy portfolios because it can perform relatively well during
periods of economic expansion and rising interest rates, as we've seen in 2006.
But it can lag government bond portfolios during periods of economic weakness
and falling interest rates.
PORTFOLIO COMPOSITION BY CREDIT RATING
- --------------------------------------------------------------------------------
% OF % OF
NET ASSETS NET ASSETS
AS OF AS OF
9/30/06 3/31/06
- --------------------------------------------------------------------------------
AAA 13% 6%
- --------------------------------------------------------------------------------
A 1% 1%
- --------------------------------------------------------------------------------
BBB 3% 2%
- --------------------------------------------------------------------------------
BB 30% 34%
- --------------------------------------------------------------------------------
B 47% 51%
- --------------------------------------------------------------------------------
CCC or lower 6% 6%
- --------------------------------------------------------------------------------
TOP FIVE INDUSTRIES
AS OF SEPTEMBER 30, 2006
- --------------------------------------------------------------------------------
% OF % OF
NET ASSETS NET ASSETS
AS OF AS OF
9/30/06 3/31/06
- --------------------------------------------------------------------------------
Media 8.4% 9.4%
- --------------------------------------------------------------------------------
Oil, Gas &
Consumable Fuels 7.8% 8.1%
- --------------------------------------------------------------------------------
Hotels, Restaurants
& Leisure 7.4% 8.7%
- --------------------------------------------------------------------------------
Wireless Telecommunication
Services 5.5% 5.6%
- --------------------------------------------------------------------------------
Diversified Telecommunication
Services 5.1% 3.8%
- --------------------------------------------------------------------------------
- ------
19
High-Yield - Schedule of Investments
SEPTEMBER 30, 2006 (UNAUDITED)
Principal Amount Value
- --------------------------------------------------------------------------------
CORPORATE BONDS -- 84.3%
AEROSPACE & DEFENSE -- 1.4%
- --------------------------------------------------------------------------------
$ 400,000 DRS Technologies, Inc.,
7.625%, 2/1/18(1) $ 408,000
- --------------------------------------------------------------------------------
350,000 L-3 Communications Corp.,
6.125%, 7/15/13 342,125
- --------------------------------------------------------------------------------
250,000 L-3 Communications Corp.,
6.375%, 10/15/15 244,375
- --------------------------------------------------------------------------------
994,500
- --------------------------------------------------------------------------------
BUILDING PRODUCTS -- 0.3%
- --------------------------------------------------------------------------------
250,000 Nortek Inc., 8.50%, 9/1/14(1) 237,500
- --------------------------------------------------------------------------------
CHEMICALS -- 3.4%
- --------------------------------------------------------------------------------
850,000 Huntsman ICI Chemicals,
10.125%, 7/1/09(5) 866,999
- --------------------------------------------------------------------------------
46,000 IMC Global Inc.,
10.875%, 6/1/08(1) 49,278
- --------------------------------------------------------------------------------
441,000 Lyondell Chemical Co.,
9.50%, 12/15/08(5) 455,884
- --------------------------------------------------------------------------------
600,000 Lyondell Chemical Co.,
8.25%, 9/15/16 612,000
- --------------------------------------------------------------------------------
400,000 Nell AF SARL, 8.375%,
8/15/15 (Acquired 8/4/05,
Cost $400,000)(1)(2) 399,000
- --------------------------------------------------------------------------------
2,383,161
- --------------------------------------------------------------------------------
COMMERCIAL SERVICES & SUPPLIES -- 2.7%
- --------------------------------------------------------------------------------
750,000 Allied Waste North
America, Inc., 6.375%,
4/15/11(1) 735,000
- --------------------------------------------------------------------------------
500,000 Cenveo Corp., 7.875%,
12/1/13(1) 476,250
- --------------------------------------------------------------------------------
700,000 Corrections Corp. of America,
6.25%, 3/15/13(5) 689,500
- --------------------------------------------------------------------------------
1,900,750
- --------------------------------------------------------------------------------
COMMUNICATIONS EQUIPMENT -- 1.3%
- --------------------------------------------------------------------------------
250,000 Lucent Technologies Inc.,
6.45%, 3/15/29 223,750
- --------------------------------------------------------------------------------
675,000 Nordic Telephone Co.
Holdings ApS, 8.875%, 5/1/16
(Acquired 4/26/06 -- 5/5/06,
Cost $693,594)(2)(5) 712,968
- --------------------------------------------------------------------------------
936,718
- --------------------------------------------------------------------------------
COMPUTERS & PERIPHERALS -- 0.7%
- --------------------------------------------------------------------------------
500,000 Xerox Corp., 6.875%, 8/15/11 517,500
- --------------------------------------------------------------------------------
CONSTRUCTION MATERIALS -- 0.4%
- --------------------------------------------------------------------------------
400,000 ACIH Inc., VRN, 0.00%,
12/15/07 (Acquired 12/21/04,
Cost $287,164)(2)(3) 268,000
- --------------------------------------------------------------------------------
Principal Amount Value
- --------------------------------------------------------------------------------
CONTAINERS & PACKAGING -- 2.5%
- --------------------------------------------------------------------------------
$ 500,000 Ball Corp., 6.875%, 12/15/12 $ 506,250
- --------------------------------------------------------------------------------
250,000 Ball Corp., 6.625%, 3/15/18 246,250
- --------------------------------------------------------------------------------
250,000 BWAY Corp., 10.00%, 10/15/10 263,750
- --------------------------------------------------------------------------------
250,000 Graham Packaging Co. Inc.,
8.50%, 10/15/12(1) 248,750
- --------------------------------------------------------------------------------
500,000 Graham Packaging Co. Inc.,
9.875%, 10/15/14(1) 493,750
- --------------------------------------------------------------------------------
1,758,750
- --------------------------------------------------------------------------------
DISTRIBUTORS -- 0.6%
- --------------------------------------------------------------------------------
500,000 Amscan Holdings Inc.,
8.75%, 5/1/14 455,000
- --------------------------------------------------------------------------------
DIVERSIFIED -- 4.5%
- --------------------------------------------------------------------------------
1,200,000 Dow Jones CDX N.A. High
Yield Secured Note, 7.125%,
12/29/11 (Acquired 9/27/06,
Cost $1,197,000)(2)(4) 1,194,750
- --------------------------------------------------------------------------------
2,000,000 Dow Jones CDX N.A. High
Yield Secured Note, 8.375%,
12/29/11 (Acquired 9/27/06,
Cost $1,999,850)(2)(4) 1,996,875
- --------------------------------------------------------------------------------
3,191,625
- --------------------------------------------------------------------------------
DIVERSIFIED FINANCIAL SERVICES -- 4.7%
- --------------------------------------------------------------------------------
400,000 Ford Motor Credit Co.,
6.625%, 6/16/08(1) 394,108
- --------------------------------------------------------------------------------
600,000 Ford Motor Credit Co.,
7.375%, 10/28/09(5) 583,474
- --------------------------------------------------------------------------------
600,000 Ford Motor Credit Co.,
7.25%, 10/25/11(5) 566,429
- --------------------------------------------------------------------------------
250,000 General Motors Acceptance Corp.,
6.15%, 4/5/07 249,745
- --------------------------------------------------------------------------------
500,000 General Motors Acceptance Corp.,
6.875%, 9/15/11 497,865
- --------------------------------------------------------------------------------
750,000 General Motors Acceptance Corp.,
6.75%, 12/1/14(1) 733,320
- --------------------------------------------------------------------------------
325,000 General Motors Acceptance Corp.,
8.00%, 11/1/31(1) 340,753
- --------------------------------------------------------------------------------
3,365,694
- --------------------------------------------------------------------------------
DIVERSIFIED TELECOMMUNICATION SERVICES -- 5.1%
- --------------------------------------------------------------------------------
586,000 AT&T Corp., 7.30%, 11/15/11(5) 635,835
- --------------------------------------------------------------------------------
325,000 Citizens Communications Co.,
6.25%, 1/15/13 317,688
- --------------------------------------------------------------------------------
500,000 Embarq Corp., 7.08%, 6/1/16(5) 510,937
- --------------------------------------------------------------------------------
200,000 Intelsat Bermuda Ltd., 9.25%,
6/15/16 (Acquired 6/19/06,
Cost $200,000)(1)(2) 211,250
- --------------------------------------------------------------------------------
250,000 Intelsat Subsidiary Holding
Co. Ltd., 8.25%, 1/15/13 254,375
- --------------------------------------------------------------------------------
500,000 Intelsat Subsidiary Holding
Co. Ltd., 8.625%, 1/15/15(5) 513,750
- --------------------------------------------------------------------------------
See Notes to Financial Statements. (continued)
- ------
20
High-Yield - Schedule of Investments
SEPTEMBER 30, 2006 (UNAUDITED)
Principal Amount Value
- --------------------------------------------------------------------------------
$ 550,000 Qwest Communications
International Inc.,
7.50%, 2/15/14(1) $ 554,125
- --------------------------------------------------------------------------------
550,000 Qwest Corp., 7.875%, 9/1/11(5) 580,250
- --------------------------------------------------------------------------------
3,578,210
- --------------------------------------------------------------------------------
ELECTRIC UTILITIES -- 0.4%
- --------------------------------------------------------------------------------
300,000 MSW Energy Holdings LLC/
MSW Energy Finance Co., Inc.,
8.50%, 9/1/10 310,500
- --------------------------------------------------------------------------------
ELECTRONIC EQUIPMENT & INSTRUMENTS -- 1.4%
- --------------------------------------------------------------------------------
500,000 Celestica Inc., 7.625%, 7/1/13(1) 498,750
- --------------------------------------------------------------------------------
500,000 Flextronics International Ltd.,
6.50%, 5/15/13(1) 497,500
- --------------------------------------------------------------------------------
996,250
- --------------------------------------------------------------------------------
ENERGY EQUIPMENT & SERVICES -- 1.5%
- --------------------------------------------------------------------------------
600,000 Hanover Compressor Co.,
8.625%, 12/15/10(5) 627,000
- --------------------------------------------------------------------------------
400,000 Universal Compression Inc.,
7.25%, 5/15/10(1) 405,000
- --------------------------------------------------------------------------------
1,032,000
- --------------------------------------------------------------------------------
FOOD & STAPLES RETAILING -- 0.7%
- --------------------------------------------------------------------------------
500,000 Ingles Markets, Inc.,
8.875%, 12/1/11(1) 523,750
- --------------------------------------------------------------------------------
HEALTH CARE EQUIPMENT & SUPPLIES -- 1.0%
- --------------------------------------------------------------------------------
650,000 Universal Hospital Services
Inc., 10.125%, 11/1/11(5) 685,750
- --------------------------------------------------------------------------------
HEALTH CARE PROVIDERS & SERVICES -- 1.6%
- --------------------------------------------------------------------------------
585,000 Genesis HealthCare Corp.,
8.00%, 10/15/13(5) 609,862
- --------------------------------------------------------------------------------
250,000 HealthSouth Corp., 10.75%,
6/15/16 (Acquired 6/9/06,
Cost $246,263)(1)(2) 256,563
- --------------------------------------------------------------------------------
250,000 Omnicare Inc.,
6.875%, 12/15/15 244,063
- --------------------------------------------------------------------------------
1,110,488
- --------------------------------------------------------------------------------
HOTELS, RESTAURANTS & LEISURE -- 7.3%
- --------------------------------------------------------------------------------
500,000 Herbst Gaming Inc.,
8.125%, 6/1/12 513,125
- --------------------------------------------------------------------------------
650,000 Intrawest Corp.,
7.50%, 10/15/13(5) 701,187
- --------------------------------------------------------------------------------
600,000 Majestic Star Casino LLC/
Majestic Star Casino Capital Corp.,
9.50%, 10/15/10(5) 616,499
- --------------------------------------------------------------------------------
34,000 Mandalay Resort Group,
9.375%, 2/15/10(1) 36,508
- --------------------------------------------------------------------------------
500,000 MGM Mirage, 8.50%, 9/15/10 534,375
- --------------------------------------------------------------------------------
300,000 MGM Mirage, 6.75%, 9/1/12 297,375
- --------------------------------------------------------------------------------
400,000 Penn National Gaming, Inc.,
6.875%, 12/1/11(1) 404,000
- --------------------------------------------------------------------------------
300,000 Royal Caribbean Cruises Ltd.,
7.00%, 6/15/13 304,788
- --------------------------------------------------------------------------------
Principal Amount Value
- --------------------------------------------------------------------------------
$ 300,000 Royal Caribbean Cruises Ltd.,
6.875%, 12/1/13 $ 300,493
- --------------------------------------------------------------------------------
250,000 Six Flags Inc., 8.875%, 2/1/10 240,625
- --------------------------------------------------------------------------------
250,000 Six Flags Inc., 9.75%,
4/15/13(1) 226,250
- --------------------------------------------------------------------------------
500,000 Trump Entertainment
Resorts, Inc., 8.50%, 6/1/15(1) 480,625
- --------------------------------------------------------------------------------
500,000 Wynn Las Vegas LLC,
6.625%, 12/1/14(1) 487,500
- --------------------------------------------------------------------------------
5,143,350
- --------------------------------------------------------------------------------
HOUSEHOLD DURABLES -- 1.4%
- --------------------------------------------------------------------------------
500,000 KB Home, 6.375%, 8/15/11(5) 485,589
- --------------------------------------------------------------------------------
500,000 Sealy Mattress Co.,
8.25%, 6/15/14(5) 512,500
- --------------------------------------------------------------------------------
998,089
- --------------------------------------------------------------------------------
INDEPENDENT POWER PRODUCERS
& ENERGY TRADERS -- 2.4%
- --------------------------------------------------------------------------------
450,000 AES Corp. (The),
8.875%, 2/15/11 483,750
- --------------------------------------------------------------------------------
500,000 AES Corp. (The), 8.75%,
5/15/13 (Acquired 5/1/03,
Cost $500,000)(2) 538,750
- --------------------------------------------------------------------------------
650,000 NRG Energy Inc.,
7.375%, 2/1/16 647,563
- --------------------------------------------------------------------------------
1,670,063
- --------------------------------------------------------------------------------
IT SERVICES -- 1.2%
- --------------------------------------------------------------------------------
450,000 SunGard Data Systems Inc.,
9.125%, 8/15/13(1) 468,000
- --------------------------------------------------------------------------------
350,000 SunGard Data Systems Inc.,
10.25%, 8/15/15(1) 362,250
- --------------------------------------------------------------------------------
830,250
- --------------------------------------------------------------------------------
LIFE SCIENCES TOOLS & SERVICES -- 0.6%
- --------------------------------------------------------------------------------
400,000 Fisher Scientific International
Inc., 6.75%, 8/15/14 409,000
- --------------------------------------------------------------------------------
MACHINERY(6)
- --------------------------------------------------------------------------------
21,000 Terex Corp., 7.375%, 1/15/14 21,210
- --------------------------------------------------------------------------------
MEDIA -- 8.4%
- --------------------------------------------------------------------------------
200,000 Cablevision Systems Corp.,
8.00%, 4/15/12(5) 203,500
- --------------------------------------------------------------------------------
350,000 Cadmus Communications Corp.,
8.375%, 6/15/14 340,375
- --------------------------------------------------------------------------------
248,000 CCH I, LLC/CCH I Capital Corp.,
11.00%, 10/1/15 226,920
- --------------------------------------------------------------------------------
550,000 CCH II, LLC/CCH II Capital Corp.,
10.25%, 9/15/10 563,750
- --------------------------------------------------------------------------------
750,000 Cinemark Inc., VRN, 0.00%,
3/15/09(3) 601,874
- --------------------------------------------------------------------------------
500,000 CSC Holdings, Inc., 8.125%,
8/15/09 520,625
- --------------------------------------------------------------------------------
250,000 CSC Holdings, Inc., 7.25%,
4/15/12 (Acquired 8/5/04,
Cost $241,250)(2)(5) 250,313
- --------------------------------------------------------------------------------
See Notes to Financial Statements. (continued)
- ------
21
High-Yield - Schedule of Investments
SEPTEMBER 30, 2006 (UNAUDITED)
Principal Amount Value
- --------------------------------------------------------------------------------
$ 500,000 Dex Media Inc., 8.00%,
11/15/13 $ 498,750
- --------------------------------------------------------------------------------
500,000 DirecTV Holdings LLC/DirecTV
Financing Co., Inc., 8.375%,
3/15/13(5) 520,625
- --------------------------------------------------------------------------------
500,000 Echostar DBS Corp.,
6.375%, 10/1/11(5) 488,125
- --------------------------------------------------------------------------------
250,000 Fisher Communications, Inc.,
8.625%, 9/15/14 260,625
- --------------------------------------------------------------------------------
500,000 Mediacom LLC, 9.50%,
1/15/13(1) 513,750
- --------------------------------------------------------------------------------
300,000 MediaNews Group, Inc.,
6.875%, 10/1/13 279,000
- --------------------------------------------------------------------------------
400,000 Primedia Inc., 8.875%, 5/15/11(1) 393,000
- --------------------------------------------------------------------------------
300,000 Primedia Inc., 8.00%, 5/15/13 273,750
- --------------------------------------------------------------------------------
5,934,982
- --------------------------------------------------------------------------------
METALS & MINING -- 0.8%
- --------------------------------------------------------------------------------
550,000 IPSCO Inc., 8.75%, 6/1/13 588,500
- --------------------------------------------------------------------------------
MULTI-UTILITIES -- 1.5%
- --------------------------------------------------------------------------------
500,000 CMS Energy Corp.,
7.50%, 1/15/09(1)(5) 517,500
- --------------------------------------------------------------------------------
500,000 CMS Energy Corp.,
7.75%, 8/1/10(5) 527,500
- --------------------------------------------------------------------------------
1,045,000
- --------------------------------------------------------------------------------
MULTILINE RETAIL -- 0.5%
- --------------------------------------------------------------------------------
350,000 Neiman Marcus Group Inc.,
10.375%, 10/15/15(1) 379,750
- --------------------------------------------------------------------------------
OIL, GAS & CONSUMABLE FUELS -- 7.8%
- --------------------------------------------------------------------------------
250,000 Chesapeake Energy Corp.,
7.625%, 7/15/13(5) 256,563
- --------------------------------------------------------------------------------
600,000 Chesapeake Energy Corp.,
7.50%, 6/15/14(5) 609,750
- --------------------------------------------------------------------------------
800,000 El Paso Corp., 7.875%,
6/15/12(1) 833,999
- --------------------------------------------------------------------------------
300,000 El Paso Corp., 7.80%, 8/1/31(5) 309,000
- --------------------------------------------------------------------------------
650,000 Forest Oil Corp.,
7.75%, 5/1/14(1) 659,749
- --------------------------------------------------------------------------------
390,000 Magnum Hunter Resources Inc.,
9.60%, 3/15/12 413,400
- --------------------------------------------------------------------------------
400,000 Massey Energy Co., 6.625%,
11/15/10 392,000
- --------------------------------------------------------------------------------
250,000 Massey Energy Co., 6.875%,
12/15/13 227,500
- --------------------------------------------------------------------------------
520,000 Pacific Energy Partners L.P./
Pacific Energy Finance Corp.,
7.125%, 6/15/14(5) 533,000
- --------------------------------------------------------------------------------
500,000 Range Resources Corp.,
7.375%, 7/15/13(5) 505,000
- --------------------------------------------------------------------------------
250,000 Tesoro Corp., 6.25%,
11/1/12 (Acquired 7/25/06,
Cost $238,125)(1)(2) 242,188
- --------------------------------------------------------------------------------
500,000 Williams Companies, Inc. (The),
8.125%, 3/15/12(1) 536,250
- --------------------------------------------------------------------------------
5,518,399
- --------------------------------------------------------------------------------
Principal Amount Value
- --------------------------------------------------------------------------------
PAPER & FOREST PRODUCTS -- 3.1%
- --------------------------------------------------------------------------------
$ 400,000 Abitibi-Consolidated Inc.,
6.95%, 4/1/08(1) $ 399,000
- --------------------------------------------------------------------------------
550,000 Boise Cascade LLC,
7.125%, 10/15/14(5) 515,625
- --------------------------------------------------------------------------------
500,000 Georgia-Pacific Corp.,
7.70%, 6/15/15(1) 500,000
- --------------------------------------------------------------------------------
21,000 Jefferson Smurfit Corp.,
8.25%, 10/1/12 20,213
- --------------------------------------------------------------------------------
500,000 Norske Skog Canada Ltd.,
7.375%, 3/1/14 462,500
- --------------------------------------------------------------------------------
250,000 Verso Paper Holdings LLC/
Verson Paper Inc., 9.125%,
8/1/14 (Acquired 7/26/06,
Cost $250,000)(2) 252,813
- --------------------------------------------------------------------------------
2,150,151
- --------------------------------------------------------------------------------
REAL ESTATE INVESTMENT TRUSTS -- 0.9%
- --------------------------------------------------------------------------------
400,000 Host Marriott L.P.,
7.00%, 8/15/12(5) 406,500
- --------------------------------------------------------------------------------
250,000 Host Marriott L.P.,
6.75%, 6/1/16(5) 247,813
- --------------------------------------------------------------------------------
654,313
- --------------------------------------------------------------------------------
ROAD & RAIL -- 1.3%
- --------------------------------------------------------------------------------
300,000 Hertz Corp., 8.875%,
1/1/14 (Acquired 12/15/05,
Cost $301,125)(2) 315,750
- --------------------------------------------------------------------------------
550,000 Hertz Corp., 10.50%, 1/1/16
(Acquired 12/15/05 -- 1/27/06,
Cost $572,313)(1)(2) 607,750
- --------------------------------------------------------------------------------
923,500
- --------------------------------------------------------------------------------
SPECIALTY RETAIL -- 4.3%
- --------------------------------------------------------------------------------
700,000 Asbury Automotive Group Inc.,
9.00%, 6/15/12(1) 720,125
- --------------------------------------------------------------------------------
250,000 Asbury Automotive Group Inc.,
8.00%, 3/15/14 248,125
- --------------------------------------------------------------------------------
600,000 Couche-Tard U.S. L.P./Couche-Tard
Finance Corp., 7.50%,
12/15/13(5) 612,000
- --------------------------------------------------------------------------------
650,000 GSC Holdings Corp., 8.00%,
10/1/12(1) 672,750
- --------------------------------------------------------------------------------
350,000 Toys "R" Us, Inc., 7.375%,
10/15/18 255,063
- --------------------------------------------------------------------------------
500,000 United Auto Group, Inc.,
9.625%, 3/15/12(1) 532,500
- --------------------------------------------------------------------------------
3,040,563
- --------------------------------------------------------------------------------
TEXTILES, APPAREL & LUXURY GOODS -- 0.9%
- --------------------------------------------------------------------------------
625,000 Perry Ellis International, Inc.,
8.875%, 9/15/13 618,750
- --------------------------------------------------------------------------------
THRIFTS & MORTGAGE FINANCE -- 0.7%
- --------------------------------------------------------------------------------
500,000 Residential Capital Corp.,
6.50%, 4/17/13 508,442
- --------------------------------------------------------------------------------
- ------
22
See Notes to Financial Statements. (continued)
High-Yield - Schedule of Investments
SEPTEMBER 30, 2006 (UNAUDITED)
Principal Amount/Shares Value
- --------------------------------------------------------------------------------
TRADING COMPANIES & DISTRIBUTORS -- 1.5%
- --------------------------------------------------------------------------------
$ 425,000 Ashtead Capital Inc., 9.00%,
8/15/16 (Acquired 8/1/06,
Cost $429,250)(2) $ 444,125
- --------------------------------------------------------------------------------
400,000 United Rentals North America,
Inc., 6.50%, 2/15/12 388,000
- --------------------------------------------------------------------------------
271,000 United Rentals North America,
Inc., 7.75%, 11/15/13(1) 268,290
- --------------------------------------------------------------------------------
1,100,415
- --------------------------------------------------------------------------------
WIRELESS TELECOMMUNICATION SERVICES -- 5.5%
- --------------------------------------------------------------------------------
200,000 Dobson Communications
Corp., 8.875%, 10/1/13(1) 199,250
- --------------------------------------------------------------------------------
500,000 Nextel Communications Inc.,
5.95%, 3/15/14(5) 489,760
- --------------------------------------------------------------------------------
500,000 Nextel Communications Inc.,
7.375%, 8/1/15(5) 516,389
- --------------------------------------------------------------------------------
400,000 Nextel Partners Inc., 8.125%,
7/1/11(5) 422,000
- --------------------------------------------------------------------------------
650,000 Rogers Wireless Inc., 7.25%,
12/15/12 683,312
- --------------------------------------------------------------------------------
300,000 Rogers Wireless Inc.,
7.50%, 3/15/15(1) 321,750
- --------------------------------------------------------------------------------
350,000 Rural Cellular Corp.,
9.75%, 1/15/10(1) 353,938
- --------------------------------------------------------------------------------
300,000 Rural Cellular Corp.,
9.875%, 2/1/10 314,250
- --------------------------------------------------------------------------------
300,000 Syniverse Technologies Inc.,
7.75%, 8/15/13 290,250
- --------------------------------------------------------------------------------
300,000 UbiquiTel Operating Company,
9.875%, 3/1/11 327,000
- --------------------------------------------------------------------------------
3,917,899
- --------------------------------------------------------------------------------
TOTAL CORPORATE BONDS
(Cost $59,326,992) 59,698,772
- --------------------------------------------------------------------------------
U.S. TREASURY SECURITIES -- 1.4%
1,000,000 U.S. Treasury Notes,
4.25%, 11/30/07(1)(5)
(Cost $998,498) 993,165
- --------------------------------------------------------------------------------
COMMON STOCKS -- 0.1%
HOTELS, RESTAURANTS & LEISURE -- 0.1%
- --------------------------------------------------------------------------------
4,076 Trump Entertainment
Resorts, Inc.(7)
(Cost $40,020) 69,129
- --------------------------------------------------------------------------------
TEMPORARY CASH INVESTMENTS -- 13.7%
Repurchase Agreement, Credit Suisse First
Boston Corp., (collateralized by
various U.S. Treasury obligations, 4.790%,
12/21/06, valued at $2,684,364), in
a joint trading account at 4.90%,
dated 9/29/06, due 10/2/06
(Delivery value $2,634,075)(5) $ 2,633,000
- --------------------------------------------------------------------------------
Repurchase Agreement, Deutsche Bank
Securities, Inc., (collateralized by various
U.S. Treasury obligations, 0.875%, 4/15/10,
valued at $3,581,907), in a joint trading account
at 4.95%, dated 9/29/06, due 10/2/06
(Delivery value $3,512,448)(5) 3,511,000
- --------------------------------------------------------------------------------
Repurchase Agreement, Goldman Sachs & Co.,
(collateralized by various U.S. Treasury
obligations, 5.25% -- 6.00%, 2/15/26 -- 2/15/29,
valued at $3,579,767), in a joint trading account
at 4.90%, dated 9/29/06, due 10/2/06
(Delivery value $3,512,434)(5) 3,511,000
- --------------------------------------------------------------------------------
TOTAL TEMPORARY CASH INVESTMENTS
(Cost $9,655,000) 9,655,000
- --------------------------------------------------------------------------------
COLLATERAL RECEIVED FOR
SECURITIES LENDING(8) -- 24.7%
REPURCHASE AGREEMENTS
- --------------------------------------------------------------------------------
Repurchase Agreement, BNP Paribas,
(collateralized by various U.S. Government
Agency obligations in a pooled account at
the lending agent), 5.37%, dated 9/29/06,
due 10/2/06 (Delivery value $9,004,028) 9,000,000
- --------------------------------------------------------------------------------
Repurchase Agreement, UBS AG,
(collateralized by various U.S. Government
Agency obligations in a pooled account at the
lending agent), 5.375%, dated 9/29/06,
due 10/2/06 (Delivery value $8,449,801) 8,446,018
- --------------------------------------------------------------------------------
TOTAL COLLATERAL RECEIVED FOR SECURITIES LENDING
(Cost $17,446,018) 17,446,018
- --------------------------------------------------------------------------------
TOTAL INVESTMENT SECURITIES -- 124.2%
(Cost $87,466,528) 87,862,084
- --------------------------------------------------------------------------------
OTHER ASSETS
AND LIABILITIES -- (24.2)% (17,136,299)
- --------------------------------------------------------------------------------
TOTAL NET ASSETS -- 100.0% $70,725,785
================================================================================
See Notes to Financial Statements. (continued)
- ------
23
High-Yield - Schedule of Investments
SEPTEMBER 30, 2006 (UNAUDITED)
FUTURES CONTRACTS
Underlying Face
Contracts Purchased Expiration Date Amount at Value Unrealized Gain (Loss)
- --------------------------------------------------------------------------------------------------------
52 U.S. Treasury 2-Year Notes December 2006 $ 10,634,000 $11,664
- --------------------------------------------------------------------------------------------------------
75 U.S. Treasury 5-Year Notes December 2006 7,913,672 37,566
- --------------------------------------------------------------------------------------------------------
$ 18,547,672 $49,230
================================================
Underlying Face
Contracts Sold Expiration Date Amount at Value Unrealized Gain (Loss)
- --------------------------------------------------------------------------------------------------------
27 U.S. Treasury 10-Year Notes December 2006 $2,917,688 $(16,233)
================================================
SWAP AGREEMENTS
Notional Description of Expiration Unrealized
Amount Agreement Date Gain (Loss)
- -------------------------------------------------------------------------------------
CREDIT DEFAULT
- -------------------------------------------------------------------------------------
$ 3,400,000 Pay semiannually a fixed rate December 2011
equal to 1.40% multiplied by the
notional amount and receive
from Barclays Capital, Inc. upon
each default event of one of the
issues of Dow Jones CDX N.A.
Investment Grade 6, par value of
the proportional notional amount. $13,858
============
NOTES TO SCHEDULE OF INVESTMENTS
CDX = Credit Derivative Indexes
VRN = Variable Rate Note. Interest reset date is indicated. Rate shown is
effective September 30, 2006.
(1) Security, or a portion thereof, was on loan as of September 30, 2006.
(2) Security was purchased under Rule 144A of the Securities Act of 1933
or is a private placement and, unless registered under the Act or exempted
from registration, may only be sold to qualified institutional investors.
The aggregate value of restricted securities at September 30, 2006 was
$7,691,095, which represented 10.9% of total net assets. None of the
restricted securities were considered illiquid.
(3) Step-coupon security. These securities are issued with a zero-coupon
and become interest bearing at a predetermined rate and date and are issued
at a substantial discount from their value at maturity. Rate shown is
effective September 30, 2006.
(4) When-issued security.
(5) Security, or a portion thereof, has been segregated for when-issued
securities, futures contracts and/or swap agreements.
(6) Industry is less than 0.05% of total net assets.
(7) Non-income producing.
(8) Investments represent purchases made by the lending agent with cash
collateral received throughsecurities lending transactions. (See Note 5 in
Notes to Financial Statements.)
See Notes to Financial Statements.
- ------
24
Shareholder Fee Examples (Unaudited)
Fund shareholders may incur two types of costs: (1) transaction costs, including
sales charges (loads) on purchase payments and redemption/exchange fees; and (2)
ongoing costs, including management fees; distribution and service (12b-1) fees;
and other fund expenses. This example is intended to help you understand your
ongoing costs (in dollars) of investing in your fund and to compare these costs
with the ongoing cost of investing in other mutual funds.
The example is based on an investment of $1,000 made at the beginning of the
period and held for the entire period from April 1, 2006 to September 30, 2006.
ACTUAL EXPENSES
The table provides information about actual account values and actual expenses
for each class. You may use the information, together with the amount you
invested, to estimate the expenses that you paid over the period. First,
identify the share class you own. Then simply divide your account value by
$1,000 (for example, an $8,600 account value divided by $1,000 = 8.6), then
multiply the result by the number under the heading "Expenses Paid During
Period" to estimate the expenses you paid on your account during this period.
If you hold Investor Class shares of any American Century fund, or Institutional
Class shares of the American Century Diversified Bond Fund, in an American
Century account (i.e., not a financial intermediary or retirement plan account),
American Century may charge you a $12.50 semiannual account maintenance fee if
the value of those shares is less than $10,000. We will redeem shares
automatically in one of your accounts to pay the $12.50 fee. In determining your
total eligible investment amount, we will include your investments in all
PERSONAL ACCOUNTS (including American Century Brokerage accounts) registered
under your Social Security number. PERSONAL ACCOUNTS include individual
accounts, joint accounts, UGMA/UTMA accounts, personal trusts, Coverdell
Education Savings Accounts and IRAs (including traditional, Roth, Rollover,
SEP-, SARSEP- and SIMPLE-IRAs), and certain other retirement accounts. If you
have only business, business retirement, employer-sponsored or American Century
Brokerage accounts, you are currently not subject to this fee. We will not
charge the fee as long as you choose to manage your accounts exclusively online.
If you are subject to the Account Maintenance Fee, your account value could be
reduced by the fee amount.
HYPOTHETICAL EXAMPLE FOR COMPARISON PURPOSES
The table also provides information about hypothetical account values and
hypothetical expenses based on the actual expense ratio of each class of your
fund and an assumed rate of return of 5% per year before expenses, which is not
the actual return of a fund's share class. The hypothetical account values and
expenses may not be used to estimate the actual ending account balance or
expenses you paid for the period. You may use this information to compare the
ongoing costs of investing in your fund and other funds. To do so, compare this
5% hypothetical
(continued)
- ------
25
Shareholder Fee Examples (Unaudited)
example with the 5% hypothetical examples that appear in the shareholder reports
of the other funds.
Please note that the expenses shown in the table are meant to highlight your
ongoing costs only and do not reflect any transactional costs, such as sales
charges (loads) or redemption/exchange fees. Therefore, the table is useful in
comparing ongoing costs only, and will not help you determine the relative total
costs of owning different funds. In addition, if these transactional costs were
included, your costs would have been higher.
- --------------------------------------------------------------------------------------
EXPENSES PAID
BEGINNING ENDING DURING PERIOD(1) ANNUALIZED
ACCOUNT VALUE ACCOUNT VALUE 4/1/06 - EXPENSE
4/1/06 9/30/06 9/30/06 RATIO(1)
- --------------------------------------------------------------------------------------
DIVERSIFIED BOND SHAREHOLDER FEE EXAMPLE
- --------------------------------------------------------------------------------------
ACTUAL:
- --------------------------------------------------------------------------------------
Investor Class $1,000 $1,033.80 $3.16 0.62%
- --------------------------------------------------------------------------------------
Institutional Class $1,000 $1,034.90 $2.14 0.42%
- --------------------------------------------------------------------------------------
Advisor Class $1,000 $1,032.50 $4.43 0.87%
- --------------------------------------------------------------------------------------
A Class $1,000 $1,032.60 $4.43 0.87%
- --------------------------------------------------------------------------------------
B Class $1,000 $1,028.70 $8.24 1.62%
- --------------------------------------------------------------------------------------
C Class $1,000 $1,028.60 $8.24 1.62%
- --------------------------------------------------------------------------------------
R Class $1,000 $1,031.20 $5.70 1.12%
- --------------------------------------------------------------------------------------
HYPOTHETICAL:
- --------------------------------------------------------------------------------------
Investor Class $1,000 $1,021.96 $3.14 0.62%
- --------------------------------------------------------------------------------------
Institutional Class $1,000 $1,022.96 $2.13 0.42%
- --------------------------------------------------------------------------------------
Advisor Class $1,000 $1,020.71 $4.41 0.87%
- --------------------------------------------------------------------------------------
A Class $1,000 $1,020.71 $4.41 0.87%
- --------------------------------------------------------------------------------------
B Class $1,000 $1,016.95 $8.19 1.62%
- --------------------------------------------------------------------------------------
C Class $1,000 $1,016.95 $8.19 1.62%
- --------------------------------------------------------------------------------------
R Class $1,000 $1,019.45 $5.67 1.12%
- --------------------------------------------------------------------------------------
(1) Expenses are equal to the class's annualized expense ratio listed in the
table above, multiplied by the average account value over the period,
multiplied by 183, the number of days in the most recent fiscal half-year,
divided by 365, to reflect the one-half year period.
(continued)
- ------
26
Shareholder Fee Examples (Unaudited)
- --------------------------------------------------------------------------------------------------
EXPENSES PAID
BEGINNING ENDING DURING PERIOD(1) ANNUALIZED
ACCOUNT VALUE ACCOUNT VALUE 4/1/06 - EXPENSE
4/1/06 9/30/06 9/30/06 RATIO(1)
- --------------------------------------------------------------------------------------------------
HIGH-YIELD FUND SHAREHOLDER FEE EXAMPLE
- --------------------------------------------------------------------------------------------------
ACTUAL:
- --------------------------------------------------------------------------------------------------
Investor Class (after waiver)(2) $1,000 $1,026.70 $3.96 0.78%
- --------------------------------------------------------------------------------------------------
Investor Class (before waiver) $1,000 $1,026.70(3) $4.42 0.87%
- --------------------------------------------------------------------------------------------------
Institutional Class (after waiver)(2) $1,000 $1,027.70 $2.95 0.58%
- --------------------------------------------------------------------------------------------------
Institutional Class (before waiver) $1,000 $1,027.70(3) $3.41 0.67%
- --------------------------------------------------------------------------------------------------
Advisor Class (after waiver)(2) $1,000 $1,025.40 $5.23 1.03%
- --------------------------------------------------------------------------------------------------
Advisor Class (before waiver) $1,000 $1,025.40(3) $5.69 1.12%
- --------------------------------------------------------------------------------------------------
A Class (after waiver)(2) $1,000 $1,025.40 $5.23 1.03%
- --------------------------------------------------------------------------------------------------
A Class (before waiver) $1,000 $1,025.40(3) $5.69 1.12%
- --------------------------------------------------------------------------------------------------
B Class (after waiver)(2) $1,000 $1,021.60 $9.02 1.78%
- --------------------------------------------------------------------------------------------------
B Class (before waiver) $1,000 $1,021.60(3) $9.48 1.87%
- --------------------------------------------------------------------------------------------------
C Class (after waiver)(2) $1,000 $1,021.50 $9.02 1.78%
- --------------------------------------------------------------------------------------------------
C Class (before waiver) $1,000 $1,021.50(3) $9.48 1.87%
- --------------------------------------------------------------------------------------------------
R Class (after waiver)(2) $1,000 $1,024.10 $6.49 1.28%
- --------------------------------------------------------------------------------------------------
R Class (before waiver) $1,000 $1,024.10(3) $6.95 1.37%
- --------------------------------------------------------------------------------------------------
HYPOTHETICAL:
- --------------------------------------------------------------------------------------------------
Investor Class (after waiver)(2) $1,000 $1,021.16 $3.95 0.78%
- --------------------------------------------------------------------------------------------------
Investor Class (before waiver) $1,000 $1,020.71 $4.41 0.87%
- --------------------------------------------------------------------------------------------------
Institutional Class (after waiver)(2) $1,000 $1,022.16 $2.94 0.58%
- --------------------------------------------------------------------------------------------------
Institutional Class (before waiver) $1,000 $1,021.71 $3.40 0.67%
- --------------------------------------------------------------------------------------------------
Advisor Class (after waiver)(2) $1,000 $1,019.90 $5.22 1.03%
- --------------------------------------------------------------------------------------------------
Advisor Class (before waiver) $1,000 $1,019.45 $5.67 1.12%
- --------------------------------------------------------------------------------------------------
A Class (after waiver)(2) $1,000 $1,019.90 $5.22 1.03%
- --------------------------------------------------------------------------------------------------
A Class (before waiver) $1,000 $1,019.45 $5.67 1.12%
- --------------------------------------------------------------------------------------------------
B Class (after waiver)(2) $1,000 $1,016.14 $9.00 1.78%
- --------------------------------------------------------------------------------------------------
B Class (before waiver) $1,000 $1,015.69 $9.45 1.87%
- --------------------------------------------------------------------------------------------------
C Class (after waiver)(2) $1,000 $1,016.14 $9.00 1.78%
- --------------------------------------------------------------------------------------------------
C Class (before waiver) $1,000 $1,015.69 $9.45 1.87%
- --------------------------------------------------------------------------------------------------
R Class (after waiver)(2) $1,000 $1,018.65 $6.48 1.28%
- --------------------------------------------------------------------------------------------------
R Class (before waiver) $1,000 $1,018.20 $6.93 1.37%
- --------------------------------------------------------------------------------------------------
(1) Expenses are equal to the class's annualized expense ratio listed in the
table above, multiplied by the average account value over the period,
multiplied by 183, the number of days in the most recent fiscal half-year,
divided by 365, to reflect the one-half year period.
(2) During the six months ended September 30, 2006, the investment advisor
waived a portion of the class's management fee.
(3) Ending account value assumes the return after waiver. The return would have
been lower had fees not been waived and would have resulted in a lower
ending account value.
- ------
27
Statement of Assets and Liabilities
SEPTEMBER 30, 2006 (UNAUDITED)
- --------------------------------------------------------------------------------
DIVERSIFIED BOND HIGH-YIELD
- --------------------------------------------------------------------------------
ASSETS
- --------------------------------------------------------------------------------
Investment securities, at value
(cost of $800,288,709 and $60,365,510,
respectively) -- including $89,432,626
and $17,233,110 of securities
on loan, respectively $801,543,314 $60,761,066
- -----------------------------------------
Repurchase agreements, at value
(cost $44,034,000 and
$9,655,000, respectively) 44,034,000 9,655,000
- -----------------------------------------
Investments made with cash collateral
received for securities on loan,
at value (cost of $85,733,775 and
$17,446,018, respectively) 85,733,775 17,446,018
- --------------------------------------------------------------------------------
Total investment securities,
at value (cost of $930,056,484
and $87,466,528, respectively) 931,311,089 87,862,084
- -----------------------------------------
Cash 2,920,460 263,898
- -----------------------------------------
Receivable for investments sold -- 2,229,000
- -----------------------------------------
Receivable for capital shares sold 500 --
- -----------------------------------------
Unrealized appreciation
on swap agreements 385,240 13,858
- -----------------------------------------
Interest receivable 5,627,304 1,249,791
- --------------------------------------------------------------------------------
940,244,593 91,618,631
- --------------------------------------------------------------------------------
LIABILITIES
- --------------------------------------------------------------------------------
Payable for collateral received
for securities on loan 85,733,775 17,446,018
- -----------------------------------------
Payable for investments purchased 156,412,666 3,195,924
- -----------------------------------------
Payable for variation
margin on futures contracts 20,065 4,884
- -----------------------------------------
Unrealized depreciation
on swap agreements 94,096 --
- -----------------------------------------
Accrued management fees 280,896 43,371
- -----------------------------------------
Distribution fees payable 3,242 2,007
- -----------------------------------------
Service fees (and distribution fees --
A Class and R Class) payable 3,146 3,058
- -----------------------------------------
Dividends payable 1,426,413 197,584
- --------------------------------------------------------------------------------
243,974,299 20,892,846
- --------------------------------------------------------------------------------
NET ASSETS $696,270,294 $70,725,785
================================================================================
See Notes to Financial Statements. (continued)
- ------
28
Statement of Assets and Liabilities
SEPTEMBER 30, 2006 (UNAUDITED)
- --------------------------------------------------------------------------------
DIVERSIFIED BOND HIGH-YIELD
- --------------------------------------------------------------------------------
NET ASSETS CONSIST OF:
- --------------------------------------------------------------------------------
Capital paid in $707,096,589 $83,460,552
- -------------------------------------
Accumulated net realized loss
on investment transactions (12,020,357) (13,160,755)
- -------------------------------------
Net unrealized appreciation
on investments 1,194,062 425,988
- --------------------------------------------------------------------------------
$696,270,294 $70,725,785
================================================================================
INVESTOR CLASS
- --------------------------------------------------------------------------------
Net assets $295,362,342 $43,247,265
- -------------------------------------
Shares outstanding 29,566,068 6,835,640
- -------------------------------------
Net asset value per share $9.99 $6.33
- --------------------------------------------------------------------------------
INSTITUTIONAL CLASS
- --------------------------------------------------------------------------------
Net assets $385,987,214 $12,316,187
- -------------------------------------
Shares outstanding 38,637,704 1,946,690
- -------------------------------------
Net asset value per share $9.99 $6.33
- --------------------------------------------------------------------------------
ADVISOR CLASS
- --------------------------------------------------------------------------------
Net assets $4,590,166 $576,760
- -------------------------------------
Shares outstanding 459,480 91,162
- -------------------------------------
Net asset value per share $9.99 $6.33
- --------------------------------------------------------------------------------
A CLASS
- --------------------------------------------------------------------------------
Net assets $6,659,228 $11,448,183
- -------------------------------------
Shares outstanding 666,595 1,809,488
- -------------------------------------
Net asset value per share $9.99 $6.33
- -------------------------------------
Maximum offering price (net asset
value divided by 0.955) $10.46 $6.63
- --------------------------------------------------------------------------------
B CLASS
- --------------------------------------------------------------------------------
Net assets $936,745 $1,241,700
- -------------------------------------
Shares outstanding 93,769 196,263
- -------------------------------------
Net asset value per share $9.99 $6.33
- --------------------------------------------------------------------------------
C CLASS
- --------------------------------------------------------------------------------
Net assets $2,708,901 $1,869,525
- -------------------------------------
Shares outstanding 271,164 295,496
- -------------------------------------
Net asset value per share $9.99 $6.33
- --------------------------------------------------------------------------------
R CLASS
- --------------------------------------------------------------------------------
Net assets $25,698 $26,165
- -------------------------------------
Shares outstanding 2,572 4,136
- -------------------------------------
Net asset value per share $9.99 $6.33
- --------------------------------------------------------------------------------
See Notes to Financial Statements.
- ------
29
Statement of Operations
FOR THE SIX MONTHS ENDED SEPTEMBER 30, 2006 (UNAUDITED)
- ---------------------------------------------------------------------------------
DIVERSIFIED BOND HIGH-YIELD
- --------------------------------------------------------------------------------
INVESTMENT INCOME (LOSS)
- ---------------------------------------------------------------------------------
INCOME:
- --------------------------------------
Interest $17,813,216 $2,669,402
- --------------------------------------
Securities lending 63,867 14,202
- ---------------------------------------------------------------------------------
17,877,083 2,683,604
- ---------------------------------------------------------------------------------
EXPENSES:
- --------------------------------------
Management fees 1,668,387 292,993
- --------------------------------------
Distribution fees:
- --------------------------------------
Advisor Class 6,352 581
- --------------------------------------
B Class 2,979 4,370
- --------------------------------------
C Class 8,057 7,418
- --------------------------------------
Service fees:
- --------------------------------------
Advisor Class 6,352 581
- --------------------------------------
B Class 993 1,457
- --------------------------------------
C Class 2,686 2,473
- --------------------------------------
Distribution and service fees:
- --------------------------------------
A Class 8,936 13,945
- --------------------------------------
R Class 63 64
- --------------------------------------
Trustees' fees and expenses 13,147 1,355
- --------------------------------------
Other expenses 429 44
- --------------------------------------------------------------------------------
1,718,381 325,281
Amount waived -- (30,625)
- --------------------------------------------------------------------------------
1,718,381 294,656
- --------------------------------------------------------------------------------
NET INVESTMENT INCOME (LOSS) 16,158,702 2,388,948
- --------------------------------------------------------------------------------
REALIZED AND UNREALIZED GAIN (LOSS)
- --------------------------------------------------------------------------------
NET REALIZED GAIN (LOSS) ON:
- --------------------------------------
Investment transactions (4,863,041) (244,496)
- --------------------------------------
Futures and swaps transactions (530,404) (1,304)
- --------------------------------------------------------------------------------
(5,393,445) (245,800)
- --------------------------------------------------------------------------------
CHANGE IN NET UNREALIZED
APPRECIATION (DEPRECIATION) ON:
- --------------------------------------
Investments 12,000,168 (403,044)
- --------------------------------------
Futures and swaps (130,675) 30,036
- --------------------------------------------------------------------------------
11,869,493 (373,008)
- --------------------------------------------------------------------------------
NET REALIZED AND UNREALIZED GAIN (LOSS) 6,476,048 (618,808)
- --------------------------------------------------------------------------------
NET INCREASE (DECREASE) IN NET ASSETS
RESULTING FROM OPERATIONS $22,634,750 $1,770,140
================================================================================
See Notes to Financial Statements.
- ------
30
Statement of Changes in Net Assets
SIX MONTHS ENDED SEPTEMBER 30, 2006 (UNAUDITED) AND YEAR ENDED MARCH 31, 2006
- -----------------------------------------------------------------------------------------------------------
DIVERSIFIED BOND HIGH-YIELD
- -----------------------------------------------------------------------------------------------------------
INCREASE (DECREASE) IN NET ASSETS SEPT. 30, 2006 MARCH 31, 2006 SEPT. 30, 2006 MARCH 31, 2006
- -----------------------------------------------------------------------------------------------------------
OPERATIONS
- -----------------------------------------------------------------------------------------------------------
Net investment income (loss) $16,158,702 $25,984,480 $2,388,948 $4,302,756
- -----------------------------------
Net realized gain (loss) (5,393,445) (5,011,899) (245,800) (15,073)
- -----------------------------------
Change in net unrealized
appreciation (depreciation) 11,869,493 (9,619,678) (373,008) (403,901)
- -----------------------------------------------------------------------------------------------------------
Net increase (decrease)
in net assets resulting
from operations 22,634,750 11,352,903 1,770,140 3,883,782
- -----------------------------------------------------------------------------------------------------------
DISTRIBUTIONS TO SHAREHOLDERS
- -----------------------------------------------------------------------------------------------------------
From net investment income:
- -----------------------------------
Investor Class (5,940,502) (8,278,499) (1,523,557) (2,727,023)
- -----------------------------------
Institutional Class (9,825,652) (17,369,743) (389,407) (419,682)
- -----------------------------------
Advisor Class (111,697) (210,522) (15,359) (26,097)
- -----------------------------------
A Class (157,838) (236,977) (367,615) (888,500)
- -----------------------------------
B Class (14,536) (23,055) (34,011) (68,092)
- -----------------------------------
C Class (38,914) (43,329) (57,759) (172,294)
- -----------------------------------
R Class (520) (621) (814) (1,068)
- -----------------------------------------------------------------------------------------------------------
Decrease in net assets
from distributions (16,089,659) (26,162,746) (2,388,522) (4,302,756)
- -----------------------------------------------------------------------------------------------------------
CAPITAL SHARE TRANSACTIONS
- -----------------------------------------------------------------------------------------------------------
Net increase (decrease)
in net assets from
capital share transactions 9,275,236 166,070,874 4,577,713 3,061,218
- -----------------------------------------------------------------------------------------------------------
NET INCREASE (DECREASE)
IN NET ASSETS 15,820,327 151,261,031 3,959,331 2,642,244
===========================================================================================================
NET ASSETS
- -----------------------------------------------------------------------------------------------------------
Beginning of period 680,449,967 529,188,936 66,766,454 64,124,210
- -----------------------------------------------------------------------------------------------------------
End of period $696,270,294 $680,449,967 $70,725,785 $66,766,454
===========================================================================================================
See Notes to Financial Statements.
- ------
31
Notes to Financial Statements
SEPTEMBER 30, 2006 (UNAUDITED)
1. ORGANIZATION AND SUMMARY OF SIGNIFICANT ACCOUNTING POLICIES
ORGANIZATION -- American Century Investment Trust (the trust) is registered
under the Investment Company Act of 1940 (the 1940 Act) as an open-end
management investment company. Diversified Bond Fund (Diversified Bond) and
High-Yield Fund (High-Yield) (the funds) are two funds in a series issued by the
trust. The funds are diversified under the 1940 Act. Diversified Bond's
investment objective is to seek a high level of income by investing in non-money
market debt securities. High-Yield's investment objective is to seek high
current income by investing in a diversified portfolio of high-yield corporate
bonds and other debt securities. High-Yield invests primarily in lower-rated
debt securities, which are subject to greater credit risk and consequently offer
higher yields. The following is a summary of the funds' significant accounting
policies.
MULTIPLE CLASS -- The funds are authorized to issue the Investor Class, the
Institutional Class, the Advisor Class, the A Class, the B Class, the C Class
and the R Class. The A Class may incur an initial sales charge. The A Class, B
Class and C Class may be subject to a contingent deferred sales charge. The
share classes differ principally in their respective sales charges and
distribution and shareholder servicing expenses and arrangements. All shares of
the funds represent an equal pro rata interest in the net assets of the class to
which such shares belong, and have identical voting, dividend, liquidation and
other rights and the same terms and conditions, except for class specific
expenses and exclusive rights to vote on matters affecting only individual
classes. Income, non-class specific expenses, and realized and unrealized
capital gains and losses of the funds are allocated to each class of shares
based on their relative net assets. The funds are closed to new self-directed
retail investors. Sale of the R Class commenced on July 29, 2005 for the funds.
SECURITY VALUATIONS -- Debt securities maturing in greater than 60 days are
valued at current market value as provided by a commercial pricing service or at
the mean of the most recent bid and asked prices. Debt securities maturing
within 60 days may be valued at cost, plus or minus any amortized discount or
premium. Securities traded primarily on a principal securities exchange are
valued at the last reported sales price, or at the mean of the latest bid and
asked prices where no last sales price is available. Securities traded on
foreign securities exchanges and over-the-counter markets are normally completed
before the close of business on days that the New York Stock Exchange (the
Exchange) is open and may also take place on days when the Exchange is not open.
If an event occurs after the value of a security was established but before the
net asset value per share was determined that was likely to materially change
the net asset value, that security would be valued at fair value as determined
in accordance with procedures adopted by the Board of Trustees. If the funds
determine that the market price of a portfolio security is not readily
available, or that the valuation methods mentioned above do not reflect the
security's fair value, such security is valued at its fair value as determined
by, or in accordance with procedures adopted by, the Board of Trustees or its
designee if such fair value determination would materially impact a fund's net
asset value. Certain other circumstances may cause the funds to fair value a
security such as: a security has been declared in default; or trading in a
security has been halted during the trading day; or there is a foreign market
holiday and no trading will commence.
SECURITY TRANSACTIONS -- Security transactions are accounted for as of the trade
date. Net realized gains and losses are determined on the identified cost basis,
which is also used for federal income tax purposes.
INVESTMENT INCOME -- Interest income is recorded on the accrual basis and
includes paydown gain (loss) and accretion of discounts and amortization of
premiums.
SECURITIES ON LOAN -- The funds may lend portfolio securities through their
lending agent to certain approved borrowers in order to earn additional income.
The funds continue to recognize any gain or loss in the market price of the
securities loaned and record any interest earned or dividends declared.
WHEN-ISSUED AND FORWARD COMMITMENTS -- The funds may engage in securities
transactions on a when-issued or forward commitment basis. In these
transactions, the securities' prices and yields are fixed on the date of the
commitment. In a when-issued transaction, the payment and delivery are scheduled
for a future date and during this period, securities are subject to market
fluctuations. In a forward commitment transaction, the funds may sell a security
and at the same time make a commitment to purchase the same security at a future
date at a specified price. Conversely, the funds may purchase a security and at
the same time make a commitment to sell the same security at a future date at a
specified price. These types of transactions are executed simultaneously in what
are known as "roll" transactions. The funds will segregate cash, cash
equivalents or other appropriate liquid securities on their records in amounts
sufficient to meet the purchase price. The funds account for "roll" transactions
as purchases and sales; as such these transactions may increase portfolio
turnover.
(continued)
- ------
32
Notes to Financial Statements
SEPTEMBER 30, 2006 (UNAUDITED)
1. ORGANIZATION AND SUMMARY OF SIGNIFICANT ACCOUNTING POLICIES (CONTINUED)
TRACERS(SM)/TRAINS(SM) - The funds may invest in TRACERS and TRAINS which
represent ownership of a specified percentage of each security in an underlying
pool of securities. Owners are entitled to receive a pro rata share of
distributions from the underlying securities. In the event an underlying
security is downgraded by a rating agency, that portion of the investment
product will be redeemed and the underlying security will be distributed to the
owner pro rata or the owner may receive cash proceeds. The risk of owning these
products are the same as owning the individual securities, but enable each fund
to be more diversified by owning a single security.
FUTURES CONTRACTS - The funds may enter into futures contracts in order to
manage the funds' exposure to changes in market conditions. One of the risks of
entering into futures contracts is the possibility that the change in value of
the contract may not correlate with the changes in value of the underlying
securities. Upon entering into a futures contract, the funds are required to
deposit either cash or securities in an amount equal to a certain percentage of
the contract value (initial margin). Subsequent payments (variation margin) are
made or received daily, in cash, by the funds. The variation margin is equal to
the daily change in the contract value and is recorded as unrealized gains and
losses. The funds recognize a realized gain or loss when the contract is closed
or expires. Net realized and unrealized gains or losses occurring during the
holding period of futures contracts are a component of realized gain (loss) on
futures and swaps transactions and unrealized appreciation (depreciation) on
futures and swaps, respectively.
SWAP AGREEMENTS - The funds may enter into a swap agreement in order to attempt
to obtain or preserve a particular return or spread at a lower cost than
obtaining a return or spread through purchases and/or sales of instruments in
other markets; protect against currency fluctuations; attempt to manage duration
to protect against any increase in the price of securities the funds anticipate
purchasing at a later date; or gain exposure to certain markets in the most
economical way possible. A basic swap agreement is a contract in which two
parties agree to exchange the returns earned or realized on predetermined
investments or instruments. Credit default swaps enable an investor to buy/sell
protection against a credit event of a specific issuer. The seller of credit
protection against a security or basket of securities receives an up-front or
periodic payment to compensate against potential default events. The funds may
enhance returns by selling protection or attempt to mitigate credit risk by
buying protection. The funds will segregate cash, cash equivalents or other
appropriate liquid securities on their records in amounts sufficient to meet
requirements. Unrealized gains are reported as an asset and unrealized losses
are reported as a liability on the Statement of Assets and Liabilities. Swap
agreements are valued daily and changes in value, including the periodic amounts
of interest to be paid or received on swaps, are recorded as unrealized
appreciation (depreciation) on futures and swaps. Realized gain or loss is
recorded upon receipt or payment of a periodic settlement or termination of swap
agreements. The risks of entering into swap agreements include the possible lack
of liquidity, failure of the counterparty to meet its obligations, and that
there may be unfavorable changes in the underlying investments and instruments.
REPURCHASE AGREEMENTS -- The funds may enter into repurchase agreements with
institutions that American Century Investment Management, Inc. (ACIM) (the
investment advisor) has determined are creditworthy pursuant to criteria adopted
by the Board of Trustees. Each repurchase agreement is recorded at cost. Each
fund requires that the collateral, represented by securities, received in a
repurchase transaction be transferred to the custodian in a manner sufficient to
enable each fund to obtain those securities in the event of a default under the
repurchase agreement. ACIM monitors, on a daily basis, the securities
transferred to ensure the value, including accrued interest, of the securities
under each repurchase agreement is equal to or greater than amounts owed to each
fund under each repurchase agreement.
JOINT TRADING ACCOUNT -- Pursuant to an Exemptive Order issued by the Securities
and Exchange Commission, each fund, along with other registered investment
companies having management agreements with ACIM or American Century Global
Investment Management, Inc. (ACGIM), may transfer uninvested cash balances into
a joint trading account. These balances are invested in one or more repurchase
agreements that are collateralized by U.S. Treasury or Agency obligations.
INCOME TAX STATUS -- It is each fund's policy to distribute substantially all
net investment income and net realized gains to shareholders and to otherwise
qualify as a regulated investment company under provisions of the Internal
Revenue Code. Accordingly, no provision has been made for federal or state
income taxes.
DISTRIBUTIONS TO SHAREHOLDERS -- Distributions from net investment income for
the funds are declared daily and paid monthly. Distributions from net realized
gains for the funds, if any, are generally declared and paid annually.
(continued)
- ------
33
Notes to Financial Statements
SEPTEMBER 30, 2006 (UNAUDITED)
1. ORGANIZATION AND SUMMARY OF SIGNIFICANT ACCOUNTING POLICIES (CONTINUED)
INDEMNIFICATIONS - Under the trust's organizational documents, its officers and
trustees are indemnified against certain liabilities arising out of the
performance of their duties to the funds. In addition, in the normal course of
business, the funds enter into contracts that provide general indemnifications.
The funds' maximum exposure under these arrangements is unknown as this would
involve future claims that may be made against the funds. The risk of material
loss from such claims is considered by management to be remote.
USE OF ESTIMATES -- The financial statements are prepared in conformity with
accounting principles generally accepted in the United States of America, which
may require management to make certain estimates and assumptions at the date of
the financial statements. Actual results could differ from these estimates.
2. FEES AND TRANSACTIONS WITH RELATED PARTIES
MANAGEMENT FEES -- The trust has entered into a Management Agreement with ACIM,
under which ACIM provides the funds with investment advisory and management
services in exchange for a single, unified management fee (the fee) per class.
The Agreement provides that all expenses of the funds, except brokerage
commissions, taxes, interest, fees and expenses of those trustees who are not
considered "interested persons" as defined in the 1940 Act (including counsel
fees) and extraordinary expenses, will be paid by ACIM. The fee is computed and
accrued daily based on the daily net assets of each specific class of shares of
each fund and paid monthly in arrears. The fee consists of (1) an Investment
Category Fee based on the daily net assets of the funds and certain other
accounts managed by the investment advisor that are in the same broad investment
category as each fund and (2) a Complex Fee based on the assets of all the funds
in the American Century family of funds. The rates for the Investment Category
Fee range from 0.2925% to 0.4100% for Diversified Bond and from 0.5425% to
0.6600% for High-Yield. The rates for the Complex Fee (Investor, A, B, C and R
Classes) range from 0.2500% to 0.3100%. The Institutional Class is 0.2000% less
and the Advisor Class is 0.2500% less at each point within the Complex Fee
range. From July 29, 2005 through July 31, 2006, ACIM voluntarily agreed to
waive 0.095% of its management fee for High-Yield. Effective August 1, 2006,
ACIM voluntarily agreed to waive 0.071% of its management fee for High-Yield.
The total amount of the waiver for the six months ended September 30, 2006, was
$19,421, $4,771, $199, $4,855, $506, $862 and $11 for the Investor Class,
Institutional Class, Advisor Class, A Class, B Class, C Class and R Class,
respectively. The fee waiver may be revised or terminated at any time without
notice.
The effective annual management fees for the funds for the six months ended
September 30, 2006 were as follows:
- --------------------------------------------------------------------------------
INVESTOR,
A, B, C & R INSTITUTIONAL ADVISOR
- --------------------------------------------------------------------------------
Diversified Bond 0.62% 0.42% 0.37%
- --------------------------------------------------------------------------------
High-Yield (before waiver) 0.87% 0.67% 0.62%
- --------------------------------------------------------------------------------
High-Yield (after waiver) 0.78% 0.58% 0.53%
- --------------------------------------------------------------------------------
(continued)
- ------
34
Notes to Financial Statements
SEPTEMBER 30, 2006 (UNAUDITED)
2. FEES AND TRANSACTIONS WITH RELATED PARTIES (CONTINUED)
DISTRIBUTION AND SERVICE FEES -- The Board of Trustees has adopted a Master
Distribution and Shareholder Services Plan for the Advisor Class (the Advisor
Class plan) and a separate Master Distribution and Individual Shareholder
Services Plan for each of the A Class, B Class, C Class and R Class
(collectively with the Advisor Class Plan, the plans), pursuant to Rule 12b-1 of
the 1940 Act. The plans provide that the Advisor Class, B Class and C Class will
pay American Century Investment Services, Inc. (ACIS) the following annual
distribution and service fees:
- --------------------------------------------------------------------------------
ADVISOR B & C
- --------------------------------------------------------------------------------
Distribution Fee 0.25% 0.75%
- --------------------------------------------------------------------------------
Service Fee 0.25% 0.25%
- --------------------------------------------------------------------------------
The plans provide that the A Class and R Class will pay ACIS an annual
distribution and service fee of 0.25% for the A Class and 0.50% for the R Class.
The fees are computed and accrued daily based on each class's daily net assets
and paid monthly in arrears. The distribution fee provides compensation for
expenses incurred in connection with distributing shares of the classes
including, but not limited to, payments to brokers, dealers, and financial
institutions that have entered into sales agreements with respect to shares of
the funds. The service fee provides compensation for shareholder and
administrative services rendered by ACIS, its affiliates or independent third
party providers for Advisor Class shares and for individual shareholder services
rendered by broker/dealers or other independent financial intermediaries for A
Class, B Class, C Class and R Class shares. Fees incurred under the plans during
the six months ended September 30, 2006, are detailed in the Statement of
Operations.
RELATED PARTIES -- Certain officers and trustees of the trust are also officers
and/or directors, and, as a group, controlling stockholders of American Century
Companies, Inc. (ACC), the parent of the trust's investment advisor, ACIM, the
distributor of the trust, ACIS, and the trust's transfer agent, American Century
Services, LLC. American Century Asset Allocation Portfolios, Inc. (ACAAP) owns
23.8% and 41.8% of the shares of Diversified Bond and High-Yield, respectively.
ACAAP does not invest in the funds for the purpose of exercising management or
control.
The funds have a bank line of credit and securities lending agreement with
JPMorgan Chase Bank (JPMCB). JPMCB is a custodian of the funds and a wholly
owned subsidiary of J.P. Morgan Chase & Co. (JPM). JPM is an equity investor in
ACC.
3. INVESTMENT TRANSACTIONS
Investment transactions, excluding short-term investments, for the six months
ended September 30, 2006, were as follows:
DIVERSIFIED BOND HIGH-YIELD
- --------------------------------------------------------------------------------
PURCHASES
- --------------------------------------------------------------------------------
U.S. Treasury & Government
Agency Obligations $992,160,331 --
- --------------------------------------------------------------------------------
Investment securities other
than U.S. Treasury & Government
Agency Obligations $54,052,609 $15,775,643
- --------------------------------------------------------------------------------
PROCEEDS FROM SALES
- --------------------------------------------------------------------------------
U.S. Treasury & Government
Agency Obligations $991,361,021 --
- --------------------------------------------------------------------------------
Investment securities other than
U.S. Treasury & Government
Agency Obligations $62,645,735 $16,831,305
- --------------------------------------------------------------------------------
For the six months ended September 30, 2006, Diversified Bond incurred net
realized losses of $1,823,747 from a redemption in kind. A redemption in kind
occurs when a fund delivers securities from its portfolio in lieu of cash as
payment to a redeeming shareholder.
(continued)
- ------
35
Notes to Financial Statements
SEPTEMBER 30, 2006 (UNAUDITED)
4. CAPITAL SHARE TRANSACTIONS
Transactions in shares of the funds were as follows (unlimited number of shares
authorized):
- ----------------------------------------------------------------------------------------------------------
DIVERSIFIED BOND HIGH-YIELD
- ----------------------------------------------------------------------------------------------------------
SHARES AMOUNT SHARES AMOUNT
- ----------------------------------------------------------------------------------------------------------
INVESTOR CLASS
- ----------------------------------------------------------------------------------------------------------
SIX MONTHS ENDED SEPTEMBER 30, 2006
- ----------------------------------------
Sold 8,036,721 $ 79,271,852 1,961,580 $ 12,420,230
- ----------------------------------------
Issued in reinvestment of distributions 282,920 2,787,275 126,111 795,098
- ----------------------------------------
Redeemed (1,533,383) (15,062,565) (1,936,928) (12,199,841)
- ----------------------------------------------------------------------------------------------------------
Net increase (decrease) 6,786,258 $ 66,996,562 150,763 $ 1,015,487
==========================================================================================================
YEAR ENDED MARCH 31, 2006
- ----------------------------------------
Sold 7,808,708 $ 78,850,698 2,180,349 $ 13,942,540
- ----------------------------------------
Issued in reinvestment of distributions 536,988 5,426,621 279,573 1,789,818
- ----------------------------------------
Redeemed (3,422,528) (34,610,361) (2,117,976) (13,561,048)
- ----------------------------------------------------------------------------------------------------------
Net increase (decrease) 4,923,168 $ 49,666,958 341,946 $ 2,171,310
==========================================================================================================
INSTITUTIONAL CLASS
- ----------------------------------------------------------------------------------------------------------
SIX MONTHS ENDED SEPTEMBER 30, 2006
- ----------------------------------------
Sold 8,853,926 $ 86,842,637 611,522 $3,863,690
- ----------------------------------------
Issued in reinvestment of distributions 415,355 4,092,615 103 648
- ----------------------------------------
Redeemed (15,200,274) (148,717,438) (136,208) (856,454)
- ----------------------------------------------------------------------------------------------------------
Net increase (decrease) (5,930,993) $ (57,782,186) 475,417 $3,007,884
==========================================================================================================
YEAR ENDED MARCH 31, 2006
- ----------------------------------------
Sold 16,101,487 $162,621,605 1,066,108 $6,808,122
- ----------------------------------------
Issued in reinvestment of distributions 697,667 7,047,145 293 1,878
- ----------------------------------------
Redeemed (5,519,540) (55,648,083) (65,384) (417,123)
- ----------------------------------------------------------------------------------------------------------
Net increase (decrease) 11,279,614 $114,020,667 1,001,017 $6,392,877
==========================================================================================================
ADVISOR CLASS
- ----------------------------------------------------------------------------------------------------------
SIX MONTHS ENDED SEPTEMBER 30, 2006
- ----------------------------------------
Sold 62,658 $ 616,876 33,801 $212,181
- ----------------------------------------
Issued in reinvestment of distributions 9,794 96,484 1,331 8,387
- ----------------------------------------
Redeemed (183,755) (1,810,788) (7,690) (48,997)
- ----------------------------------------------------------------------------------------------------------
Net increase (decrease) (111,303) $(1,097,428) 27,442 $171,571
==========================================================================================================
YEAR ENDED MARCH 31, 2006
- ----------------------------------------
Sold 295,210 $ 2,979,735 22,380 $ 143,515
- ----------------------------------------
Issued in reinvestment of distributions 19,229 194,316 1,400 8,962
- ----------------------------------------
Redeemed (280,450) (2,830,313) (20,011) (128,011)
- ----------------------------------------------------------------------------------------------------------
Net increase (decrease) 33,989 $ 343,738 3,769 $ 24,466
==========================================================================================================
(continued)
- ------
36
Notes to Financial Statements
SEPTEMBER 30, 2006 (UNAUDITED)
4. CAPITAL SHARE TRANSACTIONS (CONTINUED)
- --------------------------------------------------------------------------------------------------
DIVERSIFIED BOND HIGH-YIELD
- --------------------------------------------------------------------------------------------------
SHARES AMOUNT SHARES AMOUNT
- --------------------------------------------------------------------------------------------------
A CLASS
- --------------------------------------------------------------------------------------------------
SIX MONTHS ENDED SEPTEMBER 30, 2006
- ----------------------------------------
Sold 161,888 $ 1,590,895 324,260 $ 2,044,424
- ----------------------------------------
Issued in reinvestment of distributions 13,892 136,844 50,787 320,220
- ----------------------------------------
Redeemed (210,471) (2,076,928) (335,526) (2,115,853)
- --------------------------------------------------------------------------------------------------
Net increase (decrease) (34,691) $ (349,189) 39,521 $ 248,791
==================================================================================================
YEAR ENDED MARCH 31, 2006
- ----------------------------------------
Sold 374,541 $ 3,796,765 557,021 $ 3,569,732
- ----------------------------------------
Issued in reinvestment of distributions 20,028 201,978 124,590 797,794
- ----------------------------------------
Redeemed (192,740) (1,946,128) (1,327,233) (8,503,116)
- --------------------------------------------------------------------------------------------------
Net increase (decrease) 201,829 $ 2,052,615 (645,622) $(4,135,590)
==================================================================================================
B CLASS
- --------------------------------------------------------------------------------------------------
SIX MONTHS ENDED SEPTEMBER 30, 2006
- ----------------------------------------
Sold 21,333 $210,187 14,060 $ 88,475
- ----------------------------------------
Issued in reinvestment of distributions 1,117 11,008 3,020 19,042
- ----------------------------------------
Redeemed (4,512) (44,306) (6,039) (38,254)
- --------------------------------------------------------------------------------------------------
Net increase (decrease) 17,938 $176,889 11,041 $ 69,263
==================================================================================================
YEAR ENDED MARCH 31, 2006
- ----------------------------------------
Sold 15,070 $ 152,344 32,108 $ 205,702
- ----------------------------------------
Issued in reinvestment of distributions 1,836 18,547 6,435 41,186
- ----------------------------------------
Redeemed (15,588) (157,463) (25,271) (161,726)
- --------------------------------------------------------------------------------------------------
Net increase (decrease) 1,318 $ 13,428 13,272 $ 85,162
==================================================================================================
C CLASS
- --------------------------------------------------------------------------------------------------
SIX MONTHS ENDED SEPTEMBER 30, 2006
- ---------------------------------
Sold 185,137 $1,812,358 79,192 $ 500,042
- ----------------------------------------
Issued in reinvestment of distributions 2,961 29,223 3,104 19,573
- ----------------------------------------
Redeemed (51,924) (511,510) (72,538) (455,707)
- --------------------------------------------------------------------------------------------------
Net increase (decrease) 136,174 $1,330,071 9,758 $ 63,908
==================================================================================================
YEAR ENDED MARCH 31, 2006
- ---------------------------------
Sold 60,295 $ 610,099 84,511 $ 542,886
- ----------------------------------------
Issued in reinvestment of distributions 2,887 29,170 7,368 47,183
- ----------------------------------------
Redeemed (68,596) (691,426) (327,746) (2,093,146)
- --------------------------------------------------------------------------------------------------
Net increase (decrease) (5,414) $ (52,157) (235,867) $(1,503,077)
==================================================================================================
R CLASS
- --------------------------------------------------------------------------------------------------
SIX MONTHS ENDED SEPTEMBER 30, 2006
- ----------------------------------------
Issued in reinvestment of distributions 52 $517 129 $809
==================================================================================================
PERIOD ENDED MARCH 31, 2006(1)
- ----------------------------------------
Sold 2,458 $25,005 3,840 $25,003
- ----------------------------------------
Issued in reinvestment of distributions 62 620 167 1,067
- --------------------------------------------------------------------------------------------------
Net increase (decrease) 2,520 $25,625 4,007 $26,070
==================================================================================================
(1) July 29, 2005 (commencement of sale) through March 31, 2006.
(continued)
- ------
36
Notes to Financial Statements
SEPTEMBER 30, 2006 (UNAUDITED)
5. SECURITIES LENDING
As of September 30, 2006, securities in Diversified Bond and High-Yield valued
at $89,432,626 and $17,233,110, respectively, were on loan through the lending
agent, JPMCB, to certain approved borrowers. JPMCB receives and maintains
collateral in the form of cash, and/or acceptable securities as approved by
ACIM. Cash collateral is invested in authorized investments by the lending agent
in a pooled account. The value of cash collateral received at period end is
disclosed in the Statement of Assets and Liabilities and investments made with
the cash by the lending agent are listed in the Schedule of Investments. Any
deficiencies or excess of collateral must be delivered or transferred by the
member firms no later than the close of business on the next business day. The
total value of all collateral received, at this date, was $90,988,658 and
$17,446,018, respectively. The funds' risks in securities lending are that the
borrower may not provide additional collateral when required or return the
securities when due. If the borrower defaults, receipt of the collateral by the
funds may be delayed or limited.
6. BANK LINE OF CREDIT
The funds, along with certain other funds managed by ACIM or ACGIM, have a
$500,000,000 unsecured bank line of credit agreement with JPMCB. The funds may
borrow money for temporary or emergency purposes to fund shareholder
redemptions. Borrowings under the agreement bear interest at the Federal Funds
rate plus 0.50%. The funds did not borrow from the line during the six months
ended September 30, 2006.
7. RISK FACTORS
High-Yield invests primarily in lower-rated debt securities, which are subject
to substantial risks including price volatility, liquidity risk, and default
risk.
8. FEDERAL TAX INFORMATION
The book-basis character of distributions made during the year from net
investment income or net realized gains may differ from their ultimate
characterization for federal income tax purposes. These differences reflect the
differing character of paydown losses, certain income items and net realized
gains and losses for financial statement and tax purposes, and may result in
reclassification among certain capital accounts on the financial statements.
Reclassifications between income and realized gain in Diversified Bond relate
primarily to the character of paydown losses and interest on swap agreements.
As of September 30, 2006, the components of investments for federal income tax
purposes were as follows:
- --------------------------------------------------------------------------------
DIVERSIFIED BOND HIGH-YIELD
- --------------------------------------------------------------------------------
Federal tax cost of investments $930,082,881
$87,466,528
================================================================================
Gross tax appreciation of investments $5,050,903 $1,226,238
- ----------------------------------------
Gross tax depreciation of investments (3,822,695) (830,682)
- --------------------------------------------------------------------------------
Net tax appreciation
(depreciation) of investments $1,228,208 $395,556
================================================================================
(continued)
- ------
38
Notes to Financial Statements
SEPTEMBER 30, 2006 (UNAUDITED)
8. FEDERAL TAX INFORMATION (CONTINUED)
The difference between book-basis and tax-basis cost and unrealized appreciation
(depreciation) is attributable primarily to the tax deferral of losses on wash
sales.
As of March 31, 2006, Diversified Bond had net capital loss carryovers of
$1,154,158 and $591,687 expiring in 2013 and 2014, respectively. High-Yield had
net capital loss carryovers of $2,609,243, $10,290,678 and $15,064 expiring in
2009, 2010 and 2014, respectively. The net capital loss carryovers may be used
to offset future realized capital gains for federal income tax purposes.
As of March 31, 2006, Diversified Bond had capital loss deferrals of $4,860,978,
which represent net capital losses incurred in the five-month period ended March
31, 2006. The fund has elected to treat such losses as having been incurred in
the following fiscal year for federal income tax purposes.
9. RECENTLY ISSUED ACCOUNTING STANDARDS
In June 2006, the Financial Accounting Standards Board (FASB) issued
Interpretation No. 48, "Accounting for Uncertainty in Income Taxes -- an
Interpretation of FASB Statement No. 109" (FIN 48). FIN 48 establishes a minimum
threshold for financial statement recognition of the benefit of positions taken
in filing tax returns (including whether an entity is taxable in a particular
jurisdiction), and requires certain expanded tax disclosures. FIN 48 is
effective for fiscal years beginning after December 15, 2006, and is to be
applied to all open tax years as of the date of effectiveness. The FASB issued
Statement of Financial Accounting Standards No. 157, "Fair Value Measurements"
(FAS 157), in September 2006, which is effective for fiscal years beginning
after November 15, 2007. FAS 157 defines fair value, establishes a framework for
measuring fair value and expands the required financial statement disclosures
about fair value measurements. Management is currently evaluating the impact of
adopting FIN 48 and FAS 157.
- ------
39
Diversified Bond - Financial Highlights
For a Share Outstanding Throughout the Years Ended March 31 (except as noted)
- ------------------------------------------------------------------------------------------------------------
INVESTOR CLASS
- ------------------------------------------------------------------------------------------------------------
2006(1) 2006 2005 2004 2003 2002(2)
- ------------------------------------------------------------------------------------------------------------
PER-SHARE DATA
- ------------------------------------------------------------------------------------------------------------
Net Asset Value, Beginning of Period $9.89 $10.10 $10.49 $10.47 $9.98 $10.25
- ------------------------------------------------------------------------------------------------------------
Income From Investment Operations
- ----------------------------------------
Net Investment Income (Loss) 0.23(3) 0.41(3) 0.33(3) 0.36(3) 0.48 0.17
- ----------------------------------------
Net Realized and Unrealized
Gain (Loss) 0.10 (0.21) (0.27) 0.14 0.49 (0.27)
- ------------------------------------------------------------------------------------------------------------
Total From Investment Operations 0.33 0.20 0.06 0.50 0.97 (0.10)
- ------------------------------------------------------------------------------------------------------------
Distributions
- ----------------------------------------
From Net Investment Income (0.23) (0.41) (0.34) (0.37) (0.48) (0.17)
- ----------------------------------------
From Net Realized Gains -- -- (0.11) (0.11) -- --
- ------------------------------------------------------------------------------------------------------------
Total Distributions (0.23) (0.41) (0.45) (0.48) (0.48) (0.17)
- ------------------------------------------------------------------------------------------------------------
Net Asset Value, End of Period $9.99 $9.89 $10.10 $10.49 $10.47 $9.98
============================================================================================================
TOTAL RETURN(4) 3.38% 1.97% 0.63% 4.92% 9.93% (0.99)%
RATIOS/SUPPLEMENTAL DATA
- ------------------------------------------------------------------------------------------------------------
Ratio of Operating Expenses
to Average Net Assets 0.62%(5) 0.62% 0.63% 0.64% 0.64% 0.63%(5)
- ----------------------------------------
Ratio of Net Investment Income (Loss)
to Average Net Assets 4.66%(5) 4.04% 3.25% 3.38% 4.67% 5.19%(5)
- ----------------------------------------
Portfolio Turnover Rate 167% 341% 386% 324% 151% 136%(6)
- ----------------------------------------
Net Assets, End of Period (in thousands) $295,362 $225,187 $180,346 $177,791 $198,835 $170,707
- ------------------------------------------------------------------------------------------------------------
(1) Six months ended September 30, 2006 (unaudited).
(2) December 3, 2001 (acquisition date) through March 31, 2002.
(3) Computed using average shares outstanding throughout the period.
(4) Total return assumes reinvestment of net investment income and capital
gains distributions, if any. Total returns for periods less than one year
are not annualized. The total return of the classes may not precisely
reflect the class expense differences because of the impact of calculating
the net asset values to two decimal places. If net asset values were
calculated to three decimal places, the total return differences would more
closely reflect the class expense differences. The calculation of net asset
values to two decimal places is made in accordance with SEC guidelines and
does not result in any gain or loss of value between one class and another.
(5) Annualized.
(6) Portfolio turnover is calculated at the fund level. Percentage indicated
was calculated for the year ended March 31, 2002.
See Notes to Financial Statements.
- ------
40
Diversified Bond - Financial Highlights
For a Share Outstanding Throughout the Years Ended March 31 (except as noted)
- -----------------------------------------------------------------------------------------------------------
INSTITUTIONAL CLASS
- -----------------------------------------------------------------------------------------------------------
2006(1) 2006 2005 2004 2003 2002
- -----------------------------------------------------------------------------------------------------------
PER-SHARE DATA
- -----------------------------------------------------------------------------------------------------------
Net Asset Value, Beginning of Period $9.89 $10.10 $10.49 $10.47 $9.98 $10.12
- -----------------------------------------------------------------------------------------------------------
Income From Investment Operations
- ----------------------------------------
Net Investment Income (Loss) 0.24(2) 0.43(2) 0.35(2) 0.38(2) 0.50 0.56
- ----------------------------------------
Net Realized and Unrealized
Gain (Loss) 0.10 (0.21) (0.27) 0.14 0.49 (0.09)
- -----------------------------------------------------------------------------------------------------------
Total From Investment Operations 0.34 0.22 0.08 0.52 0.99 0.47
- -----------------------------------------------------------------------------------------------------------
Distributions
- ----------------------------------------
From Net Investment Income (0.24) (0.43) (0.36) (0.39) (0.50) (0.56)
- ----------------------------------------
From Net Realized Gains -- -- (0.11) (0.11) -- (0.05)
- -----------------------------------------------------------------------------------------------------------
Total Distributions (0.24) (0.43) (0.47) (0.50) (0.50) (0.61)
- -----------------------------------------------------------------------------------------------------------
Net Asset Value, End of Period $9.99 $9.89 $10.10 $10.49 $10.47 $9.98
===========================================================================================================
TOTAL RETURN(3) 3.49% 2.17% 0.83% 5.13% 10.15% 4.76%
RATIOS/SUPPLEMENTAL DATA
- -----------------------------------------------------------------------------------------------------------
Ratio of Operating Expenses
to Average Net Assets 0.42%(4) 0.42% 0.43% 0.44% 0.44% 0.44%
- ----------------------------------------
Ratio of Net Investment Income (Loss)
to Average Net Assets 4.86%(4) 4.24% 3.45% 3.58% 4.87% 5.46%
- ----------------------------------------
Portfolio Turnover Rate 167% 341% 386% 324% 151% 136%
- ----------------------------------------
Net Assets, End of Period (in thousands) $385,987 $440,579 $336,207 $309,579 $281,998 $202,476
- -----------------------------------------------------------------------------------------------------------
(1) Six months ended September 30, 2006 (unaudited).
(2) Computed using average shares outstanding throughout the period.
(3) Total return assumes reinvestment of net investment income and capital
gains distributions, if any. Total returns for periods less than one year
are not annualized. The total return of the classes may not precisely
reflect the class expense differences because of the impact of calculating
the net asset values to two decimal places. If net asset values were
calculated to three decimal places, the total return differences would more
closely reflect the class expense differences. The calculation of net asset
values to two decimal places is made in accordance with SEC guidelines and
does not result in any gain or loss of value between one class and another.
(4) Annualized.
See Notes to Financial Statements.
- ------
41
Diversified Bond - Financial Highlights
For a Share Outstanding Throughout the Years Ended March 31 (except as noted)
- ----------------------------------------------------------------------------------------------------------
ADVISOR CLASS
- ----------------------------------------------------------------------------------------------------------
2006(1) 2006 2005 2004 2003 2002(2)
- ----------------------------------------------------------------------------------------------------------
PER-SHARE DATA
- ----------------------------------------------------------------------------------------------------------
Net Asset Value, Beginning of Period $9.89 $10.10 $10.49 $10.47 $9.98 $10.25
- ----------------------------------------------------------------------------------------------------------
Income From Investment Operations
- ----------------------------------------
Net Investment Income (Loss) 0.22(3) 0.38(3) 0.31(3) 0.33(3) 0.46 0.16
- ----------------------------------------
Net Realized and Unrealized
Gain (Loss) 0.10 (0.21) (0.28) 0.14 0.49 (0.27)
- ----------------------------------------------------------------------------------------------------------
Total From Investment Operations 0.32 0.17 0.03 0.47 0.95 (0.11)
- ----------------------------------------------------------------------------------------------------------
Distributions
- ----------------------------------------
From Net Investment Income (0.22) (0.38) (0.31) (0.34) (0.46) (0.16)
- ----------------------------------------
From Net Realized Gains -- -- (0.11) (0.11) -- --
- ----------------------------------------------------------------------------------------------------------
Total Distributions (0.22) (0.38) (0.42) (0.45) (0.46) (0.16)
- ----------------------------------------------------------------------------------------------------------
Net Asset Value, End of Period $9.99 $9.89 $10.10 $10.49 $10.47 $9.98
==========================================================================================================
TOTAL RETURN(4) 3.25% 1.72% 0.38% 4.66% 9.66% (1.07)%
RATIOS/SUPPLEMENTAL DATA
- ----------------------------------------------------------------------------------------------------------
Ratio of Operating Expenses
to Average Net Assets 0.87%(5) 0.87% 0.88% 0.89% 0.89% 0.88%(5)
- ----------------------------------------
Ratio of Net Investment Income (Loss)
to Average Net Assets 4.41%(5) 3.79% 3.00% 3.13% 4.42% 4.94%(5)
- ----------------------------------------
Portfolio Turnover Rate 167% 341% 386% 324% 151% 136%(6)
- ----------------------------------------
Net Assets, End of Period (in thousands) $4,590 $5,642 $5,421 $7,107 $11,567 $10,291
- ----------------------------------------------------------------------------------------------------------
(1) Six months ended September 30, 2006 (unaudited).
(2) December 3, 2001 (acquisition date) through March 31, 2002.
(3) Computed using average shares outstanding throughout the period.
(4) Total return assumes reinvestment of net investment income and capital
gains distributions, if any. Total returns for periods less than one year
are not annualized. The total return of the classes may not precisely
reflect the class expense differences because of the impact of calculating
the net asset values to two decimal places. If net asset values were
calculated to three decimal places, the total return differences would more
closely reflect the class expense differences. The calculation of net asset
values to two decimal places is made in accordance with SEC guidelines and
does not result in any gain or loss of value between one class and another.
(5) Annualized.
(6) Portfolio turnover is calculated at the fund level. Percentage indicated
was calculated for the year ended March 31, 2002.
See Notes to Financial Statements.
- ------
42
Diversified Bond - Financial Highlights
For a Share Outstanding Throughout the Years Ended March 31 (except as noted)
- ---------------------------------------------------------------------------------------------------
A CLASS
- ---------------------------------------------------------------------------------------------------
2006(1) 2006 2005 2004 2003(2)
- ---------------------------------------------------------------------------------------------------
PER-SHARE DATA
- ---------------------------------------------------------------------------------------------------
Net Asset Value, Beginning of Period $9.89 $10.10 $10.49 $10.47 $10.40
- ---------------------------------------------------------------------------------------------------
Income From Investment Operations
- ----------------------------------------
Net Investment Income (Loss) 0.22(3) 0.39(3) 0.31(3) 0.33(3) 0.06
- ----------------------------------------
Net Realized and Unrealized Gain (Loss) 0.10 (0.22) (0.28) 0.14 0.07
- ---------------------------------------------------------------------------------------------------
Total From Investment Operations 0.32 0.17 0.03 0.47 0.13
- ---------------------------------------------------------------------------------------------------
Distributions
- ----------------------------------------
From Net Investment Income (0.22) (0.38) (0.31) (0.34) (0.06)
- ----------------------------------------
From Net Realized Gains -- -- (0.11) (0.11) --
- ---------------------------------------------------------------------------------------------------
Total Distributions (0.22) (0.38) (0.42) (0.45) (0.06)
- ---------------------------------------------------------------------------------------------------
Net Asset Value, End of Period $9.99 $9.89 $10.10 $10.49 $10.47
===================================================================================================
TOTAL RETURN(4) 3.26% 1.72% 0.38% 4.65% 1.27%
RATIOS/SUPPLEMENTAL DATA
- ---------------------------------------------------------------------------------------------------
Ratio of Operating Expenses
to Average Net Assets 0.87%(5) 0.87% 0.88% 0.89% 0.88%(5)
- ----------------------------------------
Ratio of Net Investment Income (Loss)
to Average Net Assets 4.41%(5) 3.79% 3.00% 3.13% 3.69%(5)
- ----------------------------------------
Portfolio Turnover Rate 167% 341% 386% 324% 151%(6)
- ----------------------------------------
Net Assets, End of Period (in thousands) $6,659 $6,932 $5,044 $3,625 $294
- ---------------------------------------------------------------------------------------------------
(1) Six months ended September 30, 2006 (unaudited).
(2) January 31, 2003 (commencement of sale) through March 31, 2003.
(3) Computed using average shares outstanding throughout the period.
(4) Total return assumes reinvestment of net investment income and capital
gains distributions, if any, and does not reflect applicable sales charges.
Total returns for periods less than one year are not annualized. The total
return of the classes may not precisely reflect the class expense
differences because of the impact of calculating the net asset values to
two decimal places. If net asset values were calculated to three decimal
places, the total return differences would more closely reflect the class
expense differences. The calculation of net asset values to two decimal
places is made in accordance with SEC guidelines and does not result in
any gain or loss of value between one class and another.
(5) Annualized.
(6) Portfolio turnover is calculated at the fund level. Percentage indicated
was calculated for the year ended March 31, 2003.
See Notes to Financial Statements.
- ------
43
Diversified Bond - Financial Highlights
For a Share Outstanding Throughout the Years Ended March 31 (except as noted)
- ---------------------------------------------------------------------------------------------------------
B CLASS
- ---------------------------------------------------------------------------------------------------------
2006(1) 2006 2005 2004 2003(2)
- ---------------------------------------------------------------------------------------------------------
PER-SHARE DATA
- ---------------------------------------------------------------------------------------------------------
Net Asset Value, Beginning of Period $9.89 $10.10 $10.49 $10.47 $10.40
- ---------------------------------------------------------------------------------------------------------
Income From Investment Operations
- -----------------------------------------
Net Investment Income (Loss) 0.18(3) 0.31(3) 0.23(3) 0.26(3) 0.05
- -----------------------------------------
Net Realized and Unrealized Gain (Loss) 0.10 (0.21) (0.27) 0.14 0.07
- ---------------------------------------------------------------------------------------------------------
Total From Investment Operations 0.28 0.10 (0.04) 0.40 0.12
- ---------------------------------------------------------------------------------------------------------
Distributions
- -----------------------------------------
From Net Investment Income (0.18) (0.31) (0.24) (0.27) (0.05)
- -----------------------------------------
From Net Realized Gains -- -- (0.11) (0.11) --
- ---------------------------------------------------------------------------------------------------------
Total Distributions (0.18) (0.31) (0.35) (0.38) (0.05)
- ---------------------------------------------------------------------------------------------------------
Net Asset Value, End of Period $9.99 $9.89 $10.10 $10.49 $10.47
=========================================================================================================
TOTAL RETURN(4) 2.87% 0.96% (0.37)% 3.87% 1.20%
RATIOS/SUPPLEMENTAL DATA
- ---------------------------------------------------------------------------------------------------------
Ratio of Operating Expenses
to Average Net Assets 1.62%(5) 1.62% 1.63% 1.64% 1.61%(5)
- -----------------------------------------
Ratio of Operating Expenses
to Average Net Assets
(Before Expense Waiver) 1.62%(5) 1.62% 1.63% 1.64% 1.63%(5)(6)
- -----------------------------------------
Ratio of Net Investment
Income (Loss) to
Average Net Assets 3.66%(5) 3.04% 2.25% 2.38% 2.98%(5)
- -----------------------------------------
Ratio of Net Investment
Income (Loss) to Average
Net Assets (Before Expense Waiver) 3.66%(5) 3.04% 2.25% 2.38% 2.96%(5)(6)
- -----------------------------------------
Portfolio Turnover Rate 167% 341% 386% 324% 151%(7)
- -----------------------------------------
Net Assets, End of Period (in thousands) $937 $750 $753 $615 $84
- ---------------------------------------------------------------------------------------------------------
(1) Six months ended September 30, 2006 (unaudited).
(2) January 31, 2003 (commencement of sale) through March 31, 2003.
(3) Computed using average shares outstanding throughout the period.
(4) Total return assumes reinvestment of net investment income and capital
gains distributions, if any, and does not reflect applicable sales charges.
Total returns for periods less than one year are not annualized. The total
return of the classes may not precisely reflect the class expense
differences because of the impact of calculating the net asset values to
two decimal places. If net asset values were calculated to three decimal
places, the total return differences would more closely reflect the class
expense differences. The calculation of net asset values to two decimal
places is made in accordance with SEC guidelines and does not result in
any gain or loss of value between one class and another.
(5) Annualized.
(6) During the period ended March 31, 2003, the distributor volunatarily waived
a portion of the distribution and service fees.
(7) Portfolio turnover is calculated at the fund level. Percentage indicated
was calculated for the year ended March 31, 2003.
See Notes to Financial Statements.
- ------
44
Diversified Bond - Financial Highlights
For a Share Outstanding Throughout the Years Ended March 31 (except as noted)
- ----------------------------------------------------------------------------------------------------
C CLASS
- ----------------------------------------------------------------------------------------------------
2006(1) 2006 2005 2004 2003(2)
- ----------------------------------------------------------------------------------------------------
PER-SHARE DATA
- ----------------------------------------------------------------------------------------------------
Net Asset Value, Beginning of Period $9.89 $10.10 $10.49 $10.47 $10.40
- ----------------------------------------------------------------------------------------------------
Income From Investment Operations
- ------------------------------------------
Net Investment Income (Loss) 0.18(3) 0.31(3) 0.23(3) 0.28(3) 0.05
- ------------------------------------------
Net Realized and Unrealized Gain (Loss) 0.10 (0.21) (0.27) 0.14 0.07
- ----------------------------------------------------------------------------------------------------
Total From Investment Operations 0.28 0.10 (0.04) 0.42 0.12
- ----------------------------------------------------------------------------------------------------
Distributions
- ------------------------------------------
From Net Investment Income (0.18) (0.31) (0.24) (0.29) (0.05)
- ------------------------------------------
From Net Realized Gains -- -- (0.11) (0.11) --
- ----------------------------------------------------------------------------------------------------
Total Distributions (0.18) (0.31) (0.35) (0.40) (0.05)
- ----------------------------------------------------------------------------------------------------
Net Asset Value, End of Period $9.99 $9.89 $10.10 $10.49 $10.47
====================================================================================================
TOTAL RETURN(4) 2.86% 0.96% (0.37)% 4.07% 1.20%
RATIOS/SUPPLEMENTAL DATA
- ----------------------------------------------------------------------------------------------------
Ratio of Operating Expenses
to Average Net Assets 1.62%(5) 1.62% 1.63% 1.47% 1.38%(5)
- ------------------------------------------
Ratio of Net Investment Income (Loss)
to Average Net Assets 3.66%(5) 3.04% 2.25% 2.55% 3.23%(5)
- ------------------------------------------
Portfolio Turnover Rate 167% 341% 386% 324% 151%(6)
- ------------------------------------------
Net Assets, End of Period (in thousands) $2,709 $1,334 $1,418 $1,347 $342
- ----------------------------------------------------------------------------------------------------
(1) Six months ended September 30, 2006 (unaudited).
(2) January 31, 2003 (commencement of sale) through March 31, 2003.
(3) Computed using average shares outstanding throughout the period.
(4) Total return assumes reinvestment of net investment income and capital
gains distributions, if any, and does not reflect applicable sales charges.
Total returns for periods less than one year are not annualized. The total
return of the classes may not precisely reflect the class expense
differences because of the impact of calculating the net asset value to two
decimal places. If net asset values were calculated to three decimal
places, the total return differences would more closely reflect the class
expense differences. The calculation of net asset values to two decimal
places is made in accordance with SEC guidelines and does not result in any
gain or loss of value between one class and another.
(5) Annualized.
(6) Portfolio turnover is calculated at the fund level. Percentage indicated
was calculated for the year ended March 31, 2003.
See Notes to Financial Statements.
- ------
45
Diversified Bond - Financial Highlights
For a Share Outstanding Throughout the Periods Indicated
- --------------------------------------------------------------------------------
R CLASS
- --------------------------------------------------------------------------------
2006(1) 2006(2)
- --------------------------------------------------------------------------------
PER-SHARE DATA
- --------------------------------------------------------------------------------
Net Asset Value, Beginning of Period $9.89 $10.17
- --------------------------------------------------------------------------------
Income From Investment Operations
- --------------------------------------------
Net Investment Income (Loss)(3) 0.20 0.25
- --------------------------------------------
Net Realized and Unrealized Gain (Loss) 0.10 (0.28)
- --------------------------------------------------------------------------------
Total From Investment Operations 0.30 (0.03)
- --------------------------------------------------------------------------------
Distributions
- --------------------------------------------
From Net Investment Income (0.20) (0.25)
- --------------------------------------------------------------------------------
Net Asset Value, End of Period $9.99 $9.89
================================================================================
TOTAL RETURN(4) 3.12% (0.33)%
RATIOS/SUPPLEMENTAL DATA
- --------------------------------------------------------------------------------
Ratio of Operating Expenses
to Average Net Assets 1.12%(5) 1.12%(5)
- --------------------------------------------
Ratio of Net Investment Income (Loss)
to Average Net Assets 4.16%(5) 3.68%(5)
- --------------------------------------------
Portfolio Turnover Rate 167% 341%(6)
- --------------------------------------------
Net Assets, End of Period (in thousands) $26 $25
- --------------------------------------------------------------------------------
(1) Six months ended September 30, 2006 (unaudited).
(2) July 29, 2005 (commencement of sale) through March 31, 2006.
(3) Computed using average shares outstanding throughout the period.
(4) Total return assumes reinvestment of net investment income and capital
gains distributions, if any. Total returns for periods less than one year
are not annualized. The total return of the classes may not precisely
reflect the class expense differences because of the impact of calculating
the net asset values to two decimal places. If net asset values were
calculated to three decimal places, the total return differences would more
closely reflect the class expense differences. The calculation of net asset
values to two decimal places is made in accordance with SEC guidelines and
does not result in any gain or loss of value between one class and another.
(5) Annualized.
(6) Portfolio turnover is calculated at the fund level. Percentage indicated
was calculated for the year ended March 31, 2006.
See Notes to Financial Statements.
- ------
46
High-Yield - Financial Highlights
For a Share Outstanding Throughout the Years Ended March 31 (except as noted)
- ----------------------------------------------------------------------------------------------------
INVESTOR CLASS
- ----------------------------------------------------------------------------------------------------
2006(1) 2006 2005 2004 2003(2) 2002 2001
- ----------------------------------------------------------------------------------------------------
PER-SHARE DATA
- ----------------------------------------------------------------------------------------------------
Net Asset Value,
Beginning of Period $6.38 $6.42 $6.55 $6.13 $5.76 $6.18 $7.20
- ----------------------------------------------------------------------------------------------------
Income From
Investment Operations
- ---------------------------
Net Investment
Income (Loss) 0.22 0.43 0.46 0.50 0.18 0.52 0.74
- ---------------------------
Net Realized and
Unrealized Gain (Loss) (0.05) (0.04) (0.13) 0.42 0.37 (0.42) (0.97)
- ----------------------------------------------------------------------------------------------------
Total From
Investment Operations 0.17 0.39 0.33 0.92 0.55 0.10 (0.23)
- ----------------------------------------------------------------------------------------------------
Distributions
- ---------------------------
From Net
Investment Income (0.22) (0.43) (0.46) (0.50) (0.18) (0.52) (0.79)
- ----------------------------------------------------------------------------------------------------
Net Asset Value,
End of Period $6.33 $6.38 $6.42 $6.55 $6.13 $5.76 $6.18
====================================================================================================
TOTAL RETURN(3) 2.67% 6.29% 5.17% 15.53% 9.61% 1.43% (3.56)%
RATIOS/SUPPLEMENTAL DATA
- ----------------------------------------------------------------------------------------------------
Ratio of Operating
Expenses to Average
Net Assets 0.78%(4)(5) 0.81%(4) 0.88% 0.89% 0.88%(5) 0.90% 0.90%
- ---------------------------
Ratio of Operating
Expenses to Average
Net Assets (Before
Expense Waiver) 0.87%(5) 0.87% 0.88% 0.89% 0.88%(5) 0.90% 0.90%
- ---------------------------
Ratio of Net Investment
Income (Loss) to
Average Net Assets 6.84%(4)(5) 6.74%(4) 7.04% 7.82% 7.22%(5) 8.37% 10.88%
- ---------------------------
Ratio of Net Investment
Income (Loss) to Average
Net Assets (Before
Expense Waiver) 6.75%(5) 6.68% 7.04% 7.82% 7.22%(5) 8.37% 10.88%
- ---------------------------
Portfolio Turnover Rate 25% 40% 64% 80% 9% 80% 131%
- ---------------------------
Net Assets, End of Period
(in thousands) $43,247 $42,650 $40,746 $54,074 $78,223 $50,287 $34,150
- ----------------------------------------------------------------------------------------------------
(1) Six months ended September 30, 2006 (unaudited).
(2) November 1, 2002 through March 31, 2003. The fund's fiscal year was changed
from October 31 to March 31, resulting in a five-month annual reporting
period. For the years before 2003, the fund's fiscal year end was October
31.
(3) Total return assumes reinvestment of net investment income and capital
gains distributions, if any. Total returns for periods less than one year
are not annualized. The total return of the classes may not precisely
reflect the class expense differences because of the impact of calculating
the net asset values to two decimal places. If net asset values were
calculated to three decimal places, the total return differences would more
closely reflect the class expense differences. The calculation of net asset
values to two decimal places is made in accordance with SEC guidelines and
does not result in any gain or loss of value between one class and another.
(4) Effective July 29, 2005, the investment advisor voluntarily agreed to waive
a portion of the management fee.
(5) Annualized.
See Notes to Financial Statements.
- ------
47
High-Yield - Financial Highlights
For a Share Outstanding Throughout the Years Ended March 31 (except as noted)
- --------------------------------------------------------------------------------
INSTITUTIONAL CLASS
- --------------------------------------------------------------------------------
2006(1) 2006 2005(2)
- --------------------------------------------------------------------------------
PER-SHARE DATA
- --------------------------------------------------------------------------------
Net Asset Value, Beginning of Period $6.38 $6.42 $6.43
- --------------------------------------------------------------------------------
Income From Investment Operations
- -----------------------------------------
Net Investment Income (Loss) 0.22 0.44 0.30
- -----------------------------------------
Net Realized and Unrealized Gain (Loss) (0.05) (0.04) (0.01)
- --------------------------------------------------------------------------------
Total From Investment Operations 0.17 0.40 0.29
- --------------------------------------------------------------------------------
Distributions
- -----------------------------------------
From Net Investment Income (0.22) (0.44) (0.30)
- --------------------------------------------------------------------------------
Net Asset Value, End of Period $6.33 $6.38 $6.42
================================================================================
TOTAL RETURN(3) 2.77% 6.50% 4.53%
RATIOS/SUPPLEMENTAL DATA
- --------------------------------------------------------------------------------
Ratio of Operating Expenses
to Average Net Assets 0.58%(4)(5) 0.61%(4) 0.68%(5)
- -----------------------------------------
Ratio of Operating Expenses
to Average Net Assets
(Before Expense Waiver) 0.67%(5) 0.67% 0.68%(5)
- -----------------------------------------
Ratio of Net Investment
Income (Loss) to Average Net Assets 7.04%(4)(5) 6.94%(4) 4.37%(5)
- -----------------------------------------
Ratio of Net Investment
Income (Loss) to Average Net Assets
(Before Expense Waiver) 6.95%(5) 6.88% 4.37%(5)
- -----------------------------------------
Portfolio Turnover Rate 25% 40% 64%(6)
- -----------------------------------------
Net Assets, End of Period (in thousands) $12,316 $9,387 $3,021
- --------------------------------------------------------------------------------
(1) Six months ended September 30, 2006 (unaudited).
(2) August 2, 2004 (commencement of sale) through March 31, 2005.
(3) Total return assumes reinvestment of net investment income and capital
gains distributions, if any. Total returns for periods less than one year
are not annualized. The total return of the classes may not precisely
reflect the class expense differences because of the impact of calculating
the net asset values to two decimal places. If net asset values were
calculated to three decimal places, the total return differences would more
closely reflect the class expense differences. The calculation of net asset
values to two decimal places is made in accordance with SEC guidelines and
does not result in any gain or loss of value between one class and another.
(4) Effective July 29, 2005, the investment advisor voluntarily agreed to waive
a portion of the management fee.
(5) Annualized.
(6) Portfolio turnover is calculated at the fund level. Percentage indicated
was calculated for the year ended March 31, 2005.
See Notes to Financial Statements.
- ------
48
High-Yield - Financial Highlights
For a Share Outstanding Throughout the Years Ended March 31 (except as noted)
- -----------------------------------------------------------------------------------------------------------
ADVISOR CLASS
- -----------------------------------------------------------------------------------------------------------
2006(1) 2006 2005 2004 2003(2) 2002(3)
- -----------------------------------------------------------------------------------------------------------
PER-SHARE DATA
- -----------------------------------------------------------------------------------------------------------
Net Asset Value, Beginning of Period $6.38 $6.42 $6.55 $6.13 $5.76 $6.22
- -----------------------------------------------------------------------------------------------------------
Income From Investment Operations
- -----------------------------------------
Net Investment Income (Loss) 0.21 0.42 0.44 0.49 0.18 0.30
- -----------------------------------------
Net Realized and Unrealized
Gain (Loss) (0.05) (0.04) (0.13) 0.42 0.37 (0.46)
- ----------------------------------------------------------------------------------------------------------
Total From Investment Operations 0.16 0.38 0.31 0.91 0.55 (0.16)
- -----------------------------------------------------------------------------------------------------------
Distributions
- -----------------------------------------
From Net Investment Income (0.21) (0.42) (0.44) (0.49) (0.18) (0.30)
- -----------------------------------------------------------------------------------------------------------
Net Asset Value, End of Period $6.33 $6.38 $6.42 $6.55 $6.13 $5.76
===========================================================================================================
TOTAL RETURN(4) 2.54% 6.02% 4.91% 15.35% 9.63% (2.72)%
RATIOS/SUPPLEMENTAL DATA
- -----------------------------------------------------------------------------------------------------------
Ratio of Operating Expenses
to Average Net Assets 1.03%(5)(7) 1.06%(5) 1.13% 1.12%(6) 0.84%(6)(7) 1.15%(7)
- -----------------------------------------
Ratio of Operating Expenses to Average
Net Assets (Before Expense Waiver) 1.12%(7) 1.12% 1.13% 1.14% 1.13%(7) 1.15%(7)
- -----------------------------------------
Ratio of Net Investment Income (Loss)
to Average Net Assets 6.59%(5)(7) 6.49%(5) 6.79% 7.59%(6) 7.27%(6)(7) 7.63%(7)
- -----------------------------------------
Ratio of Net Investment Income (Loss)
to Average Net Assets
(Before Expense Waiver) 6.50%(7) 6.43% 6.79% 7.57% 6.98%(7) 7.63%(7)
- -----------------------------------------
Portfolio Turnover Rate 25% 40% 64% 80% 9% 80%(8)
- -----------------------------------------
Net Assets, End of Period (in thousands) $577 $407 $385 $242 $1 $4
- -----------------------------------------------------------------------------------------------------------
(1) Six months ended September 30, 2006 (unaudited).
(2) November 1, 2002 through March 31, 2003. The fund's fiscal year was changed
from October 31 to March 31, resulting in a five- month annual reporting
period.
(3) March 8, 2002 (commencement of sale) through October 31, 2002.
(4) Total return assumes reinvestment of net investment income and capital
gains distributions, if any. Total returns for periods less than one year
are not annualized. The total return of the classes may not precisely
reflect the class expense differences because of the impact of calculating
the net asset values to two decimal places. If net asset values were
calculated to three decimal places, the total return differences would more
closely reflect the class expense differences. The calculation of net asset
values to two decimal places is made in accordance with SEC guidelines and
does not result in any gain or loss of value between one class and another.
(5) Effective July 29, 2005, the investment advisor voluntarily agreed to waive
a portion of the management fee.
(6) During the period ended March 31, 2003 and the year ended March 31, 2004,
the distributor voluntarily waived a portion of the distribution and service
fees.
(7) Annualized.
(8) Portfolio turnover is calculated at the fund level. Percentage indicated
was calculated for the year ended October 31, 2002.
See Notes to Financial Statements.
- ------
49
High-Yield - Financial Highlights
For a Share Outstanding Throughout the Years Ended March 31 (except as noted)
- -------------------------------------------------------------------------------------------------------
A CLASS
- -------------------------------------------------------------------------------------------------------
2006(1) 2006 2005 2004 2003(2)
- -------------------------------------------------------------------------------------------------------
PER-SHARE DATA
- -------------------------------------------------------------------------------------------------------
Net Asset Value, Beginning of Period $6.38 $6.42 $6.55 $6.13 $5.98
- -------------------------------------------------------------------------------------------------------
Income From Investment Operations
- ----------------------------------------------
Net Investment Income (Loss) 0.21 0.42 0.44 0.49 0.07
- ----------------------------------------------
Net Realized and Unrealized Gain (Loss) (0.05) (0.04) (0.13) 0.42 0.15
- -------------------------------------------------------------------------------------------------------
Total From Investment Operations 0.16 0.38 0.31 0.91 0.22
- -------------------------------------------------------------------------------------------------------
Distributions
- ----------------------------------------------
From Net Investment Income (0.21) (0.42) (0.44) (0.49) (0.07)
- -------------------------------------------------------------------------------------------------------
Net Asset Value, End of Period $6.33 $6.38 $6.42 $6.55 $6.13
=======================================================================================================
TOTAL RETURN(3) 2.54% 6.02% 4.91% 15.24% 3.74%
RATIOS/SUPPLEMENTAL DATA
- -------------------------------------------------------------------------------------------------------
Ratio of Operating Expenses
to Average Net Assets 1.03%(4)(5) 1.06%(4) 1.13% 1.14% 1.13%(5)
- ----------------------------------------------
Ratio of Operating Expenses to Average
Net Assets (Before Expense Waiver) 1.12%(5) 1.12% 1.13% 1.14% 1.13%(5)
- ----------------------------------------------
Ratio of Net Investment Income (Loss)
to Average Net Assets 6.59%(4)(5) 6.49%(4) 6.79% 7.57% 8.01%(5)
- ----------------------------------------------
Ratio of Net Investment Income (Loss)
to Average Net Assets (Before Expense Waiver) 6.50%(5) 6.43% 6.79% 7.57% 8.01%(5)
- ----------------------------------------------
Portfolio Turnover Rate 25% 40% 64% 80% 9%(6)
- ----------------------------------------------
Net Assets, End of Period (in thousands) $11,448 $11,293 $15,517 $12,449 $763
- -------------------------------------------------------------------------------------------------------
(1) Six months ended September 30, 2006 (unaudited).
(2) January 31, 2003 (commencement of sale) through March 31, 2003.
(3) Total return assumes reinvestment of net investment income and capital
gains distributions, if any, and does not reflect applicable sales charges.
Total returns for periods less than one year are not annualized. The total
return of the classes may not precisely reflect the class expense
differences because of the impact of calculating the net asset values to
two decimal places. If net asset values were calculated to three decimal
places, the total return differences would more closely reflect the class
expense differences. The calculation of net asset values to two decimal
places is made in accordance with SEC guidelines and does not result in
any gain or loss of value between one class and another.
(4) Effective July 29, 2005, the investment advisor voluntarily agreed to waive
a portion of the management fee.
(5) Annualized.
(6) Portfolio turnover is calculated at the fund level. Percentage indicated
was calculated for the period ended March 31, 2003.
See Notes to Financial Statements.
- ------
50
High-Yield - Financial Highlights
For a Share Outstanding Throughout the Years Ended March 31 (except as noted)
- ---------------------------------------------------------------------------------------------------
B CLASS
- ---------------------------------------------------------------------------------------------------
2006(1) 2006 2005 2004 2003(2)
- ---------------------------------------------------------------------------------------------------
PER-SHARE DATA
- ---------------------------------------------------------------------------------------------------
Net Asset Value, Beginning of Period $6.38 $6.42 $6.55 $6.13 $5.98
- ---------------------------------------------------------------------------------------------------
Income From Investment Operations
- -----------------------------------------
Net Investment Income (Loss) 0.18 0.37 0.39 0.44 0.07
- -----------------------------------------
Net Realized and Unrealized Gain (Loss) (0.05) (0.04) (0.13) 0.42 0.15
- ---------------------------------------------------------------------------------------------------
Total From Investment Operations 0.13 0.33 0.26 0.86 0.22
- ---------------------------------------------------------------------------------------------------
Distributions
- -----------------------------------------
From Net Investment Income (0.18) (0.37) (0.39) (0.44) (0.07)
- ---------------------------------------------------------------------------------------------------
Net Asset Value, End of Period $6.33 $6.38 $6.42 $6.55 $6.13
===================================================================================================
TOTAL RETURN(3) 2.16% 5.23% 4.13% 14.38% 3.64%
RATIOS/SUPPLEMENTAL DATA
- ---------------------------------------------------------------------------------------------------
Ratio of Operating Expenses
to Average Net Assets 1.78%(4)(5) 1.81%(4) 1.88% 1.89% 1.86%(5)(6)
- -----------------------------------------
Ratio of Operating Expenses
to Average Net Assets
(Before Expense Waiver) 1.87%(5) 1.87% 1.88% 1.89% 1.88%(5)
- -----------------------------------------
Ratio of Net Investment
Income (Loss) to
Average Net Assets 5.84%(4)(5) 5.74%(4) 6.04% 6.82% 7.27%(5)(6)
- -----------------------------------------
Ratio of Net Investment
Income (Loss) to Average Net
Assets (Before Expense Waiver) 5.75%(5) 5.68% 6.04% 6.82% 7.25%(5)
- -----------------------------------------
Portfolio Turnover Rate 25% 40% 64% 80% 9%(7)
- -----------------------------------------
Net Assets, End of Period (in thousands) $1,242 $1,182 $1,105 $855 $57
- ---------------------------------------------------------------------------------------------------
(1) Six months ended September 30, 2006 (unaudited).
(2) January 31, 2003 (commencement of sale) through March 31, 2003.
(3) Total return assumes reinvestment of net investment income and capital
gains distributions, if any, and does not reflect applicable sales charges.
Total returns for periods less than one year are not annualized. The total
return of the classes may not precisely reflect the class expense
differences because of the impact of calculating the net asset values to
two decimal places. If net asset values were calculated to three decimal
places, the total return differences would more closely reflect the class
expense differences. The calculation of net asset values to two decimal
places is made in accordance with SEC guidelines and does not result in any
gain or loss of value between one class and another.
(4) Effective July 29, 2005, the investment advisor voluntarily agreed to waive
a portion of the management fee.
(5) Annualized.
(6) During the period ended March 31, 2003, the distributor voluntarily waived
a portion of the distribution and service fees.
(7) Portfolio turnover is calculated at the fund level. Percentage indicated
was calculated for the period ended March 31, 2003.
See Notes to Financial Statements.
- ------
51
High-Yield - Financial Highlights
For a Share Outstanding Throughout the Years Ended March 31 (except as noted)
- --------------------------------------------------------------------------------------------------------
C CLASS
- --------------------------------------------------------------------------------------------------------
2006(1) 2006 2005 2004 2003(2) 2002(3)
- --------------------------------------------------------------------------------------------------------
PER-SHARE DATA
- --------------------------------------------------------------------------------------------------------
Net Asset Value, Beginning of Period $6.38 $6.42 $6.55 $6.13 $5.76 $6.32
- --------------------------------------------------------------------------------------------------------
Income From Investment Operations
- ------------------------------------------
Net Investment Income (Loss) 0.18 0.37 0.39 0.45 0.16 0.41
- ------------------------------------------
Net Realized and Unrealized
Gain (Loss) (0.05) (0.04) (0.13) 0.42 0.37 (0.56)
- --------------------------------------------------------------------------------------------------------
Total From Investment Operations 0.13 0.33 0.26 0.87 0.53 (0.15)
- --------------------------------------------------------------------------------------------------------
Distributions
- ------------------------------------------
From Net Investment Income (0.18) (0.37) (0.39) (0.45) (0.16) (0.41)
- --------------------------------------------------------------------------------------------------------
Net Asset Value, End of Period $6.33 $6.38 $6.42 $6.55 $6.13 $5.76
========================================================================================================
TOTAL RETURN(4) 2.15% 5.23% 4.13% 14.60% 9.28% (2.49)%
RATIOS/SUPPLEMENTAL DATA
- --------------------------------------------------------------------------------------------------------
Ratio of Operating Expenses
to Average Net Assets 1.78%(5)(6) 1.81%(5) 1.88% 1.72% 1.63%(6) 1.65%(6)
- ------------------------------------------
Ratio of Operating Expenses
to Average Net Assets
(Before Expense Waiver) 1.87%(6) 1.87% 1.88% 1.72% 1.63%(6) 1.65%(6)
- ------------------------------------------
Ratio of Net Investment Income (Loss)
to Average Net Assets 5.84%(5)(6) 5.74%(5) 6.04% 6.99% 6.48%(6) 7.78%(6)
- ------------------------------------------
Ratio of Net Investment Income (Loss)
to Average Net Assets
(Before Expense Waiver) 5.75%(6) 5.68% 6.04% 6.99% 6.48%(6) 7.78%(6)
- ------------------------------------------
Portfolio Turnover Rate 25% 40% 64% 80% 9% 80%(7)
- ------------------------------------------
Net Assets, End of Period (in thousands) $1,870 $1,823 $3,351 $3,590 $283 $31
- --------------------------------------------------------------------------------------------------------
(1) Six months ended September 30, 2006 (unaudited).
(2) November 1, 2002 through March 31, 2003. The fund's fiscal year was changed
from October 31 to March 31, resulting in a five-month annual reporting
period.
(3) December 10, 2001 (commencement of sale) through October 31, 2002.
(4) Total return assumes reinvestment of net investment income and capital
gains distributions, if any, and does not reflect applicable sales charges.
Total returns for periods less than one year are not annualized. The total
return of the classes may not precisely reflect the class expense
differences because of the impact of calculating the net asset values to
two decimal places. If net asset values were calculated to three decimal
places, the total return differences would more closely reflect the class
expense differences. The calculation of net asset values to two decimal
places is made in accordance with SEC guidelines and does not result in
any gain or loss of value between one class and another.
(5) Effective July 29, 2005, the investment advisor voluntarily agreed to waive
a portion of the management fee.
(6) Annualized.
(7) Portfolio turnover is calculated at the fund level. Percentage indicated
was calculated for the year ended October 31, 2002.
See Notes to Financial Statements.
- ------
52
High-Yield - Financial Highlights
For a Share Outstanding Throughout the Periods Indicated
- --------------------------------------------------------------------------------
R CLASS
- --------------------------------------------------------------------------------
2006(1) 2006(2)
- --------------------------------------------------------------------------------
PER-SHARE DATA
- --------------------------------------------------------------------------------
Net Asset Value, Beginning of Period $6.38 $6.51
- --------------------------------------------------------------------------------
Income From Investment Operations
- -------------------------------------------
Net Investment Income (Loss) 0.20 0.27
- -------------------------------------------
Net Realized and Unrealized Gain (Loss) (0.05) (0.13)
- --------------------------------------------------------------------------------
Total From Investment Operations 0.15 0.14
- --------------------------------------------------------------------------------
Distributions
- -------------------------------------------
From Net Investment Income (0.20) (0.27)
- --------------------------------------------------------------------------------
Net Asset Value, End of Period $6.33 $6.38
================================================================================
TOTAL RETURN(3) 2.41% 2.23%
RATIOS/SUPPLEMENTAL DATA
- --------------------------------------------------------------------------------
Ratio of Operating Expenses
to Average Net Assets 1.28%(4)(5) 1.27%(4)(5)
- -------------------------------------------
Ratio of Operating Expenses
to Average Net Assets
(Before Expense Waiver) 1.37%(5) 1.37%(5)
- -------------------------------------------
Ratio of Net Investment
Income (Loss)
to Average Net Assets 6.34%(4)(5) 6.39%(4)(5)
- -------------------------------------------
Ratio of Net Investment
Income (Loss)
to Average Net Assets
(Before Expense Waiver) 6.25%(5) 6.29%(5)
- -------------------------------------------
Portfolio Turnover Rate 25% 40%(6)
- -------------------------------------------
Net Assets, End of Period (in thousands) $26 $26
- --------------------------------------------------------------------------------
(1) Six months ended September 30, 2006 (unaudited).
(2) July 29, 2005 (commencement of sale) through March 31, 2006.
(3) Total return assumes reinvestment of net investment income and capital
gains distributions, if any. Total returns for periods less than one year
are not annualized. The total return of the classes may not precisely
reflect the class expense differences because of the impact of calculating
the net asset values to two decimal places. If net asset values were
calculated to three decimal places, the total return differences would more
closely reflect the class expense differences. The calculation of net asset
values to two decimal places is made in accordance with SEC guidelines and
does not result in any gain or loss of value between one class and another.
(4) Effective July 29, 2005, the investment advisor voluntarily agreed to waive
a portion of the management fee.
(5) Annualized.
(6) Portfolio turnover is calculated at the fund level. Percentage indicated
was calculated for the year ended March 31, 2006.
See Notes to Financial Statements.
- ------
53
Approval of Management Agreements for Diversified Bond and High-Yield
Under Section 15(c) of the Investment Company Act, contracts for investment
advisory services are required to be reviewed, evaluated and approved by a
majority of a fund's independent directors or trustees (the "Directors") each
year. At American Century, this process is referred to as the "15(c) Process."
As a part of this process, the board reviews fund performance, shareholder
services, audit and compliance information, and a variety of other reports from
the advisor concerning fund operations. In addition to this annual review, the
board of directors oversees and evaluates on a continuous basis at its quarterly
meetings the nature and quality of significant services performed by the
advisor, fund performance, audit and compliance information, and a variety of
other reports relating to fund operations. The board, or committees of the
board, also holds special meetings as needed.
Under a Securities and Exchange Commission rule, each fund is required to
disclose in its annual or semiannual report, as appropriate, the material
factors and conclusions that formed the basis for the board's approval or
renewal of any advisory agreements within the fund's most recently completed
fiscal half-year period.
ANNUAL CONTRACT REVIEW PROCESS
As part of the annual 15(c) Process undertaken during the most recent fiscal
half-year period, the Directors reviewed extensive data and information compiled
by the advisor and certain independent providers of evaluative data (the "15(c)
Providers") concerning Diversified Bond and High-Yield (the "funds") and the
services provided to the funds under the management agreement. The information
considered and the discussions held at the meetings included, but were not
limited to:
* the nature, extent and quality of investment management, shareholder
services and other services provided to the funds under the management
agreement;
* reports on the advisor's activities relating to the wide range of
programs and services the advisor provides to the funds and their
shareholders on a routine and non-routine basis;
* data comparing the cost of owning the funds to the cost of owning a
similar funds;
* data comparing the funds' performance to appropriate benchmarks
and/or a peer group of other mutual funds with similar investment
objectives and strategies;
* financial data showing the profitability of the funds to the advisor
and the overall profitability of the advisor; and
* data comparing services provided and charges to other investment
management clients of the advisor.
In keeping with its practice, the funds' board of directors held two regularly
scheduled meetings and one special meeting to review and discuss the information
provided by the advisor and to complete its negotiations with the advisor
regarding the renewal of the management agreement, including the setting of the
applicable advisory fee. The board also had the benefit of the advice of its
independent counsel throughout the period.
(continued)
- ------
54
Approval of Management Agreements for Diversified Bond and High-Yield
FACTORS CONSIDERED
The Directors considered all of the information provided by the advisor, the
15(c) Providers, and the board's independent counsel, and evaluated such
information for each fund for which the board has responsibility. The Directors
did not identify any single factor as being all-important or controlling, and
each Director may have attributed different levels of importance to different
factors. In deciding to renew the agreement under the terms ultimately
determined by the board to be appropriate, the Directors' decision was based on
the following factors.
NATURE, EXTENT AND QUALITY OF SERVICES -- GENERALLY. Under the management
agreement, the advisor is responsible for providing or arranging for all
services necessary for the operation of the funds. The board noted that under
the management agreement, the advisor provides or arranges at its own expense a
wide variety of services including:
* fund construction and design
* portfolio security selection
* initial capitalization/funding
* securities trading
* custody of fund assets
* daily valuation of the funds' portfolio
* shareholder servicing and transfer agency, including shareholder
confirmations, recordkeeping and communications
* legal services
* regulatory and portfolio compliance
* financial reporting
* marketing and distribution
The Directors noted that many of these services have expanded over time both in
terms of quantity and complexity in response to shareholder demands, competition
in the industry and the changing regulatory environment. In performing their
evaluation, the Directors considered information received in connection with the
annual review, as well as information provided on an ongoing basis at their
regularly scheduled board and committee meetings.
INVESTMENT MANAGEMENT SERVICES. The nature of the investment management services
provided is quite complex and allows fund shareholders access to professional
money management, instant diversification of their investments within an asset
class, the opportunity to easily diversify among asset classes, and liquidity.
In evaluating investment performance, the board expects the advisor to manage
the funds in accordance with their investment objectives and approved
strategies. In providing these services, the advisor utilizes teams of
investment professionals (portfolio managers, analysts, research assistants, and
securities traders) who require extensive information technology, research,
training, compliance and other systems to conduct their business. At each
quarterly meeting, the Directors review investment performance information for
the funds, together with comparative information for appropriate benchmarks and
peer groups of funds managed similarly to the funds. The Directors also review
detailed performance information during the 15(c) Process comparing the funds'
performance with that of similar funds not managed by the advisor. If
performance
(continued)
- ------
55
Approval of Management Agreements for Diversified Bond and High-Yield
concerns are identified, the Directors discuss with the advisor the reasons for
such results (e.g., market conditions, security selection) and any efforts being
undertaken to improve performance. The performance information presented to the
Directors showed that Diversified Bond's performance was above its benchmark for
both the one and three year periods. High-Yield's performance fell below the
median for both the one and three year periods during the past year. The board
discussed the fund's performance with the advisor and was satisfied with the
efforts being undertaken by the advisor.
SHAREHOLDER AND OTHER SERVICES. The advisor provides the funds with a
comprehensive package of transfer agency, shareholder, and other services. The
Directors review reports and evaluations of such services at their regular
quarterly meetings, including the annual meeting concerning contract review, and
reports to the board. These reports include, but are not limited to, information
regarding the operational efficiency and accuracy of the shareholder and
transfer agency services provided, staffing levels, shareholder satisfaction (as
measured by external as well as internal sources), technology support, new
products and services offered to fund shareholders, securities trading
activities, portfolio valuation services, auditing services, and legal and
operational compliance activities. Certain aspects of shareholder and transfer
agency service level efficiency and the quality of securities trading activities
are measured by independent third party providers and are presented in
comparison to other fund groups not managed by the advisor.
COSTS OF SERVICES PROVIDED AND PROFITABILITY TO THE ADVISOR. The advisor
provides detailed information concerning its cost of providing various services
to the funds, its profitability in managing the funds, its overall
profitability, and its financial condition. The Directors have reviewed with the
advisor the methodology used to prepare this financial information. This
financial information regarding the advisor is considered in order to evaluate
the advisor's financial condition, its ability to continue to provide services
under the management agreement, and the reasonableness of the current management
fee.
ETHICS OF THE ADVISOR. The Directors generally consider the advisor's commitment
to providing quality services to shareholders and to conducting its business
ethically. They noted that the advisor's practices generally meet or exceed
industry best practices and that the advisor was not implicated in the industry
scandals of 2003 and 2004.
ECONOMIES OF SCALE. The Directors review reports provided by the advisor on
economies of scale for the complex as a whole and the year-over-year changes in
revenue, costs, and profitability. The Directors concluded that economies of
scale are difficult to measure and predict with precision, especially on a
fund-by-fund basis. This analysis is also complicated by the additional services
and content provided by the advisor and its reinvestment in its ability to
provide and expand those services. Accordingly, the Directors also seek to
evaluate economies of scale by reviewing other information, such as
year-over-year
(continued)
- ------
56
Approval of Management Agreements for Diversified Bond and High-Yield
profitability of the advisor generally, the profitability of its management of
the funds specifically, the expenses incurred by the advisor in providing
various functions to the funds, and the breakpoint fees of competitive funds not
managed by the advisor. The Directors believe the advisor is appropriately
sharing economies of scale through its competitive fee structure, fee
breakpoints as the fund complex and the funds increases in size, and through
reinvestment in its business to provide shareholders additional content and
services. In particular, separate breakpoint schedules based on the size of the
entire fund complex and on the size of the funds reflect the complexity of
assessing economies of scale.
COMPARISON TO OTHER FUNDS' FEES. The funds pay the advisor a single,
all-inclusive (or unified) management fee for providing all services necessary
for the management and operation of the funds, other than brokerage expenses,
taxes, interest, extraordinary expenses, and the fees and expenses of the funds'
independent directors (including their independent legal counsel). Under the
unified fee structure, the advisor is responsible for providing all investment
advisory, custody, audit, administrative, compliance, recordkeeping, marketing
and shareholder services, or arranging and supervising third parties to provide
such services. By contrast, most other funds are charged a variety of fees,
including an investment advisory fee, a transfer agency fee, an administrative
fee, distribution charges and other expenses. Other than their investment
advisory fees and Rule 12b-1 distribution fees, all other components of the
total fees charged by these other funds may be increased without shareholder
approval. The board believes the unified fee structure is a benefit to fund
shareholders because it clearly discloses to shareholders the cost of owning
fund shares, and, since the unified fee cannot be increased without a vote of
fund shareholders, it shifts to the advisor the risk of increased costs of
operating the funds and provides a direct incentive to minimize administrative
inefficiencies. Part of the Directors' analysis of fee levels involves reviewing
certain evaluative data compiled by an independent provider and comparing the
funds' unified fee to the total expense ratio of other funds in the funds' peer
groups. The unified fee charged to shareholders of Diversified Bond was in the
lowest quartile of the total expense ratios of its peer group. The unified fee
charged to shareholders of High-Yield was below the median of the total expense
ratios of its peer group.
COMPARISON TO FEES AND SERVICES PROVIDED TO OTHER CLIENTS OF THE ADVISOR. The
Directors also requested and received information from the advisor concerning
the nature of the services, fees, and profitability of its advisory services to
advisory clients other than the funds. They observed that these varying types of
client accounts require different services and involve different regulatory and
entrepreneurial risks than the management of the funds. The Directors analyzed
this information and concluded that the fees charged and services provided to
the funds were reasonable by comparison.
(continued)
- ------
57
Approval of Management Agreements for Diversified Bond and High-Yield
COLLATERAL BENEFITS DERIVED BY THE ADVISOR. The Directors reviewed information
from the advisor concerning collateral benefits it receives as a result of its
relationship with the funds. They concluded that the advisor's primary business
is managing mutual funds and it generally does not use the funds or shareholder
information to generate profits in other lines of business, and therefore does
not derive any significant collateral benefits from them. The Directors noted
that the advisor receives proprietary research from broker dealers that execute
fund portfolio transactions and concluded that this research is likely to
benefit fund shareholders. The Directors also determined that the advisor is
able to provide investment management services to certain clients other than the
funds, at least in part, due to its existing infrastructure built to serve the
fund complex. The Directors concluded, however, that the assets of those other
clients are not material to the analysis and, in any event, are included with
the assets of the funds to determine breakpoints in the funds' fee schedules,
provided they are managed using the same investment team and strategy.
CONCLUSIONS OF THE DIRECTORS
As a result of this process, the independent directors, in the absence of
particular circumstances and assisted by the advice of legal counsel that is
independent of the advisor, taking into account all of the factors discussed
above and the information provided by the advisor concluded that the investment
management agreement between Diversified Bond and the advisor is fair and
reasonable in light of the services provided and should be renewed.
The Directors negotiated a one-year waiver by the advisor of a portion of High
Yield's management fee. These changes were proposed by the Directors based on
their review of the High-Yield's percentile rank in its peer group universe and
the fact that the Directors seek as a general rule to have total expense ratios
of fixed income and money market funds in the lowest 25th percentile of the fees
of comparable funds. The advisor accepted the principle of the fee waiver based
on the fact that the lower fee will result in increased competitiveness of the
fund within its peer group universe. The fee waiver, effective August 1, 2006,
will result in a lowering of the management fee of the fund by 0.071 percentage
points below the current management fee. Following these negotiations with the
advisor, the Directors concluded that the investment management agreement
between High-Yield and the advisor is fair and reasonable in light of the
services provided and should be renewed.
- ------
58
Share Class Information
Seven classes of shares are authorized for sale by the funds: Investor Class,
Institutional Class, Advisor Class, A Class, B Class, C Class, and R Class. The
total expense ratio of Institutional Class shares is lower than that of Investor
Class shares; the total expense ratios of Advisor Class, A Class, B Class, C
Class, and R Class shares are higher than that of Investor Class shares. The
funds are available for purchase only through financial intermediaries by
investors who seek advice from them. The funds are closed to other investors,
but those with open accounts may make additional investments and reinvest
dividends and capital gains distributions as long as such accounts remain open.
INVESTOR CLASS shares are available for purchase in two ways: 1) directly from
American Century without any commissions or other fees; or 2) through certain
financial intermediaries (such as banks, broker-dealers, insurance companies and
investment advisors), which may require payment of a transaction fee to the
financial intermediary.
INSTITUTIONAL CLASS shares are available to large investors such as endowments,
foundations, and retirement plans, and to financial intermediaries serving these
investors. This class recognizes the relatively lower cost of serving
institutional customers and others who invest at least $5 million ($3 million
for endowments and foundations) in an American Century fund or at least $10
million in multiple funds. In recognition of the larger investments and account
balances and comparatively lower transaction costs, the unified management fee
of Institutional Class shares is 0.20% less than the unified management fee of
Investor Class shares.
ADVISOR CLASS shares are sold primarily through institutions such as investment
advisors, banks, broker-dealers, insurance companies, and financial advisors.
Advisor Class shares are subject to a 0.50% annual Rule 12b-1 distribution and
service fee. The total expense ratio of Advisor Class shares is 0.25% higher
than the total expense ratio of Investor Class shares.
A CLASS shares are sold primarily through employer-sponsored retirement plans
and through institutions such as investment advisors, banks, broker-dealers, and
insurance companies. A Class shares are sold at their offering price, which is
net asset value plus an initial sales charge that ranges from 4.50% to 0.00% for
fixed-income funds, depending on the amount invested. The initial sales charge
is deducted from the purchase amount before it is invested. A Class shares may
be subject to a contingent deferred sales charge (CDSC). There is no CDSC on
shares acquired through reinvestment of dividends or capital gains. The
prospectus contains information regarding reductions and waivers of sales
charges for A Class shares. The unified management fee for A Class shares is the
same as for Investor Class shares. A Class shares also are subject to a 0.25%
annual Rule 12b-1 distribution and service fee.
B CLASS shares are sold primarily through employer-sponsored retirement plans
and through institutions such as investment advisors, banks,
(continued)
- ------
59
Share Class Information
broker-dealers, and insurance companies. B Class shares redeemed within six
years of purchase are subject to a CDSC that declines from 5.00% during the
first year after purchase to 0.00% after the sixth year. There is no CDSC on
shares acquired through reinvestment of dividends or capital gains. The unified
management fee for B Class shares is the same as for Investor Class shares. B
Class shares also are subject to a 1.00% annual Rule 12b-1 distribution and
service fee. B Class shares automatically convert to A Class shares (with lower
expenses) eight years after their purchase date.
C CLASS shares are sold primarily through employer-sponsored retirement plans
and through institutions such as investment advisors, banks, broker-dealers, and
insurance companies. C Class shares redeemed within 12 months of purchase are
subject to a CDSC of 1.00%. There is no CDSC on shares acquired through
reinvestment of dividends or capital gains. The unified management fee for C
Class shares is the same as for Investor Class shares. C Class shares also are
subject to a Rule 12b-1 distribution and service fee of 1.00%.
R CLASS shares are sold primarily through employer-sponsored retirement plans
and through institutions such as investment advisors, banks, broker-dealers, and
insurance companies. The unified management fee for R Class shares is the same
as for Investor Class shares. R Class shares are subject to a 0.50% annual Rule
12b-1 distribution and service fee.
All classes of shares represent a pro rata interest in the funds and generally
have the same rights and preferences.
- ------
60
Additional Information
RETIREMENT ACCOUNT INFORMATION
As required by law, any distributions you receive from an IRA or certain 403(b),
457 and qualified plans [those not eligible for rollover to an IRA or to another
qualified plan] are subject to federal income tax withholding, unless you elect
not to have withholding apply. Tax will be withheld on the total amount
withdrawn even though you may be receiving amounts that are not subject to
withholding, such as nondeductible contributions. In such case, excess amounts
of withholding could occur. You may adjust your withholding election so that a
greater or lesser amount will be withheld.
If you don't want us to withhold on this amount, you must notify us to not
withhold the federal income tax. Even if you plan to roll over the amount you
withdraw to another tax-deferred account, the withholding rate still applies to
the withdrawn amount unless we have received notice not to withhold federal
income tax prior to the withdrawal. You may notify us in writing or in certain
situations by telephone or through other electronic means. You have the right to
revoke your withholding election at any time and any election you make may
remain in effect until revoked by filing a new election.
Remember, even if you elect not to have income tax withheld, you are liable for
paying income tax on the taxable portion of your withdrawal. If you elect not to
have income tax withheld or you don't have enough income tax withheld, you may
be responsible for payment of estimated tax. You may incur penalties under the
estimated tax rules if your withholding and estimated tax payments are not
sufficient.
State tax will be withheld if, at the time of your distribution, your address is
within one of the mandatory withholding states and you have federal income tax
withheld. State taxes will be withheld from your distribution in accordance with
the respective state rules.
PROXY VOTING GUIDELINES
American Century Investment Management, Inc., the funds' investment advisor, is
responsible for exercising the voting rights associated with the securities
purchased and/or held by the funds. A description of the policies and procedures
the advisor uses in fulfilling this responsibility is available without charge,
upon request, by calling 1-800-345-2021. It is also available on American
Century's website at americancentury.com and on the Securities and Exchange
Commission's website at sec.gov. Information regarding how the investment
advisor voted proxies relating to portfolio securities during the most recent
12-month period ended June 30 is available on the "About Us" page at
americancentury.com. It is also available at sec.gov.
(continued)
- ------
61
Additional Information
QUARTERLY PORTFOLIO DISCLOSURE
The funds file their complete schedule of portfolio holdings with the Securities
and Exchange Commission (SEC) for the first and third quarters of each fiscal
year on Form N-Q. The funds' Forms N-Q are available on the SEC's website at
sec.gov, and may be reviewed and copied at the SEC's Public Reference Room in
Washington, DC. Information on the operation of the Public Reference Room may be
obtained by calling 1-800-SEC-0330. The funds also make their complete schedule
of portfolio holdings for the most recent quarter of their fiscal year available
on their website at americancentury.com and, upon request, by calling
1-800-345-2021.
- ------
62
Index Definitions
The following indices are used to illustrate investment market, sector, or style
performance or to serve as fund performance comparisons. They are not investment
products available for purchase.
The CITIGROUP US BROAD INVESTMENT-GRADE (USBIG) BOND INDEX is a
market-capitalization-weighted index that includes fixed-rate Treasury,
government-sponsored, mortgage, asset-backed, and investment-grade issues with a
maturity of one year or longer.
The CREDIT SUISSE FIRST BOSTON (CSFB) HIGH YIELD INDEX II is designed to mirror
the investable universe of the U.S. dollar-denominated high-yield debt market.
Prior to October 2001, the index was known as the Donaldson, Lufkin, & Jenrette
(DLJ) High-Yield Index.
The LEHMAN BROTHERS U.S. AGENCY INDEX is composed of those securities included
in the Lehman Brothers U.S. Aggregate Index that are public obligations of U.S.
government agencies, quasi-federal corporations, and corporate or foreign debt
guaranteed by the U.S. government.
The LEHMAN BROTHERS U.S. AGGREGATE INDEX represents securities that are taxable,
registered with the Securities and Exchange Commission, and U.S.
dollar-denominated. The index covers the U.S. investment-grade fixed-rate bond
market, with index components for government and corporate securities, mortgage
pass-through securities, and asset-backed securities.
The LEHMAN BROTHERS U.S. CORPORATE INDEX is composed of those securities
included in the Lehman Brothers U.S. Aggregate Index that are U.S.
dollar-denominated, investment-grade, fixed-rate, taxable securities sold by
industrial, utility and financial issuers.
The LEHMAN BROTHERS U.S. CORPORATE HIGH-YIELD INDEX covers the U.S.
dollar-denominated, non-investment grade, fixed-rate, taxable corporate bond
market.
The LEHMAN BROTHERS U.S. FIXED-RATE MORTGAGE-BACKED SECURITIES (MBS) INDEX is
the MBS Fixed-Rate component of the Lehman Brothers U.S. Aggregate Index. It
covers the mortgage-backed pass-through securities of the Government National
Mortgage Association (GNMA), the Federal National Mortgage Association (FNMA),
and the Federal Home Loan Mortgage Corporation (FHLMC).
The LEHMAN BROTHERS U.S. TREASURY INDEX is composed of those securities included
in the Lehman Brothers U.S. Aggregate Index that are public obligations of the
U.S. Treasury with a remaining maturity of one year or more.
The MERRILL LYNCH US HIGH YIELD MASTER II CONSTRAINED INDEX tracks the
performance of below investment- grade U.S. dollar-denominated corporate bonds
publicly issued in the U.S. domestic markets and limits any single issuer to no
more than 2% of the index.
- ------
63
Notes
- ------
64
CONTACT US
AMERICANCENTURY.COM
AUTOMATED INFORMATION LINE:
1-800-345-8765
INVESTOR SERVICES REPRESENTATIVE:
1-800-345-2021 or 816-531-5575
INVESTORS USING ADVISORS:
1-800-378-9878
BUSINESS, NOT-FOR-PROFIT,
EMPLOYER-SPONSORED RETIREMENT PLANS:
1-800-345-3533
BANKS AND TRUST COMPANIES, BROKER-DEALERS,
FINANCIAL PROFESSIONALS, INSURANCE COMPANIES:
1-800-345-6488
TELECOMMUNICATIONS DEVICE FOR THE DEAF:
1-800-634-4113 or 816-444-3485
AMERICAN CENTURY INVESTMENT TRUST
INVESTMENT ADVISOR:
American Century Investment Management, Inc.
Kansas City, Missouri
THIS REPORT AND THE STATEMENTS IT CONTAINS ARE SUBMITTED FOR THE GENERAL
INFORMATION OF OUR SHAREHOLDERS. THE REPORT IS NOT AUTHORIZED FOR DISTRIBUTION
TO PROSPECTIVE INVESTORS UNLESS PRECEDED OR ACCOMPANIED BY AN EFFECTIVE
PROSPECTUS.
The American Century Investments logo,
American Century and American Century
Investments are service marks of
American Century Proprietary American Century Investment
Holdings, Inc. Services, Inc., Distributor
0611 (c)2006 American Century
SH-SAN-51668N Proprietary Holdings, Inc.
All rights reserved.-
[front cover]
AMERICAN CENTURY INVESTMENTS
Semiannual Report
September 30, 2006
Premium Money Market Fund
[american century investments logo and text logo]
Our Message to You
[photo of James E. Stowers III and James E. Stowers, Jr.]
/s/James E. Stowers, Jr.
James E. Stowers, Jr.
Founder
American Century Companies, Inc.
/s/James E. Stowers III
James E. Stowers III
Chairman of the Board
American Century Companies, Inc.
We are pleased to provide you with the semiannual report for the American
Century Premium Money Market fund for the six months ended September 30, 2006.
We hope you find this information helpful in monitoring your investment. Another
useful resource we offer is our website, americancentury.com, where we post
quarterly portfolio commentaries, the views of senior investment officers and
analysts, and other communications about investments, portfolio strategy,
personal finance, and the markets.
In its most recent rankings, Dalbar -- which issues customer satisfaction
ratings and rankings based on website functionality -- ranked
americancentury.com fourth out of the sites provided by the top 25 fund
companies that it believes lead the industry in web-based technology. Our
website earned an "Excellent" rating, Dalbar's highest designation.
For most of 2006, our website has linked visitors to information explaining our
strategic collaboration with Lance Armstrong and the Lance Armstrong Foundation
(LAF). This campaign, featuring Lance, is designed to encourage investors to
take a more active role in planning their financial futures and make every
investment decision count. To learn more about the collaboration and the LAF,
please visit americancentury.com or www.lanceface.com on the Web and click on
the links to related sites.
With the approach of year end and the 2006 tax season, you can also find out
more about December fund distributions and tax information via a link from our
website. We've posted December distribution estimates for over 50 funds, answers
to frequent distribution questions, and online descriptions of all of the tax
information we provide to investors.
If you haven't visited americancentury.com yet, we encourage you to do so...it's
there to serve you. And so are we. As always, we deeply appreciate your
commitment to American Century Investments.
Table of Contents
Market Perspective. . . . . . . . . . . . . . . . . . . . . . . . . . . . . 2
U.S. Fixed-Income Total Returns . . . . . . . . . . . . . . . . . . . . 2
PREMIUM MONEY MARKET
Performance . . . . . . . . . . . . . . . . . . . . . . . . . . . . . . . . 3
Portfolio Commentary. . . . . . . . . . . . . . . . . . . . . . . . . . . . 5
Shareholder Fee Example . . . . . . . . . . . . . . . . . . . . . . . . . . 6
Schedule of Investments . . . . . . . . . . . . . . . . . . . . . . . . . . 8
FINANCIAL STATEMENTS
Statement of Assets and Liabilities . . . . . . . . . . . . . . . . . . . .13
Statement of Operations . . . . . . . . . . . . . . . . . . . . . . . . . .14
Statement of Changes in Net Assets. . . . . . . . . . . . . . . . . . . . .15
Notes to Financial Statements . . . . . . . . . . . . . . . . . . . . . . .16
Financial Highlights. . . . . . . . . . . . . . . . . . . . . . . . . . . .18
OTHER INFORMATION
Approval of Management Agreement for Premium Money Market . . . . . . . . .19
Additional Information. . . . . . . . . . . . . . . . . . . . . . . . . . .24
Index Definitions . . . . . . . . . . . . . . . . . . . . . . . . . . . . .25
The opinions expressed in the Market Perspective and the Portfolio Commentary
reflect those of the portfolio management team as of the date of the report, and
do not necessarily represent the opinions of American Century or any other
person in the American Century organization. Any such opinions are subject to
change at any time based upon market or other conditions and American Century
disclaims any responsibility to update such opinions. These opinions may not be
relied upon as investment advice and, because investment decisions made by
American Century funds are based on numerous factors, may not be relied upon as
an indication of trading intent on behalf of any American Century fund. Security
examples are used for representational purposes only and are not intended as
recommendations to purchase or sell securities. Performance information for
comparative indices and securities is provided to American Century by third
party vendors. To the best of American Century's knowledge, such information is
accurate at the time of printing.
Market Perspective
[photo of Chief Investment Officer]
BY DAVID MACEWEN, CHIEF INVESTMENT OFFICER, FIXED INCOME
A TALE OF TWO QUARTERS
The second and third quarters of 2006 were very different in terms of inflation
and interest rate expectations and market performance. In the second quarter, as
core inflation rates remained above the Federal Reserve's 1-2% "comfort zone"
and threatened to go higher, investors feared the Fed would keep raising
interest rates and tip the economy into recession. Uncertainty about how far the
Fed would go, and how successful it would be in containing inflation, created a
defensive attitude in financial markets that resulted in disappointing returns
for broad stock and bond indices.
A FED PAUSE REFRESHED THE MARKETS
But in the third quarter, a 15% drop in oil prices helped take the heat off
inflation pressures, and cut business and consumer costs. Weakness in the
housing market--though hard on many homeowners--turned into a positive factor
for the markets. As home sales and prices declined, the Fed stopped its interest
rate tightening campaign, stepping back to assess the economy's reaction to
previous rate hikes. This combination of falling energy prices and relief from
rising interest rates helped broad U.S. stock and bond markets rebound from
second-quarter losses to post some of their biggest quarterly gains this decade.
LONG-DURATION AND CORPORATE SECURITIES OUTPERFORMED
The bond market especially welcomed a gloomy housing-market forecast,
speculating that it would reduce economic growth, inflation, and interest rates.
This rekindled demand for longer-term fixed-income securities. As a result, the
Treasury yield curve fell for the six months and "inverted", as the two-year
yield (4.69%) remained higher than the 10-year yield (4.63%), and both fell well
below the Fed's 5.25% overnight interest rate target. Mirroring the stock
market's rally, the corporate sectors led the broad taxable market.
U.S. FIXED-INCOME TOTAL RETURNS
For the six months ended September 30, 2006*
- --------------------------------------------------------------------------------
TREASURY SECURITIES
- --------------------------------------------------------------------------------
3-month bill 2.51%
- --------------------------------------------------------------------------------
2-year note 2.53%
- --------------------------------------------------------------------------------
5-year note 3.20%
- --------------------------------------------------------------------------------
10-year note 3.83%
- --------------------------------------------------------------------------------
30-year bond 4.64%
- --------------------------------------------------------------------------------
LEHMAN BROTHERS U.S. BOND MARKET INDICES
- --------------------------------------------------------------------------------
Corporate High-Yield 4.33%
- --------------------------------------------------------------------------------
Corporate Investment-Grade 4.12%
- --------------------------------------------------------------------------------
Aggregate (multi-sector) 3.73%
- --------------------------------------------------------------------------------
Fixed-Rate Mortgage-Backed 3.64%
- --------------------------------------------------------------------------------
Treasury 3.61%
- --------------------------------------------------------------------------------
Agency 3.45%
- --------------------------------------------------------------------------------
* Total returns for periods less than one year are not annualized.
- ------
2
Premium Money Market - Performance
TOTAL RETURNS AS OF SEPTEMBER 30, 2006
--------------------------------
AVERAGE ANNUAL RETURNS
- --------------------------------------------------------------------------------------------
SINCE INCEPTION
6 MONTHS(1) 1 YEAR 5 YEARS 10 YEARS INCEPTION DATE
- --------------------------------------------------------------------------------------------
PREMIUM
MONEY MARKET 2.41%(2) 4.41%(2) 2.05%(2) 3.65% 3.86%(2) 4/1/93
- --------------------------------------------------------------------------------------------
90-DAY U.S.
TREASURY BILL INDEX 2.34% 4.38% 2.20% 3.59% 3.85% --
- --------------------------------------------------------------------------------------------
Lipper Money Market
INSTRUMENT FUNDS
AVERAGE RETURN(3) 2.13% 3.83% 1.59% 3.25% N/A --
- --------------------------------------------------------------------------------------------
Fund's Lipper Ranking
among Money Market
Instrument Funds(3) 23 of 357 22 of 355 25 of 294 18 of 186 -- --
- --------------------------------------------------------------------------------------------
Premium Money Market acquired all of the net assets of the American Century
Premium Capital Reserve Fund and the American Century Premium Government Reserve
Fund on December 3, 2001, pursuant to a plan of reorganization approved by the
acquired funds' shareholders on November 16, 2001. Performance information prior
to December 3, 2001 is that of the American Century Premium Capital Reserve
Fund.
(1) Total returns for periods less than one year are not annualized.
(2) Class returns would have been lower if American Century had not voluntarily
waived a portion of its management fees or its service and distribution
fees, as applicable.
(3) Data provided by Lipper Inc. - A Reuters Company. (c) 2006 Reuters. All
rights reserved. Any copying, republication or redistribution of Lipper
content, including by caching, framing or similar means, is expressly
prohibited without the prior written consent of Lipper. Lipper shall not be
liable for any errors or delays in the content, or for any actions taken in
reliance thereon.
Lipper Fund Performance -- Performance data is total return, and is
preliminary and subject to revision.
Lipper Rankings -- Rankings are based only on the universe shown and are
based on average annual total returns. This listing might not represent the
complete universe of funds tracked by Lipper.
The data contained herein has been obtained from company reports, financial
reporting services, periodicals and other resources believed to be reliable.
Although carefully verified, data on compilations is not guaranteed by
Lipper and may be incomplete. No offer or solicitations to buy or sell any
of the securities herein is being made by Lipper.
Data presented reflect past performance. Past performance is no guarantee of
future results. Current performance may be higher or lower than the performance
shown. To obtain performance data current to the most recent month end, please
call 1-800-345-2021 or visit americancentury.com.
An investment in the fund is not insured or guaranteed by the Federal Deposit
Insurance Corporation or any other government agency. Although the fund seeks to
preserve the value of your investment at $1.00 per share, it is possible to lose
money by investing in the fund.
The 7-day current yield more closely reflects the current earnings of the fund
than the total return.
(continued)
- ------
3
Premium Money Market - Performance
PORTFOLIO COMPOSITION BY CREDIT RATING
- --------------------------------------------------------------------------------
% OF FUND % OF FUND
INVESTMENTS INVESTMENTS
AS OF AS OF
9/30/06 3/31/06
- --------------------------------------------------------------------------------
A-1+ 62% 62%
- --------------------------------------------------------------------------------
A-1 38% 38%
- --------------------------------------------------------------------------------
Ratings provided by independent research companies. These ratings are listed in
Standard & Poor's format even if they were provided by other sources.
YIELDS* AND WEIGHTED AVERAGE MATURITY
- --------------------------------------------------------------------------------
9/30/06
- --------------------------------------------------------------------------------
7-Day Current Yield 4.99%
- --------------------------------------------------------------------------------
7-Day Effective Yield 5.11%
- --------------------------------------------------------------------------------
9/30/06 3/31/06
- --------------------------------------------------------------------------------
Weighted Average
Maturity 49 days 43 days
- --------------------------------------------------------------------------------
* The yields presented reflect the waiver of a portion of the fund's management
fees. Without such waiver, the 30-day yields would have been lower.
PORTFOLIO COMPOSITION BY MATURITY
- --------------------------------------------------------------------------------
% OF FUND % OF FUND
INVESTMENTS INVESTMENTS
AS OF AS OF
9/30/06 3/31/06
- --------------------------------------------------------------------------------
1 -- 30 days 52% 63%
- --------------------------------------------------------------------------------
31 -- 90 days 34% 30%
- --------------------------------------------------------------------------------
91 -- 180 days 11% 3%
- --------------------------------------------------------------------------------
More than 180 days 3% 4%
- --------------------------------------------------------------------------------
Data presented reflect past performance. Past performance is no guarantee of
future results. Current performance may be higher or lower than the performance
shown. To obtain performance data current to the most recent month end, please
call 1-800-345-2021 or visit americancentury.com.
An investment in the fund is not insured or guaranteed by the Federal Deposit
Insurance Corporation or any other government agency. Although the fund seeks to
preserve the value of your investment at $1.00 per share, it is possible to lose
money by investing in the fund.
The 7-day current yield more closely reflects the current earnings of the fund
than the total return.
- ------
4
Premium Money Market - Portfolio Commentary
PORTFOLIO MANAGERS: LYNN PASCHEN AND STEVEN PERMUT
Premium Money Market returned 2.41%* for the six months ended September 30,
2006, well ahead of the 2.13% average return of the 357 funds in Lipper Inc.'s
money market funds category. The fund's six-month return ranked in the top 7% of
the Lipper category, and its longer-term performance rankings were similarly
strong (see page 3).
HIGHER BUT MORE STABLE MONEY MARKET RATES
Money market rates continued to rise over the past six months. Responding to
higher-than-expected inflation figures, the Federal Reserve raised short-term
interest rates in May and June, boosting the federal funds rate to 5.25%, a
level not seen since March 2001. The three-month Treasury bill yield--a common
benchmark for money market rates--tracked the Fed rate hikes, rising from 4.6%
to just over 5% by the end of June.
However, after 17 consecutive rate increases between June 2004 and June 2006,
the Fed chose to keep short-term interest rates steady at its policy meetings in
August and September. The Fed made note of slowing economic activity and
expectations of moderating inflation, borne out by a decline in energy and
commodity prices. With the Fed on hold, money market rates stabilized and
trended slightly lower; the three-month Treasury bill yield ended the period at
4.9%.
PORTFOLIO STRATEGY
Premium Money Market's seven-day current yield increased from 4.31% to 4.99%
during the six-month period. For most of the period, we maintained an average
maturity of 40 to 50 days, though we extended it at various times when market
conditions warranted. For example, we extended the average maturity out to 55
days in September, when it became clear the Fed was taking a prolonged hiatus
from raising interest rates.
Sector weightings in the portfolio changed very little during the period. We
continued to invest a little more than half of the portfolio in commercial
paper, while modestly increasing our position in floating-rate corporate notes.
The yields of these floating-rate notes are tied to rate indexes that are
typically higher than prevailing commercial paper yields, making the
floating-rate notes attractive even in a stable-to-declining interest rate
environment.
LOOKING AHEAD
Based on historical averages, the Fed typically begins cutting short-term rates
about nine months after its final rate hike; the question is whether the Fed's
latest rate hike in June was the final one in the cycle. Economic and inflation
data in the coming months will provide some clues, and we believe money market
rates will remain relatively stable in the meantime.
Keep in mind that a money market fund like Premium Money Market can help
preserve capital and add stability to a diversified portfolio in any market
environment.
*Total returns for periods less than one year are not annualized.
- ------
5
Shareholder Fee Example (Unaudited)
Fund shareholders may incur two types of costs: (1) transaction costs, including
sales charges (loads) on purchase payments and redemption/exchange fees; and (2)
ongoing costs, including management fees; distribution and service (12b-1) fees;
and other fund expenses. This example is intended to help you understand your
ongoing costs (in dollars) of investing in your fund and to compare these costs
with the ongoing cost of investing in other mutual funds.
The example is based on an investment of $1,000 made at the beginning of the
period and held for the entire period from April 1, 2006 to September 30, 2006.
ACTUAL EXPENSES
The table provides information about actual account values and actual expenses
for each class. You may use the information, together with the amount you
invested, to estimate the expenses that you paid over the period. First,
identify the share class you own. Then simply divide your account value by
$1,000 (for example, an $8,600 account value divided by $1,000 = 8.6), then
multiply the result by the number under the heading "Expenses Paid During
Period" to estimate the expenses you paid on your account during this period.
If you hold Investor Class shares of any American Century fund, or Institutional
Class shares of the American Century Diversified Bond Fund, in an American
Century account (i.e., not a financial intermediary or retirement plan account),
American Century may charge you a $12.50 semiannual account maintenance fee if
the value of those shares is less than $10,000. We will redeem shares
automatically in one of your accounts to pay the $12.50 fee. In determining your
total eligible investment amount, we will include your investments in all
PERSONAL ACCOUNTS (including American Century Brokerage accounts) registered
under your Social Security number. PERSONAL ACCOUNTS include individual
accounts, joint accounts, UGMA/UTMA accounts, personal trusts, Coverdell
Education Savings Accounts and IRAs (including traditional, Roth, Rollover,
SEP-, SARSEP- and SIMPLE-IRAs), and certain other retirement accounts. If you
have only business, business retirement, employer-sponsored or American Century
Brokerage accounts, you are currently not subject to this fee. We will not
charge the fee as long as you choose to manage your accounts exclusively online.
If you are subject to the Account Maintenance Fee, your account value could be
reduced by the fee amount.
HYPOTHETICAL EXAMPLE FOR COMPARISON PURPOSES
The table also provides information about hypothetical account values and
hypothetical expenses based on the actual expense ratio of each class of your
fund and an assumed rate of return of 5% per year before expenses, which is not
the actual return of a fund's share class. The hypothetical account values and
expenses may not be used to estimate the actual ending account balance or
expenses you paid for the period. You may use this information to compare the
ongoing costs of investing in your fund and other funds. To do so, compare this
5% hypothetical example with the 5% hypothetical examples that appear in the
shareholder reports of the other funds.
(continued)
- ------
6
Shareholder Fee Example (Unaudited)
Please note that the expenses shown in the table are meant to highlight your
ongoing costs only and do not reflect any transactional costs, such as sales
charges (loads) or redemption/exchange fees. Therefore, the table is useful in
comparing ongoing costs only, and will not help you determine the relative total
costs of owning different funds. In addition, if these transactional costs were
included, your costs would have been higher.
- -------------------------------------------------------------------------------------------
EXPENSES PAID
BEGINNING ENDING DURING PERIOD(1) ANNUALIZED
ACCOUNT VALUE ACCOUNT VALUE 4/1/06 -- EXPENSE
4/1/06 9/30/06 9/30/06 RATIO(1)
- -------------------------------------------------------------------------------------------
PREMIUM MONEY MARKET SHAREHOLDER FEE EXAMPLE
- -------------------------------------------------------------------------------------------
Actual (after waiver)(2) $1,000 $1,024.10 $2.18 0.43%
- -------------------------------------------------------------------------------------------
Actual (before waiver) $1,000 $1024.10(3) $2.38 0.47%
- -------------------------------------------------------------------------------------------
Hypothetical (after waiver)(2) $1,000 $1,022.91 $2.18 0.43%
- -------------------------------------------------------------------------------------------
Hypothetical (before waiver) $1,000 $1,022.71 $2.38 0.47%
- -------------------------------------------------------------------------------------------
(1) Expenses are equal to the class's annualized expense ratio listed in the
table above, multiplied by the average account value over the period,
multiplied by 183, the number of days in the most recent fiscal half-year,
divided by 365, to reflect the one-half year period.
(2) During the six months ended September 30, 2006, the fund had received a
partial waiver of its management fees.
(3) Ending account value assumes the return earned after waiver. The return
would have been lower had fees not been waived and would have resulted in a
lower ending account value.
- ------
7
Premium Money Market - Schedule of Investments
SEPTEMBER 30, 2006 (UNAUDITED)
Principal Amount Value
- --------------------------------------------------------------------------------
COMMERCIAL PAPER(1) - 60.6%
- --------------------------------------------------------------------------------
$ 7,500,000 Allied Irish Banks N.A., 5.26%,
11/22/06 (Acquired 8/25/06,
Cost $7,402,471)(2) $ 7,443,017
- --------------------------------------------------------------------------------
4,000,000 American Family Financial
Services, 5.08%, 11/1/06 3,982,502
- --------------------------------------------------------------------------------
1,434,000 American Family Financial
Services, 5.25%, 1/25/07 1,409,741
- --------------------------------------------------------------------------------
15,000,000 American Family Financial
Services, 5.25%, 2/15/07 14,700,313
- --------------------------------------------------------------------------------
7,665,000 Amstel Funding Corp., 5.33%,
10/16/06 (Acquired 8/7/06,
Cost $7,585,561)(2) 7,647,978
- --------------------------------------------------------------------------------
2,351,000 Amstel Funding Corp., 5.37%,
10/20/06 (Acquired 8/3/06,
Cost $2,323,646)(2) 2,344,337
- --------------------------------------------------------------------------------
10,000,000 Amstel Funding Corp., 5.26%,
1/8/07 (Acquired 9/6/06,
Cost $9,821,744)(2) 9,855,350
- --------------------------------------------------------------------------------
21,700,000 Amsterdam Funding Corp., 5.28%,
11/6/06 (Acquired 8/11/06,
Cost $21,423,108)(2) 21,585,423
- --------------------------------------------------------------------------------
4,800,000 ANZ Inc., 5.26%, 11/22/06 4,763,531
- --------------------------------------------------------------------------------
10,000,000 ANZ Inc., 5.20%, 12/5/06 9,906,111
- --------------------------------------------------------------------------------
16,500,000 Canadian Imperial Holdings,
5.25%, 12/11/06 16,329,155
- --------------------------------------------------------------------------------
5,000,000 Cedar Springs Capital Co., 5.41%,
10/25/06 (Acquired 7/11/06,
Cost $4,920,353)(2) 4,981,967
- --------------------------------------------------------------------------------
9,000,000 Cedar Springs Capital Co., 5.29%,
11/14/06 (Acquired 8/16/06,
Cost $8,880,975)(2) 8,941,810
- --------------------------------------------------------------------------------
6,000,000 Cedar Springs Capital Co., 5.27%,
12/6/06 (Acquired 9/6/06,
Cost $5,920,072)(2) 5,942,030
- --------------------------------------------------------------------------------
5,000,000 Cedar Springs Capital Co., 5.24%,
3/12/07 (Acquired 9/13/06,
Cost $4,869,000)(2) 4,882,100
- --------------------------------------------------------------------------------
15,000,000 Citibank Credit Card Issuance
Trust, 5.25%, 11/6/06 (Acquired
9/5/06, Cost $14,864,375)(2) 14,921,250
- --------------------------------------------------------------------------------
10,000,000 CRC Funding LLC, 5.26%,
11/13/06 (Acquired 9/19/06,
Cost $9,919,639)(2) 9,937,172
- --------------------------------------------------------------------------------
25,000,000 Credit Suisse First Boston, 5.25%,
10/23/06 (Acquired 8/21/06,
Cost $24,770,313)(2) 24,919,791
- --------------------------------------------------------------------------------
16,410,000 Crown Point Capital Co., 5.39%,
10/11/06 (Acquired 7/11/06 -
7/17/06, Cost $16,185,228)(2) 16,385,429
- --------------------------------------------------------------------------------
8,500,000 Crown Point Capital Co., 5.27%,
11/6/06 (Acquired 8/22/06,
Cost $8,405,433)(2) 8,455,205
- --------------------------------------------------------------------------------
2,718,000 Danske Corporation, 5.375%,
10/2/06 (Acquired 9/29/06,
Cost $2,716,783)(2) 2,717,594
- --------------------------------------------------------------------------------
Principal Amount Value
- --------------------------------------------------------------------------------
$ 5,000,000 Danske Corporation, 5.29%,
12/18/06 (Acquired 8/16/06,
Cost $4,908,981)(2) $ 4,942,746
- --------------------------------------------------------------------------------
1,500,000 Depfa Bank plc, 5.10%,
10/19/06 (Acquired 5/12/06,
Cost $1,466,000)(2) 1,496,175
- --------------------------------------------------------------------------------
4,000,000 Depfa Bank plc, 5.26%, 12/1/06
(Acquired 9/1/06,
Cost $3,946,866)(2) 3,964,383
- --------------------------------------------------------------------------------
10,000,000 Emerald Notes of the MBNA,
5.28%, 12/6/06 (Acquired 9/7/06,
Cost $9,868,000)(2) 9,903,200
- --------------------------------------------------------------------------------
15,500,000 Fortis Funding LLC, 5.25%,
12/12/06 (Acquired 9/12/06,
Cost $15,294,302)(2) 15,337,250
- --------------------------------------------------------------------------------
6,700,000 General Electric Capital Corp.,
5.33%, 10/26/06 6,675,201
- --------------------------------------------------------------------------------
3,100,000 Govco Incorporated, 5.32%,
10/10/06 (Acquired 8/4/06,
Cost $3,069,307)(2) 3,095,877
- --------------------------------------------------------------------------------
12,000,000 Govco Incorporated, 5.27%,
10/16/06 (Acquired 8/23/06,
Cost $11,905,140)(2) 11,973,650
- --------------------------------------------------------------------------------
1,000,000 HBOS Treasury Services plc,
5.28%, 11/6/06 994,720
- --------------------------------------------------------------------------------
3,500,000 HBOS Treasury Services plc,
5.28%, 11/7/06 3,481,007
- --------------------------------------------------------------------------------
10,000,000 ING (U.S.) Funding LLC, 5.36%,
10/6/06 9,992,556
- --------------------------------------------------------------------------------
15,000,000 ING (U.S.) Funding LLC, 5.25%,
12/4/06 14,860,000
- --------------------------------------------------------------------------------
14,000,000 IXIS, 5.35%, 10/4/06 (Acquired
7/18/06, Cost $13,837,717)(2) 13,993,759
- --------------------------------------------------------------------------------
1,350,000 IXIS, 5.28%, 1/4/07 (Acquired
8/16/06, Cost $1,322,082)(2) 1,331,190
- --------------------------------------------------------------------------------
7,579,000 Legacy Capital LLC, 5.26%,
10/5/06 (Acquired 9/21/06,
Cost $7,563,497)(2) 7,574,571
- --------------------------------------------------------------------------------
2,880,000 Legacy Capital LLC, 5.40%,
10/16/06 (Acquired 7/25/06,
Cost $2,844,144)(2) 2,873,520
- --------------------------------------------------------------------------------
4,000,000 Legacy Capital LLC, 5.26%,
1/4/07 (Acquired 9/25/06,
Cost $3,940,971)(2) 3,944,478
- --------------------------------------------------------------------------------
10,000,000 Legacy Capital LLC, 5.26%,
1/10/07 (Acquired 9/12/06,
Cost $9,824,667)(2) 9,852,428
- --------------------------------------------------------------------------------
11,659,000 Lexington Parker Capital, 5.40%,
10/11/06 (Acquired 7/14/06 -
7/24/06, Cost $11,510,443)(2) 11,641,525
- --------------------------------------------------------------------------------
2,783,000 Lexington Parker Capital, 5.09%,
10/20/06 (Acquired 5/12/06,
Cost $2,719,649)(2) 2,775,524
- --------------------------------------------------------------------------------
10,000,000 Lexington Parker Capital, 5.28%,
11/2/06 (Acquired 8/23/06,
Cost $9,895,867)(2) 9,953,067
- --------------------------------------------------------------------------------
10,000,000 Merrill Lynch & Co., Inc., 5.34%,
10/3/06 9,997,033
- --------------------------------------------------------------------------------
See Notes to Financial Statements.
(continued)
- ------
8
Premium Money Market - Schedule of Investments
SEPTEMBER 30, 2006 (UNAUDITED)
Principal Amount Value
- --------------------------------------------------------------------------------
$ 1,175,000 Nestle Capital Corp., 5.17%,
8/13/07 (Acquired 8/23/06,
Cost $1,115,154)(2) $ 1,121,729
- --------------------------------------------------------------------------------
2,527,000 Nieuw Amsterdam Rec, 5.40%,
10/6/06 (Acquired 7/10/06,
Cost $2,493,644)(2) 2,525,105
- --------------------------------------------------------------------------------
8,000,000 Nieuw Amsterdam Rec, 5.39%,
10/10/06 (Acquired 7/11/06,
Cost $7,891,002)(2) 7,989,220
- --------------------------------------------------------------------------------
8,500,000 Nieuw Amsterdam Rec, 5.27%,
10/12/06 (Acquired 9/12/06,
Cost $8,462,671)(2) 8,486,313
- --------------------------------------------------------------------------------
2,000,000 Paradigm Funding LLC, 5.27%,
10/6/06 (Acquired 9/6/06,
Cost $1,991,217)(2) 1,998,536
- --------------------------------------------------------------------------------
10,000,000 Paradigm Funding LLC, 5.27%,
1/8/07 (Acquired 9/15/06,
Cost $9,831,813)(2) 9,855,213
- --------------------------------------------------------------------------------
7,500,000 Ranger Funding Co. LLC, 5.39%,
10/16/06 (Acquired 7/18/06,
Cost $7,398,938)(2) 7,483,157
- --------------------------------------------------------------------------------
2,300,000 Spintab AB, 5.27%, 11/27/06 2,280,808
- --------------------------------------------------------------------------------
17,000,000 Spintab AB, 5.26%, 12/5/06 16,838,546
- --------------------------------------------------------------------------------
7,500,000 Stadshypotek Deleware, Inc., 5.26%,
10/16/06 (Acquired 8/23/06,
Cost $7,440,825)(2) 7,483,562
- --------------------------------------------------------------------------------
12,400,000 Stadshypotek Deleware, Inc., 5.30%,
10/30/06 (Acquired 8/8/06 -
8/10/06, Cost $12,249,317)(2) 12,347,034
- --------------------------------------------------------------------------------
4,900,000 Stadshypotek Deleware, Inc., 5.27%,
11/15/06 (Acquired 8/17/06,
Cost $4,835,443)(2) 4,867,721
- --------------------------------------------------------------------------------
10,000,000 Toyota Motor Credit Corp., 5.05%,
12/28/06 9,876,531
- --------------------------------------------------------------------------------
2,000,000 Tulip Funding Corp., 5.27%,
11/15/06 (Acquired 8/22/06,
Cost $1,975,114)(2) 1,986,825
- --------------------------------------------------------------------------------
7,500,000 UBS Finance LLC, 5.38%, 10/6/06 7,494,396
- --------------------------------------------------------------------------------
10,000,000 Variable Funding
Capital Co. LLC, VRN, 5.28%,
10/12/06, resets monthly off the
1-month LIBOR minus 0.05% with
no caps (Acquired 8/9/06,
Cost $10,000,000)(2) 10,000,000
- --------------------------------------------------------------------------------
10,500,000 Variable Funding Corp., 5.36%,
10/2/06 (Acquired 9/29/06, Cost
$10,495,310)(2) 10,498,437
- --------------------------------------------------------------------------------
14,000,000 Yorktown Capital LLC, 5.25%,
10/18/06 (Acquired 9/13/06,
Cost $13,928,542)(2) 13,965,292
- --------------------------------------------------------------------------------
TOTAL COMMERCIAL PAPER 499,804,091
- --------------------------------------------------------------------------------
CORPORATE BONDS - 21.1%
- --------------------------------------------------------------------------------
5,000,000 Allied Irish Banks (New York),
VRN, 5.33%, 10/16/06, resets
monthly off the 1-month LIBOR
minus 0.005% with no caps 5,000,247
- --------------------------------------------------------------------------------
Principal Amount Value
- --------------------------------------------------------------------------------
$ 5,000,000 American Honda Finance Corp.,
VRN, 5.66%, 10/6/06, resets
quarterly off the 3-month LIBOR
plus 0.17% with no caps (Acquired
4/6/06, Cost $5,005,000)(2) $ 5,000,140
- --------------------------------------------------------------------------------
2,500,000 American Honda Finance Corp.,
VRN, 5.65%, 10/16/06, resets
quarterly off the 3-month LIBOR
plus 0.14% with no caps (Acquired 8/23/06,
Cost $2,502,075)(2) 2,501,531
- --------------------------------------------------------------------------------
3,000,000 American Honda Finance Corp.,
VRN, 5.50%, 10/18/06, resets
quarterly off the 3-month LIBOR
with no caps (Acquired 6/22/06,
Cost $2,999,760)(2) 2,999,965
- --------------------------------------------------------------------------------
4,000,000 American Honda Finance Corp.,
VRN, 5.52%, 11/20/06, resets
quarterly off the 3-month LIBOR
plus 0.13% with no caps (Acquired
9/19/06, Cost $4,002,676)(2) 4,002,517
- --------------------------------------------------------------------------------
10,000,000 Bank of America N.A., VRN, 5.36%,
11/24/06, resets quarterly off the
3-month LIBOR minus 0.05%
with no caps 10,000,000
- --------------------------------------------------------------------------------
3,545,000 Christopher Place Inc., VRN, 5.42%,
10/5/06 (LOC: Fifth Third Bank) 3,545,000
- --------------------------------------------------------------------------------
2,425,000 Coastal Area Stores Inc./Tattnall
Foods Inc., VRN, 5.37%, 10/5/06
(LOC: Columbus Bank & Trust) 2,425,000
- --------------------------------------------------------------------------------
3,465,000 CPR Investments LLC, VRN, 5.37%,
10/5/06 3,465,000
- --------------------------------------------------------------------------------
16,375,000 Cunat Sheffield Heights LLC, VRN,
5.36%, 10/5/06 16,375,000
- --------------------------------------------------------------------------------
1,000,000 Fifth Third Bancorp, 2.70%,
1/30/07 990,517
- --------------------------------------------------------------------------------
2,000,000 First Baptist Church of Opelika,
VRN, 5.33%, 10/5/06 2,000,000
- --------------------------------------------------------------------------------
8,000,000 Florida Hurricane Catastrophe
Fund, Series 2006 B, VRN,
5.34%, 10/16/06, resets monthly
off the 1-month LIBOR plus
0.01% with no caps 8,000,000
- --------------------------------------------------------------------------------
4,545,000 Green Island Country Club Inc.,
VRN, 5.37%, 10/5/06
(LOC: Columbus Bank & Trust) 4,545,000
- --------------------------------------------------------------------------------
8,575,000 Guardian Angel Homes
Lewiston LLC, VRN, 5.37%,
10/5/06 8,575,000
- --------------------------------------------------------------------------------
1,000,000 HBOS Treasury Services plc,
3.125%, 1/12/07 (Acquired
9/19/06, Cost $992,650)(2) 993,359
- --------------------------------------------------------------------------------
16,100,000 HBOS Treasury Services plc,
VRN, 5.58%, 10/12/06, resets
quarterly off the 3-month LIBOR
plus 0.08% with no caps
(Acquired 1/12/06 - 8/9/06,
Cost $16,114,350)(2) 16,106,863
- --------------------------------------------------------------------------------
See Notes to Financial Statements.
(continued)
- ------
9
Premium Money Market - Schedule of Investments
SEPTEMBER 30, 2006 (UNAUDITED)
Principal Amount Value
- --------------------------------------------------------------------------------
$ 5,950,000 Lee Group Inc./County
Materials Inc./Lees Aggregate
& Trucking Inc., VRN, 5.43%,
10/5/06 (LOC: FHLB) $ 5,950,000
- --------------------------------------------------------------------------------
13,000,000 OSS Realty Co., VRN, 5.40%,
10/5/06 (LOC: SunTrust Bank) 13,000,000
- --------------------------------------------------------------------------------
4,000,000 Royal Bank of Scotland plc, VRN,
5.41%, 11/24/06, resets quarterly
off the 3-month LIBOR plus
0.01% with no caps (Acquired 5/12/06,
Cost $4,000,680)(2) 4,000,187
- --------------------------------------------------------------------------------
2,000,000 Salvation Army, Series 2004 A,
VRN, 5.33%, 10/5/06
(LOC: Bank of New York) 2,000,000
- --------------------------------------------------------------------------------
2,400,000 Santa Rosa Property Holding LLC,
VRN, 5.37%, 10/5/06, resets
monthly off the 1-month LIBOR
with no caps 2,400,000
- --------------------------------------------------------------------------------
3,830,000 Six Ten Properties LLC, VRN,
5.37%, 10/5/06 (LOC: Columbus
Bank & Trust) 3,830,000
- --------------------------------------------------------------------------------
1,860,000 St. Mary's Congregation, VRN,
5.47%, 10/5/06 (LOC: Marshall
& Isley Bank) 1,860,000
- --------------------------------------------------------------------------------
5,000,000 Transamerica Occidental Life
Insurance Co., VRN, 5.60%,
11/1/06, resets quarterly off the
3-month LIBOR plus 0.11% with
no caps (Acquired 11/9/99,
Cost $5,000,000)(2) 5,000,000
- --------------------------------------------------------------------------------
9,000,000 Travelers Insurance Co. Group,
VRN, 5.54%, 11/7/06, resets
quarterly off the 3-month LIBOR
plus 0.06% with no caps (Acquired
8/7/03, Cost $9,000,000)(2) 9,000,000
- --------------------------------------------------------------------------------
10,000,000 Wachovia Bank N.A., VRN, 5.46%,
12/30/06, resets quarterly off
the 3-month LIBOR minus 0.04%
with no caps 10,000,066
- --------------------------------------------------------------------------------
10,000,000 Wal-Mart Stores, Inc., VRN,
5.26%, 12/28/06, resets quarterly
off the 3-month LIBOR minus
0.10% with no caps 9,998,052
- --------------------------------------------------------------------------------
10,000,000 Wal-Mart Stores, Inc., VRN,
5.88%, 6/1/07 10,033,740
- --------------------------------------------------------------------------------
TOTAL CORPORATE BONDS 173,597,184
- --------------------------------------------------------------------------------
MUNICIPAL SECURITIES - 11.6%
- --------------------------------------------------------------------------------
600,000 American National Fish & Wildlife
Museum District Rev., Series
2004 B, VRDN, 5.42%, 10/5/06
(LOC: Commerce Bank N.A.) 600,000
- --------------------------------------------------------------------------------
680,000 Board Trustees Morgan County
Memorial Hospital Rev.,
(Johnson County), VRDN, 5.49%, 10/5/06
(LOC: Fifth Third Bank) 680,000
- --------------------------------------------------------------------------------
1,625,000 Calexico Unified School District COP,
(Refinancing Project),
VRDN, 5.35%, 10/5/06 (XLCA)
(SBBPA: Wachovia Bank N.A.) 1,625,000
- --------------------------------------------------------------------------------
Principal Amount Value
- --------------------------------------------------------------------------------
$ 1,360,000 California Infrastructure &
Economic Development Bank Rev.,
Series 2000 B, (Metrotile
Manufacturing), VRDN, 5.43%,
10/5/06 (LOC: Comerica Bank) $ 1,360,000
- --------------------------------------------------------------------------------
10,000,000 California Pollution Control
Financing Auth. Rev., Series 2001 A,
(Cheese & Protein International,
LLC), VRDN, 5.32%, 10/5/06
(LOC: JPMorgan Chase Bank) 10,000,000
- --------------------------------------------------------------------------------
300,000 California Statewide Communities
Development Auth. Rev.,
(Industrial Improvements), VRDN,
5.41%, 10/5/06
(LOC: Bank of the West) 300,000
- --------------------------------------------------------------------------------
840,000 Colorado Housing & Finance Auth.
Rev., Series 2004 B, (Corey Building),
VRDN, 5.43%, 10/5/06
(LOC: Guaranty Bank & Trust and
Wells Fargo Bank N.A.) 840,000
- --------------------------------------------------------------------------------
920,000 Colorado Housing & Finance Auth.
Rev., Series 2004 B, (Taxable
POPIEL Properties), VRDN,
5.41%, 10/5/06 (LOC: Guaranty Bank &
Trust and Wells Fargo Bank N.A.) 920,000
- --------------------------------------------------------------------------------
2,110,000 Colorado Housing & Finance Auth.
Rev., Series 2005 B, (Closet
Factory), VRDN, 5.43%, 10/5/06
(LOC: Bank of New York) 2,110,000
- --------------------------------------------------------------------------------
1,000,000 Columbus Development Auth. Rev.,
(CEDC/ICFORM Inc.), VRDN, 5.42%,
10/5/06 (LOC: Columbus
Bank & Trust) 1,000,000
- --------------------------------------------------------------------------------
2,000,000 Columbus Development Auth.
Rev., (Columbus Park East), VRDN,
5.37%, 10/5/06 (LOC: Columbus
Bank & Trust) 2,000,000
- --------------------------------------------------------------------------------
1,400,000 Columbus Development Auth. Rev.,
Series 2005 B, (Foundation
Properties, Inc., Student
Housing), VRDN, 5.38%, 10/5/06
(LOC: Columbus Bank & Trust) 1,400,000
- --------------------------------------------------------------------------------
3,155,000 Columbus Development Auth. Rev.,
VRDN, 5.37%, 10/5/06
(LOC: Columbus Bank & Trust) 3,155,000
- --------------------------------------------------------------------------------
5,000,000 Cook County GO, Series 2005 D,
(Public Improvements), VRDN,
5.34%, 10/4/06 (SBBPA: Depfa
Bank plc) 5,000,000
- --------------------------------------------------------------------------------
5,105,000 Cook County Industrial Development
Rev., Series 1999 B, (Devorahco LLC),
VRDN, 5.36%, 10/5/06
(LOC: LaSalle Bank N.A.)
(Acquired 3/23/01,
Cost $5,105,000)(2) 5,105,000
- --------------------------------------------------------------------------------
925,000 Crawford Education Facilities
Corp. Rev., Series 2004 B,
(Refunding Taxable University
Package), VRDN, 5.42%, 10/5/06
(LOC: BNP Paribas) 925,000
- --------------------------------------------------------------------------------
See Notes to Financial Statements.
(continued)
- ------
10
Premium Money Market - Schedule of Investments
SEPTEMBER 30, 2006 (UNAUDITED)
Principal Amount Value
- --------------------------------------------------------------------------------
$ 5,000,000 Fairfield Rev., Series 2005 A-2,
VRDN, 5.32%, 10/5/06 (LOC:
Landesbank Hessen-Thuringen
Girozentrale) $ 5,000,000
- --------------------------------------------------------------------------------
500,000 Greenville South Carolina
Memorial Auditorium District COP,
Series 1996 C, (BI-LO
Center), VRDN, 5.42%, 10/4/06
(LOC: Bank of America N.A.) 500,000
- --------------------------------------------------------------------------------
6,285,000 Kansas City Missouri Tax
Increment Rev., Series 2003 B,
(Chouteau Development Company
LLC), VRDN, 5.35%, 10/5/06 (MBIA)
(SBBPA: JPMorgan Chase Bank) 6,285,000
- --------------------------------------------------------------------------------
7,500,000 Mississippi Business Finance
Corp. Rev., Series 2005, (Future Pipe
Industries, Inc.) VRDN, 5.33%,
10/5/06 (LOC: Mashreqbank and
Bank of New York) 7,500,000
- --------------------------------------------------------------------------------
3,000,000 Mississippi Business Finance
Corp. Rev., Series 2006 R-1,
(Aurora Flight Sciences Corporation),
VRDN, 5.33%, 10/5/06
(LOC: Cadence Bank N.A. and FHLB) 3,000,000
- --------------------------------------------------------------------------------
7,615,000 Montebello COP, VRDN, 5.38%,
10/4/06 (LOC: Union Bank of
California N.A. and California State
Teacher's Retirement System) 7,615,000
- --------------------------------------------------------------------------------
280,000 Nebraska Investment Finance
Auth. Multifamily Rev., Series 2001 B,
(Riverbend Apartments), VRDN, 5.44%,
10/5/06 (LOC: LaSalle Bank N.A.)
(Acquired 9/5/01, Cost $280,000)(2) 280,000
- --------------------------------------------------------------------------------
1,000,000 New Jersey Economic Development
Auth. Rev., Series 2006 B,
(Accurate Box Co., Inc.), VRDN,
5.37%, 12/1/06 (LOC: SunTrust Bank) 1,000,000
- --------------------------------------------------------------------------------
4,820,000 New Orleans Rev., VRDN, 5.55%,
10/5/06 (Ambac) (SBBPA: Bank
One Louisiana) 4,820,000
- --------------------------------------------------------------------------------
3,000,000 Ogden City Redevelopment Ageny
Rev., Series 2005 C1, VRDN,
5.48%, 10/3/06 (LOC: Bank of
New York) 3,000,000
- --------------------------------------------------------------------------------
1,220,000 Ontario County Industrial
Development Agency Rev.,
Series 2005 B, (Friends of the
Finger Lakes Performing Arts
Center, Inc. Civic Facility),
VRDN, 5.60%, 10/2/06 (LOC: Citizens
Bank NA) 1,220,000
- --------------------------------------------------------------------------------
1,700,000 Oregon State Facilities Auth. Rev.,
(Hazelden Springbrook), VRDN,
5.45%, 10/5/06 (LOC: Allied Irish Bank plc) 1,700,000
- --------------------------------------------------------------------------------
Principal Amount Value
- --------------------------------------------------------------------------------
$ 2,000,000 Osceola County Housing Finance
Auth. Rev., Series 2002 B,
(Regatta Bay Apartments), VRDN,
5.42%, 10/4/06 (LOC: FNMA) $ 2,000,000
- --------------------------------------------------------------------------------
100,000 Palm Beach County Florida
Housing Finance Auth. Rev.,
Series 2003 B, (Renaissance),
VRDN, 5.42%, 10/4/06 (FNMA)
(LIQ FAC: FNMA) 100,000
- --------------------------------------------------------------------------------
3,900,000 Southeast Alabama Gas District
Rev., (Lateral Project), VRDN, 5.33%,
10/5/06 (Ambac) (SBBPA: AmSouth
Bank of Alabama) 3,900,000
- --------------------------------------------------------------------------------
2,500,000 Southeast Industrial Development
Agency Rev., (Powers Fasteners),
VRDN, 5.43%, 10/5/06 (LOC:
Bank of New York) 2,500,000
- --------------------------------------------------------------------------------
2,250,000 Vermont Economic Development
Auth. Rev., Series 2006 D, (Wake
Robin Corp.), VRDN, 5.35%,
10/5/06 (LOC: Sovereign Bank FSB and
Lloyds TSB Bank plc) 2,250,000
- --------------------------------------------------------------------------------
3,355,000 Washington Economic Development
Finance Auth. Rev., Series 2006 G,
(Wesmar Company, Inc.),
VRDN, 5.37%, 10/4/06 (LOC: U.S.
Bank N.A.) 3,355,000
- --------------------------------------------------------------------------------
2,500,000 West Covina Public Financing
Auth. Tax Allocation Rev., Series 1999,
(Redevelopment Agency & Sub-Lien),
VRDN, 5.41%, 10/5/06
(LOC: Allied Irish Bank plc) 2,500,000
- --------------------------------------------------------------------------------
TOTAL MUNICIPAL SECURITIES 95,545,000
- --------------------------------------------------------------------------------
CERTIFICATES OF DEPOSIT - 6.7%
- --------------------------------------------------------------------------------
20,000,000 Calyon New York, 5.35%,
11/13/06 20,000,000
- --------------------------------------------------------------------------------
10,000,000 Citibank N.A., 5.33%, 12/14/06
(Acquired 9/11/06,
Cost $10,000,000)(2) 10,000,000
- --------------------------------------------------------------------------------
7,000,000 Citizens Bank of Massachusetts,
5.34%, 12/29/06 7,000,000
- --------------------------------------------------------------------------------
10,000,000 First Tennessee Bank N.A., 5.27%,
10/16/06 (Acquired 9/15/06,
Cost $10,000,000)(2) 10,000,000
- --------------------------------------------------------------------------------
8,100,000 Royal Bank of Scotland
(New York), 4.82%, 1/18/07
(Acquired 12/21/05,
Cost $8,101,768)(2) 8,100,490
- --------------------------------------------------------------------------------
TOTAL CERTIFICATES OF DEPOSIT 55,100,490
- --------------------------------------------------------------------------------
See Notes to Financial Statements.
(continued)
- ------
11
Premium Money Market - Schedule of Investments
SEPTEMBER 30, 2006 (UNAUDITED)
Principal Value
- -------------------------------------------------------------------------------
U.S. GOVERNMENT AGENCY SECURITIES - 6.1%
- -------------------------------------------------------------------------------
$ 5,000,000 FHLB, 5.00%, 1/29/07 $ 5,000,000
- -------------------------------------------------------------------------------
5,000,000 FHLB, 4.80%, 2/23/07 5,000,000
- -------------------------------------------------------------------------------
10,000,000 FHLB, 4.89%, 3/5/07 10,000,000
- -------------------------------------------------------------------------------
10,000,000 FHLB, 5.58%, 8/14/07 10,000,000
- -------------------------------------------------------------------------------
10,000,000 FHLB, 5.50%, 8/21/07 10,005,945
- -------------------------------------------------------------------------------
10,000,000 FHLB, VRN, 5.50%, 10/27/06(3) 10,000,000
- -------------------------------------------------------------------------------
TOTAL U.S. GOVERNMENT
AGENCY SECURITIES 50,005,945
- -------------------------------------------------------------------------------
Value
- -------------------------------------------------------------------------------
TOTAL INVESTMENT
SECURITIES - 106.1% $ 874,052,710
- -------------------------------------------------------------------------------
OTHER ASSETS AND
LIABILITIES - (6.1)% (49,925,955)
- -------------------------------------------------------------------------------
TOTAL NET ASSETS - 100.0% $ 824,126,755
===============================================================================
NOTES TO SCHEDULE OF INVESTMENTS
Ambac = Ambac Assurance Corporation
COP = Certificates of Participation
FHLB = Federal Home Loan Bank
FNMA = Federal National Mortgage Association
GO = General Obligation
LIBOR = London Interbank Offered Rate
LIQ FAC = Liquidity Facilities
LOC = Letter of Credit
MBIA = MBIA Insurance Corporation
resets = The frequency with which a security's coupon changes, based on current
market conditions or an underlying index. The more frequently a security resets,
the less risk the investor is taking that the coupon will vary significantly
from current market rates.
SBBPA = Standby Bond Purchase Agreement
VRDN = Variable Rate Demand Note. Interest reset date is indicated. Rate shown
is effective September 30, 2006.
VRN = Variable Rate Note. Interest reset date is indicated. Rate shown is
effective September 30, 2006.
XLCA = XL Capital Ltd.
(1) The rate indicated is the yield to maturity at purchase.
(2) Security was purchased under Rule 144A or Section 4(2) of the Securities
Act of 1933 or is a private placement and, unless registered under the Act
or exempted from registration, may only be sold to qualified institutional
investors. The aggregate value of restricted securities at September 30,
2006 was $449,311,992, which represented 54.5% of total net assets.
Restricted securities considered illiquid represent 1.7% of total net
assets.
(3) Step-coupon security. Coupon increases quarterly at a predetermined rate.
Rate shown is effective September 30, 2006.
See Notes to Financial Statements.
- ------
12
Statement of Assets and Liabilities
SEPTEMBER 30, 2006 (UNAUDITED)
- --------------------------------------------------------------------------------
ASSETS
- --------------------------------------------------------------------------------
Investment securities, at value (amortized cost
and cost for federal income tax purposes) $874,052,710
- -------------------------------------------------------------
Cash 133,467
- -------------------------------------------------------------
Receivable for capital shares sold 2,003,153
- -------------------------------------------------------------
Interest receivable 2,808,423
- -------------------------------------------------------------
Prepaid portfolio insurance 35,908
- --------------------------------------------------------------------------------
879,033,661
- --------------------------------------------------------------------------------
LIABILITIES
- --------------------------------------------------------------------------------
Payable for capital shares redeemed 54,055,893
- -------------------------------------------------------------
Accrued management fees 272,407
- -------------------------------------------------------------
Dividends payable 578,606
- --------------------------------------------------------------------------------
54,906,906
- --------------------------------------------------------------------------------
NET ASSETS $824,126,755
================================================================================
CAPITAL SHARES
- --------------------------------------------------------------------------------
Outstanding (unlimited number of shares authorized) 824,137,926
================================================================================
NET ASSET VALUE PER SHARE $1.00
================================================================================
NET ASSETS CONSIST OF:
- --------------------------------------------------------------------------------
Capital paid in $824,131,856
- -------------------------------------------------------------
Accumulated net realized loss on investment transactions (5,101)
- --------------------------------------------------------------------------------
$824,126,755
================================================================================
See Notes to Financial Statements.
- ------
13
Statement of Operations
FOR THE SIX MONTHS ENDED SEPTEMBER 30, 2006 (UNAUDITED)
- --------------------------------------------------------------------------------
INVESTMENT INCOME
- --------------------------------------------------------------------------------
INCOME:
- ---------------------------------------------------------------
Interest $19,953,921
- --------------------------------------------------------------------------------
EXPENSES:
- ---------------------------------------------------------------
Management fees 1,724,879
- ---------------------------------------------------------------
Trustees' fees and expenses 13,620
- ---------------------------------------------------------------
Portfolio insurance 53,748
- --------------------------------------------------------------------------------
1,792,247
Amount waived (173,475)
- --------------------------------------------------------------------------------
1,618,772
- --------------------------------------------------------------------------------
NET INVESTMENT INCOME 18,335,149
- --------------------------------------------------------------------------------
NET REALIZED GAIN (LOSS) ON INVESTMENT TRANSACTIONS (131)
- --------------------------------------------------------------------------------
NET INCREASE (DECREASE) IN
NET ASSETS RESULTING FROM OPERATIONS $18,335,018
================================================================================
See Notes to Financial Statements.
- ------
14
Statement of Changes in Net Assets
SIX MONTHS ENDED SEPTEMBER 30, 2006 (UNAUDITED)
AND YEAR ENDED MARCH 31, 2006
- --------------------------------------------------------------------------------
INCREASE (DECREASE) IN NET ASSETS SEPT. 30, 2006 MARCH 31, 2006
- --------------------------------------------------------------------------------
OPERATIONS
- --------------------------------------------------------------------------------
Net investment income $ 18,335,149 $ 18,952,271
- ----------------------------------------------
Net realized gain (loss) (131) (4,225)
- --------------------------------------------------------------------------------
Net increase (decrease) in net assets
resulting from operations 18,335,018 18,948,046
- --------------------------------------------------------------------------------
DISTRIBUTIONS TO SHAREHOLDERS
From net investment income (18,335,149) (18,952,271)
- --------------------------------------------------------------------------------
CAPITAL SHARE TRANSACTIONS
Proceeds from shares sold 511,739,798 492,713,081
- ----------------------------------------------
Proceeds from reinvestment of distributions 14,721,620 15,788,464
- ----------------------------------------------
Payments for shares redeemed (343,584,018) (340,201,909)
- --------------------------------------------------------------------------------
Net increase (decrease) in net assets
from capital share transactions 182,877,400 168,299,636
- --------------------------------------------------------------------------------
NET INCREASE (DECREASE) IN NET ASSETS 182,877,269 168,295,411
- --------------------------------------------------------------------------------
NET ASSETS
- --------------------------------------------------------------------------------
Beginning of period 641,249,486 472,954,075
- --------------------------------------------------------------------------------
End of period $824,126,755 $641,249,486
================================================================================
TRANSACTIONS IN SHARES OF THE FUND
- --------------------------------------------------------------------------------
Sold 511,739,684 492,713,081
- ----------------------------------------------
Issued in reinvestment of distributions 14,721,620 15,788,464
- ----------------------------------------------
Redeemed (343,584,018) (340,201,909)
- --------------------------------------------------------------------------------
Net increase (decrease) in shares of the fund 182,877,286 168,299,636
================================================================================
See Notes to Financial Statements.
- ------
15
Notes to Financial Statements
SEPTEMBER 30, 2006 (UNAUDITED)
1. ORGANIZATION AND SUMMARY OF SIGNIFICANT ACCOUNTING POLICIES
ORGANIZATION -- American Century Investment Trust (the trust) is registered
under the Investment Company Act of 1940 (the 1940 Act) as an open-end
management investment company. Premium Money Market Fund (the fund) is one fund
in a series issued by the trust. The fund is diversified under the 1940 Act. The
fund's investment objective is to earn the highest level of current income while
preserving the value of your investment. The following is a summary of the
fund's significant accounting policies.
SECURITY VALUATIONS -- Securities are generally valued at amortized cost, which
approximates current market value. When such valuations do not reflect market
value, securities may be valued as determined in accordance with procedures
adopted by the Board of Trustees.
SECURITY TRANSACTIONS -- Security transactions are accounted for as of the trade
date. Net realized gains and losses are determined on the identified cost basis,
which is also used for federal income tax purposes.
INVESTMENT INCOME -- Interest income is recorded on the accrual basis and
includes accretion of discounts and amortization of premiums.
REPURCHASE AGREEMENTS -- The fund may enter into repurchase agreements with
institutions that American Century Investment Management, Inc. (ACIM) (the
investment advisor) has determined are creditworthy pursuant to criteria adopted
by the Board of Trustees. Each repurchase agreement is recorded at cost. The
fund requires that the collateral, represented by securities, received in a
repurchase transaction be transferred to the custodian in a manner sufficient to
enable the fund to obtain those securities in the event of a default under the
repurchase agreement. ACIM monitors, on a daily basis, the securities
transferred to ensure the value, including accrued interest, of the securities
under each repurchase agreement is equal to or greater than amounts owed to the
fund under each repurchase agreement.
JOINT TRADING ACCOUNT -- Pursuant to an Exemptive Order issued by the Securities
and Exchange Commission, the fund, along with other registered investment
companies having management agreements with ACIM or American Century Global
Investment Management, Inc. (ACGIM), may transfer uninvested cash balances into
a joint trading account. These balances are invested in one or more repurchase
agreements that are collateralized by U.S. Treasury or Agency obligations.
WHEN-ISSUED AND FORWARD COMMITMENTS -- The fund may engage in securities
transactions on a when-issued or forward commitment basis. Under these
arrangements, the securities' prices and yields are fixed on the date of the
commitment, but payment and delivery are scheduled for a future date. During
this period, securities are subject to market fluctuations. The fund will
segregate cash, cash equivalents or other appropriate liquid securities on its
records in amounts sufficient to meet the purchase price.
INCOME TAX STATUS -- It is the fund's policy to distribute substantially all net
investment income and net realized gains to shareholders and to otherwise
qualify as a regulated investment company under provisions of the Internal
Revenue Code. Accordingly, no provision has been made for federal or state
income taxes.
DISTRIBUTIONS TO SHAREHOLDERS -- Distributions from net investment income and
short-term capital gains, if any, are declared daily and paid monthly. The fund
does not expect to realize any long-term capital gains, and accordingly, does
not expect to pay any capital gains distributions.
INDEMNIFICATIONS -- Under the trust's organizational documents, its officers and
trustees are indemnified against certain liabilities arising out of the
performance of their duties to the fund. In addition, in the normal course of
business, the fund enters into contracts that provide general indemnifications.
The fund's maximum exposure under these arrangements is unknown as this would
involve future claims that may be made against the fund. The risk of material
loss from such claims is considered by management to be remote.
USE OF ESTIMATES -- The financial statements are prepared in conformity with
accounting principles generally accepted in the United States of America, which
may require management to make certain estimates and assumptions at the date of
the financial statements. Actual results could differ from these estimates.
(continued)
- ------
16
Notes to Financial Statements
SEPTEMBER 30, 2006 (UNAUDITED)
2. FEES AND TRANSACTIONS WITH RELATED PARTIES
MANAGEMENT FEES -- The trust has entered into a Management Agreement with ACIM,
under which ACIM provides the fund with investment advisory and management
services in exchange for a single, unified management fee (the fee). The
Agreement provides that all expenses of the fund, except brokerage commissions,
taxes, portfolio insurance, interest, fees and expenses of those trustees who
are not considered "interested persons" as defined in the 1940 Act (including
counsel fees) and extraordinary expenses, will be paid by ACIM. The fee is
computed and accrued daily based on the daily net assets of the specific class
of shares of the fund and paid monthly in arrears. The fee consists of (1) an
Investment Category Fee based on the daily net assets of the funds and certain
other accounts managed by the investment manager that are in the same broad
investment category as the fund and (2) a Complex Fee based on the assets of all
the funds in the American Century family of funds. The rates for the Investment
Category Fee range from 0.1170% to 0.2300% and the rates for the Complex Fee
range from 0.2500% to 0.3100%. From July 29, 2005 to July 31, 2006, the
investment advisor voluntarily agreed to waive 0.030% of its management fee.
Effective August 1, 2006, the investment advisor voluntarily agreed to waive
0.071% of its management fee. This fee waiver may be revised or terminated at
any time without notice. The effective annual management fee for the fund before
waiver is 0.45%. The effective annual management fee for the fund after waiver
is 0.41%.
MONEY MARKET INSURANCE -- The fund, along with other money market funds managed
by ACIM, has entered into an insurance agreement with Ambac Assurance
Corporation (Ambac). Ambac provides limited coverage for certain loss events
including issuer defaults as to payment of principal or interest and insolvency
of a credit enhancement provider. The fund pays annual premiums to Ambac, which
are amortized daily over one year. For the six months ended September 30, 2006,
the annualized ratio of money market insurance expense to average net assets was
0.02%.
RELATED PARTIES -- Certain officers and trustees of the trust are also officers
and/or directors, and, as a group, controlling stockholders of American Century
Companies, Inc. (ACC), the parent of the trust's investment advisor, ACIM, the
distributor of the trust, American Century Investment Services, Inc., and the
trust's transfer agent, American Century Services, LLC.
JPMorgan Chase Bank is a custodian of the fund and a wholly owned subsidiary of
J.P. Morgan Chase & Co. (JPM). JPM is an equity investor in ACC.
3. FEDERAL TAX INFORMATION
The book-basis character of distributions made during the year from net
investment income or net realized gains may differ from their ultimate
characterization for federal income tax purposes. These differences reflect the
differing character of certain income items and net realized gains and losses
for financial statement and tax purposes, and may result in reclassification
among certain capital accounts on the financial statements.
As of March 31, 2006, the fund had accumulated net realized capital loss
carryovers for federal income tax purposes of $1,331, which may be used to
offset future taxable realized gains. Capital loss carryovers of $446 and $885
expire in 2013 and 2014, respectively.
As of March 31, 2006, the fund had capital loss deferrals of $3,524, which
represent net capital losses incurred in the five-month period ended March 31,
2006. The fund has elected to treat such losses as having been incurred in the
following fiscal year for federal income tax purposes.
4. RECENTLY ISSUED ACCOUNTING STANDARDS
In June 2006, the Financial Accounting Standards Board (FASB) issued
Interpretation No. 48, "Accounting for Uncertainty in Income Taxes -- an
Interpretation of FASB Statement No. 109" (FIN 48). FIN 48 establishes a minimum
threshold for financial statement recognition of the benefit of positions taken
in filing tax returns (including whether an entity is taxable in a particular
jurisdiction), and requires certain expanded tax disclosures. FIN 48 is
effective for fiscal years beginning after December 15, 2006, and is to be
applied to all open tax years as of the date of effectiveness. The FASB issued
Statement of Financial Accounting Standards No. 157, "Fair Value Measurements"
(FAS 157), in September 2006, which is effective for fiscal years beginning
after November 15, 2007. FAS 157 defines fair value, establishes a framework for
measuring fair value and expands the required financial statement disclosures
about fair value measurements. Management is currently evaluating the impact of
adopting FIN 48 and FAS 157.
- ------
17
Premium Money Market - Financial Highlights
For a Share Outstanding Throughout the Years Ended March 31 (except as noted)
- ---------------------------------------------------------------------------------------------
2006(1) 2006 2005 2004 2003 2002
- ---------------------------------------------------------------------------------------------
PER-SHARE DATA
- ---------------------------------------------------------------------------------------------
Net Asset Value,
Beginning of Period $1.00 $1.00 $1.00 $1.00 $1.00 $1.00
- ---------------------------------------------------------------------------------------------
Income From
Investment Operations
- ------------------------
Net Investment Income 0.02 0.03 0.01 0.01 0.01 0.03
- ---------------------------------------------------------------------------------------------
Distributions
- ------------------------
From Net
Investment Income (0.02) (0.03) (0.01) (0.01) (0.01) (0.03)
- ---------------------------------------------------------------------------------------------
Net Asset Value,
End of Period $1.00 $1.00 $1.00 $1.00 $1.00 $1.00
=============================================================================================
TOTAL RETURN(2) 2.41% 3.41% 1.33% 0.74% 1.32% 3.03%
- ---------------------------------------------------------------------------------------------
RATIOS/SUPPLEMENTAL DATA
- ---------------------------------------------------------------------------------------------
Ratio of Operating
Expenses to
Average Net Assets 0.43%(3)(4) 0.45%(3) 0.48% 0.47% 0.47% 0.46%
- ------------------------
Ratio of Operating
Expenses to Average
Net Assets (Before
Expense Waiver) 0.47%(4) 0.47% 0.48% 0.47% 0.47% 0.46%
- ------------------------
Ratio of Net Investment
Income to
Average Net Assets 4.80%(3)(4) 3.41%(3) 1.31% 0.73% 1.32% 2.91%
- ------------------------
Ratio of Net Investment
Income to
Average Net Assets
(Before Expense waiver) 4.76%(4) 3.39% 1.31% 0.73% 1.32% 2.91%
- ------------------------
Net Assets, End of Period
(in thousands) $824,127 $641,249 $472,954 $479,341 $560,991 $575,389
- ---------------------------------------------------------------------------------------------
(1) Six months ended September 30, 2006 (unaudited).
(2) Total return assumes reinvestment of net investment income and capital
gains distributions, if any. Total returns for periods less than one year
are not annualized.
(3) Effective July 29, 2005, the investment advisor voluntarily agreed to waive
a portion of the management fee.
(4) Annualized.
See Notes to Financial Statements.
- ------
18
Approval of Management Agreement for Premium Money Market
Under Section 15(c) of the Investment Company Act, contracts for investment
advisory services are required to be reviewed, evaluated and approved by a
majority of a fund's independent directors or trustees (the "Directors") each
year. At American Century, this process is referred to as the "15(c) Process."
As a part of this process, the board reviews fund performance, shareholder
services, audit and compliance information, and a variety of other reports from
the advisor concerning fund operations. In addition to this annual review, the
board of directors oversees and evaluates on a continuous basis at its quarterly
meetings the nature and quality of significant services performed by the
advisor, fund performance, audit and compliance information, and a variety of
other reports relating to fund operations. The board, or committees of the
board, also holds special meetings as needed.
Under a Securities and Exchange Commission rule, each fund is required to
disclose in its annual or semiannual report, as appropriate, the material
factors and conclusions that formed the basis for the board's approval or
renewal of any advisory agreements within the fund's most recently completed
fiscal half-year period.
ANNUAL CONTRACT REVIEW PROCESS
As part of the annual 15(c) Process undertaken during the most recent fiscal
half-year period, the Directors reviewed extensive data and information compiled
by the advisor and certain independent providers of evaluative data (the "15(c)
Providers") concerning Premium Money Market (the "fund") and the services
provided to the fund under the management agreement. The information considered
and the discussions held at the meetings included, but were not limited to:
* the nature, extent and quality of investment management, shareholder
services and other services provided to the fund under the management
agreement;
* reports on the advisor's activities relating to the wide range of programs
and services the advisor provides to the fund and its shareholders on a
routine and non-routine basis;
* data comparing the cost of owning the fund to the cost of owning a similar
fund;
* data comparing the fund's performance to appropriate benchmarks and/or a
peer group of other mutual funds with similar investment objectives and
strategies;
* financial data showing the profitability of the fund to the advisor and the
overall profitability of the advisor; and
* data comparing services provided and charges to other investment management
clients of the advisor.
In keeping with its practice, the fund's board of directors held two regularly
scheduled meetings and one special meeting to review and discuss the information
provided by the advisor and to complete its negotiations with the advisor
regarding the renewal of the management agreement, including the setting of the
applicable advisory fee. The board also had the benefit of the advice of its
independent counsel throughout the period.
(continued)
- ------
19
Approval of Management Agreement for Premium Money Market
FACTORS CONSIDERED
The Directors considered all of the information provided by the advisor, the
15(c) Providers, and the board's independent counsel, and evaluated such
information for each fund for which the board has responsibility. The Directors
did not identify any single factor as being all-important or controlling, and
each Director may have attributed different levels of importance to different
factors. In deciding to renew the agreement under the terms ultimately
determined by the board to be appropriate, the Directors' decision was based on
the following factors.
NATURE, EXTENT AND QUALITY OF SERVICES -- GENERALLY. Under the management
agreement, the advisor is responsible for providing or arranging for all
services necessary for the operation of the fund. The board noted that under the
management agreement, the advisor provides or arranges at its own expense a wide
variety of services including:
* fund construction and design
* portfolio security selection
* initial capitalization/funding
* securities trading
* custody of fund assets
* daily valuation of the fund's portfolio
* shareholder servicing and transfer agency, including shareholder
confirmations, recordkeeping and communications
* legal services
* regulatory and portfolio compliance
* financial reporting
* marketing and distribution
The Directors noted that many of these services have expanded over time both in
terms of quantity and complexity in response to shareholder demands, competition
in the industry and the changing regulatory environment. In performing their
evaluation, the Directors considered information received in connection with the
annual review, as well as information provided on an ongoing basis at their
regularly scheduled board and committee meetings.
INVESTMENT MANAGEMENT SERVICES. The nature of the investment management services
provided is quite complex and allows fund shareholders access to professional
money management, instant diversification of their investments within an asset
class, the opportunity to easily diversify among asset classes, and liquidity.
In evaluating investment performance, the board expects the advisor to manage
the fund in accordance with its investment objectives and approved strategies.
In providing these services, the advisor utilizes teams of investment
professionals (portfolio managers, analysts, research assistants, and securities
traders) who require extensive information technology, research, training,
compliance and other systems to conduct their business. At each quarterly
meeting the Directors review investment performance information for the fund,
together with comparative information for appropriate benchmarks and peer groups
of funds managed similarly to the fund. The Directors also review detailed
performance information during the 15(c) Process comparing the fund's
performance with that of similar funds not managed by the advisor. If
performance concerns are identified, the Directors discuss with
(continued)
- ------
20
Approval of Management Agreement for Premium Money Market
the advisor the reasons for such results (e.g., market conditions, security
selection) and any efforts being undertaken to improve performance. The fund's
performance for both the one and three year periods was above the median for its
peer group.
SHAREHOLDER AND OTHER SERVICES. The advisor provides the fund with a
comprehensive package of transfer agency, shareholder, and other services. The
Directors review reports and evaluations of such services at their regular
quarterly meetings, including the annual meeting concerning contract review, and
reports to the board. These reports include, but are not limited to, information
regarding the operational efficiency and accuracy of the shareholder and
transfer agency services provided, staffing levels, shareholder satisfaction (as
measured by external as well as internal sources), technology support, new
products and services offered to fund shareholders, securities trading
activities, portfolio valuation services, auditing services, and legal and
operational compliance activities. Certain aspects of shareholder and transfer
agency service level efficiency and the quality of securities trading activities
are measured by independent third party providers and are presented in
comparison to other fund groups not managed by the advisor.
COSTS OF SERVICES PROVIDED AND PROFITABILITY TO THE ADVISOR. The advisor
provides detailed information concerning its cost of providing various services
to the fund, its profitability in managing the fund, its overall profitability,
and its financial condition. The Directors have reviewed with the advisor the
methodology used to prepare this financial information. This financial
information regarding the advisor is considered in order to evaluate the
advisor's financial condition, its ability to continue to provide services under
the management agreement, and the reasonableness of the current management fee.
ETHICS OF THE ADVISOR. The Directors generally consider the advisor's commitment
to providing quality services to shareholders and to conducting its business
ethically. They noted that the advisor's practices generally meet or exceed
industry best practices and that the advisor was not implicated in the industry
scandals of 2003 and 2004.
ECONOMIES OF SCALE. The Directors review reports provided by the advisor on
economies of scale for the complex as a whole and the year-over-year changes in
revenue, costs, and profitability. The Directors concluded that economies of
scale are difficult to measure and predict with precision, especially on a
fund-by-fund basis. This analysis is also complicated by the additional services
and content provided by the advisor and its reinvestment in its ability to
provide and expand those services. Accordingly, the Directors also seek to
evaluate economies of scale by reviewing other information, such as
year-over-year profitability of the advisor generally, the profitability of its
management of the fund specifically, the expenses incurred by the advisor in
providing various functions to the fund, and the breakpoint fees of competitive
funds not managed by the advisor. The Directors believe the advisor is
appropriately sharing economies of scale through its competitive fee structure,
fee breakpoints as the fund complex and the fund increases in size, and through
(continued)
- ------
21
Approval of Management Agreement for Premium Money Market
reinvestment in its business to provide shareholders additional content and
services. In particular, separate breakpoint schedules based on the size of the
entire fund complex and on the size of the fund reflect the complexity of
assessing economies of scale.
COMPARISON TO OTHER FUNDS' FEES. The fund pays the advisor a single,
all-inclusive (or unified) management fee for providing all services necessary
for the management and operation of the fund, other than brokerage expenses,
taxes, interest, extraordinary expenses, and the fees and expenses of the fund's
independent directors (including their independent legal counsel). Under the
unified fee structure, the advisor is responsible for providing all investment
advisory, custody, audit, administrative, compliance, recordkeeping, marketing
and shareholder services, or arranging and supervising third parties to provide
such services. By contrast, most other funds are charged a variety of fees,
including an investment advisory fee, a transfer agency fee, an administrative
fee, distribution charges and other expenses. Other than their investment
advisory fees and Rule 12b-1 distribution fees, all other components of the
total fees charged by these other funds may be increased without shareholder
approval. The board believes the unified fee structure is a benefit to fund
shareholders because it clearly discloses to shareholders the cost of owning
fund shares, and, since the unified fee cannot be increased without a vote of
fund shareholders, it shifts to the advisor the risk of increased costs of
operating the fund and provides a direct incentive to minimize administrative
inefficiencies. Part of the Directors' analysis of fee levels involves reviewing
certain evaluative data compiled by an independent provider and comparing the
fund's unified fee to the total expense ratio of other funds in the fund's peer
group. The unified fee charged to shareholders of the fund was slightly above
the median of the total expense ratios of its peer group.
COMPARISON TO FEES AND SERVICES PROVIDED TO OTHER CLIENTS OF THE ADVISOR. The
Directors also requested and received information from the advisor concerning
the nature of the services, fees, and profitability of its advisory services to
advisory clients other than the fund. They observed that these varying types of
client accounts require different services and involve different regulatory and
entrepreneurial risks than the management of the fund. The Directors analyzed
this information and concluded that the fees charged and services provided to
the fund were reasonable by comparison.
COLLATERAL BENEFITS DERIVED BY THE ADVISOR. The Directors reviewed information
from the advisor concerning collateral benefits it receives as a result of its
relationship with the fund. They concluded that the advisor's primary business
is managing mutual funds and it generally does not use the fund or shareholder
information to generate profits in other lines of business, and therefore does
not derive any significant collateral benefits from them. The Directors noted
that the advisor receives proprietary research from broker dealers that execute
fund portfolio transactions and concluded that this research is likely to
benefit fund shareholders. The Directors also determined that the advisor is
able to provide investment management services to certain clients other than the
(continued)
- ------
22
Approval of Management Agreement for Premium Money Market
fund, at least in part, due to its existing infrastructure built to serve the
fund complex. The Directors concluded, however, that the assets of those other
clients are not material to the analysis and, in any event, are included with
the assets of the fund to determine breakpoints in the fund's fee schedule,
provided they are managed using the same investment team and strategy.
CONCLUSIONS OF THE DIRECTORS
As a result of this process, the Directors negotiated a one-year waiver by the
advisor of a portion of the management fee. These changes were proposed by the
Directors based on their review of the fund's percentile rank in its peer group
universe and the fact that the Directors seek as a general rule to have total
expense ratios of fixed income and money market funds in the lowest 25th
percentile of the fees of comparable funds. The advisor accepted the principle
of the fee waiver based on the fact that the lower fee will result in increased
competitiveness of the fund within its peer group universe. The fee waiver,
effective August 1, 2006, will result in a lowering of the management fee of the
fund by 0.071 percentage points below the current management fee. Following
these negotiations with the advisor, the Directors concluded that the investment
management agreement between the fund and the advisor is fair and reasonable in
light of the services.
- ------
23
Additional Information
RETIREMENT ACCOUNT INFORMATION
As required by law, any distributions you receive from an IRA or certain 403(b),
457 and qualified plans [those not eligible for rollover to an IRA or to another
qualified plan] are subject to federal income tax withholding, unless you elect
not to have withholding apply. Tax will be withheld on the total amount
withdrawn even though you may be receiving amounts that are not subject to
withholding, such as nondeductible contributions. In such case, excess amounts
of withholding could occur. You may adjust your withholding election so that a
greater or lesser amount will be withheld.
If you don't want us to withhold on this amount, you must notify us to not
withhold the federal income tax. Even if you plan to roll over the amount you
withdraw to another tax-deferred account, the withholding rate still applies to
the withdrawn amount unless we have received notice not to withhold federal
income tax prior to the withdrawal. You may notify us in writing or in certain
situations by telephone or through other electronic means. You have the right to
revoke your withholding election at any time and any election you make may
remain in effect until revoked by filing a new election.
Remember, even if you elect not to have income tax withheld, you are liable for
paying income tax on the taxable portion of your withdrawal. If you elect not to
have income tax withheld or you don't have enough income tax withheld, you may
be responsible for payment of estimated tax. You may incur penalties under the
estimated tax rules if your withholding and estimated tax payments are not
sufficient.
State tax will be withheld if, at the time of your distribution, your address is
within one of the mandatory withholding states and you have federal income tax
withheld. State taxes will be withheld from your distribution in accordance with
the respective state rules.
PROXY VOTING GUIDELINES
American Century Investment Management, Inc., the fund's investment advisor, is
responsible for exercising the voting rights associated with the securities
purchased and/or held by the fund. A description of the policies and procedures
the advisor uses in fulfilling this responsibility is available without charge,
upon request, by calling 1-800-345-2021. It is also available on American
Century's website at americancentury.com and on the Securities and Exchange
Commission's website at sec.gov. Information regarding how the investment
advisor voted proxies relating to portfolio securities during the most recent
12-month period ended June 30 is available on the "About Us" page at
americancentury.com. It is also available at sec.gov.
QUARTERLY PORTFOLIO DISCLOSURE
The fund files its complete schedule of portfolio holdings with the Securities
and Exchange Commission (SEC) for the first and third quarters of each fiscal
year on Form N-Q. The fund's Form N-Q is available on the SEC's website at
sec.gov, and may be reviewed and copied at the SEC's Public Reference Room in
Washington, DC. Information on the operation of the Public Reference Room may be
obtained by calling 1-800-SEC-0330. The fund also makes its complete schedule of
portfolio holdings for the most recent quarter of its fiscal year available on
its website at americancentury.com and, upon request, by calling 1-800-345-2021.
- ------
24
Index Definitions
The following indices are used to illustrate investment market, sector, or style
performance or to serve as fund performance comparisons. They are not investment
products available for purchase.
The 90-DAY U.S. TREASURY BILL INDEX is derived from secondary market interest
rates as published by the Federal Reserve Bank and includes three-month,
six-month, and one-year instruments.
The LEHMAN BROTHERS U.S. AGENCY INDEX is composed of those securities included
in the Lehman Brothers U.S. Aggregate Index that are public obligations of U.S.
government agencies, quasi-federal corporations, and corporate or foreign debt
guaranteed by the U.S. government.
The LEHMAN BROTHERS U.S. AGGREGATE INDEX represents securities that are taxable,
registered with the Securities and Exchange Commission, and U.S.
dollar-denominated. The index covers the U.S. investment-grade fixed-rate bond
market, with index components for government and corporate securities, mortgage
pass-through securities, and asset-backed securities.
The LEHMAN BROTHERS U.S. CORPORATE INDEX is composed of those securities
included in the Lehman Brothers U.S. Aggregate Index that are U.S.
dollar-denominated, investment-grade, fixed-rate, taxable securities sold by
industrial, utility and financial issuers.
The LEHMAN BROTHERS U.S. CORPORATE HIGH-YIELD INDEX covers the U.S.
dollar-denominated, non-investment grade, fixed-rate, taxable corporate bond
market.
The LEHMAN BROTHERS U.S. FIXED-RATE MORTGAGE-BACKED SECURITIES (MBS) INDEX is
the MBS Fixed-Rate component of the Lehman Brothers U.S. Aggregate Index. It
covers the mortgage-backed pass-through securities of the Government National
Mortgage Association (GNMA), the Federal National Mortgage Association (FNMA),
and the Federal Home Loan Mortgage Corporation (FHLMC).
The LEHMAN BROTHERS U.S. TREASURY INDEX is composed of those securities included
in the Lehman Brothers U.S. Aggregate Index that are public obligations of the
U.S. Treasury with a remaining maturity of one year or more.
- ------
25
Notes
- ------
26
Notes
- ------
27
Notes
- ------
28
CONTACT US
AMERICANCENTURY.COM
AUTOMATED INFORMATION LINE:
1-800-345-8765
INVESTOR SERVICES REPRESENTATIVE:
1-800-345-2021 or 816-531-5575
BUSINESS, NOT-FOR-PROFIT,
EMPLOYER-SPONSORED RETIREMENT PLANS:
1-800-345-3533
BANKS AND TRUST COMPANIES, BROKER-DEALERS,
FINANCIAL PROFESSIONALS, INSURANCE COMPANIES:
1-800-345-6488
TELECOMMUNICATIONS DEVICE FOR THE DEAF:
1-800-634-4113 or 816-444-3485
AMERICAN CENTURY INVESTMENT TRUST
INVESTMENT ADVISOR:
American Century Investment Management, Inc.
Kansas City, Missouri
THIS REPORT AND THE STATEMENTS IT CONTAINS ARE SUBMITTED FOR THE GENERAL
INFORMATION OF OUR SHAREHOLDERS. THE REPORT IS NOT AUTHORIZED FOR DISTRIBUTION
TO PROSPECTIVE INVESTORS UNLESS PRECEDED OR ACCOMPANIED BY AN EFFECTIVE
PROSPECTUS.
The American Century Investments logo, American Century and American Century
Investments are service marks of American Century Proprietary Holdings, Inc.
American Century Investment Services, Inc., Distributor
(c)2006 American Century Proprietary Holdings, Inc. All rights reserved.
0611
SH-SAN-51669N
[front cover]
AMERICAN CENTURY INVESTMENTS
Semiannual Report
September 30, 2006
[photo of autumn trees]
Inflation Protection Bond Fund
[american century investments logo and text logo]
Our Message to You
[photo of James E. Stowers III and James E. Stowers, Jr.]
/s/James E. Stowers, Jr.
James E. Stowers, Jr.
FOUNDER
AMERICAN CENTURY COMPANIES, INC.
/s/James E. Stowers III
James E. Stowers III
CHAIRMAN OF THE BOARD
AMERICAN CENTURY COMPANIES, INC.
We are pleased to provide you with the semiannual report for the American
Century Inflation Protection Bond fund for the six months ended September 30,
2006. We hope you find this information helpful in monitoring your investment.
Another useful resource we offer is our website, americancentury.com, where we
post quarterly portfolio commentaries, the views of senior investment officers
and analysts, and other communications about investments, portfolio strategy,
personal finance, and the markets.
In its most recent rankings, Dalbar -- which issues customer satisfaction
ratings and rankings based on website functionality -- ranked
americancentury.com fourth out of the sites provided by the top 25 fund
companies that it believes lead the industry in web-based technology. Our
website earned an "Excellent" rating, Dalbar's highest designation.
For most of 2006, our website has linked visitors to information explaining our
strategic collaboration with Lance Armstrong and the Lance Armstrong Foundation
(LAF). This campaign, featuring Lance, is designed to encourage investors to
take a more active role in planning their financial futures and make every
investment decision count. To learn more about the collaboration and the LAF,
please visit americancentury.com or www.lanceface.com on the Web and click on
the links to related sites.
With the approach of year end and the 2006 tax season, you can also find out
more about December fund distributions and tax information via a link from our
website. We've posted December distribution estimates for over 50 funds, answers
to frequent distribution questions, and online descriptions of all of the tax
information we provide to investors.
If you haven't visited americancentury.com yet, we encourage you to do so...it's
there to serve you. And so are we. As always, we deeply appreciate your
commitment to American Century Investments.
Table of Contents
Market Perspective. . . . . . . . . . . . . . . . . . . . . . . . . . . . . 2
U.S. Fixed-Income Total Returns . . . . . . . . . . . . . . . . . . . . 2
INFLATION PROTECTION BOND
Performance . . . . . . . . . . . . . . . . . . . . . . . . . . . . . . . . 3
Portfolio Commentary. . . . . . . . . . . . . . . . . . . . . . . . . . . . 5
Portfolio at a Glance . . . . . . . . . . . . . . . . . . . . . . . . . 5
Yields . . . . . . . . . . . . . . . . . . . . . . . . . . . . . . . . . 6
Portfolio Composition by Maturity . . . . . . . . . . . . . . . . . . . 6
Shareholder Fee Example . . . . . . . . . . . . . . . . . . . . . . . . . . 7
Schedule of Investments . . . . . . . . . . . . . . . . . . . . . . . . . . 9
FINANCIAL STATEMENTS
Statement of Assets and Liabilities . . . . . . . . . . . . . . . . . . . .10
Statement of Operations . . . . . . . . . . . . . . . . . . . . . . . . . .12
Statement of Changes in Net Assets. . . . . . . . . . . . . . . . . . . . .13
Notes to Financial Statements . . . . . . . . . . . . . . . . . . . . . . .14
Financial Highlights. . . . . . . . . . . . . . . . . . . . . . . . . . . .19
OTHER INFORMATION
Approval of Management Agreement for Inflation Protection Bond. . . . . . .25
Share Class Information . . . . . . . . . . . . . . . . . . . . . . . . . .30
Additional Information. . . . . . . . . . . . . . . . . . . . . . . . . . .32
Index Definitions . . . . . . . . . . . . . . . . . . . . . . . . . . . . .33
The opinions expressed in the Market Perspective and the Portfolio Commentary
reflect those of the portfolio management team as of the date of the report, and
do not necessarily represent the opinions of American Century or any other
person in the American Century organization. Any such opinions are subject to
change at any time based upon market or other conditions and American Century
disclaims any responsibility to update such opinions. These opinions may not be
relied upon as investment advice and, because investment decisions made by
American Century funds are based on numerous factors, may not be relied upon as
an indication of trading intent on behalf of any American Century fund. Security
examples are used for representational purposes only and are not intended as
recommendations to purchase or sell securities. Performance information for
comparative indices and securities is provided to American Century by third
party vendors. To the best of American Century's knowledge, such information is
accurate at the time of printing.
Market Perspective
[photo of Chief Investment Officer]
BY DAVID MACEWEN, CHIEF INVESTMENT OFFICER, FIXED INCOME
A TALE OF TWO QUARTERS
The second and third quarters of 2006 were very different in terms of inflation
and interest rate expectations and market performance. In the second quarter, as
core inflation rates remained above the Federal Reserve's 1-2% "comfort zone"
and threatened to go higher, investors feared the Fed would keep raising
interest rates and tip the economy into recession. Uncertainty about how far the
Fed would go, and how successful it would be in containing inflation, created a
defensive attitude in financial markets that resulted in disappointing returns
for broad stock and bond indices.
A FED PAUSE REFRESHED THE MARKETS
But in the third quarter, a 15% drop in oil prices helped take the heat off
inflation pressures, and cut business and consumer costs. Weakness in the
housing market--though hard on many homeowners--turned into a positive factor
for the markets. As home sales and prices declined, the Fed stopped its interest
rate tightening campaign, stepping back to assess the economy's reaction to
previous rate hikes. This combination of falling energy prices and relief from
rising interest rates helped broad U.S. stock and bond markets rebound from
second-quarter losses to post some of their biggest quarterly gains this decade.
LONG-DURATION AND CORPORATE SECURITIES OUTPERFORMED
The bond market especially welcomed a gloomy housing-market forecast,
speculating that it would reduce economic growth, inflation, and interest rates.
This rekindled demand for longer-term fixed-income securities. As a result, the
Treasury yield curve fell for the six months and "inverted", as the two-year
yield (4.69%) remained higher than the 10-year yield (4.63%), and both fell well
below the Fed's 5.25% overnight interest rate target. Mirroring the stock
market's rally, the corporate sectors led the broad taxable market.
- --------------------------------------------------------------------------------
U.S. FIXED-INCOME TOTAL RETURNS
- --------------------------------------------------------------------------------
For the six months ended September 30, 2006*
- --------------------------------------------------------------------------------
TREASURY SECURITIES
- --------------------------------------------------------------------------------
3-month bill 2.51%
- --------------------------------------------------------------------------------
2-year note 2.53%
- --------------------------------------------------------------------------------
5-year note 3.20%
- --------------------------------------------------------------------------------
10-year note 3.83%
- --------------------------------------------------------------------------------
30-year bond 4.64%
- --------------------------------------------------------------------------------
LEHMAN BROTHERS U.S. BOND MARKET INDICES
- --------------------------------------------------------------------------------
Corporate High-Yield 4.33%
- --------------------------------------------------------------------------------
Corporate Investment-Grade 4.12%
- --------------------------------------------------------------------------------
Aggregate (multi-sector) 3.73%
- --------------------------------------------------------------------------------
Fixed-Rate Mortgage-Backed 3.64%
- --------------------------------------------------------------------------------
Treasury 3.61%
- --------------------------------------------------------------------------------
Agency 3.45%
- --------------------------------------------------------------------------------
*Total returns for periods less than one year are not annualized.
- ------
2
Inflation Protection Bond - Performance
TOTAL RETURNS AS OF SEPTEMBER 30, 2006
----------------
AVERAGE ANNUAL
RETURNS
- --------------------------------------------------------------------------------
SINCE INCEPTION
6 MONTHS(1) 1 YEAR INCEPTION DATE
- --------------------------------------------------------------------------------
INVESTOR CLASS 3.68% 1.43% 1.14% 5/31/05
- --------------------------------------------------------------------------------
CITIGROUP U.S.
INFLATION-LINKED
SECURITIES INDEX(2) 4.11% 1.88% 1.71% --
- --------------------------------------------------------------------------------
Institutional Class 3.91% 1.71% 1.39% 5/31/05
- --------------------------------------------------------------------------------
A Class 5/31/05
No sales charge* 3.60% 1.17% 0.88%
With sales charge* -1.10% -3.42% -2.54%
- --------------------------------------------------------------------------------
B Class 5/31/05
No sales charge* 3.16% 0.45% 0.15%
With sales charge* -1.84% -3.55% -2.86%
- --------------------------------------------------------------------------------
C Class 5/31/05
No sales charge* 3.18% 0.36% 0.10%
With sales charge* 2.18% 0.36% 0.10%
- --------------------------------------------------------------------------------
R Class 3.49% 1.02% 0.70% 5/31/05
- --------------------------------------------------------------------------------
*Sales charges include initial sales charges and contingent deferred sales
charges (CDSCs), as applicable. A Class shares have a 4.50% maximum initial
sales charge for fixed income funds and may be subject to a maximum CDSC of
1.00%. B Class shares redeemed within six years of purchase are subject to a
CDSC that declines from 5.00% during the first year after purchase to 0.00% the
sixth year after purchase. C Class shares redeemed within 12 months of purchase
are subject to a maximum CDSC of 1.00%. Please see the Share Class Information
pages for more about the applicable sales charges for each share class. The SEC
requires that mutual funds provide performance information net of maximum sales
charges in all cases where charges could be applied.
(1) Total returns for periods less than one year are not annualized.
(2) The Citigroup U.S. Inflation-Linked Securities Index is not subject to the
tax code diversification and other regulatory requirements limiting the type
and amount of securities that the fund may own.
Data presented reflect past performance. Past performance is no guarantee of
future results. Current performance may be higher or lower than the performance
shown. Investment return and principal value will fluctuate, and redemption
value may be more or less than original cost. To obtain performance data current
to the most recent month end, please call 1-800-345-2021 or visit
americancentury.com. As interest rates rise, bond values will decline.
Unless otherwise indicated, performance reflects Investor Class shares;
performance for other share classes will vary due to differences in fee
structure. For information about other share classes available, please consult
the prospectus. Data assumes reinvestment of dividends and capital gains, and
none of the charts reflect the deduction of taxes that a shareholder would pay
on fund distributions or the redemption of fund shares. Returns for the index
are provided for comparison. The fund's total returns include operating expenses
(such as transaction costs and management fees) that reduce returns, while the
total returns of the index do not.
(continued)
- ------
3
Inflation Protection Bond - Performance
GROWTH OF $10,000 OVER LIFE OF CLASS
$10,000 investment made May 31, 2005

ONE-YEAR RETURNS OVER LIFE OF CLASS
Periods ended September 30
- --------------------------------------------------------------------------------
2005* 2006
- --------------------------------------------------------------------------------
Investor Class 0.08% 1.43%
- --------------------------------------------------------------------------------
Citigroup U.S. Inflation-Linked Securities Index 0.39% 1.88%
- --------------------------------------------------------------------------------
*From 5/31/05 (fund inception) to 9/30/05. Not annualized.
Data presented reflect past performance. Past performance is no guarantee of
future results. Current performance may be higher or lower than the performance
shown. Investment return and principal value will fluctuate, and redemption
value may be more or less than original cost. To obtain performance data current
to the most recent month end, please call 1-800-345-2021 or visit
americancentury.com. As interest rates rise, bond values will decline.
Unless otherwise indicated, performance reflects Investor Class shares;
performance for other share classes will vary due to differences in fee
structure. For information about other share classes available, please consult
the prospectus. Data assumes reinvestment of dividends and capital gains, and
none of the charts reflect the deduction of taxes that a shareholder would pay
on fund distributions or the redemption of fund shares. Returns for the index
are provided for comparison. The fund's total returns include operating expenses
(such as transaction costs and management fees) that reduce returns, while the
total returns of the index do not.
- ------
4
Inflation Protection Bond - Portfolio Commentary
PORTFOLIO MANAGERS: JEREMY FLETCHER AND BOB GAHAGAN
PERFORMANCE SUMMARY
Inflation Protection Bond returned 3.68%* for the six months ended September 30,
2006. By comparison, the Citigroup U.S. Inflation-Linked Securities Index
returned 4.11%. The portfolio's results reflected operating expenses, while the
returns of the index did not.
The relative and absolute performance of the U.S. inflation-linked securities
market--which posted moderate gains in a challenging bond environment and
outpaced nearly all other investment-grade sectors for the reporting
period--dictated portfolio and index returns.
INFLATION-LINKED BOND PERFORMANCE
Global inflation-linked securities returned 6.70% for the reporting period in
U.S. dollar terms, according to Lehman Brothers. U.S. Treasury Inflation
Protected Securities (TIPS)--which represent the biggest portion of the
worldwide market for inflation-indexed bonds--underperformed inflation-linked
securities from Canada, France, Germany, and the U.K. Excluding U.S. bonds,
inflation-linked securities returned 8.42%, according to Lehman.
In the U.S., TIPS returned more than conventional Treasury securities. This
reflected TIPS' outperformance during the bond market selloff in the first half
of the reporting period, and narrow underperformance during the bond rally in
the second half. It's not unusual for TIPS to outperform during selloffs and
underperform during rallies, owing to their inflation-linked feature and their
somewhat shorter durations--sensitivities to interest rate changes--than that of
conventional Treasury securities.
BREAKEVEN RATES DECLINED
TIPS breakeven rates (representing the gap between the yields of TIPS and of
their conventional Treasury counterparts, and used as a measure of long-term
inflation expectations) fell. Factors influencing the declines included falling
energy prices and moderate long-term inflation expectations, as stated by the
Federal Reserve in its recent policy statements and expressed by the bond market
in Treasury yields that fell well below the Fed's 5.25% overnight interest rate
target.
PORTFOLIO STRATEGY
We continued to focus on our investment approach, which employs a consistent,
repeatable framework that helps us to identify the best relative values within
the global inflation-linked securities universe. We actively apply a multi-step
process that includes yield-curve/duration positioning, security selection,
portfolio construction, and attribution analysis.
Inflation Protection Bond experienced slight cash inflows over the six months
that were generally used to purchase
PORTFOLIO AT A GLANCE
- --------------------------------------------------------------------------------
AS OF AS OF
9/30/06 3/31/06
- --------------------------------------------------------------------------------
Weighted Average
Maturity 10.2 years 10.3 years
- --------------------------------------------------------------------------------
Average Duration
(effective) 6.5 years 6.2 years
- --------------------------------------------------------------------------------
*All fund returns referenced in this commentary are for Investor Class shares.
Total returns for periods less than one year are not annualized.
(continued)
- ------
5
Inflation Protection - Portfolio Commentary
TIPS across a range of maturities. Toward the end of the six months, we used any
cash inflows and outflows to adjust the portfolio's bond-maturity structure so
that the fund should benefit if the Treasury yield curve steepens (10-year
yields rise above two-year yields; as of September 30, two-year yields were
higher).
In addition, we identified some German inflation-linked bonds as possible
portfolio candidates around early July. However, we didn't purchase the
securities due to our belief that the euro--the currency in which German
inflation-linked bonds are denominated--was trading at relatively rich levels
compared with the U.S. dollar, making a euro rally seem unlikely. Based on the
third-quarter, dollar-converted returns of German inflation-linked bonds and
TIPS' returns (up 1.77% and 3.56%, respectively, according to Lehman), we made
the right choice.
We also conservatively positioned the fund's duration early in the period,
keeping it roughly in line with that of the Citigroup index as interest rate
uncertainty prevailed in the marketplace. Then, as signs of moderating economic
growth began to support a more bullish outlook, we conservatively extended the
duration.
PORTFOLIO OBJECTIVES AND EXPECTATIONS
Inflation Protection Bond is designed to serve as a supporting/specialty slice
of a portfolio. The fund offers high credit quality, inflation protection,
negative correlations with broad stock indices, and only moderate correlations
with broad bond indices. It is not a steady income producer, owing to the
volatile nature of monthly inflation data and the fund's structure. Like most
other high-credit-quality bond portfolios, the fund can perform well during
periods of economic weakness and declining interest rates, and, owing to its
inflation-protection feature, it can perform relatively well in bond selloffs.
But if inflation isn't a threat, Inflation Protection Bond can decline like
other bond funds in rising interest rate environments.
- --------------------------------------------------------------------------------
YIELDS AS OF SEPTEMBER 30, 2006
- --------------------------------------------------------------------------------
30-DAY SEC YIELD 9/30/06
- --------------------------------------------------------------------------------
Investor Class 5.22%
- --------------------------------------------------------------------------------
Institutional Class 5.41%
- --------------------------------------------------------------------------------
A Class 4.75%
- --------------------------------------------------------------------------------
B Class 4.22%
- --------------------------------------------------------------------------------
C Class 4.22%
- --------------------------------------------------------------------------------
R Class 4.71%
- --------------------------------------------------------------------------------
- --------------------------------------------------------------------------------
PORTFOLIO COMPOSITION BY MATURITY
- --------------------------------------------------------------------------------
% OF FUND % OF FUND
INVESTMENTS INVESTMENTS
AS OF AS OF
9/30/06 3/31/06
- --------------------------------------------------------------------------------
0 - 5-Year Notes(1) 30.7% 33.9%
- --------------------------------------------------------------------------------
5 - 10-Year Notes 40.2% 37.4%
- --------------------------------------------------------------------------------
10 - 30-Year Bonds 29.1% 28.7%
- --------------------------------------------------------------------------------
(1) Includes temporary cash investments.
- ------
6
Shareholder Fee Example (Unaudited)
Fund shareholders may incur two types of costs: (1) transaction costs, including
sales charges (loads) on purchase payments and redemption/exchange fees; and (2)
ongoing costs, including management fees; distribution and service (12b-1) fees;
and other fund expenses. This example is intended to help you understand your
ongoing costs (in dollars) of investing in your fund and to compare these costs
with the ongoing cost of investing in other mutual funds.
The example is based on an investment of $1,000 made at the beginning of the
period and held for the entire period from April 1, 2006 to September 30, 2006.
ACTUAL EXPENSES
The table provides information about actual account values and actual expenses
for each class. You may use the information, together with the amount you
invested, to estimate the expenses that you paid over the period. First,
identify the share class you own. Then simply divide your account value by
$1,000 (for example, an $8,600 account value divided by $1,000 = 8.6), then
multiply the result by the number under the heading "Expenses Paid During
Period" to estimate the expenses you paid on your account during this period.
If you hold Investor Class shares of any American Century fund, or Institutional
Class shares of the American Century Diversified Bond Fund, in an American
Century account (i.e., not a financial intermediary or retirement plan account),
American Century may charge you a $12.50 semiannual account maintenance fee if
the value of those shares is less than $10,000. We will redeem shares
automatically in one of your accounts to pay the $12.50 fee. In determining your
total eligible investment amount, we will include your investments in all
PERSONAL ACCOUNTS (including American Century Brokerage accounts) registered
under your Social Security number. PERSONAL ACCOUNTS include individual
accounts, joint accounts, UGMA/UTMA accounts, personal trusts, Coverdell
Education Savings Accounts and IRAs (including traditional, Roth, Rollover,
SEP-, SARSEP- and SIMPLE-IRAs), and certain other retirement accounts. If you
have only business, business retirement, employer-sponsored or American Century
Brokerage accounts, you are currently not subject to this fee. We will not
charge the fee as long as you choose to manage your accounts exclusively online.
If you are subject to the Account Maintenance Fee, your account value could be
reduced by the fee amount.
HYPOTHETICAL EXAMPLE FOR COMPARISON PURPOSES
The table also provides information about hypothetical account values and
hypothetical expenses based on the actual expense ratio of each class of your
fund and an assumed rate of return of 5% per year before expenses, which is not
the actual return of a fund's share class. The hypothetical account values and
expenses may not be used to estimate the actual ending account balance or
expenses you paid for the period. You may use this information to compare the
ongoing costs of investing in your fund and other funds. To do so, compare this
5% hypothetical example with the 5% hypothetical examples that appear in the
shareholder reports of the other funds.
Please note that the expenses shown in the table are meant to highlight your
(continued)
- ------
7
Shareholder Fee Example (Unaudited)
ongoing costs only and do not reflect any transactional costs, such as sales
charges (loads) or redemption/exchange fees. Therefore, the table is useful in
comparing ongoing costs only, and will not help you determine the relative total
costs of owning different funds. In addition, if these transactional costs were
included, your costs would have been higher.
- --------------------------------------------------------------------------------
EXPENSES PAID
BEGINNING ENDING DURING PERIOD* ANNUALIZED
ACCOUNT VALUE ACCOUNT VALUE 4/1/06 - EXPENSE
4/1/06 9/30/06 9/30/06 RATIO*
- --------------------------------------------------------------------------------
INFLATION PROTECTION BOND SHAREHOLDER FEE EXAMPLE
- --------------------------------------------------------------------------------
ACTUAL
- --------------------------------------------------------------------------------
Investor Class $1,000 $1,036.80 $3.01 0.59%
- --------------------------------------------------------------------------------
Institutional
Class $1,000 $1,039.10 $1.99 0.39%
- --------------------------------------------------------------------------------
A Class $1,000 $1,036.00 $4.29 0.84%
- --------------------------------------------------------------------------------
B Class $1,000 $1,031.60 $8.10 1.59%
- --------------------------------------------------------------------------------
C Class $1,000 $1,031.80 $8.10 1.59%
- --------------------------------------------------------------------------------
R Class $1,000 $1,034.90 $5.56 1.09%
- --------------------------------------------------------------------------------
HYPOTHETICAL
- --------------------------------------------------------------------------------
Investor Class $1,000 $1,022.11 $2.99 0.59%
- --------------------------------------------------------------------------------
Institutional
Class $1,000 $1,023.11 $1.98 0.39%
- --------------------------------------------------------------------------------
A Class $1,000 $1,020.86 $4.26 0.84%
- --------------------------------------------------------------------------------
B Class $1,000 $1,017.10 $8.04 1.59%
- --------------------------------------------------------------------------------
C Class $1,000 $1,017.10 $8.04 1.59%
- --------------------------------------------------------------------------------
R Class $1,000 $1,019.60 $5.52 1.09%
- --------------------------------------------------------------------------------
*Expenses are equal to the class's annualized expense ratio listed in the table
above, multiplied by the average account value over the period, multiplied by
183, the number of days in the most recent fiscal half-year, divided by 365, to
reflect the one-half year period.
- ------
8
Inflation Protection Bond - Schedule of Investments
SEPTEMBER 30, 2006 (UNAUDITED)
Principal Amount Value
- --------------------------------------------------------------------------------
U.S. TREASURY SECURITIES - 97.3%
- --------------------------------------------------------------------------------
$1,500,000 U.S. Treasury Inflation Indexed
Bonds, 2.375%, 1/15/25(1) $ 1,645,960
- --------------------------------------------------------------------------------
1,350,000 U.S. Treasury Inflation Indexed
Bonds, 2.00%, 1/15/26 1,327,938
- --------------------------------------------------------------------------------
1,015,000 U.S. Treasury Inflation Indexed
Bonds, 3.625%, 4/15/28(1) 1,583,009
- --------------------------------------------------------------------------------
435,000 U.S. Treasury Inflation Indexed
Bonds, 3.875%, 4/15/29 695,941
- --------------------------------------------------------------------------------
575,000 U.S. Treasury Inflation Indexed
Bonds, 3.375%, 4/15/32 818,754
- --------------------------------------------------------------------------------
500,000 U.S. Treasury Inflation Indexed
Notes, 3.625%, 1/15/08 635,056
- --------------------------------------------------------------------------------
925,000 U.S. Treasury Inflation Indexed
Notes, 3.875%, 1/15/09 1,181,100
- --------------------------------------------------------------------------------
530,000 U.S. Treasury Inflation Indexed
Notes, 4.25%, 1/15/10 678,218
- --------------------------------------------------------------------------------
1,025,000 U.S. Treasury Inflation Indexed
Notes, 0.875%, 4/15/10(1) 1,043,713
- --------------------------------------------------------------------------------
1,100,000 U.S. Treasury Inflation Indexed
Notes, 3.50%, 1/15/11 1,347,559
- --------------------------------------------------------------------------------
850,000 U.S. Treasury Inflation Indexed
Notes, 2.375%, 4/15/11 872,663
- --------------------------------------------------------------------------------
600,000 U.S. Treasury Inflation Indexed
Notes, 3.375%, 1/15/12 724,006
- --------------------------------------------------------------------------------
775,000 U.S. Treasury Inflation Indexed
Notes, 3.00%, 7/15/12 910,355
- --------------------------------------------------------------------------------
550,000 U.S. Treasury Inflation Indexed
Notes, 1.875%, 7/15/13 593,809
- --------------------------------------------------------------------------------
1,000,000 U.S. Treasury Inflation Indexed
Notes, 2.00%, 1/15/14 1,080,647
- --------------------------------------------------------------------------------
Principal Amount Value
- --------------------------------------------------------------------------------
$ 900,000 U.S. Treasury Inflation Indexed
Notes, 2.00%, 7/15/14 $ 952,578
- --------------------------------------------------------------------------------
900,000 U.S. Treasury Inflation Indexed
Notes, 1.625%, 1/15/15 912,641
- --------------------------------------------------------------------------------
1,000,000 U.S. Treasury Inflation Indexed
Notes, 1.875%, 7/15/15 1,013,362
- --------------------------------------------------------------------------------
1,000,000 U.S. Treasury Inflation Indexed
Notes, 2.00%, 1/15/16 1,002,081
- --------------------------------------------------------------------------------
1,150,000 U.S. Treasury Inflation Indexed
Notes, 2.50%, 7/15/16 1,182,360
- --------------------------------------------------------------------------------
TOTAL U.S. TREASURY SECURITIES
(Cost $20,451,746) 20,201,750
- --------------------------------------------------------------------------------
U.S. GOVERNMENT
AGENCY SECURITIES - 2.2%
- --------------------------------------------------------------------------------
360,000 TVA Inflation Indexed Notes,
3.375%, 1/15/07
(Cost $465,211) 460,601
- --------------------------------------------------------------------------------
COMMERCIAL PAPER - 0.8%
- --------------------------------------------------------------------------------
176,000 Rabobank USA Financial
Corp., 5.36%, 10/2/06(2)
(Cost $176,000) 176,000
- --------------------------------------------------------------------------------
TOTAL INVESTMENT SECURITIES - 100.3%
(Cost $21,092,957) 20,838,351
- --------------------------------------------------------------------------------
OTHER ASSETS AND LIABILITIES - (0.3)% (67,439)
- --------------------------------------------------------------------------------
TOTAL NET ASSETS - 100.0% $20,770,912
================================================================================
- --------------------------------------------------------------------------------
FUTURES CONTRACTS
- --------------------------------------------------------------------------------
Underlying Face Unrealized
Contracts Purchased Expiration Date Amount at Value Gain (Loss)
- --------------------------------------------------------------------------------
16 U.S. Treasury 2-Year Notes December 2006 $3,272,000 $3,172
==============================
Underlying Face Unrealized
Contracts Sold Expiration Date Amount at Value Gain (Loss)
- --------------------------------------------------------------------------------
8 U.S. Treasury 10-Year Notes December 2006 $ 864,500 $(4,697)
==============================
- --------------------------------------------------------------------------------
NOTES TO SCHEDULE OF INVESTMENTS
- --------------------------------------------------------------------------------
TVA = Tennessee Valley Authority
(1) Security, or a portion thereof, has been segregated for futures contracts.
(2) The rate indicated is the yield to maturity at purchase.
See Notes to Financial Statements.
- ------
9
Statement of Assets and Liabilities
SEPTEMBER 30, 2006 (UNAUDITED)
- --------------------------------------------------------------------------------
ASSETS
- --------------------------------------------------------------------------------
Investment securities, at value (cost of $21,092,957) $20,838,351
- -------------------------------------------------------------
Receivable for capital shares sold 50,081
- -------------------------------------------------------------
Interest receivable 141,256
- --------------------------------------------------------------------------------
21,029,688
- --------------------------------------------------------------------------------
LIABILITIES
- --------------------------------------------------------------------------------
Disbursements in excess of demand deposit cash 834
- -------------------------------------------------------------
Payable for investments purchased 109,980
- -------------------------------------------------------------
Payable for capital shares redeemed 53,077
- -------------------------------------------------------------
Payable for variation margin on futures contracts 55
- -------------------------------------------------------------
Accrued management fees 10,046
- -------------------------------------------------------------
Distribution fees payable 1,567
- -------------------------------------------------------------
Service fees (and distribution fees -
A Class and R Class) payable 7,293
- -------------------------------------------------------------
Dividends payable 75,924
- --------------------------------------------------------------------------------
258,776
- --------------------------------------------------------------------------------
NET ASSETS $20,770,912
================================================================================
See Notes to Financial Statements.
(continued)
- ------
10
Statement of Assets and Liabilities
SEPTEMBER 30, 2006 (UNAUDITED)
- --------------------------------------------------------------------------------
NET ASSETS CONSIST OF:
- --------------------------------------------------------------------------------
Capital paid in $21,195,201
- -------------------------------------------------------------
Undistributed net investment income 4,259
- -------------------------------------------------------------
Accumulated net realized loss on investment transactions (172,417)
- -------------------------------------------------------------
Net unrealized depreciation on investments (256,131)
- --------------------------------------------------------------------------------
$20,770,912
================================================================================
INVESTOR CLASS
- --------------------------------------------------------------------------------
Net assets $639,607
- -------------------------------------------------------------
Shares outstanding 67,123
- -------------------------------------------------------------
Net asset value per share $9.53
- --------------------------------------------------------------------------------
INSTITUTIONAL CLASS
- --------------------------------------------------------------------------------
Net assets $39,658
- -------------------------------------------------------------
Shares outstanding 4,029
- -------------------------------------------------------------
Net asset value per share $9.84
- --------------------------------------------------------------------------------
A CLASS
- --------------------------------------------------------------------------------
Net assets $12,474,821
- -------------------------------------------------------------
Shares outstanding 1,314,564
- -------------------------------------------------------------
Net asset value per share $9.49
- -------------------------------------------------------------
Maximum offering price (net asset value divided by 0.955) $9.94
- --------------------------------------------------------------------------------
B CLASS
- --------------------------------------------------------------------------------
Net assets $982,731
- -------------------------------------------------------------
Shares outstanding 103,470
- -------------------------------------------------------------
Net asset value per share $9.50
- --------------------------------------------------------------------------------
C CLASS
- --------------------------------------------------------------------------------
Net assets $6,577,580
- -------------------------------------------------------------
Shares outstanding 693,565
- -------------------------------------------------------------
Net asset value per share $9.48
- --------------------------------------------------------------------------------
R CLASS
- --------------------------------------------------------------------------------
Net assets $56,515
- -------------------------------------------------------------
Shares outstanding 5,771
- -------------------------------------------------------------
Net asset value per share $9.79
- --------------------------------------------------------------------------------
See Notes to Financial Statements.
- ------
11
Statement of Operations
FOR THE SIX MONTHS ENDED SEPTEMBER 30, 2006 (UNAUDITED)
- --------------------------------------------------------------------------------
INVESTMENT INCOME (LOSS)
- --------------------------------------------------------------------------------
INCOME:
- -------------------------------------------------------------
Interest $618,814
- --------------------------------------------------------------------------------
EXPENSES:
- -------------------------------------------------------------
Management fees 51,425
- -------------------------------------------------------------
Distribution fees:
- -------------------------------------------------------------
B Class 3,340
- -------------------------------------------------------------
C Class 21,815
- -------------------------------------------------------------
Service fees:
- -------------------------------------------------------------
B Class 1,113
- -------------------------------------------------------------
C Class 7,272
- -------------------------------------------------------------
Distribution and service fees -- A Class 12,776
- -------------------------------------------------------------
Distribution and service fees -- R Class 90
- -------------------------------------------------------------
Trustees' fees and expenses 315
- -------------------------------------------------------------
Other expenses 473
- --------------------------------------------------------------------------------
98,619
- --------------------------------------------------------------------------------
NET INVESTMENT INCOME (LOSS) 520,195
- --------------------------------------------------------------------------------
REALIZED AND UNREALIZED GAIN (LOSS)
- -------------------------------------------------------------
Net realized gain (loss) on investment transactions (104,636)
- -------------------------------------------------------------
Change in net unrealized appreciation
(depreciation) on investments 227,079
- --------------------------------------------------------------------------------
NET REALIZED AND UNREALIZED GAIN (LOSS) 122,443
- --------------------------------------------------------------------------------
NET INCREASE (DECREASE) IN NET ASSETS RESULTING FROM OPERATIONS $642,638
================================================================================
See Notes to Financial Statements.
- ------
12
Statement of Changes in Net Assets
SIX MONTHS ENDED SEPTEMBER 30, 2006 (UNAUDITED) AND PERIOD ENDED MARCH 31, 2006
- --------------------------------------------------------------------------------
INCREASE (DECREASE) IN NET ASSETS SEPT. 30, 2006 MARCH 31, 2006(1)
- --------------------------------------------------------------------------------
OPERATIONS
- --------------------------------------------------------------------------------
Net investment income (loss) $ 520,195 $ 262,359
- --------------------------------------------
Net realized gain (loss) (104,636) (67,781)
- --------------------------------------------
Change in net unrealized
appreciation (depreciation) 227,079 (483,210)
- --------------------------------------------------------------------------------
Net increase (decrease) in net assets
resulting from operations 642,638 (288,632)
- --------------------------------------------------------------------------------
DISTRIBUTIONS TO SHAREHOLDERS
- --------------------------------------------------------------------------------
From net investment income:
- --------------------------------------------
Investor Class (17,668) (28,216)
- --------------------------------------------
Institutional Class -- (23,866)
- --------------------------------------------
A Class (317,784) (100,237)
- --------------------------------------------
B Class (23,033) (29,331)
- --------------------------------------------
C Class (157,451) (60,961)
- --------------------------------------------
R Class -- (19,748)
- --------------------------------------------------------------------------------
Decrease in net assets from distributions (515,936) (262,359)
- --------------------------------------------------------------------------------
CAPITAL SHARE TRANSACTIONS
- --------------------------------------------------------------------------------
Net increase (decrease) in net assets
from capital share transactions 5,995,921 15,199,280
- --------------------------------------------------------------------------------
NET INCREASE (DECREASE) IN NET ASSETS 6,122,623 14,648,289
- --------------------------------------------------------------------------------
NET ASSETS
- --------------------------------------------------------------------------------
Beginning of period 14,648,289 --
- --------------------------------------------------------------------------------
End of period $20,770,912 $14,648,289
================================================================================
Undistributed net investment income $4,259 --
================================================================================
(1) May 31, 2005 (fund inception) through March 31, 2006
See Notes to Financial Statements.
- ------
13
Notes to Financial Statements
SEPTEMBER 30, 2006 (UNAUDITED)
1. ORGANIZATION AND SUMMARY OF SIGNIFICANT ACCOUNTING POLICIES
ORGANIZATION -- American Century Investment Trust (the trust) is registered
under the Investment Company Act of 1940 (the 1940 Act) as an open-end
management investment company. Inflation Protection Bond Fund (the fund) is one
fund in a series issued by the trust. The fund is nondiversified under the 1940
Act. The fund's investment objective is to seek total return and protection
against U.S. inflation. The fund invests primarily in inflation-linked debt
securities. These securities include inflation-linked securities issued by the
U.S. Treasury, by U.S. government agencies and instrumentalities, and by
entities other than the U.S. Treasury or U.S. government agencies and
instrumentalities. The following is a summary of the fund's significant
accounting policies.
MULTIPLE CLASS -- The fund is authorized to issue the Investor Class, the
Institutional Class, the A Class, the B Class, the C Class, and the R Class. The
A Class may incur an initial sales charge. The A Class, B Class, and C Class may
be subject to a contingent deferred sales charge. The share classes differ
principally in their respective sales charges and distribution and shareholder
servicing expenses and arrangements. All shares of the funds represent an equal
pro rata interest in the assets of the class to which such shares belong, and
have identical voting, dividend, liquidation and other rights and the same terms
and conditions, except for class specific expenses and exclusive rights to vote
on matters affecting only individual classes. Income, non-class specific
expenses, and realized and unrealized capital gains and losses of the funds are
allocated to each class of shares based on their relative net assets. All
classes of the fund commenced sale on May 31, 2005, the fund's inception date.
SECURITY VALUATIONS -- Debt securities maturing in greater than 60 days are
valued at current market value as provided by a commercial pricing service or at
the mean of the most recent bid and asked prices. Debt securities maturing
within 60 days may be valued at cost, plus or minus any amortized discount or
premium. Securities traded on foreign securities exchanges and over-the-counter
markets are normally completed before the close of business on days that the New
York Stock Exchange (the Exchange) is open and may also take place on days when
the Exchange is not open. If an event occurs after the value of a security was
established but before the net asset value per share was determined that was
likely to materially change the net asset value, that security would be valued
at fair value as determined in accordance with procedures adopted by the Board
of Trustees. If the fund determines that the market price of a portfolio
security is not readily available, or that the valuation methods mentioned above
do not reflect the security's fair value, such security is valued at its fair
value as determined by, or in accordance with procedures adopted by, the Board
of Trustees or its designee if such fair value determination would materially
impact a fund's net asset value. Certain other circumstances may cause the fund
to fair value a security such as: a security has been declared in default; or
trading in a security has been halted during the trading day; or there is a
foreign market holiday and no trading will commence.
SECURITY TRANSACTIONS -- Security transactions are accounted for as of the trade
date. Net realized gains and losses are determined on the identified cost basis,
which is also used for federal income tax purposes.
INVESTMENT INCOME -- Interest income less foreign taxes withheld, if any, is
recorded on the accrual basis and includes accretion of discounts and
amortization of premiums. Inflation adjustments related to inflation-linked debt
securities are reflected as interest income.
FUTURES CONTRACTS -- The fund may enter into futures contracts in order to
manage the fund's exposure to changes in market conditions. One of the risks of
entering into futures contracts is the possibility that the change in value of
the contract may not correlate with the changes in value of the underlying
securities. Upon entering into a futures contract, the fund is required to
deposit either cash or securities in an amount equal to a certain percentage of
the contract value (initial margin). Subsequent payments (variation margin) are
made or received daily, in cash, by the fund. The variation margin is equal to
the daily change in the contract value and is recorded as unrealized gains and
losses. The fund recognizes a realized gain or loss when the contract is closed
or expires. Net realized and unrealized gains or losses occurring during the
holding period of futures contracts are a component of realized gain (loss) on
investment transactions and unrealized appreciation (depreciation) on
investments, respectively.
INCOME TAX STATUS -- It is the fund's policy to distribute substantially all net
investment income and net realized gains to shareholders and to otherwise
qualify as a regulated investment company under provisions of the Internal
Revenue Code. Accordingly, no provision has been made for federal or state
income taxes.
DISTRIBUTIONS TO SHAREHOLDERS -- Distributions to shareholders are recorded on
the ex-dividend date. Distributions from net investment income
(continued)
- ------
14
Notes to Financial Statements
SEPTEMBER 30, 2006 (UNAUDITED)
1. ORGANIZATION AND SUMMARY OF SIGNIFICANT ACCOUNTING POLICIES (CONTINUED)
are declared daily and paid monthly. Distributions from net realized gains, if
any, are generally declared and paid annually.
INDEMNIFICATIONS -- Under the trust's organizational documents, its officers and
trustees are indemnified against certain liabilities arising out of the
performance of their duties to the fund. In addition, in the normal course of
business, the fund enters into contracts that provide general indemnifications.
The fund's maximum exposure under these arrangements is unknown as this would
involve future claims that may be made against the fund. The risk of material
loss from such claims is considered by management to be remote.
USE OF ESTIMATES -- The financial statements are prepared in conformity with
accounting principles generally accepted in the United States of America, which
may require management to make certain estimates and assumptions at the date of
the financial statements. Actual results could differ from these estimates.
2. FEES AND TRANSACTIONS WITH RELATED PARTIES
MANAGEMENT FEES -- The trust has entered into a Management Agreement with
American Century Investment Management, Inc. (ACIM) (the investment advisor),
under which ACIM provides the fund with investment advisory and management
services in exchange for a single, unified management fee (the fee) per class.
The Agreement provides that all expenses of the fund, except brokerage
commissions, taxes, interest, fees and expenses of those trustees who are not
considered "interested persons" as defined in the 1940 Act (including counsel
fees) and extraordinary expenses, will be paid by ACIM. The fee is computed and
accrued daily based on the daily net assets of each specific class of shares of
the fund and paid monthly in arrears. The fee consists of (1) an Investment
Category Fee based on the daily net assets of the funds and certain other
accounts managed by the investment advisor that are in the same broad investment
category as the fund and (2) a Complex Fee based on the assets of all the funds
in the American Century family of funds. The rates for the Investment Category
Fee range from 0.2625% to 0.3800% and the rates for the Complex Fee (except for
Institutional Class) range from 0.2500% to 0.3100%. The Institutional Class is
0.2000% less at each point within the Complex Fee range. The effective annual
management fee for the fund for the six months ended September 30, 2006 was
0.59% for all classes except Institutional Class, which was 0.39%.
DISTRIBUTION AND SERVICE FEES -- The Board of Trustees has adopted a separate
Master Distribution and Individual Shareholder Services Plan for each of the A
Class, B Class, C Class and R Class (collectively the plans), pursuant to Rule
12b-1 of the 1940 Act. The plans provide that the B Class and C Class will pay
American Century Investment Services, Inc. (ACIS) an annual distribution fee and
service fee of 0.75% and 0.25%, respectively. The plans provide that the A Class
and the R Class will pay ACIS an annual distribution and service fee of 0.25%
for the A Class and 0.50% for the R Class. The fees are computed and accrued
daily based on each class's daily net assets and paid monthly in arrears. The
distribution fee provides compensation for expenses incurred in connection with
distributing shares of the classes including, but not limited to, payments to
brokers, dealers, and financial institutions that have entered into sales
agreements with respect to shares of the fund. The service fee provides
compensation for individual shareholder services rendered by broker/dealers or
other independent financial intermediaries. Fees incurred under the plans during
the six months ended September 30, 2006, are detailed in the Statement of
Operations.
RELATED PARTIES -- Certain officers and trustees of the trust are also officers
and/or directors, and, as a group, controlling stockholders of American Century
Companies, Inc. (ACC), the parent of the trust's investment advisor, ACIM, the
distributor of the trust, ACIS, and the trust's transfer agent, American Century
Services, LLC.
The fund has a bank line of credit agreement with JPMorgan Chase Bank (JPMCB).
JPMCB is a custodian of the fund and a wholly owned subsidiary of J.P. Morgan
Chase & Co. (JPM). JPM is an equity investor in ACC.
3. INVESTMENT TRANSACTIONS
Purchases and sales of investment securities, excluding short-term investments,
for the six months ended September 30, 2006, were $8,607,229 and $2,668,069,
respectively.
(continued)
- ------
15
Notes to Financial Statements
SEPTEMBER 30, 2006 (UNAUDITED)
4. CAPITAL SHARE TRANSACTIONS
Transactions in shares of the fund were as follows (unlimited number of shares
authorized):
- --------------------------------------------------------------------------------
SHARES AMOUNT
- --------------------------------------------------------------------------------
INVESTOR CLASS
- --------------------------------------------------------------------------------
SIX MONTHS ENDED SEPTEMBER 30, 2006
- -----------------------------------------------------
Sold 37,926 $357,483
- -----------------------------------------------------
Issued in reinvestment of distributions 389 3,656
- -----------------------------------------------------
Redeemed (10,767) (101,343)
- --------------------------------------------------------------------------------
Net increase (decrease) 27,548 $259,796
================================================================================
PERIOD ENDED MARCH 31, 2006(1)
- -----------------------------------------------------
Sold 125,108 $1,239,757
- -----------------------------------------------------
Issued in reinvestment of distributions 2,261 22,063
- -----------------------------------------------------
Redeemed (87,794) (850,562)
- --------------------------------------------------------------------------------
Net increase (decrease) 39,575 $411,258
================================================================================
INSTITUTIONAL CLASS
- --------------------------------------------------------------------------------
SIX MONTHS ENDED SEPTEMBER 30, 2006
- -----------------------------------------------------
Net increase (decrease) -- --
================================================================================
PERIOD ENDED MARCH 31, 2006(1)
- -----------------------------------------------------
Sold 84,969 $844,334
- -----------------------------------------------------
Issued in reinvestment of distributions 2,439 23,789
- -----------------------------------------------------
Redeemed (83,379) (800,000)
- --------------------------------------------------------------------------------
Net increase (decrease) 4,029 $68,123
================================================================================
A CLASS
- --------------------------------------------------------------------------------
SIX MONTHS ENDED SEPTEMBER 30, 2006
- -----------------------------------------------------
Sold 638,102 $5,990,044
- -----------------------------------------------------
Issued in reinvestment of distributions 26,966 252,756
- -----------------------------------------------------
Redeemed (214,413) (2,006,798)
- --------------------------------------------------------------------------------
Net increase (decrease) 450,655 $4,236,002
================================================================================
PERIOD ENDED MARCH 31, 2006(1)
- -----------------------------------------------------
Sold 1,039,894 $10,109,268
- -----------------------------------------------------
Issued in reinvestment of distributions 7,980 77,303
- -----------------------------------------------------
Redeemed (183,965) (1,783,726)
- --------------------------------------------------------------------------------
Net increase (decrease) 863,909 $8,402,845
================================================================================
B CLASS
- --------------------------------------------------------------------------------
SIX MONTHS ENDED SEPTEMBER 30, 2006
- -----------------------------------------------------
Sold 27,638 $259,641
- -----------------------------------------------------
Issued in reinvestment of distributions 1,429 13,401
- -----------------------------------------------------
Redeemed (13,490) (125,828)
- --------------------------------------------------------------------------------
Net increase (decrease) 15,577 $147,214
================================================================================
PERIOD ENDED MARCH 31, 2006(1)
- -----------------------------------------------------
Sold 172,288 $1,696,275
- -----------------------------------------------------
Issued in reinvestment of distributions 2,629 25,579
- -----------------------------------------------------
Redeemed (87,024) (837,931)
- --------------------------------------------------------------------------------
Net increase (decrease) 87,893 $883,923
================================================================================
(1) May 31, 2005 (fund inception) through March 31, 2006.
(continued)
- ------
16
Notes to Financial Statements
SEPTEMBER 30, 2006 (UNAUDITED)
4. CAPITAL SHARE TRANSACTIONS (CONTINUED)
- --------------------------------------------------------------------------------
SHARES AMOUNT
- --------------------------------------------------------------------------------
C CLASS
- --------------------------------------------------------------------------------
SIX MONTHS ENDED SEPTEMBER 30, 2006
- -----------------------------------------------------
Sold 189,349 $1,774,092
- -----------------------------------------------------
Issued in reinvestment of distributions 6,250 58,496
- -----------------------------------------------------
Redeemed (54,268) (509,127)
- --------------------------------------------------------------------------------
Net increase (decrease) 141,331 $1,323,461
================================================================================
PERIOD ENDED MARCH 31, 2006(1)
- -----------------------------------------------------
Sold 638,149 $6,208,377
- -----------------------------------------------------
Issued in reinvestment of distributions 3,935 38,204
- -----------------------------------------------------
Redeemed (89,850) (866,471)
- --------------------------------------------------------------------------------
Net increase (decrease) 552,234 $5,380,110
================================================================================
R CLASS
- --------------------------------------------------------------------------------
SIX MONTHS ENDED SEPTEMBER 30, 2006
- -----------------------------------------------------
Sold 3,062 $29,448
================================================================================
PERIOD ENDED MARCH 31, 2006(1)
- -----------------------------------------------------
Sold 83,889 $833,334
- -----------------------------------------------------
Issued in reinvestment of distributions 2,020 19,687
- -----------------------------------------------------
Redeemed (83,200) (800,000)
- --------------------------------------------------------------------------------
Net increase (decrease) 2,709 $53,021
================================================================================
(1) May 31, 2005 (fund inception) through March 31, 2006
(continued)
- ------
17
Notes to Financial Statements
SEPTEMBER 30, 2006 (UNAUDITED)
5. BANK LINE OF CREDIT
The fund, along with certain other funds managed by ACIM or American Century
Global Investment Management, Inc., has a $500,000,000 unsecured bank line of
credit agreement with JPMCB. The fund may borrow money for temporary or
emergency purposes to fund shareholder redemptions. Borrowings under the
agreement bear interest at the Federal Funds rate plus 0.50%. The fund did not
borrow from the line during the six months ended September 30, 2006.
6. FEDERAL TAX INFORMATION
The book-basis character of distributions made during the year from net
investment income or net realized gains may differ from their ultimate
characterization for federal income tax purposes. These differences reflect the
differing character of certain income items and net realized gains and losses
for financial statement and tax purposes, and may result in reclassification
among certain capital accounts on the financial statements.
As of September 30, 2006, the components of investments for federal income tax
purposes were as follows:
- --------------------------------------------------------------------------------
Federal tax cost of investments $21,135,827
================================================================================
Gross tax appreciation of investments $16,129
- ------------------------------------------------------------------
Gross tax depreciation of investments (313,605)
- --------------------------------------------------------------------------------
Net tax appreciation (depreciation) of investments $(297,476)
================================================================================
The difference between book-basis and tax-basis cost and unrealized appreciation
(depreciation) is attributable primarily to the tax deferral of losses on wash
sales.
As of March 31, 2006, the fund had accumulated capital losses of $6,509 which
represent net capital loss carryovers that may be used to offset future realized
capital gains for federal income tax purposes. The capital loss carryovers
expire in 2014.
As of March 31, 2006, the fund had capital loss deferrals of $18,402 which
represent net capital losses incurred in the five-month period ended March 31,
2006. The fund has elected to treat such losses as having been incurred in the
following fiscal year for federal income tax purposes.
7. RECENTLY ISSUED ACCOUNTING STANDARDS
In June 2006, the Financial Accounting Standards Board (FASB) issued
Interpretation No. 48, "Accounting for Uncertainty in Income Taxes -- an
Interpretation of FASB Statement No. 109" (FIN 48). FIN 48 establishes a minimum
threshold for financial statement recognition of the benefit of positions taken
in filing tax returns (including whether an entity is taxable in a particular
jurisdiction), and requires certain expanded tax disclosures. FIN 48 is
effective for fiscal years beginning after December 15, 2006, and is to be
applied to all open tax years as of the date of effectiveness. The FASB issued
Statement of Financial Accounting Standards No. 157, "Fair Value Measurements"
(FAS 157), in September 2006, which is effective for fiscal years beginning
after November 15, 2007. FAS 157 defines fair value, establishes a framework for
measuring fair value and expands the required financial statement disclosures
about fair value measurements. Management is currently evaluating the impact of
adopting FIN 48 and FAS 157.
- ------
18
Inflation Protection Bond - Financial Highlights
For a Share Outstanding Throughout the Periods Indicated
- --------------------------------------------------------------------------------
INVESTOR CLASS
- --------------------------------------------------------------------------------
2006(1) 2006(2)
- --------------------------------------------------------------------------------
PER-SHARE DATA
- --------------------------------------------------------------------------------
Net Asset Value, Beginning of Period $9.47 $10.00
- --------------------------------------------------------------------------------
Income From Investment Operations
- -----------------------------------------------------
Net Investment Income 0.31(3) 0.33
- -----------------------------------------------------
Net Realized and Unrealized Gain (Loss) 0.03 (0.53)
- --------------------------------------------------------------------------------
Total From Investment Operations 0.34 (0.20)
- --------------------------------------------------------------------------------
Distributions
- -----------------------------------------------------
From Net Investment Income (0.28) (0.33)
- --------------------------------------------------------------------------------
Net Asset Value, End of Period $9.53 $9.47
================================================================================
TOTAL RETURN(4) 3.68% (2.09)%
- --------------------------------------------------------------------------------
RATIOS/SUPPLEMENTAL DATA
- --------------------------------------------------------------------------------
Ratio of Operating Expenses to Average Net Assets 0.59%(5) 0.59%(5)
- -----------------------------------------------------
Ratio of Net Investment Income to Average Net Assets 6.42%(5) 3.97%(5)
- -----------------------------------------------------
Portfolio Turnover Rate 15% 51%
- -----------------------------------------------------
Net Assets, End of Period (in thousands) $640 $375
- --------------------------------------------------------------------------------
(1) Six months ended September 30, 2006 (unaudited).
(2) May 31, 2005 (fund inception) through March 31, 2006.
(3) Computed using average shares outstanding throughout the period.
(4) Total return assumes reinvestment of net investment income and capital
gains distributions, if any. Total returns for periods less than one year
are not annualized. The total return of the classes may not precisely
reflect the class expense differences because of the impact of calculating
the net asset values to two decimal places. If net asset values were
calculated to three decimal places, the total return differences would more
closely reflect the class expense differences. The calculation of net asset
values to two decimal places is made in accordance with SEC guidelines and
does not result in any gain or loss of value between one class and another.
(5) Annualized.
See Notes to Financial Statements.
- ------
19
Inflation Protection Bond - Financial Highlights
For a Share Outstanding Throughout the Periods Indicated
- --------------------------------------------------------------------------------
INSTITUTIONAL CLASS
- --------------------------------------------------------------------------------
2006(1) 2006(2)
- --------------------------------------------------------------------------------
PER-SHARE DATA
- --------------------------------------------------------------------------------
Net Asset Value, Beginning of Period $9.47 $10.00
- --------------------------------------------------------------------------------
Income From Investment Operations
- -----------------------------------------------------
Net Investment Income 0.32(3) 0.34
- -----------------------------------------------------
Net Realized and Unrealized Gain (Loss) 0.05 (0.53)
- --------------------------------------------------------------------------------
Total From Investment Operations 0.37 (0.19)
- --------------------------------------------------------------------------------
Distributions
- -----------------------------------------------------
From Net Investment Income -- (0.34)
- --------------------------------------------------------------------------------
Net Asset Value, End of Period $9.84 $9.47
================================================================================
TOTAL RETURN(4) 3.91% (1.97)%
- --------------------------------------------------------------------------------
RATIOS/SUPPLEMENTAL DATA
- --------------------------------------------------------------------------------
Ratio of Operating Expenses to Average Net Assets 0.39%(5) 0.39%(5)
- -----------------------------------------------------
Ratio of Net Investment Income to Average Net Assets 6.62%(5) 4.17%(5)
- -----------------------------------------------------
Portfolio Turnover Rate 15% 51%
- -----------------------------------------------------
Net Assets, End of Period (in thousands) $40 $38
- --------------------------------------------------------------------------------
(1) Six months ended September 30, 2006 (unaudited).
(2) May 31, 2005 (fund inception) through March 31, 2006.
(3) Computed using average shares outstanding throughout the period.
(4) Total return assumes reinvestment of net investment income and capital
gains distributions, if any. Total returns for periods less than one year
are not annualized. The total return of the classes may not precisely
reflect the class expense differences because of the impact of calculating
the net asset values to two decimal places. If net asset values were
calculated to three decimal places, the total return differences would more
closely reflect the class expense differences. The calculation of net asset
values to two decimal places is made in accordance with SEC guidelines and
does not result in any gain or loss of value between one class and another.
(5) Annualized.
See Notes to Financial Statements.
- ------
20
Inflation Protection Bond - Financial Highlights
For a Share Outstanding Throughout the Periods Indicated
- --------------------------------------------------------------------------------
A CLASS
- --------------------------------------------------------------------------------
2006(1) 2006(2)
- --------------------------------------------------------------------------------
PER-SHARE DATA
- --------------------------------------------------------------------------------
Net Asset Value, Beginning of Period $9.45 $10.00
- --------------------------------------------------------------------------------
Income From Investment Operations
- -----------------------------------------------------
Net Investment Income 0.29(3) 0.33
- -----------------------------------------------------
Net Realized and Unrealized Gain (Loss) 0.04 (0.55)
- --------------------------------------------------------------------------------
Total From Investment Operations 0.33 (0.22)
- --------------------------------------------------------------------------------
Distributions
- -----------------------------------------------------
From Net Investment Income (0.29) (0.33)
- --------------------------------------------------------------------------------
Net Asset Value, End of Period $9.49 $9.45
================================================================================
TOTAL RETURN(4) 3.60% (2.35)%
- --------------------------------------------------------------------------------
RATIOS/SUPPLEMENTAL DATA
- --------------------------------------------------------------------------------
Ratio of Operating Expenses to Average Net Assets 0.84%(5) 0.84%(5)
- -----------------------------------------------------
Ratio of Net Investment Income to Average Net Assets 6.17%(5) 3.72%(5)
- -----------------------------------------------------
Portfolio Turnover Rate 15% 51%
- -----------------------------------------------------
Net Assets, End of Period (in thousands) $12,475 $8,164
- --------------------------------------------------------------------------------
(1) Six months ended September 30, 2006 (unaudited).
(2) May 31, 2005 (fund inception) through March 31, 2006.
(3) Computed using average shares outstanding throughout the period.
(4) Total return assumes reinvestment of net investment income and capital
gains distributions, if any, and does not reflect applicable sales charges.
Total returns for periods less than one year are not annualized. The total
return of the classes may not precisely reflect the class expense
differences because of the impact of calculating the net asset values to two
decimal places. If net asset values were calculated to three decimal places,
the total return differences would more closely reflect the class expense
differences. The calculation of net asset values to two decimal places is
made in accordance with SEC guidelines and does not result in any gain or
loss of value between one class and another.
(5) Annualized.
See Notes to Financial Statements.
- ------
21
Inflation Protection Bond - Financial Highlights
For a Share Outstanding Throughout the Periods Indicated
- --------------------------------------------------------------------------------
B CLASS
- --------------------------------------------------------------------------------
2006(1) 2006(2)
- --------------------------------------------------------------------------------
PER-SHARE DATA
- --------------------------------------------------------------------------------
Net Asset Value, Beginning of Period $9.45 $10.00
- --------------------------------------------------------------------------------
Income From Investment Operations
- -----------------------------------------------------
Net Investment Income 0.25(3) 0.27
- -----------------------------------------------------
Net Realized and Unrealized Gain (Loss) 0.04 (0.55)
- --------------------------------------------------------------------------------
Total From Investment Operations 0.29 (0.28)
- --------------------------------------------------------------------------------
Distributions
- -----------------------------------------------------
From Net Investment Income (0.24) (0.27)
- --------------------------------------------------------------------------------
Net Asset Value, End of Period $9.50 $9.45
================================================================================
TOTAL RETURN(4) 3.16% (2.87)%
- --------------------------------------------------------------------------------
RATIOS/SUPPLEMENTAL DATA
- --------------------------------------------------------------------------------
Ratio of Operating Expenses to Average Net Assets 1.59%(5) 1.59%(5)
- -----------------------------------------------------
Ratio of Net Investment Income to Average Net Assets 5.42%(5) 2.97%(5)
- -----------------------------------------------------
Portfolio Turnover Rate 15% 51%
- -----------------------------------------------------
Net Assets, End of Period (in thousands) $983 $830
- --------------------------------------------------------------------------------
(1) Six months ended September 30, 2006 (unaudited).
(2) May 31, 2005 (fund inception) through March 31, 2006.
(3) Computed using average shares outstanding throughout the period.
(4) Total return assumes reinvestment of net investment income and capital
gains distributions, if any, and does not reflect applicable sales charges.
Total returns for periods less than one year are not annualized. The total
return of the classes may not precisely reflect the class expense
differences because of the impact of calculating the net asset values to two
decimal places. If net asset values were calculated to three decimal places,
the total return differences would more closely reflect the class expense
differences. The calculation of net asset values to two decimal places is
made in accordance with SEC guidelines and does not result in any gain or
loss of value between one class and another.
(5) Annualized.
See Notes to Financial Statements.
- ------
22
Inflation Protection Bond - Financial Highlights
For a Share Outstanding Throughout the Periods Indicated
- --------------------------------------------------------------------------------
C CLASS
- --------------------------------------------------------------------------------
2006(1) 2006(2)
- --------------------------------------------------------------------------------
PER-SHARE DATA
- --------------------------------------------------------------------------------
Net Asset Value, Beginning of Period $9.44 $10.00
- --------------------------------------------------------------------------------
Income From Investment Operations
- -----------------------------------------------------
Net Investment Income 0.25(3) 0.27
- -----------------------------------------------------
Net Realized and Unrealized Gain (Loss) 0.04 (0.56)
- --------------------------------------------------------------------------------
Total From Investment Operations 0.29 (0.29)
- --------------------------------------------------------------------------------
Distributions
- -----------------------------------------------------
From Net Investment Income (0.25) (0.27)
- --------------------------------------------------------------------------------
Net Asset Value, End of Period $9.48 $9.44
================================================================================
TOTAL RETURN(4) 3.18% (2.95)%
- --------------------------------------------------------------------------------
RATIOS/SUPPLEMENTAL DATA
- --------------------------------------------------------------------------------
Ratio of Operating Expenses to Average Net Assets 1.59%(5) 1.59%(5)
- -----------------------------------------------------
Ratio of Net Investment Income to Average Net Assets 5.42%(5) 2.97%(5)
- -----------------------------------------------------
Portfolio Turnover Rate 15% 51%
- -----------------------------------------------------
Net Assets, End of Period (in thousands) $6,578 $5,215
- --------------------------------------------------------------------------------
(1) Six months ended September 30, 2006 (unaudited).
(2) May 31, 2005 (fund inception) through March 31, 2006.
(3) Computed using average shares outstanding throughout the period.
(4) Total return assumes reinvestment of net investment income and capital
gains distributions, if any, and does not reflect applicable sales charges.
Total returns for periods less than one year are not annualized. The total
return of the classes may not precisely reflect the class expense
differences because of the impact of calculating the net asset values to two
decimal places. If net asset values were calculated to three decimal places,
the total return differences would more closely reflect the class expense
differences. The calculation of net asset values to two decimal places is
made in accordance with SEC guidelines and does not result in any gain or
loss of value between one class and another.
(5) Annualized.
See Notes to Financial Statements.
- ------
23
Inflation Protection Bond - Financial Highlights
For a Share Outstanding Throughout the Periods Indicated
- --------------------------------------------------------------------------------
R CLASS
- --------------------------------------------------------------------------------
2006(1) 2006(2)
- --------------------------------------------------------------------------------
PER-SHARE DATA
- --------------------------------------------------------------------------------
Net Asset Value, Beginning of Period $9.46 $10.00
- --------------------------------------------------------------------------------
Income From Investment Operations
- -----------------------------------------------------
Net Investment Income 0.26(3) 0.30
- -----------------------------------------------------
Net Realized and Unrealized Gain (Loss) 0.07 (0.54)
- --------------------------------------------------------------------------------
Total From Investment Operations 0.33 (0.24)
- --------------------------------------------------------------------------------
Distributions
- -----------------------------------------------------
From Net Investment Income -- (0.30)
- --------------------------------------------------------------------------------
Net Asset Value, End of Period $9.79 $9.46
================================================================================
TOTAL RETURN(4) 3.49% (2.48)%
- --------------------------------------------------------------------------------
RATIOS/SUPPLEMENTAL DATA
- --------------------------------------------------------------------------------
Ratio of Operating Expenses to Average Net Assets 1.09%(5) 1.09%(5)
- -----------------------------------------------------
Ratio of Net Investment Income to Average Net Assets 5.92%(5) 3.47%(5)
- -----------------------------------------------------
Portfolio Turnover Rate 15% 51%
- -----------------------------------------------------
Net Assets, End of Period (in thousands) $57 $26
- --------------------------------------------------------------------------------
(1) Six months ended September 30, 2006 (unaudited).
(2) May 31, 2005 (fund inception) through March 31, 2006.
(3) Computed using average shares outstanding throughout the period.
(4) Total return assumes reinvestment of net investment income and capital
gains distributions, if any. Total returns for periods less than one year
are not annualized. The total return of the classes may not precisely
reflect the class expense differences because of the impact of calculating
the net asset values to two decimal places. If net asset values were
calculated to three decimal places, the total return differences would more
closely reflect the class expense differences. The calculation of net asset
values to two decimal places is made in accordance with SEC guidelines and
does not result in any gain or loss of value between one class and another.
(5) Annualized.
See Notes to Financial Statements.
- ------
24
Approval of Management Agreement for Inflation Protection Bond
Under Section 15(c) of the Investment Company Act, contracts for investment
advisory services are required to be reviewed, evaluated and approved by a
majority of a fund's independent directors or trustees (the "Directors") each
year. At American Century, this process is referred to as the "15(c) Process."
As a part of this process, the board reviews fund performance, shareholder
services, audit and compliance information, and a variety of other reports from
the advisor concerning fund operations. In addition to this annual review, the
board of directors oversees and evaluates on a continuous basis at its quarterly
meetings the nature and quality of significant services performed by the
advisor, fund performance, audit and compliance information, and a variety of
other reports relating to fund operations. The board, or committees of the
board, also holds special meetings as needed.
Under a Securities and Exchange Commission rule, each fund is required to
disclose in its annual or semiannual report, as appropriate, the material
factors and conclusions that formed the basis for the board's approval or
renewal of any advisory agreements within the fund's most recently completed
fiscal half-year period.
ANNUAL CONTRACT REVIEW PROCESS
As part of the annual 15(c) Process undertaken during the most recent fiscal
half-year period, the Directors reviewed extensive data and information compiled
by the advisor and certain independent providers of evaluative data (the "15(c)
Providers") concerning Inflation Protection Bond (the "fund") and the services
provided to the fund under the management agreement. The information considered
and the discussions held at the meetings included, but were not limited to:
* the nature, extent and quality of investment management, share-holder
services and other services provided to the fund under the management
agreement;
* reports on the advisor's activities relating to the wide range of programs
and services the advisor provides to the fund and its shareholders on a
routine and non-routine basis;
* data comparing the cost of owning the fund to the cost of owning a similar
fund;
* data comparing the fund's performance to appropriate benchmarks and/or a
peer group of other mutual funds with similar investment objectives and
strategies;
* financial data showing the profitability of the fund to the advisor and the
overall profitability of the advisor; and
* data comparing services provided and charges to other investment management
clients of the advisor.
In keeping with its practice, the fund's board of directors held two regularly
scheduled meetings and one special meeting to review and discuss the information
provided by the advisor and to complete its negotiations with the advisor
regarding the renewal of the management agreement, including the setting of the
applicable advisory fee. The board also had the benefit of
(continued)
- ------
25
Approval of Management Agreement for Inflation Protection Bond
the advice of its independent counsel throughout the period.
FACTORS CONSIDERED
The Directors considered all of the information provided by the advisor, the
15(c) Providers, and the board's independent counsel, and evaluated such
information for each fund for which the board has responsibility. The Directors
did not identify any single factor as being all-important or controlling, and
each Director may have attributed different levels of importance to different
factors. In deciding to renew the agreement under the terms ultimately
determined by the board to be appropriate, the Directors' decision was based on
the following factors.
NATURE, EXTENT AND QUALITY OF SERVICES -- GENERALLY. Under the management
agreement, the advisor is responsible for providing or arranging for all
services necessary for the operation of the fund. The board noted that under the
management agreement, the advisor provides or arranges at its own expense a wide
variety of services including:
* fund construction and design
* portfolio security selection
* initial capitalization/funding
* securities trading
* custody of fund assets
* daily valuation of the fund's portfolio
* shareholder servicing and transfer agency, including shareholder
confirmations, recordkeeping and communications
* legal services
* regulatory and portfolio compliance
* financial reporting
* marketing and distribution
The Directors noted that many of these services have expanded over time both in
terms of quantity and complexity in response to shareholder demands, competition
in the industry and the changing regulatory environment. In performing their
evaluation, the Directors considered information received in connection with the
annual review, as well as information provided on an ongoing basis at their
regularly scheduled board and committee meetings.
INVESTMENT MANAGEMENT SERVICES. The nature of the investment management services
provided is quite complex and allows fund shareholders access to professional
money management, instant diversification of their investments within an asset
class, the opportunity to easily diversify among asset classes, and liquidity.
In evaluating investment performance, the board expects the advisor to manage
the fund in accordance with its investment objectives and approved strategies.
In providing these services, the advisor utilizes teams of investment
professionals (portfolio managers, analysts, research assistants, and securities
traders) who require extensive information technology, research, training,
compliance and other systems to conduct their business. At each quarterly
meeting the Directors review investment performance information for the fund,
together with comparative information for appropriate bench-
(continued)
- ------
26
Approval of Management Agreement for Inflation Protection Bond
marks and peer groups of funds managed similarly to the fund. If performance
concerns are identified, the Directors discuss with the advisor the reasons for
such results (e.g., market conditions, security selection) and any efforts being
undertaken to improve performance.
SHAREHOLDER AND OTHER SERVICES. The advisor provides the fund with a
comprehensive package of transfer agency, shareholder, and other services. The
Directors review reports and evaluations of such services at their regular
quarterly meetings, including the annual meeting concerning contract review, and
reports to the board. These reports include, but are not limited to, information
regarding the operational efficiency and accuracy of the shareholder and
transfer agency services provided, staffing levels, shareholder satisfaction (as
measured by external as well as internal sources), technology support, new
products and services offered to fund shareholders, securities trading
activities, portfolio valuation services, auditing services, and legal and
operational compliance activities. Certain aspects of shareholder and transfer
agency service level efficiency and the quality of securities trading activities
are measured by independent third party providers and are presented in
comparison to other fund groups not managed by the advisor.
COSTS OF SERVICES PROVIDED AND PROFITABILITY TO THE ADVISOR. The advisor
provides detailed information concerning its cost of providing various services
to the fund, its profitability in managing the fund, its overall profitability,
and its financial condition. The Directors have reviewed with the advisor the
methodology used to prepare this financial information. This financial
information regarding the advisor is considered in order to evaluate the
advisor's financial condition, its ability to continue to provide services under
the management agreement, and the reasonableness of the current management fee.
ETHICS OF THE ADVISOR. The Directors generally consider the advisor's commitment
to providing quality services to shareholders and to conducting its business
ethically. They noted that the advisor's practices generally meet or exceed
industry best practices and that the advisor was not implicated in the industry
scandals of 2003 and 2004.
ECONOMIES OF SCALE. The Directors review reports provided by the advisor on
economies of scale for the complex as a whole and the year-over-year changes in
revenue, costs, and profitability. The Directors concluded that economies of
scale are difficult to measure and predict with precision, especially on a
fund-by-fund basis. This analysis is also complicated by the additional services
and content provided by the advisor and its reinvestment in its ability to
provide and expand those services. Accordingly, the Directors also seek to
evaluate economies of scale by reviewing other information, such as
year-over-year profitability of the advisor generally, the profitability of its
management of the fund specifically, the expenses incurred by the advisor in
providing various functions to the fund, and the breakpoint fees of competitive
funds not managed by the advisor. The Directors
(continued)
- ------
27
Approval of Management Agreement for Inflation Protection Bond
believe the advisor is appropriately sharing economies of scale through its
competitive fee structure, fee breakpoints as the fund complex and the fund
increases in size, and through reinvestment in its business to provide
shareholders additional content and services. In particular, separate breakpoint
schedules based on the size of the entire fund complex and on the size of the
fund reflect the complexity of assessing economies of scale.
COMPARISON TO OTHER FUNDS' FEES. The fund pays the advisor a single,
all-inclusive (or unified) management fee for providing all services necessary
for the management and operation of the fund, other than brokerage expenses,
taxes, interest, extraordinary expenses, and the fees and expenses of the fund's
independent directors (including their independent legal counsel). Under the
unified fee structure, the advisor is responsible for providing all investment
advisory, custody, audit, administrative, compliance, recordkeeping, marketing
and shareholder services, or arranging and supervising third parties to provide
such services. By contrast, most other funds are charged a variety of fees,
including an investment advisory fee, a transfer agency fee, an administrative
fee, distribution charges and other expenses. Other than their investment
advisory fees and Rule 12b-1 distribution fees, all other components of the
total fees charged by these other funds may be increased without shareholder
approval. The board believes the unified fee structure is a benefit to fund
shareholders because it clearly discloses to shareholders the cost of owning
fund shares, and, since the unified fee cannot be increased without a vote of
fund shareholders, it shifts to the advisor the risk of increased costs of
operating the fund and provides a direct incentive to minimize administrative
inefficiencies. Part of the Directors' analysis of fee levels involves reviewing
certain evaluative data compiled by an independent provider and comparing the
fund's unified fee to the total expense ratio of other funds in the fund's peer
group. The unified fee charged to shareholders of the fund was in the lowest
quartile of the total expense ratios of its peer group.
COMPARISON TO FEES AND SERVICES PROVIDED TO OTHER CLIENTS OF THE ADVISOR. The
Directors also requested and received information from the advisor concerning
the nature of the services, fees, and profitability of its advisory services to
advisory clients other than the fund. They observed that these varying types of
client accounts require different services and involve different regulatory and
entrepreneurial risks than the management of the fund. The Directors analyzed
this information and concluded that the fees charged and services provided to
the fund were reasonable by comparison.
COLLATERAL BENEFITS DERIVED BY THE ADVISOR. The Directors reviewed information
from the advisor concerning collateral benefits it receives as a result of its
relationship with the fund. They concluded that the advisor's primary business
is managing mutual funds and it generally does not use the fund or shareholder
information to generate profits in other lines of business, and therefore does
not derive any significant collateral benefits from them. The
(continued)
- ------
28
Approval of Management Agreement for Inflation Protection Bond
Directors noted that the advisor receives proprietary research from broker
dealers that execute fund portfolio transactions and concluded that this
research is likely to benefit fund shareholders. The Directors also determined
that the advisor is able to provide investment management services to certain
clients other than the fund, at least in part, due to its existing
infrastructure built to serve the fund complex. The Directors concluded,
however, that the assets of those other clients are not material to the analysis
and, in any event, are included with the assets of the fund to determine
breakpoints in the fund's fee schedule, provided they are managed using the same
investment team and strategy.
CONCLUSIONS OF THE DIRECTORS
As a result of this process, the Directors, in the absence of particular
circumstances and assisted by the advice of legal counsel that is independent of
the advisor, taking into account all of the factors discussed above and the
information provided by the advisor concluded that the investment management
agreement between the fund and the advisor is fair and reasonable in light of
the services provided and should be renewed.
- ------
29
Share Class Information
Six classes of shares are authorized for sale by the fund: Investor Class,
Institutional Class, A Class, B Class, C Class, and R Class. The total expense
ratio of Institutional Class shares is lower than that of Investor Class shares.
The total expense ratios of A Class, B Class, C Class, and R Class shares are
higher than that of Investor Class shares. The fund is available for purchase
only through financial intermediaries by investors who seek advice from them.
The fund is closed to other investors, but those with open accounts may make
additional investments and reinvest dividends and capital gains distributions as
long as such accounts remain open.
INVESTOR CLASS shares are available for purchase in two ways: 1) directly from
American Century without any commissions or other fees; or 2) through certain
financial intermediaries (such as banks, broker-dealers, insurance companies and
investment advisors), which may require payment of a transaction fee to the
financial intermediary.
INSTITUTIONAL CLASS shares are available to large investors such as endowments,
foundations, and retirement plans, and to financial intermediaries serving these
investors. This class recognizes the relatively lower cost of serving
institutional customers and others who invest at least $5 million ($3 million
for endowments and foundations) in an American Century fund or at least $10
million in multiple funds. In recognition of the larger investments and account
balances and comparatively lower transaction costs, the unified management fee
of Institutional Class shares is 0.20% less than the unified management fee of
Investor Class shares.
A CLASS shares are sold primarily through employer-sponsored retirement plans
and through institutions such as investment advisors, banks, broker-dealers, and
insurance companies. A Class shares are sold at their offering price, which is
net asset value plus an initial sales charge that ranges from 4.50% to 0.00% for
fixed-income funds, depending on the amount invested. The initial sales charge
is deducted from the purchase amount before it is invested. A Class shares may
be subject to a contingent deferred sales charge (CDSC). There is no CDSC on
shares acquired through reinvestment of dividends or capital gains. The
prospectus contains information regarding reductions and waivers of sales
charges for A Class shares. The unified management fee for A Class shares is the
same as for Investor Class shares. A Class shares also are subject to a 0.25%
annual Rule 12b-1 distribution and service fee.
B CLASS shares are sold primarily through employer-sponsored retirement plans
and through institutions such as investment advisors, banks, broker-dealers, and
insurance companies. B Class shares redeemed within six years of purchase are
subject to a CDSC that declines from 5.00% during the first year after purchase
to 0.00% after the sixth year. There is no CDSC on shares acquired through
reinvestment of dividends or capital gains. The unified management fee for B
Class shares is the same as for Investor Class shares. B Class shares also are
subject to a 1.00% annual Rule 12b-1 distribution and service fee. B Class
shares automatically convert to A Class shares (with lower expenses) eight years
after their purchase date.
(continued)
- ------
30
Share Class Information
C CLASS shares are sold primarily through employer-sponsored retirement plans
and through institutions such as investment advisors, banks, broker-dealers, and
insurance companies. C Class shares redeemed within 12 months of purchase are
subject to a CDSC of 1.00%. There is no CDSC on shares acquired through
reinvestment of dividends or capital gains. The unified management fee for C
Class shares is the same as for Investor Class shares. C Class shares also are
subject to a Rule 12b-1 distribution and service fee of 1.00%.
R CLASS shares are sold primarily through employer-sponsored retirement plans
and through institutions such as investment advisors, banks, broker-dealers, and
insurance companies. The unified management fee for R Class shares is the same
as for Investor Class shares. R Class shares are subject to a 0.50% annual Rule
12b-1 distribution and service fee.
All classes of shares represent a pro rata interest in the fund and generally
have the same rights and preferences.
- ------
31
Additional Information
RETIREMENT ACCOUNT INFORMATION
As required by law, any distributions you receive from an IRA or certain 403(b),
457 and qualified plans [those not eligible for rollover to an IRA or to another
qualified plan] are subject to federal income tax withholding, unless you elect
not to have withholding apply. Tax will be withheld on the total amount
withdrawn even though you may be receiving amounts that are not subject to
withholding, such as nondeductible contributions. In such case, excess amounts
of withholding could occur. You may adjust your withholding election so that a
greater or lesser amount will be withheld.
If you don't want us to withhold on this amount, you must notify us to not
withhold the federal income tax. Even if you plan to roll over the amount you
withdraw to another tax-deferred account, the withholding rate still applies to
the withdrawn amount unless we have received notice not to withhold federal
income tax prior to the withdrawal. You may notify us in writing or in certain
situations by telephone or through other electronic means. You have the right to
revoke your withholding election at any time and any election you make may
remain in effect until revoked by filing a new election.
Remember, even if you elect not to have income tax withheld, you are liable for
paying income tax on the taxable portion of your withdrawal. If you elect not to
have income tax withheld or you don't have enough income tax withheld, you may
be responsible for payment of estimated tax. You may incur penalties under the
estimated tax rules if your withholding and estimated tax payments are not
sufficient.
State tax will be withheld if, at the time of your distribution, your address is
within one of the mandatory withholding states and you have federal income tax
withheld. State taxes will be withheld from your distribution in accordance with
the respective state rules.
PROXY VOTING GUIDELINES
American Century Investment Management, Inc., the fund's investment advisor, is
responsible for exercising the voting rights associated with the securities
purchased and/or held by the fund. A description of the policies and procedures
the advisor uses in fulfilling this responsibility is available without charge,
upon request, by calling 1-800-345-2021. It is also available on American
Century's website at americancentury.com and on the Securities and Exchange
Commission's website at sec.gov. Information regarding how the investment
advisor voted proxies relating to portfolio securities during the most recent
12-month period ended June 30 is available on the "About Us" page at
americancentury.com. It is also available at sec.gov.
QUARTERLY PORTFOLIO DISCLOSURE
The fund files its complete schedule of portfolio holdings with the Securities
and Exchange Commission (SEC) for the first and third quarters of each fiscal
year on Form N-Q. The fund's Form N-Q is available on the SEC's website at
sec.gov, and may be reviewed and copied at the SEC's Public Reference Room in
Washington, DC. Information on the operation of the Public Reference Room may be
obtained by calling 1-800-SEC-0330. The fund also makes its complete schedule of
portfolio holdings for the most recent quarter of its fiscal year available on
its website at americancentury.com and, upon request, by calling 1-800-345-2021.
- ------
32
Index Definitions
The following indices are used to illustrate investment market, sector, or style
performance or to serve as fund performance comparisons. They are not investment
products available for purchase.
The CITIGROUP U.S. INFLATION-LINKED SECURITIES INDEX (ILSI) measures the return
of bonds with fixed-rate coupon payments that adjust for inflation as measured
by the Consumer Price Index (CPI).
The LEHMAN BROTHERS U.S. AGENCY INDEX is composed of those securities included
in the Lehman Brothers U.S. Aggregate Index that are public obligations of U.S.
government agencies, quasi-federal corporations, and corporate or foreign debt
guaranteed by the U.S. government.
The LEHMAN BROTHERS U.S. AGGREGATE INDEX represents securities that are taxable,
registered with the Securities and Exchange Commission, and U.S. dollar-
denominated. The index covers the U.S. investment-grade fixed-rate bond market,
with index components for government and corporate securities, mortgage pass-
through securities, and asset-backed securities.
The LEHMAN BROTHERS U.S. CORPORATE HIGH-YIELD INDEX covers the U.S. dollar-
denominated, non-investment grade, fixed-rate, taxable corporate bond market.
The LEHMAN BROTHERS U.S. CORPORATE INDEX is composed of those securities
included in the Lehman Brothers U.S. Aggregate Index that are U.S. dollar-
denominated, investment-grade, fixed-rate, taxable securities sold by
industrial, utility and financial issuers.
The LEHMAN BROTHERS U.S. FIXED-RATE MORTGAGE-BACKED SECURITIES (MBS) INDEX is
the MBS Fixed-Rate component of the Lehman Brothers U.S. Aggregate Index. It
covers the mortgage-backed pass-through securities of the Government National
Mortgage Association (GNMA), the Federal National Mortgage Association (FNMA),
and the Federal Home Loan Mortgage Corporation (FHLMC).
The LEHMAN BROTHERS U.S. TREASURY INDEX is composed of those securities included
in the Lehman Brothers U.S. Aggregate Index that are public obligations of the
U.S. Treasury with a remaining maturity of one year or more.
The LEHMAN BROTHERS U.S. TIPS (TREASURY INFLATION PROTECTED SECURITIES) INDEX
measures the performance of coupon-bearing fixed-income securities that adjust
for inflation, as measured by the Consumer Price Index for All Urban Consumers.
- ------
33
Notes
- ------
34
Notes
- ------
35
Notes
- ------
36
CONTACT US
AMERICANCENTURY.COM
AUTOMATED INFORMATION LINE:
1-800-345-8765
INVESTOR SERVICES REPRESENTATIVE:
1-800-345-2021 or 816-531-5575
INVESTORS USING ADVISORS:
1-800-378-9878
BUSINESS, NOT-FOR-PROFIT,
EMPLOYER-SPONSORED RETIREMENT PLANS:
1-800-345-3533
BANKS AND TRUST COMPANIES, BROKER-DEALERS,
FINANCIAL PROFESSIONALS, INSURANCE COMPANIES:
1-800-345-6488
TELECOMMUNICATIONS DEVICE FOR THE DEAF:
1-800-634-4113 or 816-444-3485
AMERICAN CENTURY INVESTMENT TRUST
INVESTMENT ADVISOR:
American Century Investment Management, Inc.
Kansas City, Missouri
THIS REPORT AND THE STATEMENTS IT CONTAINS ARE SUBMITTED FOR THE GENERAL
INFORMATION OF OUR SHAREHOLDERS. THE REPORT IS NOT AUTHORIZED FOR DISTRIBUTION
TO PROSPECTIVE INVESTORS UNLESS PRECEDED OR ACCOMPANIED BY AN EFFECTIVE
PROSPECTUS.
The American Century Investments logo, American Century and American Century
Investments are service marks of American Century Proprietary Holdings, Inc.
American Century Investment Services, Inc., Distributor
(c)2006 American Century Proprietary Holdings, Inc. All rights reserved.
0611
SH-SAN-51667N
[front cover]
American Century Investments
Semiannual Report
September 30, 2006
[photo of autumn]
American Century-Mason Street Select Bond Fund
American Century-Mason Street High-Yield Bond Fund
[american century investments logo and text logo]
Our Message to You
[photo of James E. Stowers III and James E. Stowers, Jr.]
/s/James E. Stowers, Jr.
James E. Stowers, Jr.
FOUNDER
AMERICAN CENTURY COMPANIES, INC.
/s/James E. Stowers III
James E. Stowers III
CHAIRMAN OF THE BOARD
AMERICAN CENTURY COMPANIES, INC.
We are pleased to provide you with the semiannual report for the American
Century-Mason Street Select Bond and High-Yield Bond funds for the six months
ended September 30, 2006. We hope you find this information helpful in
monitoring your investment. Another useful resource we offer is our website,
americancentury.com, where we post quarterly portfolio commentaries, the views
of senior investment officers and analysts, and other communications about
investments, portfolio strategy, personal finance, and the markets.
In its most recent rankings, Dalbar -- which issues customer satisfaction
ratings and rankings based on website functionality -- ranked
americancentury.com fourth out of the sites provided by the top 25 fund
companies that it believes lead the industry in web-based technology. Our
website earned an "Excellent" rating, Dalbar's highest designation.
For most of 2006, our website has linked visitors to information explaining our
strategic collaboration with Lance Armstrong and the Lance Armstrong Foundation
(LAF). This campaign, featuring Lance, is designed to encourage investors to
take a more active role in planning their financial futures and make every
investment decision count. To learn more about the collaboration and the LAF,
please visit americancentury.com or www.lanceface.com on the Web and click on
the links to related sites.
With the approach of year end and the 2006 tax season, you can also find out
more about December fund distributions and tax information via a link from our
website. We've posted December distribution estimates for over 50 funds, answers
to frequent distribution questions, and online descriptions of all of the tax
information we provide to investors.
If you haven't visited americancentury.com yet, we encourage you to do so...it's
there to serve you. And so are we. As always, we deeply appreciate your
commitment to American Century Investments.
Table of Contents
Market Perspective. . . . . . . . . . . . . . . . . . . . . . . . . . . . . 2
U.S. Fixed-Income Total Returns . . . . . . . . . . . . . . . . . . . . 2
SELECT BOND
Performance . . . . . . . . . . . . . . . . . . . . . . . . . . . . . . . . 3
Portfolio Commentary. . . . . . . . . . . . . . . . . . . . . . . . . . . . 5
Portfolio at a Glance . . . . . . . . . . . . . . . . . . . . . . . . . 5
Yields . . . . . . . . . . . . . . . . . . . . . . . . . . . . . . . . . 5
Types of Investments in Portfolio . . . . . . . . . . . . . . . . . . . 6
Portfolio Composition by Credit Rating . . . . . . . . . . . . . . . . . 6
Schedule of Investments . . . . . . . . . . . . . . . . . . . . . . . . . . 7
HIGH-YIELD BOND
Performance . . . . . . . . . . . . . . . . . . . . . . . . . . . . . . . .14
Portfolio Commentary. . . . . . . . . . . . . . . . . . . . . . . . . . . .16
Portfolio at a Glance . . . . . . . . . . . . . . . . . . . . . . . . .16
Yields . . . . . . . . . . . . . . . . . . . . . . . . . . . . . . . . .16
Top Five Industries . . . . . . . . . . . . . . . . . . . . . . . . . .17
Portfolio Composition by Credit Rating . . . . . . . . . . . . . . . . .17
Schedule of Investments . . . . . . . . . . . . . . . . . . . . . . . . . .18
Shareholder Fee Examples. . . . . . . . . . . . . . . . . . . . . . . . . .24
FINANCIAL STATEMENTS
Statement of Assets and Liabilities . . . . . . . . . . . . . . . . . . . .27
Statement of Operations . . . . . . . . . . . . . . . . . . . . . . . . . .29
Statement of Changes in Net Assets. . . . . . . . . . . . . . . . . . . . .30
Notes to Financial Statements . . . . . . . . . . . . . . . . . . . . . . .31
Financial Highlights. . . . . . . . . . . . . . . . . . . . . . . . . . . .38
OTHER INFORMATION
Share Class Information . . . . . . . . . . . . . . . . . . . . . . . . . .50
Additional Information. . . . . . . . . . . . . . . . . . . . . . . . . . .52
Index Definitions . . . . . . . . . . . . . . . . . . . . . . . . . . . . .53
The opinions expressed in the Market Perspective and each of the Portfolio
Commentaries reflect those of the portfolio management team as of the date of
the report, and do not necessarily represent the opinions of American Century or
any other person in the American Century organization. Any such opinions are
subject to change at any time based upon market or other conditions and American
Century disclaims any responsibility to update such opinions. These opinions may
not be relied upon as investment advice and, because investment decisions made
by American Century funds are based on numerous factors, may not be relied upon
as an indication of trading intent on behalf of any American Century fund.
Security examples are used for representational purposes only and are not
intended as recommendations to purchase or sell securities. Performance
information for comparative indices and securities is provided to American
Century by third party vendors. To the best of American Century's knowledge,
such information is accurate at the time of printing.
Market Perspective
[photo of David MacEwen]
BY DAVID MACEWEN, CHIEF INVESTMENT OFFICER, FIXED INCOME
A TALE OF TWO QUARTERS
The second and third quarters of 2006 were very different in terms of inflation
and interest rate expectations and market performance. In the second quarter, as
core inflation rates remained above the Federal Reserve's 1-2% "comfort zone"
and threatened to go higher, investors feared the Fed would keep raising
interest rates and tip the economy into recession. Uncertainty about how far the
Fed would go, and how successful it would be in containing inflation, created a
defensive attitude in financial markets that resulted in disappointing returns
for broad stock and bond indices.
A FED PAUSE REFRESHED THE MARKETS
But in the third quarter, a 15% drop in oil prices helped take the heat off
inflation pressures, and cut business and consumer costs. Weakness in the
housing market--though hard on many homeowners--turned into a positive factor
for the markets. As home sales and prices declined, the Fed stopped its interest
rate tightening campaign, stepping back to assess the economy's reaction to
previous rate hikes. This combination of falling energy prices and relief from
rising interest rates helped broad U.S. stock and bond markets rebound from
second-quarter losses to post some of their biggest quarterly gains this decade.
LONG-DURATION AND CORPORATE SECURITIES OUTPERFORMED
The bond market especially welcomed a gloomy housing-market forecast,
speculating that it would reduce economic growth, inflation, and interest rates.
This rekindled demand for longer-term fixed-income securities. As a result, the
Treasury yield curve fell for the six months and "inverted", as the two-year
yield (4.69%) remained higher than the 10-year yield (4.63%), and both fell well
below the Fed's 5.25% overnight interest rate target. Mirroring the stock
market's rally, the corporate sectors led the broad taxable market.
U.S. FIXED-INCOME TOTAL RETURNS
For the six months ended September 30, 2006(1)
- --------------------------------------------------------------------------------
TREASURY SECURITIES
- --------------------------------------------------------------------------------
3-month bill 2.51%
- --------------------------------------------------------------------------------
2-year note 2.53%
- --------------------------------------------------------------------------------
5-year note 3.20%
- --------------------------------------------------------------------------------
10-year note 3.83%
- --------------------------------------------------------------------------------
30-year bond 4.64%
- --------------------------------------------------------------------------------
LEHMAN BROTHERS U.S. BOND MARKET INDICES
- --------------------------------------------------------------------------------
Corporate High-Yield 4.33%
- --------------------------------------------------------------------------------
Corporate Investment-Grade 4.12%
- --------------------------------------------------------------------------------
Aggregate (multi-sector) 3.73%
- --------------------------------------------------------------------------------
Fixed-Rate Mortgage-Backed 3.64%
- --------------------------------------------------------------------------------
Treasury 3.61%
- --------------------------------------------------------------------------------
Agency 3.45%
- --------------------------------------------------------------------------------
(1) Total returns for less than one year are not annualized.
- ------
2
Select Bond - Performance
TOTAL RETURNS AS OF SEPTEMBER 30, 2006
----------------------
AVERAGE ANNUAL RETURNS
- --------------------------------------------------------------------------------------------
SINCE INCEPTION
6 MONTHS(1) 1 YEAR 5 YEARS INCEPTION DATE
- --------------------------------------------------------------------------------------------
A CLASS 3/31/97
No sales charge* 3.19%(2) 2.72%(2) 4.87% 6.43%
With sales charge* -1.46%(2) -1.90%(2) 3.90% 5.91%
- --------------------------------------------------------------------------------------------
CITIGROUP US BROAD
INVESTMENT-GRADE BOND INDEX 3.73% 3.71% 4.85% 6.52% --
- --------------------------------------------------------------------------------------------
Investor Class -- -- -- 3.27%(1) 4/3/06
- --------------------------------------------------------------------------------------------
Institutional Class -- -- -- 3.37%(1) 4/3/06
- --------------------------------------------------------------------------------------------
B Class 3/31/97
No sales charge* 2.86%(2) 2.07%(2) 4.19%(2) 5.73%
With sales charge* -2.14%(2) -1.93%(2) 4.02%(2) 5.73%
- --------------------------------------------------------------------------------------------
C Class 4/3/06
No sales charge* -- -- -- 2.76%(1)
With sales charge* -- -- -- 1.76%(1)
- --------------------------------------------------------------------------------------------
R Class -- -- -- 3.02%(1) 4/3/06
- --------------------------------------------------------------------------------------------
*Sales charges include initial sales charges and contingent deferred sales
charges (CDSCs), as applicable. A Class shares have a 4.50% maximum initial
sales charge for fixed income funds and may be subject to a maximum CDSC of
1.00%. B Class shares redeemed within six years of purchase are subject to a
CDSC that declines from 5.00% during the first year after purchase to 0.00% the
sixth year after purchase. C Class shares redeemed within 12 months of purchase
are subject to a maximum CDSC of 1.00%. Please see the Share Class Information
pages for more about the applicable sales charges for each share class. The SEC
requires that mutual funds provide performance information net of maximum sales
charges in all cases where charges could be applied.
Select Bond acquired all of the net assets of the Mason Street Select Bond Fund
on March 31, 2006, pursuant to a plan of reorganization approved by the
acquired fund's shareholders on March 23, 2006. Performance information prior
to April 1, 2006 is that of the Mason Street Select Bond Fund.
(1) Total returns for periods less than one year are not annualized.
(2) Class returns would have been lower if fees had not been waived.
Data presented reflect past performance. Past performance is no guarantee of
future results. Current performance may be higher or lower than the performance
shown. Investment return and principal value will fluctuate, and redemption
value may be more or less than original cost. To obtain performance data current
to the most recent month end, please call 1-800-345-2021 or visit
americancentury.com. As interest rates rise, bond values will decline.
Unless otherwise indicated, performance reflects A Class shares; performance for
other share classes will vary due to differences in fee structure. For
information about other share classes available, please consult the prospectus.
Data assumes reinvestment of dividends and capital gains, and none of the charts
reflect the deduction of taxes that a shareholder would pay on fund
distributions or the redemption of fund shares. Returns for the index are
provided for comparison. The fund's total returns include operating expenses
(such as transaction costs and management fees) that reduce returns, while the
total returns of the index do not.
(continued)
- ------
3
Select Bond - Performance
GROWTH OF $10,000 OVER LIFE OF CLASS
$10,000 investment made March 31, 1997

ONE-YEAR RETURNS OVER LIFE OF CLASS
Periods ended September 30
- ----------------------------------------------------------------------------------------------
1997* 1998 1999 2000 2001 2002 2003 2004 2005 2006
- ----------------------------------------------------------------------------------------------
A Class**
(no sales charge) 8.76% 3.69% 4.81% 6.15% 13.58% 11.56% 5.80% 2.98% 1.61% 2.72%
- ----------------------------------------------------------------------------------------------
Citigroup US Broad
Investment-Grade
Bond Index 7.05% 11.47% -0.26% 6.92% 13.06% 8.38% 5.49% 3.82% 2.92% 3.71%
- ----------------------------------------------------------------------------------------------
*From 3/31/97, the A Class's inception date. Not annualized. Select Bond A
Class's initial investment is $9,550 to reflect the maximum 4.50% initial sales
charge.
**Class returns would have been lower, along with the ending value, if fees had
not been waived.
Data presented reflect past performance. Past performance is no guarantee of
future results. Current performance may be higher or lower than the performance
shown. Investment return and principal value will fluctuate, and redemption
value may be more or less than original cost. To obtain performance data current
to the most recent month end, please call 1-800-345-2021 or visit
americancentury.com. As interest rates rise, bond values will decline.
Unless otherwise indicated, performance reflects A Class shares; performance for
other share classes will vary due to differences in fee structure. For
information about other share classes available, please consult the prospectus.
Data assumes reinvestment of dividends and capital gains, and none of the charts
reflect the deduction of taxes that a shareholder would pay on fund
distributions or the redemption of fund shares. Returns for the index are
provided for comparison. The fund's total returns include operating expenses
(such as transaction costs and management fees) that reduce returns, while the
total returns of the index do not.
- ------
4
Select Bond - Portfolio Commentary
PORTFOLIO MANAGER: DAVID ELLS
PERFORMANCE SUMMARY
During the six months ended September 30, 2006, American Century-Mason Street
Select Bond returned 3.19%*, compared with the 3.73% return of its benchmark,
the Citigroup US Broad Investment-Grade (BIG) Bond Index. The portfolio's
returns are reduced by management fees, while the returns of the index are not.
The key theme explaining the portfolio's performance relative to its benchmark
was its defensive positioning--the portfolio had a shorter duration (less
interest rate sensitivity) and higher credit quality than the benchmark at a
time when riskier, longer-term bonds outperformed.
SECTOR COMPOSITION OF THE BENCHMARK AND PORTFOLIO
Select Bond's market exposure is based on the Citigroup BIG, which contains
primarily three bond sectors: fixed-rate mortgage-backed securities (MBS),
Treasury securities, and corporate bonds. MBS represent nearly 40% of the
taxable, investment-grade market while Treasury and corporate securities,
combined, represent approximately 45% of the market.
PORTFOLIO STRATEGIES
We manage Select Bond for high current income by investing primarily in the bond
sectors described earlier. We attempt to add value over a complete market cycle
through sector weightings and individual security selection, looking for
attractive relative values. We make only modest adjustments to the portfolio's
duration, typically keeping it in a relatively narrow range around that of the
benchmark.
Our portfolio positioning during the reporting period--in terms of duration,
credit quality, yield curve exposure, and sector allocation--was based on our
economic view, which calls for a soft landing on the economy, as opposed to an
outright recession.
Looking first at the portfolio's sensitivity to rate changes, we generally kept
duration neutral to slightly short relative to our benchmark. That's because, in
our opinion, many Treasury bonds looked expensive after a big rally in recent
months, pushing yields across the curve well below the Fed's overnight lending
rate. We believe yields at those levels would be attractive only if the economy
were staring down the barrel of a recession and multiple Fed rate cuts.
PORTFOLIO AT A GLANCE
- --------------------------------------------------------------------------------
AS OF
9/30/06
- --------------------------------------------------------------------------------
Weighted Average Maturity 6.7 years
- --------------------------------------------------------------------------------
Average Duration (effective) 4.1 years
- --------------------------------------------------------------------------------
YIELDS AS OF SEPTEMBER 30, 2006
- --------------------------------------------------------------------------------
30-DAY SEC YIELD
- --------------------------------------------------------------------------------
Investor Class 4.94%
- --------------------------------------------------------------------------------
Institutional Class 5.12%
- --------------------------------------------------------------------------------
A Class 4.48%
- --------------------------------------------------------------------------------
B Class 4.04%
- --------------------------------------------------------------------------------
C Class 4.00%
- --------------------------------------------------------------------------------
R Class 4.43%
- --------------------------------------------------------------------------------
*All fund returns referenced in this commentary
are for A Class shares and are not reduced by sales
charges. A Class shares are subject to a maximum sales
charge of 4.50%. Had the sales charge been applied,
returns would be lower than those shown. Total returns
for periods less than one year are not annualized. (continued)
- ------
5
Select Bond - Portfolio Commentary
Because the Treasury yield curve was "flat" (there was relatively little
difference between short- and long-term yields), we were able to reduce Select
Bond's duration without giving up significant additional yield. However, since
long-duration bonds performed well during the period, our duration positioning
limited our relative results.
In terms of credit quality, our expectations for slower economic growth led us
to improve the portfolio's credit profile, underweighting bonds rated BBB in
favor of securities rated A and AA. Because there's little difference in yield
between the highest- and lowest-rated segments of the investment-grade market,
we improved the portfolio's credit quality with comparatively little give-up in
yield. However, because lower-rated bonds outperformed, this trade detracted
modestly from our performance relative to the benchmark.
This cautious theme extends to our sector allocation, where we overweighted MBS
at the expense of corporates. That's because we're concerned that slower
economic growth could hurt corporate credit quality, and because of the
relatively modest yield pick-up currently associated with corporate bonds. In
contrast, MBS offer a combination of high credit quality and attractive yields.
While we think these trades have improved the portfolio's risk/reward profile
going forward, this sector allocation detracted slightly from returns relative
to the index during the last six months.
PORTFOLIO OBJECTIVES AND EXPECTATIONS
Select Bond is designed to serve as a core portfolio holding. Investors can
benefit from exposure to a broad spectrum of bond sectors and from the fund's
historically negative correlation with the major U.S. stock indices. And while
results are not guaranteed, the fund has historically delivered steady monthly
income. Dividend income becomes even more important when there's potential for
flat or rising rates -- it can provide return when there's little price action
and help cushion the impact of price declines. And, because of its high overall
credit quality and broad bond market exposure, Select Bond has the potential to
perform well during periods of economic weakness and declining interest rates.
TYPES OF INVESTMENTS IN PORTFOLIO
- --------------------------------------------------------------------------------
% OF
NET ASSETS
AS OF
9/30/06
- --------------------------------------------------------------------------------
Mortgage-Backed Securities 34.6%
- --------------------------------------------------------------------------------
Corporate Bonds 28.3%
- --------------------------------------------------------------------------------
U.S. Treasury Securities 15.6%
- --------------------------------------------------------------------------------
CMOs 8.9%
- --------------------------------------------------------------------------------
Asset-Backed Securities 5.8%
- --------------------------------------------------------------------------------
Commercial Paper 4.6%
- --------------------------------------------------------------------------------
U.S. Government Agency Securities 2.3%
- --------------------------------------------------------------------------------
Sovereign Governments & Agencies 0.7%
- --------------------------------------------------------------------------------
Temporary Cash Investments 0.4%
- --------------------------------------------------------------------------------
Other Assets and Liabilities (1.2)%
- --------------------------------------------------------------------------------
PORTFOLIO COMPOSITION BY CREDIT RATING
- --------------------------------------------------------------------------------
% OF FUND
INVESTMENTS
AS OF
9/30/06
- --------------------------------------------------------------------------------
AAA 71%
- --------------------------------------------------------------------------------
AA 3%
- --------------------------------------------------------------------------------
A 10%
- --------------------------------------------------------------------------------
BBB 14%
- --------------------------------------------------------------------------------
BB 2%
- --------------------------------------------------------------------------------
- ------
6
Select Bond - Schedule of Investments
SEPTEMBER 30, 2006 (UNAUDITED)
Principal Amount Value
- --------------------------------------------------------------------------------
U.S. GOVERNMENT AGENCY
MORTGAGE-BACKED SECURITIES(1) -- 34.6%
- --------------------------------------------------------------------------------
$ 1,763,000 FHLMC, 6.00%,
settlement date 10/12/06(2) $ 1,772,365
- --------------------------------------------------------------------------------
785,205 FHLMC, 4.50%, 5/1/19 758,439
- --------------------------------------------------------------------------------
325,309 FHLMC, 5.00%, 10/1/19 320,108
- --------------------------------------------------------------------------------
1,106,999 FHLMC, 5.00%, 11/1/19 1,089,302
- --------------------------------------------------------------------------------
74,101 FHLMC, 5.50%, 11/1/19 74,176
- --------------------------------------------------------------------------------
107,163 FHLMC, 5.50%, 11/1/19 107,271
- --------------------------------------------------------------------------------
132,090 FHLMC, 5.50%, 11/1/19 132,224
- --------------------------------------------------------------------------------
95,401 FHLMC, 5.50%, 11/1/19 95,497
- --------------------------------------------------------------------------------
158,246 FHLMC, 5.50%, 11/1/19 158,407
- --------------------------------------------------------------------------------
106,678 FHLMC, 5.50%, 12/1/19 106,786
- --------------------------------------------------------------------------------
32,992 FHLMC, 5.00%, 2/1/20 32,432
- --------------------------------------------------------------------------------
67,981 FHLMC, 5.00%, 2/1/20 66,825
- --------------------------------------------------------------------------------
189,362 FHLMC, 5.50%, 3/1/20 189,387
- --------------------------------------------------------------------------------
172,228 FHLMC, 5.50%, 3/1/20 172,250
- --------------------------------------------------------------------------------
391,568 FHLMC, 5.50%, 3/1/20 391,618
- --------------------------------------------------------------------------------
40,945 FHLMC, 5.00%, 5/1/20 40,250
- --------------------------------------------------------------------------------
115,145 FHLMC, 5.00%, 5/1/20 113,188
- --------------------------------------------------------------------------------
228,876 FHLMC, 5.00%, 5/1/20 224,986
- --------------------------------------------------------------------------------
153,078 FHLMC, 4.00%, 10/1/20 144,353
- --------------------------------------------------------------------------------
254,817 FHLMC, 6.50%, 5/1/34 259,907
- --------------------------------------------------------------------------------
595,514 FHLMC, 5.50%, 6/1/35 587,764
- --------------------------------------------------------------------------------
401,511 FHLMC, 5.50%, 10/1/35 396,285
- --------------------------------------------------------------------------------
2,188,570 FHLMC, 5.00%, 11/1/35 2,106,725
- --------------------------------------------------------------------------------
2,296,941 FHLMC, 5.00%, 12/1/35 2,211,043
- --------------------------------------------------------------------------------
130,682 FHLMC, 6.50%, 3/1/36 133,164
- --------------------------------------------------------------------------------
161,101 FHLMC, 6.50%, 3/1/36 164,160
- --------------------------------------------------------------------------------
939,000 FNMA, 6.00%,
settlement date 10/12/06(2) 943,402
- --------------------------------------------------------------------------------
317,009 FNMA, 5.32%, 4/1/14 318,256
- --------------------------------------------------------------------------------
489,429 FNMA, 5.17%, 1/1/16 487,011
- --------------------------------------------------------------------------------
1,278,789 FNMA, 5.29%, 4/1/16 1,286,924
- --------------------------------------------------------------------------------
160,705 FNMA, 4.00%, 6/1/19 152,143
- --------------------------------------------------------------------------------
1,251,693 FNMA, 4.50%, 6/1/19 1,209,760
- --------------------------------------------------------------------------------
984,780 FNMA, 4.50%, 8/1/19 951,789
- --------------------------------------------------------------------------------
119,760 FNMA, 6.00%, 10/1/19 121,626
- --------------------------------------------------------------------------------
140,399 FNMA, 4.50%, 12/1/19 135,695
- --------------------------------------------------------------------------------
227,706 FNMA, 5.00%, 3/1/20 224,135
- --------------------------------------------------------------------------------
216,606 FNMA, 5.00%, 3/1/20 212,973
- --------------------------------------------------------------------------------
184,719 FNMA, 5.00%, 4/1/20 181,620
- --------------------------------------------------------------------------------
273,673 FNMA, 5.00%, 5/1/20 269,083
- --------------------------------------------------------------------------------
54,913 FNMA, 5.00%, 5/1/20 53,992
- --------------------------------------------------------------------------------
454,446 FNMA, 5.00%, 5/1/20 446,824
- --------------------------------------------------------------------------------
637,838 FNMA, 4.50%, 7/1/20 615,826
- --------------------------------------------------------------------------------
518,394 FNMA, 5.50%, 9/1/34 511,868
- --------------------------------------------------------------------------------
885,112 FNMA, 6.00%, 10/1/34 890,829
- --------------------------------------------------------------------------------
1,602,734 FNMA, 5.00%, 11/1/34 1,543,740
- --------------------------------------------------------------------------------
703,551 FNMA, 6.00%, 11/1/34 708,095
- --------------------------------------------------------------------------------
Principal Amount Value
- --------------------------------------------------------------------------------
$ 53,281 FNMA, 5.50%, 3/1/35 $ 52,536
- --------------------------------------------------------------------------------
349,169 FNMA, 5.50%, 3/1/35 344,281
- --------------------------------------------------------------------------------
86,645 FNMA, 5.50%, 3/1/35 85,432
- --------------------------------------------------------------------------------
422,441 FNMA, 5.50%, 3/1/35 416,528
- --------------------------------------------------------------------------------
106,982 FNMA, 5.50%, 3/1/35 105,484
- --------------------------------------------------------------------------------
492,737 FNMA, 5.00%, 4/1/35 473,929
- --------------------------------------------------------------------------------
66,914 FNMA, 6.00%, 5/1/35 67,260
- --------------------------------------------------------------------------------
13,196 FNMA, 6.00%, 6/1/35 13,264
- --------------------------------------------------------------------------------
59,652 FNMA, 6.00%, 6/1/35 59,961
- --------------------------------------------------------------------------------
1,582,522 FNMA, 5.00%, 7/1/35 1,522,116
- --------------------------------------------------------------------------------
305,128 FNMA, 5.50%, 7/1/35 300,857
- --------------------------------------------------------------------------------
297,773 FNMA, 6.00%, 7/1/35 299,315
- --------------------------------------------------------------------------------
500,624 FNMA, 5.50%, 8/1/35 493,615
- --------------------------------------------------------------------------------
236,605 FNMA, 6.00%, 8/1/35 237,830
- --------------------------------------------------------------------------------
2,010,928 FNMA, 4.50%, 9/1/35 1,880,049
- --------------------------------------------------------------------------------
152,693 FNMA, 5.50%, 9/1/35 150,556
- --------------------------------------------------------------------------------
347,835 FNMA, 5.50%, 9/1/35 342,965
- --------------------------------------------------------------------------------
683,247 FNMA, 5.50%, 9/1/35 673,682
- --------------------------------------------------------------------------------
556,564 FNMA, 5.50%, 9/1/35 548,773
- --------------------------------------------------------------------------------
352,293 FNMA, 5.50%, 9/1/35 347,362
- --------------------------------------------------------------------------------
1,395,357 FNMA, 4.50%, 10/1/35 1,305,139
- --------------------------------------------------------------------------------
552,953 FNMA, 5.00%, 10/1/35 531,847
- --------------------------------------------------------------------------------
1,359,755 FNMA, 5.50%, 10/1/35 1,340,720
- --------------------------------------------------------------------------------
274,526 FNMA, 6.00%, 10/1/35 275,948
- --------------------------------------------------------------------------------
508,616 FNMA, 5.50%, 11/1/35 501,496
- --------------------------------------------------------------------------------
2,143,528 FNMA, 5.50%, 11/1/35 2,113,519
- --------------------------------------------------------------------------------
305,334 FNMA, 6.50%, 11/1/35 311,082
- --------------------------------------------------------------------------------
160,008 FNMA, 6.50%, 11/1/35 163,021
- --------------------------------------------------------------------------------
909,684 FNMA, 6.50%, 12/1/35 926,810
- --------------------------------------------------------------------------------
241,557 FNMA, 6.50%, 4/1/36 246,068
- --------------------------------------------------------------------------------
554,000 FNMA, 6.00%, 9/1/36 556,728
- --------------------------------------------------------------------------------
143,088 GNMA, 5.50%, 2/15/32 142,322
- --------------------------------------------------------------------------------
244,447 GNMA, 5.50%, 2/15/32 243,139
- --------------------------------------------------------------------------------
TOTAL U.S. GOVERNMENT AGENCY
MORTGAGE-BACKED SECURITIES
(Cost $40,571,597) 40,188,137
- --------------------------------------------------------------------------------
CORPORATE BONDS -- 28.3%
AEROSPACE & DEFENSE -- 1.5%
- --------------------------------------------------------------------------------
315,000 BAE Systems Holdings Inc.,
4.75%, 8/15/10 (Acquired
3/21/06, Cost $305,566)(3) 307,097
- --------------------------------------------------------------------------------
125,000 BAE Systems Holdings Inc.,
5.20%, 8/15/15 (Acquired
4/21/06, Cost $116,704)(3) 119,808
- --------------------------------------------------------------------------------
313,000 Boeing Capital Corp.,
4.75%, 8/25/08 310,955
- --------------------------------------------------------------------------------
316,000 General Dynamics Corp.,
3.00%, 5/15/08 305,337
- --------------------------------------------------------------------------------
109,000 General Dynamics Corp.,
4.25%, 5/15/13 103,357
- --------------------------------------------------------------------------------
See Notes to Financial Statements. (continued)
- ------
7
Select Bond - Schedule of Investments
SEPTEMBER 30, 2006 (UNAUDITED)
Principal Amount Value
- --------------------------------------------------------------------------------
$ 65,000 Honeywell International Inc.,
5.40%, 3/15/16 $ 65,308
- --------------------------------------------------------------------------------
75,000 Lockheed Martin Corp., 6.19%,
9/1/36 (Acquired 8/30/06,
Cost $75,527)(3) 78,867
- --------------------------------------------------------------------------------
462,000 Raytheon Company,
5.50%, 11/15/12 466,603
- --------------------------------------------------------------------------------
1,757,332
- --------------------------------------------------------------------------------
AUTO COMPONENTS -- 0.2%
- --------------------------------------------------------------------------------
134,000 Johnson Controls, Inc.,
5.50%, 1/15/16 131,180
- --------------------------------------------------------------------------------
63,000 Johnson Controls, Inc.,
6.00%, 1/15/36 61,177
- --------------------------------------------------------------------------------
192,357
- --------------------------------------------------------------------------------
AUTOMOBILES -- 0.3%
- --------------------------------------------------------------------------------
315,000 DaimlerChrysler N.A.
Holding Corp., 5.75%, 5/18/09 316,488
- --------------------------------------------------------------------------------
BEVERAGES -- 0.7%
- --------------------------------------------------------------------------------
42,000 Anheuser-Busch Companies, Inc.,
7.50%, 3/15/12 46,476
- --------------------------------------------------------------------------------
55,000 Anheuser-Busch Companies, Inc.,
5.75%, 4/1/36 55,587
- --------------------------------------------------------------------------------
160,000 Constellation Brands Inc.,
7.25%, 9/1/16 162,600
- --------------------------------------------------------------------------------
238,000 Fortune Brands Inc.,
5.375%, 1/15/16 227,427
- --------------------------------------------------------------------------------
95,000 PepsiAmericas, Inc.,
4.875%, 1/15/15 91,378
- --------------------------------------------------------------------------------
285,000 SABMiller plc, 6.20%, 7/1/11
(Acquired 6/27/06,
Cost $284,798)(3) 292,782
- --------------------------------------------------------------------------------
876,250
- --------------------------------------------------------------------------------
CAPITAL MARKETS -- 1.5%
- --------------------------------------------------------------------------------
165,000 Credit Suisse First Boston
(USA), Inc., 5.50%, 8/16/11 166,655
- --------------------------------------------------------------------------------
245,000 Credit Suisse First Boston
(USA), Inc., 6.125%, 11/15/11 254,377
- --------------------------------------------------------------------------------
402,000 Goldman Sachs Group, Inc.
(The), 5.15%, 1/15/14 393,613
- --------------------------------------------------------------------------------
105,000 Lehman Brothers Holdings Inc.,
5.50%, 4/4/16 104,804
- --------------------------------------------------------------------------------
60,000 Lehman Brothers Holdings Inc.,
5.875%, 11/15/17 61,520
- --------------------------------------------------------------------------------
50,000 Mellon Bank N.A., 5.45%, 4/1/16 50,182
- --------------------------------------------------------------------------------
77,000 Merrill Lynch & Co., Inc.,
5.00%, 1/15/15 74,784
- --------------------------------------------------------------------------------
181,000 Morgan Stanley,
5.375%, 10/15/15 179,037
- --------------------------------------------------------------------------------
110,000 Morgan Stanley, 6.25%, 8/9/26 114,203
- --------------------------------------------------------------------------------
80,000 Northern Trust Corp.,
5.30%, 8/29/11 80,651
- --------------------------------------------------------------------------------
250,000 State Street Bank & Trust Co.,
5.30%, 1/15/16 248,971
- --------------------------------------------------------------------------------
1,728,797
- --------------------------------------------------------------------------------
Principal Amount Value
- --------------------------------------------------------------------------------
COMMERCIAL BANKS -- 2.0%
- --------------------------------------------------------------------------------
$ 186,000 Bank of New York Co. Inc.
(The), 4.95%, 1/14/11 $ 184,675
- --------------------------------------------------------------------------------
422,000 Bank One Corp., 5.25%, 1/30/13 420,506
- --------------------------------------------------------------------------------
105,000 Barclays Bank plc, 5.93%,
12/15/49 (Acquired
9/21/06-9/27/06,
Cost $105,107)(3) 105,137
- --------------------------------------------------------------------------------
67,000 BB&T Corp., 4.90%, 6/30/17 63,688
- --------------------------------------------------------------------------------
134,000 Compass Bank, 5.50%, 4/1/20 132,551
- --------------------------------------------------------------------------------
124,000 Deutsche Bank Capital
Funding Trust VII, 5.63%,
1/19/16 (Acquired 5/9/06,
Cost $117,352)(3) 121,114
- --------------------------------------------------------------------------------
25,000 HSBC Capital Funding L.P.,
4.61%, 6/27/13 (Acquired
7/18/06, Cost $22,613)(3) 23,238
- --------------------------------------------------------------------------------
250,000 M&I Marshall & Ilsley Bank,
5.30%, 9/8/11 251,359
- --------------------------------------------------------------------------------
255,000 National Australia Bank Ltd.,
4.80%, 4/6/10 (Acquired
3/30/05, Cost $254,709)(3) 251,841
- --------------------------------------------------------------------------------
93,000 UnionBanCal Corp.,
5.25%, 12/16/13 91,792
- --------------------------------------------------------------------------------
380,000 Wachovia Corp., 5.35%, 3/15/11 382,981
- --------------------------------------------------------------------------------
279,000 Zions Bancorporation,
5.50%, 11/16/15 276,145
- --------------------------------------------------------------------------------
2,305,027
- --------------------------------------------------------------------------------
COMMUNICATIONS EQUIPMENT(4)
- --------------------------------------------------------------------------------
35,000 Cisco Systems Inc.,
5.50%, 2/22/16 35,343
- --------------------------------------------------------------------------------
COMPUTERS & PERIPHERALS -- 0.1%
- --------------------------------------------------------------------------------
125,000 Seagate Technology HDD
Holdings, 6.80%, 10/1/16 125,000
- --------------------------------------------------------------------------------
CONSTRUCTION MATERIALS -- 0.1%
- --------------------------------------------------------------------------------
75,000 CRH America Inc.,
6.00%, 9/30/16 75,245
- --------------------------------------------------------------------------------
CONSUMER FINANCE -- 0.2%
- --------------------------------------------------------------------------------
285,000 SLM Corporation,
5.45%, 4/25/11 287,036
- --------------------------------------------------------------------------------
DIVERSIFIED FINANCIAL SERVICES -- 1.2%
- --------------------------------------------------------------------------------
304,000 Bank of America Corp.,
7.40%, 1/15/11 329,315
- --------------------------------------------------------------------------------
105,000 EnCana Holdings Finance Corp.,
5.80%, 5/1/14 105,967
- --------------------------------------------------------------------------------
425,000 HSBC Finance Corp.,
4.125%, 11/16/09 412,457
- --------------------------------------------------------------------------------
276,000 International Lease
Finance Corp., 4.75%, 1/13/12 268,474
- --------------------------------------------------------------------------------
197,000 John Deere Capital Corp.,
4.50%, 8/25/08 194,510
- --------------------------------------------------------------------------------
30,000 Western Union Co. (The),
5.93%, 10/1/16 (Acquired
9/20/06, Cost $29,989)(3) 30,303
- --------------------------------------------------------------------------------
1,341,026
- --------------------------------------------------------------------------------
See Notes to Financial Statements. (continued)
- ------
8
Select Bond - Schedule of Investments
SEPTEMBER 30, 2006 (UNAUDITED)
Principal Amount Value
- --------------------------------------------------------------------------------
DIVERSIFIED TELECOMMUNICATION SERVICES -- 1.7%
- --------------------------------------------------------------------------------
$ 159,000 AT&T Corp., 7.30%, 11/15/11 $ 172,522
- --------------------------------------------------------------------------------
194,000 AT&T Corp., 8.00%, 11/15/31 237,831
- --------------------------------------------------------------------------------
195,000 Deutsche Telekom International
Finance BV, 5.75%, 3/23/16 191,127
- --------------------------------------------------------------------------------
105,000 Embarq Corp., 6.74%, 6/1/13 108,176
- --------------------------------------------------------------------------------
65,000 Embarq Corp., 7.08%, 6/1/16 66,422
- --------------------------------------------------------------------------------
125,000 France Telecom SA,
8.50%, 3/1/31 163,577
- --------------------------------------------------------------------------------
210,000 Sprint Capital Corp.,
8.375%, 3/15/12 235,625
- --------------------------------------------------------------------------------
62,000 Sprint Capital Corp.,
8.75%, 3/15/32 75,825
- --------------------------------------------------------------------------------
146,000 Telecom Italia Capital SA,
4.00%, 1/15/10 138,441
- --------------------------------------------------------------------------------
175,000 Telecom Italia Capital SA,
6.20%, 7/18/11 177,260
- --------------------------------------------------------------------------------
75,000 Telecom Italia Capital SA,
6.00%, 9/30/34 67,268
- --------------------------------------------------------------------------------
140,000 Verizon Communications Inc.,
5.55%, 2/15/16 138,402
- --------------------------------------------------------------------------------
175,000 Verizon Global Funding Corp.,
5.85%, 9/15/35 165,433
- --------------------------------------------------------------------------------
1,937,909
- --------------------------------------------------------------------------------
ELECTRIC UTILITIES -- 4.0%
- --------------------------------------------------------------------------------
60,000 Carolina Power & Light Co.,
6.50%, 7/15/12 63,191
- --------------------------------------------------------------------------------
65,000 Commonwealth Edison Co.,
5.90%, 3/15/36 64,007
- --------------------------------------------------------------------------------
634,000 DTE Energy Co., 7.05%, 6/1/11 671,864
- --------------------------------------------------------------------------------
268,000 Duquesne Light Holdings, Inc.,
5.50%, 8/15/15 251,713
- --------------------------------------------------------------------------------
153,000 Entergy Mississippi Inc.,
6.25%, 4/1/34 149,089
- --------------------------------------------------------------------------------
469,000 Florida Power Corp.,
4.50%, 6/1/10 457,795
- --------------------------------------------------------------------------------
418,000 FPL Group Capital Inc.,
5.55%, 2/16/08 418,823
- --------------------------------------------------------------------------------
339,000 Indiana Michigan Power Co.,
5.05%, 11/15/14 325,716
- --------------------------------------------------------------------------------
181,552 Kiowa Power Partners LLC,
4.81%, 12/30/13 (Acquired
11/19/04, Cost $177,249)(3) 176,496
- --------------------------------------------------------------------------------
123,000 Kiowa Power Partners LLC,
5.74%, 3/30/21 (Acquired
11/19/04, Cost $123,000)(3) 119,219
- --------------------------------------------------------------------------------
30,000 MidAmerican Energy
Holdings Co., 6.125%,
4/1/36 (Acquired 6/16/06,
Cost $28,376)(3) 30,428
- --------------------------------------------------------------------------------
80,000 Monongahela Power Co., 5.70%,
3/15/17 (Acquired 9/13/06,
Cost $79,708)(3) 80,573
- --------------------------------------------------------------------------------
272,000 Nevada Power Co.,
5.875%, 1/15/15 272,135
- --------------------------------------------------------------------------------
Principal Amount Value
- --------------------------------------------------------------------------------
$ 90,000 Nevada Power Co., 6.50%,
5/18/18 (Acquired 5/9/06,
Cost $89,733)(3) $ 93,992
- --------------------------------------------------------------------------------
130,000 Oncor Electric Delivery Co.,
6.375%, 1/15/15 134,432
- --------------------------------------------------------------------------------
110,000 Oncor Electric Delivery Co.,
7.00%, 9/1/22 119,500
- --------------------------------------------------------------------------------
371,000 PacifiCorp, 5.45%, 9/15/13 372,946
- --------------------------------------------------------------------------------
373,000 PPL Electric Utilities Corp.,
4.30%, 6/1/13 348,538
- --------------------------------------------------------------------------------
224,000 Public Service Electric & Gas,
5.00%, 1/1/13 220,240
- --------------------------------------------------------------------------------
235,000 Southern California Edison Co.,
5.00%, 1/15/16 227,390
- --------------------------------------------------------------------------------
4,598,087
- --------------------------------------------------------------------------------
ENERGY EQUIPMENT & SERVICES -- 0.3%
- --------------------------------------------------------------------------------
268,000 Consolidated Natural Gas
Company, 5.00%, 12/1/14 254,901
- --------------------------------------------------------------------------------
65,000 Weatherford International Ltd.,
6.50%, 8/1/36 66,512
- --------------------------------------------------------------------------------
321,413
- --------------------------------------------------------------------------------
FOOD & STAPLES RETAILING -- 0.6%
- --------------------------------------------------------------------------------
253,000 CVS Corp., 4.875%, 9/15/14 240,511
- --------------------------------------------------------------------------------
120,000 CVS Corp., 6.125%, 8/15/16 123,024
- --------------------------------------------------------------------------------
285,000 Delhaize America Inc.,
8.125%, 4/15/11 307,312
- --------------------------------------------------------------------------------
670,847
- --------------------------------------------------------------------------------
FOOD PRODUCTS -- 0.5%
- --------------------------------------------------------------------------------
473,000 Kellogg Co., 6.60%, 4/1/11 498,158
- --------------------------------------------------------------------------------
68,000 Kraft Foods Inc., 6.25%, 6/1/12 70,808
- --------------------------------------------------------------------------------
568,966
- --------------------------------------------------------------------------------
HOTELS, RESTAURANTS & LEISURE -- 0.2%
- --------------------------------------------------------------------------------
100,000 Harrah's Operating Co. Inc.,
5.75%, 10/1/17 91,636
- --------------------------------------------------------------------------------
170,000 Royal Caribbean Cruises Ltd.,
7.00%, 6/15/13 172,713
- --------------------------------------------------------------------------------
264,349
- --------------------------------------------------------------------------------
HOUSEHOLD PRODUCTS -- 0.9%
- --------------------------------------------------------------------------------
399,000 Clorox Company, 4.20%, 1/15/10 386,862
- --------------------------------------------------------------------------------
745,000 Gillette Company (The),
2.50%, 6/1/08 714,005
- --------------------------------------------------------------------------------
1,100,867
- --------------------------------------------------------------------------------
INDUSTRIAL CONGLOMERATES -- 0.2%
- --------------------------------------------------------------------------------
110,000 Siemens
Financieringsmaatschappij N.V.,
5.75%, 10/17/16 (Acquired
8/9/06, Cost $109,721)(3) 111,859
- --------------------------------------------------------------------------------
110,000 Siemens
Financieringsmaatschappij N.V.,
6.125%, 8/17/26 (Acquired
8/9/06, Cost $109,773)(3) 113,112
- --------------------------------------------------------------------------------
224,971
- --------------------------------------------------------------------------------
See Notes to Financial Statements. (continued)
- ------
9
Select Bond - Schedule of Investments
SEPTEMBER 30, 2006 (UNAUDITED)
Principal Amount Value
- --------------------------------------------------------------------------------
INSURANCE -- 1.0%
- --------------------------------------------------------------------------------
$ 745,000 Berkley (W.R.) Corp.,
9.875%, 5/15/08 $ 798,891
- --------------------------------------------------------------------------------
373,000 Berkshire Hathaway
Finance Corp., 3.40%, 7/2/07 368,127
- --------------------------------------------------------------------------------
1,167,018
- --------------------------------------------------------------------------------
MEDIA -- 0.8%
- --------------------------------------------------------------------------------
55,000 News America Inc.,
6.40%, 12/15/35 54,116
- --------------------------------------------------------------------------------
125,000 TCI Communications, Inc.,
8.75%, 8/1/15 148,254
- --------------------------------------------------------------------------------
40,000 Time Warner Companies, Inc.,
7.25%, 10/15/17 43,259
- --------------------------------------------------------------------------------
600,000 Time Warner Entertainment Co.
L.P., 7.25%, 9/1/08 619,896
- --------------------------------------------------------------------------------
37,000 Time Warner Entertainment Co.
L.P., 8.375%, 7/15/33 43,766
- --------------------------------------------------------------------------------
40,000 Viacom Inc., 6.25%, 4/30/16
(Acquired 9/19/06,
Cost $39,444)(3) 39,720
- --------------------------------------------------------------------------------
949,011
- --------------------------------------------------------------------------------
MULTI-UTILITIES -- 1.8%
- --------------------------------------------------------------------------------
25,000 CenterPoint Energy Houston
Electric LLC, 5.70%, 3/15/33 25,257
- --------------------------------------------------------------------------------
30,000 CenterPoint Energy Houston
Electric LLC, 6.95%, 3/15/33 33,449
- --------------------------------------------------------------------------------
313,000 CenterPoint Energy Transition
Bond Co. LLC, 5.17%, 8/1/19 311,186
- --------------------------------------------------------------------------------
55,000 Consolidated Edison Co. of
New York, 5.50%, 9/15/16 55,257
- --------------------------------------------------------------------------------
834,000 Consumers Energy Co.,
4.80%, 2/17/09 824,013
- --------------------------------------------------------------------------------
110,000 Nisource Finance Corp.,
5.40%, 7/15/14 106,619
- --------------------------------------------------------------------------------
110,000 Pacific Gas & Electric Co.,
6.05%, 3/1/34 111,009
- --------------------------------------------------------------------------------
313,000 Puget Sound Energy, Inc.,
3.36%, 6/1/08 302,830
- --------------------------------------------------------------------------------
65,000 Tampa Electric Co.,
6.55%, 5/15/36 69,814
- --------------------------------------------------------------------------------
180,000 Virginia Electric and Power Co.,
6.00%, 1/15/36 178,972
- --------------------------------------------------------------------------------
85,000 XCEL Energy Inc.,
6.50%, 7/1/36 89,982
- --------------------------------------------------------------------------------
2,108,388
- --------------------------------------------------------------------------------
MULTILINE RETAIL -- 0.9%
- --------------------------------------------------------------------------------
302,000 Federated Department
Stores, Inc., 6.30%, 4/1/09 307,313
- --------------------------------------------------------------------------------
63,000 J.C. Penney Corp. Inc.,
6.875%, 10/15/15 66,686
- --------------------------------------------------------------------------------
30,000 May Department Stores Co.
(The), 6.65%, 7/15/24 30,105
- --------------------------------------------------------------------------------
644,000 Target Corp., 5.40%, 10/1/08 647,199
- --------------------------------------------------------------------------------
1,051,303
- --------------------------------------------------------------------------------
Principal Amount Value
- --------------------------------------------------------------------------------
OIL, GAS & CONSUMABLE FUELS -- 2.7%
- --------------------------------------------------------------------------------
$ 30,000 Amerada Hess Corp.,
7.125%, 3/15/33 $ 33,269
- --------------------------------------------------------------------------------
115,000 Anadarko Finance Co.,
7.50%, 5/1/31 131,888
- --------------------------------------------------------------------------------
70,000 Anadarko Petroleum Corp.,
5.95%, 9/15/16 70,968
- --------------------------------------------------------------------------------
45,000 Anadarko Petroleum Corp.,
6.45%, 9/15/36 46,118
- --------------------------------------------------------------------------------
475,000 Conoco Funding Co.,
6.35%, 10/15/11 500,095
- --------------------------------------------------------------------------------
225,000 Kinder Morgan Energy
Partners L.P., 7.30%, 8/15/33 244,817
- --------------------------------------------------------------------------------
300,000 Kinder Morgan Finance Co.,
ULC, 5.35%, 1/5/11 292,045
- --------------------------------------------------------------------------------
82,000 Nexen Inc., 5.875%, 3/10/35 78,444
- --------------------------------------------------------------------------------
380,000 Occidental Petroleum Corp.,
10.125%, 9/15/09 430,601
- --------------------------------------------------------------------------------
610,000 Pemex Project Funding
Master Trust, 5.75%, 12/15/15 596,734
- --------------------------------------------------------------------------------
125,000 Petro-Canada, 5.95%, 5/15/35 119,685
- --------------------------------------------------------------------------------
160,000 Pioneer Natural Resources Co.,
6.875%, 5/1/18 160,687
- --------------------------------------------------------------------------------
257,000 Talisman Energy Inc.,
5.85%, 2/1/37 240,397
- --------------------------------------------------------------------------------
220,000 Tesoro Corp., 6.25%, 11/1/12
(Acquired 8/7/06-8/9/06,
Cost $212,850)(3) 213,125
- --------------------------------------------------------------------------------
30,000 XTO Energy Inc.,
5.30%, 6/30/15 29,150
- --------------------------------------------------------------------------------
3,188,023
- --------------------------------------------------------------------------------
PAPER & FOREST PRODUCTS -- 0.1%
- --------------------------------------------------------------------------------
115,000 Weyerhaeuser Co.,
7.375%, 3/15/32 119,474
- --------------------------------------------------------------------------------
PHARMACEUTICALS -- 0.2%
- --------------------------------------------------------------------------------
186,000 Abbott Laboratories,
3.75%, 3/15/11 175,869
- --------------------------------------------------------------------------------
REAL ESTATE INVESTMENT TRUSTS -- 1.8%
- --------------------------------------------------------------------------------
104,000 Archstone-Smith Operating
Trust, 5.25%, 12/1/10 103,651
- --------------------------------------------------------------------------------
50,000 AvalonBay Communities Inc.,
5.50%, 1/15/12 50,315
- --------------------------------------------------------------------------------
231,000 Developers Diversified
Realty Corp., 5.375%, 10/15/12 228,926
- --------------------------------------------------------------------------------
80,000 Duke Realty L.P.,
5.95%, 2/15/17 81,196
- --------------------------------------------------------------------------------
242,000 iStar Financial Inc.,
5.15%, 3/1/12 236,372
- --------------------------------------------------------------------------------
211,000 ProLogis, 5.50%, 3/1/13 210,243
- --------------------------------------------------------------------------------
170,000 ProLogis, 5.75%, 4/1/16 170,735
- --------------------------------------------------------------------------------
440,000 Rouse Co. L.P./TRC
Co-Issuer Inc., 6.75%,
5/1/13 (Acquired 5/2/06,
Cost $438,627)(3) 441,915
- --------------------------------------------------------------------------------
See Notes to Financial Statements. (continued)
- ------
10
Select Bond - Schedule of Investments
SEPTEMBER 30, 2006 (UNAUDITED)
Principal Amount Value
- --------------------------------------------------------------------------------
$ 440,000 Simon Property Group L.P.,
5.375%, 6/1/11 $ 439,341
- --------------------------------------------------------------------------------
190,000 Simon Property Group L.P.,
6.10%, 5/1/16 196,278
- --------------------------------------------------------------------------------
2,158,972
- --------------------------------------------------------------------------------
REAL ESTATE MANAGEMENT &
DEVELOPMENT -- 0.1%
- --------------------------------------------------------------------------------
35,000 Colonial Realty L.P.,
6.05%, 9/1/16 35,396
- --------------------------------------------------------------------------------
91,000 ERP Operating L.P.,
5.25%, 9/15/14 89,557
- --------------------------------------------------------------------------------
124,953
- --------------------------------------------------------------------------------
ROAD & RAIL -- 1.1%
- --------------------------------------------------------------------------------
471,000 Burlington Northern
Santa Fe Corp.,
6.125%, 3/15/09 480,657
- --------------------------------------------------------------------------------
98,000 Union Pacific Corp.,
3.875%, 2/15/09 95,101
- --------------------------------------------------------------------------------
671,000 Union Pacific Corp.,
7.375%, 9/15/09 707,118
- --------------------------------------------------------------------------------
1,282,876
- --------------------------------------------------------------------------------
SPECIALTY RETAIL -- 0.3%
- --------------------------------------------------------------------------------
315,000 Home Depot, Inc. (The),
5.40%, 3/1/16 313,492
- --------------------------------------------------------------------------------
THRIFTS & MORTGAGE FINANCE -- 0.8%
- --------------------------------------------------------------------------------
90,000 Countrywide Financial Corp.,
6.25%, 5/15/16 91,503
- --------------------------------------------------------------------------------
555,000 Residential Capital Corp.,
6.00%, 2/22/11 554,851
- --------------------------------------------------------------------------------
280,000 Residential Capital Corp.,
6.50%, 4/17/13 284,727
- --------------------------------------------------------------------------------
931,081
- --------------------------------------------------------------------------------
TOBACCO -- 0.1%
- --------------------------------------------------------------------------------
85,000 Reynolds American Inc.,
7.625%, 6/1/16 (Acquired
7/6/06, Cost $84,437)(3) 88,596
- --------------------------------------------------------------------------------
WIRELESS TELECOMMUNICATION SERVICES -- 0.4%
- --------------------------------------------------------------------------------
160,000 Cingular Wireless LLC,
7.125%, 12/15/31 175,658
- --------------------------------------------------------------------------------
350,000 Vodafone Group plc,
5.50%, 12/15/06 351,203
- --------------------------------------------------------------------------------
526,861
- --------------------------------------------------------------------------------
TOTAL CORPORATE BONDS
(Cost $33,125,191) 32,913,227
- --------------------------------------------------------------------------------
Principal Amount Value
- --------------------------------------------------------------------------------
U.S. TREASURY SECURITIES -- 14.3%
- --------------------------------------------------------------------------------
$ 2,225,000 U.S. Treasury Bonds,
4.50%, 2/15/36 $ 2,132,698
- --------------------------------------------------------------------------------
2,604,779 U.S. Treasury Inflation Indexed
Notes, 2.00%, 1/15/16 2,545,765
- --------------------------------------------------------------------------------
810,000 U.S. Treasury Notes,
4.875%, 8/31/08 812,500
- --------------------------------------------------------------------------------
4,327,000 U.S. Treasury Notes,
5.125%, 6/30/11(5) 4,423,851
- --------------------------------------------------------------------------------
1,230,000 U.S. Treasury Notes,
4.875%, 7/31/11 1,244,655
- --------------------------------------------------------------------------------
95,000 U.S. Treasury Notes,
4.625%, 8/31/11 95,134
- --------------------------------------------------------------------------------
4,652,000 U.S. Treasury Notes,
5.125%, 5/15/16(5) 4,827,180
- --------------------------------------------------------------------------------
565,000 U.S. Treasury Notes,
4.875%, 8/15/16 575,859
- --------------------------------------------------------------------------------
TOTAL U.S. TREASURY SECURITIES
(Cost $16,286,041) 16,657,642
- --------------------------------------------------------------------------------
COLLATERALIZED MORTGAGE
OBLIGATIONS(1) -- 8.9%
- --------------------------------------------------------------------------------
12,980,205 Asset Securitization Corp.,
Series 1997 D5, Class PS1,
STRIPS -- COUPON, VRN,
1.48%, 10/11/06 491,028
- --------------------------------------------------------------------------------
563,000 Banc of America Mortgage
Securities, Series 2004 G,
Class 2A6, 4.66%, 8/25/34 560,273
- --------------------------------------------------------------------------------
1,417,000 Bear Stearns Adjustable Rate
Mortgage Trust, Series 2004-4,
Class A6, 3.51%, 6/25/34 1,369,519
- --------------------------------------------------------------------------------
447,000 Criimi Mae Commercial
Mortgage Trust, Series 1998 C1,
Class B, 7.00%, 6/2/33
(Acquired 3/9/99,
Cost $354,178)(3) 463,460
- --------------------------------------------------------------------------------
15,424,092 DLJ Commercial Mortgage Corp.,
Series 1998 CF1, Class S,
STRIPS -- COUPON, VRN,
0.95%, 10/1/06 241,680
- --------------------------------------------------------------------------------
16,234,983 DLJ Mortgage Acceptance Corp.,
Series 1997 CF2, Class S,
STRIPS -- COUPON, VRN, 0.68%,
10/1/06 (Acquired 1/22/98-2/25/98,
Cost $439,325)(3) 139,312
- --------------------------------------------------------------------------------
5,853,650 Enterprise Mortgage
Acceptance Co. LLC,
Series 1998-1, Class IO,
STRIPS -- COUPON, VRN,
1.27%, 10/15/06 (Acquired
6/26/98, Cost $769,643)(3) 208,536
- --------------------------------------------------------------------------------
See Notes to Financial Statements. (continued)
- ------
11
Select Bond - Schedule of Investments
SEPTEMBER 30, 2006 (UNAUDITED)
Principal Amount Value
- --------------------------------------------------------------------------------
$ 282,000 FHLMC, Series 3065, Class TN,
4.50%, 10/15/33 $ 272,901
- --------------------------------------------------------------------------------
1,092,710 FHLMC, Series K001, Class A2,
5.65%, 4/25/16 1,105,690
- --------------------------------------------------------------------------------
542,703 First Horizon Alternative
Mortgage Securities,
Series 2004 FA1, Class 1A1
SEQ, 6.25%, 10/25/34 546,905
- --------------------------------------------------------------------------------
278,000 First Union Commercial
Mortgage Securities Inc.,
Series 1997 C2, Class B,
6.79%, 11/18/29 286,453
- --------------------------------------------------------------------------------
1,053,590 FNMA, Series 2002 W4,
Class A4 SEQ, 6.25%, 5/25/42 1,067,663
- --------------------------------------------------------------------------------
758,332 FNMA, Final Maturity Amortizing
Notes, Series 2004-1, Class 1,
4.45%, 8/25/12 731,647
- --------------------------------------------------------------------------------
1,254,000 FNMA, Alternative Credit
Enhancement Structures,
Series 2006 M1, Class C SEQ,
5.36%, 3/1/36 1,250,685
- --------------------------------------------------------------------------------
1,582,374 Midland Realty Acceptance Corp.,
Series 1996 C2, Class AEC,
STRIPS -- COUPON, VRN, 1.24%,
10/1/06 (Acquired 11/26/97,
Cost $124,964)(3) 16,324
- --------------------------------------------------------------------------------
298,000 RMF Commercial Mortgage
Pass-Through Certificates,
Series 1997-1, Class F, 7.47%,
1/15/19 (Acquired 11/24/97,
Cost $291,617)(3) 29,800
- --------------------------------------------------------------------------------
282,000 Washington Mutual, Inc.,
Series 2003 AR10, Class A6,
4.08%, 10/25/33 276,137
- --------------------------------------------------------------------------------
546,205 Washington Mutual Asset
Securities Corp., Series 2003
C1A, Class A SEQ, 3.83%,
1/25/35 (Acquired 2/3/06,
Cost $529,115)(3) 528,122
- --------------------------------------------------------------------------------
829,000 Wells Fargo Mortgage Backed
Securities Trust, Series 2004 N,
Class A6, 4.00%, 8/25/34 808,345
- --------------------------------------------------------------------------------
TOTAL COLLATERALIZED
MORTGAGE OBLIGATIONS
(Cost $10,931,635) 10,394,480
- --------------------------------------------------------------------------------
ASSET-BACKED SECURITIES(1) -- 5.8%
- --------------------------------------------------------------------------------
236,473 Massachusetts RRB Special
Purpose Trust WMECO-1,
Series 2001-1, Class A,
6.53%, 6/1/15 247,977
- --------------------------------------------------------------------------------
188,150 Mid-State Trust, Series 1997-6,
Class A3 SEQ, 7.54%, 7/1/35 195,577
- --------------------------------------------------------------------------------
Principal Amount Value
- --------------------------------------------------------------------------------
$ 2,982,000 Nissan Auto Receivables Owner
Trust, Series 2006 A, Class A3
SEQ, 4.74%, 9/15/09(5) $ 2,968,145
- --------------------------------------------------------------------------------
1,778,000 World Omni Auto Receivables
Trust, Series 2006 A, Class A3
SEQ, 5.01%, 10/15/10 1,776,094
- --------------------------------------------------------------------------------
1,560,000 World Omni Auto Receivables
Trust, Series 2006 B, Class A1
SEQ, 5.37%, 10/15/07 1,560,250
- --------------------------------------------------------------------------------
TOTAL ASSET-BACKED SECURITIES
(Cost $6,761,793) 6,748,043
- --------------------------------------------------------------------------------
COMMERCIAL PAPER(6) -- 4.6%
- --------------------------------------------------------------------------------
3,000,000 New Century Asset Trust,
5.27%, 10/11/06(5) 2,995,989
- --------------------------------------------------------------------------------
2,400,000 Sheffield Receivables,
5.26%, 10/12/06 2,396,434
- --------------------------------------------------------------------------------
TOTAL COMMERCIAL PAPER
(Cost $5,391,751) 5,392,423
- --------------------------------------------------------------------------------
U.S. GOVERNMENT
AGENCY SECURITIES -- 2.3%
1,485,000 FNMA, 5.25%, 9/15/16 1,516,884
- --------------------------------------------------------------------------------
559,000 Housing and Urban
Development, 6.08%, 8/1/13 583,812
- --------------------------------------------------------------------------------
745,000 TVA STRIPS - PRINCIPAL,
8.25%, 4/15/12(7) 586,404
- --------------------------------------------------------------------------------
TOTAL U.S. GOVERNMENT
AGENCY SECURITIES
(Cost $2,680,735) 2,687,100
- --------------------------------------------------------------------------------
ZERO-COUPON U.S. TREASURY
SECURITIES AND EQUIVALENTS(7) -- 1.3%
- --------------------------------------------------------------------------------
1,490,000 BECC, 2.95%, 11/15/11
(Cost $1,484,700) 1,480,926
- --------------------------------------------------------------------------------
SOVEREIGN GOVERNMENTS
& AGENCIES -- 0.7%
- --------------------------------------------------------------------------------
554,282 Overseas Private
Investment Corp.,
4.10%, 11/15/14 534,275
- --------------------------------------------------------------------------------
260,000 United Mexican States,
5.625%, 1/15/17 257,530
- --------------------------------------------------------------------------------
TOTAL SOVEREIGN
GOVERNMENTS & AGENCIES
(Cost $810,109) 791,805
- --------------------------------------------------------------------------------
See Notes to Financial Statements. (continued)
- ------
12
Select Bond - Schedule of Investments
SEPTEMBER 30, 2006 (UNAUDITED)
Principal Amount Value
- --------------------------------------------------------------------------------
TEMPORARY CASH INVESTMENTS -- 0.4%
- --------------------------------------------------------------------------------
$ 500,000 FHLMC Discount Notes,
5.14%, 12/27/06(6)
(Cost $493,788) $ 493,986
- --------------------------------------------------------------------------------
TOTAL INVESTMENT
SECURITIES -- 101.2%
(Cost $118,537,340) 117,747,769
- --------------------------------------------------------------------------------
OTHER ASSETS
AND LIABILITIES -- (1.2)% (1,452,283)
- --------------------------------------------------------------------------------
TOTAL NET ASSETS -- 100.0% $ 116,295,486
================================================================================
FUTURES CONTRACTS
Expiration Underlying Face Unrealized
Contracts Sold Date Amount at Value Gain (Loss)
- --------------------------------------------------------------------------------
5 U.S. Long Bond December 2006 $ 562,031 $ (9,156)
- --------------------------------------------------------------------------------
22 U.S. Treasury 5-Year Notes December 2006 2,321,344 (14,848)
- --------------------------------------------------------------------------------
42 U.S. Treasury 10-Year Notes December 2006 4,538,625 (46,721)
- --------------------------------------------------------------------------------
$7,422,000 $(70,725)
==============================
NOTES TO SCHEDULE OF INVESTMENTS
BECC = Book Entry Callable Corpus
Equivalent = Security whose principal payments are secured by U.S. Treasurys
FHLMC = Federal Home Loan Mortgage Corporation
FNMA = Federal National Mortgage Association
GNMA = Government National Mortgage Association
SEQ = Sequential Payer
STRIPS = Separate Trading of Registered Interest and Principal of Securities
TVA = Tennessee Valley Authority
VRN = Variable Rate Note. Interest reset date is indicated. Rate shown is
effective September 30, 2006.
(1) Final maturity indicated, unless otherwise noted.
(2) Forward commitment.
(3) Security was purchased under Rule 144A of the Securities Act of 1933 or is
a private placement and, unless registered under the Act or exempted from
registration, may only be sold to qualified institutional investors. The
aggregate value of restricted securities at September 30, 2006 was
$4,224,776, which represented 3.6% of total net assets.
(4) Industry is less than 0.05% of total net assets.
(5) Security, or a portion thereof, has been segregated for a forward
commitment and/or futures contract.
(6) The rate indicated is the yield to maturity at purchase.
(7) The rate indicated is the yield to maturity at purchase. These securities
are issued at a substantial discount from their value at maturity.
See Notes to Financial Statements.
- ------
13
High-Yield Bond - Performance
TOTAL RETURNS AS OF SEPTEMBER 30, 2006
----------------------
AVERAGE ANNUAL RETURNS
- ---------------------------------------------------------------------------------------------------
SINCE INCEPTION
6 MONTHS(1) 1 YEAR 5 YEARS INCEPTION DATE
- ---------------------------------------------------------------------------------------------------
A CLASS 3/31/97
No sales charge* 3.57%(2) 6.30%(2) 8.88%(2) 5.77%
With sales charge* -1.10%(2) 1.54%(2) 7.87%(2) 5.26%
- ---------------------------------------------------------------------------------------------------
CITIGROUP HIGH-YIELD CASH-PAY INDEX 4.19% 7.50% 10.51% 6.76% --
- ---------------------------------------------------------------------------------------------------
LEHMAN BROTHERS U.S. INTERMEDIATE
HIGH YIELD MARKET INDEX 4.15% 7.99% 10.10% 5.82% --
- ---------------------------------------------------------------------------------------------------
Investor Class -- -- -- 3.20%(1)(2) 4/3/06
- ---------------------------------------------------------------------------------------------------
Institutional Class -- -- -- 3.30%(1)(2) 4/3/06
- ---------------------------------------------------------------------------------------------------
B Class 3/31/97
No sales charge* 3.33%(2) 5.56%(2) 8.19%(2) 5.07%
With sales charge* -1.67%(2) 1.56%(2) 8.05%(2) 5.07%
- ---------------------------------------------------------------------------------------------------
C Class 4/3/06
No sales charge* -- -- -- 2.69%(1)(2)
With sales charge* -- -- -- 1.69%(1)(2)
- ---------------------------------------------------------------------------------------------------
R Class -- -- -- 2.95%(1)(2) 4/3/06
- ---------------------------------------------------------------------------------------------------
*Sales charges include initial sales charges and contingent deferred sales
charges (CDSCs), as applicable. A Class shares have a 4.50% maximum initial
sales charge for fixed income funds and may be subject to a maximum CDSC of
1.00%. B Class shares redeemed within six years of purchase are subject to a
CDSC that declines from 5.00% during the first year after purchase to 0.00% the
sixth year after purchase. C Class shares redeemed within 12 months of purchase
are subject to a maximum CDSC of 1.00%. Please see the Share Class Information
pages for more about the applicable sales charges for each share class. The SEC
requires that mutual funds provide performance information net of maximum sales
charges in all cases where charges could be applied.
High-Yield Bond acquired all of the net assets of the Mason Street High Yield
Bond Fund on March 31, 2006, pursuant to a plan of reorganization approved by
the acquired fund's shareholders on March 23, 2006. Performance information
prior to April 1, 2006 is that of the Mason Street High Yield Bond Fund.
(1) Total returns for periods less than one year are not annualized.
(2) Class returns would have been lower if fees had not been waived.
Data presented reflect past performance. Past performance is no guarantee of
future results. Current performance may be higher or lower than the performance
shown. Investment return and principal value will fluctuate, and redemption
value may be more or less than original cost. To obtain performance data current
to the most recent month end, please call 1-800-345-2021 or visit
americancentury.com. As interest rates rise, bond values will decline. In
addition, the lower-rated securities in which the fund invests are subject to
greater credit risk, default risk and liquidity risk.
Unless otherwise indicated, performance reflects A Class shares; performance for
other share classes will vary due to differences in fee structure. For
information about other share classes available, please consult the prospectus.
Data assumes reinvestment of dividends and capital gains, and none of the charts
reflect the deduction of taxes that a shareholder would pay on fund
distributions or the redemption of fund shares. Returns for the indices are
provided for comparison. The fund's total returns include operating expenses
(such as transaction costs and management fees) that reduce returns, while the
total returns of the indices do not. (continued)
- ------
14
High-Yield Bond - Performance
GROWTH OF $10,000 OVER LIFE OF CLASS
$10,000 investment made March 31, 1997
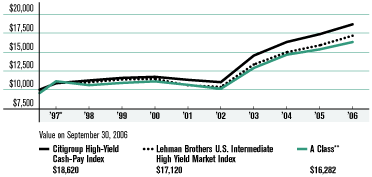
ONE-YEAR RETURNS OVER LIFE OF CLASS
Periods ended September 30
- ------------------------------------------------------------------------------------------------
1997* 1998 1999 2000 2001 2002 2003 2004 2005 2006
- ------------------------------------------------------------------------------------------------
A Class**
(no sales charge) 16.36% -4.62% 2.78% 1.88% -4.15% -4.80% 27.04% 13.60% 4.80% 6.30%
- ------------------------------------------------------------------------------------------------
Citigroup High-Yield
Cash-Pay Index 8.50% 3.39% 3.01% 1.22% -3.40% -2.71% 31.89% 12.34% 6.33% 7.50%
- ------------------------------------------------------------------------------------------------
Lehman Brothers U.S.
Intermediate High
Yield Market Index 8.86% 0.97% 3.17% 0.77% -7.38% -2.12% 28.62% 12.11% 6.13% 7.99%
- ------------------------------------------------------------------------------------------------
*From 3/31/97, the A Class's inception date. Not annualized. High-Yield Bond A
Class's initial investment is $9,550 to reflect the maximum 4.50% initial sales
charge.
**Class returns would have been lower, along with ending value, if fees had not
been waived.
Data presented reflect past performance. Past performance is no guarantee of
future results. Current performance may be higher or lower than the performance
shown. Investment return and principal value will fluctuate, and redemption
value may be more or less than original cost. To obtain performance data current
to the most recent month end, please call 1-800-345-2021 or visit
americancentury.com. As interest rates rise, bond values will decline. In
addition, the lower-rated securities in which the fund invests are subject to
greater credit risk, default risk and liquidity risk.
Unless otherwise indicated, performance reflects A Class shares; performance for
other share classes will vary due to differences in fee structure. For
information about other share classes available, please consult the prospectus.
Data assumes reinvestment of dividends and capital gains, and none of the charts
reflect the deduction of taxes that a shareholder would pay on fund
distributions or the redemption of fund shares. Returns for the indices are
provided for comparison. The fund's total returns include operating expenses
(such as transaction costs and management fees) that reduce returns, while the
total returns of the indices do not.
- ------
15
High-Yield Bond - Portfolio Commentary
PORTFOLIO MANAGER: ANDREW WASSWEILLER
PERFORMANCE SUMMARY
During the six months ended September 30, 2006, American Century-Mason Street
High-Yield Bond returned 3.57%*. By comparison, the fund's benchmark, the
Citigroup High-Yield Cash-Pay Index, returned 4.19%. It's worth noting that the
portfolio's returns are reduced by management fees, while the returns of the
index are not.
We're proud to report that the portfolio outperformed the 3.05% return of the
Lipper High Current Yield Bond Funds Index**, a measure of the performance of
leading high-yield bond funds.
RISK RULED THE HIGH-YIELD MARKET
High-yield securities finished among the best-performing segments of the bond
market for the six months; however, performance see-sawed along with changing
perceptions of the economy, rates, and inflation (see the Market Perspective on
page 2).
Looking at returns by credit quality, bonds rated CCC (among the riskiest,
lowest-rated segments of the high-yield market) outperformed bonds rated BB (the
highest-rated, high-yield slice). That continued a trend of the last several
years; however, the performance disparity narrowed in recent months as investors
began to wonder about the effect of slower growth on the most economically
sensitive bonds.
In terms of performance by sector, autos led the market, followed by bonds in
more defensive industries, such as cable and utilities. It's important to note
that the returns of the index are skewed by an approximately 15% weighting in
auto bonds as a result of an earlier downgrade of massive amounts of Ford and GM
debt to junk status. Because we typically do not concentrate the portfolio so
heavily in bonds of any single sector or issuer, we essentially carry a
structural underweight to automotive debt relative to our benchmark. In periods
when autos perform poorly, we should have a leg up. But when autos do well, as
they did during the last six months, we are at a disadvantage compared with the
index.
PORTFOLIO AT A GLANCE
- --------------------------------------------------------------------------------
AS OF
9/30/06
- --------------------------------------------------------------------------------
Weighted Average Maturity 6.2 years
- --------------------------------------------------------------------------------
Average Duration (effective) 3.9 years
- --------------------------------------------------------------------------------
YIELDS AS OF SEPTEMBER 30, 2006
- --------------------------------------------------------------------------------
30-DAY SEC YIELD
- --------------------------------------------------------------------------------
Investor Class 6.87%
- --------------------------------------------------------------------------------
Institutional Class 7.07%
- --------------------------------------------------------------------------------
A Class 6.31%
- --------------------------------------------------------------------------------
B Class 5.85%
- --------------------------------------------------------------------------------
C Class 5.85%
- --------------------------------------------------------------------------------
R Class 6.36%
- --------------------------------------------------------------------------------
*All fund returns referenced in this commentary are for A Class shares and are
not reduced by sales charges. A Class shares are subject to a maximum sales
charge of 4.50%. Had the sales charge been applied, returns would be lower than
those shown. Total returns for periods less than one year are not annualized.
**The Lipper High Current Yield Bond Funds Index returned 6.75% and 9.29% for
the one- and five- periods ended September 30, 2006, respectively. Data
provided by Lipper Inc. -- A Reuters Company. (c) 2006 Reuters. All rights
reserved. Any copying, republication or redistribution of Lipper content,
including by caching, framing or similar means, is expressly prohibited
without the prior written consent of Lipper. Lipper shall not be liable for
any errors or delays in the content, or for any actions taken in reliance
thereon. (continued)
- ------
16
High-Yield Bond - Portfolio Commentary
PORTFOLIO STRATEGIES
Consistent with our outlook for slower economic growth, we worked to position
the portfolio more defensively and improve its risk/reward profile. For example,
in terms of credit quality, we overweighted the portfolio in BB bonds and
underweighted CCC bonds.
That's also because after a long period of outperformance, we believe CCCs are
richly valued; that is, the spread--or difference in yield--between CCC and
higher-rated bonds is near record lows. In our view, CCC securities aren't
offering enough additional yield to compensate for their greater credit risk.
And with little difference in yield between the highest- and lowest-rated
segments of the market, we think we managed to improve the portfolio's credit
profile with comparatively little give-up in yield. Nevertheless, CCCs continued
to outperform for the six months, limiting our relative return.
Similarly, in an environment where the yield curve was flat (with little
difference in yield between short- and long-term bonds), we reduced the
portfolio's duration (price sensitivity to rate changes) without sacrificing
much yield. We did that by trading down selectively from 10-year bonds into
five-year securities, and eliminating some of our 30-year bond positions.
In terms of sector weightings, our defensive positioning led us to such
industries as cable and gaming bonds, as well as securities issued by more
asset-rich companies, such as lodging. That helped results relative to the
benchmark, as cable bonds were among the best performers in our index.
PORTFOLIO OBJECTIVES AND EXPECTATIONS
We manage the portfolio to deliver high current income and capital appreciation
by investing in high-yield bonds (riskier securities rated below investment
grade). For investors willing to assume the greater credit risk, we believe this
fund can be an aggressive complement to a fixed-income portfolio, bringing
additional yield and return potential.
That said, we're cautious on the high-yield sector in the near term--these bonds
remain fairly richly valued, and likely slower economic growth ahead argues for
a gradual rise in the default rate from near-historic lows.
TOP FIVE INDUSTRIES AS OF SEPTEMBER 30, 2006
- --------------------------------------------------------------------------------
% OF
NET ASSETS
AS OF
9/30/06
- --------------------------------------------------------------------------------
Oil, Gas & Consumable Fuels 10.2%
- --------------------------------------------------------------------------------
Media 9.7%
- --------------------------------------------------------------------------------
Hotels, Restaurants & Leisure 7.0%
- --------------------------------------------------------------------------------
Diversified Telecommunication Services 6.4%
- --------------------------------------------------------------------------------
Diversified Financial Services 4.0%
- --------------------------------------------------------------------------------
PORTFOLIO COMPOSITION BY CREDIT RATING
- --------------------------------------------------------------------------------
% OF FUND
INVESTMENTS
AS OF
9/30/06
- --------------------------------------------------------------------------------
AAA 6%
- --------------------------------------------------------------------------------
BBB 2%
- --------------------------------------------------------------------------------
BB 41%
- --------------------------------------------------------------------------------
B 47%
- --------------------------------------------------------------------------------
CCC or lower 4%
- --------------------------------------------------------------------------------
- ------
17
High-Yield Bond - Schedule of Investments
SEPTEMBER 30, 2006 (UNAUDITED)
Principal Amount Value
- --------------------------------------------------------------------------------
CORPORATE BONDS -- 92.1%
AEROSPACE & DEFENSE -- 1.0%
- --------------------------------------------------------------------------------
$ 1,145,000 L-3 Communications Corp.,
7.63%, 6/15/12 $ 1,185,075
- --------------------------------------------------------------------------------
315,000 L-3 Communications Corp.,
6.13%, 7/15/13 307,913
- --------------------------------------------------------------------------------
1,492,988
- --------------------------------------------------------------------------------
AUTO COMPONENTS -- 0.9%
- --------------------------------------------------------------------------------
240,000 ArvinMeritor Inc., 8.75%, 3/1/12 231,000
- --------------------------------------------------------------------------------
310,000 Goodyear Tire & Rubber Co.
(The), 7.86%, 8/15/11 303,025
- --------------------------------------------------------------------------------
555,000 Lear Corp., 8.11%, 5/15/09 538,350
- --------------------------------------------------------------------------------
255,000 TRW Automotive Inc.,
9.38%, 2/15/13 272,850
- --------------------------------------------------------------------------------
1,345,225
- --------------------------------------------------------------------------------
AUTOMOBILES -- 0.3%
- --------------------------------------------------------------------------------
460,000 General Motors Corp.,
8.38%, 7/15/33 400,200
- --------------------------------------------------------------------------------
BEVERAGES -- 0.4%
- --------------------------------------------------------------------------------
495,000 Constellation Brands Inc.,
7.25%, 9/1/16 503,044
- --------------------------------------------------------------------------------
CAPITAL MARKETS -- 1.7%
- --------------------------------------------------------------------------------
429,000 BCP Crystal US Holdings Corp.,
9.63%, 6/15/14 467,610
- --------------------------------------------------------------------------------
665,000 E*TRADE Financial Corp.,
7.88%, 12/1/15 703,238
- --------------------------------------------------------------------------------
140,000 LaBranche & Co. Inc.,
9.50%, 5/15/09 146,650
- --------------------------------------------------------------------------------
413,000 LaBranche & Co. Inc.,
11.00%, 5/15/12 443,975
- --------------------------------------------------------------------------------
665,000 Vanguard Health Holding Co. II,
LLC/Vanguard Holding Co. II, Inc.,
9.00%, 10/1/14 648,375
- --------------------------------------------------------------------------------
2,409,848
- --------------------------------------------------------------------------------
CHEMICALS -- 3.3%
- --------------------------------------------------------------------------------
305,000 Berry Plastics Holding Corp.,
8.88%, 9/15/14 (Acquired
9/15/06, Cost $305,000)(1) 308,050
- --------------------------------------------------------------------------------
720,000 Equistar Chemicals L.P./Equistar
Funding Corp., 8.75%, 2/15/09 748,800
- --------------------------------------------------------------------------------
785,000 Equistar Chemicals L.P./Equistar
Funding Corp., 10.63%, 5/1/11 845,837
- --------------------------------------------------------------------------------
515,000 Georgia Gulf Corp., 9.50%,
10/15/14 (Acquired 9/28/06,
Cost $511,416)(1) 512,425
- --------------------------------------------------------------------------------
292,000 Hexion US Finance Corp/Hexion
Nova Scotia Finance ULC,
9.00%, 7/15/14 299,300
- --------------------------------------------------------------------------------
432,000 Huntsman LLC,
11.50%, 7/15/12 493,560
- --------------------------------------------------------------------------------
865,000 Lyondell Chemical Co.,
8.00%, 9/15/17 880,137
- --------------------------------------------------------------------------------
Principal Amount Value
- --------------------------------------------------------------------------------
$ 661,000 Rockwood Specialties
Group, Inc., 10.63%, 5/15/11 $ 710,575
- --------------------------------------------------------------------------------
4,798,684
- --------------------------------------------------------------------------------
COMMERCIAL SERVICES & SUPPLIES -- 3.3%
- --------------------------------------------------------------------------------
330,000 Allied Waste North America, Inc.,
6.50%, 11/15/10 326,700
- --------------------------------------------------------------------------------
1,310,000 Allied Waste North America, Inc.,
6.38%, 4/15/11 1,283,799
- --------------------------------------------------------------------------------
1,014,000 Allied Waste North America, Inc.,
7.25%, 3/15/15 1,011,464
- --------------------------------------------------------------------------------
975,000 Corrections Corp. of America,
6.25%, 3/15/13 960,375
- --------------------------------------------------------------------------------
131,000 Corrections Corp. of America,
6.75%, 1/31/14 131,655
- --------------------------------------------------------------------------------
170,000 FTI Consulting Inc., 7.75%,
10/1/16 (Acquired 9/27/06,
Cost $170,000)(1)(2) 172,550
- --------------------------------------------------------------------------------
435,000 Quebecor World Capital Corp.,
8.75%, 3/15/16 420,863
- --------------------------------------------------------------------------------
495,000 WCA Waste Corp., 9.25%,
6/15/14 (Acquired 6/28/06,
Cost $495,000)(1) 516,038
- --------------------------------------------------------------------------------
4,823,444
- --------------------------------------------------------------------------------
CONSTRUCTION MATERIALS -- 0.9%
- --------------------------------------------------------------------------------
379,000 Beazer Homes USA Inc.,
6.50%, 11/15/13 343,943
- --------------------------------------------------------------------------------
151,000 Beazer Homes USA Inc.,
6.88%, 7/15/15 137,410
- --------------------------------------------------------------------------------
865,000 FMG Finance Pty Ltd.,
10.63%, 9/1/16 (Acquired
8/11/06, Cost $865,000)(1) 834,725
- --------------------------------------------------------------------------------
1,316,078
- --------------------------------------------------------------------------------
CONSUMER FINANCE -- 0.3%
- --------------------------------------------------------------------------------
430,000 Ford Motor Credit Co.,
8.63%, 11/1/10 428,724
- --------------------------------------------------------------------------------
CONTAINERS & PACKAGING -- 3.1%
- --------------------------------------------------------------------------------
543,000 Crown Americas LLC/Crown
Americas Capital Corp.,
7.63%, 11/15/13 552,503
- --------------------------------------------------------------------------------
415,000 Crown Americas LLC/Crown
Americas Capital Corp.,
7.75%, 11/15/15 422,263
- --------------------------------------------------------------------------------
302,000 Graphic Packaging International
Corp., 9.50%, 8/15/13 310,305
- --------------------------------------------------------------------------------
380,000 Jefferson Smurfit Corp.,
7.50%, 6/1/13 352,450
- --------------------------------------------------------------------------------
375,000 Norampac Inc., 6.75%, 6/1/13 356,250
- --------------------------------------------------------------------------------
795,000 Owens-Brockway Glass
Container Inc., 7.75%, 5/15/11 820,838
- --------------------------------------------------------------------------------
776,000 Owens-Brockway Glass
Container Inc., 6.75%, 12/1/14 741,080
- --------------------------------------------------------------------------------
1,025,000 Smurfit-Stone Container
Enterprises, Inc., 8.38%, 7/1/12 989,124
- --------------------------------------------------------------------------------
4,544,813
- --------------------------------------------------------------------------------
See Notes to Financial Statements. (continued)
- ------
18
High-Yield Bond - Schedule of Investments
SEPTEMBER 30, 2006 (UNAUDITED)
Principal Amount Value
- --------------------------------------------------------------------------------
DIVERSIFIED -- 0.6%
- --------------------------------------------------------------------------------
$ 305,000 Ashtead Capital Inc., 9.00%,
8/15/16 (Acquired 8/1/06,
Cost $305,000)(1) $ 318,725
- --------------------------------------------------------------------------------
495,000 Kabel Deutschland GmbH,
10.63%, 7/1/14 (Acquired
3/14/06, Cost $525,938)(1) 533,363
- --------------------------------------------------------------------------------
852,088
- --------------------------------------------------------------------------------
DIVERSIFIED CONSUMER SERVICES -- 0.9%
- --------------------------------------------------------------------------------
670,000 Education Management LLC,
10.25%, 6/1/16 (Acquired
5/19/06, Cost $670,000)(1) 688,425
- --------------------------------------------------------------------------------
100,000 Service Corp. International,
7.38%, 10/1/14 (Acquired
9/27/06, Cost $100,000)(1)(2) 101,125
- --------------------------------------------------------------------------------
505,000 Service Corp. International,
6.75%, 4/1/16 486,694
- --------------------------------------------------------------------------------
1,276,244
- --------------------------------------------------------------------------------
DIVERSIFIED FINANCIAL SERVICES -- 4.0%
- --------------------------------------------------------------------------------
700,000 Arch Western Finance LLC,
6.75%, 7/1/13 675,500
- --------------------------------------------------------------------------------
495,000 Da-Lite Screen Company, Inc.,
9.50%, 5/15/11 523,463
- --------------------------------------------------------------------------------
230,000 Ford Motor Credit Co.,
7.38%, 2/1/11 220,960
- --------------------------------------------------------------------------------
1,510,000 Ford Motor Credit Co.,
9.88%, 8/10/11 1,564,058
- --------------------------------------------------------------------------------
530,000 General Motors
Acceptance Corp.,
7.75%, 1/19/10 543,452
- --------------------------------------------------------------------------------
1,655,000 General Motors
Acceptance Corp.,
6.88%, 9/15/11 1,647,933
- --------------------------------------------------------------------------------
418,000 Universal City Development
Partners, 11.75%, 4/1/10 452,485
- --------------------------------------------------------------------------------
256,000 Universal City Florida
Holding Co. I/Universal City
Florida Holdings Co.II,
8.38%, 5/1/10 258,240
- --------------------------------------------------------------------------------
5,886,091
- --------------------------------------------------------------------------------
DIVERSIFIED TELECOMMUNICATION
SERVICES -- 6.4%
- --------------------------------------------------------------------------------
770,000 American Tower Corp.,
7.13%, 10/15/12 793,099
- --------------------------------------------------------------------------------
1,545,000 Citizens Communications Co.,
9.25%, 5/15/11 1,711,087
- --------------------------------------------------------------------------------
740,000 Embarq Corp., 6.74%, 6/1/13 762,383
- --------------------------------------------------------------------------------
371,000 Intelsat Bermuda Ltd., 11.25%,
6/15/16 (Acquired 6/19/06,
Cost $371,000)(1) 396,043
- --------------------------------------------------------------------------------
497,000 Intelsat Bermuda Ltd., VRN,
11.64%, 12/15/06, resets
semiannually off the 6-month
LIBOR plus 6.00% with no caps 524,335
- --------------------------------------------------------------------------------
505,000 Intelsat Subsidiary Holding Co.
Ltd., 8.25%, 1/15/13 513,838
- --------------------------------------------------------------------------------
Principal Amount Value
- --------------------------------------------------------------------------------
$ 495,000 Nortel Networks Ltd., 10.75%,
7/15/16 (Acquired 6/29/06,
Cost $495,000)(1) $ 532,125
- --------------------------------------------------------------------------------
505,000 Qwest Capital Funding Inc.,
7.90%, 8/15/10 521,413
- --------------------------------------------------------------------------------
275,000 Qwest Communications
International Inc.,
7.50%, 11/1/08 280,500
- --------------------------------------------------------------------------------
1,641,000 Qwest Corp., 7.88%, 9/1/11 1,731,254
- --------------------------------------------------------------------------------
124,000 Qwest Corp., 7.50%,
10/1/14 (Acquired 8/3/06,
Cost $124,000)(1) 128,650
- --------------------------------------------------------------------------------
655,000 Windstream Corp., 8.13%,
8/1/13 (Acquired 6/28/06,
Cost $655,000)(1) 698,394
- --------------------------------------------------------------------------------
620,000 Windstream Corp., 8.63%,
8/1/16 (Acquired 6/28/06,
Cost $604,791)(1) 666,500
- --------------------------------------------------------------------------------
9,259,621
- --------------------------------------------------------------------------------
ELECTRIC UTILITIES -- 2.8%
- --------------------------------------------------------------------------------
41,000 Aquila, Inc., 9.95%, 2/1/11 45,176
- --------------------------------------------------------------------------------
1,245,000 Edison Mission Energy,
7.73%, 6/15/09 1,285,463
- --------------------------------------------------------------------------------
690,000 Midwest Generation,
LLC/Midwest Finance Corp.,
8.75%, 5/1/34 740,025
- --------------------------------------------------------------------------------
495,000 Nevada Power Co.,
8.25%, 6/1/11 547,424
- --------------------------------------------------------------------------------
700,000 Sierra Pacific Resources,
8.63%, 3/15/14 759,302
- --------------------------------------------------------------------------------
395,000 TECO Energy, Inc.,
6.75%, 5/1/15 406,850
- --------------------------------------------------------------------------------
330,000 TXU Corp., 5.55%, 11/15/14 313,427
- --------------------------------------------------------------------------------
4,097,667
- --------------------------------------------------------------------------------
ELECTRONIC EQUIPMENT &
INSTRUMENTS -- 0.7%
- --------------------------------------------------------------------------------
570,000 Flextronics International Ltd.,
6.50%, 5/15/13 567,150
- --------------------------------------------------------------------------------
94,000 Flextronics International Ltd.,
6.25%, 11/15/14 91,650
- --------------------------------------------------------------------------------
305,000 Sanmina-SCI Corp.,
8.13%, 3/1/16 300,425
- --------------------------------------------------------------------------------
959,225
- --------------------------------------------------------------------------------
ENERGY EQUIPMENT & SERVICES -- 0.8%
- --------------------------------------------------------------------------------
89,000 Hanover Compressor Co.,
7.50%, 4/15/13 89,445
- --------------------------------------------------------------------------------
445,000 Hanover Compressor Co.,
9.00%, 6/1/14 473,925
- --------------------------------------------------------------------------------
665,000 SESI LLC, 6.88%, 6/1/14
(Acquired 5/17/06,
Cost $654,952)(1) 661,675
- --------------------------------------------------------------------------------
1,225,045
- --------------------------------------------------------------------------------
See Notes to Financial Statements. (continued)
- ------
19
High-Yield Bond - Schedule of Investments
SEPTEMBER 30, 2006 (UNAUDITED)
Principal Amount Value
- --------------------------------------------------------------------------------
FOOD & STAPLES RETAILING -- 1.7%
- --------------------------------------------------------------------------------
$ 745,000 Albertson's Inc., 7.50%, 2/15/11 $ 762,739
- --------------------------------------------------------------------------------
750,000 Delhaize America Inc.,
8.13%, 4/15/11 808,716
- --------------------------------------------------------------------------------
875,000 Rite Aid Corp., 8.13%, 5/1/10 881,563
- --------------------------------------------------------------------------------
2,453,018
- --------------------------------------------------------------------------------
FOOD PRODUCTS -- 1.6%
- --------------------------------------------------------------------------------
550,000 B&G Foods, Inc. EIS,
8.00%, 10/1/11 566,500
- --------------------------------------------------------------------------------
263,000 Dole Food Company, Inc.,
8.63%, 5/1/09 258,398
- --------------------------------------------------------------------------------
454,000 Gold Kist Inc., 10.25%, 3/15/14 524,370
- --------------------------------------------------------------------------------
470,000 Land O' Lakes, Inc.,
9.00%, 12/15/10 500,550
- --------------------------------------------------------------------------------
410,000 Smithfield Foods, Inc.,
7.75%, 5/15/13 424,350
- --------------------------------------------------------------------------------
2,274,168
- --------------------------------------------------------------------------------
HEALTH CARE PROVIDERS & SERVICES -- 2.0%
- --------------------------------------------------------------------------------
255,000 Fresenius Medical Care Capital
Trust II, 7.88%, 2/1/08 260,100
- --------------------------------------------------------------------------------
255,000 Fresenius Medical Care Capital
Trust IV, 7.88%, 6/15/11 262,969
- --------------------------------------------------------------------------------
245,000 HCA Inc., 8.75%, 9/1/10 248,062
- --------------------------------------------------------------------------------
1,008,000 IASIS Healthcare LLC/IASIS
Capital Corp., 8.75%, 6/15/14 980,280
- --------------------------------------------------------------------------------
110,000 Tenet Healthcare Corp.,
9.88%, 7/1/14 110,138
- --------------------------------------------------------------------------------
645,000 Tenet Healthcare Corp.,
6.38%, 12/1/11 570,019
- --------------------------------------------------------------------------------
555,000 US Oncology, Inc.,
9.00%, 8/15/12 577,200
- --------------------------------------------------------------------------------
3,008,768
- --------------------------------------------------------------------------------
HOTELS, RESTAURANTS & LEISURE -- 7.0%
- --------------------------------------------------------------------------------
525,000 American Casino &
Entertainment Properties LLC,
7.85%, 2/1/12 535,500
- --------------------------------------------------------------------------------
265,000 American Real Estate Partners
L.P./American Real Estate
Finance Corp., 7.13%, 2/15/13 265,000
- --------------------------------------------------------------------------------
795,000 Boyd Gaming Corp.,
7.75%, 12/15/12 819,843
- --------------------------------------------------------------------------------
495,000 Caesars Entertainment Inc.,
8.13%, 5/15/11 524,700
- --------------------------------------------------------------------------------
380,000 Intrawest Corp.,
7.50%, 10/15/13 409,925
- --------------------------------------------------------------------------------
370,000 Mandalay Resort Group,
9.38%, 2/15/10 397,288
- --------------------------------------------------------------------------------
295,000 Mandalay Resort Group,
6.38%, 12/15/11 289,838
- --------------------------------------------------------------------------------
660,000 MGM Mirage, 8.50%, 9/15/10 705,374
- --------------------------------------------------------------------------------
795,000 MGM Mirage, 8.38%, 2/1/11 832,801
- --------------------------------------------------------------------------------
530,000 MGM Mirage, 6.75%, 9/1/12 525,363
- --------------------------------------------------------------------------------
509,000 MGM Mirage, 6.63%, 7/15/15 491,185
- --------------------------------------------------------------------------------
250,000 Mohegan Tribal Gaming
Authority, 6.13%, 2/15/13 245,625
- --------------------------------------------------------------------------------
Principal Amount Value
- --------------------------------------------------------------------------------
$ 218,000 Pokagon Gaming Authority,
10.38%, 6/15/14 (Acquired
6/15/06, Cost $218,000)(1) $ 233,533
- --------------------------------------------------------------------------------
500,000 Royal Caribbean Cruises Ltd.,
7.00%, 6/15/13 507,980
- --------------------------------------------------------------------------------
415,000 Starwood Hotels & Resorts
Worldwide Inc., 7.88%, 5/1/12 437,825
- --------------------------------------------------------------------------------
510,000 Station Casinos Inc.,
6.00%, 4/1/12 494,700
- --------------------------------------------------------------------------------
665,000 Station Casinos Inc.,
6.88%, 3/1/16 626,763
- --------------------------------------------------------------------------------
365,000 Station Casinos Inc.,
6.63%, 3/15/18 331,238
- --------------------------------------------------------------------------------
280,000 Trump Entertainment
Resorts, Inc., 8.50%, 6/1/15 269,150
- --------------------------------------------------------------------------------
1,243,000 Wynn Las Vegas LLC,
6.63%, 12/1/14 1,211,924
- --------------------------------------------------------------------------------
10,155,555
- --------------------------------------------------------------------------------
HOUSEHOLD DURABLES -- 2.1%
- --------------------------------------------------------------------------------
765,000 K. Hovnanian Enterprises, Inc.,
7.75%, 5/15/13 703,800
- --------------------------------------------------------------------------------
525,000 KB Home, 7.75%, 2/1/10 527,625
- --------------------------------------------------------------------------------
381,000 KB Home, 5.75%, 2/1/14 347,137
- --------------------------------------------------------------------------------
740,000 Standard-Pacific Corp.,
6.50%, 8/15/10 699,300
- --------------------------------------------------------------------------------
300,000 Technical Olympic USA, Inc.,
9.00%, 7/1/10 286,875
- --------------------------------------------------------------------------------
570,000 Technical Olympic USA, Inc.,
8.25%, 4/1/11 (Acquired
4/5/06, Cost $570,000)(1) 527,963
- --------------------------------------------------------------------------------
3,092,700
- --------------------------------------------------------------------------------
INDEPENDENT POWER PRODUCERS &
ENERGY TRADERS -- 2.7%
- --------------------------------------------------------------------------------
255,000 AES Corp. (The),
9.38%, 9/15/10 276,675
- --------------------------------------------------------------------------------
1,175,000 AES Corp. (The), 8.75%,
5/15/13 (Acquired
10/5/05-10/26/05,
Cost $1,276,344)(1) 1,266,062
- --------------------------------------------------------------------------------
535,000 Dynegy Holdings Inc.,
8.38%, 5/1/16 547,038
- --------------------------------------------------------------------------------
935,000 NRG Energy Inc.,
7.25%, 2/1/14 930,325
- --------------------------------------------------------------------------------
875,000 NRG Energy Inc.,
7.38%, 2/1/16 871,719
- --------------------------------------------------------------------------------
3,891,819
- --------------------------------------------------------------------------------
INDUSTRIAL CONGLOMERATES -- 0.6%
- --------------------------------------------------------------------------------
945,000 Stena AB, 7.50%, 11/1/13 933,188
- --------------------------------------------------------------------------------
INSURANCE -- 0.6%
- --------------------------------------------------------------------------------
405,000 Crum & Forster Holdings Corp.,
10.38%, 6/15/13 417,150
- --------------------------------------------------------------------------------
420,000 UnumProvident Finance Co.
plc, 6.85%, 11/15/15 431,751
- --------------------------------------------------------------------------------
848,901
- --------------------------------------------------------------------------------
See Notes to Financial Statements. (continued)
- ------
20
High-Yield Bond - Schedule of Investments
SEPTEMBER 30, 2006 (UNAUDITED)
Principal Amount Value
- --------------------------------------------------------------------------------
IT SERVICES -- 1.0%
- --------------------------------------------------------------------------------
$ 835,000 SunGard Data Systems Inc.,
9.13%, 8/15/13 $ 868,400
- --------------------------------------------------------------------------------
80,000 SunGard Data Systems Inc.,
4.88%, 1/15/14 69,600
- --------------------------------------------------------------------------------
522,000 Unisys Corp., 8.00%, 10/15/12 490,680
- --------------------------------------------------------------------------------
1,428,680
- --------------------------------------------------------------------------------
LEISURE EQUIPMENT & PRODUCTS -- 1.4%
- --------------------------------------------------------------------------------
925,000 TDS Investor Corp., 9.88%,
9/1/14 (Acquired 8/11/06,
Cost $925,000)(1) 897,250
- --------------------------------------------------------------------------------
1,110,000 TDS Investor Corp., 11.88%,
9/1/16 (Acquired 8/11/06,
Cost $1,110,000)(1) 1,071,150
- --------------------------------------------------------------------------------
1,968,400
- --------------------------------------------------------------------------------
MACHINERY -- 1.4%
- --------------------------------------------------------------------------------
465,000 Amsted Industries Inc.,
10.25%, 10/15/11 499,875
- --------------------------------------------------------------------------------
1,083,000 Case New Holland Inc.,
9.25%, 8/1/11 1,153,395
- --------------------------------------------------------------------------------
385,000 Terex Corp., 7.38%, 1/15/14 388,850
- --------------------------------------------------------------------------------
2,042,120
- --------------------------------------------------------------------------------
MEDIA -- 9.7%
- --------------------------------------------------------------------------------
250,000 AMC Entertainment Inc.,
9.50%, 2/1/11 250,938
- --------------------------------------------------------------------------------
437,000 AMC Entertainment Inc.,
11.00%, 2/1/16 478,515
- --------------------------------------------------------------------------------
495,000 CCH I, LLC/CCH I Capital Corp.,
11.00%, 10/1/15 452,925
- --------------------------------------------------------------------------------
495,000 CCH II, LLC/CCH II
Capital Corp., 10.25%, 9/15/10 504,900
- --------------------------------------------------------------------------------
495,000 Clear Channel
Communications Inc.,
6.25%, 3/15/11 496,993
- --------------------------------------------------------------------------------
495,000 Cox Communications, Inc.,
7.13%, 10/1/12 528,177
- --------------------------------------------------------------------------------
530,000 CSC Holdings, Inc.,
8.13%, 7/15/09 551,200
- --------------------------------------------------------------------------------
254,000 CSC Holdings, Inc.,
8.13%, 8/15/09 264,478
- --------------------------------------------------------------------------------
810,000 CSC Holdings, Inc.,
7.63%, 4/1/11 835,312
- --------------------------------------------------------------------------------
685,000 CSC Holdings, Inc., 7.25%,
4/15/12 (Acquired 7/6/05,
Cost $659,313)(1) 685,855
- --------------------------------------------------------------------------------
495,000 CSC Holdings, Inc.,
7.88%, 2/15/18 516,038
- --------------------------------------------------------------------------------
480,000 DirecTV Holdings LLC/DirecTV
Finance LLC, 6.38%, 6/15/15 453,600
- --------------------------------------------------------------------------------
1,285,000 Echostar DBS Corp.,
6.38%, 10/1/11 1,254,480
- --------------------------------------------------------------------------------
365,000 Echostar DBS Corp., 7.00%,
10/1/13 (Acquired 9/28/06,
Cost $357,638)(1)(2) 358,613
- --------------------------------------------------------------------------------
Principal Amount Value
- --------------------------------------------------------------------------------
$ 255,000 Echostar DBS Corp., 7.13%,
2/1/16 (Acquired 3/21/06,
Cost $252,131)(1) $ 247,669
- --------------------------------------------------------------------------------
885,000 Lamar Media Corp.,
6.63%, 8/15/15 852,918
- --------------------------------------------------------------------------------
655,000 LIN Television Corp.,
6.50%, 5/15/13 614,063
- --------------------------------------------------------------------------------
420,000 Mediacom Broadband LLC,
8.50%, 10/15/15 419,475
- --------------------------------------------------------------------------------
220,000 Mediacom Broadband
LLC/Mediacom Broadband Corp.,
8.50%, 10/15/15 218,348
- --------------------------------------------------------------------------------
265,000 Mediacom LLC/Mediacom
Capital Corp., 7.88%, 2/15/11 263,013
- --------------------------------------------------------------------------------
530,000 Primedia Inc., 8.00%, 5/15/13 483,625
- --------------------------------------------------------------------------------
1,495,000 R.H. Donnelley Corp.,
6.88%, 1/15/13 1,371,662
- --------------------------------------------------------------------------------
750,000 R.H. Donnelley Corp.,
6.88%, 1/15/13 688,124
- --------------------------------------------------------------------------------
310,000 R.H. Donnelley Corp.,
6.88%, 1/15/13 284,425
- --------------------------------------------------------------------------------
215,000 R.H. Donnelley Corp.,
8.88%, 1/15/16 216,613
- --------------------------------------------------------------------------------
552,000 Sinclair Broadcast Group, Inc.,
8.00%, 3/15/12 562,350
- --------------------------------------------------------------------------------
235,000 Videotron Ltee, 6.38%, 12/15/15 223,838
- --------------------------------------------------------------------------------
14,078,147
- --------------------------------------------------------------------------------
METALS & MINING -- 0.4%
- --------------------------------------------------------------------------------
539,000 Novelis Inc., 7.25%,
2/15/15 (Acquired 1/28/05,
Cost $539,000)(1) 514,745
- --------------------------------------------------------------------------------
MULTI-UTILITIES -- 0.7%
- --------------------------------------------------------------------------------
355,000 Basic Energy Services Inc.,
7.13%, 4/15/16 (Acquired
4/7/06, Cost $355,000)(1) 344,350
- --------------------------------------------------------------------------------
665,000 CMS Energy Corp.,
7.75%, 8/1/10 701,575
- --------------------------------------------------------------------------------
1,045,925
- --------------------------------------------------------------------------------
OFFICE ELECTRONICS -- 1.1%
- --------------------------------------------------------------------------------
695,000 Xerox Corp., 7.63%, 6/15/13 733,225
- --------------------------------------------------------------------------------
285,000 Xerox Corp., 6.40%, 3/15/16 285,000
- --------------------------------------------------------------------------------
548,000 Xerox Corp., 7.20%, 4/1/16 578,140
- --------------------------------------------------------------------------------
1,596,365
- --------------------------------------------------------------------------------
OIL, GAS & CONSUMABLE FUELS -- 10.2%
- --------------------------------------------------------------------------------
840,000 Amerigas Partners L.P.,
7.25%, 5/20/15 841,050
- --------------------------------------------------------------------------------
375,000 Chesapeake Energy Corp.,
7.63%, 7/15/13 384,844
- --------------------------------------------------------------------------------
235,000 Chesapeake Energy Corp.,
7.50%, 9/15/13 239,700
- --------------------------------------------------------------------------------
683,000 Chesapeake Energy Corp.,
6.38%, 6/15/15 655,680
- --------------------------------------------------------------------------------
1,287,000 Chesapeake Energy Corp.,
6.63%, 1/15/16 1,248,389
- --------------------------------------------------------------------------------
See Notes to Financial Statements. (continued)
- ------
21
High-Yield Bond - Schedule of Investments
SEPTEMBER 30, 2006 (UNAUDITED)
Principal Amount Value
- --------------------------------------------------------------------------------
$ 1,125,000 Colorado Interstate Gas Co.,
6.80%, 11/15/15 $ 1,139,390
- --------------------------------------------------------------------------------
250,000 Denbury Resources Inc.,
7.50%, 12/15/15 251,250
- --------------------------------------------------------------------------------
585,000 El Paso Performance-Linked
Trust, 7.75%, 7/15/11 (Acquired 7/12/06,
Cost $585,000)(1) 604,013
- --------------------------------------------------------------------------------
796,000 El Paso Production Holding Co.,
7.75%, 6/1/13 817,890
- --------------------------------------------------------------------------------
500,000 Kinder Morgan Finance Co.,
ULC, 5.35%, 1/5/11 486,742
- --------------------------------------------------------------------------------
885,000 Massey Energy Co.,
6.88%, 12/15/13 805,350
- --------------------------------------------------------------------------------
110,000 Newfield Exploration Co.,
6.63%, 9/1/14 108,213
- --------------------------------------------------------------------------------
525,000 Newfield Exploration Co.,
6.63%, 4/15/16 513,188
- --------------------------------------------------------------------------------
871,000 PetroHawk Energy Corp.,
9.13%, 7/15/13 879,710
- --------------------------------------------------------------------------------
360,000 Pioneer Natural Resources Co.,
5.88%, 7/15/16 338,907
- --------------------------------------------------------------------------------
429,000 Pogo Producing Co.,
7.88%, 5/1/13 (Acquired 6/1/06-6/7/06,
Cost $429,784)(1) 439,189
- --------------------------------------------------------------------------------
704,000 Range Resources Corp.,
6.38%, 3/15/15 672,320
- --------------------------------------------------------------------------------
130,000 Range Resources Corp.,
7.50%, 5/15/16 131,300
- --------------------------------------------------------------------------------
365,000 Ship Finance International Ltd.,
8.50%, 12/15/13 354,050
- --------------------------------------------------------------------------------
415,000 Sonat Inc., 7.63%, 7/15/11 427,450
- --------------------------------------------------------------------------------
670,000 Tesoro Corp., 6.63%, 11/1/15 648,225
- --------------------------------------------------------------------------------
788,000 Whiting Petroleum Corp.,
7.25%, 5/1/13 776,180
- --------------------------------------------------------------------------------
2,125,000 Williams Companies, Inc.
(The), 6.38%, 10/1/10 2,124,999
- --------------------------------------------------------------------------------
14,888,029
- --------------------------------------------------------------------------------
PAPER & FOREST PRODUCTS -- 1.6%
- --------------------------------------------------------------------------------
1,013,000 Abitibi-Consolidated Inc.,
7.75%, 6/15/11 931,960
- --------------------------------------------------------------------------------
385,000 Bowater Canada Finance,
7.95%, 11/15/11 369,600
- --------------------------------------------------------------------------------
352,000 Cascades Inc., 7.25%, 2/15/13 344,960
- --------------------------------------------------------------------------------
525,000 Georgia-Pacific Corp.,
8.13%, 5/15/11 540,750
- --------------------------------------------------------------------------------
140,000 Georgia-Pacific Corp.,
7.70%, 6/15/15 140,000
- --------------------------------------------------------------------------------
2,327,270
- --------------------------------------------------------------------------------
PHARMACEUTICALS -- 0.3%
- --------------------------------------------------------------------------------
505,000 Omnicare Inc., 6.75%, 12/15/13 493,638
- --------------------------------------------------------------------------------
Principal Amount Value
- --------------------------------------------------------------------------------
REAL ESTATE INVESTMENT TRUSTS -- 3.8%
- --------------------------------------------------------------------------------
$ 1,605,000 Host Marriott L.P.,
7.13%, 11/1/13 $ 1,633,087
- --------------------------------------------------------------------------------
425,000 Omega Healthcare
Investors, Inc., 7.00%, 4/1/14 422,875
- --------------------------------------------------------------------------------
140,000 Omega Healthcare
Investors, Inc., 7.00%, 1/15/16 138,600
- --------------------------------------------------------------------------------
665,000 Rouse Co. (The),
7.20%, 9/15/12 683,432
- --------------------------------------------------------------------------------
602,000 Rouse Co. L.P./TRC
Co-Issuer Inc., 6.75%,
5/1/13 (Acquired 5/2/06,
Cost $600,122)(1) 604,620
- --------------------------------------------------------------------------------
384,000 Senior Housing Properties
Trust, 8.63%, 1/15/12 414,240
- --------------------------------------------------------------------------------
580,000 Trustreet Properties Inc.,
7.50%, 4/1/15 578,550
- --------------------------------------------------------------------------------
425,000 Ventas Realty L.P./Ventas
Capital Corp., 6.75%, 6/1/10 434,563
- --------------------------------------------------------------------------------
400,000 Ventas Realty L.P./Ventas
Capital Corp., 9.00%, 5/1/12 448,000
- --------------------------------------------------------------------------------
170,000 Ventas Realty L.P./Ventas
Capital Corp., 6.50%, 6/1/16 169,788
- --------------------------------------------------------------------------------
5,527,755
- --------------------------------------------------------------------------------
ROAD & RAIL -- 1.2%
- --------------------------------------------------------------------------------
83,000 Grupo Transportacion
Ferroviaria Mexicana SA
de CV, 9.38%, 5/1/12 88,395
- --------------------------------------------------------------------------------
800,000 Grupo Transportacion
Ferroviaria Mexicana SA
de CV, 12.50%, 6/15/12 884,000
- --------------------------------------------------------------------------------
785,000 Hertz Corp., 8.88%, 1/1/14
(Acquired 12/15/05,
Cost $785,000)(1) 826,213
- --------------------------------------------------------------------------------
1,798,608
- --------------------------------------------------------------------------------
SEMICONDUCTORS &
SEMICONDUCTOR EQUIPMENT -- 0.3%
- --------------------------------------------------------------------------------
432,000 STATS ChipPAC Ltd.,
6.75%, 11/15/11 416,880
- --------------------------------------------------------------------------------
SPECIALTY RETAIL -- 1.9%
- --------------------------------------------------------------------------------
655,000 GSC Holdings Corp.,
8.00%, 10/1/12 677,925
- --------------------------------------------------------------------------------
315,000 Rent-A-Center Inc.,
7.50%, 5/1/10 318,150
- --------------------------------------------------------------------------------
740,000 Simmons Bedding Co.,
7.88%, 1/15/14 721,500
- --------------------------------------------------------------------------------
485,000 Visant Corp., 7.63%, 10/1/12 489,850
- --------------------------------------------------------------------------------
530,000 Warnaco Inc., 8.88%, 6/15/13 551,200
- --------------------------------------------------------------------------------
2,758,625
- --------------------------------------------------------------------------------
See Notes to Financial Statements. (continued)
- ------
22
High-Yield Bond - Schedule of Investments
SEPTEMBER 30, 2006 (UNAUDITED)
Principal Amount Value
- --------------------------------------------------------------------------------
TEXTILES, APPAREL & LUXURY GOODS -- 2.3%
- --------------------------------------------------------------------------------
$ 520,000 Invista, 9.25%, 5/1/12 $ 552,500
- --------------------------------------------------------------------------------
525,000 Levi Strauss & Co., VRN,
10.26%, 10/1/06, resets
quarterly off the 3-month
LIBOR plus 4.75% with no caps 543,375
- --------------------------------------------------------------------------------
1,047,000 Oxford Industries, Inc.,
8.88%, 6/1/11 1,073,175
- --------------------------------------------------------------------------------
412,000 Phillips-Van Heusen,
7.25%, 2/15/11 418,180
- --------------------------------------------------------------------------------
682,000 Samsonite Corp., 8.88%, 6/1/11 717,805
- --------------------------------------------------------------------------------
3,305,035
- --------------------------------------------------------------------------------
THRIFTS & MORTGAGE FINANCE -- 0.5%
- --------------------------------------------------------------------------------
764,000 Residential Capital Corp., VRN,
7.34%, 10/17/06, resets
quarterly off the 3-month LIBOR
plus 1.83% with no caps
(Acquired 4/11/06,
Cost $764,000)(1) 767,968
- --------------------------------------------------------------------------------
TOBACCO -- 1.3%
- --------------------------------------------------------------------------------
1,220,000 Reynolds American Inc.,
7.25%, 6/1/13 (Acquired
5/18/06, Cost $1,211,179)(1) 1,261,514
- --------------------------------------------------------------------------------
630,000 Reynolds American Inc.,
7.63%, 6/1/16 (Acquired
5/18/06, Cost $627,089)(1) 656,655
- --------------------------------------------------------------------------------
1,918,169
- --------------------------------------------------------------------------------
TRADING COMPANIES & DISTRIBUTORS -- 0.9%
- --------------------------------------------------------------------------------
1,368,000 United Rentals North
America, Inc., 6.50%, 2/15/12 1,326,960
- --------------------------------------------------------------------------------
TRANSPORTATION INFRASTRUCTURE -- 0.5%
- --------------------------------------------------------------------------------
682,000 OMI Corp., 7.63%, 12/1/13 692,230
- --------------------------------------------------------------------------------
WIRELESS TELECOMMUNICATION
SERVICES -- 1.9%
- --------------------------------------------------------------------------------
620,000 Nextel Communications Inc.,
6.88%, 10/31/13 631,793
- --------------------------------------------------------------------------------
530,000 Rogers Cable Inc.,
7.88%, 5/1/12 568,425
- --------------------------------------------------------------------------------
Principal Amount/Shares Value
- --------------------------------------------------------------------------------
$ 304,000 Rogers Cable Inc.,
6.25%, 6/15/13 $ 301,720
- --------------------------------------------------------------------------------
274,000 Rogers Wireless Inc.,
7.25%, 12/15/12 288,043
- --------------------------------------------------------------------------------
542,000 Rogers Wireless Inc.,
8.00%, 12/15/12 578,585
- --------------------------------------------------------------------------------
380,000 Rogers Wireless Inc.,
6.38%, 3/1/14 380,475
- --------------------------------------------------------------------------------
2,749,041
- --------------------------------------------------------------------------------
TOTAL CORPORATE BONDS
(Cost $133,263,899) 133,921,736
- --------------------------------------------------------------------------------
COMMERCIAL PAPER(3) -- 6.2%
- --------------------------------------------------------------------------------
3,000,000 Bryant Park Funding, LLC,
5.26%, 10/25/06 2,989,785
- --------------------------------------------------------------------------------
2,500,000 Morgan Stanley, 5.26%, 10/5/06 2,498,895
- --------------------------------------------------------------------------------
600,000 Rabobank USA Financial Corp.,
5.35%, 10/2/06 600,000
- --------------------------------------------------------------------------------
3,000,000 Windmill Funding Corp.,
5.25%, 10/25/06(4) 2,989,824
- --------------------------------------------------------------------------------
TOTAL COMMERCIAL PAPER
(Cost $9,077,430) 9,078,504
- --------------------------------------------------------------------------------
COMMON STOCKS(5)
HOTELS, RESTAURANTS & LEISURE(5)
- --------------------------------------------------------------------------------
1,786 Shreveport Gaming
Holdings Inc.(6)
(Cost $32,476) 31,755
- --------------------------------------------------------------------------------
TOTAL INVESTMENT
SECURITIES -- 98.3%
(Cost $142,373,805) 143,031,995
- --------------------------------------------------------------------------------
OTHER ASSETS
AND LIABILITIES -- 1.7% 2,509,804
- --------------------------------------------------------------------------------
TOTAL NET ASSETS -- 100.0% $145,541,799
================================================================================
NOTES TO SCHEDULE OF INVESTMENTS
LIBOR = London Interbank Offered Rate
resets = The frequency with which a security's coupon changes, based on current
market conditions or an underlying index. The more frequently a
security resets, the less risk the investor is taking that the coupon
will vary significantly from current market rates.
VRN = Variable Rate Note. Interest reset date is indicated. Rate shown is
effective September 30, 2006.
(1) Security was purchased under Rule 144A of the Securities Act of 1933 or is
a private placement and, unless registered under the Act or exempted from
registration, may only be sold to qualified institutional investors. The
aggregate value of restricted securities at September 30, 2006 was
$18,376,175, which represented 12.6% of total net assets. None of the
restricted securities were considered illiquid.
(2) When-issued security.
(3) The rate indicated is the yield to maturity at purchase.
(4) Security, or a portion thereof, has been segregated for a when-issued
security.
(5) Category is less than 0.05% of total net assets.
(6) Non-income producing.
See Notes to Financial Statements.
- ------
23
Shareholder Fee Examples (Unaudited)
Fund shareholders may incur two types of costs: (1) transaction costs, including
sales charges (loads) on purchase payments and redemption/exchange fees; and (2)
ongoing costs, including management fees; distribution and service (12b-1) fees;
and other fund expenses. This example is intended to help you understand your
ongoing costs (in dollars) of investing in your fund and to compare these costs
with the ongoing cost of investing in other mutual funds.
The example is based on an investment of $1,000 made at the beginning of the
period and held for the entire period from April 1, 2006 to September 30, 2006
(except as noted).
ACTUAL EXPENSES
The table provides information about actual account values and actual expenses
for each class. You may use the information, together with the amount you
invested, to estimate the expenses that you paid over the period. First,
identify the share class you own. Then simply divide your account value by
$1,000 (for example, an $8,600 account value divided by $1,000 = 8.6), then
multiply the result by the number under the heading "Expenses Paid During
Period" to estimate the expenses you paid on your account during this period.
If you hold Investor Class shares of any American Century fund, or Institutional
Class shares of the American Century Diversified Bond Fund, in an American
Century account (i.e., not a financial intermediary or retirement plan account),
American Century may charge you a $12.50 semiannual account maintenance fee if
the value of those shares is less than $10,000. We will redeem shares
automatically in one of your accounts to pay the $12.50 fee. In determining your
total eligible investment amount, we will include your investments in all
PERSONAL ACCOUNTS (including American Century Brokerage accounts) registered
under your Social Security number. PERSONAL ACCOUNTS include individual
accounts, joint accounts, UGMA/UTMA accounts, personal trusts, Coverdell
Education Savings Accounts and IRAs (including traditional, Roth, Rollover,
SEP-, SARSEP- and SIMPLE-IRAs), and certain other retirement accounts. If you
have only business, business retirement, employer-sponsored or American Century
Brokerage accounts, you are currently not subject to this fee. We will not
charge the fee as long as you choose to manage your accounts exclusively online.
If you are subject to the Account Maintenance Fee, your account value could be
reduced by the fee amount.
HYPOTHETICAL EXAMPLE FOR COMPARISON PURPOSES
The table also provides information about hypothetical account values and
hypothetical expenses based on the actual expense ratio of each class of your
fund and an assumed rate of return of 5% per year before expenses, which is not
the actual return of a fund's share class. The hypothetical account values and
expenses may not be used to estimate the actual ending account balance or
expenses you paid for the period. You may use this information to compare the
ongoing costs of investing in your fund and other funds. To do so, compare this
5% hypothetical example with the 5% hypothetical examples that appear in the
shareholder reports of the other funds.
(continued)
- ------
24
Shareholder Fee Examples (Unaudited)
Please note that the expenses shown in the table are meant to highlight your
ongoing costs only and do not reflect any transactional costs, such as sales
charges (loads) or redemption/exchange fees. Therefore, the table is useful in
comparing ongoing costs only, and will not help you determine the relative total
costs of owning different funds. In addition, if these transactional costs were
included, your costs would have been higher.
- ------------------------------------------------------------------------------------------
EXPENSES PAID
BEGINNING ENDING DURING PERIOD(1) ANNUALIZED
ACCOUNT VALUE ACCOUNT VALUE 4/1/06 - EXPENSE
4/1/06 9/30/06 9/30/06 RATIO(1)
- ------------------------------------------------------------------------------------------
SELECT BOND SHAREHOLDER FEE EXAMPLE
- ------------------------------------------------------------------------------------------
ACTUAL
- ------------------------------------------------------------------------------------------
Investor Class $1,000 $1,032.70(2) $3.11(3) 0.62%
- ------------------------------------------------------------------------------------------
Institutional Class $1,000 $1,033.70(2) $2.11(3) 0.42%
- ------------------------------------------------------------------------------------------
A Class (after waiver)(4) $1,000 $1,031.90 $4.33 0.85%
- ------------------------------------------------------------------------------------------
A Class (before waiver) $1,000 $1,031.90(5) $4.43 0.87%
- ------------------------------------------------------------------------------------------
B Class (after waiver)(4) $1,000 $1,028.60 $7.63 1.50%
- ------------------------------------------------------------------------------------------
B Class (before waiver) $1,000 $1,028.60(5) $8.24 1.62%
- ------------------------------------------------------------------------------------------
C Class $1,000 $1,027.60(2) $8.10(3) 1.62%
- ------------------------------------------------------------------------------------------
R Class $1,000 $1,030.20(2) $5.61(3) 1.12%
- ------------------------------------------------------------------------------------------
HYPOTHETICAL
- ------------------------------------------------------------------------------------------
Investor Class $1,000 $1,021.96(6) $3.14(6) 0.62%
- ------------------------------------------------------------------------------------------
Institutional Class $1,000 $1,022.96(6) $2.13(6) 0.42%
- ------------------------------------------------------------------------------------------
A Class (after waiver)(4) $1,000 $1,020.81 $4.31 0.85%
- ------------------------------------------------------------------------------------------
A Class (before waiver) $1,000 $1,020.71 $4.41 0.87%
- ------------------------------------------------------------------------------------------
B Class (after waiver)(4) $1,000 $1,017.55 $7.59 1.50%
- ------------------------------------------------------------------------------------------
B Class (before waiver) $1,000 $1,016.95 $8.19 1.62%
- ------------------------------------------------------------------------------------------
C Class $1,000 $1,016.95(6) $8.19(6) 1.62%
- ------------------------------------------------------------------------------------------
R Class $1,000 $1,019.45(6) $5.67(6) 1.12%
- ------------------------------------------------------------------------------------------
(1) Expenses are equal to the class's annualized expense ratio listed in the
table above, multiplied by the average account value over the period,
multiplied by 183, the number of days in the most recent fiscal half-year,
divided by 365, to reflect the one-half year period.
(2) Ending account value based on actual return from April 3, 2006
(commencement of sale) through September 30, 2006.
(3) Expenses are equal to the class's annualized expense ratio listed in the
table above, multiplied by the average account value over the period,
multiplied by 180, the number of days in the period from April 3, 2006
(commencement of sale) through September 30, 2006, divided by 365, to
reflect the period. Had the class been available for the full period, the
expenses paid during the period would have been higher.
(4) During the six months ended September 30, 2006, the class received a
partial waiver of its distribution and service fees.
(5) Ending account value assumes the return earned after waiver. The return
would have been lower had fees not been waived and may have resulted in a
lower ending account value.
(6) Ending account value and expenses paid during period assumes the class had
been available throughout the entire fiscal half-year period and are
calculated using the class's annualized expense ratio listed in the table
above.
(continued)
- ------
25
Shareholder Fee Examples (Unaudited)
- ---------------------------------------------------------------------------------------------------------
EXPENSES PAID
BEGINNING ENDING DURING PERIOD(1) ANNUALIZED
ACCOUNT VALUE ACCOUNT VALUE 4/1/06 - EXPENSE
4/1/06 9/30/06 9/30/06 RATIO(1)
- ---------------------------------------------------------------------------------------------------------
HIGH-YIELD BOND SHAREHOLDER FEE EXAMPLE
- ---------------------------------------------------------------------------------------------------------
ACTUAL
- ---------------------------------------------------------------------------------------------------------
Investor Class (after waiver)(2) $1,000 $1,032.00(3) $3.91(4) 0.78%
- ---------------------------------------------------------------------------------------------------------
Investor Class (before waiver) $1,000 $1,032.00(3)(5) $4.36(4) 0.87%
- ---------------------------------------------------------------------------------------------------------
Institutional Class (after waiver)(2) $1,000 $1,033.00(3) $2.91(4) 0.58%
- ---------------------------------------------------------------------------------------------------------
Institutional Class (before waiver) $1,000 $1,033.00(3)(5) $3.36(4) 0.67%
- ---------------------------------------------------------------------------------------------------------
A Class (after waiver)(6) $1,000 $1,035.70 $5.26 1.03%
- ---------------------------------------------------------------------------------------------------------
A Class (before waiver) $1,000 $1,035.70(5) $5.72 1.12%
- ---------------------------------------------------------------------------------------------------------
B Class (after waiver)(6) $1,000 $1,033.30 $9.07 1.78%
- ---------------------------------------------------------------------------------------------------------
B Class (before waiver) $1,000 $1,033.30(5) $9.53 1.87%
- ---------------------------------------------------------------------------------------------------------
C Class (after waiver)(2) $1,000 $1,026.90(3) $8.90(4) 1.78%
- ---------------------------------------------------------------------------------------------------------
C Class (before waiver) $1,000 $1,026.90(3)(5) $9.35(4) 1.87%
- ---------------------------------------------------------------------------------------------------------
R Class (after waiver)(2) $1,000 $1,029.50(3) $6.41(4) 1.28%
- ---------------------------------------------------------------------------------------------------------
R Class (before waiver) $1,000 $1,029.50(3)(5) $6.86(4) 1.37%
- ---------------------------------------------------------------------------------------------------------
HYPOTHETICAL
- ---------------------------------------------------------------------------------------------------------
Investor Class (after waiver)(2) $1,000 $1,021.16(7) $3.95(7) 0.78%
- ---------------------------------------------------------------------------------------------------------
Investor Class (before waiver) $1,000 $1,020.71(7) $4.41(7) 0.87%
- ---------------------------------------------------------------------------------------------------------
Institutional Class (after waiver)(2) $1,000 $1,022.16(7) $2.94(7) 0.58%
- ---------------------------------------------------------------------------------------------------------
Institutional Class (before waiver) $1,000 $1,021.71(7) $3.40(7) 0.67%
- ---------------------------------------------------------------------------------------------------------
A Class (after waiver)(6) $1,000 $1,019.90 $5.22 1.03%
- ---------------------------------------------------------------------------------------------------------
A Class (before waiver) $1,000 $1,019.45 $5.67 1.12%
- ---------------------------------------------------------------------------------------------------------
B Class (after waiver)(6) $1,000 $1,016.14 $9.00 1.78%
- ---------------------------------------------------------------------------------------------------------
B Class (before waiver) $1,000 $1,015.69 $9.45 1.87%
- ---------------------------------------------------------------------------------------------------------
C Class (after waiver)(2) $1,000 $1,016.14(7) $9.00(7) 1.78%
- ---------------------------------------------------------------------------------------------------------
C Class (before waiver) $1,000 $1,015.69(7) $9.45(7) 1.87%
- ---------------------------------------------------------------------------------------------------------
R Class (after waiver)(2) $1,000 $1,018.65(7) $6.48(7) 1.28%
- ---------------------------------------------------------------------------------------------------------
R Class (before waiver) $1,000 $1,018.20(7) $6.93(7) 1.37%
- ---------------------------------------------------------------------------------------------------------
(1) Expenses are equal to the class's annualized expense ratio listed in the
table above, multiplied by the average account value over the period,
multiplied by 183, the number of days in the most recent fiscal half-year,
divided by 365, to reflect the one-half year period.
(2) During the period April 3, 2006 (commencement of sale) through September
30, 2006, the investment advisor waived a portion of the class's management
fees.
(3) Ending account value based on actual return from April 3, 2006
(commencement of sale) through September 30, 2006.
(4) Expenses are equal to the class's annualized expense ratio listed in the
table above, multiplied by the average account value over the period,
multiplied by 180, the number of days in the period from April 3, 2006
(commencement of sale) through September 30, 2006, divided by 365, to
reflect the period. Had the class been available for the full period, the
expenses paid during the period would have been higher.
(5) Ending account value assumes the return earned after waiver. The return
would have been lower had fees not been waived and may have resulted in a
lower ending account value.
(6) During the six months ended September 30, 2006, the investment advisor
waived a portion of the class's management fees.
(7) Ending account value and expenses paid during period assumes the class had
been available throughout the entire fiscal half-year period and are
calculated using the class's annualized expense ratio listed in the table
above.
- ------
26
Statement of Assets and Liabilities
SEPTEMBER 30, 2006 (UNAUDITED)
- --------------------------------------------------------------------------------
SELECT BOND HIGH-YIELD BOND
- --------------------------------------------------------------------------------
ASSETS
- --------------------------------------------------------------------------------
Investment securities,
at value (cost of $118,537,340
and $142,373,805, respectively) $117,747,769 $143,031,995
- ---------------------------------------------
Cash 27,793 142,120
- ---------------------------------------------
Receivable for investments sold 1,497,857 1,808,725
- ---------------------------------------------
Receivable for capital shares sold 21,411 1,649
- ---------------------------------------------
Receivable for variation margin
on futures contracts 7,959 --
- ---------------------------------------------
Interest receivable 955,734 2,895,513
- --------------------------------------------------------------------------------
120,258,523 147,880,002
- --------------------------------------------------------------------------------
LIABILITIES
- --------------------------------------------------------------------------------
Payable for investments purchased 3,712,849 2,078,855
- ---------------------------------------------
Payable for capital shares redeemed 165,043 175,303
- ---------------------------------------------
Accrued management fees 53,425 74,795
- ---------------------------------------------
Distribution fees payable 5,446 2,366
- ---------------------------------------------
Service fees (and distribution
fees -- A Class) payable 15,069 5,242
- ---------------------------------------------
Dividends payable 11,205 1,642
- --------------------------------------------------------------------------------
3,963,037 2,338,203
- --------------------------------------------------------------------------------
NET ASSETS $116,295,486 $145,541,799
================================================================================
See Notes to Financial Statements. (continued)
- ------
27
Statement of Assets and Liabilities
SEPTEMBER 30, 2006 (UNAUDITED)
- --------------------------------------------------------------------------------
SELECT BOND HIGH-YIELD BOND
- --------------------------------------------------------------------------------
NET ASSETS CONSIST OF:
- --------------------------------------------------------------------------------
Capital paid in $125,590,433 $153,105,733
- ---------------------------------------------
Accumulated net investment loss (192,228) (89,650)
- ---------------------------------------------
Accumulated net realized loss
on investment transactions (8,242,423) (8,132,474)
- ---------------------------------------------
Net unrealized appreciation
(depreciation) on investments (860,296) 658,190
- --------------------------------------------------------------------------------
$116,295,486 $145,541,799
================================================================================
INVESTOR CLASS
- --------------------------------------------------------------------------------
Net assets $26,718 $25,699
- ---------------------------------------------
Shares outstanding 2,840 3,666
- ---------------------------------------------
Net asset value per share $9.41 $7.01
- --------------------------------------------------------------------------------
INSTITUTIONAL CLASS
- --------------------------------------------------------------------------------
Net assets $33,012,533 $120,215,567
- ---------------------------------------------
Shares outstanding 3,508,672 17,147,083
- ---------------------------------------------
Net asset value per share $9.41 $7.01
- --------------------------------------------------------------------------------
A CLASS
- --------------------------------------------------------------------------------
Net assets $74,332,009 $21,481,187
- ---------------------------------------------
Shares outstanding 7,900,230 3,063,997
- ---------------------------------------------
Net asset value per share $9.41 $7.01
- ---------------------------------------------
Maximum offering price
(net asset value divided by 0.955) $9.85 $7.34
- --------------------------------------------------------------------------------
B CLASS
- --------------------------------------------------------------------------------
Net assets $8,810,062 $3,722,576
- ---------------------------------------------
Shares outstanding 936,481 531,276
- ---------------------------------------------
Net asset value per share $9.41 $7.01
- --------------------------------------------------------------------------------
C CLASS
- --------------------------------------------------------------------------------
Net assets $88,410 $71,134
- ---------------------------------------------
Shares outstanding 9,395 10,145
- ---------------------------------------------
Net asset value per share $9.41 $7.01
- --------------------------------------------------------------------------------
R CLASS
- --------------------------------------------------------------------------------
Net assets $25,754 $25,636
- ---------------------------------------------
Shares outstanding 2,737 3,657
- ---------------------------------------------
Net asset value per share $9.41 $7.01
- --------------------------------------------------------------------------------
See Notes to Financial Statements.
- ------
28
Statement of Operations
FOR THE SIX MONTHS ENDED SEPTEMBER 30, 2006 (UNAUDITED)
- --------------------------------------------------------------------------------
SELECT BOND HIGH-YIELD BOND
- --------------------------------------------------------------------------------
INVESTMENT INCOME (LOSS)
- --------------------------------------------------------------------------------
INCOME:
- ------------------------------------
Interest $ 3,333,163 $5,390,043
- --------------------------------------------------------------------------------
EXPENSES:
- ------------------------------------
Management fees 341,271 507,119
- ------------------------------------
Distribution fees:
- ------------------------------------
B Class 33,897 14,845
- ------------------------------------
C Class 104 178
- ------------------------------------
Service fees:
- ------------------------------------
B Class 11,299 4,948
- ------------------------------------
C Class 35 59
- ------------------------------------
Distribution and service fees:
- ------------------------------------
A Class 100,823 31,972
- ------------------------------------
R Class 62 62
- ------------------------------------
Trustees' fees and expenses 1,744 2,045
- ------------------------------------
Other expenses 1,316 382
- --------------------------------------------------------------------------------
490,551 561,610
- ------------------------------------
Amount waived (13,489) (62,397)
- --------------------------------------------------------------------------------
477,062 499,213
- --------------------------------------------------------------------------------
NET INVESTMENT INCOME (LOSS) 2,856,101 4,890,830
- --------------------------------------------------------------------------------
REALIZED AND UNREALIZED GAIN (LOSS)
- --------------------------------------------------------------------------------
NET REALIZED GAIN (LOSS) ON:
- ------------------------------------
Investment and foreign currency transactions (2,248,818) (633,070)
- ------------------------------------
Futures transactions 140,102 --
- --------------------------------------------------------------------------------
(2,108,716) (633,070)
- --------------------------------------------------------------------------------
CHANGE IN NET UNREALIZED
APPRECIATION (DEPRECIATION) ON:
- ------------------------------------
Investments and translation of assets
and liabilities in foreign currencies 3,068,878 1,109,989
- ------------------------------------
Futures (162,318) --
- --------------------------------------------------------------------------------
2,906,560 1,109,989
- --------------------------------------------------------------------------------
NET REALIZED AND UNREALIZED GAIN (LOSS) 797,844 476,919
- --------------------------------------------------------------------------------
NET INCREASE (DECREASE) IN NET ASSETS
RESULTING FROM OPERATIONS $ 3,653,945 $5,367,749
================================================================================
See Notes to Financial Statements.
- ------
29
Statement of Changes in Net Assets
SIX MONTHS ENDED SEPTEMBER 30, 2006 (UNAUDITED) AND YEAR ENDED MARCH 31, 2006
- ------------------------------------------------------------------------------------------------------------
SELECT BOND HIGH-YIELD BOND
- ------------------------------------------------------------------------------------------------------------
INCREASE (DECREASE) IN NET ASSETS SEPT. 30, 2006 MARCH 31, 2006 SEPT. 30, 2006 MARCH 31, 2006
- ------------------------------------------------------------------------------------------------------------
OPERATIONS
- ------------------------------------------------------------------------------------------------------------
Net investment income (loss) $ 2,856,101 $ 7,380,295 $ 4,890,830 $ 9,859,652
- -------------------------------------------
Net realized gain (loss) (2,108,716) (4,467,337) (633,070) (3,067,724)
- -------------------------------------------
Change in net unrealized
appreciation (depreciation) 2,906,560 107,551 1,109,989 (203,372)
- ------------------------------------------------------------------------------------------------------------
Net increase (decrease) in net assets
resulting from operations 3,653,945 3,020,509 5,367,749 6,588,556
- ------------------------------------------------------------------------------------------------------------
DISTRIBUTIONS TO SHAREHOLDERS
- ------------------------------------------------------------------------------------------------------------
From net investment income:
- -------------------------------------------
Investor Class (599) -- (827) --
- -------------------------------------------
Institutional Class (789,986) -- (3,952,230) --
- -------------------------------------------
A Class (1,849,675) (7,506,310) (823,119) (9,895,183)
- -------------------------------------------
B Class (177,683) (317,474) (112,557) (274,427)
- -------------------------------------------
C Class (536) (67,368) (1,334) (27,679)
- -------------------------------------------
R Class (534) -- (765) --
- ------------------------------------------------------------------------------------------------------------
Decrease in net assets from distributions (2,819,013) (7,891,152) (4,890,832) (10,197,289)
- ------------------------------------------------------------------------------------------------------------
CAPITAL SHARE TRANSACTIONS
- ------------------------------------------------------------------------------------------------------------
Net increase (decrease) in net assets
from capital share transactions (16,993,334) (70,178,940) (1,223,264) (12,651,620)
- ------------------------------------------------------------------------------------------------------------
NET INCREASE (DECREASE) IN NET ASSETS (16,158,402) (75,049,583) (746,347) (16,260,353)
NET ASSETS
- ------------------------------------------------------------------------------------------------------------
Beginning of period 132,453,888 207,503,471 146,288,146 162,548,499
- ------------------------------------------------------------------------------------------------------------
End of period $116,295,486 $132,453,888 $145,541,799 $146,288,146
============================================================================================================
Accumulated net investment loss $(192,228) $(193,145) $(89,650) $(89,648)
============================================================================================================
See Notes to Financial Statements.
- ------
30
Notes to Financial Statements
SEPTEMBER 30, 2006 (UNAUDITED)
1. ORGANIZATION AND SUMMARY OF SIGNIFICANT ACCOUNTING POLICIES
ORGANIZATION -- American Century Investment Trust (the trust) is registered
under the Investment Company Act of 1940 (the 1940 Act) as an open-end
management investment company. American Century-Mason Street Select Bond Fund
(Select Bond) and American Century-Mason Street High-Yield Bond Fund (High-Yield
Bond) (the funds) (See Note 7) are two funds in a series issued by the
corporation. The funds are diversified under the 1940 Act. Select Bond's
investment objective is to seek high income and capital appreciation, consistent
with capital preservation. Select Bond invests primarily in investment-grade
debt securities with maturities exceeding one year. High-Yield Bond's investment
objective is to seek high current income and capital appreciation. High-Yield
Bond invests primarily in non-investment-grade debt securities, which are
subject to greater credit risk and consequently offer higher yields. The
following is a summary of the funds' significant accounting policies.
MULTIPLE CLASS -- The funds are authorized to issue the Investor Class, the
Institutional Class, the A Class, the B Class, the C Class and the R Class. The
A Class may incur an initial sales charge. The A Class, B Class and C Class may
be subject to a contingent deferred sales charge. The share classes differ
principally in their respective sales charges and distribution and shareholder
servicing expenses and arrangements. All shares of each fund represent an equal
pro rata interest in the net assets of the class to which such shares belong,
and have identical voting, dividend, liquidation and other rights and the same
terms and conditions, except for class specific expenses and exclusive rights to
vote on matters affecting only individual classes. Income, non-class specific
expenses, and realized and unrealized capital gains and losses of the funds are
allocated to each class of shares based on their relative net assets. Sale of
the funds' Investor Class, Institutional Class, C Class and R Class commenced on
April 3, 2006.
SECURITY VALUATIONS -- Debt securities maturing in greater than 60 days are
valued at current market value as provided by a commercial pricing service or at
the mean of the most recent bid and asked prices. Debt securities maturing
within 60 days may be valued at cost, plus or minus any amortized discount or
premium. Discount notes may be valued through a commercial pricing service or at
amortized cost, which approximates fair value. Securities traded primarily on a
principal securities exchange are valued at the last reported sales price, or at
the mean of the latest bid and asked prices where no last sales price is
available. Securities traded on foreign securities exchanges and
over-the-counter markets are normally completed before the close of business on
days that the New York Stock Exchange (the Exchange) is open and may also take
place on days when the Exchange is not open. If an event occurs after the value
of a security was established but before the net asset value per share was
determined that was likely to materially change the net asset value, that
security would be valued at fair value as determined in accordance with
procedures adopted by the Board of Trustees. If the funds determine that the
market price of a portfolio security is not readily available, or that the
valuation methods mentioned above do not reflect the security's fair value, such
security is valued at its fair value as determined by, or in accordance with
procedures adopted by, the Board of Trustees or its designee if such fair value
determination would materially impact a fund's net asset value. Certain other
circumstances may cause the funds to fair value a security such as: a security
has been declared in default; or trading in a security has been halted during
the trading day; or there is a foreign market holiday and no trading will
commence.
SECURITY TRANSACTIONS -- Security transactions are accounted for as of the trade
date. Net realized gains and losses are determined on the identified cost basis,
which is also used for federal income tax purposes.
INVESTMENT INCOME -- Interest income is recorded on the accrual basis and
includes paydown gain (loss) and accretion of discounts and amortization of
premiums.
WHEN-ISSUED AND FORWARD COMMITMENTS -- The funds may engage in securities
transactions on a when-issued or forward commitment basis. In these
transactions, the securities' prices and yields are fixed on the date of the
commitment. In a when-issued transaction, the payment and delivery are scheduled
for a future date and during this period, securities are subject to market
fluctuations. In a forward commitment transaction, the funds may sell a security
and at the same time make a commitment to purchase the same security at a future
date at a specified price. Conversely, the funds may purchase a security and at
the same time make a commitment to sell the same security at a future date at a
specified price. These types of transactions are executed simultaneously in what
are known as "roll" transactions. The funds will segregate cash, cash
equivalents or other appropriate liquid securities on their records in amounts
sufficient to meet the purchase price. The funds account for "roll" transactions
as purchases and sales; as such these transactions may increase portfolio
turnover.
FUTURES CONTRACTS -- The funds may enter into futures contracts in order to
manage the funds' exposure to changes in market conditions. One of the risks of
entering into futures contracts is the possibility that the change in value of
the contract may not correlate with the changes in value of the underlying
securities. Upon entering into a futures contract, the funds are required to
deposit either cash or securities in an amount equal to a certain percentage of
the contract value (initial margin). Subsequent payments (variation margin)
(continued)
- ------
31
Notes to Financial Statements
SEPTEMBER 30, 2006 (UNAUDITED)
1. ORGANIZATION AND SUMMARY OF SIGNIFICANT ACCOUNTING POLICIES (CONTINUED)
are made or received daily, in cash, by the funds. The variation margin is equal
to the daily change in the contract value and is recorded as unrealized gains
and losses. The funds recognize a realized gain or loss when the contract is
closed or expires. Net realized and unrealized gains or losses occurring during
the holding period of futures contracts are a component of realized gain (loss)
on futures transactions and unrealized appreciation (depreciation) on futures,
respectively.
FOREIGN CURRENCY TRANSACTIONS -- All assets and liabilities initially expressed
in foreign currencies are translated into U.S. dollars at prevailing exchange
rates at period end. Purchases and sales of investment securities, dividend and
interest income, and certain expenses are translated at the rates of exchange
prevailing on the respective dates of such transactions. For assets and
liabilities, other than investments in securities, net realized and unrealized
gains and losses from foreign currency translations arise from changes in
currency exchange rates.
Net realized and unrealized foreign currency exchange gains or losses occurring
during the holding period of investment securities are a component of realized
gain (loss) on investment transactions and unrealized appreciation
(depreciation) on investments, respectively. Certain countries may impose taxes
on the contract amount of purchases and sales of foreign currency contracts in
their currency. The funds record the foreign tax expense, if any, as a reduction
to the net realized gain (loss) on foreign currency transactions.
REPURCHASE AGREEMENTS -- The funds may enter into repurchase agreements with
institutions that American Century Investment Management, Inc. (ACIM) (the
investment advisor) has determined are creditworthy pursuant to criteria adopted
by the Board of Trustees. Each repurchase agreement is recorded at cost. Each
fund requires that the collateral, represented by securities, received in a
repurchase transaction be transferred to the custodian in a manner sufficient to
enable each fund to obtain those securities in the event of a default under the
repurchase agreement. ACIM monitors, on a daily basis, the securities
transferred to ensure the value, including accrued interest, of the securities
under each repurchase agreement is equal to or greater than amounts owed to each
fund under each repurchase agreement.
JOINT TRADING ACCOUNT -- Pursuant to an Exemptive Order issued by the Securities
and Exchange Commission, each fund, along with other registered investment
companies having management agreements with ACIM or American Century Global
Investment Management, Inc. (ACGIM), may transfer uninvested cash balances into
a joint trading account. These balances are invested in one or more repurchase
agreements that are collateralized by U.S. Treasury or Agency obligations.
INCOME TAX STATUS -- It is each fund's policy to distribute substantially all
net investment income and net realized gains to shareholders and to otherwise
qualify as a regulated investment company under provisions of the Internal
Revenue Code. Accordingly, no provision has been made for federal or state
income taxes.
DISTRIBUTIONS TO SHAREHOLDERS -- Distributions from net investment income for
the funds are declared daily and paid monthly. Distributions from net realized
gains for the funds, if any, are generally declared and paid annually.
INDEMNIFICATIONS -- Under the trust's organizational documents, its officers and
trustees are indemnified against certain liabilities arising out of the
performance of their duties to the funds. In addition, in the normal course of
business, the funds enter into contracts that provide general indemnifications.
The funds' maximum exposure under these arrangements is unknown as this would
involve future claims that may be made against the funds. The risk of material
loss from such claims is considered by management to be remote.
USE OF ESTIMATES -- The financial statements are prepared in conformity with
accounting principles generally accepted in the United States of America, which
may require management to make certain estimates and assumptions at the date of
the financial statements. Actual results could differ from these estimates.
(continued)
- ------
32
Notes to Financial Statements
SEPTEMBER 30, 2006 (UNAUDITED)
2. FEES AND TRANSACTIONS WITH RELATED PARTIES
MANAGEMENT FEES -- The trust has entered into a Management Agreement with ACIM,
under which ACIM provides the funds with investment advisory and management
services in exchange for a single, unified management fee (the fee). The
Agreement provides that all expenses of the funds, except brokerage commissions,
taxes, interest, fees and expenses of those trustees who are not considered
"interested persons" as defined in the 1940 Act (including counsel fees) and
extraordinary expenses, will be paid by ACIM. The fee is computed and accrued
daily based on the daily net assets of each specific class of shares of each
fund and paid monthly in arrears. The fee consists of (1) an Investment Category
Fee based on the daily net assets of the funds and certain other accounts
managed by the investment advisor that are in the same broad investment category
as each fund and (2) a Complex Fee based on the assets of all the funds in the
American Century family of funds. The rates for the Investment Category Fee
range from 0.2925% to 0.4100% for Select Bond and from 0.5425% to 0.6600% for
High-Yield Bond. The rates for the Complex Fee (Investor Class, A Class, B
Class, C Class and R Class) range from 0.2500% to 0.3100%. The Institutional
Class is 0.2000% less at each point within the Complex Fee range. For the period
from April 1, 2006 through July 31, 2006, ACIM voluntarily agreed to waive
0.095% of its management fee for High-Yield Bond. Effective August 1, 2006, ACIM
voluntarily agreed to waive 0.071% of its management fee for High-Yield Bond.
The total amount of the waiver for the six months ended September 30, 2006, was
$10, $49,346, $11,283, $1,728, $20 and $10 for the Investor Class, Institutional
Class, A Class, B Class, C Class and R Class, respectively. The fee waiver may
be revised or terminated at any time without notice.
The effective annual management fee for each class of each fund for the six
months ended September 30, 2006, was as follows:
- --------------------------------------------------------------------------------
INVESTOR,
A, B, C & R INSTITUTIONAL
- --------------------------------------------------------------------------------
Select Bond 0.62% 0.42%
- --------------------------------------------------------------------------------
High-Yield Bond (before waiver) 0.87% 0.67%
- --------------------------------------------------------------------------------
High-Yield Bond (after waiver) 0.78% 0.58%
- --------------------------------------------------------------------------------
ACIM has entered into a Subadvisory Agreement with Mason Street Advisors LLC
(Mason Street) on behalf of the funds. The subadvisor makes investment decisions
for the funds in accordance with the funds' investment objectives, policies, and
restrictions under the supervision of ACIM and the Board of Trustees. ACIM pays
all costs associated with retaining Mason Street as the subadvisor of the funds.
DISTRIBUTION AND SERVICE FEES -- The Board of Trustees has adopted a separate
Master Distribution and Individual Shareholder Services Plan for each of the A
Class, B Class, C Class and R Class (collectively the plans), pursuant to Rule
12b-1 of the 1940 Act. The plans provide that the B Class and C Class will pay
American Century Investment Services, Inc. (ACIS) an annual distribution fee and
service fee of 0.75% and 0.25%, respectively. The plans provide that the A Class
and the R Class will pay ACIS an annual distribution and service fee of 0.25%
for the A Class and 0.50% for the R Class. The fees are computed and accrued
daily based on each class's daily net assets and paid monthly in arrears. The
distribution fee provides compensation for expenses incurred in connection with
distributing shares of the classes including, but not limited to, payments to
brokers, dealers, and financial institutions that have entered into sales
agreements with respect to shares of the funds. The service fee provides
compensation for individual shareholder services rendered by broker/dealers or
other independent financial intermediaries for A Class, B Class, C Class and R
Class shares. ACIM has agreed to voluntarily waive a portion of its distribution
and service fees through March 31, 2008, by 0.02% and 0.12% for the A Class and
B Class, respectively, of Select Bond. The total amount of the waiver for the
six months ended September 30, 2006, was $8,066 and $5,423 for the A Class and B
Class, respectively. Fees incurred under the plans during the six months ended
September 30, 2006, are detailed in the Statement of Operations.
RELATED PARTIES -- Certain officers and trustees of the trust are also officers
and/or directors, and, as a group, controlling stockholders of American Century
Companies, Inc. (ACC), the parent of the trust's investment advisor, ACIM, the
distributor of the trust, ACIS, and the trust's transfer agent, American Century
Services, LLC.
JPMorgan Chase Bank is a custodian of the funds and a wholly owned subsidiary of
J.P. Morgan Chase & Co. (JPM). JPM is an equity investor in ACC.
(continued)
- ------
33
Notes to Financial Statements
SEPTEMBER 30, 2006 (UNAUDITED)
3. INVESTMENT TRANSACTIONS
Investment transactions, excluding short-term investments, for the six months
ended September 30, 2006, were as follows:
- --------------------------------------------------------------------------------
SELECT BOND HIGH-YIELD BOND
- --------------------------------------------------------------------------------
PURCHASES
- --------------------------------------------------------------------------------
U.S. Treasury & Government Agency Obligations $79,838,528 --
- --------------------------------------------------------------------------------
Investment securities other than U.S. Treasury
& Government Agency Obligations $22,382,571 $48,061,749
- --------------------------------------------------------------------------------
PROCEEDS FROM SALES
- --------------------------------------------------------------------------------
U.S. Treasury & Government Agency Obligations $88,867,659 --
- --------------------------------------------------------------------------------
Investment securities other than U.S. Treasury
& Government Agency Obligations $28,333,167 $52,942,005
- --------------------------------------------------------------------------------
4. CAPITAL SHARE TRANSACTIONS
Transactions in shares of the funds were as follows (unlimited number of shares
authorized):
- -------------------------------------------------------------------------------------------------------
SELECT BOND HIGH-YIELD BOND
- -------------------------------------------------------------------------------------------------------
SHARES AMOUNT SHARES AMOUNT
- -------------------------------------------------------------------------------------------------------
INVESTOR CLASS
- -------------------------------------------------------------------------------------------------------
PERIOD ENDED SEPTEMBER 30, 2006(1)
- ------------------------------------------
Sold 2,775 $25,894 3,546 $25,000
- ------------------------------------------
Issued in reinvestment of distributions 65 599 120 827
- -------------------------------------------------------------------------------------------------------
Net increase (decrease) 2,840 $26,493 3,666 $25,827
=======================================================================================================
INSTITUTIONAL CLASS
- -------------------------------------------------------------------------------------------------------
PERIOD ENDED SEPTEMBER 30, 2006(1)
- ------------------------------------------
Sold 3,423,279 $31,952,772 16,575,523 $116,356,268
- ------------------------------------------
Issued in reinvestment of distributions 85,393 789,986 571,560 3,952,230
- -------------------------------------------------------------------------------------------------------
Net increase (decrease) 3,508,672 $32,742,758 17,147,083 $120,308,498
=======================================================================================================
A CLASS
- -------------------------------------------------------------------------------------------------------
SIX MONTHS ENDED SEPTEMBER 30, 2006
- ------------------------------------------
Sold 870,351 $ 8,089,672 375,185 $ 2,616,252
- ------------------------------------------
Issued in reinvestment of distributions 179,928 1,674,985 83,683 603,027
- ------------------------------------------
Redeemed (6,341,207) (58,993,034) (17,724,359) (124,350,255)
- -------------------------------------------------------------------------------------------------------
Net increase (decrease) (5,290,928) $(49,228,377) (17,265,491) $(121,130,976)
=======================================================================================================
YEAR ENDED MARCH 31, 2006
- ------------------------------------------
Sold 4,874,382 $ 46,966,237 839,989 $ 5,904,266
- ------------------------------------------
Issued in reinvestment of distributions 737,390 7,047,017 1,337,933 9,395,137
- ------------------------------------------
Redeemed (13,112,351) (124,042,033) (3,924,491) (27,331,381)
- -------------------------------------------------------------------------------------------------------
Net increase (decrease) (7,500,579) $ (70,028,779) (1,746,569) $(12,031,978)
=======================================================================================================
(1) April 3, 2006 (commencement of sale) through September 30, 2006.
(continued)
- ------
34
Notes to Financial Statements
SEPTEMBER 30, 2006 (UNAUDITED)
4. CAPITAL SHARE TRANSACTIONS (CONTINUED)
- -------------------------------------------------------------------------------------------------------
SELECT BOND HIGH-YIELD BOND
- -------------------------------------------------------------------------------------------------------
SHARES AMOUNT SHARES AMOUNT
- -------------------------------------------------------------------------------------------------------
B CLASS
- -------------------------------------------------------------------------------------------------------
SIX MONTHS ENDED SEPTEMBER 30, 2006
- ------------------------------------------
Sold 14,500 $ 135,460 16,992 $ 116,845
- ------------------------------------------
Issued in reinvestment of distributions 16,334 151,740 13,182 91,631
- ------------------------------------------
Redeemed (100,719) (933,560) (104,781) (729,596)
- -------------------------------------------------------------------------------------------------------
Net increase (decrease) (69,885) $(646,360) (74,607) $(521,120)
=======================================================================================================
YEAR ENDED MARCH 31, 2006
- ------------------------------------------
Sold 126,300 $ 1,204,767 33,194 $ 233,387
- ------------------------------------------
Issued in reinvestment of distributions 28,159 268,789 32,661 229,202
- ------------------------------------------
Redeemed (195,688) (1,866,380) (164,718) (1,153,601)
- -------------------------------------------------------------------------------------------------------
Net increase (decrease) (41,229) $ (392,824) (98,863) $ (691,012)
=======================================================================================================
C CLASS
- -------------------------------------------------------------------------------------------------------
PERIOD ENDED SEPTEMBER 30, 2006(1)
- ------------------------------------------
Sold 9,337 $86,082 9,951 $67,408
- ------------------------------------------
Issued in reinvestment of distributions 58 536 194 1,334
- -------------------------------------------------------------------------------------------------------
Net increase (decrease) 9,395 $86,618 10,145 $68,742
=======================================================================================================
C CLASS -- ACQUIRED FUND (SEE NOTE 7)
- -------------------------------------------------------------------------------------------------------
YEAR ENDED MARCH 31, 2006
- ------------------------------------------
Sold 73,088 $ 703,421 24,422 $ 171,671
- ------------------------------------------
Issued in reinvestment of distributions 6,755 64,456 3,794 26,612
- ------------------------------------------
Redeemed (55,129) (525,214) (18,175) (126,913)
- -------------------------------------------------------------------------------------------------------
Net increase (decrease) 24,714 $ 242,663 10,041 $ 71,370
=======================================================================================================
R CLASS
- -------------------------------------------------------------------------------------------------------
PERIOD ENDED SEPTEMBER 30, 2006(1)
- ------------------------------------------
Sold 2,679 $25,000 3,546 $25,000
- ------------------------------------------
Issued in reinvestment of distributions 58 534 111 765
- -------------------------------------------------------------------------------------------------------
Net increase (decrease) 2,737 $25,534 3,657 $25,765
=======================================================================================================
(1) April 3, 2006 (commencement of sale) through September 30, 2006.
5. RISK FACTORS
High-Yield Bond invests primarily in lower-rated debt securities, which are
subject to substantial risks including price volatility, liquidity risk, and
default risk.
(continued)
- ------
35
Notes to Financial Statements
SEPTEMBER 30, 2006 (UNAUDITED)
6. FEDERAL TAX INFORMATION
The book-basis character of distributions made during the year from net
investment income or net realized gains may differ from their ultimate
characterization for federal income tax purposes. These differences reflect the
differing character of paydown losses, certain income items and net realized
gains and losses for financial statement and tax purposes, and may result in
reclassification among certain capital accounts on the financial statements.
Reclassifications between income and realized gain in Select Bond relate
primarily to the character of paydown losses.
As of September 30, 2006, the components of investments for federal income tax
purposes were as follows:
- --------------------------------------------------------------------------------
SELECT BOND HIGH-YIELD BOND
- --------------------------------------------------------------------------------
Federal tax cost of investments $118,696,592 $142,373,805
================================================================================
Gross tax appreciation of investments $ 916,786 $ 2,186,629
- --------------------------------------------
Gross tax depreciation of investments (1,865,609) (1,528,439)
- --------------------------------------------------------------------------------
Net tax appreciation
(depreciation) of investments $ (948,823) $ 658,190
================================================================================
The difference between book-basis and tax-basis cost and unrealized appreciation
(depreciation) is attributable primarily to the tax deferral of losses on wash
sales.
Following are the capital loss carryovers and capital loss deferral amounts as
of March 31, 2006:
- --------------------------------------------------------------------------------
SELECT BOND HIGH-YIELD BOND
- --------------------------------------------------------------------------------
Accumulated capital losses $4,179,415 $6,224,444
- --------------------------------------------
Capital loss deferrals $1,815,845 $1,322,006
- --------------------------------------------------------------------------------
The accumulated capital losses listed above represent net capital loss
carryovers that may be used to offset future realized capital gains for federal
income tax purposes. The capital loss carryovers expire as follows:
- --------------------------------------------------------------------------------
2011 2012 2013 2014
- --------------------------------------------------------------------------------
Select Bond -- -- $244,518 $3,934,897
- --------------------------------------------------------------------------------
High-Yield Bond $4,168,083 -- -- $2,056,361
- --------------------------------------------------------------------------------
The capital loss deferrals represent net capital losses incurred in the
five-month period ended March 31, 2006. The funds have elected to treat such
losses as having been incurred in the following fiscal year for federal income
tax purposes.
(continued)
- ------
36
Notes to Financial Statements
SEPTEMBER 30, 2006 (UNAUDITED)
7. REORGANIZATION PLAN
As of the close of business on March 31, 2006, Select Bond and High-Yield Bond
acquired all of the net assets of two funds issued by Mason Street Funds, Inc.,
Mason Street Select Bond Fund (Mason Street Select) and Mason Street High Yield
Bond Fund (Mason Street High Yield), respectively, pursuant to a plan of
reorganization approved by the acquired funds' shareholders on March 23, 2006.
The surviving funds for the purposes of maintaining the financial statements and
performance history in the post-reorganization period are Mason Street Select
and Mason Street High Yield.
Prior to the reorganization, Mason Street Select and Mason Street High Yield had
A Class, B Class and C Class shares. At the close of business and as a result of
the reorganization, A Class shares and B Class shares of the acquired funds were
converted to A Class shares and B Class shares, respectively, of the surviving
funds. C Class shares of the acquired funds were converted to A Class shares of
the surviving funds.
A Class, B Class and C Class net assets of Mason Street Select before the
reorganization were $121,068,940, $9,387,851 and $1,997,097, respectively.
Immediately after the reorganization, A Class, B Class and C Class net assets of
Select Bond were $123,066,037, $9,387,851 and $-, respectively.
A Class, B Class and C Class net assets of Mason Street High Yield before the
reorganization were $141,592,864, $4,231,440 and $463,842, respectively.
Immediately after the reorganization, A Class, B Class and C Class net assets of
High-Yield Bond were $142,056,706, $4,231,440 and $-, respectively.
8. RECENTLY ISSUED ACCOUNTING STANDARDS
In June 2006, the Financial Accounting Standards Board (FASB) issued
Interpretation No. 48, "Accounting for Uncertainty in Income Taxes - an
Interpretation of FASB Statement No. 109" (FIN 48). FIN 48 establishes a minimum
threshold for financial statement recognition of the benefit of positions taken
in filing tax returns (including whether an entity is taxable in a particular
jurisdiction), and requires certain expanded tax disclosures. FIN 48 is
effective for fiscal years beginning after December 15, 2006, and is to be
applied to all open tax years as of the date of effectiveness. The FASB issued
Statement of Financial Accounting Standards No. 157, "Fair Value Measurements"
(FAS 157), in September 2006, which is effective for fiscal years beginning
after November 15, 2007. FAS 157 defines fair value, establishes a framework for
measuring fair value and expands the required financial statement disclosures
about fair value measurements. Management is currently evaluating the impact of
adopting FIN 48 and FAS 157.
- ------
37
Select Bond - Financial Highlights
For a Share Outstanding Throughout the Period Indicated
- --------------------------------------------------------------------------------
INVESTOR
CLASS
- --------------------------------------------------------------------------------
2006(1)
- --------------------------------------------------------------------------------
PER-SHARE DATA
- --------------------------------------------------------------------------------
Net Asset Value, Beginning of Period $9.33
- --------------------------------------------------------------------------------
Income From Investment Operations
- -----------------------------------------------------------
Net Investment Income(2) 0.22
- -----------------------------------------------------------
Net Realized and Unrealized Gain (Loss) 0.08
- --------------------------------------------------------------------------------
Total From Investment Operations 0.30
- --------------------------------------------------------------------------------
Distributions
- -----------------------------------------------------------
From Net Investment Income (0.22)
- --------------------------------------------------------------------------------
Net Asset Value, End of Period $9.41
================================================================================
TOTAL RETURN(3) 3.27%
- --------------------------------------------------------------------------------
RATIOS/SUPPLEMENTAL DATA
- --------------------------------------------------------------------------------
Ratio of Operating Expenses to Average Net Assets 0.62%(4)
- -----------------------------------------------------------
Ratio of Net Investment Income to Average Net Assets 4.81%(4)
- -----------------------------------------------------------
Portfolio Turnover Rate 91%
- -----------------------------------------------------------
Net Assets, End of Period (in thousands) $27
- --------------------------------------------------------------------------------
(1) April 3, 2006 (commencement of sale) through September 30, 2006 (unaudited).
(2) Computed using average shares outstanding throughout the period.
(3) Total return assumes reinvestment of net investment income and capital
gains distributions, if any. Total returns for periods less than one year
are not annualized. The total return of the classes may not precisely
reflect the class expense differences because of the impact of calculating
the net asset values to two decimal places. If net asset values were
calculated to three decimal places, the total return differences would more
closely reflect the class expense differences. The calculation of net asset
values to two decimal places is made in accordance with SEC guidelines and
does not result in any gain or loss of value between one class and another.
(4) Annualized.
See Notes to Financial Statements.
- ------
38
Select Bond - Financial Highlights
For a Share Outstanding Throughout the Period Indicated
- --------------------------------------------------------------------------------
INSTITUTIONAL
CLASS
- --------------------------------------------------------------------------------
2006(1)
- --------------------------------------------------------------------------------
PER-SHARE DATA
- --------------------------------------------------------------------------------
Net Asset Value, Beginning of Period $9.33
- --------------------------------------------------------------------------------
Income From Investment Operations
- --------------------------------------------------------------
Net Investment Income(2) 0.23
- --------------------------------------------------------------
Net Realized and Unrealized Gain (Loss) 0.08
- --------------------------------------------------------------------------------
Total From Investment Operations 0.31
- --------------------------------------------------------------------------------
Distributions
- --------------------------------------------------------------
From Net Investment Income (0.23)
- --------------------------------------------------------------------------------
Net Asset Value, End of Period $9.41
================================================================================
TOTAL RETURN(3) 3.37%
- --------------------------------------------------------------------------------
RATIOS/SUPPLEMENTAL DATA
- --------------------------------------------------------------------------------
Ratio of Operating Expenses to Average Net Assets 0.42%(4)
- --------------------------------------------------------------
Ratio of Net Investment Income to Average Net Assets 5.01%(4)
- --------------------------------------------------------------
Portfolio Turnover Rate 91%
- --------------------------------------------------------------
Net Assets, End of Period (in thousands) $33,013
- --------------------------------------------------------------------------------
(1) April 3, 2006 (commencement of sale) through September 30, 2006 (unaudited).
(2) Computed using average shares outstanding throughout the period.
(3) Total return assumes reinvestment of net investment income and capital
gains distributions, if any. Total returns for periods less than one year
are not annualized. The total return of the classes may not precisely
reflect the class expense differences because of the impact of calculating
the net asset values to two decimal places. If net asset values were
calculated to three decimal places, the total return differences would more
closely reflect the class expense differences. The calculation of net asset
values to two decimal places is made in accordance with SEC guidelines and
does not result in any gain or loss of value between one class and another.
(4) Annualized.
See Notes to Financial Statements.
- ------
39
Select Bond - Financial Highlights
For a Share Outstanding Throughout the Years Ended March 31 (except as noted)
- ------------------------------------------------------------------------------------------------------------
A CLASS
- ------------------------------------------------------------------------------------------------------------
2006(1) 2006 2005 2004 2003 2002
- ------------------------------------------------------------------------------------------------------------
PER-SHARE DATA
- ------------------------------------------------------------------------------------------------------------
Net Asset Value, Beginning of Period $9.33 $9.56 $10.01 $9.98 $9.50 $9.69
- ------------------------------------------------------------------------------------------------------------
Income From Investment Operations
- -----------------------------------
Net Investment Income 0.21(2) 0.35(2) 0.32(2) 0.31(2) 0.41(2) 0.49
- -----------------------------------
Net Realized and Unrealized
Gain (Loss) 0.08 (0.21) (0.34) 0.32 0.82 0.05
- ------------------------------------------------------------------------------------------------------------
Total From Investment Operations 0.29 0.14 (0.02) 0.63 1.23 0.54
- ------------------------------------------------------------------------------------------------------------
Distributions
- -----------------------------------
From Net Investment Income (0.21) (0.37) (0.36) (0.36) (0.45) (0.49)
- -----------------------------------
From Net Realized Gains -- -- (0.07) (0.24) (0.30) (0.24)
- ------------------------------------------------------------------------------------------------------------
Total Distributions (0.21) (0.37) (0.43) (0.60) (0.75) (0.73)
- ------------------------------------------------------------------------------------------------------------
Net Asset Value, End of Period $9.41 $9.33 $9.56 $10.01 $9.98 $9.50
============================================================================================================
TOTAL RETURN(3) 3.19% 1.47% (0.27)% 6.50% 13.19% 5.76%
- ------------------------------------------------------------------------------------------------------------
RATIOS/SUPPLEMENTAL DATA
- ------------------------------------------------------------------------------------------------------------
Ratio of Operating Expenses
to Average Net Assets 0.85%(4)(5) 0.85%(6) 0.85%(6) 0.85%(6) 0.85%(6) 0.85%(6)
- -----------------------------------
Ratio of Operating Expenses
to Average Net Assets
(Before Expense Waiver) 0.87%(4) 0.86% 0.88% 0.93% 0.96% 1.04%
- -----------------------------------
Ratio of Net Investment Income
to Average Net Assets 4.65%(4)(5) 3.66%(6) 3.29%(6) 3.08%(6) 4.13%(6) 4.97%(6)
- -----------------------------------
Ratio of Net Investment Income
to Average Net Assets
(Before Expense Waiver) 4.63%(4) 3.65% 3.26% 3.00% 4.02% 4.78%
- -----------------------------------
Portfolio Turnover Rate 91% 251%(7) 233% 168% 214% 129%
- -----------------------------------
Net Assets, End of Period
(in thousands) $74,332 $121,069 $195,684 $146,431 $107,953 $64,073
- ------------------------------------------------------------------------------------------------------------
(1) Six months ended September 30, 2006 (unaudited).
(2) Computed using average shares outstanding throughout the period.
(3) Total return assumes reinvestment of net investment income and capital
gains distributions, if any, and does not reflect applicable sales charges.
Total returns for periods less than one year are not annualized. The total
return of the classes may not precisely reflect the class expense
differences because of the impact of calculating the net asset values to two
decimal places. If net asset values were calculated to three decimal places,
the total return differences would more closely reflect the class expense
differences. The calculation of net asset values to two decimal places is
made in accordance with SEC guidelines and does not result in any gain or
loss of value between one class and another.
(4) Annualized.
(5) During the six months ended September 30, 2006, the distributor voluntarily
waived a portion of its distribution and service fees.
(6) The investment advisor voluntarily agreed to waive fees and absorb certain
operating expenses.
(7) Portfolio turnover rate excludes the impact of mortgage dollar roll
transactions.
See Notes to Financial Statements.
- ------
40
Select Bond - Financial Highlights
For a Share Outstanding Throughout the Years Ended March 31 (except as noted)
- ---------------------------------------------------------------------------------------------------------------
B CLASS
- ---------------------------------------------------------------------------------------------------------------
2006(1) 2006 2005 2004 2003 2002
- ---------------------------------------------------------------------------------------------------------------
PER-SHARE DATA
- ---------------------------------------------------------------------------------------------------------------
Net Asset Value, Beginning of Period $9.33 $9.56 $10.01 $9.98 $9.50 $9.69
- ---------------------------------------------------------------------------------------------------------------
Income From Investment Operations
- ------------------------------------
Net Investment Income 0.18(2) 0.29(2) 0.25(2) 0.24(2) 0.34(2) 0.43
- ------------------------------------
Net Realized and Unrealized
Gain (Loss) 0.08 (0.21) (0.35) 0.33 0.82 0.05
- ---------------------------------------------------------------------------------------------------------------
Total From Investment Operations 0.26 0.08 (0.10) 0.57 1.16 0.48
- ---------------------------------------------------------------------------------------------------------------
Distributions
- ------------------------------------
From Net Investment Income (0.18) (0.31) (0.29) (0.30) (0.38) (0.43)
- ------------------------------------
From Net Realized Gains -- -- (0.06) (0.24) (0.30) (0.24)
- ---------------------------------------------------------------------------------------------------------------
Total Distributions (0.18) (0.31) (0.35) (0.54) (0.68) (0.67)
- ---------------------------------------------------------------------------------------------------------------
Net Asset Value, End of Period $9.41 $9.33 $9.56 $10.01 $9.98 $9.50
===============================================================================================================
TOTAL RETURN(3) 2.86% 0.82% (0.91)% 5.80% 12.46% 5.08%
- ---------------------------------------------------------------------------------------------------------------
RATIOS/SUPPLEMENTAL DATA
- ---------------------------------------------------------------------------------------------------------------
Ratio of Operating Expenses
to Average Net Assets 1.50%(4) 1.50%(6) 1.50%(6) 1.50%(6) 1.50%(6) 1.50%(6)
- ------------------------------------
Ratio of Operating Expenses
to Average Net Assets
(Before Expense Waiver) 1.62%(4)(5) 1.54% 1.55% 1.57% 1.61% 1.69%
- ------------------------------------
Ratio of Net Investment Income
to Average Net Assets 4.00%(4) 2.99%(6) 2.64%(6) 2.44%(6) 3.41%(6) 4.32%(6)
- ------------------------------------
Ratio of Net Investment Income
to Average Net Assets
(Before Expense Waiver) 3.88%(4)(5) 2.95% 2.59% 2.37% 3.30% 4.13%
- ------------------------------------
Portfolio Turnover Rate 91% 251%(7) 233% 168% 214% 129%
- ------------------------------------
Net Assets, End of Period
(in thousands) $8,810 $9,388 $10,010 $11,353 $10,082 $4,518
- ---------------------------------------------------------------------------------------------------------------
(1) Six months ended September 30, 2006 (unaudited).
(2) Computed using average shares outstanding throughout the period.
(3) Total return assumes reinvestment of net investment income and capital
gains distributions, if any, and does not reflect applicable sales charges.
Total returns for periods less than one year are not annualized. The total
return of the classes may not precisely reflect the class expense
differences because of the impact of calculating the net asset values to two
decimal places. If net asset values were calculated to three decimal places,
the total return differences would more closely reflect the class expense
differences. The calculation of net asset values to two decimal places is
made in accordance with SEC guidelines and does not result in any gain or
loss of value between one class and another.
(4) Annualized.
(5) During the six months ended September 30, 2006, the distributor voluntarily
waived a portion of its distribution and service fees.
(6) The investment advisor voluntarily agreed to waive fees and absorb certain
operating expenses.
(7) Portfolio turnover rate excludes the impact of mortgage dollar roll
transactions.
See Notes to Financial Statements.
- ------
41
Select Bond - Financial Highlights
For a Share Outstanding Throughout the Period Indicated
- --------------------------------------------------------------------------------
C CLASS
- --------------------------------------------------------------------------------
2006(1)
- --------------------------------------------------------------------------------
PER-SHARE DATA
- --------------------------------------------------------------------------------
Net Asset Value, Beginning of Period $9.33
- --------------------------------------------------------------------------------
Income From Investment Operations
- -------------------------------------------------------------
Net Investment Income(2) 0.17
- -------------------------------------------------------------
Net Realized and Unrealized Gain (Loss) 0.08
- --------------------------------------------------------------------------------
Total From Investment Operations 0.25
- --------------------------------------------------------------------------------
Distributions
- -------------------------------------------------------------
From Net Investment Income (0.17)
- --------------------------------------------------------------------------------
Net Asset Value, End of Period $9.41
================================================================================
TOTAL RETURN(3) 2.76%
- --------------------------------------------------------------------------------
RATIOS/SUPPLEMENTAL DATA
- --------------------------------------------------------------------------------
Ratio of Operating Expenses to Average Net Assets 1.62%(4)
- -------------------------------------------------------------
Ratio of Net Investment Income to Average Net Assets 3.81%(4)
- -------------------------------------------------------------
Portfolio Turnover Rate 91%
- -------------------------------------------------------------
Net Assets, End of Period (in thousands) $88
- --------------------------------------------------------------------------------
(1) April 3, 2006 (commencement of sale) through September 30, 2006 (unaudited).
(2) Computed using average shares outstanding throughout the period.
(3) Total return assumes reinvestment of net investment income and capital
gains distributions, if any, and does not reflect applicable sales charges.
Total returns for periods less than one year are not annualized. The total
return of the classes may not precisely reflect the class expense
differences because of the impact of calculating the net asset values to two
decimal places. If net asset values were calculated to three decimal places,
the total return differences would more closely reflect the class expense
differences. The calculation of net asset values to two decimal places is
made in accordance with SEC guidelines and does not result in any gain or
loss of value between one class and another.
(4) Annualized.
See Notes to Financial Statements.
- ------
42
Select Bond - Financial Highlights
For a Share Outstanding Throughout the Period Indicated
- --------------------------------------------------------------------------------
R CLASS
- --------------------------------------------------------------------------------
2006(1)
- --------------------------------------------------------------------------------
PER-SHARE DATA
- --------------------------------------------------------------------------------
Net Asset Value, Beginning of Period $9.33
- --------------------------------------------------------------------------------
Income From Investment Operations
- ------------------------------------------------------------
Net Investment Income(2) 0.20
- ------------------------------------------------------------
Net Realized and Unrealized Gain (Loss) 0.08
- --------------------------------------------------------------------------------
Total From Investment Operations 0.28
- --------------------------------------------------------------------------------
Distributions
- ------------------------------------------------------------
From Net Investment Income (0.20)
- --------------------------------------------------------------------------------
Net Asset Value, End of Period $9.41
================================================================================
TOTAL RETURN(3) 3.02%
- --------------------------------------------------------------------------------
RATIOS/SUPPLEMENTAL DATA
- --------------------------------------------------------------------------------
Ratio of Operating Expenses to Average Net Assets 1.12%(4)
- ------------------------------------------------------------
Ratio of Net Investment Income to Average Net Assets 4.31%(4)
- ------------------------------------------------------------
Portfolio Turnover Rate 91%
- ------------------------------------------------------------
Net Assets, End of Period (in thousands) $26
- --------------------------------------------------------------------------------
(1) April 3, 2006 (commencement of sale) through September 30, 2006 (unaudited).
(2) Computed using average shares outstanding throughout the period.
(3) Total return assumes reinvestment of net investment income and capital
gains distributions, if any. Total returns for periods less than one year
are not annualized. The total return of the classes may not precisely
reflect the class expense differences because of the impact of calculating
the net asset values to two decimal places. If net asset values were
calculated to three decimal places, the total return differences would more
closely reflect the class expense differences. The calculation of net asset
values to two decimal places is made in accordance with SEC guidelines and
does not result in any gain or loss of value between one class and another.
(4) Annualized.
See Notes to Financial Statements.
- ------
43
High-Yield Bond - Financial Highlights
For a Share Outstanding Throughout the Period Indicated
- --------------------------------------------------------------------------------
INVESTOR
CLASS
- --------------------------------------------------------------------------------
2006(1)
- --------------------------------------------------------------------------------
PER-SHARE DATA
- --------------------------------------------------------------------------------
Net Asset Value, Beginning of Period $7.02
- --------------------------------------------------------------------------------
Income From Investment Operations
- -------------------------------------------------------------
Net Investment Income 0.23
- -------------------------------------------------------------
Net Realized and Unrealized Gain (Loss) (0.01)
- --------------------------------------------------------------------------------
Total From Investment Operations 0.22
- --------------------------------------------------------------------------------
Distributions
- -------------------------------------------------------------
From Net Investment Income (0.23)
- --------------------------------------------------------------------------------
Net Asset Value, End of Period $7.01
================================================================================
TOTAL RETURN(2) 3.20%
- --------------------------------------------------------------------------------
RATIOS/SUPPLEMENTAL DATA
- --------------------------------------------------------------------------------
Ratio of Operating Expenses
to Average Net Assets 0.78%(3)(4)
- -------------------------------------------------------------
Ratio of Operating Expenses
to Average Net Assets (Before Expense Waiver) 0.87%(3)
- -------------------------------------------------------------
Ratio of Net Investment Income
to Average Net Assets 6.76%(3)(4)
- -------------------------------------------------------------
Ratio of Net Investment Income
to Average Net Assets (Before Expense Waiver) 6.67%(3)
- -------------------------------------------------------------
Portfolio Turnover Rate 36%
- -------------------------------------------------------------
Net Assets, End of Period (in thousands) $26
- --------------------------------------------------------------------------------
(1) April 3, 2006 (commencement of sale) through September 30, 2006 (unaudited).
(2) Total return assumes reinvestment of net investment income and capital
gains distributions, if any. Total returns for periods less than one year
are not annualized. The total return of the classes may not precisely
reflect the class expense differences because of the impact of calculating
the net asset values to two decimal places. If net asset values were
calculated to three decimal places, the total return differences would more
closely reflect the class expense differences. The calculation of net asset
values to two decimal places is made in accordance with SEC guidelines and
does not result in any gain or loss of value between one class and another.
(3) Annualized.
(4) Effective April 3, 2006, the investment advisor voluntarily agreed to waive
a portion of the management fee.
See Notes to Financial Statements.
- ------
44
High-Yield Bond - Financial Highlights
For a Share Outstanding Throughout the Period Indicated
- --------------------------------------------------------------------------------
INSTITUTIONAL
CLASS
- --------------------------------------------------------------------------------
2006(1)
- --------------------------------------------------------------------------------
PER-SHARE DATA
- --------------------------------------------------------------------------------
Net Asset Value, Beginning of Period $7.02
- --------------------------------------------------------------------------------
Income From Investment Operations
- ----------------------------------------------------------
Net Investment Income 0.24
- ----------------------------------------------------------
Net Realized and Unrealized Gain (Loss) (0.01)
- --------------------------------------------------------------------------------
Total From Investment Operations 0.23
- --------------------------------------------------------------------------------
Distributions
- ----------------------------------------------------------
From Net Investment Income (0.24)
- --------------------------------------------------------------------------------
Net Asset Value, End of Period $7.01
================================================================================
TOTAL RETURN(2) 3.30%
- --------------------------------------------------------------------------------
RATIOS/SUPPLEMENTAL DATA
- --------------------------------------------------------------------------------
Ratio of Operating Expenses
to Average Net Assets 0.58%(3)(4)
- ----------------------------------------------------------
Ratio of Operating Expenses
to Average Net Assets (Before Expense Waiver) 0.67%(3)
- ----------------------------------------------------------
Ratio of Net Investment Income
to Average Net Assets 6.96%(3)(4)
- ----------------------------------------------------------
Ratio of Net Investment Income
to Average Net Assets (Before Expense Waiver) 6.87%(3)
- ----------------------------------------------------------
Portfolio Turnover Rate 36%
- ----------------------------------------------------------
Net Assets, End of Period (in thousands) $120,216
- --------------------------------------------------------------------------------
(1) April 3, 2006 (commencement of sale) through September 30, 2006 (unaudited).
(2) Total return assumes reinvestment of net investment income and capital
gains distributions, if any. Total returns for periods less than one year
are not annualized. The total return of the classes may not precisely
reflect the class expense differences because of the impact of calculating
the net asset values to two decimal places. If net asset values were
calculated to three decimal places, the total return differences would more
closely reflect the class expense differences. The calculation of net asset
values to two decimal places is made in accordance with SEC guidelines and
does not result in any gain or loss of value between one class and another.
(3) Annualized.
(4) Effective April 3, 2006, the investment advisor voluntarily agreed to waive
a portion of the management fee.
See Notes to Financial Statements.
- ------
45
High-Yield Bond - Financial Highlights
For a Share Outstanding Throughout the Years Ended March 31 (except as noted)
- -----------------------------------------------------------------------------------------------------------
A CLASS
- -----------------------------------------------------------------------------------------------------------
2006(1) 2006 2005 2004 2003 2002
- -----------------------------------------------------------------------------------------------------------
PER-SHARE DATA
- -----------------------------------------------------------------------------------------------------------
Net Asset Value, Beginning of Period $6.99 $7.14 $7.13 $6.25 $6.79 $7.49
- -----------------------------------------------------------------------------------------------------------
Income From Investment Operations
- ----------------------------------
Net Investment Income 0.22 0.45(2) 0.48(2) 0.50(2) 0.57(2) 0.68
- ----------------------------------
Net Realized and Unrealized
Gain (Loss) 0.02 (0.14) 0.02 0.88 (0.53) (0.69)
- -----------------------------------------------------------------------------------------------------------
Total From Investment Operations 0.24 0.31 0.50 1.38 0.04 (0.01)
- -----------------------------------------------------------------------------------------------------------
Distributions
- ----------------------------------
From Net Investment Income (0.22) (0.46) (0.49) (0.50) (0.58) (0.69)
- -----------------------------------------------------------------------------------------------------------
Net Asset Value, End of Period $7.01 $6.99 $7.14 $7.13 $6.25 $6.79
===========================================================================================================
TOTAL RETURN(3) 3.57% 4.55% 7.16% 22.79% 1.15% (0.08)%
- -----------------------------------------------------------------------------------------------------------
RATIOS/SUPPLEMENTAL DATA
- -----------------------------------------------------------------------------------------------------------
Ratio of Operating Expenses
to Average Net Assets 1.03%(4)(5) 1.26% 1.30%(6) 1.30%(6) 1.30%(6) 1.30%(6)
- ----------------------------------
Ratio of Operating Expenses
to Average Net Assets
(Before Expense Waiver) 1.12%(4) 1.26% 1.31% 1.35% 1.46% 1.50%
- ----------------------------------
Ratio of Net Investment Income
to Average Net Assets 6.45%(4)(5) 6.38% 6.70%(6) 7.29%(6) 9.24%(6) 9.66%(6)
- ----------------------------------
Ratio of Net Investment Income
to Average Net Assets
(Before Expense Waiver) 6.36%(4) 6.38% 6.69% 7.24% 9.08% 9.46%
- ----------------------------------
Portfolio Turnover Rate 36% 116% 141% 199% 78% 87%
- ----------------------------------
Net Assets, End of Period
(in thousands) $21,481 $141,593 $157,118 $140,330 $107,051 $53,506
- -----------------------------------------------------------------------------------------------------------
(1) Six months ended September 30, 2006 (unaudited).
(2) Computed using average shares outstanding throughout the period.
(3) Total return assumes reinvestment of net investment income and capital
gains distributions, if any, and does not reflect applicable sales charges.
Total returns for periods less than one year are not annualized. The total
return of the classes may not precisely reflect the class expense
differences because of the impact of calculating the net asset values to two
decimal places. If net asset values were calculated to three decimal places,
the total return differences would more closely reflect the class expense
differences. The calculation of net asset values to two decimal places is
made in accordance with SEC guidelines and does not result in any gain or
loss of value between one class and another.
(4) Annualized.
(5) Effective April 1, 2006, the investment advisor voluntarily agreed to waive
a portion of the management fee.
(6) The investment advisor voluntarily agreed to waive fees and absorb certain
operating expenses.
See Notes to Financial Statements.
- ------
46
High-Yield Bond - Financial Highlights
For a Share Outstanding Throughout the Years Ended March 31 (except as noted)
- -----------------------------------------------------------------------------------------------------------
B CLASS
- -----------------------------------------------------------------------------------------------------------
2006(1) 2006 2005 2004 2003 2002
- -----------------------------------------------------------------------------------------------------------
PER-SHARE DATA
- -----------------------------------------------------------------------------------------------------------
Net Asset Value, Beginning of Period $6.98 $7.13 $7.13 $6.24 $6.78 $7.49
- -----------------------------------------------------------------------------------------------------------
Income From Investment Operations
- ------------------------------------
Net Investment Income 0.20 0.40(2) 0.43(2) 0.45(2) 0.53(2) 0.63
- ------------------------------------
Net Realized and Unrealized
Gain (Loss) 0.03 (0.14) 0.01 0.90 (0.53) (0.70)
- -----------------------------------------------------------------------------------------------------------
Total From Investment Operations 0.23 0.26 0.44 1.35 -- (0.07)
- -----------------------------------------------------------------------------------------------------------
Distributions
- ------------------------------------
From Net Investment Income (0.20) (0.41) (0.44) (0.46) (0.54) (0.64)
- -----------------------------------------------------------------------------------------------------------
Net Asset Value, End of Period $7.01 $6.98 $7.13 $7.13 $6.24 $6.78
===========================================================================================================
TOTAL RETURN(3) 3.33% 3.84% 6.32% 22.19% 0.48% (0.87)%
- -----------------------------------------------------------------------------------------------------------
RATIOS/SUPPLEMENTAL DATA
- -----------------------------------------------------------------------------------------------------------
Ratio of Operating Expenses
to Average Net Assets 1.78%(4)(5) 1.95%(6) 1.95%(6) 1.95%(6) 1.95%(6) 1.95%(6)
- ------------------------------------
Ratio of Operating Expenses
to Average Net Assets
(Before Expense Waiver) 1.87%(4) 1.99% 1.99% 2.00% 2.11% 2.15%
- ------------------------------------
Ratio of Net Investment Income
to Average Net Assets 5.70%(4)(5) 5.69%(6) 6.06%(6) 6.63%(6) 8.64%(6) 9.01%(6)
- ------------------------------------
Ratio of Net Investment Income
to Average Net Assets
(Before Expense Waiver) 5.61%(4) 5.65% 6.02% 6.58% 8.48% 8.81%
- ------------------------------------
Portfolio Turnover Rate 36% 116% 141% 199% 78% 87%
- ------------------------------------
Net Assets, End of Period
(in thousands) $3,723 $4,231 $5,028 $5,316 $4,243 $3,843
- -----------------------------------------------------------------------------------------------------------
(1) Six months ended September 30, 2006 (unaudited).
(2) Computed using average shares outstanding throughout the period.
(3) Total return assumes reinvestment of net investment income and capital
gains distributions, if any, and does not reflect applicable sales charges.
Total returns for periods less than one year are not annualized. The total
return of the classes may not precisely reflect the class expense
differences because of the impact of calculating the net asset values to two
decimal places. If net asset values were calculated to three decimal places,
the total return differences would more closely reflect the class expense
differences. The calculation of net asset values to two decimal places is
made in accordance with SEC guidelines and does not result in any gain or
loss of value between one class and another.
(4) Annualized.
(5) Effective April 1, 2006, the investment advisor voluntarily agreed to waive
a portion of the management fee.
(6) The investment advisor voluntarily agreed to waive fees and absorb certain
operating expenses.
See Notes to Financial Statements.
- ------
47
High-Yield Bond - Financial Highlights
For a Share Outstanding Throughout the Period Indicated
- --------------------------------------------------------------------------------
C CLASS
- --------------------------------------------------------------------------------
2006(1)
- --------------------------------------------------------------------------------
PER-SHARE DATA
- --------------------------------------------------------------------------------
Net Asset Value, Beginning of Period $7.02
- --------------------------------------------------------------------------------
Income From Investment Operations
- -------------------------------------------------------
Net Investment Income 0.19
- -------------------------------------------------------
Net Realized and Unrealized Gain (Loss) (0.01)
- --------------------------------------------------------------------------------
Total From Investment Operations 0.18
- --------------------------------------------------------------------------------
Distributions
- -------------------------------------------------------
From Net Investment Income (0.19)
- --------------------------------------------------------------------------------
Net Asset Value, End of Period $7.01
================================================================================
TOTAL RETURN(2) 2.69%
- --------------------------------------------------------------------------------
RATIOS/SUPPLEMENTAL DATA
- --------------------------------------------------------------------------------
Ratio of Operating Expenses
to Average Net Assets 1.78%(3)(4)
- -------------------------------------------------------
Ratio of Operating Expenses
to Average Net Assets (Before Expense Waiver) 1.87%(3)
- -------------------------------------------------------
Ratio of Net Investment Income
to Average Net Assets 5.76%(3)(4)
- -------------------------------------------------------
Ratio of Net Investment Income
to Average Net Assets (Before Expense Waiver) 5.67%(3)
- -------------------------------------------------------
Portfolio Turnover Rate 36%
- -------------------------------------------------------
Net Assets, End of Period (in thousands) $71
- --------------------------------------------------------------------------------
(1) April 3, 2006 (commencement of sale) through September 30, 2006 (unaudited).
(2) Total return assumes reinvestment of net investment income and capital
gains distributions, if any, and does not reflect applicable sales charges.
Total returns for periods less than one year are not annualized. The total
return of the classes may not precisely reflect the class expense
differences because of the impact of calculating the net asset values to two
decimal places. If net asset values were calculated to three decimal places,
the total return differences would more closely reflect the class expense
differences. The calculation of net asset values to two decimal places is
made in accordance with SEC guidelines and does not result in any gain or
loss of value between one class and another.
(3) Annualized.
(4) Effective April 3, 2006, the investment advisor voluntarily agreed to waive
a portion of the management fee.
See Notes to Financial Statements.
- ------
48
High-Yield Bond - Financial Highlights
For a Share Outstanding Throughout the Period Indicated
- --------------------------------------------------------------------------------
R CLASS
- --------------------------------------------------------------------------------
2006(1)
- --------------------------------------------------------------------------------
PER-SHARE DATA
- --------------------------------------------------------------------------------
Net Asset Value, Beginning of Period $7.02
- --------------------------------------------------------------------------------
Income From Investment Operations
- -------------------------------------------------------
Net Investment Income 0.21
- -------------------------------------------------------
Net Realized and Unrealized Gain (Loss) (0.01)
- --------------------------------------------------------------------------------
Total From Investment Operations 0.20
- --------------------------------------------------------------------------------
Distributions
- -------------------------------------------------------
From Net Investment Income (0.21)
- --------------------------------------------------------------------------------
Net Asset Value, End of Period $7.01
================================================================================
TOTAL RETURN(2) 2.95%
- --------------------------------------------------------------------------------
RATIOS/SUPPLEMENTAL DATA
- --------------------------------------------------------------------------------
Ratio of Operating Expenses
to Average Net Assets 1.28%(3)(4)
- -------------------------------------------------------
Ratio of Operating Expenses
to Average Net Assets (Before Expense Waiver) 1.37%(3)
- -------------------------------------------------------
Ratio of Net Investment Income
to Average Net Assets 6.26%(3)(4)
- -------------------------------------------------------
Ratio of Net Investment Income
to Average Net Assets (Before Expense Waiver) 6.17%(3)
- -------------------------------------------------------
Portfolio Turnover Rate 36%
- -------------------------------------------------------
Net Assets, End of Period (in thousands) $26
- --------------------------------------------------------------------------------
(1) April 3, 2006 (commencement of sale) through September 30, 2006 (unaudited).
(2) Total return assumes reinvestment of net investment income and capital
gains distributions, if any. Total returns for periods less than one year
are not annualized. The total return of the classes may not precisely
reflect the class expense differences because of the impact of calculating
the net asset values to two decimal places. If net asset values were
calculated to three decimal places, the total return differences would more
closely reflect the class expense differences. The calculation of net asset
values to two decimal places is made in accordance with SEC guidelines and
does not result in any gain or loss of value between one class and another.
(3) Annualized.
(4) Effective April 3, 2006, the investment advisor voluntarily agreed to waive
a portion of the management fee.
See Notes to Financial Statements.
- ------
49
Share Class Information
Six classes of shares are authorized for sale by the funds: Investor Class,
Institutional Class, A Class, B Class, C Class and R Class. The total expense
ratio of Institutional Class shares is lower than that of Investor Class shares.
The total expense ratios of Advisor Class, A Class, B Class, C Class and R Class
shares are higher than that of Investor Class shares. The funds are available
for purchase only through financial intermediaries by investors who seek advice
from them. The funds are closed to other investors, but those with open accounts
may make additional investments and reinvest dividends and capital gains
distributions as long as such accounts remain open.
INVESTOR CLASS shares are available for purchase in two ways: 1) directly from
American Century without any commissions or other fees; or 2) through certain
financial intermediaries (such as banks, broker-dealers, insurance companies and
investment advisors), which may require payment of a transaction fee to the
financial intermediary.
INSTITUTIONAL CLASS shares are available to large investors such as endowments,
foundations, and retirement plans, and to financial intermediaries serving these
investors. This class recognizes the relatively lower cost of serving
institutional customers and others who invest at least $5 million ($3 million
for endowments and foundations) in an American Century fund or at least $10
million in multiple funds. In recognition of the larger investments and account
balances and comparatively lower transaction costs, the unified management fee
of Institutional Class shares is 0.20% less than the unified management fee of
Investor Class shares.
A CLASS shares are sold primarily through employer-sponsored retirement plans
and through institutions such as investment advisors, banks, broker-dealers, and
insurance companies. A Class shares are sold at their offering price, which is
net asset value plus an initial sales charge that ranges from 5.75% to 0.00% for
equity funds, depending on the amount invested. The initial sales charge is
deducted from the purchase amount before it is invested. A Class shares may be
subject to a contingent deferred sales charge (CDSC). There is no CDSC on shares
acquired through reinvestment of dividends or capital gains. The prospectus
contains information regarding reductions and waivers of sales charges for A
Class shares. The unified management fee for A Class shares is the same as for
Investor Class shares. A Class shares also are subject to a 0.25% annual Rule
12b-1 distribution and service fee.
B CLASS shares are sold primarily through employer-sponsored retirement plans
and through institutions such as investment advisors, banks, broker-dealers, and
insurance companies. B Class shares redeemed within six years of purchase are
subject to a CDSC that declines from 5.00% during the first year after purchase
to 0.00% after the sixth year. There is no CDSC on shares acquired through
reinvestment of dividends or capital gains. The unified management fee for B
Class shares is the same as for Investor Class shares. B Class shares also are
subject to a 1.00% annual Rule 12b-1 distribution and service fee. B Class
shares automatically convert to A Class shares (with lower expenses) eight years
after their purchase date.
(continued)
- ------
50
Share Class Information
C CLASS shares are sold primarily through employer-sponsored retirement plans
and through institutions such as investment advisors, banks, broker-dealers, and
insurance companies. C Class shares redeemed within 12 months of purchase are
subject to a CDSC of 1.00%. There is no CDSC on shares acquired through
reinvestment of dividends or capital gains. The unified management fee for C
Class shares is the same as for Investor Class shares. C Class shares also are
subject to a Rule 12b-1 distribution and service fee of 1.00%.
R CLASS shares are sold primarily through employer-sponsored retirement plans
and through institutions such as investment advisors, banks, broker-dealers, and
insurance companies. The unified management fee for R Class shares is the same
as for Investor Class shares. R Class shares are subject to a 0.50% annual Rule
12b-1 distribution and service fee.
All classes of shares represent a pro rata interest in the funds and generally
have the same rights and preferences.
- ------
51
Additional Information
RETIREMENT ACCOUNT INFORMATION
As required by law, any distributions you receive from an IRA or certain 403(b),
457 and qualified plans [those not eligible for rollover to an IRA or to another
qualified plan] are subject to federal income tax withholding, unless you elect
not to have withholding apply. Tax will be withheld on the total amount
withdrawn even though you may be receiving amounts that are not subject to
withholding, such as nondeductible contributions. In such case, excess amounts
of withholding could occur. You may adjust your withholding election so that a
greater or lesser amount will be withheld.
If you don't want us to withhold on this amount, you must notify us to not
withhold the federal income tax. Even if you plan to roll over the amount you
withdraw to another tax-deferred account, the withholding rate still applies to
the withdrawn amount unless we have received notice not to withhold federal
income tax prior to the withdrawal. You may notify us in writing or in certain
situations by telephone or through other electronic means. You have the right to
revoke your withholding election at any time and any election you make may
remain in effect until revoked by filing a new election.
Remember, even if you elect not to have income tax withheld, you are liable for
paying income tax on the taxable portion of your withdrawal. If you elect not to
have income tax withheld or you don't have enough income tax withheld, you may
be responsible for payment of estimated tax. You may incur penalties under the
estimated tax rules if your withholding and estimated tax payments are not
sufficient.
State tax will be withheld if, at the time of your distribution, your address is
within one of the mandatory withholding states and you have federal income tax
withheld. State taxes will be withheld from your distribution in accordance with
the respective state rules.
PROXY VOTING GUIDELINES
American Century Investment Management, Inc., the funds' investment advisor, is
responsible for exercising the voting rights associated with the securities
purchased and/or held by the funds. A description of the policies and procedures
the advisor uses in fulfilling this responsibility is available without charge,
upon request, by calling 1-800-345-2021. It is also available on American
Century's website at americancentury.com and on the Securities and Exchange
Commission's website at sec.gov. Information regarding how the investment
advisor voted proxies relating to portfolio securities during the most recent
12-month period ended June 30 is available on the "About Us" page at
americancentury.com. It is also available at sec.gov.
QUARTERLY PORTFOLIO DISCLOSURE
The funds file their complete schedule of portfolio holdings with the Securities
and Exchange Commission (SEC) for the first and third quarters of each fiscal
year on Form N-Q. The funds' Forms N-Q are available on the SEC's website at
sec.gov, and may be reviewed and copied at the SEC's Public Reference Room in
Washington, DC. Information on the operation of the Public Reference Room may be
obtained by calling 1-800-SEC-0330. The funds also make their complete schedule
of portfolio holdings for the most recent quarter of their fiscal year available
on their website at americancentury.com and, upon request, by calling
1-800-345-2021.
- ------
52
Index Definitions
The following indices are used to illustrate investment market, sector, or style
performance or to serve as fund performance comparisons. They are not investment
products available for purchase.
The CITIGROUP US BROAD INVESTMENT-GRADE (USBIG) BOND INDEX is a
market-capitalization-weighted index that includes fixed-rate Treasury,
government-sponsored, mortgage, asset-backed, and investment-grade issues with a
maturity of one year or longer.
The CITIGROUP US HIGH-YIELD MARKET INDEX captures the performance of
below-investment-grade debt issued by corporations domiciled in the United
States or Canada. This index includes cash-pay and deferred-interest securities
that are publicly placed, have a fixed coupon, and are nonconvertible.
The CITIGROUP HIGH-YIELD CASH-PAY INDEX is composed of those cash-pay securities
included in the Citigroup US High-Yield Market Index with remaining maturities
of at least one year.
The LEHMAN BROTHERS U.S. AGENCY INDEX is composed of those securities included
in the Lehman Brothers U.S. Aggregate Index that are public obligations of U.S.
government agencies, quasi-federal corporations, and corporate or foreign debt
guaranteed by the U.S. government.
The LEHMAN BROTHERS U.S. AGGREGATE INDEX represents securities that are taxable,
registered with the Securities and Exchange Commission, and U.S.
dollar-denominated. The index covers the U.S. investment-grade fixed-rate bond
market, with index components for government and corporate securities, mortgage
pass-through securities, and asset-backed securities.
The LEHMAN BROTHERS U.S. CORPORATE INDEX is composed of those securities
included in the Lehman Brothers U.S. Aggregate Index that are U.S.
dollar-denominated, investment-grade, fixed-rate, taxable securities sold by
industrial, utility and financial issuers.
The LEHMAN BROTHERS U.S. CORPORATE HIGH-YIELD INDEX covers the U.S.
dollar-denominated, non-investment grade, fixed-rate, taxable corporate bond
market.
The LEHMAN BROTHERS U.S. FIXED-RATE MORTGAGE-BACKED SECURITIES (MBS) INDEX is
the MBS Fixed-Rate component of the Lehman Brothers U.S. Aggregate Index. It
covers the mortgage-backed pass-through securities of the Government National
Mortgage Association (GNMA), the Federal National Mortgage Association (FNMA),
and the Federal Home Loan Mortgage Corporation (FHLMC).
The LEHMAN BROTHERS U.S. INTERMEDIATE HIGH YIELD MARKET INDEX covers the U.S.
dollar-denominated universe of fixed-rate, non-investment-grade debt with
remaining maturities of less than 10 years.
The LEHMAN BROTHERS U.S. TREASURY INDEX is composed of those securities included
in the Lehman Brothers U.S. Aggregate Index that are public obligations of the
U.S. Treasury with a remaining maturity of one year or more.
The LIPPER HIGH CURRENT YIELD BOND FUNDS INDEX is an equally-weighted index of,
typically, the 30 largest funds within the Lipper High Yield Funds category.
- ------
53
Notes
- ------
54
Notes
- ------
55
Notes
- ------
56
CONTACT US
AMERICANCENTURY.COM
AUTOMATED INFORMATION LINE:
1-800-345-8765
INVESTOR SERVICES REPRESENTATIVE:
1-800-345-2021 or 816-531-5575
INVESTORS USING ADVISORS:
1-800-378-9878
BUSINESS, NOT-FOR-PROFIT,
EMPLOYER-SPONSORED RETIREMENT PLANS:
1-800-345-3533
BANKS AND TRUST COMPANIES, BROKER-DEALERS,
FINANCIAL PROFESSIONALS, INSURANCE COMPANIES:
1-800-345-6488
TELECOMMUNICATIONS DEVICE FOR THE DEAF:
1-800-634-4113 or 816-444-3485
AMERICAN CENTURY INVESTMENT TRUST
INVESTMENT ADVISOR:
American Century Investment Management, Inc.
Kansas City, Missouri
THIS REPORT AND THE STATEMENTS IT CONTAINS ARE SUBMITTED FOR THE GENERAL
INFORMATION OF OUR SHAREHOLDERS. THE REPORT IS NOT AUTHORIZED FOR DISTRIBUTION
TO PROSPECTIVE INVESTORS UNLESS PRECEDED OR ACCOMPANIED BY AN EFFECTIVE
PROSPECTUS.
The American Century Investments logo, American Century
and American Century Investments are service marks
of American Century Proprietary Holdings, Inc.
0611
SH-SAN-51672N
American Century Investment Services, Inc., Distributor
(c)2006 American Century Proprietary Holdings, Inc. All rights reserved.
[front cover]
American Century Investments
Semiannual Report
September 30, 2006
[photo of autumn]
NT Diversified Bond Fund
[american century investments logo and text logo]
Our Message to You
[photo of James E. Stowers III and James E. Stowers, Jr.]
/s/James E. Stowers, Jr.
James E. Stowers, Jr.
FOUNDER
AMERICAN CENTURY COMPANIES, INC.
/s/James E. Stowers III
James E. Stowers III
CHAIRMAN OF THE BOARD
AMERICAN CENTURY COMPANIES, INC.
We are pleased to provide you with the semiannual report for the American
Century NT Diversified Bond Fund from its inception May 12, 2006 through
September 30, 2006. We hope you find this information helpful in monitoring your
investment. Another useful resource we offer is our website,
americancentury.com, where we post quarterly portfolio commentaries, the views
of senior investment officers and analysts, and other communications about
investments, portfolio strategy, personal finance, and the markets.
In its most recent rankings, Dalbar -- which issues customer satisfaction
ratings and rankings based on website functionality -- ranked
americancentury.com fourth out of the sites provided by the top 25 fund
companies that it believes lead the industry in web-based technology. Our
website earned an "Excellent" rating, Dalbar's highest designation.
For most of 2006, our website has linked visitors to information explaining our
strategic collaboration with Lance Armstrong and the Lance Armstrong Foundation
(LAF). This campaign, featuring Lance, is designed to encourage investors to
take a more active role in planning their financial futures and make every
investment decision count. To learn more about the collaboration and the LAF,
please visit americancentury.com or www.lanceface.com on the Web and click on
the links to related sites.
With the approach of year end and the 2006 tax season, you can also find out
more about December fund distributions and tax information via a link from our
website. We've posted December distribution estimates for over 50 funds, answers
to frequent distribution questions, and online descriptions of all of the tax
information we provide to investors.
If you haven't visited americancentury.com yet, we encourage you to do so...it's
there to serve you. And so are we. As always, we deeply appreciate your
commitment to American Century Investments.
Table of Contents
Market Perspective. . . . . . . . . . . . . . . . . . . . . . . . . . . . . 2
U.S. Fixed-Income Total Returns . . . . . . . . . . . . . . . . . . . . 2
NT DIVERSIFIED BOND
Performance . . . . . . . . . . . . . . . . . . . . . . . . . . . . . . . . 3
Portfolio Commentary. . . . . . . . . . . . . . . . . . . . . . . . . . . . 4
Portfolio at a Glance . . . . . . . . . . . . . . . . . . . . . . . . . 4
Yields . . . . . . . . . . . . . . . . . . . . . . . . . . . . . . . . . 4
Types of Investments in Portfolio . . . . . . . . . . . . . . . . . . . 5
Portfolio Composition by Credit Rating . . . . . . . . . . . . . . . . . 5
Shareholder Fee Example . . . . . . . . . . . . . . . . . . . . . . . . . . 6
Schedule of Investments . . . . . . . . . . . . . . . . . . . . . . . . . . 8
FINANCIAL STATEMENTS
Statement of Assets and Liabilities . . . . . . . . . . . . . . . . . . . .16
Statement of Operations . . . . . . . . . . . . . . . . . . . . . . . . . .17
Statement of Changes in Net Assets. . . . . . . . . . . . . . . . . . . . .18
Notes to Financial Statements . . . . . . . . . . . . . . . . . . . . . . .19
Financial Highlights. . . . . . . . . . . . . . . . . . . . . . . . . . . .22
OTHER INFORMATION
Additional Information. . . . . . . . . . . . . . . . . . . . . . . . . . .23
Index Definitions . . . . . . . . . . . . . . . . . . . . . . . . . . . . .25
The opinions expressed in the Market Perspective and the Portfolio Commentary
reflect those of the portfolio management team as of the date of the report, and
do not necessarily represent the opinions of American Century or any other
person in the American Century organization. Any such opinions are subject to
change at any time based upon market or other conditions and American Century
disclaims any responsibility to update such opinions. These opinions may not be
relied upon as investment advice and, because investment decisions made by
American Century funds are based on numerous factors, may not be relied upon as
an indication of trading intent on behalf of any American Century fund. Security
examples are used for representational purposes only and are not intended as
recommendations to purchase or sell securities. Performance information for
comparative indices and securities is provided to American Century by third
party vendors. To the best of American Century's knowledge, such information is
accurate at the time of printing.
Market Perspective
[photo of David MacEwen]
BY DAVID MACEWEN, CHIEF INVESTMENT OFFICER, FIXED INCOME
A TALE OF TWO QUARTERS
The second and third quarters of 2006 were very different in terms of inflation
and interest rate expectations and market performance. In the second quarter, as
core inflation rates remained above the Federal Reserve's 1-2% "comfort zone"
and threatened to go higher, investors feared the Fed would keep raising
interest rates and tip the economy into recession. Uncertainty about how far the
Fed would go, and how successful it would be in containing inflation, created a
defensive attitude in financial markets that resulted in disappointing returns
for broad stock and bond indices.
A FED PAUSE REFRESHED THE MARKETS
But in the third quarter, a 15% drop in oil prices helped take the heat off
inflation pressures, and cut business and consumer costs. Weakness in the
housing market--though hard on many homeowners--turned into a positive factor
for the markets. As home sales and prices declined, the Fed stopped its interest
rate tightening campaign, stepping back to assess the economy's reaction to
previous rate hikes. This combination of falling energy prices and relief from
rising interest rates helped broad U.S. stock and bond markets rebound from
second-quarter losses to post some of their biggest quarterly gains this decade.
LONG-DURATION AND CORPORATE SECURITIES OUTPERFORMED
The bond market especially welcomed a gloomy housing-market forecast,
speculating that it would reduce economic growth, inflation, and interest rates.
This rekindled demand for longer-term fixed-income securities. As a result, the
Treasury yield curve fell for the reporting period and "inverted", as the
two-year yield (4.69%) remained higher than the 10-year yield (4.63%), and both
fell well below the Fed's 5.25% overnight interest rate target. Mirroring the
stock market's rally, the corporate sectors led the broad taxable market.
U.S. FIXED-INCOME TOTAL RETURNS*
From May 12, 2006 (fund inception) to September 30, 2006
- --------------------------------------------------------------------------------
TREASURY SECURITIES
- --------------------------------------------------------------------------------
3-month bill 1.97%
- --------------------------------------------------------------------------------
2-year note 2.32%
- --------------------------------------------------------------------------------
5-year note 3.82%
- --------------------------------------------------------------------------------
10-year note 6.11%
- --------------------------------------------------------------------------------
30-year bond 10.68%
- --------------------------------------------------------------------------------
LEHMAN BROTHERS U.S. BOND MARKET INDICES
- --------------------------------------------------------------------------------
Corporate Investment-Grade 5.06%
- --------------------------------------------------------------------------------
Treasury 4.56%
- --------------------------------------------------------------------------------
Aggregate (multi-sector) 4.44%
- --------------------------------------------------------------------------------
Fixed-Rate Mortgage-Backed 4.21%
- --------------------------------------------------------------------------------
Agency 3.75%
- --------------------------------------------------------------------------------
*Total returns for periods less than one year are not annualized.
- ------
2
NT Diversified Bond - Performance
TOTAL RETURNS AS OF SEPTEMBER 30, 2006
- --------------------------------------------------------------------------------
SINCE INCEPTION
INCEPTION(1) DATE
- --------------------------------------------------------------------------------
INSTITUTIONAL CLASS 4.20% 5/12/06
- --------------------------------------------------------------------------------
LEHMAN BROTHERS U.S. AGGREGATE INDEX(2) 4.03%(3) --
- --------------------------------------------------------------------------------
CITIGROUP US BROAD INVESTMENT-GRADE BOND INDEX 4.07%(3) --
- --------------------------------------------------------------------------------
(1) Total returns for periods less than one year are not annualized.
(2) Data provided by Lipper Inc. -- A Reuters Company. (c) 2006 Reuters. All
rights reserved. Any copying, republication or redistribution of Lipper
content, including by caching, framing or similar means, is expressly
prohibited without the prior written consent of Lipper. Lipper shall not be
liable for any errors or delays in the content, or for any actions taken in
reliance thereon.
The data contained herein has been obtained from company reports, financial
reporting services, periodicals and other resources believed to be reliable.
Although carefully verified, data on compilations is not guaranteed by
Lipper and may be incomplete. No offer or solicitations to buy or sell any
of the securities herein is being made by Lipper.
(3) Since 5/31/06, the date nearest the Institutional Class's inception for
which data are available.
Data presented reflect past performance. Past performance is no guarantee of
future results. Current performance may be higher or lower than the performance
shown. Investment return and principal value will fluctuate, and redemption
value may be more or less than original cost. To obtain performance data current
to the most recent month end, please call 1-800-345-2021 or visit
americancentury.com. As interest rates rise, bond values will decline.
Data assumes reinvestment of dividends and capital gains, and none of the charts
reflect the deduction of taxes that a shareholder would pay on fund
distributions or the redemption of fund shares. Returns for the indices are
provided for comparison. The fund's total returns include operating expenses
(such as transaction costs and management fees) that reduce returns, while the
total returns of the indices do not.
- ------
3
NT Diversified Bond - Portfolio Commentary
PORTFOLIO MANAGERS: DAVID MACEWEN, BOB GAHAGAN, JIM KEEGAN, JEFF HOUSTON, HANDO
AGUILAR, BRIAN HOWELL, JOHN WALSH AND DAN SHIFFMAN
PERFORMANCE SUMMARY
NT Diversified Bond returned 4.20%* from its inception on May 12, 2006 through
September 30, 2006. By comparison, two broad indices representing the taxable
investment-grade U.S. bond market--the Citigroup US Broad Investment-Grade Bond
Index (BIG), and the Lehman Brothers U.S. Aggregate Index--returned 4.07% and
4.03%, respectively, from May 31, 2006, to September 30, 2006 (May 31 is the
date closest to the fund's inception for which index data are available). The
portfolio's results reflected operating expenses, while the indices returns did
not.
NT Diversified Bond is one of nine new NT tracker funds available exclusively in
LIVESTRONG(reg.tm) Portfolios from American Century Investments. NT is an acronym
for "No Tobacco." American Century Investments introduced LIVESTRONG Portfolios
on May 12, 2006, as part of a strategic collaboration with Lance Armstrong and
the Lance Armstrong Foundation (LAF).**
Though the Fed's interest rate pause and one of the strongest quarterly bond
rallies this decade boosted all sectors of the taxable investment-grade U.S.
bond market in the third quarter of 2006, they helped some sectors more than
others. Relative performance between the sectors, sector weighting, and maturity
and duration positioning helped determine the returns of the fund and the
comparative indices.
SECTOR COMPOSITION OF THE PORTFOLIO AND THE INDICES
The market represented by the Citigroup BIG and the Lehman Aggregate consists
primarily of three bond sectors: fixed-rate mortgage-backed securities (MBS),
Treasury securities, and corporate bonds. MBS are part of a broader
"securitized" sector that includes asset-backed securities (ABS), which are
backed by payments from credit card debt, auto loans, and home-equity lines of
credit; and commercial mortgage-backed securities (CMBS). The securitized sector
represents over 40% of the taxable investment-grade market. Treasury and
corporate securities, by contrast, each represent about 20-25% of the market,
depending on your source and how you define the sectors.
NT Diversified Bond's market exposure is based on the Citigroup BIG. Since the
fund's inception, we've maintained an overweight position in the securitized
sector, which has higher yields and less volatility than the Treasury sector,
and higher credit quality than the corporate sector.
PORTFOLIO AT A GLANCE
- --------------------------------------------------------------------------------
AS OF
9/30/06
- --------------------------------------------------------------------------------
Weighted Average Maturity 4.7 years
- --------------------------------------------------------------------------------
Average Duration (effective) 4.7 years
- --------------------------------------------------------------------------------
YIELDS AS OF SEPTEMBER 30, 2006
- --------------------------------------------------------------------------------
30-DAY SEC YIELD
- --------------------------------------------------------------------------------
Institutional Class 4.95%
- --------------------------------------------------------------------------------
*Total returns for periods less than one year are not annualized.
**American Century Investment Services, Inc., has entered
into an agreement with the Lance Armstrong Foundation for
rights to use the LIVESTRONG name. LIVESTRONG is a trademark
of the Lance Armstrong Foundation. For more information
about the foundation, visit www.livestrong.org. (continued)
- ------
4
NT Diversified Bond - Portfolio Commentary
PORTFOLIO POSITIONING
Our investment approach uses a consistent, repeatable framework that seeks to
identify the best relative value among the bond sectors discussed on the
previous page. We apply a multi-step process that includes yield curve/duration
positioning, security selection, portfolio construction, and attribution
analysis. The weighted average maturity of the portfolio must be 3.5 years or
longer.
During the period, longer-duration positions were rewarded. When bonds rallied
in the third quarter of the year, NT Diversified Bond's duration was slightly
longer than neutral, giving performance a boost. Our strategy to overweight
"spread" products (non-Treasury securities such as corporates, MBS, ABS, and
CMBS) also benefited the fund since these sectors outperformed Treasurys during
the period.
Within the fund's spread product overweight, we maintained an underweight
corporate position to protect the fund from so-called event and "idiosyncratic"
risks (such as leveraged buyouts, share buybacks and special dividends). Though
corporates performed well, this underweight position turned out to be a plus for
the fund, since we reallocated those assets into CMBS, which offered the highest
excess returns in the taxable bond market. We believe a corporate underweight
position is warranted, given changing economic conditions, the peak in the
credit cycle, and historically tight valuations.
PORTFOLIO OBJECTIVE AND STRATEGIES
NT Diversified Bond seeks high current income. Investors can benefit from
exposure to a broad spectrum of bond sectors and from the discipline's
historically negative correlation with the major U.S. stock indices. Because of
its high overall credit quality and broad bond market exposure, NT Diversified
Bond has the potential to perform well during periods of economic weakness and
declining interest rates. We seek to fulfill the fund's investment objectives by
investing in high- and medium-grade debt securities of all maturity ranges. We
work to diversify the fund broadly across all bond sectors.
TYPES OF INVESTMENTS IN PORTFOLIO
- --------------------------------------------------------------------------------
% OF FUND
INVESTMENTS
AS OF
9/30/06
- --------------------------------------------------------------------------------
Mortgage-Backed Securities 26.0%
- --------------------------------------------------------------------------------
U.S. Government Agency Securities 15.8%
- --------------------------------------------------------------------------------
Corporate Bonds 13.4%
- --------------------------------------------------------------------------------
CMOs 13.3%
- --------------------------------------------------------------------------------
U.S. Treasury Securities 11.4%
- --------------------------------------------------------------------------------
Asset-Backed Securities 9.0%
- --------------------------------------------------------------------------------
Municipal Securities 1.4%
- --------------------------------------------------------------------------------
Sovereign Governments & Agencies 0.4%
- --------------------------------------------------------------------------------
Temporary Cash Investments 9.3%
- --------------------------------------------------------------------------------
PORTFOLIO COMPOSITION BY CREDIT RATING
- --------------------------------------------------------------------------------
% OF FUND
INVESTMENTS
AS OF
9/30/06
- --------------------------------------------------------------------------------
AAA 83%
- --------------------------------------------------------------------------------
AA 3%
- --------------------------------------------------------------------------------
A 6%
- --------------------------------------------------------------------------------
BBB 8%
- --------------------------------------------------------------------------------
- ------
5
Shareholder Fee Example (Unaudited)
Fund shareholders may incur two types of costs: (1) transaction costs, including
sales charges (loads) on purchase payments and redemption/exchange fees; and (2)
ongoing costs, including management fees; distribution and service (12b-1) fees;
and other fund expenses. This example is intended to help you understand your
ongoing costs (in dollars) of investing in your fund and to compare these costs
with the ongoing cost of investing in other mutual funds.
The example is based on an investment of $1,000 made at the beginning of the
period and held for the entire period from April 1, 2006 to September 30, 2006
(except as noted).
ACTUAL EXPENSES
The table provides information about actual account values and actual expenses
for each class. You may use the information, together with the amount you
invested, to estimate the expenses that you paid over the period. First,
identify the share class you own. Then simply divide your account value by
$1,000 (for example, an $8,600 account value divided by $1,000 = 8.6), then
multiply the result by the number under the heading "Expenses Paid During
Period" to estimate the expenses you paid on your account during this period.
If you hold Investor Class shares of any American Century fund, or Institutional
Class shares of the American Century Diversified Bond Fund, in an American
Century account (i.e., not a financial intermediary or retirement plan account),
American Century may charge you a $12.50 semiannual account maintenance fee if
the value of those shares is less than $10,000. We will redeem shares
automatically in one of your accounts to pay the $12.50 fee. In determining your
total eligible investment amount, we will include your investments in all
PERSONAL ACCOUNTS (including American Century Brokerage accounts) registered
under your Social Security number. PERSONAL ACCOUNTS include individual
accounts, joint accounts, UGMA/UTMA accounts, personal trusts, Coverdell
Education Savings Accounts and IRAs (including traditional, Roth, Rollover,
SEP-, SARSEP- and SIMPLE-IRAs), and certain other retirement accounts. If you
have only business, business retirement, employer-sponsored or American Century
Brokerage accounts, you are currently not subject to this fee. We will not
charge the fee as long as you choose to manage your accounts exclusively online.
If you are subject to the Account Maintenance Fee, your account value could be
reduced by the fee amount.
HYPOTHETICAL EXAMPLE FOR COMPARISON PURPOSES
The table also provides information about hypothetical account values and
hypothetical expenses based on the actual expense ratio of each class of your
fund and an assumed rate of return of 5% per year before expenses, which is not
the actual return of a fund's share class. The hypothetical account values and
expenses may not be used to estimate the actual ending account balance or
expenses you paid for the period. You may use this information to compare the
ongoing costs of investing in your fund and other funds. To do so, compare this
5% hypothetical example with the 5% hypothetical examples that appear in the
shareholder reports of the other funds.
(continued)
- ------
6
Shareholder Fee Example (Unaudited)
Please note that the expenses shown in the table are meant to highlight your
ongoing costs only and do not reflect any transactional costs, such as sales
charges (loads) or redemption/exchange fees. Therefore, the table is useful in
comparing ongoing costs only, and will not help you determine the relative total
costs of owning different funds. In addition, if these transactional costs were
included, your costs would have been higher.
- -----------------------------------------------------------------------------------------------
EXPENSES PAID
BEGINNING ENDING DURING PERIOD(1) ANNUALIZED
ACCOUNT VALUE ACCOUNT VALUE 4/1/06 - EXPENSE
4/1/06 9/30/06 9/30/06 RATIO(1)
- -----------------------------------------------------------------------------------------------
NT DIVERSIFIED BOND -- INSTITUTIONAL CLASS SHAREHOLDER FEE EXAMPLE
- -----------------------------------------------------------------------------------------------
Actual $1,000 $1,042.00(2) $1.66(3) 0.42%
- -----------------------------------------------------------------------------------------------
Hypothetical $1,000 $1,022.96(4) $2.13(4) 0.42%
- -----------------------------------------------------------------------------------------------
(1) Expenses are equal to the class's annualized expense ratio listed in the
table above, multiplied by the average account value over the period,
multiplied by 183, the number of days in the most recent fiscal half-year,
divided by 365, to reflect the one-half year period.
(2) Ending account value based on actual return from May 12, 2006 (fund
inception) through September 30, 2006.
(3) Expenses are equal to the class's annualized expense ratio listed in the
table above, multiplied by the average account value over the period,
multiplied by 141, the number of days in the period from May 12, 2006 (fund
inception) through September 30, 2006, divided by 365, to reflect the
period. Had the class been available for the full period, the expenses paid
during the period would have been higher.
(4) Ending account value and expenses paid during period assumes the class had
been available throughout the entire period and are calculated using the
class's annualized expense ratio listed in the table above.
- ------
7
NT Diversified Bond - Schedule of Investments
SEPTEMBER 30, 2006 (UNAUDITED)
Principal Amount Value
- --------------------------------------------------------------------------------
U.S. GOVERNMENT AGENCY
MORTGAGE-BACKED SECURITIES(1) -- 31.3%
- --------------------------------------------------------------------------------
$ 2,514 FHLMC, 6.50%, 2/1/09(2) $ 2,537
- --------------------------------------------------------------------------------
3,829 FHLMC, 6.50%, 12/1/12(2) 3,897
- --------------------------------------------------------------------------------
28,429 FHLMC, 6.00%, 1/1/13(2) 28,677
- --------------------------------------------------------------------------------
5,179 FHLMC, 7.00%, 11/1/13(2) 5,318
- --------------------------------------------------------------------------------
8,431 FHLMC, 7.00%, 6/1/14(2) 8,656
- --------------------------------------------------------------------------------
26,888 FHLMC, 6.50%, 6/1/16(2) 27,467
- --------------------------------------------------------------------------------
16,264 FHLMC, 6.50%, 6/1/16(2) 16,614
- --------------------------------------------------------------------------------
340,823 FHLMC, 5.00%, 11/1/17(2) 336,046
- --------------------------------------------------------------------------------
563,647 FHLMC, 4.50%, 1/1/19(2) 544,752
- --------------------------------------------------------------------------------
2,023,253 FHLMC, 5.00%, 1/1/21(2) 1,988,866
- --------------------------------------------------------------------------------
2,968 FHLMC, 7.00%, 9/1/27(2) 3,065
- --------------------------------------------------------------------------------
4,741 FHLMC, 6.50%, 1/1/28(2) 4,861
- --------------------------------------------------------------------------------
754 FHLMC, 7.00%, 2/1/28(2) 779
- --------------------------------------------------------------------------------
27,723 FHLMC, 6.50%, 3/1/29(2) 28,425
- --------------------------------------------------------------------------------
17,972 FHLMC, 6.50%, 6/1/29(2) 18,424
- --------------------------------------------------------------------------------
2,911 FHLMC, 7.00%, 8/1/29(2) 3,003
- --------------------------------------------------------------------------------
8,070 FHLMC, 7.50%, 8/1/29(2) 8,391
- --------------------------------------------------------------------------------
330 FHLMC, 6.50%, 5/1/31(2) 337
- --------------------------------------------------------------------------------
20,167 FHLMC, 6.50%, 5/1/31(2) 20,632
- --------------------------------------------------------------------------------
570 FHLMC, 6.50%, 6/1/31(2) 583
- --------------------------------------------------------------------------------
1,354 FHLMC, 6.50%, 6/1/31(2) 1,385
- --------------------------------------------------------------------------------
9,569 FHLMC, 6.50%, 6/1/31(2) 9,790
- --------------------------------------------------------------------------------
456 FHLMC, 6.50%, 6/1/31(2) 467
- --------------------------------------------------------------------------------
331,006 FHLMC, 5.50%, 12/1/33(2) 327,474
- --------------------------------------------------------------------------------
1,354,000 FNMA, 5.00%,
settlement date 10/12/06(3) 1,301,533
- --------------------------------------------------------------------------------
6,236,000 FNMA, 5.50%,
settlement date 10/12/06(3) 6,144,407
- --------------------------------------------------------------------------------
3,984,000 FNMA, 6.00%,
settlement date 10/12/06(3) 4,002,677
- --------------------------------------------------------------------------------
3,868,000 FNMA, 6.50%,
settlement date 10/12/06(3) 3,939,318
- --------------------------------------------------------------------------------
1,573,000 FNMA, 5.50%,
settlement date 10/17/06(3) 1,572,509
- --------------------------------------------------------------------------------
6,834 FNMA, 6.00%, 2/1/09(2) 6,859
- --------------------------------------------------------------------------------
3,327 FNMA, 6.00%, 5/1/13(2) 3,366
- --------------------------------------------------------------------------------
2,963 FNMA, 6.00%, 5/1/13(2) 3,000
- --------------------------------------------------------------------------------
10,966 FNMA, 6.00%, 7/1/13(2) 11,093
- --------------------------------------------------------------------------------
14,495 FNMA, 6.00%, 12/1/13(2) 14,663
- --------------------------------------------------------------------------------
12,996 FNMA, 6.00%, 1/1/14(2) 13,147
- --------------------------------------------------------------------------------
22,431 FNMA, 6.00%, 2/1/14(2) 22,691
- --------------------------------------------------------------------------------
23,356 FNMA, 6.00%, 4/1/14(2) 23,627
- --------------------------------------------------------------------------------
86,012 FNMA, 5.50%, 12/1/16(2) 86,284
- --------------------------------------------------------------------------------
163,592 FNMA, 5.50%, 12/1/16(2) 164,109
- --------------------------------------------------------------------------------
561,870 FNMA, 4.50%, 5/1/19 543,047
- --------------------------------------------------------------------------------
Principal Amount Value
- --------------------------------------------------------------------------------
$ 14,748 FNMA, 6.50%, 1/1/26(2) $ 15,114
- --------------------------------------------------------------------------------
1,961 FNMA, 7.00%, 12/1/27(2) 2,025
- --------------------------------------------------------------------------------
767 FNMA, 6.50%, 1/1/28(2) 786
- --------------------------------------------------------------------------------
863 FNMA, 7.00%, 1/1/28(2) 891
- --------------------------------------------------------------------------------
4,058 FNMA, 7.50%, 4/1/28(2) 4,215
- --------------------------------------------------------------------------------
13,577 FNMA, 7.00%, 5/1/28(2) 14,016
- --------------------------------------------------------------------------------
882 FNMA, 7.00%, 6/1/28(2) 911
- --------------------------------------------------------------------------------
3,709 FNMA, 6.50%, 1/1/29(2) 3,801
- --------------------------------------------------------------------------------
9,373 FNMA, 6.50%, 4/1/29(2) 9,606
- --------------------------------------------------------------------------------
5,574 FNMA, 7.00%, 7/1/29(2) 5,754
- --------------------------------------------------------------------------------
5,165 FNMA, 7.00%, 7/1/29(2) 5,328
- --------------------------------------------------------------------------------
13,457 FNMA, 7.50%, 7/1/29(2) 13,970
- --------------------------------------------------------------------------------
3,820 FNMA, 7.00%, 5/1/30(2) 3,937
- --------------------------------------------------------------------------------
17,225 FNMA, 7.50%, 8/1/30(2) 17,840
- --------------------------------------------------------------------------------
8,029 FNMA, 7.50%, 9/1/30(2) 8,316
- --------------------------------------------------------------------------------
40,514 FNMA, 7.00%, 9/1/31(2) 41,723
- --------------------------------------------------------------------------------
20,655 FNMA, 6.50%, 1/1/32(2) 21,125
- --------------------------------------------------------------------------------
202,330 FNMA, 7.00%, 6/1/32(2) 208,308
- --------------------------------------------------------------------------------
84,003 FNMA, 6.50%, 8/1/32(2) 85,915
- --------------------------------------------------------------------------------
439,363 FNMA, 5.50%, 6/1/33(2) 434,219
- --------------------------------------------------------------------------------
2,196,791 FNMA, 5.50%, 7/1/33(2) 2,171,073
- --------------------------------------------------------------------------------
363,065 FNMA, 5.50%, 8/1/33(2) 358,813
- --------------------------------------------------------------------------------
479,682 FNMA, 5.50%, 9/1/33(2) 474,066
- --------------------------------------------------------------------------------
1,177,687 FNMA, 5.00%, 11/1/33 1,135,997
- --------------------------------------------------------------------------------
963,100 FNMA, 5.50%, 1/1/34(2) 951,823
- --------------------------------------------------------------------------------
5,329 GNMA, 7.50%, 8/20/17(2) 5,486
- --------------------------------------------------------------------------------
9,440 GNMA, 7.00%, 11/15/22(2) 9,744
- --------------------------------------------------------------------------------
7,155 GNMA, 8.75%, 3/15/25(2) 7,697
- --------------------------------------------------------------------------------
1,959 GNMA, 7.00%, 4/20/26(2) 2,019
- --------------------------------------------------------------------------------
3,952 GNMA, 7.50%, 8/15/26(2) 4,122
- --------------------------------------------------------------------------------
1,909 GNMA, 8.00%, 8/15/26(2) 2,024
- --------------------------------------------------------------------------------
278 GNMA, 7.50%, 4/15/27(2) 290
- --------------------------------------------------------------------------------
4,435 GNMA, 7.50%, 5/15/27(2) 4,628
- --------------------------------------------------------------------------------
2,663 GNMA, 8.00%, 6/15/27(2) 2,823
- --------------------------------------------------------------------------------
275 GNMA, 7.50%, 11/15/27(2) 287
- --------------------------------------------------------------------------------
1,795 GNMA, 7.00%, 2/15/28(2) 1,854
- --------------------------------------------------------------------------------
3,272 GNMA, 7.50%, 2/15/28(2) 3,410
- --------------------------------------------------------------------------------
2,693 GNMA, 6.50%, 3/15/28(2) 2,771
- --------------------------------------------------------------------------------
3,302 GNMA, 7.00%, 4/15/28(2) 3,411
- --------------------------------------------------------------------------------
1,632 GNMA, 6.50%, 5/15/28(2) 1,680
- --------------------------------------------------------------------------------
8,185 GNMA, 6.50%, 5/15/28(2) 8,422
- --------------------------------------------------------------------------------
2,171 GNMA, 7.00%, 12/15/28(2) 2,243
- --------------------------------------------------------------------------------
737 GNMA, 8.00%, 12/15/29(2) 781
- --------------------------------------------------------------------------------
20,469 GNMA, 7.00%, 5/15/31(2) 21,148
- --------------------------------------------------------------------------------
TOTAL U.S. GOVERNMENT AGENCY
MORTGAGE-BACKED SECURITIES
(Cost $27,073,951) 27,317,188
- --------------------------------------------------------------------------------
See Notes to Financial Statements. (continued)
- ------
8
NT Diversified Bond - Schedule of Investments
SEPTEMBER 30, 2006 (UNAUDITED)
Principal Amount Value
- --------------------------------------------------------------------------------
U.S. GOVERNMENT
AGENCY SECURITIES -- 19.0%
- --------------------------------------------------------------------------------
$ 2,020,000 FHLB, 4.25%, 4/16/07(2) $ 2,009,108
- --------------------------------------------------------------------------------
750,000 FHLB, 4.875%, 8/22/07(2) 748,173
- --------------------------------------------------------------------------------
912,000 FHLB, 4.625%, 2/1/08(2) 907,289
- --------------------------------------------------------------------------------
1,055,000 FHLB, 5.125%, 9/29/10(2) 1,060,918
- --------------------------------------------------------------------------------
2,400,000 FHLMC, 5.25%, 7/18/11(2) 2,436,247
- --------------------------------------------------------------------------------
639,000 FHLMC, 5.50%, 3/28/16(2) 644,882
- --------------------------------------------------------------------------------
2,115,000 FHLMC, 5.30%, 5/12/20(2) 2,045,584
- --------------------------------------------------------------------------------
3,027,000 FNMA, 4.75%, 8/3/07(2) 3,016,489
- --------------------------------------------------------------------------------
1,098,000 FNMA, 5.00%, 9/14/07(2) 1,096,461
- --------------------------------------------------------------------------------
1,907,000 FNMA, 5.80%, 2/9/26(2) 1,910,385
- --------------------------------------------------------------------------------
597,000 FNMA, 6.625%, 11/15/30(2) 719,189
- --------------------------------------------------------------------------------
TOTAL U.S. GOVERNMENT
AGENCY SECURITIES
(Cost $16,304,829) 16,594,725
- --------------------------------------------------------------------------------
CORPORATE BONDS -- 16.1%
AEROSPACE & DEFENSE -- 0.6%
- --------------------------------------------------------------------------------
172,000 Honeywell International Inc.,
5.70%, 3/15/36(2) 173,344
- --------------------------------------------------------------------------------
29,000 Lockheed Martin Corp., 6.19%,
9/1/36 (Acquired 8/30/06,
Cost $29,204)(4) 30,495
- --------------------------------------------------------------------------------
197,000 United Technologies Corp.,
4.375%, 5/1/10(2) 192,556
- --------------------------------------------------------------------------------
130,000 United Technologies Corp.,
6.05%, 6/1/36(2) 138,369
- --------------------------------------------------------------------------------
534,764
- --------------------------------------------------------------------------------
BEVERAGES -- 0.7%
- --------------------------------------------------------------------------------
190,000 Diageo Capital plc,
5.875%, 9/30/36(2) 186,581
- --------------------------------------------------------------------------------
157,000 Miller Brewing Co., 4.25%,
8/15/08 (Acquired 5/12/06,
Cost $152,719)(4) 153,981
- --------------------------------------------------------------------------------
240,000 SABMiller plc, 6.20%,
7/1/11 (Acquired 6/27/06,
Cost $239,830)(4) 246,553
- --------------------------------------------------------------------------------
587,115
- --------------------------------------------------------------------------------
BIOTECHNOLOGY -- 0.2%
- --------------------------------------------------------------------------------
171,000 Genentech, Inc.,
4.75%, 7/15/15 164,510
- --------------------------------------------------------------------------------
BUILDING PRODUCTS -- 0.2%
- --------------------------------------------------------------------------------
190,000 Masco Corp., 6.125%, 10/3/16 189,019
- --------------------------------------------------------------------------------
CAPITAL MARKETS -- 1.1%
- --------------------------------------------------------------------------------
183,000 Lehman Brothers Holdings Inc.,
5.00%, 1/14/11(2) 181,391
- --------------------------------------------------------------------------------
124,000 Merrill Lynch & Co., Inc.,
4.25%, 2/8/10(2) 120,538
- --------------------------------------------------------------------------------
227,000 Merrill Lynch & Co., Inc.,
4.79%, 8/4/10(2) 223,725
- --------------------------------------------------------------------------------
Principal Amount Value
- --------------------------------------------------------------------------------
$ 200,000 Merrill Lynch & Co., Inc.,
6.05%, 5/16/16(2) $ 207,190
- --------------------------------------------------------------------------------
105,000 Morgan Stanley,
4.00%, 1/15/10(2) 101,405
- --------------------------------------------------------------------------------
94,000 Morgan Stanley,
4.25%, 5/15/10(2) 90,975
- --------------------------------------------------------------------------------
68,000 Morgan Stanley,
5.05%, 1/21/11(2) 67,447
- --------------------------------------------------------------------------------
992,671
- --------------------------------------------------------------------------------
CHEMICALS(5)
- --------------------------------------------------------------------------------
29,000 Dow Chemical Co. (The),
7.375%, 11/1/29(2) 33,965
- --------------------------------------------------------------------------------
COMMERCIAL BANKS -- 1.7%
- --------------------------------------------------------------------------------
29,000 Abbey National plc,
7.95%, 10/26/29(2) 36,607
- --------------------------------------------------------------------------------
309,000 Bank of America Corp.,
4.375%, 12/1/10(2) 300,571
- --------------------------------------------------------------------------------
180,000 Capital One Financial Corp.,
5.70%, 9/15/11 181,461
- --------------------------------------------------------------------------------
128,000 PNC Bank N.A.,
4.875%, 9/21/17(2) 121,726
- --------------------------------------------------------------------------------
123,000 PNC Funding Corp.,
5.125%, 12/14/10(2) 122,752
- --------------------------------------------------------------------------------
129,000 SouthTrust Corp.,
5.80%, 6/15/14(2) 131,530
- --------------------------------------------------------------------------------
139,000 Wachovia Bank N.A.,
4.80%, 11/1/14(2) 133,550
- --------------------------------------------------------------------------------
218,000 Wachovia Bank N.A.,
4.875%, 2/1/15(2) 210,320
- --------------------------------------------------------------------------------
193,000 Wells Fargo & Co.,
4.625%, 8/9/10(2) 190,141
- --------------------------------------------------------------------------------
1,428,658
- --------------------------------------------------------------------------------
COMMERCIAL SERVICES & SUPPLIES -- 0.1%
- --------------------------------------------------------------------------------
115,000 Waste Management, Inc.,
7.00%, 7/15/28 126,264
- --------------------------------------------------------------------------------
CONSUMER FINANCE -- 0.1%
- --------------------------------------------------------------------------------
94,000 American Express Centurion
Bank, 4.375%, 7/30/09(2) 92,332
- --------------------------------------------------------------------------------
DIVERSIFIED FINANCIAL SERVICES -- 1.7%
- --------------------------------------------------------------------------------
117,000 American General Finance
Corp., Series 2002 H,
4.50%, 11/15/07(2) 116,112
- --------------------------------------------------------------------------------
374,000 Citigroup Inc., 5.00%,
9/15/14(2) 364,969
- --------------------------------------------------------------------------------
110,000 Citigroup Inc., 6.125%,
8/25/36(2) 113,527
- --------------------------------------------------------------------------------
127,000 General Electric Capital Corp.,
6.125%, 2/22/11(2) 131,891
- --------------------------------------------------------------------------------
257,000 HSBC Finance Corp.,
4.75%, 4/15/10(2) 253,784
- --------------------------------------------------------------------------------
93,000 HSBC Finance Corp.,
4.625%, 9/15/10(2) 91,182
- --------------------------------------------------------------------------------
See Notes to Financial Statements. (continued)
- ------
9
NT Diversified Bond - Schedule of Investments
SEPTEMBER 30, 2006 (UNAUDITED)
Principal Amount Value
- --------------------------------------------------------------------------------
$ 162,000 J.P. Morgan Chase & Co.,
6.75%, 2/1/11(2) $ 171,480
- --------------------------------------------------------------------------------
193,000 John Deere Capital Corp.,
4.50%, 8/25/08(2) 190,561
- --------------------------------------------------------------------------------
1,433,506
- --------------------------------------------------------------------------------
DIVERSIFIED TELECOMMUNICATION
SERVICES -- 0.8%
- --------------------------------------------------------------------------------
193,000 AT&T Corp., 7.30%, 11/15/11 209,413
- --------------------------------------------------------------------------------
100,000 AT&T Inc., 6.80%, 5/15/36 105,397
- --------------------------------------------------------------------------------
29,000 BellSouth Corp., 6.875%,
10/15/31(2) 30,294
- --------------------------------------------------------------------------------
82,000 Embarq Corp., 7.08%, 6/1/16 83,794
- --------------------------------------------------------------------------------
182,000 Telecom Italia Capital SA,
4.00%, 1/15/10 172,577
- --------------------------------------------------------------------------------
70,000 Verizon Communications Inc.,
5.55%, 2/15/16(2) 69,201
- --------------------------------------------------------------------------------
670,676
- --------------------------------------------------------------------------------
ELECTRIC UTILITIES -- 0.9%
- --------------------------------------------------------------------------------
185,000 Carolina Power & Light Co.,
5.15%, 4/1/15 181,168
- --------------------------------------------------------------------------------
90,000 Carolina Power & Light Co.,
5.25%, 12/15/15 88,653
- --------------------------------------------------------------------------------
190,000 CenterPoint Energy Resources
Corp., 6.50%, 2/1/08 192,270
- --------------------------------------------------------------------------------
96,000 FirstEnergy Corp.,
7.375%, 11/15/31 111,331
- --------------------------------------------------------------------------------
60,000 Florida Power Corp.,
4.50%, 6/1/10 58,567
- --------------------------------------------------------------------------------
129,000 Southern California
Edison Co., 5.625%, 2/1/36 125,629
- --------------------------------------------------------------------------------
757,618
- --------------------------------------------------------------------------------
FOOD & STAPLES RETAILING -- 0.4%
- --------------------------------------------------------------------------------
168,000 Wal-Mart Stores, Inc.,
4.125%, 7/1/10(2) 162,805
- --------------------------------------------------------------------------------
29,000 Wal-Mart Stores, Inc.,
7.55%, 2/15/30(2) 35,730
- --------------------------------------------------------------------------------
175,000 Wal-Mart Stores, Inc.,
5.25%, 9/1/35 164,249
- --------------------------------------------------------------------------------
362,784
- --------------------------------------------------------------------------------
FOOD PRODUCTS -- 0.3%
- --------------------------------------------------------------------------------
219,000 Cadbury Schweppes
U.S. Finance LLC, 3.875%,
10/1/08 (Acquired 5/12/06,
Cost $210,515)(4) 213,117
- --------------------------------------------------------------------------------
29,000 Kellogg Co., 7.45%, 4/1/31 35,107
- --------------------------------------------------------------------------------
29,000 Kraft Foods Inc.,
6.50%, 11/1/31(2) 31,401
- --------------------------------------------------------------------------------
279,625
- --------------------------------------------------------------------------------
HEALTH CARE EQUIPMENT & SUPPLIES -- 0.3%
- --------------------------------------------------------------------------------
179,000 Baxter Finco BV,
4.75%, 10/15/10(2) 176,006
- --------------------------------------------------------------------------------
100,000 Boston Scientific Corp.,
6.40%, 6/15/16 101,029
- --------------------------------------------------------------------------------
277,035
- --------------------------------------------------------------------------------
Principal Amount Value
- --------------------------------------------------------------------------------
HEALTH CARE PROVIDERS & SERVICES -- 0.2%
- --------------------------------------------------------------------------------
$ 214,000 Laboratory Corp. of America
Holdings, 5.625%, 12/15/15 $ 212,768
- --------------------------------------------------------------------------------
HOTELS, RESTAURANTS & LEISURE -- 0.2%
- --------------------------------------------------------------------------------
160,000 Royal Caribbean Cruises Ltd.,
7.00%, 6/15/13 162,553
- --------------------------------------------------------------------------------
HOUSEHOLD DURABLES -- 0.1%
- --------------------------------------------------------------------------------
122,000 D.R. Horton, Inc.,
7.875%, 8/15/11 130,428
- --------------------------------------------------------------------------------
INDUSTRIAL CONGLOMERATES -- 0.5%
- --------------------------------------------------------------------------------
452,000 General Electric Co.,
5.00%, 2/1/13(2) 447,492
- --------------------------------------------------------------------------------
INSURANCE -- 0.8%
- --------------------------------------------------------------------------------
210,000 Allstate Financial Global
Funding, 4.25%, 9/10/08
(Acquired 5/12/06,
Cost $204,511)(2)(4) 206,451
- --------------------------------------------------------------------------------
29,000 AXA SA, 8.60%, 12/15/30(2) 37,132
- --------------------------------------------------------------------------------
100,000 Genworth Financial Inc.,
4.95%, 10/1/15(2) 96,170
- --------------------------------------------------------------------------------
231,000 Monumental Global Funding II,
3.85%, 3/3/08 (Acquired
5/12/06, Cost $224,499)(2)(4) 226,276
- --------------------------------------------------------------------------------
100,000 Prudential Financial, Inc.,
5.40%, 6/13/35(2) 93,441
- --------------------------------------------------------------------------------
659,470
- --------------------------------------------------------------------------------
MEDIA -- 0.9%
- --------------------------------------------------------------------------------
233,000 Comcast Corp.,
5.90%, 3/15/16 233,525
- --------------------------------------------------------------------------------
258,000 Cox Communications, Inc.,
7.125%, 10/1/12 275,293
- --------------------------------------------------------------------------------
160,000 Knight-Ridder, Inc.,
7.125%, 6/1/11(2) 167,039
- --------------------------------------------------------------------------------
105,000 News America Holdings,
7.75%, 1/20/24 116,409
- --------------------------------------------------------------------------------
29,000 Time Warner Inc.,
7.625%, 4/15/31 32,129
- --------------------------------------------------------------------------------
824,395
- --------------------------------------------------------------------------------
METALS & MINING -- 0.1%
- --------------------------------------------------------------------------------
102,000 Alcan Inc., 4.50%, 5/15/13 96,274
- --------------------------------------------------------------------------------
MULTI-UTILITIES -- 0.8%
- --------------------------------------------------------------------------------
180,000 Consolidated Edison Co.
of New York, 5.50%, 9/15/16(2) 180,843
- --------------------------------------------------------------------------------
241,000 Dominion Resources Inc.,
4.125%, 2/15/08 237,233
- --------------------------------------------------------------------------------
96,000 Dominion Resources Inc.,
4.75%, 12/15/10 93,698
- --------------------------------------------------------------------------------
134,000 Nisource Finance Corp.,
5.25%, 9/15/17 125,283
- --------------------------------------------------------------------------------
101,000 Pacific Gas & Electric Co.,
6.05%, 3/1/34 101,927
- --------------------------------------------------------------------------------
738,984
- --------------------------------------------------------------------------------
See Notes to Financial Statements. (continued)
- ------
10
NT Diversified Bond - Schedule of Investments
SEPTEMBER 30, 2006 (UNAUDITED)
Principal Amount Value
- --------------------------------------------------------------------------------
MULTILINE RETAIL -- 0.3%
- --------------------------------------------------------------------------------
$ 63,000 May Department Stores Co.
(The), 3.95%, 7/15/07 $ 62,168
- --------------------------------------------------------------------------------
168,000 May Department Stores Co.
(The), 4.80%, 7/15/09 164,940
- --------------------------------------------------------------------------------
29,000 Target Corp., 7.00%, 7/15/31(2) 33,998
- --------------------------------------------------------------------------------
261,106
- --------------------------------------------------------------------------------
OIL, GAS & CONSUMABLE FUELS -- 1.5%
- --------------------------------------------------------------------------------
130,000 Anadarko Petroleum Corp.,
5.95%, 9/15/16 131,799
- --------------------------------------------------------------------------------
80,000 Anadarko Petroleum Corp.,
6.45%, 9/15/36 81,988
- --------------------------------------------------------------------------------
29,000 ConocoPhillips Holding Co.,
6.95%, 4/15/29 33,546
- --------------------------------------------------------------------------------
89,000 Devon Financing Corp., ULC,
7.875%, 9/30/31 108,797
- --------------------------------------------------------------------------------
293,000 Enterprise Products Operating
L.P., 4.95%, 6/1/10 286,835
- --------------------------------------------------------------------------------
97,000 Enterprise Products Operating
L.P., 6.65%, 10/15/34 97,427
- --------------------------------------------------------------------------------
229,000 Premcor Refining Group Inc.
(The), 6.125%, 5/1/11 234,137
- --------------------------------------------------------------------------------
128,000 XTO Energy Inc.,
5.30%, 6/30/15 124,374
- --------------------------------------------------------------------------------
102,000 XTO Energy Inc.,
6.10%, 4/1/36 101,240
- --------------------------------------------------------------------------------
1,200,143
- --------------------------------------------------------------------------------
PHARMACEUTICALS -- 0.3%
- --------------------------------------------------------------------------------
129,000 Abbott Laboratories,
5.875%, 5/15/16(2) 133,882
- --------------------------------------------------------------------------------
84,000 Schering-Plough Corp.,
5.55%, 12/1/13(2) 84,397
- --------------------------------------------------------------------------------
218,279
- --------------------------------------------------------------------------------
REAL ESTATE MANAGEMENT
& DEVELOPMENT-- 0.1%
- --------------------------------------------------------------------------------
94,000 ERP Operating L.P.,
5.125%, 3/15/16 90,972
- --------------------------------------------------------------------------------
ROAD & RAIL -- 0.3%
- --------------------------------------------------------------------------------
180,000 Burlington Northern
Santa Fe Corp.,
6.20%, 8/15/36 188,176
- --------------------------------------------------------------------------------
116,000 Norfolk Southern Corp.,
5.64%, 5/17/29 113,223
- --------------------------------------------------------------------------------
301,399
- --------------------------------------------------------------------------------
SOFTWARE -- 0.2%
- --------------------------------------------------------------------------------
164,000 Oracle Corp., 5.00%, 1/15/11(2) 162,588
- --------------------------------------------------------------------------------
SPECIALTY RETAIL -- 0.2%
- --------------------------------------------------------------------------------
203,000 Home Depot, Inc. (The),
5.40%, 3/1/16(2) 202,028
- --------------------------------------------------------------------------------
Principal Amount Value
- --------------------------------------------------------------------------------
THRIFTS & MORTGAGE FINANCE -- 0.2%
- --------------------------------------------------------------------------------
$ 155,000 Residential Capital Corp.,
6.50%, 4/17/13 $ 157,617
- --------------------------------------------------------------------------------
WIRELESS TELECOMMUNICATION SERVICES -- 0.3%
- --------------------------------------------------------------------------------
283,000 Nextel Communications Inc.,
5.95%, 3/15/14 277,204
- --------------------------------------------------------------------------------
TOTAL CORPORATE BONDS
(Cost $13,717,923) 14,074,242
- --------------------------------------------------------------------------------
COLLATERALIZED MORTGAGE
OBLIGATIONS(1) -- 16.0%
- --------------------------------------------------------------------------------
2,455,877 Bank of America Commercial
Mortgage Inc. STRIPS --
COUPON, Series 2004-1,
Class XP, VRN, 0.65%, 10/1/06(2) 54,484
- --------------------------------------------------------------------------------
341,814 Bank of America Large Loan,
Series 2005 MIB1, Class A1,
VRN, 5.48%, 10/15/06, resets
monthly off the 1-month
LIBOR plus 0.15% with no caps
(Acquired 5/12/06,
Cost $341,946)(2)(4) 342,029
- --------------------------------------------------------------------------------
550,000 Bear Stearns Commercial
Mortgage Securities,
Series 2006 BBA7, Class A1,
VRN, 5.44%, 10/16/06,
resets monthly off the
1-month LIBOR plus 0.11%
with no caps (Acquired
6/5/06, Cost $550,000)(2)(4) 550,346
- --------------------------------------------------------------------------------
3,415,387 Bear Stearns Commercial
Mortgage Securities
STRIPS -- COUPON,
Series 2004 T16,
Class X2, VRN, 0.77%, 10/1/06(2) 113,575
- --------------------------------------------------------------------------------
2,036,155 Commercial Mortgage
Acceptance Corp.
STRIPS -- COUPON,
Series 1998 C2, Class X,
VRN, 1.00%, 10/1/06(2) 56,399
- --------------------------------------------------------------------------------
158,342 Commercial Mortgage
Pass-Through Certificates,
Series 2005 F10A, Class A1,
VRN, 5.43%, 10/15/06, resets
monthly off the 1-month
LIBOR plus 0.10% with no
caps (Acquired 5/12/06,
Cost $158,458)(2)(4) 158,459
- --------------------------------------------------------------------------------
186,745 Commercial Mortgage
Pass-Through Certificates,
Series 2005 FL11, Class A1,
VRN, 5.48%, 10/16/06, resets
monthly off the 1-month
LIBOR plus 0.15% with no caps
(Acquired 5/12/06,
Cost $186,859)(2)(4) 186,889
- --------------------------------------------------------------------------------
See Notes to Financial Statements. (continued)
- ------
11
NT Diversified Bond - Schedule of Investments
SEPTEMBER 30, 2006 (UNAUDITED)
Principal Amount Value
- --------------------------------------------------------------------------------
$ 854,000 FHLMC, Series 2567,
Class OD, 5.00%, 8/15/15 $ 849,879
- --------------------------------------------------------------------------------
737,111 FHLMC, Series 2900, Class PA,
4.50%, 3/15/14 730,077
- --------------------------------------------------------------------------------
378,050 FHLMC, Series 2937,
Class KA, 4.50%, 12/15/14 374,487
- --------------------------------------------------------------------------------
4,572 FNMA, Series 1989-35,
Class G SEQ, 9.50%, 7/25/19(2) 4,907
- --------------------------------------------------------------------------------
688,000 FNMA, Series 2003-92,
Class PD, 4.50%, 3/25/17 669,134
- --------------------------------------------------------------------------------
34,222 GMAC Commercial Mortgage
Securities, Inc., Series 2002 C2,
Class A1 SEQ, 4.32%,
10/15/38(2) 34,063
- --------------------------------------------------------------------------------
796,000 GMAC Commercial Mortgage
Securities, Inc., Series 2005 C1,
Class A2 SEQ, 4.47%, 5/10/43(2) 780,237
- --------------------------------------------------------------------------------
1,029,000 Greenwich Capital Commercial
Funding Corp., Series 2005 GG3,
Class A2 SEQ, VRN, 4.31%,
10/1/06(2) 1,005,928
- --------------------------------------------------------------------------------
1,495,000 Greenwich Capital Commercial
Funding Corp., Series 2005 GG5,
Class A5, 5.22%, 4/10/37(2) 1,482,580
- --------------------------------------------------------------------------------
671,000 LB-UBS Commercial Mortgage
Trust, Series 2005 C3, Class A3
SEQ, 4.65%, 7/30/30(2) 655,505
- --------------------------------------------------------------------------------
941,000 LB-UBS Commercial Mortgage
Trust, Series 2005 C3, Class A5
SEQ, 4.74%, 7/15/30(2) 903,415
- --------------------------------------------------------------------------------
681,000 LB-UBS Commercial Mortgage
Trust, Series 2006 C1, Class A4
SEQ, 5.16%, 2/15/31(2) 672,280
- --------------------------------------------------------------------------------
242,232 Lehman Brothers Floating Rate
Commercial Mortgage Trust,
Series 2005 LLFA, Class A1,
VRN, 5.43%, 10/15/06, resets
monthly off the 1-month
LIBOR plus 0.10% with no caps
(Acquired 5/12/06,
Cost $193,316)(2)(4) 242,384
- --------------------------------------------------------------------------------
497,747 Lehman Brothers Floating Rate
Commercial Mortgage Trust,
Series 2006 LLFA, Class A1, VRN,
5.41%, 10/16/06, resets monthly
off the 1-month LIBOR plus
0.08% with no caps (Acquired
8/7/06, Cost $497,747)(2)(4) 498,062
- --------------------------------------------------------------------------------
26,335 MASTR Alternative Loans Trust,
Series 2003-8, Class 4A1,
7.00%, 12/25/33(2) 26,638
- --------------------------------------------------------------------------------
Principal Amount Value
- --------------------------------------------------------------------------------
$ 374,926 Morgan Stanley Capital I, Series
2006 XLF, Class A1, VRN, 5.42%,
10/16/06, resets monthly off
the 1-month LIBOR plus 0.09%
with no caps (Acquired 7/28/06,
Cost $374,926)(2)(4) $ 375,163
- --------------------------------------------------------------------------------
397,457 Thornburg Mortgage Securities
Trust, Series 2006-5, Class A1,
VRN, 5.45%, 10/25/06, resets
monthly off the 1-month LIBOR
plus 0.12% with no caps 397,457
- --------------------------------------------------------------------------------
1,301,000 Wachovia Bank Commercial
Mortgage Trust, Series 2006
C23, Class A4, 5.42%, 1/15/45(2) 1,306,558
- --------------------------------------------------------------------------------
275,000 Washington Mutual, Inc.,
Series 2005 AR4, Class A3,
4.59%, 4/25/35(2) 269,779
- --------------------------------------------------------------------------------
603,000 Washington Mutual, Inc.,
Series 2005 AR4, Class A4B,
VRN, 4.67%, 10/25/06(2) 592,955
- --------------------------------------------------------------------------------
77,594 Washington Mutual, Inc., Series
2005 AR11, Class A1C1, VRN,
5.53%, 10/25/06, resets monthly
off the 1-month LIBOR plus
0.20% with a cap of 10.50% 77,666
- --------------------------------------------------------------------------------
600,000 Wells Fargo Mortgage
Backed Securities Trust,
Series 2004 N, Class A4,
4.10%, 12/23/08(2) 588,010
- --------------------------------------------------------------------------------
TOTAL COLLATERALIZED MORTGAGE OBLIGATIONS
(Cost $13,803,654) 13,999,345
- --------------------------------------------------------------------------------
U.S. TREASURY SECURITIES -- 13.8%
- --------------------------------------------------------------------------------
1,160,000 U.S. Treasury Bonds,
8.125%, 8/15/21(2) 1,563,282
- --------------------------------------------------------------------------------
1,383,000 U.S. Treasury Bonds,
7.125%, 2/15/23(2) 1,737,611
- --------------------------------------------------------------------------------
159,000 U.S. Treasury Bonds,
6.125%, 11/15/27(2) 186,018
- --------------------------------------------------------------------------------
336,000 U.S. Treasury Bonds,
6.25%, 5/15/30(2) 403,909
- --------------------------------------------------------------------------------
1,641,185 U.S. Treasury Inflation Indexed
Notes, 2.00%, 1/15/16(2) 1,604,002
- --------------------------------------------------------------------------------
2,887,000 U.S. Treasury Notes,
4.875%, 4/30/11(2) 2,920,045
- --------------------------------------------------------------------------------
3,100,000 U.S. Treasury Notes,
5.125%, 6/30/11(2) 3,169,387
- --------------------------------------------------------------------------------
416,000 U.S. Treasury Notes,
4.875%, 8/15/16(2) 423,995
- --------------------------------------------------------------------------------
TOTAL U.S. TREASURY SECURITIES
(Cost $11,632,184) 12,008,249
- --------------------------------------------------------------------------------
See Notes to Financial Statements. (continued)
- ------
12
NT Diversified Bond - Schedule of Investments
SEPTEMBER 30, 2006 (UNAUDITED)
Principal Amount Value
- --------------------------------------------------------------------------------
ASSET-BACKED SECURITIES(1) -- 10.9%
- --------------------------------------------------------------------------------
$ 1,190 ABSC Net Interest Margin,
Series 2004 HE5, Class A1,
5.00%, 8/27/34 (Acquired
5/12/06, Cost $1,188)(4) $ 1,188
- --------------------------------------------------------------------------------
314,214 Accredited Mortgage Loan Trust,
Series 2006-1, Class A1, VRN,
5.39%, 10/25/06, resets
monthly off the 1-month LIBOR
plus 0.06% with no caps(2) 314,451
- --------------------------------------------------------------------------------
454,668 Accredited Mortgage Loan Trust,
Series 2006-2, Class A1, VRN,
5.37%, 10/25/06, resets
monthly off the 1-month LIBOR
plus 0.04% with no caps 454,954
- --------------------------------------------------------------------------------
152,705 Ameriquest Mortgage
Securities Inc., Series 2006 R1,
Class A2A, VRN, 5.41%,
10/25/06, resets monthly off
the 1-month LIBOR plus 0.08%
with no caps 152,828
- --------------------------------------------------------------------------------
305 AQ Finance Net Interest Margin,
Series 2004 RN5, Class A,
5.19%, 6/29/34 (Acquired
5/12/06, Cost $304)(4) 304
- --------------------------------------------------------------------------------
350,000 Argent Securities Inc., Series
2006 M3, Class A2A, VRN,
5.38%, 10/25/06, resets
monthly off the 1-month LIBOR
plus 0.05% with no caps(2) 350,000
- --------------------------------------------------------------------------------
534,000 Capital One Prime Auto
Receivables Trust, Series
2004-2, Class A4, VRN, 5.39%,
10/15/06, resets monthly off
the 1-month LIBOR plus 0.06%
with no caps(2) 534,607
- --------------------------------------------------------------------------------
588,581 CNH Equipment Trust, Series
2004 A, Class A3A, VRN, 5.40%,
10/16/06, resets monthly off
the 1-month LIBOR plus 0.07%
with no caps(2) 589,094
- --------------------------------------------------------------------------------
12,425 Countrywide Asset-Backed
Certificates, Series 2005-7,
Class 3AV1, VRN, 5.45%,
10/25/06, resets monthly off
the 1-month LIBOR plus 0.12%
with no caps(2) 12,433
- --------------------------------------------------------------------------------
120,684 Countrywide Asset-Backed
Certificates, Series 2005-8,
Class 2A1, VRN, 5.46%,
10/25/06, resets monthly off
the 1-month LIBOR plus 0.13%
with no caps 120,773
- --------------------------------------------------------------------------------
411,768 Countrywide Asset-Backed
Certificates, Series 2006-6,
Class 2A1, VRN, 5.40%,
10/25/06, resets monthly off
the 1-month LIBOR plus 0.07%
with no caps 412,052
- --------------------------------------------------------------------------------
Principal Amount Value
- --------------------------------------------------------------------------------
$ 444,027 Credit-Based Asset Servicing
and Securitization, Series 2006
CB3, Class AV1, VRN, 5.39%,
10/25/06, resets monthly off
the 1-month LIBOR plus 0.06%
with no caps(2) $ 444,335
- --------------------------------------------------------------------------------
136,000 Detroit Edison Securitization
Funding LLC, Series 2001-1,
Class A4 SEQ, 6.19%, 3/1/13(2) 141,130
- --------------------------------------------------------------------------------
565,019 First Franklin Mortgage Loan
Asset Backed Certificates,
Series 2006 FF11, Class 2A1,
VRN, 5.37%, 10/25/06, resets
monthly off the 1-month LIBOR
plus 0.04% with no caps(2) 565,321
- --------------------------------------------------------------------------------
470,857 First Franklin Mortgage Loan
Asset Backed Certificates,
Series 2006 FF12, Class A2,
VRN, 5.37%, 10/25/06, resets
monthly off the 1-month LIBOR
plus 0.04% with no caps(2) 471,117
- --------------------------------------------------------------------------------
212,358 IndyMac Residential Asset
Backed Trust, Series 2006 B,
Class 2A1, VRN, 5.39%,
10/25/06, resets monthly
off the 1-month LIBOR plus
0.06% with no caps 212,533
- --------------------------------------------------------------------------------
125,408 Long Beach Mortgage Loan
Trust, Series 2006-2, Class 2A1,
VRN, 5.40%, 10/25/06,
resets monthly off the 1-month LIBOR
plus 0.07% with no caps(2) 125,506
- --------------------------------------------------------------------------------
614,460 Long Beach Mortgage Loan
Trust, Series 2006-6, Class 2A1,
VRN, 5.37%, 10/25/06,
resets monthly off the 1-month LIBOR
plus 0.04% with no caps 614,846
- --------------------------------------------------------------------------------
281,001 Nomura Home Equity Loan, Inc.,
Series 2006 HE1, Class A1, VRN,
5.41%, 10/25/06, resets
montly off the 1-month LIBOR plus
0.08% with no caps(2) 281,248
- --------------------------------------------------------------------------------
448,047 Nomura Home Equity Loan, Inc.,
Series 2006 HE2, Class A1, VRN,
5.39%, 10/25/06, resets
montly off the 1-month LIBOR plus
0.06% with no caps(2) 448,361
- --------------------------------------------------------------------------------
935,313 NovaStar Home Equity Loan,
Series 2005-4, Class A2A, VRN,
5.42%, 10/25/06, resets
monthly off the 1-month
LIBOR plus 0.09% with
a cap of 11.00% 936,033
- --------------------------------------------------------------------------------
62,000 Residential Asset Securities
Corp., Series 2004 KS2,
Class MI1, 4.71%, 3/25/34(2) 60,455
- --------------------------------------------------------------------------------
375,000 SLC Student Loan Trust,
Series 2006-2, Class A1, VRN,
5.37%, 12/15/06, resets
quarterly off the 3-month LIBOR
minus 0.02% with no caps 375,000
- --------------------------------------------------------------------------------
See Notes to Financial Statements. (continued)
- ------
13
NT Diversified Bond - Schedule of Investments
SEPTEMBER 30, 2006 (UNAUDITED)
Principal Amount Value
- --------------------------------------------------------------------------------
$ 232,948 SLM Student Loan Trust,
Series 2006-2, Class A1, VRN,
5.36%, 10/25/06, resets
quarterly off the 3-month LIBOR
minus 0.03% with no caps $ 233,084
- --------------------------------------------------------------------------------
141,852 SLM Student Loan Trust,
Series 2006-4, Class A1, VRN,
5.36%, 10/25/06, resets
quarterly off the 3-month LIBOR
minus 0.03% with no caps 141,938
- --------------------------------------------------------------------------------
300,000 SLM Student Loan Trust,
Series 2006-5, Class A2, VRN,
5.38%, 10/25/06, resets
quarterly off the 3-month LIBOR
minus 0.01% with no caps(2) 299,785
- --------------------------------------------------------------------------------
450,000 SLM Student Loan Trust,
Series 2006-7, Class A1, VRN,
5.35%, 10/25/06, resets
quarterly off the 3-month LIBOR
minus 0.04% with no caps(2) 450,246
- --------------------------------------------------------------------------------
659,951 Soundview Home Equity Loan
Trust, Series 2006-3, Class A1,
VRN, 5.37%, 10/25/06, resets
monthly off the 1-month LIBOR
plus 0.04% with no caps(2) 660,424
- --------------------------------------------------------------------------------
85,528 Structured Asset Securities Corp.,
Series 2005 WF2, Class A1, VRN,
5.41%, 10/25/06, resets
monthly off the 1-month LIBOR plus
0.08% with no caps(2) 85,575
- --------------------------------------------------------------------------------
TOTAL ASSET-BACKED SECURITIES
(Cost $9,483,307) 9,489,621
- --------------------------------------------------------------------------------
MUNICIPAL SECURITIES -- 1.7%
1,100,000 Commonwealth of
Massachusetts Rev., 5.50%,
1/1/34 (FGIC)(2) 1,321,628
- --------------------------------------------------------------------------------
173,000 Illinois GO, (Taxable Pension),
5.10%, 6/1/33(2) 166,097
- --------------------------------------------------------------------------------
TOTAL MUNICIPAL SECURITIES
(Cost $1,403,592) 1,487,725
- --------------------------------------------------------------------------------
Principal Amount Value
- --------------------------------------------------------------------------------
SOVEREIGN GOVERNMENTS
& AGENCIES -- 0.5%
- --------------------------------------------------------------------------------
$ 29,000 Hydro Quebec, 8.40%, 1/15/22(2) $ 38,147
- --------------------------------------------------------------------------------
215,000 Province of Quebec,
5.00%, 7/17/09(2) 215,110
- --------------------------------------------------------------------------------
198,000 Republic of Italy,
4.00%, 6/16/08(2) 194,961
- --------------------------------------------------------------------------------
TOTAL SOVEREIGN
GOVERNMENTS & AGENCIES
(Cost $442,631) 448,218
- --------------------------------------------------------------------------------
TEMPORARY CASH INVESTMENTS -- 11.2%
Repurchase Agreement, Credit Suisse
First Boston Corp., (collateralized by
various U.S. Treasury obligations, 4.790%,
12/21/06, valued at $4,078,032), in
a joint trading account at 4.90%, dated 9/29/06,
due 10/2/06 (Delivery value $4,001,633)(2) 4,000,000
- --------------------------------------------------------------------------------
Repurchase Agreement, Deutsche Bank
Securities, Inc., (collateralized by
various U.S. Treasury obligations, 0.875%, 4/15/10,
valued at $1,422,153), in a joint trading
account at 4.95%, dated 9/29/06,
due 10/2/06 (Delivery value $1,394,575)(2) 1,394,000
- --------------------------------------------------------------------------------
Repurchase Agreement, Goldman Sachs & Co.,
(collateralized by various U.S.
Treasury obligations, 5.25% - 6.00%,
2/15/26 - 2/15/29, valued at $4,438,258),
in a joint trading account at 4.90%, dated 9/29/06,
due 10/2/06 (Delivery value $4,354,777)(2) 4,353,000
- --------------------------------------------------------------------------------
TOTAL TEMPORARY CASH INVESTMENTS
(Cost $9,747,000) 9,747,000
- --------------------------------------------------------------------------------
TOTAL INVESTMENT SECURITIES -- 120.5%
(Cost $103,609,071) 105,166,313
- --------------------------------------------------------------------------------
OTHER ASSETS
AND LIABILITIES -- (20.5)% (17,869,918)
- --------------------------------------------------------------------------------
TOTAL NET ASSETS -- 100.0% $ 87,296,395
================================================================================
FUTURES CONTRACTS
Expiration Underlying Face Unrealized
Contracts Purchased Date Amount at Value Gain (Loss)
- --------------------------------------------------------------------------------
82 U.S. Treasury 2-Year Notes December 2006 $16,769,000 $ 20,207
- --------------------------------------------------------------------------------
175 U.S. Treasury 5-Year Notes December 2006 18,465,234 92,309
- --------------------------------------------------------------------------------
$35,234,234 $112,516
=============================
Expiration Underlying Face Unrealized
Contracts Sold Date Amount at Value Gain (Loss)
- --------------------------------------------------------------------------------
8 U.S. Long Bond December 2006 $ 899,250 $ (17,018)
- --------------------------------------------------------------------------------
122 U.S. Treasury 10-Year Notes December 2006 13,183,625 (118,056)
- --------------------------------------------------------------------------------
$14,082,875 $ (135,074)
=============================
See Notes to Financial Statements. (continued)
- ------
14
NT Diversified Bond - Schedule of Investments
SEPTEMBER 30, 2006 (UNAUDITED)
SWAP AGREEMENTS
Notional Amount Description of Agreement Expiration Date Unrealized Gain (Loss)
- -----------------------------------------------------------------------------------------------------------
CREDIT DEFAULT
- -----------------------------------------------------------------------------------------------------------
$2,150,000 Pay quarterly a fixed rate equal to 0.40% June 2011 $(3,368)
multiplied by the notional amount and receive
from Morgan Stanley Capital Services Inc.
upon each default event of one of the issues
of Dow Jones CDX N.A. Investment Grade 6,
par value of the proportional notional amount.
- -----------------------------------------------------------------------------------------------------------
2,000,000 Pay quarterly a fixed rate equal to 0.75% June 2011 (1,391)
multiplied by the notional amount and receive
from Morgan Stanley Capital Services Inc. upon
each default event of one of the issues of
Dow Jones CDX N.A. Investment Grade High
Volume 6, par value of the proportional
notional amount.
- -----------------------------------------------------------------------------------------------------------
$(4,759)
====================
NOTES TO SCHEDULE OF INVESTMENTS
ABSC = Asset-Backed Securities Corp.
CDX = Credit Derivative Indexes
FGIC = Financial Guaranty Insurance Co.
FHLB = Federal Home Loan Bank
FHLMC = Federal Home Loan Mortgage Corporation
FNMA = Federal National Mortgage Association
GMAC = General Motors Acceptance Corporation
GNMA = Government National Mortgage Association
GO = General Obligation
LB-UBS = Lehman Brothers Inc. -- UBS AG
LIBOR = London Interbank Offered Rate
MASTR = Mortgage Asset Securitization Transactions, Inc.
resets = The frequency with which a security's coupon changes, based on current
market conditions or an underlying index. The more frequently a
security resets, the less risk the investor is taking that the coupon
will vary significantly from current market rates.
SEQ = Sequential Payer
STRIPS = Separate Trading of Registered Interest and Principal of Securities
VRN = Variable Rate Note. Interest reset date is indicated. Rate shown is
effective September 30, 2006.
(1) Final maturity indicated, unless otherwise noted.
(2) Security, or a portion thereof, has been segregated for forward
commitments, futures contracts and/or swap agreements.
(3) Forward commitment.
(4) Security was purchased under Rule 144A of the Securities Act of 1933 or is
a private placement and, unless registered under the Act or exempted from
registration, may only be sold to qualified institutional investors. The
aggregate value of restricted securities at September 30, 2006 was
$3,431,697, which represented 3.9% of total net assets.
(5) Industry is less than 0.05% of total net assets.
See Notes to Financial Statements.
- ------
15
Statement of Assets and Liabilities
SEPTEMBER 30, 2006 (UNAUDITED)
- --------------------------------------------------------------------------------
ASSETS
- --------------------------------------------------------------------------------
Investment securities, at value (cost of $103,609,071) $105,166,313
- ---------------------------------------------------------------
Cash 144,090
- ---------------------------------------------------------------
Interest receivable 680,848
- --------------------------------------------------------------------------------
105,991,251
- --------------------------------------------------------------------------------
LIABILITIES
- --------------------------------------------------------------------------------
Payable for investments purchased 18,307,227
- ---------------------------------------------------------------
Unrealized depreciation on swap agreements 4,759
- ---------------------------------------------------------------
Payable for variation margin on futures contracts 3,812
- ---------------------------------------------------------------
Dividends payable 349,932
- ---------------------------------------------------------------
Accrued management fees 29,126
- --------------------------------------------------------------------------------
18,694,856
- --------------------------------------------------------------------------------
NET ASSETS $ 87,296,395
================================================================================
CAPITAL SHARES
- --------------------------------------------------------------------------------
Outstanding (unlimited number of shares authorized) 8,542,043
================================================================================
NET ASSET VALUE PER SHARE $10.22
================================================================================
NET ASSETS CONSIST OF:
- --------------------------------------------------------------------------------
Capital paid-in $85,495,380
- ---------------------------------------------------------------
Undistributed net realized gain on investment transactions 289,174
- ---------------------------------------------------------------
Net unrealized appreciation on investments 1,511,841
- --------------------------------------------------------------------------------
$87,296,395
================================================================================
See Notes to Financial Statements.
- ------
16
Statement of Operations
PERIOD ENDED SEPTEMBER 30, 2006 (UNAUDITED)(1)
- --------------------------------------------------------------------------------
INVESTMENT INCOME (LOSS)
- --------------------------------------------------------------------------------
INCOME:
- --------------------------------------------------------------
Interest $1,678,667
- --------------------------------------------------------------------------------
EXPENSES:
- --------------------------------------------------------------
Management fees 125,704
- --------------------------------------------------------------
Directors' fees and expenses 619
- --------------------------------------------------------------
Other expenses 17
- --------------------------------------------------------------------------------
126,340
- --------------------------------------------------------------------------------
NET INVESTMENT INCOME (LOSS) 1,552,327
- --------------------------------------------------------------------------------
REALIZED AND UNREALIZED GAIN (LOSS)
- --------------------------------------------------------------------------------
NET REALIZED GAIN (LOSS) ON:
- --------------------------------------------------------------
Investment transactions 340,644
- --------------------------------------------------------------
Futures and swaps transactions (54,569)
- --------------------------------------------------------------------------------
286,075
- --------------------------------------------------------------------------------
CHANGE IN NET UNREALIZED APPRECIATION (DEPRECIATION) ON:
- --------------------------------------------------------------
Investments 1,557,242
- --------------------------------------------------------------
Futures and swaps (46,122)
- --------------------------------------------------------------------------------
1,511,120
- --------------------------------------------------------------------------------
NET REALIZED AND UNREALIZED GAIN (LOSS) 1,797,195
- --------------------------------------------------------------------------------
NET INCREASE (DECREASE) IN NET ASSETS RESULTING FROM OPERATIONS $3,349,522
================================================================================
(1) May 12, 2006 (fund inception) through September 30, 2006.
See Notes to Financial Statements.
- ------
17
Statement of Changes in Net Assets
PERIOD ENDED SEPTEMBER 30, 2006 (UNAUDITED)(1)
- --------------------------------------------------------------------------------
INCREASE (DECREASE) IN NET ASSETS 2006
- --------------------------------------------------------------------------------
OPERATIONS
- --------------------------------------------------------------------------------
Net investment income (loss) $ 1,552,327
- ----------------------------------------------------------------
Net realized gain (loss) 286,075
- ----------------------------------------------------------------
Change in net unrealized appreciation (depreciation) 1,511,120
- --------------------------------------------------------------------------------
Net increase (decrease) in net assets resulting from operations 3,349,522
- --------------------------------------------------------------------------------
DISTRIBUTIONS TO SHAREHOLDERS
- --------------------------------------------------------------------------------
From net investment income (1,548,507)
- --------------------------------------------------------------------------------
CAPITAL SHARE TRANSACTIONS
- --------------------------------------------------------------------------------
Proceeds from shares sold 92,251,641
- ----------------------------------------------------------------
Payments for shares redeemed (6,756,261)
- --------------------------------------------------------------------------------
Net increase (decrease) in net assets
from capital share transactions 85,495,380
- --------------------------------------------------------------------------------
NET INCREASE (DECREASE) IN NET ASSETS 87,296,395
NET ASSETS
- --------------------------------------------------------------------------------
End of period $87,296,395
================================================================================
TRANSACTIONS IN SHARES OF THE FUND
- --------------------------------------------------------------------------------
Sold 9,213,099
- ----------------------------------------------------------------
Redeemed (671,056)
- --------------------------------------------------------------------------------
Net increase (decrease) in shares of the fund 8,542,043
================================================================================
(1) May 12, 2006 (fund inception) through September 30, 2006.
See Notes to Financial Statements.
- ------
18
Notes to Financial Statements
SEPTEMBER 30, 2006 (UNAUDITED)
1. ORGANIZATION AND SUMMARY OF SIGNIFICANT ACCOUNTING POLICIES
ORGANIZATION -- American Century Investment Trust (the trust) is registered
under the Investment Company Act of 1940 (the 1940 Act) as an open-end
management investment company. NT Diversified Bond Fund (NT Diversified Bond)
(the fund) is one fund in a series issued by the trust. The fund is diversified
under the 1940 Act. The fund's investment objective is to seek a high level of
income by investing in non-money market debt securities. The fund is not
permitted to invest in any securities issued by companies assigned by the Global
Industry Classification Standard to the tobacco industry. The fund incepted on
May 12, 2006. The following is a summary of the fund's significant accounting
policies.
SECURITY VALUATIONS -- Debt securities maturing in greater than 60 days are
valued at current market value as provided by a commercial pricing service or at
the mean of the most recent bid and asked prices. Debt securities maturing
within 60 days may be valued at cost, plus or minus any amortized discount or
premium. Securities traded on foreign securities exchanges and over-the-counter
markets are normally completed before the close of business on days that the New
York Stock Exchange (the Exchange) is open and may also take place on days when
the Exchange is not open. If an event occurs after the value of a security was
established but before the net asset value per share was determined that was
likely to materially change the net asset value, that security would be valued
at fair value as determined in accordance with procedures adopted by the Board
of Trustees. If the fund determines that the market price of a portfolio
security is not readily available, or that the valuation methods mentioned above
do not reflect the security's fair value, such security is valued at its fair
value as determined by, or in accordance with procedures adopted by, the Board
of Trustees or its designee if such fair value determination would materially
impact a fund's net asset value. Certain other circumstances may cause the fund
to fair value a security such as: a security has been declared in default; or
trading in a security has been halted during the trading day; or there is a
foreign market holiday and no trading will commence.
SECURITY TRANSACTIONS -- Security transactions are accounted for as of the trade
date. Net realized gains and losses are determined on the identified cost basis,
which is also used for federal income tax purposes.
INVESTMENT INCOME -- Interest income is recorded on the accrual basis and
includes paydown gain (loss) and accretion of discounts and amortization of
premiums.
WHEN-ISSUED AND FORWARD COMMITMENTS -- The fund may engage in securities
transactions on a when-issued or forward commitment basis. In these
transactions, the securities' prices and yields are fixed on the date of the
commitment. In a when-issued transaction, the payment and delivery are scheduled
for a future date and during this period, securities are subject to market
fluctuations. In a forward commitment transaction, the fund may sell a security
and at the same time make a commitment to purchase the same security at a future
date at a specified price. Conversely, the fund may purchase a security and at
the same time make a commitment to sell the same security at a future date at a
specified price. These types of transactions are executed simultaneously in what
are known as "roll" transactions. The fund will segregate cash, cash equivalents
or other appropriate liquid securities on its records in amounts sufficient to
meet the purchase price. The fund accounts for "roll" transactions as purchases
and sales; as such these transactions may increase portfolio turnover.
FUTURES CONTRACTS -- The fund may enter into futures contracts in order to
manage the fund's exposure to changes in market conditions. One of the risks of
entering into futures contracts is the possibility that the change in value of
the contract may not correlate with the changes in value of the underlying
securities. Upon entering into a futures contract, the fund is required to
deposit either cash or securities in an amount equal to a certain percentage of
the contract value (initial margin). Subsequent payments (variation margin) are
made or received daily, in cash, by the fund. The variation margin is equal to
the daily change in the contract value and is recorded as unrealized gains and
losses. The fund recognizes a realized gain or loss when the contract is closed
or expires. Net realized and unrealized gains or losses occurring during the
holding period of futures contracts are a component of realized gain (loss) on
futures and swaps transactions and unrealized appreciation (depreciation) on
futures and swaps, respectively.
SWAP AGREEMENTS -- The fund may enter into a swap agreement in order to attempt
to obtain or preserve a particular return or spread at a lower cost than
obtaining a return or spread through purchases and/or sales of instruments in
other markets; protect against currency fluctuations; attempt to manage duration
to protect against any increase in the price of securities the fund anticipates
purchasing at a later date; or gain exposure to certain markets in the most
economical way possible. A basic swap agreement is a contract in which two
parties agree to exchange the returns earned or realized on predetermined
investments or instruments. Credit default swaps enable an investor to buy/sell
protection against a
(continued)
- ------
19
Notes to Financial Statements
SEPTEMBER 30, 2006 (UNAUDITED)
1. ORGANIZATION AND SUMMARY OF SIGNIFICANT ACCOUNTING POLICIES (CONTINUED)
credit event of a specific issuer. The seller of credit protection against a
security or basket of securities receives an up-front or periodic payment to
compensate against potential default events. The fund may enhance returns by
selling protection or attempt to mitigate credit risk by buying protection. The
fund will segregate cash, cash equivalents or other appropriate liquid
securities on its records in amounts sufficient to meet requirements. Unrealized
gains are reported as an asset and unrealized losses are reported as a liability
on the Statement of Assets and Liabilities. Swap agreements are valued daily and
changes in value, including the periodic amounts of interest to be paid or
received on swaps, are recorded as unrealized appreciation (depreciation) on
futures and swaps. Realized gain or loss is recorded upon receipt or payment of
a periodic settlement or termination of swap agreements. The risks of entering
into swap agreements include the possible lack of liquidity, failure of the
counterparty to meet its obligations, and that there may be unfavorable changes
in the underlying investments and instruments.
REPURCHASE AGREEMENTS -- The fund may enter into repurchase agreements with
institutions that American Century Investment Management, Inc. (ACIM) (the
investment advisor) has determined are creditworthy pursuant to criteria adopted
by the Board of Trustees. Each repurchase agreement is recorded at cost. The
fund requires that the collateral, represented by securities, received in a
repurchase transaction be transferred to the custodian in a manner sufficient to
enable the fund to obtain those securities in the event of a default under the
repurchase agreement. ACIM monitors, on a daily basis, the securities
transferred to ensure the value, including accrued interest, of the securities
under each repurchase agreement is equal to or greater than amounts owed to the
fund under each repurchase agreement.
JOINT TRADING ACCOUNT -- Pursuant to an Exemptive Order issued by the Securities
and Exchange Commission, the fund, along with other registered investment
companies having management agreements with ACIM or American Century Global
Investment Management, Inc. (ACGIM), may transfer uninvested cash balances into
a joint trading account. These balances are invested in one or more repurchase
agreements that are collateralized by U.S. Treasury or Agency obligations.
INCOME TAX STATUS -- It is the fund's policy to distribute substantially all net
investment income and net realized gains to shareholders and to otherwise
qualify as a regulated investment company under provisions of the Internal
Revenue Code. Accordingly, no provision has been made for federal or state
income taxes.
DISTRIBUTIONS TO SHAREHOLDERS -- Distributions from net investment income for
the fund are declared daily and paid monthly. Distributions from net realized
gains for the fund, if any, are generally declared and paid annually.
INDEMNIFICATIONS -- Under the trust's organizational documents, its officers and
trustees are indemnified against certain liabilities arising out of the
performance of their duties to the fund. In addition, in the normal course of
business, the fund enters into contracts that provide general indemnifications.
The fund's maximum exposure under these arrangements is unknown as this would
involve future claims that may be made against the fund. The risk of material
loss from such claims is considered by management to be remote.
USE OF ESTIMATES -- The financial statements are prepared in conformity with
accounting principles generally accepted in the United States of America, which
may require management to make certain estimates and assumptions at the date of
the financial statements. Actual results could differ from these estimates.
2. FEES AND TRANSACTIONS WITH RELATED PARTIES
MANAGEMENT FEES -- The trust has entered into a Management Agreement with ACIM,
under which ACIM provides the fund with investment advisory and management
services in exchange for a single, unified management fee (the fee). The
Agreement provides that all expenses of the fund, except brokerage commissions,
taxes, interest, fees and expenses of those trustees who are not considered
"interested persons" as defined in the 1940 Act (including counsel fees) and
extraordinary expenses, will be paid by ACIM. The fee is computed and accrued
daily based on the daily net assets of the specific class of shares of the fund
and paid monthly in arrears. The fee consists of (1) an Investment Category Fee
based on the daily net assets of the funds and certain other accounts managed by
the investment advisor that are in the same broad investment category as the
fund and (2) a Complex Fee based on the assets of all the funds in the American
Century family of funds. The rates for the Investment Category Fee range from
0.2925% to 0.4100% and the rates for the Complex Fee range from 0.0500% to
0.1100%. The effective annual management fee for the period May 12, 2006 (fund
inception) through September 30, 2006 was 0.42%.
(continued)
- ------
20
Notes to Financial Statements
SEPTEMBER 30, 2006 (UNAUDITED)
2. FEES AND TRANSACTIONS WITH RELATED PARTIES (CONTINUED)
RELATED PARTIES -- Certain officers and trustees of the trust are also officers
and/or directors, and, as a group, controlling stockholders of American Century
Companies, Inc. (ACC), the parent of the trust's investment advisor, ACIM, the
distributor of the trust, American Century Investment Services, Inc., and the
trust's transfer agent, American Century Services, LLC. The fund is wholly owned
by American Century Asset Allocation Portfolios, Inc. (ACAAP). ACAAP does not
invest in the funds for the purpose of exercising management or control.
JPMorgan Chase Bank is a custodian of the fund and a wholly owned subsidiary of
J.P. Morgan Chase & Co. (JPM). JPM is an equity investor in ACC.
3. INVESTMENT TRANSACTIONS
Purchases of investment securities, excluding short-term investments, for the
period May 12, 2006 (fund inception) through September 30, 2006, totaled
$160,861,786, of which $134,930,061 represented U.S. Treasury and Agency
obligations. Sales of investment securities, excluding short-term investments,
for the period May 12, 2006 (fund inception) through September 30, 2006, totaled
$83,811,766, of which $80,446,984 represented U.S. Treasury and Agency
obligations.
For the period May 12, 2006 (fund inception) through September 30, 2006, the
fund incurred a purchase in kind of debt securities valued at $72,678,664. A
purchase in kind occurs when a fund receives securities into its portfolio in
lieu of cash as payment from a purchasing shareholder.
4. FEDERAL TAX INFORMATION
The book-basis character of distributions made during the year from net
investment income or net realized gains may differ from their ultimate
characterization for federal income tax purposes. These differences reflect the
differing character of paydown losses, certain income items and net realized
gains and losses for financial statement and tax purposes, and may result in
reclassification among certain capital accounts on the financial statements.
Reclassifications between income and realized gain relate primarily to the
character of paydown losses and interest on swap agreements.
As of September 30, 2006, the components of investments for federal income tax
purposes were as follows:
- --------------------------------------------------------------------------------
Federal tax cost of investments $103,609,071
================================================================================
Gross tax appreciation of investments $1,561,778
- ----------------------------------------------------------
Gross tax depreciation of investments (4,536)
- --------------------------------------------------------------------------------
Net tax appreciation (depreciation) of investments $1,557,242
================================================================================
The cost of investments for federal income tax purposes was the same as the cost
for financial reporting purposes.
5. RECENTLY ISSUED ACCOUNTING STANDARDS
In June 2006, the Financial Accounting Standards Board (FASB) issued
Interpretation No. 48, "Accounting for Uncertainty in Income Taxes - an
Interpretation of FASB Statement No. 109" (FIN 48). FIN 48 establishes a minimum
threshold for financial statement recognition of the benefit of positions taken
in filing tax returns (including whether an entity is taxable in a particular
jurisdiction), and requires certain expanded tax disclosures. FIN 48 is
effective for fiscal years beginning after December 15, 2006, and is to be
applied to all open tax years as of the date of effectiveness. The FASB issued
Statement of Financial Accounting Standards No. 157, "Fair Value Measurements"
(FAS 157), in September 2006, which is effective for fiscal years beginning
after November 15, 2007. FAS 157 defines fair value, establishes a framework for
measuring fair value and expands the required financial statement disclosures
about fair value measurements. Management is currently evaluating the impact of
adopting FIN 48 and FAS 157.
- ------
21
NT Diversified Bond - Financial Highlights
For a Share Outstanding Throughout the Period Indicated
- --------------------------------------------------------------------------------
2006(1)
- --------------------------------------------------------------------------------
PER-SHARE DATA
- --------------------------------------------------------------------------------
Net Asset Value, Beginning of Period $10.00
- --------------------------------------------------------------------------------
Income From Investment Operations
- ----------------------------------------------------------------
Net Investment Income (Loss)(2) 0.20
- ----------------------------------------------------------------
Net Realized and Unrealized Gain (Loss) 0.22
- --------------------------------------------------------------------------------
Total From Investment Operations 0.42
- --------------------------------------------------------------------------------
Distributions
- ----------------------------------------------------------------
From Net Investment Income (0.20)
- --------------------------------------------------------------------------------
Net Asset Value, End of Period $10.22
================================================================================
TOTAL RETURN(3) 4.20%
- --------------------------------------------------------------------------------
RATIOS/SUPPLEMENTAL DATA
- --------------------------------------------------------------------------------
Ratio of Operating Expenses to Average Net Assets 0.42%(4)
- ----------------------------------------------------------------
Ratio of Net Investment Income (Loss) to Average Net Assets 5.05%(4)
- ----------------------------------------------------------------
Portfolio Turnover Rate 124%
- ----------------------------------------------------------------
Net Assets, End of Period (in thousands) $87,296
- --------------------------------------------------------------------------------
(1) May 12, 2006 (fund inception) through September 30, 2006 (unaudited).
(2) Computed using average shares outstanding throughout the period.
(3) Total return assumes reinvestment of net investment income and capital
gains distributions, if any. Total returns for periods less than one year
are not annualized.
(4) Annualized.
See Notes to Financial Statements.
- ------
22
Additional Information
RETIREMENT ACCOUNT INFORMATION
As required by law, any distributions you receive from an IRA or certain 403(b),
457 and qualified plans [those not eligible for rollover to an IRA or to another
qualified plan] are subject to federal income tax withholding, unless you elect
not to have withholding apply. Tax will be withheld on the total amount
withdrawn even though you may be receiving amounts that are not subject to
withholding, such as nondeductible contributions. In such case, excess amounts
of withholding could occur. You may adjust your withholding election so that a
greater or lesser amount will be withheld.
If you don't want us to withhold on this amount, you must notify us to not
withhold the federal income tax. Even if you plan to roll over the amount you
withdraw to another tax-deferred account, the withholding rate still applies to
the withdrawn amount unless we have received notice not to withhold federal
income tax prior to the withdrawal. You may notify us in writing or in certain
situations by telephone or through other electronic means. You have the right to
revoke your withholding election at any time and any election you make may
remain in effect until revoked by filing a new election.
Remember, even if you elect not to have income tax withheld, you are liable for
paying income tax on the taxable portion of your withdrawal. If you elect not to
have income tax withheld or you don't have enough income tax withheld, you may
be responsible for payment of estimated tax. You may incur penalties under the
estimated tax rules if your withholding and estimated tax payments are not
sufficient.
State tax will be withheld if, at the time of your distribution, your address is
within one of the mandatory withholding states and you have federal income tax
withheld. State taxes will be withheld from your distribution in accordance with
the respective state rules.
PROXY VOTING GUIDELINES
American Century Investment Management, Inc., the fund's investment advisor, is
responsible for exercising the voting rights associated with the securities
purchased and/or held by the fund. A description of the policies and procedures
the advisor uses in fulfilling this responsibility is available without charge,
upon request, by calling 1-800-345-2021. It is also available on American
Century's website at americancentury.com and on the Securities and Exchange
Commission's website at sec.gov. Information regarding how the investment
advisor voted proxies relating to portfolio securities during the most recent
12-month period ended June 30 is available on the "About Us" page at
americancentury.com. It is also available at sec.gov.
(continued)
- ------
23
Additional Information
QUARTERLY PORTFOLIO DISCLOSURE
The fund files its complete schedule of portfolio holdings with the Securities
and Exchange Commission (SEC) for the first and third quarters of each fiscal
year on Form N-Q. The fund's Form N-Q is available on the SEC's website at
sec.gov, and may be reviewed and copied at the SEC's Public Reference Room in
Washington, DC. Information on the operation of the Public Reference Room may be
obtained by calling 1-800-SEC-0330. The fund also makes its complete schedule of
portfolio holdings for the most recent quarter of its fiscal year available on
its website at americancentury.com and, upon request, by calling 1-800-345-2021.
- ------
24
Index Definitions
The following indices are used to illustrate investment market, sector, or style
performance or to serve as fund performance comparisons. They are not investment
products available for purchase.
The CITIGROUP US BROAD INVESTMENT-GRADE (USBIG) BOND INDEX is a
market-capitalization-weighted index that includes fixed-rate Treasury,
government-sponsored, mortgage, asset-backed, and investment-grade issues with a
maturity of one year or longer.
The LEHMAN BROTHERS U.S. AGENCY INDEX is composed of those securities included
in the Lehman Brothers U.S. Aggregate Index that are public obligations of U.S.
government agencies, quasi-federal corporations, and corporate or foreign debt
guaranteed by the U.S. government.
The LEHMAN BROTHERS U.S. AGGREGATE INDEX represents securities that are taxable,
registered with the Securities and Exchange Commission, and U.S.
dollar-denominated. The index covers the U.S. investment-grade fixed-rate bond
market, with index components for government and corporate securities, mortgage
pass-through securities, and asset-backed securities.
The LEHMAN BROTHERS U.S. CORPORATE INDEX is composed of those securities
included in the Lehman Brothers U.S. Aggregate Index that are U.S.
dollar-denominated, investment-grade, fixed-rate, taxable securities sold by
industrial, utility and financial issuers.
The LEHMAN BROTHERS U.S. FIXED-RATE MORTGAGE-BACKED SECURITIES (MBS) INDEX is
the MBS Fixed-Rate component of the Lehman Brothers U.S. Aggregate Index. It
covers the mortgage-backed pass-through securities of the Government National
Mortgage Association (GNMA), the Federal National Mortgage Association (FNMA),
and the Federal Home Loan Mortgage Corporation (FHLMC).
The LEHMAN BROTHERS U.S. TREASURY INDEX is composed of those securities included
in the Lehman Brothers U.S. Aggregate Index that are public obligations of the
U.S. Treasury with a remaining maturity of one year or more.
- ------
25
Notes
- ------
26
Notes
- ------
27
Notes
- ------
28
CONTACT US
AMERICANCENTURY.COM
AUTOMATED INFORMATION LINE:
1-800-345-8765
INVESTOR SERVICES REPRESENTATIVE:
1-800-345-2021 or 816-531-5575
BUSINESS, NOT-FOR-PROFIT,
EMPLOYER-SPONSORED RETIREMENT PLANS:
1-800-345-3533
BANKS AND TRUST COMPANIES, BROKER-DEALERS,
FINANCIAL PROFESSIONALS, INSURANCE COMPANIES:
1-800-345-6488
TELECOMMUNICATIONS DEVICE FOR THE DEAF:
1-800-634-4113 or 816-444-3485
AMERICAN CENTURY INVESTMENT TRUST
INVESTMENT ADVISOR:
American Century Investment Management, Inc.
Kansas City, Missouri
THIS REPORT AND THE STATEMENTS IT CONTAINS ARE SUBMITTED FOR THE GENERAL
INFORMATION OF OUR SHAREHOLDERS. THE REPORT IS NOT AUTHORIZED FOR DISTRIBUTION
TO PROSPECTIVE INVESTORS UNLESS PRECEDED OR ACCOMPANIED BY AN EFFECTIVE
PROSPECTUS.
The American Century Investments logo, American Century
and American Century Investments are service marks
of American Century Proprietary Holdings, Inc.
0611
SH-SAN-51673N
American Century Investment Services, Inc., Distributor
(c)2006 American Century Proprietary Holdings, Inc. All rights reserved.
ITEM 2. CODE OF ETHICS.
Not applicable for semiannual report filings.
ITEM 3. AUDIT COMMITTEE FINANCIAL EXPERT.
Not applicable for semiannual report filings.
ITEM 4. PRINCIPAL ACCOUNTANT FEES AND SERVICES.
Not applicable for semiannual report filings.
ITEM 5. AUDIT COMMITTEE OF LISTED REGISTRANTS.
Not applicable.
ITEM 6. SCHEDULE OF INVESTMENTS.
The schedule of investments is included as part of the report to stockholders
filed under Item 1 of this Form.
ITEM 7. DISCLOSURE OF PROXY VOTING POLICIES AND PROCEDURES FOR CLOSED-END
MANAGEMENT INVESTMENT COMPANIES.
Not applicable.
ITEM 8. PORTFOLIO MANAGERS OF CLOSED-END MANAGEMENT INVESTMENT COMPANIES.
Not applicable.
ITEM 9. PURCHASES OF EQUITY SECURITIES BY CLOSED-END MANAGEMENT INVESTMENT
COMPANY AND AFFILIATED PURCHASERS.
Not applicable.
ITEM 10. SUBMISSION OF MATTERS TO A VOTE OF SECURITY HOLDERS.
During the reporting period, there were no material changes to the procedures by
which shareholders may recommend nominees to the registrant's board.
ITEM 11. CONTROLS AND PROCEDURES.
(a) The registrant's principal executive officer and principal financial
officer have concluded that the registrant's disclosure controls and
procedures (as defined in Rule 30a-3(c) under the Investment Company Act of
1940) are effective based on their evaluation of these controls and
procedures as of a date within 90 days of the filing date of this report.
(b) There were no changes in the registrant's internal control over financial
reporting (as defined in Rule 30a-3(d) under the Investment Company Act of
1940) that occurred during the registrant's second fiscal quarter of the
period covered by this report that have materially affected, or are
reasonably likely to materially affect, the registrant's internal control
over financial reporting.
ITEM 12. EXHIBITS.
(a)(1) Not applicable for semiannual report filings.
(a)(2) Separate certifications by the registrant's principal executive officer
and principal financial officer, pursuant to Section 302 of the
Sarbanes-Oxley Act of 2002 and Rule 30a-2(a) under the Investment
Company Act of 1940, are filed and attached hereto as Exhibit
99.302CERT.
(a)(3) Not applicable.
(b) A certification by the registrant's chief executive officer and chief
financial officer, pursuant to Section 906 of the Sarbanes-Oxley Act of
2002, is furnished and attached hereto as Exhibit 99.906CERT.
SIGNATURES
Pursuant to the requirements of the Securities Exchange Act of 1934 and the
Investment Company Act of 1940, the registrant has duly caused this report to be
signed on its behalf by the undersigned, thereunto duly authorized.
Registrant: AMERICAN CENTURY INVESTMENT TRUST
By: /s/ William M. Lyons
--------------------------------------
Name: William M. Lyons
Title: President
Date: November 28, 2006
Pursuant to the requirements of the Securities Exchange Act of 1934 and the
Investment Company Act of 1940, this report has been signed below by the
following persons on behalf of the registrant and in the capacities and on the
dates indicated.
By: /s/ William M. Lyons
--------------------------------------
Name: William M. Lyons
Title: President
(principal executive officer)
Date: November 28, 2006
By: /s/ Robert J. Leach
--------------------------------------
Name: Robert J. Leach
Title: Vice President, Treasurer, and
Chief Financial Officer
(principal financial officer)
Date: November 28, 2006