UNITED STATES
SECURITIES AND EXCHANGE COMMISSION
Washington, D.C. 20549
FORM N-CSR
CERTIFIED SHAREHOLDER REPORT OF REGISTERED
MANAGEMENT INVESTMENT COMPANIES
Investment Company Act file number 811-7822
---------------------------------------------
AMERICAN CENTURY INVESTMENT TRUST
- --------------------------------------------------------------------------------
(Exact name of registrant as specified in charter)
4500 MAIN STREET, KANSAS CITY, MISSOURI 64111
- --------------------------------------------------------------------------------
(Address of principal executive offices) (Zip code)
CHARLES A. ETHERINGTON, 4500 MAIN STREET, KANSAS CITY, MISSOURI 64111
- --------------------------------------------------------------------------------
(Name and address of agent for service)
Registrant's telephone number, including area code: 816-531-5575
-----------------------------
Date of fiscal year end: 03-31
------------------------------------------------------
Date of reporting period: 09-30-2007
------------------------------------------------------
ITEM 1. REPORTS TO STOCKHOLDERS.
[front cover]
AMERICAN CENTURY INVESTMENTS
Semiannual Report September 30, 2007
[photo of fall]
Prime Money Market Fund
[american century investments logo and text logo]
OUR MESSAGE TO YOU
To help you monitor your investment, my colleagues and I take pride in
providing you with the semiannual report for the American Century® Prime Money
Market Fund for the six months ended September 30, 2007. This has been an
eventful and exciting period for us. We've been working diligently to secure a
smooth executive leadership transition.
I'm honored to be addressing you in the "Our Message" space long devoted to
company founder Jim Stowers, Jr. and his son Jim Stowers III. The Stowers
family remains an integral part of our heritage, leadership, and financial
structure. Jim Jr. continues as co-chair of the American Century Companies,
Inc. (ACC) board of directors with Richard Brown, who has been on the board
since 1998 and co-chairs the Stowers Institute for Medical Research board.
But times and opportunities change. As the latest step in a career transition
that began when he relinquished his executive leadership and investment
management responsibilities in early 2005, Jim III stepped down from the ACC
board in July 2007 to focus on new business ventures. Jim III's move reflects
his family's comfort with our direction and leadership, and gives the Stowers
more leeway to devote time and energy to other important priorities, such as
the Stowers Institute for Medical Research.
Meanwhile, American Century Investments, our clients, and our employees have
been my top priority since I became company president and CEO in March. We've
also added the executive talents of overall chief investment officer Enrique
Chang, international equity CIO Mark On, U.S. growth equity CIO Steve Lurito,
and chief operating officer Barry Fink.
This skilled group, combined with our existing senior management team, has
already had a positive impact on the development and management of the
products and services we take pride in delivering to you.
/s/Jonathan Thomas
Jonathan Thomas
[photo of Jonathan Thomas]
Jonathan Thomas
PRESIDENT
AMERICAN CENTURY COMPANIES, INC.
[photo of James E. Stowers, Jr.]
James E. Stowers, Jr.
FOUNDER AND CO-CHAIRMAN OF THE BOARD
AMERICAN CENTURY COMPANIES, INC.
[photo of Richard Brown]
Richard Brown
CO-CHAIRMAN OF THE BOARD
AMERICAN CENTURY COMPANIES, INC.
TABLE OF CONTENTS
Market Perspective. . . . . . . . . . . . . . . . . . . . . . . . . . 2
U.S. Fixed-Income Total Returns. . . . . . . . . . . . . . . . . . 2
PRIME MONEY MARKET FUND
Performance . . . . . . . . . . . . . . . . . . . . . . . . . . . . . 3
Portfolio Commentary. . . . . . . . . . . . . . . . . . . . . . . . . 4
Portfolio Composition by Credit Rating . . . . . . . . . . . . . . 4
Yields and Weighted Average Maturity . . . . . . . . . . . . . . . 4
Portfolio Composition by Maturity. . . . . . . . . . . . . . . . . 5
Shareholder Fee Example . . . . . . . . . . . . . . . . . . . . . . . 6
Schedule of Investments . . . . . . . . . . . . . . . . . . . . . . . 8
FINANCIAL STATEMENTS
Statement of Assets and Liabilities . . . . . . . . . . . . . . . . . 14
Statement of Operations . . . . . . . . . . . . . . . . . . . . . . . 15
Statement of Changes in Net Assets. . . . . . . . . . . . . . . . . . 16
Notes to Financial Statements . . . . . . . . . . . . . . . . . . . . 17
Financial Highlights. . . . . . . . . . . . . . . . . . . . . . . . . 21
OTHER INFORMATION
Proxy Voting Results. . . . . . . . . . . . . . . . . . . . . . . . . 25
Approval of Management Agreement for Prime Money Market . . . . . . . 27
Share Class Information . . . . . . . . . . . . . . . . . . . . . . . 32
Additional Information. . . . . . . . . . . . . . . . . . . . . . . . 33
Index Definitions . . . . . . . . . . . . . . . . . . . . . . . . . . 34
The opinions expressed in the Market Perspective and the Portfolio Commentary
reflect those of the portfolio management team as of the date of the report,
and do not necessarily represent the opinions of American Century or any other
person in the American Century organization. Any such opinions are subject to
change at any time based upon market or other conditions and American Century
disclaims any responsibility to update such opinions. These opinions may not
be relied upon as investment advice and, because investment decisions made by
American Century funds are based on numerous factors, may not be relied upon
as an indication of trading intent on behalf of any American Century fund.
Security examples are used for representational purposes only and are not
intended as recommendations to purchase or sell securities. Performance
information for comparative indices and securities is provided to American
Century by third party vendors. To the best of American Century's knowledge,
such information is accurate at the time of printing.
MARKET PERSPECTIVE
[photo of Chief Investment Officer]
By David MacEwen, Chief Investment Officer, Fixed-Income
MODEST GROWTH, INFLATION, BOND RETURNS
U.S. bonds managed positive returns during the six months ended September 30,
2007. But the ride was bumpy -- bond market volatility surged to the highest
level in years as waves from the bursting housing and subprime mortgage
bubbles spread to the broader economy and financial markets.
U.S. economic growth was moderate over the last four complete calendar
quarters, running at an approximately 2 - 3% average annual rate. Many
economists are calling for sub-2% growth going forward. Inflation slowed, as
the trailing 12-month percentage change in core consumer prices (without
volatile food and energy prices) finished September at 2.1%. That's down from
2.9% as recently as September 2006.
To help alleviate some of the market and economic concerns, the Federal
Reserve (the Fed) lowered its benchmark federal funds rate target in
September. This came on top of cuts to its discount rate in both August and
September -- the Fed's first rate cuts since June 2003.
RATES FELL, CURVE STEEPENED
Against that backdrop, Treasury yields generally declined. The yield on the
two-year Treasury note fell from 4.58% to 3.99%; however, yields on
longer-term notes and bonds fell less. That's because investors worried about
the potential long-term inflation effects of Fed rate cuts, high energy and
commodity prices, and a weaker dollar. As a result, the yield curve (a graphic
representation of bond yields at different maturities) fell and steepened --
the difference in yield between two- and 10-year Treasury securities increased
sharply from seven to 60 basis points (a basis point equals 0.01%).
HIGH-QUALITY BONDS DID BEST
The volatility, credit, and liquidity concerns in the market all favored
Treasury securities over higher-yielding, lower-quality alternatives (see the
returns table above). So, for example, while the Treasury market enjoyed its
best quarter in five years from July to September, July was one of the worst
months on record for high-yield bonds. Treasury inflation-indexed securities
performed best because of their combination of high credit quality and
inflation protection.
U.S. Fixed-Income Total Returns
For the six months ended September 30, 2007*
TREASURY SECURITIES
3-Month Bill 2.69%
2-Year Note 3.25%
5-Year Note 3.60%
10-Year Note 2.72%
30-Year Bond 2.57%
CITIGROUP US BOND MARKET INDICES
High-Yield (corporate) 0.65%
Credit (investment-grade corporate) 1.50%
Mortgage 2.16%
Broad Investment-Grade (multi-sector) 2.42%
Agency 3.04%
Treasury 3.38%
Inflation-Linked Securities 3.76%
*Total returns for periods less than one year are not annualized.
- ------
2
PERFORMANCE
Prime Money Market
Total Returns as of September 30, 2007
Average Annual Returns
6 10 Since Inception
months(1) 1 year 5 years years Inception Date
INVESTOR CLASS 2.46%(2) 4.95%(2) 2.55% 3.49% 3.93% 11/17/93
90-DAY U.S.
TREASURY BILL
INDEX 2.24% 4.73% 2.79% 3.55% 3.95%(3) --
LIPPER MONEY
MARKET
INSTRUMENT
FUNDS AVERAGE
RETURN(4) 2.26% 4.56% 2.24% 3.19% 3.69%(3) --
Fund's Lipper
Ranking among
Money Market
Instrument 41 of 25 of
Funds(4) 62 of 348 58 of 334 61 of 294 188 122(3) --
A Class(5)
No sales
charge* 2.33%(2) 4.69%(2) 2.30% -- 3.06%
With sales
charge* 1.33%(2) 4.69%(2) 2.30% -- 3.06% 8/28/98
B Class
No sales
charge* 1.95%(2) 3.91%(2) -- -- 1.85%(2)
With sales
charge* -3.05%(2) -0.09%(2) -- -- 1.45%(2) 1/31/03
C Class
No sales
charge* 2.07%(2) 4.17%(2) 1.88%(2) -- 1.79%(2)
With sales
charge* 1.32%(2) 4.17%(2) 1.88%(2) -- 1.79%(2) 5/7/02
* Sales charges include initial sales charges and contingent deferred sales
charges (CDSCs), as applicable. (Please see the Share Class Information page
for more about the applicable sales charges for each share class.) The SEC
requires that mutual funds provide performance information net of maximum
sales charges in all cases where charges could be applied.
(1) Total returns for periods less than one year are not annualized.
(2) Class returns would have been lower if American Century had not
voluntarily waived a portion of its management fees or its distribution and
service fees, as applicable.
(3) Since 11/30/93, the date nearest the Investor Class's inception for which
data are available.
(4) Data provided by Lipper Inc. - A Reuters Company. © 2007 Reuters. All
rights reserved. Any copying, republication or redistribution of Lipper
content, including by caching, framing or similar means, is expressly
prohibited without the prior written consent of Lipper. Lipper shall not be
liable for any errors or delays in the content, or for any actions taken in
reliance thereon.
Lipper Fund Performance -- Performance data is total return, and is
preliminary and subject to revision.
Lipper Rankings -- Rankings are based only on the universe shown and are
based on average annual total returns. This listing might not represent the
complete universe of funds tracked by Lipper.
The data contained herein has been obtained from company reports, financial
reporting services, periodicals and other resources believed to be reliable.
Although carefully verified, data on compilations is not guaranteed by Lipper
and may be incomplete. No offer or solicitations to buy or sell any of the
securities herein is being made by Lipper.
(5) Prior to September 4, 2007, the A Class was referred to as the Advisor
Class. Performance, with sales charge, prior to that date has been adjusted to
reflect the A Class's current sales charge.
Data presented reflect past performance. Past performance is no guarantee of
future results. Current performance may be higher or lower than the
performance shown. To obtain performance data current to the most recent month
end, please call 1-800-345-2021 or visit americancentury.com.
An investment in the fund is not insured or guaranteed by the Federal Deposit
Insurance Corporation or any other government agency. Although the fund seeks
to preserve the value of your investment at $1.00 per share, it is possible to
lose money by investing in the fund.
The 7-day current yield more closely reflects the current earnings of the fund
than the total return.
- ------
3
PORTFOLIO COMMENTARY
Prime Money Market
Lead Portfolio Manager: Denise Latchford
Macro Strategy Team Representative: Steven Permut
PERFORMANCE SUMMARY
Prime Money Market returned 2.46%* for the six months ended September 30,
2007, outperforming the 2.26% average return of the 348 funds in Lipper Inc.'s
Money Market Funds category. The portfolio's six-month return ranked in the
top 18% of the Lipper category, and its five- and 10-year returns ranked in
the top 21% and 22%, respectively, of the Lipper group (see the previous page).
CREDIT CRUNCH PROMPTED FED RATE CUTS
For much of the reporting period, a lingering threat of inflation kept the
Federal Reserve (Fed) on hold, and the federal (fed) funds rate target at
5.25%. Despite increasing burdens on economic growth from the housing market
slump and high energy prices, the Fed continued to view inflation as a bigger
concern than recession. Money market rates declined slightly during this
period of Fed inactivity. This was due to reduced Treasury bill issuance
stemming from surprisingly strong federal tax receipts in April.
In late July, credit and liquidity concerns took hold of the financial
markets. The bulk of the problems were confined to the bond market, but the
panic eventually filtered through to the asset-backed segment of the money
market. Many organizations regularly use asset-backed commercial paper. They
issue this short-term debt to purchase higher-yielding, longer-term
securities, such as those backed by credit card debt, student loans and
mortgage loans. But what was unclear and worrisome to many investors was the
extent of subprime mortgage exposure within these asset-backed and structured
finance securities.
The mounting credit crisis sent investors fleeing to the safety of U.S.
Treasury securities. It also sent U.S. economic growth prospects tumbling.
* All fund returns, rankings and yields referenced in this commentary are for
Investor Class shares. Class returns would have been lower had management fees
not been waived. Total returns for periods less than one year are not
annualized.
Portfolio Composition by Credit Rating
% of fund % of fund
investments investments
as of as of
9/30/07 3/31/07
A-1+ 74% 72%
A-1 26% 28%
Ratings provided by independent research companies. These ratings are listed
in Standard & Poor's format even if they were provided by other sources.
Yields and Weighted Average Maturity
7-DAY CURRENT YIELD* AS OF SEPTEMBER 30, 2007
Investor Class 4.87%
A Class 4.62%
B Class 3.87%
C Class 4.12%
7-DAY EFFECTIVE YIELD* AS OF SEPTEMBER 30, 2007
Investor Class 4.99%
A Class 4.73%
B Class 3.94%
C Class 4.20%
9/30/07 3/31/07
Weighted Average
Maturity 45 days 43 days
* The yields presented reflect the waiver of a portion of the fund's
management fees. Without such waiver, the 7-day yields would have been lower.
- ------
4
Prime Money Market
The Fed took action, first cutting the discount rate in August and later, on
September 18, reducing the fed funds rate target to 4.75% as it cut the
discount rate again. These represented the Fed's first rate cuts since June
25, 2003.
The yield on the benchmark three-month Treasury bill fell 123 basis points
during the reporting period from 5.04% to 3.81% (a basis point equals 0.01%).
The bulk of the decline occurred during the third quarter of 2007, when the
yield dropped 100 basis points.
PORTFOLIO STRATEGY
Prime Money Market's 7-day current yield ended the reporting period at 4.87%,
only one basis point higher than it was on March 31, 2007.
Early in the reporting period we extended the portfolio's average maturity to
approximately 50 days, which helped lock in higher yields in a declining-yield
environment. Then, with credit concerns mounting and the demand for Treasury
bills skyrocketing, the portfolio's average maturity began drifting downward.
The heightened demand meant there were fewer bills available and,
consequently, little opportunity to maintain a longer average maturity.
At the height of the credit meltdown, we reaffirmed our commitment to
liquidity, focusing on the shortest-term, most-liquid securities. The
portfolio held no securities exposed to the subprime market and no
mortgage-related asset-backed commercial paper. Such securities do not meet
the portfolio's stringent selection criteria. At the same time, the portfolio
avoided any securities the team felt were at risk of losing liquidity due to
the "contagion effect."
With a Fed rate cut imminent, we attempted to extend the portfolio's average
maturity by purchasing longer-term CDs and commercial paper. Extending was not
easy, though, as longer-term paper remained in limited supply. The portfolio's
average maturity ended the reporting period at 45 days.
OUTLOOK
Based on futures prices at the end of the reporting period, the bond market
expected the Fed to cut the fed funds rate target at least one more time by
the end of 2007. We agree with that market assessment. We also believe the Fed
still faces a major challenge in shoring up confidence in the financial
markets without igniting inflation or re-inflating the speculative bubbles
that developed in the credit, real estate and leveraged-buyout markets. Going
forward we think the Fed will proceed cautiously in cutting rates, to further
assess economic conditions and the impact of September's unexpectedly large
rate cut.
Portfolio Composition by Maturity
% of fund % of fund
investments investments
as of as of
9/30/07 3/31/07
1-30 days 47% 56%
31-90 days 42% 32%
91-180 days 10% 9%
More than 180 days 1% 3%
- ------
5
SHAREHOLDER FEE EXAMPLE (UNAUDITED)
Fund shareholders may incur two types of costs: (1) transaction costs,
including sales charges (loads) on purchase payments and redemption/exchange
fees; and (2) ongoing costs, including management fees; distribution and
service (12b-1) fees; and other fund expenses. This example is intended to
help you understand your ongoing costs (in dollars) of investing in your fund
and to compare these costs with the ongoing cost of investing in other mutual
funds.
The example is based on an investment of $1,000 made at the beginning of the
period and held for the entire period from April 1, 2007 to September 30, 2007.
ACTUAL EXPENSES
The table provides information about actual account values and actual expenses
for each class. You may use the information, together with the amount you
invested, to estimate the expenses that you paid over the period. First,
identify the share class you own. Then simply divide your account value by
$1,000 (for example, an $8,600 account value divided by $1,000 = 8.6), then
multiply the result by the number under the heading "Expenses Paid During
Period" to estimate the expenses you paid on your account during this period.
If you hold Investor Class shares of any American Century fund, or
Institutional Class shares of the American Century Diversified Bond Fund, in
an American Century account (i.e., not a financial intermediary or retirement
plan account), American Century may charge you a $12.50 semiannual account
maintenance fee if the value of those shares is less than $10,000. We will
redeem shares automatically in one of your accounts to pay the $12.50 fee. In
determining your total eligible investment amount, we will include your
investments in all PERSONAL ACCOUNTS (including American Century Brokerage
accounts) registered under your Social Security number. PERSONAL ACCOUNTS
include individual accounts, joint accounts, UGMA/UTMA accounts, personal
trusts, Coverdell Education Savings Accounts and IRAs (including traditional,
Roth, Rollover, SEP-, SARSEP- and SIMPLE-IRAs), and certain other retirement
accounts. If you have only business, business retirement, employer-sponsored
or American Century Brokerage accounts, you are currently not subject to this
fee. We will not charge the fee as long as you choose to manage your accounts
exclusively online. If you are subject to the Account Maintenance Fee, your
account value could be reduced by the fee amount.
HYPOTHETICAL EXAMPLE FOR COMPARISON PURPOSES
The table also provides information about hypothetical account values and
hypothetical expenses based on the actual expense ratio of each class of your
fund and an assumed rate of return of 5% per year before expenses, which is
not the actual return of a fund's share class. The hypothetical account values
and expenses may not be used to estimate the actual ending account balance or
expenses you paid for the period. You may use this information to compare the
ongoing costs of investing in your fund and other funds. To do so, compare
this 5% hypothetical example with the 5% hypothetical examples that appear in
the shareholder reports of the other funds.
Please note that the expenses shown in the table are meant to highlight your
ongoing costs only and do not reflect any transactional costs, such as sales
charges (loads) or redemption/exchange fees. Therefore, the table is useful in
comparing ongoing costs only, and will not help you determine the relative
total costs of owning different funds. In addition, if these transactional
costs were included, your costs would have been higher.
- ------
6
Expenses Paid
Beginning During
Account Ending Period(1) Annualized
Value Account Value 4/1/07 - Expense
4/1/07 9/30/07 9/30/07 Ratio(1)
ACTUAL
Investor Class (after
waiver)(2) $1,000 $1,024.60 $2.78 0.55%
Investor Class (before
waiver) $1,000 $1,024.60(3) $2.99 0.59%
A Class (after
waiver)(2) $1,000 $1,023.30 $4.05 0.80%
A Class (before waiver) $1,000 $1,023.30(3) $4.25 0.84%
B Class (after
waiver)(2) $1,000 $1,019.50 $7.83 1.55%
B Class (before waiver) $1,000 $1,019.50(3) $8.03 1.59%
C Class (after
waiver)(2) $1,000 $1,020.70 $6.57 1.30%
C Class (before waiver) $1,000 $1,020.70(3) $6.77 1.34%
HYPOTHETICAL
Investor Class (after
waiver)(2) $1,000 $1,022.25 $2.78 0.55%
Investor Class (before
waiver) $1,000 $1,022.05 $2.98 0.59%
A Class (after
waiver)(2) $1,000 $1,021.00 $4.04 0.80%
A Class (before waiver) $1,000 $1,020.80 $4.24 0.84%
B Class (after
waiver)(2) $1,000 $1,017.25 $7.82 1.55%
B Class (before waiver) $1,000 $1,017.05 $8.02 1.59%
C Class (after
waiver)(2) $1,000 $1,018.50 $6.56 1.30%
C Class (before waiver) $1,000 $1,018.30 $6.76 1.34%
(1) Expenses are equal to the class's annualized expense ratio listed in the
table above, multiplied by the average account value over the period,
multiplied by 183, the number of days in the most recent fiscal half-year,
divided by 366, to reflect the one-half year period.
(2) During the six months ended September 30, 2007, the class received a
partial waiver of its management fees.
(3) Ending account value assumes the return earned after waiver. The return
would have been lower had fees not been waived and would have resulted in a
lower ending account value.
- ------
7
SCHEDULE OF INVESTMENTS
PRIME MONEY MARKET
SEPTEMBER 30, 2007 (UNAUDITED)
Principal Amount Value
Commercial Paper(1) -- 50.9%
$28,000,000 Allied Irish Banks N.A., 5.20%, 10/29/07
(Acquired 5/29/07, Cost $27,381,200)(2) $ 27,886,755
9,000,000 Amstel Funding Corp., 5.20%, 11/21/07 (Acquired
6/4/07, Cost $8,779,000)(2) 8,933,700
25,000,000 Bank of America Corp., 5.19%, 11/30/07 24,783,958
15,000,000 BASF AG, 5.25%, 10/2/07 (Acquired 7/2/07,
Cost $14,798,750)(2) 14,997,813
8,000,000 Cedar Springs Capital Co., 5.75%, 10/1/07
(Acquired 9/28/07, Cost $7,996,167)(2) 8,000,000
12,600,000 Cedar Springs Capital Co., 6.30%, 10/19/07
(Acquired 9/5/07, Cost $12,502,980)(2) 12,560,310
13,000,000 Cedar Springs Capital Co., 6.28%, 11/16/07
(Acquired 9/5/07, Cost $12,836,720)(2) 12,895,682
50,000,000 Chariot Funding LLC, 6.10%, 11/13/07 (Acquired
8/31/07, Cost $49,373,056)(2) 49,635,694
15,000,000 Chariot Funding LLC, 5.15%, 11/27/07 (Acquired
9/25/07, Cost $14,864,813)(2) 14,877,687
13,000,000 Chariot Funding LLC, 5.50%, 12/14/07 (Acquired
9/17/07, Cost $12,825,222)(2) 12,853,028
40,000,000 Charta LLC, 5.26%, 11/6/07 (Acquired 8/1/07,
Cost $39,433,089)(2) 39,789,600
30,000,000 Charta LLC, 5.80%, 1/28/08 (Acquired 8/31/07,
Cost $29,294,333)(2) 29,424,833
19,000,000 Citibank Credit Card Issuance Trust, Series 2007
A3, 6.05%, 10/31/07 (Acquired 8/17/07, Cost
$18,760,521)(2) 18,904,209
50,000,000 Cobbler Funding Ltd./Cobbler Funding LLC, 5.28%,
10/25/07 (Acquired 7/25/07, Cost $49,325,333)(2) 49,824,000
7,000,000 Cobbler Funding Ltd./Cobbler Funding LLC, 5.21%,
1/23/08 (Acquired 6/12/07, Cost $6,774,089)(2) 6,884,512
18,000,000 CRC Funding LLC, 5.27%, 11/5/07 (Acquired
8/3/07, Cost $17,752,310)(2) 17,907,775
19,400,000 CRC Funding LLC, 5.95%, 11/13/07 (Acquired
9/13/07, Cost $19,204,410)(2) 19,262,125
Principal Amount Value
$40,000,000 CRC Funding LLC, 5.05%, 1/29/08 (Acquired
9/21/07, Cost $39,270,556)(2) $ 39,326,667
31,349,000 Crown Point Capital Co., 5.24%, 10/18/07
(Acquired 7/17/07-7/30/07, Cost $30,927,012)(2) 31,271,390
1,013,000 Crown Point Capital Co., 5.30%, 10/22/07
(Acquired 7/30/07, Cost $1,000,473)(2) 1,009,868
33,000,000 Crown Point Capital Co., 5.27%, 11/9/07
(Acquired 8/3/07-9/28/07, Cost $32,618,283)(2) 32,811,565
10,000,000 Crown Point Capital Co., 5.85%, 2/25/08
(Acquired 9/17/07, Cost $9,738,375)(2) 9,761,125
2,200,000 Danske Corp., 5.23%, 11/19/07 (Acquired 6/22/07,
Cost $2,152,104)(2) 2,184,354
50,000,000 Danske Corp., 5.36%, 3/4/08 (Acquired 8/31/07,
Cost $48,645,111)(2) 48,846,111
2,575,000 Depfa Bank plc, 5.55%, 10/22/07 (Acquired
8/13/07, Cost $2,547,211)(2) 2,566,663
28,000,000 Depfa Bank plc, 5.45%, 11/13/07 (Acquired
8/13/07, Cost $27,610,022)(2) 27,817,728
30,000,000 Emerald Notes of the BA Credit Card Trust,
5.26%, 10/29/07 (Acquired 7/23/07, Cost
$29,570,842)(2) 29,877,384
8,000,000 Emerald Notes of the BA Credit Card Trust,
5.28%, 11/1/07 (Acquired 8/1/07, Cost
$7,892,053)(2) 7,963,626
10,000,000 Govco Incorporated, 5.25%, 10/2/07 (Acquired
7/2/07, Cost $9,865,833)(2) 9,998,541
46,000,000 Govco Incorporated, 5.24%, 10/23/07 (Acquired
7/23/07, Cost $45,384,009)(2) 45,852,698
10,000,000 Govco Incorporated, 5.21%, 12/31/07 (Acquired
7/2/07, Cost $9,736,606)(2) 9,868,303
5,000,000 HBOS Treasury Services plc, 5.17%, 11/13/07 4,969,153
20,000,000 HBOS Treasury Services plc, 5.67%, 12/10/07 19,779,500
15,000,000 ING (U.S.) Funding LLC, 5.25%, 11/5/07 14,923,511
15,000,000 ING (U.S.) Funding LLC, 5.01%, 12/3/07 14,868,488
50,000,000 ING (U.S.) Funding LLC, 5.19%, 12/4/07 49,538,666
- ------
8
Prime Money Market
Principal Amount Value
$36,000,000 Legacy Capital LLC, 6.30%, 10/19/07 (Acquired
9/5/07, Cost $35,779,500)(2) $ 35,943,300
629,000 Legacy Capital LLC, 5.34%, 10/24/07 (Acquired
8/6/07, Cost $621,629)(2) 626,854
6,000,000 Legacy Capital LLC, 5.30%, 11/7/07 (Acquired
8/6/07, Cost $5,917,850)(2) 5,967,316
30,000,000 Legacy Capital LLC, 6.28%, 11/16/07 (Acquired
9/5/07, Cost $29,623,200)(2) 29,759,267
15,000,000 Lexington Parker Capital, 5.26%, 10/5/07
(Acquired 6/26/07, Cost $14,780,833)(2) 14,991,234
10,000,000 Lexington Parker Capital, 5.25%, 10/31/07
(Acquired 9/25/07, Cost $9,947,500)(2) 9,956,250
14,000,000 Lexington Parker Capital, 5.30%, 11/6/07
(Acquired 8/6/07, Cost $13,810,378)(2) 13,925,800
4,000,000 Lexington Parker Capital, 5.25%, 11/14/07
(Acquired 9/28/07, Cost $3,972,583)(2) 3,974,333
24,000,000 Lexington Parker Capital, 5.90%, 2/5/08
(Acquired 9/14/07, Cost $23,433,600)(2) 23,500,467
13,000,000 Lexington Parker Capital, 5.85%, 2/25/08
(Acquired 9/17/07, Cost $12,659,888)(2) 12,689,463
50,000,000 Morgan Stanley, 5.65%, 12/6/07 49,482,084
35,000,000 Ranger Funding Co. LLC, 5.15%, 12/14/07
(Acquired 9/24/07, Cost $34,594,438)(2) 34,629,486
10,000,000 Societe Generale, 5.25%, 10/17/07 9,976,689
1,287,000 Societe Generale, 5.25%, 10/22/07 1,283,059
30,000,000 Societe Generale, 5.21%, 11/2/07 29,861,200
20,000,000 Societe Generale, 5.65%, 12/5/07 19,795,972
10,600,000 Societe Generale, 5.35%, 12/21/07 10,472,403
15,000,000 Toronto Dominion Holdings, 5.70%, 11/8/07
(Acquired 9/4/07, Cost $14,845,760)(2) 14,909,829
35,000,000 Triple A One Funding Corp., 6.41%, 10/16/07
(Acquired 9/7/07, Cost $34,756,954)(2) 34,906,521
8,000,000 Triple A One Funding Corp., 5.33%, 10/30/07
(Acquired 9/26/07, Cost $7,959,729)(2) 7,965,651
36,480,000 Triple A One Funding Corp., 6.30%, 11/13/07
(Acquired 9/4/07, Cost $36,033,120)(2) 36,205,488
Principal Amount Value
$14,500,000 Tulip Funding Corp., 5.25%, 10/25/07 (Acquired
9/25/07, Cost $14,436,563)(2) $ 14,449,250
40,000,000 UBS Finance LLC, 5.27%, 10/3/07 39,988,289
6,000,000 UBS Finance LLC, 5.25%, 10/22/07 5,981,625
10,000,000 UBS Finance LLC, 5.39%, 1/18/08 9,836,803
7,500,000 UBS Finance LLC, 5.40%, 2/11/08 7,350,375
6,000,000 Variable Funding Capital Corp. LLC, 5.90%,
11/21/07 (Acquired 8/23/07, Cost $5,911,500)(2) 5,949,850
1,700,000 Westpac Securities NZ Ltd., 5.70%, 10/23/07
(Acquired 8/16/07, Cost $1,681,697)(2) 1,694,078
2,934,000 Westpac Securities NZ Ltd., 5.65%, 11/8/07
(Acquired 8/16/07, Cost $2,895,320)(2) 2,916,502
8,500,000 Westpac Securities NZ Ltd., 5.45%, 11/30/07
(Acquired 8/21/07, Cost $8,370,033)(2) 8,422,792
30,000,000 Westpac Securities NZ Ltd., 5.41%, 12/19/07
(Acquired 9/18/07, Cost $29,589,742)(2) 29,643,842
40,000,000 Windmill Funding Corp., 5.24%, 10/9/07 (Acquired
7/10/07, Cost $39,470,178)(2) 39,953,422
19,000,000 Windmill Funding Corp., 6.20%, 10/19/07
(Acquired 9/12/07, Cost $18,878,928)(2) 18,941,100
7,000,000 Windmill Funding Corp., 5.15%, 11/2/07 (Acquired
9/19/07, Cost $6,955,939)(2) 6,967,956
40,000,000 Yorktown Capital LLC, 5.10%, 12/20/07 (Acquired
9/21/07, Cost $39,490,000)(2) 39,546,667
--------------
TOTAL COMMERCIAL PAPER 1,405,122,239
--------------
Corporate Bonds -- 20.0%
3,135,000 A&M Hospital Convention Center, VRN, 5.18%,
10/4/07 (LOC: Columbus Bank & Trust) 3,135,000
1,250,000 A&M Hospitalities LLC, VRN, 5.18%, 10/4/07 (LOC:
Columbus Bank & Trust) 1,250,000
5,500,000 AIK Partners LLC, VRN, 5.15%, 10/4/07 (LOC:
Wachovia Bank N.A.) 5,500,000
15,500,000 American Honda Finance Corp., VRN, 5.20%,
12/21/07, resets quarterly off the 3-month
T-Bill minus 0.04% with no caps (Acquired
9/5/07, Cost $15,490,158)(2) 15,491,234
- ------
9
Prime Money Market
Principal Amount Value
$46,000,000 Berkshire Hathaway Finance Corp., VRN, 5.41%,
10/11/07, resets quarterly off the 3-month LIBOR
plus 0.05% with no caps $ 46,012,502
25,000,000 Berkshire Hathaway Finance Corp., VRN, 5.59%,
11/16/07, resets quarterly off the 3-month
T-Bill plus 0.06% with no caps 25,002,162
1,910,000 Capital Markets Access Co. LLC, VRN, 5.20%,
10/4/07 1,910,000
5,685,000 Capital Markets Access Co. LLC, VRN, 5.20%,
10/4/07 5,685,000
890,000 Capital Markets Access Co. LLC, VRN, 5.20%,
10/4/07 890,000
4,295,000 Chaffee Point Hospitalities LLC, VRN, 5.18%,
10/4/07 (LOC: Columbus Bank & Trust) 4,295,000
13,170,000 Cityscape SCP, LLC/Cityscape Turnberry,
LLC/Cityscape Lakeside, LLC/et al, VRN, 5.16%,
10/4/07 (LOC: Columbus Bank & Trust) 13,170,000
2,295,000 Coastal Area Stores Inc./Tattnall Foods Inc.,
VRN, 5.18%, 10/4/07 (LOC: Columbus Bank & Trust) 2,295,000
3,550,000 Colorado Natural Gas Inc., VRN, 5.16%, 10/4/07
(LOC: Harris Trust & Savings Bank) 3,550,000
3,275,000 Delos LLC, VRN, 5.18%, 10/4/07 (LOC: Fifth Third
Bank) 3,275,000
4,658,000 FIA Credit Services, N.A., 5.375%, 1/15/08 4,656,354
8,105,000 Fiore Capital LLC, VRN, 5.13%, 10/4/07 8,105,000
2,000,000 Freehold Young Men's Christian Association
(The), VRN, 5.13%, 10/4/07 (LOC: Wachovia Bank
N.A.) 2,000,000
25,000,000 General Electric Capital Corp., VRN, 5.42%,
10/3/07, resets quarterly off the 3-month T-Bill
plus 0.06% with no caps 25,006,352
10,100,000 General Electric Capital Corp., VRN, 5.66%,
12/3/07, resets quarterly off the 3-month LIBOR
plus 0.04% with no caps 10,103,504
23,000,000 Great Falls Clinic, LLP, VRN, 5.30%, 10/3/07
(LOC: Bank of America N.A.) 23,000,000
21,000,000 Gwinnett Instructional LLC, VRN, 5.13%, 10/4/07
(LOC: Allied Irish Bank plc) 21,000,000
Principal Amount Value
$ 1,490,000 Herman & Kittle Capital LLC, VRN, 5.15%, 10/4/07
(LOC: FHLB) $ 1,490,000
23,655,000 KMS Fed Ex L.P., VRN, 5.40%, 10/1/07 (LOC: Union
Bank of California) 23,655,000
40,000,000 MBIA Global Funding LLC, VRN, 4.25%, 10/2/07,
resets weekly off the 3-month T-Bill plus 0.33%
with no caps (Acquired 4/11/07, Cost
$40,000,000)(2) 40,000,000
15,000,000 MBIA Global Funding LLC, VRN, 4.63%, 1/22/08,
resets quarterly off the 3-month T-Bill plus
0.33% with no caps (Acquired 8/30/07, Cost
$15,000,000)(2) 15,000,000
7,100,000 Mullenix-St Charles Properties LP, VRN, 5.12%,
10/4/07 (LOC: Wachovia Bank N.A.) 7,100,000
20,000,000 Natixis, VRN, 4.91%, 10/1/07, resets daily off
the Federal Funds Target Rate plus 0.16% with no
caps 20,000,000
33,000,000 Natixis, VRN, 4.91%, 10/1/07, resets daily off
the Federal Funds Target Rate plus 0.16% with no
caps 33,000,000
5,300,000 Oklahoma Christian University Inc., VRN, 5.17%,
10/4/07 (LOC: FHLB) 5,300,000
5,350,000 Roman Catholic Bishop of San Jose, VRN, 5.13%,
10/4/07 (LOC: Allied Irish Bank plc) 5,350,000
25,000,000 Royal Bank of Scotland Group plc, VRN, 5.24%,
12/21/07, resets quarterly off the 3-month LIBOR
with no caps (Acquired 1/8/07, Cost
$25,012,625)(2) 25,002,973
7,500,000 Salvation Army, Series 2003 A, VRN, 5.13%,
10/4/07 (LOC: Bank of New York) 7,500,000
8,000,000 Salvation Army, Series 2004 A, VRN, 5.13%,
10/4/07 (LOC: Bank of New York) 8,000,000
15,100,000 Signal International LLC/Signal International
L.P., VRN, 5.13%, 10/4/07 (LOC: General Electric
Capital Corp.) (Acquired 12/29/05, Cost
$15,100,000)(2) 15,100,000
7,000,000 Southwest Georgia Oil Co. Inc., VRN, 5.18%,
10/4/07 7,000,000
21,000,000 Toyota Motor Credit Corp., 5.32%, 6/2/08 21,000,000
- ------
10
Prime Money Market
Principal Amount Value
$10,000,000 Toyota Motor Credit Corp., VRN, 4.24%, 10/2/07,
resets weekly off the 3-month T-Bill plus 0.32%
with no caps $ 10,000,000
10,000,000 Toyota Motor Credit Corp., VRN, 4.24%, 10/2/07,
resets weekly off the 3-month T-Bill plus 0.32%
with no caps 10,000,000
41,000,000 Travelers Insurance Co. Group, VRN, 5.41%,
11/2/07, resets quarterly off the 3-month LIBOR
plus 0.06% with no caps (Acquired 8/7/03, Cost
$41,000,000)(2) 41,000,000
20,000,000 UBS AG, 5.40%, 11/28/07 20,000,000
10,490,000 Woodgrain Millwork, VRN, 5.16%, 10/4/07 (LOC:
General Electric Capital Corp.) 10,490,000
--------------
TOTAL CORPORATE BONDS 551,320,081
--------------
Municipal Securities -- 16.2%
12,000,000 Association of Bay Area Governments Finance
Auth. for Nonprofit Corps. Rev., Series 2007 B,
(Casa De Las Campanas, Inc.), VRDN, 6.50%,
10/4/07 (RADIAN) (SBBPA: KBC Bank N.V.) 12,000,000
4,380,000 Babylon Industrial Development Agency Rev.,
Series 2004 A, (Topiderm Inc.), VRDN, 5.16%,
10/4/07 (LOC: Citibank N.A.) 4,380,000
4,850,000 Calexico Unified School District COP,
(Refinancing Project), VRDN, 5.16%, 10/4/07
(XLCA) (SBBPA: Wachovia Bank N.A.) 4,850,000
8,160,000 California Educational Facilities Auth. Rev.,
Series 2005 B, (University La Verne), VRDN,
5.19%, 10/4/07 (LOC: Allied Irish Bank plc) 8,160,000
24,270,000 California Statewide Communities Development
Auth. Rev., Series 2002 B, (Biola University),
VRDN, 5.30%, 10/4/07 (LOC: BNP Paribas) 24,270,000
34,000,000 Catholic Health Initiatives Rev., Series 2007 B,
5.38%, 11/6/07 34,000,000
5,420,000 City of Fairfield Rev., Series 2005 A, VRDN,
5.13%, 10/4/07 (LOC: Landesbank Hessen-Thuringen
Girozentrale) 5,420,000
Principal Amount Value
$38,000,000 City of Portland GO, (Taxable Pension), VRDN,
5.13%, 10/3/07 (SBBPA: Landesbank
Hessen-Thuringen Girozentrale) $ 37,999,636
3,265,000 Columbus Development Auth. Rev., (Woodmont
Properties LLC), VRDN, 5.21%, 10/4/07 (LOC:
Columbus Bank & Trust) 3,265,000
19,665,000 Concordia College Rev., VRDN, 5.13%, 10/1/07
(LOC: Bank of America N.A.) 19,665,000
20,000,000 Cook County GO, Series 2005 D, (Public
Improvements), VRDN, 5.17%, 10/3/07 (SBBPA:
Depfa Bank plc) 20,000,000
2,715,000 El Monte COP, Series 2003 B, (Community
Improvement), VRDN, 5.17%, 10/4/07 (LOC:
California State Teacher's Retirement System) 2,715,000
22,000,000 Florida Hurricane Catastrophe Fund Financing
Corp. Rev., Series 2006 B, VRDN, 5.96%,
10/15/07, resets monthly off the 1-month LIBOR
plus 0.02% with no caps 22,000,000
6,720,000 Gadsden Airport Auth. Rev., VRDN, 5.15%, 10/4/07
(LOC: Southtrust Bank N.A.) 6,720,000
7,670,000 Georgia Municipal Gas Auth. Rev., (National Gas
Utility Improvements), VRDN, 5.16%, 10/4/07
(LOC: Wachovia Bank N.A. and JPMorgan Chase Bank) 7,670,000
15,000,000 Groton City GO, Series 2007 B, 6.00%, 10/10/07 15,002,149
5,750,000 JJB Properties LLC Rev., (Rental Property),
VRDN, 5.12%, 10/4/07 (LOC: Arvest Bank and FHLB) 5,750,000
10,690,000 Kansas City Financing Commission Tax Increment
Rev., Series 2006 B, (Briarcliff West), VRDN,
5.14%, 10/4/07 (LOC: Marshall & Isley Bank) 10,690,000
1,400,000 Las Cruces Industrial Rev., (F&A Dairy
Products), VRDN, 5.63%, 12/1/07 (LOC: Wells
Fargo Bank N.A.) 1,400,000
2,880,000 Long Beach Rev., Series 2004 A, (Towne Center
Site), VRDN, 5.12%, 10/4/07 (LOC: Allied Irish
Bank plc) 2,880,000
- ------
11
Prime Money Market
Principal Amount Value
$21,250,000 Louisiana Agriculture Finance Auth. Rev.,
(Lacassine Syrup Mill), VRDN, 5.17%, 10/4/07
(LOC: AmSouth Bank) $ 21,250,000
8,200,000 Lower Colorado River Auth. Rev., 5.37%, 11/1/07 8,200,000
6,070,000 Minnesota Higher Education Facilities Auth.
Rev., Series 2003 5-P2, (Concordia University,
St. Paul), VRDN, 5.17%, 10/1/07 (LOC: U.S. Bank
N.A.) 6,070,000
6,400,000 Mississippi Business Finance Corp. Rev.,
(Medical Development Properties), VRDN, 5.13%,
10/4/07 (LOC: BancorpSouth Bank and FHLB) 6,400,000
3,525,000 Mississippi Business Finance Corp. Rev.,
(Millsaps Chevrolet-Pontiac-Buick-GMC Truck,
Inc.), VRDN, 5.13%, 10/4/07 (LOC: National Bank
of Commerce and FHLB) 3,525,000
11,000,000 Mississippi Business Finance Corp. Rev.,
(Skyline Steel Pipe), VRDN, 5.13%, 10/4/07 (LOC:
Fortis Bank SA N.V.) 11,000,000
7,500,000 Mississippi Business Finance Corp. Rev., Series
2005, (Future Pipe Industries, Inc.), VRDN,
5.13%, 10/4/07 (LOC: Mashreqbank and Bank of New
York) 7,500,000
5,000,000 Mississippi Business Finance Corp. Rev., Series
2006 R-1, (Brown Bottling Group, Inc.), VRDN,
5.13%, 10/4/07 (LOC: FHLB) 5,000,000
10,000,000 Mississippi Business Finance Corp. Industrial
Development Rev., (VC Regional Assembly), VRDN,
5.21%, 10/3/07 (LOC: JPMorgan Chase Bank) 10,000,000
18,640,000 New Orleans Rev., VRDN, 5.38%, 10/4/07 (Ambac)
(SBBPA: JPMorgan Chase Bank) 18,640,000
24,000,000 North Texas Higher Education Auth., Inc. Student
Loan Rev., Series 2006 D, VRDN, 5.13%, 10/3/07
(Ambac/Guaranteed Student Loans) (SBBPA: Lloyds
TSB Bank plc) 24,000,000
5,000,000 Omaha Special Obligation Rev., (Riverfront
Redevelopment), VRDN, 5.18%, 10/3/07 (Ambac)
(SBBPA: Dexia Credit Local) 5,000,000
Principal Amount Value
$10,300,000 Pasadena COP, (Los Robles Avenue Parking
Facilities), VRDN, 5.13%, 10/2/07 (LOC: Bank of
New York and California State Teacher's
Retirement System) $ 10,300,000
20,000,000 Pennsylvania Housing Finance Agency Single
Family Mortgage Rev., Series 2007-97D, VRDN,
5.13%, 10/3/07 (SBBPA: Dexia Credit Local) 20,000,000
945,000 Plymouth Rev., (Carlson Center), VRDN, 5.15%,
10/4/07 (LOC: U.S. Bank N.A.) 945,000
9,990,000 Putnam County Industrial Development Agency
Rev., (Sincerity Facility LLC), VRDN, 5.13%,
10/4/07 (LOC: Bank of New York) 9,990,000
5,000,000 Roman Catholic Diocese of Raleigh Rev., Series
2002 A, VRDN, 5.18%, 10/4/07 (LOC: Bank of
America N.A.) 5,000,000
4,755,000 Santa Rosa Pension Obligation Rev., Series 2003
A, VRDN, 5.13%, 10/4/07 (LOC: Landesbank
Hessen-Thuringen Girozentrale) 4,755,000
6,761,331 Savannah College of Art & Design Inc. Rev.,
Series 2004 BD, VRDN, 5.30%, 10/4/07 (LOC: Bank
of America N.A.) 6,761,331
10,845,000 Southeast Alabama Gas District Rev., VRDN,
5.15%, 10/4/07 (XLCA) (SBBPA: Southtrust Bank
N.A.) 10,845,000
4,145,000 Sterling Tax Allocation Rev., (Rock River
Redevelopment), VRDN, 5.20%, 10/3/07 (LOC:
Wachovia Bank N.A.) 4,145,000
--------------
TOTAL MUNICIPAL SECURITIES 448,163,116
--------------
Certificates Of Deposit -- 10.2%
65,000,000 Barclays Bank plc, 5.32%, 12/4/07 65,000,000
30,000,000 Calyon New York, 5.04%, 12/19/07 30,000,000
10,000,000 Canadian Imperial Bank of Commerce (New York),
5.28%, 10/12/07 9,999,275
5,000,000 Canadian Imperial Bank of Commerce (New York),
5.375%, 10/26/07 4,999,550
20,000,000 Comerica Bank, 5.41%, 11/26/07 20,000,721
7,930,000 HBOS Treasury Services plc (New York), 5.31%,
10/16/07 7,929,800
- ------
12
Prime Money Market
Principal Amount Value
$25,000,000 HBOS Treasury Services plc (New York), 5.26%,
1/8/08 $ 25,000,000
15,000,000 HBOS Treasury Services plc (New York), 5.33%,
5/30/08 14,990,940
12,600,000 Natixis (New York), 5.26%, 1/9/08 12,591,835
25,000,000 Royal Bank of Scotland (New York), 5.45%, 3/14/08 25,002,265
65,000,000 Toronto Dominion Bank (New York), VRN, 4.75%,
10/1/07, resets daily off the Federal Funds
Target Rate plus 0.07% with no caps 65,000,000
--------------
TOTAL CERTIFICATES OF DEPOSIT 280,514,386
--------------
TOTAL INVESTMENT SECURITIES -- 97.3% 2,685,119,822
--------------
OTHER ASSETS AND LIABILITIES -- 2.7% 74,765,406
--------------
TOTAL NET ASSETS -- 100.0% $2,759,885,228
==============
Notes to Schedule of Investments
Ambac = Ambac Assurance Corporation
COP = Certificates of Participation
FHLB = Federal Home Loan Bank
GO = General Obligation
LIBOR = London Interbank Offered Rate
LOC = Letter of Credit
MBIA = MBIA Insurance Corporation
RADIAN = Radian Asset Assurance, Inc.
resets = The frequency with which a security's coupon changes, based on
current market conditions or an underlying index. The more frequently a
security resets, the less risk the investor is taking that the coupon will
vary significantly from current market rates.
SBBPA = Standby Bond Purchase Agreement
VRDN = Variable Rate Demand Note. Interest reset date is indicated. Rate shown
is effective September 30, 2007.
VRN = Variable Rate Note. Interest reset date is indicated. Rate shown is
effective September 30, 2007.
XLCA = XL Capital Ltd.
(1) The rate indicated is the yield to maturity at purchase.
(2) Security was purchased under Rule 144A or Section 4(2) of the Securities
Act of 1933 or is a private placement and, unless registered under the Act or
exempted from registration, may only be sold to qualified institutional
investors. The aggregate value of restricted securities at September 30, 2007,
was $1,243,824,671, which represented 45.1% of total net assets. Restricted
securities considered illiquid represent 1.5% of total net assets.
See Notes to Financial Statements.
- ------
13
STATEMENT OF ASSETS AND LIABILITIES
SEPTEMBER 30, 2007 (UNAUDITED)
ASSETS
Investment securities, at value (amortized cost and cost for
federal income tax purposes) $2,685,119,822
Cash 74,107,644
Interest receivable 14,128,544
Prepaid portfolio insurance 135,619
--------------
2,773,491,629
--------------
LIABILITIES
Payable for investments purchased 11,969,346
Payable for capital shares redeemed 33,377
Accrued management fees 1,161,633
Distribution fees payable 1,304
Service fees (and distribution fees - A Class) payable 24,815
Dividends payable 415,926
--------------
13,606,401
--------------
NET ASSETS $2,759,885,228
==============
NET ASSETS CONSIST OF:
Capital paid in $2,759,951,840
Accumulated net realized loss on investment transactions (66,612)
--------------
$2,759,885,228
==============
INVESTOR CLASS
Net assets $2,636,105,848
Shares outstanding 2,636,169,741
Net asset value per share $1.00
A CLASS
Net assets $121,628,789
Shares outstanding 121,631,551
Net asset value per share $1.00
B CLASS
Net assets $1,131,000
Shares outstanding 1,131,074
Net asset value per share $1.00
C CLASS
Net assets $1,019,591
Shares outstanding 1,019,596
Net asset value per share $1.00
See Notes to Financial Statements.
- ------
14
STATEMENT OF OPERATIONS
FOR THE SIX MONTHS ENDED SEPTEMBER 30, 2007 (UNAUDITED)
INVESTMENT INCOME (LOSS)
INCOME:
Interest $65,347,215
-----------
EXPENSES:
Management fees 6,874,105
Distribution fees:
A Class 5,569
B Class 3,367
C Class 1,907
Service fees:
A Class 5,569
B Class 1,122
C Class 954
Distribution and service fees - A Class 24,520
Distribution and service fees - A Class (old) (Note 5) 121,458
Trustees' fees and expenses 56,324
Portfolio insurance and other expenses 218,541
-----------
7,313,436
Amount waived (482,538)
-----------
6,830,898
-----------
NET INVESTMENT INCOME (LOSS) 58,516,317
-----------
NET REALIZED GAIN (LOSS) ON INVESTMENT TRANSACTIONS (24,092)
-----------
NET INCREASE (DECREASE) IN NET ASSETS
RESULTING FROM OPERATIONS $58,492,225
===========
See Notes to Financial Statements.
- ------
15
STATEMENT OF CHANGES IN NET ASSETS
SIX MONTHS ENDED SEPTEMBER 30, 2007 (UNAUDITED) AND YEAR ENDED MARCH 31, 2007
Increase (Decrease) in Net Assets Sept. 30, 2007 March 31, 2007
OPERATIONS
Net investment income (loss) $58,516,317 $105,957,150
Net realized gain (loss) (24,092) (3,528)
-------------- --------------
Net increase (decrease)
in net assets resulting
from operations 58,492,225 105,953,622
-------------- --------------
DISTRIBUTIONS TO SHAREHOLDERS
From net investment income:
Investor Class (55,702,276) (101,854,192)
A Class (559,725) (153,038)
A Class (old) (Note 5) (2,221,170) (3,877,527)
B Class (17,406) (45,130)
C Class (15,740) (27,263)
-------------- --------------
Decrease in net assets
from distributions (58,516,317) (105,957,150)
-------------- --------------
CAPITAL SHARE TRANSACTIONS
Net increase (decrease)
in net assets from
capital share transactions 484,561,153 244,090,701
-------------- --------------
NET INCREASE (DECREASE) IN NET ASSETS 484,537,061 244,087,173
NET ASSETS
Beginning of period 2,275,348,167 2,031,260,994
-------------- --------------
End of period $2,759,885,228 $2,275,348,167
============== ==============
See Notes to Financial Statements.
- ------
16
NOTES TO FINANCIAL STATEMENTS
SEPTEMBER 30, 2007 (UNAUDITED)
1. ORGANIZATION AND SUMMARY OF SIGNIFICANT ACCOUNTING POLICIES
ORGANIZATION -- American Century Investment Trust (the trust) is registered
under the Investment Company Act of 1940 (the 1940 Act) as an open-end
management investment company. Prime Money Market Fund (the fund) is one fund
in a series issued by the trust. The fund is diversified under Rule 2a-7 of
the 1940 Act. The fund's investment objective is to earn the highest level of
current income while preserving the value of your investment. The fund invests
most of its assets in high-quality, very short-term debt securities issued by
corporations, banks and governments. The following is a summary of the fund's
significant accounting policies.
MULTIPLE CLASS -- The fund is authorized to issue the Investor Class, the A
Class (formerly Advisor Class), the B Class and the C Class. The A Class, B
Class and C Class may be subject to a contingent deferred sales charge. The
share classes differ principally in their respective sales charges and
distribution and shareholder servicing expenses and arrangements. All shares
of the fund represent an equal pro rata interest in the assets of the class to
which such shares belong, and have identical voting, dividend, liquidation and
other rights and the same terms and conditions, except for class specific
expenses and exclusive rights to vote on matters affecting only individual
classes. Income, non-class specific expenses, and realized and unrealized
capital gains and losses of the fund are allocated to each class of shares
based on their relative net assets.
SECURITY VALUATIONS -- Securities are generally valued at amortized cost,
which approximates current market value. When such valuations do not reflect
market value, securities may be valued as determined in accordance with
procedures adopted by the Board of Trustees.
SECURITY TRANSACTIONS -- For financial reporting, security transactions are
accounted for as of the trade date. Net realized gains and losses are
determined on the identified cost basis, which is also used for federal income
tax purposes.
INVESTMENT INCOME-- Interest income is recorded on the accrual basis and
includes accretion of discounts and amortization of premiums.
REPURCHASE AGREEMENTS -- The fund may enter into repurchase agreements with
institutions that American Century Investment Management, Inc. (ACIM) (the
investment advisor) has determined are creditworthy pursuant to criteria
adopted by the Board of Trustees. Each repurchase agreement is recorded at
cost. The fund requires that the collateral, represented by securities,
received in a repurchase transaction be transferred to the custodian in a
manner sufficient to enable the fund to obtain those securities in the event
of a default under the repurchase agreement. ACIM monitors, on a daily basis,
the securities transferred to ensure the value, including accrued interest, of
the securities under each repurchase agreement is equal to or greater than
amounts owed to the fund under each repurchase agreement.
JOINT TRADING ACCOUNT -- Pursuant to an Exemptive Order issued by the
Securities and Exchange Commission, the fund, along with other registered
investment companies having management agreements with ACIM or American
Century Global Investment Management, Inc. (ACGIM), may transfer uninvested
cash balances into a joint trading account. These balances are invested in one
or more repurchase agreements that are collateralized by U.S. Treasury or
Agency obligations.
WHEN-ISSUED AND FORWARD COMMITMENTS -- The fund may engage in securities
transactions on a when-issued or forward commitment basis. Under these
arrangements, the securities' prices and yields are fixed on the date of the
commitment, but payment and delivery are scheduled for a future date. During
this period, securities are subject to market fluctuations. The fund will
segregate cash, cash equivalents or other appropriate liquid securities on its
records in amounts sufficient to meet the purchase price.
INCOME TAX STATUS -- It is the fund's policy to distribute substantially all
net investment income and net realized gains to shareholders and to otherwise
qualify as a regulated investment company under provisions of the Internal
Revenue Code. The fund is no longer subject to examination by tax authorities
for years prior to 2004. At this time, management has not identified any
uncertain tax positions that would materially impact the financial statements.
Accordingly, no provision has been made for federal or state income taxes.
Interest and penalties associated with any federal or state income tax
obligations, if any, are recorded as interest expense.
- ------
17
SEPTEMBER 30, 2007 (UNAUDITED)
DISTRIBUTIONS TO SHAREHOLDERS -- Distributions from net investment income and
short-term capital gains, if any, are declared daily and paid monthly. The
fund does not expect to realize any long-term capital gains, and accordingly,
does not expect to pay any capital gains distributions.
INDEMNIFICATIONS -- Under the trust's organizational documents, its officers
and trustees are indemnified against certain liabilities arising out of the
performance of their duties to the fund. In addition, in the normal course of
business, the fund enters into contracts that provide general
indemnifications. The fund's maximum exposure under these arrangements is
unknown as this would involve future claims that may be made against the fund.
The risk of material loss from such claims is considered by management to be
remote.
USE OF ESTIMATES -- The financial statements are prepared in conformity with
accounting principles generally accepted in the United States of America,
which may require management to make certain estimates and assumptions at the
date of the financial statements. Actual results could differ from these
estimates.
2. FEES AND TRANSACTIONS WITH RELATED PARTIES
On July 27, 2007, the A Class (formerly Advisor Class, also referred to as "A
Class (new)") shareholders of the fund approved a change in the class's fee
structure. The change was approved by the Board of Trustees on December 8,
2006. Effective September 4, 2007, the fee structure change resulted in an
increase of 0.25% in the unified management fee and a simultaneous decrease of
0.25% in total distribution and service fee, resulting in no change to the
total operating expense ratio of the class.
MANAGEMENT FEES -- The trust has entered into a Management Agreement with
ACIM, under which ACIM provides the fund with investment advisory and
management services in exchange for a single, unified management fee (the fee)
per class. The Agreement provides that all expenses of the fund, except
brokerage commissions, taxes, portfolio insurance, interest, fees and expenses
of those trustees who are not considered "interested persons" as defined in
the 1940 Act (including counsel fees) and extraordinary expenses, will be paid
by ACIM. The fee is computed and accrued daily based on the daily net assets
of the specific class of shares of the fund and paid monthly in arrears. The
fee consists of (1) an Investment Category Fee based on the daily net assets
of the fund and certain other accounts managed by the investment advisor that
are in the same broad investment category as the fund and (2) a Complex Fee
based on the assets of all the funds in the American Century family of funds.
The rates for the Investment Category Fee range from 0.2370% to 0.3500% and
the rates for the Complex Fee (Investor Class, A Class, B Class and C Class)
range from 0.2500% to 0.3100%. Prior to September 4, 2007, the A Class (new)
was 0.2500% less at each point within the Complex Fee range. From August 1,
2006 to July 31, 2007, the investment advisor voluntarily agreed to waive
0.050% of its management fee. Effective August 1, 2007, the investment advisor
voluntarily agreed to waive 0.021% of its management fee. The total amount of
the waiver for each class of the fund for the six months ended September 30,
2007, was $457,716, $2,988, $21,518, $173, and $143 for the Investor Class, A
Class (new), A Class (old), B Class and C Class, respectively. This fee waiver
may be revised or terminated at any time without notice. The effective annual
management fee before waiver for each class of the fund for the six months
ended September 30, 2007 was 0.57% for the Investor Class, B Class and C
Class, and 0.36% for the A Class (new). The effective annual management fee
after waiver for each class of the fund for the six months ended September 30,
2007 was 0.53% for the Investor Class, B Class and C Class, and 0.32% for the
A Class (new).
DISTRIBUTION AND SERVICE FEES -- The Board of Trustees has adopted a separate
Master Distribution and Individual Shareholder Services Plan for each of the A
Class, B Class and C Class (collectively the plans), pursuant to Rule 12b-1 of
the 1940 Act. The plans provide that the A Class will pay American Century
Investment Services, Inc. (ACIS) an annual distribution and service fee of
0.25%. The plans provide that the B Class and the C Class will each pay ACIS
an annual distribution fee of 0.75% and service fee of 0.25%. Prior to
September 4, 2007, the Board of Trustees had adopted a Master Distribution and
Shareholder Services plan for the A Class (new), pursuant to Rule 12b-1 of the
1940 Act, in which the A Class (new) paid ACIS an annual distribution fee of
0.25% and service fee of 0.25%. The fees are computed and accrued daily based
on each class's daily net assets and paid monthly in arrears. The distribution
fee provides compensation for expenses incurred in connection with
distributing shares of the classes including, but not limited to, payments to
brokers, dealers, and financial institutions that have entered into sales
agreements with respect to shares of the fund. The service fee provides
compensation for individual shareholder services rendered by broker/dealers or
other independent financial intermediaries for A Class (new), A Class (old), B
Class and C Class shares. Prior to September 4, 2007, the service fee provided
compensation for shareholder and administrative
- ------
18
SEPTEMBER 30, 2007 (UNAUDITED)
services rendered by ACIS, its affiliates or independent third party providers
for A Class (new) shares. Fees incurred under the plans during the six months
ended September 30, 2007, are detailed in the Statement of Operations.
MONEY MARKET INSURANCE -- The fund, along with other money market funds
managed by ACIM, has entered into an insurance agreement with Ambac Assurance
Corporation (Ambac). Ambac provides limited coverage for certain loss events
including issuer defaults as to payment of principal or interest and
insolvency of a credit enhancement provider. The fund pays annual premiums to
Ambac, which are amortized daily over one year. For the six months ended
September 30, 2007, the annualized ratio of money market insurance expense to
average net assets was 0.02%.
RELATED PARTIES -- Certain officers and trustees of the trust are also
officers and/or directors, and, as a group, controlling stockholders of
American Century Companies, Inc. (ACC), the parent of the trust's investment
advisor, ACIM, the distributor of the trust, ACIS, and the trust's transfer
agent, American Century Services, LLC. ACIM owns 11% of the oustanding shares
of the fund.
JPMorgan Chase Bank is a custodian of the fund and a wholly owned subsidiary
of JPMorgan Chase & Co. (JPM). JPM is an equity investor in ACC.
3. CAPITAL SHARE TRANSACTIONS
Transactions in shares of the fund were as follows (unlimited number of shares
authorized):
Six months ended Year ended
September 30, 2007 March 31, 2007
Shares Amount Shares Amount
INVESTOR CLASS
Sold 1,477,313,978 $1,477,313,978 2,293,636,505 $2,293,636,505
Issued in
reinvestment of
distributions 52,526,281 52,526,281 97,522,574 97,522,574
Redeemed (1,049,510,214) (1,049,510,214) (2,217,321,520) (2,217,321,520)
--------------- --------------- --------------- ---------------
480,330,045 480,330,045 173,837,559 173,837,559
--------------- --------------- --------------- ---------------
A CLASS
Sold 24,831,684 24,831,684 3,411,695 3,411,695
Issued in
connection with
reclassification
(Note 5) 109,222,892 109,218,798 -- --
Issued in
reinvestment of
distributions 474,910 474,910 149,117 149,117
Redeemed (17,082,694) (17,082,694) (2,520,839) (2,520,839)
--------------- --------------- --------------- ---------------
117,446,792 117,442,698 1,039,973 1,039,973
--------------- --------------- --------------- ---------------
A CLASS (OLD)
Sold 64,249,272 64,249,272 198,542,700 198,542,700
Issued in
reinvestment of
distributions 1,551,046 1,551,046 3,203,673 3,203,673
Redeemed in
connection with
reclassification
(Note 5) (109,222,892) (109,218,798) -- --
Redeemed (70,578,778) (70,578,778) (132,900,813) (132,900,813)
--------------- --------------- --------------- ---------------
(114,001,352) (113,997,258) 68,845,560 68,845,560
--------------- --------------- --------------- ---------------
B CLASS
Sold 394,263 394,263 2,159,121 2,159,121
Issued in
reinvestment of
distributions 15,709 15,709 42,105 42,105
Redeemed (117,368) (117,368) (1,497,102) (1,497,102)
--------------- --------------- --------------- ---------------
292,604 292,604 704,124 704,124
--------------- --------------- --------------- ---------------
C CLASS
Sold 712,712 712,712 821,690 821,690
Issued in
reinvestment of
distributions 14,685 14,685 26,399 26,399
Redeemed (234,333) (234,333) (1,184,604) (1,184,604)
--------------- --------------- --------------- ---------------
493,064 493,064 (336,515) (336,515)
--------------- --------------- --------------- ---------------
Net increase
(decrease) 484,561,153 $ 484,561,153 244,090,701 $244,090,701
=============== =============== =============== ===============
- ------
19
SEPTEMBER 30, 2007 (UNAUDITED)
4. FEDERAL TAX INFORMATION
The book-basis character of distributions made during the year from net
investment income or net realized gains may differ from their ultimate
characterization for federal income tax purposes. These differences reflect
the differing character of certain income items and net realized gains and
losses for financial statement and tax purposes, and may result in
reclassification among certain capital accounts on the financial statements.
As of March 31, 2007, the fund had accumulated net realized capital loss
carryovers for federal income tax purposes of $(41,623), which may be used to
offset future taxable gains. The capital loss carryovers expire as follows:
2010 2011 2012 2013 2014 2015
$(13,456) $(36) -- $(11,584) $(2,029) $(14,518)
Capital loss deferrals of $(897) represent net capital losses incurred in the
five-month period ended March 31, 2007. The fund has elected to treat such
losses as having been incurred in the following fiscal year for federal income
tax purposes.
5. CORPORATE EVENT
Effective September 4, 2007, the A Class (old) shares of the fund were
reclassified as Advisor Class shares. Subsequent to the reclassification, the
Advisor Class was renamed A Class. The change was approved by the Board of
Trustees on December 8, 2006.
6. RECENTLY ISSUED ACCOUNTING STANDARDS
In June 2006, the Financial Accounting Standards Board (FASB) issued
Interpretation No. 48, "Accounting for Uncertainty in Income Taxes -- an
Interpretation of FASB Statement No. 109" (FIN 48). FIN 48 establishes a
minimum threshold for financial statement recognition of the benefit of
positions taken in filing tax returns (including whether an entity is taxable
in a particular jurisdiction), and requires certain expanded tax disclosures.
FIN 48 is effective for fiscal years beginning after December 15, 2006, and is
to be applied to all open tax years as of the date of effectiveness.
Management has concluded that the adoption of FIN 48 will not materially
impact the financial statements.
The FASB issued Statement of Financial Accounting Standards No. 157, "Fair
Value Measurements" (FAS 157), in September 2006, which is effective for
fiscal years beginning after November 15, 2007. FAS 157 defines fair value,
establishes a framework for measuring fair value and expands the required
financial statement disclosures about fair value measurements. Management is
currently evaluating the impact that adopting FAS 157 will have on the
financial statement disclosures.
- ------
20
FINANCIAL HIGHLIGHTS
Prime Money Market
Investor Class
For a Share Outstanding Throughout the Years Ended March 31 (except as noted)
2007(1) 2007 2006 2005 2004 2003
PER-SHARE DATA
Net Asset
Value,
Beginning of
Period $1.00 $1.00 $1.00 $1.00 $1.00 $1.00
--------- -------- -------- -------- -------- --------
Income From
Investment
Operations
Net
Investment
Income
(Loss) 0.02 0.05 0.03 0.01 0.01 0.01
--------- -------- -------- -------- -------- --------
Distributions
From Net
Investment
Income (0.02) (0.05) (0.03) (0.01) (0.01) (0.01)
--------- -------- -------- -------- -------- --------
Net Asset
Value, End of
Period $1.00 $1.00 $1.00 $1.00 $1.00 $1.00
========= ======== ======== ======== ======== ========
TOTAL RETURN(2) 2.46% 4.83% 3.28% 1.19% 0.58% 1.19%
RATIOS/SUPPLEMENTAL DATA
Ratio of
Operating
Expenses to
Average Net
Assets 0.55%(3)(4) 0.55%(3) 0.57%(3) 0.60% 0.61% 0.61%
Ratio of
Operating
Expenses to
Average Net
Assets (Before
Expense Waiver) 0.59%(4) 0.59% 0.60% 0.61%
0.59% 0.61%
Ratio of Net
Investment
Income (Loss)
to Average Net
Assets 4.87%(3)(4) 4.73%(3) 3.24%(3) 1.17% 0.58% 1.19%
Ratio of Net
Investment
Income (Loss)
to Average Net
Assets (Before
Expense Waiver) 4.83%(4) 4.69% 3.22% 1.17% 0.58% 1.19%
Net Assets, End
of Period (in
thousands) $2,636,106 $2,155,800 $1,981,964 $1,964,135 $2,126,433 $2,574,694
(1) Six months ended September 30, 2007 (unaudited).
(2) Total return assumes reinvestment of net investment income and capital
gains distributions, if any. Total returns for periods less than one year are
not annualized.
(3) Effective July 29, 2005, the investment advisor voluntarily agreed to
waive a portion of its management fee.
(4) Annualized.
See Notes to Financial Statements.
- ------
21
Prime Money Market
A Class(1)
For a Share Outstanding Throughout the Years Ended March 31 (except as noted)
2007(2) 2007 2006 2005 2004 2003
PER-SHARE DATA
Net Asset Value,
Beginning of Period $1.00 $1.00 $1.00 $1.00 $1.00 $1.00
----------- -------- -------- ------ ------ ------
Income From
Investment
Operations
Net Investment
Income (Loss) 0.02 0.04 0.03 0.01 --(3) 0.01
----------- -------- -------- ------ ------ ------
Distributions
From Net
Investment
Income (0.02) (0.04) (0.03) (0.01) --(3) (0.01)
----------- -------- -------- ------ ------ ------
Net Asset Value,
End of Period $1.00 $1.00 $1.00 $1.00 $1.00 $1.00
=========== ======== ======== ====== ====== ======
TOTAL RETURN(4) 2.33% 4.58% 3.02% 0.94% 0.33% 0.93%
RATIOS/SUPPLEMENTAL DATA
Ratio of Operating
Expenses to Average
Net Assets 0.80%(5)(6) 0.80%(5) 0.82%(5) 0.85% 0.86% 0.86%
Ratio of Operating
Expenses to Average
Net Assets (Before
Expense Waiver) 0.84%(6) 0.84% 0.84% 0.85% 0.86% 0.86%
Ratio of Net
Investment Income
(Loss) to Average
Net Assets 4.62%(5)(6) 4.48%(5) 2.99%(5) 0.92% 0.33% 0.94%
Ratio of Net
Investment Income
(Loss) to Average
Net Assets (Before
Expense Waiver) 4.58%(6) 4.44% 2.97% 0.92% 0.33% 0.94%
Net Assets, End of
Period (in
thousands) $121,629 $4,185 $3,145 $2,560 $3,055 $5,431
(1) Prior to September 4, 2007, the A Class was referred to as the Advisor
Class.
(2) Six months ended September 30, 2007 (unaudited).
(3) Per-share amount was less than $0.005.
(4) Total return assumes reinvestment of net investment income and capital
gains distributions, if any, and does not reflect applicable sales charges.
Total returns for periods less than one year are not annualized.
(5) Effective July 29, 2005, the investment advisor voluntarily agreed to
waive a portion of its management fee.
(6) Annualized.
See Notes to Financial Statements.
- ------
22
Prime Money Market
B Class
For a Share Outstanding Throughout the Years Ended March 31 (except as noted)
2007(1) 2007 2006 2005 2004 2003(2)
PER-SHARE DATA
Net Asset
Value,
Beginning of
Period $1.00 $1.00 $1.00 $1.00 $1.00 $1.00
----------- -------- -------- -------- -------- ----------
Income From
Investment
Operations
Net
Investment
Income
(Loss) 0.02 0.04 0.02 --(3) --(3) --(3)
----------- -------- -------- -------- -------- ----------
Distributions
From Net
Investment
Income (0.02) (0.04) (0.02) --(3) --(3) --(3)
----------- -------- -------- -------- -------- ----------
Net Asset
Value, End of
Period $1.00 $1.00 $1.00 $1.00 $1.00 $1.00
=========== ======== ======== ======== ======== ==========
TOTAL RETURN(4) 1.95% 3.80% 2.26% 0.34% 0.22% 0.12%
RATIOS/SUPPLEMENTAL DATA
Ratio of
Operating
Expenses to
Average Net
Assets 1.55%(5)(6) 1.55%(5) 1.57%(5) 1.48%(7) 0.99%(7) 0.61%(6)(7)
Ratio of
Operating
Expenses to
Average Net
Assets (Before
Expense Waiver) 1.59%(6) 1.59% 1.59% 1.60% 1.61% 1.61%(6)
Ratio of Net
Investment
Income (Loss)
to Average Net
Assets 3.87%(5)(6) 3.73%(5) 2.24%(5) 0.29%(7) 0.20%(7) 0.76%(6)(7)
Ratio of Net
Investment
Income (Loss)
to Average Net
Assets (Before
Expense Waiver) 3.83%(6) 3.69% 2.22% 0.17% (0.42)% (0.24)%(6)
Net Assets, End
of Period (in
thousands) $1,131 $838 $134 $97 $74 $25
(1) Six months ended September 30, 2007 (unaudited).
(2) January 31, 2003 (commencement of sale) through March 31, 2003.
(3) Per-share amount was less than $0.005.
(4) Total return assumes reinvestment of net investment income and capital
gains distributions, if any, and does not reflect applicable sales charges.
Total returns for periods less than one year are not annualized.
(5) Effective July 29, 2005, the investment advisor voluntarily agreed to
waive a portion of its management fee.
(6) Annualized.
(7) The distributor voluntarily waived a portion of its distribution and
service fees.
See Notes to Financial Statements.
- ------
23
Prime Money Market
C Class
For a Share Outstanding Throughout the Years Ended March 31 (except as
noted)
2007(1) 2007 2006 2005 2004 2003(2)
PER-SHARE DATA
Net Asset
Value,
Beginning of
Period $1.00 $1.00 $1.00 $1.00 $1.00 $1.00
----------- -------- -------- -------- -------- -----------
Income From
Investment
Operations
Net
Investment
Income
(Loss) 0.02 0.04 0.02 0.01 --(3) --(3)
----------- -------- -------- -------- -------- -----------
Distributions
From Net
Investment
Income (0.02) (0.04) (0.02) (0.01) --(3) --(3)
----------- -------- -------- -------- -------- -----------
Net Asset
Value, End of
Period $1.00 $1.00 $1.00 $1.00 $1.00 $1.00
=========== ======== ======== ======== ======== ===========
TOTAL RETURN(4) 2.07% 4.06% 2.51% 0.57% 0.09% 0.40%
RATIOS/SUPPLEMENTAL DATA
Ratio of
Operating
Expenses to
Average Net
Assets 1.30%(5)(6) 1.30%(5) 1.32%(5) 1.28%(7) 1.10%(7) 1.34%(6)(7)
Ratio of
Operating
Expenses to
Average Net
Assets (Before
Expense Waiver) 1.34%(6) 1.34% 1.34% 1.35% 1.36% 1.36%(6)
Ratio of Net
Investment
Income (Loss)
to Average Net
Assets 4.12%(5)(6) 3.98%(5) 2.49%(5) 0.49%(7) 0.09%(7) 0.47%(6)(7)
Ratio of Net
Investment
Income (Loss)
to Average Net
Assets (Before
Expense Waiver) 4.08%(6) 3.94% 2.47% 0.42% (0.17)% 0.45%(6)
Net Assets, End
of Period (in
thousands) $1,020 $527 $863 $604 $96 $40
(1) Six months ended September 30, 2007 (unaudited).
(2) May 7, 2002 (commencement of sale) through March 31, 2003.
(3) Per-share amount was less than $0.005.
(4) Total return assumes reinvestment of net investment income and capital
gains distributions, if any, and does not reflect applicable sales charges.
Total returns for periods less than one year are not annualized.
(5) Effective July 29, 2005, the investment advisor voluntarily agreed to
waive a portion of its management fee.
(6) Annualized.
(7) The distributor voluntarily waived a portion of its distribution and
service fees.
See Notes to Financial Statements.
- ------
24
PROXY VOTING RESULTS
A special meeting of shareholders was held on July 27, 2007, to vote on the
following proposals. The proposals received the required number of votes of
the American Century Investment Trust or the applicable fund, depending on the
proposal, and were adopted. A summary of voting results is listed below each
proposal.
PROPOSAL 1:
To elect eight Trustees to the Board of Trustees of American Century
Investment Trust (the proposal was voted on by all shareholders of funds
issued by American Century Investment Trust).
Jonathan S. Thomas For: 3,336,300,729
Withhold: 35,929,005
Abstain: 0
Broker Non-Vote: 0
John Freidenrich For: 3,337,319,127
Withhold: 34,910,607
Abstain: 0
Broker Non-Vote: 0
Ronald J. Gilson For: 3,337,806,752
Withhold: 34,422,982
Abstain: 0
Broker Non-Vote: 0
Kathryn A. Hall For: 3,337,653,997
Withhold: 34,575,737
Abstain: 0
Broker Non-Vote: 0
Peter F. Pervere For: 3,336,793,063
Withhold: 35,436,671
Abstain: 0
Broker Non-Vote: 0
Myron S. Scholes For: 3,335,709,158
Withhold: 36,520,576
Abstain: 0
Broker Non-Vote: 0
John B. Shoven For: 3,337,333,277
Withhold: 34,896,457
Abstain: 0
Broker Non-Vote: 0
Jeanne D. Wohlers For: 3,336,368,531
Withhold: 35,861,203
Abstain: 0
Broker Non-Vote: 0
- ------
25
PROPOSAL 2:
To approve a change in the fee structure of the Advisor Class. This proposal
was voted on by the Advisor Class shareholders of the fund.
For: 1,955,971
Against: 144,822
Abstain: 13,584
Broker Non-Vote: 500,497
- ------
26
APPROVAL OF MANAGEMENT AGREEMENT
Prime Money Market
Under Section 15(c) of the Investment Company Act, contracts for investment
advisory services are required to be reviewed, evaluated and approved by a
majority of a fund's independent directors or trustees (the "Directors") each
year. At American Century, this process is referred to as the "15(c) Process."
As a part of this process, the board reviews fund performance, shareholder
services, audit and compliance information, and a variety of other reports
from the advisor concerning fund operations. In addition to this annual
review, the board of directors oversees and evaluates on a continuous basis at
its quarterly meetings the nature and quality of significant services
performed by the advisor, fund performance, audit and compliance information,
and a variety of other reports relating to fund operations. The board, or
committees of the board, also holds special meetings as needed.
Under a Securities and Exchange Commission rule, each fund is required to
disclose in its annual or semiannual report, as appropriate, the material
factors and conclusions that formed the basis for the board's approval or
renewal of any advisory agreements within the fund's most recently completed
fiscal half-year period.
ANNUAL CONTRACT REVIEW PROCESS
As part of the annual 15(c) Process undertaken during the most recent fiscal
half-year period, the Directors reviewed extensive data and information
compiled by the advisor and certain independent providers of evaluative data
(the "15(c) Providers") concerning Prime Money Market (the "fund") and the
services provided to the fund under the management agreement. The information
considered and the discussions held at the meetings included, but were not
limited to:
* the nature, extent and quality of investment management, shareholder
services and other services provided to the fund under the management
agreement;
* reports on the advisor's activities relating to the wide range of programs
and services the advisor provides to the fund and its shareholders on a
routine and non-routine basis;
* data comparing the cost of owning the fund to the cost of owning a similar
fund;
* data comparing the fund's performance to appropriate benchmarks and/or a
peer group of other mutual funds with similar investment objectives and
strategies;
* financial data showing the profitability of the fund to the advisor and the
overall profitability of the advisor; and
* data comparing services provided and charges to other investment management
clients of the advisor.
In keeping with its practice, the fund's board of directors held two regularly
scheduled meetings to review and discuss the information provided by the
advisor and to complete its negotiations with the advisor regarding the
renewal of the management agreement, including the setting of the applicable
advisory fee. The board also had the benefit of the advice of its independent
counsel throughout the period.
- ------
27
FACTORS CONSIDERED
The Directors considered all of the information provided by the advisor, the
15(c) Providers, and the board's independent counsel, and evaluated such
information for each fund for which the board has responsibility. The
Directors did not identify any single factor as being all-important or
controlling, and each Director may have attributed different levels of
importance to different factors. In deciding to renew the agreement under the
terms ultimately determined by the board to be appropriate, the Directors'
decision was based on the following factors.
NATURE, EXTENT AND QUALITY OF SERVICES - GENERALLY. Under the management
agreement, the advisor is responsible for providing or arranging for all
services necessary for the operation of the fund. The board noted that under
the management agreement, the advisor provides or arranges at its own expense
a wide variety of services including:
* fund construction and design
* portfolio security selection
* initial capitalization/funding
* securities trading
* custody of fund assets
* daily valuation of the fund's portfolio
* shareholder servicing and transfer agency, including shareholder
confirmations, recordkeeping and communications
* legal services
* regulatory and portfolio compliance
* financial reporting
* marketing and distribution
The Directors noted that many of these services have expanded over time both
in terms of quantity and complexity in response to shareholder demands,
competition in the industry and the changing regulatory environment. In
performing their evaluation, the Directors considered information received in
connection with the annual review, as well as information provided on an
ongoing basis at their regularly scheduled board and committee meetings.
INVESTMENT MANAGEMENT SERVICES. The nature of the investment management
services provided is quite complex and allows fund shareholders access to
professional money management, instant diversification of their investments
within an asset class, the opportunity to easily diversify among asset
classes, and liquidity. In evaluating investment performance, the board
expects the advisor to manage the fund in accordance with its investment
objectives and approved strategies. In providing these
- ------
28
services, the advisor utilizes teams of investment professionals (portfolio
managers, analysts, research assistants, and securities traders) who require
extensive information technology, research, training, compliance and other
systems to conduct their business. At each quarterly meeting the Directors
review investment performance information for the fund, together with
comparative information for appropriate benchmarks and peer groups of funds
managed similarly to the fund. The Directors also review detailed performance
information during the 15(c) Process. If performance concerns are identified,
the Directors discuss with the advisor the reasons for such results (e.g.,
market conditions, security selection) and any efforts being undertaken to
improve performance. The fund's performance for both the one- and three-year
periods was above the median for its peer group.
SHAREHOLDER AND OTHER SERVICES. The advisor provides the fund with a
comprehensive package of transfer agency, shareholder, and other services. The
Directors review reports and evaluations of such services at their regular
quarterly meetings, including the annual meeting concerning contract review,
and reports to the board. These reports include, but are not limited to,
information regarding the operational efficiency and accuracy of the
shareholder and transfer agency services provided, staffing levels,
shareholder satisfaction (as measured by external as well as internal
sources), technology support, new products and services offered to fund
shareholders, securities trading activities, portfolio valuation services,
auditing services, and legal and operational compliance activities. Certain
aspects of shareholder and transfer agency service level efficiency and the
quality of securities trading activities are measured by independent third
party providers and are presented in comparison to other fund groups not
managed by the advisor.
COSTS OF SERVICES PROVIDED AND PROFITABILITY TO THE ADVISOR. The advisor
provides detailed information concerning its cost of providing various
services to the fund, its profitability in managing the fund, its overall
profitability, and its financial condition. The Directors have reviewed with
the advisor the methodology used to prepare this financial information. This
financial information regarding the advisor is considered in order to evaluate
the advisor's financial condition, its ability to continue to provide services
under the management agreement, and the reasonableness of the current
management fee.
ETHICS OF THE ADVISOR. The Directors generally consider the advisor's
commitment to providing quality services to shareholders and to conducting its
business ethically. They noted that the advisor's practices generally meet or
exceed industry best practices.
ECONOMIES OF SCALE. The Directors review reports provided by the advisor on
economies of scale for the complex as a whole and the year-over-year changes
in revenue, costs, and profitability. The Directors concluded that economies
of scale are difficult to measure and predict with precision, especially on a
fund-by-fund basis. This analysis is also complicated by the additional
services and content provided by the advisor and its reinvestment in its
ability to provide and expand those services. Accordingly, the Directors also
seek to evaluate economies of scale by reviewing other information, such as
year-over-year profitability of the advisor generally, the profitability of
its management of the fund specifically, the expenses incurred by the advisor
in providing various functions to the fund, and the breakpoint fees of
competitive funds not managed by the advisor. The Directors believe the
advisor is appropriately sharing
- ------
29
economies of scale through its competitive fee structure, fee breakpoints as
the fund complex and the fund increases in size, and through reinvestment in
its business to provide shareholders additional content and services. In
particular, separate breakpoint schedules based on the size of the entire fund
complex and on the size of the fund reflect the complexity of assessing
economies of scale.
COMPARISON TO OTHER FUNDS' FEES. The fund pays the advisor a single,
all-inclusive (or unified) management fee for providing all services necessary
for the management and operation of the fund, other than brokerage expenses,
taxes, interest, extraordinary expenses, and the fees and expenses of the
fund's independent directors (including their independent legal counsel).
Under the unified fee structure, the advisor is responsible for providing all
investment advisory, custody, audit, administrative, compliance,
recordkeeping, marketing and shareholder services, or arranging and
supervising third parties to provide such services. By contrast, most other
funds are charged a variety of fees, including an investment advisory fee, a
transfer agency fee, an administrative fee, distribution charges and other
expenses. Other than their investment advisory fees and Rule 12b-1
distribution fees, all other components of the total fees charged by these
other funds may be increased without shareholder approval. The board believes
the unified fee structure is a benefit to fund shareholders because it clearly
discloses to shareholders the cost of owning fund shares, and, since the
unified fee cannot be increased without a vote of fund shareholders, it shifts
to the advisor the risk of increased costs of operating the fund and provides
a direct incentive to minimize administrative inefficiencies. Part of the
Directors' analysis of fee levels involves reviewing certain evaluative data
compiled by an independent provider and comparing the fund's unified fee to
the total expense ratio of other funds in the fund's peer group. The unified
fee charged to shareholders of the fund was slightly above the median of the
total expense ratios of its peer group.
COMPARISON TO FEES AND SERVICES PROVIDED TO OTHER CLIENTS OF THE ADVISOR. The
Directors also requested and received information from the advisor concerning
the nature of the services, fees, and profitability of its advisory services
to advisory clients other than the fund. They observed that these varying
types of client accounts require different services and involve different
regulatory and entrepreneurial risks than the management of the fund. The
Directors analyzed this information and concluded that the fees charged and
services provided to the fund were reasonable by comparison.
COLLATERAL BENEFITS DERIVED BY THE ADVISOR. The Directors reviewed information
from the advisor concerning collateral benefits it receives as a result of its
relationship with the fund. They concluded that the advisor's primary business
is managing mutual funds and it generally does not use fund or shareholder
information to generate profits in other lines of business, and therefore does
not derive any significant collateral benefits from them. The Directors noted
that the advisor receives proprietary research from broker-dealers that
execute fund portfolio transactions and concluded that this research is likely
to benefit fund shareholders. The Directors also determined that the advisor
is able to provide investment management services to certain clients other
than the fund, at least in part, due to its existing infrastructure built to
serve the fund complex. The Directors concluded, however, that the assets of
those other clients are not material to the analysis and, in any event, are
included with the assets of the fund to determine breakpoints in the fund's
fee schedule, provided they are managed using the same investment team and
strategy.
- ------
30
CONCLUSIONS OF THE DIRECTORS
As a result of this process, the Directors negotiated a one-year waiver by the
advisor of a portion of the management fee. These changes were proposed by the
Directors based on their review of the fund's percentile rank in its peer
group universe and the fact that the Directors seek as a general rule to have
total expense ratios of fixed income and money market funds in the lowest 25th
percentile of the fees of comparable funds. The advisor accepted the principle
of the fee waiver based on the fact that the lower fee will result in
increased competitiveness of the fund within its peer group universe. The fee
waiver, effective August 1, 2007, will result in a lowering of the management
fee of the fund by 0.021 percentage points below the current management fee.
Following these negotiations with the advisor, the Directors concluded that
the investment management agreement between the fund and the advisor is fair
and reasonable in light of the services provided and should be renewed.
- ------
31
SHARE CLASS INFORMATION
Four classes of shares are authorized for sale by the fund: Investor Class, A
Class, B Class, and C Class. The total expense ratios of A Class, B Class, and
C Class shares are higher than that of Investor Class shares.
INVESTOR CLASS shares are available for purchase in two ways: 1) directly from
American Century without any commissions or other fees; and/or 2) through
certain financial intermediaries (such as banks, broker-dealers, insurance
companies and investment advisors), which may require payment of a transaction
fee to the financial intermediary. The fund's prospectus contains additional
information regarding eligibility for Investor Class shares.
A CLASS shares are sold primarily through employer-sponsored retirement plans
and through institutions such as investment advisors, banks, broker-dealers,
and insurance companies. A Class shares are sold at their net asset value. If
you purchase A Class shares of the fund directly, a sales charge will apply
when you exchange into the A Class shares of another American Century Advisor
Fund, in accordance with the schedule set forth in that fund's prospectus. A
Class shares may be subject to a contingent deferred sales charge (CDSC).
There is no CDSC on shares acquired through reinvestment of dividends or
capital gains. The prospectus contains information regarding reductions and
waivers of sales charges for A Class shares. The unified management fee for A
Class shares is the same as for Investor Class shares. A Class shares also are
subject to a 0.25% annual Rule 12b-1 distribution and service fee.
B CLASS shares are sold primarily through employer-sponsored retirement plans
and through institutions such as investment advisors, banks, broker-dealers,
and insurance companies. B Class shares redeemed within six years of purchase
are subject to a CDSC that declines from 5.00% during the first year after
purchase to 0.00% after the sixth year. There is no CDSC on shares acquired
through reinvestment of dividends or capital gains. The unified management fee
for B Class shares is the same as for Investor Class shares. B Class shares
also are subject to a 1.00% annual Rule 12b-1 distribution and service fee. B
Class shares automatically convert to A Class shares (with lower expenses)
eight years after their purchase date.
C CLASS shares are sold primarily through employer-sponsored retirement plans
and through institutions such as investment advisors, banks, broker-dealers,
and insurance companies. C Class shares redeemed within 12 months of purchase
are subject to a CDSC of 0.75%. There is no CDSC on shares acquired through
reinvestment of dividends or capital gains. The unified management fee for C
Class shares is the same as for Investor Class shares. C Class shares also are
subject to a Rule 12b-1 distribution and service fee of 0.75%.
All classes of shares represent a pro rata interest in the fund and generally
have the same rights and preferences.
- ------
32
ADDITIONAL INFORMATION
RETIREMENT ACCOUNT INFORMATION
As required by law, any distributions you receive from an IRA or certain
403(b), 457 and qualified plans [those not eligible for rollover to an IRA or
to another qualified plan] are subject to federal income tax withholding,
unless you elect not to have withholding apply. Tax will be withheld on the
total amount withdrawn even though you may be receiving amounts that are not
subject to withholding, such as nondeductible contributions. In such case,
excess amounts of withholding could occur. You may adjust your withholding
election so that a greater or lesser amount will be withheld.
If you don't want us to withhold on this amount, you must notify us to not
withhold the federal income tax. Even if you plan to roll over the amount you
withdraw to another tax-deferred account, the withholding rate still applies
to the withdrawn amount unless we have received notice not to withhold federal
income tax prior to the withdrawal. You may notify us in writing or in certain
situations by telephone or through other electronic means. You have the right
to revoke your withholding election at any time and any election you make may
remain in effect until revoked by filing a new election.
Remember, even if you elect not to have income tax withheld, you are liable
for paying income tax on the taxable portion of your withdrawal. If you elect
not to have income tax withheld or you don't have enough income tax withheld,
you may be responsible for payment of estimated tax. You may incur penalties
under the estimated tax rules if your withholding and estimated tax payments
are not sufficient.
State tax will be withheld if, at the time of your distribution, your address
is within one of the mandatory withholding states and you have federal income
tax withheld. State taxes will be withheld from your distribution in
accordance with the respective state rules.
PROXY VOTING GUIDELINES
American Century Investment Management, Inc., the fund's investment advisor,
is responsible for exercising the voting rights associated with the securities
purchased and/or held by the fund. A description of the policies and
procedures the advisor uses in fulfilling this responsibility is available
without charge, upon request, by calling 1-800-345-2021. It is also available
on American Century's website at americancentury.com and on the Securities and
Exchange Commission's website at sec.gov. Information regarding how the
investment advisor voted proxies relating to portfolio securities during the
most recent 12-month period ended June 30 is available on the "About Us" page
at americancentury.com. It is also available at sec.gov.
QUARTERLY PORTFOLIO DISCLOSURE
The fund files its complete schedule of portfolio holdings with the Securities
and Exchange Commission (SEC) for the first and third quarters of each fiscal
year on Form N-Q. The fund's Form N-Q is available on the SEC's website at
sec.gov, and may be reviewed and copied at the SEC's Public Reference Room in
Washington, DC. Information on the operation of the Public Reference Room may
be obtained by calling 1-800-SEC-0330. The fund also makes its complete
schedule of portfolio holdings for the most recent quarter of its fiscal year
available on its website at americancentury.com and, upon request, by calling
1-800-345-2021.
- ------
33
INDEX DEFINITIONS
The following indices are used to illustrate investment market, sector, or
style performance or to serve as fund performance comparisons. They are not
investment products available for purchase.
The 90-DAY U.S. TREASURY BILL INDEX is derived from secondary market interest
rates as published by the Federal Reserve Bank and includes three-month,
six-month, and one-year instruments.
The CITIGROUP AGENCY INDEX is a market-capitalization-weighted index that
includes U.S. government sponsored agencies with a remaining maturity of at
least one year.
The CITIGROUP CREDIT INDEX includes US and non-US corporate securities and
non-US sovereign and provincial securities.
The CITIGROUP MORTGAGE INDEX measures the mortgage component of the US BIG
Index, comprising 30-and 15-year GNMA, FNMA, and FHLMC pass-throughs and FNMA
and FHLMC balloon mortgages.
The CITIGROUP TREASURY INDEX is comprised of U.S. Treasury securities with an
amount outstanding of at least $5 billion and a remaining maturity of at least
one year.
The CITIGROUP US BROAD INVESTMENT-GRADE (BIG) BOND INDEX is a market-
capitalization-weighted index that includes fixed-rate Treasury,
government-sponsored, mortgage, asset-backed, and investment-grade issues with
a maturity of one year or longer.
The CITIGROUP US HIGH-YIELD MARKET INDEX captures the performance of
below-investment-grade debt issued by corporations domiciled in the United
States or Canada. This index includes cash-pay and deferred-interest
securities that are publicly placed, have a fixed coupon, and are
nonconvertible.
The CITIGROUP US INFLATION-LINKED SECURITIES INDEX (ILSI) measures the return
of bonds with fixed-rate coupon payments that adjust for inflation as measured
by the Consumer Price Index (CPI).
- ------
34
NOTES
- ------
35
NOTES
- ------
36
[back cover]
CONTACT US
AMERICANCENTURY.COM
AUTOMATED INFORMATION LINE:
1-800-345-8765
INVESTOR SERVICES REPRESENTATIVE:
1-800-345-2021 or 816-531-5575
INVESTORS USING ADVISORS:
1-800-378-9878
BUSINESS, NOT-FOR-PROFIT,
EMPLOYER-SPONSORED RETIREMENT PLANS:
1-800-345-3533
BANKS AND TRUST COMPANIES, BROKER-DEALERS,
FINANCIAL PROFESSIONALS, INSURANCE COMPANIES:
1-800-345-6488
TELECOMMUNICATIONS DEVICE FOR THE DEAF:
1-800-634-4113 or 816-444-3485
AMERICAN CENTURY INVESTMENT TRUST
INVESTMENT ADVISOR:
American Century Investment Management, Inc.
Kansas City, Missouri
THIS REPORT AND THE STATEMENTS IT CONTAINS ARE SUBMITTED FOR THE GENERAL
INFORMATION OF OUR SHAREHOLDERS. THE REPORT IS NOT AUTHORIZED FOR DISTRIBUTION
TO PROSPECTIVE INVESTORS UNLESS PRECEDED OR ACCOMPANIED BY AN EFFECTIVE
PROSPECTUS.
American Century Investments
P.O. Box 419200
Kansas City, MO 64141-6200
PRSRT STD
U.S. POSTAGE PAID
AMERICAN CENTURY
COMPANIES
American Century Investment Services, Inc., Distributor
©2007 American Century Proprietary Holdings, Inc. All rights reserved.
The American Century Investments logo, American Century and American Century
Investments are service marks of American Century Proprietary Holdings, Inc.
0711
SH-SAN-56804S
[front cover]
AMERICAN CENTURY INVESTMENTS
Semiannual Report September 30, 2007
[photo of fall]
Diversified Bond Fund
High-Yield Fund
[american century investments logo and text logo]
OUR MESSAGE TO YOU
To help you monitor your investment, my colleagues and I take pride in
providing you with the semiannual report for the American Century® Diversified
Bond and High-Yield funds for the six months ended September 30, 2007. This
has been an eventful and exciting period for us. We've been working diligently
to secure a smooth executive leadership transition.
I'm honored to be addressing you in the "Our Message" space long devoted to
company founder Jim Stowers, Jr. and his son Jim Stowers III. The Stowers
family remains an integral part of our heritage, leadership, and financial
structure. Jim Jr. continues as co-chair of the American Century Companies,
Inc. (ACC) board of directors with Richard Brown, who has been on the board
since 1998 and co-chairs the Stowers Institute for Medical Research board.
But times and opportunities change. As the latest step in a career transition
that began when he relinquished his executive leadership and investment
management responsibilities in early 2005, Jim III stepped down from the ACC
board in July 2007 to focus on new business ventures. Jim III's move reflects
his family's comfort with our direction and leadership, and gives the Stowers
more leeway to devote time and energy to other important priorities, such as
the Stowers Institute for Medical Research.
Meanwhile, American Century Investments, our clients, and our employees have
been my top priority since I became company president and CEO in March. We've
also added the executive talents of overall chief investment officer Enrique
Chang, international equity CIO Mark On, U.S. growth equity CIO Steve Lurito,
and chief operating officer Barry Fink.
This skilled group, combined with our existing senior management team, has
already had a positive impact on the development and management of the
products and services we take pride in delivering to you.
/s/Jonathan Thomas
Jonathan Thomas
[photo of Jonathan Thomas]
Jonathan Thomas
PRESIDENT
AMERICAN CENTURY COMPANIES, INC.
[photo of James E. Stowers, Jr.]
James E. Stowers, Jr.
FOUNDER AND CO-CHAIRMAN OF THE BOARD
AMERICAN CENTURY COMPANIES, INC.
[photo of Richard Brown]
Richard Brown
CO-CHAIRMAN OF THE BOARD
AMERICAN CENTURY COMPANIES, INC.
TABLE OF CONTENTS
Market Perspective. . . . . . . . . . . . . . . . . . . . . . . . . . 2
U.S. Fixed-Income Total Returns. . . . . . . . . . . . . . . . . . . 2
DIVERSIFIED BOND
Performance . . . . . . . . . . . . . . . . . . . . . . . . . . . . . 3
Portfolio Commentary. . . . . . . . . . . . . . . . . . . . . . . . . 5
Portfolio at a Glance. . . . . . . . . . . . . . . . . . . . . . . . 5
Yields . . . . . . . . . . . . . . . . . . . . . . . . . . . . . . . 5
Types of Investments in Portfolio. . . . . . . . . . . . . . . . . . 6
Portfolio Composition by Credit Rating . . . . . . . . . . . . . . . 6
Schedule of Investments . . . . . . . . . . . . . . . . . . . . . . . 7
HIGH-YIELD
Performance . . . . . . . . . . . . . . . . . . . . . . . . . . . . . 17
Portfolio Commentary. . . . . . . . . . . . . . . . . . . . . . . . . 19
Portfolio at a Glance. . . . . . . . . . . . . . . . . . . . . . . . 19
Yields . . . . . . . . . . . . . . . . . . . . . . . . . . . . . . . 19
Top Five Industries. . . . . . . . . . . . . . . . . . . . . . . . . 20
Portfolio Composition by Credit Rating . . . . . . . . . . . . . . . 20
Schedule of Investments . . . . . . . . . . . . . . . . . . . . . . . 21
Shareholder Fee Examples. . . . . . . . . . . . . . . . . . . . . . . 27
FINANCIAL STATEMENTS
Statement of Assets and Liabilities . . . . . . . . . . . . . . . . . 30
Statement of Operations . . . . . . . . . . . . . . . . . . . . . . . 32
Statement of Changes in Net Assets. . . . . . . . . . . . . . . . . . 33
Notes to Financial Statements . . . . . . . . . . . . . . . . . . . . 34
Financial Highlights. . . . . . . . . . . . . . . . . . . . . . . . . 42
OTHER INFORMATION
Proxy Voting Results. . . . . . . . . . . . . . . . . . . . . . . . . 54
Approval of Management Agreements for Diversified Bond
and High-Yield. . . . . . 56
Share Class Information . . . . . . . . . . . . . . . . . . . . . . . 61
Additional Information. . . . . . . . . . . . . . . . . . . . . . . . 63
Index Definitions . . . . . . . . . . . . . . . . . . . . . . . . . . 64
The opinions expressed in the Market Perspective and each of the Portfolio
Commentaries reflect those of the portfolio management team as of the date of
the report, and do not necessarily represent the opinions of American Century
or any other person in the American Century organization. Any such opinions
are subject to change at any time based upon market or other conditions and
American Century disclaims any responsibility to update such opinions. These
opinions may not be relied upon as investment advice and, because investment
decisions made by American Century funds are based on numerous factors, may
not be relied upon as an indication of trading intent on behalf of any
American Century fund. Security examples are used for representational
purposes only and are not intended as recommendations to purchase or sell
securities. Performance information for comparative indices and securities is
provided to American Century by third party vendors. To the best of American
Century's knowledge, such information is accurate at the time of printing.
MARKET PERSPECTIVE
[photo of chief investment officer]
By David MacEwen, Chief Investment Officer, Fixed Income
MODEST GROWTH, INFLATION, BOND RETURNS
U.S. bonds managed positive returns during the six months ended September 30,
2007. But the ride was bumpy -- bond market volatility surged to the highest
level in years as waves from the bursting housing and subprime mortgage
bubbles spread to the broader economy and financial markets.
U.S. economic growth was moderate over the last four complete calendar
quarters, running at an approximately 2-3% average annual rate. Many
economists are calling for sub-2% growth going forward. Inflation slowed, as
the trailing 12-month percentage change in core consumer prices (without
volatile food and energy prices) finished September at 2.1%. That's down from
2.9% as recently as September 2006.
To help alleviate some of the market and economic concerns, the Federal
Reserve (the Fed) lowered its benchmark federal funds rate target in
September. This came on top of cuts to its discount rate in both August and
September -- the Fed's first rate cuts since June 2003.
RATES FELL, CURVE STEEPENED
Against that backdrop, Treasury yields generally declined. The yield on the
two-year Treasury note fell from 4.58% to 3.99%; however, yields on
longer-term notes and bonds fell less. That's because investors worried about
the potential long-term inflation effects of Fed rate cuts, high energy and
commodity prices, and a weaker dollar. As a result, the yield curve (a graphic
representation of bond yields at different maturities) fell and steepened --
the difference in yield between two- and 10-year Treasury securities increased
sharply from seven to 60 basis points (a basis point equals 0.01%).
HIGH-QUALITY BONDS DID BEST
The volatility, credit, and liquidity concerns in the market all favored
Treasury securities over higher-yielding, lower-quality alternatives (see the
accompanying returns table above). So, for example, while the Treasury market
enjoyed its best quarter in five years from July to September, July was one of
the worst months on record for high-yield bonds. Treasury inflation-indexed
securities performed best because of their combination of high credit quality
and inflation protection.
U.S. Fixed-Income Total Returns
For the six months ended September 30, 2007*
TREASURY SECURITIES
3-Month Bill 2.69%
2-Year Note 3.25%
5-Year Note 3.60%
10-Year Note 2.72%
30-Year Bond 2.57%
CITIGROUP US BOND MARKET INDICES
High-Yield (corporate) 0.65%
Credit (investment-grade corporate) 1.50%
Mortgage 2.16%
Broad Investment-Grade (multi-sector) 2.42%
Agency 3.04%
Treasury 3.38%
Inflation-Linked Securities 3.76%
*Total returns for periods less than one year are not annualized.
- ------
2
PERFORMANCE
Diversified Bond
Total Returns as of September 30, 2007
Average Annual Returns
6 5 10 Since Inception
months(1) 1 year years years Inception Date
INVESTOR CLASS 2.41% 5.05% 3.78% -- 4.22% 12/3/01
CITIGROUP US BROAD
INVESTMENT-GRADE BOND
INDEX 2.42% 5.25% 4.23% 6.01% 4.95%(2) --
Institutional Class 2.51% 5.26% 3.99% 5.47% 5.70% 4/1/93
A Class(3)
No sales charge* 2.28% 4.78% 3.52% -- 3.96%
With sales charge* -2.30% 0.07% 2.57% -- 3.15% 12/3/01
B Class
No sales charge* 1.90% 4.01% -- -- 2.68%
With sales charge* -3.10% 0.01% -- -- 2.29% 1/31/03
C Class
No sales charge* 1.90% 4.01% -- -- 2.72%
With sales charge* 0.90% 4.01% -- -- 2.72% 1/31/03
R Class 2.16% 4.53% -- -- 3.36% 7/29/05
* Sales charges include initial sales charges and contingent deferred sales
charges (CDSCs), as applicable. A Class shares have a 4.50% maximum initial
sales charge for fixed income funds and may be subject to a maximum CDSC of
1.00%. B Class shares redeemed within six years of purchase are subject to a
CDSC that declines from 5.00% during the first year after purchase to 0.00%
the sixth year after purchase. C Class shares redeemed within 12 months of
purchase are subject to a maximum CDSC of 1.00%. Please see the Share Class
Information pages for more about the applicable sales charges for each share
class. The SEC requires that mutual funds provide performance information net
of maximum sales charges in all cases where charges could be applied.
Diversified Bond acquired all of the net assets of the American Century
Intermediate-Term Bond Fund, the American Century Bond Fund, and the American
Century Premium Bond Fund on December 3, 2001, pursuant to a plan of
reorganization approved by the acquired funds' shareholders on November 16,
2001. Financial information prior to December 3, 2001 is that of American
Century Premium Bond Fund and is used in calculating the performance of
Diversified Bond.
(1) Total returns for periods less than one year are not annualized.
(2) Since 11/30/01, the date nearest the Investor Class's inception for which
data are available.
(3) Prior to September 4, 2007, the A Class was referred to as the Advisor
Class. Performance, with sales charge, prior to that date has been adjusted to
reflect the A Class's current sales charge.
Data presented reflect past performance. Past performance is no guarantee of
future results. Current performance may be higher or lower than the
performance shown. Investment return and principal value will fluctuate, and
redemption value may be more or less than original cost. To obtain performance
data current to the most recent month end, please call 1-800-345-2021 or visit
americancentury.com. As interest rates rise, bond values will decline.
Unless otherwise indicated, performance reflects Investor Class shares;
performance for other share classes will vary due to differences in fee
structure. For information about other share classes available, please consult
the prospectus. Data assumes reinvestment of dividends and capital gains, and
none of the charts reflect the deduction of taxes that a shareholder would pay
on fund distributions or the redemption of fund shares. Returns for the index
are provided for comparison. The fund's total returns include operating
expenses (such as transaction costs and management fees) that reduce returns,
while the total returns of the index do not.
- ------
3
Diversified Bond
Growth of $10,000 Over Life of Class
$10,000 investment made December 3, 2001
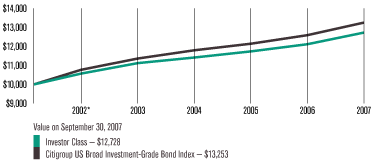
One-Year Returns Over Life of Class
Periods ended September 30
2002* 2003 2004 2005 2006 2007
Investor Class 5.72% 5.19% 2.66% 2.82% 3.22% 5.05%
Citigroup US Broad
Investment-Grade Bond Index 7.72% 5.49% 3.82% 2.92% 3.71% 5.25%
* From 12/3/01, the Investor Class's inception date. Index data from 11/30/01,
the date nearest the Investor Class's inception for which data are available.
Not annualized.
Data presented reflect past performance. Past performance is no guarantee of
future results. Current performance may be higher or lower than the
performance shown. Investment return and principal value will fluctuate, and
redemption value may be more or less than original cost. To obtain performance
data current to the most recent month end, please call 1-800-345-2021 or visit
americancentury.com. As interest rates rise, bond values will decline.
Unless otherwise indicated, performance reflects Investor Class shares;
performance for other share classes will vary due to differences in fee
structure. For information about other share classes available, please consult
the prospectus. Data assumes reinvestment of dividends and capital gains, and
none of the charts reflect the deduction of taxes that a shareholder would pay
on fund distributions or the redemption of fund shares. Returns for the index
are provided for comparison. The fund's total returns include operating
expenses (such as transaction costs and management fees) that reduce returns,
while the total returns of the index do not.
- ------
4
PORTFOLIO COMMENTARY
Diversified Bond
Lead Portfolio Managers: Jeff Houston, Hando Aguilar, Brian Howell, John
Walsh, Dan Shiffman, Jim Platz and Seth Plunkett
Macro Strategy Team Representatives: Dave MacEwen, Bob Gahagan and Jim Keegan
PERFORMANCE SUMMARY
Diversified Bond returned 2.41%* for the six months ended September 30, 2007,
in line with the 2.42% return of its benchmark, the Citigroup US Broad
Investment-Grade (BIG) Bond Index. Portfolio returns reflect operating
expenses, while index returns do not.
The portfolio's absolute return reflected the challenging climate for bonds
prevailing in recent months (see the Market Perspective on page 2). Relative
to the benchmark, Diversified Bond's performance benefited from some of our
credit, yield curve, sector, and currency allocation decisions.
CURVE POSITIONING WAS KEY
Our yield-curve positioning was the key factor explaining the portfolio's
solid performance relative to the benchmark, as we maintained a yield
curve-steepening bias during the period using two- and 10-year Treasury
futures. This trade helped relative results as the yield curve steepened
overall, particularly in August. For the six months, the yield difference
between two- and 10-year Treasurys went from seven to 60 basis points (a basis
point equals 0.01%). This curve-steepening bias is a strategy we expect to
carry forward, given our view of the economy, interest rates, and shape of the
curve.
SECTOR AND SECURITY SELECTION CONTRIBUTED
For some time now we've believed that investors have not been adequately
compensated for credit or volatility risks -- risk premiums, expressed in
terms of yield, seemed too low. As a result, we maintained an overweight
position in the securitized sector and an underweight position in the
corporate sector relative to the Citigroup US BIG Index. These trades
contributed to return in the last six months as mortgages outperformed
corporates.
Our security selection also contributed to relative results. For example, we
used a small slice of the portfolio to gain Japanese yen exposure, a trade we
put on when the yen was at a 4 1/2-year low against the dollar early in 2007.
Though currency values have been volatile, the yen appreciated against the
dollar overall for the six-month period.
Portfolio at a Glance
As of As of
9/30/07 3/31/07
Average Duration (effective) 4.9 years 4.6 years
Average Life 7.9 years 6.9 years
Yields as of September 30, 2007
30-day SEC Yield
Investor Class 4.66%
Institutional Class 4.87%
A Class 4.22%
B Class 3.66%
C Class 3.66%
R Class 4.16%
*All fund returns referenced in this commentary are for Investor Class shares.
Total returns for periods less than one year are not annualized.
- ------
5
Diversified Bond
In addition, we avoided the worst performers during the credit and liquidity
crunch that peaked in July and August. Among mortgage-backed securities, we
had essentially no subprime exposure. And when you look across all the
non-Treasury sectors, we tended to avoid the least-liquid off-the-run bonds,
which typically performed worse than more easily bought and sold on-the-run
securities.
RELATIVE-VALUE APPROACH
"We continued to focus on identifying the best relative values across the U.S.
taxable fixed-income securities universe," said Macro Strategy Team
representative Jim Keegan. "We think this steady, long-term approach to
investing is the best way to generate outperformance over time. Because of
this relative-value approach, we saw the sell-off during the liquidity crunch
in July and August as an opportunity to make some select trades to swap into
high-quality corporate issuers at what we believed were very attractive
prices. That said, we should point out that we remain underweight corporates
overall because we think there's potential for more underperformance as credit
spreads widen and risk assets are re-priced."
OUTLOOK
"We see a difficult path for the economy as a result of headwinds from
housing, the consumer, and higher energy prices," said Macro Strategy Team
representative Bob Gahagan. "The economic, market, and interest rate
environment also argue for the continuation of our curve-steepening trade and
yen overweight position. In terms of sector allocations, our caution about the
economy means we plan to continue to underweight credit-sensitive corporate
bonds and overweight Treasury and government agency securities. In addition,
we think the environment for inflation-indexed securities could be positive
going forward. On top of some positive fundamentals, inflation-indexed bonds
are benefiting from demand from investors who think the Federal Reserve will
err on the side of fighting recession, rather than inflation."
Types of Investments in Portfolio
% of fund % of fund
investments investments
as of as of
9/30/07 3/31/07
Mortgage-Backed Securities 24.5% 24.0%
U.S. Treasury Securities 17.3% 16.1%
Collateralized Mortgage Obligations 13.6% 11.7%
Corporate Bonds 12.1% 10.6%
U.S. Government Agency Securities 7.3% 10.6%
Asset-Backed Securities 3.8% 4.7%
Sovereign Governments & Agencies 2.2% 1.6%
Municipal Securities 0.2% 0.1%
Temporary Cash Investments 0.3% 1.1%
Temporary Cash Investments --
Securities Lending Collateral 18.7% 19.5%
Portfolio Composition by Credit Rating
% of fund % of fund
investments investments
as of as of
9/30/07 3/31/07
AAA 84% 85%
AA 4% 3%
A 5% 5%
BBB 7% 7%
- ------
6
SCHEDULE OF INVESTMENTS
Diversified Bond
SEPTEMBER 30, 2007 (UNAUDITED)
Principal Amount Value
U.S. Government Agency Mortgage-Backed Securities(1) -- 31.7%
$9,605 FHLMC, 6.50%, 2/1/09(2) $9,732
1,601,267 FHLMC, 5.00%, 10/1/10(2) 1,599,157
19,473 FHLMC, 6.50%, 12/1/12(2) 19,996
193,334 FHLMC, 6.00%, 1/1/13(2) 196,129
28,055 FHLMC, 7.00%, 11/1/13(2) 29,005
57,706 FHLMC, 7.00%, 6/1/14(2) 59,765
182,342 FHLMC, 6.50%, 6/1/16(2) 187,089
108,390 FHLMC, 6.50%, 6/1/16(2) 111,211
2,450,201 FHLMC, 5.00%, 11/1/17(2) 2,411,020
242,746 FHLMC, 4.50%, 1/1/19(2) 234,350
10,366,126 FHLMC, 5.00%, 1/1/21(2) 10,165,490
4,128,828 FHLMC, 5.00%, 4/1/21(2) 4,048,914
20,771 FHLMC, 7.00%, 9/1/27(2) 21,604
34,011 FHLMC, 6.50%, 1/1/28(2) 34,990
5,082 FHLMC, 7.00%, 2/1/28(2) 5,285
197,234 FHLMC, 6.50%, 3/1/29(2) 202,591
126,872 FHLMC, 6.50%, 6/1/29(2) 130,204
18,655 FHLMC, 7.00%, 8/1/29(2) 19,408
42,541 FHLMC, 7.50%, 8/1/29(2) 44,591
119,246 FHLMC, 6.50%, 5/1/31(2) 122,219
2,843 FHLMC, 6.50%, 5/1/31(2) 2,914
9,086 FHLMC, 6.50%, 6/1/31(2) 9,313
1,760 FHLMC, 6.50%, 6/1/31(2) 1,804
9,781 FHLMC, 6.50%, 6/1/31(2) 10,025
79,984 FHLMC, 6.50%, 6/1/31(2) 81,977
4,055 FHLMC, 6.50%, 6/1/31(2) 4,156
3,676 FHLMC, 6.50%, 6/1/31(2) 3,767
2,376,539 FHLMC, 5.50%, 12/1/33(2) 2,334,125
653,238 FHLMC, 6.50%, 7/1/47(2) 659,413
45,808,623 FNMA, 6.00%, settlement date 10/11/07(3) 45,873,031
22,858 FNMA, 6.00%, 2/1/09(2) 23,068
13,423 FNMA, 6.00%, 5/1/13(2) 13,669
25,276 FNMA, 6.00%, 5/1/13(2) 25,656
69,171 FNMA, 6.00%, 7/1/13(2) 70,212
105,894 FNMA, 6.00%, 12/1/13(2) 107,488
84,447 FNMA, 6.00%, 1/1/14(2) 85,719
142,711 FNMA, 6.00%, 2/1/14(2) 144,860
151,727 FNMA, 6.00%, 4/1/14(2) 154,012
578,169 FNMA, 5.50%, 12/1/16(2) 579,219
1,090,794 FNMA, 5.50%, 12/1/16(2) 1,092,776
4,131,496 FNMA, 4.50%, 5/1/19(2) 3,983,184
110,501 FNMA, 6.50%, 1/1/26(2) 113,386
Principal Amount Value
$12,331 FNMA, 7.00%, 12/1/27(2) $12,847
6,389 FNMA, 6.50%, 1/1/28(2) 6,574
6,155 FNMA, 7.00%, 1/1/28(2) 6,413
33,977 FNMA, 7.50%, 4/1/28(2) 35,667
103,374 FNMA, 7.00%, 5/1/28(2) 107,727
6,391 FNMA, 7.00%, 6/1/28(2) 6,660
26,279 FNMA, 6.50%, 1/1/29(2) 27,001
74,217 FNMA, 6.50%, 4/1/29(2) 76,182
34,021 FNMA, 7.00%, 7/1/29(2) 35,453
39,928 FNMA, 7.00%, 7/1/29(2) 41,616
106,219 FNMA, 7.50%, 7/1/29(2) 111,387
10,655 FNMA, 7.00%, 5/1/30(2) 11,107
144,206 FNMA, 7.50%, 8/1/30(2) 150,981
52,623 FNMA, 7.50%, 9/1/30(2) 55,095
275,049 FNMA, 7.00%, 9/1/31(2) 286,509
155,124 FNMA, 6.50%, 1/1/32(2) 159,030
1,383,379 FNMA, 7.00%, 6/1/32(2) 1,439,826
589,520 FNMA, 6.50%, 8/1/32(2) 604,366
3,354,384 FNMA, 5.50%, 6/1/33(2) 3,295,485
16,409,935 FNMA, 5.50%, 7/1/33(2) 16,121,793
2,774,387 FNMA, 5.50%, 8/1/33(2) 2,725,672
3,549,559 FNMA, 5.50%, 9/1/33(2) 3,487,233
23,185,640 FNMA, 5.00%, 11/1/33(2) 22,198,488
7,412,392 FNMA, 5.50%, 1/1/34(2) 7,282,238
2,472,694 FNMA, 5.00%, 8/1/35(2) 2,362,896
8,838,311 FNMA, 4.50%, 9/1/35(2) 8,206,734
10,606,453 FNMA, 5.00%, 2/1/36(2) 10,135,484
13,881,224 FNMA, 5.50%, 4/1/36(2) 13,615,121
8,618,417 FNMA, 6.50%, 8/1/37(2) 8,713,736
12,502,500 FNMA, 6.50%, 9/1/37(2) 12,732,596
317,736 FNMA, 6.50%, 6/1/47(2) 320,740
836,807 FNMA, 6.50%, 8/1/47(2) 844,718
1,176,354 FNMA, 6.50%, 8/1/47(2) 1,187,474
147,881 FNMA, 6.50%, 9/1/47(2) 149,279
1,317,568 FNMA, 6.50%, 9/1/47(2) 1,330,023
1,060,834 FNMA, 6.50%, 9/1/47(2) 1,070,862
1,070,853 FNMA, 6.50%, 9/1/47(2) 1,080,976
1,866,873 FNMA, 6.50%, 9/1/47(2) 1,884,521
42,799 GNMA, 7.50%, 8/20/17(2) 44,583
55,737 GNMA, 7.00%, 11/15/22(2) 58,426
55,866 GNMA, 8.75%, 3/15/25(2) 60,194
13,771 GNMA, 7.00%, 4/20/26(2) 14,408
26,747 GNMA, 7.50%, 8/15/26(2) 28,111
12,482 GNMA, 8.00%, 8/15/26(2) 13,276
2,367 GNMA, 7.50%, 4/15/27(2) 2,487
- ------
7
Diversified Bond
Principal Amount Value
$27,444 GNMA, 7.50%, 5/15/27(2) $28,838
21,431 GNMA, 8.00%, 6/15/27(2) 22,788
2,320 GNMA, 7.50%, 11/15/27(2) 2,438
10,601 GNMA, 7.00%, 2/15/28(2) 11,115
19,798 GNMA, 7.50%, 2/15/28(2) 20,796
16,009 GNMA, 6.50%, 3/15/28(2) 16,430
3,003 GNMA, 7.00%, 4/15/28(2) 3,148
13,621 GNMA, 6.50%, 5/15/28(2) 13,980
53,279 GNMA, 6.50%, 5/15/28(2) 54,681
2,241 GNMA, 6.50%, 5/15/28(2) 2,300
17,792 GNMA, 7.00%, 12/15/28(2) 18,654
5,074 GNMA, 8.00%, 12/15/29(2) 5,397
139,212 GNMA, 7.00%, 5/15/31(2) 145,787
-------------
TOTAL U.S. GOVERNMENT AGENCY MORTGAGE-BACKED SECURITIES
(Cost $199,120,454) 197,514,871
-------------
U.S. Treasury Securities -- 22.3%
11,000,000 U.S. Treasury Bonds, 8.125%, 8/15/19(2)(4) 14,331,801
2,180,000 U.S. Treasury Bonds, 8.125%, 8/15/21(2)(4) 2,896,165
11,817,000 U.S. Treasury Bonds, 7.125%, 2/15/23(2)(4) 14,669,707
22,556,000 U.S. Treasury Bonds, 6.125%, 11/15/27(2)(4) 26,106,811
37,882,000 U.S. Treasury Notes, 4.875%, 6/30/12(2)(4) 38,953,378
11,500,000 U.S. Treasury Notes, 4.25%, 8/15/14(2)(4) 11,422,743
15,427,000 U.S. Treasury Notes, 4.625%, 2/15/17(2)(4) 15,502,932
15,410,000 U.S. Treasury Notes, 4.50%, 5/15/17(2)(4) 15,328,142
-------------
TOTAL U.S. TREASURY SECURITIES
(Cost $135,995,002) 139,211,679
-------------
Collateralized Mortgage Obligations(1) -- 17.7%
5,540,700 Banc of America Alternative Loan Trust, Series
2007-2, Class 2A4, 5.75%, 6/25/37(2) 5,535,985
18,291,848 Banc of America Commercial Mortgage Inc.
STRIPS - COUPON, Series 2004-1, Class XP, VRN,
0.63%, 10/1/07(2) 337,751
6,766,366 Banc of America Commercial Mortgage Inc.,
Series 2000-2, Class B, 7.38%, 9/15/32(2) 7,163,423
8,250,000 Banc of America Commercial Mortgage Inc.,
Series 2004-2, Class A3 SEQ, 4.05%, 11/10/38(2) 8,060,448
Principal Amount Value
$ 13,300,000 Banc of America Commercial Mortgage Inc.,
Series 2006-6, Class A3 SEQ, 5.37%, 12/10/16(2) $ 13,211,687
1,042,091 Banc of America Large Loan, Series 2005 MIB1,
Class A1, VRN, 5.90%, 10/15/07, resets monthly
off the 1-month LIBOR plus 0.15% with no caps
(Acquired 11/18/05, Cost $1,042,090)(2)(5) 1,037,855
27,050,806 Bear Stearns Commercial Mortgage Securities
Trust STRIPS - COUPON, Series 2004 T16, Class
X2, VRN, 0.75%, 10/1/07(2) 763,434
4,311,219 Bear Stearns Commercial Mortgage Securities
Trust, Series 2006 BBA7, Class A1, VRN, 5.86%,
10/15/07, resets monthly off the 1-month LIBOR
plus 0.11% with no caps (Acquired 6/5/06, Cost
$4,311,219)(2)(5) 4,311,133
15,528,983 Commercial Mortgage Acceptance Corp. STRIPS -
COUPON, Series 1998 C2, Class X, VRN, 0.98%,
10/1/07(2) 313,275
143,990 Commercial Mortgage Pass-Through Certificates,
Series 2005 F10A, Class A1, VRN, 5.85%,
10/15/07, resets monthly off the 1-month LIBOR
plus 0.10% with no caps (Acquired 3/18/05,
Cost $143,990)(2)(5) 143,993
306,848 Commercial Mortgage Pass-Through Certificates,
Series 2005 FL11, Class A1, VRN, 5.90%,
10/15/07, resets monthly off the 1-month LIBOR
plus 0.15% with no caps (Acquired 11/18/05,
Cost $306,849)(2)(5) 306,680
11,847,790 Countrywide Home Loan Mortgage Pass-Through
Trust, Series 2007-16, Class A1, 6.50%,
10/25/37(2) 11,959,289
5,675,903 Credit Suisse First Boston Mortgage Securities
Corp., Series 2003 AR28, Class 2A1, 4.41%,
12/25/33(2) 5,713,092
3,750,000 Credit Suisse Mortgage Capital Certificates,
Series 2007 TF2A, Class A1, VRN, 5.93%,
10/15/07, resets monthly off the 1-month LIBOR
plus 0.18% with no caps (Acquired 7/24/07,
Cost $3,750,000)(2)(5) 3,721,875
- ------
8
Diversified Bond
Principal Amount Value
$ 5,151,323 FHLMC, Series 2567, Class OD, 5.00%, 8/15/15(2) $ 5,150,483
3,831,938 FHLMC, Series 2900, Class PA, 4.50%, 3/15/14(2) 3,817,001
2,020,727 FHLMC, Series 2937, Class KA, 4.50%,
12/15/14(2) 2,012,731
30,557 FNMA, Series 1989-35, Class G SEQ, 9.50%,
7/25/19(2) 33,182
1,085,000 FNMA, Series 2003-92, Class PD, 4.50%,
3/25/17(2) 1,064,411
6,804,000 GMAC Commercial Mortgage Securities, Inc.,
Series 2005 C1, Class A2 SEQ, 4.47%, 5/10/43(2) 6,722,916
1,698,012 Greenwich Capital Commercial Funding Corp.,
Series 2006 FL4A, Class A1, VRN, 5.86%,
10/5/07, resets monthly off the 1-month LIBOR
plus 0.09% with no caps (Acquired 12/14/06,
Cost $1,698,012)(2)(5) 1,693,952
1,213,608 GS Mortgage Securities Corp. II, Series 2007
EOP, Class A1 VRN, 5.89%, 10/6/07, resets
monthly off the 1-month LIBOR plus 0.09% with
no caps (Acquired 6/1/07, Cost
$1,213,608)(2)(5) 1,202,844
5,729,000 LB-UBS Commercial Mortgage Trust, Series 2005
C3, Class A3 SEQ, 4.65%, 7/30/30(2) 5,627,305
950,000 Lehman Brothers Commercial Conduit Mortgage
Trust, Series 1998 C1, Class C, 6.68%,
2/18/30(2) 950,536
1,051,512 Lehman Brothers Floating Rate Commercial
Mortgage Trust, Series 2006 LLFA, Class A1,
VRN, 5.83%, 10/15/07, resets monthly off the
1-month LIBOR plus 0.08% with no caps
(Acquired 8/7/06-9/25/06, Cost
$1,051,455)(2)(5) 1,051,061
151,466 MASTR Alternative Loans Trust, Series 2003-8,
Class 4A1, 7.00%, 12/25/33(2) 155,318
2,593,547 Merrill Lynch Floating Trust, Series 2006-1,
Class A1, VRN, 5.82%, 10/15/07, resets monthly
off the 1-month LIBOR plus 0.07% with no caps
(Acquired 10/31/06, Cost $2,593,547)(2)(5) 2,578,816
Principal Amount Value
$ 2,716,648 Thornburg Mortgage Securities Trust, Series
2006-5, Class A1, VRN, 5.25%, 10/25/07, resets
monthly off the 1-month LIBOR plus 0.12% with
no caps(2) $ 2,677,251
2,275,000 Washington Mutual Mortgage Pass-Through
Certificates, Series 2005 AR4, Class A3,
4.59%, 4/25/35(2) 2,247,830
4,497,000 Washington Mutual Mortgage Pass-Through
Certificates, Series 2005 AR4, Class A4B,
4.68%, 4/25/35(2) 4,450,811
5,893,627 Wells Fargo Mortgage Backed Securities Trust,
Series 2007-11, Class A19 SEQ, 6.00%,
8/25/37(2) 5,919,536
-------------
TOTAL COLLATERALIZED MORTGAGE OBLIGATIONS
(Cost $110,028,510) 109,935,904
-------------
Corporate Bonds -- 15.7%
AEROSPACE & DEFENSE -- 0.6%
675,000 Honeywell International Inc., 5.30%, 3/15/17(2) 659,067
853,000 Lockheed Martin Corp., 6.15%, 9/1/36(2) 865,111
1,183,000 United Technologies Corp., 4.375%, 5/1/10(2) 1,171,135
1,027,000 United Technologies Corp., 6.05%, 6/1/36(2) 1,034,589
-------------
3,729,902
-------------
AUTOMOBILES -- 0.1%
800,000 DaimlerChrysler N.A. Holding Corp., 6.50%,
11/15/13(2) 830,582
-------------
BEVERAGES -- 0.4%
951,000 Miller Brewing Co., 4.25%, 8/15/08 (Acquired
8/6/03, Cost $947,738)(2)(5) 941,793
1,490,000 SABMiller plc, 6.20%, 7/1/11 (Acquired
6/27/06, Cost $1,488,942)(2)(5) 1,540,625
-------------
2,482,418
-------------
BIOTECHNOLOGY -- 0.2%
1,034,000 Genentech, Inc., 4.75%, 7/15/15(2) 976,466
-------------
CAPITAL MARKETS -- 0.3%
747,000 Merrill Lynch & Co., Inc., 4.25%, 2/8/10(2) 734,246
1,376,000 Merrill Lynch & Co., Inc., 4.79%, 8/4/10(2) 1,354,350
-------------
2,088,596
-------------
- ------
9
Diversified Bond
Principal Amount Value
CHEMICALS -- 0.1%
$ 550,000 Rohm and Haas Co., 5.60%, 3/15/13(2) $ 548,998
-------------
COMMERCIAL BANKS -- 0.8%
1,012,000 PNC Bank N.A., 4.875%, 9/21/17(2) 932,867
741,000 PNC Funding Corp., 5.125%, 12/14/10(2) 742,207
845,000 Wachovia Bank N.A., 4.80%, 11/1/14(2) 805,593
1,320,000 Wachovia Bank N.A., 4.875%, 2/1/15(2) 1,250,521
1,167,000 Wells Fargo & Co., 4.625%, 8/9/10(2) 1,155,534
-------------
4,886,722
-------------
COMMERCIAL SERVICES & SUPPLIES -- 0.2%
550,000 Deluxe Corp., 7.375%, 6/1/15(2) 545,875
540,000 Pitney Bowes, Inc., 5.75%, 9/15/17(2) 541,798
-------------
1,087,673
-------------
CONSUMER FINANCE -- 0.1%
571,000 American Express Centurion Bank, 4.375%,
7/30/09(2) 564,665
-------------
DIVERSIFIED FINANCIAL SERVICES -- 1.6%
1,861,000 Bank of America Corp., 4.375%, 12/1/10(2) 1,833,064
949,000 Bank of America N.A., 5.30%, 3/15/17(2) 922,223
825,000 Bank of America N.A., 6.00%, 10/15/36(2) 812,161
1,634,000 Citigroup Inc., 5.00%, 9/15/14(2) 1,577,316
631,000 Citigroup Inc., 6.125%, 8/25/36(2) 626,723
1,080,000 General Electric Capital Corp., 5.625%,
9/15/17(2) 1,081,742
773,000 General Electric Capital Corp., 6.125%,
2/22/11(2) 797,223
1,167,000 John Deere Capital Corp., 4.50%, 8/25/08(2) 1,159,214
1,205,000 John Deere Capital Corp., 5.50%, 4/13/17(2) 1,195,918
-------------
10,005,584
-------------
Principal Amount Value
DIVERSIFIED TELECOMMUNICATION SERVICES -- 1.2%
$ 1,167,000 AT&T Corp., 7.30%, 11/15/11(2) $ 1,254,803
1,000,000 AT&T Inc., 6.80%, 5/15/36(2) 1,073,764
176,000 BellSouth Corp., 6.875%, 10/15/31(2) 184,781
494,000 Embarq Corp., 7.08%, 6/1/16(2) 512,952
280,000 Qwest Corp., 7.875%, 9/1/11(2) 295,400
280,000 Qwest Corp., 7.50%, 10/1/14(2) 292,600
1,263,000 Telecom Italia Capital SA, 4.00%, 1/15/10(2) 1,230,339
540,000 Telecom Italia Capital SA, 5.25%, 10/1/15(2) 513,457
680,000 Telefonica Emisiones SAU, 7.05%, 6/20/36(2) 726,632
686,000 Verizon Communications Inc., 5.55%, 2/15/16(2) 680,344
489,000 Verizon Communications Inc., 6.25%, 4/1/37(2) 493,417
-------------
7,258,489
-------------
ELECTRIC UTILITIES -- 0.8%
1,123,000 Carolina Power & Light Co., 5.15%, 4/1/15(2) 1,090,139
545,000 Carolina Power & Light Co., 5.25%, 12/15/15(2) 530,663
908,000 Cleveland Electric Illuminating Co. (The),
5.70%, 4/1/17(2) 885,040
602,000 Florida Power Corp., 4.50%, 6/1/10(2) 595,095
540,000 Florida Power Corp., 6.35%, 9/15/37(2) 552,207
780,000 Southern California Edison Co., 5.625%,
2/1/36(2) 730,957
425,000 Toledo Edison Co., 6.15%, 5/15/37(2) 397,974
-------------
4,782,075
-------------
FOOD & STAPLES RETAILING -- 0.7%
820,000 CVS Caremark Corp., 5.75%, 6/1/17(2) 801,823
500,000 Kroger Co. (The), 6.40%, 8/15/17(2) 510,766
1,014,000 Wal-Mart Stores, Inc., 4.125%, 7/1/10(2) 994,111
1,060,000 Wal-Mart Stores, Inc., 5.875%, 4/5/27(2) 1,025,388
850,000 Wal-Mart Stores, Inc., 6.50%, 8/15/37(2) 885,031
-------------
4,217,119
-------------
- ------
10
Diversified Bond
Principal Amount Value
FOOD PRODUCTS -- 0.6%
$ 1,566,000 Cadbury Schweppes U.S. Finance LLC, 3.875%,
10/1/08 (Acquired 6/14/05-11/28/05, Cost
$1,528,931)(2)(5) $ 1,544,418
1,460,000 General Mills Inc., 5.65%, 9/10/12(2) 1,474,569
830,000 Kraft Foods Inc., 6.00%, 2/11/13(2) 855,408
-------------
3,874,395
-------------
HEALTH CARE EQUIPMENT & SUPPLIES -- 0.4%
1,531,000 Baxter Finco BV, 4.75%, 10/15/10(2) 1,530,502
1,130,000 Baxter International Inc., 5.90%, 9/1/16(2) 1,141,230
-------------
2,671,732
-------------
HEALTH CARE PROVIDERS & SERVICES -- 0.3%
1,826,000 Laboratory Corp. of America Holdings, 5.625%,
12/15/15(2) 1,769,925
-------------
HOTELS, RESTAURANTS & LEISURE -- 0.2%
1,390,000 Royal Caribbean Cruises Ltd., 7.00%, 6/15/13(2) 1,389,233
-------------
HOUSEHOLD PRODUCTS -- 0.3%
560,000 Kimberly-Clark Corp., 6.125%, 8/1/17(2) 577,877
1,030,000 Procter & Gamble Co. (The), 5.55%, 3/5/37(2) 987,506
-------------
1,565,383
-------------
INDUSTRIAL CONGLOMERATES -- 0.4%
2,734,000 General Electric Co., 5.00%, 2/1/13(2) 2,713,254
-------------
INSURANCE -- 0.5%
1,280,000 Allstate Financial Global Funding, 4.25%,
9/10/08 (Acquired 9/3/03, Cost
$1,277,491)(2)(5) 1,271,100
956,000 Hartford Financial Services Group Inc. (The),
5.375%, 3/15/17(2) 925,449
600,000 Prudential Financial, Inc., 5.40%, 6/13/35(2) 525,718
570,000 Travelers Companies, Inc. (The), 6.25%,
6/15/37(2) 551,632
-------------
3,273,899
-------------
IT SERVICES -- 0.3%
1,940,000 International Business Machines Corp., 5.70%,
9/14/17(2) 1,953,836
-------------
Principal Amount Value
MACHINERY -- 0.1%
$ 550,000 Atlas Copco AB, 5.60%, 5/22/17 (Acquired
5/15/07, Cost $549,753)(2)(5) $ 543,758
-------------
MEDIA -- 1.0%
1,104,000 Comcast Corp., 5.90%, 3/15/16(2) 1,100,043
635,000 News America Holdings, 7.75%, 1/20/24(2) 697,130
1,600,000 Rogers Cable Inc., 6.25%, 6/15/13(2) 1,622,434
1,650,000 Time Warner Cable Inc., 5.40%, 7/2/12
(Acquired 4/4/07-8/9/07, Cost $1,641,366)(2)(5) 1,631,393
760,000 Time Warner Cable Inc., 6.55%, 5/1/37
(Acquired 4/4/07, Cost $755,106)(2)(5) 747,947
445,000 Time Warner Inc., 5.50%, 11/15/11(2) 444,776
176,000 Time Warner Inc., 7.625%, 4/15/31(2) 191,977
-------------
6,435,700
-------------
METALS & MINING -- 0.2%
1,045,000 Xstrata Finance Canada Ltd., 5.50%, 11/16/11
(Acquired 11/8/06-11/17/06, Cost
$1,045,503)(2)(5) 1,039,545
447,000 Xstrata Finance Canada Ltd., 5.80%, 11/15/16
(Acquired 11/8/06, Cost $445,896)(2)(5) 445,280
-------------
1,484,825
-------------
MULTI-UTILITIES -- 1.0%
950,000 CenterPoint Energy Resources Corp., 6.25%,
2/1/37(2) 935,711
1,198,000 CenterPoint Energy Resources Corp., 6.50%,
2/1/08(2) 1,198,557
1,027,000 Consolidated Edison Co. of New York, Inc.,
Series 2006 C, 5.50%, 9/15/16(2) 1,012,437
1,459,000 Dominion Resources Inc., 4.125%, 2/15/08(2) 1,451,185
584,000 Dominion Resources Inc., 4.75%, 12/15/10(2) 576,082
614,000 Pacific Gas & Electric Co., 6.05%, 3/1/34(2) 604,967
367,000 Pacific Gas & Electric Co., 5.80%, 3/1/37(2) 348,035
-------------
6,126,974
-------------
- ------
11
Diversified Bond
Principal Amount Value
MULTILINE RETAIL -- 0.4%
$ 396,000 Federated Retail Holdings, Inc., 5.35%,
3/15/12(2) $388,705
560,000 Kohl's Corp., 6.875%, 12/15/37(2) 564,080
1,390,000 Macy's Retail Holdings, Inc., 5.875%,
1/15/13(2) 1,385,974
-------------
2,338,759
-------------
OIL, GAS & CONSUMABLE FUELS -- 1.4%
560,000 Canadian Natural Resources Ltd., 5.70%,
5/15/17(2) 547,656
585,000 Devon Financing Corp., ULC, 7.875%, 9/30/31(2) 692,911
1,776,000 Enterprise Products Operating L.P., 4.95%,
6/1/10(2) 1,769,872
590,000 Enterprise Products Operating L.P., 6.65%,
10/15/34(2) 588,878
810,000 Nexen Inc., 6.40%, 5/15/37(2) 789,685
1,386,000 Premcor Refining Group Inc. (The), 6.125%,
5/1/11(2) 1,421,649
780,000 Tesoro Corp., 6.25%, 11/1/12(2) 785,850
490,000 Tesoro Corp., 6.50%, 6/1/17 (Acquired 5/23/07,
Cost $490,000)(2)(5) 488,775
470,000 Williams Companies, Inc. (The), 8.75%,
3/15/32(2) 543,438
773,000 XTO Energy Inc., 5.30%, 6/30/15(2) 744,281
615,000 XTO Energy Inc., 6.10%, 4/1/36(2) 596,830
-------------
8,969,825
-------------
PHARMACEUTICALS -- 0.7%
1,021,000 Abbott Laboratories, 5.875%, 5/15/16(2) 1,031,919
1,390,000 AstraZeneca plc, 5.40%, 9/15/12(2) 1,402,435
830,000 AstraZeneca plc, 5.90%, 9/15/17(2) 844,083
1,205,000 Wyeth, 5.95%, 4/1/37(2) 1,166,804
-------------
4,445,241
-------------
REAL ESTATE INVESTMENT TRUSTS -- 0.2%
1,080,000 ProLogis, 5.625%, 11/15/16(2) 1,025,512
-------------
SOFTWARE -- 0.3%
573,000 Intuit Inc., 5.75%, 3/15/17(2) 547,846
1,233,000 Oracle Corp., 5.00%, 1/15/11(2) 1,231,180
-------------
1,779,026
-------------
Principal Amount Value
SPECIALTY RETAIL -- 0.1%
$ 560,000 Lowe's Companies, Inc., 5.60%, 9/15/12(2) $ 566,097
-------------
WIRELESS TELECOMMUNICATION SERVICES -- 0.2%
762,000 Nextel Communications Inc., 5.95%, 3/15/14(2) 728,443
708,000 Vodafone Group plc, 5.625%, 2/27/17(2) 689,385
-------------
1,417,828
-------------
TOTAL CORPORATE BONDS
(Cost $98,474,721) 97,804,491
-------------
U.S. Government Agency Securities -- 9.4%
22,075,000 FHLMC, 4.625%, 10/25/12(2)(4) 22,074,779
8,875,000 FHLMC, 4.75%, 1/19/16(2)(4) 8,798,418
5,461,000 FNMA, 4.375%, 7/17/13(2) 5,357,126
5,700,000 FNMA, 5.375%, 6/12/17(2)(4) 5,872,721
16,293,000 FNMA, 5.80%, 2/9/26(2) 16,308,691
-------------
TOTAL U.S. GOVERNMENT AGENCY SECURITIES
(Cost $57,823,542) 58,411,735
-------------
Asset-Backed Securities(1) -- 4.9%
703,360 Accredited Mortgage Loan Trust, Series 2006-1,
Class A1, VRN, 5.19%, 10/25/07, resets monthly
off the 1-month LIBOR plus 0.06% with no
caps(2) 702,269
1,738,099 Accredited Mortgage Loan Trust, Series 2006-2,
Class A1, VRN, 5.17%, 10/25/07, resets monthly
off the 1-month LIBOR plus 0.04% with no
caps(2) 1,729,116
2,109,186 Capital One Prime Auto Receivables Trust,
Series 2004-2, Class A4, VRN, 5.81%, 10/15/07,
resets monthly off the 1-month LIBOR plus
0.06% with no caps(2) 2,108,723
7,400,000 Citibank Credit Card Issuance Trust, Series
2007 A2, VRN, 5.49%, 11/21/07, resets
quarterly off the 3-month LIBOR minus 0.01%
with no caps(2) 7,362,031
225,585 Countrywide Asset-Backed Certificates, Series
2006-6, Class 2A1, VRN, 5.20%, 10/25/07,
resets monthly off the 1-month LIBOR plus
0.07% with no caps(2) 225,525
- ------
12
Diversified Bond
Principal Amount Value
$ 3,675,287 Countrywide Asset-Backed Certificates, Series
2006-22, Class 2A1, VRN, 5.18%, 10/25/07,
resets monthly off the 1-month LIBOR plus
0.05% with no caps(2) $ 3,644,084
772,209 Countrywide Asset-Backed Certificates, Series
2006 BC2, Class 2A1, VRN, 5.17%, 10/25/07,
resets monthly off the 1-month LIBOR plus
0.04% with no caps(2) 769,212
1,164,000 Detroit Edison Securitization Funding LLC,
Series 2001-1, Class A4 SEQ, 6.19%, 3/1/13(2) 1,193,753
3,179,314 First Franklin Mortgage Loan Asset Backed
Certificates, Series 2006 FF11, Class 2A1,
VRN, 5.17%, 10/25/07, resets monthly off the
1-month LIBOR plus 0.04% with no caps(2) 3,148,182
9,374 IndyMac Residential Asset Backed Trust, Series
2006 B, Class 2A1, VRN, 5.19%, 10/25/07,
resets monthly off the 1-month LIBOR plus
0.06% with no caps(2) 9,372
136,732 Long Beach Mortgage Loan Trust, Series 2006-2,
Class 2A1, VRN, 5.20%, 10/25/07, resets
monthly off the 1-month LIBOR plus 0.07% with
no caps(2) 136,657
2,467,457 Long Beach Mortgage Loan Trust, Series 2006-6,
Class 2A1, VRN, 5.17%, 10/25/07, resets
monthly off the 1-month LIBOR plus 0.04% with
no caps(2) 2,456,499
81,423 Nomura Home Equity Loan, Inc., Series 2006
HE1, Class A1, VRN, 5.21%, 10/25/07, resets
monthly off the 1-month LIBOR plus 0.08% with
no caps(2) 81,211
67,796 Nomura Home Equity Loan, Inc., Series 2006
HE2, Class A1, VRN, 5.19%, 10/25/07, resets
monthly off the 1-month LIBOR plus 0.06% with
no caps(2) 67,450
2,041,975 SLM Student Loan Trust, Series 2006-5, Class
A2, VRN, 5.35%, 10/25/07, resets quarterly off
the 3-month LIBOR minus 0.01% with no caps(2) 2,040,693
Principal Amount Value
$ 3,000,000 SLM Student Loan Trust, Series 2006-10, Class
A2, VRN, 5.37%, 10/25/07, resets quarterly off
the 3-month LIBOR plus 0.01% with no caps(2) $ 3,001,575
1,800,560 Soundview Home Equity Loan Trust, 2006-3,
Class A1, VRN, 5.17%, 10/25/07, resets monthly
off the 1-month LIBOR plus 0.04% with no
caps(2) 1,794,994
-------------
TOTAL ASSET-BACKED SECURITIES
(Cost $30,572,355) 30,471,346
-------------
Sovereign Governments & Agencies -- 2.9%
246,000 Hydro Quebec, 8.40%, 1/15/22(2) 318,671
JPY KfW, VRN, 0.60%, 11/8/07, resets quarterly off
1,874,000,000 the 3-month JPY LIBOR minus 0.22% with no
caps(2) 16,336,551
$ 1,305,000 Province of Quebec, 5.00%, 7/17/09(2) 1,317,997
-------------
TOTAL SOVEREIGN GOVERNMENTS & AGENCIES
(Cost $17,028,033) 17,973,219
-------------
Municipal Securities -- 0.2%
1,477,000 Illinois GO, (Taxable Pension), 5.10%,
6/1/33(2)
(Cost $1,477,000) 1,386,297
-------------
Temporary Cash Investments -- 0.4%
Repurchase Agreement, Bank of America Securities, LLC,
(collateralized by various U.S. Treasury obligations, 0.875%,
4/15/10, valued at $2,851,047), in a joint trading account at
3.80%, dated 9/28/07, due 10/1/07 (Delivery value $2,537,803)(2)
(Cost $2,537,000) 2,537,000
-------------
Temporary Cash Investments -- Securities Lending Collateral(6) -- 24.2%
6,000,287 Bancaja US Debt, SAu, VRN, 5.41%, 10/10/07,
resets quarterly off the 3-month LIBOR plus
0.05% with no caps 6,000,287
5,000,000 Barclays Bank plc, 5.37%, 12/17/07 5,000,000
4,999,500 BASF AG, VRN, 5.36%, 10/22/07, resets
quarterly off the 3-month LIBOR minus 0.01%
with no caps 4,999,500
3,000,000 Dexia Credit Local, VRN, 4.84%, 10/1/07 3,000,000
4,868,524 Govco Inc., 5.37%, 12/17/07 4,868,524
- ------
13
Diversified Bond
Principal Amount Value
$ 5,996,863 K2 (USA) LLC, VRN, 4.87%, 10/1/07, resets
quarterly off the Federal Reserve Prime Loan
Rate minus 2.91% with no caps $ 5,996,863
5,997,000 Links Finance LLC, VRN, 4.87%, 10/1/07 5,997,000
5,000,000 Merrill Lynch & Co. Inc., VRN, 4.92%, 10/1/07,
resets quarterly off the Federal Reserve Prime
Loan Rate minus 2.83% with no caps 5,000,000
4,723,726 Morgan Stanley ABS Capital I, Series 2007 NC4,
Class A2A, VRN, 5.21%, 10/25/07, resets
monthly off the 1-month LIBOR plus 0.08% with
no caps 4,723,726
3,004,946 Nationwide Building Society, VRN, 5.73%,
12/10/07 3,004,946
6,000,000 Northern Rock plc, 5.34%, 10/18/07 6,000,000
6,210,953 Old Line Funding, 5.37%, 10/18/07 6,210,953
1,979,549 Silver Tower US Funding, LLC, 5.39%, 10/10/07 1,979,549
Principal Amount Value
$ 4,996,826 Tango Finance Corp., VRN, 4.88%, 10/1/07,
resets quarterly off the Federal Reserve Prime
Loan Rate minus 2.91% with no caps $ 4,996,826
6,000,000 Ulster Bank Ireland Ltd., VRN, 4.85%, 10/1/07 6,000,000
Repurchase Agreement, Lehman Brothers, Inc., (collateralized by
various U.S. Government Agency obligations in a pooled account at
the lending agent), 5.15%, dated 9/28/07, due 10/1/07 (Delivery
value $77,096,090) 77,063,017
-------------
TOTAL TEMPORARY CASH INVESTMENTS -- SECURITIES LENDING COLLATERAL
(Cost $150,841,191) 150,841,191
-------------
TOTAL INVESTMENT SECURITIES -- 129.4%
(Cost $803,897,808) 806,087,733
-------------
OTHER ASSETS AND LIABILITIES -- (29.4)% (183,333,755)
-------------
TOTAL NET ASSETS -- 100.0% $ 622,753,978
=============
Futures Contracts
Underlying
Face Amount Unrealized
Contracts Purchased Expiration Date at Value Gain (Loss)
1,198 U.S. Treasury
2-Year Notes December 2007 $248,042,156 $1,229,711
1,101 U.S. Treasury
5-Year Notes December 2007 117,841,406 1,297,179
------------ ------------
$365,883,562 $2,526,890
============ ============
Underlying
Face Amount Unrealized
Contracts Sold Expiration Date at Value Gain (Loss)
281 U.S. Long Bond December 2007 $ 31,287,594 $ (570,604)
1,071 U.S. Treasury
10-Year Notes December 2007 117,040,219 (1,787,806)
------------ ------------
$148,327,813 $(2,358,410)
============ ============
- ------
14
Diversified Bond
Swap Agreements
Notional Expiration Unrealized
Amount Description of Agreement Date Gain (Loss)
CREDIT DEFAULT
$1,725,000 Pay quarterly a fixed rate equal to March 2012 $ 172,169
0.46% multiplied by the notional
amount and receive from Barclays Bank
plc upon each default event of Centex
Corp., par value of the proportional
notional amount.
4,650,000 Pay quarterly a fixed rate equal to March 2012 465,205
0.55% multiplied by the notional
amount and receive from Deutsche Bank
Securities Inc. upon each default
event of Lennar Corp., par value of
the proportional notional amount.
27,100,000 Pay quarterly a fixed rate equal to June 2012 296,741
0.35% multiplied by the notional
amount and receive from Barclays Bank
plc upon each default event of one of
the issues of Dow Jones CDX N.A.
Investment Grade 8, par value of the
proportional notional amount.
8,500,000 Pay quarterly a fixed rate equal to June 2012 (53,621)
0.57% multiplied by the notional
amount and receive from Deutsche Bank
AG upon each default event of Darden
Restaurants, Inc., par value of the
proportional notional amount.
1,450,000 Pay quarterly a fixed rate equal to September (1,062)
0.35% multiplied by the notional 2012
amount and receive from Merrill Lynch
International upon each default event
of Computer Sciences Corp., par value
of the proportional notional amount.
1,100,000 Pay quarterly a fixed rate equal to September 219
0.36% multiplied by the notional 2012
amount and receive from Barclays Bank
plc upon each default event of
Whirlpool Corp., par value of the
proportional notional amount.
4,520,000 Pay quarterly a fixed rate equal to September (33,281)
0.47% multiplied by the notional 2012
amount and receive from Deutsche Bank
AG upon each default event of JPMorgan
Chase & Co., par value of the
proportional notional amount.
6,000,000 Pay quarterly a fixed rate equal to September (25,672)
0.63% multiplied by the notional 2012
amount and receive from Deutsche Bank
AG upon each default event of Morgan
Stanley, par value of the proportional
notional amount.
6,000,000 Pay quarterly a fixed rate equal to September (112,832)
1.32% multiplied by the notional 2012
amount and receive from Deutsche Bank
AG upon each default event of Bear
Stearns Companies Inc. (The), par
value of the proportional notional
amount.
7,600,000 Pay quarterly a fixed rate equal to March 2017 38,498
0.12% multiplied by the notional
amount and receive from Barclays Bank
plc upon each default event of Pfizer
Inc., par value of the proportional
notional amount.
3,010,000 Pay quarterly a fixed rate equal to September (23,874)
0.64% multiplied by the notional 2017
amount and receive from Deutsche Bank
AG upon each default event of JPMorgan
Chase & Co., par value of the
proportional notional amount.
----------
$ 722,490
==========
- ------
15
Diversified Bond
Notes to Schedule of Investments
CDX = Credit Derivative Indexes
FHLMC = Federal Home Loan Mortgage Corporation
FNMA = Federal National Mortgage Association
GMAC = General Motors Acceptance Corporation
GNMA = Government National Mortgage Association
GO = General Obligation
JPY = Japanese Yen
LB-UBS = Lehman Brothers Inc. -- UBS AG
LIBOR = London Interbank Offered Rate
MASTR = Mortgage Asset Securitization Transactions, Inc.
resets = The frequency with which a security's coupon changes, based on
current market conditions or an underlying index. The more frequently a
security resets, the less risk the investor is taking that the coupon will
vary significantly from current market rates.
SEQ = Sequential Payer
STRIPS = Separate Trading of Registered Interest and Principal of Securities
VRN = Variable Rate Note. Interest reset date is indicated. Rate shown is
effective September 30, 2007.
(1) Final maturity indicated, unless otherwise noted.
(2) Security, or a portion thereof, has been segregated for forward
commitments, futures contracts and/or swap agreements.
(3) Forward commitment.
(4) Security, or a portion thereof, was on loan as of September 30, 2007.
(5) Security was purchased under Rule 144A of the Securities Act of 1933 or is
a private placement and, unless registered under the Act or exempted from
registration, may only be sold to qualified institutional investors. The
aggregate value of restricted securities at September 30, 2007, was
$26,242,843, which represented 4.2% of total net assets.
(6) Investments represent purchases made by the lending agent with cash
collateral received through securities lending transactions.
See Notes to Financial Statements.
- ------
16
PERFORMANCE
High-Yield
Total Returns as of September 30, 2007
Average Annual Returns
6 Since Inception
months(1) 1 year 5 years 10 years Inception Date
INVESTOR CLASS 0.82%(2) 6.59%(2) 9.17%(2) 3.71% 3.71% 9/30/97
MERRILL LYNCH US HIGH
YIELD MASTER II
CONSTRAINED INDEX 0.65% 7.79% 12.25% 5.92% 5.92% --
LIPPER HIGH CURRENT
YIELD FUNDS AVERAGE
RETURN(3) 0.26% 7.03% 11.10% 4.31% 4.31% --
Investor Class's Lipper 333 of 270 of 105 of
Ranking(3) -- 446 320 146 105 of 146 --
Institutional Class(2) 0.92% 6.80% -- -- 6.54% 8/2/04
A Class(2)(4)
No sales charge* 0.70% 6.33% 8.95% -- 7.45%
With sales charge* -3.90% 1.52% 7.96% -- 6.57% 3/8/02
B Class(2)
No sales charge* 0.32% 5.54% -- -- 7.48%
With sales charge* -4.68% 1.54% -- -- 7.15% 1/31/03
C Class(2)
No sales charge* 0.32% 5.53% 8.16% -- 6.51%
With sales charge* -0.66% 5.53% 8.16% -- 6.51% 12/10/01
R Class(2) 0.57% 6.06% -- -- 4.94% 7/29/05
* Sales charges include initial sales charges and contingent deferred sales
charges (CDSCs), as applicable. A Class shares have a 4.50% maximum initial
sales charge for fixed income funds and may be subject to a maximum CDSC of
1.00%. B Class shares redeemed within six years of purchase are subject to a
CDSC that declines from 5.00% during the first year after purchase to 0.00%
the sixth year after purchase. C Class shares redeemed within 12 months of
purchase are subject to a maximum CDSC of 1.00%. Please see the Share Class
Information pages for more about the applicable sales charges for each share
class. The SEC requires that mutual funds provide performance information net
of maximum sales charges in all cases where charges could be applied.
(1) Total returns for periods less than one year are not annualized.
(2) Class returns would have been lower if American Century had not
voluntarily waived a portion of its management fees and reimbursed a portion
of its distribution and service fees, as applicable.
(3) Data provided by Lipper Inc. -- A Reuters Company. © 2007 Reuters. All
rights reserved. Any copying, republication or redistribution of Lipper
content, including by caching, framing or similar means, is expressly
prohibited without the prior written consent of Lipper. Lipper shall not be
liable for any errors or delays in the content, or for any actions taken in
reliance thereon.
Lipper Fund Performance -- Performance data is total return, and is
preliminary and subject to revision.
Lipper Rankings -- Rankings are based only on the universe shown and are
based on average annual total returns. This listing might not represent the
complete universe of funds tracked by Lipper.
The data contained herein has been obtained from company reports, financial
reporting services, periodicals and other resources believed to be reliable.
Although carefully verified, data on compilations is not guaranteed by Lipper
and may be incomplete. No offer or solicitations to buy or sell any of the
securities herein is being made by Lipper.
(4) Prior to September 4, 2007, the A Class was referred to as the Advisor
Class. Performance, with sales charge, prior to that date has been adjusted to
reflect the A Class's current sales charge.
Data presented reflect past performance. Past performance is no guarantee of
future results. Current performance may be higher or lower than the
performance shown. Investment return and principal value will fluctuate, and
redemption value may be more or less than original cost. To obtain performance
data current to the most recent month end, please call 1-800-345-2021 or visit
americancentury.com. As interest rates rise, bond values will decline. In
addition, the lower-rated securities in which the fund invests are subject to
greater credit risk, default risk and liquidity risk.
Unless otherwise indicated, performance reflects Investor Class shares;
performance for other share classes will vary due to differences in fee
structure. For information about other share classes available, please consult
the prospectus. Data assumes reinvestment of dividends and capital gains, and
none of the charts reflect the deduction of taxes that a shareholder would pay
on fund distributions or the redemption of fund shares. Returns for the index
are provided for comparison. The fund's total returns include operating
expenses (such as transaction costs and management fees) that reduce returns,
while the total returns of the index do not.
- ------
17
High-Yield
Growth of $10,000 Over 10 Years
$10,000 investment made September 30, 1997

One-Year Returns Over 10 Years
Periods ended September 30
1998 1999 2000 2001 2002 2003 2004 2005 2006 2007
Investor Class -0.45% 3.37% -1.80% -11.54% 3.86% 18.81% 10.67% 4.51% 5.90%* 6.59%*
Merrill Lynch
US High Yield
Master II
Constrained
Index 2.48% 3.86% 0.89% -6.13% -1.08% 28.80% 12.33% 6.59% 7.22% 7.79%
*Returns would have been lower, along with the ending value, if a portion of
the class's management fees had not been waived during the period.
Data presented reflect past performance. Past performance is no guarantee of
future results. Current performance may be higher or lower than the
performance shown. Investment return and principal value will fluctuate, and
redemption value may be more or less than original cost. To obtain performance
data current to the most recent month end, please call 1-800-345-2021 or visit
americancentury.com. As interest rates rise, bond values will decline. In
addition, the lower-rated securities in which the fund invests are subject to
greater credit risk, default risk and liquidity risk.
Unless otherwise indicated, performance reflects Investor Class shares;
performance for other share classes will vary due to differences in fee
structure. For information about other share classes available, please consult
the prospectus. Data assumes reinvestment of dividends and capital gains, and
none of the charts reflect the deduction of taxes that a shareholder would pay
on fund distributions or the redemption of fund shares. Returns for the index
are provided for comparison. The fund's total returns include operating
expenses (such as transaction costs and management fees) that reduce returns,
while the total returns of the index do not.
- ------
18
PORTFOLIO COMMENTARY
High-Yield
Lead Portfolio Manager: Mike Difley
Macro Strategy Team Representative: Jim Keegan
PERFORMANCE SUMMARY
High-Yield returned 0.82%* for the six months ended September 30, 2007. That
compares with the 0.65% return of its benchmark, the Merrill Lynch US High
Yield Master II Constrained Index. Portfolio returns reflect operating
expenses, while the index returns do not.
The portfolio's absolute return reflected the difficult climate for high-yield
bonds prevailing in recent months (see the Market Perspective on page 2).
Relative to the benchmark, the portfolio outperformed because of our sector
and security selection, as well as an underweight position in the lowest-rated
segment of the market.
HIGH-YIELD MARKET REVIEW
Beginning in June, a long streak of outperformance by the riskiest,
lowest-rated segment of the high-yield market came to an end, reflecting a
lack of liquidity and aversion to risk in the marketplace. At the peak of the
credit crunch in July and August, demand for highly leveraged bonds with light
covenants and low risk premiums evaporated. As a result, CCC-rated bonds had
negative returns for the six months, while the higher-quality B and BB bonds
managed positive performance. Looking at returns by sector, consumer-related
sectors performed poorly, led by housing bonds, while bonds from more
defensive sectors, such as telecommunications and utilities bonds, held up
well.
HIGHER-QUALITY PAID OFF
We have been positioning the portfolio to benefit from higher risk premiums by
holding underweight positions in CCC bonds relative to the major high-yield
benchmarks. That's because we viewed the risk/reward trade-off of CCCs as
being unattractive -- yield spreads were in the neighborhood of all-time lows
even as the credit cycle appeared to have peaked and housing had begun to drag
on the economy.
While we thought this positioning made sense over time given our view of the
economy, credit quality, and spreads, it limited portfolio performance
relative to the benchmark until June, when CCC bonds finally gave back some
ground and began underperforming higher-rated debt. The re-pricing of risk
accelerated through the summer, peaking in August. As a result, the
lowest-quality bonds underperformed for the six months, rewarding our
higher-quality, more defensive positioning.
Portfolio at a Glance
As of As of
9/30/07 3/31/07
Weighted Average Maturity 5.4 years 4.7 years
Average Duration (effective) 4.1 years 3.5 years
Yields as of September 30, 2007(1)
30-day SEC Yield
Investor Class 6.85%
Institutional Class 7.05%
A Class 6.32%
B Class 5.85%
C Class 5.85%
R Class 6.35%
(1) The yields presented reflect the waiver of a portion of the fund's
management fees. Without such waiver, the 30-day yields would have been lower.
* All fund returns referenced in this commentary are for Investor Class
shares. Class returns would have been lower had management fees not been
waived. Total returns for periods less than one year are not annualized.
- ------
19
High-Yield
SECTOR, SECURITY PICKS CONTRIBUTED
Our sector allocation and security selection also helped relative performance,
as some of our larger, defensive holdings performed well. Examples are waste
transporter and recycler Allied Waste, and health care names HCA and Community
Health. We favored these securities because they're in less economically
sensitive sectors of the economy and should hold up better given a slowdown in
growth. In addition, it helped performance to hold an underweight position in
paper & forest products names, which struggled with higher input costs at a
time of slack demand and negative currency effects. That said, our holdings in
the finance company bonds of GMAC and Ford Motor Credit underperformed as
finance-related bonds in general came under pressure following major
dislocations in the mortgage finance market.
OUTLOOK
"We use a relative value approach to investing, looking for what we believe
are good fundamental credits trading at attractive valuations," said portfolio
manager Mike Difley. "We think that style should fare better in a more
discriminating market where good credits lead, as opposed to the recent past,
when the lowest-rated bonds outperformed seemingly without regard to deal
quality or structure."
"Credit selection will become increasingly important in the coming months as
the high-yield market faces a large new issue calendar in the face of a
slowing economic environment," Difley continued. "While default rates remain
near all-time lows, they are likely to see upward pressure over the next 12
months. In that environment, we will remain vigilant in our investment process
while looking to capitalize on today's wider spread levels through fundamental
credit selection."
Top Five Industries* as of September 30, 2007
% of net % of net
assets as of assets as of
9/30/07 3/31/07
Media 10.8% 10.9%
Oil, Gas & Consumable Fuels 8.5% 7.2%
Hotels, Restaurants & Leisure 7.1% 6.2%
Diversified Financial Services 6.3% 3.9%
Health Care Providers & Services 5.5% 4.5%
* Excludes securities in the Diversified industry category. These securities
represent investments in diversified pools of underlying securities in multiple
industry categories.
Portfolio Composition by Credit Rating
% of fund % of fund
investments investments
as of as of
9/30/07 3/31/07
AAA 8% 12%
A -- 1%
BBB 1% 4%
BB 31% 24%
B 48% 50%
CCC or lower 12% 9%
- ------
20
SCHEDULE OF INVESTMENTS
High-Yield
SEPTEMBER 30, 2007 (UNAUDITED)
Principal Amount Value
Corporate Bonds -- 88.5%
AEROSPACE & DEFENSE -- 1.1%
$ 400,000 DRS Technologies, Inc., 7.625%, 2/1/18 $410,000
350,000 L-3 Communications Corp., 6.125%, 7/15/13(1) 345,625
250,000 L-3 Communications Corp., 6.375%, 10/15/15 246,875
------------
1,002,500
------------
AUTOMOBILES -- 1.7%
500,000 Ford Motor Co., 7.45%, 7/16/31(1) 395,000
1,300,000 General Motors Corp., 8.375%, 7/15/33(1)(2) 1,145,629
------------
1,540,629
------------
CHEMICALS -- 2.6%
550,000 Hexion US Finance Corp./Hexion Nova Scotia
Finance ULC, 9.75%, 11/15/14(2) 607,750
750,000 Ineos Group Holdings plc, 8.50%, 2/15/16
(Acquired 5/14/07, Cost $757,500)(1)(3) 721,875
850,000 Lyondell Chemical Co., 8.25%, 9/15/16(2) 962,625
------------
2,292,250
------------
COMMERCIAL SERVICES & SUPPLIES -- 4.7%
750,000 Allied Waste North America, Inc., 6.375%,
4/15/11(2) 755,625
750,000 Allied Waste North America, Inc., 7.875%,
4/15/13(2) 778,125
750,000 ARAMARK Corp., 8.50%, 2/1/15(1)(2) 768,750
500,000 Cenveo Corp., 7.875%, 12/1/13(1) 457,500
700,000 Corrections Corp. of America, 6.25%, 3/15/13 693,000
750,000 Deluxe Corp., 7.375%, 6/1/15(2) 744,375
------------
4,197,375
------------
COMMUNICATIONS EQUIPMENT -- 0.8%
675,000 Nordic Telephone Co. Holdings ApS, 8.875%,
5/1/16 (Acquired 4/26/06-5/5/06, Cost
$693,594)(2)(3) 715,500
------------
CONTAINERS & PACKAGING -- 2.7%
500,000 Ball Corp., 6.875%, 12/15/12 508,750
250,000 Ball Corp., 6.625%, 3/15/18 246,250
250,000 Graham Packaging Co. Inc., 8.50%, 10/15/12 249,375
Principal Amount Value
$ 1,000,000 Graham Packaging Co. Inc., 9.875%, 10/15/14(1) $995,000
400,000 Smurfit-Stone Container Enterprises, Inc.,
8.00%, 3/15/17(1) 395,000
------------
2,394,375
------------
DIVERSIFIED -- 6.5%
4,000,000 Dow Jones CDX N.A. High Yield Secured Note,
Series 8-T1, 7.625%, 6/29/12 (Acquired 4/11/07,
Cost $3,935,000)(1)(3) 3,874,999
2,000,000 Dow Jones CDX N.A. High Yield Secured Note,
Series 8-T2, 6.75%, 6/29/12 (Acquired 4/11/07,
Cost $1,980,000)(3) 1,935,000
------------
5,809,999
------------
DIVERSIFIED FINANCIAL SERVICES -- 6.3%
400,000 Ford Motor Credit Co., 6.625%, 6/16/08 397,044
1,600,000 Ford Motor Credit Co., 7.375%, 10/28/09(2) 1,569,628
1,100,000 Ford Motor Credit Co., 7.25%, 10/25/11(2) 1,031,705
1,000,000 General Motors Acceptance Corp., 6.875%,
9/15/11(2) 952,467
750,000 General Motors Acceptance Corp., 6.75%,
12/1/14(2) 680,715
1,000,000 KAR Holdings Inc., 8.75%, 5/1/14 (Acquired
4/13/07-9/25/07, Cost $977,500)(2)(3) 962,500
------------
5,594,059
------------
DIVERSIFIED TELECOMMUNICATION SERVICES -- 5.1%
325,000 Citizens Communications Co., 6.25%, 1/15/13 318,500
500,000 Embarq Corp., 7.08%, 6/1/16 519,183
200,000 Intelsat Bermuda Ltd., 9.25%, 6/15/16(1) 208,500
250,000 Intelsat Subsidiary Holding Co. Ltd., 8.25%,
1/15/13 255,000
500,000 Intelsat Subsidiary Holding Co. Ltd., 8.625%,
1/15/15 512,500
550,000 Level 3 Financing Inc., 9.25%, 11/1/14 544,500
1,000,000 MetroPCS Wireless, Inc., 9.25%, 11/1/14
(Acquired 5/31/07-6/5/07, Cost $1,060,625)(3) 1,025,000
- ------
21
High-Yield
Principal Amount Value
$ 550,000 Qwest Communications International Inc., 7.50%,
2/15/14(1) $559,625
550,000 Qwest Corp., 7.875%, 9/1/11 580,250
------------
4,523,058
------------
ELECTRIC UTILITIES -- 1.4%
500,000 Edison Mission Energy, 7.00%, 5/15/17 (Acquired
5/1/07, Cost $500,000)(3) 495,000
750,000 Reliant Energy, Inc., 7.625%, 6/15/14(2) 759,375
------------
1,254,375
------------
ELECTRICAL EQUIPMENT -- 0.3%
250,000 Baldor Electric Co., 8.625%, 2/15/17(1) 262,500
------------
ELECTRONIC EQUIPMENT & INSTRUMENTS -- 0.5%
500,000 Flextronics International Ltd., 6.50%, 5/15/13 480,000
------------
FOOD & STAPLES RETAILING -- 2.0%
500,000 Ingles Markets, Inc., 8.875%, 12/1/11(1) 512,500
750,000 Rite Aid Corp., 7.50%, 3/1/17(2) 709,688
550,000 SUPERVALU INC., 7.50%, 11/15/14 562,375
------------
1,784,563
------------
FOOD PRODUCTS -- 0.9%
750,000 Smithfield Foods Inc., 7.75%, 7/1/17(2) 772,500
------------
HEALTH CARE PROVIDERS & SERVICES -- 5.5%
1,400,000 Community Health Systems Inc., 8.875%, 7/15/15
(Acquired 6/27/07-7/13/07, Cost $1,396,658)(2)(3) 1,445,500
750,000 HCA Inc., 6.50%, 2/15/16(1)(2) 641,250
1,250,000 HCA Inc., 9.25%, 11/15/16 (Acquired
11/9/06-7/13/07, Cost $1,291,231)(2)(3) 1,331,250
500,000 Omnicare Inc., 6.125%, 6/1/13 460,000
250,000 Omnicare Inc., 6.875%, 12/15/15 232,500
750,000 Sun Healthcare Group, Inc., 9.125%, 4/15/15
(Acquired 3/22/07-6/1/07, Cost $780,000)(3) 768,750
------------
4,879,250
------------
HOTELS, RESTAURANTS & LEISURE -- 7.1%
600,000 Majestic Star Casino LLC/Majestic Star Casino
Capital Corp., 9.50%, 10/15/10(2) 579,000
Principal Amount Value
$ 34,000 Mandalay Resort Group, 9.375%, 2/15/10 $35,785
1,000,000 MGM Mirage, 8.50%, 9/15/10(2) 1,049,999
300,000 MGM Mirage, 6.75%, 9/1/12 296,625
400,000 Penn National Gaming, Inc., 6.875%, 12/1/11 407,000
750,000 Pinnacle Entertainment Inc., 7.50%, 6/15/15
(Acquired 6/5/07, Cost $738,938)(2)(3) 713,438
300,000 Royal Caribbean Cruises Ltd., 7.00%, 6/15/13 299,834
300,000 Royal Caribbean Cruises Ltd., 6.875%, 12/1/13 297,890
250,000 Six Flags Inc., 8.875%, 2/1/10(1) 226,875
500,000 Six Flags Inc., 9.75%, 4/15/13(1) 426,250
500,000 Station Casinos Inc., 6.875%, 3/1/16 437,500
750,000 Station Casinos Inc., 7.75%, 8/15/16(2) 746,250
400,000 Wimar OpCo LLC/Wimar OpCo Finance Corp., 9.625%,
12/15/14 (Acquired 12/14/06, Cost $400,000)(1)(3) 312,000
500,000 Wynn Las Vegas LLC, 6.625%, 12/1/14 492,500
------------
6,320,946
------------
HOUSEHOLD DURABLES -- 1.4%
500,000 KB Home, 6.375%, 8/15/11(2) 462,500
750,000 Sealy Mattress Co., 8.25%, 6/15/14(2) 759,375
------------
1,221,875
------------
INDEPENDENT POWER PRODUCERS & ENERGY TRADERS -- 1.3%
500,000 AES Corp. (The), 8.75%, 5/15/13 (Acquired
5/1/03, Cost $500,000)(3) 525,625
650,000 NRG Energy Inc., 7.375%, 2/1/16(2) 653,250
------------
1,178,875
------------
INSURANCE -- 0.7%
675,000 Fairfax Financial Holdings Ltd., 7.75%,
6/15/17(1) 646,313
------------
IT SERVICES -- 0.9%
450,000 SunGard Data Systems Inc., 9.125%, 8/15/13 470,250
350,000 SunGard Data Systems Inc., 10.25%, 8/15/15(1) 367,500
------------
837,750
------------
- ------
22
High-Yield
Principal Amount Value
MACHINERY -- 1.1%
$ 950,000 Rental Service Corp., 9.50%, 12/1/14(1) $912,000
21,000 Terex Corp., 7.375%, 1/15/14 21,420
------------
933,420
------------
MEDIA -- 10.8%
200,000 Cablevision Systems Corp., 8.00%, 4/15/12 195,000
350,000 Cadmus Communications Corp., 8.375%, 6/15/14 324,188
1,798,000 CCH I, LLC/CCH I Capital Corp., 11.00%, 10/1/15 1,829,464
1,000,000 Cinemark Inc., VRN, 0.00%, 3/15/09(4) 950,000
500,000 CSC Holdings, Inc., 8.125%, 8/15/09 510,000
250,000 CSC Holdings, Inc., 6.75%, 4/15/12 241,875
500,000 Dex Media Inc., 8.00%, 11/15/13 506,250
500,000 DirecTV Holdings LLC/DirecTV Financing Co.,
Inc., 8.375%, 3/15/13 521,875
500,000 Echostar DBS Corp., 6.375%, 10/1/11 503,750
750,000 Harland Clarke Holdings Corp., 9.50%, 5/15/15(2) 673,125
250,000 Harland Clarke Holdings Corp., VRN, 10.31%,
11/15/07, resets quarterly off the 3-month LIBOR
plus 4.75% with no caps 224,375
1,200,000 Idearc Inc., 8.00%, 11/15/16(2) 1,202,999
500,000 Mediacom LLC/Mediacom Capital Corp., 9.50%,
1/15/13 508,750
800,000 MediaNews Group, Inc., 6.875%, 10/1/13(2) 612,000
850,000 R.H. Donnelley Corp., 8.875%, 1/15/16(2) 870,188
------------
9,673,839
------------
METALS & MINING -- 2.4%
300,000 Freeport-McMoRan Copper & Gold Inc., 8.25%,
4/1/15 324,750
950,000 Freeport-McMoRan Copper & Gold Inc., 8.375%,
4/1/17(2) 1,040,250
775,000 Tube City IMS Corp., 9.75%, 2/1/15(1)(2) 761,438
------------
2,126,438
------------
MULTI-UTILITIES -- 0.6%
500,000 CMS Energy Corp., 7.75%, 8/1/10 525,533
------------
MULTILINE RETAIL -- 0.5%
500,000 Bon-Ton Stores, Inc. (The), 10.25%, 3/15/14(1) 470,000
------------
Principal Amount Value
OIL, GAS & CONSUMABLE FUELS -- 8.5%
$ 500,000 Chesapeake Energy Corp., 7.625%, 7/15/13 $525,000
600,000 Chesapeake Energy Corp., 7.50%, 6/15/14(1) 618,000
750,000 Cimarex Energy Co., 7.125%, 5/1/17(2) 748,125
650,000 Forest Oil Corp., 7.75%, 5/1/14 663,000
400,000 Massey Energy Co., 6.625%, 11/15/10 393,000
750,000 Massey Energy Co., 6.875%, 12/15/13(2) 703,125
800,000 OPTI Canada Inc., 7.875%, 12/15/14 (Acquired
6/25/07-7/13/07, Cost $800,000)(2)(3) 803,999
520,000 Pacific Energy Partners L.P./Pacific Energy
Finance Corp., 7.125%, 6/15/14 533,746
500,000 Peabody Energy Corp., 7.375%, 11/1/16 530,000
500,000 Range Resources Corp., 7.375%, 7/15/13 510,000
750,000 Sabine Pass LNG, L.P., 7.50%, 11/30/16(2) 742,500
250,000 Tesoro Corp., 6.25%, 11/1/12 251,875
500,000 Williams Companies, Inc. (The), 8.125%, 3/15/12 541,250
------------
7,563,620
------------
PAPER & FOREST PRODUCTS -- 1.7%
300,000 Boise Cascade LLC, 7.125%, 10/15/14 289,500
500,000 Georgia-Pacific Corp., 7.70%, 6/15/15(1) 500,000
150,000 Georgia-Pacific Corp., 7.125%, 1/15/17 (Acquired
12/13/06, Cost $150,000)(3) 145,875
21,000 Jefferson Smurfit Corp., 8.25%, 10/1/12 21,158
500,000 Verso Paper Holdings LLC/Verso Paper Inc.,
9.125%, 8/1/14 517,500
------------
1,474,033
------------
REAL ESTATE INVESTMENT TRUSTS -- 0.7%
400,000 Host Marriott L.P., 7.00%, 8/15/12 405,000
250,000 Host Marriott L.P., 6.75%, 6/1/16 248,750
------------
653,750
------------
ROAD & RAIL -- 1.2%
550,000 Hertz Corp., 8.875%, 1/1/14 569,250
500,000 Hertz Corp., 10.50%, 1/1/16(1)(2) 542,500
------------
1,111,750
------------
- ------
23
High-Yield
Principal Amount Value
SPECIALTY RETAIL -- 3.5%
$ 250,000 Asbury Automotive Group Inc., 8.00%, 3/15/14 $242,500
650,000 Asbury Automotive Group Inc., 7.625%, 3/15/17
(Acquired 3/12/07-4/13/07, Cost $653,000)(3) 601,250
350,000 Claire's Stores Inc., 9.25%, 6/1/15 (Acquired
5/22/07, Cost $350,000)(1)(3) 304,500
600,000 Couche-Tard U.S. L.P./Couche-Tard Finance Corp.,
7.50%, 12/15/13 613,500
650,000 GSC Holdings Corp., 8.00%, 10/1/12(2) 679,250
425,000 Michaels Stores, Inc., 10.00%, 11/1/14(1) 437,750
350,000 Toys "R" Us, Inc., 7.375%, 10/15/18 282,625
------------
3,161,375
------------
TEXTILES, APPAREL & LUXURY GOODS -- 1.6%
850,000 Hanesbrands Inc., VRN, 8.78%, 12/17/07, resets
semiannually off the 6-month LIBOR plus 3.375%
with no caps(2) 850,000
625,000 Perry Ellis International, Inc., 8.875%, 9/15/13 617,188
------------
1,467,188
------------
TRADING COMPANIES & DISTRIBUTORS -- 1.5%
675,000 Ashtead Capital Inc., 9.00%, 8/15/16 (Acquired
8/1/06-10/5/06, Cost $690,500)(3) 669,094
400,000 United Rentals North America, Inc., 6.50%,
2/15/12 407,000
271,000 United Rentals North America, Inc., 7.75%,
11/15/13(1) 280,485
------------
1,356,579
------------
WIRELESS TELECOMMUNICATION SERVICES -- 0.9%
200,000 Dobson Communications Corp., 8.875%, 10/1/13 214,000
300,000 Rural Cellular Corp., 9.875%, 2/1/10 315,000
300,000 Syniverse Technologies Inc., 7.75%, 8/15/13 288,000
------------
817,000
------------
TOTAL CORPORATE BONDS
(Cost $79,687,251) 79,043,217
------------
Principal Amount Value
Sovereign Governments & Agencies -- 2.9%
JPY KfW, VRN, 0.60%, 11/8/07, resets quarterly off
302,000,000 the 3-month JPY LIBOR minus 0.22% with no caps
(Cost $2,483,751) $ 2,632,395
------------
Temporary Cash Investments -- 6.4%
Repurchase Agreement, Bank of America Securities, LLC,
(collateralized by various U.S. Treasury obligations, 0.875%,
4/15/10, valued at $4,943,538), in a joint trading account at
3.80%, dated 9/28/07, due 10/1/07 (Delivery value $4,400,393)(2) 4,399,000
Repurchase Agreement, Merrill Lynch & Co., Inc., (collateralized
by various U.S. Treasury obligations, 2.375%, 4/15/11, valued at
$1,358,277), in a joint trading account at 3.75%, dated 9/28/07,
due 10/1/07 (Delivery value $1,329,415)(2) 1,329,000
------------
TOTAL TEMPORARY CASH INVESTMENTS
(Cost $5,728,000) 5,728,000
------------
Temporary Cash Investments -- Securities Lending Collateral(5) -- 15.2%
$ 1,000,048 Bancaja US Debt, SAu, VRN, 5.41%, 10/10/07,
resets quarterly off the 3-month LIBOR plus
0.05% with no caps 1,000,048
1,000,000 Barclays Bank plc, 5.37%, 12/17/07 1,000,000
999,900 BASF AG, VRN, 5.36%, 10/22/07, resets quarterly
off the 3-month LIBOR minus 0.01% with no caps 999,900
1,000,000 Dexia Credit Local, VRN, 4.84%, 10/1/07 1,000,000
973,704 Govco Incorporated, 5.37%, 12/17/07 973,705
999,477 K2 (USA) LLC, VRN, 4.87%, 10/1/07, resets
quarterly off the Federal Reserve Prime Loan
Rate minus 2.91% with no caps 999,477
999,500 Links Finance LLC, VRN, 4.87%, 10/1/07 999,500
1,000,000 Merrill Lynch & Co. Inc., VRN, 4.92%, 10/1/07,
resets quarterly off the Federal Reserve Prime
Loan Rate minus 2.83% with no caps 1,000,000
- ------
24
High-Yield
Principal Amount Value
$ 944,744 Morgan Stanley ABS Capital I, Series 2007 NC4,
Class A2A, VRN, 5.21%, 10/25/07, resets monthly
off the 1-month LIBOR plus 0.08% with no caps $944,744
1,001,648 Nationwide Building Society, VRN, 5.73%, 12/10/07 1,001,648
1,000,000 Northern Rock plc, 5.34%, 10/18/07 1,000,000
494,887 Silver Tower US Funding, LLC, 5.39%, 10/10/07 494,887
999,365 Tango Finance Corp., VRN, 4.88%, 10/1/07, resets
quarterly off the Federal Reserve Prime Loan
Rate minus 2.91% with no caps 999,365
1,000,000 Ulster Bank Ireland Ltd., VRN, 4.85%, 10/1/07 1,000,000
Principal Amount Value
Repurchase Agreement, Lehman Brothers, Inc., (collateralized by
various U.S. Government Agency obligations in a pooled account at
the lending agent), 5.15%, dated 9/28/07, due 10/1/07 (Delivery
value $140,184) $140,124
------------
TOTAL TEMPORARY CASH INVESTMENTS -- SECURITIES LENDING COLLATERAL
(Cost $13,553,398) 13,553,398
------------
TOTAL INVESTMENT SECURITIES -- 113.0%
(Cost $101,452,400) 100,957,010
------------
OTHER ASSETS AND LIABILITIES -- (13.0)% (11,604,253)
------------
TOTAL NET ASSETS -- 100.0% $ 89,352,757
============
Futures Contracts
Underlying Face Unrealized Gain
Contracts Purchased Expiration Date Amount at Value (Loss)
90 U.S. Treasury
2-Year Notes December 2007 $18,634,219 $102,454
============ =========
Underlying Face Unrealized Gain
Contracts Sold Expiration Date Amount at Value (Loss)
45 U.S. Treasury
10-Year Notes December 2007 $4,917,656 $(75,118)
============ =========
Swap Agreements
Notional Expiration Unrealized
Amount Description of Agreement Date Gain (Loss)
CREDIT DEFAULT
$1,800,000 Pay quarterly a fixed rate equal to June 2012 $ (9,819)
0.55% multiplied by the notional
amount and receive from Barclays Bank
plc upon each default event of Darden
Restaurants, Inc., par value of the
proportional notional amount.
5,100,000 Pay semiannually a fixed rate equal June 2012 12,356
to 1.25% multiplied by the notional
amount and receive from Barclays Bank
plc upon each default event of one of
the issues of Dow Jones CDX Emerging
Markets 7, par value of the
proportional notional amount.
---------
$2,537
=========
- ------
25
High-Yield
Notes to Schedule of Investments
CDX = Credit Derivative Indexes
JPY = Japanese Yen
LIBOR = London Interbank Offered Rate
resets = The frequency with which a security's coupon changes, based on
current market conditions or an underlying index. The more frequently a
security resets, the less risk the investor is taking that the coupon will
vary significantly from current market rates.
VRN = Variable Rate Note. Interest reset date is indicated. Rate shown is
effective September 30, 2007.
(1) Security, or a portion thereof, was on loan as of September 30, 2007.
(2) Security, or a portion thereof, has been segregated for futures contracts
and/or swap agreements.
(3) Security was purchased under Rule 144A of the Securities Act of 1933 or is
a private placement and, unless registered under the Act or exempted from
registration, may only be sold to qualified institutional investors. The
aggregate value of restricted securities at September 30, 2007 was
$17,351,155, which represented 19.4% of total net assets. None of the
restricted securities were considered illiquid.
(4) Step-coupon security. These securities are issued with a zero-coupon and
become interest bearing at a predetermined rate and date and are issued at a
substantial discount from their value at maturity. Rate shown is effective
September 30, 2007.
(5) Investments represent purchases made by the lending agent with cash
collateral received through securities lending transactions.
See Notes to Financial Statements.
- ------
26
SHAREHOLDER FEE EXAMPLES (UNAUDITED)
Fund shareholders may incur two types of costs: (1) transaction costs,
including sales charges (loads) on purchase payments and redemption/exchange
fees; and (2) ongoing costs, including management fees; distribution and
service (12b-1) fees; and other fund expenses. This example is intended to
help you understand your ongoing costs (in dollars) of investing in your fund
and to compare these costs with the ongoing cost of investing in other mutual
funds.
The example is based on an investment of $1,000 made at the beginning of the
period and held for the entire period from April 1, 2007 to September 30, 2007.
ACTUAL EXPENSES
The table provides information about actual account values and actual expenses
for each class. You may use the information, together with the amount you
invested, to estimate the expenses that you paid over the period. First,
identify the share class you own. Then simply divide your account value by
$1,000 (for example, an $8,600 account value divided by $1,000 = 8.6), then
multiply the result by the number under the heading "Expenses Paid During
Period" to estimate the expenses you paid on your account during this period.
If you hold Investor Class shares of any American Century fund, or
Institutional Class shares of the American Century Diversified Bond Fund, in
an American Century account (i.e., not a financial intermediary or retirement
plan account), American Century may charge you a $12.50 semiannual account
maintenance fee if the value of those shares is less than $10,000. We will
redeem shares automatically in one of your accounts to pay the $12.50 fee. In
determining your total eligible investment amount, we will include your
investments in all PERSONAL ACCOUNTS (including American Century Brokerage
accounts) registered under your Social Security number. PERSONAL ACCOUNTS
include individual accounts, joint accounts, UGMA/UTMA accounts, personal
trusts, Coverdell Education Savings Accounts and IRAs (including traditional,
Roth, Rollover, SEP-, SARSEP- and SIMPLE-IRAs), and certain other retirement
accounts. If you have only business, business retirement, employer-sponsored
or American Century Brokerage accounts, you are currently not subject to this
fee. We will not charge the fee as long as you choose to manage your accounts
exclusively online. If you are subject to the Account Maintenance Fee, your
account value could be reduced by the fee amount.
HYPOTHETICAL EXAMPLE FOR COMPARISON PURPOSES
The table also provides information about hypothetical account values and
hypothetical expenses based on the actual expense ratio of each class of your
fund and an assumed rate of return of 5% per year before expenses, which is
not the actual return of a fund's share class. The hypothetical account values
and expenses may not be used to estimate the actual ending account balance or
expenses you paid for the period. You may use this information to compare the
ongoing costs of investing in your fund and other funds. To do so, compare
this 5% hypothetical example with the 5% hypothetical examples that appear in
the shareholder reports of the other funds.
Please note that the expenses shown in the table are meant to highlight your
ongoing costs only and do not reflect any transactional costs, such as sales
charges (loads) or redemption/exchange fees. Therefore, the table is useful in
comparing ongoing costs only, and will not help you determine the relative
total costs of owning different funds. In addition, if these transactional
costs were included, your costs would have been higher.
- ------
27
Expenses Paid
Beginning During
Account Ending Period(1) Annualized
Value Account Value 4/1/07 - Expense
4/1/07 9/30/07 9/30/07 Ratio(1)
Diversified Bond
ACTUAL
Investor Class $1,000 $1,024.10 $3.14 0.62%
Institutional Class $1,000 $1,025.10 $2.13 0.42%
A Class $1,000 $1,022.80 $4.40 0.87%
B Class $1,000 $1,019.00 $8.18 1.62%
C Class $1,000 $1,019.00 $8.18 1.62%
R Class $1,000 $1,021.60 $5.66 1.12%
HYPOTHETICAL
Investor Class $1,000 $1,021.90 $3.13 0.62%
Institutional Class $1,000 $1,022.90 $2.12 0.42%
A Class $1,000 $1,020.65 $4.39 0.87%
B Class $1,000 $1,016.90 $8.17 1.62%
C Class $1,000 $1,016.90 $8.17 1.62%
R Class $1,000 $1,019.40 $5.65 1.12%
(1) Expenses are equal to the class's annualized expense ratio listed in the
table above, multiplied by the average account value over the period,
multiplied by 183, the number of days in the most recent fiscal half-year,
divided by 366, to reflect the one-half year period.
- ------
28
Beginning Expenses Paid
Account Ending During Annualized
Value Account Value Period(1) Expense
4/1/07 9/30/07 4/1/07 - 9/30/07 Ratio(1)
High-Yield
ACTUAL
Investor Class (after waiver)(2) $1,000 $1,008.20 $4.02 0.80%
Investor Class (before waiver) $1,000 $1,008.20(3) $4.37 0.87%
Institutional Class (after waiver)(2) $1,000 $1,009.20 $3.01 0.60%
Institutional Class (before waiver) $1,000 $1,009.20(3) $3.37 0.67%
A Class (after waiver)(2) $1,000 $1,007.00 $5.27 1.05%
A Class (before waiver) $1,000 $1,007.00(3) $5.62 1.12%
B Class (after waiver)(2) $1,000 $1,003.20 $9.01 1.80%
B Class (before waiver) $1,000 $1,003.20(3) $9.36 1.87%
C Class (after waiver)(2) $1,000 $1,003.20 $9.01 1.80%
C Class (before waiver) $1,000 $1,003.20(3) $9.36 1.87%
R Class (after waiver)(2) $1,000 $1,005.70 $6.52 1.30%
R Class (before waiver) $1,000 $1,005.70(3) $6.87 1.37%
HYPOTHETICAL
Investor Class (after waiver)(2) $1,000 $1,021.00 $4.04 0.80%
Investor Class (before waiver) $1,000 $1,020.65 $4.39 0.87%
Institutional Class (after waiver)(2) $1,000 $1,022.00 $3.03 0.60%
Institutional Class (before waiver) $1,000 $1,021.65 $3.39 0.67%
A Class (after waiver)(2) $1,000 $1,019.75 $5.30 1.05%
A Class (before waiver) $1,000 $1,019.40 $5.65 1.12%
B Class (after waiver)(2) $1,000 $1,016.00 $9.07 1.80%
B Class (before waiver) $1,000 $1,015.65 $9.42 1.87%
C Class (after waiver)(2) $1,000 $1,016.00 $9.07 1.80%
C Class (before waiver) $1,000 $1,015.65 $9.42 1.87%
R Class (after waiver)(2) $1,000 $1,018.50 $6.56 1.30%
R Class (before waiver) $1,000 $1,018.15 $6.91 1.37%
(1) Expenses are equal to the class's annualized expense ratio listed in the
table above, multiplied by the average account value over the period,
multiplied by 183, the number of days in the most recent fiscal half-year,
divided by 366, to reflect the one-half year period.
(2) During the six months ended September 30, 2007, the class received a
partial waiver of its management fee.
(3) Ending account value assumes the return earned after waiver. The return
would have been lower had fees not been waived and may have resulted in a
lower ending account value.
- ------
29
STATEMENT OF ASSETS AND LIABILITIES
SEPTEMBER 30, 2007 (UNAUDITED)
Diversified
Bond High-Yield
ASSETS
Investment securities, at value (cost of
$653,056,617 and $87,899,002, respectively) --
including $152,764,091 and $13,331,132 of
securities on loan, respectively $655,246,542 $87,403,612
Investments made with cash collateral received for
securities on loan, at value (cost of $150,841,191
and $13,553,398, respectively) 150,841,191 13,553,398
------------ -----------
Total investment securities, at value (cost of
$803,897,808 and $101,452,400, respectively) 806,087,733 100,957,010
Cash 15,475,743 1,387,242
Receivable for investments sold 218,028 --
Receivable for variation margin on futures contracts 44,248 44,797
Unrealized appreciation on swap agreements 972,832 12,356
Interest receivable 4,821,381 1,838,217
------------ -----------
827,619,965 104,239,622
------------ -----------
LIABILITIES
Payable for collateral received for securities on
loan 150,841,191 13,553,398
Payable for investments purchased 52,373,662 974,227
Payable for capital shares redeemed 218 14,359
Unrealized depreciation on swap agreements 250,342 9,819
Accrued management fees 279,420 52,778
Distribution fees payable 2,491 2,010
Service fees (and distribution fees -- A Class and
R Class) payable 3,255 2,825
Dividends payable 1,115,408 277,449
------------ -----------
204,865,987 14,886,865
------------ -----------
NET ASSETS $622,753,978 $89,352,757
============ ===========
See Notes to Financial Statements.
- ------
30
SEPTEMBER 30, 2007 (UNAUDITED)
Diversified
Bond High-Yield
NET ASSETS CONSIST OF:
Capital paid in $628,674,176 $102,507,934
Accumulated net realized loss on investment
transactions (8,945,448) (12,727,978)
Net unrealized appreciation (depreciation) on
investments 3,025,250 (427,199)
------------ ------------
$622,753,978 $ 89,352,757
============ ============
INVESTOR CLASS
Net assets $450,892,292 $53,138,804
Shares outstanding 44,932,164 8,406,612
Net asset value per share $10.03 $6.32
INSTITUTIONAL CLASS
Net assets $155,906,733 $22,097,732
Shares outstanding 15,536,373 3,495,882
Net asset value per share $10.03 $6.32
A CLASS
Net assets $12,003,489 $10,857,884
Shares outstanding 1,196,169 1,717,724
Net asset value per share $10.03 $6.32
Maximum offering price (net asset value divided
by 0.955) $10.50 $6.62
B CLASS
Net assets $802,876 $1,338,094
Shares outstanding 80,008 211,688
Net asset value per share $10.03 $6.32
C CLASS
Net assets $3,121,715 $1,892,294
Shares outstanding 311,084 299,363
Net asset value per share $10.03 $6.32
R CLASS
Net assets $26,873 $27,949
Shares outstanding 2,678 4,422
Net asset value per share $10.03 $6.32
See Notes to Financial Statements.
- ------
31
STATEMENT OF OPERATIONS
FOR THE SIX MONTHS ENDED SEPTEMBER 30, 2007 (UNAUDITED)
Diversified
Bond High-Yield
INVESTMENT INCOME (LOSS)
INCOME:
Interest $ 16,326,730 $ 3,261,041
Securities lending 277,392 17,939
------------ -----------
16,604,122 3,278,980
------------ -----------
EXPENSES:
Management fees 1,756,520 356,661
Distribution fees:
A Class 3,329 957
B Class 2,977 4,871
C Class 10,592 7,319
Service fees:
A Class 3,329 957
B Class 992 1,624
C Class 3,531 2,440
Distribution and service fees:
A Class 2,497 2,169
A Class (old) (Note 9) 8,396 10,929
R Class 66 69
Trustees' fees and expenses 15,731 2,084
Other expenses 5,096 47
------------ -----------
1,813,056 390,127
Amount waived -- (30,898)
------------ -----------
1,813,056 359,229
------------ -----------
NET INVESTMENT INCOME (LOSS) 14,791,066 2,919,751
------------ -----------
REALIZED AND UNREALIZED GAIN (LOSS)
NET REALIZED GAIN (LOSS) ON:
Investment transactions (2,453,008) 56,323
Futures and swaps transactions 1,170,550 69,965
------------ -----------
(1,282,458) 126,288
------------ -----------
CHANGE IN NET UNREALIZED APPRECIATION (DEPRECIATION)
ON:
Investments 1,584,892 (2,408,122)
Futures and swaps (116,058) 9,175
------------ -----------
1,468,834 (2,398,947)
------------ -----------
NET REALIZED AND UNREALIZED GAIN (LOSS) 186,376 (2,272,659)
------------ -----------
NET INCREASE (DECREASE) IN NET ASSETS RESULTING FROM
OPERATIONS $ 14,977,442 $ 647,092
============ ===========
See Notes to Financial Statements.
- ------
32
STATEMENT OF CHANGES IN NET ASSETS
SIX MONTHS ENDED SEPTEMBER 30, 2007 (UNAUDITED) AND YEAR ENDED MARCH 31, 2007
Diversified Bond High-Yield
Increase
(Decrease)
in Net Assets Sept. 30, 2007 March 31, 2007 Sept. 30, 2007 March 31, 2007
OPERATIONS
Net investment
income (loss) $ 14,791,066 $ 33,433,873 $ 2,919,751 $ 4,961,267
Net realized gain
(loss) (1,282,458) (3,020,837) 126,288 17,724
Change in net
unrealized
appreciation
(depreciation) 1,468,834 12,151,171 (2,398,947) 1,154,960
------------- ------------- -------------- -------------
Net increase
(decrease) in net
assets resulting
from operations 14,977,442 42,564,207 647,092 6,133,951
------------- ------------- -------------- -------------
DISTRIBUTIONS TO
SHAREHOLDERS
From net investment
income:
Investor Class (9,649,723) (13,796,392) (1,731,513) (3,048,546)
Institutional
Class (4,764,418) (18,990,587) (703,654) (947,906)
A Class (99,917) (202,222) (79,901) (38,759)
A Class (old)
(Note 9) (144,687) (313,123) (277,389) (717,605)
B Class (14,196) (29,896) (36,495) (69,352)
C Class (50,465) (85,835) (54,832) (111,418)
R Class (536) (1,039) (848) (1,617)
------------- ------------- -------------- -------------
Decrease in net
assets from
distributions (14,723,942) (33,419,094) (2,884,632) (4,935,203)
------------- ------------- -------------- -------------
CAPITAL SHARE
TRANSACTIONS
Net increase
(decrease) in net
assets from capital
share transactions (176,238,791) 109,144,189 6,496,957 17,128,138
------------- ------------- -------------- -------------
NET INCREASE
(DECREASE) IN NET
ASSETS (175,985,291) 118,289,302 4,259,417 18,326,886
NET ASSETS
Beginning of period 798,739,269 680,449,967 85,093,340 66,766,454
------------- ------------- -------------- -------------
End of period $ 622,753,978 $798,739,269 $89,352,757 $85,093,340
============= ============= ============== =============
Accumulated net
investment loss -- $(163,172) -- $(1,359)
============= ============= ============== =============
See Notes to Financial Statements.
- ------
33
NOTES TO FINANCIAL STATEMENTS
SEPTEMBER 30, 2007 (UNAUDITED)
1. ORGANIZATION AND SUMMARY OF SIGNIFICANT ACCOUNTING POLICIES
ORGANIZATION -- American Century Investment Trust (the trust) is registered
under the Investment Company Act of 1940 (the 1940 Act) as an open-end
management investment company. Diversified Bond Fund (Diversified Bond) and
High-Yield Fund (High-Yield) (the funds) are two funds in a series issued by
the trust. The funds are diversified under the 1940 Act. Diversified Bond's
investment objective is to seek a high level of income by investing in
non-money market debt securities. High-Yield's investment objective is to seek
high current income by investing in high-yield corporate bonds and other debt
securities. High-Yield invests primarily in lower-rated debt securities, which
are subject to greater credit risk and consequently offer higher yields. The
following is a summary of the funds' significant accounting policies.
MULTIPLE CLASS -- The funds are authorized to issue the Investor Class, the
Institutional Class, the A Class (formerly Advisor Class), the B Class, the C
Class and the R Class. The A Class may incur an initial sales charge. The A
Class, B Class and C Class may be subject to a contingent deferred sales
charge. The share classes differ principally in their respective sales charges
and distribution and shareholder servicing expenses and arrangements. All
shares of the funds represent an equal pro rata interest in the net assets of
the class to which such shares belong, and have identical voting, dividend,
liquidation and other rights and the same terms and conditions, except for
class specific expenses and exclusive rights to vote on matters affecting only
individual classes. Income, non-class specific expenses, and realized and
unrealized capital gains and losses of the funds are allocated to each class
of shares based on their relative net assets.
SECURITY VALUATIONS -- Debt securities maturing in greater than 60 days are
valued at current market value as provided by a commercial pricing service or
at the mean of the most recent bid and asked prices. Debt securities maturing
within 60 days may be valued at cost, plus or minus any amortized discount or
premium. Discount notes may be valued through a commercial pricing service or
at amortized cost, which approximates fair value. Securities traded on foreign
securities exchanges and over-the-counter markets are normally completed
before the close of business on days that the New York Stock Exchange (the
Exchange) is open and may also take place on days when the Exchange is not
open. If an event occurs after the value of a security was established but
before the net asset value per share was determined that was likely to
materially change the net asset value, that security would be valued at fair
value as determined in accordance with procedures adopted by the Board of
Trustees. If the funds determine that the market price of a portfolio security
is not readily available, or that the valuation methods mentioned above do not
reflect the security's fair value, such security is valued as determined by,
or in accordance with procedures adopted by, the Board of Trustees or its
designee if such determination would materially impact a fund's net asset
value. Certain other circumstances may cause the funds to use alternative
procedures to value a security such as: a security has been declared in
default; trading in a security has been halted during the trading day; or
there is a foreign market holiday and no trading will commence.
SECURITY TRANSACTIONS -- For financial reporting, security transactions are
accounted for as of the trade date. Net realized gains and losses are
determined on the identified cost basis, which is also used for federal income
tax purposes.
INVESTMENT INCOME -- Interest income less foreign taxes withheld, if any, is
recorded on the accrual basis and includes paydown gain (loss) and accretion
of discounts and amortization of premiums.
SECURITIES ON LOAN -- The funds may lend portfolio securities through their
lending agent to certain approved borrowers in order to earn additional
income. The funds continue to recognize any gain or loss in the market price
of the securities loaned and record any interest earned or dividends declared.
FOREIGN CURRENCY TRANSACTIONS -- All assets and liabilities initially
expressed in foreign currencies are translated into U.S. dollars at prevailing
exchange rates at period end. Purchases and sales of investment securities,
dividend and interest income, and certain expenses are translated at the rates
of exchange prevailing on the respective dates of such transactions. For
assets and liabilities, other than investments in securities, net realized and
unrealized gains and losses from foreign currency translations arise from
changes in currency exchange rates.
- ------
34
Net realized and unrealized foreign currency exchange gains or losses
occurring during the holding period of investment securities are a component
of realized gain (loss) on investment transactions and unrealized appreciation
(depreciation) on investments, respectively. Certain countries may impose
taxes on the contract amount of purchases and sales of foreign currency
contracts in their currency. The funds record the foreign tax expense, if any,
as a reduction to the net realized gain (loss) on foreign currency
transactions.
WHEN-ISSUED AND FORWARD COMMITMENTS -- The funds may engage in securities
transactions on a when-issued or forward commitment basis. In these
transactions, the securities' prices and yields are fixed on the date of the
commitment. In a when-issued transaction, the payment and delivery are
scheduled for a future date and during this period, securities are subject to
market fluctuations. In a forward commitment transaction, the funds may sell a
security and at the same time make a commitment to purchase the same security
at a future date at a specified price. Conversely, the funds may purchase a
security and at the same time make a commitment to sell the same security at a
future date at a specified price. These types of transactions are executed
simultaneously in what are known as "roll" transactions. The funds will
segregate cash, cash equivalents or other appropriate liquid securities on
their records in amounts sufficient to meet the purchase price. The funds
account for "roll" transactions as purchases and sales; as such these
transactions may increase portfolio turnover.
FUTURES CONTRACTS -- The funds may enter into futures contracts in order to
manage the funds' exposure to changes in market conditions. One of the risks
of entering into futures contracts is the possibility that the change in value
of the contract may not correlate with the changes in value of the underlying
securities. Upon entering into a futures contract, the funds are required to
deposit either cash or securities in an amount equal to a certain percentage
of the contract value (initial margin). Subsequent payments (variation margin)
are made or received daily, in cash, by the funds. The variation margin is
equal to the daily change in the contract value and is recorded as unrealized
gains and losses. The funds recognize a realized gain or loss when the
contract is closed or expires. Net realized and unrealized gains or losses
occurring during the holding period of futures contracts are a component of
realized gain (loss) on futures and swaps transactions and unrealized
appreciation (depreciation) on futures and swaps, respectively.
SWAP AGREEMENTS -- The funds may enter into swap agreements in order to
attempt to obtain or preserve a particular return or spread at a lower cost
than obtaining a return or spread through purchases and/or sales of
instruments in other markets; protect against currency fluctuations; attempt
to manage duration to protect against any increase in the price of securities
the funds anticipate purchasing at a later date; or gain exposure to certain
markets in the most economical way possible. A basic swap agreement is a
contract in which two parties agree to exchange the returns earned or realized
on predetermined investments or instruments. Credit default swaps enable an
investor to buy/sell protection against a credit event of a specific issuer.
The seller of credit protection against a security or basket of securities
receives an up-front or periodic payment to compensate against potential
default events. The funds may enhance returns by selling protection or attempt
to mitigate credit risk by buying protection. The funds will segregate cash,
cash equivalents or other appropriate liquid securities on their records in
amounts sufficient to meet requirements. Unrealized gains are reported as an
asset and unrealized losses are reported as a liability on the Statement of
Assets and Liabilities. Swap agreements are valued daily and changes in value,
including the periodic amounts of interest to be paid or received on swaps,
are recorded as unrealized appreciation (depreciation) on futures and swaps.
Realized gain or loss is recorded upon receipt or payment of a periodic
settlement or termination of swap agreements. The risks of entering into swap
agreements include the possible lack of liquidity, failure of the counterparty
to meet its obligations, and that there may be unfavorable changes in the
underlying investments and instruments.
CREDIT-LINKED TRUST CERTIFICATES -- Credit-linked trust certificates are
investments in a limited purpose trust formed under state law which invests in
a basket of derivative instruments, such as credit default swaps.
Credit-linked trust certificates represent the right to receive periodic
income payments and payment of principal at the end of the term of the
certificate. The risks of investing in credit-linked trust certificates
include the payments are conditioned on the trust's receipt of payments from,
and the trust's potential obligations to, the counterparties to the derivative
instruments and other securities in which the trust invests.
REPURCHASE AGREEMENTS -- The funds may enter into repurchase agreements with
institutions that American Century Investment Management, Inc. (ACIM) (the
investment advisor) has determined are creditworthy pursuant to criteria
adopted by the Board of Trustees. Each repurchase agreement is recorded at
cost. Each fund requires that the collateral, represented by securities,
received in a repurchase transaction be transferred to the custodian in a
manner sufficient to enable each fund to obtain those securities in the event
of a default under the repurchase agreement. ACIM monitors, on
- ------
35
a daily basis, the securities transferred to ensure the value, including
accrued interest, of the securities under each repurchase agreement is equal
to or greater than amounts owed to each fund under each repurchase agreement.
JOINT TRADING ACCOUNT -- Pursuant to an Exemptive Order issued by the
Securities and Exchange Commission, each fund, along with other registered
investment companies having management agreements with ACIM or American
Century Global Investment Management, Inc. (ACGIM), may transfer uninvested
cash balances into a joint trading account. These balances are invested in one
or more repurchase agreements that are collateralized by U.S. Treasury or
Agency obligations.
INCOME TAX STATUS -- It is each fund's policy to distribute substantially all
net investment income and net realized gains to shareholders and to otherwise
qualify as a regulated investment company under provisions of the Internal
Revenue Code. The funds are no longer subject to examination by tax
authorities for years prior to 2004. At this time, management has not
identified any uncertain tax positions that would materially impact the
financial statements. Accordingly, no provision has been made for federal or
state income taxes. Interest and penalties associated with any federal or
state income tax obligations, if any, are recorded as interest expense.
DISTRIBUTIONS TO SHAREHOLDERS -- Distributions from net investment income for
the funds are declared daily and paid monthly. Distributions from net realized
gains for the funds, if any, are generally declared and paid annually.
INDEMNIFICATIONS -- Under the trust's organizational documents, its officers
and trustees are indemnified against certain liabilities arising out of the
performance of their duties to the funds. In addition, in the normal course of
business, the funds enter into contracts that provide general
indemnifications. The funds' maximum exposure under these arrangements is
unknown as this would involve future claims that may be made against the
funds. The risk of material loss from such claims is considered by management
to be remote.
USE OF ESTIMATES -- The financial statements are prepared in conformity with
accounting principles generally accepted in the United States of America,
which may require management to make certain estimates and assumptions at the
date of the financial statements. Actual results could differ from these
estimates.
2. FEES AND TRANSACTIONS WITH RELATED PARTIES
On July 27, 2007, the A Class (formerly Advisor Class, also referred to as "A
Class (new)") shareholders of Diversified Bond and High-Yield approved a
change in the class's fee structure. The change was approved by the Board of
Trustees on December 8, 2006. Effective September 4, 2007, the fee structure
change resulted in an increase of 0.25% in the unified management fee and a
simultaneous decrease of 0.25% in the total distribution and service fee,
resulting in no change to the total operating expense ratio of the class.
MANAGEMENT FEES -- The trust has entered into a Management Agreement with
ACIM, under which ACIM provides the funds with investment advisory and
management services in exchange for a single, unified management fee (the fee)
per class. The Agreement provides that all expenses of the funds, except
brokerage commissions, taxes, interest, fees and expenses of those trustees
who are not considered "interested persons" as defined in the 1940 Act
(including counsel fees) and extraordinary expenses, will be paid by ACIM. The
fee is computed and accrued daily based on the daily net assets of each
specific class of shares of each fund and paid monthly in arrears. The fee
consists of (1) an Investment Category Fee based on the daily net assets of
the funds and certain other accounts managed by the investment advisor that
are in the same broad investment category as each fund and (2) a Complex Fee
based on the assets of all the funds in the American Century family of funds.
The rates for the Investment Category Fee range from 0.2925% to 0.4100% for
Diversified Bond and from 0.5425% to 0.6600% for High-Yield. The rates for the
Complex Fee (Investor Class, A Class, B Class, C Class and R Class) range from
0.2500% to 0.3100%. The Institutional Class is 0.2000% less at each point
within the Complex Fee range. Prior to September 4, 2007, the A Class (new)
was 0.2500% less at each point within the Complex Fee range. From August 1,
2006 to July 31, 2007, the investment advisor voluntarily agreed to waive
0.071% of its management fee for High-Yield. Effective August 1, 2007, the
investment advisor voluntarily agreed to waive 0.070% of its management fee
for High-Yield. The total amount of the waiver for the six months ended
September 30, 2007, was $18,498, $7,274, $873, $3,094, $459, $690 and $10 for
the Investor Class, Institutional Class, A Class, A Class (old), B Class, C
Class and R Class, respectively. The fee waiver may be revised or terminated
at any time without notice.
- ------
36
The effective annual management fee for each class of each fund for the six
months ended September 30, 2007, was as follows:
Investor, B, C & R Institutional A
Diversified Bond 0.62% 0.42% 0.41%
High-Yield (before waiver) 0.87% 0.67% 0.66%
High-Yield (after waiver) 0.80% 0.60% 0.59%
DISTRIBUTION AND SERVICE FEES -- The Board of Trustees has adopted a separate
Master Distribution and Individual Shareholder Services Plan for each of the A
Class, B Class, C Class and R Class (collectively the plans), pursuant to Rule
12b-1 of the 1940 Act. The plans provide that the A Class will pay American
Century Investment Services, Inc. (ACIS) an annual distribution and service
fee of 0.25%. The plans provide that the B Class and the C Class will each pay
ACIS an annual distribution fee of 0.75% and service fee of 0.25%. The plans
provide that the R Class will pay ACIS an annual distribution and service fee
of 0.50%. Prior to September 4, 2007, the Board of Trustees had adopted a
Master Distribution and Shareholder Services Plan for the A Class (new),
pursuant to Rule 12b-1 of the 1940 Act, in which the A Class (new) paid ACIS
an annual distribution fee of 0.25% and service fee of 0.25%. The fees are
computed and accrued daily based on each class's daily net assets and paid
monthly in arrears. The distribution fee provides compensation for expenses
incurred in connection with distributing shares of the classes including, but
not limited to, payments to brokers, dealers, and financial institutions that
have entered into sales agreements with respect to shares of the funds. The
service fee provides compensation for individual shareholder services rendered
by broker/dealers or other independent financial intermediaries for A Class
(new), A Class (old), B Class, C Class and R Class shares. Prior to September
4, 2007, the service fee provided compensation for shareholder and
administrative services rendered by ACIS, its affiliates or independent third
party providers for A Class (new) shares. Fees incurred under the plans during
the six months ended September 30, 2007, are detailed in the Statement of
Operations.
RELATED PARTIES -- Certain officers and trustees of the trust are also
officers and/or directors, and, as a group, controlling stockholders of
American Century Companies, Inc. (ACC), the parent of the trust's investment
advisor, ACIM, the distributor of the trust, ACIS, and the trust's transfer
agent, American Century Services, LLC. American Century Asset Allocation
Portfolios, Inc. (ACAAP) owns 53% and 56% of the shares of Diversified Bond
and High-Yield, respectively. ACAAP does not invest in the funds for the
purpose of exercising management or control.
The funds have a bank line of credit agreement and securities lending
agreement with JPMorgan Chase Bank (JPMCB). JPMCB is a custodian of the funds
and a wholly owned subsidiary of JPMorgan Chase & Co. (JPM). JPM is an equity
investor in ACC.
3. INVESTMENT TRANSACTIONS
Investment transactions, excluding short-term investments, for the six months
ended September 30, 2007, were as follows:
Diversified Bond High-Yield
PURCHASES
U.S. Treasury & Government Agency Obligations $851,570,302 --
Investment securities other than U.S. Treasury &
Government Agency Obligations $60,575,371 $30,797,414
PROCEEDS FROM SALES
U.S. Treasury & Government Agency Obligations $1,053,458,127 --
Investment securities other than U.S. Treasury &
Government Agency Obligations $95,844,392 $20,240,347
- ------
37
4. CAPITAL SHARE TRANSACTIONS
Transactions in shares of the funds were as follows (unlimited number of
shares authorized):
Six months ended Year ended
September 30, 2007 March 31, 2007
Shares Amount Shares Amount
Diversified Bond
INVESTOR CLASS
Sold 9,170,155 $ 91,345,701 19,083,598 $189,679,584
Issued in
reinvestment of
distributions 256,551 2,548,201 551,974 5,481,168
Redeemed (3,837,497) (38,053,674) (3,072,427) (30,463,768)
------------ -------------- ------------ -------------
5,589,209 55,840,228 16,563,145 164,696,984
------------ -------------- ------------ -------------
INSTITUTIONAL CLASS
Sold 19,580,753 195,443,903 12,690,857 125,229,593
Issued in
reinvestment of
distributions 357,220 3,548,321 785,190 7,795,930
Redeemed (43,293,887) (432,433,377) (19,152,457) (188,236,458)
------------ -------------- ------------ -------------
(23,355,914) (233,441,153) (5,676,410) (55,210,935)
------------ -------------- ------------ -------------
A CLASS
Sold 82,078 818,247 121,547 1,207,066
Issued in
connection with
reclassification
(Note 9) 847,474 8,460,890 -- --
Issued in
reinvestment of
distributions 8,971 89,363 18,205 180,700
Redeemed (82,086) (815,693) (370,803) (3,680,623)
------------ -------------- ------------ -------------
856,437 8,552,807 (231,051) (2,292,857)
------------ -------------- ------------ -------------
A CLASS (OLD)
Sold 178,372 1,764,421 359,978 3,569,345
Issued in
reinvestment of
distributions 10,124 100,181 27,435 272,444
Redeemed in
connection with
reclassification
(Note 9) (847,474) (8,460,890) -- --
Redeemed (100,169) (991,431) (329,552) (3,266,681)
------------ -------------- ------------ -------------
(759,147) (7,587,719) 57,861 575,108
------------ -------------- ------------ -------------
B CLASS
Sold 6,520 64,989 30,434 301,436
Issued in
reinvestment of
distributions 1,071 10,642 2,190 21,749
Redeemed (7,980) (79,620) (28,058) (279,528)
------------ -------------- ------------ -------------
(389) (3,989) 4,566 43,657
------------ -------------- ------------ -------------
C CLASS
Sold 82,925 825,211 209,537 2,057,287
Issued in
reinvestment of
distributions 3,814 37,877 6,593 65,583
Redeemed (46,798) (462,589) (79,977) (791,675)
------------ -------------- ------------ -------------
39,941 400,499 136,153 1,331,195
------------ -------------- ------------ -------------
R CLASS
Issued in
reinvestment of
distributions 54 536 104 1,037
------------ -------------- ------------ -------------
Net increase
(decrease) (17,629,809) $(176,238,791) 10,854,368 $109,144,189
============ ============== ============ =============
- ------
38
Six months ended Year ended
September 30, 2007 March 31, 2007
Shares Amount Shares Amount
High-Yield
INVESTOR CLASS
Sold 1,545,293 $ 9,869,207 3,955,742 $ 25,227,656
Issued in reinvestment
of distributions 93,881 594,442 219,459 1,396,011
Redeemed (1,215,209) (7,682,617) (2,877,431) (18,220,571)
----------- ------------ ----------- -------------
423,965 2,781,032 1,297,770 8,403,096
----------- ------------ ----------- -------------
INSTITUTIONAL CLASS
Sold 852,844 5,448,259 1,774,286 11,314,912
Issued in reinvestment
of distributions 8,526 53,994 8,236 53,017
Redeemed (171,146) (1,075,259) (448,137) (2,872,655)
----------- ------------ ----------- -------------
690,224 4,426,994 1,334,385 8,495,274
----------- ------------ ----------- -------------
A CLASS
Sold 136,439 860,114 93,171 593,364
Issued in connection
with reclassification
(Note 9) 1,531,917 9,523,342 -- --
Issued in reinvestment
of distributions 10,230 64,697 4,098 26,222
Redeemed (99,811) (623,691) (22,040) (141,034)
----------- ------------ ----------- -------------
1,578,775 9,824,462 75,229 478,552
----------- ------------ ----------- -------------
A CLASS (OLD)
Sold 128,872 822,538 613,956 3,907,488
Issued in reinvestment
of distributions 31,139 198,358 99,327 632,705
Redeemed in connection
with reclassification
(Note 9) (1,531,917) (9,523,342) -- --
Redeemed (312,246) (1,982,035) (799,098) (5,095,378)
----------- ------------ ----------- -------------
(1,684,152) (10,484,481) (85,815) (555,185)
----------- ------------ ----------- -------------
B CLASS
Sold 34,016 213,270 32,561 207,334
Issued in reinvestment
of distributions 3,332 21,100 6,257 39,884
Redeemed (35,229) (226,239) (14,471) (92,149)
----------- ------------ ----------- -------------
2,119 8,131 24,347 155,069
----------- ------------ ----------- -------------
C CLASS
Sold 36,153 226,343 130,824 831,650
Issued in reinvestment
of distributions 3,193 20,204 5,694 36,239
Redeemed (48,919) (306,221) (113,320) (718,696)
----------- ------------ ----------- -------------
(9,573) (59,674) 23,198 149,193
----------- ------------ ----------- -------------
R CLASS
Sold 14 84 82 527
Issued in reinvestment
of distributions 133 844 253 1,612
Redeemed (67) (435) -- --
----------- ------------ ----------- -------------
80 493 335 2,139
----------- ------------ ----------- -------------
Net increase (decrease) 1,001,438 $ 6,496,957 2,669,449 $ 17,128,138
=========== ============ =========== =============
- ------
39
5. SECURITIES LENDING
As of September 30, 2007, securities in Diversified Bond and High-Yield valued
at $152,764,091, and $13,331,132, respectively, were on loan through the
lending agent, JPMCB, to certain approved borrowers. JPMCB receives and
maintains collateral in the form of cash and/or acceptable securities as
approved by ACIM. Cash collateral is invested in authorized investments by the
lending agent in a pooled account. The value of cash collateral received at
period end is disclosed in the Statement of Assets and Liabilities and
investments made with the cash by the lending agent are listed in the Schedule
of Investments. Any deficiencies or excess of collateral must be delivered or
transferred by the member firms no later than the close of business on the
next business day. The total value of all collateral received, at this date,
was $155,413,633 and $13,553,398, respectively. The funds' risks in securities
lending are that the borrower may not provide additional collateral when
required or return the securities when due. If the borrower defaults, receipt
of the collateral by the funds may be delayed or limited.
6. BANK LINE OF CREDIT
The funds, along with certain other funds managed by ACIM or ACGIM, have a
$500,000,000 unsecured bank line of credit agreement with JPMCB. The funds may
borrow money for temporary or emergency purposes to fund shareholder
redemptions. Borrowings under the agreement bear interest at the Federal Funds
rate plus 0.40%. The funds did not borrow from the line during the six months
ended September 30, 2007.
7. RISK FACTORS
High-Yield invests primarily in lower-rated debt securities, which are subject
to substantial risks including price volatility, liquidity risk, and default
risk.
8. FEDERAL TAX INFORMATION
The book-basis character of distributions made during the year from net
investment income or net realized gains may differ from their ultimate
characterization for federal income tax purposes. These differences reflect
the differing character of paydown losses, certain income items and net
realized gains and losses for financial statement and tax purposes, and may
result in reclassification among certain capital accounts on the financial
statements. Reclassifications between income and realized gain in Diversified
Bond relate primarily to the character of paydown losses and interest on swap
agreements.
As of September 30, 2007, the components of investments for federal income tax
purposes were as follows:
Diversified
Bond High-Yield
Federal tax cost of investments $804,024,580 $101,452,400
============= =============
Gross tax appreciation of investments $ 6,046,447 $ 1,131,989
Gross tax depreciation of investments (3,983,294) (1,627,379)
------------- -------------
Net tax appreciation (depreciation) of investments $ 2,063,153 $ (495,390)
============= =============
The difference between book-basis and tax-basis cost and unrealized
appreciation (depreciation) is attributable primarily to the tax deferral of
losses on wash sales.
As of March 31, 2007, Diversified Bond had net capital loss carryovers of
$(1,154,579), $(591,687) and $(5,332,851) expiring in 2013, 2014 and 2015,
respectively. High-Yield had net capital loss carryovers of $(2,522,625),
$(10,290,681) and $(15,064) expiring in 2009, 2010 and 2014, respectively. The
net capital loss carryovers may be used to offset future realized capital
gains for federal income tax purposes.
- ------
40
9. CORPORATE EVENT
Effective September 4, 2007, the A Class (old) shares of Diversified Bond and
High-Yield were reclassified as Advisor Class shares of the same fund.
Subsequent to the reclassification, the Advisor Class was renamed A Class. The
changes were approved by the Board of Trustees on December 8, 2006.
10. RECENTLY ISSUED ACCOUNTING STANDARDS
In June 2006, the Financial Accounting Standards Board (FASB) issued
Interpretation No. 48, "Accounting for Uncertainty in Income Taxes -- an
Interpretation of FASB Statement No. 109" (FIN 48). FIN 48 establishes a
minimum threshold for financial statement recognition of the benefit of
positions taken in filing tax returns (including whether an entity is taxable
in a particular jurisdiction), and requires certain expanded tax disclosures.
FIN 48 is effective for fiscal years beginning after December 15, 2006, and is
to be applied to all open tax years as of the date of effectiveness.
Management has concluded that the adoption of FIN 48 will not materially
impact the financial statements.
The FASB issued Statement of Financial Accounting Standards No. 157, "Fair
Value Measurements" (FAS 157), in September 2006, which is effective for
fiscal years beginning after November 15, 2007. FAS 157 defines fair value,
establishes a framework for measuring fair value and expands the required
financial statement disclosures about fair value measurements. Management is
currently evaluating the impact that adopting FAS 157 will have on the
financial statement disclosures.
- ------
41
FINANCIAL HIGHLIGHTS
Diversified Bond
Investor Class
For a Share Outstanding Throughout the Years Ended March 31 (except as noted)
2007(1) 2007 2006 2005 2004 2003
PER-SHARE DATA
Net Asset Value,
Beginning of
Period $10.02 $9.89 $10.10 $10.49 $10.47 $9.98
-------- -------- -------- -------- -------- --------
Income From
Investment
Operations
Net
Investment
Income
(Loss) 0.23(2) 0.45(2) 0.41(2) 0.33(2) 0.36(2) 0.48
Net Realized
and
Unrealized
Gain (Loss) 0.01 0.13 (0.21) (0.27) 0.14 0.49
-------- -------- -------- -------- -------- --------
Total From
Investment
Operations 0.24 0.58 0.20 0.06 0.50 0.97
-------- -------- -------- -------- -------- --------
Distributions
From Net
Investment
Income (0.23) (0.45) (0.41) (0.34) (0.37) (0.48)
From Net
Realized
Gains -- -- -- (0.11) (0.11) --
-------- -------- -------- -------- -------- --------
Total
Distributions (0.23) (0.45) (0.41) (0.45) (0.48) (0.48)
-------- -------- -------- -------- -------- --------
Net Asset
Value, End
of Period $10.03 $10.02 $9.89 $10.10 $10.49 $10.47
======== ======== ======== ======== ======== ========
TOTAL RETURN(3) 2.41% 6.05% 1.97% 0.63% 4.92% 9.93%
RATIOS/SUPPLEMENTAL DATA
Ratio of
Operating
Expenses to
Average Net Assets 0.62%(4) 0.62% 0.62% 0.63% 0.64% 0.64%
Ratio of Net
Investment Income
(Loss) to Average
Net Assets 4.60%(4) 4.58% 4.04% 3.25% 3.38% 4.67%
Portfolio
Turnover Rate 151% 323% 341% 386% 324% 151%
Net Assets, End
of Period (in
thousands) $450,892 $394,346 $225,187 $180,346 $177,791 $198,835
(1) Six months ended September 30, 2007 (unaudited).
(2) Computed using average shares outstanding throughout the period.
(3) Total return assumes reinvestment of net investment income and capital
gains distributions, if any. Total returns for periods less than one year are
not annualized. The total return of the classes may not precisely reflect the
class expense differences because of the impact of calculating the net asset
values to two decimal places. If net asset values were calculated to three
decimal places, the total return differences would more closely reflect the
class expense differences. The calculation of net asset values to two decimal
places is made in accordance with SEC guidelines and does not result in any
gain or loss of value between one class and another.
(4) Annualized.
See Notes to Financial Statements.
- ------
42
Diversified Bond
Institutional Class
For a Share Outstanding Throughout the Years Ended March 31 (except as noted)
2007(1) 2007 2006 2005 2004 2003
PER-SHARE DATA
Net Asset Value,
Beginning of
Period $10.02 $9.89 $10.10 $10.49 $10.47 $9.98
-------- -------- -------- -------- -------- --------
Income From
Investment
Operations
Net
Investment
Income (Loss) 0.24(2) 0.47(2) 0.43(2) 0.35(2) 0.38(2) 0.50
Net Realized
and
Unrealized
Gain (Loss) 0.01 0.13 (0.21) (0.27) 0.14 0.49
-------- -------- -------- -------- -------- --------
Total From
Investment
Operations 0.25 0.60 0.22 0.08 0.52 0.99
-------- -------- -------- -------- -------- --------
Distributions
From Net
Investment
Income (0.24) (0.47) (0.43) (0.36) (0.39) (0.50)
From Net
Realized
Gains -- -- -- (0.11) (0.11) --
-------- -------- -------- -------- -------- --------
Total
Distributions (0.24) (0.47) (0.43) (0.47) (0.50) (0.50)
-------- -------- -------- -------- -------- --------
Net Asset
Value, End
of Period $10.03 $10.02 $9.89 $10.10 $10.49 $10.47
======== ======== ======== ======== ======== ========
TOTAL RETURN(3) 2.51% 6.26% 2.17% 0.83% 5.13% 10.15%
RATIOS/SUPPLEMENTAL DATA
Ratio of
Operating
Expenses to
Average Net Assets 0.42%(4) 0.42% 0.42% 0.43% 0.44% 0.44%
Ratio of Net
Investment Income
(Loss) to Average
Net Assets 4.80%(4) 4.78% 4.24% 3.45% 3.58% 4.87%
Portfolio
Turnover Rate 151% 323% 341% 386% 324% 151%
Net Assets, End
of Period (in
thousands) $155,907 $389,829 $440,579 $336,207 $309,579 $281,998
(1) Six months ended September 30, 2007 (unaudited).
(2) Computed using average shares outstanding throughout the period.
(3) Total return assumes reinvestment of net investment income and capital
gains distributions, if any. Total returns for periods less than one year are
not annualized. The total return of the classes may not precisely reflect the
class expense differences because of the impact of calculating the net asset
values to two decimal places. If net asset values were calculated to three
decimal places, the total return differences would more closely reflect the
class expense differences. The calculation of net asset values to two decimal
places is made in accordance with SEC guidelines and does not result in any
gain or loss of value between one class and another.
(4) Annualized.
See Notes to Financial Statements.
- ------
43
Diversified Bond
A Class(1)
For a Share Outstanding Throughout the Years Ended March 31 (except as noted)
2007(2) 2007 2006 2005 2004 2003
PER-SHARE DATA
Net Asset Value,
Beginning of Period $10.02 $9.89 $10.10 $10.49 $10.47 $9.98
------- ------- ------- ------- ------- -------
Income From
Investment Operations
Net Investment
Income (Loss) 0.21(3) 0.43(3) 0.38(3) 0.31(3) 0.33(3) 0.46
Net Realized and
Unrealized Gain
(Loss) 0.01 0.13 (0.21) (0.28) 0.14 0.49
------- ------- ------- ------- ------- -------
Total From
Investment
Operations 0.22 0.56 0.17 0.03 0.47 0.95
------- ------- ------- ------- ------- -------
Distributions
From Net
Investment Income (0.21) (0.43) (0.38) (0.31) (0.34) (0.46)
From Net
Realized Gains -- -- -- (0.11) (0.11) --
------- ------- ------- ------- ------- -------
Total
Distributions (0.21) (0.43) (0.38) (0.42) (0.45) (0.46)
------- ------- ------- ------- ------- -------
Net Asset Value, End
of Period $10.03 $10.02 $9.89 $10.10 $10.49 $10.47
======= ======= ======= ======= ======= =======
TOTAL RETURN(4) 2.28% 5.77% 1.72% 0.38% 4.66% 9.66%
RATIOS/SUPPLEMENTAL DATA
Ratio of Operating
Expenses to Average
Net Assets 0.87%(5) 0.87% 0.87% 0.88% 0.89% 0.89%
Ratio of Net
Investment Income
(Loss) to Average Net
Assets 4.35%(5) 4.33% 3.79% 3.00% 3.13% 4.42%
Portfolio Turnover
Rate 151% 323% 341% 386% 324% 151%
Net Assets,
End of Period
(in thousands) $12,003 $3,405 $5,642 $5,421 $7,107 $11,567
(1) Prior to September 4, 2007, the A Class was referred to as the Advisor
Class.
(2) Six months ended September 30, 2007 (unaudited).
(3) Computed using average shares outstanding throughout the period.
(4) Total return assumes reinvestment of net investment income and capital
gains distributions, if any, and does not reflect applicable sales charges.
Total returns for periods less than one year are not annualized. The total
return of the classes may not precisely reflect the class expense differences
because of the impact of calculating the net asset values to two decimal
places. If net asset values were calculated to three decimal places, the total
return differences would more closely reflect the class expense differences.
The calculation of net asset values to two decimal places is made in
accordance with SEC guidelines and does not result in any gain or loss of
value between one class and another.
(5) Annualized.
See Notes to Financial Statements.
- ------
44
Diversified Bond
B Class
For a Share Outstanding Throughout the Years Ended March 31 (except as noted)
2007(1) 2007 2006 2005 2004 2003(2)
PER-SHARE DATA
Net Asset Value,
Beginning of
Period $10.02 $9.89 $10.10 $10.49 $10.47 $10.40
------- ------- ------- ------- ------- -------
Income From
Investment
Operations
Net
Investment
Income (Loss) 0.18(3) 0.35(3) 0.31(3) 0.23(3) 0.26(3) 0.05
Net Realized
and
Unrealized
Gain (Loss) 0.01 0.13 (0.21) (0.27) 0.14 0.07
------- ------- ------- ------- ------- -------
Total From
Investment
Operations 0.19 0.48 0.10 (0.04) 0.40 0.12
------- ------- ------- ------- ------- -------
Distributions
From Net
Investment
Income (0.18) (0.35) (0.31) (0.24) (0.27) (0.05)
From Net
Realized
Gains -- -- -- (0.11) (0.11) --
------- ------- ------- ------- ------- -------
Total
Distributions (0.18) (0.35) (0.31) (0.35) (0.38) (0.05)
------- ------- ------- ------- ------- -------
Net Asset Value,
End of Period $10.03 $10.02 $9.89 $10.10 $10.49 $10.47
======= ======= ======= ======= ======= =======
TOTAL RETURN(4) 1.90% 5.00% 0.96% (0.37)% 3.87% 1.20%
RATIOS/SUPPLEMENTAL DATA
Ratio of
Operating
Expenses to
Average Net Assets 1.62%(5) 1.62% 1.62% 1.63% 1.64% 1.61%(5)(6)
Ratio of Net
Investment Income
(Loss) to Average
Net Assets 3.60%(5) 3.58% 3.04% 2.25% 2.38% 2.98%(5)(6)
Portfolio
Turnover Rate 151% 323% 341% 386% 324% 151%(7)
Net Assets, End
of Period (in
thousands) $803 $806 $750 $753 $615 $84
(1) Six months ended September 30, 2007 (unaudited).
(2) January 31, 2003 (commencement of sale) through March 31, 2003.
(3) Computed using average shares outstanding throughout the period.
(4) Total return assumes reinvestment of net investment income and capital
gains distributions, if any, and does not reflect applicable sales charges.
Total returns for periods less than one year are not annualized. The total
return of the classes may not precisely reflect the class expense differences
because of the impact of calculating the net asset values to two decimal
places. If net asset values were calculated to three decimal places, the total
return differences would more closely reflect the class expense differences.
The calculation of net asset values to two decimal places is made in
accordance with SEC guidelines and does not result in any gain or loss of
value between one class and another.
(5) Annualized.
(6) During the period ended March 31, 2003, the distributor voluntarily waived
a portion of its distribution and service fees. Had fees not been waived the
annualized ratio of operating expenses to average net assets and annualized
ratio of net investment income (loss) to average net assets would have been
1.63% and 2.96%, respectively.
(7) Portfolio turnover is calculated at the fund level. Percentage indicated
was calculated for the year ended March 31, 2003.
See Notes to Financial Statements.
- ------
45
Diversified Bond
C Class
For a Share Outstanding Throughout the Years Ended March 31 (except as noted)
2007(1) 2007 2006 2005 2004 2003(2)
PER-SHARE DATA
Net Asset Value,
Beginning of Period $10.02 $9.89 $10.10 $10.49 $10.47 $10.40
------- ------- ------- ------- ------- -------
Income From
Investment Operations
Net Investment
Income (Loss) 0.18(3) 0.35(3) 0.31(3) 0.23(3) 0.28(3) 0.05
Net Realized and
Unrealized Gain
(Loss) 0.01 0.13 (0.21) (0.27) 0.14 0.07
------- ------- ------- ------- ------- -------
Total From
Investment
Operations 0.19 0.48 0.10 (0.04) 0.42 0.12
------- ------- ------- ------- ------- -------
Distributions
From Net
Investment
Income (0.18) (0.35) (0.31) (0.24) (0.29) (0.05)
From Net
Realized Gains -- -- -- (0.11) (0.11) --
------- ------- ------- ------- ------- -------
Total
Distributions (0.18) (0.35) (0.31) (0.35) (0.40) (0.05)
------- ------- ------- ------- ------- -------
Net Asset Value, End
of Period $10.03 $10.02 $9.89 $10.10 $10.49 $10.47
======= ======= ======= ======= ======= =======
TOTAL RETURN(4) 1.90% 4.99% 0.96% (0.37)% 4.07% 1.20%
RATIOS/SUPPLEMENTAL DATA
Ratio of Operating
Expenses to Average
Net Assets 1.62%(5) 1.62% 1.62% 1.63% 1.47% 1.38%(5)
Ratio of Net
Investment Income
(Loss) to Average
Net Assets 3.60%(5) 3.58% 3.04% 2.25% 2.55% 3.23%(5)
Portfolio Turnover
Rate 151% 323% 341% 386% 324% 151%(6)
Net Assets, End of
Period (in thousands) $3,122 $2,718 $1,334 $1,418 $1,347 $342
(1) Six months ended September 30, 2007 (unaudited).
(2) January 31, 2003 (commencement of sale) through March 31, 2003.
(3) Computed using average shares outstanding throughout the period.
(4) Total return assumes reinvestment of net investment income and capital
gains distributions, if any, and does not reflect applicable sales charges.
Total returns for periods less than one year are not annualized. The total
return of the classes may not precisely reflect the class expense differences
because of the impact of calculating the net asset values to two decimal
places. If net asset values were calculated to three decimal places, the total
return differences would more closely reflect the class expense differences.
The calculation of net asset values to two decimal places is made in
accordance with SEC guidelines and does not result in any gain or loss of
value between one class and another.
(5) Annualized.
(6) Portfolio turnover is calculated at the fund level. Percentage indicated
was calculated for the year ended March 31, 2003.
See Notes to Financial Statements.
- ------
46
Diversified Bond
R Class
For a Share Outstanding Throughout the Years Ended March 31 (except as noted)
2007(1) 2007 2006(2)
PER-SHARE DATA
Net Asset Value, Beginning of Period $10.02 $9.89 $10.17
------- ------- -------
Income From Investment Operations
Net Investment Income (Loss)(3) 0.20 0.40 0.25
Net Realized and Unrealized Gain (Loss) 0.01 0.13 (0.28)
------- ------- -------
Total From Investment Operations 0.21 0.53 (0.03)
------- ------- -------
Distributions
From Net Investment Income (0.20) (0.40) (0.25)
------- ------- -------
Net Asset Value, End of Period $10.03 $10.02 $9.89
======= ======= =======
TOTAL RETURN(4) 2.16% 5.52% (0.33)%
RATIOS/SUPPLEMENTAL DATA
Ratio of Operating Expenses to Average Net Assets 1.12%(5) 1.12% 1.12%(5)
Ratio of Net Investment Income (Loss) to Average
Net Assets 4.10%(5) 4.08% 3.68%(5)
Portfolio Turnover Rate 151% 323% 341%(6)
Net Assets, End of Period (in thousands) $27 $26 $25
(1) Six months ended September 30, 2007 (unaudited).
(2) July 29, 2005 (commencement of sale) through March 31, 2006.
(3) Computed using average shares outstanding throughout the period.
(4) Total return assumes reinvestment of net investment income and capital
gains distributions, if any. Total returns for periods less than one year are
not annualized. The total return of the classes may not precisely reflect the
class expense differences because of the impact of calculating the net asset
values to two decimal places. If net asset values were calculated to three
decimal places, the total return differences would more closely reflect the
class expense differences. The calculation of net asset values to two decimal
places is made in accordance with SEC guidelines and does not result in any
gain or loss of value between one class and another.
(5) Annualized.
(6) Portfolio turnover is calculated at the fund level. Percentage indicated
was calculated for the year ended March 31, 2006.
See Notes to Financial Statements.
- ------
47
High-Yield
Investor Class
For a Share Outstanding Throughout the Years Ended March 31 (except as noted)
2007(1) 2007 2006 2005 2004 2003(2) 2002
PER-SHARE DATA
Net Asset
Value,
Beginning of
Period $6.48 $6.38 $6.42 $6.55 $6.13 $5.76 $6.18
------- ------- ------- ------- ------- ------- -------
Income From
Investment
Operations
Net
Investment
Income
(Loss) 0.21 0.42 0.43 0.46 0.50 0.18 0.52
Net Realized
and
Unrealized
Gain (Loss) (0.16) 0.10 (0.04) (0.13) 0.42 0.37 (0.42)
------- ------- ------- ------- ------- ------- -------
Total From
Investment
Operations 0.05 0.52 0.39 0.33 0.92 0.55 0.10
------- ------- ------- ------- ------- ------- -------
Distributions
From Net
Investment
Income (0.21) (0.42) (0.43) (0.46) (0.50) (0.18) (0.52)
------- ------- ------- ------- ------- ------- -------
Net Asset
Value, End of
Period $6.32 $6.48 $6.38 $6.42 $6.55 $6.13 $5.76
======= ======= ======= ======= ======= ======= =======
TOTAL RETURN(3) 0.82% 8.54% 6.29% 5.17% 15.53% 9.61% 1.43%
RATIOS/SUPPLEMENTAL DATA
Ratio of
Operating
Expenses to
Average Net
Assets 0.80%(4)(5) 0.79%(4) 0.81%(4) 0.88% 0.89% 0.88%(5) 0.90%
Ratio of
Operating
Expenses to
Average Net
Assets (Before
Expense Waiver) 0.87%(5) 0.87% 0.87% 0.88% 0.89% 0.88%(5) 0.90%
Ratio of Net
Investment
Income (Loss)
to Average Net
Assets 6.72%(4)(5) 6.69%(4) 6.74%(4) 7.04% 7.82% 7.22%(5) 8.37%
Ratio of Net
Investment
Income (Loss)
to Average Net
Assets (Before
Expense Waiver) 6.65%(5) 6.61% 6.68% 7.04% 7.82% 7.22%(5) 8.37%
Portfolio
Turnover Rate 26% 45% 40% 64% 80% 9% 80%
Net Assets, End
of Period (in
thousands) $53,139 $51,717 $42,650 $40,746 $54,074 $78,223 $50,287
(1) Six months ended September 30, 2007 (unaudited).
(2) November 1, 2002 through March 31, 2003. The fund's fiscal year was
changed from October 31 to March 31, resulting in a five-month annual
reporting period. For the years before 2003, the fund's fiscal year end was
October 31.
(3) Total return assumes reinvestment of net investment income and capital
gains distributions, if any. Total returns for periods less than one year are
not annualized. The total return of the classes may not precisely reflect the
class expense differences because of the impact of calculating the net asset
values to two decimal places. If net asset values were calculated to three
decimal places, the total return differences would more closely reflect the
class expense differences. The calculation of net asset values to two decimal
places is made in accordance with SEC guidelines and does not result in any
gain or loss of value between one class and another.
(4) Effective July 29, 2005, the investment advisor voluntarily agreed to
waive a portion of its management fee.
(5) Annualized.
See Notes to Financial Statements.
- ------
48
High-Yield
Institutional Class
For a Share Outstanding Throughout the Years Ended March 31 (except as noted)
2007(1) 2007 2006 2005(2)
PER-SHARE DATA
Net Asset Value, Beginning
of Period $6.48 $6.38 $6.42 $6.43
-------- -------- -------- --------
Income From Investment Operations
Net Investment Income (Loss) 0.22 0.44 0.44 0.30
Net Realized and
Unrealized Gain (Loss) (0.16) 0.10 (0.04) (0.01)
-------- -------- -------- --------
Total From Investment
Operations 0.06 0.54 0.40 0.29
-------- -------- -------- --------
Distributions
From Net Investment Income (0.22) (0.44) (0.44) (0.30)
-------- -------- -------- --------
Net Asset Value, End of Period $6.32 $6.48 $6.38 $6.42
======== ======== ======== ========
TOTAL RETURN(3) 0.92% 8.76% 6.50% 4.53%
RATIOS/SUPPLEMENTAL DATA
Ratio of Operating Expenses to
Average Net Assets 0.60%(4)(5) 0.59%(4) 0.61%(4) 0.68%(5)
Ratio of Operating Expenses to
Average Net Assets (Before Expense
Waiver) 0.67%(5) 0.67% 0.67% 0.68%(5)
Ratio of Net Investment Income
(Loss) to Average Net Assets 6.92%(4)(5) 6.89%(4) 6.94%(4) 4.37%(5)
Ratio of Net Investment Income
(Loss) to Average Net Assets
(Before Expense Waiver) 6.85%(5) 6.81% 6.88% 4.37%(5)
Portfolio Turnover Rate 26% 45% 40% 64%(6)
Net Assets, End of Period (in
thousands) $22,098 $18,177 $9,387 $3,021
(1) Six months ended September 30, 2007 (unaudited).
(2) August 2, 2004 (commencement of sale) through March 31, 2005.
(3) Total return assumes reinvestment of net investment income and capital
gains distributions, if any. Total returns for periods less than one year are
not annualized. The total return of the classes may not precisely reflect the
class expense differences because of the impact of calculating the net asset
values to two decimal places. If net asset values were calculated to three
decimal places, the total return differences would more closely reflect the
class expense differences. The calculation of net asset values to two decimal
places is made in accordance with SEC guidelines and does not result in any
gain or loss of value between one class and another.
(4) Effective July 29, 2005, the investment advisor voluntarily agreed to
waive a portion of its management fee.
(5) Annualized.
(6) Portfolio turnover is calculated at the fund level. Percentage indicated
was calculated for the year ended March 31, 2005.
See Notes to Financial Statements.
- ------
49
High-Yield
A Class(1)
For a Share Outstanding Throughout the Years Ended March 31 (except as noted)
2007(2) 2007 2006 2005 2004 2003(3) 2002(4)
PER-SHARE DATA
Net Asset
Value,
Beginning of
Period $6.48 $6.38 $6.42 $6.55 $6.13 $5.76 $6.22
-------- -------- -------- -------- -------- -------- --------
Income From
Investment
Operations
Net
Investment
Income
(Loss) 0.20 0.41 0.42 0.44 0.49 0.18 0.30
Net Realized
and
Unrealized
Gain (Loss) (0.16) 0.10 (0.04) (0.13) 0.42 0.37 (0.46)
-------- -------- -------- -------- -------- -------- --------
Total From
Investment
Operations 0.04 0.51 0.38 0.31 0.91 0.55 (0.16)
-------- -------- -------- -------- -------- -------- --------
Distributions
From Net
Investment
Income (0.20) (0.41) (0.42) (0.44) (0.49) (0.18) (0.30)
-------- -------- -------- -------- -------- -------- --------
Net Asset
Value, End
of Period $6.32 $6.48 $6.38 $6.42 $6.55 $6.13 $5.76
======== ======== ======== ======== ======== ======== ========
TOTAL RETURN(5) 0.70% 8.27% 6.02% 4.91% 15.35% 9.63% (2.72)%
RATIOS/SUPPLEMENTAL DATA
Ratio of
Operating
Expenses to
Average Net
Assets 1.05%(6)(7) 1.04%(6) 1.06%(6) 1.13% 1.12%(8) 0.84%(7)(8) 1.15%(7)
Ratio of
Operating
Expenses to
Average Net
Assets (Before
Expense Waiver) 1.12%(7) 1.12% 1.12% 1.13% 1.14% 1.13%(7) 1.15%(7)
Ratio of Net
Investment
Income (Loss)
to Average Net
Assets 6.47%(6)(7) 6.44%(6) 6.49%(6) 6.79% 7.59%(8) 7.27%(7)(8) 7.63%(7)
Ratio of Net
Investment
Income (Loss)
to Average Net
Assets (Before
Expense Waiver) 6.40%(7) 6.36% 6.43% 6.79% 7.57% 6.98%(7) 7.63%(7)
Portfolio
Turnover Rate 26% 45% 40% 64% 80% 9% 80%(9)
Net Assets, End
of Period (in
thousands) $10,858 $900 $407 $385 $242 $1 $4
(1) Prior to September 4, 2007, the A Class was referred to as the Advisor
Class.
(2) Six months ended September 30, 2007 (unaudited).
(3) November 1, 2002 through March 31, 2003. The fund's fiscal year was
changed from October 31 to March 31, resulting in a five-month annual
reporting period.
(4) March 8, 2002 (commencement of sale) through October 31, 2002.
(5) Total return assumes reinvestment of net investment income and capital
gains distributions, if any, and does not reflect applicable sales charges.
Total returns for periods less than one year are not annualized. The total
return of the classes may not precisely reflect the class expense differences
because of the impact of calculating the net asset values to two decimal
places. If net asset values were calculated to three decimal places, the total
return differences would more closely reflect the class expense differences.
The calculation of net asset values to two decimal places is made in
accordance with SEC guidelines and does not result in any gain or loss of
value between one class and another.
(6) Effective July 29, 2005, the investment advisor voluntarily agreed to
waive a portion of its management fee.
(7) Annualized.
(8) During the period ended March 31, 2003 and the year ended March 31, 2004,
the distributor voluntarily waived a portion of its distribution and service
fees.
(9) Portfolio turnover is calculated at the fund level. Percentage indicated
was calculated for the year ended October 31, 2002.
See Notes to Financial Statements.
- ------
50
High-Yield
B Class
For a Share Outstanding Throughout the Years Ended March 31 (except as noted)
2007(1) 2007 2006 2005 2004 2003(2)
PER-SHARE DATA
Net Asset
Value,
Beginning
of Period $6.48 $6.38 $6.42 $6.55 $6.13 $5.98
------- ------- ------- ------- ------- -------
Income From
Investment
Operations
Net
Investment
Income
(Loss) 0.18 0.36 0.37 0.39 0.44 0.07
Net Realized
and
Unrealized
Gain (Loss) (0.16) 0.10 (0.04) (0.13) 0.42 0.15
------- ------- ------- ------- ------- -------
Total From
Investment
Operations 0.02 0.46 0.33 0.26 0.86 0.22
------- ------- ------- ------- ------- -------
Distributions
From Net
Investment
Income (0.18) (0.36) (0.37) (0.39) (0.44) (0.07)
------- ------- ------- ------- ------- -------
Net Asset
Value, End
of Period $6.32 $6.48 $6.38 $6.42 $6.55 $6.13
======= ======= ======= ======= ======= =======
TOTAL RETURN(3) 0.32% 7.47% 5.23% 4.13% 14.38% 3.64%
RATIOS/SUPPLEMENTAL DATA
Ratio of
Operating
Expenses to
Average Net
Assets 1.80%(4)(5) 1.79%(4) 1.81%(4) 1.88% 1.89% 1.86%(5)(6)
Ratio of
Operating
Expenses to
Average Net
Assets (Before
Expense Waiver) 1.87%(5) 1.87% 1.87% 1.88% 1.89% 1.88%(5)
Ratio of Net
Investment
Income (Loss)
to Average Net
Assets 5.72%(4)(5) 5.69%(4) 5.74%(4) 6.04% 6.82% 7.27%(5)(6)
Ratio of Net
Investment
Income (Loss)
to Average Net
Assets (Before
Expense Waiver) 5.65%(5) 5.61% 5.68% 6.04% 6.82% 7.25%(5)
Portfolio
Turnover Rate 26% 45% 40% 64% 80% 9%(7)
Net Assets, End
of Period (in
thousands) $1,338 $1,358 $1,182 $1,105 $855 $57
(1) Six months ended September 30, 2007 (unaudited).
(2) January 31, 2003 (commencement of sale) through March 31, 2003.
(3) Total return assumes reinvestment of net investment income and capital
gains distributions, if any, and does not reflect applicable sales charges.
Total returns for periods less than one year are not annualized. The total
return of the classes may not precisely reflect the class expense differences
because of the impact of calculating the net asset values to two decimal
places. If net asset values were calculated to three decimal places, the total
return differences would more closely reflect the class expense differences.
The calculation of net asset values to two decimal places is made in
accordance with SEC guidelines and does not result in any gain or loss of
value between one class and another.
(4) Effective July 29, 2005, the investment advisor voluntarily agreed to
waive a portion of its management fee.
(5) Annualized.
(6) During the period ended March 31, 2003, the distributor voluntarily waived
a portion of its distribution and service fees.
(7) Portfolio turnover is calculated at the fund level. Percentage indicated
was calculated for the period ended March 31, 2003.
See Notes to Financial Statements.
- ------
51
High-Yield
C Class
For a Share Outstanding Throughout the Years Ended March 31 (except as noted)
2007(1) 2007 2006 2005 2004 2003(2) 2002(3)
PER-SHARE DATA
Net Asset
Value,
Beginning of
Period $6.48 $6.38 $6.42 $6.55 $6.13 $5.76 $6.32
------- ------- ------- ------- ------- ------- -------
Income From
Investment
Operations
Net
Investment
Income
(Loss) 0.18 0.36 0.37 0.39 0.45 0.16 0.41
Net Realized
and
Unrealized
Gain (Loss) (0.16) 0.10 (0.04) (0.13) 0.42 0.37 (0.56)
------- ------- ------- ------- ------- ------- -------
Total From
Investment
Operations 0.02 0.46 0.33 0.26 0.87 0.53 (0.15)
------- ------- ------- ------- ------- ------- -------
Distributions
From Net
Investment
Income (0.18) (0.36) (0.37) (0.39) (0.45) (0.16) (0.41)
------- ------- ------- ------- ------- ------- -------
Net Asset
Value, End
of Period $6.32 $6.48 $6.38 $6.42 $6.55 $6.13 $5.76
======= ======= ======= ======= ======= ======= =======
TOTAL RETURN(4) 0.32% 7.46% 5.23% 4.13% 14.60% 9.28% (2.49)%
RATIOS/SUPPLEMENTAL DATA
Ratio of
Operating
Expenses to
Average Net
Assets 1.80%(5)(6) 1.79%(5) 1.81%(5) 1.88% 1.72% 1.63%(6) 1.65%(6)
Ratio of
Operating
Expenses to
Average Net
Assets (Before
Expense Waiver) 1.87%(6) 1.87% 1.87% 1.88% 1.72% 1.63%(6) 1.65%(6)
Ratio of Net
Investment
Income (Loss)
to Average Net
Assets 5.72%(5)(6) 5.69%(5) 5.74%(5) 6.04% 6.99% 6.48%(6) 7.78%(6)
Ratio of Net
Investment
Income (Loss)
to Average Net
Assets (Before
Expense Waiver) 5.65%(6) 5.61% 5.68% 6.04% 6.99% 6.48%(6) 7.78%(6)
Portfolio
Turnover Rate 26% 45% 40% 64% 80% 9% 80%(7)
Net Assets, End
of Period (in
thousands) $1,892 $2,002 $1,823 $3,351 $3,590 $283 $31
(1) Six months ended September 30, 2007 (unaudited).
(2) November 1, 2002 through March 31, 2003. The fund's fiscal year was
changed from October 31 to March 31, resulting in a five-month annual
reporting period.
(3) December 10, 2001 (commencement of sale) through October 31, 2002.
(4) Total return assumes reinvestment of net investment income and capital
gains distributions, if any, and does not reflect applicable sales charges.
Total returns for periods less than one year are not annualized. The total
return of the classes may not precisely reflect the class expense differences
because of the impact of calculating the net asset values to two decimal
places. If net asset values were calculated to three decimal places, the total
return differences would more closely reflect the class expense differences.
The calculation of net asset values to two decimal places is made in
accordance with SEC guidelines and does not result in any gain or loss of
value between one class and another.
(5) Effective July 29, 2005, the investment advisor voluntarily agreed to
waive a portion of its management fee.
(6) Annualized.
(7) Portfolio turnover is calculated at the fund level. Percentage indicated
was calculated for the year ended October 31, 2002.
See Notes to Financial Statements.
- ------
52
High-Yield
R Class
For a Share Outstanding Throughout the Years Ended March 31 (except as noted)
2007(1) 2007 2006(2)
PER-SHARE DATA
Net Asset Value, Beginning of Period $6.48 $6.38 $6.51
------- ------- -------
Income From Investment Operations
Net Investment Income (Loss) 0.19 0.39 0.27
Net Realized and Unrealized Gain (Loss) (0.16) 0.10 (0.13)
------- ------- -------
Total From Investment Operations 0.03 0.49 0.14
------- ------- -------
Distributions
From Net Investment Income (0.19) (0.39) (0.27)
------- ------- -------
Net Asset Value, End of Period $6.32 $6.48 $6.38
======= ======= =======
TOTAL RETURN(3) 0.57% 8.00% 2.23%
RATIOS/SUPPLEMENTAL DATA
Ratio of Operating Expenses to Average Net
Assets(4) 1.30%(5) 1.29% 1.27%(5)
Ratio of Operating Expenses to Average Net Assets
(Before Expense Waiver) 1.37%(5) 1.37% 1.37%(5)
Ratio of Net Investment Income (Loss) to Average
Net Assets(4) 6.22%(5) 6.19% 6.39%(5)
Ratio of Net Investment Income (Loss) to Average
Net Assets (Before Expense Waiver) 6.15%(5) 6.11% 6.29%(5)
Portfolio Turnover Rate 26% 45% 40%(6)
Net Assets, End of Period (in thousands) $28 $28 $26
(1) Six months ended September 30, 2007 (unaudited).
(2) July 29, 2005 (commencement of sale) through March 31, 2006.
(3) Total return assumes reinvestment of net investment income and capital
gains distributions, if any. Total returns for periods less than one year are
not annualized. The total return of the classes may not precisely reflect the
class expense differences because of the impact of calculating the net asset
values to two decimal places. If net asset values were calculated to three
decimal places, the total return differences would more closely reflect the
class expense differences. The calculation of net asset values to two decimal
places is made in accordance with SEC guidelines and does not result in any
gain or loss of value between one class and another.
(4) Effective July 29, 2005, the investment advisor voluntarily agreed to
waive a portion of its management fee.
(5) Annualized.
(6) Portfolio turnover is calculated at the fund level. Percentage indicated
was calculated for the year ended March 31, 2006.
See Notes to Financial Statements.
- ------
53
PROXY VOTING RESULTS
A special meeting of shareholders was held on July 27, 2007, to vote on the
following proposals. The proposals received the required number of votes of
the American Century Investment Trust or the applicable fund, depending on the
proposal, and were adopted. A summary of voting results is listed below each
proposal.
PROPOSAL 1:
To elect eight Trustees to the Board of Trustees of American Century
Investment Trust (the proposal was voted on by all shareholders of funds
issued by American Century Investment Trust).
Jonathan S. Thomas For: 3,336,300,729
Withhold: 35,929,005
Abstain: 0
Broker Non-Vote: 0
John Freidenrich For: 3,337,319,127
Withhold: 34,910,607
Abstain: 0
Broker Non-Vote: 0
Ronald J. Gilson For: 3,337,806,752
Withhold: 34,422,982
Abstain: 0
Broker Non-Vote: 0
Kathryn A. Hall For: 3,337,653,997
Withhold: 34,575,737
Abstain: 0
Broker Non-Vote: 0
Peter F. Pervere For: 3,336,793,063
Withhold: 35,436,671
Abstain: 0
Broker Non-Vote: 0
Myron S. Scholes For: 3,335,709,158
Withhold: 36,520,576
Abstain: 0
Broker Non-Vote: 0
John B. Shoven For: 3,337,333,277
Withhold: 34,896,457
Abstain: 0
Broker Non-Vote: 0
Jeanne D. Wohlers For: 3,336,368,531
Withhold: 35,861,203
Abstain: 0
Broker Non-Vote: 0
- ------
55
PROPOSAL 2:
To approve a change in the fee structure of the Advisor Class. This proposal
was voted on by the Advisor Class shareholders of the following funds:
Diversified Bond High-Yield
For: 1,627,739 492,484
Against: 69,900 0
Abstain: 61,086 0
Broker Non-Vote: 407,534 347,478
- ------
55
APPROVAL OF MANAGEMENT AGREEMENTS
Diversified Bond and High-Yield
Under Section 15(c) of the Investment Company Act, contracts for investment
advisory services are required to be reviewed, evaluated and approved by a
majority of a fund's independent directors or trustees (the "Directors") each
year. At American Century, this process is referred to as the "15(c) Process."
As a part of this process, the board reviews fund performance, shareholder
services, audit and compliance information, and a variety of other reports
from the advisor concerning fund operations. In addition to this annual
review, the board of directors oversees and evaluates on a continuous basis at
its quarterly meetings the nature and quality of significant services
performed by the advisor, fund performance, audit and compliance information,
and a variety of other reports relating to fund operations. The board, or
committees of the board, also holds special meetings as needed.
Under a Securities and Exchange Commission rule, each fund is required to
disclose in its annual or semiannual report, as appropriate, the material
factors and conclusions that formed the basis for the board's approval or
renewal of any advisory agreements within the fund's most recently completed
fiscal half-year period.
ANNUAL CONTRACT REVIEW PROCESS
As part of the annual 15(c) Process undertaken during the most recent fiscal
half-year period, the Directors reviewed extensive data and information
compiled by the advisor and certain independent providers of evaluative data
(the "15(c) Providers") concerning Diversified Bon and High-Yield (the
"funds") and the services provided to the funds under the management
agreements. The information considered and the discussions held at the
meetings included, but were not limited to:
* the nature, extent and quality of investment management, shareholder
services and other services provided to the funds under the management
agreements;
* reports on the advisor's activities relating to the wide range of programs
and services the advisor provides to the funds and their shareholders on a
routine and non-routine basis;
* data comparing the cost of owning the funds to the cost of owning similar
funds;
* data comparing the funds' performance to appropriate benchmarks and/or a
peer group of other mutual funds with similar investment objectives and
strategies;
* financial data showing the profitability of the funds to the advisor and the
overall profitability of the advisor; and
* data comparing services provided and charges to other investment management
clients of the advisor.
In keeping with its practice, the funds' board of directors held two regularly
scheduled meetings to review and discuss the information provided by the
advisor and to complete its negotiations with the advisor regarding the
renewal of the management agreements, including the setting of the applicable
advisory fee. The board also had the benefit of the advice of its independent
counsel throughout the period.
- ------
56
FACTORS CONSIDERED
The Directors considered all of the information provided by the advisor, the
15(c) Providers, and the board's independent counsel, and evaluated such
information for each fund for which the board has responsibility. The
Directors did not identify any single factor as being all-important or
controlling, and each Director may have attributed different levels of
importance to different factors. In deciding to renew the agreement under the
terms ultimately determined by the board to be appropriate, the Directors'
decision was based on the following factors.
NATURE, EXTENT AND QUALITY OF SERVICES -- GENERALLY. Under the management
agreements, the advisor is responsible for providing or arranging for all
services necessary for the operation of the funds. The board noted that under
the management agreements, the advisor provides or arranges at its own expense
a wide variety of services including:
* fund construction and design
* portfolio security selection
* initial capitalization/funding
* securities trading
* custody of fund assets
* daily valuation of the funds' portfolio
* shareholder servicing and transfer agency, including shareholder
confirmations, recordkeeping and communications
* legal services
* regulatory and portfolio compliance
* financial reporting
* marketing and distribution
The Directors noted that many of these services have expanded over time both
in terms of quantity and complexity in response to shareholder demands,
competition in the industry and the changing regulatory environment. In
performing their evaluation, the Directors considered information received in
connection with the annual review, as well as information provided on an
ongoing basis at their regularly scheduled board and committee meetings.
INVESTMENT MANAGEMENT SERVICES. The nature of the investment management
services provided is quite complex and allows fund shareholders access to
professional money management, instant diversification of their investments
within an asset class, the opportunity to easily diversify among asset
classes, and liquidity. In evaluating investment performance, the board
expects the advisor to manage the funds in accordance with their investment
objectives and approved strategies. In providing these services, the advisor
utilizes teams of investment professionals (portfolio managers, analysts,
research assistants, and securities traders) who require extensive information
technology, research, training, compliance and other systems
- ------
57
to conduct their business. At each quarterly meeting the Directors review
investment performance information for the funds, together with comparative
information for appropriate benchmarks and peer groups of funds managed
similarly to the funds. The Directors also review detailed performance
information during the 15(c) Process. If performance concerns are identified,
the Directors discuss with the advisor the reasons for such results (e.g.,
market conditions, security selection) and any efforts being undertaken to
improve performance. The performance information presented to the Directors
showed that Diversified Bond's performance was above its benchmark for the
one-year period and below the median for the three-year period. High-Yield's
performance fell below the median for both the one- and three-year periods
during the past year. The board discussed the funds' performance with the
advisor and was satisfied with the efforts being undertaken by the advisor.
SHAREHOLDER AND OTHER SERVICES. The advisor provides the funds with a
comprehensive package of transfer agency, shareholder, and other services. The
Directors review reports and evaluations of such services at their regular
quarterly meetings, including the annual meeting concerning contract review,
and reports to the board. These reports include, but are not limited to,
information regarding the operational efficiency and accuracy of the
shareholder and transfer agency services provided, staffing levels,
shareholder satisfaction (as measured by external as well as internal
sources), technology support, new products and services offered to fund
shareholders, securities trading activities, portfolio valuation services,
auditing services, and legal and operational compliance activities. Certain
aspects of shareholder and transfer agency service level efficiency and the
quality of securities trading activities are measured by independent third
party providers and are presented in comparison to other fund groups not
managed by the advisor.
COSTS OF SERVICES PROVIDED AND PROFITABILITY TO THE ADVISOR. The advisor
provides detailed information concerning its cost of providing various
services to the funds, its profitability in managing the funds, its overall
profitability, and its financial condition. The Directors have reviewed with
the advisor the methodology used to prepare this financial information. This
financial information regarding the advisor is considered in order to evaluate
the advisor's financial condition, its ability to continue to provide services
under the management agreements, and the reasonableness of the current
management fee.
ETHICS OF THE ADVISOR. The Directors generally consider the advisor's
commitment to providing quality services to shareholders and to conducting its
business ethically. They noted that the advisor's practices generally meet or
exceed industry best practices.
ECONOMIES OF SCALE. The Directors review reports provided by the advisor on
economies of scale for the complex as a whole and the year-over-year changes
in revenue, costs, and profitability. The Directors concluded that economies
of scale are difficult to measure and predict with precision, especially on a
fund-by-fund basis. This analysis is also complicated by the additional
services and content provided by the advisor and its reinvestment in its
ability to provide and expand those services. Accordingly, the Directors also
seek to evaluate economies of scale by reviewing other information, such as
year-over-year profitability of the advisor generally, the profitability of
its management of the funds specifically, the expenses incurred by the advisor
in providing various functions to the funds, and the breakpoint fees of
competitive funds not managed by the advisor. The Directors believe the
advisor is appropriately sharing economies of scale through its competitive
fee structure, fee breakpoints as the fund complex and the funds increase in
size, and through reinvestment in its business to provide shareholders
additional
- ------
58
content and services. In particular, separate breakpoint schedules based on
the size of the entire fund complex and on the size of the funds reflect the
complexity of assessing economies of scale.
COMPARISON TO OTHER FUNDS' FEES. The funds pay the advisor a single,
all-inclusive (or unified) management fee for providing all services necessary
for the management and operation of the funds, other than brokerage expenses,
taxes, interest, extraordinary expenses, and the fees and expenses of the
funds' independent directors (including their independent legal counsel).
Under the unified fee structure, the advisor is responsible for providing all
investment advisory, custody, audit, administrative, compliance,
recordkeeping, marketing and shareholder services, or arranging and
supervising third parties to provide such services. By contrast, most other
funds are charged a variety of fees, including an investment advisory fee, a
transfer agency fee, an administrative fee, distribution charges and other
expenses. Other than their investment advisory fees and Rule 12b-1
distribution fees, all other components of the total fees charged by these
other funds may be increased without shareholder approval. The board believes
the unified fee structure is a benefit to fund shareholders because it clearly
discloses to shareholders the cost of owning fund shares, and, since the
unified fee cannot be increased without a vote of fund shareholders, it shifts
to the advisor the risk of increased costs of operating the funds and provides
a direct incentive to minimize administrative inefficiencies. Part of the
Directors' analysis of fee levels involves reviewing certain evaluative data
compiled by an independent provider and comparing the funds' unified fee to
the total expense ratio of other funds in the funds' peer group. The unified
fee charged to shareholders of Diversified Bond was in the lowest quartile of
the total expense ratios of its peer group. The unified fee charged to
shareholders of High-Yield was at the median of the total expense ratios of
its peer group.
COMPARISON TO FEES AND SERVICES PROVIDED TO OTHER CLIENTS OF THE ADVISOR. The
Directors also requested and received information from the advisor concerning
the nature of the services, fees, and profitability of its advisory services
to advisory clients other than the funds. They observed that these varying
types of client accounts require different services and involve different
regulatory and entrepreneurial risks than the management of the funds. The
Directors analyzed this information and concluded that the fees charged and
services provided to the funds were reasonable by comparison.
COLLATERAL BENEFITS DERIVED BY THE ADVISOR. The Directors reviewed information
from the advisor concerning collateral benefits it receives as a result of its
relationship with the funds. They concluded that the advisor's primary
business is managing mutual funds and it generally does not use fund or
shareholder information to generate profits in other lines of business, and
therefore does not derive any significant collateral benefits from them. The
Directors noted that the advisor receives proprietary research from
broker-dealers that execute fund portfolio transactions and concluded that
this research is likely to benefit fund shareholders. The Directors also
determined that the advisor is able to provide investment management services
to certain clients other than the funds, at least in part, due to its existing
infrastructure built to serve the fund complex. The Directors concluded,
however, that the assets of those other clients are not material to the
analysis and, in any event, are included with the assets of the funds to
determine breakpoints in the funds' fee schedule, provided they are managed
using the same investment team and strategy.
- ------
59
CONCLUSIONS OF THE DIRECTORS
As a result of this process, the Directors, in the absence of particular
circumstances and assisted by the advice of legal counsel that is independent
of the advisor, taking into account all of the factors discussed above and the
information provided by the advisor concluded that the investment management
agreements between Diversified Bond and the advisor is fair and reasonable in
light of the services provided and should be renewed.
The Directors negotiated a one-year waiver by the advisor of a portion of the
management fee on behalf of High-Yield. These changes were proposed by the
Directors based on their review of the fund's percentile rank in its peer
group universe and the fact that the Directors seek as a general rule to have
total expense ratios of fixed income and money market funds in the lowest 25th
percentile of the fees of comparable funds. The advisor accepted the principle
of the fee waiver based on the fact that the lower fee will result in
increased competitiveness of the fund within its peer group universe. The fee
waiver, effective August 1, 2007, will result in a lowering of the management
fee of the fund by 0.07 percentage points below the current management fee.
Following these negotiations with the advisor, the Directors concluded that
the investment management agreement between the fund and the advisor is fair
and reasonable in light of the services provided and should be renewed.
- ------
60
SHARE CLASS INFORMATION
Six classes of shares are authorized for sale by the funds: Investor Class,
Institutional Class, A Class, B Class, C Class, and R Class. The total expense
ratio of Institutional Class shares is lower than that of Investor Class
shares; the total expense ratios of A Class, B Class, C Class, and R Class
shares are higher than that of Investor Class shares.
INVESTOR CLASS shares are available for purchase in two ways: 1) directly from
American Century without any commissions or other fees; and/or 2) through
certain financial intermediaries (such as banks, broker-dealers, insurance
companies and investment advisors), which may require payment of a transaction
fee to the financial intermediary. The funds' prospectuses contain additional
information regarding eligibility for Investor Class shares.
INSTITUTIONAL CLASS shares are available to large investors such as
endowments, foundations, and retirement plans, and to financial intermediaries
serving these investors. This class recognizes the relatively lower cost of
serving institutional customers and others who invest at least $5 million ($3
million for endowments and foundations) in an American Century fund or at
least $10 million in multiple funds. In recognition of the larger investments
and account balances and comparatively lower transaction costs, the unified
management fee of Institutional Class shares is 0.20% less than the unified
management fee of Investor Class shares.
A CLASS shares are sold primarily through employer-sponsored retirement plans
and through institutions such as investment advisors, banks, broker-dealers,
and insurance companies. A Class shares are sold at their offering price,
which is net asset value plus an initial sales charge that ranges from 4.50%
to 0.00% for fixed-income funds, depending on the amount invested. The initial
sales charge is deducted from the purchase amount before it is invested. A
Class shares may be subject to a contingent deferred sales charge (CDSC).
There is no CDSC on shares acquired through reinvestment of dividends or
capital gains. The prospectus contains information regarding reductions and
waivers of sales charges for A Class shares. The unified management fee for A
Class shares is the same as for Investor Class shares. A Class shares also are
subject to a 0.25% annual Rule 12b-1 distribution and service fee.
B CLASS shares are sold primarily through employer-sponsored retirement plans
and through institutions such as investment advisors, banks, broker-dealers,
and insurance companies. B Class shares redeemed within six years of purchase
are subject to a CDSC that declines from 5.00% during the first year after
purchase to 0.00% after the sixth year. There is no CDSC on shares acquired
through reinvestment of dividends or capital gains. The unified management fee
for B Class shares is the same as for Investor Class shares. B Class shares
also are subject to a 1.00% annual Rule 12b-1 distribution and service fee. B
Class shares automatically convert to A Class shares (with lower expenses)
eight years after their purchase date.
C CLASS shares are sold primarily through employer-sponsored retirement plans
and through institutions such as investment advisors, banks, broker-dealers,
and insurance companies. C Class shares redeemed within 12 months of purchase
are subject to a CDSC of 1.00%. There is no CDSC on shares acquired through
reinvestment of dividends or capital gains. The unified management fee for C
Class shares is the same as for Investor Class shares. C Class shares also are
subject to a Rule 12b-1 distribution and service fee of 1.00%.
- ------
61
R CLASS shares are sold primarily through employer-sponsored retirement plans
and through institutions such as investment advisors, banks, broker-dealers,
and insurance companies. The unified management fee for R Class shares is the
same as for Investor Class shares. R Class shares are subject to a 0.50%
annual Rule 12b-1 distribution and service fee.
All classes of shares represent a pro rata interest in the funds and generally
have the same rights and preferences.
- ------
62
ADDITIONAL INFORMATION
RETIREMENT ACCOUNT INFORMATION
As required by law, any distributions you receive from an IRA or certain
403(b), 457 and qualified plans [those not eligible for rollover to an IRA or
to another qualified plan] are subject to federal income tax withholding,
unless you elect not to have withholding apply. Tax will be withheld on the
total amount withdrawn even though you may be receiving amounts that are not
subject to withholding, such as nondeductible contributions. In such case,
excess amounts of withholding could occur. You may adjust your withholding
election so that a greater or lesser amount will be withheld.
If you don't want us to withhold on this amount, you must notify us to not
withhold the federal income tax. Even if you plan to roll over the amount you
withdraw to another tax-deferred account, the withholding rate still applies
to the withdrawn amount unless we have received notice not to withhold federal
income tax prior to the withdrawal. You may notify us in writing or in certain
situations by telephone or through other electronic means. You have the right
to revoke your withholding election at any time and any election you make may
remain in effect until revoked by filing a new election.
Remember, even if you elect not to have income tax withheld, you are liable
for paying income tax on the taxable portion of your withdrawal. If you elect
not to have income tax withheld or you don't have enough income tax withheld,
you may be responsible for payment of estimated tax. You may incur penalties
under the estimated tax rules if your withholding and estimated tax payments
are not sufficient.
State tax will be withheld if, at the time of your distribution, your address
is within one of the mandatory withholding states and you have federal income
tax withheld. State taxes will be withheld from your distribution in
accordance with the respective state rules.
PROXY VOTING GUIDELINES
American Century Investment Management, Inc., the funds' investment advisor,
is responsible for exercising the voting rights associated with the securities
purchased and/or held by the funds. A description of the policies and
procedures the advisor uses in fulfilling this responsibility is available
without charge, upon request, by calling 1-800-345-2021. It is also available
on American Century's website at americancentury.com and on the Securities and
Exchange Commission's website at sec.gov. Information regarding how the
investment advisor voted proxies relating to portfolio securities during the
most recent 12-month period ended June 30 is available on the "About Us" page
at americancentury.com. It is also available at sec.gov.
QUARTERLY PORTFOLIO DISCLOSURE
The funds file their complete schedule of portfolio holdings with the
Securities and Exchange Commission (SEC) for the first and third quarters of
each fiscal year on Form N-Q. The funds' Forms N-Q are available on the SEC's
website at sec.gov, and may be reviewed and copied at the SEC's Public
Reference Room in Washington, DC. Information on the operation of the Public
Reference Room may be obtained by calling 1-800-SEC-0330. The funds also make
their complete schedule of portfolio holdings for the most recent quarter of
their fiscal year available on their website at americancentury.com and, upon
request, by calling 1-800-345-2021.
- ------
63
INDEX DEFINITIONS
The following indices are used to illustrate investment market, sector, or
style performance or to serve as fund performance comparisons. They are not
investment products available for purchase.
The CITIGROUP AGENCY INDEX is a market-capitalization-weighted index that
includes U.S. government sponsored agencies with a remaining maturity of at
least one year.
The CITIGROUP CREDIT INDEX includes US and non-US corporate securities and
non-US sovereign and provincial securities.
The CITIGROUP MORTGAGE INDEX measures the mortgage component of the US BIG
Index, comprising 30-and 15-year GNMA, FNMA, and FHLMC pass-throughs and FNMA
and FHLMC balloon mortgages.
The CITIGROUP TREASURY INDEX is comprised of U.S. Treasury securities with an
amount outstanding of at least $5 billion and a remaining maturity of at least
one year.
The CITIGROUP US BROAD INVESTMENT-GRADE (BIG) BOND INDEX is a market-
capitalization-weighted index that includes fixed-rate Treasury, government-
sponsored, mortgage, asset-backed, and investment-grade issues with a maturity
of one year or longer.
The CITIGROUP US HIGH-YIELD MARKET INDEX captures the performance of
below-investment-grade debt issued by corporations domiciled in the United
States or Canada. This index includes cash-pay and deferred-interest
securities that are publicly placed, have a fixed coupon, and are
nonconvertible.
The CITIGROUP US INFLATION-LINKED SECURITIES INDEX (ILSI) measures the return
of bonds with fixed-rate coupon payments that adjust for inflation as measured
by the Consumer Price Index (CPI).
The MERRILL LYNCH US HIGH YIELD MASTER II CONSTRAINED INDEX tracks the
performance of below investment-grade U.S. dollar-denominated corporate bonds
publicly issued in the U.S. domestic markets and limits any single issuer to
no more than 2% of the index.
- ------
64
[back cover]
CONTACT US
AMERICANCENTURY.COM
AUTOMATED INFORMATION LINE:
1-800-345-8765
INVESTOR SERVICES REPRESENTATIVE:
1-800-345-2021 or 816-531-5575
INVESTORS USING ADVISORS:
1-800-378-9878
BUSINESS, NOT-FOR-PROFIT,
EMPLOYER-SPONSORED RETIREMENT PLANS:
1-800-345-3533
BANKS AND TRUST COMPANIES, BROKER-DEALERS,
FINANCIAL PROFESSIONALS, INSURANCE COMPANIES:
1-800-345-6488
TELECOMMUNICATIONS DEVICE FOR THE DEAF:
1-800-634-4113 or 816-444-3485
AMERICAN CENTURY INVESTMENT TRUST
INVESTMENT ADVISOR:
American Century Investment Management, Inc.
Kansas City, Missouri
THIS REPORT AND THE STATEMENTS IT CONTAINS ARE SUBMITTED FOR THE GENERAL
INFORMATION OF OUR SHAREHOLDERS. THE REPORT IS NOT AUTHORIZED FOR DISTRIBUTION
TO PROSPECTIVE INVESTORS UNLESS PRECEDED OR ACCOMPANIED BY AN EFFECTIVE
PROSPECTUS.
American Century Investment Services, Inc., Distributor
��2007 American Century Proprietary Holdings, Inc. All rights reserved.
The American Century Investments logo, American Century and American Century
Investments are service marks of American Century Proprietary Holdings, Inc.
0711
SH-SAN-56802N
AMERICAN CENTURY INVESTMENTS
Semiannual Report September 30, 2007
Premium Money Market Fund
[american century investments logo and text logo]
OUR MESSAGE TO YOU
To help you monitor your investment, my colleagues and I take pride in
providing you with the semiannual report for the American Century® Premium
Money Market Fund for the six months ended September 30, 2007. This has been
an eventful and exciting period for us. We've been working diligently to
secure a smooth executive leadership transition.
I'm honored to be addressing you in the "Our Message" space long devoted to
company founder Jim Stowers, Jr. and his son Jim Stowers III. The Stowers
family remains an integral part of our heritage, leadership, and financial
structure. Jim Jr. continues as co-chair of the American Century Companies,
Inc. (ACC) board of directors with Richard Brown, who has been on the board
since 1998 and co-chairs the Stowers Institute for Medical Research board.
But times and opportunities change. As the latest step in a career transition
that began when he relinquished his executive leadership and investment
management responsibilities in early 2005, Jim III stepped down from the ACC
board in July 2007 to focus on new business ventures. Jim III's move reflects
his family's comfort with our direction and leadership, and gives the Stowers
more leeway to devote time and energy to other important priorities, such as
the Stowers Institute for Medical Research.
Meanwhile, American Century Investments, our clients, and our employees have
been my top priority since I became company president and CEO in March. We've
also added the executive talents of overall chief investment officer Enrique
Chang, international equity CIO Mark On, U.S. growth equity CIO Steve Lurito,
and chief operating officer Barry Fink.
This skilled group, combined with our existing senior management team, has
already had a positive impact on the development and management of the
products and services we take pride in delivering to you.
/s/Jonathan Thomas
Jonathan Thomas
[photo of Jonathan Thomas]
Jonathan Thomas
PRESIDENT AMERICAN CENTURY COMPANIES, INC.
[photo of James E. Stowers, Jr.]
James E. Stowers, Jr.
FOUNDER AND CO-CHAIRMAN OF THE BOARD AMERICAN CENTURY COMPANIES, INC.
[photo of Richard Brown]
Richard Brown
CO-CHAIRMAN OF THE BOARD AMERICAN CENTURY COMPANIES, INC.
TABLE OF CONTENTS
Market Perspective. . . . . . . . . . . . . . . . . . . . . . . . . . 2
U.S. Fixed-Income Total Returns. . . . . . . . . . . . . . . . . . . 2
PREMIUM MONEY MARKET FUND
Performance . . . . . . . . . . . . . . . . . . . . . . . . . . . . . 3
Portfolio Commentary. . . . . . . . . . . . . . . . . . . . . . . . . 4
Portfolio Composition by Credit Rating . . . . . . . . . . . . . . . 4
Portfolio Composition by Maturity. . . . . . . . . . . . . . . . . . 4
Yields and Weighted Average Maturity . . . . . . . . . . . . . . . . 5
Shareholder Fee Example . . . . . . . . . . . . . . . . . . . . . . . 6
Schedule of Investments . . . . . . . . . . . . . . . . . . . . . . . 8
FINANCIAL STATEMENTS
Statement of Assets and Liabilities . . . . . . . . . . . . . . . . . 14
Statement of Operations . . . . . . . . . . . . . . . . . . . . . . . 15
Statement of Changes in Net Assets. . . . . . . . . . . . . . . . . . 16
Notes to Financial Statements . . . . . . . . . . . . . . . . . . . . 17
Financial Highlights. . . . . . . . . . . . . . . . . . . . . . . . . 19
OTHER INFORMATION
Proxy Voting Results. . . . . . . . . . . . . . . . . . . . . . . . . 20
Approval of Management Agreement for Premium Money Market . . . . . . 21
Additional Information. . . . . . . . . . . . . . . . . . . . . . . . 26
Index Definitions . . . . . . . . . . . . . . . . . . . . . . . . . . 27
The opinions expressed in the Market Perspective and the Portfolio Commentary
reflect those of the portfolio management team as of the date of the report,
and do not necessarily represent the opinions of American Century or any other
person in the American Century organization. Any such opinions are subject to
change at any time based upon market or other conditions and American Century
disclaims any responsibility to update such opinions. These opinions may not
be relied upon as investment advice and, because investment decisions made by
American Century funds are based on numerous factors, may not be relied upon
as an indication of trading intent on behalf of any American Century fund.
Security examples are used for representational purposes only and are not
intended as recommendations to purchase or sell securities. Performance
information for comparative indices and securities is provided to American
Century by third party vendors. To the best of American Century's knowledge,
such information is accurate at the time of printing.
MARKET PERSPECTIVE
[photo of chief investment officer]
By David MacEwen, Chief Investment Officer, Fixed Income
MODEST GROWTH, INFLATION, BOND RETURNS
U.S. bonds managed positive returns during the six months ended September 30,
2007. But the ride was bumpy -- bond market volatility surged to the highest
level in years as waves from the bursting housing and subprime mortgage
bubbles spread to the broader economy and financial markets.
U.S. economic growth was moderate over the last four complete calendar
quarters, running at an approximately 2-3% average annual rate. Many
economists are calling for sub-2% growth going forward. Inflation slowed, as
the trailing 12-month percentage change in core consumer prices (without
volatile food and energy prices) finished September at 2.1%. That's down from
2.9% as recently as September 2006.
To help alleviate some of the market and economic concerns, the Federal
Reserve (the Fed) lowered its benchmark federal funds rate target in
September. This came on top of cuts to its discount rate in both August and
September -- the Fed's first rate cuts since June 2003.
RATES FELL, CURVE STEEPENED
Against that backdrop, Treasury yields generally declined. The yield on the
two-year Treasury note fell from 4.58% to 3.99%; however, yields on
longer-term notes and bonds fell less. That's because investors worried about
the potential long-term inflation effects of Fed rate cuts, high energy and
commodity prices, and a weaker dollar. As a result, the yield curve (a graphic
representation of bond yields at different maturities) fell and steepened --
the difference in yield between two- and 10-year Treasury securities increased
sharply from seven to 60 basis points (a basis point equals 0.01%).
HIGH-QUALITY BONDS DID BEST
The volatility, credit, and liquidity concerns in the market all favored
Treasury securities over higher-yielding, lower-quality alternatives (see the
returns table above). So, for example, while the Treasury market enjoyed its
best quarter in five years from July to September, July was one of the worst
months on record for high-yield bonds. Treasury inflation-indexed securities
performed best because of their combination of high credit quality and
inflation protection.
U.S. Fixed-Income Total Returns
For the six months ended September 30, 2007*
TREASURY SECURITIES
3-Month Bill 2.69%
2-Year Note 3.25%
5-Year Note 3.60%
10-Year Note 2.72%
30-Year Bond 2.57%
CITIGROUP U.S. BOND MARKET INDICES
High-Yield (corporate) 0.65%
Credit (investment-grade corporate) 1.50%
Mortgage 2.16%
Broad Investment-Grade (multi-sector) 2.42%
Agency 3.04%
Treasury 3.38%
Inflation-Linked Securities 3.76%
*Total returns for periods less than one year are not annualized.
- ------
2
PERFORMANCE
Premium Money Market
Total Returns as of September 30, 2007
Average Annual Returns
10 Since Inception
6 months(1) 1 year 5 years years Inception Date
INVESTOR
CLASS 2.53%(2) 5.09%(2) 2.70% 3.64% 3.94% 4/1/93
90-DAY U.S.
TREASURY
BILL
INDEX 2.24% 4.73% 2.79% 3.55% 3.91% --
LIPPER
MONEY
MARKET
INSTRUMENT
FUNDS
AVERAGE
RETURN(3) 2.26% 4.56% 2.24% 3.19% -- --
Fund's Lipper
Ranking
among
Money
Market 19
Instrument of
Funds(3) 25 of 348 25 of 334 22 of 294 188 -- --
Premium Money market acquired all of the net assets of American Century
Premium Capital Reserve Fund and the American Century Premium Government
Reserve Fund on December 3, 2001, pursuant to a plan of reorganization
approved by the acquired funds' shareholders on November 16, 2001. Performance
information prior to December 3, 2001 is that of the American Century Premium
Capital Reserve Fund.
(1) Total returns for periods less than one year are not annualized.
(2) Class returns would have been lower if American Century had not
voluntarily waived a portion of its management fees.
(3) Data provided by Lipper Inc. -- A Reuters Company. © 2007 Reuters. All
rights reserved. Any copying, republication or redistribution of Lipper
content, including by caching, framing or similar means, is expressly
prohibited without the prior written consent of Lipper. Lipper shall not be
liable for any errors or delays in the content, or for any actions taken in
reliance thereon.
Lipper Fund Performance -- Performance data is total return, and is
preliminary and subject to revision.
Lipper Rankings -- Rankings are based only on the universe shown and are
based on average annual total returns. This listing might not represent the
complete universe of funds tracked by Lipper.
The data contained herein has been obtained from company reports, financial
reporting services, periodicals and other resources believed to be reliable.
Although carefully verified, data on compilations is not guaranteed by Lipper
and may be incomplete. No offer or solicitations to buy or sell any of the
securities herein is being made by Lipper.
Data presented reflect past performance. Past performance is no guarantee of
future results. Current performance may be higher or lower than the
performance shown. To obtain performance data current to the most recent month
end, please call 1-800-345-2021 or visit americancentury.com.
An investment in the fund is not insured or guaranteed by the Federal Deposit
Insurance Corporation or any other government agency. Although the fund seeks
to preserve the value of your investment at $1.00 per share, it is possible to
lose money by investing in the fund.The 7-day current yield more closely
reflects the current earnings of the fund than the total return.
- ------
3
PORTFOLIO COMMENTARY
Premium Money Market
Lead Portfolio Manager: Lynn Paschen
Macro Strategy Team Representative: Steven Permut
PERFORMANCE SUMMARY
Premium Money Market returned 2.53%* for the six months ended September 30,
2007, outperforming the 2.26% average return of the 348 funds in Lipper Inc.'s
Money Market Funds category. The portfolio's six-month return ranked in the
top 8% of the Lipper category, and its five- and 10-year returns ranked in the
top 8% and 11%, respectively, of the Lipper group (see the previous page).
CREDIT CRUNCH PROMPTED FED RATE CUTS
For much of the reporting period, a lingering threat of inflation kept the
Federal Reserve (Fed) on hold, and the federal (fed) funds rate target at
5.25%. Despite increasing burdens on economic growth from the housing market
slump and high energy prices, the Fed continued to view inflation as a bigger
concern than recession. Money market rates declined slightly during this
period of Fed inactivity. This was due to reduced Treasury bill issuance
stemming from surprisingly strong federal tax receipts in April.
In late July, credit and liquidity concerns took hold of the financial
markets. The bulk of the problems were confined to the bond market, but the
panic eventually filtered through to the asset-backed segment of the money
market. Many organizations regularly use asset-backed commercial paper. They
issue this short-term debt to purchase higher-yielding, longer-term
securities, such as those backed by credit card debt, student loans and
mortgage loans. But what was unclear and worrisome to many investors was the
extent of subprime mortgage exposure within these asset-backed and structured
finance securities.
The mounting credit crisis sent investors fleeing to the safety of U.S.
Treasury securities. It also sent U.S. economic growth prospects tumbling. The
Fed took action, first cutting the discount rate in August and later, on
September 18, reducing the fed funds rate target to 4.75% as it cut the
discount rate again. These represented the Fed's first rate cuts since June
25, 2003.
The yield on the benchmark three-month Treasury bill fell 123 basis points
during the reporting period, from 5.04% to 3.81% (a basis point equals 0.01%).
The bulk of the decline occurred during the third quarter of 2007, when the
yield dropped 100 basis points.
Portfolio Composition by Credit Rating
% of fund investments % of fund investments
as of 9/30/07 as of 3/31/07
A-1+ 67% 71%
A-1 33% 29%
Ratings provided by independent research companies. These ratings are listed
in Standard & Poor's format even if they were provided by other sources.
Portfolio Composition by Maturity
% of fund investments % of fund investments
as of 9/30/07 as of 3/31/07
1 - 30
days 56% 63%
31 - 90
days 35% 24%
91 - 180
days 7% 11%
More than
180 days 2% 2%
*Total returns for periods less than one year are not annualized. Class
returns would have been lower had management fees not been waived.
- ------
4
Premium Money Market
PORTFOLIO STRATEGY
Premium Money Market's 7-day current yield ended the reporting period at
5.02%, up slightly from 4.99% on March 31, 2007.
Early in the period we extended the portfolio's average maturity to
approximately 50 days to help lock in higher yields in a declining-yield
environment. Then, with credit concerns mounting and the demand for Treasury
bills skyrocketing, the portfolio's average maturity began drifting downward.
The heightened demand meant there were fewer bills available and,
consequently, little opportunity to maintain a longer average maturity.
At the height of the credit meltdown, we reaffirmed our commitment to
liquidity, focusing on the shortest-term, most-liquid securities. The
portfolio held no securities exposed to the subprime market and no
mortgage-related asset-backed commercial paper. Such securities do not meet
the portfolio's stringent selection criteria. At the same time, the portfolio
avoided any securities the team felt were at risk of losing liquidity due to
the "contagion effect."
With a Fed rate cut imminent, we attempted to extend the portfolio's average
maturity by purchasing longer-term CDs and commercial paper. Extending was not
easy, though, as longer-term paper was in limited supply. The portfolio's
average maturity ended the reporting period at 39 days.
OUTLOOK
Based on futures prices at the end of the reporting period, the bond market
expected the Fed to cut the fed funds rate target at least one more time by
the end of 2007. We agree with that market assessment. We also believe the Fed
still faces a major challenge in shoring up confidence in the financial
markets without igniting inflation or re-inflating the speculative bubbles
that developed in the credit, real estate and leveraged-buyout markets. Going
forward we think the Fed will proceed cautiously in cutting rates, to further
assess economic conditions and the impact of September's unexpectedly large
rate cut.
Yields and Weighted Average Maturity
9/30/07
7-Day Current Yield* 5.02%
7-Day Effective Yield* 5.14%
9/30/07 3/31/07
Weighted Average Maturity 39 days 38 days
*The yields presented reflect the waiver of a portion of the fund's management
fees. Without such waiver, the 7-day yields would have been lower.
- ------
5
SHAREHOLDER FEE EXAMPLE (UNAUDITED)
Fund shareholders may incur two types of costs: (1) transaction costs,
including sales charges (loads) on purchase payments and redemption/exchange
fees; and (2) ongoing costs, including management fees; distribution and
service (12b-1) fees; and other fund expenses. This example is intended to
help you understand your ongoing costs (in dollars) of investing in your fund
and to compare these costs with the ongoing cost of investing in other mutual
funds.
The example is based on an investment of $1,000 made at the beginning of the
period and held for the entire period from April 1, 2007 to September 30, 2007.
ACTUAL EXPENSES
The table provides information about actual account values and actual expenses
for each class. You may use the information, together with the amount you
invested, to estimate the expenses that you paid over the period. First,
identify the share class you own. Then simply divide your account value by
$1,000 (for example, an $8,600 account value divided by $1,000 = 8.6), then
multiply the result by the number under the heading "Expenses Paid During
Period" to estimate the expenses you paid on your account during this period.
If you hold Investor Class shares of any American Century fund, or
Institutional Class shares of the American Century Diversified Bond Fund, in
an American Century account (i.e., not a financial intermediary or retirement
plan account), American Century may charge you a $12.50 semiannual account
maintenance fee if the value of those shares is less than $10,000. We will
redeem shares automatically in one of your accounts to pay the $12.50 fee. In
determining your total eligible investment amount, we will include your
investments in all PERSONAL ACCOUNTS (including American Century Brokerage
accounts) registered under your Social Security number. PERSONAL ACCOUNTS
include individual accounts, joint accounts, UGMA/UTMA accounts, personal
trusts, Coverdell Education Savings Accounts and IRAs (including traditional,
Roth, Rollover, SEP-, SARSEP- and SIMPLE-IRAs), and certain other retirement
accounts. If you have only business, business retirement, employer-sponsored
or American Century Brokerage accounts, you are currently not subject to this
fee. We will not charge the fee as long as you choose to manage your accounts
exclusively online. If you are subject to the Account Maintenance Fee, your
account value could be reduced by the fee amount.
HYPOTHETICAL EXAMPLE FOR COMPARISON PURPOSES
The table also provides information about hypothetical account values and
hypothetical expenses based on the actual expense ratio of each class of your
fund and an assumed rate of return of 5% per year before expenses, which is
not the actual return of a fund's share class. The hypothetical account values
and expenses may not be used to estimate the actual ending account balance or
expenses you paid for the period. You may use this information to compare the
ongoing costs of investing in your fund and other funds. To do so, compare
this 5% hypothetical example with the 5% hypothetical examples that appear in
the shareholder reports of the other funds.
Please note that the expenses shown in the table are meant to highlight your
ongoing costs only and do not reflect any transactional costs, such as sales
charges (loads) or redemption/exchange fees. Therefore, the table is useful in
comparing ongoing costs only, and will not help you determine the relative
total costs of owning different funds. In addition, if these transactional
costs were included, your costs would have been higher.
- ------
6
Expenses
Paid
Beginning Ending During
Account Account Period(1) Annualized
Value Value 4/1/07 - Expense
4/1/07 9/30/07 9/30/07 Ratio(1)
Actual (after waiver)(2) $1,000 $1,025.30 $2.13 0.42%
Actual (before waiver) $1,000 $1,025.30(3) $2.38 0.47%
Hypothetical
(after waiver)(2) $1,000 $1,022.90 $2.12 0.42%
Hypothetical
(before waiver) $1,000 $1,022.65 $2.38 0.47%
(1) Expenses are equal to the fund's annualized expense ratio listed in the
table above, multiplied by the average account value over the period,
multiplied by 183, the number of days in the most recent fiscal half-year,
divided by 366, to reflect the one-half year period.
(2) During the six months ended September 30, 2007, the fund received a
partial waiver of its management fees.
(3) Ending account value assumes the return earned after waiver. The return
would have been lower had fees not been waived and would have resulted in a
lower ending account value.
- ------
7
SCHEDULE OF INVESTMENTS
Premium Money Market
SEPTEMBER 30, 2007 (UNAUDITED)
Principal Amount Value
Commercial Paper(1) -- 53.5%
$ 1,230,000 Allied Irish Banks N.A., 5.38%, 10/17/07
(Acquired 8/21/07, Cost $1,219,522)(2) $ 1,227,059
1,900,000 Allied Irish Banks N.A., 5.26%, 11/16/07
(Acquired 7/27/07, Cost $1,869,769)(2) 1,887,242
15,000,000 Allied Irish Banks N.A., 5.29%, 3/12/08
(Acquired 9/12/07, Cost $14,603,625)(2) 14,641,060
6,958,000 American Family Financial Services, 5.25%,
10/5/07 6,953,941
5,000,000 American Family Financial Services, 5.24%,
10/19/07 4,986,900
6,000,000 American Family Financial Services, 5.24%,
11/8/07 5,966,813
5,000,000 American Family Financial Services, 5.26%,
11/26/07 4,959,089
10,000,000 American Family Financial Services, 5.46%,
12/17/07 9,883,217
10,200,000 Amstel Funding Corp., 5.20%, 11/21/07 (Acquired
6/4/07, Cost $9,949,533)(2) 10,124,860
11,000,000 Amsterdam Funding Corp., 6.15%, 10/1/07
(Acquired 8/24/07, Cost $10,928,592)(2) 11,000,000
2,075,000 Bank of America Corp., 5.26%, 11/20/07 2,059,855
15,000,000 Canadian Imperial Holdings, 5.53%, 12/3/07 14,854,837
28,000,000 Cedar Springs Capital Co., 5.75%, 10/1/07
(Acquired 9/28/07, Cost $27,986,583)(2) 28,000,000
1,211,000 Cedar Springs Capital Co., 5.26%, 10/11/07
(Acquired 7/13/07, Cost $1,195,075)(2) 1,209,231
3,400,000 Cedar Springs Capital Co., 5.29%, 10/17/07
(Acquired 7/30/07, Cost $3,360,531)(2) 3,392,006
20,000,000 Citibank Credit Card Issuance Trust, Series 2007
A3, 6.42%, 10/1/07 (Acquired 9/7/07, Cost
$19,914,400)(2) 20,000,000
10,036,000 Cobbler Funding Ltd./Cobbler Funding LLC, 5.21%,
10/22/07 (Acquired 5/4/07-5/22/07, Cost
$9,798,995)(2) 10,005,499
5,000,000 Cobbler Funding Ltd./Cobbler Funding LLC, 5.23%,
12/17/07 (Acquired 7/19/07, Cost $4,890,315)(2) 4,944,068
3,000,000 Cobbler Funding Ltd./Cobbler Funding LLC, 5.21%,
1/23/08 (Acquired 6/12/07, Cost $2,903,181)(2) 2,950,505
Principal Amount Value
$15,000,000 CRC Funding LLC, 5.10%, 10/1/07 (Acquired
9/21/07, Cost $14,978,750)(2) $ 15,000,000
20,000,000 Crown Point Capital Co., 5.28%, 10/25/07
(Acquired 8/2/07, Cost $19,753,600)(2) 19,929,600
10,000,000 Crown Point Capital Co., 5.90%, 2/5/08 (Acquired
9/14/07, Cost $9,764,000)(2) 9,791,861
1,000,000 Danske Corp., 5.22%, 10/12/07 (Acquired 6/5/07,
Cost $981,295)(2) 998,405
8,000,000 Danske Corp., 5.23%, 11/19/07 (Acquired 6/22/07,
Cost $7,825,833)(2) 7,943,105
10,000,000 Depfa Bank plc, 5.25%, 10/24/07 (Acquired
7/20/07, Cost $9,860,000)(2) 9,966,458
800,000 Depfa Bank plc, 5.25%, 11/13/07 (Acquired
6/22/07, Cost $783,216)(2) 794,989
8,000,000 Emerald Notes of the BA Credit Card Trust,
5.26%, 10/17/07 (Acquired 7/17/07, Cost
$7,892,462)(2) 7,981,298
5,000,000 Emerald Notes of the BA Credit Card Trust,
5.28%, 11/1/07 (Acquired 8/1/07, Cost
$4,932,533)(2) 4,977,266
4,500,000 Govco Incorporated, 5.10%, 10/1/07 (Acquired
9/28/07, Cost $4,498,088)(2) 4,500,000
13,000,000 Govco Incorporated, 5.31%, 11/7/07 (Acquired
8/8/07, Cost $12,825,508)(2) 12,929,053
20,000,000 HBOS Treasury Services plc, 5.17%, 11/13/07 19,876,613
11,800,000 ING (U.S.) Funding LLC, 5.44%, 1/8/08 11,623,472
15,000,000 Legacy Capital LLC, 6.30%, 10/19/07 (Acquired
9/5/07, Cost $14,884,500)(2) 14,952,750
1,693,000 Legacy Capital LLC, 5.34%, 11/7/07 (Acquired
8/8/07, Cost $1,670,147)(2) 1,683,708
14,003,000 Legacy Capital LLC, 5.20%, 1/7/08 (Acquired
7/10/07, Cost $13,636,899)(2) 13,804,780
13,000,000 Lexington Parker Capital, 6.40%, 10/2/07
(Acquired 9/7/07, Cost $12,942,222)(2) 12,997,689
18,000,000 Lexington Parker Capital, 5.30%, 11/6/07
(Acquired 8/6/07, Cost $17,756,200)(2) 17,904,600
- ------
8
Premium Money Market
Principal Amount Value
$ 1,350,000 Lexington Parker Capital, 5.40%, 1/14/08
(Acquired 9/26/07, Cost $1,327,725)(2) $ 1,328,738
25,000,000 Morgan Stanley, 5.65%, 12/6/07 24,741,042
15,000,000 Paradigm Funding LLC, 5.24%, 12/3/07 (Acquired
8/2/07, Cost $14,731,450)(2) 14,862,450
7,000,000 Ranger Funding Co. LLC, 5.60%, 10/15/07
(Acquired 9/17/07, Cost $6,969,511)(2) 6,984,756
3,713,000 Ranger Funding Co. LLC, 5.12%, 10/22/07
(Acquired 9/20/07, Cost $3,696,102)(2) 3,701,910
21,542,000 Ranger Funding Co. LLC, 5.84%, 10/24/07
(Acquired 8/20/07-9/5/07, Cost $21,319,228)(2) 21,461,633
2,600,000 Societe Generale, 5.22%, 11/5/07 2,586,805
4,400,000 Societe Generale, 5.23%, 11/13/07 4,372,513
5,000,000 Toronto Dominion Holdings, 5.70%, 11/8/07
(Acquired 9/4/07, Cost $4,948,587)(2) 4,969,943
10,000,000 Toronto Dominion Holdings, 5.16%, 2/11/08
(Acquired 8/8/07, Cost $9,733,400)(2) 9,809,366
5,200,000 Triple A One Funding Corp., 6.35%, 10/9/07
(Acquired 9/11/07, Cost $5,174,318)(2) 5,192,662
25,000,000 Triple A One Funding Corp., 6.30%, 11/13/07
(Acquired 9/4/07, Cost $24,693,750)(2) 24,811,875
4,400,000 UBS Finance LLC, 5.25%, 10/10/07 4,394,225
11,900,000 UBS Finance LLC, 5.40%, 10/22/07 11,862,515
6,000,000 Variable Funding Capital Corp. LLC, 5.90%,
11/21/07 (Acquired 8/23/07, Cost $5,911,500)(2) 5,949,850
1,000,000 Westpac Banking Corp., 5.25%, 11/9/07 (Acquired
7/30/07, Cost $985,125)(2) 994,312
1,000,000 Westpac Securities NZ Ltd., 5.23%, 10/18/07
(Acquired 6/19/07, Cost $982,421)(2) 997,531
1,300,000 Westpac Securities NZ Ltd., 5.50%, 10/23/07
(Acquired 8/20/07, Cost $1,287,289)(2) 1,295,631
6,900,000 Westpac Securities NZ Ltd., 5.50%, 11/8/07
(Acquired 8/13/07, Cost $6,808,288)(2) 6,859,942
1,800,000 Westpac Securities NZ Ltd., 5.20%, 11/26/07
(Acquired 6/1/07, Cost $1,753,720)(2) 1,785,440
Principal Amount Value
$ 6,500,000 Westpac Securities NZ Ltd., 5.45%, 11/30/07
(Acquired 8/20/07, Cost $6,399,629)(2) $ 6,440,958
14,000,000 Westpac Securities NZ Ltd., 5.28%, 12/12/07
(Acquired 7/12/07-8/27/07, Cost $13,713,806)(2) 13,852,260
20,000,000 Windmill Funding Corp., 5.25%, 10/2/07 (Acquired
7/5/07, Cost $19,740,417)(2) 19,997,084
25,000,000 Yorktown Capital LLC, 5.13%, 12/3/07 (Acquired
9/24/07, Cost $24,750,625)(2) 24,775,563
-------------
TOTAL COMMERCIAL PAPER 570,730,833
-------------
Municipal Securities -- 20.6%
4,945,000 Association of Bay Area Governments Finance
Auth. for Nonprofit Corps. Rev., Series 2007 B,
(Casa De Las Campanas, Inc.), VRDN, 6.50%,
10/4/07 (RADIAN) (SBBPA: KBC Bank N.V.) 4,945,000
560,000 Board of Trustees of Morgan County Memorial
Hospital Rev., (Johnson County), VRDN, 5.30%,
10/4/07 (LOC: Fifth Third Bank) 560,000
1,500,000 Calexico Unified School District COP,
(Refinancing Project), VRDN, 5.16%, 10/4/07
(XLCA) (SBBPA: Wachovia Bank N.A.) 1,500,000
1,260,000 California Infrastructure & Economic Development
Bank Rev., Series 2000 B, (Metrotile
Manufacturing), VRDN, 5.22%, 10/4/07 (LOC:
Comerica Bank) 1,260,000
300,000 California Statewide Communities Development
Auth. Rev., (Industrial Improvements), VRDN,
5.40%, 10/4/07 (LOC: Bank of the West) 300,000
16,000,000 Catholic Health Initiatives Rev., Series 2007 B,
5.38%, 11/6/07 16,000,000
2,160,000 City of Houston Higher Education Finance Corp.
Housing Rev., Series 2003 C, (Tierwester Oaks &
Richfield Manor), VRDN, 5.82%, 10/1/07 (LOC:
Bank of New York) 2,160,000
1,570,000 City of Salinas Economic Development Rev.,
Series 2007 B, (Monterey County Public
Building), VRDN, 5.16%, 10/4/07 (LOC: Bank of
New York) 1,570,000
- ------
9
Premium Money Market
Principal Amount Value
$ 1,040,000 Colorado Housing & Finance Auth. Economic
Development Rev., Series 2007 B, (Monaco LLC),
VRDN, 5.22%, 10/3/07 (LOC: JPMorgan Chase Bank) $ 1,040,000
380,000 Colorado Housing & Finance Auth. Economic
Development Rev., Series 2004 B, (Corey
Building), VRDN, 5.22%, 10/4/07 (LOC: Wells
Fargo Bank N.A.) 380,000
655,000 Colorado Housing & Finance Auth. Economic
Development Rev., Series 2004 B, (Taxable POPIEL
Properties), VRDN, 5.20%, 10/4/07 (LOC: Guaranty
Bank & Trust and Wells Fargo Bank N.A.) 655,000
1,425,000 Colorado Housing & Finance Auth. Economic
Development Rev., Series 2005 B, (Closet
Factory), VRDN, 5.22%, 10/4/07 (LOC: Colorado
Business Bank and Bank of New York) 1,425,000
1,000,000 Columbus Development Auth. Rev., (CEDC/ICFORM
Inc.), VRDN, 5.23%, 10/4/07 (LOC: Columbus Bank
& Trust) 1,000,000
2,000,000 Columbus Development Auth. Rev., (Columbus Park
East), VRDN, 5.18%, 10/4/07 (LOC: Columbus Bank
& Trust) 2,000,000
1,350,000 Columbus Development Auth. Rev., Series 2005 B,
(Foundation Properties, Inc., Student Housing),
VRDN, 5.19%, 10/4/07 (LOC: Columbus Bank & Trust) 1,350,000
3,055,000 Columbus Development Auth. Rev., VRDN, 5.18%,
10/4/07 (LOC: Columbus Bank & Trust) 3,055,000
5,000,000 Cook County GO, Series 2005 D, (Public
Improvements), VRDN, 5.17%, 10/3/07 (SBBPA:
Depfa Bank plc) 5,000,000
5,105,000 Cook County Industrial Development Rev., Series
1999 B, (Devorahco LLC), VRDN, 5.17%, 10/4/07
(LOC: LaSalle Bank N.A.) 5,105,000
630,000 Crawford Education Facilities Corp. Rev., Series
2004 B, (Refunding Taxable University Package),
VRDN, 5.22%, 10/4/07 (LOC: BNP Paribas) 630,000
4,700,000 Fairfield Rev., Series 2005 A2, VRDN, 5.13%,
10/4/07 (LOC: Landesbank Hessen-Thuringen
Girozentrale) 4,700,000
Principal Amount Value
$12,500,000 Florida Housing Finance Corp. Multifamily
Mortgage Rev., Series 2007 G2, (Northbridge
Apartments), VRDN, 5.25%, 10/3/07 (LOC: Keybank
N.A.) $ 12,500,000
8,000,000 Florida Hurricane Catastrophe Fund Financing
Corp. Rev., Series 2006 B, VRDN, 5.96%,
10/15/07, resets monthly off the 1-month LIBOR
plus 0.02% with no caps 8,000,000
400,000 Greenville Memorial Auditorium District COP,
Series 1996 C, (BI-LO Center), VRDN, 5.23%,
10/3/07 (LOC: Bank of America N.A) 400,000
5,000,000 Groton City GO, Series 2007 B, 6.00%, 10/10/07 5,000,717
10,000,000 Kansas City Financing Commission Tax Increment
Rev., Series 2006 B, (Briarcliff West), VRDN,
5.14%, 10/4/07 (LOC: Marshall & Isley Bank) 10,000,000
6,090,000 Kansas City Tax Increment Rev., Series 2003 B,
(Chouteau Development Company LLC), VRDN, 5.13%,
10/4/07 (MBIA) (SBBPA: JPMorgan Chase Bank) 6,090,000
8,100,000 Lower Colorado River Auth. Rev., 5.37%, 11/1/07 8,100,000
7,500,000 Mississippi Business Finance Corp. Rev., Series
2005, (Future Pipe Industries, Inc.), VRDN,
5.13%, 10/4/07 (LOC: Mashreqbank and Bank of New
York) 7,500,000
3,000,000 Mississippi Business Finance Corp. Rev., Series
2006 R-1, (Aurora Flight Sciences Corporation),
VRDN, 5.13%, 10/4/07 (LOC: FHLB) 3,000,000
8,000,000 Mississippi Business Finance Corp. Rev., Series
2006 R1, (Brown Bottling Group, Inc.), VRDN,
5.13%, 10/4/07 (LOC: FHLB) 8,000,000
2,845,000 Mobile Airport Auth. Rev., VRDN, 5.15%, 10/4/07
(LOC: Regions Bank) 2,845,000
12,870,000 Mobile Medical Clinic Board Rev., (Springhill
Medical Complex, Inc.), VRDN, 5.13%, 10/4/07
(LOC: Regions Bank) 12,870,000
7,345,000 Montebello COP, VRDN, 5.17%, 10/3/07 (LOC: Union
Bank of California N.A. and California State
Teacher's Retirement System) 7,345,000
- ------
10
Premium Money Market
Principal Amount Value
$ 280,000 Nebraska Investment Finance Auth. Multifamily
Rev., Series 2001 B, (Riverbend Apartments),
VRDN, 5.25%, 10/4/07 (LOC: LaSalle Bank N.A.) $ 280,000
1,350,000 New Jersey Economic Development Auth. Rev.,
Series 2006 B, (Accurate Box Co., Inc.), VRDN,
5.20%, 12/3/07 (LOC: Sun Bank N.A. and Wells
Fargo Bank N.A.) 1,350,000
4,660,000 New Orleans Rev., VRDN, 5.38%, 10/4/07 (Ambac)
(SBBPA: JPMorgan Chase Bank) 4,660,000
3,000,000 Ogden City Redevelopment Ageny Rev., Series 2005
C1, VRDN, 5.26%, 10/2/07 (LOC: Bank of New York) 3,000,000
1,220,000 Ontario County Industrial Development Agency
Rev., Series 2005 B, (Friends of the Finger
Lakes Performing Arts Center, Inc. Civic
Facility), VRDN, 6.20%, 10/1/07 (LOC: RBS
Citizens Bank N.A.) 1,220,000
315,000 Ontario County Industrial Development Agency
Rev., Series 2006 B, (CHF - Finger Lakes, LLC
Civic Facility), VRDN, 5.18%, 10/4/07 (LOC: RBS
Citizens Bank N.A.) 315,000
1,500,000 Oregon Facilities Auth. Rev., Series 2002-1,
(Hazelden Springbrook), VRDN, 5.30%, 10/4/07
(LOC: Allied Irish Bank plc) 1,500,000
2,000,000 Osceola County Housing Finance Auth. Rev.,
Series 2002 B, (Regatta Bay Apartments), VRDN,
5.23%, 10/3/07 (LOC: FNMA) 2,000,000
500,000 Pasadena COP, (Los Robles Avenue Parking
Facilities), VRDN, 5.13%, 10/2/07 (LOC: Bank of
New York and California State Teacher's
Retirement System) 500,000
10,000,000 Pennsylvania Housing Finance Agency Single
Family Mortgage Rev., Series 2007-97D, VRDN,
5.13%, 10/3/07 (SBBPA: Dexia Credit Local) 10,000,000
11,505,000 Phenix City Water and Sewer Rev. Warrants,
Series 2004 B, VRDN, 5.16%, 10/4/07 (XLCA) 11,505,000
3,510,000 Putnam Hospital Center Rev., VRDN, 5.33%,
10/3/07 (LOC: JPMorgan Chase Bank) 3,510,000
Principal Amount Value
$ 3,700,000 Southeast Alabama Gas District Rev., (Lateral
Project), VRDN, 5.13%, 10/4/07 (Ambac) (SBBPA:
AmSouth Bank of Alabama) (Acquired 2/21/06, Cost
$3,700,000)(2) $ 3,700,000
10,860,000 Southeast Alabama Gas District Rev., VRDN,
5.15%, 10/4/07 (XLCA) (SBBPA: Southtrust Bank
N.A.) 10,860,000
2,500,000 Southeast Industrial Development Agency Rev.,
(Powers Fasteners, Inc.), VRDN, 5.23%, 10/4/07
(LOC: Bank of New York) 2,500,000
2,395,000 Southeast Industrial Development Agency Rev.,
(Powers Fasteners, Inc.), VRDN, 5.23%, 10/4/07
(LOC: JPMorgan Chase Bank) 2,395,000
2,250,000 Vermont Economic Development Auth. Rev., Series
2006 D, (Wake Robin Corp.), VRDN, 5.15%, 10/4/07
(LOC: Lloyds TSB Bank plc) 2,250,000
1,880,000 Washington Economic Development Finance Auth.
Rev., Series 2006 G, (Wesmar Company, Inc.),
VRDN, 5.16%, 10/3/07 (LOC: U.S. Bank N.A.) 1,880,000
7,835,000 Washington Economic Development Finance Auth.
Rev., Series 2007 B, (Delta Marine Industries,
Inc.), VRDN, 5.18%, 10/4/07 (LOC: KeyBank, N.A.) 7,835,000
2,500,000 West Covina Public Financing Auth. Tax
Allocation Rev., Series 1999, (Redevelopment
Agency & Sub-Lien), VRDN, 5.20%, 10/4/07 (LOC:
Allied Irish Bank plc) 2,500,000
--------------
TOTAL MUNICIPAL SECURITIES 220,045,717
--------------
Corporate Bonds -- 18.2%
12,000,000 Astin Redevelopment L.P., VRN, 5.13%, 10/4/07 12,000,000
20,000,000 Berkshire Hathaway Finance Corp., VRN, 5.41%,
10/11/07, resets quarterly off the 3-month LIBOR
plus 0.05% with no caps 20,005,436
10,000,000 Berkshire Hathaway Finance Corp., VRN, 5.59%,
11/16/07, resets quarterly off the 3-month
T-Bill plus 0.06% with no caps 10,000,865
3,000,000 Castleton United Methodist Church Inc., VRN,
5.23%, 10/3/07 (LOC: U.S. Bank, N.A.) 3,000,000
- ------
11
Premium Money Market
Principal Amount Value
$ 3,485,000 Christopher Place Inc., VRN, 5.23%, 10/4/07
(LOC: Fifth Third Bank) $ 3,485,000
2,315,000 Coastal Area Stores Inc./Tattnall Foods Inc.,
VRN, 5.18%, 10/4/07 (LOC: Columbus Bank & Trust) 2,315,000
3,320,000 CPR Investments LLC, VRN, 5.18%, 10/4/07 3,320,000
4,465,000 Crosspoint Community Church, VRN, 5.18%,
10/4/07, resets monthly off the 1-month LIBOR
plus 0.10% with no caps (LOC: AmSouth Bank) 4,465,000
16,750,000 Cunat Sheffield Heights LLC, VRN, 5.15%, 10/4/07 16,750,000
6,135,000 Delos LLC, VRN, 5.18%, 10/4/07 (LOC: Fifth Third
Bank) 6,135,000
4,000,000 First Baptist Church of Opelika, VRN, 5.13%,
10/4/07 (LOC: FHLB) 4,000,000
1,835,000 Gastroenterology Associates LLC, VRN, 5.15%,
10/4/07 (Acquired 7/16/07, Cost $1,835,000)(2) 1,835,000
2,070,000 Grace Community Church of Amarillo, VRN, 5.13%,
10/4/07 (LOC: Wells Fargo Bank N.A.) 2,070,000
4,205,000 Green Island Country Club Inc., VRN, 5.18%,
10/4/07 (LOC: Columbus Bank & Trust) 4,205,000
375,000 Lakeshore Crossing Apartments, Ltd., VRN, 5.28%,
10/4/07 (LOC: Wachovia Bank, N.A.) 375,000
5,600,000 Lee Group Inc./County Materials Inc./Lees
Aggregate & Trucking Inc., VRN, 5.24%, 10/4/07
(LOC: FHLB) 5,600,000
10,000,000 MBIA Global Funding LLC, VRN, 4.25%, 10/2/07,
resets weekly off the 3-month T-Bill plus 0.33%
with no caps (Acquired 4/11/07, Cost
$10,000,000)(2) 10,000,000
10,000,000 MBIA Global Funding LLC, VRN, 4.63%, 1/22/08,
resets quarterly off the 3-month T-Bill plus
0.33% with no caps (Acquired 8/30/07, Cost
$10,000,000)(2) 10,000,000
2,400,000 Multimetco Inc., VRN, 5.20%, 10/4/07, resets
monthly off the 1-month LIBOR plus 0.10% with no
caps (LOC: AmSouth Bank) 2,400,000
Principal Amount Value
$ 7,000,000 Natixis, VRN, 4.91%, 10/1/07, resets daily off
the Federal Funds Target Rate plus 0.16% with no
caps $ 7,000,000
1,300,000 Royal Bank of Canada (New York), VRN, 5.07%,
10/31/07, resets monthly off the 1-month T-Bill
minus 0.06% with no caps 1,299,267
6,000,000 Rupert E. Phillips, VRN, 5.13%, 10/4/07 (LOC:
FHLB) 6,000,000
7,500,000 Salvation Army, Series 2003 A, VRN, 5.13%,
10/4/07 (LOC: Bank of New York) 7,500,000
2,000,000 Salvation Army, Series 2004 A, VRN, 5.13%,
10/4/07 (LOC: Bank of New York) 2,000,000
2,400,000 Santa Rosa Property Holding LLC, VRN, 5.18%,
10/4/07 2,400,000
3,710,000 Six Ten Properties LLC, VRN, 5.18%, 10/4/07
(LOC: Columbus Bank & Trust) 3,710,000
3,300,000 St. James United Methodist Church, VRN, 5.15%,
10/4/07 (LOC: Regions Bank) 3,300,000
1,705,000 St. Mary's Congregation, VRN, 5.28%, 10/4/07
(LOC: Marshall & Isley Bank) 1,705,000
9,000,000 Toyota Motor Credit Corp., 5.32%, 6/2/08 9,000,000
5,000,000 Toyota Motor Credit Corp., VRN, 4.24%, 10/2/07,
resets weekly off the 3-month T-Bill plus 0.32%
with no caps 5,000,000
5,000,000 Toyota Motor Credit Corp., VRN, 4.24%, 10/2/07,
resets weekly off the 3-month T-Bill plus 0.32%
with no caps 5,000,000
9,000,000 Travelers Insurance Co. Group, VRN, 5.41%,
11/2/07, resets quarterly off the 3-month LIBOR
plus 0.06% with no caps (Acquired 8/7/03, Cost
$9,000,000)(2) 9,000,000
10,000,000 UBS AG, 5.40%, 11/28/07 10,000,000
--------------
TOTAL CORPORATE BONDS 194,875,568
--------------
Certificates Of Deposit -- 11.0%
10,000,000 ABN AMRO Bank N.V., 5.35%, 1/16/08 10,000,000
20,000,000 Barclays Bank plc (New York), 5.33%, 12/7/07 20,000,000
10,000,000 Barclays Bank plc (New York), 5.35%, 12/17/07 10,000,000
10,000,000 Branch Banking & Trust Co., 5.35%, 4/23/08 10,000,000
- ------
12
Premium Money Market
Principal Amount Value
$15,000,000 Canadian Imperial Bank of Commerce (New York),
5.375%, 10/26/07 $ 14,998,649
15,000,000 Citibank N.A., 5.36%, 11/9/07 15,000,000
10,000,000 Citibank N.A., 5.48%, 11/29/07 10,000,000
10,000,000 Comerica Bank, 5.41%, 11/26/07 10,000,360
Principal Amount Value
$ 2,000,000 Natixis (New York), 5.24%, 5/2/08 $ 1,997,562
15,000,000 Toronto Dominion Bank (New York), 5.70%, 10/12/07 15,000,000
--------------
TOTAL CERTIFICATES OF DEPOSIT 116,996,571
--------------
TOTAL INVESTMENT SECURITIES -- 103.3% 1,102,648,689
--------------
OTHER ASSETS AND LIABILITIES -- (3.3)% (35,413,835)
--------------
TOTAL NET ASSETS -- 100.0% $1,067,234,854
==============
Notes to Schedule of Investments
Ambac = Ambac Assurance Corporation
COP = Certificates of Participation
FHLB = Federal Home Loan Bank
FNMA = Federal National Mortgage Association
GO = General Obligation
LIBOR = London Interbank Offered Rate
LOC = Letter of Credit
MBIA = MBIA Insurance Corporation
RADIAN = Radian Asset Assurance, Inc.
resets = The frequency with which a security's coupon changes, based on
current market conditions or an underlying index. The more frequently a
security resets, the less risk the investor is taking that the coupon will
vary significantly from current market rates.
SBBPA = Standby Bond Purchase Agreement
VRDN = Variable Rate Demand Note. Interest reset date is indicated. Rate shown
is effective September 30, 2007.
VRN = Variable Rate Note. Interest reset date is indicated. Rate shown is
effective September 30, 2007.
XLCA = XL Capital Ltd.
(1) The rate indicated is the yield to maturity at purchase.
(2) Security was purchased under Rule 144A or Section 4(2) of the Securities
Act of 1933 or is a private placement and, unless registered under the Act or
exempted from registration, may only be sold to qualified institutional
investors. The aggregate value of restricted securities at September 30, 2007,
was $476,143,996, which represented 44.6 % of total net assets. Restricted
securities considered illiquid represent 0.8% of total net assets.
See Notes to Financial Statements.
- ------
13
STATEMENT OF ASSETS AND LIABILITIES
SEPTEMBER 30, 2007 (UNAUDITED)
ASSETS
Investment securities, at value (amortized cost and cost for
federal income tax purposes) $1,102,648,689
Cash 8,030,948
Interest receivable 5,361,544
Prepaid portfolio insurance 51,347
--------------
1,116,092,528
--------------
LIABILITIES
Payable for capital shares redeemed 47,619,691
Accrued management fees 385,853
Dividends payable 852,130
--------------
48,857,674
--------------
NET ASSETS $1,067,234,854
==============
INVESTOR CLASS CAPITAL SHARES
Outstanding (unlimited number of shares authorized) 1,067,256,804
==============
NET ASSET VALUE PER SHARE $1.00
==============
NET ASSETS CONSIST OF:
Capital paid in $1,067,250,620
Accumulated net realized loss on investment transactions (15,766)
--------------
$1,067,234,854
==============
See Notes to Financial Statements.
- ------
14
STATEMENT OF OPERATIONS
FOR THE SIX MONTHS ENDED SEPTEMBER 30, 2007 (UNAUDITED)
INVESTMENT INCOME (LOSS)
INCOME:
Interest $27,743,574
------------
EXPENSES:
Management fees 2,301,745
Trustees' fees and expenses 23,624
Portfolio insurance and other expenses 82,696
------------
2,408,065
Amount waived (271,567)
------------
2,136,498
------------
NET INVESTMENT INCOME (LOSS) 25,607,076
------------
NET REALIZED GAIN (LOSS) ON INVESTMENT TRANSACTIONS (10,960)
------------
NET INCREASE (DECREASE) IN NET ASSETS RESULTING FROM OPERATIONS $25,596,116
============
See Notes to Financial Statements.
- ------
15
STATEMENT OF CHANGES IN NET ASSETS
SIX MONTHS ENDED SEPTEMBER 30, 2007 (UNAUDITED) AND YEAR ENDED MARCH 31, 2007
Increase (Decrease) in Net Assets Sept. 30, 2007 March 31, 2007
OPERATIONS
Net investment income (loss) $ 25,607,076 $39,550,030
Net realized gain (loss) (10,960) 164
-------------- --------------
Net increase (decrease) in net assets resulting
from operations 25,596,116 39,550,194
-------------- --------------
DISTRIBUTIONS TO SHAREHOLDERS
From net investment income (25,607,076) (39,550,030)
-------------- --------------
CAPITAL SHARE TRANSACTIONS
Proceeds from shares sold 620,340,625 913,300,007
Proceeds from reinvestment of distributions 19,907,157 31,468,928
Payments for shares redeemed (490,780,378) (668,240,175)
-------------- --------------
Net increase (decrease) in net assets
from capital share transactions 149,467,404 276,528,760
-------------- --------------
NET INCREASE (DECREASE) IN NET ASSETS 149,456,444 276,528,924
NET ASSETS
Beginning of period 917,778,410 641,249,486
-------------- --------------
End of period $1,067,234,854 $917,778,410
============== ==============
TRANSACTIONS IN SHARES OF THE FUND
Sold 620,340,625 913,300,007
Issued in reinvestment of distributions 19,907,157 31,468,928
Redeemed (490,780,378) (668,240,175)
-------------- --------------
Net increase (decrease) in
shares of the fund 149,467,404 276,528,760
============== ==============
See Notes to Financial Statements.
- ------
16
NOTES TO FINANCIAL STATEMENTS
SEPTEMBER 30, 2007 (UNAUDITED)
1. ORGANIZATION AND SUMMARY OF SIGNIFICANT ACCOUNTING POLICIES
ORGANIZATION -- American Century Investment Trust (the trust) is registered
under the Investment Company Act of 1940 (the 1940 Act) as an open-end
management investment company. Premium Money Market Fund (the fund) is one
fund in a series issued by the trust. The fund is diversified under Rule 2a-7
of the 1940 Act. The fund's investment objective is to earn the highest level
of current income while preserving the value of your investment. The fund
invests most of its assets in high-quality, very short-term debt securities
issued by corporations, banks and governments. The following is a summary of
the fund's significant accounting policies.
SECURITY VALUATIONS -- Securities are generally valued at amortized cost,
which approximates current market value. When such valuations do not reflect
market value, securities may be valued as determined in accordance with
procedures adopted by the Board of Trustees.
SECURITY TRANSACTIONS -- For financial reporting, security transactions are
accounted for as of the trade date. Net realized gains and losses are
determined on the identified cost basis, which is also used for federal income
tax purposes.
INVESTMENT INCOME -- Interest income is recorded on the accrual basis and
includes accretion of discounts and amortization of premiums.
REPURCHASE AGREEMENTS -- The fund may enter into repurchase agreements with
institutions that American Century Investment Management, Inc. (ACIM) (the
investment advisor) has determined are creditworthy pursuant to criteria
adopted by the Board of Trustees. Each repurchase agreement is recorded at
cost. The fund requires that the collateral, represented by securities,
received in a repurchase transaction be transferred to the custodian in a
manner sufficient to enable the fund to obtain those securities in the event
of a default under the repurchase agreement. ACIM monitors, on a daily basis,
the securities transferred to ensure the value, including accrued interest, of
the securities under each repurchase agreement is equal to or greater than
amounts owed to the fund under each repurchase agreement.
JOINT TRADING ACCOUNT -- Pursuant to an Exemptive Order issued by the
Securities and Exchange Commission, the fund, along with other registered
investment companies having management agreements with ACIM or American
Century Global Investment Management, Inc. (ACGIM), may transfer uninvested
cash balances into a joint trading account. These balances are invested in one
or more repurchase agreements that are collateralized by U.S. Treasury or
Agency obligations.
WHEN-ISSUED AND FORWARD COMMITMENTS -- The fund may engage in securities
transactions on a when-issued or forward commitment basis. Under these
arrangements, the securities' prices and yields are fixed on the date of the
commitment, but payment and delivery are scheduled for a future date. During
this period, securities are subject to market fluctuations. The fund will
segregate cash, cash equivalents or other appropriate liquid securities on its
records in amounts sufficient to meet the purchase price.
INCOME TAX STATUS -- It is the fund's policy to distribute substantially all
net investment income and net realized gains to shareholders and to otherwise
qualify as a regulated investment company under provisions of the Internal
Revenue Code. The fund is no longer subject to examination by tax authorities
for years prior to 2004. At this time, management has not identified any
uncertain tax positions that would materially impact the financial statements.
Accordingly, no provision has been made for federal or state income taxes.
Interest and penalties associated with any federal or state income tax
obligations, if any, are recorded as interest expense.
DISTRIBUTIONS TO SHAREHOLDERS -- Distributions from net investment income and
short-term capital gains, if any, are declared daily and paid monthly. The
fund does not expect to realize any long-term capital gains, and accordingly,
does not expect to pay any capital gains distributions.
INDEMNIFICATIONS -- Under the trust's organizational documents, its officers
and trustees are indemnified against certain liabilities arising out of the
performance of their duties to the fund. In addition, in the normal course of
business, the fund enters into contracts that provide general
indemnifications. The fund's maximum exposure under these arrangements is
unknown as this would involve future claims that may be made against the fund.
The risk of material loss from such claims is considered by management to be
remote.
USE OF ESTIMATES -- The financial statements are prepared in conformity with
accounting principles generally accepted in the United States of America,
which may require management to make certain estimates and assumptions at the
date of the financial statements. Actual results could differ from these
estimates.
- ------
17
2. FEES AND TRANSACTIONS WITH RELATED PARTIES
MANAGEMENT FEES -- The trust has entered into a Management Agreement with
ACIM, under which ACIM provides the fund with investment advisory and
management services in exchange for a single, unified management fee (the
fee). The Agreement provides that all expenses of the fund, except brokerage
commissions, taxes, portfolio insurance, interest, fees and expenses of those
trustees who are not considered "interested persons" as defined in the 1940
Act (including counsel fees) and extraordinary expenses, will be paid by ACIM.
The fee is computed and accrued daily based on the daily net assets of the
specific class of shares of the fund and paid monthly in arrears. The fee
consists of (1) an Investment Category Fee based on the daily net assets of
the fund and certain other accounts managed by the investment manager that are
in the same broad investment category as the fund and (2) a Complex Fee based
on the assets of all the funds in the American Century family of funds. The
rates for the Investment Category Fee range from 0.1170% to 0.2300% and the
rates for the Complex Fee range from 0.2500% to 0.3100%. From August 1, 2006
to July 31, 2007, the investment advisor voluntarily agreed to waive 0.071% of
its management fee. Effective August 1, 2007, the investment advisor
voluntarily agreed to waive 0.020% of its management fee. This fee waiver may
be revised or terminated any time without notice. The effective annual
management fee before waiver for the fund for the six months ended September
30, 2007 was 0.45%. The effective annual management fee after waiver for the
fund for the six months ended September 30, 2007, was 0.40%.
MONEY MARKET INSURANCE -- The fund, along with other money market funds
managed by ACIM, has entered into an insurance agreement with Ambac Assurance
Corporation (Ambac). Ambac provides limited coverage for certain loss events
including issuer defaults as to payment of principal or interest and
insolvency of a credit enhancement provider. The fund pays annual premiums to
Ambac, which are amortized daily over one year. For the six months ended
September 30, 2007, the annualized ratio of money market insurance expense to
average net assets was 0.02%.
RELATED PARTIES -- Certain officers and trustees of the trust are also
officers and/or directors, and, as a group, controlling stockholders of
American Century Companies, Inc. (ACC), the parent of the trust's investment
advisor, ACIM, the distributor of the trust, American Century Investment
Services, Inc., and the trust's transfer agent, American Century Services,
LLC.
JPMorgan Chase Bank is a custodian of the fund and a wholly owned subsidiary
of JPMorgan Chase & Co. (JPM). JPM is an equity investor in ACC.
3. FEDERAL TAX INFORMATION
The book-basis character of distributions made during the year from net
investment income or net realized gains may differ from their ultimate
characterization for federal income tax purposes. These differences reflect
the differing character of certain income items and net realized gains and
losses for financial statement and tax purposes, and may result in
reclassification among certain capital accounts on the financial statements.
As of March 31, 2007, the fund had accumulated net realized capital loss
carryovers for federal income tax purposes of $(4,495), which may be used to
offset future taxable realized gains. Capital loss carryovers of $(446),
$(885) and $(3,164) expire in 2013, 2014 and 2015, respectively.
Capital loss deferrals of $(311) represent net capital losses incurred in the
five-month period ended March 31, 2007. The fund has elected to treat such
losses as having been incurred in the following fiscal year for federal income
tax purposes.
4. RECENTLY ISSUED ACCOUNTING STANDARDS
In June 2006, the Financial Accounting Standards Board (FASB) issued
Interpretation No. 48, "Accounting for Uncertainty in Income Taxes -- an
Interpretation of FASB Statement No. 109" (FIN 48). FIN 48 establishes a
minimum threshold for financial statement recognition of the benefit of
positions taken in filing tax returns (including whether an entity is taxable
in a particular jurisdiction), and requires certain expanded tax disclosures.
FIN 48 is effective for fiscal years beginning after December 15, 2006, and is
to be applied to all open tax years as of the date of effectiveness.
Management has concluded that the adoption of FIN 48 will not materially
impact the financial statements.
The FASB issued Statement of Financial Accounting Standards No. 157, "Fair
Value Measurements" (FAS 157), in September 2006, which is effective for
fiscal years beginning after November 15, 2007. FAS 157 defines fair value,
establishes a framework for measuring fair value and expands the required
financial statement disclosures about fair value measurements. Management is
currently evaluating the impact that adopting FAS 157 will have on the
financial statement disclosures.
- ------
18
FINANCIAL HIGHLIGHTS
Premium Money Market
For a Share Outstanding Throughout the Years Ended March 31 (except as noted)
2007(1) 2007 2006 2005 2004 2003
PER-SHARE DATA
Net Asset
Value,
Beginning
of Period $1.00 $1.00 $1.00 $1.00 $1.00 $1.00
-------- -------- -------- -------- -------- --------
Income From Investment Operations
Net
Investment
Income
(Loss) 0.03 0.05 0.03 0.01 0.01 0.01
-------- -------- -------- -------- -------- --------
Distributions
From Net
Investment
Income (0.03) (0.05) (0.03) (0.01) (0.01) (0.01)
-------- -------- -------- -------- -------- --------
Net Asset
Value, End
of Period $1.00 $1.00 $1.00 $1.00 $1.00 $1.00
======== ======== ======== ======== ======== ========
TOTAL
RETURN(2) 2.53% 4.98% 3.41% 1.33% 0.74% 1.32%
RATIOS/SUPPLEMENTAL DATA
Ratio of
Operating
Expenses
to Average
Net Assets 0.42%(3)(4) 0.41%(3) 0.45%(3) 0.48% 0.47% 0.47%
Ratio of
Operating
Expenses
to Average
Net Assets
(Before
Expense
Waiver) 0.47%(4) 0.47% 0.47% 0.48% 0.47% 0.47%
Ratio of
Net
Investment
Income
(Loss) to
Average
Net Assets 5.01%(3)(4) 4.89%(3) 3.41%(3) 1.31% 0.73% 1.32%
Ratio of
Net
Investment
Income
(Loss) to
Average
Net Assets
(Before
Expense
Waiver) 4.96%(4) 4.83% 3.39% 1.31% 0.73% 1.32%
Net
Assets,
End of
Period (in
thousands) $1,067,235 $917,778 $641,249 $472,954 $479,341 $560,991
(1) Six months ended September 30, 2007 (unaudited).
(2) Total return assumes reinvestment of net investment income and capital
gains distributions, if any. Total returns for periods less than one year are
not annualized.
(3) Effective July 29, 2005, the investment advisor voluntarily agreed to
waive a portion of its management fee.
(4) Annualized.
See Notes to Financial Statements.
- ------
19
PROXY VOTING RESULTS
A special meeting of shareholders was held on July 27, 2007, to vote on the
following proposal. The proposal received the required number of votes of the
American Century Investment Trust and was adopted. A summary of voting results
is listed below the proposal.
PROPOSAL:
To elect eight Trustees to the Board of Trustees of American Century
Investment Trust (the proposal was voted on by all shareholders of funds
issued by American Century Investment Trust).
Jonathan S. Thomas For: 3,336,300,729
Withhold: 35,929,005
Abstain: 0
Broker Non-Vote: 0
John Freidenrich For: 3,337,319,127
Withhold: 34,910,607
Abstain: 0
Broker Non-Vote: 0
Ronald J. Gilson For: 3,337,806,752
Withhold: 34,422,982
Abstain: 0
Broker Non-Vote: 0
Kathryn A. Hall For: 3,337,653,997
Withhold: 34,575,737
Abstain: 0
Broker Non-Vote: 0
Peter F. Pervere For: 3,336,793,063
Withhold: 35,436,671
Abstain: 0
Broker Non-Vote: 0
Myron S. Scholes For: 3,335,709,158
Withhold: 36,520,576
Abstain: 0
Broker Non-Vote: 0
John B. Shoven For: 3,337,333,277
Withhold: 34,896,457
Abstain: 0
Broker Non-Vote: 0
Jeanne D. Wohlers For: 3,336,368,531
Withhold: 35,861,203
Abstain: 0
Broker Non-Vote: 0
- ------
20
APPROVAL OF MANAGEMENT AGREEMENT
Premium Money Market
Under Section 15(c) of the Investment Company Act, contracts for investment
advisory services are required to be reviewed, evaluated and approved by a
majority of a fund's independent directors or trustees (the "Directors") each
year. At American Century, this process is referred to as the "15(c) Process."
As a part of this process, the board reviews fund performance, shareholder
services, audit and compliance information, and a variety of other reports
from the advisor concerning fund operations. In addition to this annual
review, the board of directors oversees and evaluates on a continuous basis at
its quarterly meetings the nature and quality of significant services
performed by the advisor, fund performance, audit and compliance information,
and a variety of other reports relating to fund operations. The board, or
committees of the board, also holds special meetings as needed.
Under a Securities and Exchange Commission rule, each fund is required to
disclose in its annual or semiannual report, as appropriate, the material
factors and conclusions that formed the basis for the board's approval or
renewal of any advisory agreements within the fund's most recently completed
fiscal half-year period.
ANNUAL CONTRACT REVIEW PROCESS
As part of the annual 15(c) Process undertaken during the most recent fiscal
half-year period, the Directors reviewed extensive data and information
compiled by the advisor and certain independent providers of evaluative data
(the "15(c) Providers") concerning Premium Money Market (the "fund") and the
services provided to the fund under the management agreement. The information
considered and the discussions held at the meetings included, but were not
limited to:
* the nature, extent and quality of investment management, shareholder
services and other services provided to the fund under the management
agreement;
* reports on the advisor's activities relating to the wide range of programs
and services the advisor provides to the fund and its shareholders on a
routine and non-routine basis;
* data comparing the cost of owning the fund to the cost of owning a similar
fund;
* data comparing the fund's performance to appropriate benchmarks and/or a
peer group of other mutual funds with similar investment objectives and
strategies;
* financial data showing the profitability of the fund to the advisor and the
overall profitability of the advisor; and
* data comparing services provided and charges to other investment management
clients of the advisor.
In keeping with its practice, the fund's board of directors held two regularly
scheduled meetings to review and discuss the information provided by the
advisor and to complete its negotiations with the advisor regarding the
renewal of the management agreement, including the setting of the applicable
advisory fee. The board also had the benefit of the advice of its independent
counsel throughout the period.
- ------
21
FACTORS CONSIDERED
The Directors considered all of the information provided by the advisor, the
15(c) Providers, and the board's independent counsel, and evaluated such
information for each fund for which the board has responsibility. The
Directors did not identify any single factor as being all-important or
controlling, and each Director may have attributed different levels of
importance to different factors. In deciding to renew the agreement under the
terms ultimately determined by the board to be appropriate, the Directors'
decision was based on the following factors.
NATURE, EXTENT AND QUALITY OF SERVICES -- GENERALLY. Under the management
agreement, the advisor is responsible for providing or arranging for all
services necessary for the operation of the fund. The board noted that under
the management agreement, the advisor provides or arranges at its own expense
a wide variety of services including:
* fund construction and design
* portfolio security selection
* initial capitalization/funding
* securities trading
* custody of fund assets
* daily valuation of the fund's portfolio
* shareholder servicing and transfer agency, including shareholder
confirmations, recordkeeping and communications
* legal services
* regulatory and portfolio compliance
* financial reporting
* marketing and distribution
The Directors noted that many of these services have expanded over time both
in terms of quantity and complexity in response to shareholder demands,
competition in the industry and the changing regulatory environment. In
performing their evaluation, the Directors considered information received in
connection with the annual review, as well as information provided on an
ongoing basis at their regularly scheduled board and committee meetings.
INVESTMENT MANAGEMENT SERVICES. The nature of the investment management
services provided is quite complex and allows fund shareholders access to
professional money management, instant diversification of their investments
within an asset class, the opportunity to easily diversify among asset
classes, and liquidity. In evaluating investment performance, the board
expects the advisor to manage the fund in accordance with its investment
objectives and approved strategies. In providing these services, the advisor
utilizes teams of investment professionals (portfolio managers, analysts,
research assistants, and securities traders) who require extensive information
technology, research, training, compliance and other systems to conduct their
business.
- ------
22
At each quarterly meeting the Directors review investment performance
information for the fund, together with comparative information for
appropriate benchmarks and peer groups of funds managed similarly to the fund.
The Directors also review detailed performance information during the 15(c)
Process. If performance concerns are identified, the Directors discuss with
the advisor the reasons for such results (e.g., market conditions, security
selection) and any efforts being undertaken to improve performance. The fund's
performance for both the one- and three-year periods was above the median for
its peer group.
SHAREHOLDER AND OTHER SERVICES. The advisor provides the fund with a
comprehensive package of transfer agency, shareholder, and other services. The
Directors review reports and evaluations of such services at their regular
quarterly meetings, including the annual meeting concerning contract review,
and reports to the board. These reports include, but are not limited to,
information regarding the operational efficiency and accuracy of the
shareholder and transfer agency services provided, staffing levels,
shareholder satisfaction (as measured by external as well as internal
sources), technology support, new products and services offered to fund
shareholders, securities trading activities, portfolio valuation services,
auditing services, and legal and operational compliance activities. Certain
aspects of shareholder and transfer agency service level efficiency and the
quality of securities trading activities are measured by independent third
party providers and are presented in comparison to other fund groups not
managed by the advisor.
COSTS OF SERVICES PROVIDED AND PROFITABILITY TO THE ADVISOR. The advisor
provides detailed information concerning its cost of providing various
services to the fund, its profitability in managing the fund, its overall
profitability, and its financial condition. The Directors have reviewed with
the advisor the methodology used to prepare this financial information. This
financial information regarding the advisor is considered in order to evaluate
the advisor's financial condition, its ability to continue to provide services
under the management agreement, and the reasonableness of the current
management fee.
ETHICS OF THE ADVISOR. The Directors generally consider the advisor's
commitment to providing quality services to shareholders and to conducting its
business ethically. They noted that the advisor's practices generally meet or
exceed industry best practices.
ECONOMIES OF SCALE. The Directors review reports provided by the advisor on
economies of scale for the complex as a whole and the year-over-year changes
in revenue, costs, and profitability. The Directors concluded that economies
of scale are difficult to measure and predict with precision, especially on a
fund-by-fund basis. This analysis is also complicated by the additional
services and content provided by the advisor and its reinvestment in its
ability to provide and expand those services. Accordingly, the Directors also
seek to evaluate economies of scale by reviewing other information, such as
year-over-year profitability of the advisor generally, the profitability of
its management of the fund specifically, the expenses incurred by the advisor
in providing various functions to the fund, and the breakpoint fees of
competitive funds not managed by the advisor. The Directors believe the
advisor is appropriately sharing economies of scale through its competitive
fee structure, fee breakpoints as the fund complex and the fund increases in
size, and through reinvestment in its business to provide shareholders
additional content and services. In particular, separate breakpoint schedules
based on the size of the entire fund complex and on the size of the fund
reflect the complexity of assessing economies of scale.
- ------
23
COMPARISON TO OTHER FUNDS' FEES. The fund pays the advisor a single,
all-inclusive (or unified) management fee for providing all services necessary
for the management and operation of the fund, other than brokerage expenses,
taxes, interest, extraordinary expenses, and the fees and expenses of the
fund's independent directors (including their independent legal counsel).
Under the unified fee structure, the advisor is responsible for providing all
investment advisory, custody, audit, administrative, compliance,
recordkeeping, marketing and shareholder services, or arranging and
supervising third parties to provide such services. By contrast, most other
funds are charged a variety of fees, including an investment advisory fee, a
transfer agency fee, an administrative fee, distribution charges and other
expenses. Other than their investment advisory fees and Rule 12b-1
distribution fees, all other components of the total fees charged by these
other funds may be increased without shareholder approval. The board believes
the unified fee structure is a benefit to fund shareholders because it clearly
discloses to shareholders the cost of owning fund shares, and, since the
unified fee cannot be increased without a vote of fund shareholders, it shifts
to the advisor the risk of increased costs of operating the fund and provides
a direct incentive to minimize administrative inefficiencies. Part of the
Directors' analysis of fee levels involves reviewing certain evaluative data
compiled by an independent provider and comparing the fund's unified fee to
the total expense ratio of other funds in the fund's peer group. The unified
fee charged to shareholders of the fund was slightly below the median of the
total expense ratios of its peer group.
COMPARISON TO FEES AND SERVICES PROVIDED TO OTHER CLIENTS OF THE ADVISOR. The
Directors also requested and received information from the advisor concerning
the nature of the services, fees, and profitability of its advisory services
to advisory clients other than the fund. They observed that these varying
types of client accounts require different services and involve different
regulatory and entrepreneurial risks than the management of the fund. The
Directors analyzed this information and concluded that the fees charged and
services provided to the fund were reasonable by comparison.
COLLATERAL BENEFITS DERIVED BY THE ADVISOR. The Directors reviewed information
from the advisor concerning collateral benefits it receives as a result of its
relationship with the fund. They concluded that the advisor's primary business
is managing mutual funds and it generally does not use fund or shareholder
information to generate profits in other lines of business, and therefore does
not derive any significant collateral benefits from them. The Directors noted
that the advisor receives proprietary research from broker-dealers that
execute fund portfolio transactions and concluded that this research is likely
to benefit fund shareholders. The Directors also determined that the advisor
is able to provide investment management services to certain clients other
than the fund, at least in part, due to its existing infrastructure built to
serve the fund complex. The Directors concluded, however, that the assets of
those other clients are not material to the analysis and, in any event, are
included with the assets of the fund to determine breakpoints in the fund's
fee schedule, provided they are managed using the same investment team and
strategy.
- ------
24
CONCLUSIONS OF THE DIRECTORS
As a result of this process, the Directors negotiated a one-year waiver by the
advisor of a portion of the management fee. These changes were proposed by the
Directors based on their review of the fund's percentile rank in its peer
group universe and the fact that the Directors seek as a general rule to have
total expense ratios of fixed income and money market funds in the lowest 25th
percentile of the fees of comparable funds. The advisor accepted the principle
of the fee waiver based on the fact that the lower fee will result in
increased competitiveness of the fund within its peer group universe. The fee
waiver, effective August 1, 2007, will result in a lowering of the management
fee of the fund by 0.02 percentage points below the current management fee.
Following these negotiations with the advisor, the Directors concluded that
the investment management agreement between the fund and the advisor is fair
and reasonable in light of the services provided and should be renewed.
- ------
25
ADDITIONAL INFORMATION
RETIREMENT ACCOUNT INFORMATION
As required by law, any distributions you receive from an IRA or certain
403(b), 457 and qualified plans [those not eligible for rollover to an IRA or
to another qualified plan] are subject to federal income tax withholding,
unless you elect not to have withholding apply. Tax will be withheld on the
total amount withdrawn even though you may be receiving amounts that are not
subject to withholding, such as nondeductible contributions. In such case,
excess amounts of withholding could occur. You may adjust your withholding
election so that a greater or lesser amount will be withheld.
If you don't want us to withhold on this amount, you must notify us to not
withhold the federal income tax. Even if you plan to roll over the amount you
withdraw to another tax-deferred account, the withholding rate still applies
to the withdrawn amount unless we have received notice not to withhold federal
income tax prior to the withdrawal. You may notify us in writing or in certain
situations by telephone or through other electronic means. You have the right
to revoke your withholding election at any time and any election you make may
remain in effect until revoked by filing a new election.
Remember, even if you elect not to have income tax withheld, you are liable
for paying income tax on the taxable portion of your withdrawal. If you elect
not to have income tax withheld or you don't have enough income tax withheld,
you may be responsible for payment of estimated tax. You may incur penalties
under the estimated tax rules if your withholding and estimated tax payments
are not sufficient.
State tax will be withheld if, at the time of your distribution, your address
is within one of the mandatory withholding states and you have federal income
tax withheld. State taxes will be withheld from your distribution in
accordance with the respective state rules.
PROXY VOTING GUIDELINES
American Century Investment Management, Inc., the fund's investment advisor,
is responsible for exercising the voting rights associated with the securities
purchased and/or held by the fund. A description of the policies and
procedures the advisor uses in fulfilling this responsibility is available
without charge, upon request, by calling 1-800-345-2021. It is also available
on American Century's website at americancentury.com and on the Securities and
Exchange Commission's website at sec.gov. Information regarding how the
investment advisor voted proxies relating to portfolio securities during the
most recent 12-month period ended June 30 is available on the "About Us" page
at americancentury.com. It is also available at sec.gov.
QUARTERLY PORTFOLIO DISCLOSURE
The fund files its complete schedule of portfolio holdings with the Securities
and Exchange Commission (SEC) for the first and third quarters of each fiscal
year on Form N-Q. The fund's Form N-Q is available on the SEC's website at
sec.gov, and may be reviewed and copied at the SEC's Public Reference Room in
Washington, DC. Information on the operation of the Public Reference Room may
be obtained by calling 1-800-SEC-0330. The fund also makes its complete
schedule of portfolio holdings for the most recent quarter of its fiscal year
available on its website at americancentury.com and, upon request, by calling
1-800-345-2021.
- ------
26
INDEX DEFINITIONS
The following indices are used to illustrate investment market, sector, or
style performance or to serve as fund performance comparisons. They are not
investment products available for purchase.
The 90-DAY U.S. TREASURY BILL INDEX is derived from secondary market interest
rates as published by the Federal Reserve Bank and includes three-month,
six-month, and one-year instruments.
The CITIGROUP AGENCY INDEX is a market-capitalization-weighted index that
includes U.S. government sponsored agencies with a remaining maturity of at
least one year.
The CITIGROUP CREDIT INDEX includes US and non-US corporate securities and
non-US sovereign and provincial securities.
The CITIGROUP MORTGAGE INDEX measures the mortgage component of the US BIG
Index, comprising 30-and 15-year GNMA, FNMA, and FHLMC pass-throughs and FNMA
and FHLMC balloon mortgages.
The CITIGROUP TREASURY INDEX is comprised of U.S. Treasury securities with an
amount outstanding of at least $5 billion and a remaining maturity of at least
one year.
The CITIGROUP US BROAD INVESTMENT-GRADE (BIG) BOND INDEX is a market-
capitalization-weighted index that includes fixed-rate Treasury, government-
sponsored, mortgage, asset-backed, and investment-grade issues with a maturity
of one year or longer.
The CITIGROUP US HIGH-YIELD MARKET INDEX captures the performance of
below-investment-grade debt issued by corporations domiciled in the United
States or Canada. This index includes cash-pay and deferred-interest
securities that are publicly placed, have a fixed coupon, and are
nonconvertible.
The CITIGROUP US INFLATION-LINKED SECURITIES INDEX (ILSI) measures the return
of bonds with fixed-rate coupon payments that adjust for inflation as measured
by the Consumer Price Index (CPI).
- ------
27
NOTES
- ------
28
[back cover]
CONTACT US
AMERICANCENTURY.COM
AUTOMATED INFORMATION LINE:
1-800-345-8765
INVESTOR SERVICES REPRESENTATIVE:
1-800-345-2021 or 816-531-5575
BUSINESS, NOT-FOR-PROFIT,
EMPLOYER-SPONSORED RETIREMENT PLANS:
1-800-345-3533
BANKS AND TRUST COMPANIES, BROKER-DEALERS,
FINANCIAL PROFESSIONALS, INSURANCE COMPANIES:
1-800-345-6488
TELECOMMUNICATIONS DEVICE FOR THE DEAF:
1-800-634-4113 or 816-444-3485
AMERICAN CENTURY INVESTMENT TRUST
INVESTMENT ADVISOR:
American Century Investment Management, Inc.
Kansas City, Missouri
THIS REPORT AND THE STATEMENTS IT CONTAINS ARE SUBMITTED FOR THE GENERAL
INFORMATION OF OUR SHAREHOLDERS. THE REPORT IS NOT AUTHORIZED FOR DISTRIBUTION
TO PROSPECTIVE INVESTORS UNLESS PRECEDED OR ACCOMPANIED BY AN EFFECTIVE
PROSPECTUS.
American Century Investment Services, Inc., Distributor
©2007 American Century Proprietary Holdings, Inc. All rights reserved.
The American Century Investments logo, American Century and American Century
Investments are service marks of American Century Proprietary Holdings, Inc.
0711
SH-SAN-56803N
[front cover]
AMERICAN CENTURY INVESTMENTS
Semiannual Report September 30, 2007
[photo of fall]
Inflation Protection Bond Fund
[american century investments logo and text logo]
OUR MESSAGE TO YOU
To help you monitor your investment, my colleagues and I take pride in
providing you with the semiannual report for the American Century® Inflation
Protection Bond Fund for the six months ended September 30, 2007. This has
been an eventful and exciting period for us. We've been working diligently to
secure a smooth executive leadership transition.
I'm honored to be addressing you in the "Our Message" space long devoted to
company founder Jim Stowers, Jr. and his son Jim Stowers III. The Stowers
family remains an integral part of our heritage, leadership, and financial
structure. Jim Jr. continues as co-chair of the American Century Companies,
Inc. (ACC) board of directors with Richard Brown, who has been on the board
since 1998 and co-chairs the Stowers Institute for Medical Research board.
But times and opportunities change. As the latest step in a career transition
that began when he relinquished his executive leadership and investment
management responsibilities in early 2005, Jim III stepped down from the ACC
board in July 2007 to focus on new business ventures. Jim III's move reflects
his family's comfort with our direction and leadership, and gives the Stowers
more leeway to devote time and energy to other important priorities, such as
the Stowers Institute for Medical Research.
Meanwhile, American Century Investments, our clients, and our employees have
been my top priority since I became company president and CEO in March. We've
also added the executive talents of overall chief investment officer Enrique
Chang, international equity CIO Mark On, U.S. growth equity CIO Steve Lurito,
and chief operating officer Barry Fink.
This skilled group, combined with our existing senior management team, has
already had a positive impact on the development and management of the
products and services we take pride in delivering to you.
/s/Jonathan Thomas
Jonathan Thomas
[photo of Jonathan Thomas]
Jonathan Thomas
PRESIDENT
AMERICAN CENTURY COMPANIES, INC.
[photo of James E. Stowers, Jr.]
James E. Stowers, Jr.
FOUNDER AND
CO-CHAIRMAN OF THE BOARD
AMERICAN CENTURY COMPANIES, INC.
[photo of Richard Brown]
Richard Brown
CO-CHAIRMAN OF THE BOARD
AMERICAN CENTURY COMPANIES, INC.
TABLE OF CONTENTS
Market Perspective. . . . . . . . . . . . . . . . . . . . . . . . . . 2
U.S. Fixed-Income Total Returns. . . . . . . . . . . . . . . . . . . 2
INFLATION PROTECTION BOND
Performance . . . . . . . . . . . . . . . . . . . . . . . . . . . . . 3
Portfolio Commentary. . . . . . . . . . . . . . . . . . . . . . . . . 5
Portfolio at a Glance. . . . . . . . . . . . . . . . . . . . . . . . 5
Yields . . . . . . . . . . . . . . . . . . . . . . . . . . . . . . . 6
Portfolio Composition by Effective Maturity. . . . . . . . . . . . . 6
Shareholder Fee Example . . . . . . . . . . . . . . . . . . . . . . . 7
Schedule of Investments . . . . . . . . . . . . . . . . . . . . . . . 9
FINANCIAL STATEMENTS
Statement of Assets and Liabilities . . . . . . . . . . . . . . . . . 11
Statement of Operations . . . . . . . . . . . . . . . . . . . . . . . 13
Statement of Changes in Net Assets. . . . . . . . . . . . . . . . . . 14
Notes to Financial Statements . . . . . . . . . . . . . . . . . . . . 15
Financial Highlights. . . . . . . . . . . . . . . . . . . . . . . . . 20
OTHER INFORMATION
Proxy Voting Results. . . . . . . . . . . . . . . . . . . . . . . . . 26
Approval of Management Agreement for Inflation Protection Bond. . . . 27
Share Class Information . . . . . . . . . . . . . . . . . . . . . . . 31
Additional Information. . . . . . . . . . . . . . . . . . . . . . . . 33
Index Definitions . . . . . . . . . . . . . . . . . . . . . . . . . . 34
The opinions expressed in the Market Perspective and the Portfolio Commentary
reflect those of the portfolio management team as of the date of the report,
and do not necessarily represent the opinions of American Century or any other
person in the American Century organization. Any such opinions are subject to
change at any time based upon market or other conditions and American Century
disclaims any responsibility to update such opinions. These opinions may not
be relied upon as investment advice and, because investment decisions made by
American Century funds are based on numerous factors, may not be relied upon
as an indication of trading intent on behalf of any American Century fund.
Security examples are used for representational purposes only and are not
intended as recommendations to purchase or sell securities. Performance
information for comparative indices and securities is provided to American
Century by third party vendors. To the best of American Century's knowledge,
such information is accurate at the time of printing.
MARKET PERSPECTIVE
[photo of chief investment officer]
By David MacEwen, Chief Investment Officer, Fixed Income
MODEST GROWTH, INFLATION, BOND RETURNS
U.S. bonds managed positive returns during the six months ended September 30,
2007. But the ride was bumpy -- bond market volatility surged to the highest
level in years as waves from the bursting housing and subprime mortgage
bubbles spread to the broader economy and financial markets.
U.S. economic growth was moderate over the last four complete calendar
quarters, running at an approximately 2-3% average annual rate. Many
economists are calling for sub-2% growth going forward. Inflation slowed, as
the trailing 12-month percentage change in core consumer prices (without
volatile food and energy prices) finished September at 2.1%. That's down from
2.9% as recently as September 2006.
To help alleviate some of the market and economic concerns, the Federal
Reserve (the Fed) lowered its benchmark federal funds rate target in
September. This came on top of cuts to its discount rate in both August and
September -- the Fed's first rate cuts since June 2003.
RATES FELL, CURVE STEEPENED
Against that backdrop, Treasury yields generally declined. The yield on the
two-year Treasury note fell from 4.58% to 3.99%; however, yields on
longer-term notes and bonds fell less. That's because investors worried about
the potential long-term inflation effects of Fed rate cuts, high energy and
commodity prices, and a weaker dollar. As a result, the yield curve (a graphic
representation of bond yields at different maturities) fell and steepened --
the difference in yield between two- and 10-year Treasury securities increased
sharply from seven to 60 basis points (a basis point equals 0.01%).
HIGH-QUALITY BONDS DID BEST
The volatility, credit, and liquidity concerns in the market all favored
Treasury securities over higher-yielding, lower-quality alternatives (see the
returns table above). So, for example, while the Treasury market enjoyed its
best quarter in five years from July to September, July was one of the worst
months on record for high-yield bonds. Treasury inflation-indexed securities
performed best because of their combination of high credit quality and
inflation protection.
U.S. Fixed-Income Total Returns
For the six months ended September 30, 2007*
TREASURY SECURITIES
3-Month Bill 2.69%
2-Year Note 3.25%
5-Year Note 3.60%
10-Year Note 2.72%
30-Year Bond 2.57%
CITIGROUP US BOND MARKET INDICES
High-Yield (corporate) 0.65%
Credit (investment-grade corporate) 1.50%
Mortgage 2.16%
Broad Investment-Grade (multi-sector) 2.42%
Agency 3.04%
Treasury 3.38%
Inflation-Linked Securities 3.76%
*Total returns for periods less than one year are not annualized.
- ------
2
PERFORMANCE
Inflation Protection Bond
Total Returns as of September 30, 2007
Average Annual
Returns
Since Inception
6 months(1) 1 year Inception Date
INVESTOR CLASS 3.44% 4.21% 2.44% 5/31/05
CITIGROUP US INFLATION-LINKED
SECURITIES INDEX(2) 3.76% 4.91% 3.07% --
Institutional Class 3.66% 4.56% 2.74% 5/31/05
A Class
No sales charge* 3.31% 3.95% 2.18%
With sales charge* -1.35% -0.75% 0.19% 5/31/05
B Class
No sales charge* 2.93% 3.18% 1.44%
With sales charge* -2.07% -0.82% 0.17% 5/31/05
C Class
No sales charge* 2.93% 3.29% 1.45%
With sales charge* 1.93% 3.29% 1.45% 5/31/05
R Class 3.21% 3.74% 1.99% 5/31/05
* Sales charges include initial sales charges and contingent deferred sales
charges (CDSCs), as applicable. A Class shares have a 4.50% maximum initial
sales charge for fixed income funds and may be subject to a maximum CDSC of
1.00%. B Class shares redeemed within six years of purchase are subject to a
CDSC that declines from 5.00% during the first year after purchase to 0.00%
the sixth year after purchase. C Class shares redeemed within 12 months of
purchase are subject to a maximum CDSC of 1.00%. Please see the Share Class
Information pages for more about the applicable sales charges for each share
class. The SEC requires that mutual funds provide performance information net
of maximum sales charges in all cases where charges could be applied.
(1) Total returns for periods less than one year are not annualized.
(2) The Citigroup US Inflation-Linked Securities Index is not subject to the
tax code diversification and other regulatory requirements limiting the type
and amount of securities that the fund may own.
Data presented reflect past performance. Past performance is no guarantee of
future results. Current performance may be higher or lower than the
performance shown. Investment return and principal value will fluctuate, and
redemption value may be more or less than original cost. To obtain performance
data current to the most recent month end, please call 1-800-345-2021 or visit
americancentury.com. As interest rates rise, bond values will decline.
Unless otherwise indicated, performance reflects Investor Class shares;
performance for other share classes will vary due to differences in fee
structure. For information about other share classes available, please consult
the prospectus. Data assumes reinvestment of dividends and capital gains, and
none of the charts reflect the deduction of taxes that a shareholder would pay
on fund distributions or the redemption of fund shares. Returns for the index
are provided for comparison. The fund's total returns include operating
expenses (such as transaction costs and management fees) that reduce returns,
while the total returns of the index do not.
- ------
3
Inflation Protection Bond
Growth of $10,000 Over Life of Class
$10,000 investment made May 31, 2005

One-Year Returns Over Life of Class
Periods ended September 30
2005* 2006 2007
Investor Class 0.08% 1.43% 4.21%
Citigroup US Inflation-Linked Securities Index 0.39% 1.88% 4.91%
*From 5/31/05 (fund inception) to 9/30/05. Not annualized.
Data presented reflect past performance. Past performance is no guarantee of
future results. Current performance may be higher or lower than the
performance shown. Investment return and principal value will fluctuate, and
redemption value may be more or less than original cost. To obtain performance
data current to the most recent month end, please call 1-800-345-2021 or visit
americancentury.com. As interest rates rise, bond values will decline.
Unless otherwise indicated, performance reflects Investor Class shares;
performance for other share classes will vary due to differences in fee
structure. For information about other share classes available, please consult
the prospectus. Data assumes reinvestment of dividends and capital gains, and
none of the charts reflect the deduction of taxes that a shareholder would pay
on fund distributions or the redemption of fund shares. Returns for the index
are provided for comparison. The fund's total returns include operating
expenses (such as transaction costs and management fees) that reduce returns,
while the total returns of the index do not.
- ------
4
PORTFOLIO COMMENTARY
Inflation Protection Bond
Lead Portfolio Managers: Brian Howell, Jim Platz, Seth Plunkett, and Bob
Gahagan
Macro Strategy Team Representatives: Brian Howell and Bob Gahagan
PERFORMANCE SUMMARY
Inflation Protection Bond returned 3.44%* for the six months ended September
30, 2007. By comparison, the fund's benchmark, the Citigroup US
Inflation-Linked Securities Index, returned 3.76%. It's worth noting that the
fund's returns are reduced by operating expenses, while the index's are not.
The portfolio's absolute return reflected the solid performance of
inflation-indexed securities in an otherwise challenging environment for bonds
prevailing in recent months (see the Market Perspective on page 2). Relative
to the benchmark, our yield-curve positioning helped performance, while
security selection, sector allocation, and duration position had a mixed
effect.
MANAGEMENT CHANGE
In September 2007, we announced changes in our liquid markets team, which is
responsible for security selection within the U.S. Treasury, agency, and
derivatives markets in which Inflation Protection Bond invests. In the past,
some team members had primary responsibility for one or more of the portfolios
the group manages. Going forward, the entire team will be involved in
collective decision-making across all of these portfolios. As part of these
changes, portfolio manager Jeremy Fletcher left the company in September. The
portfolios he managed were team-managed prior to his departure and should
continue to benefit from the skills and experience of the present team.
CURVE POSITIONING HELPED
We helped performance by maintaining a yield curve-steepening bias during the
period using Treasury inflation-indexed securities (TIIS), as well as two- and
10-year Treasury futures. This trade helped relative results as the yield
curve steepened overall, particularly in August. For the six months, the yield
difference between two- and 10-year Treasurys went from seven to 60 basis
points (a basis point equals 0.01%). This curve-steepening bias is a strategy
we expect to carry forward, given our view of the economy, interest rates, and
shape of the curve.
SECURITY, SECTOR DECISIONS MIXED
Our security and sector allocation decisions had a mixed effect on relative
performance. In terms of positive contributors, we used a small slice of the
portfolio to gain Japanese yen exposure, a trade we put on when the yen was at
a 4 1/2-year low against the dollar early in 2007. This trade added value as
the yen appreciated against the greenback over the last six months.
However, it limited return relative to the benchmark to hold attractively
valued government agency and high-quality collateralized mortgage-backed
securities (CMBS) because they trailed Treasury bonds. Other things being
equal, higher-yielding CMBS
Portfolio at a Glance
As of As of
9/30/07 3/31/07
Weighted Average Maturity 9.9 years 11.2 years
Average Duration (effective) 6.3 years 6.5 years
*All fund returns referenced in this commentary are for Investor Class shares.
Total returns for periods less than one year are not annualized.
- ------
5
Inflation Protection Bond
and agency debt should outperform Treasury bonds over time. But for short
periods, price changes can overwhelm these bonds' income advantage, and that's
exactly what happened in recent months.
DURATION POSITION DETRACTED SLIGHTLY
Looking at the portfolio's duration, or interest rate sensitivity, we prefer
to keep it in a narrow band around the benchmark's and make small, tactical
adjustments. And with rate volatility surging, we kept duration neutral to
slightly short of our benchmark. But because intermediate-term yields ended
the period a little lower than they started, our duration position had a
slight negative effect on returns compared with the benchmark.
OUTLOOK
"We continue to focus on the fund's repeatable, multi-layered approach to
investing in an effort to identify the best relative values in the U.S.
inflation-linked securities universe. We think this steady, long-term approach
to investing is the best way to generate outperformance over time," says
portfolio manager Bob Gahagan. "We think the environment for TIIS could be
positive going forward, given that the Federal Reserve (the Fed) is at the
beginning of a cycle of interest rate cuts at a time when commodity prices are
in the neighborhood of record highs and the dollar's at an all-time low. TIIS
could benefit if investors think the Fed will err on the side of fighting
recession, rather than inflation. The economic, market, and interest rate
environment also argues for carrying forward our yield curve-steepening trade
and yen overweight position."
Yields as of September 30, 2007
30-Day SEC Yield
Investor Class 1.95%
Institutional Class 2.12%
A Class 1.65%
B Class 1.07%
C Class 1.07%
R Class 1.51%
Portfolio Composition by Effective Maturity
% of fund % of fund
investments investments
as of as of
9/30/07 3/31/07
0 - 5-Year Notes 38.7% 32.2%
5 - 10-Year Notes 31.5% 38.5%
10 - 30-Year Bonds 29.8% 29.3%
- ------
6
SHAREHOLDER FEE EXAMPLE (UNAUDITED)
Fund shareholders may incur two types of costs: (1) transaction costs,
including sales charges (loads) on purchase payments and redemption/exchange
fees; and (2) ongoing costs, including management fees; distribution and
service (12b-1) fees; and other fund expenses. This example is intended to
help you understand your ongoing costs (in dollars) of investing in your fund
and to compare these costs with the ongoing cost of investing in other mutual
funds.
The example is based on an investment of $1,000 made at the beginning of the
period and held for the entire period from April 1, 2007 to September 30, 2007.
ACTUAL EXPENSES
The table provides information about actual account values and actual expenses
for each class. You may use the information, together with the amount you
invested, to estimate the expenses that you paid over the period. First,
identify the share class you own. Then simply divide your account value by
$1,000 (for example, an $8,600 account value divided by $1,000 = 8.6), then
multiply the result by the number under the heading "Expenses Paid During
Period" to estimate the expenses you paid on your account during this period.
If you hold Investor Class shares of any American Century fund, or
Institutional Class shares of the American Century Diversified Bond Fund, in
an American Century account (i.e., not a financial intermediary or retirement
plan account), American Century may charge you a $12.50 semiannual account
maintenance fee if the value of those shares is less than $10,000. We will
redeem shares automatically in one of your accounts to pay the $12.50 fee. In
determining your total eligible investment amount, we will include your
investments in all PERSONAL ACCOUNTS (including American Century Brokerage
accounts) registered under your Social Security number. PERSONAL ACCOUNTS
include individual accounts, joint accounts, UGMA/UTMA accounts, personal
trusts, Coverdell Education Savings Accounts and IRAs (including traditional,
Roth, Rollover, SEP-, SARSEP- and SIMPLE-IRAs), and certain other retirement
accounts. If you have only business, business retirement, employer-sponsored
or American Century Brokerage accounts, you are currently not subject to this
fee. We will not charge the fee as long as you choose to manage your accounts
exclusively online. If you are subject to the Account Maintenance Fee, your
account value could be reduced by the fee amount.
HYPOTHETICAL EXAMPLE FOR COMPARISON PURPOSES
The table also provides information about hypothetical account values and
hypothetical expenses based on the actual expense ratio of each class of your
fund and an assumed rate of return of 5% per year before expenses, which is
not the actual return of a fund's share class. The hypothetical account values
and expenses may not be used to estimate the actual ending account balance or
expenses you paid for the period. You may use this information to compare the
ongoing costs of investing in your fund and other funds. To do so, compare
this 5% hypothetical example with the 5% hypothetical examples that appear in
the shareholder reports of the other funds.
Please note that the expenses shown in the table are meant to highlight your
ongoing costs only and do not reflect any transactional costs, such as sales
charges (loads) or redemption/exchange fees. Therefore, the table is useful in
comparing ongoing costs only, and will not help you determine the relative
total costs of owning different funds. In addition, if these transactional
costs were included, your costs would have been higher.
- ------
7
Expenses Paid
Beginning Ending During Period* Annualized
Account Value Account Value 4/1/07 - Expense
4/1/07 9/30/07 9/30/07 Ratio*
ACTUAL
Investor Class $1,000 $1,034.40 $3.00 0.59%
Institutional Class $1,000 $1,036.60 $1.99 0.39%
A Class $1,000 $1,033.10 $4.27 0.84%
B Class $1,000 $1,029.30 $8.07 1.59%
C Class $1,000 $1,029.30 $8.07 1.59%
R Class $1,000 $1,032.10 $5.54 1.09%
HYPOTHETICAL
Investor Class $1,000 $1,022.05 $2.98 0.59%
Institutional Class $1,000 $1,023.05 $1.97 0.39%
A Class $1,000 $1,020.80 $4.24 0.84%
B Class $1,000 $1,017.05 $8.02 1.59%
C Class $1,000 $1,017.05 $8.02 1.59%
R Class $1,000 $1,019.55 $5.50 1.09%
* Expenses are equal to the class's annualized expense ratio listed in the
table above, multiplied by the average account value over the period,
multiplied by 183, the number of days in the most recent fiscal half-year,
divided by 366, to reflect the one-half year period.
- ------
8
SCHEDULE OF INVESTMENTS
Inflation Protection Bond
SEPTEMBER 30, 2007 (UNAUDITED)
Principal Amount Value
U.S. Treasury Securities -- 88.8%
$1,878,602 U.S. Treasury Inflation Indexed Bonds,
2.375%, 1/15/25(1) $1,895,774
1,784,133 U.S. Treasury Inflation Indexed Bonds,
2.00%, 1/15/26(1) 1,704,405
2,065,820 U.S. Treasury Inflation Indexed Bonds,
2.375%, 1/15/27(1) 2,091,646
1,146,204 U.S. Treasury Inflation Indexed Bonds,
3.625%, 4/15/28(1) 1,396,579
551,184 U.S. Treasury Inflation Indexed Bonds,
3.875%, 4/15/29 700,090
604,368 U.S. Treasury Inflation Indexed Bonds,
3.375%, 4/15/32 738,368
381,039 U.S. Treasury Inflation Indexed Notes,
3.875%, 1/15/09 388,958
1,139,034 U.S. Treasury Inflation Indexed Notes,
4.25%, 1/15/10(1) 1,193,228
1,017,065 U.S. Treasury Inflation Indexed Notes,
0.875%, 4/15/10(1) 983,614
1,077,138 U.S. Treasury Inflation Indexed Notes,
3.50%, 1/15/11(1) 1,124,432
1,049,440 U.S. Treasury Inflation Indexed Notes,
2.375%, 4/15/11(1) 1,056,573
1,407,720 U.S. Treasury Inflation Indexed Notes,
3.375%, 1/15/12(1) 1,480,747
1,077,836 U.S. Treasury Inflation Indexed Notes,
2.00%, 4/15/12(1) 1,070,341
810,957 U.S. Treasury Inflation Indexed Notes,
3.00%, 7/15/12 844,282
793,898 U.S. Treasury Inflation Indexed Notes,
1.875%, 7/15/13 781,494
676,398 U.S. Treasury Inflation Indexed Notes,
2.00%, 1/15/14(1) 666,886
884,048 U.S. Treasury Inflation Indexed Notes,
2.00%, 7/15/14 872,376
1,090,890 U.S. Treasury Inflation Indexed Notes,
1.625%, 1/15/15(1) 1,044,017
1,017,355 U.S. Treasury Inflation Indexed Notes,
1.875%, 7/15/15(1) 990,730
1,049,490 U.S. Treasury Inflation Indexed Notes,
2.00%, 1/15/16 1,026,205
1,826,680 U.S. Treasury Inflation Indexed Notes,
2.50%, 7/15/16 1,861,217
1,058,733 U.S. Treasury Inflation Indexed Notes,
2.375%, 1/15/17 1,066,674
678,402 U.S. Treasury Inflation Indexed Notes,
2.625%, 7/15/17 699,496
-----------
TOTAL U.S. TREASURY SECURITIES
(Cost $25,584,840) 25,678,132
-----------
Principal Amount Value
Collateralized Mortgage Obligations(2) -- 3.4%
$ 500,000 Credit Suisse Mortgage Capital Certificates,
Series 2007 TF2A, Class A1, VRN, 5.93%, 11/15/07,
resets monthly off the 1-month LIBOR plus 0.18%
with no caps $ 496,250
489,307 Lehman Brothers Floating Rate Commercial Mortgage
Trust, Series 2007 LLFA, Class A1, VRN, 6.05%,
11/15/07, resets monthly off the 1-month LIBOR
plus 0.30% with no caps 488,084
-----------
TOTAL COLLATERALIZED MORTGAGE OBLIGATIONS
(Cost $989,307) 984,334
-----------
Commercial Paper -- 3.2%
911,000 Cedar Springs Capital Co., 5.75%, 10/1/07
(Acquired 9/28/07, Cost $911,000)(3)(4)
(Cost $911,000) 911,000
-----------
U.S. Government Agency Securities -- 2.9%
300,000 FHLMC, 5.00%, 6/11/09 302,880
500,000 PEFCO, 6.67%, 9/15/09 521,708
-----------
TOTAL U.S. GOVERNMENT AGENCY SECURITIES
(Cost $812,220) 824,588
-----------
Sovereign Governments & Agencies -- 0.7%
JPY KfW, VRN, 0.60%, 11/8/07, resets quarterly off the
25,000,000 3-month JPY LIBOR minus 0.22% with no caps
(Cost $206,608) 217,975
-----------
TOTAL INVESTMENT SECURITIES -- 99.0%
(Cost $28,503,975) 28,616,029
-----------
OTHER ASSETS AND LIABILITIES -- 1.0% 279,634
-----------
TOTAL NET ASSETS -- 100.0% $28,895,663
===========
- ------
9
Inflation Protection Bond
Futures Contracts
Underlying
Face Amount at Unrealized Gain
Contracts Purchased Expiration Date Value (Loss)
49 U.S. Treasury
2-Year Notes December 2007 $10,145,297 $13,897
11 U.S. Treasury
5-Year Notes December 2007 1,177,344 44,687
------------ ------------
$11,322,641 $58,584
============ ============
Underlying
Face Amount at Unrealized Gain
Contracts Sold Expiration Date Value (Loss)
21 U.S. Treasury
10-Year Notes December 2007 $2,294,906 $(35,055)
============ ============
Swap Agreements
Notional Expiration Unrealized
Amount Description of Agreement Date Gain (Loss)
CREDIT DEFAULT
$ 250,000 Pay quarterly a fixed rate equal to June 2012 $ 676
0.53% multiplied by the notional
amount and receive from Barclays Bank
plc upon each default event of Darden
Restaurants, Inc., par value of the
proportional notional amount.
400,000 Pay quarterly a fixed rate equal to September 4,374
0.69% multiplied by the notional 2017
amount and receive from Barclays Bank
plc upon each default event of
JPMorgan Chase & Co., par value of the
proportional notional amount.
TOTAL RETURN
800,000 Pay a fixed rate equal to 1.13% and January 2012 7,317
receive the return of the U.S. CPI
Urban Consumers NSA Index upon the
termination date with Barclays Bank
plc.
1,000,000 Pay a fixed rate equal to 1.31% and April 2017 9,217
receive the return of the U.S. CPI
Urban Consumers NSA Index upon the
termination date with Barclays Bank
plc.
----------
$21,584
==========
Notes to Schedule of Investments
CPI = Consumer Price Index
FHLMC = Federal Home Loan Mortgage Corporation
JPY = Japanese Yen
LIBOR = London Interbank Offered Rate
NSA = Not Seasonally Adjusted
PEFCO = Private Export Funding Corporation
resets = The frequency with which a security's coupon changes, based on
current market conditions or an underlying index. The more frequently a
security resets, the less risk the investor is taking that the coupon will
vary significantly from current market rates.
VRN = Variable Rate Note. Interest reset date is indicated. Rate shown is
effective September 30, 2007.
(1) Security, or a portion thereof, has been segregated for futures contracts
and/or swap agreements.
(2) Final maturity indicated, unless otherwise noted.
(3) Security was purchased under Rule 144A of the Securities Act of 1933 or is
a private placement and, unless registered under the Act or exempted from
registration, may only be sold to qualified institutional investors. The
aggregate value of restricted securities at September 30, 2007 was $911,000,
which represented 3.2% of total net assets.
(4) The rate indicated is the yield to maturity at purchase.
See Notes to Financial Statements.
- ------
10
STATEMENT OF ASSETS AND LIABILITIES
SEPTEMBER 30, 2007 (UNAUDITED)
ASSETS
Investment securities, at value (cost of $28,503,975) $28,616,029
Cash 1,439
Foreign currency holdings, at value (cost of $240) 254
Unrealized appreciation on swap agreements 21,584
Receivable for capital shares sold 201,175
Receivable for variation margin on futures contracts 306
Interest receivable 177,956
------------
29,018,743
------------
LIABILITIES
Payable for capital shares redeemed 90,625
Accrued management fees 12,204
Distribution fees payable 4,584
Service fees (and distribution fees -- A Class and R Class)
payable 3,977
Dividends payable 11,690
------------
123,080
------------
NET ASSETS $28,895,663
============
See Notes to Financial Statements.
- ------
11
SEPTEMBER 30, 2007 (UNAUDITED)
NET ASSETS CONSIST OF:
Capital paid in $29,237,957
Undistributed net investment income 1,868
Accumulated net realized loss on investment and foreign currency
transactions (501,939)
Net unrealized appreciation on investments and translation of
assets and liabilities in foreign currencies 157,777
------------
$28,895,663
============
INVESTOR CLASS
Net assets $6,934,061
Shares outstanding 725,924
Net asset value per share $9.55
INSTITUTIONAL CLASS
Net assets $51,920
Shares outstanding 5,430
Net asset value per share $9.56
A CLASS
Net assets $13,465,102
Shares outstanding 1,416,974
Net asset value per share $9.50
Maximum offering price (net asset value divided by 0.955) $9.95
B CLASS
Net assets $1,154,501
Shares outstanding 121,759
Net asset value per share $9.48
C CLASS
Net assets $7,132,051
Shares outstanding 753,287
Net asset value per share $9.47
R CLASS
Net assets $158,028
Shares outstanding 16,253
Net asset value per share $9.72
See Notes to Financial Statements.
- ------
12
STATEMENT OF OPERATIONS
FOR THE SIX MONTHS ENDED SEPTEMBER 30, 2007 (UNAUDITED)
INVESTMENT INCOME (LOSS)
INCOME:
Interest $984,375
----------
EXPENSES:
Management fees 73,427
Distribution fees:
B Class 4,013
C Class 25,151
Service fees:
B Class 1,338
C Class 8,384
Distribution and service fees -- A Class 14,791
Distribution and service fees -- R Class 322
Trustees' fees and expenses 595
----------
128,021
----------
NET INVESTMENT INCOME (LOSS) 856,354
----------
REALIZED AND UNREALIZED GAIN (LOSS)
NET REALIZED GAIN (LOSS) ON:
Investment and foreign currency transactions (168,915)
Futures and swaps transactions 46,925
----------
(121,990)
----------
CHANGE IN NET UNREALIZED APPRECIATION (DEPRECIATION) ON:
Investments and translation of assets and liabilities in foreign
currencies 81,385
Futures and swaps 29,890
----------
111,275
----------
NET REALIZED AND UNREALIZED GAIN (LOSS) (10,715)
----------
NET INCREASE (DECREASE) IN NET ASSETS RESULTING FROM OPERATIONS $845,639
==========
See Notes to Financial Statements.
- ------
13
STATEMENT OF CHANGES IN NET ASSETS
SIX MONTHS ENDED SEPTEMBER 30, 2007 (UNAUDITED) AND YEAR ENDED MARCH 31, 2007
Increase (Decrease) in Net Assets Sept. 30, 2007 March 31, 2007
OPERATIONS
Net investment income (loss) $ 856,354 $ 524,244
Net realized gain (loss) (121,990) (311,252)
Change in net unrealized appreciation
(depreciation) 111,275 529,124
------------ ------------
Net increase (decrease) in net assets resulting
from operations 845,639 742,116
------------ ------------
DISTRIBUTIONS TO SHAREHOLDERS
From net investment income:
Investor Class (191,935) (19,831)
Institutional Class (1,576) (1,427)
A Class (414,284) (336,894)
B Class (33,798) (22,154)
C Class (209,664) (142,850)
R Class (4,225) (1,088)
From return of capital:
Investor Class -- (83)
Institutional Class -- --
A Class -- (20,050)
B Class -- (3,328)
C Class -- (30,712)
R Class -- --
------------ ------------
Decrease in net assets from distributions (855,482) (578,417)
------------ ------------
CAPITAL SHARE TRANSACTIONS
Net increase (decrease) in net assets from
capital share transactions 7,926,482 6,167,036
------------ ------------
NET INCREASE (DECREASE) IN NET ASSETS 7,916,639 6,330,735
NET ASSETS
Beginning of period 20,979,024 14,648,289
------------ ------------
End of period $28,895,663 $20,979,024
============ ============
Undistributed net investment income $1,868 $1,584
============ ============
See Notes to Financial Statements.
- ------
14
NOTES TO FINANCIAL STATEMENTS
SEPTEMBER 30, 2007 (UNAUDITED)
1. ORGANIZATION AND SUMMARY OF SIGNIFICANT ACCOUNTING POLICIES
ORGANIZATION -- American Century Investment Trust (the trust) is registered
under the Investment Company Act of 1940 (the 1940 Act) as an open-end
management investment company. Inflation Protection Bond Fund (the fund) is
one fund in a series issued by the trust. The fund is nondiversified under the
1940 Act. The fund's investment objective is to seek total return and
protection against U.S. inflation. The fund invests primarily in
inflation-linked debt securities. These securities include inflation-linked
securities issued by the U.S. Treasury, by U.S. government agencies and
instrumentalities, and by entities other than the U.S. Treasury or U.S.
government agencies and instrumentalities. The following is a summary of the
fund's significant accounting policies.
MULTIPLE CLASS -- The fund is authorized to issue the Investor Class, the
Institutional Class, the A Class, the B Class, the C Class, and the R Class.
The A Class may incur an initial sales charge. The A Class, B Class, and C
Class may be subject to a contingent deferred sales charge. The share classes
differ principally in their respective sales charges and distribution and
shareholder servicing expenses and arrangements. All shares of the funds
represent an equal pro rata interest in the assets of the class to which such
shares belong, and have identical voting, dividend, liquidation and other
rights and the same terms and conditions, except for class specific expenses
and exclusive rights to vote on matters affecting only individual classes.
Income, non-class specific expenses, and realized and unrealized capital gains
and losses of the funds are allocated to each class of shares based on their
relative net assets.
SECURITY VALUATIONS -- Debt securities maturing in greater than 60 days are
valued at current market value as provided by a commercial pricing service or
at the mean of the most recent bid and asked prices. Debt securities maturing
within 60 days may be valued at cost, plus or minus any amortized discount or
premium. Securities traded on foreign securities exchanges and
over-the-counter markets are normally completed before the close of business
on days that the New York Stock Exchange (the Exchange) is open and may also
take place on days when the Exchange is not open. If an event occurs after the
value of a security was established but before the net asset value per share
was determined that was likely to materially change the net asset value, that
security would be valued as determined in accordance with procedures adopted
by the Board of Trustees. If the fund determines that the market price of a
portfolio security is not readily available, or that the valuation methods
mentioned above do not reflect the security's fair value, such security is
valued as determined by, or in accordance with procedures adopted by, the
Board of Trustees or its designee if such determination would materially
impact a fund's net asset value. Certain other circumstances may cause the
fund to use alternative procedures to value a security such as: a security has
been declared in default; trading in a security has been halted during the
trading day; or there is a foreign market holiday and no trading will commence.
SECURITY TRANSACTIONS -- For financial reporting, security transactions are
accounted for as of the trade date. Net realized gains and losses are
determined on the identified cost basis, which is also used for federal income
tax purposes.
INVESTMENT INCOME -- Interest income less foreign taxes withheld, if any, is
recorded on the accrual basis and includes accretion of discounts and
amortization of premiums. Inflation adjustments related to inflation-linked
debt securities are reflected as interest income.
FUTURES CONTRACTS -- The fund may enter into futures contracts in order to
manage the fund's exposure to changes in market conditions. One of the risks
of entering into futures contracts is the possibility that the change in value
of the contract may not correlate with the changes in value of the underlying
securities. Upon entering into a futures contract, the fund is required to
deposit either cash or securities in an amount equal to a certain percentage
of the contract value (initial margin). Subsequent payments (variation margin)
are made or received daily, in cash, by the fund. The variation margin is
equal to the daily change in the contract value and is recorded as unrealized
gains and losses. The fund recognizes a realized gain or loss when the
contract is closed or expires. Net realized and unrealized gains or losses
occurring during the holding period of futures contracts are a component of
realized gain (loss) on futures and swaps transactions and unrealized
appreciation (depreciation) on futures and swaps, respectively.
FOREIGN CURRENCY TRANSACTIONS -- All assets and liabilities initially
expressed in foreign currencies are translated into U.S. dollars at prevailing
exchange rates at period end. Purchases and sales of investment securities,
dividend and interest income, and certain expenses are translated at the rates
of exchange prevailing on the respective dates of such transactions. For
assets and liabilities, other than investments in securities, net realized and
unrealized gains and losses from foreign currency translations arise from
changes in currency exchange rates.
- ------
15
Net realized and unrealized foreign currency exchange gains or losses
occurring during the holding period of investment securities are a component
of realized gain (loss) on investment transactions and unrealized appreciation
(depreciation) on investments, respectively. Certain countries may impose
taxes on the contract amount of purchases and sales of foreign currency
contracts in their currency. The fund records the foreign tax expense, if any,
as a reduction to the net realized gain (loss) on foreign currency
transactions.
SWAP AGREEMENTS -- The fund may enter into swap agreements in order to attempt
to obtain or preserve a particular return or spread at a lower cost than
obtaining a return or spread through purchases and/or sales of instruments in
other markets; protect against currency fluctuations; attempt to manage
duration to protect against any increase in the price of securities the fund
anticipates purchasing at a later date; or gain exposure to certain markets in
the most economical way possible. A basic swap agreement is a contract in
which two parties agree to exchange the returns earned or realized on
predetermined investments or instruments. Credit default swaps enable an
investor to buy/sell protection against a credit event of a specific issuer.
The seller of credit protection against a security or basket of securities
receives an up-front or periodic payment to compensate against potential
default events. The fund may enhance returns by selling protection or attempt
to mitigate credit risk by buying protection. The fund will segregate cash,
cash equivalents or other appropriate liquid securities on its records in
amounts sufficient to meet requirements. Unrealized gains are reported as an
asset and unrealized losses are reported as a liability on the Statement of
Assets and Liabilities. Swap agreements are valued daily and changes in value,
including the periodic amounts of interest to be paid or received on swaps,
are recorded as unrealized appreciation (depreciation) on futures and swaps.
Realized gain or loss is recorded upon receipt or payment of a periodic
settlement or termination of swap agreements. The risks of entering into swap
agreements include the possible lack of liquidity, failure of the counterparty
to meet its obligations, and that there may be unfavorable changes in the
underlying investments and instruments.
INCOME TAX STATUS -- It is the fund's policy to distribute substantially all
net investment income and net realized gains to shareholders and to otherwise
qualify as a regulated investment company under provisions of the Internal
Revenue Code. At this time, management has not identified any uncertain tax
positions that would materially impact the financial statements. Accordingly,
no provision has been made for federal or state income taxes. Interest and
penalties associated with any federal or state income tax obligations, if any,
are recorded as interest expense.
DISTRIBUTIONS TO SHAREHOLDERS -- Distributions to shareholders are recorded on
the ex-dividend date. Distributions from net investment income are declared
daily and paid monthly. Effective October 1, 2007, distributions from net
investment income will be paid quarterly. Distributions from net realized
gains, if any, are generally declared and paid annually.
INDEMNIFICATIONS -- Under the trust's organizational documents, its officers
and trustees are indemnified against certain liabilities arising out of the
performance of their duties to the fund. In addition, in the normal course of
business, the fund enters into contracts that provide general
indemnifications. The fund's maximum exposure under these arrangements is
unknown as this would involve future claims that may be made against the fund.
The risk of material loss from such claims is considered by management to be
remote.
USE OF ESTIMATES -- The financial statements are prepared in conformity with
accounting principles generally accepted in the United States of America,
which may require management to make certain estimates and assumptions at the
date of the financial statements. Actual results could differ from these
estimates.
- ------
16
2. FEES AND TRANSACTIONS WITH RELATED PARTIES
MANAGEMENT FEES -- The trust has entered into a Management Agreement with
American Century Investment Management, Inc. (ACIM) (the investment advisor),
under which ACIM provides the fund with investment advisory and management
services in exchange for a single, unified management fee (the fee) per class.
The Agreement provides that all expenses of the fund, except brokerage
commissions, taxes, interest, fees and expenses of those trustees who are not
considered "interested persons" as defined in the 1940 Act (including counsel
fees) and extraordinary expenses, will be paid by ACIM. The fee is computed
and accrued daily based on the daily net assets of the specific class of
shares of the fund and paid monthly in arrears. The fee consists of (1) an
Investment Category Fee based on the daily net assets of the fund and certain
other accounts managed by the investment advisor that are in the same broad
investment category as the fund and (2) a Complex Fee based on the assets of
all the funds in the American Century family of funds. The rates for the
Investment Category Fee range from 0.2625% to 0.3800% and the rates for the
Complex Fee (except for Institutional Class) range from 0.2500% to 0.3100%.
The Institutional Class is 0.2000% less at each point within the Complex Fee
range. The effective annual management fee for the fund for the six months
ended September 30, 2007 was 0.58% for all classes except Institutional Class,
which was 0.38%.
DISTRIBUTION AND SERVICE FEES -- The Board of Trustees has adopted a separate
Master Distribution and Individual Shareholder Services Plan for each of the A
Class, B Class, C Class and R Class (collectively the plans), pursuant to Rule
12b-1 of the 1940 Act. The plans provide that the A Class and the R Class will
each pay American Century Investment Services, Inc. (ACIS) an annual
distribution and service fee of 0.25% for the A Class and 0.50% for the R
Class. The plans provide that the B Class and C Class will each pay ACIS an
annual distribution fee and service fee of 0.75% and 0.25%, respectively. The
fees are computed and accrued daily based on each class's daily net assets and
paid monthly in arrears. The distribution fee provides compensation for
expenses incurred in connection with distributing shares of the classes
including, but not limited to, payments to brokers, dealers, and financial
institutions that have entered into sales agreements with respect to shares of
the fund. The service fee provides compensation for individual shareholder
services rendered by broker/dealers or other independent financial
intermediaries for A Class, B Class, C Class and R Class shares. Fees incurred
under the plans during the six months ended September 30, 2007, are detailed
in the Statement of Operations.
RELATED PARTIES -- Certain officers and trustees of the trust are also
officers and/or directors, and, as a group, controlling stockholders of
American Century Companies, Inc. (ACC), the parent of the trust's investment
advisor, ACIM, the distributor of the trust, ACIS, and the trust's transfer
agent, American Century Services, LLC.
The fund has a bank line of credit agreement with JPMorgan Chase Bank (JPMCB).
JPMCB is a wholly owned subsidiary of JPMorgan Chase & Co. (JPM). JPM is an
equity investor in ACC.
3. INVESTMENT TRANSACTIONS
Purchases and sales of investment securities, excluding short-term
investments, for the six months ended September 30, 2007, were $16,078,963 and
$10,270,969, respectively.
- ------
17
4. CAPITAL SHARE TRANSACTIONS
Transactions in shares of the fund were as follows (unlimited number of shares
authorized):
Six months ended Year ended
September 30, 2007 March 31, 2007
Shares Amount Shares Amount
INVESTOR CLASS
Sold 708,503 $6,738,910 76,590 $ 722,622
Issued in reinvestment of
distributions 1,197 11,232 521 4,911
Redeemed (46,087) (431,415) (54,375) (512,192)
--------- ---------- --------- ----------
663,613 6,318,727 22,736 215,341
--------- ---------- --------- ----------
INSTITUTIONAL CLASS
Sold 866 8,168 343 3,231
Issued in reinvestment of
distributions 170 1,576 152 1,427
Redeemed (130) (1,231) -- --
--------- ---------- --------- ----------
906 8,513 495 4,658
--------- ---------- --------- ----------
A CLASS
Sold 334,057 3,133,531 947,874 8,907,190
Issued in reinvestment of
distributions 40,805 381,036 35,366 332,299
Redeemed (260,412) (2,429,551) (544,625) (5,108,120)
--------- ---------- --------- ----------
114,450 1,085,016 438,615 4,131,369
--------- ---------- --------- ----------
B CLASS
Sold 8,613 80,728 52,410 493,406
Issued in reinvestment of
distributions 2,538 23,629 1,858 17,462
Redeemed (8,572) (79,538) (22,981) (214,939)
--------- ---------- --------- ----------
2,579 24,819 31,287 295,929
--------- ---------- --------- ----------
C CLASS
Sold 132,251 1,230,243 356,677 3,342,230
Issued in reinvestment of
distributions 9,949 92,495 7,955 74,632
Redeemed (93,241) (867,734) (212,538) (1,992,934)
--------- ---------- --------- ----------
48,959 455,004 152,094 1,423,928
--------- ---------- --------- ----------
R CLASS
Sold 3,176 30,403 9,843 94,816
Issued in reinvestment of
distributions 446 4,225 113 1,088
Redeemed (24) (225) (10) (93)
--------- ---------- --------- ----------
3,598 34,403 9,946 95,811
--------- ---------- --------- ----------
Net increase (decrease) 834,105 $7,926,482 655,173 $6,167,036
========= ========== ========= ==========
5. BANK LINE OF CREDIT
The fund, along with certain other funds managed by ACIM or American Century
Global Investment Management, Inc., has a $500,000,000 unsecured bank line of
credit agreement with JPMCB. The fund may borrow money for temporary or
emergency purposes to fund shareholder redemptions. Borrowings under the
agreement bear interest at the Federal Funds rate plus 0.40%. The fund did not
borrow from the line during the six months ended September 30, 2007.
- ------
18
6. FEDERAL TAX INFORMATION
The book-basis character of distributions made during the year from net
investment income or net realized gains may differ from their ultimate
characterization for federal income tax purposes. These differences reflect
the differing character of certain income items and net realized gains and
losses for financial statement and tax purposes, and may result in
reclassification among certain capital accounts on the financial statements.
As of September 30, 2007, the components of investments for federal income tax
purposes were as follows:
Federal tax cost of investments $28,656,529
============
Gross tax appreciation of investments $158,630
Gross tax depreciation of investments (199,130)
------------
Net tax appreciation (depreciation) of investments $(40,500)
============
The difference between book-basis and tax-basis cost and unrealized
appreciation (depreciation) is attributable primarily to the tax deferral of
losses on wash sales.
As of March 31, 2007, the fund had accumulated capital losses of $(33,021)
which represent net capital loss carryovers that may be used to offset future
realized capital gains for federal income tax purposes. The capital loss
carryovers of $(6,481) and $(26,540) expire in 2014 and 2015, respectively.
The fund had capital loss deferrals of $(187,983) which represent net capital
losses incurred in the five-month period ended March 31, 2007. The fund has
elected to treat such losses as having been incurred in the following fiscal
year for federal income tax purposes.
7. RECENTLY ISSUED ACCOUNTING STANDARDS
In June 2006, the Financial Accounting Standards Board (FASB) issued
Interpretation No. 48, "Accounting for Uncertainty in Income Taxes -- an
Interpretation of FASB Statement No. 109" (FIN 48). FIN 48 establishes a
minimum threshold for financial statement recognition of the benefit of
positions taken in filing tax returns (including whether an entity is taxable
in a particular jurisdiction), and requires certain expanded tax disclosures.
FIN 48 is effective for fiscal years beginning after December 15, 2006, and is
to be applied to all open tax years as of the date of effectiveness.
Management has concluded that the adoption of FIN 48 will not materially
impact the financial statements.
The FASB issued Statement of Financial Accounting Standards No. 157, "Fair
Value Measurements" (FAS 157), in September 2006, which is effective for
fiscal years beginning after November 15, 2007. FAS 157 defines fair value,
establishes a framework for measuring fair value and expands the required
financial statement disclosures about fair value measurements. Management is
currently evaluating the impact that adopting FAS 157 will have on the
financial statement disclosures.
- ------
19
FINANCIAL HIGHLIGHTS
Inflation Protection Bond
Investor Class
For a Share Outstanding Throughout the Years Ended March 31 (except as noted)
2007(1) 2007 2006(2)
PER-SHARE DATA
Net Asset Value, Beginning of Period $9.57 $9.47 $10.00
-------- -------- --------
Income From Investment Operations
Net Investment Income (Loss) 0.33(3) 0.33(3) 0.33
Net Realized and Unrealized Gain (Loss) (0.01) 0.08 (0.53)
-------- -------- --------
Total From Investment Operations 0.32 0.41 (0.20)
-------- -------- --------
Distributions
From Net Investment Income (0.34) (0.31) (0.33)
From Return of Capital -- --(4) --
-------- -------- --------
Total Distributions (0.34) (0.31) (0.33)
-------- -------- --------
Net Asset Value, End of Period $9.55 $9.57 $9.47
======== ======== ========
TOTAL RETURN(5) 3.44% 4.46% (2.09)%
RATIOS/SUPPLEMENTAL DATA
Ratio of Operating Expenses to Average Net Assets 0.59%(6) 0.59% 0.59%(6)
Ratio of Net Investment Income (Loss) to Average
Net Assets 7.08%(6) 3.26% 3.97%(6)
Portfolio Turnover Rate 41% 52% 51%
Net Assets, End of Period (in thousands) $6,934 $596 $375
(1) Six months ended September 30, 2007 (unaudited).
(2) May 31, 2005 (fund inception) through March 31, 2006.
(3) Computed using average shares outstanding throughout the period.
(4) Per-share amount was less than $0.005.
(5) Total return assumes reinvestment of net investment income and capital
gains distributions, if any. Total returns for periods less than one year are
not annualized. The total return of the classes may not precisely reflect the
class expense differences because of the impact of calculating the net asset
values to two decimal places. If net asset values were calculated to three
decimal places, the total return differences would more closely reflect the
class expense differences. The calculation of net asset values to two decimal
places is made in accordance with SEC guidelines and does not result in any
gain or loss of value between one class and another.
(6) Annualized.
See Notes to Financial Statements.
- ------
20
Inflation Protection Bond
Institutional Class
For a Share Outstanding Throughout the Years Ended March 31 (except as noted)
2007(1) 2007 2006(2)
PER-SHARE DATA
Net Asset Value, Beginning of Period $9.57 $9.47 $10.00
-------- -------- --------
Income From Investment Operations
Net Investment Income (Loss) 0.33(3) 0.35(3) 0.34
Net Realized and Unrealized Gain (Loss) 0.01 0.11 (0.53)
-------- -------- --------
Total From Investment Operations 0.34 0.46 (0.19)
-------- -------- --------
Distributions
From Net Investment Income (0.35) (0.36) (0.34)
-------- -------- --------
Net Asset Value, End of Period $9.56 $9.57 $9.47
======== ======== ========
TOTAL RETURN(4) 3.66% 4.81% (1.97)%
RATIOS/SUPPLEMENTAL DATA
Ratio of Operating Expenses to Average Net Assets 0.39%(5) 0.39% 0.39%(5)
Ratio of Net Investment Income (Loss) to Average
Net Assets 7.28%(5) 3.46% 4.17%(5)
Portfolio Turnover Rate 41% 52% 51%
Net Assets, End of Period (in thousands) $52 $43 $38
(1) Six months ended September 30, 2007 (unaudited).
(2) May 31, 2005 (fund inception) through March 31, 2006.
(3) Computed using average shares outstanding throughout the period.
(4) Total return assumes reinvestment of net investment income and capital
gains distributions, if any. Total returns for periods less than one year are
not annualized. The total return of the classes may not precisely reflect the
class expense differences because of the impact of calculating the net asset
values to two decimal places. If net asset values were calculated to three
decimal places, the total return differences would more closely reflect the
class expense differences. The calculation of net asset values to two decimal
places is made in accordance with SEC guidelines and does not result in any
gain or loss of value between one class and another.
(5) Annualized.
See Notes to Financial Statements.
- ------
21
Inflation Protection Bond
A Class
For a Share Outstanding Throughout the Years Ended March 31 (except as noted)
2007(1) 2007 2006(2)
PER-SHARE DATA
Net Asset Value, Beginning of Period $9.52 $9.45 $10.00
-------- -------- --------
Income From Investment Operations
Net Investment Income (Loss) 0.32(3) 0.28(3) 0.33
Net Realized and Unrealized Gain (Loss) (0.02) 0.11 (0.55)
-------- -------- --------
Total From Investment Operations 0.30 0.39 (0.22)
-------- -------- --------
Distributions
From Net Investment Income (0.32) (0.30) (0.33)
From Return of Capital -- (0.02) --
-------- -------- --------
Total Distributions (0.32) (0.32) (0.33)
-------- -------- --------
Net Asset Value, End of Period $9.50 $9.52 $9.45
======== ======== ========
TOTAL RETURN(4) 3.31% 4.25% (2.35)%
RATIOS/SUPPLEMENTAL DATA
Ratio of Operating Expenses to Average Net Assets 0.84%(5) 0.84% 0.84%(5)
Ratio of Net Investment Income (Loss) to Average
Net Assets 6.83%(5) 3.01% 3.72%(5)
Portfolio Turnover Rate 41% 52% 51%
Net Assets, End of Period (in thousands) $13,465 $12,402 $8,164
(1) Six months ended September 30, 2007 (unaudited).
(2) May 31, 2005 (fund inception) through March 31, 2006.
(3) Computed using average shares outstanding throughout the period.
(4) Total return assumes reinvestment of net investment income and capital
gains distributions, if any, and does not reflect applicable sales charges.
Total returns for periods less than one year are not annualized. The total
return of the classes may not precisely reflect the class expense differences
because of the impact of calculating the net asset values to two decimal
places. If net asset values were calculated to three decimal places, the total
return differences would more closely reflect the class expense differences.
The calculation of net asset values to two decimal places is made in
accordance with SEC guidelines and does not result in any gain or loss of
value between one class and another.
(5) Annualized.
See Notes to Financial Statements.
- ------
22
Inflation Protection Bond
B Class
For a Share Outstanding Throughout the Years Ended March 31 (except as noted)
2007(1) 2007 2006(2)
PER-SHARE DATA
Net Asset Value, Beginning of Period $9.50 $9.45 $10.00
-------- -------- --------
Income From Investment Operations
Net Investment Income (Loss) 0.29(3) 0.21(3) 0.27
Net Realized and Unrealized Gain (Loss) (0.02) 0.11 (0.55)
-------- -------- --------
Total From Investment Operations 0.27 0.32 (0.28)
-------- -------- --------
Distributions
From Net Investment Income (0.29) (0.23) (0.27)
From Return of Capital -- (0.04) --
-------- -------- --------
Total Distributions (0.29) (0.27) (0.27)
-------- -------- --------
Net Asset Value, End of Period $9.48 $9.50 $9.45
======== ======== ========
TOTAL RETURN(4) 2.93% 3.41% (2.87)%
RATIOS/SUPPLEMENTAL DATA
Ratio of Operating Expenses to Average Net Assets 1.59%(5) 1.59% 1.59%(5)
Ratio of Net Investment Income (Loss) to Average
Net Assets 6.08%(5) 2.26% 2.97%(5)
Portfolio Turnover Rate 41% 52% 51%
Net Assets, End of Period (in thousands) $1,155 $1,132 $830
(1) Six months ended September 30, 2007 (unaudited).
(2) May 31, 2005 (fund inception) through March 31, 2006.
(3) Computed using average shares outstanding throughout the period.
(4) Total return assumes reinvestment of net investment income and capital
gains distributions, if any, and does not reflect applicable sales charges.
Total returns for periods less than one year are not annualized. The total
return of the classes may not precisely reflect the class expense differences
because of the impact of calculating the net asset values to two decimal
places. If net asset values were calculated to three decimal places, the total
return differences would more closely reflect the class expense differences.
The calculation of net asset values to two decimal places is made in
accordance with SEC guidelines and does not result in any gain or loss of
value between one class and another.
(5) Annualized.
See Notes to Financial Statements.
- ------
23
Inflation Protection Bond
C Class
For a Share Outstanding Throughout the Years Ended March 31 (except as noted)
2007(1) 2007 2006(2)
PER-SHARE DATA
Net Asset Value, Beginning of Period $9.49 $9.44 $10.00
-------- -------- --------
Income From Investment Operations
Net Investment Income (Loss) 0.29(3) 0.21(3) 0.27
Net Realized and Unrealized Gain (Loss) (0.02) 0.12 (0.56)
-------- -------- --------
Total From Investment Operations 0.27 0.33 (0.29)
-------- -------- --------
Distributions
From Net Investment Income (0.29) (0.23) (0.27)
From Return of Capital -- (0.05) --
-------- -------- --------
Total Distributions (0.29) (0.28) (0.27)
-------- -------- --------
Net Asset Value, End of Period $9.47 $9.49 $9.44
======== ======== ========
TOTAL RETURN(4) 2.93% 3.54% (2.95)%
RATIOS/SUPPLEMENTAL DATA
Ratio of Operating Expenses to Average Net Assets 1.59%(5) 1.59% 1.59%(5)
Ratio of Net Investment Income (Loss) to Average
Net Assets 6.08%(5) 2.26% 2.97%(5)
Portfolio Turnover Rate 41% 52% 51%
Net Assets, End of Period (in thousands) $7,132 $6,682 $5,215
(1) Six months ended September 30, 2007 (unaudited).
(2) May 31, 2005 (fund inception) through March 31, 2006.
(3) Computed using average shares outstanding throughout the period.
(4) Total return assumes reinvestment of net investment income and capital
gains distributions, if any, and does not reflect applicable sales charges.
Total returns for periods less than one year are not annualized. The total
return of the classes may not precisely reflect the class expense differences
because of the impact of calculating the net asset values to two decimal
places. If net asset values were calculated to three decimal places, the total
return differences would more closely reflect the class expense differences.
The calculation of net asset values to two decimal places is made in
accordance with SEC guidelines and does not result in any gain or loss of
value between one class and another.
(5) Annualized.
See Notes to Financial Statements.
- ------
24
Inflation Protection Bond
R Class
For a Share Outstanding Throughout the Years Ended March 31 (except as noted)
2007(1) 2007 2006(2)
PER-SHARE DATA
Net Asset Value, Beginning of Period $9.74 $9.46 $10.00
-------- -------- --------
Income From Investment Operations
Net Investment Income (Loss) 0.31(3) 0.15(3) 0.30
Net Realized and Unrealized Gain (Loss) (0.01) 0.23 (0.54)
-------- -------- --------
Total From Investment Operations 0.30 0.38 (0.24)
-------- -------- --------
Distributions
From Net Investment Income (0.32) (0.10) (0.30)
-------- -------- --------
Net Asset Value, End of Period $9.72 $9.74 $9.46
======== ======== ========
TOTAL RETURN(4) 3.21% 4.03% (2.48)%
RATIOS/SUPPLEMENTAL DATA
Ratio of Operating Expenses to Average Net Assets 1.09%(5) 1.09% 1.09%(5)
Ratio of Net Investment Income (Loss) to Average
Net Assets 6.58%(5) 2.76% 3.47%(5)
Portfolio Turnover Rate 41% 52% 51%
Net Assets, End of Period (in thousands) $158 $123 $26
(1) Six months ended September 30, 2007 (unaudited).
(2) May 31, 2005 (fund inception) through March 31, 2006.
(3) Computed using average shares outstanding throughout the period.
(4) Total return assumes reinvestment of net investment income and capital
gains distributions, if any. Total returns for periods less than one year are
not annualized. The total return of the classes may not precisely reflect the
class expense differences because of the impact of calculating the net asset
values to two decimal places. If net asset values were calculated to three
decimal places, the total return differences would more closely reflect the
class expense differences. The calculation of net asset values to two decimal
places is made in accordance with SEC guidelines and does not result in any
gain or loss of value between one class and another.
(5) Annualized.
See Notes to Financial Statements.
- ------
25
PROXY VOTING RESULTS
A special meeting of shareholders was held on July 27, 2007, to vote on the
following proposal. The proposal received the required number of votes of the
American Century Investment Trust and was adopted. A summary of voting results
is listed below the proposal.
PROPOSAL:
To elect eight Trustees to the Board of Trustees of American Century
Investment Trust (the proposal was voted on by all shareholders of funds
issued by American Century Investment Trust).
Jonathan S. Thomas For: 3,336,300,729
Withhold: 35,929,005
Abstain: 0
Broker Non-Vote: 0
John Freidenrich For: 3,337,319,127
Withhold: 34,910,607
Abstain: 0
Broker Non-Vote: 0
Ronald J. Gilson For: 3,337,806,752
Withhold: 34,422,982
Abstain: 0
Broker Non-Vote: 0
Kathryn A. Hall For: 3,337,653,997
Withhold: 34,575,737
Abstain: 0
Broker Non-Vote: 0
Peter F. Pervere For: 3,336,793,063
Withhold: 35,436,671
Abstain: 0
Broker Non-Vote: 0
Myron S. Scholes For: 3,335,709,158
Withhold: 36,520,576
Abstain: 0
Broker Non-Vote: 0
John B. Shoven For: 3,337,333,277
Withhold: 34,896,457
Abstain: 0
Broker Non-Vote: 0
Jeanne D. Wohlers For: 3,336,368,531
Withhold: 35,861,203
Abstain: 0
Broker Non-Vote: 0
- ------
26
APPROVAL OF MANAGEMENT AGREEMENT
Inflation Protection Bond
Under Section 15(c) of the Investment Company Act, contracts for investment
advisory services are required to be reviewed, evaluated and approved by a
majority of a fund's independent directors or trustees (the "Directors") each
year. At American Century, this process is referred to as the "15(c) Process."
As a part of this process, the board reviews fund performance, shareholder
services, audit and compliance information, and a variety of other reports
from the advisor concerning fund operations. In addition to this annual
review, the board of directors oversees and evaluates on a continuous basis at
its quarterly meetings the nature and quality of significant services
performed by the advisor, fund performance, audit and compliance information,
and a variety of other reports relating to fund operations. The board, or
committees of the board, also holds special meetings as needed.
Under a Securities and Exchange Commission rule, each fund is required to
disclose in its annual or semiannual report, as appropriate, the material
factors and conclusions that formed the basis for the board's approval or
renewal of any advisory agreements within the fund's most recently completed
fiscal half-year period.
ANNUAL CONTRACT REVIEW PROCESS
As part of the annual 15(c) Process undertaken during the most recent fiscal
half-year period, the Directors reviewed extensive data and information
compiled by the advisor and certain independent providers of evaluative data
(the "15(c) Providers") concerning Inflation Protection Bond (the "fund") and
the services provided to the fund under the management agreement. The
information considered and the discussions held at the meetings included, but
were not limited to:
* the nature, extent and quality of investment management, shareholder
services and other services provided to the fund under the management
agreement;
* reports on the advisor's activities relating to the wide range of programs
and services the advisor provides to the fund and its shareholders on a
routine and non-routine basis;
* data comparing the cost of owning the fund to the cost of owning a similar
fund;
* data comparing the fund's performance to appropriate benchmarks and/or a
peer group of other mutual funds with similar investment objectives and
strategies;
* financial data showing the profitability of the fund to the advisor and the
overall profitability of the advisor; and
* data comparing services provided and charges to other investment management
clients of the advisor.
In keeping with its practice, the fund's board of directors held two regularly
scheduled meetings to review and discuss the information provided by the
advisor and to complete its negotiations with the advisor regarding the
renewal of the management agreement, including the setting of the applicable
advisory fee. The board also had the benefit of the advice of its independent
counsel throughout the period.
- ------
27
FACTORS CONSIDERED
The Directors considered all of the information provided by the advisor, the
15(c) Providers, and the board's independent counsel, and evaluated such
information for each fund for which the board has responsibility. The
Directors did not identify any single factor as being all-important or
controlling, and each Director may have attributed different levels of
importance to different factors. In deciding to renew the agreement under the
terms ultimately determined by the board to be appropriate, the Directors'
decision was based on the following factors.
NATURE, EXTENT AND QUALITY OF SERVICES -- GENERALLY. Under the management
agreement, the advisor is responsible for providing or arranging for all
services necessary for the operation of the fund. The board noted that under
the management agreement, the advisor provides or arranges at its own expense
a wide variety of services including:
* fund construction and design
* portfolio security selection
* initial capitalization/funding
* securities trading
* custody of fund assets
* daily valuation of the fund's portfolio
* shareholder servicing and transfer agency, including shareholder
confirmations, recordkeeping and communications
* legal services
* regulatory and portfolio compliance
* financial reporting
* marketing and distribution
The Directors noted that many of these services have expanded over time both
in terms of quantity and complexity in response to shareholder demands,
competition in the industry and the changing regulatory environment. In
performing their evaluation, the Directors considered information received in
connection with the annual review, as well as information provided on an
ongoing basis at their regularly scheduled board and committee meetings.
INVESTMENT MANAGEMENT SERVICES. The nature of the investment management
services provided is quite complex and allows fund shareholders access to
professional money management, instant diversification of their investments
within an asset class, the opportunity to easily diversify among asset
classes, and liquidity. In evaluating investment performance, the board
expects the advisor to manage the fund in accordance with its investment
objectives and approved strategies. In providing these services, the advisor
utilizes teams of investment professionals (portfolio managers, analysts,
research assistants, and securities traders) who require extensive information
technology, research, training, compliance and other systems to conduct their
business.
- ------
28
At each quarterly meeting the Directors review investment performance
information for the fund, together with comparative information for
appropriate benchmarks and peer groups of funds managed similarly to the fund.
The Directors also review detailed performance information during the 15(c)
Process. If performance concerns are identified, the Directors discuss with
the advisor the reasons for such results (e.g., market conditions, security
selection) and any efforts being undertaken to improve performance. The
performance information presented to the Directors showed that the fund's
performance for the one-year period was above the median for its peer group.
SHAREHOLDER AND OTHER SERVICES. The advisor provides the fund with a
comprehensive package of transfer agency, shareholder, and other services. The
Directors review reports and evaluations of such services at their regular
quarterly meetings, including the annual meeting concerning contract review,
and reports to the board. These reports include, but are not limited to,
information regarding the operational efficiency and accuracy of the
shareholder and transfer agency services provided, staffing levels,
shareholder satisfaction (as measured by external as well as internal
sources), technology support, new products and services offered to fund
shareholders, securities trading activities, portfolio valuation services,
auditing services, and legal and operational compliance activities. Certain
aspects of shareholder and transfer agency service level efficiency and the
quality of securities trading activities are measured by independent third
party providers and are presented in comparison to other fund groups not
managed by the advisor.
COSTS OF SERVICES PROVIDED AND PROFITABILITY TO THE ADVISOR. The advisor
provides detailed information concerning its cost of providing various
services to the fund, its profitability in managing the fund, its overall
profitability, and its financial condition. The Directors have reviewed with
the advisor the methodology used to prepare this financial information. This
financial information regarding the advisor is considered in order to evaluate
the advisor's financial condition, its ability to continue to provide services
under the management agreement, and the reasonableness of the current
management fee.
ETHICS OF THE ADVISOR. The Directors generally consider the advisor's
commitment to providing quality services to shareholders and to conducting its
business ethically. They noted that the advisor's practices generally meet or
exceed industry best practices.
ECONOMIES OF SCALE. The Directors review reports provided by the advisor on
economies of scale for the complex as a whole and the year-over-year changes
in revenue, costs, and profitability. The Directors concluded that economies
of scale are difficult to measure and predict with precision, especially on a
fund-by-fund basis. This analysis is also complicated by the additional
services and content provided by the advisor and its reinvestment in its
ability to provide and expand those services. Accordingly, the Directors also
seek to evaluate economies of scale by reviewing other information, such as
year-over-year profitability of the advisor generally, the profitability of
its management of the fund specifically, the expenses incurred by the advisor
in providing various functions to the fund, and the breakpoint fees of
competitive funds not managed by the advisor. The Directors believe the
advisor is appropriately sharing economies of scale through its competitive
fee structure, fee breakpoints as the fund complex and the fund increases in
size, and through reinvestment in its business to provide shareholders
additional content and services. In particular, separate breakpoint schedules
based on the size of the entire fund complex and on the size of the fund
reflect the complexity of assessing economies of scale.
- ------
29
COMPARISON TO OTHER FUNDS' FEES. The fund pays the advisor a single,
all-inclusive (or unified) management fee for providing all services necessary
for the management and operation of the fund, other than brokerage expenses,
taxes, interest, extraordinary expenses, and the fees and expenses of the
fund's independent directors (including their independent legal counsel).
Under the unified fee structure, the advisor is responsible for providing all
investment advisory, custody, audit, administrative, compliance,
recordkeeping, marketing and shareholder services, or arranging and
supervising third parties to provide such services. By contrast, most other
funds are charged a variety of fees, including an investment advisory fee, a
transfer agency fee, an administrative fee, distribution charges and other
expenses. Other than their investment advisory fees and Rule 12b-1
distribution fees, all other components of the total fees charged by these
other funds may be increased without shareholder approval. The board believes
the unified fee structure is a benefit to fund shareholders because it clearly
discloses to shareholders the cost of owning fund shares, and, since the
unified fee cannot be increased without a vote of fund shareholders, it shifts
to the advisor the risk of increased costs of operating the fund and provides
a direct incentive to minimize administrative inefficiencies. Part of the
Directors' analysis of fee levels involves reviewing certain evaluative data
compiled by an independent provider and comparing the fund's unified fee to
the total expense ratio of other funds in the fund's peer group. The unified
fee charged to shareholders of the fund was in the lowest quartile of the
total expense ratios of its peer group.
COMPARISON TO FEES AND SERVICES PROVIDED TO OTHER CLIENTS OF THE ADVISOR. The
Directors also requested and received information from the advisor concerning
the nature of the services, fees, and profitability of its advisory services
to advisory clients other than the fund. They observed that these varying
types of client accounts require different services and involve different
regulatory and entrepreneurial risks than the management of the fund. The
Directors analyzed this information and concluded that the fees charged and
services provided to the fund were reasonable by comparison.
COLLATERAL BENEFITS DERIVED BY THE ADVISOR. The Directors reviewed information
from the advisor concerning collateral benefits it receives as a result of its
relationship with the fund. They concluded that the advisor's primary business
is managing mutual funds and it generally does not use fund or shareholder
information to generate profits in other lines of business, and therefore does
not derive any significant collateral benefits from them. The Directors noted
that the advisor receives proprietary research from broker-dealers that
execute fund portfolio transactions and concluded that this research is likely
to benefit fund shareholders. The Directors also determined that the advisor
is able to provide investment management services to certain clients other
than the fund, at least in part, due to its existing infrastructure built to
serve the fund complex. The Directors concluded, however, that the assets of
those other clients are not material to the analysis and, in any event, are
included with the assets of the fund to determine breakpoints in the fund's
fee schedule, provided they are managed using the same investment team and
strategy.
CONCLUSIONS OF THE DIRECTORS
As a result of this process, the Directors, in the absence of particular
circumstances and assisted by the advice of legal counsel that is independent
of the advisor, taking into account all of the factors discussed above and the
information provided by the advisor concluded that the investment management
agreement between the fund and the advisor is fair and reasonable in light of
the services provided and should be renewed.
- ------
30
SHARE CLASS INFORMATION
Six classes of shares are authorized for sale by the fund: Investor Class,
Institutional Class, A Class, B Class, C Class and R Class. The total expense
ratio of Institutional Class shares is lower than that of Investor Class
shares. The total expense ratios of A Class, B Class, C Class and R Class
shares are higher than that of Investor Class shares.
INVESTOR CLASS shares are available for purchase in two ways: 1) directly from
American Century without any commissions or other fees; and/or 2) through
certain financial intermediaries (such as banks, broker-dealers, insurance
companies and investment advisors), which may require payment of a transaction
fee to the financial intermediary. The fund's prospectus contains additional
information regarding eligibility for investor class shares.
INSTITUTIONAL CLASS shares are available to large investors such as
endowments, foundations, and retirement plans, and to financial intermediaries
serving these investors. This class recognizes the relatively lower cost of
serving institutional customers and others who invest at least $5 million ($3
million for endowments and foundations) in an American Century fund or at
least $10 million in multiple funds. In recognition of the larger investments
and account balances and comparatively lower transaction costs, the unified
management fee of Institutional Class shares is 0.20% less than the unified
management fee of Investor Class shares.
A CLASS shares are sold primarily through employer-sponsored retirement plans
and through institutions such as investment advisors, banks, broker-dealers,
and insurance companies. A Class shares are sold at their offering price,
which is net asset value plus an initial sales charge that ranges from 4.50%
to 0.00% for fixed-income funds, depending on the amount invested. The initial
sales charge is deducted from the purchase amount before it is invested. A
Class shares may be subject to a contingent deferred sales charge (CDSC).
There is no CDSC on shares acquired through reinvestment of dividends or
capital gains. The prospectus contains information regarding reductions and
waivers of sales charges for A Class shares. The unified management fee for A
Class shares is the same as for Investor Class shares. A Class shares also are
subject to a 0.25% annual Rule 12b-1 distribution and service fee.
B CLASS shares are sold primarily through employer-sponsored retirement plans
and through institutions such as investment advisors, banks, broker-dealers,
and insurance companies. B Class shares redeemed within six years of purchase
are subject to a CDSC that declines from 5.00% during the first year after
purchase to 0.00% after the sixth year. There is no CDSC on shares acquired
through reinvestment of dividends or capital gains. The unified management fee
for B Class shares is the same as for Investor Class shares. B Class shares
also are subject to a 1.00% annual Rule 12b-1 distribution and service fee. B
Class shares automatically convert to A Class shares (with lower expenses)
eight years after their purchase date.
C CLASS shares are sold primarily through employer-sponsored retirement plans
and through institutions such as investment advisors, banks, broker-dealers,
and insurance companies. C Class shares redeemed within 12 months of purchase
are subject to a CDSC of 1.00%. There is no CDSC on shares acquired through
reinvestment of dividends or capital gains. The unified management fee for C
Class shares is the same as for Investor Class shares. C Class shares also are
subject to a Rule 12b-1 distribution and service fee of 1.00%.
- ------
31
R CLASS shares are sold primarily through employer-sponsored retirement plans
and through institutions such as investment advisors, banks, broker-dealers,
and insurance companies. The unified management fee for R Class shares is the
same as for Investor Class shares. R Class shares are subject to a 0.50%
annual Rule 12b-1 distribution and service fee.
All classes of shares represent a pro rata interest in the fund and generally
have the same rights and preferences.
- ------
32
ADDITIONAL INFORMATION
RETIREMENT ACCOUNT INFORMATION
As required by law, any distributions you receive from an IRA or certain
403(b), 457 and qualified plans [those not eligible for rollover to an IRA or
to another qualified plan] are subject to federal income tax withholding,
unless you elect not to have withholding apply. Tax will be withheld on the
total amount withdrawn even though you may be receiving amounts that are not
subject to withholding, such as nondeductible contributions. In such case,
excess amounts of withholding could occur. You may adjust your withholding
election so that a greater or lesser amount will be withheld.
If you don't want us to withhold on this amount, you must notify us to not
withhold the federal income tax. Even if you plan to roll over the amount you
withdraw to another tax-deferred account, the withholding rate still applies
to the withdrawn amount unless we have received notice not to withhold federal
income tax prior to the withdrawal. You may notify us in writing or in certain
situations by telephone or through other electronic means. You have the right
to revoke your withholding election at any time and any election you make may
remain in effect until revoked by filing a new election.
Remember, even if you elect not to have income tax withheld, you are liable
for paying income tax on the taxable portion of your withdrawal. If you elect
not to have income tax withheld or you don't have enough income tax withheld,
you may be responsible for payment of estimated tax. You may incur penalties
under the estimated tax rules if your withholding and estimated tax payments
are not sufficient.
State tax will be withheld if, at the time of your distribution, your address
is within one of the mandatory withholding states and you have federal income
tax withheld. State taxes will be withheld from your distribution in
accordance with the respective state rules.
PROXY VOTING GUIDELINES
American Century Investment Management, Inc., the fund's investment advisor,
is responsible for exercising the voting rights associated with the securities
purchased and/or held by the fund. A description of the policies and
procedures the advisor uses in fulfilling this responsibility is available
without charge, upon request, by calling 1-800-345-2021. It is also available
on American Century's website at americancentury.com and on the Securities and
Exchange Commission's website at sec.gov. Information regarding how the
investment advisor voted proxies relating to portfolio securities during the
most recent 12-month period ended June 30 is available on the "About Us" page
at americancentury.com. It is also available at sec.gov.
QUARTERLY PORTFOLIO DISCLOSURE
The fund files its complete schedule of portfolio holdings with the Securities
and Exchange Commission (SEC) for the first and third quarters of each fiscal
year on Form N-Q. The fund's Form N-Q is available on the SEC's website at
sec.gov, and may be reviewed and copied at the SEC's Public Reference Room in
Washington, DC. Information on the operation of the Public Reference Room may
be obtained by calling 1-800-SEC-0330. The fund also makes its complete
schedule of portfolio holdings for the most recent quarter of its fiscal year
available on its website at americancentury.com and, upon request, by calling
1-800-345-2021.
- ------
33
INDEX DEFINITIONS
The following indices are used to illustrate investment market, sector, or
style performance or to serve as fund performance comparisons. They are not
investment products available for purchase.
The CITIGROUP AGENCY INDEX is a market-capitalization-weighted index that
includes U.S. government sponsored agencies with a remaining maturity of at
least one year.
The CITIGROUP CREDIT INDEX includes US and non-US corporate securities and
non-US sovereign and provincial securities.
The CITIGROUP MORTGAGE INDEX measures the mortgage component of the US BIG
Index, comprising 30-and 15-year GNMA, FNMA, and FHLMC pass-throughs and FNMA
and FHLMC balloon mortgages.
The CITIGROUP TREASURY INDEX is comprised of U.S. Treasury securities with an
amount outstanding of at least $5 billion and a remaining maturity of at least
one year.
The CITIGROUP US BROAD INVESTMENT-GRADE (BIG) BOND INDEX is a market-
capitalization-weighted index that includes fixed-rate Treasury, government-
sponsored, mortgage, asset-backed, and investment-grade issues with a maturity
of one year or longer.
The CITIGROUP US HIGH-YIELD MARKET INDEX captures the performance of
below-investment-grade debt issued by corporations domiciled in the United
States or Canada. This index includes cash-pay and deferred-interest
securities that are publicly placed, have a fixed coupon, and are
nonconvertible.
The CITIGROUP US INFLATION-LINKED SECURITIES INDEX (ILSI) measures the return
of bonds with fixed-rate coupon payments that adjust for inflation as measured
by the Consumer Price Index (CPI).
- ------
34
NOTES
- ------
35
NOTES
- ------
36
[back cover]
CONTACT US
AMERICANCENTURY.COM
AUTOMATED INFORMATION LINE:
1-800-345-8765
INVESTOR SERVICES REPRESENTATIVE:
1-800-345-2021 or 816-531-5575
INVESTORS USING ADVISORS:
1-800-378-9878
BUSINESS, NOT-FOR-PROFIT,
EMPLOYER-SPONSORED RETIREMENT PLANS:
1-800-345-3533
BANKS AND TRUST COMPANIES, BROKER-DEALERS,
FINANCIAL PROFESSIONALS, INSURANCE COMPANIES:
1-800-345-6488
TELECOMMUNICATIONS DEVICE FOR THE DEAF:
1-800-634-4113 or 816-444-3485
AMERICAN CENTURY INVESTMENT TRUST
INVESTMENT ADVISOR:
American Century Investment Management, Inc.
Kansas City, Missouri
THIS REPORT AND THE STATEMENTS IT CONTAINS ARE SUBMITTED FOR THE GENERAL
INFORMATION OF OUR SHAREHOLDERS. THE REPORT IS NOT AUTHORIZED FOR DISTRIBUTION
TO PROSPECTIVE INVESTORS UNLESS PRECEDED OR ACCOMPANIED BY AN EFFECTIVE
PROSPECTUS.
American Century Investment Services, Inc., Distributor
©2007 American Century Proprietary Holdings, Inc. All rights reserved.
The American Century Investments logo, American Century and American Century
Investments are service marks of American Century Proprietary Holdings, Inc.
0711
SH-SAN-56801N
[front cover]
AMERICAN CENTURY INVESTMENTS
Semiannual Report September 30, 2007
[photo of fall]
American Century-Mason Street Select Bond Fund
American Century-Mason Street High-Yield Bond Fund
[american century investments logo and text logo]
OUR MESSAGE TO YOU
To help you monitor your investment, my colleagues and I take pride in
providing you with the semiannual report for the American Century®-Mason
Street Select Bond and High-Yield Bond funds for the six months ended
September 30, 2007. This has been an eventful and exciting period for us.
We've been working diligently to secure a smooth executive leadership
transition.
I'm honored to be addressing you in the "Our Message" space long devoted to
company founder Jim Stowers, Jr. and his son Jim Stowers III. The Stowers
family remains an integral part of our heritage, leadership, and financial
structure. Jim Jr. continues as co-chair of the American Century Companies,
Inc. (ACC) board of directors with Richard Brown, who has been on the board
since 1998 and co-chairs the Stowers Institute for Medical Research board.
But times and opportunities change. As the latest step in a career transition
that began when he relinquished his executive leadership and investment
management responsibilities in early 2005, Jim III stepped down from the ACC
board in July 2007 to focus on new business ventures. Jim III's move reflects
his family's comfort with our direction and leadership, and gives the Stowers
more leeway to devote time and energy to other important priorities, such as
the Stowers Institute for Medical Research.
Meanwhile, American Century Investments, our clients, and our employees have
been my top priority since I became company president and CEO in March. We've
also added the executive talents of overall chief investment officer Enrique
Chang, international equity CIO Mark On, U.S. growth equity CIO Steve Lurito,
and chief operating officer Barry Fink.
This skilled group, combined with our existing senior management team, has
already had a positive impact on the development and management of the
products and services we take pride in delivering to you.
/s/Jonathan Thomas
Jonathan Thomas
[photo of Jonathan Thomas]
Jonathan Thomas
PRESIDENT
AMERICAN CENTURY COMPANIES, INC.
[photo of James E. Stowers, Jr.]
James E. Stowers, Jr.
FOUNDER AND CO-CHAIRMAN OF THE BOARD
AMERICAN CENTURY COMPANIES, INC.
[photo of Richard Brown]
Richard Brown
CO-CHAIRMAN OF THE BOARD
AMERICAN CENTURY COMPANIES, INC.
TABLE OF CONTENTS
Market Perspective. . . . . . . . . . . . . . . . . . . . . . . . . . 2
U.S. Fixed-Income Total Returns. . . . . . . . . . . . . . . . . . . 2
SELECT BOND
Performance . . . . . . . . . . . . . . . . . . . . . . . . . . . . . 3
Portfolio Commentary. . . . . . . . . . . . . . . . . . . . . . . . . 5
Portfolio at a Glance. . . . . . . . . . . . . . . . . . . . . . . . 5
Yields . . . . . . . . . . . . . . . . . . . . . . . . . . . . . . . 5
Types of Investments in Portfolio. . . . . . . . . . . . . . . . . . 6
Portfolio Composition by Credit Rating . . . . . . . . . . . . . . . 6
Schedule of Investments . . . . . . . . . . . . . . . . . . . . . . . 7
HIGH-YIELD BOND
Performance . . . . . . . . . . . . . . . . . . . . . . . . . . . . . 16
Portfolio Commentary. . . . . . . . . . . . . . . . . . . . . . . . . 18
Portfolio at a Glance. . . . . . . . . . . . . . . . . . . . . . . . 18
Yields . . . . . . . . . . . . . . . . . . . . . . . . . . . . . . . 18
Top Five Industries. . . . . . . . . . . . . . . . . . . . . . . . . 19
Portfolio Composition by Credit Rating . . . . . . . . . . . . . . . 19
Schedule of Investments . . . . . . . . . . . . . . . . . . . . . . . 20
Shareholder Fee Examples. . . . . . . . . . . . . . . . . . . . . . . 27
FINANCIAL STATEMENTS
Statement of Assets and Liabilities . . . . . . . . . . . . . . . . . 30
Statement of Operations . . . . . . . . . . . . . . . . . . . . . . . 32
Statement of Changes in Net Assets. . . . . . . . . . . . . . . . . . 33
Notes to Financial Statements . . . . . . . . . . . . . . . . . . . . 34
Financial Highlights. . . . . . . . . . . . . . . . . . . . . . . . . 41
OTHER INFORMATION
Proxy Voting Results. . . . . . . . . . . . . . . . . . . . . . . . . 53
Approval of Management Agreements for Select Bond
and High-Yield Bond . . . . . . . . . . . . . . . . . . . . . . . . . 54
Share Class Information . . . . . . . . . . . . . . . . . . . . . . . 59
Additional Information. . . . . . . . . . . . . . . . . . . . . . . . 61
Index Definitions . . . . . . . . . . . . . . . . . . . . . . . . . . 62
The opinions expressed in the Market Perspective and each of the Portfolio
Commentaries reflect those of the portfolio management team as of the date of
the report, and do not necessarily represent the opinions of American Century
or any other person in the American Century organization. Any such opinions
are subject to change at any time based upon market or other conditions and
American Century disclaims any responsibility to update such opinions. These
opinions may not be relied upon as investment advice and, because investment
decisions made by American Century funds are based on numerous factors, may
not be relied upon as an indication of trading intent on behalf of any
American Century fund. Security examples are used for representational
purposes only and are not intended as recommendations to purchase or sell
securities. Performance information for comparative indices and securities is
provided to American Century by third party vendors. To the best of American
Century's knowledge, such information is accurate at the time of printing.
MARKET PERSPECTIVE
[photo of Chief Investment Officer]
By David MacEwen, Chief Investment Officer, Fixed Income
MODEST GROWTH, INFLATION, BOND RETURNS
U.S. bonds managed positive returns during the six months ended September 30,
2007. But the ride was bumpy--bond market volatility surged to the highest
level in years as waves from the bursting housing and subprime mortgage
bubbles spread to the broader economy and financial markets.
U.S. economic growth was moderate over the last four complete calendar
quarters, running at an approximately 2-3% average annual rate. Many
economists are calling for sub-2% growth going forward. Inflation slowed, as
the trailing 12-month percentage change in core consumer prices (without
volatile food and energy prices) finished September at 2.1%. That's down from
2.9% as recently as September 2006.
To help alleviate some of the market and economic concerns, the Federal
Reserve (the Fed) lowered its benchmark federal funds rate target in
September. This came on top of cuts to its discount rate in both August and
September--the Fed's first rate cuts since June 2003.
RATES FELL, CURVE STEEPENED
Against that backdrop, Treasury yields generally declined. The yield on the
two-year Treasury note fell from 4.58% to 3.99%; however, yields on
longer-term notes and bonds fell less. That's because investors worried about
the potential long-term inflation effects of Fed rate cuts, high energy and
commodity prices, and a weaker dollar. As a result, the yield curve (a graphic
representation of bond yields at different maturities) fell and steepened--the
difference in yield between two- and 10-year Treasury securities increased
sharply from seven to 60 basis points (a basis point equals 0.01%).
HIGH-QUALITY BONDS DID BEST
The volatility, credit, and liquidity concerns in the market all favored
Treasury securities over higher-yielding, lower-quality alternatives (see the
returns table above). So, for example, while the Treasury market enjoyed its
best quarter in five years from July to September, July was one of the worst
months on record for high-yield bonds. Treasury inflation-indexed securities
performed best because of their combination of high credit quality and
inflation protection.
U.S. Fixed-Income Total Returns
For the six months ended September 30, 2007*
TREASURY SECURITIES
3-Month Bill 2.69%
2-Year Note 3.25%
5-Year Note 3.60%
10-Year Note 2.72%
30-Year Bond 2.57%
CITIGROUP US BOND MARKET INDICES
High-Yield (corporate) 0.65%
Credit (investment-grade corporate) 1.50%
Mortgage 2.16%
Broad Investment-Grade (multi-sector) 2.42%
Agency 3.04%
Treasury 3.38%
Inflation-Linked Securities 3.76%
*Total returns for periods less than one year are not annualized.
- ------
2
PERFORMANCE
Select Bond
Total Returns as of September 30, 2007
Average Annual Returns
6 10 Since Inception
months(1) 1 year 5 years years Inception Date
A CLASS
No sales
charge*
With sales 1.28% 3.90% 3.39% 5.61% 6.18%
charge* -3.32% -0.74% 2.45% 5.13% 5.72% 3/31/97
CITIGROUP US
BROAD
INVESTMENT-GRADE
BOND INDEX 2.42% 5.25% 4.23% 6.01% 6.40% --
Investor Class 1.40% 4.14% -- -- 4.99% 4/3/06
Institutional
Class 1.50% 4.34% -- -- 5.20% 4/3/06
B Class
No sales
charge*
With sales 0.95%(2) 3.23%(2) 2.72%(2) 4.93% 5.49%
charge* -4.05%(2) -0.77%(2) 2.54%(2) 4.93% 5.49% 3/31/97
C Class
No sales
charge*
With sales 0.89% 3.10% -- -- 3.95%
charge* -0.10% 3.10% -- -- 3.95% 4/3/06
R Class 1.14% 3.62% -- -- 4.47% 4/3/06
* Sales charges include initial sales charges and contingent deferred sales
charges (CDSCs), as applicable. A Class shares have a 4.50% maximum initial
sales charge for fixed income funds and may be subject to a maximum CDSC of
1.00%. B Class shares redeemed within six years of purchase are subject to a
CDSC that declines from 5.00% during the first year after purchase to 0.00%
the sixth year after purchase. C Class shares redeemed within 12 months of
purchase are subject to a maximum CDSC of 1.00%. Please see the Share Class
Information pages for more about the applicable sales charges for each share
class. The SEC requires that mutual funds provide performance information net
of maximum sales charges in all cases where charges could be applied.
Select Bond acquired all of the net assets of the Mason Street Select Bond
Fund on March 31, 2006, pursuant to a plan of reorganization approved by the
acquired fund's shareholders on March 23, 2006. Performance information prior
to April 1, 2006 is that of the Mason Street Select Bond Fund.
(1) Total returns for periods less than one year are not annualized.
(2) Class returns would have been lower if fees had not been waived.
Data presented reflect past performance. Past performance is no guarantee of
future results. Current performance may be higher or lower than the
performance shown. Investment return and principal value will fluctuate, and
redemption value may be more or less than original cost. To obtain performance
data current to the most recent month end, please call 1-800-345-2021 or visit
americancentury.com. As interest rates rise, bond values will decline.
Unless otherwise indicated, performance reflects A Class shares; performance
for other share classes will vary due to differences in fee structure. For
information about other share classes available, please consult the
prospectus. Data assumes reinvestment of dividends and capital gains, and none
of the charts reflect the deduction of taxes that a shareholder would pay on
fund distributions or the redemption of fund shares. Returns for the index are
provided for comparison. The fund's total returns include operating expenses
(such as transaction costs and management fees) that reduce returns, while the
total returns of the index do not.
- ------
3
Select Bond
Growth of $10,000 Over 10 Years
$10,000 investment made September 30, 1997*
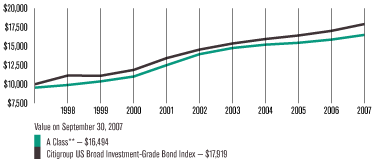
One-Year Returns Over 10 Years
Periods ended September 30
1998 1999 2000 2001 2002 2003 2004 2005 2006 2007
A Class** (no
sales charge) 3.69% 4.81% 6.15% 13.58% 11.56% 5.80% 2.98% 1.61% 2.72% 3.90%
Citigroup US
Broad
Investment-Grade
Bond Index 11.47% -0.26% 6.92% 13.06% 8.38% 5.49% 3.82% 2.92% 3.71% 5.25%
* Select Bond A Class's initial investment is $9,550 to reflect the maximum
4.50% initial sales charge.
** Class returns would have been lower, along with the ending value, if fees
had not been waived.
Data presented reflect past performance. Past performance is no guarantee of
future results. Current performance may be higher or lower than the
performance shown. Investment return and principal value will fluctuate, and
redemption value may be more or less than original cost. To obtain performance
data current to the most recent month end, please call 1-800-345-2021 or visit
americancentury.com. As interest rates rise, bond values will decline.
Unless otherwise indicated, performance reflects A Class shares; performance
for other share classes will vary due to differences in fee structure. For
information about other share classes available, please consult the
prospectus. Data assumes reinvestment of dividends and capital gains, and none
of the charts reflect the deduction of taxes that a shareholder would pay on
fund distributions or the redemption of fund shares. Returns for the index are
provided for comparison. The fund's total returns include operating expenses
(such as transaction costs and management fees) that reduce returns, while the
total returns of the index do not.
- ------
4
PORTFOLIO COMMENTARY
Select Bond
Portfolio Manager: David Ells
PERFORMANCE SUMMARY
American Century-Mason Street Select Bond returned 1.28%* for the six months
ended September 30, 2007. By comparison, the fund's benchmark, the Citigroup
US Broad Investment-Grade Bond Index, returned 2.42%. Portfolio returns
reflect operating expenses, while the index returns do not.
The portfolio's absolute return reflected the challenging climate for taxable
bonds (see the Market Perspective on page 2). Relative to the benchmark, the
portfolio underperformed largely as a result of our sector allocations--we
held underweight positions in Treasurys and overweight positions in
higher-yielding "spread products" (mortagage-backed and corporate securities).
SECTOR ALLOCATION DETRACTED
Far and away the largest factor explaining the portfolio's performance
relative to the benchmark was our overweight position in corporate and
mortgage-backed securities (MBS) and underweight position in Treasurys. We
view this positioning as a long-term, strategic trade that we believe is
likely to deliver outperformance over time. Consider that there are two
components to a bond fund's total return--income and price changes. Other
things being equal, higher-yielding spread products such as mortgages and
corporates should outperform Treasury bonds over time.
But for short periods, price changes can overwhelm these bonds' income
advantage, which is exactly what happened in recent quarters. The jump in
interest rate volatility limited MBS returns, while a "re-pricing of risk"
beginning in June led to the underperformance of corporates and other
higher-yielding, lower-quality bonds at a time when Treasurys enjoyed their
best results in years.
HIGH-QUALITY MORTGAGES, CORPORATES
It's also worth mentioning how we derived our MBS and corporate exposure. In
mortgages, we're careful about how we invest in this sector, and had
essentially zero subprime exposure. We favored high-quality mortgages from
Fannie Mae and Freddie Mac--two large, government-sponsored entities
originally created by Congress during the Great Depression that buy mortgages
and re-package them as MBS for sale to investors.
Portfolio at a Glance
As of As of
9/30/07 3/31/07
Weighted Average Maturity 6.3 years 6.8 years
Average Duration (effective) 4.9 years 4.6 years
Yields as of September 30, 2007
30-day SEC Yield
Investor Class 4.72%
Institutional Class 4.92%
A Class(1) 4.28%
B Class(1) 3.83%
C Class 3.71%
R Class 4.22%
(1) The yields presented reflect the waiver of a portion of the class's
distribution and service fees. Without such waiver, the 30-day yields would
have been lower.
* All fund returns referenced in this commentary are for A Class shares and
are not reduced by sales charges. A Class shares are subject to a maximum
sales charge of 4.50%. Had the sales charge been applied or if distribution
and service fees had not been waived, returns would be lower than those shown.
Total returns for periods less than one year are not annualized.
- ------
5
Select Bond
Within corporates, we prefer short- and intermediate-term securities to
long-term bonds. We like this strategy because it gives us the extra yield
corporates offer, but without the price volatility associated with long-term
bonds. In addition, we tend to hold an overweight position in higher-quality
bonds from more defensive sectors, such as utilities and cable, and
underweight positions in select consumer discretionary and financial sector
bonds. We view this as a longer-term trade consistent with our view of
economic growth, interest rates, corporate credit quality, and yield spreads.
DURATION HAD LIMITED EFFECT
We managed the fund's duration, or price sensitivity to interest rate changes,
conservatively. With rate volatility surging, we preferred to keep duration
close to that of our benchmark. In addition, yields on intermediate-term notes
ended the period about where they began, despite a wild ride in between.
That's because even though the economy slowed and the Federal Reserve cut
interest rates, many in the bond market were worried about the potential for
inflation down the road. As a result, we gave up little performance to limit
the fund's risk relative to its index.
OUTLOOK
"We continue to focus on our relative-value approach to investing, looking for
what we believe to be high-quality securities trading at attractive
valuations. In terms of sector allocation, we're likely to continue to favor
higher-yielding spread products because we think this steady, long-term
approach to investing is the best way to generate outperformance over time,"
says portfolio manager David Ells. "We remain cautious about the effect of the
housing downturn on the consumer and broader economy. As a result, we'll work
to position the portfolio defensively in terms of credit and sector exposures.
And with rates likely to be volatile for some time, we expect to continue to
manage the portfolio's duration fairly conservatively."
Types of Investments in Portfolio
% of net % of net
assets as of assets as of
9/30/07 3/31/07
Mortgage-Backed Securities 36.3% 38.8%
Corporate Bonds 35.3% 34.3%
CMOs 13.3% 11.8%
U.S. Treasury Securities 8.4% 6.4%
Asset-Backed Securities 5.4% 5.8%
U.S. Government Agency Securities 1.2% 1.1%
Sovereign Governments & Agencies 0.8% 1.2%
Commercial Paper -- 4.7%
Temporary Cash Investments 0.5% 0.5%
Other Assets and Liabilities (1.2)% (4.6)%
Portfolio Composition by Credit Rating
% of fund % of fund
investments investments
as of as of
9/30/07 3/31/07
AAA 64% 64%
AA 4% 5%
A 10% 11%
BBB 19% 17%
BB 3% 3%
- ------
6
SCHEDULE OF INVESTMENTS
Select Bond
SEPTEMBER 30, 2007 (UNAUDITED)
Principal Amount Value
U.S. Government Agency Mortgage-Backed Securities(1) -- 36.3%
$ 305,000 FHLMC, 6.00%, settlement date 11/13/07(2) $ 305,143
685,533 FHLMC, 4.50%, 5/1/19 660,759
302,861 FHLMC, 5.00%, 10/1/19 297,455
912,524 FHLMC, 5.00%, 11/1/19 896,235
63,856 FHLMC, 5.50%, 11/1/19 63,748
82,862 FHLMC, 5.50%, 11/1/19 82,720
91,829 FHLMC, 5.50%, 11/1/19 91,672
93,789 FHLMC, 5.50%, 11/1/19 93,629
128,471 FHLMC, 5.50%, 11/1/19 128,252
79,581 FHLMC, 5.50%, 12/1/19 79,445
26,741 FHLMC, 5.00%, 2/1/20 26,223
60,131 FHLMC, 5.00%, 2/1/20 58,967
141,722 FHLMC, 5.50%, 3/1/20 141,380
170,737 FHLMC, 5.50%, 3/1/20 170,325
332,243 FHLMC, 5.50%, 3/1/20 331,442
33,452 FHLMC, 5.00%, 5/1/20 32,805
91,102 FHLMC, 5.00%, 5/1/20 89,338
184,484 FHLMC, 5.00%, 5/1/20 180,913
137,061 FHLMC, 4.00%, 10/1/20 128,913
520,132 FHLMC, 5.50%, 6/1/35 510,014
2,018,374 FHLMC, 5.00%, 11/1/35 1,928,807
1,247,713 FHLMC, 5.50%, 5/1/37 1,221,937
1,759,311 FNMA, 6.00%, settlement date 11/13/07(2) 1,760,136
312,143 FNMA, 5.32%, 4/1/14 311,754
479,460 FNMA, 5.17%, 1/1/16 471,095
1,122,166 FNMA, 5.29%, 4/1/16 1,109,483
253,000 FNMA, 5.38%, 1/1/17 254,940
143,351 FNMA, 4.00%, 6/1/19 135,125
1,062,186 FNMA, 4.50%, 6/1/19 1,024,056
916,838 FNMA, 4.50%, 8/1/19 883,925
97,897 FNMA, 6.00%, 10/1/19 99,238
114,888 FNMA, 4.50%, 12/1/19 110,764
184,811 FNMA, 5.00%, 3/1/20 181,231
193,175 FNMA, 5.00%, 3/1/20 189,728
155,261 FNMA, 5.00%, 4/1/20 152,254
46,940 FNMA, 5.00%, 5/1/20 46,031
215,100 FNMA, 5.00%, 5/1/20 210,933
378,048 FNMA, 5.00%, 5/1/20 370,726
532,999 FNMA, 4.50%, 7/1/20 513,494
450,618 FNMA, 5.50%, 9/1/34 442,349
783,490 FNMA, 6.00%, 10/1/34 786,481
1,460,256 FNMA, 5.00%, 11/1/34 1,396,828
575,776 FNMA, 6.00%, 11/1/34 577,975
48,476 FNMA, 5.50%, 3/1/35 47,547
Principal Amount Value
$ 58,963 FNMA, 5.50%, 3/1/35 $57,833
92,151 FNMA, 5.50%, 3/1/35 90,385
302,677 FNMA, 5.50%, 3/1/35 296,874
360,019 FNMA, 5.50%, 3/1/35 353,117
429,719 FNMA, 5.00%, 4/1/35 410,638
40,846 FNMA, 6.00%, 5/1/35 40,948
10,064 FNMA, 6.00%, 6/1/35 10,089
46,424 FNMA, 6.00%, 6/1/35 46,541
1,425,039 FNMA, 5.00%, 7/1/35 1,361,762
270,211 FNMA, 5.50%, 7/1/35 265,031
280,488 FNMA, 6.00%, 7/1/35 281,190
443,219 FNMA, 5.50%, 8/1/35 434,722
130,212 FNMA, 5.50%, 9/1/35 127,716
301,519 FNMA, 5.50%, 9/1/35 295,739
319,815 FNMA, 5.50%, 9/1/35 313,685
533,366 FNMA, 5.50%, 9/1/35 523,141
607,682 FNMA, 5.50%, 9/1/35 596,033
495,902 FNMA, 5.00%, 10/1/35 473,882
1,241,021 FNMA, 5.50%, 10/1/35 1,217,230
218,663 FNMA, 6.00%, 10/1/35 219,211
475,989 FNMA, 5.50%, 11/1/35 466,864
1,828,505 FNMA, 5.50%, 11/1/35 1,793,453
119,038 FNMA, 6.50%, 11/1/35 121,367
252,494 FNMA, 6.50%, 11/1/35 257,433
687,571 FNMA, 6.50%, 12/1/35 701,022
223,414 FNMA, 6.50%, 4/1/36 227,549
495,428 FNMA, 6.00%, 9/1/36 496,330
131,983 FNMA, 5.50%, 12/1/36 129,320
213,611 FNMA, 5.50%, 12/1/36 209,302
195,324 FNMA, 5.50%, 1/1/37 191,350
159,286 FNMA, 5.50%, 2/1/37 156,073
584,267 FNMA, 6.50%, 7/1/37 595,020
668,410 FNMA, 6.50%, 8/1/37 680,712
1,039,254 FNMA, 6.50%, 8/1/37 1,058,381
1,541,737 FNMA, 6.50%, 8/1/37 1,570,111
122,834 GNMA, 5.50%, 2/15/32 121,333
203,883 GNMA, 5.50%, 2/15/32 201,390
-----------
TOTAL U.S. GOVERNMENT AGENCY MORTGAGE-BACKED SECURITIES
(Cost $35,540,248) 34,988,992
-----------
Corporate Bonds -- 35.3%
AEROSPACE & DEFENSE -- 2.1%
315,000 BAE Systems Holdings Inc., 4.75%, 8/15/10 (Acquired
3/21/06, Cost $305,566)(3) 311,605
313,000 Boeing Capital Corp., 4.75%, 8/25/08 312,839
316,000 General Dynamics Corp., 3.00%, 5/15/08 312,201
- ------
7
Select Bond
Principal Amount Value
$ 139,000 General Dynamics Corp., 4.25%, 5/15/13 $ 131,231
370,000 L-3 Communications Corp., 6.375%, 10/15/15 365,375
75,000 Lockheed Martin Corp., 6.15%, 9/1/36 76,065
462,000 Raytheon Company, 5.50%, 11/15/12 467,680
50,000 United Technologies Corp., 6.35%, 3/1/11 52,385
-----------
2,029,381
-----------
AUTO COMPONENTS -- 0.2%
104,000 Johnson Controls, Inc., 5.50%, 1/15/16 102,598
63,000 Johnson Controls, Inc., 6.00%, 1/15/36 61,037
-----------
163,635
-----------
AUTOMOBILES -- 0.4%
315,000 DaimlerChrysler N.A. Holding Corp., 5.75%, 5/18/09 318,416
25,000 DaimlerChrysler N.A. Holding Corp., 8.50%, 1/18/31 31,077
-----------
349,493
-----------
BEVERAGES -- 0.7%
15,000 Anheuser-Busch Companies, Inc., 5.95%, 1/15/33 14,663
25,000 Anheuser-Busch Companies, Inc., 5.75%, 4/1/36 23,841
160,000 Constellation Brands Inc., 7.25%, 9/1/16 160,800
98,000 Fortune Brands Inc., 5.375%, 1/15/16 93,087
95,000 PepsiCo, Inc., 5.15%, 5/15/12 96,064
285,000 SABMiller plc, 6.20%, 7/1/11 (Acquired 6/27/06, Cost
$284,798)(3) 294,683
-----------
683,138
-----------
CAPITAL MARKETS -- 1.5%
35,000 Credit Suisse Group Finance (Guernsey) Ltd., VRN,
5.86%, 12/29/49 33,165
25,000 Eaton Vance Corp., 6.50%, 10/2/17 24,955
402,000 Goldman Sachs Group, Inc. (The), 5.15%, 1/15/14 390,548
25,000 Lehman Brothers Holdings Inc., 4.80%, 3/13/14 23,286
90,000 Lehman Brothers Holdings Inc., 5.75%, 1/3/17 86,647
110,000 Lehman Brothers Holdings Inc., 5.875%, 11/15/17 106,647
Principal Amount Value
$ 30,000 Lehman Brothers Holdings Inc., 7.00%, 9/27/27 $ 30,800
10,000 Lehman Brothers Holdings Inc., 6.875%, 7/17/37 9,951
50,000 Mellon Bank N.A., 5.45%, 4/1/16 48,205
205,000 Merrill Lynch & Co., Inc., 5.70%, 5/2/17 199,670
15,000 Merrill Lynch & Co., Inc., 6.40%, 8/28/17 15,505
20,000 Merrill Lynch & Co., Inc., 6.22%, 9/15/26 19,641
110,000 Morgan Stanley, 6.25%, 8/9/26 108,623
80,000 Northern Trust Corp., 5.30%, 8/29/11 80,518
250,000 State Street Bank & Trust Co., 5.30%, 1/15/16 241,289
-----------
1,419,450
-----------
COMMERCIAL BANKS -- 2.4%
186,000 Bank of New York Co. Inc. (The), 4.95%, 1/14/11 185,316
422,000 Bank One Corp., 5.25%, 1/30/13 418,843
180,000 Barclays Bank plc, 5.93%, 12/15/49 (Acquired
9/20/07-9/21/07, Cost $163,852)(3) 171,072
22,000 BB&T Corp., 4.90%, 6/30/17 20,331
20,000 BNP Paribas, 5.19%, 6/29/49 (Acquired 9/21/07, Cost
$18,063)(3) 18,358
114,000 Deutsche Bank Capital Funding Trust VII, 5.63%,
1/19/49, (Acquired 5/9/06-9/21/07, Cost $107,331)(3) 106,088
250,000 Marshall & Ilsley Bank, 5.15%, 2/22/12 249,394
255,000 National Australia Bank Ltd., 4.80%, 4/6/10
(Acquired 3/30/05, Cost $254,709)(3) 255,769
60,000 PNC Funding Corp., 5.625%, 2/1/17 58,746
75,000 U.S. Bank N.A., 4.80%, 4/15/15 70,797
93,000 UnionBanCal Corp., 5.25%, 12/16/13 90,702
380,000 Wachovia Corp., 5.35%, 3/15/11 380,686
25,000 Wells Fargo Bank N.A., 5.75%, 5/16/16 25,258
279,000 Zions Bancorporation, 5.50%, 11/16/15 268,354
-----------
2,319,714
-----------
- ------
8
Select Bond
Principal Amount Value
COMMUNICATIONS EQUIPMENT(4)
$ 35,000 Cisco Systems Inc., 5.50%, 2/22/16 $ 34,824
-----------
COMPUTERS & PERIPHERALS -- 0.1%
70,000 Seagate Technology HDD Holdings, 6.80%, 10/1/16 68,775
-----------
CONSTRUCTION MATERIALS -- 0.1%
75,000 CRH America Inc., 6.00%, 9/30/16 72,997
-----------
CONSUMER FINANCE -- 0.3%
285,000 SLM Corporation, 5.45%, 4/25/11 268,777
45,000 SLM Corporation, 5.375%, 5/15/14 39,324
-----------
308,101
-----------
DIVERSIFIED FINANCIAL SERVICES -- 1.3%
30,000 Bank of America Corp., 5.625%, 10/14/16 30,028
20,000 Capmark Financial Group Inc., 6.30%, 5/10/17
(Acquired 5/3/07, Cost $19,968)(3) 17,436
140,000 Citigroup Inc., 5.125%, 5/5/14 136,542
195,000 GMAC LLC, 6.00%, 12/15/11 180,143
425,000 HSBC Finance Corp., 4.125%, 11/16/09 414,438
276,000 International Lease Finance Corp., 4.75%, 1/13/12 267,794
197,000 John Deere Capital Corp., 4.50%, 8/25/08 195,686
-----------
1,242,067
-----------
DIVERSIFIED TELECOMMUNICATION SERVICES -- 1.8%
224,000 AT&T Corp., 8.00%, 11/15/07 273,349
159,000 AT&T Corp., 7.30%, 11/15/11 170,963
45,000 British Telecommunications plc, 9.125%, 12/15/30 59,756
85,000 Deutsche Telekom International Finance BV, 5.75%,
3/23/16 84,135
105,000 Embarq Corp., 6.74%, 6/1/13 109,300
80,000 Embarq Corp., 7.08%, 6/1/16 83,069
15,000 Embarq Corp., 8.00%, 3/1/36 16,029
125,000 France Telecom SA, 8.50%, 3/1/31 161,129
210,000 Sprint Capital Corp., 8.375%, 3/15/12 231,433
20,000 Sprint Capital Corp., 6.90%, 5/1/19 20,119
62,000 Sprint Capital Corp., 8.75%, 3/15/32 71,292
146,000 Telecom Italia Capital SA, 4.00%, 1/15/10 142,224
Principal Amount Value
$ 175,000 Telecom Italia Capital SA, 6.20%, 7/18/11 $ 179,472
175,000 Verizon Global Funding Corp., 5.85%, 9/15/35 167,735
-----------
1,770,005
-----------
ELECTRIC UTILITIES -- 4.8%
45,000 Bruce Mansfield Plant Units 1 & 2, 6.85%, 6/1/34 46,121
60,000 Carolina Power & Light Co., 6.50%, 7/15/12 62,996
35,000 Carolina Power & Light Co., 5.15%, 4/1/15 33,976
634,000 DTE Energy Co., 7.05%, 6/1/11 668,009
148,000 Duquesne Light Holdings, Inc., 5.50%, 8/15/15 139,819
153,000 Entergy Mississippi Inc., 6.25%, 4/1/34 143,197
25,000 Exelon Generation Co. LLC, 6.20%, 10/1/17 25,066
100,000 Florida Power & Light Co., 5.625%, 4/1/34 94,260
469,000 Florida Power Corp., 4.50%, 6/1/10 463,620
418,000 FPL Group Capital Inc., 5.55%, 2/16/08 417,278
339,000 Indiana Michigan Power Co., 5.05%, 11/15/14 322,352
161,248 Kiowa Power Partners LLC, 4.81%, 12/30/13 (Acquired
11/19/04, Cost $157,427)(3) 160,170
123,000 Kiowa Power Partners LLC, 5.74%, 3/30/21 (Acquired
11/19/04, Cost $123,000)(3) 122,371
30,000 MidAmerican Energy Holdings Co., 5.95%, 5/15/37 28,431
80,000 Monongahela Power Co., 5.70%, 3/15/17 (Acquired
9/13/06, Cost $79,708)(3) 78,885
272,000 Nevada Power Co., 5.875%, 1/15/15 266,985
90,000 Nevada Power Co., 6.50%, 5/18/18 90,928
160,000 Oncor Electric Delivery Co., 6.375%, 1/15/15 160,636
110,000 Oncor Electric Delivery Co., 7.00%, 9/1/22 112,416
371,000 PacifiCorp, 5.45%, 9/15/13 367,761
75,000 PacifiCorp, 5.75%, 4/1/37 70,523
373,000 PPL Electric Utilities Corp., 4.30%, 6/1/13 347,940
40,000 PPL Energy Supply LLC, 6.00%, 12/15/36 36,036
45,000 Sierra Pacific Power Co., 6.75%, 7/1/37 45,461
- ------
9
Select Bond
Principal Amount Value
$ 235,000 Southern California Edison Co., 5.00%, 1/15/16 $ 224,926
15,000 Southern California Edison Co., 5.55%, 1/15/37 13,892
25,000 Tampa Electric Co., 6.15%, 5/15/37 24,455
115,000 Toledo Edison Co., 6.15%, 5/15/37 107,687
-----------
4,676,197
-----------
ENERGY EQUIPMENT & SERVICES -- 0.3%
268,000 Consolidated Natural Gas Co., 5.00%, 12/1/14 253,995
65,000 Pride International Inc., 7.375%, 7/15/14 66,950
10,000 Southern Natural Gas Co., 5.90%, 4/1/17 (Acquired
3/14/07, Cost $9,983)(3) 9,782
-----------
330,727
-----------
FOOD & STAPLES RETAILING -- 0.4%
20,000 Costco Wholesale Corp., 5.30%, 3/15/12 20,082
113,000 CVS Caremark Corp., 4.875%, 9/15/14 107,574
80,000 CVS Caremark Corp., 6.125%, 8/15/16 80,101
20,000 Delhaize Group, 6.50%, 6/15/17 20,204
15,000 Kroger Co. (The), 6.40%, 8/15/17 15,323
35,000 Kroger Co. (The), 7.00%, 5/1/18 37,132
10,000 Kroger Co. (The), 6.80%, 12/15/18 10,474
85,000 Wal-Mart Stores, Inc., 5.875%, 4/5/27 82,225
-----------
373,115
-----------
FOOD PRODUCTS -- 0.8%
85,000 General Mills, Inc., 5.70%, 2/15/17 83,753
473,000 Kellogg Co., 6.60%, 4/1/11 494,106
68,000 Kraft Foods Inc., 6.25%, 6/1/12 70,277
40,000 Kraft Foods Inc., 6.50%, 8/11/17 41,393
85,000 Smithfield Foods, Inc., 7.75%, 5/15/13 87,125
-----------
776,654
-----------
HOTELS, RESTAURANTS & LEISURE -- 0.2%
40,000 Harrah's Operating Co. Inc., 5.75%, 10/1/17 30,654
170,000 Royal Caribbean Cruises Ltd., 7.00%, 6/15/13 169,906
-----------
200,560
-----------
Principal Amount Value
HOUSEHOLD DURABLES -- 0.5%
$ 45,000 Centex Corp., 7.875%, 2/1/11 $ 44,963
95,000 Centex Corp., 5.45%, 8/15/12 86,827
15,000 D.R. Horton, Inc., 7.875%, 8/15/11 14,715
65,000 D.R. Horton, Inc., 5.375%, 6/15/12 57,495
145,000 KB Home, 7.75%, 2/1/10 138,113
130,000 Lennar Corp., 5.95%, 10/17/11 119,058
-----------
461,171
-----------
HOUSEHOLD PRODUCTS -- 1.2%
399,000 Clorox Company, 4.20%, 1/15/10 391,468
745,000 Gillette Company (The), 2.50%, 6/1/08 732,300
55,000 Procter & Gamble Co. (The), 5.55%, 3/5/37 52,731
-----------
1,176,499
-----------
INDUSTRIAL CONGLOMERATES -- 0.1%
110,000 Siemens Financieringsmaatschappij N.V., 5.75%,
10/17/16 (Acquired 8/9/06, Cost $109,721)(3) 111,124
-----------
INSURANCE -- 0.8%
745,000 Berkley (W.R.) Corp., 9.875%, 5/15/08 762,332
25,000 Progressive Corp. (The), 6.70%, 6/15/37 24,297
20,000 Travelers Companies, Inc. (The), 6.25%, 6/15/37 19,356
-----------
805,985
-----------
MEDIA -- 1.9%
180,000 Clear Channel Communications, Inc., 6.25%, 3/15/11 165,126
130,000 Comcast Corp., 6.30%, 11/15/17 132,382
40,000 Comcast Corp., 5.875%, 2/15/18 39,421
65,000 News America Inc., 6.40%, 12/15/35 62,975
5,000 News America Inc., 6.15%, 3/1/37 4,678
20,000 Rogers Cable Inc., 6.25%, 6/15/13 20,280
345,000 Rogers Cable Inc., 5.50%, 3/15/14 333,124
125,000 TCI Communications, Inc., 8.75%, 8/1/15 145,117
10,000 Time Warner Cable Inc., 6.55%, 5/1/37 (Acquired
4/4/07, Cost $9,936)(3) 9,841
- ------
10
Select Bond
Principal Amount Value
$ 600,000 Time Warner Entertainment Co. L.P., 7.25%, 9/1/08 $ 606,848
105,000 Time Warner Entertainment Co. L.P., 8.375%, 3/15/23 121,838
30,000 Time Warner Inc., 6.625%, 5/15/29 29,463
90,000 Viacom Inc., 5.75%, 4/30/11 90,943
55,000 Viacom Inc., 6.625%, 5/15/11 57,112
-----------
1,819,148
-----------
METALS & MINING -- 0.2%
100,000 Alcoa Inc., 5.72%, 2/23/19 96,231
85,000 Alcoa Inc., 5.90%, 2/1/27 79,913
-----------
176,144
-----------
MULTI-UTILITIES -- 2.9%
15,000 AmerenUE, 6.40%, 6/15/17 15,486
25,000 CenterPoint Energy Houston Electric LLC, 5.70%,
3/15/13 25,076
30,000 CenterPoint Energy Houston Electric LLC, 6.95%,
3/15/33 32,685
313,000 CenterPoint Energy Transition Bond Co. II, LLC,
5.17%, 8/1/19 312,407
110,000 CMS Energy Corp., 6.875%, 12/15/15 111,253
25,000 Consolidated Edison Co. of New York, Inc., Series
2005 C, 5.375%, 12/15/15 24,465
55,000 Consolidated Edison Co. of New York, Inc., Series
2006 C, 5.50%, 9/15/16 54,220
30,000 Consolidated Edison Co. of New York, Inc., Series
2007 A, 6.30%, 8/15/37 30,187
834,000 Consumers Energy Co., 4.80%, 2/17/09 830,295
80,000 NiSource Finance Corp., 5.40%, 7/15/14 77,864
25,000 Northern States Power Co., 5.25%, 10/1/18 24,082
45,000 Pacific Gas & Electric Co., 6.05%, 3/1/34 44,338
20,000 Pacific Gas & Electric Co., 5.80%, 3/1/37 18,966
115,000 Public Service Co. of Colorado, 5.50%, 4/1/14 113,741
224,000 Public Service Electric & Gas Co., 5.00%, 1/1/13 217,411
145,000 Public Service Electric & Gas Co., 5.70%, 12/1/36 134,110
313,000 Puget Sound Energy, Inc., 3.36%, 6/1/08 308,392
50,000 Puget Sound Energy, Inc., 6.27%, 3/15/37 49,083
Principal Amount Value
$ 20,000 San Diego Gas & Electric Co., 5.30%, 11/15/15 $ 19,543
15,000 San Diego Gas & Electric Co., 6.125%, 9/15/37 15,065
65,000 Tampa Electric Co., 6.55%, 5/15/36 67,022
210,000 Virginia Electric and Power Co., 6.00%, 5/15/37 201,494
85,000 XCEL Energy Inc., 6.50%, 7/1/36 84,846
-----------
2,812,031
-----------
MULTILINE RETAIL -- 1.3%
302,000 Federated Department Stores, Inc., 6.30%, 4/1/09 305,270
55,000 Federated Retail Holdings, Inc., 5.35%, 3/15/12 53,987
63,000 J.C. Penney Corp., Inc., 6.875%, 10/15/15 65,435
30,000 J.C. Penney Corp., Inc., 7.95%, 4/1/17 33,349
10,000 J.C. Penney Corp., Inc., 5.75%, 2/15/18 9,618
20,000 J.C. Penney Corp., Inc., 6.375%, 10/15/36 18,773
35,000 Kohl's Corp., 6.25%, 12/15/17 35,029
15,000 Macy's Retail Holdings Inc., 7.00%, 2/15/28 14,319
5,000 May Department Stores Co. (The), 6.65%, 7/15/24 4,704
644,000 Target Corp., 5.40%, 10/1/08 643,777
110,000 Target Corp., 5.375%, 5/1/17 105,698
-----------
1,289,959
-----------
OIL, GAS & CONSUMABLE FUELS -- 3.1%
35,000 Amerada Hess Corp., 7.125%, 3/15/33 37,818
115,000 Anadarko Finance Co., 7.50%, 5/1/31 125,602
75,000 Anadarko Petroleum Corp., 5.95%, 9/15/16 74,408
25,000 Apache Corp., 6.00%, 1/15/37 24,146
35,000 Canadian Natural Resources Ltd., 5.70%, 5/15/17 34,229
30,000 Canadian Natural Resources Ltd., 6.50%, 2/15/37 30,024
35,000 Canadian Natural Resources Ltd., 6.25%, 3/15/38 33,876
475,000 Conoco Funding Co., 6.35%, 10/15/11 495,597
25,000 Devon Energy Corp., 7.95%, 4/15/32 29,886
40,000 El Paso Corp., 7.00%, 6/15/17 40,815
5,000 EnCana Corp., 6.625%, 8/15/37 5,146
- ------
11
Select Bond
Principal Amount Value
$ 105,000 EnCana Holdings Finance Corp., 5.80%, 5/1/14 $ 105,712
125,000 Kinder Morgan Energy Partners L.P., 7.30%, 8/15/33 131,367
300,000 Kinder Morgan Finance Co., ULC, 5.35%, 1/5/11 293,480
10,000 Marathon Oil Corp., 6.60%, 10/1/37 10,258
138,000 Nexen Inc., 5.875%, 3/10/35 126,804
330,000 Pemex Project Funding Master Trust, 5.75%, 12/15/15 331,853
125,000 Petro-Canada, 5.95%, 5/15/35 118,781
210,000 Pioneer Natural Resources Co., 6.875%, 5/1/18 198,232
35,000 Suncor Energy Inc., 6.50%, 6/15/38 35,927
75,000 Sunoco Inc., 5.75%, 1/15/17 73,908
107,000 Talisman Energy Inc., 5.85%, 2/1/37 95,717
220,000 Tesoro Corp., 6.25%, 11/1/12 221,650
200,000 Tesoro Corp., 6.50%, 6/1/17 (Acquired 5/23/07, Cost
$200,000)(3) 199,500
20,000 Valero Energy Corp., 6.125%, 6/15/17 20,168
55,000 Valero Energy Corp., 6.625%, 6/15/37 56,001
30,000 XTO Energy Inc., 5.30%, 6/30/15 28,885
20,000 XTO Energy Inc., 6.75%, 8/1/37 20,937
-----------
3,000,727
-----------
PAPER & FOREST PRODUCTS(4)
20,000 Weyerhaeuser Co., 6.875%, 12/15/33 18,950
-----------
PHARMACEUTICALS -- 0.3%
186,000 Abbott Laboratories, 3.75%, 3/15/11 179,421
65,000 Wyeth, 5.95%, 4/1/37 62,940
-----------
242,361
-----------
REAL ESTATE INVESTMENT TRUSTS -- 1.7%
104,000 Archstone-Smith Operating Trust, 5.25%, 12/1/10 103,998
50,000 AvalonBay Communities Inc., 5.50%, 1/15/12 50,036
35,000 BRE Properties, Inc., 5.50%, 3/15/17 33,225
231,000 Developers Diversified Realty Corp., 5.375%, 10/15/12 225,258
80,000 Duke Realty L.P., 5.95%, 2/15/17 76,860
Principal Amount Value
$ 35,000 Health Care Property Investors, Inc., 6.00%, 1/30/17 $ 33,484
242,000 iStar Financial Inc., 5.15%, 3/1/12 224,138
241,000 ProLogis, 5.50%, 3/1/13 237,140
150,000 ProLogis, 5.75%, 4/1/16 144,864
255,000 Simon Property Group L.P., 5.375%, 6/1/11 254,491
85,000 Simon Property Group L.P., 5.60%, 9/1/11 85,198
190,000 Simon Property Group L.P., 6.10%, 5/1/16 189,801
-----------
1,658,493
-----------
REAL ESTATE MANAGEMENT & DEVELOPMENT -- 0.6%
35,000 Colonial Realty L.P., 6.05%, 9/1/16 33,858
91,000 ERP Operating L.P., 5.25%, 9/15/14 86,939
40,000 ERP Operating L.P., 5.75%, 6/15/17 38,292
440,000 Rouse Co. L.P./TRC Co-Issuer Inc., 6.75%, 5/1/13
(Acquired 5/2/06, Cost $438,627)(3) 433,811
-----------
592,900
-----------
ROAD & RAIL -- 1.6%
471,000 Burlington Northern Santa Fe Corp., 6.125%, 3/15/09 476,760
35,000 Burlington Northern Santa Fe Corp., 6.15%, 5/1/37 33,910
15,000 Canadian National Railway Co., 5.85%, 11/15/17 15,028
25,000 Canadian Pacific Railway Co., 5.95%, 5/15/37 23,161
45,000 CSX Corp., 6.25%, 3/15/18 45,322
35,000 CSX Corp., 6.15%, 5/1/37 33,552
98,000 Union Pacific Corp., 3.875%, 2/15/09 96,016
671,000 Union Pacific Corp., 7.375%, 9/15/09 701,171
90,000 Union Pacific Corp., 5.65%, 5/1/17 87,693
-----------
1,512,613
-----------
SPECIALTY RETAIL -- 0.4%
490,000 Home Depot, Inc. (The), 5.875%, 12/16/36 419,872
-----------
THRIFTS & MORTGAGE FINANCE -- 0.4%
55,000 Countrywide Financial Corp., 5.80%, 6/7/12 51,602
20,000 Countrywide Home Loans Inc., 4.125%, 9/15/09 18,390
- ------
12
Select Bond
Principal Amount Value
$ 90,000 Residential Capital Corp., 6.00%, 2/22/11 $ 73,402
280,000 Residential Capital Corp., 6.50%, 4/17/13 226,341
-----------
369,735
-----------
TOBACCO -- 0.3%
190,000 Reynolds American Inc., 7.625%, 6/1/16 203,243
20,000 Reynolds American Inc., 6.75%, 6/15/17 20,556
20,000 Reynolds American Inc., 7.25%, 6/15/37 21,008
-----------
244,807
-----------
WIRELESS TELECOMMUNICATION SERVICES -- 0.6%
160,000 Cingular Wireless LLC, 7.125%, 12/15/31 173,264
65,000 Rogers Wireless Inc., 6.375%, 3/1/14 65,747
350,000 Vodafone Group plc, 5.50%, 6/15/11 351,222
-----------
590,233
-----------
TOTAL CORPORATE BONDS
(Cost $34,704,654) 34,121,585
-----------
Collateralized Mortgage Obligations(1) -- 13.3%
8,680,425 Asset Securitization Corp., Series 1997 D5, Class
PS1, STRIPS - COUPON, VRN, 1.64%, 10/11/07 320,933
167,597 Banc of America Alternative Loan Trust, Series
2006-3, Class 1CB1, 6.00%, 4/25/36 167,947
563,000 Banc of America Mortgage Securities, Series 2004 G,
Class 2A6, 4.66%, 8/25/34 557,860
1,417,000 Bear Stearns Adjustable Rate Mortgage Trust, Series
2004-4, Class A6, 3.51%, 6/25/34 1,399,205
293,045 Chase Manhattan Auto Owner Trust, Series 2004 A,
Class A4 SEQ, 2.83%, 9/15/10 290,478
290,765 Chase Manhattan Auto Owner Trust, Series 2005 A,
Class A3 SEQ, 3.87%, 6/15/09 288,849
246,200 Credit Suisse Mortgage Capital Certificates, Series
2007-5, Class 3A19, 6.00%, 8/25/37 241,538
447,000 Criimi Mae Commercial Mortgage Trust, Series 1998
C1, Class B, 7.00%, 6/2/33 (Acquired 3/9/99, Cost
$354,178)(3) 451,193
7,245,705 DLJ Commercial Mortgage Corp., Series 1998 CF1,
Class S, STRIPS - COUPON, VRN, 0.69%, 10/1/07 113,113
Principal Amount Value
$3,606,915 DLJ Mortgage Acceptance Corp., Series 1997 CF2,
Class S, STRIPS - COUPON, VRN, 0.49%, 10/1/07
(Acquired 1/22/98-2/25/98, Cost $97,604)(3) $ 90,725
256,654 FHLMC, Series 3065, Class TN, 4.50%, 10/15/33 249,678
945,870 FHLMC, Series K001, Class A2, 5.65%, 4/25/16 959,380
434,895 First Horizon Alternative Mortgage Securities,
Series 2004 FA1, Class 1A1 SEQ, 6.25%, 10/25/34 440,788
278,000 First Union-Lehman Brothers Commercial Mortgage
Trust II, Series 1997 C2, Class B, 6.79%, 11/18/29 278,295
1,254,000 FNMA, Alternative Credit Enhancement Structures,
Series 2006 M1, Class C SEQ, 5.36%, 3/1/36 1,256,355
627,124 FNMA, Final Maturity Amortizing Notes, Series
2004-1, Class 1, 4.45%, 8/25/12 616,053
828,389 FNMA, Series 2002 W4, Class A4 SEQ, 6.25%, 5/25/42 846,048
202,042 Greenwich Capital Commercial Funding Corp., Series
2006 FL4A, Class A1, VRN, 5.86%, 10/5/07, resets
monthly off the 1-month LIBOR plus 0.09% with no
caps (Acquired 12/15/06, Cost $202,042)(3) 201,559
392,795 Merrill Lynch Alternative Note Asset, Series 2007
A1, Class A2A, VRN, 5.20%, 10/25/07, resets monthly
off the 1-month LIBOR plus 0.07% with no caps 386,474
298,000 RMF Commercial Mortgage Pass-Through Certificates,
Series 1997-1, Class F, 7.47%, 1/15/19 (Acquired
11/24/97, Cost $291,617)(3) 155,836
346,604 TBW Mortgage Backed Pass-Through Certificates,
Series 2007-1, Class A1, VRN, 5.22%, 10/25/07,
resets monthly off the 1-month LIBOR plus 0.09% with
no caps 344,054
790,152 Thornburg Mortgage Securities Trust, Series 2006-1,
Class A3, VRN, 5.30%, 10/25/07, resets monthly off
the 1-month LIBOR plus 0.17% with a cap of 11.00% 786,426
- ------
13
Select Bond
Principal Amount Value
$ 446,336 Washington Mutual Asset Securities Corp., Series
2003 C1A, Class A SEQ, 3.83%, 1/25/35 (Acquired
2/3/06, Cost $432,371)(3) $ 437,225
282,000 Washington Mutual Mortgage Pass-Through
Certificates, Series 2003 AR10, Class A6, 4.08%,
10/25/33 279,133
156,786 Washington Mutual Mortgage Pass-Through
Certificates, Series 2006-6, Class 4A, 6.70%,
11/25/34 161,648
829,000 Wells Fargo Mortgage Backed Securities Trust, Series
2004 N, Class A6, 4.00%, 8/25/34 815,727
338,522 Wells Fargo Mortgage Backed Securities Trust, Series
2005-7, Class A1, 5.25%, 9/25/35 321,504
370,171 Wells Fargo Mortgage Backed Securities Trust, Series
2005-11, Class 1A1, 5.50%, 11/25/35 357,617
-----------
TOTAL COLLATERALIZED MORTGAGE OBLIGATIONS
(Cost $12,865,610) 12,815,641
-----------
U.S. Treasury Securities -- 8.4%
293,000 U.S. Treasury Bonds, 4.75%, 2/15/37 289,040
482,429 U.S. Treasury Inflation Indexed Notes, 2.625%,
7/15/17 497,429
600,000 U.S. Treasury Notes, 4.00%, 8/31/09 600,610
985,000 U.S. Treasury Notes, 4.625%, 7/31/12 1,002,469
1,903,000 U.S. Treasury Notes, 4.125%, 8/31/12 1,895,866
15,000 U.S. Treasury Notes, 4.50%, 5/15/17 14,920
3,766,000 U.S. Treasury Notes, 4.75%, 8/15/17(5) 3,817,786
-----------
TOTAL U.S. TREASURY SECURITIES
(Cost $8,092,905) 8,118,120
-----------
Asset-Backed Securities(1) -- 5.4%
2,242,000 AEP Texas Central Transition Funding II LLC, Series
2006 A-5, 5.31%, 6/14/19(5) 2,173,493
356,574 Banc of America Funding Corp., Series 2007-1, Class
TA1A, VRN, 5.19%, 10/25/07, resets monthly off the
1-month LIBOR plus 0.06% with no caps 353,479
Principal Amount Value
$ 415,619 Banc of America Funding Corp., Series 2007-4, Class
TA1A SEQ, VRN, 5.22%, 10/25/07, resets monthly off
the 1-month LIBOR plus 0.09% with no caps $ 411,283
147,040 Countrywide Home Loan Mortgage Pass-Through Trust,
Series 2005-31, Class 2A1, 5.50%, 1/25/36 146,640
39,024 Honda Auto Receivables Owner Trust, Series 2005-1,
Class A3 SEQ, 3.53%, 10/21/08 38,991
207,612 Massachusetts RRB Special Purpose Trust WMECO-1,
Series 2001-1, Class A, 6.53%, 6/1/15 218,505
166,726 Mid-State Trust, Series 1997-6, Class A3 SEQ, 7.54%,
7/1/35 179,007
336,596 Wachovia Auto Loan Owner Trust, Series 2006-2A,
Class A2 SEQ, 5.35%, 5/20/10 (Acquired 10/27/06,
Cost $336,846)(3) 336,489
1,406,612 World Omni Auto Receivables Trust, Series 2006 A,
Class A3 SEQ, 5.01%, 10/15/10 1,404,838
-----------
TOTAL ASSET-BACKED SECURITIES
(Cost $5,335,504) 5,262,725
-----------
U.S. Government Agency Securities -- 1.2%
559,000 Housing Urban Development, 6.08%, 8/1/13 584,069
745,000 TVA STRIPS - PRINCIPAL, VRN, 0.00%, 4/15/12(6) 617,369
-----------
TOTAL U.S. GOVERNMENT AGENCY SECURITIES
(Cost $1,202,195) 1,201,438
-----------
Sovereign Governments & Agencies -- 0.8%
489,219 Overseas Private Investment Corp., 4.10%, 11/15/14 478,962
260,000 United Mexican States, 5.625%, 1/15/17 259,870
-----------
TOTAL SOVEREIGN GOVERNMENTS & AGENCIES
(Cost $745,679) 738,832
-----------
Temporary Cash Investments -- 0.5%
500,000 FHLMC Discount Notes, 4.71%, 12/10/07(7) 495,669
(Cost $495,417)
-----------
- ------
14
Select Bond
Principal Amount Value
TOTAL INVESTMENT SECURITIES -- 101.2%
(Cost $98,982,212) $97,743,002
-----------
OTHER ASSETS AND LIABILITIES -- (1.2)% (1,146,230)
-----------
TOTAL NET ASSETS -- 100.0% $96,596,772
===========
Futures Contracts
Expiration Underlying Face Amount Unrealized Gain
Contracts Purchased Date at Value (Loss)
25 U.S. Long
Bond December 2007 $2,783,594 $(12,577)
========== =========
Notes to Schedule of Investments
FHLMC = Federal Home Loan Mortgage Corporation
FNMA = Federal National Mortgage Association
GMAC = General Motors Acceptance Corporation
GNMA = Government National Mortgage Association
LIBOR = London Interbank Offered Rate
resets = The frequency with which a security's coupon changes, based on
current market conditions or an underlying index. The more frequently a
security resets, the less risk the investor is taking that the coupon will
vary significantly from current market rates.
SEQ = Sequential Payer
STRIPS = Separate Trading of Registered Interest and Principal of Securities
TVA = Tennessee Valley Authority
VRN = Variable Rate Note. Interest reset date is indicated. Rate shown is
effective September 30, 2007.
(1) Final maturity indicated, unless otherwise noted.
(2) Forward commitment.
(3) Security was purchased under Rule 144A of the Securities Act of 1933 or is
a private placement and, unless registered under the Act or exempted from
registration, may only be sold to qualified institutional investors. The
aggregate value of restricted securities at September 30, 2007, was
$3,973,522, which represented 4.1% of total net assets.
(4) Industry is less than 0.05% of total net assets.
(5) Security, or a portion thereof, has been segregated for forward
commitments and/or futures contracts.
(6) Step-coupon security. These securities are issued with a zero-coupon and
become interest bearing at a predetermined rate and date and are issued at a
substantial discount from their value at maturity. Rate shown is effective
September 30, 2007.
(7) The rate indicated is the yield to maturity at purchase.
See Notes to Financial Statements.
- ------
15
PERFORMANCE
High-Yield Bond
Total Returns as of September 30, 2007
Average Annual Returns
6 10 Since Inception
months(1) 1 year 5 years years Inception Date
A CLASS
No sales
charge*
With sales 0.57%(2) 6.81%(2) 11.41% 4.58% 5.87%
charge* -3.96%(2) 2.01%(2) 10.40% 4.09% 5.41% 3/31/97
CITIGROUP
HIGH-YIELD
CASH-PAY INDEX 0.70% 7.60% 12.76% 6.33% 6.84% --
Investor Class 0.70%(2) 7.08%(2) -- -- 6.91%(2) 4/3/06
Institutional Class 0.80%(2) 7.29%(2) -- -- 7.13%(2) 4/3/06
B Class
No sales
charge*
With sales 0.19%(2) 5.86%(2) 10.62% 3.86% 5.15%
charge* -4.81%(2) 1.86%(2) 10.49% 3.86% 5.15% 3/31/97
C Class
No sales
charge*
With sales 0.20%(2) 6.01%(2) -- -- 5.85%(2)
charge* -0.78%(2) 6.01%(2) -- -- 5.85%(2) 4/3/06
R Class 0.45%(2) 6.54%(2) -- -- 6.38%(2) 4/3/06
* Sales charges include initial sales charges and contingent deferred sales
charges (CDSCs), as applicable. A Class shares have a 4.50% maximum initial
sales charge for fixed income funds and may be subject to a maximum CDSC of
1.00%. B Class shares redeemed within six years of purchase are subject to a
CDSC that declines from 5.00% during the first year after purchase to 0.00%
the sixth year after purchase. C Class shares redeemed within 12 months of
purchase are subject to a maximum CDSC of 1.00%. Please see the Share Class
Information pages for more about the applicable sales charges for each share
class. The SEC requires that mutual funds provide performance information net
of maximum sales charges in all cases where charges could be applied.
High-Yield Bond acquired all of the net assets of the Mason Street High Yield
Bond Fund on March 31, 2006, pursuant to a plan of reorganization approved by
the acquired fund's shareholders on March 23, 2006. Performance information
prior to April 1, 2006 is that of the Mason Street High Yield Bond Fund.
(1) Total returns for periods less than one year are not annualized.
(2) Class returns would have been lower if fees had not been waived.
Data presented reflect past performance. Past performance is no guarantee of
future results. Current performance may be higher or lower than the
performance shown. Investment return and principal value will fluctuate, and
redemption value may be more or less than original cost. To obtain performance
data current to the most recent month end, please call 1-800-345-2021 or visit
americancentury.com. As interest rates rise, bond values will decline. In
addition, the lower-rated securities in which the fund invests are subject to
greater credit risk, default risk and liquidity risk.
Unless otherwise indicated, performance reflects A Class shares; performance
for other share classes will vary due to differences in fee structure. For
information about other share classes available, please consult the
prospectus. Data assumes reinvestment of dividends and capital gains, and none
of the charts reflect the deduction of taxes that a shareholder would pay on
fund distributions or the redemption of fund shares. Returns for the index are
provided for comparison. The fund's total returns include operating expenses
(such as transaction costs and management fees) that reduce returns, while the
total returns of the index do not.
- ------
16
High-Yield Bond
Growth of $10,000 Over 10 Years
$10,000 investment made September 30, 1997*
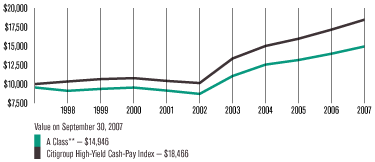
One-Year Returns Over 10 Years
Periods ended September 30
1998 1999 2000 2001 2002 2003 2004 2005 2006 2007
A Class**
(no sales
charge) -4.62% 2.78% 1.88% -4.15% -4.80% 27.04% 13.60% 4.80% 6.30% 6.81%
Citigroup
High-Yield
Cash-Pay
Index 3.39% 3.01% 1.22% -3.40% -2.71% 31.89% 12.34% 6.33% 7.50% 7.60%
* High-Yield Bond A Class's initial investment is $9,550 to reflect the
maximum 4.50% initial sales charge.
** Class returns would have been lower, along with ending value, if fees had
not been waived.
Data presented reflect past performance. Past performance is no guarantee of
future results. Current performance may be higher or lower than the
performance shown. Investment return and principal value will fluctuate, and
redemption value may be more or less than original cost. To obtain performance
data current to the most recent month end, please call 1-800-345-2021 or visit
americancentury.com. As interest rates rise, bond values will decline. In
addition, the lower-rated securities in which the fund invests are subject to
greater credit risk, default risk and liquidity risk.
Unless otherwise indicated, performance reflects A Class shares; performance
for other share classes will vary due to differences in fee structure. For
information about other share classes available, please consult the
prospectus. Data assumes reinvestment of dividends and capital gains, and none
of the charts reflect the deduction of taxes that a shareholder would pay on
fund distributions or the redemption of fund shares. Returns for the index are
provided for comparison. The fund's total returns include operating expenses
(such as transaction costs and management fees) that reduce returns, while the
total returns of the index do not.
- ------
17
PORTFOLIO COMMENTARY
High-Yield Bond
Portfolio Manager: Andrew Wassweiller
PERFORMANCE SUMMARY
High-Yield Bond returned 0.57%* for the six months ended September 30, 2007.
By comparison, its benchmark, the Citigroup High-Yield Cash-Pay Index,
returned 0.70%. Portfolio returns reflect operating expenses, while the index
returns do not.
The portfolio's absolute return reflected the difficult climate for high-yield
bonds prevailing in recent months (see the Market Perspective on page 2).
Relative to the benchmark, the fund benefited from our defensive positioning
in terms of credit quality and sector allocation at a time when the riskiest,
lowest-rated segment of the market performed worst. In addition, our security
selection also helped performance relative to the benchmark.
HIGH-YIELD MARKET REVIEW
Beginning in June, a long streak of outperformance by the riskiest,
lowest-rated segment of the high-yield market came to an end, reflecting a
lack of liquidity and aversion to risk in the marketplace. At the peak of the
credit crunch in July and August, demand for highly leveraged bonds with light
covenants and low risk premiums evaporated. As a result, CCC rated bonds had
negative returns for the six months, while higher-quality B and BB bonds
managed positive performance. Looking at returns by sector, consumer-related
sectors performed poorly, led by housing bonds, while bonds from more
defensive sectors, such as telecommunications and utilities bonds, held up
well.
HIGHER QUALITY PAID OFF
The leading contributor to portfolio performance was our overweight position
in BB bonds and underweight position in CCC securities. We have been
positioning the portfolio defensively for some time because we viewed the
risk/reward trade-off of CCCs as being unattractive--yield spreads were in the
neighborhood of all-time lows even as the credit cycle appeared to have peaked
and housing had begun to drag on the economy.
Portfolio at a Glance
As of As of
9/30/07 3/31/07
Weighted Average Maturity 7.3 years 7.2 years
Average Duration (effective) 4.6 years 4.2 years
Yields as of September 30, 2007(1)
30-day SEC Yield
Investor Class 7.70%
Institutional Class 7.90%
A Class 7.10%
B Class 6.70%
C Class 6.69%
R Class 7.19%
(1) The yields presented reflect the waiver of a portion of the class's
management fees. Without such waiver, the 30-day yields would have been lower.
* All fund returns referenced in this commentary are for A Class shares and
are not reduced by sales charges. A Class shares are subject to a maximum
sales charge of 4.50%. Had the sales charge been applied or if management fees
had not been waived, returns would be lower than those shown. Total returns
for periods less than one year are not annualized.
- ------
18
High-Yield Bond
While we thought this positioning made sense over time given our view of the
economy, credit quality, and spreads, it limited portfolio performance
relative to the benchmark until June, when CCC bonds finally gave back some
ground. The re-pricing of risk accelerated through the summer, peaking in
August. As a result, these speculative-grade bonds underperformed for the six
months, rewarding our higher-quality, more defensive positions.
SECTOR ALLOCATION MOSTLY POSITIVE
Our sector allocation decisions contributed to relative results, as we were
underweight homebuilders and building products companies, which
underperformed. It also helped performance to hold an underweight position in
paper & forest products names, which were weighed down by a stronger Canadian
dollar, poor pricing, and excess capacity. Finally, the portfolio benefited
from merger and acquisition activity among some of our holdings in the
chemical industry.
However, our underweight position in auto-related debt detracted from relative
performance. Even though these issues represent some of our larger holdings on
an absolute basis, the bonds of Ford and GM and related auto-supplier debt
make up more than 10% of the index. We typically do not concentrate the
portfolio so heavily in any single sector or issuer, so we essentially carried
a structural underweight position to automotive-related debt. These bonds
outperformed, particularly during the second quarter, limiting the portfolio's
relative results.
OUTLOOK
"We've been cautious for some time now on the high-yield market, and that
positioning paid off in the last several months," said portfolio manager
Andrew Wassweiler. "We see plenty of reasons to maintain that defensive
positioning going forward. First, we don't think we've seen the full effect of
the housing slump on the consumer or the economy as a whole. Second, as a
result of the lack of demand and liquidity over the summer, there's a large
supply of high-yield deals waiting to come to market. That means that any
up-tick in demand is likely to be met by an avalanche of new supply. Finally,
with economic growth slowing, defaults could become an issue on some of the
riskier, poorly structured deals that came to market in recent years."
Top Five Industries as of September 30, 2007
% of net % of net
assets as of assets as of
9/30/07 3/31/07
Media 10.5% 10.5%
Oil, Gas & Consumable Fuels 10.0% 9.9%
Hotels, Restaurants & Leisure 5.7% 5.7%
Diversified Financial Services 5.6% 5.2%
Health Care Providers & Services 4.6% 3.7%
Portfolio Composition by Credit Rating
% of fund % of fund
investments investments
as of as of
9/30/07 3/31/07
AAA 4% 4%
BBB 1% 1%
BB 42% 39%
B 43% 46%
CCC or lower 10% 10%
- ------
19
SCHEDULE OF INVESTMENTS
High-Yield Bond
SEPTEMBER 30, 2007 (UNAUDITED)
Principal Amount Value
Corporate Bonds -- 93.7%
AEROSPACE & DEFENSE -- 1.7%
$ 382,000 Bombardier Inc., 8.00%, 11/15/14 (Acquired
11/10/06-7/30/07, Cost $378,250)(1) $ 402,055
360,000 DRS Technologies, Inc., 7.625%, 2/1/18 369,000
655,000 L-3 Communications Corp., 7.625%, 6/15/12 673,013
1,085,000 L-3 Communications Corp., 6.375%, 10/15/15 1,071,437
------------
2,515,505
------------
AUTO COMPONENTS -- 2.7%
492,000 American Axle & Manufacturing Inc., 7.875%, 3/1/17 477,240
240,000 ArvinMeritor Inc., 8.75%, 3/1/12 246,000
360,000 Cooper Tire & Rubber Co., 8.00%, 12/15/19 349,200
215,000 Goodyear Tire & Rubber Co. (The), 8.625%, 12/1/11 225,750
587,000 Lear Corp., 8.50%, 12/1/13 564,988
480,000 Lear Corp., 8.75%, 12/1/16 453,600
600,000 TRW Automotive Inc., 7.25%, 3/15/17 (Acquired
3/14/07, Cost $589,620)(1) 588,000
1,180,000 Visteon Corp., 8.25%, 8/1/10 1,044,300
------------
3,949,078
------------
AUTOMOBILES -- 1.1%
1,090,000 Ford Motor Co., 7.45%, 7/16/31 861,100
940,000 General Motors Corp., 8.375%, 7/15/33 828,375
------------
1,689,475
------------
BEVERAGES -- 0.8%
645,000 Constellation Brands Inc., 7.25%, 9/1/16 648,225
475,000 Constellation Brands Inc., 7.25%, 5/15/17 (Acquired
5/9/07, Cost $475,000)(1) 477,375
------------
1,125,600
------------
CAPITAL MARKETS -- 1.6%
375,000 E*TRADE Financial Corp., 8.00%, 6/15/11 375,000
665,000 E*TRADE Financial Corp., 7.875%, 12/1/15 618,449
140,000 LaBranche & Co. Inc., 9.50%, 5/15/09 139,300
413,000 LaBranche & Co. Inc., 11.00%, 5/15/12 416,098
Principal Amount Value
$ 615,000 NXP BV/NXP Funding LLC, 7.875%, 10/15/14 $ 594,244
275,000 NXP BV/NXP Funding LLC, 9.50%, 10/15/15 257,125
------------
2,400,216
------------
CHEMICALS -- 4.1%
305,000 Berry Plastics Holding Corp., 8.875%, 9/15/14 313,388
448,000 Equistar Chemicals L.P./Equistar Funding Corp.,
10.625%, 5/1/11 470,400
640,000 FMC Finance III SA, 6.875%, 7/15/17 (Acquired
6/26/07, Cost $628,640)(1) 640,000
1,072,000 Hexion US Finance Corp./Hexion Nova Scotia Finance
ULC, 9.75%, 11/15/14 1,184,559
432,000 Huntsman LLC, 11.50%, 7/15/12 471,960
735,000 Lyondell Chemical Co., 6.875%, 6/15/17 801,150
865,000 Lyondell Chemical Co., 8.00%, 9/15/17 955,825
245,000 Momentive Performance Materials Inc., 9.75%,
12/1/14 (Acquired 11/29/06, Cost $245,000)(1) 243,775
306,000 Momentive Performance Materials Inc., 10.125%,
12/1/14 (Acquired 11/29/06, Cost $306,000)(1) 302,940
184,000 Mosaic Co. (The), 7.375%, 12/1/14 (Acquired
11/16/06, Cost $184,000)(1) 194,120
424,000 Mosaic Co. (The), 7.625%, 12/1/16 (Acquired
11/16/06-2/5/07, Cost $430,600)(1) 454,210
------------
6,032,327
------------
COMMERCIAL SERVICES & SUPPLIES -- 2.2%
689,000 Allied Waste North America, Inc., 7.25%, 3/15/15 706,225
430,000 Allied Waste North America, Inc., 6.875%, 6/1/17 434,300
219,000 ARAMARK Corp., VRN, 8.86%, 11/1/07, resets
quarterly off the 3-month LIBOR plus 3.50% with no
caps 222,285
704,000 ARAMARK Corp., 8.50%, 2/1/15 721,600
730,000 Corrections Corp. of America, 6.25%, 3/15/13 722,700
495,000 WCA Waste Corp., 9.25%, 6/15/14 512,325
------------
3,319,435
------------
- ------
20
High-Yield Bond
Principal Amount Value
CONSTRUCTION MATERIALS -- 0.9%
$1,105,000 FMG Finance Pty Ltd., 10.625%, 9/1/16 (Acquired
8/11/06-2/7/07, Cost $1,135,000)(1) $ 1,306,663
------------
CONSUMER FINANCE -- 0.4%
715,000 SLM Corporation, 5.375%, 5/15/14 624,811
------------
CONTAINERS & PACKAGING -- 2.3%
543,000 Crown Americas LLC/Crown Americas Capital Corp.,
7.625%, 11/15/13 559,969
415,000 Crown Americas LLC/Crown Americas Capital Corp.,
7.75%, 11/15/15 430,563
547,000 Graphic Packaging International Corp., 9.50%,
8/15/13 564,777
375,000 Norampac Inc., 6.75%, 6/1/13 360,000
626,000 Owens-Brockway Glass Container Inc., 6.75%, 12/1/14 620,522
530,000 Smurfit-Stone Container Enterprises, Inc., 8.375%,
7/1/12 532,650
360,000 Smurfit-Stone Container Enterprises, Inc., 8.00%,
3/15/17 355,500
------------
3,423,981
------------
DIVERSIFIED CONSUMER SERVICES -- 1.1%
670,000 Education Management LLC/Education Management
Finance Corp., 10.25%, 6/1/16 696,800
100,000 Service Corp. International, 7.375%, 10/1/14 103,250
445,000 Service Corp. International, 6.75%, 4/1/15 443,888
380,000 Service Corp. International, 6.75%, 4/1/16 370,025
------------
1,613,963
------------
DIVERSIFIED FINANCIAL SERVICES -- 5.6%
700,000 Arch Western Finance LLC, 6.75%, 7/1/13 689,500
430,000 Ford Motor Credit Co. LLC, 8.625%, 11/1/10 426,569
1,510,000 Ford Motor Credit Co. LLC, 9.875%, 8/10/11 1,530,638
630,000 Ford Motor Credit Co. LLC, 8.00%, 12/15/16 590,298
1,120,000 General Motors Acceptance Corp., 7.75%, 1/19/10 1,111,461
1,805,000 General Motors Acceptance Corp., 8.00%, 11/1/31 1,775,509
Principal Amount Value
$ 214,000 Hawker Beechcraft Acquisition Co. LLC, 8.50%,
4/1/15 (Acquired 3/16/07-3/22/07, Cost $216,363)(1) $ 219,350
404,000 Hawker Beechcraft Acquisition Co. LLC, 8.875%,
4/1/15 (Acquired 3/16/07-9/27/07, Cost $405,950)(1) 408,040
504,000 NSG Holdings LLC/NSG Holdings Inc., 7.75%, 12/15/25
(Acquired 3/6/07, Cost $504,000)(1) 501,480
355,000 Pinnacle Foods Finance LLC/Pinnacle Foods Finance
Corp., 9.25%, 4/1/15 (Acquired 3/21/07, Cost
$355,000)(1) 339,913
715,000 Pinnacle Foods Finance LLC/Pinnacle Foods Finance
Corp., 10.625%, 4/1/17 (Acquired 3/21/07-7/30/07,
Cost $670,000)(1) 673,888
------------
8,266,646
------------
DIVERSIFIED TELECOMMUNICATION SERVICES -- 3.8%
1,060,000 Citizens Communications Co., 9.25%, 5/15/11 1,155,399
1,085,000 Citizens Communications Co., 9.00%, 8/15/31 1,106,700
741,000 Intelsat Bermuda Ltd., 11.25%, 6/15/16 797,501
497,000 Intelsat Bermuda Ltd., VRN, 11.41%, 12/15/07,
resets semiannually off the 6-month LIBOR plus
6.00% with no caps 521,850
380,000 Intelsat Subsidiary Holding Co. Ltd., 8.25%,
11/15/13 387,600
255,000 Qwest Capital Funding Inc., 7.90%, 8/15/10 262,013
275,000 Qwest Communications International Inc., 7.50%,
11/1/08 275,000
471,000 Qwest Corp., 7.875%, 9/1/11 496,905
124,000 Qwest Corp., 7.50%, 10/1/14 129,580
530,000 Qwest Corp., 6.50%, 6/1/17 (Acquired 5/8/07, Cost
$529,338)(1) 522,050
------------
5,654,598
------------
ELECTRIC UTILITIES -- 2.2%
41,000 Aquila, Inc., 9.95%, 44,865
815,000 Edison Mission Energy, 7.00%, 5/15/17 (Acquired
5/1/07, Cost $815,675)(1) 806,850
949,000 Edison Mission Energy, 7.20%, 5/15/19 (Acquired
5/1/07, Cost $949,000)(1) 939,510
- ------
21
High-Yield Bond
Principal Amount Value
$ 600,517 Elwood Energy LLC, 8.16%, 7/5/26 $ 610,423
560,000 Intergen N.V., 9.00%, 6/30/17 (Acquired 7/23/07,
Cost $555,458)(1) 590,800
202,000 Sierra Pacific Resources, 8.625%, 3/15/14 214,831
------------
3,207,279
------------
ELECTRONIC EQUIPMENT & INSTRUMENTS -- 0.4%
570,000 Flextronics International Ltd., 6.50%, 5/15/13 547,200
94,000 Flextronics International Ltd., 6.25%, 11/15/14 88,360
------------
635,560
------------
ENERGY EQUIPMENT & SERVICES -- 0.9%
216,000 Compagnie Generale de Geophysique SA, 7.50%, 5/15/15 223,560
360,000 Compagnie Generale de Geophysique SA, 7.75%, 5/15/17 372,600
145,000 Seitel, Inc., 9.75%, 2/15/14 137,750
665,000 SESI LLC, 6.875%, 6/1/14 648,375
------------
1,382,285
------------
FOOD & STAPLES RETAILING -- 2.0%
480,000 Albertson's, Inc., 7.25%, 5/1/13 485,432
439,000 Delhaize America Inc., 9.00%, 4/15/31 525,166
375,000 Rite Aid Corp., 8.125%, 5/1/10 377,813
180,000 Rite Aid Corp., 8.625%, 3/1/15 163,800
275,000 Rite Aid Corp., 9.375%, 12/15/15 (Acquired 5/17/07,
Cost $270,985)(1) 257,125
540,000 Rite Aid Corp., 7.50%, 3/1/17 510,975
612,000 SUPERVALU INC., 7.50%, 11/15/14 625,769
------------
2,946,080
------------
FOOD PRODUCTS -- 2.3%
475,000 Dean Foods Co., 7.00%, 6/1/16 453,625
1,178,000 Dole Food Company, Inc., 8.625%, 5/1/09 1,186,835
453,000 Pilgrim's Pride Corp., 7.625%, 5/1/15 462,060
217,000 Pilgrim's Pride Corp., 8.375%, 5/1/17 222,425
626,000 Smithfield Foods, Inc., 7.75%, 5/15/13 641,650
385,000 Smithfield Foods, Inc., 7.75%, 7/1/17 396,550
------------
3,363,145
------------
Principal Amount Value
GAS UTILITIES -- 0.3%
$ 470,000 Amerigas Partners L.P., 7.25%, 5/20/15 $ 465,300
------------
HEALTH CARE EQUIPMENT & SUPPLIES -- 0.3%
521,000 PTS Acquisition Corp., 9.50%, 4/15/15 (Acquired
4/4/07, Cost $521,000)(1) 494,950
------------
HEALTH CARE PROVIDERS & SERVICES -- 4.6%
1,120,000 Community Health Systems Inc., 8.875%, 7/15/15
(Acquired 6/27/07, Cost $1,112,093)(1) 1,156,399
255,000 Fresenius Medical Care Capital Trust IV, 7.875%,
6/15/11 265,838
480,000 HCA Inc., 6.75%, 7/15/13 433,200
429,000 HCA Inc., 9.125%, 11/15/14 (Acquired 11/9/06, Cost
$429,000)(1) 453,668
1,634,000 HCA Inc., 9.25%, 11/15/16 (Acquired
11/9/06-4/25/07, Cost $1,661,888)(1) 1,740,209
644,000 HCA Inc., 9.625%, 11/15/16 (Acquired 11/9/06, Cost
$644,000)(1) 689,079
565,000 Health Management Associates Inc., 6.125%, 4/15/16 495,622
485,000 Tenet Healthcare Corp., 7.375%, 2/1/13 413,463
715,000 Tenet Healthcare Corp., 9.875%, 7/1/14 657,800
555,000 US Oncology, Inc., 9.00%, 8/15/12 561,938
------------
6,867,216
------------
HOTELS, RESTAURANTS & LEISURE -- 5.7%
525,000 American Casino & Entertainment Properties LLC,
7.85%, 2/1/12 542,063
485,000 American Real Estate Partners L.P., 7.125%, 2/15/13
(Acquired 1/11/07, Cost $482,575)(1) 464,388
155,000 American Real Estate Partners L.P./American Real
Estate Finance Corp., 7.125%, 2/15/13 148,413
670,000 Boyd Gaming Corp., 7.75%, 12/15/12 691,775
980,000 Caesars Entertainment, Inc., 8.125%, 5/15/11 1,004,499
415,000 Fontainebleau Las Vegas Holdings LLC/Fontainebleau
Las Vegas Capital Corp., 10.25%, 6/15/15 (Acquired
5/24/07, Cost $415,000)(1) 391,138
- ------
22
High-Yield Bond
Principal Amount Value
$ 370,000 Mandalay Resort Group, 9.375%, 2/15/10 $ 389,425
930,000 MGM MIRAGE, 6.75%, 9/1/12 919,537
915,000 MGM MIRAGE, 7.50%, 6/1/16 913,855
320,000 Pinnacle Entertainment Inc., 7.50%, 6/15/15
(Acquired 6/5/07, Cost $315,280)(1) 304,400
500,000 Royal Caribbean Cruises Ltd., 7.00%, 6/15/13 499,724
290,000 Seminole Hard Rock Entertainment Inc./Seminole Hard
Rock International LLC, VRN, 8.19%, 12/15/07,
resets quarterly off the 3-month T-Bill plus 2.50%
with no caps (Acquired 2/27/07, Cost $290,000)(1) 284,563
310,000 Station Casinos Inc., 6.875%, 3/1/16 271,250
365,000 Station Casinos Inc., 6.625%, 3/15/18 307,513
365,000 Wimar OpCo LLC/Wimar OpCo Finance Corp., 9.625%,
12/15/14 (Acquired 12/14/06, Cost $365,000)(1) 284,700
1,093,000 Wynn Las Vegas LLC, 6.625%, 12/1/14 1,076,604
------------
8,493,847
------------
HOUSEHOLD DURABLES -- 1.0%
765,000 K. Hovnanian Enterprises, Inc., 7.75%, 5/15/13 550,800
715,000 KB Home, 7.75%, 2/1/10 681,038
378,000 Standard Pacific Corp., 7.75%, 3/15/13 292,950
------------
1,524,788
------------
INDEPENDENT POWER PRODUCERS & ENERGY TRADERS -- 3.3%
910,000 AES Corp. (The), 9.375%, 9/15/10 964,600
275,000 Dynegy Holdings Inc., 7.50%, 6/1/15 (Acquired
5/17/07, Cost $275,000)(1) 266,750
535,000 Dynegy Holdings Inc., 8.375%, 5/1/16 540,350
415,000 Dynegy Holdings Inc., 7.75%, 6/1/19 (Acquired
5/17/07, Cost $415,000)(1) 398,919
1,085,000 Indiantown Cogeneration L.P., 9.77%, 12/15/20 1,266,320
480,000 NRG Energy Inc., 7.25%, 2/1/14 482,400
255,000 NRG Energy Inc., 7.375%, 2/1/16 256,275
723,000 NRG Energy Inc., 7.375%, 1/15/17 724,808
------------
4,900,422
------------
Principal Amount Value
INDUSTRIAL CONGLOMERATES -- 0.8%
$1,185,000 Stena AB, 7.50%, 11/1/13 $ 1,196,850
------------
INSURANCE -- 0.5%
398,000 Crum & Forster Holdings Corp., 7.75%, 5/1/17 380,090
420,000 UnumProvident Finance Co. plc, 6.85%, 11/15/15 429,012
------------
809,102
------------
INTEGRATED TELECOMMUNICATION SERVICES -- 1.1%
565,000 Windstream Corp., 8.125%, 8/1/13 597,488
620,000 Windstream Corp., 8.625%, 8/1/16 664,175
360,000 Windstream Corp., 7.00%, 3/15/19 352,800
------------
1,614,463
------------
IT SERVICES -- 0.8%
475,000 Sabre Holdings Corp., 8.35%, 3/15/16 429,875
710,000 SunGard Data Systems Inc., 9.125%, 8/15/13 741,950
------------
1,171,825
------------
LEISURE EQUIPMENT & PRODUCTS -- 0.7%
495,000 Da-Lite Screen Co., Inc., 9.50%, 5/15/11 520,988
495,000 Travelport LLC, 11.875%, 9/1/16 520,987
------------
1,041,975
------------
LEISURE FACILITIES -- 0.5%
418,000 Universal City Development Partners, 11.75%, 4/1/10 437,855
256,000 Universal City Florida Holding Co. I/Universal City
Florida Holdings Co.II, 8.375%, 5/1/10 259,200
------------
697,055
------------
MACHINERY -- 0.8%
360,000 American Railcar Industries Inc., 7.50%, 3/1/14 360,000
459,000 Rental Service Corp., 9.50%, 12/1/14 440,640
385,000 Terex Corp., 7.375%, 1/15/14 392,700
------------
1,193,340
------------
MEDIA -- 10.5%
717,000 AMC Entertainment Inc., 11.00%, 2/1/16 767,190
495,000 CCH I, LLC/CCH I Capital Corp., 11.00%, 10/1/15 503,663
985,000 CCH II, LLC/CCH II Capital Corp., 10.25%, 9/15/10 1,029,324
- ------
23
High-Yield Bond
Principal Amount Value
$ 925,000 Charter Communications Holdings, LLC/CCH I
Holdings, LLC, 11.75%, 5/15/14 $ 860,250
370,000 Charter Communications Holdings, LLC/CCH I, LLC,
11.00%, 10/1/15 381,100
530,000 CSC Holdings, Inc., 8.125%, 7/15/09 540,600
254,000 CSC Holdings, Inc., 8.125%, 8/15/09 259,080
810,000 CSC Holdings, Inc., 7.625%, 4/1/11 816,075
916,000 CSC Holdings, Inc., 7.875%, 2/15/18 893,100
365,000 EchoStar DBS Corp., 7.00%, 10/1/13 375,038
255,000 EchoStar DBS Corp., 7.125%, 2/1/16 263,288
108,000 Harland Clarke Holdings Corp., 9.50%, 5/15/15 96,930
135,000 Harland Clarke Holdings Corp., VRN, 10.31%,
11/15/07, resets quarterly off the 3-month T-Bill
plus 4.75% with no caps 121,163
1,924,000 Idearc Inc., 8.00%, 11/15/16 1,928,879
495,000 Kabel Deutschland GmbH, 10.625%, 7/1/14 532,125
630,000 Lamar Media Corp., 6.625%, 8/15/15 611,100
655,000 LIN Television Corp., 6.50%, 5/15/13 640,263
540,000 Mediacom Broadband LLC/Mediacom Broadband Corp.,
8.50%, 10/15/15 544,050
265,000 Mediacom LLC/Mediacom Capital Corp., 7.875%, 2/15/11 261,688
560,000 Quebecor Media Inc., 7.75%, 3/15/16 (Acquired
9/26/07-9/28/07, Cost $530,319)(1) 536,900
310,000 R.H. Donnelley Corp., 6.875%, 1/15/13 294,500
750,000 R.H. Donnelley Corp., 6.875%, 1/15/13 712,500
1,090,000 R.H. Donnelley Corp., 6.875%, 1/15/13 1,035,499
215,000 R.H. Donnelley Corp., 8.875%, 1/15/16 220,106
225,000 R.H. Donnelley Corp., 8.875%, 10/15/17 (Acquired
9/19/07, Cost $225,000)(1) 229,500
960,000 Univision Communications Inc., 9.75%, 3/15/15
(Acquired 3/1/07, Cost $960,000)(1) 940,799
Principal Amount Value
$ 55,000 Videotron Ltee, 6.875%, 1/15/14 $54,313
235,000 Videotron Ltee, 6.375%, 12/15/15 222,075
------------
15,671,098
------------
METALS & MINING -- 1.7%
715,000 Freeport-McMoRan Copper & Gold Inc., 8.25%, 4/1/15 773,988
1,310,000 Freeport-McMoRan Copper & Gold Inc., 8.375%, 4/1/17 1,434,450
399,000 Novelis Inc., 7.25%, 2/15/15 387,030
------------
2,595,468
------------
MULTI-UTILITIES -- 0.5%
595,000 Basic Energy Services Inc., 7.125%, 4/15/16 581,613
160,000 PSEG Energy Holdings Inc., 8.50%, 6/15/11 169,204
------------
750,817
------------
OIL, GAS & CONSUMABLE FUELS -- 10.0%
605,000 Chaparral Energy Inc., 8.875%, 2/1/17 (Acquired
1/10/07-1/11/07, Cost $602,000)(1) 570,213
375,000 Chesapeake Energy Corp., 7.625%, 7/15/13 393,750
235,000 Chesapeake Energy Corp., 7.50%, 9/15/13 242,638
383,000 Chesapeake Energy Corp., 6.375%, 6/15/15 377,734
862,000 Chesapeake Energy Corp., 6.625%, 1/15/16 861,999
145,000 Cimarex Energy Co., 7.125%, 5/1/17 144,638
444,000 Complete Production Services, Inc., 8.00%, 12/15/16 441,225
430,000 Denbury Resources Inc., 7.50%, 12/15/15 442,900
560,000 El Paso Corp., 7.75%, 1/15/32 571,448
330,000 Forest Oil Corp., 7.25%, 6/15/19 (Acquired 6/1/07,
Cost $330,000)(1) 331,650
365,000 Kinder Morgan Finance Co., ULC, 5.70%, 1/5/16 333,589
565,000 Knight Inc., 6.50%, 9/1/12 562,260
370,000 Mariner Energy Inc., 8.00%, 5/15/17 363,525
640,000 Massey Energy Co., 6.625%, 11/15/10 628,800
110,000 Newfield Exploration Co., 6.625%, 9/1/14 108,625
525,000 Newfield Exploration Co., 6.625%, 4/15/16 515,813
- ------
24
High-Yield Bond
Principal Amount Value
$ 550,000 OPTI Canada Inc., 8.25%, 12/15/14 (Acquired
12/8/06, Cost $550,000)(1) $ 556,875
515,000 Peabody Energy Corp., 7.375%, 11/1/16 545,900
560,000 Peabody Energy Corp., 7.875%, 11/1/26 595,000
871,000 Petrohawk Energy Corp., 9.125%, 7/15/13 923,259
327,000 Petroplus Finance Ltd., 6.75%, 5/1/14 (Acquired
4/25/07, Cost $327,000)(1) 315,555
272,000 Petroplus Finance Ltd., 7.00%, 5/1/17 (Acquired
4/25/07, Cost $272,000)(1) 259,760
455,000 Plains Exploration & Production Co., 7.75%, 6/15/15 448,175
360,000 Plains Exploration & Production Co., 7.00%, 3/15/17 338,400
429,000 Pogo Producing Co., 7.875%, 5/1/13 446,160
594,000 Range Resources Corp., 6.375%, 3/15/15 582,120
130,000 Range Resources Corp., 7.50%, 5/15/16 133,250
160,000 Sonat Inc., 7.625%, 7/15/11 166,388
286,000 Stallion Oilfield Services/Stallion Oilfield
Finance Corp., 9.75%, 2/1/15 (Acquired 1/19/07,
Cost $286,000)(1) 278,493
670,000 Tesoro Corp., 6.625%, 11/1/15 673,349
530,000 W&T Offshore Inc., 8.25%, 6/15/14 (Acquired 6/8/07,
Cost $530,000)(1) 512,775
668,000 Whiting Petroleum Corp., 7.25%, 5/1/13 654,639
293,000 Williams Partners L.P./Williams Partners Finance
Corp., 7.25%, 2/1/17 (Acquired 12/6/06, Cost
$293,000)(1) 300,325
280,000 VeraSun Energy Corp., 9.375%, 6/1/17 (Acquired
5/11/07, Cost $278,600)(1) 242,200
------------
14,863,430
------------
PAPER & FOREST PRODUCTS -- 2.1%
740,000 Abitibi-Consolidated Co. of Canada, 8.375%, 4/1/15 542,050
908,000 Abitibi-Consolidated Inc., 7.75%, 6/15/11 703,700
385,000 Bowater Canada Finance, 7.95%, 11/15/11 318,588
Principal Amount Value
$ 252,000 Cascades Inc., 7.25%, 2/15/13 $ 248,220
180,000 Catalyst Paper Corp., 8.625%, 6/15/11 141,300
879,000 Georgia-Pacific Corp., 7.00%, 1/15/15 (Acquired
12/13/06, Cost $879,000)(1) 861,420
284,000 Georgia-Pacific Corp., 7.125%, 1/15/17 (Acquired
12/13/06, Cost $284,000)(1) 276,190
------------
3,091,468
------------
PHARMACEUTICALS -- 0.3%
505,000 Omnicare Inc., 6.75%, 12/15/13 473,438
------------
REAL ESTATE INVESTMENT TRUSTS -- 2.1%
612,000 FelCor Lodging L.P., 8.50%, 6/1/11 648,720
1,515,000 Host Marriot, L.P., 7.125%, 11/1/13 1,533,938
384,000 Senior Housing Properties Trust, 8.625%, 1/15/12 414,720
400,000 Ventas Realty L.P./Ventas Capital Corp., 9.00%,
5/1/12 437,000
35,000 Ventas Realty L.P./Ventas Capital Corp., 6.50%,
6/1/16 34,650
------------
3,069,028
------------
REAL ESTATE MANAGEMENT & DEVELOPMENT -- 1.1%
725,000 Realogy Corp., 10.50%, 4/15/14 (Acquired
4/5/07-4/6/07, Cost $718,589)(1) 619,875
475,000 Realogy Corp., 12.375%, 4/15/15 (Acquired 4/5/07,
Cost $466,194)(1) 359,813
665,000 Rouse Co. (The), 7.20%, 9/15/12 670,556
------------
1,650,244
------------
ROAD & RAIL -- 0.5%
690,000 Hertz Corp., 8.875%, 1/1/14 714,150
------------
SEMICONDUCTORS & SEMICONDUCTOR EQUIPMENT -- 1.1%
490,000 Freescale Semiconductor Inc., 8.875%, 12/15/14 475,300
735,000 Freescale Semiconductor Inc., 9.125%, 12/15/14 683,550
184,000 Freescale Semiconductor Inc., 10.125%, 12/15/16 172,040
342,000 STATS ChipPAC Ltd., 6.75%, 11/15/11 344,565
------------
1,675,455
------------
- ------
25
High-Yield Bond
Principal Amount Value
SPECIALTY RETAIL -- 1.9%
$ 190,000 Claire's Stores Inc., 9.25%, 6/1/15 (Acquired
5/22/07, Cost $190,000)(1) $ 165,300
495,000 Claire's Stores Inc., 10.50%, 6/1/17 (Acquired
5/22/07-7/27/07, Cost $443,300)(1) 383,625
560,000 GSC Holdings Corp., 8.00%, 10/1/12 585,199
440,000 Michaels Stores, Inc., 10.00%, 11/1/14 453,200
375,000 Michaels Stores, Inc., 11.375%, 11/1/16 385,313
485,000 Visant Corp., 7.625%, 10/1/12 495,913
395,000 Warnaco Inc., 8.875%, 6/15/13 415,738
------------
2,884,288
------------
TEXTILES, APPAREL & LUXURY GOODS -- 1.4%
520,000 Invista, 9.25%, 5/1/12 548,600
605,000 Levi Strauss & Co., 8.875%, 4/1/16 626,175
922,000 Oxford Industries, Inc., 8.875%, 6/1/11 935,830
------------
2,110,605
------------
THRIFTS & MORTGAGE FINANCE -- 1.1%
480,000 Residential Capital Corp., 6.50%, 4/17/13 388,012
480,000 Residential Capital Corp., 6.875%, 6/30/15 388,123
1,134,000 Residential Capital Corp., VRN, 8.69%, 10/17/07,
resets quarterly off the 3-month LIBOR plus 1.83%
with no caps (Acquired 4/11/06-8/22/07, Cost
$982,300)(1) 795,218
------------
1,571,353
------------
TOBACCO -- 0.5%
745,000 Reynolds American Inc., 7.625%, 6/1/16 796,929
------------
TRADING COMPANIES & DISTRIBUTORS -- 1.1%
305,000 Ashtead Capital Inc., 9.00%, 8/15/16 (Acquired
8/1/06, Cost $305,000)(1) 302,331
1,243,000 United Rentals North America, Inc., 6.50%, 2/15/12 1,264,753
------------
1,567,084
------------
TRANSPORTATION INFRASTRUCTURE -- 0.6%
83,000 Kansas City Southern de Mexico, SA de CV, 9.375%,
5/1/12 87,358
257,000 Kansas City Southern de Mexico, SA de CV, 7.625%,
12/1/13 (Acquired 11/13/06, Cost $257,000)(1) 252,502
Principal Amount Value
$ 585,000 Kansas City Southern de Mexico, SA de CV, 7.375%,
6/1/14 (Acquired 5/14/07, Cost $585,000)(1) $ 573,300
------------
913,160
------------
WIRELESS TELECOMMUNICATION SERVICES -- 0.7%
420,000 American Tower Corp., 0.00%, 10/15/17 (Acquired
9/24/07, Cost $420,000)(1) 424,725
542,000 Rogers Wireless Inc., 8.00%, 12/15/12 567,788
------------
992,513
------------
TOTAL CORPORATE BONDS
(Cost $139,818,865) 139,318,308
------------
Commercial Paper(2) -- 5.0%
2,000,000 Alpine Securitization, 5.90%, 10/5/07 1,997,900
1,800,000 Rabobank USA Financial Corp., 4.84%, 10/1/07 1,799,251
1,700,000 Thunder Bay Funding LLC, 5.25%, 10/4/07 1,698,465
2,000,000 Windmill Funding Corp., 6.20%, 10/15/07 1,994,922
------------
TOTAL COMMERCIAL PAPER
(Cost $7,493,123) 7,490,538
------------
TOTAL INVESTMENT SECURITIES -- 98.7%
(Cost $147,311,988) 146,808,846
------------
OTHER ASSETS AND LIABILITIES -- 1.3% 1,985,971
------------
TOTAL NET ASSETS -- 100.0% $148,794,817
============
Notes to Schedule of Investments
LIBOR = London Interbank Offered Rate
resets = The frequency with which a security's coupon changes, based on
current market conditions or an underlying index. The more frequently a
security resets, the less risk the investor is taking that the coupon will
vary significantly from current market rates.
VRN = Variable Rate Note. Interest reset date is indicated. Rate shown is
effective September 30, 2007.
(1) Security was purchased under Rule 144A of the Securities Act of 1933 or is
a private placement and, unless registered under the Act or exempted from
registration, may only be sold to qualified institutional investors. The
aggregate value of restricted securities at September 30, 2007, was
$26,886,651, which represented 18.1% of total net assets. None of the
restricted securities are considered to be illiquid.
(2) The rate indicated is the yield to maturity at purchase.
See Notes to Financial Statements.
- ------
26
SHAREHOLDER FEE EXAMPLES (UNAUDITED)
Fund shareholders may incur two types of costs: (1) transaction costs,
including sales charges (loads) on purchase payments and redemption/exchange
fees; and (2) ongoing costs, including management fees; distribution and
service (12b-1) fees; and other fund expenses. This example is intended to
help you understand your ongoing costs (in dollars) of investing in your fund
and to compare these costs with the ongoing cost of investing in other mutual
funds.
The example is based on an investment of $1,000 made at the beginning of the
period and held for the entire period from April 1, 2007 to September 30, 2007.
ACTUAL EXPENSES
The table provides information about actual account values and actual expenses
for each class. You may use the information, together with the amount you
invested, to estimate the expenses that you paid over the period. First,
identify the share class you own. Then simply divide your account value by
$1,000 (for example, an $8,600 account value divided by $1,000 = 8.6), then
multiply the result by the number under the heading "Expenses Paid During
Period" to estimate the expenses you paid on your account during this period.
If you hold Investor Class shares of any American Century fund, or
Institutional Class shares of the American Century Diversified Bond Fund, in
an American Century account (i.e., not a financial intermediary or retirement
plan account), American Century may charge you a $12.50 semiannual account
maintenance fee if the value of those shares is less than $10,000. We will
redeem shares automatically in one of your accounts to pay the $12.50 fee. In
determining your total eligible investment amount, we will include your
investments in all PERSONAL ACCOUNTS (including American Century Brokerage
accounts) registered under your Social Security number. PERSONAL ACCOUNTS
include individual accounts, joint accounts, UGMA/UTMA accounts, personal
trusts, Coverdell Education Savings Accounts and IRAs (including traditional,
Roth, Rollover, SEP-, SARSEP- and SIMPLE-IRAs), and certain other retirement
accounts. If you have only business, business retirement, employer-sponsored
or American Century Brokerage accounts, you are currently not subject to this
fee. We will not charge the fee as long as you choose to manage your accounts
exclusively online. If you are subject to the Account Maintenance Fee, your
account value could be reduced by the fee amount.
HYPOTHETICAL EXAMPLE FOR COMPARISON PURPOSES
The table also provides information about hypothetical account values and
hypothetical expenses based on the actual expense ratio of each class of your
fund and an assumed rate of return of 5% per year before expenses, which is
not the actual return of a fund's share class. The hypothetical account values
and expenses may not be used to estimate the actual ending account balance or
expenses you paid for the period. You may use this information to compare the
ongoing costs of investing in your fund and other funds. To do so, compare
this 5% hypothetical example with the 5% hypothetical examples that appear in
the shareholder reports of the other funds.
Please note that the expenses shown in the table are meant to highlight your
ongoing costs only and do not reflect any transactional costs, such as sales
charges (loads) or redemption/exchange fees. Therefore, the table is useful in
comparing ongoing costs only, and will not help you determine the relative
total costs of owning different funds. In addition, if these transactional
costs were included, your costs would have been higher.
- ------
27
Expenses Paid
Beginning During
Account Ending Period(1) Annualized
Value Account Value 4/1/07 - Expense
4/1/07 9/30/07 9/30/07 Ratio(1)
Select Bond
ACTUAL
Investor Class $1,000 $1,014.00 $3.12 0.62%
Institutional Class $1,000 $1,015.00 $2.12 0.42%
A Class (after
waiver)(2) $1,000 $1,012.80 $4.28 0.85%
A Class (before
waiver) $1,000 $1,012.80(3) $4.38 0.87%
B Class (after
waiver)(2) $1,000 $1,009.50 $7.54 1.50%
B Class (before
waiver) $1,000 $1,009.50(3) $8.14 1.62%
C Class $1,000 $1,008.90 $8.14 1.62%
R Class $1,000 $1,011.40 $5.63 1.12%
HYPOTHETICAL
Investor Class $1,000 $1,021.90 $3.13 0.62%
Institutional Class $1,000 $1,022.90 $2.12 0.42%
A Class (after
waiver)(2) $1,000 $1,020.75 $4.29 0.85%
A Class (before
waiver) $1,000 $1,020.65 $4.39 0.87%
B Class (after
waiver)(2) $1,000 $1,017.50 $7.57 1.50%
B Class (before
waiver) $1,000 $1,016.90 $8.17 1.62%
C Class $1,000 $1,016.90 $8.17 1.62%
R Class $1,000 $1,019.40 $5.65 1.12%
(1) Expenses are equal to the class's annualized expense ratio listed in the
table above, multiplied by the average account value over the period,
multiplied by 183, the number of days in the most recent fiscal half-year,
divided by 366, to reflect the one-half year period.
(2) During the six months ended September 30, 2007, the class received a
partial waiver of its distribution and service fees.
(3) Ending account value assumes the return earned after waiver. The return
would have been lower had fees not been waived and would have resulted in a
lower ending account value.
- ------
28
Expenses
Paid
Beginning During
Account Ending Period(1) Annualized
Value Account Value 4/1/07 - Expense
4/1/07 9/30/07 9/30/07 Ratio(1)
High-Yield Bond
ACTUAL
Investor Class (after
waiver)(2) $1,000 $1,007.00 $4.01 0.80%
Investor Class (before
waiver) $1,000 $1,007.00(3) $4.37 0.87%
Institutional Class
(after waiver)(2) $1,000 $1,008.00 $3.01 0.60%
Institutional Class
(before waiver) $1,000 $1,008.00(3) $3.36 0.67%
A Class (after waiver)(2) $1,000 $1,005.70 $5.26 1.05%
A Class (before waiver) $1,000 $1,005.70(3) $5.62 1.12%
B Class (after waiver)(2) $1,000 $1,001.90 $9.01 1.80%
B Class (before waiver) $1,000 $1,001.90(3) $9.36 1.87%
C Class (after waiver)(2) $1,000 $1,002.00 $9.01 1.80%
C Class (before waiver) $1,000 $1,002.00(3) $9.36 1.87%
R Class (after waiver)(2) $1,000 $1,004.50 $6.51 1.30%
R Class (before waiver) $1,000 $1,004.50(3) $6.87 1.37%
HYPOTHETICAL
Investor Class (after
waiver)(2) $1,000 $1,021.00 $4.04 0.80%
Investor Class (before
waiver) $1,000 $1,020.65 $4.39 0.87%
Institutional Class
(after waiver)(2) $1,000 $1,022.00 $3.03 0.60%
Institutional Class
(before waiver) $1,000 $1,021.65 $3.39 0.67%
A Class (after waiver)(2) $1,000 $1,019.75 $5.30 1.05%
A Class (before waiver) $1,000 $1,019.40 $5.65 1.12%
B Class (after waiver)(2) $1,000 $1,016.00 $9.07 1.80%
B Class (before waiver) $1,000 $1,015.65 $9.42 1.87%
C Class (after waiver)(2) $1,000 $1,016.00 $9.07 1.80%
C Class (before waiver) $1,000 $1,015.65 $9.42 1.87%
R Class (after waiver)(2) $1,000 $1,018.50 $6.56 1.30%
R Class (before waiver) $1,000 $1,018.15 $6.91 1.37%
(1) Expenses are equal to the class's annualized expense ratio listed in the
table above, multiplied by the average account value over the period,
multiplied by 183, the number of days in the most recent fiscal half-year,
divided by 366, to reflect the one-half year period.
(2) During the six months ended September 30, 2007, the class received a
partial waiver of its management fees.
(3) Ending account value assumes the return earned after waiver. The return
would have been lower had fees not been waived and would have resulted in a
lower ending account value.
- ------
29
STATEMENT OF ASSETS AND LIABILITIES
SEPTEMBER 30, 2007 (UNAUDITED)
High-Yield
Select Bond Bond
ASSETS
Investment securities, at value (cost of
$98,982,212 and $147,311,988, respectively) $97,743,002 $146,808,846
Cash 260,628 154,538
Receivable for investments sold 1,670,905 420,563
Receivable for capital shares sold 705 --
Interest receivable 853,650 3,318,360
----------- ------------
100,528,890 150,702,307
----------- ------------
LIABILITIES
Payable for investments purchased 3,465,275 1,766,478
Payable for capital shares redeemed 395,429 43,945
Accrued management fees 44,011 75,163
Distribution fees payable 4,920 1,801
Service fees (and distribution fees -- A Class and
R Class) payable 11,358 4,068
Dividends payable 11,125 16,035
----------- ------------
3,932,118 1,907,490
----------- ------------
NET ASSETS $96,596,772 $148,794,817
=========== ============
See Notes to Financial Statements.
- ------
30
SEPTEMBER 30, 2007 (UNAUDITED)
Select Bond High-Yield Bond
NET ASSETS CONSIST OF:
Capital paid in $106,666,000 $156,731,689
Accumulated net realized loss on investment
transactions (8,817,441) (7,433,730)
Net unrealized depreciation on investments (1,251,787) (503,142)
------------ ------------
$ 96,596,772 $148,794,817
============ ============
INVESTOR CLASS
Net assets $280,808 $330,105
Shares outstanding 29,979 47,121
Net asset value per share $9.37 $7.01
INSTITUTIONAL CLASS
Net assets $34,435,118 $128,852,089
Shares outstanding 3,676,245 18,393,066
Net asset value per share $9.37 $7.01
A CLASS
Net assets $53,935,035 $16,631,296
Shares outstanding 5,758,023 2,374,048
Net asset value per share $9.37 $7.01
Maximum offering price (net asset value divided
by 0.955) $9.81 $7.34
B CLASS
Net assets $7,722,806 $2,876,465
Shares outstanding 824,581 410,836
Net asset value per share $9.37 $7.00
C CLASS
Net assets $192,792 $77,283
Shares outstanding 20,580 11,031
Net asset value per share $9.37 $7.01
R CLASS
Net assets $30,213 $27,579
Shares outstanding 3,225 3,937
Net asset value per share $9.37 $7.01
See Notes to Financial Statements.
- ------
31
STATEMENT OF OPERATIONS
FOR THE SIX MONTHS ENDED SEPTEMBER 30, 2007 (UNAUDITED)
Select Bond High-Yield Bond
INVESTMENT INCOME (LOSS)
INCOME:
Interest $ 2,709,295 $ 5,847,318
EXPENSES:
Management fees 282,964 521,583
Distribution fees:
B Class 29,814 11,214
C Class 721 366
Service fees:
B Class 9,938 3,738
C Class 240 122
Distribution and service fees:
A Class 75,874 23,965
R Class 74 68
Trustees' fees and expenses 2,502 3,600
Other expenses 57 81
----------- -----------
402,184 564,737
Amount waived (10,840) (53,026)
----------- -----------
391,344 511,711
----------- -----------
NET INVESTMENT INCOME (LOSS) 2,317,951 5,335,607
----------- -----------
REALIZED AND UNREALIZED GAIN (LOSS)
NET REALIZED GAIN (LOSS) ON:
Investment and foreign currency transactions (227,545) 11,812
Futures transactions (63,424) --
----------- -----------
(290,969) 11,812
----------- -----------
CHANGE IN NET UNREALIZED APPRECIATION
(DEPRECIATION) ON:
Investments (775,936) (4,257,649)
Futures (12,577) --
----------- -----------
(788,513) (4,257,649)
----------- -----------
NET REALIZED AND UNREALIZED GAIN (LOSS) (1,079,482) (4,245,837)
----------- -----------
NET INCREASE (DECREASE) IN NET ASSETS RESULTING
FROM OPERATIONS $ 1,238,469 $ 1,089,770
=========== ===========
See Notes to Financial Statements.
- ------
32
STATEMENT OF CHANGES IN NET ASSETS
SIX MONTHS ENDED SEPTEMBER 30, 2007 (UNAUDITED) AND YEAR ENDED MARCH 31, 2007
Select Bond High-Yield Bond
Increase (Decrease) Sept. 30, March 31, Sept. 30, March 31,
in Net Assets 2007 2007 2007 2007
OPERATIONS
Net investment income
(loss) $ 2,317,951 $ 5,104,412 $ 5,335,607 $ 9,960,875
Net realized gain
(loss) (290,969) (1,807,284) 11,812 337,593
Change in net
unrealized
appreciation
(depreciation) (788,513) 3,264,050 (4,257,649) 4,205,432
------------ ------------ ------------ ------------
Net increase
(decrease) in net
assets resulting from
operations 1,238,469 6,561,178 1,089,770 14,503,900
------------ ------------ ------------ ------------
DISTRIBUTIONS TO SHAREHOLDERS
From net investment
income:
Investor Class (5,021) (2,333) (10,426) (9,834)
Institutional
Class (828,769) (1,540,109) (4,586,056) (8,227,506)
A Class (1,353,284) (3,290,481) (645,832) (1,509,725)
B Class (151,094) (323,490) (89,503) (208,448)
C Class (3,531) (2,514) (2,903) (3,774)
R Class (614) (1,077) (887) (1,589)
------------ ------------ ------------ ------------
Decrease in net
assets from
distributions (2,342,313) (5,160,004) (5,335,607) (9,960,876)
------------ ------------ ------------ ------------
CAPITAL SHARE TRANSACTIONS
Net increase
(decrease) in net
assets from capital
share transactions (11,503,125) (24,651,321) 273,735 1,935,749
------------ ------------ ------------ ------------
NET INCREASE
(DECREASE) IN NET
ASSETS (12,606,969) (23,250,147) (3,972,102) 6,478,773
NET ASSETS
Beginning of period 109,203,741 132,453,888 152,766,919 146,288,146
------------ ------------ ------------ ------------
End of period $ 96,596,772 $109,203,741 $148,794,817 $152,766,919
============ ============ ============ ============
Undistributed net
investment income -- $195,339 -- $193,295
============ ============ ============ ============
See Notes to Financial Statements.
- ------
33
NOTES TO FINANCIAL STATEMENTS
SEPTEMBER 30, 2007 (UNAUDITED)
1. ORGANIZATION AND SUMMARY OF SIGNIFICANT ACCOUNTING POLICIES
ORGANIZATION -- American Century Investment Trust (the trust) is registered
under the Investment Company Act of 1940 (the 1940 Act) as an open-end
management investment company. American Century-Mason Street Select Bond Fund
(Select Bond) and American Century-Mason Street High-Yield Bond Fund
(High-Yield Bond) (the funds) are two funds in a series issued by the
corporation. The funds are diversified under the 1940 Act. Select Bond's
investment objective is to seek high income and capital appreciation,
consistent with capital preservation. Select Bond invests primarily in
investment-grade debt securities with maturities exceeding one year.
High-Yield Bond's investment objective is to seek high current income and
capital appreciation. High-Yield Bond invests primarily in non-
investment-grade debt securities, which are subject to greater credit risk and
consequently offer higher yields. The following is a summary of the funds'
significant accounting policies.
MULTIPLE CLASS -- The funds are authorized to issue the Investor Class, the
Institutional Class, the A Class, the B Class, the C Class and the R Class.
The A Class may incur an initial sales charge. The A Class, B Class and C
Class may be subject to a contingent deferred sales charge. The share classes
differ principally in their respective sales charges and distribution and
shareholder servicing expenses and arrangements. All shares of each fund
represent an equal pro rata interest in the net assets of the class to which
such shares belong, and have identical voting, dividend, liquidation and other
rights and the same terms and conditions, except for class specific expenses
and exclusive rights to vote on matters affecting only individual classes.
Income, non-class specific expenses, and realized and unrealized capital gains
and losses of the funds are allocated to each class of shares based on their
relative net assets. Sale of the funds' Investor Class, Institutional Class, C
Class and R Class commenced on April 3, 2006.
SECURITY VALUATIONS -- Debt securities maturing in greater than 60 days are
valued at current market value as provided by a commercial pricing service or
at the mean of the most recent bid and asked prices. Debt securities maturing
within 60 days may be valued at cost, plus or minus any amortized discount or
premium. Securities traded on foreign securities exchanges and
over-the-counter markets are normally completed before the close of business
on days that the New York Stock Exchange (the Exchange) is open and may also
take place on days when the Exchange is not open. If an event occurs after the
value of a security was established but before the net asset value per share
was determined that was likely to materially change the net asset value, that
security would be valued as determined in accordance with procedures adopted
by the Board of Trustees. If the funds determine that the market price of a
portfolio security is not readily available, or that the valuation methods
mentioned above do not reflect the security's fair value, such security is
valued as determined by, or in accordance with procedures adopted by, the
Board of Trustees or its designee if such determination would materially
impact a fund's net asset value. Certain other circumstances may cause the
funds to use alternative procedures to value a security such as: a security
has been declared in default; trading in a security has been halted during the
trading day; or there is a foreign market holiday and no trading will commence.
SECURITY TRANSACTIONS -- For financial reporting, security transactions are
accounted for as of the trade date. Net realized gains and losses are
determined on the identified cost basis, which is also used for federal income
tax purposes.
INVESTMENT INCOME -- Interest income less foreign taxes withheld, if any, is
recorded on the accrual basis and includes paydown gain (loss) and accretion
of discounts and amortization of premiums.
WHEN-ISSUED AND FORWARD COMMITMENTS -- The funds may engage in securities
transactions on a when-issued or forward commitment basis. In these
transactions, the securities' prices and yields are fixed on the date of the
commitment. In a when-issued transaction, the payment and delivery are
scheduled for a future date and during this period, securities are subject to
market fluctuations. In a forward commitment transaction, the funds may sell a
security and at the same time make a commitment to purchase the same security
at a future date at a specified price. Conversely, the funds may purchase a
security and at the same time make a commitment to sell the same security at a
future date at a specified price. These types of transactions are executed
simultaneously in what are known as "roll" transactions. The funds will
segregate cash, cash equivalents or other appropriate liquid securities on
their records in amounts sufficient to meet the purchase price. The funds
account for "roll" transactions as purchases and sales; as such these
transactions may increase portfolio turnover.
- ------
34
FUTURES CONTRACTS -- The funds may enter into futures contracts in order to
manage the funds' exposure to changes in market conditions. One of the risks
of entering into futures contracts is the possibility that the change in value
of the contract may not correlate with the changes in value of the underlying
securities. Upon entering into a futures contract, the funds are required to
deposit either cash or securities in an amount equal to a certain percentage
of the contract value (initial margin). Subsequent payments (variation margin)
are made or received daily, in cash, by the funds. The variation margin is
equal to the daily change in the contract value and is recorded as unrealized
gains and losses. The funds recognize a realized gain or loss when the
contract is closed or expires. Net realized and unrealized gains or losses
occurring during the holding period of futures contracts are a component of
realized gain (loss) on futures transactions and unrealized appreciation
(depreciation) on futures, respectively.
FOREIGN CURRENCY TRANSACTIONS -- All assets and liabilities initially
expressed in foreign currencies are translated into U.S. dollars at prevailing
exchange rates at period end. Purchases and sales of investment securities,
dividend and interest income, and certain expenses are translated at the rates
of exchange prevailing on the respective dates of such transactions. For
assets and liabilities, other than investments in securities, net realized and
unrealized gains and losses from foreign currency translations arise from
changes in currency exchange rates.
Net realized and unrealized foreign currency exchange gains or losses
occurring during the holding period of investment securities are a component
of realized gain (loss) on investment transactions and unrealized appreciation
(depreciation) on investments, respectively. Certain countries may impose
taxes on the contract amount of purchases and sales of foreign currency
contracts in their currency. The funds record the foreign tax expense, if any,
as a reduction to the net realized gain (loss) on foreign currency
transactions.
REPURCHASE AGREEMENTS -- The funds may enter into repurchase agreements with
institutions that American Century Investment Management, Inc. (ACIM) (the
investment advisor) has determined are creditworthy pursuant to criteria
adopted by the Board of Trustees. Each repurchase agreement is recorded at
cost. Each fund requires that the collateral, represented by securities,
received in a repurchase transaction be transferred to the custodian in a
manner sufficient to enable each fund to obtain those securities in the event
of a default under the repurchase agreement. ACIM monitors, on a daily basis,
the securities transferred to ensure the value, including accrued interest, of
the securities under each repurchase agreement is equal to or greater than
amounts owed to each fund under each repurchase agreement.
JOINT TRADING ACCOUNT -- Pursuant to an Exemptive Order issued by the
Securities and Exchange Commission, each fund, along with other registered
investment companies having management agreements with ACIM or American
Century Global Investment Management, Inc. (ACGIM), may transfer uninvested
cash balances into a joint trading account. These balances are invested in one
or more repurchase agreements that are collateralized by U.S. Treasury or
Agency obligations.
INCOME TAX STATUS -- It is each fund's policy to distribute substantially all
net investment income and net realized gains to shareholders and to otherwise
qualify as a regulated investment company under provisions of the Internal
Revenue Code. The funds are no longer subject to examination by tax
authorities for years prior to 2004. At this time, management has not
identified any uncertain tax positions that would materially impact the
financial statements. Accordingly, no provision has been made for federal or
state income taxes. Interest and penalties associated with any federal or
state income tax obligations, if any, are recorded as interest expense.
DISTRIBUTIONS TO SHAREHOLDERS -- Distributions from net investment income for
the funds are declared daily and paid monthly. Distributions from net realized
gains for the funds, if any, are generally declared and paid annually.
INDEMNIFICATIONS -- Under the trust's organizational documents, its officers
and trustees are indemnified against certain liabilities arising out of the
performance of their duties to the funds. In addition, in the normal course of
business, the funds enter into contracts that provide general
indemnifications. The funds' maximum exposure under these arrangements is
unknown as this would involve future claims that may be made against the
funds. The risk of material loss from such claims is considered by management
to be remote.
USE OF ESTIMATES -- The financial statements are prepared in conformity with
accounting principles generally accepted in the United States of America,
which may require management to make certain estimates and assumptions at the
date of the financial statements. Actual results could differ from these
estimates.
- ------
35
2. FEES AND TRANSACTIONS WITH RELATED PARTIES
MANAGEMENT FEES -- The trust has entered into a Management Agreement with
ACIM, under which ACIM provides the funds with investment advisory and
management services in exchange for a single, unified management fee (the
fee). The Agreement provides that all expenses of the funds, except brokerage
commissions, taxes, interest, fees and expenses of those trustees who are not
considered "interested persons" as defined in the 1940 Act (including counsel
fees) and extraordinary expenses, will be paid by ACIM. The fee is computed
and accrued daily based on the daily net assets of each specific class of
shares of each fund and paid monthly in arrears. The fee consists of (1) an
Investment Category Fee based on the daily net assets of the funds and certain
other accounts managed by the investment advisor that are in the same broad
investment category as each fund and (2) a Complex Fee based on the assets of
all the funds in the American Century family of funds. The rates for the
Investment Category Fee range from 0.2925% to 0.4100% for Select Bond and from
0.5425% to 0.6600% for High-Yield Bond. The rates for the Complex Fee
(Investor Class, A Class, B Class, C Class and R Class) range from 0.2500% to
0.3100%. The Institutional Class is 0.2000% less at each point within the
Complex Fee range. From August 1, 2006 through July 31, 2007, the investment
advisor voluntarily agreed to waive 0.071% of its management fee for
High-Yield Bond. Effective August 1, 2007, the investment advisor voluntarily
agreed to waive 0.070% of its management fee for High-Yield Bond. The total
amount of the waiver for the six months ended September 30, 2007, was $105,
$45,042, $6,777, $1,057, $35 and $10 for the Investor Class, Institutional
Class, A Class, B Class, C Class and R Class, respectively. The fee waiver may
be revised or terminated at any time without notice.
The effective annual management fee for each class of each fund for the six
months ended September 30, 2007, was as follows:
Investor, A, B, C & R Institutional
Select Bond 0.62% 0.42%
High-Yield Bond (before waiver) 0.87% 0.67%
High-Yield Bond (after waiver) 0.80% 0.60%
ACIM has entered into a Subadvisory Agreement with Mason Street Advisors LLC
(the subadvisor) on behalf of the funds. The subadvisor makes investment
decisions for the funds in accordance with the funds' investment objectives,
policies, and restrictions under the supervision of ACIM and the Board of
Trustees. ACIM pays all costs associated with retaining Mason Street Advisors
LLC as the subadvisor of the funds.
DISTRIBUTION AND SERVICE FEES -- The Board of Trustees has adopted a separate
Master Distribution and Individual Shareholder Services Plan for each of the A
Class, B Class, C Class and R Class (collectively the plans), pursuant to Rule
12b-1 of the 1940 Act. The plans provide that the A Class and the R Class will
pay American Century Investment Services, Inc. (ACIS) an annual distribution
and service fee of 0.25% for the A Class and 0.50% for the R Class. The plans
provide that the B Class and C Class will each pay ACIS an annual distribution
fee and service fee of 0.75% and 0.25%, respectively. The fees are computed
and accrued daily based on each class's daily net assets and paid monthly in
arrears. The distribution fee provides compensation for expenses incurred in
connection with distributing shares of the classes including, but not limited
to, payments to brokers, dealers, and financial institutions that have entered
into sales agreements with respect to shares of the funds. The service fee
provides compensation for individual shareholder services rendered by
broker/dealers or other independent financial intermediaries for A Class, B
Class, C Class and R Class shares. ACIS has agreed to voluntarily waive a
portion of its distribution and service fees through March 31, 2008, by 0.02%
and 0.12% for the A Class and B Class, respectively, of Select Bond. The total
amount of the waiver for the six months ended September 30, 2007, was $6,070
and $4,770 for the A Class and B Class, respectively. Fees incurred under the
plans during the six months ended September 30, 2007, are detailed in the
Statement of Operations.
RELATED PARTIES -- Certain officers and trustees of the trust are also
officers and/or directors, and, as a group, controlling stockholders of
American Century Companies, Inc. (ACC), the parent of the trust's investment
advisor, ACIM, the distributor of the trust, ACIS, and the trust's transfer
agent, American Century Services, LLC.
The funds have a bank line of credit agreement with JPMorgan Chase Bank
(JPMCB). JPMCB is a custodian of the funds and a wholly owned subsidiary of
JPMorgan Chase & Co. (JPM). JPM is an equity investor in ACC.
- ------
36
3. INVESTMENT TRANSACTIONS
Investment transactions, excluding short-term investments, for the six months
ended September 30, 2007, were as follows:
High-Yield
Select Bond Bond
PURCHASES
U.S. Treasury & Government Agency Obligations $74,858,454 --
Investment securities other than U.S. Treasury &
Government Agency Obligations $9,794,339 $41,721,198
PROCEEDS FROM SALES
U.S. Treasury & Government Agency Obligations $81,039,696 --
Investment securities other than U.S. Treasury &
Government Agency Obligations $14,110,660 $42,639,160
4. CAPITAL SHARE TRANSACTIONS
Transactions in shares of the funds were as follows (unlimited number of
shares authorized):
Six months ended September
30, 2007 Year ended March 31, 2007(1)
Shares Amount Shares Amount
Select Bond
INVESTOR CLASS
Sold 21,684 $ 201,865 10,589 $ 99,072
Issued in
reinvestment of
distributions 313 2,927 244 2,295
Redeemed (2,851) (26,575) -- --
----------- ------------- ----------- -------------
19,146 178,217 10,833 101,367
----------- ------------- ----------- -------------
INSTITUTIONAL CLASS
Sold -- -- 3,423,279 31,964,191
Issued in
reinvestment of
distributions 88,103 823,614 164,863 1,540,109
----------- ------------- ----------- -------------
88,103 823,614 3,588,142 33,504,300
----------- ------------- ----------- -------------
A CLASS
Sold 487,066 4,551,019 1,553,876 14,580,154
Issued in
reinvestment of
distributions 132,371 1,237,564 319,707 2,996,126
Redeemed (1,920,991) (17,943,801) (8,005,164) (74,708,637)
----------- ------------- ----------- -------------
(1,301,554) (12,155,218) (6,131,581) (57,132,357)
----------- ------------- ----------- -------------
B CLASS
Sold 10,318 96,501 45,005 425,746
Issued in
reinvestment of
distributions 13,800 128,985 29,408 275,223
Redeemed (67,498) (632,194) (212,818) (1,990,778)
----------- ------------- ----------- -------------
(43,380) (406,708) (138,405) (1,289,809)
----------- ------------- ----------- -------------
C CLASS
Sold 9,161 86,119 14,458 134,369
Issued in
reinvestment of
distributions 363 3,390 269 2,514
Redeemed (3,671) (34,220) -- --
----------- ------------- ----------- -------------
5,853 55,289 14,727 136,883
----------- ------------- ----------- -------------
R CLASS
Sold 114 1,071 4,489 41,957
Issued in
reinvestment of
distributions 65 610 112 1,053
Redeemed -- -- (1,555) (14,715)
----------- ------------- ----------- -------------
179 1,681 3,046 28,295
----------- ------------- ----------- -------------
Net increase
(decrease) (1,231,653) $(11,503,125) (2,653,238) $(24,651,321)
=========== ============= =========== =============
(1) April 3, 2006 (commencement of sale) through March 31, 2007 for Investor
Class, Institutional Class, C Class and R Class.
- ------
37
Six months ended September
30, 2007 Year ended March 31, 2007(1)
Shares Amount Shares Amount
High-Yield Bond
INVESTOR CLASS
Sold 4,295 $ 30,093 46,821 $ 329,531
Issued in
reinvestment of
distributions 1,472 10,357 1,367 9,777
Redeemed (167) (1,168) (6,667) (47,688)
--------- ----------- ------------ -------------
5,600 39,282 41,521 291,620
--------- ----------- ------------ -------------
INSTITUTIONAL CLASS
Sold -- -- 16,575,523 116,357,372
Issued in
reinvestment of
distributions 648,546 4,561,712 1,168,997 8,227,506
--------- ----------- ------------ -------------
648,546 4,561,712 17,744,520 124,584,878
--------- ----------- ------------ -------------
A CLASS
Sold 149,228 1,053,003 738,562 5,219,940
Issued in
reinvestment of
distributions 73,246 515,718 158,029 1,136,977
Redeemed (809,308) (5,700,531) (18,265,197) (128,220,528)
--------- ----------- ------------ -------------
(586,834) (4,131,810) (17,368,606) (121,863,611)
--------- ----------- ------------ -------------
B CLASS
Sold 8,538 61,462 29,791 208,698
Issued in
reinvestment of
distributions 10,347 72,782 23,801 167,556
Redeemed (43,243) (306,342) (224,281) (1,580,291)
--------- ----------- ------------ -------------
(24,358) (172,098) (170,689) (1,204,037)
--------- ----------- ------------ -------------
C CLASS
Sold 582 3,989 14,012 96,457
Issued in
reinvestment of
distributions 392 2,762 534 3,774
Redeemed (4,489) (31,071) -- --
--------- ----------- ------------ -------------
(3,515) (24,320) 14,546 100,231
--------- ----------- ------------ -------------
R CLASS
Sold 13 87 3,724 26,166
Issued in
reinvestment of
distributions 125 882 225 1,589
Redeemed -- -- (150) (1,087)
--------- ----------- ------------ -------------
138 969 3,799 26,668
--------- ----------- ------------ -------------
Net increase
(decrease) 39,577 $ 273,735 265,091 $ 1,935,749
========= =========== ============ =============
(1) April 3, 2006 (commencement of sale) through March 31, 2007 for Investor
Class, Institutional Class, C Class and R Class.
5. BANK LINE OF CREDIT
The funds, along with certain other funds managed by ACIM or ACGIM, have a
$500,000,000 unsecured bank line of credit agreement with JPMCB. The funds may
borrow money for temporary or emergency purposes to fund shareholder
redemptions. Borrowings under the agreement bear interest at the Federal Funds
rate plus 0.40%. The funds did not borrow from the line during the six months
ended September 30, 2007.
6. RISK FACTORS
High-Yield Bond invests primarily in lower-rated debt securities, which are
subject to substantial risks including price volatility, liquidity risk, and
default risk.
- ------
38
7. FEDERAL TAX INFORMATION
The book-basis character of distributions made during the year from net
investment income or net realized gains may differ from their ultimate
characterization for federal income tax purposes. These differences reflect
the differing character of paydown losses, certain income items and net
realized gains and losses for financial statement and tax purposes, and may
result in reclassification among certain capital accounts on the financial
statements. Reclassifications between income and realized gain in Select Bond
relate primarily to the character of paydown losses.
As of September 30, 2007, the components of investments for federal income tax
purposes were as follows:
Select Bond High-Yield Bond
Federal tax cost of investments $99,018,146 $147,383,493
============ ============
Gross tax appreciation of investments $ 402,738 $ 2,531,047
Gross tax depreciation of investments (1,677,882) (3,105,694)
------------ ------------
Net tax appreciation (depreciation) of investments $(1,275,144) $ (574,647)
============ ============
The difference between book-basis and tax-basis cost and unrealized
appreciation (depreciation) is attributable primarily to the tax deferral of
losses on wash sales.
Following are the capital loss carryovers and capital loss deferral amounts as
of March 31, 2007:
Select Bond High-Yield Bond
Accumulated capital losses $(7,963,150) $(7,247,151)
Capital loss deferrals $(101,534) --
The accumulated capital losses listed above represent net capital loss
carryovers that may be used to offset future realized capital gains for
federal income tax purposes. Future capital loss carryover utilization in any
given year may be limited due to large shareholder redemptions. The capital
loss carryovers expire as follows:
2011 2012 2013 2014 2015
Select Bond -- -- $(244,518) $(4,029,895) $(3,688,737)
High-Yield Bond $(4,165,343) -- -- $(2,056,361) $(1,025,447)
The capital loss deferrals listed above represent net capital losses incurred
in the five-month period ended March 31, 2007. The funds have elected to treat
such losses as having been incurred in the following fiscal year for federal
income tax purposes.
- ------
39
8. REORGANIZATION PLAN
As of the close of business on March 31, 2006, Select Bond and High-Yield Bond
acquired all of the net assets of two funds issued by Mason Street Funds,
Inc., Mason Street Select Bond Fund (Mason Street Select) and Mason Street
High Yield Bond Fund (Mason Street High Yield), respectively, pursuant to a
plan of reorganization approved by the acquired funds' shareholders on March
23, 2006. The surviving funds for the purposes of maintaining the financial
statements and performance history in the post-reorganization period are Mason
Street Select and Mason Street High Yield. These funds were also reorganized
as funds issued by American Century Investment Trust.
Prior to the reorganization, Mason Street Select and Mason Street High Yield
had A Class, B Class and C Class shares. At the close of business and as a
result of the reorganization, A Class shares and B Class shares of the
acquired funds were converted to A Class shares and B Class shares,
respectively, of the surviving funds. C Class shares of the acquired funds
were converted to A Class shares of the surviving funds.
A Class, B Class and C Class net assets of Mason Street Select before the
reorganization were $121,068,940, $9,387,851 and $1,997,097, respectively.
Immediately after the reorganization, A Class, B Class and C Class net assets
of Select Bond were $123,066,037, $9,387,851 and $-, respectively.
A Class, B Class and C Class net assets of Mason Street High Yield before the
reorganization were $141,592,864, $4,231,440 and $463,842, respectively.
Immediately after the reorganization, A Class, B Class and C Class net assets
of High-Yield Bond were $142,056,706, $4,231,440 and $-, respectively.
9. RECENTLY ISSUED ACCOUNTING STANDARDS
In June 2006, the Financial Accounting Standards Board (FASB) issued
Interpretation No. 48, "Accounting for Uncertainty in Income Taxes - an
Interpretation of FASB Statement No. 109" (FIN 48). FIN 48 establishes a
minimum threshold for financial statement recognition of the benefit of
positions taken in filing tax returns (including whether an entity is taxable
in a particular jurisdiction), and requires certain expanded tax disclosures.
FIN 48 is effective for fiscal years beginning after December 15, 2006, and is
to be applied to all open tax years as of the date of effectiveness.
Management has concluded that the adoption of FIN 48 will not materially
impact the financial statements.
The FASB issued Statement of Financial Accounting Standards No. 157, "Fair
Value Measurements" (FAS 157), in September 2006, which is effective for
fiscal years beginning after November 15, 2007. FAS 157 defines fair value,
establishes a framework for measuring fair value and expands the required
financial statement disclosures about fair value measurements. Management is
currently evaluating the impact that adopting FAS 157 will have on the
financial statement disclosures.
- ------
40
FINANCIAL HIGHLIGHTS
Select Bond
Investor Class
For a Share Outstanding Throughout the Years Ended March 31 (except as noted)
2007(1) 2007(2)
PER-SHARE DATA
Net Asset Value, Beginning of Period $9.46 $9.33
------ ------
Income From Investment Operations
Net Investment Income (Loss)(3) 0.22 0.41
Net Realized and Unrealized Gain (Loss) (0.09) 0.14
------ ------
Total From Investment Operations 0.13 0.55
------ ------
Distributions
From Net Investment Income (0.22) (0.42)
------ ------
Net Asset Value, End of Period $9.37 $9.46
====== ======
TOTAL RETURN(4) 1.40% 6.06%
RATIOS/SUPPLEMENTAL DATA
Ratio of Operating Expenses to Average Net Assets 0.62%(5) 0.62%(5)
Ratio of Net Investment Income (Loss) to Average Net Assets 4.65%(5) 4.52%(5)
Portfolio Turnover Rate 85% 161%
Net Assets, End of Period (in thousands) $281 $102
(1) Six months ended September 30, 2007 (unaudited).
(2) April 3, 2006 (commencement of sale) through March 31, 2007.
(3) Computed using average shares outstanding throughout the period.
(4) Total return assumes reinvestment of net investment income and capital
gains distributions, if any. Total returns for periods less than one year are
not annualized. The total return of the classes may not precisely reflect the
class expense differences because of the impact of calculating the net asset
values to two decimal places. If net asset values were calculated to three
decimal places, the total return differences would more closely reflect the
class expense differences. The calculation of net asset values to two decimal
places is made in accordance with SEC guidelines and does not result in any
gain or loss of value between one class and another.
(5) Annualized.
See Notes to Financial Statements.
- ------
41
Select Bond
Institutional Class
For a Share Outstanding Throughout the Years Ended March 31 (except as noted)
2007(1) 2007(2)
PER-SHARE DATA
Net Asset Value, Beginning of Period $9.46 $9.33
------ ------
Income From Investment Operations
Net Investment Income (Loss)(3) 0.23 0.44
Net Realized and Unrealized Gain (Loss) (0.09) 0.13
------ ------
Total From Investment Operations 0.14 0.57
------ ------
Distributions
From Net Investment Income (0.23) (0.44)
------ ------
Net Asset Value, End of Period $9.37 $9.46
====== ======
TOTAL RETURN(4) 1.50% 6.27%
RATIOS/SUPPLEMENTAL DATA
Ratio of Operating Expenses to Average Net Assets 0.42%(5) 0.42%(5)
Ratio of Net Investment Income (Loss) to Average Net Assets 4.85%(5) 4.72%(5)
Portfolio Turnover Rate 85% 161%
Net Assets, End of Period (in thousands) $34,435 $33,943
(1) Six months ended September 30, 2007 (unaudited).
(2) April 3, 2006 (commencement of sale) through March 31, 2007.
(3) Computed using average shares outstanding throughout the period.
(4) Total return assumes reinvestment of net investment income and capital
gains distributions, if any. Total returns for periods less than one year are
not annualized. The total return of the classes may not precisely reflect the
class expense differences because of the impact of calculating the net asset
values to two decimal places. If net asset values were calculated to three
decimal places, the total return differences would more closely reflect the
class expense differences. The calculation of net asset values to two decimal
places is made in accordance with SEC guidelines and does not result in any
gain or loss of value between one class and another.
(5) Annualized.
See Notes to Financial Statements.
- ------
42
Select Bond
A Class
For a Share Outstanding Throughout the Years Ended March 31 (except as noted)
2007(1) 2007 2006 2005 2004 2003
PER-SHARE DATA
Net Asset Value,
Beginning of
Period $9.46 $9.33 $9.56 $10.01 $9.98 $9.50
------ ------ ------ ------ ------ ------
Income From
Investment
Operations
Net
Investment
Income
(Loss)(2) 0.21 0.41 0.35 0.32 0.31 0.41
Net Realized
and
Unrealized
Gain (Loss) (0.09) 0.12 (0.21) (0.34) 0.32 0.82
------ ------ ------ ------ ------ ------
Total From
Investment
Operations 0.12 0.53 0.14 (0.02) 0.63 1.23
------ ------ ------ ------ ------ ------
Distributions
From Net
Investment
Income (0.21) (0.40) (0.37) (0.36) (0.36) (0.45)
From Net
Realized
Gains -- -- -- (0.07) (0.24) (0.30)
------ ------ ------ ------ ------ ------
Total
Distributions (0.21) (0.40) (0.37) (0.43) (0.60) (0.75)
------ ------ ------ ------ ------ ------
Net Asset Value,
End of Period $9.37 $9.46 $9.33 $9.56 $10.01 $9.98
====== ====== ====== ====== ====== ======
TOTAL RETURN(3) 1.28% 5.86% 1.47% (0.27)% 6.50% 13.19%
RATIOS/SUPPLEMENTAL DATA
Ratio of
Operating
Expenses to
Average Net
Assets 0.85%(4)(5) 0.85%(5) 0.85%(6) 0.85%(6) 0.85%(6) 0.85%(6)
Ratio of
Operating
Expenses to
Average Net
Assets (Before
Expense Waiver) 0.87%(4) 0.87% 0.86% 0.88% 0.93% 0.96%
Ratio of Net
Investment
Income (Loss)
to Average Net
Assets 4.42%(4)(5) 4.29%(5) 3.66%(6) 3.29%(6) 3.08%(6) 4.13%(6)
Ratio of Net
Investment
Income (Loss)
to Average Net
Assets (Before
Expense Waiver) 4.40%(4) 4.27% 3.65% 3.26% 3.00% 4.02%
Portfolio
Turnover Rate 85% 161% 251%(7) 233% 168% 214%
Net Assets, End
of Period (in
thousands) $53,935 $66,781 $121,069 $195,684 $146,431 $107,953
(1) Six months ended September 30, 2007 (unaudited).
(2) Computed using average shares outstanding throughout the period.
(3) Total return assumes reinvestment of net investment income and capital
gains distributions, if any, and does not reflect applicable sales charges.
Total returns for periods less than one year are not annualized. The total
return of the classes may not precisely reflect the class expense differences
because of the impact of calculating the net asset values to two decimal
places. If net asset values were calculated to three decimal places, the total
return differences would more closely reflect the class expense differences.
The calculation of net asset values to two decimal places is made in
accordance with SEC guidelines and does not result in any gain or loss of
value between one class and another.
(4) Annualized.
(5) During the six months ended September 30, 2007 and the year ended March
31, 2007, the distributor voluntarily waived a portion of its distribution and
service fees.
(6) The investment advisor voluntarily agreed to waive fees and absorb certain
operating expenses.
(7) Portfolio turnover rate excludes the impact of mortgage dollar roll
transactions.
See Notes to Financial Statements.
- ------
43
Select Bond
B Class
For a Share Outstanding Throughout the Years Ended March 31 (except as noted)
2007(1) 2007 2006 2005 2004 2003
PER-SHARE DATA
Net Asset Value,
Beginning of
Period $9.46 $9.33 $9.56 $10.01 $9.98 $9.50
------ ------ ------ ------ ------ ------
Income From
Investment
Operations
Net
Investment
Income
(Loss)(2) 0.18 0.35 0.29 0.25 0.24 0.34
Net Realized
and
Unrealized
Gain (Loss) (0.09) 0.12 (0.21) (0.35) 0.33 0.82
------ ------ ------ ------ ------ ------
Total From
Investment
Operations 0.09 0.47 0.08 (0.10) 0.57 1.16
------ ------ ------ ------ ------ ------
Distributions
From Net
Investment
Income (0.18) (0.34) (0.31) (0.29) (0.30) (0.38)
From Net
Realized
Gains -- -- -- (0.06) (0.24) (0.30)
------ ------ ------ ------ ------ ------
Total
Distributions (0.18) (0.34) (0.31) (0.35) (0.54) (0.68)
------ ------ ------ ------ ------ ------
Net Asset Value,
End of Period $9.37 $9.46 $9.33 $9.56 $10.01 $9.98
====== ====== ====== ====== ====== ======
TOTAL RETURN(3) 0.95% 5.18% 0.82% (0.91)% 5.80% 12.46%
RATIOS/SUPPLEMENTAL DATA
Ratio of
Operating
Expenses to
Average Net
Assets 1.50%(4)(5) 1.50%(5) 1.50%(6) 1.50%(6) 1.50%(6) 1.50%(6)
Ratio of
Operating
Expenses to
Average Net
Assets (Before
Expense Waiver) 1.62%(4) 1.62% 1.54% 1.55% 1.57% 1.61%
Ratio of Net
Investment
Income (Loss)
to Average Net
Assets 3.77%(4)(5) 3.64%(5) 2.99%(6) 2.64%(6) 2.44%(6) 3.41%(6)
Ratio of Net
Investment
Income (Loss)
to Average Net
Assets (Before
Expense Waiver) 3.65%(4) 3.52% 2.95% 2.59% 2.37% 3.30%
Portfolio
Turnover Rate 85% 161% 251%(7) 233% 168% 214%
Net Assets, End
of Period (in
thousands) $7,723 $8,210 $9,388 $10,010 $11,353 $10,082
(1) Six months ended September 30, 2007 (unaudited).
(2) Computed using average shares outstanding throughout the period.
(3) Total return assumes reinvestment of net investment income and capital
gains distributions, if any, and does not reflect applicable sales charges.
Total returns for periods less than one year are not annualized. The total
return of the classes may not precisely reflect the class expense differences
because of the impact of calculating the net asset values to two decimal
places. If net asset values were calculated to three decimal places, the total
return differences would more closely reflect the class expense differences.
The calculation of net asset values to two decimal places is made in
accordance with SEC guidelines and does not result in any gain or loss of
value between one class and another.
(4) Annualized.
(5) During the six months ended September 30, 2007 and the year ended March
31, 2007, the distributor voluntarily waived a portion of its distribution and
service fees.
(6) The investment advisor voluntarily agreed to waive fees and absorb certain
operating expenses.
(7) Portfolio turnover rate excludes the impact of mortgage dollar roll
transactions.
See Notes to Financial Statements.
- ------
44
Select Bond
C Class
For a Share Outstanding Throughout the Years Ended March 31 (except as noted)
2007(1) 2007(2)
PER-SHARE DATA
Net Asset Value, Beginning of Period $9.46 $9.33
------ ------
Income From Investment Operations
Net Investment Income (Loss)(3) 0.17 0.32
Net Realized and Unrealized Gain (Loss) (0.09) 0.14
------ ------
Total From Investment Operations 0.08 0.46
------ ------
Distributions
From Net Investment Income (0.17) (0.33)
------ ------
Net Asset Value, End of Period $9.37 $9.46
====== ======
TOTAL RETURN(4) 0.89% 5.02%
RATIOS/SUPPLEMENTAL DATA
Ratio of Operating Expenses to Average Net Assets 1.62%(5) 1.62%(5)
Ratio of Net Investment Income (Loss) to Average Net Assets 3.65%(5) 3.52%(5)
Portfolio Turnover Rate 85% 161%
Net Assets, End of Period (in thousands) $193 $139
(1) Six months ended September 30, 2007 (unaudited).
(2) April 3, 2006 (commencement of sale) through March 31, 2007.
(3) Computed using average shares outstanding throughout the period.
(4) Total return assumes reinvestment of net investment income and capital
gains distributions, if any, and does not reflect applicable sales charges.
Total returns for periods less than one year are not annualized. The total
return of the classes may not precisely reflect the class expense differences
because of the impact of calculating the net asset values to two decimal
places. If net asset values were calculated to three decimal places, the total
return differences would more closely reflect the class expense differences.
The calculation of net asset values to two decimal places is made in
accordance with SEC guidelines and does not result in any gain or loss of
value between one class and another.
(5) Annualized.
See Notes to Financial Statements.
- ------
45
Select Bond
R Class
For a Share Outstanding Throughout the Years Ended March 31 (except as noted)
2007(1) 2007(2)
PER-SHARE DATA
Net Asset Value, Beginning of Period $9.46 $9.33
------ ------
Income From Investment Operations
Net Investment Income (Loss)(3) 0.20 0.38
Net Realized and Unrealized Gain (Loss) (0.09) 0.13
------ ------
Total From Investment Operations 0.11 0.51
------ ------
Distributions
From Net Investment Income (0.20) (0.38)
------ ------
Net Asset Value, End of Period $9.37 $9.46
====== ======
TOTAL RETURN(4) 1.14% 5.54%
RATIOS/SUPPLEMENTAL DATA
Ratio of Operating Expenses to Average Net Assets 1.12%(5) 1.12%(5)
Ratio of Net Investment Income (Loss) to Average Net Assets 4.15%(5) 4.02%(5)
Portfolio Turnover Rate 85% 161%
Net Assets, End of Period (in thousands) $30 $29
(1) Six months ended September 30, 2007 (unaudited).
(2) April 3, 2006 (commencement of sale) through March 31, 2007.
(3) Computed using average shares outstanding throughout the period.
(4) Total return assumes reinvestment of net investment income and capital
gains distributions, if any. Total returns for periods less than one year are
not annualized. The total return of the classes may not precisely reflect the
class expense differences because of the impact of calculating the net asset
values to two decimal places. If net asset values were calculated to three
decimal places, the total return differences would more closely reflect the
class expense differences. The calculation of net asset values to two decimal
places is made in accordance with SEC guidelines and does not result in any
gain or loss of value between one class and another.
(5) Annualized.
See Notes to Financial Statements.
- ------
46
High-Yield Bond
Investor Class
For a Share Outstanding Throughout the Years Ended March 31 (except as noted)
2007(1) 2007(2)
PER-SHARE DATA
Net Asset Value, Beginning of Period $7.21 $7.02
------ ------
Income From Investment Operations
Net Investment Income (Loss) 0.25 0.47
Net Realized and Unrealized Gain (Loss) (0.20) 0.19
------ ------
Total From Investment Operations 0.05 0.66
------ ------
Distributions
From Net Investment Income (0.25) (0.47)
------ ------
Net Asset Value, End of Period $7.01 $7.21
====== ======
TOTAL RETURN(3) 0.70% 9.73%
RATIOS/SUPPLEMENTAL DATA
Ratio of Operating Expenses to Average Net Assets 0.80%(4)(5) 0.79%(4)(5)
Ratio of Operating Expenses to Average Net Assets
(Before Expense Waiver) 0.87%(4) 0.87%(4)
Ratio of Net Investment Income (Loss) to Average Net
Assets 7.02%(4)(5) 6.71%(4)(5)
Ratio of Net Investment Income (Loss) to Average Net
Assets (Before Expense Waiver) 6.95%(4) 6.63%(4)
Portfolio Turnover Rate 30% 86%
Net Assets, End of Period (in thousands) $330 $299
(1) Six months ended September 30, 2007 (unaudited).
(2) April 3, 2006 (commencement of sale) through March 31, 2007.
(3) Total return assumes reinvestment of net investment income and capital
gains distributions, if any. Total returns for periods less than one year are
not annualized. The total return of the classes may not precisely reflect the
class expense differences because of the impact of calculating the net asset
values to two decimal places. If net asset values were calculated to three
decimal places, the total return differences would more closely reflect the
class expense differences. The calculation of net asset values to two decimal
places is made in accordance with SEC guidelines and does not result in any
gain or loss of value between one class and another.
(4) Annualized.
(5) Effective April 3, 2006, the investment advisor voluntarily agreed to
waive of portion of its management fee.
See Notes to Financial Statements.
- ------
47
High-Yield Bond
Institutional Class
For a Share Outstanding Throughout the Years Ended March 31 (except as noted)
2007(1) 2007(2)
PER-SHARE DATA
Net Asset Value, Beginning of Period $7.21 $7.02
------ ------
Income From Investment Operations
Net Investment Income (Loss) 0.25 0.48
Net Realized and Unrealized Gain (Loss) (0.20) 0.19
------ ------
Total From Investment Operations 0.05 0.67
------ ------
Distributions
From Net Investment Income (0.25) (0.48)
------ ------
Net Asset Value, End of Period $7.01 $7.21
====== ======
TOTAL RETURN(3) 0.80% 9.95%
RATIOS/SUPPLEMENTAL DATA
Ratio of Operating Expenses to Average Net Assets 0.60%(4)(5) 0.59%(4)(5)
Ratio of Operating Expenses to Average Net Assets
(Before Expense Waiver) 0.67%(4) 0.67%(4)
Ratio of Net Investment Income (Loss) to Average Net
Assets 7.22%(4)(5) 6.91%(4)(5)
Ratio of Net Investment Income (Loss) to Average Net
Assets (Before Expense Waiver) 7.15%(4) 6.83%(4)
Portfolio Turnover Rate 30% 86%
Net Assets, End of Period (in thousands) $128,852 $127,865
(1) Six months ended September 30, 2007 (unaudited).
(2) April 3, 2006 (commencement of sale) through March 31, 2007.
(3) Total return assumes reinvestment of net investment income and capital
gains distributions, if any. Total returns for periods less than one year are
not annualized. The total return of the classes may not precisely reflect the
class expense differences because of the impact of calculating the net asset
values to two decimal places. If net asset values were calculated to three
decimal places, the total return differences would more closely reflect the
class expense differences. The calculation of net asset values to two decimal
places is made in accordance with SEC guidelines and does not result in any
gain or loss of value between one class and another.
(4) Annualized.
(5) Effective April 3, 2006, the investment advisor voluntarily agreed to
waive of portion of its management fee.
See Notes to Financial Statements.
- ------
48
High-Yield Bond
A Class
For a Share Outstanding Throughout the Years Ended March 31 (except as noted)
2007(1) 2007 2006 2005 2004 2003
PER-SHARE DATA
Net Asset
Value,
Beginning of
Period $7.21 $6.99 $7.14 $7.13 $6.25 $6.79
------ ------ ------ ------ ------ ------
Income From
Investment
Operations
Net
Investment
Income
(Loss) 0.24 0.45 0.45(2) 0.48(2) 0.50(2) 0.57(2)
Net Realized
and
Unrealized
Gain (Loss) (0.20) 0.22 (0.14) 0.02 0.88 (0.53)
------ ------ ------ ------ ------ ------
Total From
Investment
Operations 0.04 0.67 0.31 0.50 1.38 0.04
------ ------ ------ ------ ------ ------
Distributions
From Net
Investment
Income (0.24) (0.45) (0.46) (0.49) (0.50) (0.58)
------ ------ ------ ------ ------ ------
Net Asset
Value, End of
Period $7.01 $7.21 $6.99 $7.14 $7.13 $6.25
====== ====== ====== ====== ====== ======
TOTAL RETURN(3) 0.57% 9.99% 4.55% 7.16% 22.79% 1.15%
RATIOS/SUPPLEMENTAL DATA
Ratio of
Operating
Expenses to
Average Net
Assets 1.05%(4)(5) 1.04%(5) 1.26% 1.30%(6) 1.30%(6) 1.30%(6)
Ratio of
Operating
Expenses to
Average Net
Assets (Before
Expense Waiver) 1.12%(4) 1.12% 1.26% 1.31% 1.35% 1.46%
Ratio of Net
Investment
Income (Loss)
to Average Net
Assets 6.77%(4)(5) 6.45%(5) 6.38% 6.70%(6) 7.29%(6) 9.24%(6)
Ratio of Net
Investment
Income (Loss)
to Average Net
Assets (Before
Expense Waiver) 6.70%(4) 6.37% 6.38% 6.69% 7.24% 9.08%
Portfolio
Turnover Rate 30% 86% 116% 141% 199% 78%
Net Assets, End
of Period (in
thousands) $16,631 $21,336 $141,593 $157,118 $140,330 $107,051
(1) Six months ended September 30, 2007 (unaudited).
(2) Computed using average shares outstanding throughout the period.
(3) Total return assumes reinvestment of net investment income and capital
gains distributions, if any, and does not reflect applicable sales charges.
Total returns for periods less than one year are not annualized. The total
return of the classes may not precisely reflect the class expense differences
because of the impact of calculating the net asset values to two decimal
places. If net asset values were calculated to three decimal places, the total
return differences would more closely reflect the class expense differences.
The calculation of net asset values to two decimal places is made in
accordance with SEC guidelines and does not result in any gain or loss of
value between one class and another.
(4) Annualized.
(5) Effective April 1, 2006, the investment advisor voluntarily agreed to
waive a portion of its management fee.
(6) The investment advisor voluntarily agreed to waive fees and absorb certain
operating expenses.
See Notes to Financial Statements.
- ------
49
High-Yield Bond
B Class
For a Share Outstanding Throughout the Years Ended March 31 (except as noted)
2007(1) 2007 2006 2005 2004 2003
PER-SHARE DATA
Net Asset
Value,
Beginning of
Period $7.20 $6.98 $7.13 $7.13 $6.24 $6.78
------ ------ ------ ------ ------ ------
Income From
Investment
Operations
Net
Investment
Income
(Loss) 0.21 0.40 0.40(2) 0.43(2) 0.45(2) 0.53(2)
Net Realized
and
Unrealized
Gain (Loss) (0.20) 0.22 (0.14) 0.01 0.90 (0.53)
------ ------ ------ ------ ------ ------
Total From
Investment
Operations 0.01 0.62 0.26 0.44 1.35 --
------ ------ ------ ------ ------ ------
Distributions
From Net
Investment
Income (0.21) (0.40) (0.41) (0.44) (0.46) (0.54)
------ ------ ------ ------ ------ ------
Net Asset
Value, End of
Period $7.00 $7.20 $6.98 $7.13 $7.13 $6.24
====== ====== ====== ====== ====== ======
TOTAL RETURN(3) 0.19% 9.18% 3.84% 6.32% 22.19% 0.48%
RATIOS/SUPPLEMENTAL DATA
Ratio of
Operating
Expenses to
Average Net
Assets 1.80%(4)(5) 1.79%(5) 1.95%(6) 1.95%(6) 1.95%(6) 1.95%(6)
Ratio of
Operating
Expenses to
Average Net
Assets (Before
Expense Waiver) 1.87%(4) 1.87% 1.99% 1.99% 2.00% 2.11%
Ratio of Net
Investment
Income (Loss)
to Average Net
Assets 6.02%(4)(5) 5.70%(5) 5.69%(6) 6.06%(6) 6.63%(6) 8.64%(6)
Ratio of Net
Investment
Income (Loss)
to Average Net
Assets (Before
Expense Waiver) 5.95%(4) 5.62% 5.65% 6.02% 6.58% 8.48%
Portfolio
Turnover Rate 30% 86% 116% 141% 199% 78%
Net Assets, End
of Period (in
thousands) $2,876 $3,134 $4,231 $5,028 $5,316 $4,243
(1) Six months ended September 30, 2007 (unaudited).
(2) Computed using average shares outstanding throughout the period.
(3) Total return assumes reinvestment of net investment income and capital
gains distributions, if any, and does not reflect applicable sales charges.
Total returns for periods less than one year are not annualized. The total
return of the classes may not precisely reflect the class expense differences
because of the impact of calculating the net asset values to two decimal
places. If net asset values were calculated to three decimal places, the total
return differences would more closely reflect the class expense differences.
The calculation of net asset values to two decimal places is made in
accordance with SEC guidelines and does not result in any gain or loss of
value between one class and another.
(4) Annualized.
(5) Effective April 1, 2006, the investment advisor voluntarily agreed to
waive a portion of its management fee.
(6) The investment advisor voluntarily agreed to waive fees and absorb certain
operating expenses.
See Notes to Financial Statements.
- ------
50
High-Yield Bond
C Class
For a Share Outstanding Throughout the Years Ended March 31 (except as noted)
2007(1) 2007(2)
PER-SHARE DATA
Net Asset Value, Beginning of Period $7.21 $7.02
------ ------
Income From Investment Operations
Net Investment Income (Loss) 0.21 0.40
Net Realized and Unrealized Gain (Loss) (0.20) 0.19
------ ------
Total From Investment Operations 0.01 0.59
------ ------
Distributions
From Net Investment Income (0.21) (0.40)
------ ------
Net Asset Value, End of Period $7.01 $7.21
====== ======
TOTAL RETURN(3) 0.20% 8.65%
RATIOS/SUPPLEMENTAL DATA
Ratio of Operating Expenses to Average Net Assets 1.80%(4)(5) 1.79%(4)(5)
Ratio of Operating Expenses to Average Net Assets
(Before Expense Waiver) 1.87%(4) 1.87%(4)
Ratio of Net Investment Income (Loss) to Average Net
Assets 6.02%(4)(5) 5.71%(4)(5)
Ratio of Net Investment Income (Loss) to Average Net
Assets (Before Expense Waiver) 5.95%(4) 5.63%(4)
Portfolio Turnover Rate 30% 86%
Net Assets, End of Period (in thousands) $77 $105
(1) Six months ended September 30, 2007 (unaudited).
(2) April 3, 2006 (commencement of sale) through March 31, 2007.
(3) Total return assumes reinvestment of net investment income and capital
gains distributions, if any, and does not reflect applicable sales charges.
Total returns for periods less than one year are not annualized. The total
return of the classes may not precisely reflect the class expense differences
because of the impact of calculating the net asset values to two decimal
places. If net asset values were calculated to three decimal places, the total
return differences would more closely reflect the class expense differences.
The calculation of net asset values to two decimal places is made in
accordance with SEC guidelines and does not result in any gain or loss of
value between one class and another.
(4) Annualized.
(5) Effective April 3, 2006, the investment advisor voluntarily agreed to
waive of portion of its management fee.
See Notes to Financial Statements.
- ------
51
High-Yield Bond
R Class
For a Share Outstanding Throughout the Years Ended March 31 (except as noted)
2007(1) 2007(2)
PER-SHARE DATA
Net Asset Value, Beginning of Period $7.21 $7.02
------ ------
Income From Investment Operations
Net Investment Income (Loss) 0.23 0.43
Net Realized and Unrealized Gain (Loss) (0.20) 0.19
------ ------
Total From Investment Operations 0.03 0.62
------ ------
Distributions
From Net Investment Income (0.23) (0.43)
------ ------
Net Asset Value, End of Period $7.01 $7.21
====== ======
TOTAL RETURN(3) 0.45% 9.19%
RATIOS/SUPPLEMENTAL DATA
Ratio of Operating Expenses to Average Net Assets 1.30%(4)(5) 1.29%(4)(5)
Ratio of Operating Expenses to Average Net Assets
(Before Expense Waiver) 1.37%(4) 1.37%(4)
Ratio of Net Investment Income (Loss) to Average Net
Assets 6.52%(4)(5) 6.21%(4)(5)
Ratio of Net Investment Income (Loss) to Average Net
Assets (Before Expense Waiver) 6.45%(4) 6.13%(4)
Portfolio Turnover Rate 30% 86%
Net Assets, End of Period (in thousands) $28 $27
(1) Six months ended September 30, 2007 (unaudited).
(2) April 3, 2006 (commencement of sale) through March 31, 2007.
(3) Total return assumes reinvestment of net investment income and capital
gains distributions, if any. Total returns for periods less than one year are
not annualized. The total return of the classes may not precisely reflect the
class expense differences because of the impact of calculating the net asset
values to two decimal places. If net asset values were calculated to three
decimal places, the total return differences would more closely reflect the
class expense differences. The calculation of net asset values to two decimal
places is made in accordance with SEC guidelines and does not result in any
gain or loss of value between one class and another.
(4) Annualized.
(5) Effective April 3, 2006, the investment advisor voluntarily agreed to
waive of portion of its management fee.
See Notes to Financial Statements.
- ------
52
PROXY VOTING RESULTS
A special meeting of shareholders was held on July 27, 2007, to vote on the
following proposal. The proposal received the required number of votes of the
American Century Investment Trust and was adopted. A summary of voting results
is listed below the proposal.
PROPOSAL:
To elect eight Trustees to the Board of Trustees of American Century
Investment Trust (the proposal was voted on by all shareholders of funds
issued by American Century Investment Trust).
Jonathan S. Thomas For: 3,336,300,729
Withhold: 35,929,005
Abstain: 0
Broker Non-Vote: 0
John Freidenrich For: 3,337,319,127
Withhold: 34,910,607
Abstain: 0
Broker Non-Vote: 0
Ronald J. Gilson For: 3,337,806,752
Withhold: 34,422,982
Abstain: 0
Broker Non-Vote: 0
Kathryn A. Hall For: 3,337,653,997
Withhold: 34,575,737
Abstain: 0
Broker Non-Vote: 0
Peter F. Pervere For: 3,336,793,063
Withhold: 35,436,671
Abstain: 0
Broker Non-Vote: 0
Myron S. Scholes For: 3,335,709,158
Withhold: 36,520,576
Abstain: 0
Broker Non-Vote: 0
John B. Shoven For: 3,337,333,277
Withhold: 34,896,457
Abstain: 0
Broker Non-Vote: 0
Jeanne D. Wohlers For: 3,336,368,531
Withhold: 35,861,203
Abstain: 0
Broker Non-Vote: 0
- ------
53
APPROVAL OF MANAGEMENT AGREEMENTS
Select Bond, High-Yield Bond
Under Section 15(c) of the Investment Company Act, contracts for investment
advisory services are required to be reviewed, evaluated and approved by a
majority of a fund's independent directors or trustees (the "Directors") each
year. At American Century, this process is referred to as the "15(c) Process."
As a part of this process, the board reviews fund performance, shareholder
services, audit and compliance information, and a variety of other reports
from the advisor concerning fund operations. In addition to this annual
review, the board of directors oversees and evaluates on a continuous basis at
its quarterly meetings the nature and quality of significant services
performed by the advisor, fund performance, audit and compliance information,
and a variety of other reports relating to fund operations. The board, or
committees of the board, also holds special meetings as needed.
Under a Securities and Exchange Commission rule, each fund is required to
disclose in its annual or semiannual report, as appropriate, the material
factors and conclusions that formed the basis for the board's approval or
renewal of any advisory agreements within the fund's most recently completed
fiscal half-year period.
ANNUAL CONTRACT REVIEW PROCESS
As part of the annual 15(c) Process undertaken during the most recent fiscal
half-year period, the Directors reviewed extensive data and information
compiled by the advisor and certain independent providers of evaluative data
(the "15(c) Providers") concerning AC-MS Select Bond and AC-MS High-Yield (the
"funds") and the services provided to the funds under the management
agreements. The information considered and the discussions held at the
meetings included, but were not limited to:
* the nature, extent and quality of investment management, shareholder
services and other services provided to the funds under the management
agreements;
* reports on the advisor's activities relating to the wide range of programs
and services the advisor provides to the funds and their shareholders on a
routine and non-routine basis;
* data comparing the cost of owning the funds to the cost of owning similar
funds;
* data comparing the funds' performance to appropriate benchmarks and/or a
peer group of other mutual funds with similar investment objectives and
strategies;
* financial data showing the profitability of the funds to the advisor and the
overall profitability of the advisor; and
* data comparing services provided and charges to other investment management
clients of the advisor.
In keeping with its practice, the funds' board of directors held two regularly
scheduled meetings to review and discuss the information provided by the
advisor and to complete their negotiations with the advisor regarding the
renewal of the management agreements, including the setting of the applicable
advisory fee. The board also had the benefit of the advice of its independent
counsel throughout the period.
- ------
54
FACTORS CONSIDERED
The Directors considered all of the information provided by the advisor, the
15(c) Providers, and the board's independent counsel, and evaluated such
information for each fund for which the board has responsibility. The
Directors did not identify any single factor as being all-important or
controlling, and each Director may have attributed different levels of
importance to different factors. In deciding to renew the agreement under the
terms ultimately determined by the board to be appropriate, the Directors'
decision was based on the following factors.
NATURE, EXTENT AND QUALITY OF SERVICES -- GENERALLY. Under the management
agreements, the advisor is responsible for providing or arranging for all
services necessary for the operation of the funds. The board noted that under
the management agreements, the advisor provides or arranges at its own expense
a wide variety of services including:
* fund construction and design
* portfolio security selection
* initial capitalization/funding
* securities trading
* custody of fund assets
* daily valuation of the funds' portfolio
* shareholder servicing and transfer agency, including shareholder
confirmations, recordkeeping and communications
* legal services
* regulatory and portfolio compliance
* financial reporting
* marketing and distribution
The Directors noted that many of these services have expanded over time both
in terms of quantity and complexity in response to shareholder demands,
competition in the industry and the changing regulatory environment. In
performing their evaluation, the Directors considered information received in
connection with the annual review, as well as information provided on an
ongoing basis at their regularly scheduled board and committee meetings.
INVESTMENT MANAGEMENT SERVICES. The nature of the investment management
services provided is quite complex and allows fund shareholders access to
professional money management, instant diversification of their investments
within an asset class, the opportunity to easily diversify among asset
classes, and liquidity. In evaluating investment performance, the board
expects the advisor to manage the funds in accordance with their investment
objectives and approved strategies. In providing these services, the advisor
utilizes teams of investment professionals (portfolio managers, analysts,
research assistants, and securities traders) who require extensive information
technology, research, training, compliance and other systems
- ------
55
to conduct their business. At each quarterly meeting the Directors review
investment performance information for the funds, together with comparative
information for appropriate benchmarks and peer groups of funds managed
similarly to the funds. The Directors also review detailed performance
information during the 15(c) Process. If performance concerns are identified,
the Directors discuss with the advisor the reasons for such results (e.g.,
market conditions, security selection) and any efforts being undertaken to
improve performance. The performance information presented to the Directors
showed that AC-MS Select Bond's performance was above its benchmark for the
one-year period and equal to the median for the three-year period. The
performance information presented to the Directors showed that AC-MS
High-Yield's performance fell below the median for the one-year period and was
above the median for the three-year period.
SHAREHOLDER AND OTHER SERVICES. The advisor provides the funds with a
comprehensive package of transfer agency, shareholder, and other services. The
Directors review reports and evaluations of such services at their regular
quarterly meetings, including the annual meeting concerning contract review,
and reports to the board. These reports include, but are not limited to,
information regarding the operational efficiency and accuracy of the
shareholder and transfer agency services provided, staffing levels,
shareholder satisfaction (as measured by external as well as internal
sources), technology support, new products and services offered to fund
shareholders, securities trading activities, portfolio valuation services,
auditing services, and legal and operational compliance activities. Certain
aspects of shareholder and transfer agency service level efficiency and the
quality of securities trading activities are measured by independent third
party providers and are presented in comparison to other fund groups not
managed by the advisor.
COSTS OF SERVICES PROVIDED AND PROFITABILITY TO THE ADVISOR. The advisor
provides detailed information concerning its cost of providing various
services to the funds, its profitability in managing the funds, its overall
profitability, and its financial condition. The Directors have reviewed with
the advisor the methodology used to prepare this financial information. This
financial information regarding the advisor is considered in order to evaluate
the advisor's financial condition, its ability to continue to provide services
under the management agreements, and the reasonableness of the current
management fee.
ETHICS OF THE ADVISOR. The Directors generally consider the advisor's
commitment to providing quality services to shareholders and to conducting its
business ethically. They noted that the advisor's practices generally meet or
exceed industry best practices.
ECONOMIES OF SCALE. The Directors review reports provided by the advisor on
economies of scale for the complex as a whole and the year-over-year changes
in revenue, costs, and profitability. The Directors concluded that economies
of scale are difficult to measure and predict with precision, especially on a
fund-by-fund basis. This analysis is also complicated by the additional
services and content provided by the advisor and its reinvestment in its
ability to provide and expand those services. Accordingly, the Directors also
seek to evaluate economies of scale by reviewing other information, such as
year-over-year profitability of the advisor generally, the profitability of
its management of the funds specifically, the expenses incurred by the advisor
in providing various functions to the funds, and the breakpoint fees of
competitive funds not managed by the advisor. The Directors believe the
advisor is appropriately sharing economies of scale through its competitive
fee structure, fee breakpoints as the fund complex and the funds increase in
size, and through reinvestment in its business
- ------
56
to provide shareholders additional content and services. In particular,
separate breakpoint schedules based on the size of the entire fund complex and
on the size of the funds reflect the complexity of assessing economies of
scale.
COMPARISON TO OTHER FUNDS' FEES. The funds pay the advisor a single,
all-inclusive (or unified) management fee for providing all services necessary
for the management and operation of the funds, other than brokerage expenses,
taxes, interest, extraordinary expenses, and the fees and expenses of the
funds' independent directors (including their independent legal counsel).
Under the unified fee structure, the advisor is responsible for providing all
investment advisory, custody, audit, administrative, compliance,
recordkeeping, marketing and shareholder services, or arranging and
supervising third parties to provide such services. By contrast, most other
funds are charged a variety of fees, including an investment advisory fee, a
transfer agency fee, an administrative fee, distribution charges and other
expenses. Other than their investment advisory fees and Rule 12b-1
distribution fees, all other components of the total fees charged by these
other funds may be increased without shareholder approval. The board believes
the unified fee structure is a benefit to fund shareholders because it clearly
discloses to shareholders the cost of owning fund shares, and, since the
unified fee cannot be increased without a vote of fund shareholders, it shifts
to the advisor the risk of increased costs of operating the funds and provides
a direct incentive to minimize administrative inefficiencies. Part of the
Directors' analysis of fee levels involves reviewing certain evaluative data
compiled by an independent provider and comparing the funds' unified fee to
the total expense ratio of other funds in the funds' peer group. The unified
fee charged to shareholders of AC-MS Select Bond was in the lowest quartile of
the total expense ratios of its peer group. The unified fee charged to
shareholders of AC-MS High-Yield was at the median of the total expense ratios
of its peer group.
COMPARISON TO FEES AND SERVICES PROVIDED TO OTHER CLIENTS OF THE ADVISOR. The
Directors also requested and received information from the advisor concerning
the nature of the services, fees, and profitability of its advisory services
to advisory clients other than the funds. They observed that these varying
types of client accounts require different services and involve different
regulatory and entrepreneurial risks than the management of the funds. The
Directors analyzed this information and concluded that the fees charged and
services provided to the funds were reasonable by comparison.
COLLATERAL BENEFITS DERIVED BY THE ADVISOR. The Directors reviewed information
from the advisor concerning collateral benefits it receives as a result of its
relationship with the funds. They concluded that the advisor's primary
business is managing mutual funds and it generally does not use fund or
shareholder information to generate profits in other lines of business, and
therefore does not derive any significant collateral benefits from them. The
Directors noted that the advisor receives proprietary research from
broker-dealers that execute fund portfolio transactions and concluded that
this research is likely to benefit fund shareholders. The Directors also
determined that the advisor is able to provide investment management services
to certain clients other than the funds, at least in part, due to its existing
infrastructure built to serve the fund complex. The Directors concluded,
however, that the assets of those other clients are not material to the
analysis and, in any event, are included with the assets of the funds to
determine breakpoints in the funds' fee schedule, provided they are managed
using the same investment team and strategy.
- ------
57
CONCLUSIONS OF THE DIRECTORS
As a result of this process, the Directors, in the absence of particular
circumstances and assisted by the advice of legal counsel that is independent
of the advisor, taking into account all of the factors discussed above and the
information provided by the advisor concluded that the investment management
agreements between AC-MS Select Bond and the advisor is fair and reasonable in
light of the services provided and should be renewed.
The Directors negotiated a one-year waiver by the advisor of a portion of the
management fee on behalf of AC-MS High-Yield. These changes were proposed by
the Directors based on their review of the fund's percentile rank in its peer
group universe and the fact that the Directors seek as a general rule to have
total expense ratios of fixed income and money market funds in the lowest 25th
percentile of the fees of comparable funds. The advisor accepted the principle
of the fee waiver based on the fact that the lower fee will result in
increased competitiveness of the fund within its peer group universe. The fee
waiver, effective August 1, 2007, will result in a lowering of the management
fee of the fund by 0.07 percentage points below the current management fee.
Following these negotiations with the advisor, the Directors concluded that
the investment management agreement between the fund and the advisor is fair
and reasonable in light of the services provided and should be renewed.
As a part of the 15(c) Process, the board of directors also unanimously
approved the renewal of the investment subadvisory agreement by which Mason
Street Advisors LLC (the "subadvisor") is engaged to manage the investments of
the funds. In approving the subadvisory agreement, the board considered all
material factors including the nature, extent, and quality of investment
management services provided by the subadvisor to the funds under the
agreement. As a part of this review the board evaluated the subadvisor's
investment performance and capabilities, as well as its compliance policies,
procedures, and regulatory experience. The Directors noted that the management
fees paid to the subadvisor under the subadvisory agreement were subject to
arm's length negotiation between the advisor and the subadvisor and are paid
by the advisor out of its unified fee.
- ------
58
SHARE CLASS INFORMATION
Six classes of shares are authorized for sale by the funds: Investor Class,
Institutional Class, A Class, B Class, C Class and R Class. The total expense
ratio of Institutional Class shares is lower than that of Investor Class
shares. The total expense ratios of A Class, B Class, C Class and R Class
shares are higher than that of Investor Class shares.
INVESTOR CLASS shares are available for purchase in two ways: 1) directly from
American Century without any commissions or other fees; and/or 2) through
certain financial intermediaries (such as banks, broker-dealers, insurance
companies and investment advisors), which may require payment of a transaction
fee to the financial intermediary. The funds' prospectuses contain additional
information regarding eligibility for Investor Class shares.
INSTITUTIONAL CLASS shares are available to large investors such as
endowments, foundations, and retirement plans, and to financial intermediaries
serving these investors. This class recognizes the relatively lower cost of
serving institutional customers and others who invest at least $5 million ($3
million for endowments and foundations) in an American Century fund or at
least $10 million in multiple funds. In recognition of the larger investments
and account balances and comparatively lower transaction costs, the unified
management fee of Institutional Class shares is 0.20% less than the unified
management fee of Investor Class shares.
A CLASS shares are sold primarily through employer-sponsored retirement plans
and through institutions such as investment advisors, banks, broker-dealers,
and insurance companies. A Class shares are sold at their offering price,
which is net asset value plus an initial sales charge that ranges from 4.50%
to 0.00% for fixed-income funds, depending on the amount invested. The initial
sales charge is deducted from the purchase amount before it is invested. A
Class shares may be subject to a contingent deferred sales charge (CDSC).
There is no CDSC on shares acquired through reinvestment of dividends or
capital gains. The prospectus contains information regarding reductions and
waivers of sales charges for A Class shares. The unified management fee for A
Class shares is the same as for Investor Class shares. A Class shares also are
subject to a 0.25% annual Rule 12b-1 distribution and service fee.
B CLASS shares are sold primarily through employer-sponsored retirement plans
and through institutions such as investment advisors, banks, broker-dealers,
and insurance companies. B Class shares redeemed within six years of purchase
are subject to a CDSC that declines from 5.00% during the first year after
purchase to 0.00% after the sixth year. There is no CDSC on shares acquired
through reinvestment of dividends or capital gains. The unified management fee
for B Class shares is the same as for Investor Class shares. B Class shares
also are subject to a 1.00% annual Rule 12b-1 distribution and service fee. B
Class shares automatically convert to A Class shares (with lower expenses)
eight years after their purchase date.
C CLASS shares are sold primarily through employer-sponsored retirement plans
and through institutions such as investment advisors, banks, broker-dealers,
and insurance companies. C Class shares redeemed within 12 months of purchase
are subject to a CDSC of 1.00%. There is no CDSC on shares acquired through
reinvestment of dividends or capital gains. The unified management fee for C
Class shares is the same as for Investor Class shares. C Class shares also are
subject to a Rule 12b-1 distribution and service fee of 1.00%.
- ------
59
R CLASS shares are sold primarily through employer-sponsored retirement plans
and through institutions such as investment advisors, banks, broker-dealers,
and insurance companies. The unified management fee for R Class shares is the
same as for Investor Class shares. R Class shares are subject to a 0.50%
annual Rule 12b-1 distribution and service fee.
All classes of shares represent a pro rata interest in the funds and generally
have the same rights and preferences.
- ------
60
ADDITIONAL INFORMATION
RETIREMENT ACCOUNT INFORMATION
As required by law, any distributions you receive from an IRA or certain
403(b), 457 and qualified plans [those not eligible for rollover to an IRA or
to another qualified plan] are subject to federal income tax withholding,
unless you elect not to have withholding apply. Tax will be withheld on the
total amount withdrawn even though you may be receiving amounts that are not
subject to withholding, such as nondeductible contributions. In such case,
excess amounts of withholding could occur. You may adjust your withholding
election so that a greater or lesser amount will be withheld.
If you don't want us to withhold on this amount, you must notify us to not
withhold the federal income tax. Even if you plan to roll over the amount you
withdraw to another tax-deferred account, the withholding rate still applies
to the withdrawn amount unless we have received notice not to withhold federal
income tax prior to the withdrawal. You may notify us in writing or in certain
situations by telephone or through other electronic means. You have the right
to revoke your withholding election at any time and any election you make may
remain in effect until revoked by filing a new election.
Remember, even if you elect not to have income tax withheld, you are liable
for paying income tax on the taxable portion of your withdrawal. If you elect
not to have income tax withheld or you don't have enough income tax withheld,
you may be responsible for payment of estimated tax. You may incur penalties
under the estimated tax rules if your withholding and estimated tax payments
are not sufficient.
State tax will be withheld if, at the time of your distribution, your address
is within one of the mandatory withholding states and you have federal income
tax withheld. State taxes will be withheld from your distribution in
accordance with the respective state rules.
PROXY VOTING GUIDELINES
American Century Investment Management, Inc., the funds' investment advisor,
is responsible for exercising the voting rights associated with the securities
purchased and/or held by the funds. A description of the policies and
procedures the advisor uses in fulfilling this responsibility is available
without charge, upon request, by calling 1-800-345-2021. It is also available
on American Century's website at americancentury.com and on the Securities and
Exchange Commission's website at sec.gov. Information regarding how the
investment advisor voted proxies relating to portfolio securities during the
most recent 12-month period ended June 30 is available on the "About Us" page
at americancentury.com. It is also available at sec.gov.
QUARTERLY PORTFOLIO DISCLOSURE
The funds file their complete schedule of portfolio holdings with the
Securities and Exchange Commission (SEC) for the first and third quarters of
each fiscal year on Form N-Q. The funds' Forms N-Q are available on the SEC's
website at sec.gov, and may be reviewed and copied at the SEC's Public
Reference Room in Washington, DC. Information on the operation of the Public
Reference Room may be obtained by calling 1-800-SEC-0330. The funds also make
their complete schedule of portfolio holdings for the most recent quarter of
their fiscal year available on their website at americancentury.com and, upon
request, by calling 1-800-345-2021.
- ------
61
INDEX DEFINITIONS
The following indices are used to illustrate investment market, sector, or
style performance or to serve as fund performance comparisons. They are not
investment products available for purchase.
The CITIGROUP AGENCY INDEX is a market-capitalization-weighted index that
includes U.S. government sponsored agencies with a remaining maturity of at
least one year.
The CITIGROUP CREDIT INDEX includes US and non-US corporate securities and
non-US sovereign and provincial securities.
The CITIGROUP HIGH-YIELD CASH-PAY INDEX is composed of those cash-pay
securities included in the Citigroup US High-Yield Market Index with remaining
maturities of at least one year.
The CITIGROUP MORTGAGE INDEX measures the mortgage component of the US BIG
Index, comprising 30-and 15-year GNMA, FNMA, and FHLMC pass-throughs and FNMA
and FHLMC balloon mortgages.
The CITIGROUP TREASURY INDEX is comprised of U.S. Treasury securities with an
amount outstanding of at least $5 billion and a remaining maturity of at least
one year.
The CITIGROUP US BROAD INVESTMENT-GRADE (BIG) BOND INDEX is a market-
capitalization-weighted index that includes fixed-rate Treasury, government-
sponsored, mortgage, asset-backed, and investment-grade issues with a maturity
of one year or longer.
The CITIGROUP US HIGH-YIELD MARKET INDEX captures the performance of below-
investment-grade debt issued by corporations domiciled in the United States or
Canada. This index includes cash-pay and deferred-interest securities that are
publicly placed, have a fixed coupon, and are nonconvertible.
The CITIGROUP US INFLATION-LINKED SECURITIES INDEX (ILSI) measures the return
of bonds with fixed-rate coupon payments that adjust for inflation as measured
by the Consumer Price Index (CPI).
- ------
62
NOTES
- ------
63
NOTES
- ------
64
[back cover]
CONTACT US
AMERICANCENTURY.COM
AUTOMATED INFORMATION LINE:
1-800-345-8765
INVESTOR SERVICES REPRESENTATIVE:
1-800-345-2021 or 816-531-5575
INVESTORS USING ADVISORS:
1-800-378-9878
BUSINESS, NOT-FOR-PROFIT,
EMPLOYER-SPONSORED RETIREMENT PLANS:
1-800-345-3533
BANKS AND TRUST COMPANIES, BROKER-DEALERS,
FINANCIAL PROFESSIONALS, INSURANCE COMPANIES:
1-800-345-6488
TELECOMMUNICATIONS DEVICE FOR THE DEAF:
1-800-634-4113 or 816-444-3485
AMERICAN CENTURY INVESTMENT TRUST
INVESTMENT ADVISOR:
American Century Investment Management, Inc.
Kansas City, Missouri
THIS REPORT AND THE STATEMENTS IT CONTAINS ARE SUBMITTED FOR THE GENERAL
INFORMATION OF OUR SHAREHOLDERS. THE REPORT IS NOT AUTHORIZED FOR DISTRIBUTION
TO PROSPECTIVE INVESTORS UNLESS PRECEDED OR ACCOMPANIED BY AN EFFECTIVE
PROSPECTUS.
American Century Investment Services, Inc., Distributor
©2007 American Century Proprietary Holdings, Inc. All rights reserved.
The American Century Investments logo, American Century and American Century
Investments are service marks of American Century Proprietary Holdings, Inc.
0711
SH-SAN-56807N
[front cover]
AMERICAN CENTURY INVESTMENTS
Semiannual Report September 30, 2007
[photo of fall]
NT Diversified Bond Fund
[american century investments logo and text logo]
OUR MESSAGE TO YOU
To help you monitor your investment, my colleagues and I take pride in
providing you with the semiannual report for the American Century® NT
Diversified Bond Fund for the six months ended September 30, 2007. This has
been an eventful and exciting period for us. We've been working diligently to
secure a smooth executive leadership transition.
I'm honored to be addressing you in the "Our Message" space long devoted to
company founder Jim Stowers, Jr. and his son Jim Stowers III. The Stowers
family remains an integral part of our heritage, leadership, and financial
structure. Jim Jr. continues as co-chair of the American Century Companies,
Inc. (ACC) board of directors with Richard Brown, who has been on the board
since 1998 and co-chairs the Stowers Institute for Medical Research board.
But times and opportunities change. As the latest step in a career transition
that began when he relinquished his executive leadership and investment
management responsibilities in early 2005, Jim III stepped down from the ACC
board in July 2007 to focus on new business ventures. Jim III's move reflects
his family's comfort with our direction and leadership, and gives the Stowers
more leeway to devote time and energy to other important priorities, such as
the Stowers Institute for Medical Research.
Meanwhile, American Century Investments, our clients, and our employees have
been my top priority since I became company president and CEO in March. We've
also added the executive talents of overall chief investment officer Enrique
Chang, international equity CIO Mark On, U.S. growth equity CIO Steve Lurito,
and chief operating officer Barry Fink.
This skilled group, combined with our existing senior management team, has
already had a positive impact on the development and management of the
products and services we take pride in delivering to you.
/s/Jonathan Thomas
Jonathan Thomas
[photo of Jonathan Thomas]
Jonathan Thomas
PRESIDENT
AMERICAN CENTURY COMPANIES, INC.
[photo of James E. Stowers, Jr.]
James E. Stowers, Jr.
FOUNDER AND CO-CHAIRMAN OF THE BOARD
AMERICAN CENTURY COMPANIES, INC.
[photo of Richard Brown]
Richard Brown
CO-CHAIRMAN OF THE BOARD
AMERICAN CENTURY COMPANIES, INC.
TABLE OF CONTENTS
Market Perspective. . . . . . . . . . . . . . . . . . . . . . . . . . 2
U.S. Fixed-Income Total Returns. . . . . . . . . . . . . . . . . . . 2
NT DIVERSIFIED BOND
Performance . . . . . . . . . . . . . . . . . . . . . . . . . . . . . 3
Portfolio Commentary. . . . . . . . . . . . . . . . . . . . . . . . . 5
Portfolio at a Glance. . . . . . . . . . . . . . . . . . . . . . . . 5
Yields . . . . . . . . . . . . . . . . . . . . . . . . . . . . . . . 5
Types of Investments in Portfolio. . . . . . . . . . . . . . . . . . 6
Portfolio Composition by Credit Rating . . . . . . . . . . . . . . . 6
Shareholder Fee Example . . . . . . . . . . . . . . . . . . . . . . . 7
Schedule of Investments . . . . . . . . . . . . . . . . . . . . . . . 9
FINANCIAL STATEMENTS
Statement of Assets and Liabilities . . . . . . . . . . . . . . . . . 19
Statement of Operations . . . . . . . . . . . . . . . . . . . . . . . 20
Statement of Changes in Net Assets. . . . . . . . . . . . . . . . . . 21
Notes to Financial Statements . . . . . . . . . . . . . . . . . . . . 22
Financial Highlights. . . . . . . . . . . . . . . . . . . . . . . . . 26
OTHER INFORMATION
Proxy Voting Results. . . . . . . . . . . . . . . . . . . . . . . . . 27
Approval of Management Agreement for NT Diversified Bond. . . . . . . 28
Additional Information. . . . . . . . . . . . . . . . . . . . . . . . 32
Index Definitions . . . . . . . . . . . . . . . . . . . . . . . . . . 33
The opinions expressed in the Market Perspective and the Portfolio Commentary
reflect those of the portfolio management team as of the date of the report,
and do not necessarily represent the opinions of American Century or any other
person in the American Century organization. Any such opinions are subject to
change at any time based upon market or other conditions and American Century
disclaims any responsibility to update such opinions. These opinions may not
be relied upon as investment advice and, because investment decisions made by
American Century funds are based on numerous factors, may not be relied upon
as an indication of trading intent on behalf of any American Century fund.
Security examples are used for representational purposes only and are not
intended as recommendations to purchase or sell securities. Performance
information for comparative indices and securities is provided to American
Century by third party vendors. To the best of American Century's knowledge,
such information is accurate at the time of printing.
MARKET PERSPECTIVE
[PHOTO OF CHIEF INVESTMENT OFFICER]
By David MacEwen, Chief Investment Officer, Fixed Income
MODEST GROWTH, INFLATION, BOND RETURNS
U.S. bonds managed positive returns during the six months ended September 30,
2007. But the ride was bumpy -- bond market volatility surged to the highest
level in years as waves from the bursting housing and subprime mortgage
bubbles spread to the broader economy and financial markets.
U.S. economic growth was moderate over the last four complete calendar
quarters, running at an approximately 2-3% average annual rate. Many
economists are calling for sub-2% growth going forward. Inflation slowed, as
the trailing 12-month percentage change in core consumer prices (without
volatile food and energy prices) finished September at 2.1%. That's down from
2.9% as recently as September 2006.
To help alleviate some of the market and economic concerns, the Federal
Reserve (the Fed) lowered its benchmark federal funds rate target in
September. This came on top of cuts to its discount rate in both August and
September -- the Fed's first rate cuts since June 2003.
RATES FELL, CURVE STEEPENED
Against that backdrop, Treasury yields generally declined. The yield on the
two-year Treasury note fell from 4.58% to 3.99%; however, yields on
longer-term notes and bonds fell less. That's because investors worried about
the potential long-term inflation effects of Fed rate cuts, high energy and
commodity prices, and a weaker dollar. As a result, the yield curve (a graphic
representation of bond yields at different maturities) fell and steepened --
the difference in yield between two- and 10-year Treasury securities increased
sharply from seven to 60 basis points (a basis point equals 0.01%).
HIGH-QUALITY BONDS DID BEST
The volatility, credit, and liquidity concerns in the market all favored
Treasury securities over higher-yielding, lower-quality alternatives (see the
accompanying returns table above). So, for example, while the Treasury market
enjoyed its best quarter in five years from July to September, July was one of
the worst months on record for high-yield bonds. Treasury inflation-indexed
securities performed best because of their combination of high credit quality
and inflation protection.
U.S. Fixed-Income Total Returns
For the six months ended September 30, 2007*
TREASURY SECURITIES
3-Month Bill 2.69%
2-Year Note 3.25%
5-Year Note 3.60%
10-Year Note 2.72%
30-Year Bond 2.57%
CITIGROUP US BOND MARKET INDICES
High-Yield (corporate) 0.65%
Credit (investment-grade corporate) 1.50%
Mortgage 2.16%
Broad Investment-Grade (multi-sector) 2.42%
Agency 3.04%
Treasury 3.38%
Inflation-Linked Securities 3.76%
*Total returns for periods less than one year are not annualized.
- ------
2
PERFORMANCE
NT Diversified Bond
Total Returns as of September 30, 2007
Average Annual
Returns
Since Inception
6 months(1) 1 year Inception Date
INSTITUTIONAL CLASS 2.55% 5.27% 6.90% 5/12/06
CITIGROUP US BROAD
INVESTMENT-GRADE BOND INDEX 2.42% 5.25% 7.12% --
(1) Total returns for periods less than one year are not annualized.
Data presented reflect past performance. Past performance is no guarantee of
future results. Current performance may be higher or lower than the
performance shown. Investment return and principal value will fluctuate, and
redemption value may be more or less than original cost. To obtain performance
data current to the most recent month end, please call 1-800-345-2021 or visit
americancentury.com. As interest rates rise, bond values will decline.
Data assumes reinvestment of dividends and capital gains, and none of the
charts reflect the deduction of taxes that a shareholder would pay on fund
distributions or the redemption of fund shares. Returns for the index are
provided for comparison. The fund's total returns include operating expenses
(such as transaction costs and management fees) that reduce returns, while the
total returns of the index do not.
- ------
3
NT Diversified Bond
Growth of $10,000 Over Life of Class
$10,000 investment made May 12, 2006
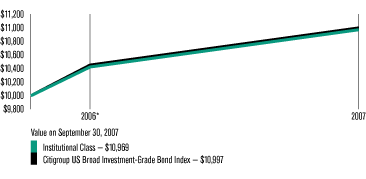
One-Year Returns Over Life of Class
Periods ended September 30
2006* 2007
Institutional Class 4.20% 5.27%
Citigroup US Broad Investment-Grade Bond Index 4.48% 5.25%
*From 5/12/06, the Institutional Class's inception date. Not annualized.
Data presented reflect past performance. Past performance is no guarantee of
future results. Current performance may be higher or lower than the
performance shown. Investment return and principal value will fluctuate, and
redemption value may be more or less than original cost. To obtain performance
data current to the most recent month end, please call 1-800-345-2021 or visit
americancentury.com. As interest rates rise, bond values will decline.
Data assumes reinvestment of dividends and capital gains, and none of the
charts reflect the deduction of taxes that a shareholder would pay on fund
distributions or the redemption of fund shares. Returns for the index are
provided for comparison. The fund's total returns include operating expenses
(such as transaction costs and management fees) that reduce returns, while the
total returns of the index do not.
- -----
4
PORTFOLIO COMMENTARY
NT Diversified Bond
Lead Portfolio Managers: Jeff Houston, Hando Aguilar, Brian Howell, John
Walsh, Dan Shiffman, Jim Platz and Seth Plunkett
Macro Strategy Team Representatives: Dave MacEwen, Bob Gahagan and Jim Keegan
PERFORMANCE SUMMARY
NT Diversified Bond returned 2.55%* for the six months ended September 30,
2007, just ahead of the 2.42% return of its benchmark, the Citigroup US Broad
Investment-Grade (BIG) Bond Index. Portfolio returns reflect operating
expenses, while the index returns do not.
The portfolio's absolute return reflected the challenging climate for bonds
prevailing in recent months (see the Market Perspective on page 2). Relative
to the benchmark, NT Diversified Bond's performance benefited from some of our
credit, yield curve, sector, and currency allocation decisions.
CURVE POSITIONING WAS KEY
Our yield-curve positioning was the key factor explaining the portfolio's
solid performance relative to the benchmark, as we maintained a yield
curve-steepening bias during the period using two- and 10-year Treasury
futures. This trade helped relative results as the yield curve steepened
overall, particularly in August. For the six months, the yield difference
between two- and 10-year Treasurys went from seven to 60 basis points (a basis
point equals 0.01%). This curve-steepening bias is a strategy we expect to
carry forward, given our view of the economy, interest rates, and shape of the
curve.
SECTOR AND SECURITY SELECTION CONTRIBUTED
For some time now we've believed that investors have not been adequately
compensated for credit or volatility risks -- risk premiums, expressed in
terms of yield, seemed too low. As a result, we maintained an overweight
position in the securitized sector and an underweight position in the
corporate sector relative to the Citigroup US BIG Bond Index. These trades
contributed to return in the last six months as mortgages outperformed
corporates.
Our security selection also contributed to relative results. For example, we
used a small slice of the portfolio to gain Japanese yen exposure, a trade we
put on when the yen was at a 4 1/2-year low against the dollar early in 2007.
Though currency values have been volatile, the yen appreciated against the
dollar overall for the six-month period.
In addition, we avoided the worst performers during the credit and liquidity
crunch that peaked in July and August. Among mortgage-backed securities, we
had essentially no subprime exposure. And when you look across all the
non-Treasury sectors, we tended to avoid the least-liquid off-the-run bonds,
which typically performed worse than more easily bought and sold on-the-run
securities.
*Total returns for periods less than one year are not annualized.
Portfolio at a Glance
As of 9/30/07 As of 3/31/07
Average Duration (effective) 5.1 years 4.6 years
Average Life 6.5 years 6.6 years
Yields as of September 30, 2007
30-day SEC Yield
Institutional Class 4.84%
- ------
5
NT Diversified Bond
RELATIVE-VALUE APPROACH
"We continued to focus on identifying the best relative values across the U.S.
taxable fixed-income securities universe," said Macro Strategy Team
representative Jim Keegan. "We think this steady, long-term approach to
investing is the best way to generate outperformance over time. Because of
this relative-value approach, we saw the sell-off during the liquidity crunch
in July and August as an opportunity to make some select trades to swap into
high-quality corporate issuers at what we believed were very attractive
prices. That said, we should point out that we remain underweight corporates
overall because we think there's potential for more underperformance as credit
spreads widen and risk assets are re-priced."
OUTLOOK
"We see a difficult path for the economy as a result of headwinds from
housing, the consumer, and higher energy prices," said Macro Strategy Team
representative Bob Gahagan. "The economic, market, and interest rate
environment also argue for the continuation of our curve-steepening trade and
yen overweight position. In terms of sector allocations, our caution about the
economy means we plan to continue to underweight credit-sensitive corporate
bonds and overweight Treasury and government agency securities. In addition,
we think the environment for inflation-indexed securities could be positive
going forward. On top of some positive fundamentals, inflation-indexed bonds
are benefiting from demand from investors who think the Federal Reserve will
err on the side of fighting recession, rather than inflation."
Types of Investments in Portfolio
% of fund % of fund
investments investments
as of as of
9/30/07 3/31/07
Mortgage-Backed Securities 23.9% 23.3%
U.S. Treasury Securities 16.4% 15.6%
CMOs 13.6% 10.8%
Corporate Bonds 10.3% 9.7%
U.S. Government Agency Securities 9.2% 10.7%
Asset-Backed Securities 3.2% 4.3%
Sovereign Governments & Agencies 1.4% 1.5%
Municipal Securities 0.1% 0.1%
Temporary Cash Investments 3.4% 8.1%
Temporary Cash Investments --
Securities Lending Collateral 18.5% 15.9%
Portfolio Composition by Credit Rating
% of fund % of fund
investments investments
as of as of
9/30/07 3/31/07
AAA 87% 87%
AA 3% 3%
A 4% 4%
BBB 6% 6%
- ------
6
SHAREHOLDER FEE EXAMPLE (UNAUDITED)
Fund shareholders may incur two types of costs: (1) transaction costs,
including sales charges (loads) on purchase payments and redemption/exchange
fees; and (2) ongoing costs, including management fees; distribution and
service (12b-1) fees; and other fund expenses. This example is intended to
help you understand your ongoing costs (in dollars) of investing in your fund
and to compare these costs with the ongoing cost of investing in other mutual
funds.
The example is based on an investment of $1,000 made at the beginning of the
period and held for the entire period from April 1, 2007 to September 30, 2007.
ACTUAL EXPENSES
The table provides information about actual account values and actual expenses
for each class. You may use the information, together with the amount you
invested, to estimate the expenses that you paid over the period. First,
identify the share class you own. Then simply divide your account value by
$1,000 (for example, an $8,600 account value divided by $1,000 = 8.6), then
multiply the result by the number under the heading "Expenses Paid During
Period" to estimate the expenses you paid on your account during this period.
If you hold Investor Class shares of any American Century fund, or
Institutional Class shares of the American Century Diversified Bond Fund, in
an American Century account (i.e., not a financial intermediary or retirement
plan account), American Century may charge you a $12.50 semiannual account
maintenance fee if the value of those shares is less than $10,000. We will
redeem shares automatically in one of your accounts to pay the $12.50 fee. In
determining your total eligible investment amount, we will include your
investments in all PERSONAL ACCOUNTS (including American Century Brokerage
accounts) registered under your Social Security number. PERSONAL ACCOUNTS
include individual accounts, joint accounts, UGMA/UTMA accounts, personal
trusts, Coverdell Education Savings Accounts and IRAs (including traditional,
Roth, Rollover, SEP-, SARSEP- and SIMPLE-IRAs), and certain other retirement
accounts. If you have only business, business retirement, employer-sponsored
or American Century Brokerage accounts, you are currently not subject to this
fee. We will not charge the fee as long as you choose to manage your accounts
exclusively online. If you are subject to the Account Maintenance Fee, your
account value could be reduced by the fee amount.
HYPOTHETICAL EXAMPLE FOR COMPARISON PURPOSES
The table also provides information about hypothetical account values and
hypothetical expenses based on the actual expense ratio of each class of your
fund and an assumed rate of return of 5% per year before expenses, which is
not the actual return of a fund's share class. The hypothetical account values
and expenses may not be used to estimate the actual ending account balance or
expenses you paid for the period. You may use this information to compare the
ongoing costs of investing in your fund and other funds. To do so, compare
this 5% hypothetical example with the 5% hypothetical examples that appear in
the shareholder reports of the other funds.
Please note that the expenses shown in the table are meant to highlight your
ongoing costs only and do not reflect any transactional costs, such as sales
charges (loads) or redemption/exchange fees. Therefore, the table is useful in
comparing ongoing costs only, and will not help you determine the relative
total costs of owning different funds. In addition, if these transactional
costs were included, your costs would have been higher.
- ------
7
Beginning Ending Expenses Paid
Account Value Account Value During Period* Annualized
4/1/07 9/30/07 4/1/07 - 9/30/07 Expense Ratio*
Actual $1,000 $1,025.50 $2.13 0.42%
Hypothetical $1,000 $1,022.90 $2.12 0.42%
*Expenses are equal to the class's annualized expense ratio listed in the
table above, multiplied by the average account value over the period,
multiplied by 183, the number of days in the most recent fiscal half-year,
divided by 366, to reflect the one-half year period.
- ------
8
SCHEDULE OF INVESTMENTS
NT Diversified Bond
SEPTEMBER 30, 2007 (UNAUDITED)
Principal Amount Value
U.S. Government Agency Mortgage-Backed Securities(1) -- 31.5%
$1,127 FHLMC, 6.50%, 2/1/09(2) $1,142
2,278 FHLMC, 6.50%, 12/1/12(2) 2,339
22,643 FHLMC, 6.00%, 1/1/13(2) 22,970
3,262 FHLMC, 7.00%, 11/1/13(2) 3,372
6,769 FHLMC, 7.00%, 6/1/14 7,011
21,390 FHLMC, 6.50%, 6/1/16(2) 21,947
12,718 FHLMC, 6.50%, 6/1/16 13,049
286,579 FHLMC, 5.00%, 11/1/17(2) 281,996
481,800 FHLMC, 4.50%, 1/1/19(2) 465,136
1,747,546 FHLMC, 5.00%, 1/1/21(2) 1,713,732
2,422 FHLMC, 7.00%, 9/1/27(2) 2,519
3,986 FHLMC, 6.50%, 1/1/28(2) 4,100
605 FHLMC, 7.00%, 2/1/28(2) 629
23,078 FHLMC, 6.50%, 3/1/29(2) 23,705
14,838 FHLMC, 6.50%, 6/1/29(2) 15,228
2,189 FHLMC, 7.00%, 8/1/29(2) 2,277
4,976 FHLMC, 7.50%, 8/1/29(2) 5,216
325 FHLMC, 6.50%, 5/1/31 333
13,948 FHLMC, 6.50%, 5/1/31 14,296
9,382 FHLMC, 6.50%, 6/1/31 9,616
472 FHLMC, 6.50%, 6/1/31 484
449 FHLMC, 6.50%, 6/1/31 460
1,116 FHLMC, 6.50%, 6/1/31 1,143
278,070 FHLMC, 5.50%, 12/1/33(2) 273,107
152,149 FHLMC, 6.50%, 7/1/47(2) 153,587
9,506,354 FNMA, 6.00%, settlement date 10/11/07(3) 9,519,719
2,670 FNMA, 6.00%, 2/1/09 2,695
1,555 FNMA, 6.00%, 5/1/13 1,584
2,886 FNMA, 6.00%, 5/1/13 2,929
8,120 FNMA, 6.00%, 7/1/13 8,243
12,423 FNMA, 6.00%, 12/1/13 12,610
9,867 FNMA, 6.00%, 1/1/14 10,015
16,675 FNMA, 6.00%, 2/1/14 16,926
17,765 FNMA, 6.00%, 4/1/14 18,032
67,646 FNMA, 5.50%, 12/1/16(2) 67,769
127,571 FNMA, 5.50%, 12/1/16(2) 127,803
483,344 FNMA, 4.50%, 5/1/19(2) 465,993
12,936 FNMA, 6.50%, 1/1/26 13,274
1,447 FNMA, 7.00%, 12/1/27 1,508
748 FNMA, 6.50%, 1/1/28 769
711 FNMA, 7.00%, 1/1/28 741
3,980 FNMA, 7.50%, 4/1/28 4,178
12,121 FNMA, 7.00%, 5/1/28 12,632
753 FNMA, 7.00%, 6/1/28 785
Principal Amount Value
$3,071 FNMA, 6.50%, 1/1/29 $3,155
8,711 FNMA, 6.50%, 4/1/29 8,942
4,683 FNMA, 7.00%, 7/1/29 4,881
3,983 FNMA, 7.00%, 7/1/29(2) 4,151
12,450 FNMA, 7.50%, 7/1/29(2) 13,056
1,246 FNMA, 7.00%, 5/1/30(2) 1,298
16,876 FNMA, 7.50%, 8/1/30(2) 17,669
6,156 FNMA, 7.50%, 9/1/30 6,445
32,182 FNMA, 7.00%, 9/1/31(2) 33,523
18,160 FNMA, 6.50%, 1/1/32(2) 18,617
161,864 FNMA, 7.00%, 6/1/32(2) 168,469
69,014 FNMA, 6.50%, 8/1/32(2) 70,752
392,335 FNMA, 5.50%, 6/1/33(2) 385,446
1,920,849 FNMA, 5.50%, 7/1/33(2) 1,887,121
324,525 FNMA, 5.50%, 8/1/33(2) 318,827
415,665 FNMA, 5.50%, 9/1/33(2) 408,366
3,040,113 FNMA, 5.00%, 11/1/33(2) 2,910,676
867,298 FNMA, 5.50%, 1/1/34(2) 852,069
2,384,373 FNMA, 5.50%, 12/1/34(2) 2,340,619
2,130,377 FNMA, 5.00%, 8/1/35(2) 2,035,780
2,192,051 FNMA, 4.50%, 9/1/35(2) 2,035,409
1,244,865 FNMA, 5.00%, 2/1/36(2) 1,189,588
8,075,412 FNMA, 5.50%, 4/1/36(2) 7,920,605
2,007,354 FNMA, 6.50%, 8/1/37(2) 2,029,556
4,500,000 FNMA, 6.50%, 9/1/37(2) 4,582,817
74,005 FNMA, 6.50%, 6/1/47(2) 74,705
194,905 FNMA, 6.50%, 8/1/47(2) 196,748
273,990 FNMA, 6.50%, 8/1/47(2) 276,580
434,822 FNMA, 6.50%, 9/1/47(2) 438,933
247,084 FNMA, 6.50%, 9/1/47(2) 249,419
306,880 FNMA, 6.50%, 9/1/47(2) 309,781
34,443 FNMA, 6.50%, 9/1/47(2) 34,769
249,418 FNMA, 6.50%, 9/1/47(2) 251,776
5,007 GNMA, 7.50%, 8/20/17(2) 5,216
6,508 GNMA, 7.00%, 11/15/22(2) 6,822
6,524 GNMA, 8.75%, 3/15/25(2) 7,030
1,598 GNMA, 7.00%, 4/20/26(2) 1,672
3,119 GNMA, 7.50%, 8/15/26(2) 3,278
1,456 GNMA, 8.00%, 8/15/26(2) 1,549
272 GNMA, 7.50%, 4/15/27(2) 286
3,226 GNMA, 7.50%, 5/15/27(2) 3,390
2,516 GNMA, 8.00%, 6/15/27(2) 2,675
269 GNMA, 7.50%, 11/15/27(2) 283
1,244 GNMA, 7.00%, 2/15/28(2) 1,304
2,327 GNMA, 7.50%, 2/15/28(2) 2,444
1,869 GNMA, 6.50%, 3/15/28(2) 1,918
- -----
9
NT Diversified Bond
Principal Amount Value
$351 GNMA, 7.00%, 4/15/28(2) $368
6,247 GNMA, 6.50%, 5/15/28(2) 6,412
1,599 GNMA, 6.50%, 5/15/28(2) 1,641
2,075 GNMA, 7.00%, 12/15/28(2) 2,176
589 GNMA, 8.00%, 12/15/29(2) 626
16,301 GNMA, 7.00%, 5/15/31(2) 17,071
------------
TOTAL U.S. GOVERNMENT AGENCY MORTGAGE-BACKED SECURITIES
(Cost $44,443,318) 44,474,308
------------
U.S. Treasury Securities -- 21.5%
1,160,000 U.S. Treasury Bonds, 8.125%, 8/15/21(2)(4) 1,541,079
1,383,000 U.S. Treasury Bonds, 7.125%, 2/15/23(2) 1,716,866
2,149,000 U.S. Treasury Bonds, 6.125%, 11/15/27(2) 2,487,300
900,000 U.S. Treasury Bonds, 6.25%, 5/15/30(2)(4) 1,070,157
800,000 U.S. Treasury Bonds, 4.75%, 2/15/37(2)(4) 789,188
15,000,000 U.S. Treasury Notes, 4.875%, 6/30/09(2)(4) 15,229,694
3,056,000 U.S. Treasury Notes, 4.875%, 6/30/12(2)(4) 3,142,430
1,700,000 U.S. Treasury Notes, 4.25%, 8/15/14(2)(4) 1,688,579
2,247,000 U.S. Treasury Notes, 4.625%, 2/15/17(2)(4) 2,258,060
480,000 U.S. Treasury Notes, 4.50%, 5/15/17(2)(4) 477,450
------------
TOTAL U.S. TREASURY SECURITIES
(Cost $29,704,604) 30,400,803
------------
Collateralized Mortgage Obligations(1) -- 18.0%
1,204,500 Banc of America Alternative Loan Trust, Series
2007-2, Class 2A4, 5.75%, 6/25/37(2) 1,203,475
2,140,974 Banc of America Commercial Mortgage Inc. STRIPS -
COUPON, Series 2004-1, Class XP, VRN, 0.63%,
10/1/07(2) 38,775
950,000 Banc of America Commercial Mortgage Inc., Series
2002 PB2, Class B SEQ, 6.31%, 6/11/35(2) 992,497
600,000 Banc of America Commercial Mortgage Inc., Series
2004-2, Class A3 SEQ, 4.05%, 11/10/38(2) 586,214
1,700,000 Banc of America Commercial Mortgage Inc., Series
2006-6, Class A3 SEQ, 5.37%, 12/10/16(2) 1,688,711
Principal Amount Value
$ 121,931 Banc of America Large Loan, Series 2005 MIB1,
Class A1, VRN, 5.90%, 10/15/07, resets monthly
off the 1-month LIBOR plus 0.15% with no caps
(Acquired 5/12/06, Cost $121,978)(2)(5) $121,436
3,165,850 Bear Stearns Commercial Mortgage Securities Trust
STRIPS - COUPON, Series 2004 T16, Class X2, VRN,
0.75%, 10/1/07(2) 89,048
509,929 Bear Stearns Commercial Mortgage Securities
Trust, Series 2006 BBA7, Class A1, VRN, 5.86%,
10/15/07, resets monthly off the 1-month LIBOR
plus 0.11% with no caps (Acquired 6/5/06, Cost
$509,929)(2)(5) 509,919
1,200,000 Bear Stearns Commercial Mortgage Securities
Trust, Series 2006 PW14, Class A4 SEQ, 5.20%,
12/1/38(2) 1,171,934
1,817,344 Commercial Mortgage Acceptance Corp. STRIPS -
COUPON, Series 1998 C2, Class X, VRN, 0.98%,
10/1/07(2) 35,856
16,855 Commercial Mortgage Pass-Through Certificates,
Series 2005 F10A, Class A1, VRN, 5.85%, 10/15/07,
resets monthly off the 1-month LIBOR plus 0.10%
with no caps (Acquired 5/12/06, Cost
$16,868)(2)(5) 16,856
35,871 Commercial Mortgage Pass-Through Certificates,
Series 2005 FL11, Class A1, VRN, 5.90%, 10/15/07,
resets monthly off the 1-month LIBOR plus 0.15%
with no caps (Acquired 5/12/06, Cost
$35,893)(2)(5) 35,852
2,688,154 Countrywide Home Loan Mortgage Pass-Through
Trust, Series 2007-16, Class A1, 6.50%, 10/25/37 2,713,451
993,283 Credit Suisse First Boston Mortgage Securities
Corp., Series 2003 AR28, Class 2A1, 4.41%,
12/25/33(2) 999,791
1,600,000 Credit Suisse Mortgage Capital Certificates,
Series 2007 TF2A, Class A1, VRN, 5.93%, 10/15/07,
resets monthly off the 1-month LIBOR plus 0.18%
with no caps (Acquited 7/24/07, Cost
$1,600,000)(2)(5) 1,588,000
- ------
10
NT Diversified Bond
Principal Amount Value
$ 651,738 FHLMC, Series 2567, Class OD, 5.00%, 8/15/15(2) $651,632
448,561 FHLMC, Series 2900, Class PA, 4.50%, 3/15/14(2) 446,812
236,641 FHLMC, Series 2937, Class KA, 4.50%, 12/15/14(2) 235,705
3,572 FNMA, Series 1989-35, Class G SEQ, 9.50%, 7/25/19 3,879
688,000 FNMA, Series 2003-92, Class PD, 4.50%, 3/25/17(2) 674,945
1,176,487 FNMA, Series 2005-63, Class HA SEQ, 5.00%,
4/25/23(2) 1,167,200
796,000 GMAC Commercial Mortgage Securities, Inc., Series
2005 C1, Class A2 SEQ, 4.47%, 5/10/43(2) 786,514
806,019 Greenwich Capital Commercial Funding Corp.,
Series 2006 FL4A, Class A1, VRN, 5.86%, 10/5/07,
resets monthly off the 1-month LIBOR plus 0.09%
with no caps (Acquired 12/14/06, Cost
$806,019)(2)(5) 804,091
267,708 GS Mortgage Securities Corp. II, Series 2007 EOP,
Class A1 VRN, 5.89%, 10/9/07, resets monthly off
the 1-month LIBOR plus 0.09% with no caps
(Acquired 6/1/07, Cost $267,708)(2)(5) 265,333
1,165,000 LB-UBS Commercial Mortgage Trust, Series 2003 C5,
Class A2 SEQ, 3.48%, 7/15/27(2) 1,149,937
569,190 LB-UBS Commercial Mortgage Trust, Series 2005 C2,
Class A2 SEQ, 4.82%, 4/15/30(2) 567,215
671,000 LB-UBS Commercial Mortgage Trust, Series 2005 C3,
Class A3 SEQ, 4.65%, 7/30/30(2) 659,089
95,592 Lehman Brothers Floating Rate Commercial Mortgage
Trust, Series 2006 LLFA, Class A1, VRN, 5.83%,
10/15/07, resets monthly off the 1-month LIBOR
plus 0.08% with no caps (Acquired 8/7/06, Cost
$95,592)(2)(5) 95,551
17,711 MASTR Alternative Loans Trust, Series 2003-8,
Class 4A1, 7.00%, 12/25/33(2) 18,104
339,026 Merrill Lynch Floating Trust, Series 2006-1,
Class A1, VRN, 5.82%, 10/15/07, resets monthly
off the 1-month LIBOR plus 0.07% with no caps
(Acquired 10/31/06, Cost $339,026)(2)(5) 337,100
Principal Amount Value
$ 319,606 Thornburg Mortgage Securities Trust, Series
2006-5, Class A1, VRN, 5.25%, 10/25/07, resets
monthly off the 1-month LIBOR plus 0.12% with no
caps(2) $314,971
1,511,000 Wachovia Bank Commercial Mortgage Trust, Series
2006 C23, Class A4, 5.42%, 1/15/45(2) 1,501,593
275,000 Washington Mutual Mortgage Pass-Through
Certificates, Series 2005 AR4, Class A3, 4.59%,
4/25/35(2) 271,716
1,642,000 Washington Mutual Mortgage Pass-Through
Certificates, Series 2005 AR4, Class A4B, 4.68%,
4/25/35(2) 1,625,135
600,000 Wells Fargo Mortgage Backed Securities Trust,
Series 2004 N, Class A4, 4.10%, 12/23/08(2) 593,733
1,375,179 Wells Fargo Mortgage Backed Securities Trust,
Series 2007-11, Class A19 SEQ, 6.00%, 8/25/37 1,381,225
------------
TOTAL COLLATERALIZED MORTGAGE OBLIGATIONS
(Cost $25,260,546) 25,343,295
------------
Corporate Bonds -- 13.5%
AEROSPACE & DEFENSE -- 0.5%
160,000 Honeywell International Inc., 5.30%, 3/15/17(2) 156,223
169,000 Lockheed Martin Corp., 6.15%, 9/1/36(2) 171,399
197,000 United Technologies Corp., 4.375%, 5/1/10(2) 195,024
230,000 United Technologies Corp., 6.05%, 6/1/36(2) 231,699
------------
754,345
------------
AUTOMOBILES -- 0.1%
170,000 DaimlerChrysler N.A. Holding Corp., 6.50%,
11/15/13(2) 176,499
------------
BEVERAGES -- 0.3%
207,000 Miller Brewing Co., 4.25%, 8/15/08 (Acquired
5/12/06-12/4/06, Cost $202,072)(2)(5) 204,996
240,000 SABMiller plc, 6.20%, 7/1/11 (Acquired 6/27/06,
Cost $239,830)(2)(5) 248,154
------------
453,150
------------
BIOTECHNOLOGY -- 0.1%
171,000 Genentech, Inc., 4.75%, 7/15/15(2) 161,485
------------
- ------
11
NT Diversified Bond
Principal Amount Value
CAPITAL MARKETS -- 0.3%
$ 124,000 Merrill Lynch & Co., Inc., 4.25%, 2/8/10(2) $121,883
292,000 Merrill Lynch & Co., Inc., 4.79%, 8/4/10(2) 287,406
------------
409,289
------------
CHEMICALS -- 0.1%
130,000 Rohm and Haas Co., 5.60%, 3/15/13(2) 129,763
------------
COMMERCIAL BANKS -- 0.6%
178,000 PNC Bank N.A., 4.875%, 9/21/17(2) 164,081
133,000 PNC Funding Corp., 5.125%, 12/14/10(2) 133,217
139,000 Wachovia Bank N.A., 4.80%, 11/1/14(2) 132,518
218,000 Wachovia Bank N.A., 4.875%, 2/1/15(2) 206,525
193,000 Wells Fargo & Co., 4.625%, 8/9/10(2) 191,104
------------
827,445
------------
COMMERCIAL SERVICES & SUPPLIES -- 0.2%
110,000 Deluxe Corp., 7.375%, 6/1/15(2) 109,175
130,000 Pitney Bowes, Inc., 5.75%, 9/15/17(2) 130,433
------------
239,608
------------
CONSUMER FINANCE -- 0.1%
99,000 American Express Centurion Bank, 4.375%,
7/30/09(2) 97,902
------------
DIVERSIFIED FINANCIAL SERVICES -- 1.4%
384,000 Bank of America Corp., 4.375%, 12/1/10(2) 378,236
250,000 Bank of America N.A., 5.30%, 3/15/17(2) 242,946
200,000 Bank of America N.A., 6.00%, 10/15/36(2) 196,888
339,000 Citigroup Inc., 5.00%, 9/15/14(2) 327,240
110,000 Citigroup Inc., 6.125%, 8/25/36(2) 109,254
250,000 General Electric Capital Corp., 5.625%, 9/15/17(2) 250,403
127,000 General Electric Capital Corp., 6.125%, 2/22/11(2) 130,980
193,000 John Deere Capital Corp., 4.50%, 8/25/08(2) 191,712
220,000 John Deere Capital Corp., 5.50%, 4/13/17(2) 218,342
------------
2,046,001
------------
Principal Amount Value
DIVERSIFIED TELECOMMUNICATION SERVICES -- 1.0%
$ 193,000 AT&T Corp., 7.30%, 11/15/11(2) $207,521
195,000 AT&T Inc., 6.80%, 5/15/36(2) 209,384
29,000 BellSouth Corp., 6.875%, 10/15/31(2) 30,447
82,000 Embarq Corp., 7.08%, 6/1/16(2) 85,146
60,000 Qwest Corp., 7.875%, 9/1/11(2) 63,300
60,000 Qwest Corp., 7.50%, 10/1/14(2) 62,700
227,000 Telecom Italia Capital SA, 4.00%, 1/15/10(2) 221,130
110,000 Telecom Italia Capital SA, 5.25%, 10/1/15(2) 104,593
150,000 Telefonica Emisiones SAU, 7.05%, 6/20/36(2) 160,286
140,000 Verizon Communications Inc., 5.55%, 2/15/16(2) 138,846
90,000 Verizon Communications Inc., 6.25%, 4/1/37(2) 90,813
------------
1,374,166
------------
ELECTRIC UTILITIES -- 0.7%
185,000 Carolina Power & Light Co., 5.15%, 4/1/15(2) 179,587
90,000 Carolina Power & Light Co., 5.25%, 12/15/15(2) 87,632
260,000 Cleveland Electric Illuminating Co. (The), 5.70%,
4/1/17(2)(4) 253,426
60,000 Florida Power Corp., 4.50%, 6/1/10(2) 59,312
130,000 Florida Power Corp., 6.35%, 9/15/37(2) 132,939
179,000 Southern California Edison Co., 5.625%, 2/1/36(2) 167,745
80,000 Toledo Edison Co., 6.15%, 5/15/37(2) 74,913
------------
955,554
------------
FOOD & STAPLES RETAILING -- 0.6%
190,000 CVS Caremark Corp., 5.75%, 6/1/17(2) 185,788
168,000 Wal-Mart Stores, Inc., 4.125%, 7/1/10(2) 164,705
235,000 Wal-Mart Stores, Inc., 5.875%, 4/5/27(2) 227,327
200,000 Wal-Mart Stores, Inc., 6.50%, 8/15/37(2) 208,243
------------
786,063
------------
FOOD PRODUCTS -- 0.6%
279,000 Cadbury Schweppes U.S. Finance LLC, 3.875%,
10/1/08 (Acquired 5/12/06-10/17/06, Cost
$268,811)(2)(5) 275,155
- ------
12
NT Diversified Bond
Principal Amount Value
$ 330,000 General Mills Inc., 5.65%, 9/10/12(2) $333,293
200,000 Kraft Foods Inc., 6.00%, 2/11/13(2) 206,122
------------
814,570
------------
HEALTH CARE EQUIPMENT & SUPPLIES -- 0.3%
179,000 Baxter Finco BV, 4.75%, 10/15/10(2) 178,942
230,000 Baxter International Inc., 5.90%, 9/1/16(2) 232,286
------------
411,228
------------
HEALTH CARE PROVIDERS & SERVICES -- 0.1%
214,000 Laboratory Corp. of America Holdings, 5.625%,
12/15/15(2) 207,428
------------
HOTELS, RESTAURANTS & LEISURE -- 0.1%
160,000 Royal Caribbean Cruises Ltd., 7.00%, 6/15/13(2) 159,912
------------
HOUSEHOLD PRODUCTS -- 0.3%
120,000 Kimberly-Clark Corp., 6.125%, 8/1/17 123,831
255,000 Procter & Gamble Co. (The), 5.55%, 3/5/37(2) 244,479
------------
368,310
------------
INDUSTRIAL CONGLOMERATES -- 0.5%
652,000 General Electric Co., 5.00%, 2/1/13(2) 647,053
------------
INSURANCE -- 0.4%
210,000 Allstate Financial Global Funding, 4.25%, 9/10/08
(Acquired 5/12/06, Cost $204,511)(2)(5) 208,540
250,000 Hartford Financial Services Group Inc. (The),
5.375%, 3/15/17(2) 242,011
100,000 Prudential Financial, Inc., 5.40%, 6/13/35(2) 87,620
110,000 Travelers Companies, Inc. (The), 6.25%, 6/15/37(2) 106,455
------------
644,626
------------
IT SERVICES -- 0.3%
450,000 International Business Machines Corp., 5.70%,
9/14/17(2) 453,209
------------
MACHINERY -- 0.1%
110,000 Atlas Copco AB, 5.60%, 5/22/17 (Acquired 5/15/07,
Cost $109,951)(2)(5) 108,752
------------
MEDIA -- 0.9%
230,000 Comcast Corp., 5.90%, 3/15/16(2) 229,176
105,000 News America Holdings, 7.75%, 1/20/24(2) 115,273
Principal Amount Value
$ 340,000 Rogers Cable Inc., 6.25%, 6/15/13(2) $344,767
300,000 Time Warner Cable Inc., 5.40%, 7/2/12 (Acquired
4/4/07- 8/9/07, Cost $298,330)(2)(5) 296,617
130,000 Time Warner Cable Inc., 6.55%, 5/1/37 (Acquired
4/4/07, Cost $129,163)(2)(5) 127,938
130,000 Time Warner Inc., 5.50%, 11/15/11(2) 129,934
29,000 Time Warner Inc., 7.625%, 4/15/31(2) 31,633
------------
1,275,338
------------
METALS & MINING -- 0.2%
200,000 Xstrata Finance Canada Ltd., 5.50%, 11/16/11
(Acquired 11/8/06-11/17/06, Cost $200,159)(2)(5) 198,956
80,000 Xstrata Finance Canada Ltd., 5.80%, 11/15/16
(Acquired 11/8/06, Cost $79,802)(2)(5) 79,692
------------
278,648
------------
MULTI-UTILITIES -- 0.8%
215,000 CenterPoint Energy Resources Corp., 6.50%,
2/1/08(2) 215,100
140,000 CenterPoint Energy Resources Corp., 6.25%,
2/1/37(2) 137,894
230,000 Consolidated Edison Co. of New York, Inc., Series
2006 C, 5.50%, 9/15/16(2) 226,739
291,000 Dominion Resources Inc., 4.125%, 2/15/08(2) 289,441
96,000 Dominion Resources Inc., 4.75%, 12/15/10(2) 94,698
101,000 Pacific Gas & Electric Co., 6.05%, 3/1/34(2) 99,514
100,000 Pacific Gas & Electric Co., 5.80%, 3/1/37(2) 94,832
------------
1,158,218
------------
MULTILINE RETAIL -- 0.4%
100,000 Federated Retail Holdings, Inc., 5.35%, 3/15/12(2) 98,158
130,000 Kohl's Corp., 6.875%, 12/15/37(2) 130,947
320,000 Macy's Retail Holdings, Inc., 5.875%, 1/15/13(2) 319,073
------------
548,178
------------
OIL, GAS & CONSUMABLE FUELS -- 1.2%
100,000 Canadian Natural Resources Ltd., 5.70%, 5/15/17(2) 97,796
139,000 Devon Financing Corp., ULC, 7.875%, 9/30/31(2) 164,641
343,000 Enterprise Products Operating L.P., 4.95%,
6/1/10(2) 341,817
- ------
13
NT Diversified Bond
Principal Amount Value
$ 97,000 Enterprise Products Operating L.P., 6.65%,
10/15/34(2) $96,816
170,000 Nexen Inc., 6.40%, 5/15/37(2) 165,736
279,000 Premcor Refining Group Inc. (The), 6.125%,
5/1/11(2) 286,176
100,000 Tesoro Corp., 6.25%, 11/1/12(2) 100,750
100,000 Tesoro Corp., 6.50%, 6/1/17 (Acquired 5/23/07,
Cost $100,000)(2)(5) 99,750
100,000 Williams Companies, Inc. (The), 8.75%, 3/15/32(2) 115,625
138,000 XTO Energy Inc., 5.30%, 6/30/15(2) 132,873
102,000 XTO Energy Inc., 6.10%, 4/1/36(2) 98,986
------------
1,700,966
------------
PHARMACEUTICALS -- 0.6%
179,000 Abbott Laboratories, 5.875%, 5/15/16(2) 180,914
320,000 AstraZeneca plc, 5.40%, 9/15/12(2) 322,863
190,000 AstraZeneca plc, 5.90%, 9/15/17 193,224
220,000 Wyeth, 5.95%, 4/1/37(2) 213,026
------------
910,027
------------
REAL ESTATE INVESTMENT TRUSTS -- 0.2%
250,000 ProLogis, 5.625%, 11/15/16(2) 237,387
------------
SOFTWARE -- 0.2%
150,000 Intuit Inc., 5.75%, 3/15/17(2) 143,415
164,000 Oracle Corp., 5.00%, 1/15/11(2) 163,758
------------
307,173
------------
SPECIALTY RETAIL -- 0.1%
130,000 Lowe's Companies, Inc., 5.60%, 9/15/12(2) 131,415
------------
WIRELESS TELECOMMUNICATION SERVICES -- 0.2%
143,000 Nextel Communications Inc., 5.95%, 3/15/14(2) 136,703
200,000 Vodafone Group plc, 5.625%, 2/27/17(2) 194,741
------------
331,444
------------
TOTAL CORPORATE BONDS
(Cost $19,031,785) 19,105,152
------------
Principal Amount Value
U.S. Government Agency Securities -- 12.3%
$ 915,000 FHLB, 4.625%, 2/1/08(2) $914,077
3,150,000 FHLMC, 5.00%, 6/11/09(2) 3,180,243
1,977,000 FHLMC, 4.625%, 10/25/12(2)(4) 1,976,980
3,780,000 FHLMC, 4.75%, 1/19/16(2)(4) 3,747,383
3,000,000 FNMA, 6.625%, 9/15/09(2) 3,125,454
639,000 FNMA, 4.375%, 7/17/13(2) 626,846
1,620,000 FNMA, 5.375%, 6/12/17(2)(4) 1,669,089
1,907,000 FNMA, 5.80%, 2/9/26(2) 1,908,836
------------
TOTAL U.S. GOVERNMENT AGENCY SECURITIES
(Cost $16,806,288) 17,148,908
------------
Asset-Backed Securities(1) -- 4.2%
82,259 Accredited Mortgage Loan Trust, Series 2006-1,
Class A1, VRN, 5.19%, 10/25/07, resets monthly
off the 1-month LIBOR plus 0.06% with no caps(2) 82,131
206,716 Accredited Mortgage Loan Trust, Series 2006-2,
Class A1, VRN, 5.17%, 10/25/07, resets monthly
off the 1-month LIBOR plus 0.04% with no caps(2) 205,647
246,672 Capital One Prime Auto Receivables Trust, Series
2004-2, Class A4, VRN, 5.81%, 10/15/07, resets
monthly off the 1-month LIBOR plus 0.06% with no
caps(2) 246,618
2,000,000 Citibank Credit Card Issuance Trust, Series 2007
A2, VRN, 5.49%, 11/21/07, resets quarterly off
the 3-month LIBOR minus 0.01% with no caps(2) 1,989,739
26,382 Countrywide Asset-Backed Certificates, Series
2006-6, Class 2A1, VRN, 5.20%, 10/25/07, resets
monthly off the 1-month LIBOR plus 0.07% with no
caps(2) 26,375
938,371 Countrywide Asset-Backed Certificates, Series
2006-22, Class 2A1, VRN, 5.18%, 10/25/07, resets
monthly off the 1-month LIBOR plus 0.05% with no
caps(2) 930,404
136,000 Detroit Edison Securitization Funding LLC, Series
2001-1, Class A4 SEQ, 6.19%, 3/1/13(2) 139,476
- ------
14
NT Diversified Bond
Principal Amount Value
$ 356,704 First Franklin Mortgage Loan Asset Backed
Certificates, Series 2006 FF11, Class 2A1, VRN,
5.17%, 10/25/07, resets monthly off the 1-month
LIBOR plus 0.04% with no caps(2) $353,211
1,096 IndyMac Residential Asset Backed Trust, Series
2006 B, Class 2A1, VRN, 5.19%, 10/25/07, resets
monthly off the 1-month LIBOR plus 0.06% with no
caps(2) 1,096
15,964 Long Beach Mortgage Loan Trust, Series 2006-2,
Class 2A1, VRN, 5.20%, 10/25/07, resets monthly
off the 1-month LIBOR plus 0.07% with no caps(2) 15,955
285,128 Long Beach Mortgage Loan Trust, Series 2006-6,
Class 2A1, VRN, 5.17%, 10/25/07, resets monthly
off the 1-month LIBOR plus 0.04% with no caps(2) 283,862
57,468 Nomura Home Equity Loan, Inc., Series 2006 HE1,
Class A1, VRN, 5.21%, 10/25/07, resets monthly
off the 1-month LIBOR plus 0.08% with no caps(2) 57,318
185,595 Nomura Home Equity Loan, Inc., Series 2006 HE2,
Class A1, VRN, 5.19%, 10/25/07, resets monthly
off the 1-month LIBOR plus 0.06% with no caps(2) 184,606
228,579 SLM Student Loan Trust, Series 2006-5, Class A2,
VRN, 5.35%, 10/25/07, resets quarterly off the
3-month LIBOR minus 0.01% with no caps(2) 228,436
1,000,000 SLM Student Loan Trust, Series 2006-10, Class A2,
VRN, 5.37%, 10/25/07, resets quarterly off the
3-month LIBOR plus 0.01% with no caps(2) 1,000,525
206,622 Soundview Home Equity Loan Trust,Series 2006-3,
Class A1, VRN, 5.17%, 10/25/07, resets monthly
off the 1-month LIBOR plus 0.04% with no caps(2) 205,983
------------
TOTAL ASSET-BACKED SECURITIES
(Cost $5,975,973) 5,951,382
------------
Principal Amount Value
Sovereign Governments & Agencies -- 1.8%
$ 29,000 Hydro Quebec, 8.40%, 1/15/22(2) $37,567
JPY KfW, VRN, 0.60%, 11/8/07, resets quarterly off
266,000,000 the 3-month JPY LIBOR minus 0.22% with no caps 2,318,849
$ 215,000 Province of Quebec, 5.00%, 7/17/09(2) 217,141
------------
TOTAL SOVEREIGN GOVERNMENTS & AGENCIES
(Cost $2,436,944) 2,573,557
------------
Municipal Securities -- 0.1%
173,000 Illinois GO, (Taxable Pension), 5.10%, 6/1/33(2) 162,376
(Cost $154,225)
------------
Temporary Cash Investments -- 4.5%
Repurchase Agreement, Bank of America Securities, LLC,
(collateralized by various U.S. Treasury obligations, 0.875%,
4/15/10, valued at $3,039,843), in a joint trading account at
3.80%, dated 9/28/07, due 10/1/07 (Delivery value $2,705,857)(2) 2,705,000
Repurchase Agreement, Merrill Lynch & Co., Inc., (collateralized
by various U.S. Treasury obligations, 2.375%, 4/15/11, valued at
$3,718,142), in a joint trading account at 3.75%, dated 9/28/07,
due 10/1/07 (Delivery value $3,639,137)(2) 3,638,000
------------
TOTAL TEMPORARY CASH INVESTMENTS
(Cost $6,343,000) 6,343,000
------------
Temporary Cash Investments -- Securities Lending Collateral(6) -- 24.3%
1,000,048 Bancaja US Debt, SAu, VRN, 5.41%, 10/10/07,
resets quarterly off the 3-month LIBOR plus 0.05%
with no caps 1,000,048
1,000,000 Barclays Bank plc, 5.37%, 12/17/07 1,000,000
999,900 BASF AG, VRN, 5.36%, 10/22/07, resets quarterly
off the 3-month LIBOR minus 0.01% with no caps 999,900
1,000,000 Dexia Credit Local, VRN, 4.84%, 10/1/07 1,000,000
973,705 Govco Incorporated, 5.37%, 12/17/07 973,705
1,399,268 K2 (USA) LLC, VRN, 4.87%, 10/1/07, resets
quarterly off the federal Reserve Prime Loan Rate
minus 2.91% with no caps 1,399,268
- ------
15
NT Diversified Bond
Principal Amount Value
$ 999,500 Links Finance LLC, VRN, 4.87%, 10/1/07 $999,500
1,100,000 Merrill Lynch & Co. Inc., VRN, 4.92%, 10/1/07,
resets quarterly off the Federal Reserve Prime
Loan Rate minus 2.83% with no caps 1,100,000
1,417,115 Morgan Stanley ABS Capital I, Series 2007 NC4,
Class A2A, VRN, 5.21%, 10/25/07, resets monthly
off the 1-month LIBOR plus 0.08% with no caps 1,417,115
1,001,649 Nationwide Building Society, VRN, 5.73%, 12/10/07 1,001,649
1,000,000 Northern Rock plc, 5.34%, 10/18/07 1,000,000
1,979,549 Silver Tower US Funding, LLC, 5.39%, 10/10/07 1,979,549
Principal Amount Value
$ 999,365 Tango Finance Corp., VRN, 4.88%, 10/1/07, resets
quarterly off the Federal Reserve Prime Loan Rate
minus 2.91% with no caps $999,365
1,000,000 Ulster Bank Ireland Ltd., VRN, 4.85%, 10/1/07 1,000,000
Repurchase Agreement, Lehman Brothers, Inc., (collateralized by
various U.S. Government Agency obligations in a pooled account at
the lending agent), 5.15%, dated 9/28/07, due 10/1/07 (Delivery
value $18,490,048) 18,482,116
------------
TOTAL TEMPORARY CASH INVESTMENTS -- SECURITIES LENDING COLLATERAL
(Cost $34,352,215) 34,352,215
------------
TOTAL INVESTMENT SECURITIES -- 131.7%
(Cost $184,508,898) 185,854,996
------------
OTHER ASSETS AND LIABILITIES -- (31.7)% (44,756,425)
------------
TOTAL NET ASSETS -- 100.0% $141,098,571
============
Futures Contracts
Underlying Face
Expiration Amount Unrealized
Contracts Purchased Date at Value Gain (Loss)
18 U.S. Long Bond December 2007 $ 2,004,188 $ 36,242
255 U.S. Treasury
2-Year Notes December 2007 52,796,953 290,286
272 U.S. Treasury
5-Year Notes December 2007 29,112,500 279,138
-------------- -------------
$83,913,641 $605,666
============== =============
Expiration Underlying Face Unrealized
Contracts Sold Date Amount at Value Gain (Loss)
195 U.S. Treasury
10-Year Notes December 2007 $21,309,844 $(325,511)
============== =============
- ------
16
NT Diversified Bond
Swap Agreements
Notional Expiration Unrealized
Amount Description of Agreement Date Gain (Loss)
CREDIT DEFAULT
$ 500,000 Pay quarterly a fixed rate equal to March 2012 $ 49,904
0.46% multiplied by the notional
amount and receive from Barclays Bank
plc upon each default event of Centex
Corp., par value of the proportional
notional amount.
3,350,000 Pay quarterly a fixed rate equal to June 2012 36,690
0.35% multiplied by the notional
amount and receive from Barclays Bank
plc upon each default event of one of
the issues of Dow Jones CDX N.A.
Investment Grade 8, par value of the
proportional notional amount.
1,800,000 Pay quarterly a fixed rate equal to June 2012 (9,819)
0.55% multiplied by the notional
amount and receive from Barclays Bank
plc upon each default event of Darden
Restaurants, Inc., par value of the
proportional notional amount.
250,000 Pay quarterly a fixed rate equal to September 50
0.36% multiplied by the notional 2012
amount and receive from Barclays Bank
plc upon each default event of
Whirlpool Corp., par value of the
proportional notional amount.
1,100,000 Pay quarterly a fixed rate equal to March 2017 5,572
0.12% multiplied by the notional
amount and receive from Barclays Bank
plc upon each default event of Pfizer
Inc., par value of the proportional
notional amount.
2,000,000 Pay quarterly a fixed rate equal to September (23,401)
0.69% multiplied by the notional 2017
amount and receive from Barclays Bank
plc upon each default event of
JPMorgan Chase & Co., par value of the
proportional notional amount.
----------
$ 58,996
==========
- ------
17
NT Diversified Bond
Notes to Schedule of Investments
CDX = Credit Derivative Indexes
FHLB = Federal Home Loan Bank
FHLMC = Federal Home Loan Mortgage Corporation
FNMA = Federal National Mortgage Association
GMAC = General Motors Acceptance Corporation
GNMA = Government National Mortgage Association
GO = General Obligation
JPY = Japanese Yen
LB-UBS = Lehman Brothers Inc. - UBS AG
LIBOR = London Interbank Offered Rate
MASTR = Mortgage Asset Securitization Transactions, Inc.
resets = The frequency with which a security's coupon changes, based on
current market conditions or an underlying index. The more frequently a
security resets, the less risk the investor is taking that the coupon will
vary significantly from current market rates.
SEQ = Sequential Payer
STRIPS = Separate Trading of Registered Interest and Principal of Securities
VRN = Variable Rate Note. Interest reset date is indicated. Rate shown is
effective September 30, 2007.
(1) Final maturity indicated, unless otherwise noted.
(2) Security, or a portion thereof, has been segregated for forward
commitments, futures contracts and/or swap agreements.
(3) Forward commitment.
(4) Security, or a portion thereof, was on loan as of September 30, 2007.
(5) Security was purchased under Rule 144A of the Securities Act of 1933 or is
a private placement and, unless registered under the Act or exempted from
registration, may only be sold to qualified institutional investors. The
aggregate value of restricted securities at September 30, 2007 was $5,622,688,
which represented 4.0% of total net assets.
(6) Investments represent purchases made by the lending agent with cash
collateral received through securities lending transactions.
See Notes to Financial Statements.
- ------
18
STATEMENT OF ASSETS AND LIABILITIES
SEPTEMBER 30, 2007 (UNAUDITED)
ASSETS
Investment securities, at value (cost of $150,156,683) --
including $33,782,273 of securities on loan $151,502,781
Investments made with cash collateral received for securities on
loan, at value (cost of $34,352,215) 34,352,215
------------
Total investment securities, at value (cost of $184,508,898) 185,854,996
Receivable for investments sold 48,453
Receivable for variation margin on futures contracts 6,314
Unrealized appreciation on swap agreements 92,216
Interest receivable 1,083,047
------------
187,085,026
------------
LIABILITIES
Disbursements in excess of demand deposit cash 119,406
Payable for collateral received for securities on loan 34,352,215
Payable for investments purchased 10,914,626
Unrealized depreciation on swap agreements 33,220
Dividends payable 518,925
Accrued management fees 48,063
------------
45,986,455
------------
NET ASSETS $141,098,571
============
INSTITUTIONAL CLASS CAPITAL SHARES
Outstanding (unlimited number of shares authorized) 13,827,845
============
NET ASSET VALUE PER SHARE $10.20
============
NET ASSETS CONSIST OF:
Capital paid-in $139,025,020
Undistributed net realized gain on investment transactions 388,703
Net unrealized appreciation on investments 1,684,848
------------
$141,098,571
============
See Notes to Financial Statements.
- ------
19
STATEMENT OF OPERATIONS
FOR THE SIX MONTHS ENDED SEPTEMBER 30, 2007 (UNAUDITED)
INVESTMENT INCOME (LOSS)
INCOME:
Interest $3,436,018
Securities lending 49,226
-----------
3,485,244
-----------
EXPENSES:
Management fees 273,581
Trustees' fees and expenses 3,052
Other expenses 2,592
-----------
279,225
-----------
NET INVESTMENT INCOME (LOSS) 3,206,019
-----------
REALIZED AND UNREALIZED GAIN (LOSS)
NET REALIZED GAIN (LOSS) ON:
Investment transactions (165,594)
Futures and swaps transactions 319,333
-----------
153,739
-----------
CHANGE IN NET UNREALIZED APPRECIATION (DEPRECIATION) ON:
Investments 291,858
Futures and swaps 218,830
-----------
510,688
-----------
NET REALIZED AND UNREALIZED GAIN (LOSS) 664,427
-----------
NET INCREASE (DECREASE) IN NET ASSETS RESULTING FROM OPERATIONS $3,870,446
===========
See Notes to Financial Statements.
- ------
20
STATEMENT OF CHANGES IN NET ASSETS
SIX MONTHS ENDED SEPTEMBER 30, 2007 (UNAUDITED) AND
PERIOD ENDED MARCH 31, 2007
March 31,
Increase (Decrease) in Net Assets Sept. 30, 2007 2007(1)
OPERATIONS
Net investment income (loss) $ 3,206,019 $ 4,073,733
Net realized gain (loss) 153,739 765,416
Change in net unrealized appreciation
(depreciation) 510,688 1,172,794
------------ ------------
Net increase (decrease) in net assets resulting
from operations 3,870,446 6,011,943
------------ ------------
DISTRIBUTIONS TO SHAREHOLDERS
From net investment income (3,193,670) (4,058,434)
From net realized gains -- (556,734)
------------ ------------
Decrease in net assets from distributions (3,193,670) (4,615,168)
------------ ------------
CAPITAL SHARE TRANSACTIONS
Proceeds from shares sold 39,446,536 130,733,727
Payments for shares redeemed (12,478,249) (18,676,994)
------------ ------------
Net increase (decrease) in net assets from
capital share transactions 26,968,287 112,056,733
------------ ------------
NET INCREASE (DECREASE) IN NET ASSETS 27,645,063 113,453,508
NET ASSETS
Beginning of period 113,453,508 --
------------ ------------
End of period $141,098,571 $113,453,508
============ ============
Accumulated net investment loss -- $(1,197)
============ ============
TRANSACTIONS IN SHARES OF THE FUND
Sold 3,928,869 12,974,017
Redeemed (1,232,464) (1,842,577)
------------ ------------
NET INCREASE (DECREASE) IN SHARES OF THE FUND 2,696,405 11,131,440
============ ============
(1) May 12, 2006 (fund inception) through March 31, 2007.
See Notes to Financial Statements.
- ------
21
NOTES TO FINANCIAL STATEMENTS
SEPTEMBER 30, 2007 (UNAUDITED)
1. ORGANIZATION AND SUMMARY OF SIGNIFICANT ACCOUNTING POLICIES
ORGANIZATION -- American Century Investment Trust (the trust) is registered
under the Investment Company Act of 1940 (the 1940 Act) as an open-end
management investment company. NT Diversified Bond Fund (NT Diversified Bond)
(the fund) is one fund in a series issued by the trust. The fund is
diversified under the 1940 Act. The fund's investment objective is to seek a
high level of income by investing in non-money market debt securities. The
fund is not permitted to invest in any securities issued by companies assigned
by the Global Industry Classification Standard to the tobacco industry. The
fund incepted on May 12, 2006. The following is a summary of the fund's
significant accounting policies.
SECURITY VALUATIONS -- Debt securities maturing in greater than 60 days are
valued at current market value as provided by a commercial pricing service or
at the mean of the most recent bid and asked prices. Debt securities maturing
within 60 days may be valued at cost, plus or minus any amortized discount or
premium. Securities traded on foreign securities exchanges and
over-the-counter markets are normally completed before the close of business
on days that the New York Stock Exchange (the Exchange) is open and may also
take place on days when the Exchange is not open. If an event occurs after the
value of a security was established but before the net asset value per share
was determined that was likely to materially change the net asset value, that
security would be valued as determined in accordance with procedures adopted
by the Board of Trustees. If the fund determines that the market price of a
portfolio security is not readily available, or that the valuation methods
mentioned above do not reflect the security's fair value, such security is
valued as determined by, or in accordance with procedures adopted by, the
Board of Trustees or its designee if such determination would materially
impact a fund's net asset value. Certain other circumstances may cause the
fund to use alternative procedures to value a security such as: a security has
been declared in default; trading in a security has been halted during the
trading day; or there is a foreign market holiday and no trading will commence.
SECURITY TRANSACTIONS -- For financial reporting, security transactions are
accounted for as of the trade date. Net realized gains and losses are
determined on the identified cost basis, which is also used for federal income
tax purposes.
INVESTMENT INCOME -- Interest income less foreign taxes withheld, if any, is
recorded on the accrual basis and includes paydown gain (loss) and accretion
of discounts and amortization of premiums.
SECURITIES ON LOAN -- The fund may lend portfolio securities through its
lending agent to certain approved borrowers in order to earn additional
income. The fund continues to recognize any gain or loss in the market price
of the securities loaned and records any interest earned or dividends declared.
FOREIGN CURRENCY TRANSACTIONS -- All assets and liabilities initially
expressed in foreign currencies are translated into U.S. dollars at prevailing
exchange rates at period end. Purchases and sales of investment securities,
dividend and interest income, and certain expenses are translated at the rates
of exchange prevailing on the respective dates of such transactions. For
assets and liabilities, other than investments in securities, net realized and
unrealized gains and losses from foreign currency translations arise from
changes in currency exchange rates.
Net realized and unrealized foreign currency exchange gains or losses
occurring during the holding period of investment securities are a component
of realized gain (loss) on investment transactions and unrealized appreciation
(depreciation) on investments, respectively. Certain countries may impose
taxes on the contract amount of purchases and sales of foreign currency
contracts in their currency. The fund records the foreign tax expense, if any,
as a reduction to the net realized gain (loss) on foreign currency
transactions.
WHEN-ISSUED AND FORWARD COMMITMENTS -- The fund may engage in securities
transactions on a when-issued or forward commitment basis. In these
transactions, the securities' prices and yields are fixed on the date of the
commitment. In a when-issued transaction, the payment and delivery are
scheduled for a future date and during this period, securities are subject to
market fluctuations. In a forward commitment transaction, the fund may sell a
security and at the same time make a commitment to purchase the same security
at a future date at a specified price. Conversely, the fund may purchase a
security and at the same time make a commitment to sell the same security at a
future date at a specified price. These types of transactions are executed
simultaneously in what are known as "roll" transactions. The fund will
segregate cash, cash equivalents or other appropriate liquid securities on its
records in amounts sufficient to meet the purchase price. The fund accounts
for "roll" transactions as purchases and sales; as such these transactions may
increase portfolio turnover.
- ------
22
FUTURES CONTRACTS -- The fund may enter into futures contracts in order to
manage the fund's exposure to changes in market conditions. One of the risks
of entering into futures contracts is the possibility that the change in value
of the contract may not correlate with the changes in value of the underlying
securities. Upon entering into a futures contract, the fund is required to
deposit either cash or securities in an amount equal to a certain percentage
of the contract value (initial margin). Subsequent payments (variation margin)
are made or received daily, in cash, by the fund. The variation margin is
equal to the daily change in the contract value and is recorded as unrealized
gains and losses. The fund recognizes a realized gain or loss when the
contract is closed or expires. Net realized and unrealized gains or losses
occurring during the holding period of futures contracts are a component of
realized gain (loss) on futures and swaps transactions and unrealized
appreciation (depreciation) on futures and swaps, respectively.
SWAP AGREEMENTS -- The fund may enter into swap agreements in order to attempt
to obtain or preserve a particular return or spread at a lower cost than
obtaining a return or spread through purchases and/or sales of instruments in
other markets; protect against currency fluctuations; attempt to manage
duration to protect against any increase in the price of securities the fund
anticipates purchasing at a later date; or gain exposure to certain markets in
the most economical way possible. A basic swap agreement is a contract in
which two parties agree to exchange the returns earned or realized on
predetermined investments or instruments. Credit default swaps enable an
investor to buy/sell protection against a credit event of a specific issuer.
The seller of credit protection against a security or basket of securities
receives an up-front or periodic payment to compensate against potential
default events. The fund may enhance returns by selling protection or attempt
to mitigate credit risk by buying protection. The fund will segregate cash,
cash equivalents or other appropriate liquid securities on its records in
amounts sufficient to meet requirements. Unrealized gains are reported as an
asset and unrealized losses are reported as a liability on the Statement of
Assets and Liabilities. Swap agreements are valued daily and changes in value,
including the periodic amounts of interest to be paid or received on swaps,
are recorded as unrealized appreciation (depreciation) on futures and swaps.
Realized gain or loss is recorded upon receipt or payment of a periodic
settlement or termination of swap agreements. The risks of entering into swap
agreements include the possible lack of liquidity, failure of the counterparty
to meet its obligations, and that there may be unfavorable changes in the
underlying investments and instruments.
REPURCHASE AGREEMENTS -- The fund may enter into repurchase agreements with
institutions that American Century Investment Management, Inc. (ACIM) (the
investment advisor) has determined are creditworthy pursuant to criteria
adopted by the Board of Trustees. Each repurchase agreement is recorded at
cost. The fund requires that the collateral, represented by securities,
received in a repurchase transaction be transferred to the custodian in a
manner sufficient to enable the fund to obtain those securities in the event
of a default under the repurchase agreement. ACIM monitors, on a daily basis,
the securities transferred to ensure the value, including accrued interest, of
the securities under each repurchase agreement is equal to or greater than
amounts owed to the fund under each repurchase agreement.
JOINT TRADING ACCOUNT -- Pursuant to an Exemptive Order issued by the
Securities and Exchange Commission, the fund, along with other registered
investment companies having management agreements with ACIM or American
Century Global Investment Management, Inc. (ACGIM), may transfer uninvested
cash balances into a joint trading account. These balances are invested in one
or more repurchase agreements that are collateralized by U.S. Treasury or
Agency obligations.
INCOME TAX STATUS -- It is the fund's policy to distribute substantially all
net investment income and net realized gains to shareholders and to otherwise
qualify as a regulated investment company under provisions of the Internal
Revenue Code. At this time, management has not identified any uncertain tax
positions that would materially impact the financial statements. Accordingly,
no provision has been made for federal or state income taxes. Interest and
penalties associated with any federal or state income tax obligations, if any,
are recorded as interest expense.
DISTRIBUTIONS TO SHAREHOLDERS -- Distributions from net investment income for
the fund are declared daily and paid monthly. Distributions from net realized
gains for the fund, if any, are generally declared and paid annually.
INDEMNIFICATIONS -- Under the trust's organizational documents, its officers
and trustees are indemnified against certain liabilities arising out of the
performance of their duties to the fund. In addition, in the normal course of
business, the fund enters into contracts that provide general
indemnifications. The fund's maximum exposure under these arrangements is
unknown as this would involve future claims that may be made against the fund.
The risk of material loss from such claims is considered by management to be
remote.
- ------
23
USE OF ESTIMATES -- The financial statements are prepared in conformity with
accounting principles generally accepted in the United States of America,
which may require management to make certain estimates and assumptions at the
date of the financial statements. Actual results could differ from these
estimates.
2. FEES AND TRANSACTIONS WITH RELATED PARTIES
MANAGEMENT FEES -- The trust has entered into a Management Agreement with
ACIM, under which ACIM provides the fund with investment advisory and
management services in exchange for a single, unified management fee (the
fee). The Agreement provides that all expenses of the fund, except brokerage
commissions, taxes, interest, fees and expenses of those trustees who are not
considered "interested persons" as defined in the 1940 Act (including counsel
fees) and extraordinary expenses, will be paid by ACIM. The fee is computed
and accrued daily based on the daily net assets of the specific class of
shares of the fund and paid monthly in arrears. The fee consists of (1) an
Investment Category Fee based on the daily net assets of the funds and certain
other accounts managed by the investment advisor that are in the same broad
investment category as the fund and (2) a Complex Fee based on the assets of
all the funds in the American Century family of funds. The rates for the
Investment Category Fee range from 0.2925% to 0.4100% and the rates for the
Complex Fee range from 0.0500% to 0.1100%. The effective annual management fee
for the six months ended September 30, 2007 was 0.42%.
RELATED PARTIES -- Certain officers and trustees of the trust are also
officers and/or directors, and, as a group, controlling stockholders of
American Century Companies, Inc. (ACC), the parent of the trust's investment
advisor, ACIM, the distributor of the trust, American Century Investment
Services, Inc., and the trust's transfer agent, American Century Services,
LLC. The fund is wholly owned by American Century Asset Allocation Portfolios,
Inc. (ACAAP). ACAAP does not invest in the funds for the purpose of exercising
management or control.
The fund has a bank line of credit agreement and securities lending agreement
with JPMorgan Chase Bank (JPMCB). JPMCB is a custodian of the fund and a
wholly owned subsidiary of JPMorgan Chase & Co. (JPM). JPM is an equity
investor in ACC.
3. INVESTMENT TRANSACTIONS
Purchases of investment securities, excluding short-term investments, for the
six months ended September 30, 2007, totaled $201,706,396, of which
$187,658,737 represented U.S. Treasury and Agency obligations. Sales of
investment securities, excluding short-term investments, for the six months
ended September 30, 2007, totaled $185,382,848, of which $180,958,306
represented U.S. Treasury and Agency obligations.
4. SECURITIES LENDING
As of September 30, 2007, securities in the fund valued at $33,782,273 were on
loan through the lending agent, JPMCB, to certain approved borrowers. JPMCB
receives and maintains collateral in the form of cash and/or acceptable
securities as approved by ACIM. Cash collateral is invested in authorized
investments by the lending agent in a pooled account. The value of cash
collateral received at period end is disclosed in the Statement of Assets and
Liabilities and investments made with the cash by the lending agent are listed
in the Schedule of Investments. Any deficiencies or excess of collateral must
be delivered or transferred by the member firms no later than the close of
business on the next business day. The total value of all collateral received,
at this date, was $34,352,215. The fund's risks in securities lending are that
the borrower may not provide additional collateral when required or return the
securities when due. If the borrower defaults, receipt of the collateral by
the fund may be delayed or limited.
5. BANK LINE OF CREDIT
The fund, along with certain other funds managed by ACIM or ACGIM, has a
$500,000,000 unsecured bank line of credit agreement with JPMCB. The fund may
borrow money for temporary or emergency purposes to fund shareholder
redemptions. Borrowings under the agreement bear interest at the Federal Funds
rate plus 0.40%. The fund did not borrow from the line during the six months
ended September 30, 2007.
- ------
24
6. FEDERAL TAX INFORMATION
The book-basis character of distributions made during the year from net
investment income or net realized gains may differ from their ultimate
characterization for federal income tax purposes. These differences reflect
the differing character of paydown losses, certain income items and net
realized gains and losses for financial statement and tax purposes, and may
result in reclassification among certain capital accounts on the financial
statements. Reclassifications between income and realized gain relate
primarily to the character of paydown losses and interest on swap agreements.
As of September 30, 2007, the components of investments for federal income tax
purposes were as follows:
Federal tax cost of investments $184,517,566
=============
Gross tax appreciation of investments $1,713,583
Gross tax depreciation of investments (376,153)
-------------
Net tax appreciation (depreciation) of investments $1,337,430
=============
The difference between book-basis and tax-basis cost and unrealized
appreciation (depreciation) is attributable primarily to the tax deferral of
losses on wash sales.
7. RECENTLY ISSUED ACCOUNTING STANDARDS
In June 2006, the Financial Accounting Standards Board (FASB) issued
Interpretation No. 48, "Accounting for Uncertainty in Income Taxes - an
Interpretation of FASB Statement No. 109" (FIN 48). FIN 48 establishes a
minimum threshold for financial statement recognition of the benefit of
positions taken in filing tax returns (including whether an entity is taxable
in a particular jurisdiction), and requires certain expanded tax disclosures.
FIN 48 is effective for fiscal years beginning after December 15, 2006, and is
to be applied to all open tax years as of the date of effectiveness.
Management has concluded that the adoption of FIN 48 will not materially
impact the financial statements.
The FASB issued Statement of Financial Accounting Standards No. 157, "Fair
Value Measurements" (FAS 157), in September 2006, which is effective for
fiscal years beginning after November 15, 2007. FAS 157 defines fair value,
establishes a framework for measuring fair value and expands the required
financial statement disclosures about fair value measurements. Management is
currently evaluating the impact that adopting FAS 157 will have on the
financial statement disclosures.
- ------
25
FINANCIAL HIGHLIGHTS
NT Diversified Bond
For a Share Outstanding Throughout the Periods Indicated
2007(1) 2007(2)
PER-SHARE DATA
Net Asset Value, Beginning of Period $10.19 $10.00
-------- --------
Income From Investment Operations
Net Investment Income (Loss)(3) 0.25 0.44
Net Realized and Unrealized Gain (Loss) --(4) 0.24
-------- --------
Total From Investment Operations 0.25 0.68
-------- --------
Distributions
From Net Investment Income (0.24) (0.44)
From Net Realized Gains -- (0.05)
-------- --------
Total Distributions (0.24) (0.49)
-------- --------
Net Asset Value, End of Period $10.20 $10.19
======== ========
TOTAL RETURN(5) 2.55% 6.96%
RATIOS/SUPPLEMENTAL DATA
Ratio of Operating Expenses to Average Net Assets 0.42%(6) 0.42%(6)
Ratio of Net Investment Income (Loss) to Average Net Assets 4.88%(6) 4.95%(6)
Portfolio Turnover Rate 151% 308%
Net Assets, End of Period (in thousands) $141,099 $113,454
(1) Six months ended September 30, 2007 (unaudited).
(2) May 12, 2006 (fund inception) through March 31, 2007.
(3) Computed using average shares outstanding throughout the period.
(4) Per-share amount was less than $0.005.
(5) Total return assumes reinvestment of net investment income and capital
gains distributions, if any. Total returns for periods less than one year are
not annualized.
(6) Annualized.
See Notes to Financial Statements.
- ------
26
PROXY VOTING RESULTS
A special meeting of shareholders was held on July 27, 2007, to vote on the
following proposal. The proposal received the required number of votes of the
American Century Investment Trust and was adopted. A summary of voting results
is listed below the proposal.
PROPOSAL:
To elect eight Trustees to the Board of Trustees of American Century
Investment Trust (the proposal was voted on by all shareholders of funds
issued by American Century Investment Trust).
Jonathan S. Thomas For: 3,336,300,729
Withhold: 35,929,005
Abstain: 0
Broker Non-Vote: 0
John Freidenrich For: 3,337,319,127
Withhold: 34,910,607
Abstain: 0
Broker Non-Vote: 0
Ronald J. Gilson For: 3,337,806,752
Withhold: 34,422,982
Abstain: 0
Broker Non-Vote: 0
Kathryn A. Hall For: 3,337,653,997
Withhold: 34,575,737
Abstain: 0
Broker Non-Vote: 0
Peter F. Pervere For: 3,336,793,063
Withhold: 35,436,671
Abstain: 0
Broker Non-Vote: 0
Myron S. Scholes For: 3,335,709,158
Withhold: 36,520,576
Abstain: 0
Broker Non-Vote: 0
John B. Shoven For: 3,337,333,277
Withhold: 34,896,457
Abstain: 0
Broker Non-Vote: 0
Jeanne D. Wohlers For: 3,336,368,531
Withhold: 35,861,203
Abstain: 0
Broker Non-Vote: 0
- ------
27
APPROVAL OF MANAGEMENT AGREEMENT
NT Diversified Bond
Under Section 15(c) of the Investment Company Act, contracts for investment
advisory services are required to be reviewed, evaluated and approved by a
majority of a fund's independent directors or trustees (the "Directors") each
year. At American Century, this process is referred to as the "15(c) Process."
As a part of this process, the board reviews fund performance, shareholder
services, audit and compliance information, and a variety of other reports
from the advisor concerning fund operations. In addition to this annual
review, the board of directors oversees and evaluates on a continuous basis at
its quarterly meetings the nature and quality of significant services
performed by the advisor, fund performance, audit and compliance information,
and a variety of other reports relating to fund operations. The board, or
committees of the board, also holds special meetings as needed.
Under a Securities and Exchange Commission rule, each fund is required to
disclose in its annual or semiannual report, as appropriate, the material
factors and conclusions that formed the basis for the board's approval or
renewal of any advisory agreements within the fund's most recently completed
fiscal half-year period.
ANNUAL CONTRACT REVIEW PROCESS
As part of the annual 15(c) Process undertaken during the most recent fiscal
half-year period, the Directors reviewed extensive data and information
compiled by the advisor and certain independent providers of evaluative data
(the "15(c) Providers") concerning NT Diversified Bond (the "fund") and the
services provided to the fund under the management agreement. The information
considered and the discussions held at the meetings included, but were not
limited to:
* the nature, extent and quality of investment management, shareholder
services and other services provided to the fund under the management
agreement;
* reports on the advisor's activities relating to the wide range of programs
and services the advisor provides to the fund and its shareholders on a
routine and non-routine basis;
* data comparing the cost of owning the fund to the cost of owning a similar
fund;
* data comparing the fund's performance to appropriate benchmarks and/or a
peer group of other mutual funds with similar investment objectives and
strategies;
* financial data showing the profitability of the fund to the advisor and the
overall profitability of the advisor; and
* data comparing services provided and charges to other investment management
clients of the advisor.
In keeping with its practice, the fund's board of directors held two regularly
scheduled meetings to review and discuss the information provided by the
advisor and to complete its negotiations with the advisor regarding the
renewal of the management agreement, including the setting of the applicable
advisory fee. The board also had the benefit of the advice of its independent
counsel throughout the period.
- ------
28
FACTORS CONSIDERED
The Directors considered all of the information provided by the advisor, the
15(c) Providers, and the board's independent counsel, and evaluated such
information for each fund for which the board has responsibility. The
Directors did not identify any single factor as being all-important or
controlling, and each Director may have attributed different levels of
importance to different factors. In deciding to renew the agreement under the
terms ultimately determined by the board to be appropriate, the Directors'
decision was based on the following factors.
NATURE, EXTENT AND QUALITY OF SERVICES -- GENERALLY. Under the management
agreement, the advisor is responsible for providing or arranging for all
services necessary for the operation of the fund. The board noted that under
the management agreement, the advisor provides or arranges at its own expense
a wide variety of services including:
* fund construction and design
* portfolio security selection
* initial capitalization/funding
* securities trading
* custody of fund assets
* daily valuation of the fund's portfolio
* shareholder servicing and transfer agency, including shareholder
confirmations, recordkeeping and communications
* legal services
* regulatory and portfolio compliance
* financial reporting
* marketing and distribution
The Directors noted that many of these services have expanded over time both
in terms of quantity and complexity in response to shareholder demands,
competition in the industry and the changing regulatory environment. In
performing their evaluation, the Directors considered information received in
connection with the annual review, as well as information provided on an
ongoing basis at their regularly scheduled board and committee meetings.
INVESTMENT MANAGEMENT SERVICES. The nature of the investment management
services provided is quite complex and allows fund shareholders access to
professional money management, instant diversification of their investments
within an asset class, the opportunity to easily diversify among asset
classes, and liquidity. In evaluating investment performance, the board
expects the advisor to manage the fund in accordance with its investment
objectives and approved strategies. In providing these services, the advisor
utilizes teams of investment professionals (portfolio managers, analysts,
research assistants, and securities traders) who require extensive information
technology, research, training, compliance and other systems to conduct their
business.
- ------
29
At each quarterly meeting the Directors review investment performance
information for the fund, together with comparative information for
appropriate benchmarks and peer groups of funds managed similarly to the fund.
The Directors also review detailed performance information during the 15(c)
Process. If performance concerns are identified, the Directors discuss with
the advisor the reasons for such results (e.g., market conditions, security
selection) and any efforts being undertaken to improve performance. The
performance information presented to the Directors showed that the fund's
performance was above the median of its peer group for the one-year period and
below for the three-year period.
SHAREHOLDER AND OTHER SERVICES. The advisor provides the fund with a
comprehensive package of transfer agency, shareholder, and other services. The
Directors review reports and evaluations of such services at their regular
quarterly meetings, including the annual meeting concerning contract review,
and reports to the board. These reports include, but are not limited to,
information regarding the operational efficiency and accuracy of the
shareholder and transfer agency services provided, staffing levels,
shareholder satisfaction (as measured by external as well as internal
sources), technology support, new products and services offered to fund
shareholders, securities trading activities, portfolio valuation services,
auditing services, and legal and operational compliance activities. Certain
aspects of shareholder and transfer agency service level efficiency and the
quality of securities trading activities are measured by independent third
party providers and are presented in comparison to other fund groups not
managed by the advisor.
COSTS OF SERVICES PROVIDED AND PROFITABILITY TO THE ADVISOR. The advisor
provides detailed information concerning its cost of providing various
services to the fund, its profitability in managing the fund, its overall
profitability, and its financial condition. The Directors have reviewed with
the advisor the methodology used to prepare this financial information. This
financial information regarding the advisor is considered in order to evaluate
the advisor's financial condition, its ability to continue to provide services
under the management agreement, and the reasonableness of the current
management fee.
ETHICS OF THE ADVISOR. The Directors generally consider the advisor's
commitment to providing quality services to shareholders and to conducting its
business ethically. They noted that the advisor's practices generally meet or
exceed industry best practices.
ECONOMIES OF SCALE. The Directors review reports provided by the advisor on
economies of scale for the complex as a whole and the year-over-year changes
in revenue, costs, and profitability. The Directors concluded that economies
of scale are difficult to measure and predict with precision, especially on a
fund-by-fund basis. This analysis is also complicated by the additional
services and content provided by the advisor and its reinvestment in its
ability to provide and expand those services. Accordingly, the Directors also
seek to evaluate economies of scale by reviewing other information, such as
year-over-year profitability of the advisor generally, the profitability of
its management of the fund specifically, the expenses incurred by the advisor
in providing various functions to the fund, and the breakpoint fees of
competitive funds not managed by the advisor. The Directors believe the
advisor is appropriately sharing economies of scale through its competitive
fee structure, fee breakpoints as the fund complex and the fund increases in
size, and through reinvestment in its business to provide shareholders
additional content and services. In particular, separate breakpoint schedules
based on the size of the entire fund complex and on the size of the fund
reflect the complexity of assessing economies of scale.
- ------
30
COMPARISON TO OTHER FUNDS' FEES. The fund pays the advisor a single,
all-inclusive (or unified) management fee for providing all services necessary
for the management and operation of the fund, other than brokerage expenses,
taxes, interest, extraordinary expenses, and the fees and expenses of the
fund's independent directors (including their independent legal counsel).
Under the unified fee structure, the advisor is responsible for providing all
investment advisory, custody, audit, administrative, compliance,
recordkeeping, marketing and shareholder services, or arranging and
supervising third parties to provide such services. By contrast, most other
funds are charged a variety of fees, including an investment advisory fee, a
transfer agency fee, an administrative fee, distribution charges and other
expenses. Other than their investment advisory fees and Rule 12b-1
distribution fees, all other components of the total fees charged by these
other funds may be increased without shareholder approval. The board believes
the unified fee structure is a benefit to fund shareholders because it clearly
discloses to shareholders the cost of owning fund shares, and, since the
unified fee cannot be increased without a vote of fund shareholders, it shifts
to the advisor the risk of increased costs of operating the fund and provides
a direct incentive to minimize administrative inefficiencies. Part of the
Directors' analysis of fee levels involves reviewing certain evaluative data
compiled by an independent provider and comparing the fund's unified fee to
the total expense ratio of other funds in the fund's peer group. The unified
fee charged to shareholders of the fund was in the lowest quartile of the
total expense ratios of its peer group.
COMPARISON TO FEES AND SERVICES PROVIDED TO OTHER CLIENTS OF THE ADVISOR. The
Directors also requested and received information from the advisor concerning
the nature of the services, fees, and profitability of its advisory services
to advisory clients other than the fund. They observed that these varying
types of client accounts require different services and involve different
regulatory and entrepreneurial risks than the management of the fund. The
Directors analyzed this information and concluded that the fees charged and
services provided to the fund were reasonable by comparison.
COLLATERAL BENEFITS DERIVED BY THE ADVISOR. The Directors reviewed information
from the advisor concerning collateral benefits it receives as a result of its
relationship with the fund. They concluded that the advisor's primary business
is managing mutual funds and it generally does not use fund or shareholder
information to generate profits in other lines of business, and therefore does
not derive any significant collateral benefits from them. The Directors noted
that the advisor receives proprietary research from broker-dealers that
execute fund portfolio transactions and concluded that this research is likely
to benefit fund shareholders. The Directors also determined that the advisor
is able to provide investment management services to certain clients other
than the fund, at least in part, due to its existing infrastructure built to
serve the fund complex. The Directors concluded, however, that the assets of
those other clients are not material to the analysis and, in any event, are
included with the assets of the fund to determine breakpoints in the fund's
fee schedule, provided they are managed using the same investment team and
strategy.
CONCLUSIONS OF THE DIRECTORS
As a result of this process, the Directors, in the absence of particular
circumstances and assisted by the advice of legal counsel that is independent
of the advisor, taking into account all of the factors discussed above and the
information provided by the advisor concluded that the investment management
agreement between the fund and the advisor is fair and reasonable in light of
the services provided and should be renewed.
- ------
31
ADDITIONAL INFORMATION
RETIREMENT ACCOUNT INFORMATION
As required by law, any distributions you receive from an IRA or certain
403(b), 457 and qualified plans [those not eligible for rollover to an IRA or
to another qualified plan] are subject to federal income tax withholding,
unless you elect not to have withholding apply. Tax will be withheld on the
total amount withdrawn even though you may be receiving amounts that are not
subject to withholding, such as nondeductible contributions. In such case,
excess amounts of withholding could occur. You may adjust your withholding
election so that a greater or lesser amount will be withheld.
If you don't want us to withhold on this amount, you must notify us to not
withhold the federal income tax. Even if you plan to roll over the amount you
withdraw to another tax-deferred account, the withholding rate still applies
to the withdrawn amount unless we have received notice not to withhold federal
income tax prior to the withdrawal. You may notify us in writing or in certain
situations by telephone or through other electronic means. You have the right
to revoke your withholding election at any time and any election you make may
remain in effect until revoked by filing a new election.
Remember, even if you elect not to have income tax withheld, you are liable
for paying income tax on the taxable portion of your withdrawal. If you elect
not to have income tax withheld or you don't have enough income tax withheld,
you may be responsible for payment of estimated tax. You may incur penalties
under the estimated tax rules if your withholding and estimated tax payments
are not sufficient.
State tax will be withheld if, at the time of your distribution, your address
is within one of the mandatory withholding states and you have federal income
tax withheld. State taxes will be withheld from your distribution in
accordance with the respective state rules.
PROXY VOTING GUIDELINES
American Century Investment Management, Inc., the fund's investment advisor,
is responsible for exercising the voting rights associated with the securities
purchased and/or held by the fund. A description of the policies and
procedures the advisor uses in fulfilling this responsibility is available
without charge, upon request, by calling 1-800-345-2021. It is also available
on American Century's website at americancentury.com and on the Securities and
Exchange Commission's website at sec.gov. Information regarding how the
investment advisor voted proxies relating to portfolio securities during the
most recent 12-month period ended June 30 is available on the "About Us" page
at americancentury.com. It is also available at sec.gov.
QUARTERLY PORTFOLIO DISCLOSURE
The fund files its complete schedule of portfolio holdings with the Securities
and Exchange Commission (SEC) for the first and third quarters of each fiscal
year on Form N-Q. The fund's Form N-Q is available on the SEC's website at
sec.gov, and may be reviewed and copied at the SEC's Public Reference Room in
Washington, DC. Information on the operation of the Public Reference Room may
be obtained by calling 1-800-SEC-0330. The fund also makes its complete
schedule of portfolio holdings for the most recent quarter of its fiscal year
available on its website at americancentury.com and, upon request, by calling
1-800-345-2021.
- ------
32
INDEX DEFINITIONS
The following indices are used to illustrate investment market, sector, or
style performance or to serve as fund performance comparisons. They are not
investment products available for purchase.
The CITIGROUP AGENCY INDEX is a market-capitalization-weighted index that
includes U.S. government sponsored agencies with a remaining maturity of at
least one year.
The CITIGROUP CREDIT INDEX includes US and non-US corporate securities and
non-US sovereign and provincial securities.
The CITIGROUP MORTGAGE INDEX measures the mortgage component of the US BIG
Index, comprising 30-and 15-year GNMA, FNMA, and FHLMC pass-throughs and FNMA
and FHLMC balloon mortgages.
The CITIGROUP TREASURY INDEX is comprised of U.S. Treasury securities with an
amount outstanding of at least $5 billion and a remaining maturity of at least
one year.
The CITIGROUP US BROAD INVESTMENT-GRADE (BIG) BOND INDEX is a market-
capitalization-weighted index that includes fixed-rate Treasury, government-
sponsored, mortgage, asset-backed, and investment-grade issues with a maturity
of one year or longer.
The CITIGROUP US HIGH-YIELD MARKET INDEX captures the performance of
below-investment-grade debt issued by corporations domiciled in the United
States or Canada. This index includes cash-pay and deferred-interest
securities that are publicly placed, have a fixed coupon, and are
nonconvertible.
The CITIGROUP US INFLATION-LINKED SECURITIES INDEX (ILSI) measures the return
of bonds with fixed-rate coupon payments that adjust for inflation as measured
by the Consumer Price Index (CPI).
- ------
33
NOTES
- ------
34
NOTES
- ------
35
NOTES
- ------
36
[back cover]
CONTACT US
AMERICANCENTURY.COM
AUTOMATED INFORMATION LINE:
1-800-345-8765
INVESTOR SERVICES REPRESENTATIVE:
1-800-345-2021 or 816-531-5575
BUSINESS, NOT-FOR-PROFIT,
EMPLOYER-SPONSORED RETIREMENT PLANS:
1-800-345-3533
BANKS AND TRUST COMPANIES, BROKER-DEALERS,
FINANCIAL PROFESSIONALS, INSURANCE COMPANIES:
1-800-345-6488
TELECOMMUNICATIONS DEVICE FOR THE DEAF:
1-800-634-4113 or 816-444-3485
AMERICAN CENTURY INVESTMENT TRUST
INVESTMENT ADVISOR:
American Century Investment Management, Inc.
Kansas City, Missouri
THIS REPORT AND THE STATEMENTS IT CONTAINS ARE SUBMITTED FOR THE GENERAL
INFORMATION OF OUR SHAREHOLDERS. THE REPORT IS NOT AUTHORIZED FOR DISTRIBUTION
TO PROSPECTIVE INVESTORS UNLESS PRECEDED OR ACCOMPANIED BY AN EFFECTIVE
PROSPECTUS.
American Century Investment Services, Inc., Distributor
©2007 American Century Proprietary Holdings, Inc. All rights reserved.
The American Century Investments logo, American Century and American Century
Investments are service marks of American Century Proprietary Holdings, Inc.
0711
SH-SAN-56808N
[front cover]
AMERICAN CENTURY INVESTMENTS
Semiannual Report September 30, 2007
[photo of autumn trees]
Short Duration Fund
Core Plus Fund
[american century investments logo and text logo]
OUR MESSAGE TO YOU
To help you monitor your investment, my colleagues and I take pride in
providing you with the semiannual report for the American Century® Short
Duration and Core Plus funds for the six months ended September 30, 2007. This
has been an eventful and exciting period for us. We've been working diligently
to secure a smooth executive leadership transition.
I'm honored to be addressing you in the "Our Message" space long devoted to
company founder Jim Stowers, Jr. and his son Jim Stowers III. The Stowers
family remains an integral part of our heritage, leadership, and financial
structure. Jim Jr. continues as co-chair of the American Century Companies,
Inc. (ACC) board of directors with Richard Brown, who has been on the board
since 1998 and co-chairs the Stowers Institute for Medical Research board.
But times and opportunities change. As the latest step in a career transition
that began when he relinquished his executive leadership and investment
management responsibilities in early 2005, Jim III stepped down from the ACC
board in July 2007 to focus on new business ventures. Jim III's move reflects
his family's comfort with our direction and leadership, and gives the Stowers
more leeway to devote time and energy to other important priorities, such as
the Stowers Institute for Medical Research.
Meanwhile, American Century Investments, our clients, and our employees have
been my top priority since I became company president and CEO in March. We've
also added the executive talents of overall chief investment officer Enrique
Chang, international equity CIO Mark On, U.S. growth equity CIO Steve Lurito,
and chief operating officer Barry Fink.
This skilled group, combined with our existing senior management team, has
already had a positive impact on the development and management of the
products and services we take pride in delivering to you.
/s/Jonathan Thomas
Jonathan Thomas
[photo of Jonathan Thomas]
Jonathan Thomas
PRESIDENT AMERICAN CENTURY COMPANIES, INC.
[photo of James E. Stowers, Jr.]
James E. Stowers, Jr.
FOUNDER AND CO-CHAIRMAN OF THE BOARD AMERICAN CENTURY COMPANIES, INC.
[photo of Richard Brown]
Richard Brown
CO-CHAIRMAN OF THE BOARD AMERICAN CENTURY COMPANIES, INC.
TABLE OF CONTENTS
Market Perspective. . . . . . . . . . . . . . . . . . . . . . . . . . 2
U.S. Fixed-Income Total Returns. . . . . . . . . . . . . . . . . . . 2
SHORT DURATION
Performance . . . . . . . . . . . . . . . . . . . . . . . . . . . . . 3
Portfolio Commentary. . . . . . . . . . . . . . . . . . . . . . . . . 5
Portfolio at a Glance. . . . . . . . . . . . . . . . . . . . . . . . 5
Yields . . . . . . . . . . . . . . . . . . . . . . . . . . . . . . . 5
Types of Investments in Portfolio. . . . . . . . . . . . . . . . . . 6
Schedule of Investments . . . . . . . . . . . . . . . . . . . . . . . 7
CORE PLUS
Performance . . . . . . . . . . . . . . . . . . . . . . . . . . . . . 10
Portfolio Commentary. . . . . . . . . . . . . . . . . . . . . . . . . 12
Portfolio at a Glance. . . . . . . . . . . . . . . . . . . . . . . . 12
Yields . . . . . . . . . . . . . . . . . . . . . . . . . . . . . . . 12
Types of Investments in Portfolio. . . . . . . . . . . . . . . . . . 13
Portfolio Composition by Credit Rating . . . . . . . . . . . . . . . 13
Schedule of Investments . . . . . . . . . . . . . . . . . . . . . . . 14
Shareholder Fee Examples. . . . . . . . . . . . . . . . . . . . . . . 20
FINANCIAL STATEMENTS
Statement of Assets and Liabilities . . . . . . . . . . . . . . . . . 22
Statement of Operations . . . . . . . . . . . . . . . . . . . . . . . 24
Statement of Changes in Net Assets. . . . . . . . . . . . . . . . . . 25
Notes to Financial Statements . . . . . . . . . . . . . . . . . . . . 26
Financial Highlights. . . . . . . . . . . . . . . . . . . . . . . . . 32
OTHER INFORMATION
Proxy Voting Results. . . . . . . . . . . . . . . . . . . . . . . . . 44
Share Class Information . . . . . . . . . . . . . . . . . . . . . . . 45
Additional Information. . . . . . . . . . . . . . . . . . . . . . . . 47
Index Definitions . . . . . . . . . . . . . . . . . . . . . . . . . . 48
The opinions expressed in the Market Perspective and each of the Portfolio
Commentaries reflect those of the portfolio management team as of the date of
the report, and do not necessarily represent the opinions of American Century
or any other person in the American Century organization. Any such opinions
are subject to change at any time based upon market or other conditions and
American Century disclaims any responsibility to update such opinions. These
opinions may not be relied upon as investment advice and, because investment
decisions made by American Century funds are based on numerous factors, may
not be relied upon as an indication of trading intent on behalf of any
American Century fund. Security examples are used for representational
purposes only and are not intended as recommendations to purchase or sell
securities. Performance information for comparative indices and securities is
provided to American Century by third party vendors. To the best of American
Century's knowledge, such information is accurate at the time of printing.
MARKET PERSPECTIVE
[photo of chief investment officer]
By Dave MacEwen, Chief Investment Officer, Fixed Income
MODEST GROWTH, INFLATION, BOND RETURNS
U.S. bonds managed positive returns during the six months ended September 30,
2007. But the ride was bumpy -- bond market volatility surged to the highest
level in years as waves from the bursting housing and subprime mortgage
bubbles spread to the broader economy and financial markets.
U.S. economic growth was moderate over the last four complete calendar
quarters, running at an approximately 2-3% average annual rate. Many
economists are calling for sub-2% growth going forward. Inflation slowed, as
the trailing 12-month percentage change in core consumer prices (without
volatile food and energy prices) finished September at 2.1%. That's down from
2.9% as recently as September 2006.
To help alleviate some of the market and economic concerns, the Federal
Reserve (the Fed) lowered its benchmark federal funds rate target in
September. This came on top of cuts to its discount rate in both August and
September -- the Fed's first rate cuts since June 2003.
RATES FELL, CURVE STEEPENED
Against that backdrop, Treasury yields generally declined. The yield on the
two-year Treasury note fell from 4.58% to 3.99%; however, yields on
longer-term notes and bonds fell less. That's because investors worried about
the potential long-term inflation effects of Fed rate cuts, high energy and
commodity prices, and a weaker dollar. As a result, the yield curve (a graphic
representation of bond yields at different maturities) fell and steepened --
the difference in yield between two- and 10-year Treasury securities increased
sharply from seven to 60 basis points (a basis point equals 0.01%).
HIGH-QUALITY BONDS DID BEST
The volatility, credit, and liquidity concerns in the market all favored
Treasury securities over higher-yielding, lower-quality alternatives (see the
returns table above). So, for example, while the Treasury market enjoyed its
best quarter in five years from July to September, July was one of the worst
months on record for high-yield bonds. Treasury inflation-indexed securities
performed best because of their combination of high credit quality and
inflation protection.
U.S. Fixed-Income Total Returns
For the six months ended September 30, 2007*
TREASURY SECURITIES
3-Month Bill 2.69%
2-Year Note 3.25%
5-Year Note 3.60%
10-Year Note 2.72%
30-Year Bond 2.57%
CITIGROUP US BOND MARKET INDICES
High-Yield (corporate) 0.65%
Credit (investment-grade corporate) 1.50%
Mortgage 2.16%
Broad Investment-Grade (multi-sector) 2.42%
Agency 3.04%
Treasury 3.38%
Inflation-Linked Securities 3.76%
*Total returns for periods less than one year are not annualized.
- ------
2
PERFORMANCE
Short Duration
Total Returns as of September 30, 2007
Average Annual
Returns
-------------
6 Inception
months(1) Since Inception(1) Date
INVESTOR CLASS 2.59% 4.09% 11/30/06
CITIGROUP GOVERNMENT/CORPORATE 1-
TO 3-YEAR INDEX 3.14% 4.66% --
Institutional Class 2.70% 4.26% 11/30/06
A Class
No sales charge* 2.47% 3.88%
With sales charge* 0.16% 1.54% 11/30/06
B Class
No sales charge* 2.08% 3.23%
With sales charge* -2.92% -1.77% 11/30/06
C Class
No sales charge* 2.09% 3.24%
With sales charge* 1.09% 2.24% 11/30/06
R Class 2.34% 3.66% 11/30/06
*Sales charges include initial sales charges and contingent deferred sales
charges (CDSCs), as applicable. A Class shares have a 2.25% maximum initial
sales charge and may be subject to a maximum CDSC of 1.00%. B Class shares
redeemed within six years of purchase are subject to a CDSC that declines from
5.00% during the first year after purchase to 0.00% the sixth year after
purchase. C Class shares redeemed within 12 months of purchase are subject to
a maximum CDSC of 1.00%. Please see the Share Class Information pages for more
about the applicable sales charges for each share class. The SEC requires that
mutual funds provide performance information net of maximum sales charges in
all cases where charges could be applied.
(1) Total returns for periods less than one year are not annualized.
Data presented reflect past performance. Past performance is no guarantee of
future results. Current performance may be higher or lower than the
performance shown. Investment return and principal value will fluctuate, and
redemption value may be more or less than original cost. To obtain performance
data current to the most recent month end, please call 1-800-345-2021 or visit
americancentury.com. As interest rates rise, bond values will decline.
International investing involves special risks, such as political instability
and currency fluctuations. Investing in emerging markets may accentuate these
risks.
Unless otherwise indicated, performance reflects Investor Class shares;
performance for other share classes will vary due to differences in fee
structure. For information about other share classes available, please consult
the prospectus. Data assumes reinvestment of dividends and capital gains, and
none of the charts reflect the deduction of taxes that a shareholder would pay
on fund distributions or the redemption of fund shares. Returns for the index
are provided for comparison. The fund's total returns include operating
expenses (such as transaction costs and management fees) that reduce returns,
while the total returns of the index do not.
- ------
3
Short Duration
Growth of $10,000 Over Life of Class
$10,000 investment made November 30, 2006
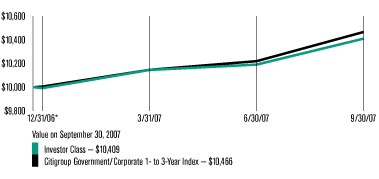
*From 11/30/06, the Investor Class's inception date. Not annualized.
Data presented reflect past performance. Past performance is no guarantee of
future results. Current performance may be higher or lower than the
performance shown. Investment return and principal value will fluctuate, and
redemption value may be more or less than original cost. To obtain performance
data current to the most recent month end, please call 1-800-345-2021 or visit
americancentury.com. As interest rates rise, bond values will decline.
International investing involves special risks, such as political instability
and currency fluctuations. Investing in emerging markets may accentuate these
risks.
Unless otherwise indicated, performance reflects Investor Class shares;
performance for other share classes will vary due to differences in fee
structure. For information about other share classes available, please consult
the prospectus. Data assumes reinvestment of dividends and capital gains, and
none of the charts reflect the deduction of taxes that a shareholder would pay
on fund distributions or the redemption of fund shares. Returns for the index
are provided for comparison. The fund's total returns include operating
expenses (such as transaction costs and management fees) that reduce returns,
while the total returns of the index do not.
- ------
4
PORTFOLIO COMMENTARY
Short Duration
Lead Portfolio Managers: Hando Aguilar, Jeff Houston, Brian Howell, Michael
Difley, Dan Shiffman, John Walsh, Jim Platz, Seth Plunkett
Macro Strategy Team Representatives: Dave MacEwen, Bob Gahagan, Jim Keegan
PERFORMANCE SUMMARY
Short Duration returned 2.59%* for the six months ended September 30, 2007. By
comparison, the fund's benchmark, the Citigroup Government/Corporate 1- to
3-Year Index, rose 3.14%. Portfolio returns reflect operating expenses, while
the index returns do not.
It's also worth pointing out that Short Duration outperformed the 1.76%**
average return of the 264 short investment-grade debt funds tracked by Lipper
Inc. The portfolio has also outperformed since its November 30, 2006
inception.
The portfolio's absolute return reflected the challenging climate for bonds
prevailing in recent months (see the Market Perspective on page 2). Relative
to the benchmark, Short Duration underperformed because we hold an overweight
position in higher-yielding spread product -- such as mortgage-backed
securities (MBS) and collateralized mortgage obligations (CMOs) -- which
trailed government bonds; our credit, curve, and currency allocations helped
relative results.
CURVE POSITIONING WAS KEY
Our yield-curve positioning was a key contributor to the portfolio's
performance relative to the benchmark, as we maintained a yield
curve-steepening bias during the period using two- and five-year Treasury
futures. This trade helped relative results as the yield curve steepened
overall, particularly in August. For the six months, the yield difference
between two- and five-year Treasurys went from -4 basis points (the yield
curve was negatively sloped) to +26 basis points (a more normal, positive
slope). This curve-steepening bias is a strategy we expect to carry forward,
given our view of the economy, interest rates, and shape of the curve.
* All fund returns referenced in this commentary are for Investor Class
shares. Total returns for periods less than one year are not annualized.
**The Lipper Short Investment Grade Debt Funds average return since the fund's
inception was 3.21%.
Data provided by Lipper Inc. - A Reuters Company. © 2007 Reuters. All rights
reserved. Any copying, republication or redistribution of Lipper content,
including by caching, framing or similar means, is expressly prohibited
without the prior written consent of Lipper. Lipper shall not be liable for
any errors or delays in the content, or for any actions taken in reliance
thereon.
Lipper Fund Performance -- Performance data is total return, and is
preliminary and subject to revision.
The data contained herein has been obtained from company reports, financial
reporting services, periodicals and other resources believed to be reliable.
Although carefully verified, data on compilations is not guaranteed by Lipper
and may be incomplete. No offer or solicitations to buy or sell any of the
securities herein is being made by Lipper.
Portfolio at a Glance
As of As of
9/30/07 3/31/07
Average Duration
(effective) 1.6 years 1.8 years
Average Life 2.2 years 2.5 years
Yields as of September 30, 2007
30-day SEC Yield
Investor Class 4.39%
Institutional Class 4.59%
A Class 4.04%
B Class 3.39%
C Class 3.39%
R Class 3.89%
- ------
5
Short Duration
SECURITY SELECTION CONTRIBUTED
Our security selection also contributed to relative results. For example, we
used a small slice of the portfolio to gain Japanese yen exposure, a trade we
put on when the yen was at a 41/2 -year low against the dollar early in 2007.
Though currency values have been volatile, the yen appreciated against the
dollar overall for the six-month period.
In addition, we avoided the worst performers during the credit and liquidity
crunch that peaked in July and August. Among MBS, we had essentially no
sub-prime exposure. And when you look across all the non-Treasury sectors, we
tended to avoid the least-liquid off-the-run bonds, which typically performed
worse than more easily bought and sold on-the-run securities.
SECTOR ALLOCATION MIXED
Compared with the Citigroup index, Short Duration underperformed because we
held an overweight position in higher-yielding MBS and CMOs at a time when
these securities trailed government bonds. However, compared with the peer
group, we believe it is this overweight position and corresponding underweight
in corporate securities that helps explain Short Duration's outperformance.
OUTLOOK
"We will continue to focus on identifying the best relative values across the
U.S. taxable fixed-income securities universe. We think our track record
versus our competition validates this steady, long-term approach to
investing," said Macro Strategy Team representative Bob Gahagan.
"We see a difficult path for the economy as a result of headwinds from
housing, the consumer, and higher energy prices," Gahagan continued. "The
economic, market, and interest rate environment also argue for the
continuation of our curve-steepening trade and yen overweight position. In
terms of sector allocations, our caution about the economy means we'll
continue to underweight credit-sensitive corporate bonds and overweight
Treasury and government agency securities. In addition, we think the
environment for inflation-indexed securities could be positive going forward.
On top of some positive fundamentals, inflation-indexed bonds are benefiting
from demand from investors who think the Federal Reserve will err on the side
of fighting recession, rather than inflation."
Types of Investments in Portfolio
% of fund % of fund
investments investments
as of as of
9/30/07 3/31/07
Collateralized Mortgage Obligations 35.2% 57.1%
U.S. Treasury Securities 21.9% 5.7%
U.S. Government Agency Securities 6.4% 11.8%
Mortgage-Backed Securities 4.3% 11.9%
Asset-Backed Securities 1.7% 4.4%
Sovereign Governments & Agencies 0.6% 1.0%
Corporate Bonds 0.6% --
Temporary Cash Investments 6.8% 1.8%
Temporary Cash Investments --
Securities Lending Collateral 22.5% 6.3%
- ------
6
SCHEDULE OF INVESTMENTS
Short Duration
SEPTEMBER 30, 2007 (UNAUDITED)
Principal Amount Value
Collateralized Mortgage Obligations(1) -- 45.8%
$ 300,000 Banc of America Commercial Mortgage Inc., Series
2000-2, Class B, 7.38%, 9/15/32(2) $ 317,604
150,000 Banc of America Commercial Mortgage Inc., Series
2002 PB2, Class A3 SEQ, 6.09%, 6/11/35 152,194
300,000 Banc of America Commercial Mortgage Inc., Series
2002 PB2, Class B SEQ, 6.31%, 6/11/35(2) 313,420
350,000 Banc of America Commercial Mortgage Inc., Series
2004-2, Class A3 SEQ, 4.05%, 11/10/38(2) 341,959
1,294,297 Bear Stearns Commercial Mortgage Securities Trust
STRIPS - COUPON, Series 2004 T16, Class X2, VRN,
0.75%, 10/1/07 36,410
300,000 Chase Commercial Mortgage Securities Corp., Series
2000-2, Class C, 7.93%, 7/15/32(2) 322,066
1,148,763 Commercial Mortgage Acceptance Corp. STRIPS -
COUPON, Series 1998 C2, Class X, VRN, 0.98%, 10/1/07 22,665
139,000 Credit Suisse First Boston Mortgage Securities
Corp., Series 2000 C1, Class B, VRN, 7.56%, 10/11/07 148,528
198,657 Credit Suisse First Boston Mortgage Securities
Corp., Series 2003 AR28, Class 2A1, 4.41%,
12/25/33(2) 199,958
180,604 FHLMC, Series 2522, Class XA SEQ, 5.00%, 8/15/16 180,506
160,050 FHLMC, Series 2632, Class TE, 2.50%, 6/15/22 158,838
168,928 FHLMC, Series 2750, Class WD SEQ, 4.50%, 9/15/15 167,920
174,040 FHLMC, Series 2763, Class PB, 4.50%, 6/15/14 173,407
250,000 FNMA, Series 2003-54, Class TC, 4.50%, 5/25/15(2) 247,567
164,898 FNMA, Series 2004-9, Class YJ, 4.00%, 10/25/13 163,659
196,485 FNMA, Series 2005-47, Class AN SEQ, 5.00%,
12/25/16(2) 195,976
278,463 FNMA, Series 2006-4, Class A SEQ, 6.00%, 11/25/22(2) 284,218
325,251 LB-UBS Commercial Mortgage Trust, Series 2005 C2,
Class A2 SEQ, 4.82%, 4/15/30(2) 324,123
Principal Amount Value
$ 250,000 LB-UBS Commercial Mortgage Trust, Series 2005 C3,
Class A3 SEQ, 4.65%, 7/30/30(2) $ 245,562
300,000 Lehman Brothers Commercial Conduit Mortgage Trust,
Series 1998 C1, Class C, 6.68%, 2/18/30(2) 300,169
200,000 Lehman Brothers Commercial Conduit Mortgage Trust,
Series 1999 C1, Class B, 6.93%, 6/15/31(2) 205,503
250,000 Merrill Lynch Mortgage Trust, Series 2006 C1, Class
A2, VRN, 5.61%, 10/1/07(2) 254,173
200,000 Morgan Stanley Capital I, Series 2004 HQ3, Class A2
SEQ, 4.05%, 1/13/41(2) 196,472
137,511 Washington Mutual Mortgage Pass-Through
Certificates, Series 2003 AR9, Class 1A4, 3.70%,
4/15/08 136,005
245,000 Washington Mutual Mortgage Pass-Through
Certificates, Series 2004 AR4, Class A6, 3.81%,
6/25/34(2) 239,684
195,000 Washington Mutual Mortgage Pass-Through
Certificates, Series 2004 AR9, Class A7, VRN,
4.14%, 10/1/07(2) 191,965
350,000 Washington Mutual Mortgage Pass-Through
Certificates, Series 2005 AR4, Class A3, 4.59%,
4/25/35(2) 345,821
200,000 Washington Mutual Mortgage Pass-Through
Certificates, Series 2005 AR4, Class A4B, 4.68%,
4/25/35(2) 197,946
147,341 Wells Fargo Mortgage Backed Securities Trust,
Series 2007-11, Class A19 SEQ, 6.00%, 8/25/37 147,988
-----------
TOTAL COLLATERALIZED MORTGAGE OBLIGATIONS
(Cost $6,175,325) 6,212,306
-----------
U.S. Treasury Securities -- 28.4%
200,000 U.S. Treasury Notes, 4.875%, 1/31/09(2)(3) 202,359
1,600,000 U.S. Treasury Notes, 3.50%, 8/15/09(2)(3) 1,587,259
106,000 U.S. Treasury Notes, 4.75%, 2/15/10(3) 107,838
1,300,000 U.S. Treasury Notes, 4.50%, 5/15/10(2)(3) 1,316,759
- ------
7
Short Duration
Principal Amount Value
$ 130,000 U.S. Treasury Notes, 4.50%, 4/30/12(3) $ 131,635
500,000 U.S. Treasury Notes, 4.875%, 6/30/12(2)(3) 514,141
-----------
TOTAL U.S. TREASURY SECURITIES
(Cost $3,827,350) 3,859,991
-----------
U.S. Government Agency Securities -- 8.3%
160,000 FHLMC, 5.00%, 6/11/09 161,536
250,000 FHLMC, 4.75%, 11/3/09(2) 251,863
685,000 FNMA, 6.625%, 9/15/09(2) 713,645
-----------
TOTAL U.S. GOVERNMENT AGENCY SECURITIES
(Cost $1,118,492) 1,127,044
-----------
U.S. Government Agency Mortgage-Backed Securities(1) -- 5.6%
366,004 FHLMC, 5.00%, 10/1/10(2) 365,522
402,130 FNMA, 5.00%, 7/1/20(2) 394,341
-----------
TOTAL U.S. GOVERNMENT AGENCY MORTGAGE-BACKED SECURITIES
(Cost $761,396) 759,863
-----------
Asset-Backed Securities(1) -- 2.2%
151,558 FHLMC, Series T7, Class A5 SEQ, 7.27%, 8/25/28 151,094
155,088 First Franklin Mortgage Loan Asset Backed
Certificates, Series 2006 FF11, Class 2A1, VRN,
5.17%, 10/25/07, resets monthly off the 1-month
LIBOR plus 0.04% with no caps 153,570
-----------
TOTAL ASSET-BACKED SECURITIES
(Cost $305,915) 304,664
-----------
Sovereign Governments & Agencies -- 0.8%
JPY KfW, VRN, 0.60%, 11/8/07, resets quarterly off the
12,000,000 3-month JPY LIBOR minus 0.22% with no caps 104,610
(Cost $98,692)
-----------
Principal Amount Value
Corporate Bonds -- 0.7%
FOOD PRODUCTS -- 0.7%
$ 100,000 General Mills Inc., 5.65%, 9/10/12 $ 100,998
(Cost $100,292)
-----------
Temporary Cash Investments -- 8.9%
527,000 FHLB Discount Notes, 4.00%, 10/1/07(2)(4) 527,000
Repurchase Agreement, Merrill Lynch & Co., Inc., (collateralized by
various U.S. Treasury obligations, 2.375%, 4/15/11, valued at
$692,936), in a joint trading account at 3.75%, dated 9/28/07, due
10/1/07 (Delivery value $678,212)(2) 678,000
-----------
TOTAL TEMPORARY CASH INVESTMENTS
(Cost $1,205,000) 1,205,000
-----------
Temporary Cash Investments -- Securities Lending Collateral(5) -- 29.1%
Repurchase Agreement, Lehman Brothers, Inc., (collateralized by
various U.S. Government Agency obligations in a pooled account at
the lending agent), 5.15%, dated 9/28/07, due 10/1/07 (Delivery
value $3,863,673) 3,862,016
98,977 Silver Tower U.S. Funding, LLC, 5.39%, 10/10/07 98,977
-----------
TOTAL TEMPORARY CASH INVESTMENTS -- SECURITIES LENDING COLLATERAL
(Cost $3,960,993) 3,960,993
-----------
TOTAL INVESTMENT SECURITIES -- 129.8%
(Cost $17,553,455) 17,635,469
-----------
OTHER ASSETS AND LIABILITIES -- (29.8)% (4,045,875)
-----------
TOTAL NET ASSETS -- 100.0% $13,589,594
===========
- ------
8
Short Duration
Futures Contracts
Contracts Purchased Expiration Underlying Face Unrealized Gain
Date Amount at Value (Loss)
32 U.S. Treasury
2-Year Notes December 2007 $ 6,625,500 $ 34,740
=========== ===========
Contracts Sold Expiration Underlying Face Unrealized Gain
Date Amount at Value (Loss)
23 U.S. Treasury
5-Year Notes December 2007 $ 2,461,719 $ (28,443)
8 U.S. Treasury
10-Year Notes December 2007 874,250 (13,354)
----------- -----------
$ 3,335,969 $ (41,797)
=========== ===========
Swap Agreements
Notional Description of Agreement Expiration Unrealized
Amount Date Gain (Loss)
CREDIT DEFAULT
$200,000 Pay quarterly a fixed rate equal to June 2012 $ (1,091)
0.55% multiplied by the notional amount
and receive from Barclays Bank plc upon
each default event of Darden
Restaurants, Inc., par value of the
proportional notional amount.
450,000 Pay semiannually a fixed rate equal to June 2012 1,091
1.25% multiplied by the notional amount
and receive from Barclays Bank plc upon
each default event of one of the issues
of Dow Jones CDX Emerging Markets 7,
par value of the proportional notional
amount.
100,000 Pay quarterly a fixed rate equal to September (73)
0.35% multiplied by the notional amount 2012
and receive from Merrill Lynch
International upon each default event
of Computer Sciences Corp., par value
of the proportional notional amount.
40,000 Pay quarterly a fixed rate equal to September 8
0.36% multiplied by the notional amount 2012
and receive from Barclays Bank plc upon
each default event of Whirlpool Corp.,
par value of the proportional notional
amount.
200,000 Pay quarterly a fixed rate equal to September (2,341)
0.69% multiplied by the notional amount 2017
and receive from Barclays Bank plc upon
each default event of JPMorgan Chase &
Co., par value of the proportional
notional amount.
----------
$ (2,406)
==========
Notes to Schedule of Investments
CDX = Credit Derivative Indexes
FHLB = Federal Home Loan Bank
FHLMC = Federal Home Loan Mortgage Corporation
FNMA = Federal National Mortgage Association
JPY = Japanese Yen
LB-UBS = Lehman Brothers Inc. - UBS AG
LIBOR = London Interbank Offered Rate
resets = The frequency with which a security's coupon changes, based on
current market conditions or an underlying index. The more frequently a
security resets, the less risk the investor is taking that the coupon will
vary significantly from current market rates.
SEQ = Sequential Payer
STRIPS = Separate Trading of Registered Interest and Principal of Securities
VRN = Variable Rate Note. Interest reset date is indicated. Rate shown is
effective September 30, 2007.
(1) Final maturity indicated, unless otherwise noted.
(2) Security, or a portion thereof, has been segregated for futures contracts
and/or swap agreements.
(3) Security, or a portion thereof, was on loan as of September 30, 2007.
(4) The rate indicated is the yield to maturity at purchase.
(5) Investments represent purchases made by the lending agent with cash
collateral received through securities lending transactions.
See Notes to Financial Statements.
- ------
9
PERFORMANCE
Core Plus
Total Returns as of September 30, 2007
Average Annual
Returns
6 months(1) Since Inception(1) Inception
Date
INVESTOR CLASS 2.45% 3.51% 11/30/06
CITIGROUP US BROAD
INVESTMENT-GRADE BOND INDEX 2.42% 3.33% --
Institutional Class 2.55% 3.68% 11/30/06
A Class
No sales charge* 2.32% 3.30%
With sales charge* -2.29% -1.34% 11/30/06
B Class
No sales charge* 1.94% 2.66%
With sales charge* -3.06% -2.34% 11/30/06
C Class
No sales charge* 1.94% 2.66%
With sales charge* 0.94% 1.67% 11/30/06
R Class 2.19% 3.09% 11/30/06
*Sales charges include initial sales charges and contingent deferred sales
charges (CDSCs), as applicable. A Class shares have a 4.50% maximum initial
sales charge and may be subject to a maximum CDSC of 1.00%. B Class shares
redeemed within six years of purchase are subject to a CDSC that declines from
5.00% during the first year after purchase to 0.00% the sixth year after
purchase. C Class shares redeemed within 12 months of purchase are subject to
a maximum CDSC of 1.00%. Please see the Share Class Information pages for more
about the applicable sales charges for each share class. The SEC requires that
mutual funds provide performance information net of maximum sales charges in
all cases where charges could be applied.
(1) Total returns for periods less than one year are not annualized.
Data presented reflect past performance. Past performance is no guarantee of
future results. Current performance may be higher or lower than the
performance shown. Investment return and principal value will fluctuate, and
redemption value may be more or less than original cost. To obtain performance
data current to the most recent month end, please call 1-800-345-2021 or visit
americancentury.com. As interest rates rise, bond values will decline.
International investing involves special risks, such as political instability
and currency fluctuations. Investing in emerging markets may accentuate these
risks.
Unless otherwise indicated, performance reflects Investor Class shares;
performance for other share classes will vary due to differences in fee
structure. For information about other share classes available, please consult
the prospectus. Data assumes reinvestment of dividends and capital gains, and
none of the charts reflect the deduction of taxes that a shareholder would pay
on fund distributions or the redemption of fund shares. Returns for the index
are provided for comparison. The fund's total returns include operating
expenses (such as transaction costs and management fees) that reduce returns,
while the total returns of the index do not.
- ------
10
Core Plus
Growth of $10,000 Over Life of Class
$10,000 investment made November 30, 2006
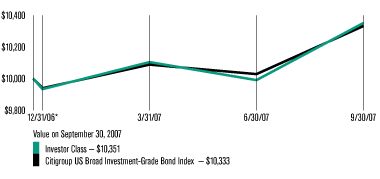
*From 11/30/06, the Investor Class's inception date. Not annualized.
Data presented reflect past performance. Past performance is no guarantee of
future results. Current performance may be higher or lower than the
performance shown. Investment return and principal value will fluctuate, and
redemption value may be more or less than original cost. To obtain performance
data current to the most recent month end, please call 1-800-345-2021 or visit
americancentury.com. As interest rates rise, bond values will decline.
International investing involves special risks, such as political instability
and currency fluctuations. Investing in emerging markets may accentuate these
risks.
Unless otherwise indicated, performance reflects Investor Class shares;
performance for other share classes will vary due to differences in fee
structure. For information about other share classes available, please consult
the prospectus. Data assumes reinvestment of dividends and capital gains, and
none of the charts reflect the deduction of taxes that a shareholder would pay
on fund distributions or the redemption of fund shares. Returns for the index
are provided for comparison. The fund's total returns include operating
expenses (such as transaction costs and management fees) that reduce returns,
while the total returns of the index do not.
- ------
11
PORTFOLIO COMMENTARY
Core Plus
Lead Portfolio Managers: Hando Aguilar, Jeff Houston, Brian Howell, Michael
Difley, Dan Shiffman, John Walsh, Jim Platz, Seth Plunkett
Macro Strategy Team Representatives: Dave MacEwen, Bob Gahagan, Jim Keegan
PERFORMANCE SUMMARY
Core Plus returned 2.45%* for the six months ended September 30, 2007, in line
with the 2.42% return of its benchmark, the Citigroup US Broad
Investment-Grade (BIG) Bond Index. Portfolio returns reflect operating
expenses, while the index returns do not.
It's also worth pointing out that Core Plus outperformed the 1.39%** average
return of the 566 intermediate investment-grade debt funds tracked by Lipper
Inc. The portfolio has also outperformed since its November 30, 2006
inception.
The portfolio's absolute return reflected the challenging climate for bonds
prevailing in recent months (see the Market Perspective on page 2). Relative
to the benchmark, Core Plus' performance benefited from some of our credit,
yield curve, sector, and currency allocation decisions.
CURVE POSITIONING WAS KEY
Our yield-curve positioning was a key factor explaining the portfolio's solid
performance relative to the benchmark, as we maintained a yield
curve-steepening bias during the period using two- and 10-year Treasury
futures. This trade helped relative results as the yield curve steepened
overall, particularly in August. For the six months, the yield difference
between two- and 10-year Treasurys went from seven to 60 basis points. This
curve-steepening bias is a strategy we expect to carry forward, given our view
of the economy, interest rates, and shape of the curve.
SECTOR AND SECURITY SELECTION CONTRIBUTED
For some time now we've believed that investors have not been adequately
compensated for credit or volatility risks--risk premiums, expressed in terms
of yield, seemed too low. As a result, we maintained an overweight position in
the securitized sector and an underweight position in the corporate sector
relative to the Citigroup BIG Index. These trades contributed to return in the
last six months as mortgages outperformed corporates.
* All fund returns referenced in this commentary are for Investor Class
shares. Total returns for periods less than one year are not annualized.
**The Lipper Intermediate Investment Grade Debt Funds average return since the
fund's inception was 2.36%.
Data provided by Lipper Inc. -- A Reuters Company. © 2007 Reuters. All
rights reserved. Any copying, republication or redistribution of Lipper
content, including by caching, framing or similar means, is expressly
prohibited without the prior written consent of Lipper. Lipper shall not be
liable for any errors or delays in the content, or for any actions taken in
reliance thereon.
Lipper Fund Performance -- Performance data is total return, and is
preliminary and subject to revision.
The data contained herein has been obtained from company reports, financial
reporting services, periodicals and other resources believed to be reliable.
Although carefully verified, data on compilations is not guaranteed by Lipper
and may be incomplete. No offer or solicitations to buy or sell any of the
securities herein is being made by Lipper.
Portfolio at a Glance
As of 9/30/07 As of 3/31/07
Average Duration 5.0 years 4.6 years
(effective)
Average Life 6.4 years 6.7 years
Yields as of September 30, 2007
30-day SEC Yield
Investor Class 4.62%
Institutional Class 4.82%
A Class 4.17%
B Class 3.62%
C Class 3.62%
R Class 4.12%
- ------
12
Core Plus
Our security selection also contributed to relative results. For example, we
used a small slice of the portfolio to gain Japanese yen exposure, a trade we
put on when the yen was at a 41/2 -year low against the dollar early in 2007.
Though currency values have been volatile, the yen appreciated against the
dollar overall for the six-month period.
In addition, we avoided the worst performers during the credit and liquidity
crunch that peaked in July and August. Among mortgage-backed securities, we
had essentially no sub-prime exposure. And when you look across all the
non-Treasury sectors, we tended to avoid the least-liquid off-the-run bonds,
which typically performed worse than more easily bought and sold on-the-run
securities.
RELATIVE-VALUE APPROACH
"We continued to focus on identifying the best relative values across the U.S.
taxable fixed-income securities universe. We think this steady, long-term
approach to investing is the best way to generate outperformance over time,"
said Macro Strategy Team representative Jim Keegan. "Because of that
longer-term, relative-value approach, we saw the sell-off during the liquidity
crunch in July and August as an opportunity to make some select trades to swap
into high-quality corporate issuers at what we believed were very attractive
prices. That said, we should point out that we remain underweight corporates
overall because we think there's potential for more underperformance as credit
spreads widen and risk assets are re-priced."
OUTLOOK
"We see a difficult path for the economy as a result of headwinds from
housing, the consumer, and higher energy prices," said Macro Strategy Team
representative Bob Gahagan. "The economic, market, and interest rate
environment also argue for the continuation of our curve-steepening trade and
yen overweight position. In terms of sector allocations, our caution about the
economy means we'll continue to underweight credit-sensitive corporate bonds
and overweight Treasury and government agency securities. In addition, we
think the environment for inflation-indexed securities could be positive going
forward. On top of some positive fundamentals, inflation-indexed bonds are
benefiting from demand from investors who think the Federal Reserve will err
on the side of fighting recession, rather than inflation."
Types of Investments in Portfolio
% of fund % of fund
investments investments
as of as of
9/30/07 3/31/07
Collateralized
Mortgage Obligations 31.5% 24.9%
Mortgage-Backed
Securities 29.6% 28.9%
Corporate Bonds 13.5% 10.4%
U.S. Government
Agency Securities 5.4% 3.5%
U.S. Treasury
Securities 5.1% 12.7%
Sovereign Governments
& Agencies 3.4% 3.0%
Asset-Backed
Securities 1.9% 0.5%
Temporary Cash
Investments 1.5% 4.6%
Temporary Cash
Investments --
Securities Lending
Collateral 8.1% 11.5%
Portfolio Composition by Credit Rating
% of fund % of fund
investments investments
as of as of
9/30/07 3/31/07
AAA 85% 89%
AA 4% 3%
A 4% 3%
BBB 6% 5%
BB 1% --
- ------
13
SCHEDULE OF INVESTMENTS
Core Plus
SEPTEMBER 30, 2007 (UNAUDITED)
Principal Amount Value
Collateralized Mortgage Obligations(1) -- 37.1%
$ 240,900 Banc of America Alternative Loan Trust, Series
2007-2, Class 2A4, 5.75%, 6/25/37(2) $ 240,695
750,000 Banc of America Commercial Mortgage Inc., Series
2000-2, Class B, 7.38%, 9/15/32(2) 794,010
150,000 Banc of America Commercial Mortgage Inc., Series
2002 PB2, Class A3 SEQ, 6.09%, 6/11/35(2) 152,194
750,000 Banc of America Commercial Mortgage Inc., Series
2002 PB2, Class B SEQ, 6.31%, 6/11/35(2) 783,551
1,025,000 Banc of America Commercial Mortgage Inc., Series
2004-2, Class A3 SEQ, 4.05%, 11/10/38(2) 1,001,448
1,294,297 Bear Stearns Commercial Mortgage Securities Trust
STRIPS - COUPON, Series 2004 T16, Class X2, VRN,
0.75%, 10/1/07(2) 36,410
425,000 Chase Commercial Mortgage Securities Corp., Series
2000-2, Class C, 7.93%, 7/15/32(2) 456,260
1,148,763 Commercial Mortgage Acceptance Corp. STRIPS -
COUPON, Series 1998 C2, Class X, VRN, 0.98%,
10/1/07(2) 22,665
496,811 Countrywide Home Loan Mortgage Pass-Through Trust,
Series 2007-16, Class A1, 6.50%, 10/25/37(2) 501,486
283,795 Credit Suisse First Boston Mortgage Securities
Corp., Series 2003 AR28, Class 2A1, 4.41%,
12/25/33(2) 285,655
451,509 FHLMC, Series 2522, Class XA SEQ, 5.00%, 8/15/16(2) 451,266
159,680 FHLMC, Series 2613, Class HB SEQ, 4.50%,
10/15/13(2) 159,221
400,124 FHLMC, Series 2632, Class TE, 2.50%, 6/15/22(2) 397,094
Principal Amount Value
$ 111,683 FNMA, Series 2003-52, Class KF SEQ, VRN, 5.53%,
10/25/07, resets monthly off the 1-month LIBOR
plus 0.40% with a cap of 7.50%(2) $ 112,486
250,000 FNMA, Series 2003-54, Class TC, 4.50%, 5/25/15(2) 247,567
164,898 FNMA, Series 2004-9, Class YJ, 4.00%, 10/25/13(2) 163,659
491,212 FNMA, Series 2005-47, Class AN SEQ, 5.00%,
12/25/16(2) 489,941
157,990 FNMA, Series 2005-63, Class HA SEQ, 5.00%,
4/25/23(2) 156,743
268,673 Greenwich Capital Commercial Funding Corp., Series
2006 FL4A, Class A1, VRN, 5.85%, 10/5/07, resets
monthly off the 1-month LIBOR plus 0.09% with no
caps (Acquired 12/14/06, Cost $268,673)(2)(3) 268,030
750,000 LB-UBS Commercial Mortgage Trust, Series 2003 C5,
Class A2 SEQ, 3.48%, 7/15/27(2) 740,302
500,000 LB-UBS Commercial Mortgage Trust, Series 2005 C3,
Class A3 SEQ, 4.65%, 7/30/30(2) 491,125
750,000 Lehman Brothers Commercial Conduit Mortgage Trust,
Series 1998 C1, Class C, 6.68%, 2/18/30(2) 750,423
211,000 Lehman Brothers Commercial Conduit Mortgage Trust,
Series 1999 C1, Class B, 6.93%, 6/15/31(2) 216,806
300,000 Washington Mutual Mortgage Pass-Through
Certificates, Series 2004 AR4, Class A6, 3.81%,
6/25/34(2) 293,490
250,000 Washington Mutual Mortgage Pass-Through
Certificates, Series 2005 AR4, Class A4B, 4.68%,
4/25/35(2) 247,432
245,568 Wells Fargo Mortgage Backed Securities Trust,
Series 2007-11, Class A19 SEQ, 6.00%, 8/25/37(2) 246,647
-----------
TOTAL COLLATERALIZED MORTGAGE OBLIGATIONS
(Cost $9,652,906) 9,706,606
-----------
- ------
14
Core Plus
Principal Amount Value
U.S. Government Agency Mortgage-Backed Securities(1) -- 34.9%
$ 915,010 FHLMC, 5.00%, 10/1/10(2) $ 913,803
423,581 FHLMC, 4.50%, 6/1/21(2) 407,918
27,402 FHLMC, 6.50%, 7/1/47(2) 27,661
2,115,000 FNMA, 6.00%, settlement date 10/11/07(4) 2,117,973
871,262 FNMA, 5.00%, 7/1/20(2) 854,388
458,623 FNMA, 5.00%, 11/1/33(2) 439,097
903,708 FNMA, 5.00%, 8/1/34(2) 864,454
478,736 FNMA, 5.00%, 8/1/35(2) 457,478
522,155 FNMA, 4.50%, 9/1/35(2) 484,842
1,249,439 FNMA, 5.50%, 4/1/36(2) 1,225,500
361,534 FNMA, 6.50%, 8/1/37(2) 365,532
600,000 FNMA, 6.50%, 9/1/37(2) 611,042
13,328 FNMA, 6.50%, 6/1/47(2) 13,454
35,104 FNMA, 6.50%, 8/1/47(2) 35,435
49,347 FNMA, 6.50%, 8/1/47(2) 49,813
6,203 FNMA, 6.50%, 9/1/47(2) 6,262
78,314 FNMA, 6.50%, 9/1/47(2) 79,054
44,921 FNMA, 6.50%, 9/1/47(2) 45,346
55,270 FNMA, 6.50%, 9/1/47(2) 55,793
44,501 FNMA, 6.50%, 9/1/47(2) 44,922
-----------
TOTAL U.S. GOVERNMENT AGENCY MORTGAGE-BACKED SECURITIES
(Cost $9,151,900) 9,099,767
-----------
Corporate Bonds -- 16.0%
AEROSPACE & DEFENSE -- 0.6%
30,000 Honeywell International Inc., 5.30%, 3/15/17(2) 29,292
30,000 Lockheed Martin Corp., 6.15%, 9/1/36(2) 30,426
95,000 United Technologies Corp., 6.05%, 6/1/36(2) 95,702
-----------
155,420
-----------
AUTOMOBILES -- 0.1%
30,000 DaimlerChrysler N.A. Holding Corp., 6.50%,
11/15/13(2) 31,147
-----------
BEVERAGES -- 0.3%
85,000 Miller Brewing Co., 4.25%, 8/15/08 (Acquired
12/4/06, Cost $83,900)(2)(3) 84,177
-----------
CAPITAL MARKETS -- 0.5%
125,000 Merrill Lynch & Co., Inc., 4.79%, 8/4/10(2) 123,033
-----------
CHEMICALS -- 0.1%
20,000 Rohm and Haas Co., 5.60%, 3/15/13(2) 19,964
-----------
Principal Amount Value
COMMERCIAL BANKS -- 0.3%
$ 90,000 PNC Bank N.A., 4.875%, 9/21/17(2) $ 82,962
-----------
COMMERCIAL SERVICES & SUPPLIES -- 0.4%
90,000 Deluxe Corp., 7.375%, 6/1/15(2)(5) 89,325
20,000 Pitney Bowes, Inc., 5.75%, 9/15/17(2) 20,067
-----------
109,392
-----------
DIVERSIFIED FINANCIAL SERVICES -- 2.0%
170,000 Bank of America Corp., 4.375%, 12/1/10(2) 167,448
60,000 Bank of America N.A., 5.30%, 3/15/17(2) 58,307
75,000 Bank of America N.A., 6.00%, 10/15/36(2) 73,833
150,000 Citigroup Inc., 5.00%, 9/15/14(2) 144,797
50,000 General Electric Capital Corp., 5.625%, 9/15/17(2) 50,081
60,000 John Deere Capital Corp., 5.50%, 4/13/17(2) 59,548
-----------
554,014
-----------
DIVERSIFIED TELECOMMUNICATION SERVICES -- 0.8%
70,000 AT&T Inc., 6.80%, 5/15/36(2) 75,163
20,000 Qwest Corp., 7.875%, 9/1/11(2) 21,100
20,000 Qwest Corp., 7.50%, 10/1/14(2) 20,900
20,000 Telecom Italia Capital SA, 5.25%, 10/1/15(2) 19,017
30,000 Telefonica Emisiones SAU, 7.05%, 6/20/36(2) 32,057
30,000 Verizon Communications Inc., 5.55%, 2/15/16(2) 29,753
-----------
197,990
-----------
ELECTRIC UTILITIES -- 0.6%
60,000 Cleveland Electric Illuminating Co. (The), 5.70%,
4/1/17(2) 58,483
20,000 Florida Power Corp., 6.35%, 9/15/37(2) 20,452
70,000 Southern California Edison Co., 5.625%, 2/1/36(2) 65,599
-----------
144,534
-----------
FOOD & STAPLES RETAILING -- 0.6%
30,000 CVS Caremark Corp., 5.75%, 6/1/17(2) 29,335
95,000 Wal-Mart Stores, Inc., 5.875%, 4/5/27(2) 91,898
30,000 Wal-Mart Stores, Inc., 6.50%, 8/15/37(2) 31,236
-----------
152,469
-----------
- ------
15
Core Plus
Principal Amount Value
FOOD PRODUCTS -- 0.4%
$ 60,000 General Mills Inc., 5.65%, 9/10/12(2) $ 60,599
40,000 Kraft Foods Inc., 6.00%, 2/11/13(2) 41,224
-----------
101,823
-----------
HEALTH CARE EQUIPMENT & SUPPLIES -- 0.2%
50,000 Baxter International Inc., 5.90%, 9/1/16(2) 50,497
-----------
HOUSEHOLD PRODUCTS -- 0.2%
20,000 Kimberly-Clark Corp., 6.125%, 8/1/17(2) 20,638
30,000 Procter & Gamble Co. (The), 5.55%, 3/5/37(2) 28,763
-----------
49,401
-----------
INDUSTRIAL CONGLOMERATES -- 1.0%
250,000 General Electric Co., 5.00%, 2/1/13(2) 248,103
-----------
INSURANCE -- 0.3%
60,000 Hartford Financial Services Group Inc. (The),
5.375%, 3/15/17(2) 58,082
20,000 Travelers Companies, Inc. (The), 6.25%, 6/15/37(2) 19,356
-----------
77,438
-----------
IT SERVICES -- 0.4%
100,000 International Business Machines Corp., 5.70%,
9/14/17(2) 100,713
-----------
MACHINERY -- 0.1%
20,000 Atlas Copco AB, 5.60%, 5/22/17 (Acquired 5/15/07,
Cost $19,991)(2)(3) 19,773
-----------
MEDIA -- 1.2%
100,000 Comcast Corp., 5.90%, 3/15/16(2) 99,642
70,000 Rogers Cable Inc., 6.25%, 6/15/13(2) 70,981
60,000 Time Warner Cable Inc., 5.40%, 7/2/12 (Acquired
4/4/07-6/27/07, Cost $59,741)(2)(3) 59,323
30,000 Time Warner Cable Inc., 6.55%, 5/1/37 (Acquired
4/4/07, Cost $29,807)(2)(3) 29,524
50,000 Time Warner Inc., 5.50%, 11/15/11(2) 49,975
-----------
309,445
-----------
Principal Amount Value
METALS & MINING -- 0.4%
$ 50,000 Freeport-McMoRan Copper & Gold Inc., 8.25%,
4/1/15(2) $ 54,125
50,000 Freeport-McMoRan Copper & Gold Inc., 8.375%,
4/1/17(2) 54,750
-----------
108,875
-----------
MULTI-UTILITIES -- 1.1%
40,000 CenterPoint Energy Resources Corp., 6.25%,
2/1/37(2) 39,398
90,000 Consolidated Edison Co. of New York, Inc., Series
2006 C, 5.50%, 9/15/16(2) 88,724
130,000 Dominion Resources Inc., 4.125%, 2/15/08(2) 129,304
20,000 Pacific Gas & Electric Co., 5.80%, 3/1/37(2) 18,966
-----------
276,392
-----------
MULTILINE RETAIL -- 0.4%
20,000 Federated Retail Holdings, Inc., 5.35%,
3/15/12(2)(5) 19,632
20,000 Kohl's Corp., 6.875%, 12/15/37(2) 20,146
60,000 Macy's Retail Holdings, Inc., 5.875%, 1/15/13(2) 59,825
-----------
99,603
-----------
OIL, GAS & CONSUMABLE FUELS -- 1.9%
20,000 Canadian Natural Resources Ltd., 5.70%, 5/15/17(2) 19,559
50,000 Devon Financing Corp., ULC, 7.875%, 9/30/31(2) 59,223
160,000 Enterprise Products Operating L.P., 4.95%,
6/1/10(2) 159,449
40,000 Nexen Inc., 6.40%, 5/15/37(2) 38,997
150,000 Premcor Refining Group Inc. (The), 6.125%,
5/1/11(2) 153,858
30,000 Tesoro Corp., 6.25%, 11/1/12(2) 30,225
30,000 Tesoro Corp., 6.50%, 6/1/17 (Acquired 5/23/07,
Cost $30,000)(2)(3)(5) 29,925
30,000 Williams Companies, Inc. (The), 8.75%, 3/15/32(2) 34,688
-----------
525,924
-----------
PHARMACEUTICALS -- 1.0%
90,000 Abbott Laboratories, 5.875%, 5/15/16(2) 90,962
60,000 AstraZeneca plc, 5.40%, 9/15/12(2) 60,537
40,000 AstraZeneca plc, 5.90%, 9/15/17(2) 40,679
60,000 Wyeth, 5.95%, 4/1/37(2) 58,098
-----------
250,276
-----------
- ------
16
Core Plus
Principal Amount Value
REAL ESTATE INVESTMENT TRUSTS -- 0.3%
$ 90,000 ProLogis, 5.625%, 11/15/16(2) $ 85,459
-----------
SOFTWARE -- 0.1%
40,000 Intuit Inc., 5.75%, 3/15/17(2) 38,244
-----------
SPECIALTY RETAIL -- 0.1%
20,000 Lowe's Companies, Inc., 5.60%, 9/15/12(2) 20,218
-----------
WIRELESS TELECOMMUNICATION SERVICES -- 0.6%
110,000 Nextel Communications Inc., 5.95%, 3/15/14(2) 105,156
50,000 Vodafone Group plc, 5.625%, 2/27/17(2) 48,685
-----------
153,841
-----------
TOTAL CORPORATE BONDS
(Cost $4,220,561) 4,171,127
-----------
U.S. Government Agency Securities -- 6.4%
485,000 FHLMC, 4.625%, 10/25/12(2)(5) 484,995
200,000 FHLMC, 4.75%, 1/19/16(2)(5) 198,274
700,000 FHLMC, 5.875%, 5/23/16(2) 721,540
249,000 FNMA, 5.375%, 6/12/17(2)(5) 256,545
-----------
TOTAL U.S. GOVERNMENT AGENCY SECURITIES
(Cost $1,648,387) 1,661,354
-----------
U.S. Treasury Securities -- 6.0%
27,000 U.S. Treasury Bonds, 8.125%, 8/15/21(2)(5) 35,870
151,000 U.S. Treasury Bonds, 7.125%, 2/15/23(2)(5) 187,452
712,000 U.S. Treasury Bonds, 6.125%, 11/15/27(2)(5) 824,085
37,000 U.S. Treasury Bonds, 6.25%, 5/15/30(2)(5) 43,995
179,000 U.S. Treasury Bonds, 4.75%, 2/15/37(2) 176,581
289,000 U.S. Treasury Notes, 4.50%, 5/15/17(2)(5) 287,465
-----------
TOTAL U.S. TREASURY SECURITIES
(Cost $1,535,436) 1,555,448
-----------
Sovereign Governments & Agencies -- 4.0%
JPY KfW, VRN, 0.60%, 11/8/07, resets quarterly off the
121,000,000 3-month JPY LIBOR minus 0.22% with no caps(2) 1,054,815
(Cost $995,145)
-----------
Principal Amount Value
Asset-Backed Securities(1) -- 2.2%
$ 100,000 Citibank Credit Card Issuance Trust, Series 2007
A2, VRN, 5.49%, 11/21/07, resets quarterly off the
3-month LIBOR minus 0.01% with no caps(2) $ 99,487
378,895 FHLMC, Series T7, Class A5 SEQ, 7.27%, 8/25/28(2) 377,735
95,931 Soundview Home Equity Loan Trust, Series 2006-3,
Class A1, VRN, 5.17%, 10/25/07, resets monthly off
the 1-month LIBOR plus 0.04% with no caps(2) 95,635
-----------
TOTAL ASSET-BACKED SECURITIES
(Cost $573,804) 572,857
-----------
Temporary Cash Investments -- 1.8%
Repurchase Agreement, Bank of America Securities, LLC,
(collateralized by various U.S. Treasury obligations, 0.875%,
4/15/10, valued at $522,561), in a joint trading account at 3.80%,
dated 9/28/07, due 10/1/07 (Delivery value $465,147)(2)
(Cost $465,000) 465,000
-----------
Temporary Cash Investments -- Securities Lending Collateral(6) -- 9.5%
150,007 Bancaja US Debt, SAu, VRN, 5.41%, 10/10/07, resets
quarterly off the 3-month LIBOR plus 0.05% with no
caps 150,007
200,000 Barclays Bank plc, 5.37%, 12/17/07 200,000
149,985 BASF AG, VRN, 5.36%, 10/22/07, resets quarterly
off the 3-month LIBOR minus 0.01% with no caps 149,985
200,000 Dexia Credit Local, VRN, 4.84%, 10/1/07 200,000
99,948 K2 (USA) LLC, VRN, 4.87%, 10/1/07, resets
quarterly off the Federal Reserve Prime Loan Rate
minus 2.91% with no caps 99,948
149,925 Links Finance LLC, VRN, 4.87%, 10/1/07, resets
quarterly off the Federal Reserve Prime Loan Rate
minus 2.91% with no caps 149,925
150,000 Merrill Lynch & Co. Inc., VRN, 4.92%, 10/1/07,
resets quarterly off the Federal Reserve Prime
Loan Rate minus 2.83% with no caps 150,000
- ------
17
Core Plus
Principal Amount Value
$ 188,950 Morgan Stanley ABS Capital I, Series 2007 NC4,
Class A2A, VRN, 5.21%, 10/25/07, resets monthly
off the 1-month LIBOR plus 0.08% with no caps $ 188,950
150,247 Nationwide Building Society, VRN, 5.73%, 12/10/07,
resets quarterly off the 3-month LIBOR plus 0.13%
with no caps 150,247
150,000 Northern Rock plc, 5.34%, 10/18/07 150,000
197,955 Silver Tower U.S. Funding, LLC, 5.39%, 10/10/07 197,955
149,905 Tango Finance Corp., VRN, 4.88%, 10/1/07, resets
quarterly off the Federal Reserve Prime Loan Rate
minus 2.91% with no caps 149,905
Principal Amount Value
$ 150,000 Ulster Bank Ireland Ltd., VRN, 4.85%, 10/1/07 $ 150,000
Repurchase Agreement, Lehman Brothers, Inc., (collateralized by
various U.S. Government Agency obligations in a pooled account at
the lending agent), 5.15%, dated 9/28/07, due 10/1/07 (Delivery
value $402,306) 402,133
-----------
TOTAL TEMPORARY CASH INVESTMENTS -- SECURITIES LENDING COLLATERAL
(Cost $2,489,055) 2,489,055
-----------
TOTAL INVESTMENT SECURITIES -- 117.9%
(Cost $30,732,194) 30,776,029
-----------
OTHER ASSETS AND LIABILITIES -- (17.9)% (4,670,246)
-----------
TOTAL NET ASSETS -- 100.0% $26,105,783
===========
Futures Contracts
Expiration Underlying Face Unrealized Gain
Contracts Purchased Date Amount at Value (Loss)
U.S. Treasury December 2007
49 2-Year Notes $ 10,145,297 $ 45,155
U.S. Treasury December 2007
60 5-Year Notes 6,421,875 50,709
------------ ------------
$ 16,567,172 $ 95,864
============ ============
Expiration Underlying Face Unrealized Gain
Contracts Sold Date Amount at Value (Loss)
U.S. Treasury December 2007
35 10-Year Notes $ 3,824,844 $ (58,425)
============ ============
- ------
18
Core Plus
Swap Agreements
Notional Expiration Unrealized
Amount Description of Agreement Date Gain (Loss)
CREDIT DEFAULT
$ 100,000 Pay quarterly a fixed rate equal to March 2012 $ 9,981
0.46% multiplied by the notional
amount and receive from Barclays Bank
plc upon each default event of Centex
Corp., par value of the proportional
notional amount.
600,000 Pay quarterly a fixed rate equal to June 2012 6,570
0.35% multiplied by the notional
amount and receive from Barclays Bank
plc upon each default event of one of
the issues of Dow Jones CDX N.A.
Investment Grade 8, par value of the
proportional notional amount.
400,000 Pay quarterly a fixed rate equal to June 2012 (2,182)
0.55% multiplied by the notional
amount and receive from Barclays Bank
plc upon each default event of Darden
Restaurants, Inc., par value of the
proportional notional amount.
1,800,000 Pay semiannually a fixed rate equal to June 2012 4,364
1.25% multiplied by the notional
amount and receive from Barclays Bank
plc upon each default event of one of
the issues of Dow Jones CDX Emerging
Markets 7, par value of the
proportional notional amount.
60,000 Pay quarterly a fixed rate equal to September (44)
0.35% multiplied by the notional 2012
amount and receive from Merrill Lynch
International upon each default event
of Computer Sciences Corp., par value
of the proportional notional amount.
50,000 Pay quarterly a fixed rate equal to September 10
0.36% multiplied by the notional 2012
amount and receive from Barclays Bank
plc upon each default event of
Whirlpool Corp., par value of the
proportional notional amount.
250,000 Pay quarterly a fixed rate equal to March 2017 1,266
0.12% multiplied by the notional
amount and receive from Barclays Bank
plc upon each default event of Pfizer
Inc., par value of the proportional
notional amount.
400,000 Pay quarterly a fixed rate equal to September (4,681)
0.69% multiplied by the notional 2017
amount and receive from Barclays Bank
plc upon each default event of
JPMorgan Chase & Co., par value of the
proportional notional amount.
---------
$ 15,284
=========
Notes to Schedule of Investments
CDX = Credit Derivative Indexes
FHLMC = Federal Home Loan Mortgage Corporation
FNMA = Federal National Mortgage Association
JPY = Japanese Yen
LB-UBS = Lehman Brothers Inc. - UBS AG
LIBOR = London Interbank Offered Rate
resets = The frequency with which a security's coupon changes, based on
current market conditions or an underlying index. The more frequently a
security resets, the less risk the investor is taking that the coupon will
vary significantly from current market rates.
SEQ = Sequential Payer
STRIPS = Separate Trading of Registered Interest and Principal of Securities
VRN = Variable Rate Note. Interest reset date is indicated. Rate shown is
effective September 30, 2007.
(1) Final maturity indicated, unless otherwise noted.
(2) Security, or a portion thereof, has been segregated for forward
commitments, futures contracts and/or swap agreements.
(3) Security was purchased under Rule 144A of the Securities Act of 1933 or is
a private placement and, unless registered under the Act or exempted from
registration, may only be sold to qualified institutional investors. The
aggregate value of restricted securities at September 30, 2007, was $490,752,
which represented 1.9% of total net assets.
(4) Forward commitment.
(5) Security, or a portion thereof, was on loan as of September 30, 2007.
(6) Investments represent purchases made by the lending agent with cash
collateral received through securities lending transactions.
See Notes to Financial Statements.
- ------
19
SHAREHOLDER FEE EXAMPLES (UNAUDITED)
Fund shareholders may incur two types of costs: (1) transaction costs,
including sales charges (loads) on purchase payments and redemption/exchange
fees; and (2) ongoing costs, including management fees; distribution and
service (12b-1) fees; and other fund expenses. This example is intended to
help you understand your ongoing costs (in dollars) of investing in your fund
and to compare these costs with the ongoing cost of investing in other mutual
funds.
The example is based on an investment of $1,000 made at the beginning of the
period and held for the entire period from April 1, 2007 to September 30, 2007.
ACTUAL EXPENSES
The table provides information about actual account values and actual expenses
for each class. You may use the information, together with the amount you
invested, to estimate the expenses that you paid over the period. First,
identify the share class you own. Then simply divide your account value by
$1,000 (for example, an $8,600 account value divided by $1,000 = 8.6), then
multiply the result by the number under the heading "Expenses Paid During
Period" to estimate the expenses you paid on your account during this period.
If you hold Investor Class shares of any American Century fund, or
Institutional Class shares of the American Century Diversified Bond Fund, in
an American Century account (i.e., not a financial intermediary or retirement
plan account), American Century may charge you a $12.50 semiannual account
maintenance fee if the value of those shares is less than $10,000. We will
redeem shares automatically in one of your accounts to pay the $12.50 fee. In
determining your total eligible investment amount, we will include your
investments in all PERSONAL ACCOUNTS (including American Century Brokerage
accounts) registered under your Social Security number. PERSONAL ACCOUNTS
include individual accounts, joint accounts, UGMA/UTMA accounts, personal
trusts, Coverdell Education Savings Accounts and IRAs (including traditional,
Roth, Rollover, SEP-, SARSEP- and SIMPLE-IRAs), and certain other retirement
accounts. If you have only business, business retirement, employer-sponsored
or American Century Brokerage accounts, you are currently not subject to this
fee. We will not charge the fee as long as you choose to manage your accounts
exclusively online. If you are subject to the Account Maintenance Fee, your
account value could be reduced by the fee amount.
HYPOTHETICAL EXAMPLE FOR COMPARISON PURPOSES
The table also provides information about hypothetical account values and
hypothetical expenses based on the actual expense ratio of each class of your
fund and an assumed rate of return of 5% per year before expenses, which is
not the actual return of a fund's share class. The hypothetical account values
and expenses may not be used to estimate the actual ending account balance or
expenses you paid for the period. You may use this information to compare the
ongoing costs of investing in your fund and other funds. To do so, compare
this 5% hypothetical example with the 5% hypothetical examples that appear in
the shareholder reports of the other funds.
Please note that the expenses shown in the table are meant to highlight your
ongoing costs only and do not reflect any transactional costs, such as sales
charges (loads) or redemption/exchange fees. Therefore, the table is useful in
comparing ongoing costs only, and will not help you determine the relative
total costs of owning different funds. In addition, if these transactional
costs were included, your costs would have been higher.
- ------
20
Beginning Ending Expenses Paid Annualized
Account Account Value During Period* Expense Ratio*
Value 4/1/07 9/30/07 4/1/07 -
9/30/07
Short Duration
ACTUAL
Investor Class $1,000 $1,025.90 $3.14 0.62%
Institutional $1,000 $1,027.00 $2.13 0.42%
Class
A Class $1,000 $1,024.70 $4.40 0.87%
B Class $1,000 $1,020.80 $8.18 1.62%
C Class $1,000 $1,020.90 $8.18 1.62%
R Class $1,000 $1,023.40 $5.67 1.12%
HYPOTHETICAL
Investor Class $1,000 $1,021.90 $3.13 0.62%
Institutional $1,000 $1,022.90 $2.12 0.42%
Class
A Class $1,000 $1,020.65 $4.39 0.87%
B Class $1,000 $1,016.90 $8.17 1.62%
C Class $1,000 $1,016.90 $8.17 1.62%
R Class $1,000 $1,019.40 $5.65 1.12%
Core Plus
ACTUAL
Investor Class $1,000 $1,024.50 $3.39 0.67%
Institutional $1,000 $1,025.50 $2.38 0.47%
Class
A Class $1,000 $1,023.20 $4.65 0.92%
B Class $1,000 $1,019.40 $8.43 1.67%
C Class $1,000 $1,019.40 $8.43 1.67%
R Class $1,000 $1,021.90 $5.91 1.17%
HYPOTHETICAL
Investor Class $1,000 $1,021.65 $3.39 0.67%
Institutional $1,000 $1,022.65 $2.38 0.47%
Class
A Class $1,000 $1,020.40 $4.65 0.92%
B Class $1,000 $1,016.65 $8.42 1.67%
C Class $1,000 $1,016.65 $8.42 1.67%
R Class $1,000 $1,019.15 $5.91 1.17%
*Expenses are equal to the class's annualized expense ratio listed in the
table above, multiplied by the average account value over the period,
multiplied by 183, the number of days in the most recent fiscal half-year,
divided by 366, to reflect the one-half year period.
- ------
21
STATEMENT OF ASSETS AND LIABILITIES
SEPTEMBER 30, 2007 (UNAUDITED)
Short Core Plus
Duration
ASSETS
Investment securities, at value (cost of $13,592,462
and $28,243,139, respectively) -- including
$3,898,930 and $2,448,972 of securities on loan,
respectively $13,674,476 $28,286,974
Investments made with cash collateral received for
securities on loan, at value (cost of $3,960,993 and
$2,489,055, respectively) 3,960,993 2,489,055
----------- -----------
Total investment securities, at value (cost of
$17,553,455 and $30,732,194, respectively) 17,635,469 30,776,029
Cash 1,282 1,307
Receivable for investments sold -- 8,075
Receivable for variation margin on futures contracts -- 985
Unrealized appreciation on swap agreements 1,099 22,191
Interest receivable 81,530 184,715
----------- -----------
17,719,380 30,993,302
----------- -----------
LIABILITIES
Payable for collateral received for securities on
loan 3,960,993 2,489,055
Payable for investments purchased 147,300 2,367,990
Payable for variation margin on futures contracts 751 --
Unrealized depreciation on swap agreements 3,505 6,907
Accrued management fees 6,349 13,448
Distribution fees payable 2,662 5,255
Service fees (and distribution fees -- A Class and R
Class) payable 2,322 4,423
Dividends payable 5,904 441
----------- -----------
4,129,786 4,887,519
----------- -----------
NET ASSETS $13,589,594 $26,105,783
=========== ===========
See Notes to Financial Statements.
- ------
22
SEPTEMBER 30, 2007 (UNAUDITED)
Short Core Plus
Duration
NET ASSETS CONSIST OF:
Capital paid in $13,544,124 $26,144,362
Accumulated net realized loss on investment
transactions (30,145) (147,805)
Net unrealized appreciation on investments 75,615 109,226
----------- -----------
$13,589,594 $26,105,783
=========== ===========
INVESTOR CLASS
Net assets $1,802,481 $4,316,126
Shares outstanding 179,713 432,424
Net asset value per share $10.03 $9.98
INSTITUTIONAL CLASS
Net assets $1,738,063 $4,321,770
Shares outstanding 173,290 432,990
Net asset value per share $10.03 $9.98
A CLASS
Net assets $3,996,621 $4,613,238
Shares outstanding 398,475 462,191
Net asset value per share $10.03 $9.98
Maximum offering price (net asset value divided by
0.9775 and 0.9550, respectively) $10.26 $10.45
B CLASS
Net assets $1,737,360 $4,278,951
Shares outstanding 173,220 428,700
Net asset value per share $10.03 $9.98
C CLASS
Net assets $2,587,069 $4,278,951
Shares outstanding 257,938 428,700
Net asset value per share $10.03 $9.98
R CLASS
Net assets $1,728,000 $4,296,747
Shares outstanding 172,287 430,482
Net asset value per share $10.03 $9.98
See Notes to Financial Statements.
- ------
23
STATEMENT OF OPERATIONS
FOR THE SIX MONTHS ENDED SEPTEMBER 30, 2007 (UNAUDITED)
Short Core Plus
Duration
INVESTMENT INCOME (LOSS)
INCOME:
Interest $281,358 $652,905
Securities lending 1,646 6,440
--------- ---------
283,004 659,345
--------- ---------
EXPENSES:
Management fees 31,635 79,833
Distribution fees:
B Class 6,382 15,730
C Class 7,355 15,730
Service fees:
B Class 2,127 5,243
C Class 2,452 5,243
Distribution and service fees:
A Class 2,541 5,300
R Class 4,253 10,515
Trustees' fees and expenses 244 597
Other expenses 79 273
--------- ---------
57,068 138,464
--------- ---------
NET INVESTMENT INCOME (LOSS) 225,936 520,881
--------- ---------
REALIZED AND UNREALIZED GAIN (LOSS)
NET REALIZED GAIN (LOSS) ON:
Investment transactions (13,423) (47,880)
Futures and swaps transactions 13,725 43,784
--------- ---------
302 (4,096)
--------- ---------
CHANGE IN NET UNREALIZED APPRECIATION (DEPRECIATION) ON:
Investments 47,301 3,258
Futures and swaps (6,382) 50,882
--------- ---------
40,919 54,140
--------- ---------
NET REALIZED AND UNREALIZED GAIN (LOSS) 41,221 50,044
--------- ---------
NET INCREASE (DECREASE) IN NET ASSETS RESULTING FROM
OPERATIONS $267,157 $570,925
========= =========
See Notes to Financial Statements.
- ------
24
STATEMENT OF CHANGES IN NET ASSETS
SIX MONTHS ENDED SEPTEMBER 30, 2007
(UNAUDITED) AND PERIOD ENDED MARCH 31, 2007
Short Duration Core Plus
Increase (Decrease) in Sept. 30, March 31, Sept. 30, March 31,
Net Assets 2007 2007(1) 2007 2007(1)
OPERATIONS
Net investment income
(loss) $225,936 $134,977 $520,881 $332,633
Net realized gain (loss) 302 (34,486) (4,096) (154,327)
Change in net
unrealized appreciation
(depreciation) 40,919 32,981 54,140 48,430
---------- ---------- ---------- ----------
Net increase (decrease)
in net assets resulting
from operations 267,157 133,472 570,925 226,736
---------- ---------- ---------- ----------
DISTRIBUTIONS TO SHAREHOLDERS
From net investment income:
Investor Class (39,192) (24,692) (93,616) (60,762)
Institutional Class (40,265) (25,741) (97,894) (63,536)
A Class (43,377) (23,233) (88,731) (57,289)
B Class (29,975) (19,059) (72,223) (46,893)
C Class (34,556) (19,059) (72,223) (46,893)
R Class (34,192) (21,841) (82,880) (53,822)
---------- ---------- ---------- ----------
Decrease in net assets
from distributions (221,557) (133,625) (507,567) (329,195)
---------- ---------- ---------- ----------
CAPITAL SHARE TRANSACTIONS
Net increase (decrease)
in net assets from
capital share
transactions 3,400,643 10,143,504 811,954 25,332,930
----------- ----------- ----------- -----------
NET INCREASE
(DECREASE)
IN NET ASSETS 3,446,243 10,143,351 875,312 25,230,471
NET ASSETS
Beginning of period 10,143,351 -- 25,230,471 --
----------- ----------- ----------- -----------
End of period $13,589,594 $10,143,351 $26,105,783 $25,230,471
=========== =========== =========== ===========
(1) November 30, 2006 (fund inception) through March 31, 2007.
See Notes to Financial Statements.
- ------
25
NOTES TO FINANCIAL STATEMENTS
SEPTEMBER 30, 2007 (UNAUDITED)
1. ORGANIZATION AND SUMMARY OF SIGNIFICANT ACCOUNTING POLICIES
ORGANIZATION -- American Century Investment Trust (the trust) is registered
under the Investment Company Act of 1940 (the 1940 Act) as an open-end
management investment company. Short Duration Fund (Short Duration) and Core
Plus Fund (Core Plus) (the funds) are two funds in a series issued by the
trust. The funds are diversified under the 1940 Act. The funds' investment
objective is to seek to maximize total return by investing in non-money market
debt securities. As a secondary objective, the funds seek a high level of
income. The following is a summary of the funds' significant accounting
policies.
MULTIPLE CLASS -- The funds are authorized to issue the Investor Class, the
Institutional Class, the A Class, the B Class, the C Class and the R Class.
The A Class may incur an initial sales charge. The A Class, B Class and C
Class may be subject to a contingent deferred sales charge. The share classes
differ principally in their respective sales charges and distribution and
shareholder servicing expenses and arrangements. All shares of the funds
represent an equal pro rata interest in the net assets of the class to which
such shares belong, and have identical voting, dividend, liquidation and other
rights and the same terms and conditions, except for class specific expenses
and exclusive rights to vote on matters affecting only individual classes.
Income, non-class specific expenses, and realized and unrealized capital gains
and losses of the funds are allocated to each class of shares based on their
relative net assets. All classes of the funds commenced sale on November 30,
2006, the funds' inception date.
SECURITY VALUATIONS -- Debt securities maturing in greater than 60 days are
valued at current market value as provided by a commercial pricing service or
at the mean of the most recent bid and asked prices. Debt securities maturing
within 60 days may be valued at cost, plus or minus any amortized discount or
premium. Discount notes may be valued through a commercial pricing service or
at amortized cost, which approximates fair value. Securities traded on foreign
securities exchanges and over-the-counter markets are normally completed
before the close of business on days that the New York Stock Exchange (the
Exchange) is open and may also take place on days when the Exchange is not
open. If an event occurs after the value of a security was established but
before the net asset value per share was determined that was likely to
materially change the net asset value, that security would be valued as
determined in accordance with procedures adopted by the Board of Trustees. If
the funds determine that the market price of a portfolio security is not
readily available, or that the valuation methods mentioned above do not
reflect the security's fair value, such security is valued as determined by,
or in accordance with procedures adopted by, the Board of Trustees or its
designee if such determination would materially impact a fund's net asset
value. Certain other circumstances may cause the funds to use alternative
procedures to value a security such as: a security has been declared in
default; trading in a security has been halted during the trading day; or
there is a foreign market holiday and no trading will commence.
SECURITY TRANSACTIONS -- For financial reporting, security transactions are
accounted for as of the trade date. Net realized gains and losses are
determined on the identified cost basis, which is also used for federal income
tax purposes.
INVESTMENT INCOME -- Interest income less foreign taxes withheld, if any, is
recorded on the accrual basis and includes paydown gain (loss) and accretion
of discounts and amortization of premiums.
SECURITIES ON LOAN -- The funds may lend portfolio securities through their
lending agent to certain approved borrowers in order to earn additional
income. The funds continue to recognize any gain or loss in the market price
of the securities loaned and record any interest earned or dividends declared.
FOREIGN CURRENCY TRANSACTIONS -- All assets and liabilities initially
expressed in foreign currencies are translated into U.S. dollars at prevailing
exchange rates at period end. Purchases and sales of investment securities,
dividend and interest income, and certain expenses are translated at the rates
of exchange prevailing on the respective dates of such transactions. For
assets and liabilities, other than investments in securities, net realized and
unrealized gains and losses from foreign currency translations arise from
changes in currency exchange rates.
Net realized and unrealized foreign currency exchange gains or losses
occurring during the holding period of investment securities are a component
of realized gain (loss) on investment transactions and unrealized appreciation
(depreciation) on investments, respectively. Certain countries may impose
taxes on the contract amount of purchases and sales of foreign currency
contracts in their currency. The funds record the foreign tax expense, if any,
as a reduction to the net realized gain (loss) on foreign currency
transactions.
- ------
26
WHEN-ISSUED AND FORWARD COMMITMENTS -- The funds may engage in securities
transactions on a when-issued or forward commitment basis. In these
transactions, the securities' prices and yields are fixed on the date of the
commitment. In a when-issued transaction, the payment and delivery are
scheduled for a future date and during this period, securities are subject to
market fluctuations. In a forward commitment transaction, the funds may sell a
security and at the same time make a commitment to purchase the same security
at a future date at a specified price. Conversely, the funds may purchase a
security and at the same time make a commitment to sell the same security at a
future date at a specified price. These types of transactions are executed
simultaneously in what are known as "roll" transactions. The funds will
segregate cash, cash equivalents or other appropriate liquid securities on
their records in amounts sufficient to meet the purchase price. The funds
account for "roll" transactions as purchases and sales; as such these
transactions may increase portfolio turnover.
FUTURES CONTRACTS -- The funds may enter into futures contracts in order to
manage the funds' exposure to changes in market conditions. One of the risks
of entering into futures contracts is the possibility that the change in value
of the contract may not correlate with the changes in value of the underlying
securities. Upon entering into a futures contract, the funds are required to
deposit either cash or securities in an amount equal to a certain percentage
of the contract value (initial margin). Subsequent payments (variation margin)
are made or received daily, in cash, by the funds. The variation margin is
equal to the daily change in the contract value and is recorded as unrealized
gains and losses. The funds recognize a realized gain or loss when the
contract is closed or expires. Net realized and unrealized gains or losses
occurring during the holding period of futures contracts are a component of
realized gain (loss) on futures and swaps transactions and unrealized
appreciation (depreciation) on futures and swaps, respectively.
SWAP AGREEMENTS -- The funds may enter into swap agreements in order to
attempt to obtain or preserve a particular return or spread at a lower cost
than obtaining a return or spread through purchases and/or sales of
instruments in other markets; protect against currency fluctuations; attempt
to manage duration to protect against any increase in the price of securities
the funds anticipate purchasing at a later date; or gain exposure to certain
markets in the most economical way possible. A basic swap agreement is a
contract in which two parties agree to exchange the returns earned or realized
on predetermined investments or instruments. Credit default swaps enable an
investor to buy/sell protection against a credit event of a specific issuer.
The seller of credit protection against a security or basket of securities
receives an up-front or periodic payment to compensate against potential
default events. The funds may enhance returns by selling protection or attempt
to mitigate credit risk by buying protection. The funds will segregate cash,
cash equivalents or other appropriate liquid securities on their records in
amounts sufficient to meet requirements. Unrealized gains are reported as an
asset and unrealized losses are reported as a liability on the Statement of
Assets and Liabilities. Swap agreements are valued daily and changes in value,
including the periodic amounts of interest to be paid or received on swaps,
are recorded as unrealized appreciation (depreciation) on futures and swaps.
Realized gain or loss is recorded upon receipt or payment of a periodic
settlement or termination of swap agreements. The risks of entering into swap
agreements include the possible lack of liquidity, failure of the counterparty
to meet its obligations, and that there may be unfavorable changes in the
underlying investments and instruments.
REPURCHASE AGREEMENTS -- The funds may enter into repurchase agreements with
institutions that American Century Investment Management, Inc. (ACIM) (the
investment advisor) has determined are creditworthy pursuant to criteria
adopted by the Board of Trustees. Each repurchase agreement is recorded at
cost. Each fund requires that the collateral, represented by securities,
received in a repurchase transaction be transferred to the custodian in a
manner sufficient to enable each fund to obtain those securities in the event
of a default under the repurchase agreement. ACIM monitors, on a daily basis,
the securities transferred to ensure the value, including accrued interest, of
the securities under each repurchase agreement is equal to or greater than
amounts owed to each fund under each repurchase agreement.
JOINT TRADING ACCOUNT -- Pursuant to an Exemptive Order issued by the
Securities and Exchange Commission, each fund, along with other registered
investment companies having management agreements with ACIM or American
Century Global Investment Management, Inc. (ACGIM), may transfer uninvested
cash balances into a joint trading account. These balances are invested in one
or more repurchase agreements that are collateralized by U.S. Treasury or
Agency obligations.
INCOME TAX STATUS -- It is each fund's policy to distribute substantially all
net investment income and net realized gains to shareholders and to otherwise
qualify as a regulated investment company under provisions of the Internal
Revenue Code. At this time, management has not identified any uncertain tax
positions that would materially impact the financial statements. Accordingly,
no provision has been made for federal or state income taxes. Interest and
penalties associated with any federal or state income tax obligations, if any,
are recorded as interest expense.
- ------
27
DISTRIBUTIONS TO SHAREHOLDERS -- Distributions from net investment income for
the funds are declared daily and paid monthly. Distributions from net realized
gains for the funds, if any, are generally declared and paid annually.
INDEMNIFICATIONS -- Under the trust's organizational documents, its officers
and trustees are indemnified against certain liabilities arising out of the
performance of their duties to the funds. In addition, in the normal course of
business, the funds enter into contracts that provide general
indemnifications. The funds' maximum exposure under these arrangements is
unknown as this would involve future claims that may be made against the
funds. The risk of material loss from such claims is considered by management
to be remote.
USE OF ESTIMATES -- The financial statements are prepared in conformity with
accounting principles generally accepted in the United States of America,
which may require management to make certain estimates and assumptions at the
date of the financial statements. Actual results could differ from these
estimates.
2. FEES AND TRANSACTIONS WITH RELATED PARTIES
MANAGEMENT FEES -- The trust has entered into a Management Agreement with
ACIM, under which ACIM provides the funds with investment advisory and
management services in exchange for a single, unified management fee (the fee)
per class. The Agreement provides that all expenses of the funds, except
brokerage commissions, taxes, interest, fees and expenses of those trustees
who are not considered "interested persons" as defined in the 1940 Act
(including counsel fees) and extraordinary expenses, will be paid by ACIM. The
fee is computed and accrued daily based on the daily net assets of each
specific class of shares of each fund and paid monthly in arrears. The fee
consists of (1) an Investment Category Fee based on the daily net assets of
the funds and certain other accounts managed by the investment advisor that
are in the same broad investment category as each fund and (2) a Complex Fee
based on the assets of all the funds in the American Century family of funds.
The rates for the Investment Category Fee range from 0.2925% to 0.4100% for
Short Duration and from 0.3425% to 0.4600% for Core Plus. The rates for the
Complex Fee (Investor Class, A Class, B Class, C Class and R Class) range from
0.2500% to 0.3100%. The Institutional Class is 0.2000% less at each point
within the Complex Fee range.
The effective annual management fee for each class of each fund for the six
months ended September 30, 2007, was as follows:
Investor, A, B, C & R Institutional
Short Duration 0.62% 0.42%
Core Plus 0.67% 0.47%
DISTRIBUTION AND SERVICE FEES -- The Board of Trustees has adopted a separate
Master Distribution and Individual Shareholder Services Plan for each of the A
Class, B Class, C Class and R Class (collectively the plans), pursuant to Rule
12b-1 of the 1940 Act. The plans provide that the A Class and the R Class will
pay American Century Investment Services, Inc. (ACIS) an annual distribution
and service fee of 0.25% for the A Class and 0.50% for the R Class. The plans
provide that the B Class and C Class will each pay ACIS an annual distribution
fee and service fee of 0.75% and 0.25%, respectively. The fees are computed
and accrued daily based on each class's daily net assets and paid monthly in
arrears. The distribution fee provides compensation for expenses incurred in
connection with distributing shares of the classes including, but not limited
to, payments to brokers, dealers, and financial institutions that have entered
into sales agreements with respect to shares of the funds. The service fee
provides compensation for individual shareholder services rendered by
broker/dealers or other independent financial intermediaries for A Class, B
Class, C Class and R Class shares. Fees incurred under the plans during the
six months ended September 30, 2007, are detailed in the Statement of
Operations.
RELATED PARTIES -- Certain officers and trustees of the trust are also
officers and/or directors, and, as a group, controlling stockholders of
American Century Companies, Inc. (ACC), the parent of the trust's investment
advisor, ACIM, the distributor of the trust, ACIS, and the trust's transfer
agent, American Century Services, LLC. ACIM owns 76% and 99% of the shares of
Short Duration and Core Plus, respectively.
The funds have a bank line of credit agreement and securities lending
agreement with JPMorgan Chase Bank (JPMCB). JPMCB is a custodian of the funds
and a wholly owned subsidiary of JPMorgan Chase & Co. (JPM). JPM is an equity
investor in ACC.
- ------
28
3. INVESTMENT TRANSACTIONS
Investment transactions, excluding short-term investments, for the six months
ended September 30, 2007, were as follows:
Short Core Plus
Duration
PURCHASES
U.S. Treasury & Government Agency Obligations $4,478,849 $35,316,849
Investment securities other than U.S. Treasury & $905,126 $3,299,122
Government Agency Obligations
PROCEEDS FROM SALES
U.S. Treasury & Government Agency Obligations $1,832,571 $38,023,929
Investment securities other than U.S. Treasury & $647,461 $1,326,266
Government Agency Obligations
4. CAPITAL SHARE TRANSACTIONS
Transactions in shares of the funds were as follows (unlimited number of
shares authorized):
Short Duration
Six months ended Period ended March 31,
September 30, 2007 2007(1)
Shares Amount Shares Amount
INVESTOR CLASS
Sold 8,550 $ 85,126 167,571 $ 1,675,623
Issued in reinvestment of
distributions 3,909 38,951 2,469 24,692
Redeemed (2,786) (27,834) -- --
------- ---------- --------- -----------
9,673 96,243 170,040 1,700,315
------- ---------- --------- -----------
INSTITUTIONAL CLASS
Sold -- -- 166,694 1,666,883
Issued in reinvestment of
distributions 4,022 40,079 2,574 25,741
------- ---------- --------- -----------
4,022 40,079 169,268 1,692,624
------- ---------- --------- -----------
A CLASS
Sold 225,689 2,256,428 166,692 1,666,863
Issued in reinvestment of
distributions 3,771 37,586 2,323 23,233
------- ---------- --------- -----------
229,460 2,294,014 169,015 1,690,096
------- ---------- --------- -----------
B CLASS
Sold 4,833 48,276 166,687 1,666,829
Issued in reinvestment of
distributions 2,985 29,743 1,906 19,059
Redeemed (3,191) (31,945) -- --
------- ---------- --------- -----------
4,627 46,074 168,593 1,685,888
------- ---------- --------- -----------
C CLASS
Sold 85,947 856,350 166,687 1,666,829
Issued in reinvestment of
distributions 3,398 33,876 1,906 19,059
------- ---------- --------- -----------
89,345 890,226 168,593 1,685,888
------- ---------- --------- -----------
R CLASS
Sold -- -- 166,690 1,666,852
Issued in reinvestment of
distributions 3,413 34,007 2,184 21,841
------- ---------- --------- -----------
3,413 34,007 168,874 1,688,693
------- ---------- --------- -----------
Net increase (decrease) 340,540 $3,400,643 1,014,383 $10,143,504
======= ========== ========= ===========
(1) November 30, 2006 (fund inception) through March 31, 2007.
- ------
29
Core Plus
Six months ended Period ended March 31,
September 30, 2007 2007(1)
Shares Amount Shares Amount
INVESTOR CLASS
Sold 119 $ 1,178 416,804 $ 4,167,838
Issued in reinvestment of
distributions 9,425 93,036 6,101 60,762
Redeemed -- -- (25) (249)
------ -------- --------- -----------
9,544 94,214 422,880 4,228,351
------ -------- --------- -----------
INSTITUTIONAL CLASS
Sold -- -- 416,752 4,167,312
Issued in reinvestment of
distributions 9,859 97,312 6,379 63,536
------ -------- --------- -----------
9,859 97,312 423,131 4,230,848
------ -------- --------- -----------
A CLASS
Sold 30,805 307,085 416,745 4,167,260
Issued in reinvestment of
distributions 8,889 87,738 5,752 57,289
------ -------- --------- -----------
39,694 394,823 422,497 4,224,549
------ -------- --------- -----------
B CLASS
Sold -- -- 416,733 4,167,172
Issued in reinvestment of
distributions 7,259 71,651 4,708 46,893
------ -------- --------- -----------
7,259 71,651 421,441 4,214,065
------ -------- --------- -----------
C CLASS
Sold -- -- 416,733 4,167,172
Issued in reinvestment of
distributions 7,259 71,651 4,708 46,893
------ -------- --------- -----------
7,259 71,651 421,441 4,214,065
------ -------- --------- -----------
R CLASS
Sold -- -- 416,740 4,167,230
Issued in reinvestment of
distributions 8,338 82,303 5,404 53,822
8,338 82,303 422,144 4,221,052
------ -------- --------- -----------
Net increase (decrease) 81,953 $811,954 2,533,534 $25,332,930
====== ======== ========= ===========
(1) November 30, 2006 (fund inception) through March 31, 2007.
5. SECURITIES LENDING
As of September 30, 2007, securities in Short Duration and Core Plus valued at
$3,898,930 and $2,448,972, respectively, were on loan through the lending
agent, JPMCB, to certain approved borrowers. JPMCB receives and maintains
collateral in the form of cash and/or acceptable securities as approved by
ACIM. Cash collateral is invested in authorized investments by the lending
agent in a pooled account. The value of cash collateral received at period end
is disclosed in the Statement of Assets and Liabilities and investments made
with the cash by the lending agent are listed in the Schedule of Investments.
Any deficiencies or excess of collateral must be delivered or transferred by
the member firms no later than the close of business on the next business day.
The total value of all collateral received, at this date, was $3,960,993 and
$2,489,055, respectively. The funds' risks in securities lending are that the
borrower may not provide additional collateral when required or return the
securities when due. If the borrower defaults, receipt of the collateral by
the funds may be delayed or limited.
6. BANK LINE OF CREDIT
The funds, along with certain other funds managed by ACIM or ACGIM, have a
$500,000,000 unsecured bank line of credit agreement with JPMCB. The funds may
borrow money for temporary or emergency purposes to fund shareholder
redemptions. Borrowings under the agreement bear interest at the Federal Funds
rate plus 0.40%. The funds did not borrow from the line during the six months
ended September 30, 2007.
- ------
30
7. RISK FACTORS
There are certain risks involved in investing in foreign securities. These
risks include those resulting from future adverse political, social, and
economic developments, fluctuations in currency exchange rates, the possible
imposition of exchange controls, and other foreign laws or restrictions.
Investing in emerging markets may accentuate these risks.
8. FEDERAL TAX INFORMATION
The book-basis character of distributions made during the year from net
investment income or net realized gains may differ from their ultimate
characterization for federal income tax purposes. These differences reflect
the differing character of paydown losses, certain income items and net
realized gains and losses for financial statement and tax purposes, and may
result in reclassification among certain capital accounts on the financial
statements. Reclassifications between income and realized gain relate
primarily to the interest on swap agreements.
As of September 30, 2007, the components of investments for federal income tax
purposes were as follows:
Short Duration Core Plus
Federal tax cost of investments $17,553,455 $30,733,458
=========== ===========
Gross tax appreciation of investments $93,199 $188,221
Gross tax depreciation of investments (11,185) (145,650)
----------- -----------
Net tax appreciation (depreciation) of investments $82,014 $42,571
=========== ===========
The difference between book-basis and tax-basis cost and unrealized
appreciation (depreciation) is attributable primarily to the tax deferral of
losses on wash sales.
Short Duration and Core Plus had capital loss deferrals of $(31,734) and
$(145,000), respectively, which represent net capital losses incurred during
the period November 30, 2006 (fund inception) through March 31, 2007. The
funds have elected to treat such losses as having been incurred in the
following fiscal year for federal income tax purposes.
9. RECENTLY ISSUED ACCOUNTING STANDARDS
In June 2006, the Financial Accounting Standards Board (FASB) issued
Interpretation No. 48, "Accounting for Uncertainty in Income Taxes - an
Interpretation of FASB Statement No. 109" (FIN 48). FIN 48 establishes a
minimum threshold for financial statement recognition of the benefit of
positions taken in filing tax returns (including whether an entity is taxable
in a particular jurisdiction), and requires certain expanded tax disclosures.
FIN 48 is effective for fiscal years beginning after December 15, 2006, and is
to be applied to all open tax years as of the date of effectiveness.
Management has concluded that the adoption of FIN 48 will not materially
impact the financial statements.
The FASB issued Statement of Financial Accounting Standards No. 157, "Fair
Value Measurements" (FAS 157), in September 2006, which is effective for
fiscal years beginning after November 15, 2007. FAS 157 defines fair value,
establishes a framework for measuring fair value and expands the required
financial statement disclosures about fair value measurements. Management is
currently evaluating the impact that adopting FAS 157 will have on the
financial statement disclosures.
- ------
31
FINANCIAL HIGHLIGHTS
Short Duration
Investor Class
For a Share Outstanding Throughout the Periods Indicated
2007(1) 2007(2)
PER-SHARE DATA
Net Asset Value, Beginning of Period $10.00 $10.00
-------- --------
Income From Investment Operations
Net Investment Income (Loss)(3) 0.23 0.15
Net Realized and Unrealized Gain (Loss) 0.03 --(4)
-------- --------
Total From Investment Operations 0.26 0.15
-------- --------
Distributions
From Net Investment Income (0.23) (0.15)
-------- --------
Net Asset Value, End of Period $10.03 $10.00
======== ========
TOTAL RETURN(5) 2.59% 1.46%
RATIOS/SUPPLEMENTAL DATA
Ratio of Operating Expenses to Average Net Assets 0.62%(6) 0.62%(6)
Ratio of Net Investment Income (Loss) to Average Net Assets 4.62%(6) 4.48%(6)
Portfolio Turnover Rate 26% 157%
Net Assets, End of Period (in thousands) $1,802 $1,700
(1) Six months ended September 30, 2007 (unaudited).
(2) November 30, 2006 (fund inception) through March 31, 2007.
(3) Computed using average shares outstanding throughout the period.
(4) Per-share amount was less than $0.005.
(5) Total return assumes reinvestment of net investment income and capital
gains distributions, if any. Total returns for periods less than one year are
not annualized. The total return of the classes may not precisely reflect the
class expense differences because of the impact of calculating the net asset
values to two decimal places. If net asset values were calculated to three
decimal places, the total return differences would more closely reflect the
class expense differences. The calculation of net asset values to two decimal
places is made in accordance with SEC guidelines and does not result in any
gain or loss of value between one class and another.
(6) Annualized.
See Notes to Financial Statements.
- ------
32
Short Duration
Institutional Class
For a Share Outstanding Throughout the Periods Indicated
2007(1) 2007(2)
PER-SHARE DATA
Net Asset Value, Beginning of Period $10.00 $10.00
-------- --------
Income From Investment Operations
Net Investment Income (Loss)(3) 0.24 0.15
Net Realized and Unrealized Gain (Loss) 0.03 --(4)
-------- --------
Total From Investment Operations 0.27 0.15
-------- --------
Distributions
From Net Investment Income (0.24) (0.15)
-------- --------
Net Asset Value, End of Period $10.03 $10.00
======== ========
TOTAL RETURN(5) 2.70% 1.52%
RATIOS/SUPPLEMENTAL DATA
Ratio of Operating Expenses to Average Net Assets 0.42%(6) 0.42%(6)
Ratio of Net Investment Income (Loss) to Average Net Assets 4.82%(6) 4.68%(6)
Portfolio Turnover Rate 26% 157%
Net Assets, End of Period (in thousands) $1,738 $1,693
(1) Six months ended September 30, 2007 (unaudited).
(2) November 30, 2006 (fund inception) through March 31, 2007.
(3) Computed using average shares outstanding throughout the period.
(4) Per-share amount was less than $0.005.
(5) Total return assumes reinvestment of net investment income and capital
gains distributions, if any. Total returns for periods less than one year are
not annualized. The total return of the classes may not precisely reflect the
class expense differences because of the impact of calculating the net asset
values to two decimal places. If net asset values were calculated to three
decimal places, the total return differences would more closely reflect the
class expense differences. The calculation of net asset values to two decimal
places is made in accordance with SEC guidelines and does not result in any
gain or loss of value between one class and another.
(6) Annualized.
See Notes to Financial Statements.
- ------
33
Short Duration
A Class
For a Share Outstanding Throughout the Periods Indicated
2007(1) 2007(2)
PER-SHARE DATA
Net Asset Value, Beginning of Period $10.00 $10.00
-------- --------
Income From Investment Operations
Net Investment Income (Loss)(3) 0.22 0.14
Net Realized and Unrealized Gain (Loss) 0.02 --(4)
-------- --------
Total From Investment Operations 0.24 0.14
-------- --------
Distributions
From Net Investment Income (0.21) (0.14)
-------- --------
Net Asset Value, End of Period $10.03 $10.00
======== ========
TOTAL RETURN(5) 2.47% 1.37%
RATIOS/SUPPLEMENTAL DATA
Ratio of Operating Expenses to Average Net Assets 0.87%(6) 0.87%(6)
Ratio of Net Investment Income (Loss) to Average Net Assets 4.37%(6) 4.23%(6)
Portfolio Turnover Rate 26% 157%
Net Assets, End of Period (in thousands) $3,997 $1,690
(1) Six months ended September 30, 2007 (unaudited).
(2) November 30, 2006 (fund inception) through March 31, 2007.
(3) Computed using average shares outstanding throughout the period.
(4) Per-share amount was less than $0.005.
(5) Total return assumes reinvestment of net investment income and capital
gains distributions, if any, and does not reflect applicable sales charges.
Total returns for periods less than one year are not annualized. The total
return of the classes may not precisely reflect the class expense differences
because of the impact of calculating the net asset values to two decimal
places. If net asset values were calculated to three decimal places, the total
return differences would more closely reflect the class expense differences.
The calculation of net asset values to two decimal places is made in
accordance with SEC guidelines and does not result in any gain or loss of
value between one class and another.
(6) Annualized.
See Notes to Financial Statements.
- ------
34
Short Duration
B Class
For a Share Outstanding Throughout the Periods Indicated
2007(1) 2007(2)
PER-SHARE DATA
Net Asset Value, Beginning of Period $10.00 $10.00
-------- --------
Income From Investment Operations
Net Investment Income (Loss)(3) 0.18 0.11
Net Realized and Unrealized Gain (Loss) 0.03 --(4)
-------- --------
Total From Investment Operations 0.21 0.11
-------- --------
Distributions
From Net Investment Income (0.18) (0.11)
-------- --------
Net Asset Value, End of Period $10.03 $10.00
======== ========
TOTAL RETURN(5) 2.08% 1.13%
RATIOS/SUPPLEMENTAL DATA
Ratio of Operating Expenses to Average Net Assets 1.62%(6) 1.62%(6)
Ratio of Net Investment Income (Loss) to Average Net Assets 3.62%(6) 3.48%(6)
Portfolio Turnover Rate 26% 157%
Net Assets, End of Period (in thousands) $1,737 $1,686
(1) Six months ended September 30, 2007 (unaudited).
(2) November 30, 2006 (fund inception) through March 31, 2007.
(3) Computed using average shares outstanding throughout the period.
(4) Per-share amount was less than $0.005.
(5) Total return assumes reinvestment of net investment income and capital
gains distributions, if any, and does not reflect applicable sales charges.
Total returns for periods less than one year are not annualized. The total
return of the classes may not precisely reflect the class expense differences
because of the impact of calculating the net asset values to two decimal
places. If net asset values were calculated to three decimal places, the total
return differences would more closely reflect the class expense differences.
The calculation of net asset values to two decimal places is made in
accordance with SEC guidelines and does not result in any gain or loss of
value between one class and another.
(6) Annualized.
See Notes to Financial Statements.
- ------
35
Short Duration
C Class
For a Share Outstanding Throughout the Periods Indicated
2007(1) 2007(2)
PER-SHARE DATA
Net Asset Value, Beginning of Period $10.00 $10.00
-------- --------
Income From Investment Operations
Net Investment Income (Loss)(3) 0.18 0.11
Net Realized and Unrealized Gain (Loss) 0.03 --(4)
-------- --------
Total From Investment Operations 0.21 0.11
-------- --------
Distributions
From Net Investment Income (0.18) (0.11)
-------- --------
Net Asset Value, End of Period $10.03 $10.00
======== ========
TOTAL RETURN(5) 2.09% 1.13%
RATIOS/SUPPLEMENTAL DATA
Ratio of Operating Expenses
to Average Net Assets 1.62%(6) 1.62%(6)
Ratio of Net Investment Income
(Loss) to Average Net Assets 3.62%(6) 3.48%(6)
Portfolio Turnover Rate 26% 157%
Net Assets, End of
Period (in thousands) $2,587 $1,686
(1) Six months ended September 30, 2007 (unaudited).
(2) November 30, 2006 (fund inception) through March 31, 2007.
(3) Computed using average shares outstanding throughout the period.
(4) Per-share amount was less than $0.005.
(5) Total return assumes reinvestment of net investment income and capital
gains distributions, if any, and does not reflect applicable sales charges.
Total returns for periods less than one year are not annualized. The total
return of the classes may not precisely reflect the class expense differences
because of the impact of calculating the net asset values to two decimal
places. If net asset values were calculated to three decimal places, the total
return differences would more closely reflect the class expense differences.
The calculation of net asset values to two decimal places is made in
accordance with SEC guidelines and does not result in any gain or loss of
value between one class and another.
(6) Annualized.
See Notes to Financial Statements.
- --------
36
Short Duration
R Class
For a Share Outstanding Throughout the Periods Indicated
2007(1) 2007(2)
PER-SHARE DATA
Net Asset Value, Beginning of Period $10.00 $10.00
-------- --------
Income From Investment Operations
Net Investment Income (Loss)(3) 0.20 0.13
Net Realized and Unrealized Gain (Loss) 0.03 --(4)
-------- --------
Total From Investment Operations 0.23 0.13
-------- --------
Distributions
From Net Investment Income (0.20) (0.13)
-------- --------
Net Asset Value, End of Period $10.03 $10.00
======== ========
TOTAL RETURN(5) 2.34% 1.29%
RATIOS/SUPPLEMENTAL DATA
Ratio of Operating Expenses to Average Net Assets 1.12%(6) 1.12%(6)
Ratio of Net Investment Income (Loss) to Average Net Assets 4.12%(6) 3.98%(6)
Portfolio Turnover Rate 26% 157%
Net Assets, End of Period (in thousands) $1,728 $1,689
(1) Six months ended September 30, 2007 (unaudited).
(2) November 30, 2006 (fund inception) through March 31, 2007.
(3) Computed using average shares outstanding throughout the period.
(4) Per-share amount was less than $0.005.
(5) Total return assumes reinvestment of net investment income and capital
gains distributions, if any. Total returns for periods less than one year are
not annualized. The total return of the classes may not precisely reflect the
class expense differences because of the impact of calculating the net asset
values to two decimal places. If net asset values were calculated to three
decimal places, the total return differences would more closely reflect the
class expense differences. The calculation of net asset values to two decimal
places is made in accordance with SEC guidelines and does not result in any
gain or loss of value between one class and another.
(6) Annualized.
See Notes to Financial Statements.
- ------
37
Core Plus
Investor Class
For a Share Outstanding Throughout the Periods Indicated
2007(1) 2007(2)
PER-SHARE DATA
Net Asset Value, Beginning of Period $9.96 $10.00
-------- --------
Income From Investment Operations
Net Investment Income (Loss)(3) 0.22 0.14
Net Realized and Unrealized Gain (Loss) 0.02 (0.03)
-------- --------
Total From Investment Operations 0.24 0.11
-------- --------
Distributions
From Net Investment Income (0.22) (0.15)
-------- --------
Net Asset Value, End of Period $9.98 $9.96
======== ========
TOTAL RETURN(4) 2.45% 1.04%
RATIOS/SUPPLEMENTAL DATA
Ratio of Operating Expenses to Average Net Assets 0.67%(5) 0.67%(5)
Ratio of Net Investment Income (Loss) to Average Net Assets 4.56%(5) 4.44%(5)
Portfolio Turnover Rate 138% 133%
Net Assets, End of Period (in thousands) $4,316 $4,211
(1) Six months ended September 30, 2007 (unaudited).
(2) November 30, 2006 (fund inception) through March 31, 2007.
(3) Computed using average shares outstanding throughout the period.
(4) Total return assumes reinvestment of net investment income and capital
gains distributions, if any. Total returns for periods less than one year are
not annualized. The total return of the classes may not precisely reflect the
class expense differences because of the impact of calculating the net asset
values to two decimal places. If net asset values were calculated to three
decimal places, the total return differences would more closely reflect the
class expense differences. The calculation of net asset values to two decimal
places is made in accordance with SEC guidelines and does not result in any
gain or loss of value between one class and another.
(5) Annualized.
See Notes to Financial Statements.
- ------
38
Core Plus
Institutional Class
For a Share Outstanding Throughout the Periods Indicated
2007(1) 2007(2)
PER-SHARE DATA
Net Asset Value, Beginning of Period $9.96 $10.00
-------- --------
Income From Investment Operations
Net Investment Income (Loss)(3) 0.23 0.15
Net Realized and Unrealized Gain (Loss) 0.02 (0.04)
-------- --------
Total From Investment Operations 0.25 0.11
-------- --------
Distributions
From Net Investment Income (0.23) (0.15)
-------- --------
Net Asset Value, End of Period $9.98 $9.96
======== ========
TOTAL RETURN(4) 2.55% 1.11%
RATIOS/SUPPLEMENTAL DATA
Ratio of Operating Expenses to Average Net Assets 0.47%(5) 0.47%(5)
Ratio of Net Investment Income (Loss) to Average Net Assets 4.76%(5) 4.64%(5)
Portfolio Turnover Rate 138% 133%
Net Assets, End of Period (in thousands) $4,322 $4,214
(1) Six months ended September 30, 2007 (unaudited).
(2) November 30, 2006 (fund inception) through March 31, 2007.
(3) Computed using average shares outstanding throughout the period.
(4) Total return assumes reinvestment of net investment income and capital
gains distributions, if any. Total returns for periods less than one year are
not annualized. The total return of the classes may not precisely reflect the
class expense differences because of the impact of calculating the net asset
values to two decimal places. If net asset values were calculated to three
decimal places, the total return differences would more closely reflect the
class expense differences. The calculation of net asset values to two decimal
places is made in accordance with SEC guidelines and does not result in any
gain or loss of value between one class and another.
(5) Annualized.
See Notes to Financial Statements.
- ------
39
Core Plus
A Class
For a Share Outstanding Throughout the Periods Indicated
2007(1) 2007(2)
PER-SHARE DATA
Net Asset Value, Beginning of Period $9.96 $10.00
-------- --------
Income From Investment Operations
Net Investment Income (Loss)(3) 0.21 0.14
Net Realized and Unrealized Gain (Loss) 0.02 (0.04)
-------- --------
Total From Investment Operations 0.23 0.10
-------- --------
Distributions
From Net Investment Income (0.21) (0.14)
-------- --------
Net Asset Value, End of Period $9.98 $9.96
======== ========
TOTAL RETURN(4) 2.32% 0.96%
RATIOS/SUPPLEMENTAL DATA
Ratio of Operating Expenses to Average Net Assets 0.92%(5) 0.92%(5)
Ratio of Net Investment Income (Loss) to Average Net Assets 4.31%(5) 4.19%(5)
Portfolio Turnover Rate 138% 133%
Net Assets, End of Period (in thousands) $4,613 $4,207
(1) Six months ended September 30, 2007 (unaudited).
(2) November 30, 2006 (fund inception) through March 31, 2007.
(3) Computed using average shares outstanding throughout the period.
(4) Total return assumes reinvestment of net investment income and capital
gains distributions, if any, and does not reflect applicable sales charges.
Total returns for periods less than one year are not annualized. The total
return of the classes may not precisely reflect the class expense differences
because of the impact of calculating the net asset values to two decimal
places. If net asset values were calculated to three decimal places, the total
return differences would more closely reflect the class expense differences.
The calculation of net asset values to two decimal places is made in
accordance with SEC guidelines and does not result in any gain or loss of
value between one class and another.
(5) Annualized.
See Notes to Financial Statements.
- ------
40
Core Plus
B Class
For a Share Outstanding Throughout the Periods Indicated
2007(1) 2007(2)
PER-SHARE DATA
Net Asset Value, Beginning of Period $9.96 $10.00
-------- --------
Income From Investment Operations
Net Investment Income (Loss)(3) 0.18 0.11
Net Realized and Unrealized Gain (Loss) 0.01 (0.04)
-------- --------
Total From Investment Operations 0.19 0.07
-------- --------
Distributions
From Net Investment Income (0.17) (0.11)
-------- --------
Net Asset Value, End of Period $9.98 $9.96
======== ========
TOTAL RETURN(4) 1.94% 0.71%
RATIOS/SUPPLEMENTAL DATA
Ratio of Operating Expenses to Average Net Assets 1.67%(5) 1.67%(5)
Ratio of Net Investment Income (Loss) to Average Net Assets 3.56%(5) 3.44%(5)
Portfolio Turnover Rate 138% 133%
Net Assets, End of Period (in thousands) $4,279 $4,197
(1) Six months ended September 30, 2007 (unaudited).
(2) November 30, 2006 (fund inception) through March 31, 2007.
(3) Computed using average shares outstanding throughout the period.
(4) Total return assumes reinvestment of net investment income and capital
gains distributions, if any, and does not reflect applicable sales charges.
Total returns for periods less than one year are not annualized. The total
return of the classes may not precisely reflect the class expense differences
because of the impact of calculating the net asset values to two decimal
places. If net asset values were calculated to three decimal places, the total
return differences would more closely reflect the class expense differences.
The calculation of net asset values to two decimal places is made in
accordance with SEC guidelines and does not result in any gain or loss of
value between one class and another.
(5) Annualized.
See Notes to Financial Statements.
- ------
41
Core Plus
C Class
For a Share Outstanding Throughout the Periods Indicated
2007(1) 2007(2)
PER-SHARE DATA
Net Asset Value, Beginning of Period $9.96 $10.00
-------- --------
Income From Investment Operations
Net Investment Income (Loss)(3) 0.18 0.11
Net Realized and Unrealized Gain (Loss) 0.01 (0.04)
-------- --------
Total From Investment Operations 0.19 0.07
-------- --------
Distributions
From Net Investment Income (0.17) (0.11)
-------- --------
Net Asset Value, End of Period $9.98 $9.96
======== ========
TOTAL RETURN(4) 1.94% 0.71%
RATIOS/SUPPLEMENTAL DATA
Ratio of Operating Expenses to Average Net Assets 1.67%(5) 1.67%(5)
Ratio of Net Investment Income (Loss) to Average Net Assets 3.56%(5) 3.44%(5)
Portfolio Turnover Rate 138% 133%
Net Assets, End of Period (in thousands) $4,279 $4,197
(1) Six months ended September 30, 2007 (unaudited).
(2) November 30, 2006 (fund inception) through March 31, 2007.
(3) Computed using average shares outstanding throughout the period.
(4) Total return assumes reinvestment of net investment income and capital
gains distributions, if any, and does not reflect applicable sales charges.
Total returns for periods less than one year are not annualized. The total
return of the classes may not precisely reflect the class expense differences
because of the impact of calculating the net asset values to two decimal
places. If net asset values were calculated to three decimal places, the total
return differences would more closely reflect the class expense differences.
The calculation of net asset values to two decimal places is made in
accordance with SEC guidelines and does not result in any gain or loss of
value between one class and another.
(5) Annualized.
See Notes to Financial Statements.
- ------
42
Core Plus
R Class
For a Share Outstanding Throughout the Periods Indicated
2007(1) 2007(2)
PER-SHARE DATA
Net Asset Value, Beginning of Period $9.96 $10.00
-------- --------
Income From Investment Operations
Net Investment Income (Loss)(3) 0.20 0.13
Net Realized and Unrealized Gain (Loss) 0.01 (0.04)
-------- --------
Total From Investment Operations 0.21 0.09
-------- --------
Distributions
From Net Investment Income (0.19) (0.13)
-------- --------
Net Asset Value, End of Period $9.98 $9.96
======== ========
TOTAL RETURN(4) 2.19% 0.88%
RATIOS/SUPPLEMENTAL DATA
Ratio of Operating Expenses to Average Net Assets 1.17%(5) 1.17%(5)
Ratio of Net Investment Income (Loss) to Average Net Assets 4.06%(5) 3.94%(5)
Portfolio Turnover Rate 138% 133%
Net Assets, End of Period (in thousands) $4,297 $4,204
(1) Six months ended September 30, 2007 (unaudited).
(2) November 30, 2006 (fund inception) through March 31, 2007.
(3) Computed using average shares outstanding throughout the period.
(4) Total return assumes reinvestment of net investment income and capital
gains distributions, if any. Total returns for periods less than one year are
not annualized. The total return of the classes may not precisely reflect the
class expense differences because of the impact of calculating the net asset
values to two decimal places. If net asset values were calculated to three
decimal places, the total return differences would more closely reflect the
class expense differences. The calculation of net asset values to two decimal
places is made in accordance with SEC guidelines and does not result in any
gain or loss of value between one class and another.
(5) Annualized.
See Notes to Financial Statements.
- ------
43
PROXY VOTING RESULTS
A special meeting of shareholders was held on July 27, 2007, to vote on the
following proposal. The proposal received the required number of votes of the
American Century Investment Trust and was adopted. A summary of voting results
is listed below the proposal.
PROPOSAL:
To elect eight Trustees to the Board of Trustees of American Century
Investment Trust (the proposal was voted on by all shareholders of funds
issued by American Century Investment Trust).
Jonathan S. Thomas For: 3,336,300,729
Withhold: 35,929,005
Abstain: 0
Broker Non-Vote: 0
John Freidenrich For: 3,337,319,127
Withhold: 34,910,607
Abstain: 0
Broker Non-Vote: 0
Ronald J. Gilson For: 3,337,806,752
Withhold: 34,422,982
Abstain: 0
Broker Non-Vote: 0
Kathryn A. Hall For: 3,337,653,997
Withhold: 34,575,737
Abstain: 0
Broker Non-Vote: 0
Peter F. Pervere For: 3,336,793,063
Withhold: 35,436,671
Abstain: 0
Broker Non-Vote: 0
Myron S. Scholes For: 3,335,709,158
Withhold: 36,520,576
Abstain: 0
Broker Non-Vote: 0
John B. Shoven For: 3,337,333,277
Withhold: 34,896,457
Abstain: 0
Broker Non-Vote: 0
Jeanne D. Wohlers For: 3,336,368,531
Withhold: 35,861,203
Abstain: 0
Broker Non-Vote: 0
- ------
44
SHARE CLASS INFORMATION
Six classes of shares are authorized for sale by the funds: Investor Class,
Institutional Class, A Class, B Class, C Class and R Class. The total expense
ratio of Institutional Class shares is lower than that of Investor Class
shares. The total expense ratios of A Class, B Class, C Class and R Class
shares are higher than that of Investor Class shares.
INVESTOR CLASS shares are available for purchase in two ways: 1) directly from
American Century without any commissions or other fees; and/or 2) through
certain financial intermediaries (such as banks, broker-dealers, insurance
companies and investment advisors), which may require payment of a transaction
fee to the financial intermediary. The funds' prospectuses contain additional
information regarding eligibility for Investor Class shares.
INSTITUTIONAL CLASS shares are available to large investors such as
endowments, foundations, and retirement plans, and to financial intermediaries
serving these investors. This class recognizes the relatively lower cost of
serving institutional customers and others who invest at least $5 million ($3
million for endowments and foundations) in an American Century fund or at
least $10 million in multiple funds. In recognition of the larger investments
and account balances and comparatively lower transaction costs, the unified
management fee of Institutional Class shares is 0.20% less than the unified
management fee of Investor Class shares.
A CLASS shares are sold primarily through employer-sponsored retirement plans
and through institutions such as investment advisors, banks, broker-dealers,
and insurance companies. A Class shares are sold at their offering price,
which is net asset value plus an initial sales charge that ranges from 4.50%
to 0.00% for fixed-income funds, depending on the amount invested. The initial
sales charge is deducted from the purchase amount before it is invested. A
Class shares may be subject to a contingent deferred sales charge (CDSC).
There is no CDSC on shares acquired through reinvestment of dividends or
capital gains. The prospectus contains information regarding reductions and
waivers of sales charges for A Class shares. The unified management fee for A
Class shares is the same as for Investor Class shares. A Class shares also are
subject to a 0.25% annual Rule 12b-1 distribution and service fee.
B CLASS shares are sold primarily through employer-sponsored retirement plans
and through institutions such as investment advisors, banks, broker-dealers,
and insurance companies. B Class shares redeemed within six years of purchase
are subject to a CDSC that declines from 5.00% during the first year after
purchase to 0.00% after the sixth year. There is no CDSC on shares acquired
through reinvestment of dividends or capital gains. The unified management fee
for B Class shares is the same as for Investor Class shares. B Class shares
also are subject to a 1.00% annual Rule 12b-1 distribution and service fee. B
Class shares automatically convert to A Class shares (with lower expenses)
eight years after their purchase date.
C CLASS shares are sold primarily through employer-sponsored retirement plans
and through institutions such as investment advisors, banks, broker-dealers,
and insurance companies. C Class shares redeemed within 12 months of purchase
are subject to a CDSC of 1.00%. There is no CDSC on shares acquired through
reinvestment of dividends or capital gains. The unified management fee for C
Class shares is the same as for Investor Class shares. C Class shares also are
subject to a Rule 12b-1 distribution and service fee of 1.00%.
- ------
45
R CLASS shares are sold primarily through employer-sponsored retirement plans
and through institutions such as investment advisors, banks, broker-dealers,
and insurance companies. The unified management fee for R Class shares is the
same as for Investor Class shares. R Class shares are subject to a 0.50%
annual Rule 12b-1 distribution and service fee.
All classes of shares represent a pro rata interest in the funds and generally
have the same rights and preferences.
- ------
46
ADDITIONAL INFORMATION
RETIREMENT ACCOUNT INFORMATION
As required by law, any distributions you receive from an IRA or certain
403(b), 457 and qualified plans [those not eligible for rollover to an IRA or
to another qualified plan] are subject to federal income tax withholding,
unless you elect not to have withholding apply. Tax will be withheld on the
total amount withdrawn even though you may be receiving amounts that are not
subject to withholding, such as nondeductible contributions. In such case,
excess amounts of withholding could occur. You may adjust your withholding
election so that a greater or lesser amount will be withheld.
If you don't want us to withhold on this amount, you must notify us to not
withhold the federal income tax. Even if you plan to roll over the amount you
withdraw to another tax-deferred account, the withholding rate still applies
to the withdrawn amount unless we have received notice not to withhold federal
income tax prior to the withdrawal. You may notify us in writing or in certain
situations by telephone or through other electronic means. You have the right
to revoke your withholding election at any time and any election you make may
remain in effect until revoked by filing a new election.
Remember, even if you elect not to have income tax withheld, you are liable
for paying income tax on the taxable portion of your withdrawal. If you elect
not to have income tax withheld or you don't have enough income tax withheld,
you may be responsible for payment of estimated tax. You may incur penalties
under the estimated tax rules if your withholding and estimated tax payments
are not sufficient.
State tax will be withheld if, at the time of your distribution, your address
is within one of the mandatory withholding states and you have federal income
tax withheld. State taxes will be withheld from your distribution in
accordance with the respective state rules.
PROXY VOTING GUIDELINES
American Century Investment Management, Inc., the funds' investment advisor,
is responsible for exercising the voting rights associated with the securities
purchased and/or held by the funds. A description of the policies and
procedures the advisor uses in fulfilling this responsibility is available
without charge, upon request, by calling 1-800-345-2021. It is also available
on American Century's website at americancentury.com and on the Securities and
Exchange Commission's website at sec.gov. Information regarding how the
investment advisor voted proxies relating to portfolio securities during the
most recent 12-month period ended June 30 is available on the "About Us" page
at americancentury.com. It is also available at sec.gov.
QUARTERLY PORTFOLIO DISCLOSURE
The funds file their complete schedule of portfolio holdings with the
Securities and Exchange Commission (SEC) for the first and third quarters of
each fiscal year on Form N-Q. The funds' Forms N-Q are available on the SEC's
website at sec.gov, and may be reviewed and copied at the SEC's Public
Reference Room in Washington, DC. Information on the operation of the Public
Reference Room may be obtained by calling 1-800-SEC-0330. The funds also make
their complete schedule of portfolio holdings for the most recent quarter of
their fiscal year available on their website at americancentury.com and, upon
request, by calling 1-800-345-2021.
- ------
47
INDEX DEFINITIONS
The following indices are used to illustrate investment market, sector, or
style performance or to serve as fund performance comparisons. They are not
investment products available for purchase.
The CITIGROUP AGENCY INDEX is a market-capitalization-weighted index that
includes U.S. government sponsored agencies with a remaining maturity of at
least one year.
The CITIGROUP CREDIT INDEX includes US and non-US corporate securities and
non-US sovereign and provincial securities.
The CITIGROUP GOVERNMENT/CORPORATE 1- TO 3-YEAR INDEX is a
market-capitalization-weighted index that includes fixed-rate government and
corporate issues with maturities between one and three years.
The CITIGROUP MORTGAGE INDEX measures the mortgage component of the US BIG
Index, comprising 30- and 15-year GNMA, FNMA, and FHLMC pass-throughs and FNMA
and FHLMC balloon mortgages.
The CITIGROUP TREASURY INDEX is comprised of U.S. Treasury securities with an
amount outstanding of at least $5 billion and a remaining maturity of at least
one year.
The CITIGROUP US BROAD INVESTMENT-GRADE (BIG) BOND INDEX is a market-
capitalization-weighted index that includes fixed-rate Treasury, government-
sponsored, mortgage, asset-backed, and investment-grade issues with a maturity
of one year or longer.
The CITIGROUP US HIGH-YIELD MARKET INDEX captures the performance of below-
investment-grade debt issued by corporations domiciled in the United States or
Canada. This index includes cash-pay and deferred-interest securities that are
publicly placed, have a fixed coupon, and are nonconvertible.
The CITIGROUP US INFLATION-LINKED SECURITIES INDEX (ILSI) measures the return
of bonds with fixed-rate coupon payments that adjust for inflation as measured
by the Consumer Price Index (CPI).
- ------
48
[back cover]
CONTACT US
AMERICANCENTURY.COM
AUTOMATED INFORMATION LINE:
1-800-345-8765
INVESTOR SERVICES REPRESENTATIVE:
1-800-345-2021 or 816-531-5575
INVESTORS USING ADVISORS:
1-800-378-9878
BUSINESS, NOT-FOR-PROFIT,
EMPLOYER-SPONSORED RETIREMENT PLANS:
1-800-345-3533
BANKS AND TRUST COMPANIES, BROKER-DEALERS,
FINANCIAL PROFESSIONALS, INSURANCE COMPANIES:
1-800-345-6488
TELECOMMUNICATIONS DEVICE FOR THE DEAF:
1-800-634-4113 or 816-444-3485
AMERICAN CENTURY INVESTMENT TRUST
INVESTMENT ADVISOR:
American Century Investment Management, Inc.
Kansas City, Missouri
THIS REPORT AND THE STATEMENTS IT CONTAINS ARE SUBMITTED FOR THE GENERAL
INFORMATION OF OUR SHAREHOLDERS. THE REPORT IS NOT AUTHORIZED FOR DISTRIBUTION
TO PROSPECTIVE INVESTORS UNLESS PRECEDED OR ACCOMPANIED BY AN EFFECTIVE
PROSPECTUS.
American Century Investment Services, Inc., Distributor
©2007 American Century Proprietary Holdings, Inc. All rights reserved.
The American Century Investments logo, American Century and American Century
Investments are service marks of American Century Proprietary Holdings, Inc.
0711
SH-SAN-56809N
ITEM 2. CODE OF ETHICS.
Not applicable for semiannual report filings.
ITEM 3. AUDIT COMMITTEE FINANCIAL EXPERT.
Not applicable for semiannual report filings.
ITEM 4. PRINCIPAL ACCOUNTANT FEES AND SERVICES.
Not applicable for semiannual report filings.
ITEM 5. AUDIT COMMITTEE OF LISTED REGISTRANTS.
Not applicable.
ITEM 6. SCHEDULE OF INVESTMENTS.
The schedule of investments is included as part of the reports to stockholders
filed under Item 1 of this Form.
ITEM 7. DISCLOSURE OF PROXY VOTING POLICIES AND PROCEDURES FOR CLOSED-END
MANAGEMENT INVESTMENT COMPANIES.
Not applicable.
ITEM 8. PORTFOLIO MANAGERS OF CLOSED-END MANAGEMENT INVESTMENT COMPANIES.
Not applicable.
ITEM 9. PURCHASES OF EQUITY SECURITIES BY CLOSED-END MANAGEMENT INVESTMENT
COMPANY AND AFFILIATED PURCHASERS.
Not applicable.
ITEM 10. SUBMISSION OF MATTERS TO A VOTE OF SECURITY HOLDERS.
During the reporting period, there were no material changes to the procedures by
which shareholders may recommend nominees to the registrant's board.
ITEM 11. CONTROLS AND PROCEDURES.
(a) The registrant's principal executive officer and principal financial
officer have concluded that the registrant's disclosure controls and
procedures (as defined in Rule 30a-3(c) under the Investment Company Act of
1940) are effective based on their evaluation of these controls and
procedures as of a date within 90 days of the filing date of this report.
(b) There were no changes in the registrant's internal control over financial
reporting (as defined in Rule 30a-3(d) under the Investment Company Act of
1940) that occurred during the registrant's second fiscal quarter of the
period covered by this report that have materially affected, or are
reasonably likely to materially affect, the registrant's internal control
over financial reporting.
ITEM 12. EXHIBITS.
(a)(1) Not applicable for semiannual report filings.
(a)(2) Separate certifications by the registrant's principal executive officer
and principal financial officer, pursuant to Section 302 of the
Sarbanes-Oxley Act of 2002 and Rule 30a-2(a) under the Investment
Company Act of 1940, are filed and attached hereto as Exhibit
99.302CERT.
(a)(3) Not applicable.
(b) A certification by the registrant's chief executive officer and chief
financial officer, pursuant to Section 906 of the Sarbanes-Oxley Act of
2002, is furnished and attached hereto as Exhibit 99.906CERT.
SIGNATURES
Pursuant to the requirements of the Securities Exchange Act of 1934 and
the Investment Company Act of 1940, the registrant has duly caused this report
to be signed on its behalf by the undersigned, thereunto duly authorized.
Registrant: AMERICAN CENTURY INVESTMENT TRUST
By: /s/ Jonathan S. Thomas
--------------------------------------------
Name: Jonathan S. Thomas
Title: President
Date: November 29, 2007
Pursuant to the requirements of the Securities Exchange Act of 1934 and
the Investment Company Act of 1940, this report has been signed below by the
following persons on behalf of the registrant and in the capacities and on the
dates indicated.
By: /s/ Jonathan S. Thomas
--------------------------------------------
Name: Jonathan S. Thomas
Title: President
(principal executive officer)
Date: November 29, 2007
By: /s/ Robert J. Leach
--------------------------------------------
Name: Robert J. Leach
Title: Vice President, Treasurer, and
Chief Financial Officer
(principal financial officer)
Date: November 29, 2007