| | |
| UNITED STATES |
| SECURITIES AND EXCHANGE COMMISSION |
| Washington, D.C. 20549 |
| | |
| FORM N-CSR |
| | |
| CERTIFIED SHAREHOLDER REPORT OF REGISTERED |
| MANAGEMENT INVESTMENT COMPANIES |
| | |
| Investment Company Act file number | 811-07822 |
| |
| AMERICAN CENTURY INVESTMENT TRUST |
| (Exact name of registrant as specified in charter) |
| |
| 4500 MAIN STREET, KANSAS CITY, MISSOURI | 64111 |
| (Address of principal executive offices) | | (Zip Code) |
| |
| CHARLES A. ETHERINGTON |
| 4500 MAIN STREET, KANSAS CITY, MISSOURI 64111 |
| (Name and address of agent for service) |
| |
| Registrant’s telephone number, including area code: | 816-531-5575 |
| |
| Date of fiscal year end: | 03-31 |
| |
| Date of reporting period: | 09-30-09 |
| |
| | |
| | |
| ITEM 1. REPORTS TO STOCKHOLDERS. |
| Provided under separate cover. |
|
| Semiannual Report |
| September 30, 2009 |

|
| American Century Investments |
Prime Money Market Fund

Dear Investor:
Thank you for your investment with us during the financial reporting period ended September 30, 2009. We appreciate your trust in American Century Investments® at this volatile, transitional time in the economy and investment markets.
As the upheavals associated with the “Great Recession” gradually subside, our senior management team has put considerable thought into how the investment environment has changed and what new challenges and opportunities await us. Critical factors that we are anticipating in the coming year include marked shifts in investment and spending behavior, along with consolidation in our industry.
Most importantly, we think the economic recovery will be slow and extended. The economy and capital markets have come a long way since Lehman Brothers collapsed over a year ago, but 2010 will likely bring continuing challenges. The stock market’s rebound since last March and the third-quarter economic surge this year were fueled largely by corporate cost-cutting and unprecedented monetary and fiscal stimulus, including some key programs that have since expired or been scaled back.
Meanwhile, the resilient but struggling consumer sector still faces rising unemployment, heavy debt burdens, tight credit conditions, and a housing market that is starting to stabilize, but remains vulnerable. Much of our investment positioning in 2009 has cautiously reflected these still unstable economic fundamentals, leading to underperformance, in some cases, versus market benchmarks buoyed by the rally of riskier assets. We still support our fundamentally based positioning because we believe strongly that some markets—driven more by technical factors than fundamentals—have advanced further than underlying economic conditions warrant, and remain susceptible to the possibility of more volatility ahead.
For more detailed information from our portfolio management team about the performance and positioning of your investment, please review the following pages, or visit our website, americancentury.com.
Thank you for your continued confidence in us.
Sincerely,

Jonathan Thomas
President and Chief Executive Officer
American Century Investments
| |
| Market Perspective | 2 |
| U.S. Fixed-Income Total Returns | 2 |
| |
| Prime Money Market | |
| |
| Performance | 3 |
| Yields | 4 |
| Weighted Average Maturity/Life | 5 |
| Portfolio Composition by Credit Rating | 5 |
| Portfolio Composition by Maturity | 5 |
| |
| Shareholder Fee Example | 6 |
| |
| Financial Statements | |
| |
| Schedule of Investments | 8 |
| Statement of Assets and Liabilities | 13 |
| Statement of Operations | 14 |
| Statement of Changes in Net Assets | 15 |
| Notes to Financial Statements | 16 |
| Financial Highlights | 21 |
| |
| Other Information | |
| |
| Approval of Management Agreement | 25 |
| Additional Information | 30 |
| Index Definitions | 31 |
The opinions expressed in the Market Perspective reflect those of the portfolio management team as of the date of the report, and do not necessarily represent the opinions of American Century Investments or any other person in the American Century Investments organization. Any such opinions are subject to change at any time based upon market or other conditions and American Century Investments disclaims any responsibility to update such opinions. These opinions may not be relied upon as investment advice and, because investment decisions made by American Century Investments funds are based on numerous factors, may not be relied upon as an indication of trading intent on behalf of any American Century Investments fund. Security examples are used for representational purposes only and are not intended as recommendations to purchase or sell securities. Performance information for comparative indices and securities is prov ided to American Century Investments by third party vendors. To the best of American Century Investments’ knowledge, such information is accurate at the time of printing.

By David MacEwen, Chief Investment Officer, Fixed Income
Economy Stabilized, Short-Term Rates Remained Low
The six months ended September 30, 2009, witnessed a remarkable rebound by U.S. financial markets as the credit crisis eased and the economy showed signs of stabilizing. Government stimulus boosted consumer spending, home prices steadied, and liquidity returned to credit markets. However, the unemployment rate rose to 9.8% in September, raising prospects of a weak, “jobless” recovery. To boost growth, the Federal Reserve continued to hold its short-term rate target at 0%–0.25%, and said it would keep rates low for the foreseeable future, a key issue for money market funds.
Use of WAL Anticipates Money Fund Changes
Another key issue is a set of proposed government regulations and related disclosure changes designed to strengthen money funds and improve their transparency. At American Century Investments, we are committed to helping investors understand and make informed decisions about their financial holdings. As part of this commitment, and in alignment with proposed changes, we have added Weighted Average Life (WAL) to accompany the Weighted Average Maturity (WAM) data we provide in our money fund reports. WAL, like WAM, measures potential interest rate and credit risk exposure.
However, WAM alone may understate risk exposure in portfolios that own variable- and floating-rate securities (floaters) with interest-rate reset dates. For WAL calculation purposes, a one-year floater with a 30-day interest-rate reset feature would have a 365-day remaining life (until maturity). For WAM calculation purposes, this floater would have a remaining life of just 30 days (until the next reset). WAL illustrates better than WAM the continued exposure investors have to this floater until maturity. If no floaters are present, the WAL and WAM become similar.
Providing WAL is one of three enhancements that American Century Investments has implemented prior to the expected new government regulations. The others are: 1) posting money fund portfolio holdings on a monthly basis on our website, americancentury.com, and 2) restricting our money fund WAMs to 75 days or less. We support the spirit and intent of the proposed regulations and will comply fully with the final policies when they are announced.
| | | | |
| U.S. Fixed-Income Total Returns | | | | |
| For the six months ended September 30, 2009* | | | |
| Treasury Securities | | | Citigroup U.S. Bond Market Indices | |
| 3-Month Bill | 0.09% | | High-Yield Cash-Pay (corporate) | 37.81% |
| 2-Year Note | 0.73% | | Credit (investment-grade corporate) | 16.39% |
| 10-Year Note | –3.82% | | Broad Investment-Grade (multi-sector) | 4.80% |
| 30-Year Bond | –6.62% | | Inflation-Linked Securities | 3.47% |
| | | | Mortgage (mortgage-backed) | 2.89% |
| | | | Agency | 1.51% |
| *Total returns for periods less than one year are not annualized. | | Treasury | -1.03% |
2
| | | | | | | |
| Prime Money Market | | | | | |
| |
| Total Returns as of September 30, 2009 | | | | |
| | | | | | Average Annual Returns | |
| | | | | | | Since | Inception |
| | | 6 months(1) | 1 year | 5 years | 10 years | Inception | Date |
| Investor Class | 0.19% | 1.16%(2) | 3.17%(2) | 2.94% | 3.71% | 11/17/93 |
| 90-Day U.S. Treasury | | | | | | |
| Bill Index(3) | 0.08% | 0.21% | 2.82% | 2.83% | 3.60%(4) | — |
| Lipper Money Market | | | | | | |
| Instrument Funds | | | | | | |
| Average Return(3) | 0.05% | 0.50% | 2.72% | 2.59% | 3.49%(4) | — |
| Investor Class’s Lipper Ranking | | | | | | |
| among Money Market | | | | | | |
| Instrument Funds(3) | 16 of 302 | 7 of 294 | 22 of 259 | 32 of 197 | 24 of 105(4) | — |
| A Class | | | | | | 8/28/98 |
| No sales charge* | 0.10%(2) | 0.94%(2) | 2.92%(2) | 2.69% | 2.86% | |
| With sales charge* | -0.90%(2) | 0.94%(2) | 2.92%(2) | 2.69% | 2.86% | |
| B Class | | | | | | 1/31/03 |
| No sales charge* | 0.01%(2) | 0.48%(2) | 2.21%(2) | — | 1.71%(2) | |
| With sales charge* | -4.99%(2) | -3.52%(2) | 2.03%(2) | — | 1.71%(2) | |
| C Class | | | | | | 5/7/02 |
| No sales charge* | 0.01%(2) | 0.60%(2) | 2.44%(2) | — | 1.73%(2) | |
| With sales charge* | -0.99%(2) | 0.60%(2) | 2.44%(2) | — | 1.73%(2) | |
| |
| *Sales charges include initial sales charges and contingent deferred sales charges (CDSCs), as applicable. A Class and C Class shares |
| may be subject to a maximum CDSC of 1.00%. B Class shares redeemed within six years of purchase are subject to a CDSC that |
| declines from 5.00% during the first year after purchase to 0.00% the sixth year after purchase. The SEC requires that mutual funds |
| provide performance information net of maximum sales charges in all cases where charges could be applied. | |
| |
| (1) | Total returns for periods less than one year are not annualized. | | | | |
| (2) | Class returns would have been lower if American Century Investments had not voluntarily waived a portion of its management fees or its |
| | distribution and/or service fees, as applicable. | | | | | |
| (3) | Data provided by Lipper Inc. – A Reuters Company. © 2009 Reuters. All rights reserved. Any copying, republication or redistribution of Lipper |
| | content, including by caching, framing or similar means, is expressly prohibited without the prior written consent of Lipper. Lipper shall not be |
| | liable for any errors or delays in the content, or for any actions taken in reliance thereon. | | | |
| | Lipper Fund Performance — Performance data is total return, and is preliminary and subject to revision. | | |
| | Lipper Rankings — Rankings are based only on the universe shown and are based on average annual total returns. This listing might not |
| | represent the complete universe of funds tracked by Lipper. | | | | | |
| | The data contained herein has been obtained from company reports, financial reporting services, periodicals and other resources believed to be |
| | reliable. Although carefully verified, data on compilations is not guaranteed by Lipper and may be incomplete. No offer or solicitations to buy or |
| | sell any of the securities herein is being made by Lipper. | | | | | |
| (4) | Since 11/30/93, the date nearest the Investor Class’s inception for which data are available. | | | |
Data presented reflect past performance. Past performance is no guarantee of future results. Current performance may be higher or lower than the performance shown. To obtain performance data current to the most recent month end, please call 1-800-345-2021 or visit americancentury.com.
An investment in the fund is not insured or guaranteed by the Federal Deposit Insurance Corporation or any other government agency. Although the fund seeks to preserve the value of your investment at $1.00 per share, it is possible to lose money by investing in the fund.
The 7-day current yield more closely reflects the current earnings of the fund than the total return.
3
| | | | |
| Prime Money Market | | |
| |
| Total Annual Fund Operating Expenses | | |
| | Investor Class | A Class | B Class | C Class |
| | 0.61% | 0.86% | 1.61% | 1.36% |
| The total annual fund operating expenses shown is as stated in the fund’s prospectus current as of the date of this report. The |
| prospectus may vary from the expense ratio shown elsewhere in this report because it is based on a different time period, includes |
| acquired fund fees and expenses, and, if applicable, does not include fee waivers or expense reimbursements. | |
| |
| Yields as of September 30, 2009 | | |
| 7-Day Current Yield | | After Waiver(1) | Before Waiver |
| Investor Class | | 0.06% | -0.01% |
| A Class | | 0.01%(2) | -0.26% |
| B Class | | 0.01%(2) | -1.00% |
| C Class | | 0.01%(2) | -0.75% |
| |
| 7-Day Effective Yield(1) | | | |
| Investor Class | | 0.06% | |
| A Class | | 0.01%(2) | |
| B Class | | 0.01%(2) | |
| C Class | | 0.01%(2) | |
| (1) | The yields presented reflect the waiver of a portion of the fund’s management fees. Without such waiver, the 7-day yields would have been lower. |
| (2) | The distributor voluntarily waived a portion of its distribution and/or service fees. Without such waiver, the 7-day yields would have been lower. |
| |
| Data presented reflect past performance. Past performance is no guarantee of future results. Current performance may be higher or |
| lower than the performance shown. To obtain performance data current to the most recent month end, please call 1-800-345-2021 |
| or visit americancentury.com. | | | |
| |
| An investment in the fund is not insured or guaranteed by the Federal Deposit Insurance Corporation or any other government agency. |
| Although the fund seeks to preserve the value of your investment at $1.00 per share, it is possible to lose money by investing in the fund. |
| |
| The 7-day current yield more closely reflects the current earnings of the fund than the total return. | |
4
| | |
| Prime Money Market | | |
| |
| Weighted Average Maturity/Life | | |
| | 9/30/09 | 3/31/09 |
| Weighted Average Maturity | 62 days | 65 days |
| Weighted Average Life | 80 days | N/A |
| |
| Portfolio Composition by Credit Rating | | |
| | % of | % of |
| | fund investments | fund investments |
| | as of 9/30/09 | as of 3/31/09 |
| A-1+ | 79% | 82% |
| A-1 | 21% | 18% |
| Ratings provided by independent research companies. These ratings are listed in Standard & Poor’s format even if they were provided by other |
| sources. The letter ratings indicate the credit worthiness of the underlying bonds in the portfolio and generally range from AAA (highest) to D (lowest). |
| |
| Portfolio Composition by Maturity | | |
| | % of | % of |
| | fund investments | fund investments |
| | as of 9/30/09 | as of 3/31/09 |
| 1-30 days | 49% | 46% |
| 31-90 days | 30% | 30% |
| 91-180 days | 11% | 15% |
| More than 180 days | 10% | 9% |
5
|
| Shareholder Fee Example (Unaudited) |
Fund shareholders may incur two types of costs: (1) transaction costs, including sales charges (loads) on purchase payments and redemption/ exchange fees; and (2) ongoing costs, including management fees; distribution and service (12b-1) fees; and other fund expenses. This example is intended to help you understand your ongoing costs (in dollars) of investing in your fund and to compare these costs with the ongoing cost of investing in other mutual funds.
The example is based on an investment of $1,000 made at the beginning of the period and held for the entire period from April 1, 2009 to September 30, 2009.
Actual Expenses
The table provides information about actual account values and actual expenses for each class. You may use the information, together with the amount you invested, to estimate the expenses that you paid over the period. First, identify the share class you own. Then simply divide your account value by $1,000 (for example, an $8,600 account value divided by $1,000 = 8.6), then multiply the result by the number under the heading “Expenses Paid During Period” to estimate the expenses you paid on your account during this period.
If you hold Investor Class shares of any American Century Investments fund, or Institutional Class shares of the American Century Diversified Bond Fund, in an American Century Investments account (i.e., not a financial intermediary or retirement plan account), American Century Investments may charge you a $12.50 semiannual account maintenance fee if the value of those shares is less than $10,000. We will redeem shares automatically in one of your accounts to pay the $12.50 fee. In determining your total eligible investment amount, we will include your investments in all personal accounts (including American Century Investments Brokerage accounts) registered under your Social Security number. Personal accounts include individual accounts, joint accounts, UGMA/UTMA accounts, personal trusts, Coverdell Education Savings Accounts and IRAs (including traditional, Roth, Rollover, SEP-, SARSEP- and SIMPLE-IRAs), and certain other retirement accounts. If you have only business, business retirement, employer-sponsored or Amer-ican Century Investments Brokerage accounts, you are currently not subject to this fee. We will not charge the fee as long as you choose to manage your accounts exclusively online. If you are subject to the Account Maintenance Fee, your account value could be reduced by the fee amount.
Hypothetical Example for Comparison Purposes
The table also provides information about hypothetical account values and hypothetical expenses based on the actual expense ratio of each class of your fund and an assumed rate of return of 5% per year before expenses, which is not the actual return of a fund’s share class. The hypothetical account values and expenses may not be used to estimate the actual ending account balance or expenses you paid for the period. You may use this information to compare the ongoing costs of investing in your fund and other funds.
To do so, compare this 5% hypothetical example with the 5% hypothetical examples that appear in the shareholder reports of the other funds.
6
Please note that the expenses shown in the table are meant to highlight your ongoing costs only and do not reflect any transactional costs, such as sales charges (loads) or redemption/exchange fees. Therefore, the table is useful in comparing ongoing costs only, and will not help you determine the relative total costs of owning different funds. In addition, if these transactional costs were included, your costs would have been higher.
| | | | | |
| | | Beginning | Ending | Expenses Paid | |
| | | Account Value | Account Value | During Period(1) | Annualized |
| | | 4/1/09 | 9/30/09 | 4/1/09 - 9/30/09 | Expense Ratio(1) |
| Actual | | | | |
| Investor Class (after waiver)(2) | $1,000 | $1,001.90 | $2.81 | 0.56% |
| Investor Class (before waiver) | $1,000 | $1,001.90(3) | $3.06 | 0.61% |
| A Class (after waiver)(2)(4) | $1,000 | $1,001.00 | $3.81 | 0.76% |
| A Class (before waiver) | $1,000 | $1,001.00(3) | $4.31 | 0.86% |
| B Class (after waiver)(2)(4) | $1,000 | $1,000.10 | $4.81 | 0.96% |
| B Class (before waiver) | $1,000 | $1,000.10(3) | $8.07 | 1.61% |
| C Class (after waiver)(2)(4) | $1,000 | $1,000.10 | $4.81 | 0.96% |
| C Class (before waiver) | $1,000 | $1,000.10(3) | $6.82 | 1.36% |
| Hypothetical | | | | |
| Investor Class (after waiver)(2) | $1,000 | $1,022.26 | $2.84 | 0.56% |
| Investor Class (before waiver) | $1,000 | $1,022.01 | $3.09 | 0.61% |
| A Class (after waiver)(2)(4) | $1,000 | $1,021.26 | $3.85 | 0.76% |
| A Class (before waiver) | $1,000 | $1,020.76 | $4.36 | 0.86% |
| B Class (after waiver)(2)(4) | $1,000 | $1,020.26 | $4.86 | 0.96% |
| B Class (before waiver) | $1,000 | $1,017.00 | $8.14 | 1.61% |
| C Class (after waiver)(2)(4) | $1,000 | $1,020.26 | $4.86 | 0.96% |
| C Class (before waiver) | $1,000 | $1,018.25 | $6.88 | 1.36% |
| (1) | Expenses are equal to the class’s annualized expense ratio listed in the table above, multiplied by the average account value over the period, |
| | multiplied by 183, the number of days in the most recent fiscal half-year, divided by 365, to reflect the one-half year period. |
| (2) | During the six months ended September 30, 2009, the fund received a partial waiver of its management fee. | |
| (3) | Ending account value assumes the return earned after waiver. The return would have been lower had fees not been waived and would have |
| | resulted in a lower ending account value. | | | |
| (4) | During the six months ended September 30, 2009, the distributor voluntarily waived a portion of its distribution and/or service fees. |
7
|
| Schedule of Investments |
| Prime Money Market |
| | | | | | |
| SEPTEMBER 30, 2009 (UNAUDITED) | | | | | |
| |
| | Principal | | | | Principal | |
| | Amount | Value | | | Amount | Value |
| Commercial Paper(1) — 47.8% | | | Govco LLC, | | |
| | | | | 0.75%, 12/16/09(2) | $10,000,000 | $ 9,984,167 |
| Amsterdam Funding Corp., | | | | Govco LLC, | | |
| 0.25%, 10/2/09(2) | $10,000,000 | $ 9,999,931 | | | | |
| | | | | 0.80%, 12/21/09(2) | 2,900,000 | 2,894,780 |
| Austin Texas, | | | | Govco LLC, | | |
| 0.65%, 12/3/09 | 19,146,000 | 19,124,221 | | 0.43%, 12/22/09(2) | 59,100,000 | 59,042,853 |
| Austin Texas, | | | | Honeywell International, Inc., | | |
| 0.65%, 12/11/09 | 1,740,000 | 1,737,769 | | 0.96%, 12/11/09(2) | 25,000,000 | 24,953,160 |
| Australia & New Zealand | | | | Legacy Capital LLC, | | |
| Banking Group Ltd., | | | | 0.43%, 10/8/09(2) | 34,000,000 | 33,997,161 |
| 0.21%, 11/6/09(2) | 70,000,000 | 69,985,300 | | | | |
| Bank of Nova Scotia, | | | | Legacy Capital LLC, | | |
| | | | | 0.41%, 10/9/09(2) | 20,200,000 | 20,198,141 |
| 0.18%, 10/1/09 | 19,000,000 | 19,000,000 | | | | |
| BASF SE, 0.31%, | | | | Legacy Capital LLC, | | |
| | | | | 0.45%, 10/22/09(2) | 17,600,000 | 17,595,380 |
| 11/23/09(2) | 55,993,000 | 55,967,357 | | | | |
| BNP Paribas Finance, Inc., | | | | Legacy Capital LLC, | | |
| | | | | 0.50%, 11/6/09(2) | 24,000,000 | 23,988,000 |
| 0.23%, 10/26/09 | 8,000,000 | 7,998,722 | | | | |
| Catholic Health Initiatives, | | | | Lexington Parker Capital, | | |
| | | | | 0.45%, 10/8/09(2) | 20,000,000 | 19,998,250 |
| 0.70%, 11/12/09 | 30,000,000 | 30,000,000 | | | | |
| Catholic Health Initiatives, | | | | Lexington Parker Capital, | | |
| | | | | 0.45%, 10/9/09(2) | 30,000,000 | 29,997,000 |
| 0.95%, 2/4/10 | 55,663,000 | 55,663,000 | | | | |
| Chariot Funding LLC, | | | | Lexington Parker Capital, | | |
| | | | | 0.40%, 10/23/09(2) | 37,000,000 | 36,990,956 |
| 0.20%, 11/13/09(2) | 17,000,000 | 16,995,939 | | | | |
| Chariot Funding LLC, | | | | Lexington Parker Capital, | | |
| | | | | 0.45%, 11/10/09(2) | 8,000,000 | 7,996,000 |
| 0.22%, 12/14/09(2) | 22,007,000 | 21,997,048 | | | | |
| | | | | Oakland-Alameda County, | | |
| Charta LLC, | | | | 0.30%, 10/2/09 | 37,855,000 | 37,855,031 |
| 0.23%, 11/2/09(2) | 65,000,000 | 64,986,711 | | | | |
| | | | | Oakland-Alameda County, | | |
| Chicago Midway Airport, | | | | 0.38%, 10/20/09 | 7,100,000 | 7,100,000 |
| 0.45%, 1/6/10 | 4,275,000 | 4,275,000 | | | | |
| Citibank Credit Card | | | | Pfizer, Inc., | | |
| | | | | 0.32%, 12/1/09(2) | 33,000,000 | 32,982,107 |
| Issuance Trust, | | | | | | |
| 0.31%, 10/5/09(2) | 26,000,000 | 25,999,113 | | Pfizer, Inc., | | |
| | | | | 0.46%, 2/26/10(2) | 62,000,000 | 61,882,751 |
| Citibank Credit Card | | | | | | |
| Issuance Trust, | | | | Providence Health & | | |
| 0.23%, 10/15/09(2) | 10,000,000 | 9,999,106 | | Services, 1.15%, 12/4/09 | 30,000,000 | 30,000,000 |
| Citibank Credit Card | | | | Providence Health & | | |
| Issuance Trust, | | | | Services, 1.00%, 12/7/09 | 7,000,000 | 7,000,000 |
| 0.27%, 11/13/09(2) | 13,000,000 | 12,995,808 | | Regents of University of | | |
| CRC Funding LLC, | | | | California, 0.30%, 10/8/09 | 12,500,000 | 12,499,271 |
| 0.30%, 10/6/09(2) | 40,000,000 | 39,998,333 | | Salvation Army (The), | | |
| Crown Point Capital Co. LLC, | | | | 0.32%, 10/8/09 | 42,900,000 | 42,900,000 |
| 0.42%, 10/1/09(2) | 60,000,000 | 60,000,000 | | Salvation Army (The), | | |
| Crown Point Capital Co. LLC, | | | | 0.32%, 10/21/09 | 28,000,000 | 28,000,000 |
| 0.45%, 10/26/09(2) | 15,000,000 | 14,995,313 | | St. Joseph County, | | |
| Falcon Asset Securitization | | | | 0.30%, 10/30/09 | 6,314,000 | 6,312,474 |
| Co. LLC, 0.19%, 10/23/09(2) | 24,000,000 | 23,997,213 | | Swedbank AB, | | |
| Govco LLC, | | | | 0.57%, 11/16/09(2) | 26,000,000 | 25,981,063 |
| 0.78%, 12/11/09(2) | 40,000,000 | 39,938,467 | | Swedbank AB, | | |
| | | | | 0.53%, 12/2/09(2) | 25,000,000 | 24,977,181 |
8
| | | | | | |
| Prime Money Market | | | | | |
| |
| |
| | Principal | | | | Principal | |
| | Amount | Value | | | Amount | Value |
| Toyota Credit Canada, Inc., | | | | U.S. GOVERNMENT AGENCY | | |
| 0.32%, 10/23/09 | $28,000,000 | $ 27,994,524 | | DISCOUNT NOTES(1) — 5.2% | | |
| Toyota Credit Canada, Inc., | | | | FHLB Discount Notes, | | |
| 0.29%, 10/30/09 | 32,000,000 | 31,992,524 | | 0.60%, 10/19/09 | $50,000,000 | $ 49,985,000 |
| Toyota Motor Credit Corp., | | | | FHLB Discount Notes, | | |
| 0.35%, 10/5/09 | 28,400,000 | 28,398,896 | | 0.15%, 11/12/09 | 45,000,000 | 44,992,125 |
| Yale University, | | | | FHLB Discount Notes, | | |
| 0.45%, 11/17/09 | 25,000,000 | 24,985,312 | | 0.70%, 1/13/10 | 55,000,000 | 54,888,778 |
| Yorktown Capital LLC, | | | | | | 149,865,903 |
| 0.23%, 11/18/09(2) | 50,000,000 | 49,984,667 | | GOVERNMENT-BACKED CORPORATE BONDS(3) — 1.4% |
| TOTAL COMMERCIAL PAPER | | 1,374,136,000 | | Bank of America N.A., VRN, | | |
| | | | | 0.33%, 12/14/09, resets | | |
| U.S. Government Agency Securities | | quarterly off the 3-month | | |
| and Equivalents — 27.9% | | | LIBOR plus 0.03% with | | |
| FIXED-RATE U.S. GOVERNMENT | | | no caps | 40,000,000 | 40,000,000 |
| AGENCY SECURITIES — 13.4% | | | TOTAL U.S. GOVERNMENT AGENCY | |
| FFCB, 0.95%, 3/2/10 | 5,000,000 | 4,999,149 | | SECURITIES AND EQUIVALENTS | 803,080,813 |
| |
| FHLB, 5.00%, 10/2/09 | 2,050,000 | 2,050,165 | | Municipal Securities — 17.8% | |
| FHLB, 4.25%, 11/20/09 | 2,140,000 | 2,147,622 | | ABAG Finance Auth. for | | |
| FHLB, 3.125%, 12/11/09 | 3,075,000 | 3,083,627 | | Nonprofit Corps. Rev., (899 | | |
| FHLB, 5.00%, 12/11/09 | 18,780,000 | 18,901,845 | | Charleston LLC), VRDN, | | |
| FHLB, 1.12%, 1/15/10 | 50,000,000 | 50,015,442 | | 0.35%, 10/1/09 (LOC: | | |
| | | | | LaSalle Bank N.A.) | 5,650,000 | 5,650,000 |
| FHLB, 3.10%, 2/4/10 | 64,210,000 | 64,713,091 | | ABAG Finance Auth. for | | |
| FHLB, 1.10%, 3/30/10 | 20,000,000 | 19,991,888 | | Nonprofit Corps. Rev., | | |
| FHLB, 3.00%, 6/11/10 | 4,695,000 | 4,779,670 | | (Urban School of San | | |
| FHLB, 5.25%, 6/11/10 | 8,290,000 | 8,568,838 | | Francisco), VRDN, 0.47%, | | |
| | | | | 10/1/09 (LOC: Allied Irish | | |
| FHLB, 2.75%, 6/18/10 | 4,235,000 | 4,305,960 | | Bank plc) | 4,670,000 | 4,670,000 |
| FHLB, 0.60%, 6/22/10 | 85,000,000 | 84,909,010 | | Alameda County Industrial | | |
| FHLB, 0.60%, 6/25/10 | 10,000,000 | 10,014,717 | | Development Auth. Rev., | | |
| FHLB, 0.55%, 7/28/10 | 40,000,000 | 39,994,986 | | (Segale Bros. Wood | | |
| FHLB, 3.375%, 8/13/10 | 5,200,000 | 5,323,672 | | Products), VRDN, 0.50%, | | |
| | | | | 10/1/09 (LOC: Bank of | | |
| FHLB, 0.625%, 8/17/10 | 10,000,000 | 9,995,616 | | the West) | 2,030,000 | 2,030,000 |
| FHLB, 0.56%, 8/20/10 | 30,000,000 | 29,987,523 | | California State Department | | |
| FHLB, 0.60%, 9/17/10 | 22,865,000 | 22,889,922 | | of Water Resources Power | | |
| | | 386,672,743 | | Supply Rev., Series 2005 | | |
| ADJUSTABLE-RATE U.S. GOVERNMENT | | | G3, VRDN, 0.45%, 10/1/09 | | |
| AGENCY SECURITIES — 7.9% | | | (FSA) (SBBPA: JPMorgan | | |
| | | | | Chase Bank N.A.) | 3,000,000 | 3,000,000 |
| FHLB, VRN, 0.76%, 10/1/09 | 40,000,000 | 40,000,000 | | Camden County Public | | |
| FHLB, VRN, 0.79%, 10/1/09 | 23,000,000 | 23,000,000 | | Service Auth. Rev., (St. | | |
| FHLB, VRN, 0.79%, 10/1/09 | 25,000,000 | 25,004,164 | | Marys), VRDN, 0.37%, | | |
| FHLB, VRN, 0.58%, 10/2/09 | 41,000,000 | 41,000,000 | | 10/1/09 (AGC) (SBBPA: | | |
| FHLB, VRN, 0.35%, 10/26/09 | 50,000,000 | 50,000,000 | | Bank of America N.A.) | 23,995,000 | 23,995,000 |
| | | | | Connecticut Housing | | |
| FHLB, VRN, 0.39%, 11/10/09 | 40,000,000 | 40,032,958 | | Finance Auth. Rev., Series | | |
| FHLB, VRN, 0.40%, 11/19/09 | 7,500,000 | 7,505,045 | | 2008 A5, (Housing Mortgage | | |
| | | 226,542,167 | | Finance), VRDN, 0.35%, | | |
| | | | | 10/1/09 (SBBPA: JPMorgan | | |
| | | | | Chase Bank N.A.) | 48,690,000 | 48,690,000 |
9
| | | | | | |
| Prime Money Market | | | | | |
| |
| |
| | Principal | | | | Principal | |
| | Amount | Value | | | Amount | Value |
| El Monte COP, Series | | | | Minnesota State Office | | |
| 2003 B, (Community | | | | of Higher Education Rev., | | |
| Improvement), VRDN, | | | | Series 2008 A, (Suppl | | |
| 1.05%, 10/1/09 (LOC: | | | | Student-A), VRDN, | | |
| Union Bank of CA N.A. and | | | | 0.47%, 10/1/09 (LOC: | | |
| California State Teacher’s | | | | U.S. Bank N.A.) | $ 6,000,000 | $ 6,000,000 |
| Retirement System) | $ 2,350,000 | $ 2,350,000 | | Mississippi Business | | |
| Fairfield Pension Obligation | | | | Finance Corp. Rev., (Medical | | |
| Rev., Series 2005 A, VRDN, | | | | Development Properties | | |
| 1.80%, 10/1/09 (LOC: | | | | LLC), VRDN, 1.00%, 10/1/09 | | |
| Landesbank Hessen- | | | | (LOC: BancorpSouth Bank | | |
| Thuringen Girozentrale) | 5,420,000 | 5,420,000 | | and FHLB) | 5,730,000 | 5,730,000 |
| Harris County Health | | | | Mississippi Business Finance | | |
| Facilities Development | | | | Corp. Rev., Series 2006 | | |
| Corp. Rev., Series 2008 | | | | R1, (Brown Bottling Group, | | |
| A2, (Methodist Hospital | | | | Inc.), VRDN, 1.00%, 10/1/09 | | |
| System), VRDN, | | | | (LOC: Trustmark National | | |
| 0.27%, 10/1/09 | 7,000,000 | 7,000,000 | | Bank and FHLB) | 4,415,000 | 4,415,000 |
| Illinois GO, 2.00%, 4/13/10 | 20,000,000 | 20,145,546 | | New York City Housing | | |
| Illinois GO, 4.00%, 5/20/10 | 25,500,000 | 25,947,475 | | Dev. Corp. Multifamily Rev., | | |
| | | | | Series 2005 A, (270 East | | |
| Illinois GO, 2.00%, 6/10/10 | 15,000,000 | 15,102,828 | | Burnside), VRDN, 0.23%, | | |
| JJB Properties LLC Rev., | | | | 10/7/09 (LIQ FAC: FNMA) | 6,400,000 | 6,400,000 |
| (Rental Property), VRDN, | | | | New York GO, Series 2008 | | |
| 2.00%, 10/1/09 (LOC: | | | | J13, VRDN, 0.45%, 10/7/09 | | |
| Arvest Bank and FHLB) | 5,750,000 | 5,750,000 | | (SBBPA: Lloyds TSB | | |
| Kentucky Housing Corp. | | | | Bank plc) | 72,900,000 | 72,900,000 |
| Rev., Series 2006 O, VRDN, | | | | Pasadena COP, (Los Robles | | |
| 0.46%, 10/1/09 (SBBPA: | | | | Avenue Parking Facilities), | | |
| BNP Paribas) | 14,885,000 | 14,885,000 | | VRDN, 1.25%, 10/6/09 | | |
| Kentucky Housing Corp. | | | | (LOC: Bank of New York and | | |
| Rev., Series 2007 O, VRDN, | | | | California State Teacher’s | | |
| 0.60%, 10/1/09 (SBBPA: | | | | Retirement System) | 7,700,000 | 7,700,000 |
| Lloyds TSB Bank plc) | 5,445,000 | 5,445,000 | | Plymouth Rev., (Carlson | | |
| Kentucky Housing Corp. | | | | Center), VRDN, 0.50%, | | |
| Rev., Series 2008 B, VRDN, | | | | 10/1/09 (LOC: U.S. | | |
| 0.80%, 10/1/09 (SBBPA: | | | | Bank N.A.) | 565,000 | 565,000 |
| Lloyds TSB Bank plc) | 6,875,000 | 6,875,000 | | Portland GO, (Taxable | | |
| LoanStar Assets Partners LP | | | | Pension), VRDN, 1.00%, | | |
| Rev., Series 2004 A, VRDN, | | | | 10/7/09 (SBBPA: | | |
| 0.33%, 10/1/09 (LOC: State | | | | Landesbank Hessen- | | |
| Street Bank & Trust Co.)(2) | 16,700,000 | 16,700,000 | | Thuringen Girozentrale) | 75,755,000 | 75,754,677 |
| Long Beach Rev., Series | | | | Putnam County Industrial | | |
| 2004 A, (Towne Center Site), | | | | Development Agency Rev., | | |
| VRDN, 1.95%, 10/1/09 | | | | (Sincerity Facility LLC), | | |
| (LOC: Allied Irish Bank plc) | 5,685,000 | 5,685,000 | | VRDN, 1.25%, 10/1/09 | | |
| Midwestern University | | | | (LOC: Bank of New York) | 9,990,000 | 9,990,000 |
| Foundation Rev., Series | | | | Santa Ana Multifamily | | |
| 2009 A, VRDN, 0.45%, | | | | Housing Auth. Rev., (Vintage | | |
| 10/1/09 (LOC: Royal Bank | | | | Apartments), VRDN, 0.45%, | | |
| of Canada) | 5,000,000 | 5,000,000 | | 10/1/09 (LOC: FNMA) (LIQ | | |
| | | | | FAC: FNMA) | 5,235,000 | 5,235,000 |
10
| | | | | | |
| Prime Money Market | | | | | |
| |
| |
| | Principal | | | | Principal | |
| | Amount | Value | | | Amount | Value |
| Santa Rosa Pension | | | | DCC Development Corp., | | |
| Obligation Rev., Series 2003 | | | | VRDN, 0.47%, 10/1/09 | $ 1,875,000 | $ 1,875,000 |
| A, VRDN, 1.80%, 10/1/09 | | | | General Electric Capital | | |
| (LOC: Landesbank Hessen- | | | | Corp., VRN, 0.60%, 10/8/09 | 7,800,000 | 7,810,463 |
| Thuringen Girozentrale) | $13,270,000 | $ 13,270,000 | | Herman & Kittle Capital LLC, | | |
| South Carolina Association | | | | VRDN, 0.45%, 10/1/09 | 1,405,000 | 1,405,000 |
| of Governmental | | | | | | |
| Organizations COP, | | | | High Track LLC, VRDN, | | |
| Series 2009 B, 1.50%, | | | | 0.47%, 10/1/09 | 2,530,000 | 2,530,000 |
| 3/1/10 (SCSDE) | 25,000,000 | 25,096,545 | | Lammert Building LP, VRDN, | | |
| | | | | 0.38%, 10/7/09(2) | 3,160,000 | 3,160,000 |
| Texas GO, Series 2002 IB, | | | | | | |
| (Veterans Housing), VRDN, | | | | Procter & Gamble | | |
| 0.90%, 10/7/09 (SBBPA: | | | | International Funding SCA, | | |
| Landesbank Hessen- | | | | VRN, 0.71%, 11/8/09, resets | | |
| Thuringen Girozentrale) | 13,345,000 | 13,345,000 | | quarterly off the 3-month | | |
| University Hospitals Trust | | | | LIBOR plus 0.25% with | | |
| Rev., Series 2005 B, VRDN, | | | | no caps | 5,000,000 | 5,000,000 |
| 0.35%, 10/7/09 (LOC: Bank | | | | Procter & Gamble | | |
| of America N.A.) | 5,200,000 | 5,200,000 | | International Funding SCA, | | |
| University of Kansas Hospital | | | | VRN, 0.48%, 11/9/09, resets | | |
| Auth. Rev., (Health System), | | | | quarterly off the 3-month | | |
| VRDN, 0.35%, 10/1/09 | | | | LIBOR plus 0.01% with | | |
| (LOC: U.S. Bank N.A.) | 6,210,000 | 6,210,000 | | no caps | 15,000,000 | 15,000,000 |
| Wisconsin Health & | | | | RMD Note Issue, LLC, VRDN, | | |
| Educational Facilities | | | | 0.45%, 10/7/09 | 10,150,000 | 10,150,000 |
| Auth Rev., Series 2008 | | | | Roman Catholic Bishop of | | |
| B, (ProHealth Care, Inc.), | | | | San Jose, VRDN, 2.55%, | | |
| VRDN, 0.35%, | | | | 10/1/09 (LOC: Allied Irish | | |
| 10/1/09 (LOC: Chase | | | | Bank plc) | 9,885,000 | 9,885,000 |
| Manhattan Bank) | 14,000,000 | 14,000,000 | | Saddleback Valley | | |
| Wisconsin Health & | | | | Community Church, VRDN, | | |
| Educational Facilities Auth. | | | | 0.35%, 10/1/09 | 9,800,000 | 9,800,000 |
| Rev., Series 2006 C, (Aurora | | | | Salvation Army (The), VRN, | | |
| Health Care), VRDN, | | | | 1.25%, 10/1/09 (LOC: Bank | | |
| 0.35%, 10/1/09 (LOC: | | | | of New York) | 7,500,000 | 7,500,000 |
| U.S. Bank N.A.) | 15,000,000 | 15,000,000 | | Salvation Army (The), VRN, | | |
| TOTAL MUNICIPAL SECURITIES | 511,152,071 | | 1.25%, 10/1/09 (LOC: Bank | | |
| | | | | of New York) | 8,000,000 | 8,000,000 |
| Corporate Bonds — 5.5% | | | TOTAL CORPORATE BONDS | | 157,944,188 |
| Blodgett Capital LLC, VRDN, | | | | | | |
| 0.47%, 10/1/09 | 6,340,000 | 6,340,000 | | Certificates of Deposit — 1.0% | |
| Brosis Finance LLC, VRDN, | | | | BNP Paribas, | | |
| 0.50%, 10/7/09 (LOC: | | | | 0.34%, 10/7/09 | 30,000,000 | 30,000,000 |
| Branch Banking & Trust) | 9,195,000 | 9,195,000 | | TOTAL INVESTMENT | | |
| Citigroup Funding, Inc., VRN, | | | | SECURITIES — 100.0% | | 2,876,313,072 |
| 0.59%, 10/30/09 | 35,000,000 | 35,068,725 | | OTHER ASSETS | | |
| Colorado Natural Gas, Inc., | | | | AND LIABILITIES(4) | | (45,056) |
| VRDN, 0.75%, 10/1/09 | 3,225,000 | 3,225,000 | | TOTAL NET ASSETS — 100.0% | $2,876,268,016 |
| Cypress Bend Real Estate | | | | | | |
| Development Co. LLC, | | | | | | |
| VRDN, 0.45%, 10/1/09 | 22,000,000 | 22,000,000 | | | | |
11
| |
| Prime Money Market |
| |
| Notes to Schedule of Investments |
| ABAG = Association of Bay Area Governments |
| AGC = Assured Guaranty Corporation |
| COP = Certificates of Participation |
| Equivalent = Security whose principal payments are backed by the full |
| faith and credit of the United States |
| FFCB = Federal Farm Credit Bank |
| FHLB = Federal Home Loan Bank |
| FNMA = Federal National Mortgage Association |
| FSA = Financial Security Assurance, Inc. |
| GO = General Obligation |
| LIBOR = London Interbank Offered Rate |
| LIQ FAC = Liquidity Facilities |
| LOC = Letter of Credit |
| resets = The frequency with which a security’s coupon changes, |
| based on current market conditions or an underlying index. The more |
| frequently a security resets, the less risk the investor is taking that the |
| coupon will vary significantly from current market rates. |
| SBBPA = Standby Bond Purchase Agreement |
| SCSDE = South Carolina School District Enhancement |
| VRDN = Variable Rate Demand Note. Interest reset date is indicated. |
| Rate shown is effective at the period end. |
| VRN = Variable Rate Note. Interest reset date is indicated. Rate shown |
| is effective at the period end. |
| (1) | The rate indicated is the yield to maturity at purchase for |
| | non-interest bearing securities. For interest bearing securities, |
| | the stated coupon rate is shown. |
| (2) | Security was purchased under Rule 144A or Section 4(2) of |
| | the Securities Act of 1933 or is a private placement and, unless |
| | registered under the Act or exempted from registration, may only |
| | be sold to qualified institutional investors. The aggregate value |
| | of these securities at the period end was $971,159,256, which |
| | represented 33.8% of total net assets. None of the restricted |
| | securities are considered to be illiquid. |
| (3) | The debt is guaranteed under the Federal Deposit Insurance |
| | Corporation’s (FDIC) Temporary Liquidity Guarantee Program and |
| | is backed by the full faith and credit of the United States. The |
| | expiration date of the FDIC’s guarantee is the earlier of the maturity |
| | date of the debt or June 30, 2012. |
| (4) | Category is less than 0.05% of total net assets. |
| |
| |
| See Notes to Financial Statements. |
12
|
| Statement of Assets and Liabilities |
| |
| SEPTEMBER 30, 2009 (UNAUDITED) | |
| Assets | |
| Investment securities, at value (amortized cost and cost for federal income tax purposes) | $2,876,313,072 |
| Receivable for investments sold | 1,870,626 |
| Receivable for capital shares sold | 3,392,339 |
| Interest receivable | 3,246,460 |
| | 2,884,822,497 |
| | |
| Liabilities | |
| Disbursements in excess of demand deposit cash | 179,897 |
| Payable for capital shares redeemed | 7,147,252 |
| Accrued management fees | 1,214,079 |
| Distribution fees payable | 3,006 |
| Service fees (and distribution fees – A Class) payable | 4,237 |
| Dividends payable | 6,010 |
| | 8,554,481 |
| | |
| Net Assets | $2,876,268,016 |
| | |
| Net Assets Consist of: | |
| Capital paid in | $2,876,842,768 |
| Accumulated net investment loss | (15) |
| Accumulated net realized loss on investment transactions | (574,737) |
| | $2,876,268,016 |
| | |
| Investor Class | |
| Net assets | $2,728,758,559 |
| Shares outstanding | 2,729,299,305 |
| Net asset value per share | $1.00 |
| | |
| A Class | |
| Net assets | $141,631,602 |
| Shares outstanding | 141,664,582 |
| Net asset value per share | $1.00 |
| | |
| B Class | |
| Net assets | $2,463,328 |
| Shares outstanding | 2,463,694 |
| Net asset value per share | $1.00 |
| | |
| C Class | |
| Net assets | $3,414,527 |
| Shares outstanding | 3,415,309 |
| Net asset value per share | $1.00 |
| |
| |
| See Notes to Financial Statements. | |
13
| |
| FOR THE SIX MONTHS ENDED SEPTEMBER 30, 2009 (UNAUDITED) | |
| Investment Income (Loss) | |
| Income: | |
| Interest | $13,985,786 |
| | |
| Expenses: | |
| Management fees | 8,399,529 |
| Distribution fees: | |
| B Class | 10,592 |
| C Class | 9,756 |
| Service fees: | |
| B Class | 3,531 |
| C Class | 4,878 |
| Distribution and service fees — A Class | 207,351 |
| Temporary guarantee program fees | 525,152 |
| Trustees’ fees and expenses | 65,987 |
| Other expenses | 462 |
| | 9,227,238 |
| Fees waived | (785,427) |
| | 8,441,811 |
| | |
| Net investment income (loss) | 5,543,975 |
| | |
| Net realized gain (loss) on investment transactions | (41,917) |
| | |
| Net Increase (Decrease) in Net Assets Resulting from Operations | $5,502,058 |
| |
| |
| |
| See Notes to Financial Statements. | |
14
|
| Statement of Changes in Net Assets |
| | |
| SIX MONTHS ENDED SEPTEMBER 30, 2009 (UNAUDITED) AND YEAR ENDED MARCH 31, 2009 | |
| Increase (Decrease) in Net Assets | Sept. 30, 2009 | March 31, 2009 |
| Operations | | |
| Net investment income (loss) | $ 5,543,975 | $ 60,881,646 |
| Net realized gain (loss) | (41,917) | (384,450) |
| Net increase (decrease) in net assets resulting from operations | 5,502,058 | 60,497,196 |
| | | |
| Distributions to Shareholders | | |
| From net investment income: | | |
| Investor Class | (5,369,984) | (57,624,138) |
| A Class | (173,427) | (3,191,328) |
| B Class | (100) | (18,680) |
| C Class | (479) | (53,219) |
| Decrease in net assets from distributions | (5,543,990) | (60,887,365) |
| | | |
| Capital Share Transactions | | |
| Net increase (decrease) in net assets from capital share transactions | (83,758,033) | 241,296,042 |
| | | |
| Net increase (decrease) in net assets | (83,799,965) | 240,905,873 |
| | | |
| Net Assets | | |
| Beginning of period | 2,960,067,981 | 2,719,162,108 |
| End of period | $2,876,268,016 | $2,960,067,981 |
| | | |
| Accumulated net investment loss | $(15) | — |
| |
| |
| See Notes to Financial Statements. | | |
15
|
| Notes to Financial Statements |
SEPTEMBER 30, 2009 (UNAUDITED)
1. Organization and Summary of Significant Accounting Policies
Organization — American Century Investment Trust (the trust) is registered under the Investment Company Act of 1940 (the 1940 Act) as an open-end management investment company. Prime Money Market Fund (the fund) is one fund in a series issued by the trust. The fund is diversified under Rule 2a-7 of the 1940 Act. The fund’s investment objective is to earn the highest level of current income while preserving the value of your investment. The fund invests most of its assets in high-quality, very short-term debt securities issued by corporations, banks and governments. The following is a summary of the fund’s significant accounting policies.
Multiple Class — The fund is authorized to issue the Investor Class, the A Class, the B Class and the C Class. The A Class, B Class and C Class may be subject to a contingent deferred sales charge. The share classes differ principally in their respective sales charges and distribution and shareholder servicing expenses and arrangements. All shares of the fund represent an equal pro rata interest in the net assets of the class to which such shares belong, and have identical voting, dividend, liquidation and other rights and the same terms and conditions, except for class specific expenses and exclusive rights to vote on matters affecting only individual classes. Income, non-class specific expenses, and realized and unrealized capital gains and losses of the fund are allocated to each class of shares based on their relative net assets.
Security Valuations —Securities are generally valued at amortized cost, which approximates current market value. Investments in open-end management investment companies are valued at the reported net asset value. When such valuations do not reflect market value, securities may be valued as determined by the Board of Trustees or its designee, in accordance with procedures adopted by the Board of Trustees.
Security Transactions — For financial reporting purposes, security transactions are accounted for as of the trade date. Net realized gains and losses are determined on the identified cost basis, which is also used for federal income tax purposes.
Investment Income— Interest income is recorded on the accrual basis and includes accretion of discounts and amortization of premiums.
Repurchase Agreements — The fund may enter into repurchase agreements with institutions that American Century Investment Management, Inc. (ACIM) (the investment advisor) has determined are creditworthy pursuant to criteria adopted by the Board of Trustees. Each repurchase agreement is recorded at cost. The fund requires that the collateral, represented by securities, received in a repurchase transaction be transferred to the custodian in a manner sufficient to enable the fund to obtain those securities in the event of a default under the repurchase agreement. ACIM monitors, on a daily basis, the securities transferred to ensure the value, including accrued interest, of the securities under each repurchase agreement is equal to or greater than amounts owed to the fund under each repurchase agreement.
Joint Trading Account — Pursuant to an Exemptive Order issued by the Securities and Exchange Commission, the fund, along with certain other funds in the American Century Investments family of funds, may transfer uninvested cash balances into a joint trading account. These balances are invested in one or more repurchase agreements that are collateralized by U.S. Treasury or Agency obligations.
16
Income Tax Status — It is the fund’s policy to distribute substantially all net investment income and net realized gains to shareholders and to otherwise qualify as a regulated investment company under provisions of the Internal Revenue Code. The fund is no longer subject to examination by tax authorities for years prior to 2006. At this time, management believes there are no uncertain tax positions which, based on their technical merit, would not be sustained upon examination and for which it is reasonably possible that the total amounts of unrecognized tax benefits will significantly change in the next twelve months. Accordingly, no provision has been made for federal or state income taxes. Interest and penalties associated with any federal or state income tax obligations, if any, are recorded as interest expense.
Distributions to Shareholders — Distributions from net investment income and short-term capital gains, if any, are declared daily and paid monthly. The fund does not expect to realize any long-term capital gains, and accordingly, does not expect to pay any capital gains distributions.
Indemnifications — Under the trust’s organizational documents, its officers and trustees are indemnified against certain liabilities arising out of the performance of their duties to the fund. In addition, in the normal course of business, the fund enters into contracts that provide general indemnifications. The maximum exposure under these arrangements is unknown as this would involve future claims that may be made against a fund. The risk of material loss from such claims is considered by management to be remote.
Use of Estimates — The financial statements are prepared in conformity with accounting principles generally accepted in the United States of America, which may require management to make certain estimates and assumptions at the date of the financial statements. Actual results could differ from these estimates.
Subsequent Events— Management has evaluated events or transactions that may have occurred since September 30, 2009, that would merit recognition or disclosure in the financial statements. This evaluation was completed through November 27, 2009, the date the financial statements were issued.
2. Fees and Transactions with Related Parties
Management Fees — The trust has entered into a Management Agreement with ACIM, under which ACIM provides the fund with investment advisory and management services in exchange for a single, unified management fee (the fee) per class. The Agreement provides that all expenses of the fund, except brokerage commissions, taxes, portfolio insurance, interest, fees and expenses of those trustees who are not considered “interested persons” as defined in the 1940 Act (including counsel fees) and extraordinary expenses, will be paid by ACIM. The fee is computed and accrued daily based on the daily net assets of the specific class of shares of the fund and paid monthly in arrears. The fee consists of (1) an Investment Category Fee based on the daily net assets of the fund and certain other accounts managed by the investment advisor that are in the same broad investment category as the fund and (2) a Complex Fee based on the assets of all the funds in the American Century Investments family of funds. The rates for the Investment Category Fee range from 0.2370% to 0.3500% and the rates for the Complex Fee (Investor Class, A Class, B Class and C Class) range from 0.2500% to 0.3100%. From April 1, 2009 to July 31, 2009, the investment advisor voluntarily agreed to waive 0.043% of its management fee. Effective August 1, 2009, the investment advisor agreed to waive 0.062% of its management fee. The investment advisor expects this waiver to continue for one year and cannot terminate it without consulting the Board of Trustees. The total amount of the waiver for each class of the fund for the six months ended September 30, 2009, was $683,841, $40,437, $689, and $959 for the Investor Class, A Class, B Class and C Class, respectively. The effective annual management fee before waiver for each class of the fund for the six months ended September 30, 2009 was 0.57%. The effective annual management fee after waiver for each class of the fund for the six months ended September 30, 2009 was 0.52%.
17
Distribution and Service Fees — The Board of Trustees has adopted a separate Master Distribution and Individual Shareholder Services Plan for each of the A Class, B Class and C Class (collectively the plans), pursuant to Rule 12b-1 of the 1940 Act. The plans provide that the A Class will pay American Century Investment Services, Inc. (ACIS) an annual distribution and service fee of 0.25%. The plans provide that the B Class will pay ACIS an annual distribution fee of 0.75% and service fee of 0.25%. The plans provide that the C Class will pay ACIS an annual distribution fee of 0.50% and service fee of 0.25%. The fees are computed and accrued daily based on each class’s daily net assets and paid monthly in arrears. The fees are used to pay financial intermediaries for distribution and individual shareholder services. Fees incurred u nder the plans during the six months ended September 30, 2009, are detailed in the Statement of Operations.
In order to maintain a positive yield, ACIS may voluntarily waive a portion of its distribution and/or service fee on a daily basis. For the A, B, and C Class for the six months ended September 30, 2009, the total amount of the waiver was $44,052, $8,522, and $6,927, respectively, and the annual distribution and service fee waiver ratio to average net assets was 0.05%, 0.60% and 0.35%, respectively. The fee waiver may be revised or terminated at any time without notice.
Temporary Guarantee Program — On October 3, 2008, the Board of Trustees approved the fund to participate in the U.S. Treasury Department’s Temporary Guarantee Program for Money Market Funds (the program). The program provides coverage to guarantee the account values of shareholders in the event the fund’s net asset value falls below $0.995 and the Trustees liquidate the fund. The program covers the lesser of a shareholder’s account value on September 19, 2008, or on the date of liquidation. Participation in the program requires the fund to pay a fee based on the net assets of the fund as of the close of business on September 19, 2008, which is amortized daily over the period. The fund participated in the program from September 19, 2008 through December 19, 2008 and paid a fee of 0.01% of its net assets as of Septemb er 19, 2008. The fund continued its participation in the program from December 20, 2008 through April 30, 2009 and paid a fee of 0.015% of its net assets as of September 19, 2008. The fund continued its participation in a program extension from May 1, 2009 through September 18, 2009 and paid a fee of 0.015% of its net assets as of September 19, 2008. The program expired September 18, 2009. For the six months ended September 30, 2009, the annualized ratio of the program fee to average net assets was 0.036%.
Related Parties — Certain officers and trustees of the trust are also officers and/or directors of American Century Companies, Inc. (ACC), the parent of the trust’s investment advisor, ACIM, the distributor of the trust, ACIS, and the trust’s transfer agent, American Century Services, LLC.
The fund is eligible to invest in a money market fund for temporary purposes, which is managed by J.P. Morgan Investment Management, Inc. (JPMIM). The fund has a Mutual Funds Services Agreement with J.P. Morgan Investor Services Co. (JPMIS). JPMorgan Chase Bank (JPMCB) is a custodian of the fund. JPMIM, JPMIS and JPMCB are wholly owned subsidiaries of JPMorgan Chase & Co. (JPM). JPM is an equity investor in ACC.
18
| | | | |
| 3. Capital Share Transactions | | | |
| |
| Transactions in shares of the fund were as follows (unlimited number of shares authorized): |
| |
| | Six months ended September 30, 2009 | Year ended March 31, 2009 |
| | Shares | Amount | Shares | Amount |
| Investor Class | | | | |
| Sold | 866,081,690 | $866,081,690 | 2,204,392,237 | $2,204,392,237 |
| Issued in reinvestment of distributions | 5,134,564 | 5,134,564 | 54,699,228 | 54,699,228 |
| Redeemed | (912,324,419) | (912,324,419) | (2,028,649,707) | (2,028,649,707) |
| | (41,108,165) | (41,108,165) | 230,441,758 | 230,441,758 |
| A Class | | | | |
| Sold | 35,413,093 | 35,413,093 | 213,854,175 | 213,854,175 |
| Issued in reinvestment of distributions | 154,431 | 154,431 | 2,819,376 | 2,819,376 |
| Redeemed | (75,304,547) | (75,304,547) | (211,454,345) | (211,454,345) |
| | (39,737,023) | (39,737,023) | 5,219,206 | 5,219,206 |
| B Class | | | | |
| Sold | 58,612 | 58,612 | 2,890,336 | 2,890,336 |
| Issued in reinvestment of distributions | 75 | 75 | 14,942 | 14,942 |
| Redeemed | (784,149) | (784,149) | (909,869) | (909,869) |
| | (725,462) | (725,462) | 1,995,409 | 1,995,409 |
| C Class | | | | |
| Sold | 1,826,109 | 1,826,109 | 7,280,619 | 7,280,619 |
| Issued in reinvestment of distributions | 322 | 322 | 29,369 | 29,369 |
| Redeemed | (4,013,814) | (4,013,814) | (3,670,319) | (3,670,319) |
| | (2,187,383) | (2,187,383) | 3,639,669 | 3,639,669 |
| Net increase (decrease) | (83,758,033) | $ (83,758,033) | 241,296,042 | $ 241,296,042 |
4. Fair Value Measurements
The fund’s securities valuation process is based on several considerations and may use multiple inputs to determine the fair value of the positions held by the fund. In conformity with accounting principles generally accepted in the United States of America, the inputs used to determine a valuation are classified into three broad levels as follows:
• Level 1 valuation inputs consist of actual quoted prices in an active market for identical securities;
• Level 2 valuation inputs consist of significant direct or indirect observable market data (including quoted prices for similar securities, evaluations of subsequent market events, interest rates, prepayment speeds, credit risk, etc.); or
• Level 3 valuation inputs consist of significant unobservable inputs (including a fund’s own assumptions).
The level classification is based on the lowest level input that is significant to the fair valuation measurement. The valuation inputs are not an indication of the risks associated with investing in these securities or other financial instruments.
As of September 30, 2009, the valuation inputs used to determine the fair value of the fund’s investment securities were classified as Level 2.
19
5. Interfund Lending
The fund, along with certain other funds in the American Century Investments family of funds, may participate in an interfund lending program, pursuant to an Exemptive Order issued by the Securities and Exchange Commission (SEC). This program provides an alternative credit facility allowing the fund to borrow from or lend to other funds in the American Century Investments family of funds that permit such transactions. Interfund lending transactions are subject to each fund’s investment policies and borrowing and lending limits. The interfund loan rate earned/paid on interfund lending transactions is determined daily based on the average of certain current market rates. Interfund lending transactions normally extend only overnight, but can have a maximum duration of seven days. The program is subject to annual approval by the Board of Trustees. During the six months ended September 30, 2009, the fund did not utilize the pro gram.
6. Federal Tax Information
The book-basis character of distributions made during the year from net investment income or net realized gains may differ from their ultimate characterization for federal income tax purposes. These differences reflect the differing character of certain income items and net realized gains and losses for financial statement and tax purposes, and may result in reclassification among certain capital accounts on the financial statements.
As of March 31, 2009, the fund had accumulated net realized capital loss carryovers for federal income tax purposes of $(532,820), which may be used to offset future taxable gains. Future capital loss carryover utilization in any given year may be subject to Internal Revenue Code limitations. The capital loss carryovers expire as follows:
| | | | | | | |
| 2010 | 2011 | 2012 | 2013 | 2014 | 2015 | 2016 | 2017 |
| $(13,456) | $(36) | — | $(11,584) | $(2,029) | $(20,223) | $(23,536) | $(461,956) |
7. Recently Issued Accounting Standards
In March 2008, the Financial Accounting Standards Board (FASB) issued Accounting Standards Codification (ASC) Section 815-10 (formerly Statement of Financial Accounting Standards No. 161, “Disclosures about Derivative Instruments and Hedging Activities —an amendment of FASB Statement No. 133”). ASC Section 815-10 is effective for interim periods beginning after November 15, 2008 and has been adopted by the fund. ASC Section 815-10 amends and expands disclosures about derivative instruments and hedging activities. ASC Section 815-10 requires qualitative disclosures about the objectives and strategies of derivative instruments, quantitative disclosures about the fair value amounts of and gains and losses on derivative instruments, and disclosures of credit-risk-related contingent features in hedging activities.
20
|
| Financial Highlights |
| Prime Money Market |
| | | | | | | |
| Investor Class | | | | | | |
| For a Share Outstanding Throughout the Years Ended March 31 (except as noted) | | |
| | | 2009(1) | 2009 | 2008 | 2007 | 2006 | 2005 |
| Per-Share Data | | | | | | |
| Net Asset Value, | | | | | | |
| Beginning of Period | $1.00 | $1.00 | $1.00 | $1.00 | $1.00 | $1.00 |
| Income From | | | | | | |
| Investment Operations | | | | | | |
| Net Investment | | | | | | |
| Income (Loss) | —(2) | 0.02 | 0.04 | 0.05 | 0.03 | 0.01 |
| Distributions | | | | | | |
| From Net | | | | | | |
| Investment Income | —(2) | (0.02) | (0.04) | (0.05) | (0.03) | (0.01) |
| Net Asset Value, | | | | | | |
| End of Period | $1.00 | $1.00 | $1.00 | $1.00 | $1.00 | $1.00 |
| |
| Total Return(3) | 0.19% | 2.19% | 4.58% | 4.83% | 3.28% | 1.19% |
| |
| Ratios/Supplemental Data | | | | | | |
| Ratio of Operating | | | | | | |
| Expenses to Average | | | | | | |
| Net Assets | 0.56%(4)(5) | 0.57%(4) | 0.56%(4) | 0.55%(4) | 0.57%(4) | 0.60% |
| Ratio of Operating | | | | | | |
| Expenses to Average | | | | | | |
| Net Assets (Before | | | | | | |
| Expense Waiver) | 0.61%(5) | 0.61% | 0.59% | 0.59% | 0.59% | 0.60% |
| Ratio of Net Investment | | | | | | |
| Income (Loss) to | | | | | | |
| Average Net Assets | 0.39%(4)(5) | 2.16%(4) | 4.47%(4) | 4.73%(4) | 3.24%(4) | 1.17% |
| Ratio of Net Investment | | | | | | |
| Income (Loss) to Average | | | | | | |
| Net Assets (Before | | | | | | |
| Expense Waiver) | 0.34%(5) | 2.12% | 4.44% | 4.69% | 3.22% | 1.17% |
| Net Assets, End of Period | | | | | | |
| (in thousands) | $2,728,759 | $2,769,906 | $2,539,830 | $2,155,800 | $1,981,964 | $1,964,135 |
| (1) | Six months ended September 30, 2009 (unaudited). | | | | |
| (2) | Per-share amount was less than $0.005. | | | | | |
| (3) | Total return assumes reinvestment of net investment income and capital gains distributions, if any. Total returns for periods less than one year |
| | are not annualized. | | | | | | |
| (4) | Effective July 29, 2005, the investment advisor voluntarily agreed to waive a portion of its management fee. | | |
| (5) | Annualized. | | | | | | |
| |
| |
| See Notes to Financial Statements. | | | | | | |
21
| | | | | | | |
| Prime Money Market | | | | | |
| |
| A Class(1) | | | | | | |
| For a Share Outstanding Throughout the Years Ended March 31 (except as noted) | | |
| | | 2009(2) | 2009 | 2008 | 2007 | 2006 | 2005 |
| Per-Share Data | | | | | | |
| Net Asset Value, | | | | | | |
| Beginning of Period | $1.00 | $1.00 | $1.00 | $1.00 | $1.00 | $1.00 |
| Income From | | | | | | |
| Investment Operations | | | | | | |
| Net Investment | | | | | | |
| Income (Loss) | —(3) | 0.02 | 0.04 | 0.04 | 0.03 | 0.01 |
| Distributions | | | | | | |
| From Net | | | | | | |
| Investment Income | —(3) | (0.02) | (0.04) | (0.04) | (0.03) | (0.01) |
| Net Asset Value, | | | | | | |
| End of Period | $1.00 | $1.00 | $1.00 | $1.00 | $1.00 | $1.00 |
| |
| Total Return(4) | 0.10% | 1.94% | 4.32% | 4.58% | 3.02% | 0.94% |
| |
| Ratios/Supplemental Data | | | | | | |
| Ratio of Operating | | | | | | |
| Expenses to Average | | | | | | |
| Net Assets | 0.76%(5)(6)(7) | 0.82%(5) | 0.81%(5) | 0.80%(5) | 0.82%(5) | 0.85% |
| Ratio of Operating | | | | | | |
| Expenses to Average | | | | | | |
| Net Assets (Before | | | | | | |
| Expense Waiver) | 0.86%(7) | 0.86% | 0.84% | 0.84% | 0.84% | 0.85% |
| Ratio of Net Investment | | | | | | |
| Income (Loss) to | | | | | | |
| Average Net Assets | 0.19%(5)(6)(7) | 1.91%(5) | 4.22%(5) | 4.48%(5) | 2.99%(5) | 0.92% |
| Ratio of Net Investment | | | | | | |
| Income (Loss) to Average | | | | | | |
| Net Assets (Before | | | | | | |
| Expense Waiver) | 0.09%(7) | 1.87% | 4.19% | 4.44% | 2.97% | 0.92% |
| Net Assets, End of Period | | | | | | |
| (in thousands) | $141,632 | $181,371 | $176,175 | $4,185 | $3,145 | $2,560 |
| (1) | Prior to September 4, 2007, the A Class was referred to as the Advisor Class. | | | |
| (2) | Six months ended September 30, 2009 (unaudited). | | | | |
| (3) | Per-share amount was less than $0.005. | | | | | |
| (4) | Total return assumes reinvestment of net investment income and capital gains distributions, if any, and does not reflect applicable sales charges. |
| | Total returns for periods less than one year are not annualized. | | | | |
| (5) | Effective July 29, 2005, the investment advisor voluntarily agreed to waive a portion of its management fee. | | |
| (6) | The distributor voluntarily waived a portion of its distribution and service fees. | | | |
| (7) | Annualized. | | | | | | |
| |
| |
| See Notes to Financial Statements. | | | | | |
22
| | | | | | | |
| Prime Money Market | | | | | |
| |
| B Class | | | | | | |
| For a Share Outstanding Throughout the Years Ended March 31 (except as noted) | | |
| | | 2009(1) | 2009 | 2008 | 2007 | 2006 | 2005 |
| Per-Share Data | | | | | | |
| Net Asset Value, | | | | | | |
| Beginning of Period | $1.00 | $1.00 | $1.00 | $1.00 | $1.00 | $1.00 |
| Income From | | | | | | |
| Investment Operations | | | | | | |
| Net Investment | | | | | | |
| Income (Loss) | —(2) | 0.01 | 0.03 | 0.04 | 0.02 | —(2) |
| Distributions | | | | | | |
| From Net | | | | | | |
| Investment Income | —(2) | (0.01) | (0.03) | (0.04) | (0.02) | —(2) |
| Net Asset Value, | | | | | | |
| End of Period | $1.00 | $1.00 | $1.00 | $1.00 | $1.00 | $1.00 |
| |
| Total Return(3) | 0.01% | 1.19% | 3.54% | 3.80% | 2.26% | 0.34% |
| |
| Ratios/Supplemental Data | | | | | |
| Ratio of Operating | | | | | | |
| Expenses to Average | | | | | | |
| Net Assets | 0.96%(4)(5)(6) | 1.55%(4)(5) | 1.56%(4) | 1.55%(4) | 1.57%(4) | 1.48%(5) |
| Ratio of Operating | | | | | | |
| Expenses to Average | | | | | | |
| Net Assets (Before | | | | | | |
| Expense Waiver) | 1.61%(6) | 1.61% | 1.59% | 1.59% | 1.59% | 1.60% |
| Ratio of Net Investment | | | | | | |
| Income (Loss) to | | | | | | |
| Average Net Assets | (0.01)%(4)(5)(6) | 1.18%(4)(5) | 3.47%(4) | 3.73%(4) | 2.24%(4) | 0.29%(5) |
| Ratio of Net Investment | | | | | | |
| Income (Loss) to Average | | | | | | |
| Net Assets (Before | | | | | | |
| Expense Waiver) | (0.66)%(6) | 1.12% | 3.44% | 3.69% | 2.22% | 0.17% |
| Net Assets, End of Period | | | | | | |
| (in thousands) | $2,463 | $3,189 | $1,194 | $838 | $134 | $97 |
| (1) | Six months ended September 30, 2009 (unaudited). | | | | |
| (2) | Per-share amount was less than $0.005. | | | | | |
| (3) | Total return assumes reinvestment of net investment income and capital gains distributions, if any, and does not reflect applicable sales charges. |
| | Total returns for periods less than one year are not annualized. | | | | |
| (4) | Effective July 29, 2005, the investment advisor voluntarily agreed to waive a portion of its management fee. | | |
| (5) | The distributor voluntarily waived a portion of its distribution and service fees. | | | |
| (6) | Annualized. | | | | | | |
| |
| |
| See Notes to Financial Statements. | | | | | |
23
| | | | | | | |
| Prime Money Market | | | | | |
| |
| C Class | | | | | | |
| For a Share Outstanding Throughout the Years Ended March 31 (except as noted) | | |
| | | 2009(1) | 2009 | 2008 | 2007 | 2006 | 2005 |
| Per-Share Data | | | | | | |
| Net Asset Value, | | | | | | |
| Beginning of Period | $1.00 | $1.00 | $1.00 | $1.00 | $1.00 | $1.00 |
| Income From | | | | | | |
| Investment Operations | | | | | | |
| Net Investment | | | | | | |
| Income (Loss) | —(2) | 0.01 | 0.04 | 0.04 | 0.02 | 0.01 |
| Distributions | | | | | | |
| From Net | | | | | | |
| Investment Income | —(2) | (0.01) | (0.04) | (0.04) | (0.02) | (0.01) |
| Net Asset Value, | | | | | | |
| End of Period | $1.00 | $1.00 | $1.00 | $1.00 | $1.00 | $1.00 |
| |
| Total Return(3) | 0.01% | 1.44% | 3.81% | 4.06% | 2.51% | 0.57% |
| |
| Ratios/Supplemental Data | | | | | |
| Ratio of Operating | | | | | | |
| Expenses to Average | | | | | | |
| Net Assets | 0.96%(4)(5)(6) | 1.32%(4) | 1.31%(4) | 1.30%(4) | 1.32%(4) | 1.28%(5) |
| Ratio of Operating | | | | | | |
| Expenses to Average | | | | | | |
| Net Assets (Before | | | | | | |
| Expense Waiver) | 1.36%(6) | 1.36% | 1.34% | 1.34% | 1.34% | 1.35% |
| Ratio of Net Investment | | | | | | |
| Income (Loss) to | | | | | | |
| Average Net Assets | (0.01)%(4)(5)(6) | 1.41%(4) | 3.72%(4) | 3.98%(4) | 2.49%(4) | 0.49%(5) |
| Ratio of Net Investment | | | | | | |
| Income (Loss) to Average | | | | | | |
| Net Assets (Before | | | | | | |
| Expense Waiver) | (0.41)%(6) | 1.37% | 3.69% | 3.94% | 2.47% | 0.42% |
| Net Assets, End of Period | | | | | | |
| (in thousands) | $3,415 | $5,602 | $1,963 | $527 | $863 | $604 |
| (1) | Six months ended September 30, 2009 (unaudited). | | | | |
| (2) | Per-share amount was less than $0.005. | | | | | |
| (3) | Total return assumes reinvestment of net investment income and capital gains distributions, if any, and does not reflect applicable sales charges. |
| | Total returns for periods less than one year are not annualized. | | | | |
| (4) | Effective July 29, 2005, the investment advisor voluntarily agreed to waive a portion of its management fee. | | |
| (5) | The distributor voluntarily waived a portion of its distribution and service fees. | | | |
| (6) | Annualized. | | | | | | |
| |
| |
| See Notes to Financial Statements. | | | | | |
24
|
| Approval of Management Agreement |
Under Section 15(c) of the Investment Company Act, contracts for investment advisory services to a mutual fund are required to be reviewed, evaluated and approved each year by the fund’s board of directors/ trustees, including a majority of a fund’s independent directors/trustees (the “Directors”). At American Century Investments, this process is referred to as the “15(c) Process.” The board oversees on a continuous basis and evaluates at its quarterly meetings, directly and through the committees of the board, the nature and quality of significant services provided by the advisor, the investment performance of the funds, shareholder services, audit and compliance functions and a variety of other matters relating to fund operations. Each year, it also holds a special meeting in connection with determining whether to renew the contracts for advisory services, to review fund performance, shareholder services, adviser profitability, audit and compliance matters, and other fund operational matters.
Under a Securities and Exchange Commission rule, each fund is required to disclose in its annual or semiannual report, as appropriate, the material factors and conclusions that formed the basis for the board’s approval or renewal of any advisory agreements within the fund’s most recently completed fiscal half-year period.
Annual Contract Review Process
As part of the annual 15(c) Process, the Directors requested and reviewed extensive data and information compiled by the advisor and certain independent providers of evaluative data (the “15(c) Providers”) concerning Prime Money Market (the “fund”) and the services provided to the fund under the management agreement. The information considered and the discussions held at the meetings included, but were not limited to:
• the nature, extent and quality of investment management, shareholder services and other services that the advisor provides to the fund;
• the wide range of programs and services the advisor provides to the fund and its shareholders on a routine and non-routine basis;
• the compliance policies, procedures, and regulatory experience of the advisor;
• data comparing the cost of owning the fund to the cost of owning a similar fund;
• data comparing the fund’s performance to appropriate benchmarks and/ or a peer group of other mutual funds with similar investment objectives and strategies;
• financial data showing the profitability of the fund to the advisor and the overall profitability of the advisor;
• data comparing services provided and charges to other non-fund investment management clients of the advisor; and
25
• collateral or “fall-out” benefits derived by the advisor from the manage-ment of the fund, and potential sharing of economies of scale in connection with the management of the fund.
In keeping with its practice, the Directors at a special meeting and at a regularly scheduled quarterly meeting reviewed and discussed the information provided by the advisor throughout the year and to negotiate with the advisor the renewal of the management agreement, including the setting of the applicable management fee. The Directors had the benefit of the advice of their independent counsel throughout the period.
Factors Considered
The Directors considered all of the information provided by the advisor, independent data providers, and the board’s independent counsel, and evaluated such information for each fund the board oversees. The Directors did not identify any single factor as being all-important or controlling, and each Director may have attributed different levels of importance to different factors. In deciding to renew the agreement under the terms ultimately determined by the board to be appropriate, the Directors’ decision was based on a number of factors, including the following.
Nature, Extent and Quality of Services – Generally. Under the management agreement, the advisor is responsible for providing or arranging for all services necessary for the operation of the fund. The board noted that under the management agreement, the advisor provides or arranges at its own expense a wide variety of services including:
• fund construction and design
• initial capitalization/funding
• portfolio research and security selection
• securities trading
• fund administration
• custody of fund assets
• daily valuation of the fund’s portfolio
• shareholder servicing and transfer agency, including shareholder confirmations, recordkeeping and communications
• legal services
• regulatory and portfolio compliance
• financial reporting
• marketing and distribution
26
The Directors noted that many of these services have expanded over time both in terms of quantity and complexity in response to shareholder demands, competition in the industry, changing distribution channels and the changing regulatory environment. In performing their evaluation, the Directors considered information received in connection with the annual review, as well as information provided on an ongoing basis throughout the year and at their regularly scheduled board and committee meetings.
Investment Management Services. The nature of the investment management services provided is quite complex and allows fund shareholders access to professional money management, instant diversification of their investments within an asset class, the opportunity to easily diversify among asset classes, and liquidity. In evaluating investment performance, the board expects the advisor to manage the fund in accordance with its investment objectives and approved strategies. In providing these services, the advisor utilizes teams of investment professionals (portfolio managers, analysts, research assistants, and securities traders) who require extensive information technology, research, training, compliance and other systems to conduct their business. At each quarterly meeting and at the special meeting to consider renewal of the management agre ement, the Directors, directly and through its Portfolio Committee, review investment performance information for the fund, together with comparative information for appropriate benchmarks and/or peer groups of similarly-managed funds, over different time horizons. If performance concerns are identified, the underperforming fund receives special reviews until performance improves, during which Directors discuss with the advisor the reasons for such underperformance (e.g., market conditions, security and sector selection) and any efforts being undertaken to improve performance. The Fund’s performance for both the one- and three-year periods was in the top decile of its peer group.
Shareholder and Other Services. The advisor provides the fund with a comprehensive package of transfer agency, shareholder, and other services. The Directors, directly and through the various Committees of the Board, review reports and evaluations of such services at their regular quarterly meetings and at their special meeting to consider renewal of the management agreement, including the annual meeting concerning contract review, and other reports to the board. These reports include, but are not limited to, information regarding the operational efficiency and accuracy of the shareholder and transfer agency services provided, staffing levels, shareholder satisfaction (as measured by external as well as internal sources), technology support, new products and services offered to fund shareholders, securities trading activities, portfolio va luation services, auditing services, and legal and operational compliance activities. Certain aspects of shareholder and transfer agency service level efficiency and the quality of securities trading activities are measured by independent third party providers and are presented in comparison to other fund groups not managed by the advisor.
27
Costs of Services Provided and Profitability. The advisor provides detailed information concerning its cost of providing various services to the fund, its profitability in managing the fund, its overall profitability, and its financial condition. The Directors have reviewed with the advisor the methodology used to prepare this financial information. The Directors have also reviewed with the advisor its methodology for compensating the investment professionals that provide services to the fund. This financial information regarding the advisor is considered in order to evaluate the advisor’s financial condition, its ability to continue to provide services under the management agreement, and the reasonableness of the current management fee.
Ethics. The Directors generally consider the advisor’s commitment to providing quality services to shareholders and to conducting its business ethically. They noted that the advisor’s practices generally meet or exceed industry best practices.
Economies of Scale. The Directors review information provided by the advisor regarding the existence of economies of scale in connection with the investment management of the funds. The Directors concluded that economies of scale are difficult to measure and predict with precision, especially on a fund-by-fund basis. The analysis of economies of scale is further complicated by the additional services and content provided by the advisor and its reinvestment in its ability to provide and expand those services. Accordingly, the Directors seek to evaluate economies of scale by reviewing information, such as year-over-year profitability of the advisor generally, the profitability of its management of the fund specifically, and the expenses incurred by the advisor in providing various functions to the fund. The Directors believe the advisor is a ppropriately sharing economies of scale through its competitive fee structure, fee breakpoints as the fund complex and the fund increases in size, and through reinvestment in its business to provide shareholders additional services and enhancements to existing services. In particular, separate breakpoint schedules based on the size of the entire fund complex and on the size of the fund reflect the complexity of assessing economies of scale.
Comparison to Other Funds’ Fees. The fund pays the advisor a single, all-inclusive (or unified) management fee for providing all services necessary for the management and operation of the fund, other than brokerage expenses, taxes, interest, extraordinary expenses, and the fees and expenses of the fund’s independent directors (including their independent legal counsel). Under the unified fee structure, the advisor is responsible for providing all investment advisory, custody, audit, administrative, compliance, record-keeping, marketing and shareholder services, or arranging and supervising third parties to provide such services. By contrast, most other funds are charged a variety of fees, including an investment advisory fee, a transfer agency fee, an administrative fee, distribution charges and other expenses. Other than their i nvestment advisory fees and Rule 12b-1 distribution fees, the components of the total fees charged by these other funds may be increased without shareholder approval. The board believes the unified fee structure is a benefit to fund shareholders because it clearly discloses to shareholders the cost of owning fund shares, and, since the unified fee cannot be increased without a vote of fund shareholders, it shifts to the
28
advisor the risk of increased costs of operating the fund and provides a direct incentive to minimize administrative inefficiencies. Part of the Directors’ analysis of fee levels involves reviewing certain evaluative data compiled by an independent provider and comparing the fund’s unified fee to the total expense ratio of other funds in the fund’s peer group. The Directors also reviewed updated fee level data provided by the advisor, but recognized that comparative data was particularly difficult to evaluate given the significant market developments during the past year impacting fund assets. The unified fee charged to shareholders of the fund was below the median of the total expense ratios of its peer group.
Comparison to Fees and Services Provided to Other Clients of the Advisor. The Directors also requested and received information from the advisor concerning the nature and extent of the services, fees, and profitability of its advisory services to advisory clients other than the fund. They observed that these varying types of client accounts require different services and involve different regulatory and entrepreneurial risks than the management of the fund. The Directors analyzed this information and concluded that the fees charged and services provided to the fund were reasonable by comparison.
Collateral or “Fall-Out” Benefits Derived by the Advisor. The Directors considered the existence of collateral benefits the advisor may receive as a result of its relationship with the fund. They concluded that the advisor’s primary business is managing mutual funds and it generally does not use fund or shareholder information to generate profits in other lines of business, and therefore does not derive any significant collateral benefits from them. The Directors noted that the advisor receives proprietary research from broker dealers that execute fund portfolio transactions but concluded that this research is likely to benefit fund shareholders. The Directors also determined that the advisor is able to provide investment management services to certain clients other than the fund, at least in part, due to its existing infras tructure built to serve the fund complex. The Directors concluded, however, that the assets of those other clients are not material to the analysis and, in any event, are included with the assets of the fund to determine breakpoints in the fund’s fee schedule, provided they are managed using the same investment team and strategy.
Conclusions of the Directors
As a result of this process, the Directors, in the absence of particular circumstances and assisted by the advice of their independent legal counsel, taking into account all of the factors discussed above and the information provided by the advisor and others, concluded that the investment management agreement between the fund and the advisor, including the management fee, is fair and reasonable in light of the services provided and should be renewed for a one-year term. In addition, the Directors negotiated a renewal of the one-year waiver by the advisor of a portion of the management fee that was in place during the previous year. This change was proposed by the Directors based on their review of the percentile rank of the fund’s fees within the fund’s peer universe and the fact that the Directors seek, as a general rule, to have total expense ratios of existing fixed income and money market funds in the lowest 2 5th percentile of the fees of comparable funds.
29
Retirement Account Information
As required by law, distributions you receive from certain IRAs, or 403(b), 457 and qualified plans are subject to federal income tax withholding, unless you elect not to have withholding apply. Tax will be withheld on the total amount withdrawn even though you may be receiving amounts that are not subject to withholding, such as nondeductible contributions. In such case, excess amounts of withholding could occur. You may adjust your withholding election so that a greater or lesser amount will be withheld.
If you don’t want us to withhold on this amount, you must notify us to not withhold the federal income tax. You may notify us in writing or in certain situations by telephone or through other electronic means. You have the right to revoke your withholding election at any time and any election you make may remain in effect until revoked by filing a new election.
Remember, even if you elect not to have income tax withheld, you are liable for paying income tax on the taxable portion of your withdrawal. If you elect not to have income tax withheld or you don’t have enough income tax withheld, you may be responsible for payment of estimated tax. You may incur penalties under the estimated tax rules if your withholding and estimated tax payments are not sufficient. You can reduce or defer the income tax on a distribution by directly or indirectly rolling such distribution over to another IRA or eligible plan. You should consult your tax advisor for additional information.
State tax will be withheld if, at the time of your distribution, your address is within one of the mandatory withholding states and you have federal income tax withheld. State taxes will be withheld from your distribution in accordance with the respective state rules.
Proxy Voting Guidelines
American Century Investment Management, Inc., the fund’s investment advisor, is responsible for exercising the voting rights associated with the securities purchased and/or held by the fund. A description of the policies and procedures the advisor uses in fulfilling this responsibility is available without charge, upon request, by calling 1-800-345-2021. It is also available on American Century Investments’ website at americancentury.com and on the Securities and Exchange Commission’s website at sec.gov. Information regarding how the investment advisor voted proxies relating to portfolio securities during the most recent 12-month period ended June 30 is available on the “About Us” page at americancentury.com. It is also available at sec.gov.
Quarterly Portfolio Disclosure
The fund files its complete schedule of portfolio holdings with the Securities and Exchange Commission (SEC) for the first and third quarters of each fiscal year on Form N-Q. The fund’s Form N-Q is available on the SEC’s website at sec.gov, and may be reviewed and copied at the SEC’s Public Reference Room in Washington, DC. Information on the operation of the Public Reference Room may be obtained by calling 1-800-SEC-0330. The fund also makes its complete schedule of portfolio holdings for the most recent quarter of its fiscal year available on its website at ameri-cancentury.com and, upon request, by calling 1-800-345-2021.
30
The following indices are used to illustrate investment market, sector, or style performance or to serve as fund performance comparisons. They are not investment products available for purchase.
The 90-Day U.S. Treasury Bill Index is derived from secondary market interest rates for three-month instruments as published by the Federal Reserve Bank.
The Citigroup Agency Index is a market-capitalization-weighted index that includes US government sponsored agencies with a remaining maturity of at least one year.
The Citigroup Credit Index includes US and non-US corporate securities and non-US sovereign and provincial securities.
The Citigroup High-Yield Cash-Pay Index is composed of those cash-pay securities included in the Citigroup US High-Yield Market Index with remaining maturities of at least one year.
The Citigroup Mortgage Index measures the mortgage component of the US BIG Bond Index, comprising 15- and 30-year GNMA, FNMA, and FHLMC pass-throughs and FNMA and FHLMC balloon mortgages.
The Citigroup Treasury Index is comprised of US Treasury securities with an amount outstanding of at least $5 billion and a remaining maturity of at least one year.
The Citigroup US Broad Investment-Grade (BIG) Bond Index is a market-capitalization-weighted index that includes fixed-rate Treasury, government-sponsored, mortgage, asset-backed, and investment-grade issues with a maturity of one year or longer.
The Citigroup US High-Yield Market Index captures the performance of below-investment-grade debt issued by corporations domiciled in the United States or Canada. This index includes cash-pay and deferred-interest securities that are publicly placed, have a fixed coupon, and are nonconvertible.
The Citigroup US Inflation-Linked Securities Index (ILSI)SM measures the return of bonds with fixed-rate coupon payments that adjust for inflation as measured by the Consumer Price Index (CPI).
31
32

| |
| |
| Contact Us | |
| americancentury.com | |
| Automated Information Line | 1-800-345-8765 |
| Investor Services Representative | 1-800-345-2021 or |
| | 816-531-5575 |
| Investors Using Advisors | 1-800-378-9878 |
| Business, Not-For-Profit, Employer-Sponsored | |
| Retirement Plans | 1-800-345-3533 |
| Banks and Trust Companies, Broker-Dealers, | |
| Financial Professionals, Insurance Companies | 1-800-345-6488 |
| Telecommunications Device for the Deaf | 1-800-634-4113 |
| American Century Investment Trust | |
| Investment Advisor: | |
| American Century Investment Management, Inc. | |
| Kansas City, Missouri | |
This report and the statements it contains are submitted for the general
information of our shareholders. The report is not authorized for distribution to
prospective investors unless preceded or accompanied by an effective prospectus.
American Century Investment Services, Inc., Distributor
©2009 American Century Proprietary Holdings, Inc. All rights reserved.
0911
CL-SAN-66870S
|
| Semiannual Report |
| September 30, 2009 |

|
| American Century Investments |
Diversified Bond Fund
High-Yield Fund

Dear Investor:
Thank you for your investment with us during the financial reporting period ended September 30, 2009. We appreciate your trust in American Century Investments® at this volatile, transitional time in the economy and investment markets.
As the upheavals associated with the “Great Recession” gradually subside, our senior management team has put considerable thought into how the investment environment has changed and what new challenges and opportunities await us. Critical factors that we are anticipating in the coming year include marked shifts in investment and spending behavior, along with consolidation in our industry.
Most importantly, we think the economic recovery will be slow and extended. The economy and capital markets have come a long way since Lehman Brothers collapsed over a year ago, but 2010 will likely bring continuing challenges. The stock market’s rebound since last March and the third-quarter economic surge this year were fueled largely by corporate cost-cutting and unprecedented monetary and fiscal stimulus, including some key programs that have since expired or been scaled back.
Meanwhile, the resilient but struggling consumer sector still faces rising unemployment, heavy debt burdens, tight credit conditions, and a housing market that is starting to stabilize, but remains vulnerable. Much of our investment positioning in 2009 has cautiously reflected these still unstable economic fundamentals, leading to underperformance, in some cases, versus market benchmarks buoyed by the rally of riskier assets. We still support our fundamentally based positioning because we believe strongly that some markets—driven more by technical factors than fundamentals—have advanced further than underlying economic conditions warrant, and remain susceptible to the possibility of more volatility ahead.
For more detailed information from our portfolio management team about the performance and positioning of your investment, please review the following pages, or visit our website, americancentury.com.
Thank you for your continued confidence in us.
Sincerely,

Jonathan Thomas
President and Chief Executive Officer
American Century Investments
| |
| Market Perspective | 2 |
| U.S. Fixed-Income Total Returns | 2 |
| |
| Diversified Bond | |
| |
| Performance | 3 |
| Portfolio Commentary | 5 |
| Portfolio at a Glance | 7 |
| Yields | 7 |
| Portfolio Composition by Credit Rating | 7 |
| Types of Investments in Portfolio | 7 |
| |
| High-Yield | |
| |
| Performance | 8 |
| Portfolio Commentary | 10 |
| Portfolio at a Glance | 12 |
| �� Yields | 12 |
| Portfolio Composition by Credit Rating | 12 |
| Top Five Industries | 12 |
| |
| Shareholder Fee Examples | 13 |
| |
| Financial Statements | |
| |
| Schedule of Investments | 16 |
| Statement of Assets and Liabilities | 37 |
| Statement of Operations | 39 |
| Statement of Changes in Net Assets | 40 |
| Notes to Financial Statements | 41 |
| Financial Highlights | 52 |
| |
| Other Information | |
| |
| Approval of Management Agreements | 64 |
| Additional Information | 69 |
| Index Definitions | 70 |
The opinions expressed in the Market Perspective and each of the Portfolio Commentaries reflect those of the portfolio management team as of the date of the report, and do not necessarily represent the opinions of American Century Investments or any other person in the American Century Investments organization. Any such opinions are subject to change at any time based upon market or other conditions and American Century Investments disclaims any responsibility to update such opinions. These opinions may not be relied upon as investment advice and, because investment decisions made by American Century Investments funds are based on numerous factors, may not be relied upon as an indication of trading intent on behalf of any American Century Investments fund. Security examples are used for representational purposes only and are not intended as recommendations to purchase or sell securities. Performance information for comparat ive indices and securities is provided to American Century Investments by third party vendors. To the best of American Century Investments’ knowledge, such information is accurate at the time of printing.

By David MacEwen, Chief Investment Officer, Fixed Income
Economy Stabilized, Credit Crisis Eased
The six months ended September 30, 2009, witnessed a remarkable rebound by U.S. financial markets, made possible by the easing of the credit crisis and signs of stabilization in the economy. The government’s stimulus package and “cash for clunkers” program directly boosted consumer spending; home prices stabilized; big financial institutions passed the government’s “stress tests”; and liquidity returned to U.S. credit markets. Add it all up, and the economy expanded at a 3.5% annual rate in the third quarter. That marked the first positive reading on growth since the second quarter of 2008. But even as the economy stabilized, the unemployment rate rose to 9.8% in September, raising the prospect of a weak, “jobless” recovery.
Slack in the labor market and a still-weak economy meant a continued decline in measures of inflation, as the government’s Consumer Price Index fell by 1.3% for the year ended in September. In that environment, the Federal Reserve (the Fed) continued to hold its short-term rate target at 0%–0.25%.
Risk Reigned Supreme
The realization that financial and economic Armageddon had been averted caused a dramatic reversal of the trading that defined 2008, when Treasuries performed best by a wide margin. For the six months ended September 30, 2009, risk assets (securities such as stocks and bonds that offer potentially higher yields and returns than Treasuries) posted very strong returns while intermediate- and long-term Treasury bond prices actually fell (see the accompanying table). This resulted in historic outperformance by some segments of credit markets compared with Treasuries for the six months.
Rates Edged Up
With signs of stability in the economy and financial markets, the Fed began to look ahead to an end to its support of the market for government agency and mortgage-backed securities; nevertheless, to ensure the recovery, the Fed’s policy making arm said it would keep rates low for the foreseeable future. In that environment, investors sold Treasuries, sending their prices down and yields up.
| | | | |
| U.S. Fixed-Income Total Returns | | | | |
| For the six months ended September 30, 2009* | | | |
| Treasury Securities | | | Citigroup U.S. Bond Market Indices | |
| 3-Month Bill | 0.09% | | High-Yield Cash-Pay (corporate) | 37.81% |
| 2-Year Note | 0.73% | | Credit (investment-grade corporate) | 16.39% |
| 10-Year Note | –3.82% | | Broad Investment-Grade (multi-sector) | 4.80% |
| 30-Year Bond | –6.62% | | Inflation-Linked Securities | 3.47% |
| | | | Mortgage (mortgage-backed) | 2.89% |
| | | | Agency | 1.51% |
| *Total returns for periods less than one year are not annualized. | | Treasury | –1.03% |
2
| | | | | | |
| Diversified Bond | | | | | | |
| |
| Total Returns as of September 30, 2009 | | | | |
| | | | Average Annual Returns | |
| | | | | | Since | Inception |
| | 6 months(1) | 1 year | 5 years | 10 years | Inception | Date |
| Investor Class | 5.47% | 11.05% | 5.49% | — | 5.24% | 12/3/01 |
| Citigroup US Broad | | | | | | |
| Investment-Grade Bond Index | 4.80% | 10.98% | 5.43% | 6.45% | 5.64%(2) | — |
| Institutional Class | 5.48% | 11.16% | 5.68% | 6.21% | 6.03% | 4/1/93 |
| A Class(3) | | | | | | 12/3/01 |
| No sales charge* | 5.34% | 10.77% | 5.22% | — | 4.97% | |
| With sales charge* | 0.65% | 5.83% | 4.25% | — | 4.36% | |
| B Class | | | | | | 1/31/03 |
| No sales charge* | 4.85% | 9.85% | 4.42% | — | 3.99% | |
| With sales charge* | -0.15% | 5.85% | 4.26% | — | 3.99% | |
| C Class | | | | | | 1/31/03 |
| No sales charge* | 4.95% | 9.95% | 4.44% | — | 4.04% | |
| With sales charge* | 3.95% | 9.95% | 4.44% | — | 4.04% | |
| R Class | 5.21% | 10.50% | — | — | 5.42% | 7/29/05 |
| * | Sales charges include initial sales charges and contingent deferred sales charges (CDSCs), as applicable. A Class shares have a 4.50% maximum initial sales charge for fixed-income funds and may be subject to a maximum CDSC of 1.00%. B Class shares redeemed within six years of purchase are subject to a CDSC that declines from 5.00% during the first year after purchase to 0.00% the sixth year after purchase. C Class shares redeemed within 12 months of purchase are subject to a maximum CDSC of 1.00%. |
| | The SEC requires that mutual funds provide performance information net of maximum sales charges in all cases where charges could be applied. |
Diversified Bond acquired all of the net assets of the American Century Intermediate-Term Bond Fund, the American Century Bond Fund, and the American Century Premium Bond Fund on December 3, 2001, pursuant to a plan of reorganization approved by the acquired funds’ shareholders on November 16, 2001. Financial information prior to December 3, 2001 is that of American Century Premium Bond Fund and is used in calculating the performance of Diversified Bond.
| (1) | Total returns for periods less than one year are not annualized. |
| (2) | Since 11/30/01, the date nearest the Investor Class’s inception for which data are available. |
| (3) | Prior to September 4, 2007, the A Class was referred to as the Advisor Class. Performance, with sales charge, prior to that date has been adjusted to reflect the A Class’s current sales charge. |
Data presented reflect past performance. Past performance is no guarantee of future results. Current performance may be higher or lower than the performance shown. Investment return and principal value will fluctuate, and redemption value may be more or less than original cost. To obtain performance data current to the most recent month end, please call 1-800-345-2021 or visit americancentury.com. As interest rates rise, bond values will decline.
Unless otherwise indicated, performance reflects Investor Class shares; performance for other share classes will vary due to differences in fee structure. For information about other share classes available, please consult the prospectus. Data assumes reinvestment of dividends and capital gains, and none of the charts reflect the deduction of taxes that a shareholder would pay on fund distributions or the redemption of fund shares. Returns for the index are provided for comparison. The fund’s total returns include operating expenses (such as transaction costs and management fees) that reduce returns, while the total returns of the index do not.
3

| | | | | | | | | |
| One-Year Returns Over Life of Class | | | | | | |
| Periods ended September 30 | | | | | | | |
| | | 2002* | 2003 | 2004 | 2005 | 2006 | 2007 | 2008 | 2009 |
| Investor Class | 5.72% | 5.19% | 2.66% | 2.82% | 3.22% | 5.05% | 5.52% | 11.05% |
| Citigroup US Broad | | | | | | | | |
| Investment-Grade Bond Index | 7.72% | 5.49% | 3.82% | 2.92% | 3.71% | 5.25% | 4.48% | 10.98% |
| * From 12/3/01, the Investor Class’s inception date. Index data from 11/30/01, the date nearest the Investor Class’s inception for which data are |
| available. Not annualized. | | | | | | | | |
| |
| Total Annual Fund Operating Expenses | | | | | | |
| Institutional | | | | | |
| Investor Class | Class | A Class | B Class | C Class | R Class |
| 0.62% | 0.42% | 0.87% | 1.62% | 1.62% | 1.12% |
The total annual fund operating expenses shown is as stated in the fund’s prospectus current as of the date of this report. The prospectus may vary from the expense ratio shown elsewhere in this report because it is based on a different time period, includes acquired fund fees and expenses, and, if applicable, does not include fee waivers or expense reimbursements.
Data presented reflect past performance. Past performance is no guarantee of future results. Current performance may be higher or lower than the performance shown. Investment return and principal value will fluctuate, and redemption value may be more or less than original cost. To obt ain performance data current to the most recent month end, please call 1-800-345-2021 or visit americancentury.com. As interest rates rise, bond values will decline.
Unless otherwise indicated, performance reflects Investor Class shares; performance for other share classes will vary due to differences in fee structure. For information about other share classes available, please consult the prospectus. Data assumes reinvestment of dividends and capital gains, and none of the charts reflect the deduction of taxes that a shareholder would pay on fund distributions or the redemption of fund shares. Returns for the index are provided for comparison. The fund’s total returns include operating expenses (such as transaction costs and management fees) that reduce returns, while the total returns of the index do not.
4
|
| Portfolio Commentary |
| Diversified Bond |
Portfolio Managers: David MacEwen, Bob Gahagan, Jeff Houston, Brian Howell, and Hando Aguilar
Performance Summary
Diversified Bond returned 5.47%* for the six months ended September 30, 2009. By comparison, the Citigroup US Broad Investment-Grade (BIG) Bond Index returned 4.80%. See page 3 for additional performance comparisons. Portfolio returns reflect operating expenses, while Citigroup index returns do not.
Underweight Treasuries, Mortgages Helped
We continued to keep the portfolio’s duration and yield curve exposure neutral relative to the BIG Index, believing we could make better use of our risk budget through higher-confidence sector and security selection decisions. We were underweight Treasuries because of the combination of low current yields and record government budget deficits, which we believe argues for higher yields (and lower prices) down the road. That positioning added value for the six months, when Treasuries were the poorest-performing segment of the market.
In addition, we took some profits and moved to an underweight position in securitized bonds after a period of outperformance. The appeal of these bonds was further diminished as it became clear the Federal Reserve would end its active support of this market in early 2010. So even though mortgage-backed securities outperformed Treasuries, it was beneficial to trim this position and put those profits to work in corporates, which did best for the six months. What’s more, within the securitized slice it helped to favor collateralized mortgage obligations and commercial mortgage-backed securities over traditional passthrough mortgages.
Overweight Municipals, Corporates Benefited
We also took profits in the last six months from our overweight stakes in inflation-indexed and municipal bonds. Municipal and inflation-adjusted securities performed very well early in 2009, so we closed out some of these positions and added select corporate securities we believed offered attractive yields relative to the securities’ risk. We also liked the fact that corporate health has improved since the height of the credit crisis, though we believe that careful credit analysis and security selection remains essential. It also helped to hold a small allocation to BB-rated corporate bonds, which outperformed investment-grade securities.
Within the corporate slice, we favored companies in stable, non-cyclical sectors and industries that we thought could do well or improve profitability through innovation or cost cuts, rather than requiring top-line economic growth. Examples of sectors and industries we favored were pharmaceuticals, technology, cable, media, and energy. At the same time, we tended to avoid insurance companies and regional banks in particular
*All fund returns referenced in this commentary are for Investor Class shares. Total returns for periods less than one year are not annualized.
5
Diversified Bond
and finance in general. But we should point out that while it helped to add corporate bonds in the last six months, the portfolio’s performance would have been even better had we not been underrepresented in finance sector bonds, which rebounded sharply.
Other Changes
Late in the reporting period we put in place a trade using long-term municipal bonds and 30-year Treasury futures designed to capitalize on the changing yield relationship between municipals and Treasuries. The trade was based on the expectation that the yield difference between the two would move toward its normal historical relationship—with municipals yielding less than Treasuries—which it did. Finally, in September we began to add German government bonds in the first step of what we view as a longer-term trade intended to increase the portfolio’s non-dollar exposure.
Outlook
“While we believe the worst of the financial crisis is behind us, the economy remains weak with a ‘jobless’ recovery likely,“ said Portfolio Manager Bob Gahagan. “We believe the government’s massive monetary and fiscal stimulus could eventually result in higher inflation and lower purchasing power for the dollar. As a result, we expect to continue to evaluate opportunities to add inflation-adjusted securities and non-dollar-denominated bonds. In the meantime, we’ll continue to evaluate sectors and individual securities that we believe are attractively valued and have the potential to outperform going forward.”
6
| | |
| Diversified Bond | | |
| |
| Portfolio at a Glance | | |
| | As of 9/30/09 | As of 3/31/09 |
| Average Duration (effective) | 4.5 years | 3.8 years |
| Weighted Average Life | 6.1 years | 5.1 years |
| | | |
| Yields as of September 30, 2009 | | |
| 30-day SEC Yield | | |
| Investor Class | 3.19% | |
| Institutional Class | 3.39% | |
| A Class | 2.80% | |
| B Class | 2.19% | |
| C Class | 2.20% | |
| R Class | 2.69% | |
| | | |
| Portfolio Composition by Credit Rating | | |
| | % of fund | % of fund |
| | investments | investments |
| | as of 9/30/09 | as of 3/31/09 |
| AAA | 70% | 81% |
| AA | 3% | 3% |
| A | 11% | 10% |
| BBB | 14% | 6% |
| BB or lower | 2% | — |
| Ratings provided by independent research companies. These ratings are listed in Standard & Poor’s format even if they were provided by other sources. |
| The letter ratings indicate the credit worthiness of the underlying bonds in the portfolio and generally range from AAA (highest) to D (lowest). |
| |
| Types of Investments in Portfolio | | |
| | % of fund | % of fund |
| | investments | investments |
| | as of 9/30/09 | as of 3/31/09 |
| U.S. Government Agency Mortgage-Backed Securities | 30.2% | 34.6% |
| Corporate Bonds | 26.5% | 17.3% |
| U.S. Treasury Securities | 20.1% | 14.1% |
| U.S. Government Agency Securities and Equivalents | 12.1% | 12.4% |
| Municipal Securities | 2.4% | 4.2% |
| Collateralized Mortgage Obligations | 2.1% | 2.9% |
| Commercial Mortgage-Backed Securities | 2.1% | 4.7% |
| Sovereign Governments & Agencies | 1.6% | 0.4% |
| Asset-Backed Securities | 0.2% | 0.4% |
| Temporary Cash Investments | 2.7% | 7.1% |
| Temporary Cash Investments — Securities Lending Collateral | — | 1.9% |
7
| | | | | | | |
| Performance | | | | | | | |
| High-Yield | | | | | | |
| |
| Total Returns as of September 30, 2009 | | | | |
| | | | Average Annual Returns | |
| | | | | | Since | Inception |
| | 6 months(1) | 1 year | 5 years | 10 years | Inception | Date |
| Investor Class(2) | 23.50% | 12.63% | 4.30% | 3.88% | 3.47% | 9/30/97 |
| Merrill Lynch US High Yield | | | | | | |
| Masters II Constrained Index | 41.31% | 22.73% | 6.09% | 6.18% | 5.67% | — |
| Lipper High Current Yield | | | | | | |
| Funds Average Return(3) | 33.65% | 13.11% | 4.15% | 4.54% | 3.71% | — |
| Investor Class’s Lipper Ranking(3) | N/A | 288 of 459 | 193 of 331 | 148 of 206 | 85 of 127 | — |
| Institutional Class(2) | 23.62% | 12.85% | 4.51% | — | 4.95% | 8/2/04 |
| A Class(2)(4) | | | | | | 3/8/02 |
| No sales charge* | 23.35% | 12.35% | 4.04% | — | 5.99% | |
| With sales charge* | 17.89% | 7.22% | 3.08% | — | 5.35% | |
| B Class(2) | | | | | | 1/31/03 |
| No sales charge* | 22.91% | 11.53% | 3.27% | — | 5.58% | |
| With sales charge* | 17.91% | 7.53% | 3.09% | — | 5.58% | |
| C Class(2) | | | | | | 12/10/01 |
| No sales charge* | 22.90% | 11.53% | 3.27% | — | 5.14% | |
| With sales charge* | 21.90% | 11.53% | 3.27% | — | 5.14% | |
| R Class(2) | 23.42% | 12.28% | — | — | 3.46% | 7/29/05 |
| * | Sales charges include initial sales charges and contingent deferred sales charges (CDSCs), as applicable. A Class shares have a 4.50% maximum initial sales charge for fixed-income funds and may be subject to a maximum CDSC of 1.00%. B Class shares redeemed within six years of purchase are subject to a CDSC that declines from 5.00% during the first year after purchase to 0.00% the sixth year after purchase. C Class shares redeemed within 12 months of purchase are subject to a maximum CDSC of 1.00%. The SEC requires that mutual funds provide performance information net of maximum sales charges in all cases where charges could be applied. |
| (1) | Total returns for periods less than one year are not annualized. |
| (2) | Class returns would have been lower if American Century Investments had not voluntarily waived a portion of its management fees and reimbursed a portion of its distribution and services fees, as applicable. |
| (3) | Data provided by Lipper Inc. — A Reuters Company. © 2009 Reuters. All rights reserved. Any copying, republication or redistribution of Lipper content, including by caching, framing or similar means, is expressly prohibited without the prior written consent of Lipper. Lipper shall not be liable for any errors or delays in the content, or for any actions taken in reliance thereon. |
| | Lipper Fund Performance — Performance data is total return, and is preliminary and subject to revision. |
| | Lipper Rankings — Rankings are based only on the universe shown and are based on average annual total returns. This listing might not represent the complete universe of funds tracked by Lipper. |
| | The data contained herein has been obtained from company reports, financial reporting services, periodicals and other resources believed to be reliable. Although carefully verified, data on compilations is not guaranteed by Lipper and may be incomplete. No offer or solicitations to buy or sell any of the securities herein is being made by Lipper. |
| (4) | Prior to September 4, 2007, the A Class was referred to as the Advisor Class. Performance, with sales charge, prior to that date has been adjusted to reflect the A Class’s current sales charge. |
Data presented reflect past performance. Past performance is no guarantee of future results. Current performance may be higher or lower than the performance shown. Investment return and principal value will fluctuate, and redemption value may be more or less than original cost. To obtain performance data current to the most recent month end, please call 1-800-345-2021 or visit americancentury.com. As interest rates rise, bond values will decline. In addition, the lower-rated securities in which the fund invests are subject to greater credit risk, default risk and liquidity risk.
Unless otherwise indicated, performance reflects Investor Class shares; performance for other share classes will vary due to differences in fee structure. For information about other share classes available, please consult the prospectus. Data assumes reinvestment of dividends and capital gains, and none of the charts reflect the deduction of taxes that a shareholder would pay on fund distributions or the redemption of fund shares. Returns for the index are provided for comparison. The fund’s total returns include operating expenses (such as transaction costs and management fees) that reduce returns, while the total returns of the index do not.
8
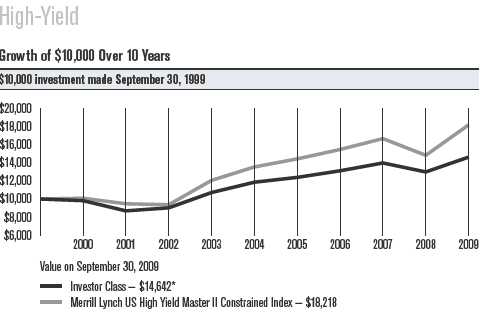
| | | | | | | | | | |
| One-Year Returns Over 10 Years | | | | | | | |
| Periods ended September 30 | | | | | | | | |
| | 2000 | 2001 | 2002 | 2003 | 2004 | 2005 | 2006* | 2007* | 2008* | 2009* |
| Investor Class | -1.80% | -11.54% | 3.86% | 18.81% | 10.67% | 4.51% | 5.90% | 6.59% | -7.10% | 12.63% |
| Merrill Lynch | | | | | | | | | | |
| US High Yield | | | | | | | | | | |
| Masters II | | | | | | | | | | |
| Constrained Index | 0.89% | -6.13% | -1.08% | 28.80% | 12.33% | 6.59% | 7.22% | 7.79% | -11.09% | 22.73% |
| *Returns would have been lower, along with ending value, if a portion of the class’s management fees had not been waived during the period. |
| |
| Total Annual Fund Operating Expenses | | | | | | |
| | | | | | | | | | | |
| Institutional | | | | | | | | |
| Investor Class | Class | A Class | B Class | C Class | R Class |
| 0.87% | 0.67% | 1.12% | 1.87% | 1.87% | 1.37% |
The total annual fund operating expenses shown is as stated in the fund’s prospectus current as of the date of this report. The prospectus may vary from the expense ratio shown elsewhere in this report because it is based on a different time period, includes acquired fund fees and expenses, and, if applicable, does not include fee waivers or expense reimbursements.
Data presented reflect past performance. Past performance is no guarantee of future results. Current p erformance may be higher or lower than the performance shown. Investment return and principal value will fluctuate, and redemption value may be more or less than original cost. To obtain performance data current to the most recent month end, please call 1-800-345-2021 or visit americancentury.com. As interest rates rise, bond values will decline. In addition, the lower-rated securiti es in which the fund invests are subject to greater credit risk, default risk and liquidity risk.
Unless otherwise indicated, performance reflects Investor Class shares; performance for other share classes will vary due to differences in fee structure. For information about other share classes available, please consult the prospectus. Data assumes reinvestment of dividends and capital gains, and none of the charts reflect the deduction of taxes that a shareholder would pay on fund distributions or the redemption of fund shares. Returns for the index are provided for comparison. The fund’s total returns include operating expenses (such as transaction costs and management fees) that reduce returns, while the total returns of the index do not.
9
High-Yield
Portfolio Managers: Mike Difley and David MacEwen
Performance Summary
High-Yield returned 23.50%* in the six months ended September 30, 2009. By comparison, the Merrill Lynch High-Yield Master II Constrained Index gained 41.31%. See page 8 for additional performance comparisons. Portfolio returns reflect operating expenses, while Merrill Lynch index returns do not.
It was a remarkable period in which the portfolio had strong positive results, but lagged the exceptional returns produced by certain segments of the market. That resulted in the fund enjoying double-digit gains for the six months, but still trailing the Merrill Lynch index.
High-Yield Market Review
High-yield bonds produced stellar returns thanks to signs of stability in the economy and strong demand from investors looking for yield and return potential above that available from Treasuries and cash-equivalent investments. Indeed, analysts at JPMorgan indicate that flows into high-yield mutual funds for the year-to-date through the end of September ran at the highest level since 2003. Against that backdrop, the high-yield new-issue and refinancing windows reopened, giving a significant boost to distressed issuers. Performance was inversely related to credit quality—the most distressed, lowest-dollar-price bonds did best, followed by CCC bonds, and so on. The market’s remarkable performance meant the spread (or difference in yield) over Treasuries declined from an all-time high over 2000 basis points (a basis point equals 0.01%, so 2000 basis points equal 20.00%) in late 2008 to finish September 2009 at just under 800 basis points.
Performance Drivers
The portfolio’s relative performance can be partly explained by its credit allocation, as it hurt to be underweight in the lowest-quality, lowest dollar-price, and distressed bonds that did best in the last six months. Having less exposure to the lowest-quality portion of the market was key to the portfolio’s outperformance during the credit crisis, but that positioning has hurt relative results so far in 2009.
Similarly, in terms of the portfolio’s sector allocation, it hurt to have less exposure to what had been many of the poorest-performing, most beaten-down names in the insurance, broadcasting, airline, and publishing segments that rebounded in recent months. At the same time, our holdings in sectors such as health care and telecommunication did very well in absolute terms, but lagged the index after holding up well throughout the credit crisis.
| * | All fund returns referenced in this commentary are for Investor Class shares. Class returns would have been lower had management fees not been waived. Total returns for periods less than one year are not annualized. |
10
High-Yield
We continued to focus on adding what we believed were good bonds trading at attractive yields relative to their credit risk. While technical (supply and demand) factors dominated market performance in recent quarters, we continue to believe that credit fundamentals still matter and that an investment approach focused in this manner can deliver outperformance over time.
Outlook
“The high-yield market rebounded from very depressed levels,” said Portfolio Manager Mike Difley. “While we don’t expect these same returns to be repeated in the near future, we think the market remains attractive. Yield spreads around 800 basis points are still in excess of long-term historical averages, and we expect default rates to peak near 12% or so and then decline. As a result, we believe high-yield bonds can still do well on an absolute basis and relative to Treasuries if we continue to see improvement in the economy and market technical factors remain positive.”
11
| | |
| High-Yield | | |
| |
| Portfolio at a Glance | | |
| | As of 9/30/09 | As of 3/31/09 |
| Weighted Average Life | 6.5 years | 4.4 years |
| Average Duration (effective) | 4.2 years | 3.2 years |
| |
| Yields as of September 30, 2009(1) | | |
| 30-day SEC Yield | | |
| Investor Class | 8.21% | |
| Institutional Class | 8.41% | |
| A Class | 7.59% | |
| B Class | 7.21% | |
| C Class | 7.21% | |
| R Class | 7.69% | |
| (1) The yields presented reflect the waiver of a portion of the fund’s management fees. Without such waiver, the | |
| 30-day yields would have been lower. | | |
| |
| Portfolio Composition by Credit Rating | | |
| | % of fund | % of fund |
| | investments | investments |
| | as of 9/30/09 | as of 3/31/09 |
| AAA | 3% | 21% |
| BBB | 1% | 10% |
| BB | 37% | 34% |
| B | 37% | 26% |
| CCC or lower | 22% | 9% |
| Ratings provided by independent research companies. These ratings are listed in Standard & Poor’s format even if they were provided by other sources. |
| The letter ratings indicate the credit worthiness of the underlying bonds in the portfolio and generally range from AAA (highest) to D (lowest). |
| |
| Top Five Industries as of September 30, 2009 | | |
| | % of net assets | % of net assets |
| | as of 9/30/09 | as of 3/31/09 |
| Media | 11.4% | 10.2% |
| Oil, Gas & Consumable Fuels | 9.9% | 14.7% |
| Diversified Telecommunication Services | 8.3% | 9.4% |
| Health Care Providers & Services | 6.4% | 6.3% |
| Consumer Finance | 5.9% | 0.9% |
12
|
| Shareholder Fee Examples (Unaudited) |
Fund shareholders may incur two types of costs: (1) transaction costs, including sales charges (loads) on purchase payments and redemption/ exchange fees; and (2) ongoing costs, including management fees; distribution and service (12b-1) fees; and other fund expenses. This example is intended to help you understand your ongoing costs (in dollars) of investing in your fund and to compare these costs with the ongoing cost of investing in other mutual funds.
The example is based on an investment of $1,000 made at the beginning of the period and held for the entire period from April 1, 2009 to September 30, 2009.
Actual Expenses
The table provides information about actual account values and actual expenses for each class. You may use the information, together with the amount you invested, to estimate the expenses that you paid over the period. First, identify the share class you own. Then simply divide your account value by $1,000 (for example, an $8,600 account value divided by $1,000 = 8.6), then multiply the result by the number under the heading “Expenses Paid During Period” to estimate the expenses you paid on your account during this period.
If you hold Investor Class shares of any American Century Investments fund, or Institutional Class shares of the American Century Diversified Bond Fund, in an American Century Investments account (i.e., not a financial intermediary or retirement plan account), American Century Investments may charge you a $12.50 semiannual account maintenance fee if the value of those shares is less than $10,000. We will redeem shares automatically in one of your accounts to pay the $12.50 fee. In determining your total eligible investment amount, we will include your investments in all personal accounts (including American Century Investments Brokerage accounts) registered under your Social Security number. Personal accounts include individual accounts, joint accounts, UGMA/UTMA accounts, personal trusts, Coverdell Education Savings Accounts and IRAs (including traditional, Roth, Rollover, SEP-, SARSEP- and SIMPLE-IRAs), and certain other retirement accounts. If you have only business, business retirement, employer-sponsored or American Century Investments Brokerage accounts, you are currently not subject to this fee. We will not charge the fee as long as you choose to manage your accounts exclusively online. If you are subject to the Account Maintenance Fee, your account value could be reduced by the fee amount.
Hypothetical Example for Comparison Purposes
The table also provides information about hypothetical account values and hypothetical expenses based on the actual expense ratio of each class of your fund and an assumed rate of return of 5% per year before expenses, which is not the actual return of a fund’s share class. The hypothetical account values and expenses may not be used to estimate the actual ending account balance or expenses you paid for the period. You may use this information to compare the ongoing costs of investing in your fund and other funds.
To do so, compare this 5% hypothetical example with the 5% hypothetical examples that appear in the shareholder reports of the other funds.
13
Please note that the expenses shown in the table are meant to highlight your ongoing costs only and do not reflect any transactional costs, such as sales charges (loads) or redemption/exchange fees. Therefore, the table is useful in comparing ongoing costs only, and will not help you determine the relative total costs of owning different funds. In addition, if these transactional costs were included, your costs would have been higher.
| | | | |
| | | | Expenses Paid | |
| | Beginning | Ending | During Period(1) | Annualized |
| | Account Value | Account Value | 4/1/09 – | Expense |
| | 4/1/09 | 9/30/09 | 9/30/09 | Ratio(1) |
| Diversified Bond | | | | |
| Actual | | | | |
| Investor Class (after waiver)(2) | $1,000 | $1,054.70 | $3.09 | 0.60% |
| Investor Class (before waiver) | $1,000 | $1,054.70(3) | $3.19 | 0.62% |
| Institutional Class (after waiver)(2) | $1,000 | $1,054.80 | $2.06 | 0.40% |
| Institutional Class (before waiver) | $1,000 | $1,054.80(3) | $2.16 | 0.42% |
| A Class (after waiver)(2) | $1,000 | $1,053.40 | $4.38 | 0.85% |
| A Class (before waiver) | $1,000 | $1,053.40(3) | $4.48 | 0.87% |
| B Class (after waiver)(2) | $1,000 | $1,048.50 | $8.22 | 1.60% |
| B Class (before waiver) | $1,000 | $1,048.50(3) | $8.32 | 1.62% |
| C Class (after waiver)(2) | $1,000 | $1,049.50 | $8.22 | 1.60% |
| C Class (before waiver) | $1,000 | $1,049.50(3) | $8.32 | 1.62% |
| R Class (after waiver)(2) | $1,000 | $1,052.10 | $5.66 | 1.10% |
| R Class (before waiver) | $1,000 | $1,052.10(3) | $5.76 | 1.12% |
| Hypothetical | | | | |
| Investor Class (after waiver)(2) | $1,000 | $1,022.06 | $3.04 | 0.60% |
| Investor Class (before waiver) | $1,000 | $1,021.96 | $3.14 | 0.62% |
| Institutional Class (after waiver)(2) | $1,000 | $1,023.06 | $2.03 | 0.40% |
| Institutional Class (before waiver) | $1,000 | $1,022.96 | $2.13 | 0.42% |
| A Class (after waiver)(2) | $1,000 | $1,020.81 | $4.31 | 0.85% |
| A Class (before waiver) | $1,000 | $1,020.71 | $4.41 | 0.87% |
| B Class (after waiver)(2) | $1,000 | $1,017.05 | $8.09 | 1.60% |
| B Class (before waiver) | $1,000 | $1,016.95 | $8.19 | 1.62% |
| C Class (after waiver)(2) | $1,000 | $1,017.05 | $8.09 | 1.60% |
| C Class (before waiver) | $1,000 | $1,016.95 | $8.19 | 1.62% |
| R Class (after waiver)(2) | $1,000 | $1,019.55 | $5.57 | 1.10% |
| R Class (before waiver) | $1,000 | $1,019.45 | $5.67 | 1.12% |
| (1) | Expenses are equal to the class’s annualized expense ratio listed in the table above, multiplied by the average account value over the period, multiplied by 183, the number of days in the most recent fiscal half-year, divided by 365, to reflect the one-half year period. |
| (2) | During the six months ended September 30, 2009, the class received a partial waiver of its management fee. |
| (3) | Ending account value assumes the return earned after waiver. The return would have been lower had fees not been waived and would have resulted in a lower ending account value. |
14
| | | | |
| | | | Expenses Paid | |
| | Beginning | Ending | During Period(1) | Annualized |
| | Account Value | Account Value | 4/1/09 – | Expense |
| | 4/1/09 | 9/30/09 | 9/30/09 | Ratio(1) |
| High-Yield | | | | |
| Actual | | | | |
| Investor Class (after waiver)(2) | $1,000 | $1,235.00 | $4.43 | 0.79% |
| Investor Class (before waiver) | $1,000 | $1,235.00(3) | $4.87 | 0.87% |
| Institutional Class (after waiver)(2) | $1,000 | $1,236.20 | $3.31 | 0.59% |
| Institutional Class (before waiver) | $1,000 | $1,236.20(3) | $3.76 | 0.67% |
| A Class (after waiver)(2) | $1,000 | $1,233.50 | $5.82 | 1.04% |
| A Class (before waiver) | $1,000 | $1,233.50(3) | $6.27 | 1.12% |
| B Class (after waiver)(2) | $1,000 | $1,229.10 | $10.00 | 1.79% |
| B Class (before waiver) | $1,000 | $1,229.10(3) | $10.45 | 1.87% |
| C Class (after waiver)(2) | $1,000 | $1,229.00 | $10.00 | 1.79% |
| C Class (before waiver) | $1,000 | $1,229.00(3) | $10.45 | 1.87% |
| R Class (after waiver)(2) | $1,000 | $1,234.20 | $7.23 | 1.29% |
| R Class (before waiver) | $1,000 | $1,234.20(3) | $7.67 | 1.37% |
| Hypothetical | | | | |
| Investor Class (after waiver)(2) | $1,000 | $1,021.11 | $4.00 | 0.79% |
| Investor Class (before waiver) | $1,000 | $1,020.71 | $4.41 | 0.87% |
| Institutional Class (after waiver)(2) | $1,000 | $1,022.11 | $2.99 | 0.59% |
| Institutional Class (before waiver) | $1,000 | $1,021.71 | $3.40 | 0.67% |
| A Class (after waiver)(2) | $1,000 | $1,019.85 | $5.27 | 1.04% |
| A Class (before waiver) | $1,000 | $1,019.45 | $5.67 | 1.12% |
| B Class (after waiver)(2) | $1,000 | $1,016.09 | $9.05 | 1.79% |
| B Class (before waiver) | $1,000 | $1,015.69 | $9.45 | 1.87% |
| C Class (after waiver)(2) | $1,000 | $1,016.09 | $9.05 | 1.79% |
| C Class (before waiver) | $1,000 | $1,015.69 | $9.45 | 1.87% |
| R Class (after waiver)(2) | $1,000 | $1,018.60 | $6.53 | 1.29% |
| R Class (before waiver) | $1,000 | $1,018.20 | $6.93 | 1.37% |
| (1) | Expenses are equal to the class’s annualized expense ratio listed in the table above, multiplied by the average account value over the period, multiplied by 183, the number of days in the most recent fiscal half-year, divided by 365, to reflect the one-half year period. |
| (2) | During the six months ended September 30, 2009, the class received a partial waiver of its management fee. |
| (3) | Ending account value assumes the return earned after waiver. The return would have been lower had fees not been waived and would have resulted in a lower ending account value. |
15
|
| Schedule of Investments |
| Diversified Bond |
| | | | | | |
| SEPTEMBER 30, 2009 (UNAUDITED) | | | | | |
| |
| | Principal | | | | Principal | |
| | Amount | Value | | | Amount | Value |
| U.S. Government Agency | | | FNMA, 6.50%, | | |
| | | | | settlement date 10/15/09(3) | $ 13,694,000 | $ 14,629,054 |
| Mortgage-Backed Securities(1) — 30.5% | | | | |
| | | | | FNMA, 6.00%, 5/1/13(2) | 5,922 | 6,332 |
| ADJUSTABLE-RATE U.S. GOVERNMENT AGENCY | | FNMA, 6.00%, 5/1/13(2) | 12,201 | 13,079 |
| MORTGAGE-BACKED SECURITIES — 0.2% | | | | | |
| | | | | FNMA, 6.00%, 7/1/13(2) | 34,645 | 37,138 |
| FNMA, VRN, | | | | | | |
| 5.63%, 3/1/12(2) | $ 5,302,001 | $ 5,591,172 | | FNMA, 6.00%, 12/1/13(2) | 49,443 | 53,000 |
| FIXED-RATE U.S. GOVERNMENT AGENCY | | | FNMA, 6.00%, 1/1/14(2) | 41,987 | 45,008 |
| MORTGAGE-BACKED SECURITIES — 30.3% | | | FNMA, 6.00%, 2/1/14(2) | 67,829 | 72,710 |
| FHLMC, 5.00%, 10/1/10(2) | 915,393 | 942,787 | | FNMA, 6.00%, 4/1/14(2) | 77,639 | 83,225 |
| FHLMC, 6.50%, 12/1/12(2) | 4,077 | 4,349 | | FNMA, 5.50%, 12/1/16(2) | 318,356 | 340,467 |
| FHLMC, 6.00%, 1/1/13(2) | 50,194 | 53,570 | | FNMA, 5.50%, 12/1/16(2) | 614,011 | 656,656 |
| FHLMC, 7.00%, 11/1/13(2) | 17,447 | 18,521 | | FNMA, 5.00%, 6/1/18 | 9,385,861 | 9,973,211 |
| FHLMC, 7.00%, 6/1/14(2) | 34,123 | 36,465 | | FNMA, 4.50%, 5/1/19(2) | 2,888,535 | 3,042,298 |
| FHLMC, 6.50%, 6/1/16(2) | 63,734 | 68,231 | | FNMA, 6.50%, 1/1/26(2) | 80,541 | 86,924 |
| FHLMC, 6.50%, 6/1/16(2) | 116,551 | 125,287 | | FNMA, 7.00%, 12/1/27(2) | 8,942 | 9,882 |
| FHLMC, 5.00%, 11/1/17(2) | 1,496,829 | 1,594,708 | | FNMA, 6.50%, 1/1/28(2) | 6,005 | 6,481 |
| FHLMC, 4.50%, 1/1/19(2) | 168,825 | 178,340 | | FNMA, 7.00%, 1/1/28(2) | 5,738 | 6,341 |
| FHLMC, 5.00%, 1/1/21(2) | 7,386,563 | 7,821,100 | | FNMA, 7.50%, 4/1/28(2) | 25,784 | 28,872 |
| FHLMC, 5.00%, 4/1/21(2) | 2,675,404 | 2,832,793 | | FNMA, 7.00%, 5/1/28(2) | 78,649 | 86,962 |
| FHLMC, 7.00%, 9/1/27(2) | 13,907 | 15,309 | | FNMA, 7.00%, 6/1/28(2) | 4,094 | 4,527 |
| FHLMC, 6.50%, 1/1/28(2) | 23,673 | 25,531 | | FNMA, 6.50%, 1/1/29(2) | 17,235 | 18,645 |
| FHLMC, 7.00%, 2/1/28(2) | 3,477 | 3,827 | | FNMA, 6.50%, 4/1/29(2) | 55,390 | 59,867 |
| FHLMC, 6.50%, 3/1/29(2) | 131,460 | 141,797 | | FNMA, 7.00%, 7/1/29(2) | 32,706 | 36,164 |
| FHLMC, 6.50%, 6/1/29(2) | 92,922 | 100,171 | | FNMA, 7.00%, 7/1/29(2) | 38,203 | 42,261 |
| FHLMC, 7.00%, 8/1/29(2) | 14,374 | 15,806 | | FNMA, 7.50%, 7/1/29(2) | 102,082 | 114,382 |
| FHLMC, 7.50%, 8/1/29(2) | 26,066 | 29,276 | | FNMA, 7.50%, 8/1/30(2) | 56,971 | 63,849 |
| FHLMC, 6.50%, 5/1/31(2) | 2,740 | 2,951 | | FNMA, 7.50%, 9/1/30(2) | 35,736 | 40,039 |
| FHLMC, 6.50%, 5/1/31(2) | 59,918 | 64,517 | | FNMA, 7.00%, 9/1/31(2) | 231,458 | 255,642 |
| FHLMC, 6.50%, 6/1/31(2) | 804 | 866 | | FNMA, 6.50%, 1/1/32(2) | 106,907 | 115,381 |
| FHLMC, 6.50%, 6/1/31(2) | 953 | 1,026 | | FNMA, 7.00%, 6/1/32(2) | 1,059,323 | 1,167,724 |
| FHLMC, 6.50%, 6/1/31(2) | 3,843 | 4,138 | | FNMA, 6.50%, 8/1/32(2) | 401,251 | 433,055 |
| FHLMC, 6.50%, 6/1/31(2) | 5,596 | 6,025 | | FNMA, 5.50%, 2/1/33 | 36,877,416 | 38,803,876 |
| FHLMC, 6.50%, 6/1/31(2) | 8,718 | 9,387 | | FNMA, 5.00%, 6/1/33 | 29,807,336 | 30,964,713 |
| FHLMC, 6.50%, 6/1/31(2) | 46,436 | 50,001 | | FNMA, 5.50%, 6/1/33(2) | 2,417,911 | 2,544,222 |
| FHLMC, 5.50%, 12/1/33(2) | 1,820,811 | 1,916,499 | | FNMA, 5.50%, 7/1/33(2) | 11,471,968 | 12,071,259 |
| FHLMC, 6.00%, 9/1/35 | 44,401,707 | 47,172,651 | | FNMA, 5.00%, 8/1/33 | 7,698,092 | 7,993,105 |
| FHLMC, 5.50%, 12/1/37 | 9,509,642 | 9,969,275 | | FNMA, 5.50%, 8/1/33(2) | 2,176,733 | 2,290,444 |
| FHLMC, 5.50%, 1/1/38(2) | 12,058,551 | 12,650,802 | | FNMA, 5.50%, 9/1/33(2) | 2,781,062 | 2,926,343 |
| FHLMC, 5.50%, 4/1/38(2) | 15,461,392 | 16,208,693 | | FNMA, 5.00%, 11/1/33(2) | 18,296,111 | 18,997,271 |
| FHLMC, 6.00%, 8/1/38 | 2,523,400 | 2,666,934 | | FNMA, 5.50%, 1/1/34(2) | 5,991,726 | 6,311,035 |
| FHLMC, 6.50%, 7/1/47(2) | 382,313 | 406,104 | | FNMA, 5.50%, 2/1/34 | 10,579,252 | 11,131,907 |
| FNMA, 6.00%, | | | | FNMA, 5.00%, 3/1/34 | 10,614,470 | 11,021,247 |
| settlement date 10/15/09(3) | 6,454,681 | 6,808,682 | | | | |
16
| | | | | | |
| Diversified Bond | | | | | |
| |
| | Principal | | | | Principal | |
| | Amount | Value | | | Amount | Value |
| FNMA, 4.50%, 1/1/35 | $ 33,695,545 | $ 34,344,886 | | GNMA, 7.00%, 4/15/28(2) | $ 2,718 | $ 2,997 |
| FNMA, 5.00%, 6/1/35 | 20,768,878 | 21,545,331 | | GNMA, 6.50%, 5/15/28(2) | 2,109 | 2,280 |
| FNMA, 5.00%, 7/1/35 | 38,131,367 | 39,556,924 | | GNMA, 6.50%, 5/15/28(2) | 5,861 | 6,337 |
| FNMA, 5.00%, 8/1/35(2) | 2,038,411 | 2,113,344 | | GNMA, 6.50%, 5/15/28(2) | 40,527 | 43,821 |
| FNMA, 4.50%, 9/1/35(2) | 6,892,157 | 7,016,359 | | GNMA, 7.00%, 12/15/28(2) | 16,378 | 18,060 |
| FNMA, 5.00%, 10/1/35 | 11,164,259 | 11,574,662 | | GNMA, 7.00%, 5/15/31(2) | 95,673 | 105,719 |
| FNMA, 5.50%, 12/1/35 | 55,760,739 | 58,603,956 | | GNMA, 4.50%, 8/15/33 | 8,493,590 | 8,684,696 |
| FNMA, 5.00%, 2/1/36(2) | 8,253,304 | 8,556,699 | | GNMA, 6.00%, 9/20/38(2) | 14,965,154 | 15,867,052 |
| FNMA, 5.50%, 4/1/36(2) | 10,066,573 | 10,573,571 | | GNMA, 5.50%, 11/15/38 | 23,142,310 | 24,339,201 |
| FNMA, 5.50%, 5/1/36(2) | 20,832,786 | 21,882,021 | | GNMA, 6.00%, 1/20/39 | 3,583,451 | 3,799,551 |
| FNMA, 5.50%, 7/1/36(2) | 7,767,905 | 8,148,209 | | GNMA, 5.00%, 3/20/39 | 19,476,031 | 20,186,443 |
| FNMA, 5.50%, 2/1/37(2) | 3,888,344 | 4,078,711 | | GNMA, 4.50%, 4/15/39 | 29,725,349 | 30,236,254 |
| FNMA, 5.50%, 5/1/37 | 15,040,021 | 15,764,605 | | | | 821,834,766 |
| FNMA, 6.50%, 8/1/37(2) | 7,059,457 | 7,527,441 | | TOTAL U.S. GOVERNMENT AGENCY | |
| FNMA, 6.00%, 11/1/37 | 41,273,421 | 43,629,875 | | MORTGAGE-BACKED SECURITIES | |
| | | | | (Cost $808,550,939) | | 827,425,938 |
| FNMA, 5.50%, 12/1/37 | 36,489,459 | 38,247,415 | | | | |
| FNMA, 5.50%, 2/1/38(2) | 6,855,269 | 7,182,322 | | Corporate Bonds — 26.7% | |
| FNMA, 5.50%, 6/1/38 | 9,756,366 | 10,221,826 | | AEROSPACE & DEFENSE — 0.7% | |
| FNMA, 6.00%, 9/1/38 | 3,675,490 | 3,873,277 | | BAE Systems Holdings, Inc., | | |
| | | | | 6.375%, 6/1/19(2)(4) | 2,700,000 | 2,984,650 |
| FNMA, 6.00%, 11/1/38 | 5,693,017 | 5,999,372 | | | | |
| FNMA, 5.50%, 12/1/38 | 29,464,088 | 30,869,771 | | Boeing Co. (The), | | |
| | | | | 5.875%, 2/15/40(2) | 1,000,000 | 1,095,046 |
| FNMA, 5.00%, 1/1/39 | 11,259,486 | 11,649,886 | | Honeywell International, Inc., | | |
| FNMA, 4.50%, 2/1/39 | 19,443,250 | 19,722,666 | | 5.30%, 3/15/17(2) | 675,000 | 730,313 |
| FNMA, 6.50%, 6/1/47(2) | 283,878 | 302,076 | | Honeywell International, Inc., | | |
| FNMA, 6.50%, 8/1/47(2) | 761,145 | 809,938 | | 5.30%, 3/1/18(2) | 610,000 | 657,756 |
| FNMA, 6.50%, 8/1/47(2) | 954,613 | 1,015,808 | | L-3 Communications Corp., | | |
| | | | | 5.20%, 10/15/19(4)(5) | 2,020,000 | 2,030,100 |
| FNMA, 6.50%, 9/1/47(2) | 114,557 | 121,900 | | | | |
| | | | | Lockheed Martin Corp., | | |
| FNMA, 6.50%, 9/1/47(2) | 829,572 | 882,751 | | 7.65%, 5/1/16(2) | 1,700,000 | 2,054,735 |
| FNMA, 6.50%, 9/1/47(2) | 927,096 | 986,527 | | Lockheed Martin Corp., | | |
| FNMA, 6.50%, 9/1/47(2) | 2,752,817 | 2,929,284 | | 6.15%, 9/1/36(2) | 1,923,000 | 2,208,925 |
| GNMA, 7.50%, 8/20/17(2) | 36,571 | 39,717 | | Northrop Grumman Corp., | | |
| | | | | 3.70%, 8/1/14(2) | 1,300,000 | 1,324,715 |
| GNMA, 7.00%, 11/15/22(2) | 46,973 | 51,701 | | | | |
| GNMA, 8.75%, 3/15/25(2) | 45,964 | 52,687 | | United Technologies Corp., | | |
| | | | | 6.125%, 2/1/19(2) | 2,660,000 | 3,048,876 |
| GNMA, 7.00%, 4/20/26(2) | 9,774 | 10,680 | | United Technologies Corp., | | |
| GNMA, 7.50%, 8/15/26(2) | 18,779 | 21,016 | | 6.05%, 6/1/36(2) | 1,027,000 | 1,185,601 |
| GNMA, 8.00%, 8/15/26(2) | 9,878 | 11,212 | | United Technologies Corp., | | |
| | | | | 6.125%, 7/15/38(2) | 650,000 | 751,540 |
| GNMA, 7.50%, 4/15/27(2) | 1,310 | 1,467 | | | | 18,072,257 |
| GNMA, 7.50%, 5/15/27(2) | 20,802 | 23,300 | | | | |
| GNMA, 8.00%, 6/15/27(2) | 18,563 | 21,084 | | AUTOMOBILES — 0.1% | | |
| | | | | American Honda Finance | | |
| GNMA, 7.50%, 11/15/27(2) | 2,215 | 2,481 | | Corp., 7.625%, 10/1/18(2)(4) | 800,000 | 926,357 |
| GNMA, 7.00%, 2/15/28(2) | 9,936 | 10,957 | | Daimler Finance N.A. LLC, | | |
| GNMA, 7.50%, 2/15/28(2) | 15,305 | 17,152 | | 5.875%, 3/15/11(2) | 710,000 | 737,035 |
| GNMA, 6.50%, 3/15/28(2) | 15,233 | 16,471 | | | | 1,663,392 |
17
| | | | | | |
| Diversified Bond | | | | | |
| |
| |
| | Principal | | | | Principal | |
| | Amount | Value | | | Amount | Value |
| BEVERAGES — 0.6% | | | | Morgan Stanley, | | |
| Anheuser-Busch | | | | 5.625%, 9/23/19(2) | $ 4,000,000 | $ 3,940,600 |
| InBev Worldwide, Inc., | | | | UBS AG (Stamford Branch), | | |
| 6.875%, 11/15/19(4) | $ 5,280,000 | $ 5,974,927 | | 5.75%, 4/25/18(2) | 2,000,000 | 2,035,958 |
| Diageo Capital plc, | | | | | | 57,123,275 |
| 5.20%, 1/30/13(2) | 1,160,000 | 1,244,477 | | CHEMICALS — 0.3% | | |
| Dr Pepper Snapple Group, | | | | Dow Chemical Co. (The), | | |
| Inc., 6.82%, 5/1/18(2) | 4,457,000 | 5,075,026 | | 4.85%, 8/15/12(2) | 1,690,000 | 1,758,883 |
| PepsiAmericas, Inc., | | | | Dow Chemical Co. (The), | | |
| 4.375%, 2/15/14(2) | 800,000 | 835,752 | | 8.55%, 5/15/19(2) | 4,050,000 | 4,560,425 |
| SABMiller plc, | | | | E.I. du Pont de Nemours | | |
| 6.20%, 7/1/11(2)(4) | 2,060,000 | 2,197,925 | | & Co., 5.00%, 1/15/13(2) | 700,000 | 758,897 |
| | | 15,328,107 | | Mosaic Co. (The), | | |
| BIOTECHNOLOGY — 0.2% | | | | 7.625%, 12/1/16(2)(4) | 1,500,000 | 1,600,992 |
| Amgen, Inc., | | | | Rohm & Haas Co., | | |
| 5.85%, 6/1/17(2) | 2,560,000 | 2,820,611 | | 5.60%, 3/15/13(2) | 550,000 | 574,867 |
| Amgen, Inc., | | | | | | 9,254,064 |
| 6.40%, 2/1/39(2) | 1,580,000 | 1,817,534 | | COMMERCIAL BANKS — 0.6% | |
| | | 4,638,145 | | Barclays Bank plc, | | |
| CAPITAL MARKETS — 2.1% | | | | 5.00%, 9/22/16(2) | 1,440,000 | 1,461,349 |
| Bank of New York Mellon | | | | BB&T Corp., | | |
| Corp. (The), 4.30%, 5/15/14 | 2,830,000 | 3,001,221 | | 5.70%, 4/30/14(2) | 1,680,000 | 1,821,935 |
| Bear Stearns Cos., Inc. | | | | PNC Bank N.A., | | |
| (The), 6.40%, 10/2/17(2) | 3,617,000 | 3,941,022 | | 4.875%, 9/21/17(2) | 882,000 | 844,323 |
| Credit Suisse (New York), | | | | PNC Bank N.A., | | |
| 5.00%, 5/15/13(2) | 4,330,000 | 4,587,821 | | 6.00%, 12/7/17(2) | 730,000 | 747,670 |
| Credit Suisse (New York), | | | | SunTrust Bank, | | |
| 5.50%, 5/1/14(2) | 2,320,000 | 2,496,561 | | 7.25%, 3/15/18(2) | 320,000 | 334,758 |
| Credit Suisse (New York), | | | | Wachovia Bank N.A., | | |
| 5.30%, 8/13/19(2) | 3,300,000 | 3,390,120 | | 4.80%, 11/1/14(2) | 1,500,000 | 1,524,608 |
| Deutsche Bank | | | | Wachovia Bank N.A., | | |
| AG (London), | | | | 4.875%, 2/1/15(2) | 3,320,000 | 3,410,058 |
| 4.875%, 5/20/13(2) | 810,000 | 863,791 | | Wells Fargo & Co., | | |
| Goldman Sachs Group, Inc. | | | | 4.375%, 1/31/13(2) | 2,310,000 | 2,387,949 |
| (The), 6.00%, 5/1/14(2) | 3,600,000 | 3,920,634 | | Wells Fargo & Co., | | |
| Goldman Sachs Group, Inc. | | | | 5.625%, 12/11/17(2) | 2,000,000 | 2,104,228 |
| (The), 5.125%, 1/15/15(2) | 3,520,000 | 3,683,944 | | Wells Fargo Bank N.A., | | |
| Goldman Sachs Group, Inc. | | | | 6.45%, 2/1/11(2) | 900,000 | 948,314 |
| (The), 6.15%, 4/1/18(2) | 1,600,000 | 1,685,845 | | | | 15,585,192 |
| Goldman Sachs Group, Inc. | | | | COMMERCIAL SERVICES & SUPPLIES — 0.6% |
| (The), 7.50%, 2/15/19(2) | 6,070,000 | 6,953,713 | | | | |
| | | | | Allied Waste North America, | | �� |
| Jefferies Group, Inc., | | | | Inc., 6.375%, 4/15/11(2) | 2,500,000 | 2,609,253 |
| 8.50%, 7/15/19(2) | 2,000,000 | 2,120,270 | | | | |
| | | | | Corrections Corp. of | | |
| Merrill Lynch & Co., Inc., | | | | America, 6.25%, 3/15/13(2) | 3,870,000 | 3,831,300 |
| 6.15%, 4/25/13(2) | 1,965,000 | 2,081,485 | | | | |
| | | | | Corrections Corp. of | | |
| Morgan Stanley, | | | | America, 7.75%, 6/1/17(2) | 1,800,000 | 1,867,500 |
| 6.00%, 4/28/15(2) | 3,310,000 | 3,510,040 | | | | |
| | | | | Republic Services, Inc., | | |
| Morgan Stanley, | | | | 5.50%, 9/15/19(2)(4) | 2,000,000 | 2,064,880 |
| 6.625%, 4/1/18(2) | 3,480,000 | 3,685,817 | | | | |
| | | | | Waste Management, Inc., | | |
| Morgan Stanley, | | | | 7.375%, 3/11/19(2) | 4,500,000 | 5,246,005 |
| 7.30%, 5/13/19(2) | 4,740,000 | 5,224,433 | | | | |
| | | | | | | 15,618,938 |
18
| | | | | | |
| Diversified Bond | | | | | |
| |
| |
| | Principal | | | | Principal | |
| | Amount | Value | | | Amount | Value |
| COMMUNICATIONS EQUIPMENT — 0.1% | | | Bank of America Corp., | | |
| Cisco Systems, Inc., | | | | 7.625%, 6/1/19(2) | $ 1,790,000 | $ 2,020,477 |
| 4.95%, 2/15/19(2) | $ 1,600,000 | $ 1,685,045 | | Bank of America N.A., | | |
| Harris Corp., | | | | 5.30%, 3/15/17(2) | 4,939,000 | 4,746,759 |
| 6.375%, 6/15/19(2) | 1,000,000 | 1,105,735 | | Bank of America N.A., | | |
| | | 2,790,780 | | 6.00%, 10/15/36(2) | 1,825,000 | 1,804,509 |
| COMPUTERS & PERIPHERALS — 0.2% | | | BP Capital Markets plc, | | |
| | | | | 5.25%, 11/7/13(2) | 1,950,000 | 2,138,856 |
| Dell, Inc., 3.375%, 6/15/12 | 1,000,000 | 1,036,972 | | | | |
| | | | | Citigroup, Inc., | | |
| Dell, Inc., 5.875%, 6/15/19 | 3,000,000 | 3,222,138 | | 5.50%, 4/11/13(2) | 6,065,000 | 6,213,368 |
| | | 4,259,110 | | Citigroup, Inc., | | |
| CONSUMER FINANCE — 0.9% | | | 5.50%, 10/15/14(2) | 1,360,000 | 1,360,076 |
| American Express Centurion | | | | Citigroup, Inc., | | |
| Bank, 5.55%, 10/17/12(2) | 1,700,000 | 1,803,559 | | 6.125%, 5/15/18(2) | 2,940,000 | 2,899,625 |
| American Express Co., | | | | Citigroup, Inc., | | |
| 7.25%, 5/20/14(2) | 3,500,000 | 3,937,955 | | 8.50%, 5/22/19(2) | 1,200,000 | 1,356,883 |
| Capital One Bank USA N.A., | | | | Citigroup, Inc., | | |
| 8.80%, 7/15/19(2) | 3,000,000 | 3,473,751 | | 8.125%, 7/15/39(2) | 2,600,000 | 2,919,173 |
| Capital One Capital V, | | | | JPMorgan Chase & Co., | | |
| 10.25%, 8/15/39(2) | 1,800,000 | 1,994,016 | | 4.65%, 6/1/14(2) | 5,360,000 | 5,598,579 |
| General Electric Capital | | | | JPMorgan Chase & Co., | | |
| Corp., 5.90%, 5/13/14(2) | 3,000,000 | 3,221,421 | | 6.00%, 1/15/18(2) | 9,530,000 | 10,245,560 |
| General Electric Capital | | | | JPMorgan Chase Bank | | |
| Corp., 5.625%, 9/15/17(2) | 3,080,000 | 3,123,647 | | National Association, | | |
| General Electric Capital | | | | 5.875%, 6/13/16(2) | 1,250,000 | 1,311,650 |
| Corp., 6.00%, 8/7/19(2) | 3,000,000 | 3,048,942 | | | | 57,699,334 |
| General Electric Capital | | | | DIVERSIFIED TELECOMMUNICATION | |
| Corp., 6.875%, 1/10/39(2) | 1,170,000 | 1,229,332 | | SERVICES — 2.0% | | |
| John Deere Capital Corp., | | | | Alltel Corp., | | |
| 4.50%, 4/3/13(2) | 600,000 | 635,077 | | 7.875%, 7/1/32(2) | 1,190,000 | 1,469,544 |
| John Deere Capital Corp., | | | | AT&T, Inc., 6.25%, 3/15/11(2) | 1,580,000 | 1,685,086 |
| 4.90%, 9/9/13(2) | 1,200,000 | 1,284,768 | | | | |
| | | | | AT&T, Inc., 6.70%, 11/15/13(2) | 2,170,000 | 2,461,199 |
| | | 23,752,468 | | | | |
| | | | | AT&T, Inc., 5.10%, 9/15/14(2) | 1,000,000 | 1,079,586 |
| CONTAINERS & PACKAGING — 0.1% | | | | | |
| | | | | AT&T, Inc., 6.80%, 5/15/36(2) | 1,000,000 | 1,116,802 |
| Ball Corp., 6.875%, | | | | | | |
| 12/15/12(2) | 3,351,000 | 3,392,887 | | AT&T, Inc., 6.55%, 2/15/39(2) | 4,440,000 | 4,858,510 |
| Ball Corp., 7.125%, 9/1/16(2) | 500,000 | 512,500 | | Cellco Partnership/Verizon | | |
| | | 3,905,387 | | Wireless Capital LLC, | | |
| | | | | 5.55%, 2/1/14(2)(4) | 1,580,000 | 1,709,453 |
| DIVERSIFIED CONSUMER SERVICES — 0.1% | | | Cellco Partnership/Verizon | | |
| Board of Trustees of | | | | Wireless Capital LLC, | | |
| The Leland Stanford | | | | 8.50%, 11/15/18(2)(4) | 5,000,000 | 6,255,230 |
| Junior University (The), | | | | CenturyTel, Inc., | | |
| 3.625%, 5/1/14(2) | 2,120,000 | 2,196,846 | | | | |
| | | | | 7.60%, 9/15/39(2) | 2,420,000 | 2,419,262 |
| DIVERSIFIED FINANCIAL SERVICES — 2.1% | | | Deutsche Telekom | | |
| Bank of America Corp., | | | | International Finance BV, | | |
| 4.90%, 5/1/13(2) | 3,050,000 | 3,130,328 | | 6.75%, 8/20/18(2) | 2,210,000 | 2,479,264 |
| Bank of America Corp., | | | | Deutsche Telekom | | |
| 6.50%, 8/1/16(2) | 10,130,000 | 10,667,731 | | International Finance BV, | | |
| Bank of America Corp., | | | | 8.75%, 6/15/30(2) | 800,000 | 1,039,049 |
| 5.65%, 5/1/18(2) | 1,300,000 | 1,285,760 | | Embarq Corp., | | |
| | | | | 7.08%, 6/1/16(2) | 944,000 | 1,027,299 |
19
| | | | | | |
| Diversified Bond | | | | | |
| |
| | Principal | | | | Principal | |
| | Amount | Value | | | Amount | Value |
| France Telecom SA, | | | | Florida Power Corp., | | |
| 4.375%, 7/8/14(2) | $ 3,140,000 | $ 3,295,854 | | 5.65%, 6/15/18(2) | $ 790,000 | $ 870,849 |
| Koninklijke KPN NV, | | | | Florida Power Corp., | | |
| 8.375%, 10/1/30(2) | 820,000 | 1,059,862 | | 6.35%, 9/15/37(2) | 540,000 | 636,137 |
| Qwest Corp., | | | | Niagara Mohawk Power | | |
| 7.875%, 9/1/11(2) | 1,950,000 | 2,020,688 | | Corp., 4.88%, 8/15/19(4) | 1,600,000 | 1,632,688 |
| Qwest Corp., | | | | Pacificorp, 6.00%, | | |
| 7.50%, 10/1/14(2) | 800,000 | 812,000 | | 1/15/39(2) | 2,340,000 | 2,630,389 |
| Sprint Capital Corp., | | | | Progress Energy, Inc., | | |
| 7.625%, 1/30/11(2) | 2,870,000 | 2,952,512 | | 6.05%, 3/15/14(2) | 950,000 | 1,043,147 |
| Telecom Italia Capital SA, | | | | Southern California Edison | | |
| 4.00%, 1/15/10(2) | 1,263,000 | 1,271,727 | | Co., 5.625%, 2/1/36(2) | 780,000 | 848,212 |
| Telecom Italia Capital SA, | | | | Toledo Edison Co. (The), | | |
| 6.18%, 6/18/14(2) | 4,410,000 | 4,789,613 | | 6.15%, 5/15/37(2) | 425,000 | 445,204 |
| Telefonica Emisiones SAU, | | | | | | 25,704,617 |
| 5.98%, 6/20/11(2) | 750,000 | 799,597 | | ELECTRICAL EQUIPMENT(6) | | |
| Telefonica Emisiones SAU, | | | | Roper Industries, Inc., | | |
| 5.88%, 7/15/19(2) | 2,800,000 | 3,048,872 | | 6.25%, 9/1/19(2) | 1,340,000 | 1,393,572 |
| Telefonica Emisiones SAU, | | | | ELECTRONIC EQUIPMENT, | | |
| 7.05%, 6/20/36(2) | 1,600,000 | 1,900,158 | | INSTRUMENTS & COMPONENTS — 0.2% | |
| Verizon Communications, | | | | Corning, Inc., | | |
| Inc., 8.75%, 11/1/18(2) | 2,670,000 | 3,341,868 | | 6.625%, 5/15/19(2) | 5,705,000 | 6,252,361 |
| Verizon Communications, | | | | ENERGY EQUIPMENT & SERVICES — 0.3% | |
| Inc., 6.25%, 4/1/37(2) | 489,000 | 510,634 | | Pride International, Inc., | | |
| Verizon Communications, | | | | 8.50%, 6/15/19(2) | 3,600,000 | 3,978,000 |
| Inc., 6.40%, 2/15/38(2) | 870,000 | 932,994 | | Weatherford International | | |
| Verizon Wireless Capital | | | | Ltd., 9.625%, 3/1/19(2) | 3,000,000 | 3,761,640 |
| LLC, 3.75%, 5/20/11(2)(4) | 300,000 | 309,694 | | | | 7,739,640 |
| | | 54,646,357 | | FOOD & STAPLES RETAILING — 0.9% | |
| ELECTRIC UTILITIES — 0.9% | | | | CVS Caremark Corp., | | |
| Carolina Power & Light Co., | | | | 6.60%, 3/15/19(2) | 5,000,000 | 5,646,430 |
| 5.15%, 4/1/15(2) | 1,123,000 | 1,212,474 | | Delhaize Group SA, | | |
| Carolina Power & Light Co., | | | | 5.875%, 2/1/14(2) | 2,560,000 | 2,760,745 |
| 5.25%, 12/15/15(2) | 545,000 | 594,818 | | Kroger Co. (The), | | |
| Carolina Power & Light Co., | | | | 6.80%, 4/1/11(2) | 3,170,000 | 3,396,218 |
| 5.30%, 1/15/19(2) | 770,000 | 835,709 | | Kroger Co. (The), | | |
| Cleveland Electric | | | | 5.00%, 4/15/13(2) | 1,580,000 | 1,668,600 |
| Illuminating Co. (The), | | | | Safeway, Inc., | | |
| 5.70%, 4/1/17(2) | 908,000 | 957,144 | | 5.80%, 8/15/12(2) | 1,670,000 | 1,811,681 |
| Duke Energy Carolinas LLC, | | | | Safeway, Inc., | | |
| 7.00%, 11/15/18(2) | 1,670,000 | 2,002,659 | | 5.00%, 8/15/19 | 1,750,000 | 1,793,003 |
| Duke Energy Corp., | | | | SYSCO Corp., | | |
| 6.30%, 2/1/14(2) | 1,570,000 | 1,738,843 | | 4.20%, 2/12/13(2) | 1,170,000 | 1,218,672 |
| Duke Energy Corp., | | | | Wal-Mart Stores, Inc., | | |
| 3.95%, 9/15/14(2) | 4,010,000 | 4,074,802 | | 3.00%, 2/3/14(2) | 2,260,000 | 2,297,708 |
| Exelon Generation Co. LLC, | | | | Wal-Mart Stores, Inc., | | |
| 5.20%, 10/1/19(2) | 2,420,000 | 2,451,978 | | 5.875%, 4/5/27(2) | 1,060,000 | 1,148,574 |
| FirstEnergy Corp., | | | | Wal-Mart Stores, Inc., | | |
| 6.45%, 11/15/11(2) | 96,000 | 103,904 | | 6.50%, 8/15/37(2) | 850,000 | 995,492 |
| FirstEnergy Solutions Corp., | | | | Wal-Mart Stores, Inc., | | |
| 6.05%, 8/15/21(2)(4) | 3,500,000 | 3,625,660 | | 6.20%, 4/15/38(2) | 640,000 | 730,950 |
| | | | | | | 23,468,073 |
20
| | | | | | |
| Diversified Bond | | | | | |
| |
| |
| | Principal | | | | Principal | |
| | Amount | Value | | | Amount | Value |
| FOOD PRODUCTS — 0.6% | | | | Yum! Brands, Inc., | | |
| Bunge Ltd. Finance Corp., | | | | 5.30%, 9/15/19(2) | $ 2,120,000 | $ 2,133,634 |
| 8.50%, 6/15/19(2) | $ 1,000,000 | $ 1,154,792 | | Yum! Brands, Inc., | | |
| General Mills, Inc., | | | | 6.875%, 11/15/37(2) | 560,000 | 622,426 |
| 5.65%, 9/10/12(2) | 1,460,000 | 1,594,866 | | | | 8,516,971 |
| General Mills, Inc., | | | | HOUSEHOLD DURABLES — 0.1% | |
| 5.25%, 8/15/13(2) | 1,410,000 | 1,535,886 | | Toll Brothers Finance Corp., | | |
| General Mills, Inc., | | | | 6.75%, 11/1/19(2) | 1,600,000 | 1,597,978 |
| 5.65%, 2/15/19(2) | 1,660,000 | 1,801,128 | | Whirlpool Corp., | | |
| Kellogg Co., | | | | 8.60%, 5/1/14(2) | 800,000 | 895,924 |
| 4.45%, 5/30/16(2) | 2,400,000 | 2,514,684 | | | | 2,493,902 |
| Kraft Foods, Inc., | | | | HOUSEHOLD PRODUCTS — 0.1% | |
| 6.00%, 2/11/13(2) | 830,000 | 891,224 | | | | |
| | | | | Kimberly-Clark Corp., | | |
| Kraft Foods, Inc., | | | | 6.125%, 8/1/17(2) | 560,000 | 638,782 |
| 6.75%, 2/19/14(2) | 1,190,000 | 1,329,360 | | | | |
| | | | | Kimberly-Clark Corp., | | |
| Kraft Foods, Inc., | | | | 7.50%, 11/1/18(2) | 820,000 | 1,022,710 |
| 6.125%, 2/1/18(2) | 2,660,000 | 2,823,353 | | | | |
| | | | | | | 1,661,492 |
| Ralcorp Holdings, Inc., | | | | | | |
| 6.625%, 8/15/39(2)(4) | 2,500,000 | 2,641,708 | | INDUSTRIAL CONGLOMERATES — 0.4% | |
| | | 16,287,001 | | General Electric Co., | | |
| | | | | 5.00%, 2/1/13(2) | 2,734,000 | 2,887,191 |
| HEALTH CARE EQUIPMENT & SUPPLIES — 0.2% | | General Electric Co., | | |
| Baxter International, Inc., | | | | 5.25%, 12/6/17(2) | 4,251,000 | 4,369,803 |
| 4.00%, 3/1/14(2) | 1,620,000 | 1,690,778 | | | | |
| | | | | Hutchison Whampoa | | |
| Baxter International, Inc., | | | | International 09/16 Ltd., | | |
| 5.90%, 9/1/16(2) | 1,130,000 | 1,272,241 | | 4.625%, 9/11/15(2)(4) | 3,600,000 | 3,583,289 |
| Baxter International, Inc., | | | | | | 10,840,283 |
| 5.375%, 6/1/18(2) | 650,000 | 705,645 | | | | |
| | | | | INSURANCE — 0.9% | | |
| Baxter International, Inc., | | | | | | |
| 6.25%, 12/1/37(2) | 590,000 | 688,307 | | Allstate Corp. (The), | | |
| | | | | 7.45%, 5/16/19 | 3,300,000 | 3,940,246 |
| St. Jude Medical, Inc., | | | | | | |
| 4.875%, 7/15/19(2) | 2,400,000 | 2,477,167 | | Berkshire Hathaway Finance | | |
| | | | | Corp., 5.00%, 8/15/13(2) | 790,000 | 859,087 |
| | | 6,834,138 | | International Lease Finance | | |
| HEALTH CARE PROVIDERS & SERVICES — 0.4% | | Corp., 5.30%, 5/1/12(2) | 950,000 | 798,954 |
| Express Scripts, Inc., | | | | MetLife Global Funding I, | | |
| 5.25%, 6/15/12(2) | 1,950,000 | 2,071,522 | | 5.125%, 4/10/13(2)(4) | 2,170,000 | 2,252,440 |
| Express Scripts, Inc., | | | | MetLife, Inc., | | |
| 7.25%, 6/15/19(2) | 1,700,000 | 2,000,152 | | 6.75%, 6/1/16(2) | 3,680,000 | 4,113,968 |
| HCA, Inc., | | | | Metropolitan Life | | |
| 7.875%, 2/15/20(2)(4) | 1,630,000 | 1,640,188 | | Global Funding I, | | |
| Medco Health Solutions, | | | | 2.875%, 9/17/12(2)(4) | 600,000 | 598,081 |
| Inc., 7.25%, 8/15/13(2) | 4,166,000 | 4,667,257 | | New York Life Global | | |
| | | 10,379,119 | | Funding, 4.65%, 5/9/13(2)(4) | 1,630,000 | 1,717,958 |
| HOTELS, RESTAURANTS & LEISURE — 0.3% | | | Prudential Financial, Inc., | | |
| McDonald’s Corp., | | | | 3.625%, 9/17/12(2) | 1,700,000 | 1,712,123 |
| 5.35%, 3/1/18(2) | 1,550,000 | 1,694,017 | | Prudential Financial, Inc., | | |
| McDonald’s Corp., | | | | 7.375%, 6/15/19(2) | 3,150,000 | 3,521,634 |
| 6.30%, 10/15/37(2) | 560,000 | 658,227 | | Prudential Financial, Inc., | | |
| Yum! Brands, Inc., | | | | 5.40%, 6/13/35(2) | 600,000 | 502,060 |
| 8.875%, 4/15/11(2) | 600,000 | 656,863 | | Travelers Cos., Inc. (The), | | |
| Yum! Brands, Inc., | | | | 5.90%, 6/2/19(2) | 3,120,000 | 3,502,649 |
| 6.25%, 3/15/18(2) | 2,550,000 | 2,751,804 | | | | 23,519,200 |
21
| | | | | | |
| Diversified Bond | | | | | |
| |
| |
| | Principal | | | | Principal | |
| | Amount | Value | | | Amount | Value |
| IT SERVICES — 0.3% | | | | Viacom, Inc., | | |
| International Business | | | | 6.25%, 4/30/16(2) | $ 6,080,000 | $ 6,567,914 |
| Machines Corp., | | | | Viacom, Inc., | | |
| 5.70%, 9/14/17(2) | $ 8,100,000 | $ 8,941,517 | | 5.625%, 9/15/19(2) | 1,400,000 | 1,426,100 |
| LEISURE EQUIPMENT & PRODUCTS — 0.1% | | | | | 53,051,192 |
| Hasbro, Inc., | | | | METALS & MINING — 1.0% | | |
| 6.125%, 5/15/14(2) | 1,500,000 | 1,633,920 | | Anglo American Capital plc, | | |
| MACHINERY — 0.1% | | | | 9.375%, 4/8/19(2)(4) | 2,250,000 | 2,738,264 |
| Caterpillar Financial | | | | ArcelorMittal, | | |
| Services Corp., | | | | 6.125%, 6/1/18(2) | 2,030,000 | 2,003,709 |
| 4.85%, 12/7/12(2) | 560,000 | 595,078 | | Barrick Gold Corp., | | |
| Caterpillar Financial | | | | 6.95%, 4/1/19 | 3,090,000 | 3,625,074 |
| Services Corp., | | | | BHP Billiton Finance USA | | |
| 5.45%, 4/15/18(2) | 1,620,000 | 1,685,636 | | Ltd., 6.50%, 4/1/19(2) | 2,661,000 | 3,092,904 |
| | | 2,280,714 | | Newmont Mining Corp., | | |
| MEDIA — 2.0% | | | | 5.125%, 10/1/19(2) | 4,030,000 | 4,036,025 |
| British Sky Broadcasting | | | | Rio Tinto Finance USA Ltd., | | |
| Group plc, 9.50%, | | | | 5.875%, 7/15/13(2) | 5,350,000 | 5,770,103 |
| 11/15/18(2)(4) | 2,950,000 | 3,781,558 | | Rio Tinto Finance USA Ltd., | | |
| Comcast Corp., | | | | 9.00%, 5/1/19(2) | 1,250,000 | 1,537,468 |
| 5.90%, 3/15/16(2) | 4,404,000 | 4,740,369 | | Teck Resources Ltd., | | |
| Comcast Corp., | | | | 10.75%, 5/15/19(2) | 2,910,000 | 3,397,425 |
| 6.40%, 5/15/38(2) | 650,000 | 687,881 | | Vale Overseas Ltd., | | |
| Comcast Corp., | | | | 5.625%, 9/15/19(2) | 1,450,000 | 1,482,606 |
| 6.55%, 7/1/39(2) | 2,400,000 | 2,574,096 | | Xstrata Finance Canada Ltd., | | |
| DirecTV Holdings LLC / | | | | 5.80%, 11/15/16(2)(4) | 447,000 | 440,331 |
| DirecTV Financing Co., Inc., | | | | | | 28,123,909 |
| 4.75%, 10/1/14(2)(4) | 4,030,000 | 4,040,075 | | | | |
| | | | | MULTILINE RETAIL(6) | | |
| Interpublic Group | | | | | | |
| of Cos., Inc. (The), | | | | Macy’s Retail Holdings, Inc., | | |
| 10.00%, 7/15/17(2)(4) | 1,000,000 | 1,085,000 | | 5.35%, 3/15/12(2) | 396,000 | 387,492 |
| News America, Inc., | | | | Nordstrom, Inc., | | |
| 6.90%, 8/15/39(2)(4) | 2,650,000 | 2,830,380 | | 6.75%, 6/1/14(2) | 700,000 | 768,976 |
| Omnicom Group, Inc., | | | | | | 1,156,468 |
| 6.25%, 7/15/19(2) | 4,000,000 | 4,323,000 | | MULTI-UTILITIES — 1.0% | | |
| Pearson Dollar Finance Two | | | | CenterPoint Energy | | |
| plc, 6.25%, 5/6/18(2)(4) | 920,000 | 973,760 | | Resources Corp., | | |
| Rogers Cable, Inc., | | | | 6.125%, 11/1/17(2) | 560,000 | 588,871 |
| 6.25%, 6/15/13(2) | 1,600,000 | 1,731,528 | | CenterPoint Energy | | |
| Time Warner Cable, Inc., | | | | Resources Corp., | | |
| 5.40%, 7/2/12(2) | 4,410,000 | 4,715,913 | | 6.25%, 2/1/37(2) | 950,000 | 917,132 |
| Time Warner Cable, Inc., | | | | Dominion Resources, Inc., | | |
| 6.75%, 7/1/18(2) | 4,400,000 | 4,870,373 | | 4.75%, 12/15/10(2) | 584,000 | 604,434 |
| Time Warner, Inc., | | | | Dominion Resources, Inc., | | |
| 5.50%, 11/15/11(2) | 2,105,000 | 2,239,655 | | 6.40%, 6/15/18(2) | 5,000,000 | 5,608,105 |
| Time Warner, Inc., | | | | Georgia Power Co., | | |
| 6.875%, 5/1/12(2) | 2,380,000 | 2,621,879 | | 6.00%, 11/1/13(2) | 1,670,000 | 1,871,547 |
| Time Warner, Inc., | | | | NSTAR Electric Co., | | |
| 7.625%, 4/15/31(2) | 1,006,000 | 1,130,851 | | 5.625%, 11/15/17(2) | 1,910,000 | 2,091,242 |
| Time Warner, Inc., | | | | Pacific Gas & Electric Co., | | |
| 7.70%, 5/1/32(2) | 2,390,000 | 2,710,860 | | 4.20%, 3/1/11(2) | 2,247,000 | 2,327,085 |
22
| | | | | | |
| Diversified Bond | | | | | |
| |
| |
| | Principal | | | | Principal | |
| | Amount | Value | | | Amount | Value |
| Pacific Gas & Electric Co., | | | | Kinder Morgan | | |
| 5.80%, 3/1/37(2) | $ 367,000 | $ 398,841 | | Energy Partners LP, | | |
| Pacific Gas & Electric Co., | | | | 6.50%, 9/1/39(2) | $ 2,020,000 | $ 2,061,705 |
| 6.35%, 2/15/38(2) | 610,000 | 713,194 | | Magellan Midstream | | |
| PG&E Corp., | | | | Partners LP, | | |
| 5.75%, 4/1/14(2) | 3,870,000 | 4,230,483 | | 6.55%, 7/15/19(2) | 2,350,000 | 2,616,159 |
| Public Service Co. of | | | | Marathon Oil Corp., | | |
| Colorado, 5.80%, 8/1/18(2) | 790,000 | 883,568 | | 7.50%, 2/15/19(2) | 1,600,000 | 1,848,670 |
| Sempra Energy, | | | | Nexen, Inc., | | |
| 8.90%, 11/15/13(2) | 3,740,000 | 4,375,549 | | 5.65%, 5/15/17(2) | 1,770,000 | 1,772,046 |
| Sempra Energy, | | | | Nexen, Inc., | | |
| 6.50%, 6/1/16(2) | 1,190,000 | 1,317,558 | | 6.20%, 7/30/19(2) | 2,610,000 | 2,712,810 |
| Sempra Energy, | | | | Nexen, Inc., | | |
| 9.80%, 2/15/19(2) | 1,840,000 | 2,361,046 | | 6.40%, 5/15/37(2) | 1,990,000 | 1,943,999 |
| | | 28,288,655 | | Plains All American Pipeline | | |
| | | | | LP, 8.75%, 5/1/19(2) | 5,060,000 | 6,084,306 |
| OIL, GAS & CONSUMABLE FUELS — 2.7% | | | | | |
| | | | | Plains All American Pipeline | | |
| Anadarko Petroleum Corp., | | | | LP/PAA Finance Corp., | | |
| 5.95%, 9/15/16(2) | 2,800,000 | 2,972,612 | | | | |
| | | | | 4.25%, 9/1/12(2) | 1,500,000 | 1,543,428 |
| Anadarko Petroleum Corp., | | | | Shell International Finance | | |
| 6.95%, 6/15/19(2) | 1,000,000 | 1,116,884 | | | | |
| | | | | BV, 4.30%, 9/22/19(2) | 4,220,000 | 4,250,587 |
| Anadarko Petroleum Corp., | | | | Shell International Finance | | |
| 6.45%, 9/15/36(2) | 3,750,000 | 3,884,385 | | | | |
| | | | | BV, 6.375%, 12/15/38(2) | 860,000 | 1,025,200 |
| Cenovus Energy, Inc., | | | | Talisman Energy, Inc., | | |
| 4.50%, 9/15/14(2)(4) | 2,260,000 | 2,312,229 | | | | |
| | | | | 7.75%, 6/1/19(2) | 3,250,000 | 3,829,218 |
| ConocoPhillips, | | | | Williams Cos., Inc. (The), | | |
| 6.50%, 2/1/39(2) | 2,270,000 | 2,625,965 | | | | |
| | | | | 8.75%, 1/15/20(2) | 1,630,000 | 1,877,726 |
| El Paso Corp., | | | | XTO Energy, Inc., | | |
| 7.875%, 6/15/12(2) | 2,000,000 | 2,069,282 | | | | |
| | | | | 5.90%, 8/1/12(2) | 2,700,000 | 2,918,368 |
| Enbridge Energy Partners | | | | XTO Energy, Inc., | | |
| LP, 6.50%, 4/15/18(2) | 1,240,000 | 1,338,362 | | | | |
| | | | | 5.30%, 6/30/15(2) | 773,000 | 820,279 |
| EnCana Corp., | | | | XTO Energy, Inc., | | |
| 6.50%, 5/15/19 | 1,000,000 | 1,112,492 | | 6.50%, 12/15/18(2) | 3,350,000 | 3,704,758 |
| Enterprise Products | | | | XTO Energy, Inc., | | |
| Operating LLC, | | | | 6.10%, 4/1/36(2) | 615,000 | 635,149 |
| 6.30%, 9/15/17(2) | 5,500,000 | 5,933,416 | | | | |
| Enterprise Products | | | | | | 73,438,008 |
| Operating LLC, | | | | PAPER & FOREST PRODUCTS — 0.2% | |
| 6.125%, 10/15/39(5) | 1,000,000 | 1,013,829 | | International Paper Co., | | |
| EOG Resources, Inc., | | | | 9.375%, 5/15/19(2) | 3,000,000 | 3,518,463 |
| 5.625%, 6/1/19(2) | 1,800,000 | 1,974,796 | | International Paper Co., | | |
| Kerr-McGee Corp., | | | | 7.50%, 8/15/21(2) | 2,400,000 | 2,547,994 |
| 6.95%, 7/1/24(2) | 2,840,000 | 3,047,763 | | | | 6,066,457 |
| Kinder Morgan | | | | PHARMACEUTICALS — 1.3% | | |
| Energy Partners LP, | | | | Abbott Laboratories, | | |
| 6.75%, 3/15/11(2) | 450,000 | 477,381 | | 5.875%, 5/15/16(2) | 1,021,000 | 1,139,954 |
| Kinder Morgan | | | | Abbott Laboratories, | | |
| Energy Partners LP, | | | | 5.60%, 11/30/17(2) | 630,000 | 695,581 |
| 5.95%, 2/15/18(2) | 1,250,000 | 1,309,801 | | | | |
| | | | | Abbott Laboratories, | | |
| Kinder Morgan | | | | 6.00%, 4/1/39(2) | 810,000 | 923,951 |
| Energy Partners LP, | | | | | | |
| 6.85%, 2/15/20(2) | 2,380,000 | 2,604,403 | | AstraZeneca plc, | | |
| | | | | 5.40%, 9/15/12(2) | 2,420,000 | 2,654,544 |
23
| | | | | | |
| Diversified Bond | | | | | |
| |
| |
| | Principal | | | | Principal | |
| | Amount | Value | | | Amount | Value |
| AstraZeneca plc, | | | | SEMICONDUCTORS & | | |
| 5.90%, 9/15/17(2) | $ 830,000 | $ 930,406 | | SEMICONDUCTOR EQUIPMENT — 0.1% | |
| GlaxoSmithKline Capital, | | | | Analog Devices, Inc., | | |
| Inc., 4.85%, 5/15/13(2) | 1,630,000 | 1,753,202 | | 5.00%, 7/1/14(2) | $ 1,550,000 | $ 1,630,908 |
| GlaxoSmithKline Capital, | | | | SOFTWARE — 0.2% | | |
| Inc., 6.375%, 5/15/38(2) | 980,000 | 1,159,449 | | Intuit, Inc., | | |
| Merck & Co., Inc., | | | | 5.75%, 3/15/17(2) | 1,833,000 | 1,920,398 |
| 5.85%, 6/30/39(2) | 1,750,000 | 1,971,573 | | Oracle Corp., | | |
| Pfizer, Inc., | | | | 6.125%, 7/8/39(2) | 4,130,000 | 4,667,284 |
| 6.20%, 3/15/19(2) | 5,090,000 | 5,747,562 | | | | 6,587,682 |
| Pfizer, Inc., | | | | SPECIALTY RETAIL — 0.2% | | |
| 7.20%, 3/15/39(2) | 3,460,000 | 4,369,928 | | | | |
| | | | | GSC Holdings Corp., | | |
| Roche Holdings, Inc., | | | | 8.00%, 10/1/12(2) | 1,300,000 | 1,348,750 |
| 5.00%, 3/1/14(2)(4) | 2,750,000 | 2,977,092 | | | | |
| | | | | Home Depot, Inc. (The), | | |
| Roche Holdings, Inc., | | | | 5.875%, 12/16/36(2) | 800,000 | 778,751 |
| 6.00%, 3/1/19(2)(4) | 3,970,000 | 4,427,221 | | | | |
| | | | | Staples, Inc., | | |
| Watson Pharmaceuticals, | | | | 9.75%, 1/15/14(2) | 2,800,000 | 3,367,695 |
| Inc., 5.00%, 8/15/14(2) | 3,600,000 | 3,695,861 | | | | 5,495,196 |
| Watson Pharmaceuticals, | | | | | | |
| Inc., 6.125%, 8/15/19(2) | 1,740,000 | 1,833,346 | | TOBACCO — 0.3% | | |
| Wyeth, 5.95%, 4/1/37(2) | 780,000 | 862,006 | | Altria Group, Inc., | | |
| | | | | 9.25%, 8/6/19(2) | 6,180,000 | 7,564,518 |
| | | 35,141,676 | | WIRELESS TELECOMMUNICATION SERVICES — 0.3% |
| REAL ESTATE INVESTMENT TRUSTS (REITs) — 0.4% | | American Tower Corp., | | |
| ProLogis, 7.625%, 8/15/14(2) | 1,940,000 | 1,985,400 | | 7.25%, 5/15/19(2)(4) | 3,700,000 | 3,820,250 |
| ProLogis, 5.75%, 4/1/16(2) | 750,000 | 671,914 | | Rogers Communications, | | |
| ProLogis, | | | | Inc., 6.80%, 8/15/18(2) | 1,370,000 | 1,540,510 |
| 5.625%, 11/15/16(2) | 1,080,000 | 970,905 | | Vodafone Group plc, | | |
| Simon Property Group LP, | | | | 5.00%, 12/16/13(2) | 2,070,000 | 2,210,124 |
| 6.75%, 5/15/14(2) | 3,770,000 | 4,048,871 | | Vodafone Group plc, | | |
| Simon Property Group LP, | | | | 5.45%, 6/10/19(2) | 1,800,000 | 1,878,277 |
| 5.75%, 12/1/15(2) | 2,250,000 | 2,304,715 | | | | 9,449,161 |
| | | 9,981,805 | | TOTAL CORPORATE BONDS | | |
| ROAD & RAIL — 0.5% | | | | (Cost $672,790,605) | | 725,005,437 |
| CSX Corp., 5.75%, 3/15/13(2) | 1,680,000 | 1,793,397 | | U.S. Treasury Securities — 20.3% | |
| CSX Corp., 7.375%, 2/1/19(2) | 4,250,000 | 5,010,023 | | U.S. Treasury Bonds, | | |
| Norfolk Southern Corp., | | | | 10.625%, 8/15/15(2) | 1,500,000 | 2,152,500 |
| 5.75%, 1/15/16(2)(4) | 750,000 | 820,692 | | U.S. Treasury Bonds, | | |
| Norfolk Southern Corp., | | | | 8.125%, 8/15/19(2) | 11,000,000 | 15,334,693 |
| 5.75%, 4/1/18(2) | 2,400,000 | 2,615,025 | | U.S. Treasury Bonds, | | |
| Norfolk Southern Corp., | | | | 8.125%, 8/15/21(2) | 2,180,000 | 3,106,160 |
| 5.90%, 6/15/19(2) | 1,190,000 | 1,325,465 | | U.S. Treasury Bonds, | | |
| Union Pacific Corp., | | | | 7.125%, 2/15/23(2) | 11,817,000 | 15,855,093 |
| 5.75%, 11/15/17(2) | 2,780,000 | 2,985,028 | | U.S. Treasury Bonds, | | |
| | | 14,549,630 | | 6.125%, 11/15/27(2) | 19,206,000 | 24,409,635 |
24
| | | | | | |
| Diversified Bond | | | | | |
| |
| |
| | Principal | | | | Principal | |
| | Amount | Value | | | Amount | Value |
| U.S. Treasury Bonds, | | | | General Electric Capital | | |
| 5.25%, 2/15/29(2) | $ 12,000,000 | $ 13,938,756 | | Corp., 2.20%, 6/8/12(2) | $ 9,220,000 | $ 9,369,512 |
| U.S. Treasury Bonds, | | | | General Electric Capital | | |
| 5.375%, 2/15/31(2) | 9,500,000 | 11,296,099 | | Corp., 2.625%, 12/28/12(2) | 20,000,000 | 20,513,220 |
| U.S. Treasury Bonds, | | | | Goldman Sachs Group, Inc. | | |
| 4.75%, 2/15/37(2) | 5,160,000 | 5,760,660 | | (The), 1.625%, 7/15/11(2) | 7,100,000 | 7,174,635 |
| U.S. Treasury Bonds, | | | | HSBC USA, Inc., | | |
| 4.25%, 5/15/39(2) | 6,300,000 | 6,521,489 | | 3.125%, 12/16/11(2) | 20,000,000 | 20,783,280 |
| U.S. Treasury Notes, | | | | Morgan Stanley, | | |
| 0.875%, 4/30/11(2) | 60,000,000 | 60,192,240 | | 2.00%, 9/22/11(2) | 6,700,000 | 6,813,056 |
| U.S. Treasury Notes, | | | | PNC Funding Corp., | | |
| 1.00%, 8/31/11(2) | 100,000,000 | 100,226,600 | | 2.30%, 6/22/12(2) | 20,000,000 | 20,374,880 |
| U.S. Treasury Notes, | | | | State Street Bank and Trust | | |
| 1.875%, 6/15/12(2) | 85,000,000 | 86,374,620 | | Co., 1.85%, 3/15/11(2) | 10,000,000 | 10,145,270 |
| U.S. Treasury Notes, | | | | State Street Corp., | | |
| 4.25%, 9/30/12(2) | 6,480,000 | 7,024,223 | | 2.15%, 4/30/12(2) | 12,000,000 | 12,197,628 |
| U.S. Treasury Notes, | | | | US Bancorp, | | |
| 2.375%, 8/31/14(2) | 164,000,000 | 164,704,708 | | 1.80%, 5/15/12 | 18,000,000 | 18,101,376 |
| U.S. Treasury Notes, | | | | Wells Fargo & Co., | | |
| 2.375%, 3/31/16(2) | 25,000,000 | 24,345,725 | | 2.125%, 6/15/12(2) | 5,000,000 | 5,075,580 |
| U.S. Treasury Notes, | | | | | | 183,795,931 |
| 3.00%, 8/31/16(2) | 10,000,000 | 10,065,630 | | TOTAL U.S. GOVERNMENT AGENCY | |
| TOTAL U.S. TREASURY SECURITIES | | | SECURITIES AND EQUIVALENTS | |
| (Cost $540,197,631) | | 551,308,831 | | (Cost $326,041,882) | | 331,627,308 |
| |
| U.S. Government Agency | | | Municipal Securities — 2.5% | |
| Securities and Equivalents — 12.2% | | California Educational | | |
| FIXED-RATE U.S. GOVERNMENT | | | Facilities Auth. Rev., | | |
| AGENCY SECURITIES — 5.5% | | | Series 2007 T1, | | |
| | | | | (Stanford University), | | |
| FHLB, 1.625%, 9/26/12(2) | 20,000,000 | 19,969,600 | | 5.00%, 3/15/39(2) | 6,400,000 | 7,639,104 |
| FHLMC, 2.125%, 3/23/12(2) | 10,000,000 | 10,193,810 | | California GO, 5.00%, | | |
| FHLMC, 1.75%, 6/15/12 | 15,000,000 | 15,093,090 | | 2/1/27 (Ambac)(2) | 15,000,000 | 15,969,900 |
| FHLMC, 2.125%, 9/21/12(2) | 15,000,000 | 15,206,475 | | California GO, (Building | | |
| | | | | Bonds), 7.55%, 4/1/39(2) | 5,000,000 | 5,599,550 |
| FHLMC, 5.00%, 1/30/14(2) | 18,000,000 | 19,771,884 | | | | |
| FHLMC, 4.875%, 6/13/18(2) | 5,395,000 | 5,893,169 | | Illinois GO, (Taxable | | |
| | | | | Pension), 5.10%, 6/1/33(2) | 6,762,000 | 6,369,195 |
| FNMA, 1.875%, 4/20/12(2) | 15,000,000 | 15,215,970 | | Metropolitan Water | | |
| FNMA, 1.75%, 8/10/12(2) | 10,000,000 | 10,055,340 | | Reclamation District of | | |
| FNMA, 4.375%, 7/17/13(2) | 5,461,000 | 5,924,289 | | Greater Chicago GO, | | |
| | | | | (Building Bonds), | | |
| FNMA, 2.75%, 3/13/14(2) | 30,000,000 | 30,507,750 | | 5.72%, 12/1/38(2) | 2,200,000 | 2,427,150 |
| | | 147,831,377 | | Missouri Highways & | | |
| GOVERNMENT-BACKED | | | | Transportation Commission | | |
| CORPORATE BONDS(7) — 6.7% | | | Rev., (Building Bonds), | | |
| Bank of America Corp., | | | | 5.45%, 5/1/33(2) | 2,050,000 | 2,131,939 |
| 3.125%, 6/15/12(2) | 9,000,000 | 9,367,767 | | New Jersey State Turnpike | | |
| Citigroup Funding, Inc., | | | | Auth. Rev., Series 2009 F, | | |
| 1.875%, 10/22/12 | 12,000,000 | 12,035,652 | | (Building Bonds), | | |
| | | | | 7.41%, 1/1/40(2) | 5,385,000 | 6,689,516 |
| Citigroup Funding, Inc., | | | | | | |
| 1.875%, 11/15/12(5) | 21,700,000 | 21,716,275 | | New York State Dormitory | | |
| | | | | Auth. Rev., (Building Bonds), | | |
| General Electric Capital | | | | 5.63%, 3/15/39(2) | 2,650,000 | 2,805,449 |
| Corp., 1.80%, 3/11/11(2) | 10,000,000 | 10,127,800 | | | | |
25
| | | | | | |
| Diversified Bond | | | | | |
| |
| |
| | Principal | | | | Principal | |
| | Amount | Value | | | Amount | Value |
| San Antonio Electric & Gas | | | | MASTR Alternative Loans | | |
| Rev., (Building Bonds), | | | | Trust, Series 2003-8, Class | | |
| 5.99%, 2/1/39(2) | $ 1,700,000 | $ 1,915,152 | | 4A1, 7.00%, 12/25/33(2) | $ 93,539 | $ 88,066 |
| Texas GO, (Building Bonds), | | | | Wells Fargo Mortgage | | |
| 5.52%, 4/1/39(2) | 5,000,000 | 5,324,250 | | Backed Securities Trust, | | |
| University of California Rev., | | | | Series 2006-AR10, Class 5A5 | | |
| (Building Bonds), | | | | SEQ, VRN, 5.59%, 10/1/09(2) | 6,750,000 | 4,650,301 |
| 5.77%, 5/15/43(2) | 3,320,000 | 3,587,160 | | Wells Fargo Mortgage | | |
| Utah GO, Series 2009 D, | | | | Backed Securities Trust, | | |
| (Building Bonds), | | | | Series 2006-AR15, Class A1, | | |
| 4.55%, 7/1/24(2) | 6,050,000 | 6,277,299 | | VRN, 5.66%, 10/1/09 | 4,084,054 | 3,173,565 |
| TOTAL MUNICIPAL SECURITIES | | | Wells Fargo Mortgage | | |
| (Cost $60,532,291) | | 66,735,664 | | Backed Securities Trust, | | |
| | | | | Series 2006-AR19, Class A1, | | |
| Collateralized Mortgage | | | VRN, 5.63%, 10/1/09(2) | 2,013,793 | 1,515,826 |
| Obligations(1) — 2.2% | | | | Wells Fargo Mortgage | | |
| PRIVATE SPONSOR COLLATERALIZED | | | Backed Securities Trust, | | |
| MORTGAGE OBLIGATIONS — 1.5% | | | Series 2007-15, Class A1, | | |
| | | | | 6.00%, 11/25/37(2) | 3,008,348 | 2,574,655 |
| Banc of America | | | | | | 40,771,010 |
| Alternative Loan Trust, | | | | | | |
| Series 2007-2, Class 2A4, | | | | U.S. GOVERNMENT AGENCY COLLATERALIZED |
| 5.75%, 6/25/37(2) | 3,154,352 | 2,621,364 | | MORTGAGE OBLIGATIONS — 0.7% | |
| Chase Mortgage Finance | | | | FHLMC, Series 2926, Class | | |
| Corp., Series 2005 A1, | | | | EW SEQ, 5.00%, 1/15/25(2) | 3,054,000 | 3,196,617 |
| Class 2A2 SEQ, VRN, | | | | FHLMC, Series 3203, Class | | |
| 5.24%, 10/1/09(2) | 3,346,186 | 2,925,271 | | VN SEQ, 5.00%, 6/15/22(2) | 10,000,000 | 10,603,919 |
| Countrywide Home Loan | | | | FNMA, Series 1989-35, | | |
| Mortgage Pass-Through | | | | Class G SEQ, 9.50%, | | |
| Trust, Series 2003-37, Class | | | | 7/25/19(2) | 22,610 | 24,750 |
| 2A2, VRN, 3.68%, 10/1/09(2) | 539,865 | 263,021 | | FNMA, Series 2003-10, | | |
| Countrywide Home Loan | | | | Class HW SEQ, 5.00%, | | |
| Mortgage Pass-Through | | | | 11/25/16(2) | 3,873,378 | 3,980,400 |
| Trust, Series 2005-17, Class | | | | | | 17,805,686 |
| 1A11, 5.50%, 9/25/35(2) | 9,033,017 | 8,347,309 | | | | |
| | | | | TOTAL COLLATERALIZED | | |
| Countrywide Home Loan | | | | MORTGAGE OBLIGATIONS | | |
| Mortgage Pass-Through | | | | (Cost $56,140,021) | | 58,576,696 |
| Trust, Series 2007-16, Class | | | | | | |
| A1, 6.50%, 10/25/37(2) | 5,184,843 | 4,251,922 | | Commercial Mortgage-Backed | |
| Credit Suisse First Boston | | | | Securities(1) — 2.1% | | |
| Mortgage Securities Corp., | | | | | | |
| Series 2003 AR28, Class | | | | Banc of America | | |
| 2A1, VRN, 4.40%, 10/1/09(2) | 2,750,155 | 2,564,097 | | Commercial Mortgage, Inc., | | |
| | | | | Series 2004-1, Class A3 | | |
| J.P. Morgan Mortgage Trust, | | | | SEQ, 4.43%, 11/10/39(2) | 8,305,000 | 8,284,703 |
| Series 2005 A4, Class 2A1, | | | | | | |
| VRN, 5.06%, 10/1/09(2) | 5,516,866 | 4,668,491 | | Banc of America Large Loan, | | |
| | | | | Series 2005 MIB1, Class | | |
| J.P. Morgan Mortgage Trust, | | | | A1, VRN, 0.39%, 10/15/09, | | |
| Series 2005 A8, Class 6A2, | | | | resets monthly off the | | |
| VRN, 5.12%, 10/1/09(2) | 563,083 | 506,873 | | 1-month LIBOR plus 0.15% | | |
| J.P. Morgan Mortgage Trust, | | | | with no caps(2)(4) | 970,243 | 832,419 |
| Series 2006 A3, Class 2A1 | | | | | | |
| SEQ, VRN, 5.59%, 10/1/09 | 2,949,510 | 2,620,249 | | | | |
26
| | | | | | | |
| Diversified Bond | | | | | | |
| |
| |
| | Principal | | | | | Principal | |
| | Amount | Value | | | | Amount | Value |
| Bear Stearns Commercial | | | | Merrill Lynch Floating Trust, | | |
| Mortgage Securities Trust, | | | | Series 2006-1, Class A1, | | |
| Series 2006 BBA7, Class | | | | VRN, 0.31%, 10/15/09, | | |
| A1, VRN, 0.35%, 10/15/09, | | | | resets monthly off the | | |
| resets monthly off the | | | | 1-month LIBOR plus 0.07% | | |
| 1-month LIBOR plus 0.11% | | | | with no caps(2)(4) | | $ 1,695,608 | $ 1,301,375 |
| with no caps(2)(4) | $ 3,299,495 | $ 2,730,818 | | TOTAL COMMERCIAL | | |
| Chase Manhattan Bank-First | | | | MORTGAGE-BACKED SECURITIES | |
| Union National Bank, Series | | | | (Cost $57,046,687) | | | 56,673,588 |
| 1999-1, Class C, VRN, | | | | | | | |
| 7.625%, 10/1/09(2) | 1,200,000 | 1,209,341 | | Sovereign Governments | |
| Commercial Mortgage Pass- | | | | & Agencies — 1.6% | | |
| Through Certificates, Series | | | | Brazilian Government | | |
| 2005 F10A, Class A1, VRN, | | | | International Bond, | | | |
| 0.34%, 10/15/09, resets | | | | 5.875%, 1/15/19(2) | | 4,930,000 | 5,324,400 |
| monthly off the 1-month | | | | German Federal Republic, | | |
| LIBOR plus 0.10% with | | | | 3.50%, 7/4/19 | EUR | 17,200,000 | 25,757,305 |
| no caps(2)(4) | 116,959 | 116,152 | | | | | |
| Credit Suisse Mortgage | | | | Hydro Quebec, Series HY, | | |
| | | | | 8.40%, 1/15/22(2) | | $ 246,000 | 326,869 |
| Capital Certificates, Series | | | | | | | |
| 2007 TF2A, Class A1, VRN, | | | | Poland Government | | | |
| 0.42%, 10/15/09, resets | | | | International Bond, | | | |
| monthly off the 1-month | | | | 6.375%, 7/15/19(2) | | 1,750,000 | 1,975,318 |
| LIBOR plus 0.18% with | | | | Province of Ontario Canada, | | |
| no caps(2)(4) | 3,726,764 | 2,769,400 | | 5.45%, 4/27/16(2) | | 3,630,000 | 4,062,206 |
| GMAC Commercial | | | | United Mexican States, | | |
| Mortgage Securities, Inc., | | | | 5.95%, 3/19/19(2) | | 6,130,000 | 6,467,150 |
| Series 2005 C1, Class A2 | | | | TOTAL SOVEREIGN | | |
| SEQ, 4.47%, 5/10/43(2) | 10,220,613 | 10,281,476 | | GOVERNMENTS & AGENCIES | |
| Greenwich Capital | | | | (Cost $42,756,154) | | | 43,913,248 |
| Commercial Funding Corp., | | | | Asset-Backed Securities(1) — 0.1% |
| Series 2006 FL4A, Class A1, | | | | | | | |
| VRN, 0.34%, 10/5/09, resets | | | | CNH Equipment Trust, Series | | |
| monthly off the 1-month | | | | 2007 C, Class A3A SEQ, | | |
| LIBOR plus 0.09% with | | | | 5.21%, 12/15/11(2) | | 1,397,701 | 1,410,295 |
| no caps(2)(4) | 473,761 | 394,058 | | Detroit Edison Securitization | | |
| Heller Financial Commercial | | | | Funding LLC, Series 2001-1, | | |
| Mortgage Asset, Series 2000 | | | | Class A4 SEQ, | | | |
| PH1, Class D, VRN, | | | | 6.19%, 3/1/13(2) | | 617,282 | 647,904 |
| 8.36%, 10/1/09 | 5,000,000 | 5,038,446 | | SLM Student Loan Trust, | | |
| LB-UBS Commercial | | | | Series 2006-5, Class A2, | | |
| Mortgage Trust, Series 2003 | | | | VRN, 0.49%, 10/26/09, | | |
| C3, Class A3 SEQ, 3.85%, | | | | resets quarterly off the | | |
| 5/15/27(2) | 10,361,447 | 10,370,166 | | 3-month LIBOR minus | | |
| LB-UBS Commercial | | | | 0.01% with no caps(2) | 363,472 | 363,241 |
| Mortgage Trust, Series 2005 | | | | SLM Student Loan Trust, | | |
| C2, Class A2 SEQ, | | | | Series 2006-10, Class A2, | | |
| 4.82%, 4/15/30(2) | 6,278,258 | 6,344,263 | | VRN, 0.51%, 10/26/09, | | |
| LB-UBS Commercial | | | | resets quarterly off the | | |
| Mortgage Trust, Series 2005 | | | | 3-month LIBOR plus 0.01% | | |
| C3, Class A3 SEQ, 4.65%, | | | | with no caps(2) | | 103,979 | 103,983 |
| 7/15/30(2) | 6,984,000 | 7,000,971 | | | | | |
27
| | | | |
| Diversified Bond | | | |
| |
| |
| | Principal | | | |
| | Amount | Value | | |
| SLM Student Loan Trust, | | | | |
| Series 2007-8, Class A1, | | | | |
| VRN, 0.73%, 10/26/09, | | | | |
| resets quarterly off the | | | | |
| 3-month LIBOR plus 0.23% | | | | |
| with no caps(2) | $ 1,547,381 | $ 1,547,526 | | |
| TOTAL ASSET-BACKED SECURITIES | | | |
| (Cost $4,029,477) | | 4,072,949 | | |
| | Shares | | | |
| Temporary Cash Investments — 2.7% | | |
| JPMorgan U.S. Treasury | | | | |
| Plus Money Market Fund | | | | |
| Agency Shares(2) | 631,949 | 631,949 | | |
| Repurchase Agreement, Deutsche Bank | | | |
| Securities, Inc., (collateralized by various | | | |
| U.S. Treasury obligations, 3.375%, 6/30/13, | | | |
| valued at $74,102,114), in a joint trading | | | |
| account at 0.03%, dated 9/30/09, due | | | |
| 10/1/09 (Delivery value $72,649,061) | 72,649,000 | | |
| TOTAL TEMPORARY | | | | |
| CASH INVESTMENTS | | | | |
| (Cost $73,280,949) | | 73,280,949 | | |
| TOTAL INVESTMENT | | | | |
| SECURITIES — 100.9% | | | | |
| (Cost $2,641,366,636) | | 2,738,620,608 | | |
| OTHER ASSETS | | | | |
| AND LIABILITIES — (0.9)% | | (24,512,445) | | |
| TOTAL NET ASSETS — 100.0% | | $2,714,108,163 | | |
| |
| |
| Forward Foreign Currency Exchange Contracts | | |
| Contracts to Sell | Settlement Date | Value | Unrealized Gain (Loss) |
| 17,694,771 EUR for USD | 10/30/09 | $25,893,643 | $116,874 |
| |
| (Value on Settlement Date $26,010,517) | | | |
| |
| Swap Agreements | | | | |
| Notional Amount Description of Agreement | Premiums Paid (Received) | Value |
| CREDIT DEFAULT — BUY PROTECTION | | | |
| $7,600,000 Pay quarterly a fixed rate equal to 0.12% | | |
| multiplied by the notional amount and | | |
| receive from Barclays Bank plc upon each | | |
| default event of Pfizer, Inc., par value of the | | |
| proportional notional amount of Pfizer, Inc., | | |
| 4.65%, 3/1/18. Expires March 2017. | — | $184,600 |
28
| |
| Diversified Bond |
| |
| Notes to Schedule of Investments |
| Ambac = Ambac Assurance Corporation |
| Equivalent = Security whose principal payments are backed by the full faith and credit of the United States |
| EUR = Euro |
| FHLB = Federal Home Loan Bank |
| FHLMC = Federal Home Loan Mortgage Corporation |
| FNMA = Federal National Mortgage Association |
| GMAC = General Motors Acceptance Corporation |
| GNMA = Government National Mortgage Association |
| GO = General Obligation |
| LB-UBS = Lehman Brothers, Inc. — UBS AG |
| LIBOR = London Interbank Offered Rate |
| MASTR = Mortgage Asset Securitization Transactions, Inc. |
| resets = The frequency with which a security’s coupon changes, based on current market conditions or an underlying index. The more frequently a |
| security resets, the less risk the investor is taking that the coupon will vary significantly from current market rates. |
| SEQ = Sequential Payer |
| USD = United States Dollar |
| VRN = Variable Rate Note. Interest reset date is indicated. Rate shown is effective at the period end. |
| (1) | Final maturity indicated, unless otherwise noted. |
| (2) | Security, or a portion thereof, has been segregated for forward commitments, when-issued securities, and/or swap agreements. At the period |
| | end, the aggregate value of securities pledged was $46,383,000. |
| (3) | Forward commitment. |
| (4) | Security was purchased under Rule 144A of the Securities Act of 1933 or is a private placement and, unless registered under the Act or |
| | exempted from registration, may only be sold to qualified institutional investors. The aggregate value of these securities at the period end was |
| | $82,137,294, which represented 3.0% of total net assets. |
| (5) | When-issued security. |
| (6) | Industry is less than 0.05% of total net assets. |
| (7) | The debt is guaranteed under the Federal Deposit Insurance Corporation’s (FDIC) Temporary Liquidity Guarantee Program and is backed by the full |
| | faith and credit of the United States. The expiration date of the FDIC’s guarantee is the earlier of the maturity date of the debt or June 30, 2012. |
| |
| |
| See Notes to Financial Statements. |
29
| | | | | | |
| High-Yield | | | | | | |
| |
| SEPTEMBER 30, 2009 (UNAUDITED) | | | | | |
| |
| | Principal | | | | Principal | |
| | Amount | Value | | | Amount | Value |
| Corporate Bonds — 94.9% | | | COMMERCIAL SERVICES & SUPPLIES — 3.2% |
| AEROSPACE & DEFENSE — 1.2% | | | ACCO Brands Corp., | | |
| | | | | 10.625%, 3/15/15(1)(2) | $ 500,000 | $ 525,000 |
| Bombardier, Inc., | | | | Allied Waste North America, | | |
| 8.00%, 11/15/14(1)(2) | $ 750,000 | $ 772,500 | | | | |
| | | | | Inc., 7.875%, 4/15/13(2) | 750,000 | 769,337 |
| Hawker Beechcraft | | | | ARAMARK Corp., | | |
| Acquisition Co. LLC/Hawker | | | | 8.50%, 2/1/15(2) | 1,350,000 | 1,368,562 |
| Beechcraft Notes Co. PIK, | | | | | | |
| 8.875%, 4/1/15(2) | 1,000,000 | 645,000 | | Cenveo Corp., | | |
| | | | | 7.875%, 12/1/13(2) | 1,250,000 | 1,009,375 |
| L-3 Communications Corp., | | | | | | |
| 6.125%, 7/15/13(2) | 675,000 | 686,813 | | Cenveo Corp., | | |
| | | | | 8.375%, 6/15/14(2) | 350,000 | 247,188 |
| L-3 Communications Corp., | | | | | | |
| 6.375%, 10/15/15(2) | 250,000 | 253,750 | | Corrections Corp. of | | |
| | | | | America, 6.25%, 3/15/13(2) | 700,000 | 693,000 |
| | | 2,358,063 | | | | |
| AUTO COMPONENTS — 1.0% | | | | Corrections Corp. of | | |
| | | | | America, 7.75%, 6/1/17(2) | 1,300,000 | 1,348,750 |
| Goodyear Tire & Rubber Co. | | | | Iron Mountain, Inc., | | |
| (The), 9.00%, 7/1/15(2) | 1,000,000 | 1,042,500 | | | | |
| | | | | 8.375%, 8/15/21(2) | 500,000 | 517,500 |
| Goodyear Tire & Rubber Co. | | | | | | 6,478,712 |
| (The), 10.50%, 5/15/16(2) | 500,000 | 545,000 | | | | |
| Tenneco, Inc., | | | | COMPUTERS & PERIPHERALS — 0.3% | |
| 8.125%, 11/15/15(2) | 500,000 | 487,500 | | Seagate Technology HDD | | |
| | | | | Holdings, 6.80%, 10/1/16(2) | 650,000 | 599,625 |
| | | 2,075,000 | | | | |
| AUTOMOBILES — 0.3% | | | | CONSUMER FINANCE — 5.9% | |
| Ford Motor Co., | | | | American General Finance | | |
| | | | | Corp., 4.875%, 7/15/12(2) | 2,000,000 | 1,552,872 |
| 7.45%, 7/16/31(2) | 650,000 | 529,750 | | | | |
| BUILDING PRODUCTS — 0.8% | | | Capital One Capital V, | | |
| | | | | 10.25%, 8/15/39(2) | 1,000,000 | 1,107,787 |
| Masco Corp., | | | | Ford Motor Credit Co. LLC, | | |
| 6.125%, 10/3/16 | 1,000,000 | 949,730 | | 7.375%, 10/28/09 | 425,000 | 425,117 |
| Nortek, Inc., | | | | Ford Motor Credit Co. LLC, | | |
| 10.00%, 12/1/13(2) | 650,000 | 666,250 | | | | |
| | | | | 7.875%, 6/15/10(2) | 1,000,000 | 1,004,550 |
| | | 1,615,980 | | Ford Motor Credit Co. LLC, | | |
| CHEMICALS — 1.0% | | | | 7.25%, 10/25/11(2) | 2,100,000 | 2,040,820 |
| Ashland, Inc., | | | | Ford Motor Credit Co. LLC, | | |
| 9.125%, 6/1/17(1)(2) | 500,000 | 536,250 | | 7.50%, 8/1/12 | 1,100,000 | 1,057,015 |
| Hexion US Finance Corp./ | | | | Ford Motor Credit Co. LLC, | | |
| Hexion Nova Scotia Finance | | | | 8.70%, 10/1/14 | 1,000,000 | 980,909 |
| ULC, 9.75%, 11/15/14(2) | 700,000 | 605,500 | | | | |
| | | | | GMAC, Inc., 6.875%, | | |
| Huntsman International LLC, | | | | 9/15/11(1) | 2,825,000 | 2,697,875 |
| 7.875%, 11/15/14 | 650,000 | 609,375 | | GMAC, Inc., 8.00%, | | |
| Nalco Co., 8.25%, | | | | 11/1/31(1) | 1,000,000 | 815,000 |
| 5/15/17(1)(2) | 250,000 | 263,750 | | | | |
| | | | | | | 11,681,945 |
| | | 2,014,875 | | CONTAINERS & PACKAGING — 1.9% | |
| COMMERCIAL BANKS — 0.6% | | | Ball Corp., | | |
| Lloyds Banking Group plc, | | | | 6.875%, 12/15/12(2) | 1,000,000 | 1,012,500 |
| VRN, 6.66%, 5/21/37(1)(3) | 1,000,000 | 611,379 | | | | |
| | | | | Ball Corp., | | |
| Royal Bank of Scotland | | | | 6.625%, 3/15/18(2) | 250,000 | 241,875 |
| Group plc, VRN, | | | | Graham Packaging Co. | | |
| 7.64%, 9/29/17(3) | 1,000,000 | 490,575 | | | | |
| | | | | LP/GPC Capital Corp I, | | |
| | | 1,101,954 | | 8.50%, 10/15/12 | 750,000 | 761,250 |
30
| | | | | | |
| High-Yield | | | | | | |
| |
| |
| | Principal | | | | Principal | |
| | Amount | Value | | | Amount | Value |
| Graham Packaging Co. | | | | Wind Acquisition Finance | | |
| LP/GPC Capital Corp I, | | | | SA, 11.75%, 7/15/17(1) | $ 1,000,000 | $ 1,132,500 |
| 9.875%, 10/15/14 | $ 1,000,000 | $ 1,032,500 | | Windstream Corp., | | |
| Rock-Tenn Co., | | | | 8.625%, 8/1/16(2) | 875,000 | 899,063 |
| 9.25%, 3/15/16(2) | 750,000 | 806,250 | | | | 16,648,281 |
| | | 3,854,375 | | ELECTRIC UTILITIES — 1.6% | | |
| DIVERSIFIED — 0.3% | | | | Edison Mission Energy, | | |
| iShares iBoxx $ High Yield | | | | 7.00%, 5/15/17(2) | 1,300,000 | 1,092,000 |
| Corporate Bond Fund ETF | 6,400 | 552,640 | | Energy Future Holdings | | |
| DIVERSIFIED FINANCIAL SERVICES — 1.9% | | | Corp., 10.875%, 11/1/17(2) | 1,850,000 | 1,406,000 |
| BankAmerica Capital II, | | | | Texas Competitive | | |
| 8.00%, 12/15/26(2) | 900,000 | 882,000 | | Electric Holdings Co. LLC, | | |
| CIT Group, Inc., | | | | 10.25%, 11/1/15(2) | 1,000,000 | 725,000 |
| 5.40%, 3/7/13(2) | 1,500,000 | 962,709 | | | | 3,223,000 |
| Citigroup Capital XXI, VRN, | | | | ELECTRICAL EQUIPMENT — 0.9% | |
| 8.30%, 12/21/37(2) | 1,000,000 | 898,750 | | Baldor Electric Co., | | |
| KAR Holdings, Inc., | | | | 8.625%, 2/15/17(2) | 750,000 | 765,000 |
| 8.75%, 5/1/14(2) | 1,000,000 | 995,000 | | Belden, Inc., | | |
| | | 3,738,459 | | 9.25%, 6/15/19(1)(2) | 1,000,000 | 1,045,000 |
| DIVERSIFIED TELECOMMUNICATION | | | | | 1,810,000 |
| SERVICES — 8.3% | | | | ELECTRONIC EQUIPMENT, | | |
| Cincinnati Bell, Inc., | | | | INSTRUMENTS & COMPONENTS — 2.4% | |
| 8.375%, 1/15/14(2) | 950,000 | 959,500 | | Celestica, Inc., | | |
| Frontier Communications | | | | 7.625%, 7/1/13(2) | 1,500,000 | 1,533,750 |
| Corp., 6.25%, 1/15/13(2) | 575,000 | 566,375 | | Flextronics International | | |
| Frontier Communications | | | | Ltd., 6.50%, 5/15/13(2) | 500,000 | 490,000 |
| Corp., 7.125%, 3/15/19(2) | 600,000 | 568,500 | | Jabil Circuit, Inc., | | |
| Global Crossing Ltd., | | | | 7.75%, 7/15/16(2) | 600,000 | 612,000 |
| 12.00%, 9/15/15(1)(2) | 750,000 | 791,250 | | Sanmina-SCI Corp., | | |
| Intelsat Bermuda Ltd., | | | | 6.75%, 3/1/13(2) | 250,000 | 238,750 |
| 11.25%, 2/4/17(1)(7) | 1,000,000 | 997,500 | | Sanmina-SCI Corp., | | |
| Intelsat Jackson Holdings | | | | 8.125%, 3/1/16(2) | 2,000,000 | 1,880,000 |
| Ltd., 11.25%, 6/15/16(2) | 750,000 | 806,250 | | | | 4,754,500 |
| Intelsat Subsidiary Holding | | | | ENERGY EQUIPMENT & SERVICES — 0.3% | |
| Co. Ltd., 8.875%, 1/15/15(2) | 1,725,000 | 1,763,812 | | | | |
| | | | | Basic Energy Services, Inc., | | |
| Level 3 Financing, Inc., | | | | 11.625%, 8/1/14(1)(2) | 500,000 | 532,500 |
| 9.25%, 11/1/14 | 1,025,000 | 908,406 | | FOOD & STAPLES RETAILING — 1.7% | |
| MetroPCS Wireless, Inc., | | | | | | |
| 9.25%, 11/1/14(2) | 1,250,000 | 1,284,375 | | Ingles Markets, Inc., | | |
| | | | | 8.875%, 5/15/17(2) | 1,000,000 | 1,030,000 |
| Nordic Telephone Co. | | | | | | |
| Holdings ApS, | | | | 8.625%, Rite Aid Corp. 3/1/15 , (2) | 1,000,000 | 818,750 |
| 8.875%, 5/1/16(1)(2) | 675,000 | 702,000 | | | | |
| Qwest Capital Funding, Inc., | | | | Rite Aid Corp., | | |
| | | | | 7.50%, 3/1/17(2) | 750,000 | 663,750 |
| 7.25%, 2/15/11(2) | 750,000 | 753,750 | | | | |
| Qwest Corp., | | | | SUPERVALU, INC., | | |
| | | | | 7.50%, 11/15/14(2) | 550,000 | 555,500 |
| 8.375%, 5/1/16(1)(2) | 2,000,000 | 2,080,000 | | | | |
| Sprint Capital Corp., | | | | Susser Holdings LLC/Susser | | |
| 6.90%, 5/1/19(2) | 1,650,000 | 1,485,000 | | Finance Corp., | | |
| | | | | 10.625%, 12/15/13(2) | 250,000 | 259,375 |
| Sprint Capital Corp., | | | | | | 3,327,375 |
| 8.75%, 3/15/32(2) | 1,000,000 | 950,000 | | | | |
31
| | | | | | |
| High-Yield | | | | | | |
| |
| |
| | Principal | | | | Principal | |
| | Amount | Value | | | Amount | Value |
| FOOD PRODUCTS — 1.2% | | | | Harrah’s Operating Escrow | | |
| Smithfield Foods, Inc., | | | | LLC/Harrah’s Escrow Corp., | | |
| 7.75%, 5/15/13(2) | $ 750,000 $ | 671,250 | | 11.25%, 6/1/17(1)(2) | $ 1,000,000 | $ 1,032,500 |
| Smithfield Foods, Inc., | | | | MGM Mirage, | | |
| 10.00%, 7/15/14(1)(2) | 750,000 | 791,250 | | 8.50%, 9/15/10(2) | 500,000 | 498,750 |
| Smithfield Foods, Inc., | | | | MGM Mirage, | | |
| 7.75%, 7/1/17(2) | 1,100,000 | 910,250 | | 6.75%, 9/1/12(2) | 300,000 | 252,750 |
| | | 2,372,750 | | MGM Mirage, | | |
| | | | | 10.375%, 5/15/14(1)(2) | 250,000 | 268,125 |
| GAS UTILITIES — 0.5% | | | | | | |
| | | | | MGM Mirage, | | |
| MarkWest Energy Partners | | | | 7.625%, 1/15/17(2) | 750,000 | 588,750 |
| LP/MarkWest Energy | | | | | | |
| Finance Corp., | | | | Penn National Gaming, Inc., | | |
| 8.75%, 4/15/18(2) | 1,000,000 | 1,000,000 | | 8.75%, 8/15/19(1)(2) | 250,000 | 251,875 |
| HEALTH CARE EQUIPMENT & SUPPLIES — 1.9% | | Pinnacle Entertainment, | | |
| | | | | Inc., 8.25%, 3/15/12(2) | 323,000 | 324,615 |
| Biomet, Inc, | | | | | | |
| 10.00%, 10/15/17(2) | 600,000 | 642,000 | | Pinnacle Entertainment, | | |
| | | | | Inc., 7.50%, 6/15/15(2) | 750,000 | 667,500 |
| Biomet, Inc, | | | | | | |
| 11.625%, 10/15/17(2) | 1,500,000 | 1,642,500 | | Pinnacle Entertainment, | | |
| | | | | Inc., 8.625%, 8/1/17(1)(2) | 1,000,000 | 1,010,000 |
| Inverness Medical | | | | | | |
| Innovations, Inc., | | | | Starwood Hotels & | | |
| 9.00%, 5/15/16(2) | 1,500,000 | 1,494,375 | | Resorts Worldwide, Inc., | | |
| | | | | 6.75%, 5/15/18(2) | 600,000 | 569,250 |
| | | 3,778,875 | | | | |
| | | | | Wynn Las Vegas LLC/Wynn | | |
| HEALTH CARE PROVIDERS & SERVICES — 6.4% | | Las Vegas Capital Corp., | | |
| Community Health Systems, | | | | 6.625%, 12/1/14(2) | 500,000 | 485,000 |
| Inc., 8.875%, 7/15/15(2) | 1,400,000 | 1,438,500 | | | | |
| | | | | | | 7,791,615 |
| DaVita, Inc., | | | | HOUSEHOLD DURABLES — 2.9% | |
| 7.25%, 3/15/15(2) | 1,800,000 | 1,791,000 | | | | |
| HCA, Inc., 6.50%, 2/15/16(2) | 1,350,000 | 1,204,875 | | D.R. Horton, Inc., | | |
| | | | | 6.875%, 5/1/13(2) | 1,000,000 | 1,025,000 |
| HCA, Inc., 9.25%, | | | | Jarden Corp., 8.00%, 5/1/16 | 250,000 | 257,500 |
| 11/15/16(2) | 1,500,000 | 1,554,375 | | | | |
| | | | | K Hovnanian Enterprises, | | |
| HCA, Inc., 8.50%, | | | | Inc., 11.50%, 5/1/13(2) | 1,161,000 | 1,230,660 |
| 4/15/19(1)(2) | 1,000,000 | 1,050,000 | | | | |
| | | | | KB Home, | | |
| HealthSouth Corp., VRN, | | | | 6.375%, 8/15/11(2) | 209,000 | 212,135 |
| 7.22%, 12/15/09 | 500,000 | 492,500 | | | | |
| | | | | Meritage Homes Corp., | | |
| HealthSouth Corp., 10.75%, | | | | 7.00%, 5/1/14(2) | 1,250,000 | 1,178,125 |
| 6/15/16 | 1,250,000 | 1,362,500 | | | | |
| | | | | Sealy Mattress Co., | | |
| Omnicare, Inc., 6.875%, | | | | 10.875%, 4/15/16(1)(2) | 1,100,000 | 1,218,250 |
| 12/15/15(2) | 1,000,000 | 965,000 | | | | |
| | | | | Yankee Acquisition Corp., | | |
| Sun Healthcare Group, Inc., | | | | 8.50%, 2/15/15(2) | 700,000 | 661,500 |
| 9.125%, 4/15/15 | 750,000 | 750,000 | | | | |
| | | | | | | 5,783,170 |
| Tenet Healthcare Corp., | | | | | | |
| 8.875%, 7/1/19(1) | 2,000,000 | 2,120,000 | | INDEPENDENT POWER PRODUCERS | |
| | | | | & ENERGY TRADERS — 2.5% | | |
| | | 12,728,750 | | | | |
| | | | | AES Corp. (The), | | |
| HOTELS, RESTAURANTS & LEISURE — 3.9% | | | 8.75%, 5/15/13(1)(2) | 818,000 | 837,428 |
| Ameristar Casinos, Inc., | | | | AES Corp. (The), | | |
| 9.25%, 6/1/14(1)(2) | 1,000,000 | 1,042,500 | | 9.75%, 4/15/16(1)(2) | 500,000 | 547,500 |
| Harrah’s Operating Co., Inc., | | | | AES Corp. (The), | | |
| 10.00%, 12/15/18(1)(2) | 1,000,000 | 800,000 | | 8.00%, 10/15/17(2) | 750,000 | 758,438 |
32
| | | | | | |
| High-Yield | | | | | | |
| |
| |
| | Principal | | | | Principal | |
| | Amount | Value | | | Amount | Value |
| Dynegy Holdings, Inc., | | | | Harland Clarke Holdings | | |
| 7.75%, 6/1/19 | $ 1,000,000 | $ 857,500 | | Corp., VRN, 6.00%, | | |
| NRG Energy, Inc., | | | | 11/15/09, resets quarterly | | |
| 7.375%, 2/1/16(2) | 1,250,000 | 1,212,500 | | off the 3-month LIBOR plus | | |
| | | | | 4.75% with no caps(2) | $ 250,000 | $ 189,375 |
| RRI Energy, Inc., | | | | | | |
| 7.625%, 6/15/14(2) | 750,000 | 739,687 | | Harland Clarke Holdings | | |
| | | | | Corp., 9.50%, 5/15/15(2) | 2,500,000 | 2,250,000 |
| | | 4,953,053 | | | | |
| | | | | Interpublic Group | | |
| INSURANCE — 1.9% | | | | of Cos., Inc. (The), | | |
| Fairfax Financial Holdings | | | | 6.25%, 11/15/14(2) | 1,000,000 | 951,250 |
| Ltd., 7.75%, 6/15/17(2) | 675,000 | 664,875 | | | | |
| | | | | Interpublic Group | | |
| International Lease Finance | | | | of Cos., Inc. (The), | | |
| Corp., 5.30%, 5/1/12(2) | 1,250,000 | 1,051,255 | | 10.00%, 7/15/17(1)(2) | 1,250,000 | 1,356,250 |
| Liberty Mutual Group, Inc., | | | | Mediacom LLC/Mediacom | | |
| VRN, 10.75%, 6/15/38(1)(2) | 2,250,000 | 2,171,250 | | Capital Corp., | | |
| | | 3,887,380 | | 9.125%, 8/15/19(1)(2) | 500,000 | 516,250 |
| IT SERVICES — 2.7% | | | | Nielsen Finance | | |
| First Data Corp., | | | | LLC/Nielsen Finance Co., | | |
| 9.875%, 9/24/15(2) | 1,250,000 | 1,160,938 | | 11.50%, 5/1/16(2) | 750,000 | 791,250 |
| First Data Corp., | | | | Sirius XM Radio, Inc., | | |
| 11.25%, 3/31/16 | 1,000,000 | 865,000 | | 9.625%, 8/1/13(2) | 1,000,000 | 912,500 |
| SunGard Data Systems, Inc., | | | | Sirius XM Radio, Inc., | | |
| 9.125%, 8/15/13(2) | 1,450,000 | 1,471,750 | | 9.75%, 9/1/15(1)(2) | 500,000 | 512,500 |
| SunGard Data Systems, Inc., | | | | tw telecom holdings inc, | | |
| 10.25%, 8/15/15(2) | 850,000 | 871,250 | | 9.25%, 2/15/14 | 1,000,000 | 1,035,000 |
| Unisys Corp., | | | | Valassis Communications, | | |
| 14.25%, 9/15/15(1)(2) | 1,000,000 | 1,035,000 | | Inc., 8.25%, 3/1/15(2) | 3,500,000 | 3,154,375 |
| | | 5,403,938 | | Videotron Ltee, | | |
| | | | | 9.125%, 4/15/18(1)(2) | 250,000 | 271,875 |
| MACHINERY — 0.7% | | | | | | |
| | | | | Videotron Ltee, | | |
| RBS Global, Inc./Rexnord | | | | 9.125%, 4/15/18(2) | 750,000 | 815,625 |
| LLC, 9.50%, 8/1/14(2) | 850,000 | 828,750 | | | | |
| | | | | Virgin Media Finance plc, | | |
| SPX Corp., 7.625%, | | | | 9.50%, 8/15/16(2) | 2,700,000 | 2,855,250 |
| 12/15/14(2) | 650,000 | 658,125 | | | | |
| | | | | WMG Acquisition Corp., | | |
| | | 1,486,875 | | 9.50%, 6/15/16(1) | 750,000 | 795,000 |
| MEDIA — 11.4% | | | | | | 22,698,495 |
| AMC Entertainment, Inc., | | | | METALS & MINING — 2.6% | | |
| 8.00%, 3/1/14 | 1,000,000 | 970,000 | | | | |
| | | | | AK Steel Corp., | | |
| Cablevision Systems Corp., | | | | 7.75%, 6/15/12(2) | 650,000 | 655,687 |
| 8.00%, 4/15/12(2) | 700,000 | 733,250 | | | | |
| | | | | Freeport-McMoRan | | |
| CCH I LLC/CCH I Capital | | | | Copper & Gold, Inc., | | |
| Corp., 11.00%, 10/1/15(4)(5) | 1,298,000 | 246,620 | | 8.25%, 4/1/15(2) | 300,000 | 319,477 |
| Cengage Learning | | | | Freeport-McMoRan | | |
| Acquisitions, Inc., | | | | Copper & Gold, Inc., | | |
| 10.50%, 1/15/15(1) | 600,000 | 570,000 | | 8.375%, 4/1/17(2) | 1,000,000 | 1,065,233 |
| Cinemark USA, Inc., | | | | Novelis, Inc., | | |
| 8.625%, 6/15/19(1)(2) | 700,000 | 727,125 | | 7.25%, 2/15/15(2) | 1,000,000 | 870,000 |
| CSC Holdings, Inc., | | | | Teck Resources Ltd., | | |
| 8.50%, 4/15/14(1)(2) | 1,000,000 | 1,055,000 | | 10.25%, 5/15/16(2) | 500,000 | 567,500 |
| DISH DBS Corp., | | | | Teck Resources Ltd., | | |
| 7.00%, 10/1/13(2) | 1,000,000 | 1,012,500 | | 10.75%, 5/15/19(2) | 1,500,000 | 1,751,250 |
| Gannett Co., Inc., | | | | | | 5,229,147 |
| 9.375%, 11/15/17(1)(6) | 1,000,000 | 977,500 | | | | |
33
| | | | | | |
| High-Yield | | | | | | |
| |
| |
| | Principal | | | | Principal | |
| | Amount | Value | | | Amount | Value |
| MULTILINE RETAIL — 0.6% | | | | PAPER & FOREST PRODUCTS — 2.2% | |
| Macy’s Retail Holdings, Inc., | | | | Boise Cascade LLC, | | |
| 5.90%, 12/1/16(2) | $ 1,250,000 | $ 1,151,750 | | 7.125%, 10/15/14(2) | $ 149,000 | $ 119,200 |
| OIL, GAS & CONSUMABLE FUELS — 9.9% | | | Domtar Corp., | | |
| Arch Coal, Inc., | | | | 9.50%, 8/1/16(2) | 1,000,000 | 1,057,500 |
| 8.75%, 8/1/16(1)(2) | 500,000 | 517,500 | | Georgia-Pacific LLC, | | |
| Bill Barrett Corp., | | | | 7.70%, 6/15/15(2) | 1,100,000 | 1,116,500 |
| 9.875%, 7/15/16(2) | 750,000 | 793,125 | | Georgia-Pacific LLC, | | |
| Chesapeake Energy Corp., | | | | 8.25%, 5/1/16(1)(2) | 500,000 | 521,250 |
| 7.625%, 7/15/13(2) | 250,000 | 249,688 | | Georgia-Pacific LLC, | | |
| Chesapeake Energy Corp., | | | | 7.125%, 1/15/17(1)(2) | 150,000 | 147,375 |
| 7.50%, 6/15/14(2) | 600,000 | 596,250 | | NewPage Corp., | | |
| Chesapeake Energy Corp., | | | | 11.375%, 12/31/14(1) | 500,000 | 493,750 |
| 9.50%, 2/15/15(2) | 1,000,000 | 1,057,500 | | Verso Paper Holdings | | |
| Cimarex Energy Co., | | | | LLC/Verso Paper, Inc., | | |
| 7.125%, 5/1/17(2) | 750,000 | 701,250 | | 9.125%, 8/1/14(2) | 1,250,000 | 931,250 |
| Denbury Resources, Inc., | | | | | | 4,386,825 |
| 9.75%, 3/1/16(2) | 1,000,000 | 1,067,500 | | REAL ESTATE INVESTMENT TRUSTS (REITs) — 1.1% |
| El Paso Corp., | | | | Host Hotels & Resorts LP, | | |
| 7.75%, 6/15/10(2) | 800,000 | 807,206 | | 7.00%, 8/15/12(2) | 400,000 | 405,500 |
| El Paso Corp., | | | | Host Hotels & Resorts LP, | | |
| 7.875%, 6/15/12(2) | 1,000,000 | 1,034,641 | | 6.75%, 6/1/16(2) | 1,000,000 | 955,000 |
| El Paso Corp., | | | | ProLogis, 7.625%, 8/15/14(2) | 750,000 | 767,552 |
| 6.875%, 6/15/14(2) | 1,000,000 | 985,312 | | | | 2,128,052 |
| Encore Acquisition Co., | | | | REAL ESTATE MANAGEMENT | | |
| 9.50%, 5/1/16(2) | 750,000 | 795,000 | | & DEVELOPMENT — 0.4% | | |
| Forest Oil Corp., | | | | CB Richard Ellis Services, | | |
| 8.00%, 12/15/11(2) | 500,000 | 510,000 | | Inc., 11.625%, 6/15/17(1)(2) | 800,000 | 868,000 |
| Forest Oil Corp., | | | | SEMICONDUCTORS & | | |
| 8.50%, 2/15/14(1)(2) | 900,000 | 911,250 | | SEMICONDUCTOR EQUIPMENT — 1.4% | |
| Forest Oil Corp., | | | | Advanced Micro Devices, | | |
| 7.75%, 5/1/14(2) | 650,000 | 640,250 | | Inc., 7.75%, 11/1/12 | 2,000,000 | 1,805,000 |
| Inergy LP/Inergy Finance | | | | Amkor Technology, Inc., | | |
| Corp., 8.25%, 3/1/16(2) | 1,000,000 | 1,010,000 | | 9.25%, 6/1/16(2) | 250,000 | 258,750 |
| Massey Energy Co., | | | | Freescale Semiconductor, | | |
| 6.875%, 12/15/13(2) | 1,500,000 | 1,455,000 | | Inc., 8.875%, 12/15/14(2) | 1,000,000 | 770,000 |
| OPTI Canada, Inc., | | | | | | 2,833,750 |
| 7.875%, 12/15/14(2) | 1,325,000 | 1,020,250 | | | | |
| | | | | SPECIALTY RETAIL — 3.3% | | |
| Peabody Energy Corp., | | | | | | |
| 7.375%, 11/1/16(2) | 500,000 | 507,500 | | Asbury Automotive Group, | | |
| | | | | Inc., 8.00%, 3/15/14(2) | 750,000 | 701,250 |
| Petrohawk Energy Corp., | | | | | | |
| 7.875%, 6/1/15(2) | 1,800,000 | 1,782,000 | | Asbury Automotive Group, | | |
| | | | | Inc., 7.625%, 3/15/17(2) | 250,000 | 222,500 |
| Range Resources Corp., | | | | | | |
| 7.375%, 7/15/13(2) | 500,000 | 506,250 | | Burlington Coat Factory | | |
| | | | | Warehouse Corp., | | |
| Sabine Pass LNG LP, | | | | 11.125%, 4/15/14(2) | 1,000,000 | 985,000 |
| 7.25%, 11/30/13(2) | 1,550,000 | 1,391,125 | | | | |
| | | | | Couche-Tard US LP/Couche- | | |
| Sabine Pass LNG LP, | | | | Tard Finance Corp., | | |
| 7.50%, 11/30/16(2) | 750,000 | 644,062 | | 7.50%, 12/15/13(2) | 1,000,000 | 1,016,250 |
| Southwestern Energy Co., | | | | GSC Holdings Corp., | | |
| 7.50%, 2/1/18(2) | 700,000 | 710,500 | | 8.00%, 10/1/12(2) | 540,000 | 560,250 |
| | | 19,693,159 | | | | |
34
| | | | | | |
| High-Yield | | | | | | |
| |
| |
| | Principal | | | | Principal | |
| | Amount | Value | | | Amount | Value |
| Michaels Stores, Inc., | | | | Nextel Communications, | | |
| 10.00%, 11/1/14(2) | $ 425,000 | $ 420,750 | | Inc., 6.875%, 10/31/13(2) | $ 1,000,000 | $ 932,500 |
| Michaels Stores, Inc., | | | | Syniverse Technologies, Inc., | | |
| 11.375%, 11/1/16(2) | 750,000 | 705,000 | | 7.75%, 8/15/13(2) | 300,000 | 279,375 |
| Toys “R” Us Property Co. I | | | | | | 2,793,625 |
| LLC, 10.75%, 7/15/17(1) | 1,000,000 | 1,080,000 | | TOTAL CORPORATE BONDS | | |
| Toys “R” Us, Inc., | | | | (Cost $176,718,645) | | 189,328,993 |
| 7.375%, 10/15/18(2) | 1,000,000 | 875,000 | | | | |
| | | 6,566,000 | | | Shares | |
| TEXTILES, APPAREL & LUXURY GOODS — 1.1% | | Preferred Stocks(8) | | |
| Hanesbrands, Inc., VRN, | | | | CONSUMER FINANCE(8) | | |
| 4.59%, 12/15/09, resets | | | | Preferred Blocker, Inc. | | |
| semiannually off the | | | | (GMAC LLC), 7.00%, | | |
| 6-month LIBOR plus | | | | 12/31/11(1)(3) | | |
| 3.375% with no caps(2) | 850,000 | 750,125 | | | | |
| | | | | (Cost $164,281) | 175 | 101,779 |
| Perry Ellis International, Inc., | | | | | | |
| 8.875%, 9/15/13(2) | 1,575,000 | 1,527,750 | | Temporary Cash Investments — 3.8% |
| | | 2,277,875 | | JPMorgan U.S. Treasury | | |
| TRADING COMPANIES & DISTRIBUTORS — 1.3% | | Plus Money Market Fund | | |
| | | | | Agency Shares(2) | 478 | 478 |
| Ashtead Capital, Inc., | | | | | | |
| 9.00%, 8/15/16(1)(2) | 675,000 | 651,375 | | Repurchase Agreement, Bank of America | |
| | | | | Securities, LLC, (collateralized by various | |
| RSC Equipment Rental, Inc., | | | | U.S. Treasury obligations, 0.270%, 7/15/10, | |
| 9.50%, 12/1/14(2) | 1,750,000 | 1,697,500 | | | | |
| | | | | valued at $7,761,841), in a joint trading | |
| RSC Equipment Rental, Inc., | | | | account at 0.02%, dated 9/30/09, due | |
| 10.00%, 7/15/17(1)(2) | 250,000 | 270,000 | | 10/1/09 (Delivery value $7,609,004) | 7,609,000 |
| | | 2,618,875 | | TOTAL TEMPORARY | | |
| WIRELESS TELECOMMUNICATION SERVICES — 1.4% | | CASH INVESTMENTS | | |
| CC Holdings GS V LLC/ | | | | (Cost $7,609,478) | | 7,609,478 |
| Crown Castle GS III Corp., | | | | TOTAL INVESTMENT | | |
| 7.75%, 5/1/17(1)(2) | 500,000 | 520,000 | | SECURITIES — 98.7% | | |
| Cricket Communications, | | | | (Cost $184,492,404) | | 197,040,250 |
| Inc., 9.375%, 11/1/14(2) | 525,000 | 535,500 | | OTHER ASSETS | | |
| Crown Castle International | | | | AND LIABILITIES — 1.3% | | 2,522,182 |
| Corp., 9.00%, 1/15/15(2) | 500,000 | 526,250 | | TOTAL NET ASSETS — 100.0% | $199,562,432 |
35
| | | |
| High-Yield | | |
| |
| Swap Agreements | | |
| Notional Amount Description of Agreement | Premiums Paid (Received) | Value |
| CREDIT DEFAULT — SELL PROTECTION | | |
| | $1,740,000 Receive quarterly a fixed rate equal to 5.00% | | |
| | multiplied by the notional amount and pay | | |
| | Barclays Bank plc upon each default event of | | |
| | one of the issues of CDX North America High | | |
| | Yield 11 Index, par value of the proportional | | |
| | notional amount. Expires December 2013.* | $(311,168) | $(88,574) |
| * The maximum potential amount the fund could be required to deliver as a seller of credit protection if a credit event occurs as defined under the |
| terms of the agreement is the notional amount. The maximum potential amount may be partially offset by any recovery values of the referenced |
| obligations and upfront payments received upon entering into the agreement. | | |
| The quoted market prices and resulting market value for credit default swap agreements on credit indices serve as an indicator of the current |
| status of the payment/performance risk and represent the likelihood of an expected liability or profit at the period end. Increasing market values |
| in absolute terms when compared to the notional amount of the credit default swap agreement represent a deterioration of the referenced entity’s |
| credit soundness and an increased likelihood or risk of a credit event occurring as defined in the agreement. | |
| |
| Notes to Schedule of Investments | | |
| CDX = Credit Derivative Indexes | | |
| ETF = Exchange Traded Fund | | |
| GMAC = General Motors Acceptance Corporation | | |
| LIBOR = London Interbank Offered Rate | | |
| PIK = Payment in Kind | | |
| resets = The frequency with which a security’s coupon changes, based on current market conditions or an underlying index. The more frequently a |
| security resets, the less risk the investor is taking that the coupon will vary significantly from current market rates. | |
| VRN = Variable Rate Note. Interest reset date is indicated. Rate shown is effective at the period end. | |
| (1) | Security was purchased under Rule 144A of the Securities Act of 1933 or is a private placement and, unless registered under the Act or |
| | exempted from registration, may only be sold to qualified institutional investors. The aggregate value of these securities at the period end was |
| | $40,541,961, which represented 20.3% of total net assets. None of the restricted securities are considered to be illiquid. | |
| (2) | Security, or a portion thereof, has been segregated for when-issued securities and/or swap agreements. At the period end, the aggregate value |
| | of securities pledged was $2,718,000. | | |
| (3) | Perpetual security. These securities do not have a predetermined maturity date. The coupon rates are fixed for a period of time and may be |
| | structured to adjust thereafter. Interest reset or next call date is indicated, as applicable. | |
| (4) | Security is in default. | | |
| (5) | Non-income producing. | | |
| (6) | When-issued security. | | |
| (7) | Step-coupon security. These securities are issued with a zero-coupon and become interest bearing at a predetermined rate and date and are |
| | issued at a substantial discount from their value at maturity. Interest reset or final maturity date is indicated, as applicable. Rate shown is |
| | effective at the period end. | | |
| (8) | Category is less than 0.05% of total net assets. | | |
| |
| |
| See Notes to Financial Statements. | | |
36
|
| Statement of Assets and Liabilities |
| | |
| SEPTEMBER 30, 2009 (UNAUDITED) | | |
| | Diversified Bond | High-Yield |
| Assets | | |
| Investment securities, at value (cost of $2,641,366,636 and $184,492,404, respectively) | $2,738,620,608 | $197,040,250 |
| Receivable for investments sold | 2,688,897 | 1,586,627 |
| Receivable for capital shares sold | 10,479,581 | 371,396 |
| Receivable for forward foreign currency exchange contracts | 116,874 | — |
| Receivable for swap agreements, at value | 184,600 | — |
| Dividends and interest receivable | 19,409,183 | 4,472,480 |
| | $2,771,499,743 | $203,470,753 |
| |
| Liabilities | | |
| Payable for investments purchased | 50,884,031 | 2,765,223 |
| Payable for capital shares redeemed | 3,408,688 | 247,139 |
| Payable for swap agreements, at value (including premiums paid (received) | | |
| of $– and $(311,168), respectively) | — | 88,574 |
| Accrued management fees | 1,110,282 | 109,781 |
| Distribution fees payable | 107,993 | 6,654 |
| Service fees (and distribution fees — A Class and R Class) payable | 173,462 | 7,658 |
| Dividends payable | 1,707,124 | 683,292 |
| | 57,391,580 | 3,908,321 |
| |
| Net Assets | $2,714,108,163 | $199,562,432 |
| |
| |
| See Notes to Financial Statements. | | |
37
| | |
| SEPTEMBER 30, 2009 (UNAUDITED) | | |
| | Diversified Bond | High-Yield |
| Net Assets Consist of: | | |
| Capital paid in | $2,614,809,371 | $207,457,538 |
| Accumulated net investment loss | (1,662,218) | (77,684) |
| Accumulated undistributed net realized gain (loss) on investment | | |
| and foreign currency transactions | 3,406,014 | (20,587,861) |
| Net unrealized appreciation on investments and translation of assets | | |
| and liabilities in foreign currencies | 97,554,996 | 12,770,439 |
| | $2,714,108,163 | $199,562,432 |
| | | |
| Investor Class | | |
| Net assets | $1,179,420,317 | $101,970,582 |
| Shares outstanding | 110,683,705 | 18,101,435 |
| Net asset value per share | $10.66 | $5.63 |
| | | |
| Institutional Class | | |
| Net assets | $681,997,745 | $58,485,215 |
| Shares outstanding | 64,009,366 | 10,380,190 |
| Net asset value per share | $10.65 | $5.63 |
| | | |
| A Class | | |
| Net assets | $660,275,699 | $26,932,099 |
| Shares outstanding | 61,957,742 | 4,780,463 |
| Net asset value per share | $10.66 | $5.63 |
| Maximum offering price (net asset value divided by 0.955) | $11.16 | $5.90 |
| | | |
| B Class | | |
| Net assets | $15,227,596 | $1,404,244 |
| Shares outstanding | 1,429,229 | 249,215 |
| Net asset value per share | $10.65 | $5.63 |
| | | |
| C Class | | |
| Net assets | $167,029,545 | $9,962,360 |
| Shares outstanding | 15,673,474 | 1,768,195 |
| Net asset value per share | $10.66 | $5.63 |
| |
| R Class | | |
| Net assets | $10,157,261 | $807,932 |
| Shares outstanding | 953,158 | 143,365 |
| Net asset value per share | $10.66 | $5.64 |
| |
| |
| See Notes to Financial Statements. | | |
38
| | |
| FOR THE SIX MONTHS ENDED SEPTEMBER 30, 2009 (UNAUDITED) | | |
| | Diversified Bond | High-Yield |
| Investment Income (Loss) | | |
| Income: | | |
| Interest (net of foreign taxes withheld of $15,002 and $– , respectively) | $ 44,324,753 | $ 7,597,155 |
| Securities lending, net | 11,850 | 4,760 |
| Dividends | — | 19,797 |
| | 44,336,603 | 7,621,712 |
| | | |
| Expenses: | | |
| Management fees | 6,202,278 | 671,904 |
| Distribution fees: | | |
| B Class | 44,652 | 4,890 |
| C Class | 485,566 | 25,865 |
| Service fees: | | |
| B Class | 14,884 | 1,630 |
| C Class | 161,855 | 8,622 |
| Distribution and service fees: | | |
| A Class | 703,140 | 25,915 |
| R Class | 19,059 | 1,209 |
| Trustees’ fees and expenses | 42,682 | 3,386 |
| Other expenses | 3,325 | 10 |
| | 7,677,441 | 743,431 |
| Fees waived | (211,940) | (67,989) |
| | 7,465,501 | 675,442 |
| | | |
| Net investment income (loss) | 36,871,102 | 6,946,270 |
| | | |
| Realized and Unrealized Gain (Loss) | | |
| Net realized gain (loss) on: | | |
| Investment transactions | 8,394,305 | 484,463 |
| Swap agreement transactions | (4,541) | (51,819) |
| Foreign currency transactions | (79,627) | — |
| | 8,310,137 | 432,644 |
| | | |
| Change in net unrealized appreciation (depreciation) on: | | |
| Investments | 76,183,988 | 26,805,386 |
| Swap agreements | (321,324) | 396,913 |
| Translation of assets and liabilities in foreign currencies | 116,424 | — |
| | 75,979,088 | 27,202,299 |
| | | |
| Net realized and unrealized gain (loss) | 84,289,225 | 27,634,943 |
| | | |
| Net Increase (Decrease) in Net Assets Resulting from Operations | $121,160,327 | $34,581,213 |
| |
| |
| See Notes to Financial Statements. | | |
39
|
| Statement of Changes in Net Assets |
| | | | |
| SIX MONTHS ENDED SEPTEMBER 30, 2009 (UNAUDITED) AND YEAR ENDED MARCH 31, 2009 | |
| | Diversified Bond | High-Yield |
| Increase (Decrease) in Net Assets | September 30, 2009 | March 31, 2009 | September 30, 2009 | March 31, 2009 |
| Operations | | | | |
| Net investment income (loss) | $ 36,871,102 | $ 36,935,008 | $ 6,946,270 | $ 7,086,971 |
| Net realized gain (loss) | 8,310,137 | 1,018,197 | 432,644 | (9,249,998) |
| Change in net unrealized | | | | |
| appreciation (depreciation) | 75,979,088 | 7,877,699 | 27,202,299 | (8,834,064) |
| Net increase (decrease) in net assets | | | | |
| resulting from operations | 121,160,327 | 45,830,904 | 34,581,213 | (10,997,091) |
| | | | | |
| Distributions to Shareholders | | | | |
| From net investment income: | | | | |
| Investor Class | (17,925,402) | (26,269,224) | (3,734,886) | (4,367,814) |
| Institutional Class | (9,101,236) | (9,427,151) | (2,110,685) | (2,466,998) |
| A Class | (9,430,977) | (4,306,046) | (847,935) | (690,365) |
| B Class | (155,321) | (73,696) | (48,112) | (76,074) |
| C Class | (1,690,686) | (610,385) | (259,416) | (132,606) |
| R Class | (118,296) | (20,715) | (19,647) | (2,391) |
| From net realized gains: | | | | |
| Investor Class | — | (6,771,460) | — | — |
| Institutional Class | — | (2,441,333) | — | — |
| A Class | — | (1,868,343) | — | — |
| B Class | — | (25,182) | — | — |
| C Class | — | (295,768) | — | — |
| R Class | — | (2,084) | — | — |
| Decrease in net assets from distributions | (38,421,918) | (52,111,387) | (7,020,681) | (7,736,248) |
| | | | | |
| Capital Share Transactions | | | | |
| Net increase (decrease) in net assets | | | | |
| from capital share transactions | 1,041,729,919 | 865,533,368 | 41,218,964 | 62,246,890 |
| | | | | |
| | | | | |
| Net increase (decrease) in net assets | 1,124,468,328 | 859,252,885 | 68,779,496 | 43,513,551 |
| | | | | |
| Net Assets | | | | |
| Beginning of period | 1,589,639,835 | 730,386,950 | 130,782,936 | 87,269,385 |
| End of period | $2,714,108,163 | $1,589,639,835 | $199,562,432 | $130,782,936 |
| | | | | |
| Accumulated net investment loss | $(1,662,218) | $(111,402) | $(77,684) | $(3,273) |
| |
| |
| See Notes to Financial Statements. | | | | |
40
|
| Notes to Financial Statements |
SEPTEMBER 30, 2009 (UNAUDITED)
1. Organization and Summary of Significant Accounting Policies
Organization — American Century Investment Trust (the trust) is registered under the Investment Company Act of 1940 (the 1940 Act) as an open-end management investment company. Diversified Bond Fund (Diversified Bond) and High-Yield Fund (High-Yield) (the funds) are two funds in a series issued by the trust. The funds are diversified under the 1940 Act. Diversified Bond’s investment objective is to seek a high level of income by investing in non-money market debt securities. High-Yield’s investment objective is to seek high current income by investing in high-yield corporate bonds and other debt securities. High-Yield invests primarily in lower-rated debt securities, which are subject to greater credit risk and consequently offer higher yields. The following is a summary of the funds’ significant accounting policies.
Multiple Class — The funds are authorized to issue the Investor Class, the Institutional Class, the A Class, the B Class, the C Class and the R Class. The A Class may incur an initial sales charge. The A Class, B Class and C Class may be subject to a contingent deferred sales charge. The share classes differ principally in their respective sales charges and distribution and shareholder servicing expenses and arrangements. All shares of the funds represent an equal pro rata interest in the net assets of the class to which such shares belong, and have identical voting, dividend, liquidation and other rights and the same terms and conditions, except for class specific expenses and exclusive rights to vote on matters affecting only individual classes. Income, non-class specific expenses, and realized and unrealized capital gains and losses of the funds are allocated to each class of shares based on their relative net assets.
Security Valuations — Debt securities maturing in greater than 60 days at the time of purchase are valued at current market value as provided by a commercial pricing service or at the mean of the most recent bid and asked prices. Debt securities maturing within 60 days at the time of purchase may be valued at cost, plus or minus any amortized discount or premium. Discount notes may be valued through a commercial pricing service or at amortized cost, which approximates fair value. Investments in open-end management investment companies are valued at the reported net asset value. Securities traded primarily on a principal securities exchange are valued at the last reported sales price, or at the mean of the latest bid and asked prices where no last sales price is available. Depending on local convention or regulation, securities traded over- the-counter are valued at the mean of the latest bid and asked prices, the last sales price, or the official close price. Securities traded on foreign securities exchanges and over-the-counter markets are normally completed before the close of business on days that the New York Stock Exchange (the Exchange) is open and may also take place on days when the Exchange is not open. If an event occurs after the value of a security was established but before the net asset value per share was determined that was likely to materially change the net asset value, that security would be valued as determined in accordance with procedures adopted by the Board of Trustees. If the funds determine that the market price of a portfolio security is not readily available, or that the valuation methods mentioned above do not reflect the security’s fair value, such security is valued as determined by the Board of Trustees or its designee, in accordance with procedures adopted by the Board of Trustees, if such determination wo uld materially impact a fund’s net asset value. Certain other circumstances may cause the funds to use alternative procedures to value a security such as: a security has been declared in default; trading in a security has been halted during the trading day; or there is a foreign market holiday and no trading will commence.
Security Transactions — For financial reporting purposes, security transactions are accounted for as of the trade date. Net realized gains and losses are determined on the identified cost basis, which is also used for federal income tax purposes.
Investment Income — Interest income less foreign taxes withheld, if any, is recorded on the accrual basis and includes paydown gain (loss) and accretion of discounts and amortization of premiums.
41
Securities on Loan — The funds may lend portfolio securities through their lending agent to certain approved borrowers in order to earn additional income. The income earned, net of any rebates or fees, is included in the Statement of Operations. The funds continue to recognize any gain or loss in the market price of the securities loaned and record any interest earned or dividends declared.
Foreign Currency Translations — All assets and liabilities initially expressed in foreign currencies are translated into U.S. dollars at prevailing exchange rates at period end. The funds may enter into spot foreign currency exchange contracts to facilitate transactions denominated in a foreign currency. Purchases and sales of investment securities, dividend and interest income, spot foreign currency exchange contracts, and certain expenses are translated at the rates of exchange prevailing on the respective dates of such transactions. For assets and liabilities, other than investments in securities, net realized and unrealized gains and losses from foreign currency translations arise from changes in currency exchange rates.
Net realized and unrealized foreign currency exchange gains or losses occurring during the holding period of investment securities are a component of realized gain (loss) on investment transactions and unrealized appreciation (depreciation) on investments, respectively. Certain countries may impose taxes on the contract amount of purchases and sales of foreign currency contracts in their currency. The funds record the foreign tax expense, if any, as a reduction to the net realized gain (loss) on foreign currency transactions.
When-Issued and Forward Commitments — The funds may engage in securities transactions on a when-issued or forward commitment basis. In these transactions, the securities’ prices and yields are fixed on the date of the commitment. In a when-issued transaction, the payment and delivery are scheduled for a future date and during this period, securities are subject to market fluctuations. In a forward commitment transaction, the funds may sell a security and at the same time make a commitment to purchase the same security at a future date at a specified price. Conversely, the funds may purchase a security and at the same time make a commitment to sell the same security at a future date at a specified price. These types of transactions are executed simultaneously in what are known as “roll” transactions. The funds will segre gate cash, cash equivalents or other appropriate liquid securities on its records in amounts sufficient to meet the purchase price. The funds accounts for “roll” transactions as purchases and sales; as such these transactions may increase portfolio turnover.
Repurchase Agreements — The funds may enter into repurchase agreements with institutions that American Century Investment Management, Inc. (ACIM) (the investment advisor) has determined are creditworthy pursuant to criteria adopted by the Board of Trustees. Each repurchase agreement is recorded at cost. Each fund requires that the collateral, represented by securities, received in a repurchase transaction be transferred to the custodian in a manner sufficient to enable each fund to obtain those securities in the event of a default under the repurchase agreement. ACIM monitors, on a daily basis, the securities transferred to ensure the value, including accrued interest, of the securities under each repurchase agreement is equal to or greater than amounts owed to each fund under each repurchase agreement.
Joint Trading Account — Pursuant to an Exemptive Order issued by the Securities and Exchange Commission, each fund, along with certain other funds in the American Century Investments family of funds, may transfer uninvested cash balances into a joint trading account. These balances are invested in one or more repurchase agreements that are collateralized by U.S. Treasury or Agency obligations.
Income Tax Status — It is each fund’s policy to distribute substantially all net investment income and net realized gains to shareholders and to otherwise qualify as a regulated investment company under provisions of the Internal Revenue Code. The funds are no longer subject to examination by tax authorities for years prior to 2006. At this time, management believes there are no uncertain tax positions which, based on their technical merit, would not be sustained upon examination and for which it is reasonably possible that the total amounts of unrecognized tax benefits will significantly change in the next twelve months. Accordingly, no provision has been made for federal or state income taxes. Interest and penalties associated with any federal or state income tax obligations, if any, are recorded as interest expense.
42
Distributions to Shareholders — Distributions from net investment income for the funds are declared daily and paid monthly. Distributions from net realized gains for the funds, if any, are generally declared and paid annually.
Indemnifications — Under the trust’s organizational documents, its officers and trustees are indemnified against certain liabilities arising out of the performance of their duties to the funds. In addition, in the normal course of business, the funds enter into contracts that provide general indemnifications. The maximum exposure under these arrangements is unknown as this would involve future claims that may be made against a fund. The risk of material loss from such claims is considered by management to be remote.
Use of Estimates — The financial statements are prepared in conformity with accounting principles generally accepted in the United States of America, which may require management to make certain estimates and assumptions at the date of the financial statements. Actual results could differ from these estimates.
Subsequent Events — Management has evaluated events or transactions that may have occurred since September 30, 2009, that would merit recognition or disclosure in the financial statements. This evaluation was completed through November 27, 2009, the date the financial statements were issued.
2. Fees and Transactions with Related Parties
Management Fees — The trust has entered into a Management Agreement with ACIM, under which ACIM provides the funds with investment advisory and management services in exchange for a single, unified management fee (the fee) per class. The Agreement provides that all expenses of the funds, except brokerage commissions, taxes, interest, fees and expenses of those trustees who are not considered “interested persons” as defined in the 1940 Act (including counsel fees) and extraordinary expenses, will be paid by ACIM.
The fee is computed and accrued daily based on the daily net assets of each specific class of shares of each fund and paid monthly in arrears. The fee consists of (1) an Investment Category Fee based on the daily net assets of the funds and certain other accounts managed by the investment advisor that are in the same broad investment category as each fund and (2) a Complex Fee based on the assets of all the funds in the American Century Investments family of funds. The rates for the Investment Category Fee range from 0.2925% to 0.4100% for Diversified Bond and from 0.5425% to 0.6600% for High-Yield. The rates for the Complex Fee (Investor Class, A Class, B Class, C Class and R Class) range from 0.2500% to 0.3100%. The Institutional Class is 0.2000% less at each point within the Complex Fee range. Effective August 1, 2009, the investment advisor voluntarily agreed to waive 0.049% of its management fee for Diversified Bond. The t otal amount of the waiver for Diversified Bond was $91,397, $53,922, $52,018, $1,176, $12,660 and $767 for the Investor Class, Institutional Class, A Class, B Class, C Class and R Class, respectively. From April 1, 2009 to July 31, 2009, the investment advisor voluntarily agreed to waive 0.07% of its management fee for High-Yield. Effective August 1, 2009, the investment advisor voluntarily agreed to waive 0.10% of its management fee for High-Yield. The total amount of the waiver for High-Yield was $36,031, $19,914, $8,450, $523, $2,865, and $206 for the Investor Class, Institutional Class, A Class, B Class, C Class, and R Class, respectively. The investment advisor expects these fee waivers to continue for one year and cannot terminate them without consulting the Board of Trustees.
The effective annual management fee for each class of each fund for the six months ended September 30, 2009, was as follows:
| | |
| | Investor, A, B, C & R | Institutional |
| Diversified Bond (before waiver) | 0.61% | 0.41% |
| Diversified Bond (after waiver) | 0.59% | 0.39% |
| High-Yield (before waiver) | 0.86% | 0.66% |
| High-Yield (after waiver) | 0.78% | 0.58% |
43
Distribution and Service Fees — The Board of Trustees has adopted a separate Master Distribution and Individual Shareholder Services Plan for each of the A Class, B Class, C Class and R Class (collectively the plans), pursuant to Rule 12b-1 of the 1940 Act. The plans provide that the A Class will pay American Century Investment Services, Inc. (ACIS) an annual distribution and service fee of 0.25%. The plans provide that the B Class and the C Class will each pay ACIS an annual distribution fee of 0.75% and service fee of 0.25%. The plans provide that the R Class will pay ACIS an annual distribution and service fee of 0.50%. The fees are computed and accrued daily based on each class’s daily net assets and paid monthly in arrears. The fees are used to pay financial intermediaries for distribution and individual shareholder services. Fee s incurred under the plans during the six months ended September 30, 2009, are detailed in the Statement of Operations.
Related Parties — Certain officers and trustees of the trust are also officers and/or directors of American Century Companies, Inc. (ACC), the parent of the trust’s investment advisor, ACIM, the distributor of the trust, ACIS, and the trust’s transfer agent, American Century Services, LLC. American Century Asset Allocation Portfolios, Inc. (ACAAP) owns 11% and 40% of the shares of Diversified Bond and High-Yield, respectively. ACAAP does not invest in the funds for the purpose of exercising management or control.
The funds are eligible to invest in a money market fund for temporary purposes, which is managed by J.P. Morgan Investment Management, Inc. (JPMIM). The funds have a Mutual Funds Services Agreement with J.P. Morgan Investor Services Co. (JPMIS) and a securities lending agreement with JPMorgan Chase Bank (JPMCB). JPMCB is a custodian of the funds. JPMIM, JPMIS and JPMCB are wholly owned subsidiaries of JPMorgan Chase & Co. (JPM). JPM is an equity investor in ACC.
3. Investment Transactions
Investment transactions, excluding short-term investments, for the six months ended September 30, 2009, were as follows:
| | |
| | Diversified Bond | High-Yield |
| Purchases | | |
| U.S. Treasury & Government Agency Obligations | $1,703,867,324 | — |
| Investment securities other than U.S. Treasury | | |
| & Government Agency Obligations | $563,149,364 | $92,154,478 |
| Sales | | |
| U.S. Treasury & Government Agency Obligations | $1,046,183,373 | — |
| Investment securities other than U.S. Treasury | | |
| & Government Agency Obligations | $188,986,034 | $37,292,020 |
44
| | | | |
| 4. Capital Share Transactions | | | |
| |
| Transactions in shares of the funds were as follows (unlimited number of shares authorized): |
| |
| | Six months ended September 30, 2009 | Year ended March 31, 2009 |
| | Shares | Amount | Shares | Amount |
| |
| Diversified Bond | | | | |
| Investor Class | | | | |
| Sold | 49,056,605 | $ 509,898,741 | 52,907,910 | $ 539,074,327 |
| Issued in reinvestment of distributions | 1,013,160 | 10,613,899 | 1,109,665 | 11,243,225 |
| Redeemed | (17,706,847) | (184,083,196) | (24,863,358) | (251,020,234) |
| | 32,362,918 | 336,429,444 | 29,154,217 | 299,297,318 |
| Institutional Class | | | | |
| Sold | 38,051,300 | 395,821,091 | 15,534,058 | 158,573,464 |
| Issued in reinvestment of distributions | 852,525 | 8,943,313 | 1,169,605 | 11,853,655 |
| Redeemed | (3,538,398) | (36,888,553) | (5,813,609) | (59,113,048) |
| | 35,365,427 | 367,875,851 | 10,890,054 | 111,314,071 |
| A Class | | | | |
| Sold | 35,079,358 | 364,088,423 | 39,512,536 | 402,162,041 |
| Issued in reinvestment of distributions | 818,420 | 8,570,759 | 572,152 | 5,786,600 |
| Redeemed | (12,239,942) | (127,554,748) | (3,981,709) | (40,467,796) |
| | 23,657,836 | 245,104,434 | 36,102,979 | 367,480,845 |
| B Class | | | | |
| Sold | 723,153 | 7,512,677 | 724,898 | 7,404,168 |
| Issued in reinvestment of distributions | 10,143 | 106,288 | 6,745 | 68,353 |
| Redeemed | (85,778) | (895,657) | (55,352) | (564,526) |
| | 647,518 | 6,723,308 | 676,291 | 6,907,995 |
| C Class | | | | |
| Sold | 8,348,540 | 86,741,761 | 7,743,622 | 78,903,594 |
| Issued in reinvestment of distributions | 84,317 | 883,878 | 52,030 | 526,002 |
| Redeemed | (727,222) | (7,584,709) | (306,510) | (3,110,639) |
| | 7,705,635 | 80,040,930 | 7,489,142 | 76,318,957 |
| R Class | | | | |
| Sold | 584,502 | 6,070,617 | 424,940 | 4,317,118 |
| Issued in reinvestment of distributions | 11,268 | 118,130 | 2,230 | 22,799 |
| Redeemed | (60,430) | (632,795) | (12,318) | (125,735) |
| | 535,340 | 5,555,952 | 414,852 | 4,214,182 |
| Net increase (decrease) | 100,274,674 | $1,041,729,919 | 84,727,535 | $ 865,533,368 |
45
| | | | |
| | Six months ended September 30, 2009 | Year ended March 31, 2009 |
| | Shares | Amount | Shares | Amount |
| |
| High-Yield | | | | |
| Investor Class | | | | |
| Sold | 9,454,592 | $ 49,281,620 | 14,732,429 | $ 72,211,468 |
| Issued in reinvestment of distributions | 453,691 | 2,418,636 | 342,191 | 1,767,392 |
| Redeemed | (6,845,095) | (35,817,068) | (8,640,787) | (42,806,243) |
| | 3,063,188 | 15,883,188 | 6,433,833 | 31,172,617 |
| Institutional Class | | | | |
| Sold | 2,478,168 | 12,988,380 | 6,384,683 | 30,947,426 |
| Issued in reinvestment of distributions | 36,094 | 192,467 | 33,206 | 171,486 |
| Redeemed | (479,867) | (2,491,930) | (2,224,844) | (10,832,707) |
| | 2,034,395 | 10,688,917 | 4,193,045 | 20,286,205 |
| A Class | | | | |
| Sold | 2,246,912 | 11,837,693 | 2,547,335 | 12,325,258 |
| Issued in reinvestment of distributions | 135,744 | 725,550 | 115,036 | 600,077 |
| Redeemed | (820,097) | (4,315,756) | (830,344) | (4,290,252) |
| | 1,562,559 | 8,247,487 | 1,832,027 | 8,635,083 |
| B Class | | | | |
| Sold | 48,572 | 254,562 | 92,369 | 452,260 |
| Issued in reinvestment of distributions | 5,690 | 30,292 | 9,127 | 48,214 |
| Redeemed | (54,979) | (286,740) | (38,950) | (201,092) |
| | (717) | (1,886) | 62,546 | 299,382 |
| C Class | | | | |
| Sold | 1,218,675 | 6,312,679 | 449,269 | 2,173,111 |
| Issued in reinvestment of distributions | 26,760 | 143,599 | 13,889 | 71,835 |
| Redeemed | (133,917) | (700,421) | (87,546) | (455,798) |
| | 1,111,518 | 5,755,857 | 375,612 | 1,789,148 |
| R Class | | | | |
| Sold | 139,093 | 720,318 | 20,630 | 97,117 |
| Issued in reinvestment of distributions | 3,627 | 19,647 | 459 | 2,379 |
| Redeemed | (17,527) | (94,564) | (7,503) | (35,041) |
| | 125,193 | 645,401 | 13,586 | 64,455 |
| Net increase (decrease) | 7,896,136 | $ 41,218,964 | 12,910,649 | $ 62,246,890 |
5. Securities Lending
As of September 30, 2009, the funds did not have any securities on loan. JPMCB receives and maintains collateral in the form of cash and/or acceptable securities as approved by ACIM. Cash collateral is invested in authorized investments by the lending agent in a pooled account. Any deficiencies or excess of collateral must be delivered or transferred by the member firms no later than the close of business on the next business day. The funds’ risks in securities lending are that the borrower may not provide additional collateral when required or return the securities when due. If the borrower defaults, receipt of the collateral by the funds may be delayed or limited. Investments made with cash collateral may decline in value.
46
6. Fair Value Measurements
The funds’ securities valuation process is based on several considerations and may use multiple inputs to determine the fair value of the positions held by the funds. In conformity with accounting principles generally accepted in the United States of America, the inputs used to determine a valuation are classified into three broad levels as follows:
• Level 1 valuation inputs consist of actual quoted prices in an active market for identical securities;
• Level 2 valuation inputs consist of significant direct or indirect observable market data (including quoted prices for similar securities, evaluations of subsequent market events, interest rates, prepayment speeds, credit risk, etc.); or
• Level 3 valuation inputs consist of significant unobservable inputs (including a fund’s own assumptions).
The level classification is based on the lowest level input that is significant to the fair valuation measurement. The valuation inputs are not an indication of the risks associated with investing in these securities or other financial instruments
The following is a summary of the valuation inputs used to determine the fair value of the funds’ securities and other financial instruments as of September 30, 2009:
| | | |
| | Level 1 | Level 2 | Level 3 |
| Diversified Bond | | | |
| Investment Securities | | | |
| U.S. Government Agency Mortgage-Backed Securities | — | $ 827,425,938 | — |
| Corporate Bonds | — | 725,005,437 | — |
| U.S. Treasury Securities | — | 551,308,831 | — |
| U.S. Government Agency Securities and Equivalents | — | 331,627,308 | — |
| Municipal Securities | — | 66,735,664 | — |
| Collateralized Mortgage Obligations | — | 58,576,696 | — |
| Commercial Mortgage-Backed Securities | — | 56,673,588 | — |
| Sovereign Governments & Agencies | — | 43,913,248 | — |
| Asset-Backed Securities | — | 4,072,949 | — |
| Temporary Cash Investments | $631,949 | 72,649,000 | — |
| Total Value of Investment Securities | $631,949 | $2,737,988,659 | — |
| | | | |
| Other Financial Instruments | | | |
| Forward Foreign Currency Exchange Contracts | — | $116,874 | — |
| Swap Agreements | — | 184,600 | — |
| Total Unrealized Gain (Loss) | | | |
| on Other Financial Instruments | — | $301,474 | — |
47
| | | | |
| | | |
| | Level 1 | Level 2 | Level 3 |
| High-Yield | | | |
| Investment Securities | | | |
| Corporate Bonds | $552,640 | $188,776,353 | — |
| Preferred Stocks | — | 101,779 | — |
| Temporary Cash Investments | 478 | 7,609,000 | — |
| Total Value of Investment Securities | $553,118 | $196,487,132 | — |
| | | | |
| Other Financial Instruments | | | |
| Total Unrealized Gain (Loss) on Swap Agreements | — | $222,594 | — |
7. Derivative Instruments
Credit Risk — Diversified Bond and High-Yield are subject to credit risk in the normal course of pursuing their investment objectives. The value of a bond generally declines as the credit quality of its issuer declines. Credit default swaps enable a fund to buy/ sell protection against a credit event of a specific issuer or index. A fund may attempt to enhance returns by selling protection or attempt to mitigate credit risk by buying protection. The buyer/seller of credit protection against a security or basket of securities may pay/receive an up-front or periodic payment to compensate for/against potential default events. A fund will segregate cash, cash equivalents or other appropriate liquid securities on its records in amounts sufficient to meet requirements. Swap agreements are valued daily at current market value as provided by a com mercial pricing service and/ or independent brokers. Changes in value, including the periodic amounts of interest to be paid or received on swaps, are recorded as unrealized appreciation (depreciation) on swap agreements. Realized gain or loss is recorded upon receipt or payment of a periodic settlement or termination of swap agreements. Net realized and unrealized gains or losses occurring during the holding period of swap agreements are a component of net realized gain (loss) on swap agreement transactions and change in net unrealized appreciation (depreciation) on swap agreements, respectively. The risks of entering into swap agreements include the possible lack of liquidity, failure of the counterparty to meet its obligations, and that there may be unfavorable changes in the underlying investments or instruments. During the six months ended September 30, 2009, Diversified Bond participated in credit default swap agreements to buy protection, and High-Yield participated in credit default swap agreements t o sell protection.
Foreign Currency Risk — Diversified Bond is subject to foreign currency exchange rate risk in the normal course of pursuing its investment objectives. The value of foreign investments held by a fund may be significantly affected by changes in foreign currency exchange rates. The dollar value of a foreign security generally decreases when the value of the dollar rises against the foreign currency in which the security is denominated and tends to increase when the value of the dollar declines against such foreign currency. A fund may enter into forward foreign currency exchange contracts to reduce a fund’s exposure to foreign currency exchange rate fluctuations. The net U.S. dollar value of foreign currency underlying all contractual commitments held by a fund and the resulting unrealized appreciation or depreciation are determined dail y using prevailing exchange rates. Realized gain or loss is recorded upon the termination of the contract. Net realized and unrealized gains or losses occurring during the holding period of forward foreign currency exchange contracts are a component of net realized gain (loss) on foreign currency transactions and change in net unrealized appreciation (depreciation) on translation of assets and liabilities in foreign currencies, respectively. A fund bears the risk of an unfavorable change in the foreign currency exchange rate underlying the forward contract. Additionally, losses, up to the fair value, may arise if the counterparties do not perform under the contract terms. The risk of loss from non-performance by the counterparty may be reduced by the use of master netting agreements. During the six months ended September 30, 2009, Diversified Bond participated in forward foreign currency exchange contracts.
48
| | | | | |
| Value of Derivative Instruments as of September 30, 2009 | |
| |
| | Asset Derivatives | | | Liability Derivatives |
| Fund/Type of | Location on Statement | | | Location on Statement | |
| Derivative | of Assets and Liabilities | Value | | of Assets and Liabilities | Value |
| Diversified Bond | | | | |
| Credit Risk | Receivable for swap | $184,600 | | Payable for swap | — |
| | agreements, at value | | | agreements, at value | |
| Foreign Currency Risk | Receivable for forward foreign | 116,874 | | Payable for forward foreign | — |
| | currency exchange contracts | | | currency exchange contracts | |
| | | $301,474 | | | — |
| |
| High-Yield | | | | | |
| Credit Risk | Receivable for swap | — | | Payable for swap agreements, | $88,574 |
| | agreements, at value | | | at value | |
| |
| Effect of Derivative Instruments on the Statement of Operations for the Six Months Ended |
| September 30, 2009 | | | | |
| |
| | | | | Change in Net Unrealized |
| | Net Realized Gain (Loss) | | Appreciation (Depreciation) |
| Fund/Type of | Location on Statement | | | Location on Statement | |
| Derivative | of Operations | | | of Operations | |
| Diversified Bond | | | | | |
| Credit Risk | Net realized gain (loss) on | $(4,541) | | Change in net unrealized | $(321,324) |
| | swap agreement transactions | | | appreciation (depreciation) | |
| | | | | on swap agreements | |
| Foreign Currency Risk | Net realized gain (loss) on | — | | Change in net unrealized | 116,874 |
| | foreign currency transactions | | | appreciation (depreciation) | |
| | | | | on translation of assets and | |
| | | | | liabilities in foreign currencies | |
| | | $(4,541) | | | $(204,450) |
| High-Yield | | | | | |
| Credit Risk | Net realized gain (loss) on | $(51,819) | | Change in net unrealized | $396,913 |
| | swap agreement transactions | | | appreciation (depreciation) | |
| | | | | on swap agreements | |
The value of derivative instruments at period end and the effect of derivatives on the Statement of Operations is indicative of each fund’s typical volume.
8. Risk Factors
High-Yield invests primarily in lower-rated debt securities, which are subject to substantial risks including price volatility, liquidity risk, and default risk.
49
9. Interfund Lending
The funds, along with certain other funds in the American Century Investments family of funds, may participate in an interfund lending program, pursuant to an Exemptive Order issued by the Securities and Exchange Commission (SEC). This program provides an alternative credit facility allowing the funds to borrow from or lend to other funds in the American Century Investments family of funds that permit such transactions. Interfund lending transactions are subject to each fund’s investment policies and borrowing and lending limits. The interfund loan rate earned/paid on interfund lending transactions is determined daily based on the average of certain current market rates. Interfund lending transactions normally extend only overnight, but can have a maximum duration of seven days. The program is subject to annual approval by the Board of Trustees. During the six months ended September 30, 2009, the funds did not utilize the program.
10. Federal Tax Information
The book-basis character of distributions made during the year from net investment income or net realized gains may differ from their ultimate characterization for federal income tax purposes. These differences reflect the differing character of paydown losses, certain income items and net realized gains and losses for financial statement and tax purposes, and may result in reclassification among certain capital accounts on the financial statements.
As of September 30, 2009, the components of investments for federal income tax purposes were as follows:
| | | | |
| | | | Diversified Bond | High-Yield |
| Federal tax cost of investments | | $2,641,389,366 | $184,492,404 |
| Gross tax appreciation of investments | | $102,175,241 | $15,372,319 |
| Gross tax depreciation of investments | | (4,943,999) | (2,824,473) |
| Net tax appreciation (depreciation) of investments | | $ 97,231,242 | $12,547,846 |
| |
| The difference between book-basis and tax-basis cost and unrealized appreciation |
| (depreciation) is attributable primarily to the tax deferral of losses on wash sales. |
| |
| As of March 31, 2009, High-Yield had accumulated capital losses of $(10,305,744), which |
| represent net capital loss carryovers that may be used to offset future realized capital gains |
| for federal income tax purposes. Future capital loss carryover utilization in any given |
| year may be subject to Internal Revenue Code limitations. The capital loss carryovers for |
| High-Yield expire as follows: | | | |
| |
| | 2010 | 2011 | 2013 | 2014 |
| High-Yield | $(10,290,680) | — | — | $(15,064) |
| |
| Diversified Bond and High-Yield had capital loss deferrals of $(1,227,094) and $(10,714,761), |
| respectively, which represent net capital losses incurred in the five-month period ended |
| March 31, 2009. The funds have elected to treat such losses as having been incurred in the |
| following fiscal year for federal income tax purposes. | | |
50
11. Recently Issued Accounting Standards
In March 2008, the Financial Accounting Standards Board (FASB) issued Accounting Standards Codification (ASC) Section 815-10 (formerly Statement of Financial Accounting Standards No. 161, “Disclosures about Derivative Instruments and Hedging Activities —an amendment of FASB Statement No. 133”). ASC Section 815-10 is effective for interim periods beginning after November 15, 2008 and has been adopted by the funds. ASC Section 815-10 amends and expands disclosures about derivative instruments and hedging activities. ASC Section 815-10 requires qualitative disclosures about the objectives and strategies of derivative instruments, quantitative disclosures about the fair value amounts of and gains and losses on derivative instruments, and disclosures of credit-risk-related contingent features in hedging activities.
51
| | | | | | | |
| Diversified Bond | | | | | |
| |
| Investor Class | | | | | | |
| For a Share Outstanding Throughout the Years Ended March 31 (except as noted) | | |
| | | 2009(1) | 2009 | 2008 | 2007 | 2006 | 2005 |
| Per-Share Data | | | | | | |
| Net Asset Value, | | | | | | |
| Beginning of Period | $10.29 | $10.48 | $10.02 | $9.89 | $10.10 | $10.49 |
| Income From | | | | | | |
| Investment Operations | | | | | | |
| Net Investment | | | | | | |
| Income (Loss)(2) | 0.18 | 0.41 | 0.46 | 0.45 | 0.41 | 0.33 |
| Net Realized and | | | | | | |
| Unrealized Gain (Loss) | 0.38 | (0.02) | 0.45 | 0.13 | (0.21) | (0.27) |
| Total From | | | | | | |
| Investment Operations | 0.56 | 0.39 | 0.91 | 0.58 | 0.20 | 0.06 |
| Distributions | | | | | | |
| From Net | | | | | | |
| Investment Income | (0.19) | (0.46) | (0.45) | (0.45) | (0.41) | (0.34) |
| From Net Realized Gains | — | (0.12) | — | — | — | (0.11) |
| Total Distributions | (0.19) | (0.58) | (0.45) | (0.45) | (0.41) | (0.45) |
| Net Asset Value, | | | | | | |
| End of Period | $10.66 | $10.29 | $10.48 | $10.02 | $9.89 | $10.10 |
| |
| Total Return(3) | 5.47% | 4.02% | 9.38% | 6.05% | 1.97% | 0.63% |
| |
| Ratios/Supplemental Data | | | | | | |
| Ratio of Operating | | | | | | |
| Expenses to Average | | | | | | |
| Net Assets | 0.60%(4)(5) | 0.62% | 0.62% | 0.62% | 0.62% | 0.63% |
| Ratio of Operating | | | | | | |
| Expenses to Average | | | | | | |
| Net Assets (Before | | | | | | |
| Expense Waiver) | 0.62%(5) | 0.62% | 0.62% | 0.62% | 0.62% | 0.63% |
| Ratio of Net Investment | | | | | | |
| Income (Loss) to Average | | | | | | |
| Net Assets | 3.45%(4)(5) | 3.95% | 4.53% | 4.58% | 4.04% | 3.25% |
| Ratio of Net Investment | | | | | | |
| Income (Loss) to Average | | | | | | |
| Net Assets (Before | | | | | | |
| Expense Waiver) | 3.43%(5) | 3.95% | 4.53% | 4.58% | 4.04% | 3.25% |
| Portfolio Turnover Rate | 60% | 198% | 250% | 323% | 341% | 386% |
| Net Assets, End of Period | | | | | | |
| (in thousands) | $1,179,420 | $806,163 | $515,184 | $394,346 | $225,187 | $180,346 |
| (1) | Six months ended September 30, 2009 (unaudited). | | | | |
| (2) | Computed using average shares outstanding throughout the period. | | | | |
| (3) | Total return assumes reinvestment of net investment income and capital gains distributions, if any. Total returns for periods less than one year |
| | are not annualized. The total return of the classes may not precisely reflect the class expense differences because of the impact of calculating |
| | the net asset values to two decimal places. If net asset values were calculated to three decimal places, the total return differences would |
| | more closely reflect the class expense differences. The calculation of net asset values to two decimal places is made in accordance with SEC |
| | guidelines and does not result in any gain or loss of value between one class and another. | | | |
| (4) | Effective August 1, 2009, the investment advisor voluntarily agreed to waive a portion of its management fee. | | |
| (5) | Annualized. | | | | | | |
| |
| See Notes to Financial Statements. | | | | | | |
52
| | | | | | |
| Diversified Bond | | | | | |
| |
| Institutional Class | | | | | | |
| For a Share Outstanding Throughout the Years Ended March 31 (except as noted) | | |
| | 2009(1) | 2009 | 2008 | 2007 | 2006 | 2005 |
| Per-Share Data | | | | | | |
| Net Asset Value, | | | | | | |
| Beginning of Period | $10.29 | $10.48 | $10.02 | $9.89 | $10.10 | $10.49 |
| Income From | | | | | | |
| Investment Operations | | | | | | |
| Net Investment | | | | | | |
| Income (Loss)(2) | 0.19 | 0.43 | 0.48 | 0.47 | 0.43 | 0.35 |
| Net Realized and | | | | | | |
| Unrealized Gain (Loss) | 0.37 | (0.02) | 0.45 | 0.13 | (0.21) | (0.27) |
| Total From | | | | | | |
| Investment Operations | 0.56 | 0.41 | 0.93 | 0.60 | 0.22 | 0.08 |
| Distributions | | | | | | |
| From Net | | | | | | |
| Investment Income | (0.20) | (0.48) | (0.47) | (0.47) | (0.43) | (0.36) |
| From Net Realized Gains | — | (0.12) | — | — | — | (0.11) |
| Total Distributions | (0.20) | (0.60) | (0.47) | (0.47) | (0.43) | (0.47) |
| Net Asset Value, | | | | | | |
| End of Period | $10.65 | $10.29 | $10.48 | $10.02 | $9.89 | $10.10 |
| |
| Total Return(3) | 5.48% | 4.22% | 9.60% | 6.26% | 2.17% | 0.83% |
| |
| Ratios/Supplemental Data | | | | | | |
| Ratio of Operating | | | | | | |
| Expenses to Average | | | | | | |
| Net Assets | 0.40%(4)(5) | 0.42% | 0.42% | 0.42% | 0.42% | 0.43% |
| Ratio of Operating | | | | | | |
| Expenses to Average | | | | | | |
| Net Assets (Before | | | | | | |
| Expense Waiver) | 0.42%(5) | 0.42% | 0.42% | 0.42% | 0.42% | 0.43% |
| Ratio of Net Investment | | | | | | |
| Income (Loss) to Average | | | | | | |
| Net Assets | 3.65%(4)(5) | 4.15% | 4.73% | 4.78% | 4.24% | 3.45% |
| Ratio of Net Investment | | | | | | |
| Income (Loss) to Average | | | | | | |
| Net Assets (Before | | | | | | |
| Expense Waiver) | 3.63%(5) | 4.15% | 4.73% | 4.78% | 4.24% | 3.45% |
| Portfolio Turnover Rate | 60% | 198% | 250% | 323% | 341% | 386% |
| Net Assets, End of Period | | | | | | |
| (in thousands) | $681,998 | $294,827 | $186,031 | $389,829 | $440,579 | $336,207 |
| (1) | Six months ended September 30, 2009 (unaudited). |
| (2) | Computed using average shares outstanding throughout the period. |
| (3) | Total return assumes reinvestment of net investment income and capital gains distributions, if any. Total returns for periods less than one year are not annualized. The total return of the classes may not precisely reflect the class expense differences because of the impact of calculating the net asset values to two decimal places. If net asset values were calculated to three decimal places, the total return differences would more closely reflect the class expense differences. The calculation of net asset values to two decimal places is made in accordance with SEC guidelines and does not result in any gain or loss of value between one class and another. |
| (4) | Effective August 1, 2009, the investment advisor voluntarily agreed to waive a portion of its management fee. |
| (5) | Annualized. |
See Notes to Financial Statements.
53
| | | | | | |
| Diversified Bond | | | | | |
| |
| A Class(1) | | | | | | |
| For a Share Outstanding Throughout the Years Ended March 31 (except as noted) | | |
| | 2009(2) | 2009 | 2008 | 2007 | 2006 | 2005 |
| Per-Share Data | | | | | | |
| Net Asset Value, | | | | | | |
| Beginning of Period | $10.29 | $10.48 | $10.02 | $9.89 | $10.10 | $10.49 |
| Income From | | | | | | |
| Investment Operations | | | | | | |
| Net Investment | | | | | | |
| Income (Loss)(3) | 0.17 | 0.35 | 0.44 | 0.43 | 0.38 | 0.31 |
| Net Realized and | | | | | | |
| Unrealized Gain (Loss) | 0.37 | 0.02 | 0.45 | 0.13 | (0.21) | (0.28) |
| Total From | | | | | | |
| Investment Operations | 0.54 | 0.37 | 0.89 | 0.56 | 0.17 | 0.03 |
| Distributions | | | | | | |
| From Net | | | | | | |
| Investment Income | (0.17) | (0.44) | (0.43) | (0.43) | (0.38) | (0.31) |
| From Net Realized Gains | — | (0.12) | — | — | — | (0.11) |
| Total Distributions | (0.17) | (0.56) | (0.43) | (0.43) | (0.38) | (0.42) |
| Net Asset Value, | | | | | | |
| End of Period | $10.66 | $10.29 | $10.48 | $10.02 | $9.89 | $10.10 |
| |
| Total Return(4) | 5.34% | 3.76% | 9.11% | 5.77% | 1.72% | 0.38% |
| |
| Ratios/Supplemental Data | | | | | | |
| Ratio of Operating | | | | | | |
| Expenses to Average | | | | | | |
| Net Assets | 0.85%(5)(6) | 0.87% | 0.87% | 0.87% | 0.87% | 0.88% |
| Ratio of Operating | | | | | | |
| Expenses to Average | | | | | | |
| Net Assets (Before | | | | | | |
| Expense Waiver) | 0.87%(6) | 0.87% | 0.87% | 0.87% | 0.87% | 0.88% |
| Ratio of Net Investment | | | | | | |
| Income (Loss) to Average | | | | | | |
| Net Assets | 3.20%(5)(6) | 3.70% | 4.28% | 4.33% | 3.79% | 3.00% |
| Ratio of Net Investment | | | | | | |
| Income (Loss) to Average | | | | | | |
| Net Assets (Before | | | | | | |
| Expense Waiver) | 3.18%(6) | 3.70% | 4.28% | 4.33% | 3.79% | 3.00% |
| Portfolio Turnover Rate | 60% | 198% | 250% | 323% | 341% | 386% |
| Net Assets, End of Period | | | | | | |
| (in thousands) | $660,276 | $394,278 | $23,020 | $3,405 | $5,642 | $5,421 |
| (1) | Prior to September 4, 2007, the A Class was referred to as the Advisor Class. |
| (2) | Six months ended September 30, 2009 (unaudited). |
| (3) | Computed using average shares outstanding throughout the period. |
| (4) | Total return assumes reinvestment of net investment income and capital gains distributions, if any, and does not reflect applicable sales charges. Total returns for periods less than one year are not annualized. The total return of the classes may not precisely reflect the class expense differences because of the impact of calculating the net asset values to two decimal places. If net asset values were calculated to three decimal places, the total return differences would more closely reflect the class expense differences. The calculation of net asset values to two decimal places is made in accordance with SEC guidelines and does not result in any gain or loss of value between one class and another. |
| (5) | Effective August 1, 2009, the investment advisor voluntarily agreed to waive a portion of its management fee. |
| (6) | Annualized. |
See Notes to Financial Statements.
54
| | | | | | |
| Diversified Bond | | | | | |
| |
| B Class | | | | | | |
| For a Share Outstanding Throughout the Years Ended March 31 (except as noted) | | |
| | 2009(1) | 2009 | 2008 | 2007 | 2006 | 2005 |
| Per-Share Data | | | | | | |
| Net Asset Value, | | | | | | |
| Beginning of Period | $10.29 | $10.48 | $10.02 | $9.89 | $10.10 | $10.49 |
| Income From | | | | | | |
| Investment Operations | | | | | | |
| Net Investment | | | | | | |
| Income (Loss)(2) | 0.13 | 0.28 | 0.36 | 0.35 | 0.31 | 0.23 |
| Net Realized and | | | | | | |
| Unrealized Gain (Loss) | 0.37 | 0.01 | 0.45 | 0.13 | (0.21) | (0.27) |
| Total From | | | | | | |
| Investment Operations | 0.50 | 0.29 | 0.81 | 0.48 | 0.10 | (0.04) |
| Distributions | | | | | | |
| From Net | | | | | | |
| Investment Income | (0.14) | (0.36) | (0.35) | (0.35) | (0.31) | (0.24) |
| From Net Realized Gains | — | (0.12) | — | — | — | (0.11) |
| Total Distributions | (0.14) | (0.48) | (0.35) | (0.35) | (0.31) | (0.35) |
| Net Asset Value, | | | | | | |
| End of Period | $10.65 | $10.29 | $10.48 | $10.02 | $9.89 | $10.10 |
| |
| Total Return(3) | 4.85% | 2.98% | 8.30% | 5.00% | 0.96% | (0.37)% |
| |
| Ratios/Supplemental Data | | | | | | |
| Ratio of Operating | | | | | | |
| Expenses to Average | | | | | | |
| Net Assets | 1.60%(4)(5) | 1.62% | 1.62% | 1.62% | 1.62% | 1.63% |
| Ratio of Operating | | | | | | |
| Expenses to Average | | | | | | |
| Net Assets (Before | | | | | | |
| Expense Waiver) | 1.62%(5) | 1.62% | 1.62% | 1.62% | 1.62% | 1.63% |
| Ratio of Net Investment | | | | | | |
| Income (Loss) to Average | | | | | | |
| Net Assets | 2.45%(4)(5) | 2.95% | 3.53% | 3.58% | 3.04% | 2.25% |
| Ratio of Net Investment | | | | | | |
| Income (Loss) to Average | | | | | | |
| Net Assets (Before | | | | | | |
| Expense Waiver) | 2.43%(5) | 2.95% | 3.53% | 3.58% | 3.04% | 2.25% |
| Portfolio Turnover Rate | 60% | 198% | 250% | 323% | 341% | 386% |
| Net Assets, End of Period | | | | | | |
| (in thousands) | $15,228 | $8,045 | $1,105 | $806 | $750 | $753 |
| (1) | Six months ended September 30, 2009 (unaudited). |
| (2) | Computed using average shares outstanding throughout the period. |
| (3) | Total return assumes reinvestment of net investment income and capital gains distributions, if any, and does not reflect applicable sales charges. Total returns for periods less than one year are not annualized. The total return of the classes may not precisely reflect the class expense differences because of the impact of calculating the net asset values to two decimal places. If net asset values were calculated to three decimal places, the total return differences would more closely reflect the class expense differences. The calculation of net asset values to two decimal places is made in accordance with SEC guidelines and does not result in any gain or loss of value between one class and another. |
| (4) | Effective August 1, 2009, the investment advisor voluntarily agreed to waive a portion of its management fee. |
| (5) | Annualized. |
See Notes to Financial Statements.
55
| | | | | | |
| Diversified Bond | | | | | |
| |
| C Class | | | | | | |
| For a Share Outstanding Throughout the Years Ended March 31 (except as noted) | | |
| | 2009(1) | 2009 | 2008 | 2007 | 2006 | 2005 |
| Per-Share Data | | | | | | |
| Net Asset Value, | | | | | | |
| Beginning of Period | $10.29 | $10.48 | $10.02 | $9.89 | $10.10 | $10.49 |
| Income From | | | | | | |
| Investment Operations | | | | | | |
| Net Investment | | | | | | |
| Income (Loss)(2) | 0.13 | 0.27 | 0.36 | 0.35 | 0.31 | 0.23 |
| Net Realized and | | | | | | |
| Unrealized Gain (Loss) | 0.38 | 0.02 | 0.45 | 0.13 | (0.21) | (0.27) |
| Total From | | | | | | |
| Investment Operations | 0.51 | 0.29 | 0.81 | 0.48 | 0.10 | (0.04) |
| Distributions | | | | | | |
| From Net | | | | | | |
| Investment Income | (0.14) | (0.36) | (0.35) | (0.35) | (0.31) | (0.24) |
| From Net Realized Gains | — | (0.12) | — | — | — | (0.11) |
| Total Distributions | (0.14) | (0.48) | (0.35) | (0.35) | (0.31) | (0.35) |
| Net Asset Value, | | | | | | |
| End of Period | $10.66 | $10.29 | $10.48 | $10.02 | $9.89 | $10.10 |
| |
| Total Return(3) | 4.95% | 2.99% | 8.30% | 4.99% | 0.96% | (0.37)% |
| |
| Ratios/Supplemental Data | | | | | | |
| Ratio of Operating | | | | | | |
| Expenses to Average | | | | | | |
| Net Assets | 1.60%(4)(5) | 1.62% | 1.62% | 1.62% | 1.62% | 1.63% |
| Ratio of Operating | | | | | | |
| Expenses to Average | | | | | | |
| Net Assets (Before | | | | | | |
| Expense Waiver) | 1.62%(5) | 1.62% | 1.62% | 1.62% | 1.62% | 1.63% |
| Ratio of Net Investment | | | | | | |
| Income (Loss) to Average | | | | | | |
| Net Assets | 2.45%(4)(5) | 2.95% | 3.53% | 3.58% | 3.04% | 2.25% |
| Ratio of Net Investment | | | | | | |
| Income (Loss) to Average | | | | | | |
| Net Assets (Before | | | | | | |
| Expense Waiver) | 2.43%(5) | 2.95% | 3.53% | 3.58% | 3.04% | 2.25% |
| Portfolio Turnover Rate | 60% | 198% | 250% | 323% | 341% | 386% |
| Net Assets, End of Period | | | | | | |
| (in thousands) | $167,030 | $82,026 | $5,016 | $2,718 | $1,334 | $1,418 |
| (1) | Six months ended September 30, 2009 (unaudited). |
| (2) | Computed using average shares outstanding throughout the period. |
| (3) | Total return assumes reinvestment of net investment income and capital gains distributions, if any, and does not reflect applicable sales charges. Total returns for periods less than one year are not annualized. The total return of the classes may not precisely reflect the class expense differences because of the impact of calculating the net asset values to two decimal places. If net asset values were calculated to three decimal places, the total return differences would more closely reflect the class expense differences. The calculation of net asset values to two decimal places is made in accordance with SEC guidelines and does not result in any gain or loss of value between one class and another. |
| (4) | Effective August 1, 2009, the investment advisor voluntarily agreed to waive a portion of its management fee. |
| (5) | Annualized. |
See Notes to Financial Statements.
56
| | | | | |
| Diversified Bond | | | | | |
| |
| R Class | | | | | |
| For a Share Outstanding Throughout the Years Ended March 31 (except as noted) | | |
| | 2009(1) | 2009 | 2008 | 2007 | 2006(2) |
| Per-Share Data | | | | | |
| Net Asset Value, Beginning of Period | $10.29 | $10.48 | $10.02 | $9.89 | $10.17 |
| Income From Investment Operations | | | | | |
| Net Investment Income (Loss)(3) | 0.15 | 0.30 | 0.41 | 0.40 | 0.25 |
| Net Realized and Unrealized Gain (Loss) | 0.38 | 0.04 | 0.45 | 0.13 | (0.28) |
| Total From Investment Operations | 0.53 | 0.34 | 0.86 | 0.53 | (0.03) |
| Distributions | | | | | |
| From Net Investment Income | (0.16) | (0.41) | (0.40) | (0.40) | (0.25) |
| From Net Realized Gains | — | (0.12) | — | — | — |
| Total Distributions | (0.16) | (0.53) | (0.40) | (0.40) | (0.25) |
| Net Asset Value, End of Period | $10.66 | $10.29 | $10.48 | $10.02 | $9.89 |
| |
| Total Return(4) | 5.21% | 3.50% | 8.84% | 5.52% | (0.33)% |
| |
| Ratios/Supplemental Data | | | | | |
| Ratio of Operating Expenses | | | | | |
| to Average Net Assets | 1.10%(5)(6) | 1.12% | 1.12% | 1.12% | 1.12%(6) |
| Ratio of Operating Expenses to Average | | | | | |
| Net Assets (Before Expense Waiver) | 1.12%(6) | 1.12% | 1.12% | 1.12% | 1.12%(6) |
| Ratio of Net Investment Income (Loss) | | | | | |
| to Average Net Assets | 2.95%(5)(6) | 3.45% | 4.03% | 4.08% | 3.68%(6) |
| Ratio of Net Investment Income | | | | | |
| (Loss) to Average Net Assets | | | | | |
| (Before Expense Waiver) | 2.93%(6) | 3.45% | 4.03% | 4.08% | 3.68%(6) |
| Portfolio Turnover Rate | 60% | 198% | 250% | 323% | 341%(7) |
| Net Assets, End of Period (in thousands) | $10,157 | $4,301 | $31 | $26 | $25 |
| (1) | Six months ended September 30, 2009 (unaudited). |
| (2) | July 29, 2005 (commencement of sale) through March 31, 2006. |
| (3) | Computed using average shares outstanding throughout the period. |
| (4) | Total return assumes reinvestment of net investment income and capital gains distributions, if any. Total returns for periods less than one year are not annualized. The total return of the classes may not precisely reflect the class expense differences because of the impact of calculating the net asset values to two decimal places. If net asset values were calculated to three decimal places, the total return differences would more closely reflect the class expense differences. The calculation of net asset values to two decimal places is made in accordance with SEC guidelines and does not result in any gain or loss of value between one class and another. |
| (5) | Effective August 1, 2009, the investment advisor voluntarily agreed to waive a portion of its management fee. |
| (6) | Annualized. |
| (7) | Portfolio turnover is calculated at the fund level. Percentage indicated was calculated for the year ended March 31, 2006. |
See Notes to Financial Statements.
57
| | | | | | |
| High-Yield | | | | | | |
| |
| Investor Class | | | | | | |
| For a Share Outstanding Throughout the Years Ended March 31 (except as noted) | | |
| | 2009(1) | 2009 | 2008 | 2007 | 2006 | 2005 |
| Per-Share Data | | | | | | |
| Net Asset Value, | | | | | | |
| Beginning of Period | $4.75 | $5.97 | $6.48 | $6.38 | $6.42 | $6.55 |
| Income From | | | | | | |
| Investment Operations | | | | | | |
| Net Investment | | | | | | |
| Income (Loss) | 0.22(2) | 0.40(2) | 0.42 | 0.42 | 0.43 | 0.46 |
| Net Realized and | | | | | | |
| Unrealized Gain (Loss) | 0.88 | (1.17) | (0.51) | 0.10 | (0.04) | (0.13) |
| Total From | | | | | | |
| Investment Operations | 1.10 | (0.77) | (0.09) | 0.52 | 0.39 | 0.33 |
| Distributions | | | | | | |
| From Net | | | | | | |
| Investment Income | (0.22) | (0.45) | (0.42) | (0.42) | (0.43) | (0.46) |
| Net Asset Value, | | | | | | |
| End of Period | $5.63 | $4.75 | $5.97 | $6.48 | $6.38 | $6.42 |
| |
| Total Return(3) | 23.50% | (13.36)% | (1.41)% | 8.54% | 6.29% | 5.17% |
| |
| Ratios/Supplemental Data | | | | | | |
| Ratio of Operating | | | | | | |
| Expenses to Average | | | | | | |
| Net Assets | 0.79%(4)(5) | 0.80%(4) | 0.80%(4) | 0.79%(4) | 0.81%(4) | 0.88% |
| Ratio of Operating | | | | | | |
| Expenses to Average | | | | | | |
| Net Assets (Before | | | | | | |
| Expense Waiver) | 0.87%(5) | 0.87% | 0.87% | 0.87% | 0.87% | 0.88% |
| Ratio of Net Investment | | | | | | |
| Income (Loss) to Average | | | | | | |
| Net Assets | 8.30%(4)(5) | 7.66%(4) | 6.87%(4) | 6.69%(4) | 6.74%(4) | 7.04% |
| Ratio of Net Investment | | | | | | |
| Income (Loss) to Average | | | | | | |
| Net Assets (Before | | | | | | |
| Expense Waiver) | 8.22%(5) | 7.59% | 6.80% | 6.61% | 6.68% | 7.04% |
| Portfolio Turnover Rate | 25% | 33% | 40% | 45% | 40% | 64% |
| Net Assets, End of Period | | | | | | |
| (in thousands) | $101,971 | $71,445 | $51,375 | $51,717 | $42,650 | $40,746 |
| (1) | Six months ended September 30, 2009 (unaudited). |
| (2) | Computed using average shares outstanding throughout the period. |
| (3) | Total return assumes reinvestment of net investment income and capital gains distributions, if any. Total returns for periods less than one year are not annualized. The total return of the classes may not precisely reflect the class expense differences because of the impact of calculating the net asset values to two decimal places. If net asset values were calculated to three decimal places, the total return differences would more closely reflect the class expense differences. The calculation of net asset values to two decimal places is made in accordance with SEC guidelines and does not result in any gain or loss of value between one class and another. |
| (4) | Effective July 29, 2005, the investment advisor voluntarily agreed to waive a portion of its management fee. |
| (5) | Annualized. |
See Notes to Financial Statements.
58
| | | | | | |
| High-Yield | | | | | | |
| |
| Institutional Class | | | | | | |
| For a Share Outstanding Throughout the Years Ended March 31 (except as noted) | | |
| | 2009(1) | 2009 | 2008 | 2007 | 2006 | 2005(2) |
| Per-Share Data | | | | | | |
| Net Asset Value, | | | | | | |
| Beginning of Period | $4.75 | $5.97 | $6.48 | $6.38 | $6.42 | $6.43 |
| Income From | | | | | | |
| Investment Operations | | | | | | |
| Net Investment | | | | | | |
| Income (Loss) | 0.22(3) | 0.41(3) | 0.44 | 0.44 | 0.44 | 0.30 |
| Net Realized and | | | | | | |
| Unrealized Gain (Loss) | 0.88 | (1.17) | (0.51) | 0.10 | (0.04) | (0.01) |
| Total From | | | | | | |
| Investment Operations | 1.10 | (0.76) | (0.07) | 0.54 | 0.40 | 0.29 |
| Distributions | | | | | | |
| From Net | | | | | | |
| Investment Income | (0.22) | (0.46) | (0.44) | (0.44) | (0.44) | (0.30) |
| Net Asset Value, | | | | | | |
| End of Period | $5.63 | $4.75 | $5.97 | $6.48 | $6.38 | $6.42 |
| |
| Total Return(4) | 23.62% | (13.19)% | (1.21)% | 8.76% | 6.50% | 4.53% |
| |
| Ratios/Supplemental Data | | | | | | |
| Ratio of Operating | | | | | | |
| Expenses to Average | | | | | | |
| Net Assets | 0.59%(5)(6) | 0.60%(5) | 0.60%(5) | 0.59%(5) | 0.61%(5) | 0.68%(6) |
| Ratio of Operating | | | | | | |
| Expenses to Average | | | | | | |
| Net Assets (Before | | | | | | |
| Expense Waiver) | 0.67%(6) | 0.67% | 0.67% | 0.67% | 0.67% | 0.68%(6) |
| Ratio of Net Investment | | | | | | |
| Income (Loss) to Average | | | | | | |
| Net Assets | 8.50%(5)(6) | 7.86%(5) | 7.07%(5) | 6.89%(5) | 6.94%(5) | 4.37%(6) |
| Ratio of Net Investment | | | | | | |
| Income (Loss) to Average | | | | | | |
| Net Assets (Before | | | | | | |
| Expense Waiver) | 8.42%(6) | 7.79% | 7.00% | 6.81% | 6.88% | 4.37%(6) |
| Portfolio Turnover Rate | 25% | 33% | 40% | 45% | 40% | 64%(7) |
| Net Assets, End of Period | | | | | | |
| (in thousands) | $58,485 | $39,655 | $24,795 | $18,177 | $9,387 | $3,021 |
| (1) | Six months ended September 30, 2009 (unaudited). |
| (2) | August 2, 2004 (commencement of sale) through March 31, 2005. |
| (3) | Computed using average shares outstanding throughout the period. |
| (4) | Total return assumes reinvestment of net investment income and capital gains distributions, if any. Total returns for periods less than one year are not annualized. The total return of the classes may not precisely reflect the class expense differences because of the impact of calculating the net asset values to two decimal places. If net asset values were calculated to three decimal places, the total return differences would more closely reflect the class expense differences. The calculation of net asset values to two decimal places is made in accordance with SEC guidelines and does not result in any gain or loss of value between one class and another. |
| (5) | Effective July 29, 2005, the investment advisor voluntarily agreed to waive a portion of its management fee. |
| (6) | Annualized. |
| (7) | Portfolio turnover is calculated at the fund level. Percentage indicated was calculated for the year ended March 31, 2005. |
See Notes to Financial Statements.
59
| | | | | | |
| High-Yield | | | | | | |
| |
| A Class(1) | | | | | | |
| For a Share Outstanding Throughout the Years Ended March 31 (except as noted) | | |
| | 2009(2) | 2009 | 2008 | 2007 | 2006 | 2005 |
| Per-Share Data | | | | | | |
| Net Asset Value, | | | | | | |
| Beginning of Period | $4.75 | $5.97 | $6.48 | $6.38 | $6.42 | $6.55 |
| Income From | | | | | | |
| Investment Operations | | | | | | |
| Net Investment | | | | | | |
| Income (Loss) | 0.21(3) | 0.39(3) | 0.41 | 0.41 | 0.42 | 0.44 |
| Net Realized and | | | | | | |
| Unrealized Gain (Loss) | 0.88 | (1.17) | (0.51) | 0.10 | (0.04) | (0.13) |
| Total From | | | | | | |
| Investment Operations | 1.09 | (0.78) | (0.10) | 0.51 | 0.38 | 0.31 |
| Distributions | | | | | | |
| From Net | | | | | | |
| Investment Income | (0.21) | (0.44) | (0.41) | (0.41) | (0.42) | (0.44) |
| Net Asset Value, | | | | | | |
| End of Period | $5.63 | $4.75 | $5.97 | $6.48 | $6.38 | $6.42 |
| |
| Total Return(4) | 23.35% | (13.57)% | (1.65)% | 8.27% | 6.02% | 4.91% |
| |
| Ratios/Supplemental Data | | | | | | |
| Ratio of Operating | | | | | | |
| Expenses to Average | | | | | | |
| Net Assets | 1.04%(5)(6) | 1.05%(5) | 1.05%(5) | 1.04%(5) | 1.06%(5) | 1.13% |
| Ratio of Operating | | | | | | |
| Expenses to Average | | | | | | |
| Net Assets (Before | | | | | | |
| Expense Waiver) | 1.12%(6) | 1.12% | 1.12% | 1.12% | 1.12% | 1.13% |
| Ratio of Net Investment | | | | | | |
| Income (Loss) to Average | | | | | | |
| Net Assets | 8.05%(5)(6) | 7.41%(5) | 6.62%(5) | 6.44%(5) | 6.49%(5) | 6.79% |
| Ratio of Net Investment | | | | | | |
| Income (Loss) to Average | | | | | | |
| Net Assets (Before | | | | | | |
| Expense Waiver) | 7.97%(6) | 7.34% | 6.55% | 6.36% | 6.43% | 6.79% |
| Portfolio Turnover Rate | 25% | 33% | 40% | 45% | 40% | 64% |
| Net Assets, End of Period | | | | | | |
| (in thousands) | $26,932 | $15,289 | $8,275 | $900 | $407 | $385 |
| (1) | Prior to September 4, 2007, the A Class was referred to as the Advisor Class. |
| (2) | Six months ended September 30, 2009 (unaudited). |
| (3) | Computed using average shares outstanding throughout the period. |
| (4) | Total return assumes reinvestment of net investment income and capital gains distributions, if any, and does not reflect applicable sales charges. Total returns for periods less than one year are not annualized. The total return of the classes may not precisely reflect the class expense differences because of the impact of calculating the net asset values to two decimal places. If net asset values were calculated to three decimal places, the total return differences would more closely reflect the class expense differences. The calculation of net asset values to two decimal places is made in accordance with SEC guidelines and does not result in any gain or loss of value between one class and another. |
| (5) | Effective July 29, 2005, the investment advisor voluntarily agreed to waive a portion of its management fee. |
| (6) | Annualized. |
See Notes to Financial Statements.
60
| | | | | | |
| High-Yield | | | | | | |
| |
| B Class | | | | | | |
| For a Share Outstanding Throughout the Years Ended March 31 (except as noted) | | |
| | 2009(1) | 2009 | 2008 | 2007 | 2006 | 2005 |
| Per-Share Data | | | | | | |
| Net Asset Value, | | | | | | |
| Beginning of Period | $4.75 | $5.97 | $6.48 | $6.38 | $6.42 | $6.55 |
| Income From | | | | | | |
| Investment Operations | | | | | | |
| Net Investment | | | | | | |
| Income (Loss) | 0.19(2) | 0.36(2) | 0.36 | 0.36 | 0.37 | 0.39 |
| Net Realized and | | | | | | |
| Unrealized Gain (Loss) | 0.88 | (1.18) | (0.51) | 0.10 | (0.04) | (0.13) |
| Total From | | | | | | |
| Investment Operations | 1.07 | (0.82) | (0.15) | 0.46 | 0.33 | 0.26 |
| Distributions | | | | | | |
| From Net | | | | | | |
| Investment Income | (0.19) | (0.40) | (0.36) | (0.36) | (0.37) | (0.39) |
| Net Asset Value, | | | | | | |
| End of Period | $5.63 | $4.75 | $5.97 | $6.48 | $6.38 | $6.42 |
| |
| Total Return(3) | 22.91% | (14.22)% | (2.39)% | 7.47% | 5.23% | 4.13% |
| |
| Ratios/Supplemental Data | | | | | | |
| Ratio of Operating | | | | | | |
| Expenses to Average | | | | | | |
| Net Assets | 1.79%(4)(5) | 1.80%(4) | 1.80%(4) | 1.79%(4) | 1.81%(4) | 1.88% |
| Ratio of Operating | | | | | | |
| Expenses to Average | | | | | | |
| Net Assets (Before | | | | | | |
| Expense Waiver) | 1.87%(5) | 1.87% | 1.87% | 1.87% | 1.87% | 1.88% |
| Ratio of Net Investment | | | | | | |
| Income (Loss) to Average | | | | | | |
| Net Assets | 7.30%(4)(5) | 6.66%(4) | 5.87%(4) | 5.69%(4) | 5.74%(4) | 6.04% |
| Ratio of Net Investment | | | | | | |
| Income (Loss) to Average | | | | | | |
| Net Assets (Before | | | | | | |
| Expense Waiver) | 7.22%(5) | 6.59% | 5.80% | 5.61% | 5.68% | 6.04% |
| Portfolio Turnover Rate | 25% | 33% | 40% | 45% | 40% | 64% |
| Net Assets, End of Period | | | | | | |
| (in thousands) | $1,404 | $1,187 | $1,119 | $1,358 | $1,182 | $1,105 |
| (1) | Six months ended September 30, 2009 (unaudited). |
| (2) | Computed using average shares outstanding throughout the period. |
| (3) | Total return assumes reinvestment of net investment income and capital gains distributions, if any, and does not reflect applicable sales charges. Total returns for periods less than one year are not annualized. The total return of the classes may not precisely reflect the class expense differences because of the impact of calculating the net asset values to two decimal places. If net asset values were calculated to three decimal places, the total return differences would more closely reflect the class expense differences. The calculation of net asset values to two decimal places is made in accordance with SEC guidelines and does not result in any gain or loss of value between one class and another. |
| (4) | Effective July 29, 2005, the investment advisor voluntarily agreed to waive a portion of its management fee. |
| (5) | Annualized. |
See Notes to Financial Statements.
61
| | | | | | |
| High-Yield | | | | | | |
| |
| C Class | | | | | | |
| For a Share Outstanding Throughout the Years Ended March 31 (except as noted) | | |
| | 2009(1) | 2009 | 2008 | 2007 | 2006 | 2005 |
| Per-Share Data | | | | | | |
| Net Asset Value, | | | | | | |
| Beginning of Period | $4.75 | $5.97 | $6.48 | $6.38 | $6.42 | $6.55 |
| Income From | | | | | | |
| Investment Operations | | | | | | |
| Net Investment | | | | | | |
| Income (Loss) | 0.19(2) | 0.35(2) | 0.36 | 0.36 | 0.37 | 0.39 |
| Net Realized and | | | | | | |
| Unrealized Gain (Loss) | 0.88 | (1.17) | (0.51) | 0.10 | (0.04) | (0.13) |
| Total From | | | | | | |
| Investment Operations | 1.07 | (0.82) | (0.15) | 0.46 | 0.33 | 0.26 |
| Distributions | | | | | | |
| From Net | | | | | | |
| Investment Income | (0.19) | (0.40) | (0.36) | (0.36) | (0.37) | (0.39) |
| Net Asset Value, | | | | | | |
| End of Period | $5.63 | $4.75 | $5.97 | $6.48 | $6.38 | $6.42 |
| |
| Total Return(3) | 22.90% | (14.22)% | (2.39)% | 7.46% | 5.23% | 4.13% |
| |
| Ratios/Supplemental Data | | | | | | |
| Ratio of Operating | | | | | | |
| Expenses to Average | | | | | | |
| Net Assets | 1.79%(4)(5) | 1.80%(4) | 1.80%(4) | 1.79%(4) | 1.81%(4) | 1.88% |
| Ratio of Operating | | | | | | |
| Expenses to Average | | | | | | |
| Net Assets (Before | | | | | | |
| Expense Waiver) | 1.87%(5) | 1.87% | 1.87% | 1.87% | 1.87% | 1.88% |
| Ratio of Net Investment | | | | | | |
| Income (Loss) to Average | | | | | | |
| Net Assets | 7.30%(4)(5) | 6.66%(4) | 5.87%(4) | 5.69%(4) | 5.74%(4) | 6.04% |
| Ratio of Net Investment | | | | | | |
| Income (Loss) to Average | | | | | | |
| Net Assets (Before | | | | | | |
| Expense Waiver) | 7.22%(5) | 6.59% | 5.80% | 5.61% | 5.68% | 6.04% |
| Portfolio Turnover Rate | 25% | 33% | 40% | 45% | 40% | 64% |
| Net Assets, End of Period | | | | | | |
| (in thousands) | $9,962 | $3,120 | $1,678 | $2,002 | $1,823 | $3,351 |
| (1) | Six months ended September 30, 2009 (unaudited). |
| (2) | Computed using average shares outstanding throughout the period. |
| (3) | Total return assumes reinvestment of net investment income and capital gains distributions, if any, and does not reflect applicable sales charges. Total returns for periods less than one year are not annualized. The total return of the classes may not precisely reflect the class expense differences because of the impact of calculating the net asset values to two decimal places. If net asset values were calculated to three decimal places, the total return differences would more closely reflect the class expense differences. The calculation of net asset values to two decimal places is made in accordance with SEC guidelines and does not result in any gain or loss of value between one class and another. |
| (4) | Effective July 29, 2005, the investment advisor voluntarily agreed to waive a portion of its management fee. |
| (5) | Annualized. |
See Notes to Financial Statements.
62
| | | | | |
| High-Yield | | | | | |
| |
| R Class | | | | | |
| For a Share Outstanding Throughout the Years Ended March 31 (except as noted) | | |
| | 2009(1) | 2009 | 2008 | 2007 | 2006(2) |
| Per-Share Data | | | | | |
| Net Asset Value, Beginning of Period | $4.75 | $5.97 | $6.48 | $6.38 | $6.51 |
| Income From Investment Operations | | | | | |
| Net Investment Income (Loss) | 0.22(3) | 0.37(3) | 0.39 | 0.39 | 0.27 |
| Net Realized and Unrealized Gain (Loss) | 0.88 | (1.16) | (0.51) | 0.10 | (0.13) |
| Total From Investment Operations | 1.10 | (0.79) | (0.12) | 0.49 | 0.14 |
| Distributions | | | | | |
| From Net Investment Income | (0.21) | (0.43) | (0.39) | (0.39) | (0.27) |
| Net Asset Value, End of Period | $5.64 | $4.75 | $5.97 | $6.48 | $6.38 |
| |
| Total Return(4) | 23.42% | (13.79)% | (1.90)% | 8.00% | 2.23% |
| |
| Ratios/Supplemental Data | | | | | |
| Ratio of Operating Expenses | | | | | |
| to Average Net Assets(5) | 1.29%(6) | 1.30% | 1.30% | 1.29% | 1.27%(6) |
| Ratio of Operating Expenses to Average | | | | | |
| Net Assets (Before Expense Waiver) | 1.37%(6) | 1.37% | 1.37% | 1.37% | 1.37%(6) |
| Ratio of Net Investment Income (Loss) | | | | | |
| to Average Net Assets(5) | 7.80%(6) | 7.16% | 6.37% | 6.19% | 6.39%(6) |
| Ratio of Net Investment Income | | | | | |
| (Loss) to Average Net Assets | | | | | |
| (Before Expense Waiver) | 7.72%(6) | 7.09% | 6.30% | 6.11% | 6.29%(6) |
| Portfolio Turnover Rate | 25% | 33% | 40% | 45% | 40%(7) |
| Net Assets, End of Period (in thousands) | $808 | $86 | $27 | $28 | $26 |
| (1) | Six months ended September 30, 2009 (unaudited). |
| (2) | July 29, 2005 (commencement of sale) through March 31, 2006. |
| (3) | Computed using average shares outstanding throughout the period. |
| (4) | Total return assumes reinvestment of net investment income and capital gains distributions, if any. Total returns for periods less than one year are not annualized. The total return of the classes may not precisely reflect the class expense differences because of the impact of calculating the net asset values to two decimal places. If net asset values were calculated to three decimal places, the total return differences would more closely reflect the class expense differences. The calculation of net asset values to two decimal places is made in accordance with SEC guidelines and does not result in any gain or loss of value between one class and another. |
| (5) | Effective July 29, 2005, the investment advisor voluntarily agreed to waive a portion of its management fee. |
| (6) | Annualized. |
| (7) | Portfolio turnover is calculated at the fund level . Percentage indicated was calculated for the year ended March 31, 2006. |
See Notes to Financial Statements.
63
|
| Approval of Management Agreements |
Under Section 15(c) of the Investment Company Act, contracts for investment advisory services to a mutual fund are required to be reviewed, evaluated and approved each year by the fund’s board of directors/trustees, including a majority of a fund’s independent directors/trustees (the “Directors”).
At American Century Investments, this process is referred to as the “15(c) Process.” The board oversees on a continuous basis and evaluates at its quarterly meetings, directly and through the committees of the board, the nature and quality of significant services provided by the advisor, the investment performance of the funds, shareholder services, audit and compliance functions and a variety of other matters relating to fund operations. Each year, it also holds a special meeting in connection with determining whether to renew the contracts for advisory services, to review fund performance, shareholder services, adviser profitability, audit and compliance matters, and other fund operational matters.
Under a Securities and Exchange Commission rule, each fund is required to disclose in its annual or semiannual report, as appropriate, the material factors and conclusions that formed the basis for the board’s approval or renewal of any advisory agreements within the fund’s most recently completed fiscal half-year period.
Annual Contract Review Process
As part of the annual 15(c) Process, the Directors requested and reviewed extensive data and information compiled by the advisor and certain independent providers of evaluative data (the “15(c) Providers”) concerning Diversified Bond and High-Yield (the “funds”) and the services provided to the funds under the management agreement. The information considered and the discussions held at the meetings included, but were not limited to:
• the nature, extent and quality of investment management, shareholder services and other services that the advisor provides to the funds;
• the wide range of programs and services the advisor provides to the funds and their shareholders on a routine and non-routine basis;
• the compliance policies, procedures, and regulatory experience of the advisor;
• data comparing the cost of owning each fund to the cost of owning a similar fund;
• data comparing each fund’s performance to appropriate benchmarks and/or a peer group of other mutual funds with similar investment objectives and strategies;
• financial data showing the profitability of each fund to the advisor and the overall profitability of the advisor;
• data comparing services provided and charges to other non-fund investment management clients of the advisor; and
64
• collateral or “fall-out” benefits derived by the advisor from the manage-ment of the funds, and potential sharing of economies of scale in connection with the management of the funds.
In keeping with its practice, the Directors at a special meeting and at a regularly scheduled quarterly meeting reviewed and discussed the information provided by the advisor throughout the year and to negotiate with the advisor the renewal of the management agreement, including the setting of the applicable management fee. The Directors had the benefit of the advice of their independent counsel throughout the period.
Factors Considered
The Directors considered all of the information provided by the advisor, independent data providers, and the board’s independent counsel, and evaluated such information for each fund the board oversees. The Directors did not identify any single factor as being all-important or controlling, and each Director may have attributed different levels of importance to different factors. In deciding to renew each fund’s management agreement under the terms ultimately determined by the board to be appropriate, the Directors based their decision on a number of factors, including the following.
Nature, Extent and Quality of Services — Generally. Under the management agreement, the advisor is responsible for providing or arranging for all services necessary for the operation of the funds. The board noted that under the management agreement, the advisor provides or arranges at its own expense a wide variety of services including:
• fund construction and design
• initial capitalization/funding
• portfolio research and security selection
• securities trading
• fund administration
• custody of fund assets
• daily valuation of fund portfolios
• shareholder servicing and transfer agency, including shareholder confirmations, recordkeeping and communications
• legal services
• regulatory and portfolio compliance
• financial reporting
• marketing and distribution
65
The Directors noted that many of these services have expanded over time both in terms of quantity and complexity in response to shareholder demands, competition in the industry, changing distribution channels and the changing regulatory environment. In performing their evaluation, the Directors considered information received in connection with the annual review, as well as information provided on an ongoing basis throughout the year and at their regularly scheduled board and committee meetings.
Investment Management Services. The nature of the investment management services provided is quite complex and allows fund shareholders access to professional money management, instant diversification of their investments within an asset class, the opportunity to easily diversify among asset classes, and liquidity. In evaluating investment performance, the board expects the advisor to manage each fund in accordance with its investment objectives and approved strategies. In providing these services, the advisor utilizes teams of investment professionals (portfolio managers, analysts, research assistants, and securities traders) who require extensive information technology, research, training, compliance and other systems to conduct their business. At each quarterly meeting and at the special meeting to consider renewal of the management agr eement, the Directors, directly and through its Portfolio Committee, review investment performance information for each fund, together with comparative information for appropriate benchmarks and/or peer groups of similarly-managed funds, over different time horizons. If performance concerns are identified, the underperforming fund receives special reviews until performance improves, during which Directors discuss with the advisor the reasons for such underperformance (e.g., market conditions, security and sector selection) and any efforts being undertaken to improve performance. High-Yield’s performance for both the one- and three-year periods was above its benchmark. Diversified Bond’s performance was above its benchmark for the three-year period and below its benchmark for the one-year period.
Shareholder and Other Services. The advisor provides the funds with a comprehensive package of transfer agency, shareholder, and other services. The Directors, directly and through the various Committees of the Board, review reports and evaluations of such services at their regular quarterly meetings and at their special meeting to consider renewal of the management agreement, including the annual meeting concerning contract review, and other reports to the board. These reports include, but are not limited to, information regarding the operational efficiency and accuracy of the shareholder and transfer agency services provided, staffing levels, shareholder satisfaction (as measured by external as well as internal sources), technology support, new products and services offered to fund shareholders, securities trading activities, portfolio v aluation services, auditing services, and legal and operational compliance activities. Certain aspects of shareholder and transfer agency service level efficiency and the quality of securities trading activities are measured by independent third party providers and are presented in comparison to other fund groups not managed by the advisor.
66
Costs of Services Provided and Profitability. The advisor provides detailed information concerning its cost of providing various services to the funds, its profitability in managing each fund, its overall profitability, and its financial condition. The Directors have reviewed with the advisor the methodology used to prepare this financial information. The Directors have also reviewed with the advisor its methodology for compensating the investment professionals that provide services to the funds. This financial information regarding the advisor is considered in order to evaluate the advisor’s financial condition, its ability to continue to provide services under the management agreement, and the reasonableness of the current management fee.
Ethics. The Directors generally consider the advisor’s commitment to providing quality services to shareholders and to conducting its business ethically. They noted that the advisor’s practices generally meet or exceed industry best practices.
Economies of Scale. The Directors review information provided by the advisor regarding the existence of economies of scale in connection with the investment management of the funds. The Directors concluded that economies of scale are difficult to measure and predict with precision, especially on a fund-by-fund basis. The analysis of economies of scale is further complicated by the additional services and content provided by the advisor and its reinvestment in its ability to provide and expand those services. Accordingly, the Directors seek to evaluate economies of scale by reviewing information, such as year-over-year profitability of the advisor generally, the profitability of its management of each fund specifically, and the expenses incurred by the advisor in providing various functions to the funds. The Directors believe the advisor is appropriately sharing economies of scale through its competitive fee structure, fee breakpoints as the fund complex and the fund increase in size, and through reinvestment in its business to provide shareholders additional services and enhancements to existing services. In particular, separate breakpoint schedules based on the size of the entire fund complex and on the size of each fund reflect the complexity of assessing economies of scale.
Comparison to Other Funds’ Fees. Each fund pays the advisor a single, all-inclusive (or unified) management fee for providing all services necessary for the management and operation of the fund, other than brokerage expenses, taxes, interest, extraordinary expenses, and the fees and expenses of the fund’s independent directors (including their independent legal counsel). Under the unified fee structure, the advisor is responsible for providing all investment advisory, custody, audit, administrative, compliance, recordkeeping, marketing and shareholder services, or arranging and supervising third parties to provide such services. By contrast, most other funds are charged a variety of fees, including an investment advisory fee, a transfer agency fee, an administrative fee, distribution charges and other expenses. Other than their i nvestment advisory fees and Rule 12b-1 distribution fees, the components of the total fees charged by these other funds may be increased without shareholder approval. The board believes the unified fee structure is a benefit to fund shareholders because it clearly discloses to shareholders the cost of owning fund shares, and, since the unified fee cannot be increased without
67
a vote of fund shareholders, it shifts to the advisor the risk of increased costs of operating the fund and provides a direct incentive to minimize administrative inefficiencies. Part of the Directors’ analysis of fee levels involves reviewing certain evaluative data compiled by an independent provider and comparing the fund’s unified fee to the total expense ratio of other funds in the fund’s peer group. The Directors also reviewed updated fee level data provided by the advisor, but recognized that comparative data was particularly difficult to evaluate given the significant market developments during the past year impacting fund assets. The unified fee charged to shareholders of each fund was below the median of the total expense ratios of its respective peer group.
Comparison to Fees and Services Provided to Other Clients of the Advisor. The Directors also requested and received information from the advisor concerning the nature and extent of the services, fees, and profitability of its advisory services to advisory clients other than the funds. They observed that these varying types of client accounts require different services and involve different regulatory and entrepreneurial risks than the management of the funds. The Directors analyzed this information and concluded that the fees charged and services provided to the funds were reasonable by comparison.
Collateral or “Fall-Out” Benefits Derived by the Advisor. The Directors considered the existence of collateral benefits the advisor may receive as a result of its relationship with the funds. They concluded that the advisor’s primary business is managing mutual funds and it generally does not use fund or shareholder information to generate profits in other lines of business, and therefore does not derive any significant collateral benefits from them. The Directors noted that the advisor receives proprietary research from broker dealers that execute fund portfolio transactions but concluded that this research is likely to benefit fund shareholders. The Directors also determined that the advisor is able to provide investment management services to certain clients other than the funds, at least in part, due to its existing infr astructure built to serve the fund complex. The Directors concluded, however, that the assets of those other clients are not material to the analysis and, in any event, are included with the assets of each fund to determine breakpoints in the fund’s fee schedule, provided they are managed using the same investment team and strategy.
Conclusions of the Directors
As a result of this process, the Directors, in the absence of particular circumstances and assisted by the advice of their independent legal counsel, taking into account all of the factors discussed above and the information provided by the advisor and others, concluded that the investment management agreement between each fund and the advisor, including the management fee, is fair and reasonable in light of the services provided and should be renewed for a one-year term. In addition, the Directors negotiated a one-year waiver by the advisor of a portion of the management fee for each fund. These changes were proposed by the Directors based on their review of the percentile rank of the fund’s fees within the fund’s peer universe and the fact that the Directors seek, as a general rule, to have total expense ratios of existing fixed income and money market funds in the lowest 25th percentile of the fees of comparable funds.
68
Retirement Account Information
As required by law, distributions you receive from certain IRAs, or 403(b), 457 and qualified plans are subject to federal income tax withholding, unless you elect not to have withholding apply. Tax will be withheld on the total amount withdrawn even though you may be receiving amounts that are not subject to withholding, such as nondeductible contributions. In such case, excess amounts of withholding could occur. You may adjust your withholding election so that a greater or lesser amount will be withheld.
If you don’t want us to withhold on this amount, you must notify us to not withhold the federal income tax. You may notify us in writing or in certain situations by telephone or through other electronic means. You have the right to revoke your withholding election at any time and any election you make may remain in effect until revoked by filing a new election.
Remember, even if you elect not to have income tax withheld, you are liable for paying income tax on the taxable portion of your withdrawal. If you elect not to have income tax withheld or you don’t have enough income tax withheld, you may be responsible for payment of estimated tax. You may incur penalties under the estimated tax rules if your withholding and estimated tax payments are not sufficient. You can reduce or defer the income tax on a distribution by directly or indirectly rolling such distribution over to another IRA or eligible plan. You should consult your tax advisor for additional information.
State tax will be withheld if, at the time of your distribution, your address is within one of the mandatory withholding states and you have federal income tax withheld. State taxes will be withheld from your distribution in accordance with the respective state rules.
Proxy Voting Guidelines
American Century Investment Management, Inc., the funds’ investment advisor, is responsible for exercising the voting rights associated with the securities purchased and/or held by the funds. A description of the policies and procedures the advisor uses in fulfilling this responsibility is available without charge, upon request, by calling 1-800-345-2021. It is also available on American Century Investments’ website at americancentury.com and on the Securities and Exchange Commission’s website at sec.gov. Information regarding how the investment advisor voted proxies relating to portfolio securities during the most recent 12-month period ended June 30 is available on the “About Us” page at americancentury.com. It is also available at sec.gov.
Quarterly Portfolio Disclosure
The funds file their complete schedule of portfolio holdings with the Securities and Exchange Commission (SEC) for the first and third quarters of each fiscal year on Form N-Q. The funds’ Forms N-Q are available on the SEC’s website at sec.gov, and may be reviewed and copied at the SEC’s Public Reference Room in Washington, DC. Information on the operation of the Public Reference Room may be obtained by calling 1-800-SEC-0330. The funds also make their complete schedule of portfolio holdings for the most recent quarter of their fiscal year available on their website at americancentury.com and, upon request, by calling 1-800-345-2021.
69
The following indices are used to illustrate investment market, sector, or style performance or to serve as fund performance comparisons. They are not investment products available for purchase.
The Citigroup Agency Index is a market-capitalization-weighted index that includes US government sponsored agencies with a remaining maturity of at least one year.
The Citigroup Credit Index includes US and non-US corporate securities and non-US sovereign and provincial securities.
The Citigroup High-Yield Cash-Pay Index is composed of those cash-pay securities included in the Citigroup US High-Yield Market Index with remaining maturities of at least one year.
The Citigroup Mortgage Index measures the mortgage component of the US BIG Bond Index, comprising 15- and 30-year GNMA, FNMA, and FHLMC pass-throughs and FNMA and FHLMC balloon mortgages.
The Citigroup Treasury Index is comprised of US Treasury securities with an amount outstanding of at least $5 billion and a remaining maturity of at least one year.
The Citigroup US Broad Investment-Grade (BIG) Bond Index is a market-capitalization-weighted index that includes fixed-rate Treasury, government-sponsored, mortgage, asset-backed, and investment-grade issues with a maturity of one year or longer.
The Citigroup US High-Yield Market Index captures the performance of below-investment-grade debt issued by corporations domiciled in the United States or Canada. This index includes cash-pay and deferred-interest securities that are publicly placed, have a fixed coupon, and are nonconvertible.
The Citigroup US Inflation-Linked Securities Index (ILSI)SM measures the return of bonds with fixed-rate coupon payments that adjust for inflation as measured by the Consumer Price Index (CPI).
The Merrill Lynch US High Yield Master II Constrained Index tracks the performance of below investment-grade U.S. dollar-denominated corporate bonds publicly issued in the U.S. domestic markets and limits any single issuer to no more than 2% of the index.
70
71
72

| |
| |
| Contact Us | |
| americancentury.com | |
| Automated Information Line | 1-800-345-8765 |
| Investor Services Representative | 1-800-345-2021 or |
| | 816-531-5575 |
| Investors Using Advisors | 1-800-378-9878 |
| Business, Not-For-Profit, Employer-Sponsored | |
| Retirement Plans | 1-800-345-3533 |
| Banks and Trust Companies, Broker-Dealers, | |
| Financial Professionals, Insurance Companies | 1-800-345-6488 |
| Telecommunications Device for the Deaf | 1-800-634-4113 |
| American Century Investment Trust | |
| Investment Advisor: | |
| American Century Investment Management, Inc. | |
| Kansas City, Missouri | |
This report and the statements it contains are submitted for the general information of our shareholders. The report is not authorized for distribution to prospective investors unless preceded or accompanied by an effective prospectus.
American Century Investment Services, Inc., Distributor
©2009 American Century Proprietary Holdings, Inc. All rights reserved.
0911 CL-SAN-66872N
|
| Semiannual Report |
| September 30, 2009 |

|
| American Century Investments |
Premium Money Market Fund

Dear Investor:
Thank you for your investment with us during the financial reporting period ended September 30, 2009. We appreciate your trust in American Century Investments® at this volatile, transitional time in the economy and investment markets.
As the upheavals associated with the “Great Recession” gradually subside, our senior management team has put considerable thought into how the investment environment has changed and what new challenges and opportunities await us. Critical factors that we are anticipating in the coming year include marked shifts in investment and spending behavior, along with consolidation in our industry.
Most importantly, we think the economic recovery will be slow and extended. The economy and capital markets have come a long way since Lehman Brothers collapsed over a year ago, but 2010 will likely bring continuing challenges. The stock market’s rebound since last March and the third-quarter economic surge this year were fueled largely by corporate cost-cutting and unprecedented monetary and fiscal stimulus, including some key programs that have since expired or been scaled back.
Meanwhile, the resilient but struggling consumer sector still faces rising unemployment, heavy debt burdens, tight credit conditions, and a housing market that is starting to stabilize, but remains vulnerable. Much of our investment positioning in 2009 has cautiously reflected these still unstable economic fundamentals, leading to underperformance, in some cases, versus market benchmarks buoyed by the rally of riskier assets. We still support our fundamentally based positioning because we believe strongly that some markets—driven more by technical factors than fundamentals—have advanced further than underlying economic conditions warrant, and remain susceptible to the possibility of more volatility ahead.
For more detailed information from our portfolio management team about the performance and positioning of your investment, please review the following pages, or visit our website, americancentury.com.
Thank you for your continued confidence in us.
Sincerely,

Jonathan S. Thomas
President and Chief Executive Officer
American Century Investments
| |
| Market Perspective | 2 |
| U.S. Fixed-Income Total Returns | 2 |
| |
| Premium Money Market | |
| |
| Performance | 3 |
| Yields | 4 |
| Weighted Average Maturity/Life | 4 |
| Portfolio Composition by Credit Rating | 4 |
| Portfolio Composition by Maturity | 4 |
| |
| Shareholder Fee Example | 5 |
| |
| Financial Statements | |
| |
| Schedule of Investments | 7 |
| Statement of Assets and Liabilities | 12 |
| Statement of Operations | 13 |
| Statement of Changes in Net Assets | 14 |
| Notes to Financial Statements | 15 |
| Financial Highlights | 19 |
| |
| Other Information | |
| |
| Approval of Management Agreement | 20 |
| Additional Information | 25 |
| Index Definitions | 26 |
The opinions expressed in the Market Perspective reflect those of the portfolio management team as of the date of the report, and do not necessarily represent the opinions of American Century Investments or any other person in the American Century Investments organization. Any such opinions are subject to change at any time based upon market or other conditions and American Century Investments disclaims any responsibility to update such opinions. These opinions may not be relied upon as investment advice and, because investment decisions made by American Century Investments funds are based on numerous factors, may not be relied upon as an indication of trading intent on behalf of any American Century Investments fund. Security examples are used for representational purposes only and are not intended as recommendations to purchase or sell securities. Performance information for comparative indices and securities is prov ided to American Century Investments by third party vendors. To the best of American Century Investments’ knowledge, such information is accurate at the time of printing.

By David MacEwen, Chief Investment Officer, Fixed Income
Economy Stabilized, Short-Term Rates Remained Low
The six months ended September 30, 2009, witnessed a remarkable rebound by U.S. financial markets as the credit crisis eased and the economy showed signs of stabilizing. Government stimulus boosted consumer spending, home prices steadied, and liquidity returned to credit markets. However, the unemployment rate rose to 9.8% in September, raising prospects of a weak, “jobless” recovery. To boost growth, the Federal Reserve continued to hold its short-term rate target at 0%–0.25%, and said it would keep rates low for the foreseeable future, a key issue for money market funds.
Use of WAL Anticipates Money Fund Changes
Another key issue is a set of proposed government regulations and related disclosure changes designed to strengthen money funds and improve their transparency. At American Century Investments, we are committed to helping investors understand and make informed decisions about their financial holdings. As part of this commitment, and in alignment with proposed changes, we have added Weighted Average Life (WAL) to accompany the Weighted Average Maturity (WAM) data we provide in our money fund reports. WAL, like WAM, measures potential interest rate and credit risk exposure.
However, WAM alone may understate risk exposure in portfolios that own variable- and floating-rate securities (floaters) with interest-rate reset dates. For WAL calculation purposes, a one-year floater with a 30-day interest-rate reset feature would have a 365-day remaining life (until maturity). For WAM calculation purposes, this floater would have a remaining life of just 30 days (until the next reset). WAL illustrates better than WAM the continued exposure investors have to this floater until maturity. If no floaters are present, the WAL and WAM become similar.
Providing WAL is one of three enhancements that American Century Investments has implemented prior to the expected new government regulations. The others are: 1) posting money fund portfolio holdings on a monthly basis on our website, americancentury.com, and 2) restricting our money fund WAMs to 75 days or less. We support the spirit and intent of the proposed regulations and will comply fully with the final policies when they are announced.
| | | | |
| U.S. Fixed-Income Total Returns | | | | |
| For the six months ended September 30, 2009* | | | |
| Treasury Securities | | | Citigroup U.S. Bond Market Indices | |
| 3-Month Bill | 0.09% | | High-Yield Cash-Pay (corporate) | 37.81% |
| 2-Year Note | 0.73% | | Credit (investment-grade corporate) | 16.39% |
| 10-Year Note | –3.82% | | Broad Investment-Grade (multi-sector) | 4.80% |
| 30-Year Bond | –6.62% | | Inflation-Linked Securities | 3.47% |
| | | | Mortgage (mortgage-backed) | 2.89% |
| | | | Agency | 1.51% |
| | | | Treasury | –1.03% |
| *Total returns for periods less than one year are not annualized. | | | |
2
| | | | | | | | |
| Premium Money Market | | | | | |
| |
| Total Returns as of September 30, 2009 | | | | |
| | | | | | Average Annual Returns | |
| | | | | | | | Since | Inception |
| | | | 6 months(1) | 1 year | 5 years | 10 years | Inception | Date |
| Premium Money Market | | 0.21% | 1.13% | 3.26%(2) | 3.07% | 3.74% | 4/1/93 |
| 90-Day U.S. Treasury | | | | | | | |
| Bill Index(3) | | 0.08% | 0.21% | 2.82% | 2.83% | 3.58%(4) | — |
| Lipper Money Market | | | | | | | |
| Instrument Funds | | | | | | | |
| Average Return(3) | | 0.05% | 0.50% | 2.72% | 2.59% | 3.47%(4) | — |
| Fund’s Lipper Ranking among | | | | | | |
| Money Market Instrument Funds(3) | 12 of 302 | 11 of 294 | 13 of 259 | 13 of 197 | — | — |
|
| Premium Money Market acquired all of the net assets of American Century Capital Reserve Fund and the American Century Premium |
| Government Reserve Fund on December 3, 2001, pursuant to a plan approved by the acquired funds’ shareholders on November 16, 2001. |
| Performance information prior to December 3, 2001 is that of the American Century Premium Capital Reserve Fund. | |
| |
| (1) | Total returns for periods less than one year are not annualized. | | | | |
| (2) | Fund returns would have been lower if American Century Investments had not voluntarily waived a portion of its management fees. |
| (3) | Data provided by Lipper Inc. — A Reuters Company. © 2009 Reuters. All rights reserved. Any copying, republication or redistribution of Lipper |
| | content, including by caching, framing or similar means, is expressly prohibited without the prior written consent of Lipper. Lipper shall not be |
| | liable for any errors or delays in the content, or for any actions taken in reliance thereon. | | | |
| | Lipper Fund Performance — Performance data is total return, and is preliminary and subject to revision. | | |
| | Lipper Rankings — Rankings are based only on the universe shown and are based on average annual total returns. This listing might not |
| | represent the complete universe of funds tracked by Lipper. | | | | | |
| | The data contained herein has been obtained from company reports, financial reporting services, periodicals and other resources believed to be |
| | reliable. Although carefully verified, data on compilations is not guaranteed by Lipper and may be incomplete. No offer or solicitations to buy or |
| | sell any of the securities herein is being made by Lipper. | | | | | |
| (4) | Since 3/31/93, the date nearest the fund’s inception for which data are available. | | | |
| |
| Total Annual Fund Operating Expenses | | | | | |
| Premium Money Market | 0.49% | | | | | |
The total annual fund operating expenses shown is as stated in the fund’s prospectus current as of the date of this report. The prospectus may vary from the expense ratio shown elsewhere in this report because it is based on a different time period, includes acquired fund fees and expenses, and, if applicable, does not include fee waivers or expense reimbursements.
Data presented reflect past performance. Past performance is no guarantee of future results. Current performance may be higher or lower than the performance shown. To obtain performance data current to the most recent month end, please call 1-800-345-2021 or visit americancentury.com.
An investment in the fund is not insured or guaranteed by the Federal Deposit Insurance Corporation or any other government agency. Although the fund seeks to preserve the value of your investment at $1.00 per share, it is possible to lose money by investing in the fund.
The 7-day current yield more closely reflects the current earnings of the fund than the total return.
3
| | | |
| Premium Money Market | | |
| |
| Yields as of September 30, 2009 | | |
| 7-Day Current Yield | | |
| After waiver(1)(2) | | 0.21% |
| Before waiver | | 0.21% |
| 7-Day Effective Yield(1) | | |
| | | | 0.21% |
| |
| Weighted Average Maturity/Life | | |
| | | 9/30/09 | 3/31/09 |
| Weighted Average Maturity | 66 days | 64 days |
| Weighted Average Life | 73 days | N/A |
| (1) | The yields presented reflect the waiver of a portion of the fund’s management fees. Without such waiver, the 7-day yields would have been lower. |
| (2) | The effect of the waiver was less than 0.005%. | | |
| |
| Portfolio Composition by Credit Rating | | |
| | | % of fund | % of fund |
| | | investments | investments |
| | | as of 9/30/09 | as of 3/31/09 |
| A-1+ | 78% | 80% |
| A-1 | | 22% | 20% |
| Ratings provided by independent research companies. These ratings are listed in Standard & Poor’s format even if they were provided by other sources. |
| The letter ratings indicate the credit worthiness of the underlying bonds in the portfolio and generally range from AAA (highest) to D (lowest). |
| |
| Portfolio Composition by Maturity | | |
| | | % of fund | % of fund |
| | | investments | investments |
| | | as of 9/30/09 | as of 3/31/09 |
| 1-30 days | 49% | 59% |
| 31-90 days | 26% | 19% |
| 91-180 days | 16% | 10% |
| More than 180 days | 9% | 12% |
Data presented reflect past performance. Past performance is no guarantee of future results. Current performance may be higher or lower than the performance shown. To obtain performance data current to the most recent month end, please call 1-800-345-2021 or visit americancentury.com.
An investment in the fund is not insured or guaranteed by the Federal Deposit Insurance Corporation or any other government agency. Although the fund seeks to preserve the value of your investment at $1.00 per share, it is possible to lose money by investing in the fund.
The 7-day current yield more closely reflects the current earnings of the fund than the total return.
4
|
| Shareholder Fee Example (Unaudited) |
Fund shareholders may incur two types of costs: (1) transaction costs, including sales charges (loads) on purchase payments and redemption/ exchange fees; and (2) ongoing costs, including management fees; distribution and service (12b-1) fees; and other fund expenses. This example is intended to help you understand your ongoing costs (in dollars) of investing in your fund and to compare these costs with the ongoing cost of investing in other mutual funds.
The example is based on an investment of $1,000 made at the beginning of the period and held for the entire period from April 1, 2009 to September 30, 2009.
Actual Expenses
The table provides information about actual account values and actual expenses for each class. You may use the information, together with the amount you invested, to estimate the expenses that you paid over the period. First, identify the share class you own. Then simply divide your account value by $1,000 (for example, an $8,600 account value divided by $1,000 = 8.6), then multiply the result by the number under the heading “Expenses Paid During Period” to estimate the expenses you paid on your account during this period.
If you hold Investor Class shares of any American Century Investments fund, or Institutional Class shares of the American Century Diversified Bond Fund, in an American Century Investments account (i.e., not a financial intermediary or retirement plan account), American Century Investments may charge you a $12.50 semiannual account maintenance fee if the value of those shares is less than $10,000. We will redeem shares automatically in one of your accounts to pay the $12.50 fee. In determining your total eligible investment amount, we will include your investments in all personal accounts (including American Century Investments Brokerage accounts) registered under your Social Security number. Personal accounts include individual accounts, joint accounts, UGMA/UTMA accounts, personal trusts, Coverdell Education Savings Accounts and IRAs (including traditional, Roth, Rollover, SEP-, SARSEP- and SIMPLE-IRAs), and certain other retirement accounts. If you have only business, business retirement, employer-sponsored or American Century Investments Brokerage accounts, you are currently not subject to this fee. We will not charge the fee as long as you choose to manage your accounts exclusively online. If you are subject to the Account Maintenance Fee, your account value could be reduced by the fee amount.
5
Hypothetical Example for Comparison Purposes
The table also provides information about hypothetical account values and hypothetical expenses based on the actual expense ratio of each class of your fund and an assumed rate of return of 5% per year before expenses, which is not the actual return of a fund’s share class. The hypothetical account values and expenses may not be used to estimate the actual ending account balance or expenses you paid for the period. You may use this information to compare the ongoing costs of investing in your fund and other funds. To do so, compare this 5% hypothetical example with the 5% hypothetical examples that appear in the shareholder reports of the other funds.
Please note that the expenses shown in the table are meant to highlight your ongoing costs only and do not reflect any transactional costs, such as sales charges (loads) or redemption/exchange fees. Therefore, the table is useful in comparing ongoing costs only, and will not help you determine the relative total costs of owning different funds. In addition, if these transactional costs were included, your costs would have been higher.
| | | | | |
| | | Beginning | Ending | Expenses Paid | |
| | | Account Value | Account Value | During Period(1) | Annualized |
| | | 4/1/09 | 9/30/09 | 4/1/09 – 9/30/09 | Expense Ratio(1) |
| Actual (after waiver)(2) | $1,000 | $1,002.10 | $2.41 | 0.48% |
| Actual (before waiver) | $1,000 | $1,002.10(3) | $2.46 | 0.49% |
| Hypothetical (after waiver)(2) | $1,000 | $1,022.66 | $2.43 | 0.48% |
| Hypothetical (before waiver) | $1,000 | $1,022.61 | $2.48 | 0.49% |
| |
| (1) | Expenses are equal to the fund’s annualized expense ratio listed in the table above, multiplied by the average account value over the period, |
| | multiplied by 183, the number of days in the most recent fiscal half-year, divided by 365, to reflect the one-half year period. |
| (2) | During the six months ended September 30, 2009, the fund received a partial waiver of its management fee. | |
| (3) | Ending account value assumes the return earned after waiver. The return would have been lower had fees not been waived and would have |
| | resulted in a lower ending account value. | | | |
6
| | | | | | |
| Premium Money Market | | | | |
| |
| SEPTEMBER 30, 2009 (UNAUDITED) | | | | | |
| |
| | Principal | | | | Principal | |
| | Amount | Value | | | Amount | Value |
| Commercial Paper(1) — 44.9% | | | Pfizer, Inc., | | |
| | | | | 0.46%, 2/26/10(2) | $38,000,000 | $ 37,928,138 |
| Bank of Nova Scotia, | | | | Providence Health & | | |
| 0.17%, 10/9/09 | $15,000,000 | $ 14,999,433 | | Services, 1.00%, 12/7/09 | 7,000,000 | 7,000,000 |
| BASF SE, | | | | Regents of University of | | |
| 0.35%, 11/23/09(2) | 21,000,000 | 20,989,106 | | | | |
| | | | | California, 0.27%, 10/13/09 | 20,000,000 | 19,998,200 |
| BNP Paribas Finance, Inc., | | | | Salvation Army (The), | | |
| 0.24%, 10/26/09 | 15,000,000 | 14,997,500 | | 1.00%, 10/7/09 | 5,100,000 | 5,100,000 |
| California Educational | | | | Salvation Army (The), | | |
| Facilities Auth., | | | | 0.32%, 10/8/09 | 19,000,000 | 19,000,000 |
| 0.19%, 10/14/09 | 3,700,000 | 3,700,000 | | | | |
| Catholic Health Initiatives, | | | | Swedbank AB, | | |
| | | | | 0.57%, 11/16/09(2) | 4,000,000 | 3,997,087 |
| 0.70%, 11/12/09 | 17,000,000 | 17,000,000 | | | | |
| | | | | Toyota Motor Credit Corp., | | |
| Catholic Health Initiatives, | | | | 0.35%, 10/5/09 | 13,600,000 | 13,599,471 |
| 0.95%, 2/4/10 | 14,000,000 | 14,000,000 | | | | |
| | | | | Toyota Motor Credit Corp., | | |
| Charta LLC, | | | | 0.24%, 11/30/09 | 18,500,000 | 18,492,600 |
| 0.23%, 11/2/09(2) | 18,000,000 | 17,996,320 | | | | |
| | | | | Toyota Motor Credit Corp., | | |
| Chicago Midway Airport, | | | | 0.25%, 12/2/09 | 11,500,000 | 11,495,049 |
| 0.45%, 11/3/09 | 3,799,000 | 3,799,000 | | | | |
| | | | | Yale University, | | |
| Citibank Credit Card | | | | 0.45%, 11/17/09 | 15,000,000 | 14,991,188 |
| Issuance Trust, | | | | | | |
| 0.31%, 10/9/09(2) | 7,000,000 | 6,999,518 | | TOTAL COMMERCIAL PAPER | | 469,816,504 |
| Crown Point Capital Co. LLC, | | | | U.S. Government Agency | |
| 0.45%, 10/13/09(2) | 28,000,000 | 27,995,800 | | | | |
| Crown Point Capital Co. LLC, | | | | Securities and Equivalents — 23.0% |
| 0.45%, 10/26/09(2) | 8,000,000 | 7,997,500 | | FIXED-RATE U.S. GOVERNMENT | |
| Crown Point Capital Co. LLC, | | | | AGENCY SECURITIES — 15.8% | |
| 0.45%, 11/2/09(2) | 14,000,000 | 13,994,400 | | FFCB, 5.08%, 12/2/09 | 4,000,000 | 4,033,232 |
| Govco LLC, | | | | FFCB, 3.875%, 12/17/09 | 4,600,000 | 4,629,909 |
| 1.11%, 10/27/09(2) | 15,000,000 | 14,988,083 | | FFCB, 0.80%, 2/2/10 | 6,140,000 | 6,137,575 |
| Govco LLC, | | | | FHLB, 4.50%, 10/9/09 | 9,000,000 | 9,007,405 |
| 0.78%, 12/11/09(2) | 23,000,000 | 22,964,618 | | FHLB, 6.50%, 11/13/09 | 1,200,000 | 1,208,080 |
| Honeywell International, Inc., | | | | FHLB, 5.00%, 12/11/09 | 10,000,000 | 10,079,196 |
| 0.60%, 10/20/09(2) | 12,050,000 | 12,046,184 | | | | |
| | | | | FHLB, 3.50%, 1/6/10 | 20,000,000 | 20,135,056 |
| Honeywell International, Inc., | | | | FHLB, 0.87%, 1/26/10 | 10,000,000 | 9,995,982 |
| 0.96%, 12/7/09(2) | 11,000,000 | 10,980,551 | | | | |
| Jupiter Securitization Co. | | | | FHLB, 1.05%, 3/9/10 | 10,000,000 | 9,998,319 |
| LLC, 0.19%, 10/15/09(2) | 10,000,000 | 9,999,261 | | FHLB, 4.875%, 3/12/10 | 6,000,000 | 6,100,655 |
| Legacy Capital LLC, | | | | FHLB, 5.00%, 3/12/10 | 2,000,000 | 2,042,440 |
| 0.45%, 11/9/09(2) | 14,000,000 | 13,993,175 | | FHLB, 4.375%, 3/17/10 | 3,000,000 | 3,044,851 |
| Legacy Capital LLC, | | | | FHLB, 0.60%, 6/22/10 | 15,000,000 | 14,983,943 |
| 0.45%, 11/20/09(2) | 15,200,000 | 15,190,500 | | FHLB, 0.55%, 7/28/10 | 15,000,000 | 14,998,120 |
| Lexington Parker Capital, | | | | FHLB, 0.55%, 7/29/10 | 7,000,000 | 6,998,523 |
| 0.45%, 10/13/09(2) | 10,000,000 | 9,998,500 | | | | |
| | | | | FHLB, 0.625%, 8/17/10 | 5,000,000 | 4,997,808 |
| Lexington Parker Capital, | | | | | | |
| 0.45%, 11/20/09(2) | 20,000,000 | 19,987,500 | | FHLB, 0.56%, 8/20/10 | 10,000,000 | 9,995,841 |
| Lower Colorado River Auth., | | | | FHLB, 5.125%, 9/10/10 | 6,550,000 | 6,821,240 |
| 1.15%, 12/4/09 | 18,600,000 | 18,600,000 | | FHLB, 0.77%, 9/29/10 | 10,000,000 | 10,033,219 |
| Pfizer, Inc., | | | | FHLB, 0.50%, 10/19/10 | 10,000,000 | 9,997,909 |
| 0.32%, 11/19/09(2) | 5,000,000 | 4,997,822 | | | | 165,239,303 |
7
| | | | | | |
| Premium Money Market | | | | |
| |
| |
| | Principal | | | | Principal | |
| | Amount | Value | | | Amount | Value |
| U.S. GOVERNMENT AGENCY | | | | California Statewide | | |
| DISCOUNT NOTES(1) — 4.8% | | | | Communities Development | | |
| FHLB Discount Notes, | | | | Auth. Multifamily Rev., | | |
| 0.76%, 1/12/10 | $15,000,000 | $ 14,967,813 | | Series 2001 S, (Birchcrest | | |
| | | | | Apartments), VRDN, | | |
| FHLB Discount Notes, | | | | 0.39%, 10/1/09 | | |
| 0.86%, 1/21/10 | 10,000,000 | 9,973,556 | | (LOC: U.S. Bank N.A.) | $ 955,000 | $ 955,000 |
| FHLB Discount Notes, | | | | Chicago Illinois Industrial | | |
| 0.96%, 2/1/10 | 25,000,000 | 24,919,025 | | Development Rev., | | |
| | | 49,860,394 | | (Enterprise Center VII), | | |
| ADJUSTABLE-RATE U.S. GOVERNMENT | | | VRDN, 0.60%, 10/7/09 | | |
| AGENCY SECURITIES — 1.4% | | | (LOC: LaSalle Bank N.A.) | 5,000,000 | 5,000,000 |
| FHLB, VRN, 0.76%, 10/1/09 | 15,000,000 | 15,000,000 | | Colorado Housing & | | |
| GOVERNMENT-BACKED CORPORATE BONDS(3) — 1.0% | | Finance Auth. Economic | | |
| | | | | Development Rev., Series | | |
| Bank of America N.A., VRN, | | | | 2004 B, (Corey Building), | | |
| 0.33%, 12/14/09, resets | | | | VRDN, 1.00%, 10/1/09 | | |
| quarterly off the 3-month | | | | (LOC: Wells Fargo | | |
| LIBOR plus 0.03% with | | | | Bank N.A.) | 245,000 | 245,000 |
| no caps | 10,000,000 | 10,000,000 | | Colorado Housing & | | |
| TOTAL U.S. GOVERNMENT AGENCY | | | Finance Auth. Economic | | |
| SECURITIES AND EQUIVALENTS | 240,099,697 | | Development Rev., | | |
| Municipal Securities — 22.1% | | | Series 2004 B, (POPIEL | | |
| | | | | Properties), VRDN, 1.05%, | | |
| Alabama Industrial | | | | 10/1/09 (LOC: Guaranty | | |
| Development Auth. | | | | Bank & Trust and Wells | | |
| Rev., (Simcala, Inc.), | | | | Fargo Bank N.A.) | 110,000 | 110,000 |
| VRDN, 1.00%, 10/7/09 | | | | Colorado Housing & | | |
| (LOC: Bank One) | 5,150,000 | 5,150,000 | | Finance Auth. Economic | | |
| California Enterprise | | | | Development Rev., Series | | |
| Development Auth. Rev., | | | | 2005 B, (Closet Factory), | | |
| Series 2008 B, (Pocino | | | | VRDN, 1.00%, 10/1/09 | | |
| Foods), VRDN, 0.65%, | | | | (LOC: Colorado Business | | |
| 10/1/09 (LOC: City | | | | Bank and Bank of New York) | 875,000 | 875,000 |
| National Bank and FHLB) | 1,245,000 | 1,245,000 | | Colorado Housing & | | |
| California Enterprise | | | | Finance Auth. Economic | | |
| Development Auth. Rev., | | | | Development Rev., Series | | |
| Series 2008 B, (Ramar | | | | 2007 B, (Monaco LLC), | | |
| International Corp.), | | | | VRDN, 1.00%, 10/1/09 | | |
| VRDN, 1.05%, 10/1/09 | | | | (LOC: JPMorgan Chase | | |
| (LOC: Bank of the West) | 1,645,000 | 1,645,000 | | Bank N.A.) | 690,000 | 690,000 |
| California Enterprise | | | | Columbus Indiana Economic | | |
| Development Auth. Rev., | | | | Development Rev., | | |
| Series 2008 B, (Sconza | | | | (Arbors At Waters Edge | | |
| Candy), VRDN, 0.60%, | | | | Apartments), VRDN, 0.45%, | | |
| 10/7/09 (LOC: Wells | | | | 10/1/09 (LOC: FHLB) | 3,980,000 | 3,980,000 |
| Fargo Bank N.A.) | 3,300,000 | 3,300,000 | | Connecticut Housing | | |
| California Infrastructure | | | | Finance Auth. Rev., | | |
| & Economic Development | | | | Series 2008 A5, (Housing | | |
| Bank Rev., Series 2000 B, | | | | Mortgage Finance), VRDN, | | |
| (Adams Rite Manufacturing | | | | 0.35%, 10/1/09 (SBBPA: | | |
| Co.), VRDN, 0.90%, 10/7/09 | | | | JPMorgan Chase Bank N.A.) | 19,695,000 | 19,695,000 |
| (LOC: U.S. Bank N.A. and | | | | Fairfield Rev., Series | | |
| Mellon Bank N.A.) | 1,870,000 | 1,870,000 | | 2005 A2, VRDN, | | |
| | | | | 1.80%, 10/1/09 (LOC: | | |
| | | | | Landesbank Hessen- | | |
| | | | | Thuringen Girozentrale) | 2,800,000 | 2,800,000 |
8
| | | | | | |
| Premium Money Market | | | | |
| |
| |
| | Principal | | | | Principal | |
| | Amount | Value | | | Amount | Value |
| Gary Industrial | | | | Mississippi Business Finance | | |
| Empowerment Zone Rev., | | | | Corp. Rev., (Aurora Flight | | |
| (Chemcoaters LLC), VRDN, | | | | Sciences Corp.), VRDN, | | |
| 1.40%, 10/1/09 (LOC: | | | | 1.00%, 10/1/09 (LOC: | | |
| American Bank & Trust | | | | Branch Banking & Trust) | $12,500,000 | $ 12,500,000 |
| and FHLB) | $ 6,500,000 | $ 6,500,000 | | Mississippi Business | | |
| Hart Family Holdings LLC | | | | Finance Corp. Rev., Series | | |
| Rev., VRDN, 2.00%, 10/1/09 | | | | 2006 R1, (Brown Bottling | | |
| (LOC: Community Bank & | | | | Group, Inc.), VRDN, 1.00%, | | |
| Trust and FHLB) | 10,720,000 | 10,720,000 | | 10/1/09 (LOC: Trustmark | | |
| Houston Higher Education | | | | National Bank and FHLB) | 8,835,000 | 8,835,000 |
| Finance Corp. Housing Rev., | | | | Montebello COP, VRDN, | | |
| Series 2003 C, (Tierwester | | | | 1.00%, 10/7/09 (LOC: Union | | |
| Oaks & Richfield Manor), | | | | Bank of California N.A. and | | |
| VRDN, 1.35%, 10/1/09 | | | | California State Teacher’s | | |
| (LOC: Bank of New York) | 1,505,000 | 1,505,000 | | Retirement System) | 6,775,000 | 6,775,000 |
| Illinois Development | | | | Morgan Hill Redevelopment | | |
| Finance Auth. Rev., (Elite | | | | Agency Tax Allocation Rev., | | |
| Manufacturing Technologies, | | | | Series 2008 B, (Ojo de | | |
| Inc.), VRDN, 0.60%, 10/1/09 | | | | Agua Redevelopment Area), | | |
| (LOC: LaSalle Bank N.A.) | 2,730,000 | 2,730,000 | | VRDN, 0.85%, 10/1/09 | | |
| Illinois GO, 2.00%, 4/13/10 | 5,000,000 | 5,036,386 | | (LOC: Scotiabank) | 13,300,000 | 13,300,000 |
| Illinois GO, 4.00%, 5/20/10 | 10,000,000 | 10,174,866 | | Nevada Multi Unit Housing | | |
| | | | | Division Rev., Series | | |
| Illinois GO, 2.00%, 6/10/10 | 4,150,000 | 4,178,449 | | 2002 B, VRDN, 0.57%, | | |
| Iowa Finance Auth. Private | | | | 10/1/09 (FNMA) | | |
| College Rev., (Morningside | | | | (LIQ FAC: FNMA) | 990,000 | 990,000 |
| College), VRDN, 0.35%, | | | | New Jersey Economic | | |
| 10/1/09 (LOC: U.S. | | | | Development Auth. Rev., | | |
| Bank N.A.) | 1,000,000 | 1,000,000 | | Series 2006 B, (Accurate | | |
| Kentucky Housing Corp. | | | | Box Co., Inc.), VRDN, 0.45%, | | |
| Rev., Series 2007 O, VRDN, | | | | 10/1/09 (LOC: Sun Bank | | |
| 0.60%, 10/1/09 (SBBPA: | | | | N.A. and Wells Fargo | | |
| Lloyds TSB Bank plc) | 2,350,000 | 2,350,000 | | Bank N.A.) | 845,000 | 845,000 |
| Kentucky Housing Corp. | | | | New Mexico Educational | | |
| Rev., Series 2008 B, VRDN, | | | | Assistance Foundation | | |
| 0.80%, 10/1/09 (SBBPA: | | | | Rev., Series 2009 A, VRDN, | | |
| Lloyds TSB Bank plc) | 2,955,000 | 2,955,000 | | 0.39%, 10/7/09 (LOC: Royal | | |
| King County Housing | | | | Bank of Canada) | 3,000,000 | 3,000,000 |
| Auth. Rev., (Auburn Court | | | | New York GO, Series | | |
| Apartments), VRDN, | | | | 2008 J13, VRDN, 0.45%, | | |
| 0.44%, 10/1/09 (FNMA) | | | | 10/7/09 (SBBPA: Lloyds | | |
| (LIQ FAC: FNMA) | 11,445,000 | 11,445,000 | | TSB Bank plc) | 10,000,000 | 10,000,000 |
| LoanStar Assets Partners LP | | | | Orange County Housing | | |
| Rev., Series 2004 A, VRDN, | | | | Finance Auth. Multifamily | | |
| 0.33%, 10/1/09 (LOC: State | | | | Rev., Series 2002 B, | | |
| Street Bank & Trust Co.)(2) | 4,200,000 | 4,200,000 | | (Millenia), VRDN, 0.34%, | | |
| Los Angeles Multifamily | | | | 10/7/09 (LOC: FNMA) | 1,200,000 | 1,200,000 |
| Rev., Series 2001 F, | | | | Oregon Facilities Auth. Rev., | | |
| (Housing-San Regis), VRDN, | | | | Series 2002-1, (Hazelden | | |
| 0.33%, 10/1/09 (FNMA) | | | | Springbrook), VRDN, 2.25%, | | |
| (LIQ FAC: FNMA) | 1,275,000 | 1,275,000 | | 10/1/09 (LOC: Allied Irish | | |
| Midwestern University | | | | Bank plc) | 900,000 | 900,000 |
| Foundation Rev., Series | | | | | | |
| 2009 A, VRDN, 0.45%, | | | | | | |
| 10/1/09 (LOC: Royal Bank | | | | | | |
| of Canada) | 3,000,000 | 3,000,000 | | | | |
9
| | | | | | |
| Premium Money Market | | | | |
| |
| |
| | Principal | | | | Principal | |
| | Amount | Value | | | Amount | Value |
| Pasadena COP, (Los Robles | | | | Washington Economic | | |
| Avenue Parking Facilities), | | | | Development Finance | | |
| VRDN, 1.25%, 10/6/09 | | | | Auth. Rev., Series 2006 G, | | |
| (LOC: Bank of New York and | | | | (Wesmar Co., Inc.), VRDN, | | |
| California State Teacher’s | | | | 1.00%, 10/1/09 (LOC: U.S. | | |
| Retirement System) | $ 300,000 | $ 300,000 | | Bank N.A.) | $ 1,715,000 | $ 1,715,000 |
| Putnam Hospital Center | | | | Washington Economic | | |
| Rev., VRDN, 1.25%, 10/7/09 | | | | Development Finance Auth. | | |
| (LOC: JPMorgan Chase | | | | Rev., Series 2007 K, (Ocean | | |
| Bank N.A.)(2) | 3,140,000 | 3,140,000 | | Gold Seafoods, Inc.), VRDN, | | |
| Salinas COP, (Fairways | | | | 0.75%, 10/1/09 (LOC: Wells | | |
| Golf), VRDN, 0.85%, | | | | Fargo Bank N.A.) | 1,985,000 | 1,985,000 |
| 10/1/09 (LOC: | | | | Washington Industrial | | |
| Rabobank N.A. and | | | | Development Auth. Rev., | | |
| Cooperative Centrale) | 4,660,000 | 4,660,000 | | (Pauwels), VRDN, 0.68%, | | |
| Salinas Economic | | | | 10/1/09 (LOC: Bank of | | |
| Development Rev., Series | | | | America N.A.) | 1,880,000 | 1,880,000 |
| 2007 B, (Monterey County | | | | Wisconsin Health & | | |
| Public Building), VRDN, | | | | Educational Facilities | | |
| 1.25%, 10/8/09 (LOC: | | | | Auth. Rev., Series | | |
| Bank of New York) | 1,070,000 | 1,070,000 | | 2008 A, (ProHealth | | |
| South Carolina Association | | | | Care, Inc.), VRDN, | | |
| of Governmental | | | | 0.35%, 10/1/09 | | |
| Organizations COP, | | | | (LOC: U.S. Bank N.A.) | 6,000,000 | 6,000,000 |
| Series 2009 B, 1.50%, | | | | Wisconsin Health & | | |
| 3/1/10 (SCSDE) | 5,500,000 | 5,521,240 | | Educational Facilities Auth. | | |
| Southeast Industrial | | | | Rev., Series 2008 C, VRDN, | | |
| Development Agency Rev., | | | | 0.35%, 10/1/09 (LOC: U.S. | | |
| (Powers Fasteners, Inc.), | | | | Bank N.A.) | 1,200,000 | 1,200,000 |
| VRDN, 1.25%, 10/1/09 | | | | TOTAL MUNICIPAL SECURITIES | 231,530,941 |
| (LOC: Bank of New York) | 2,500,000 | 2,500,000 | | | | |
| Southeast Industrial | | | | Corporate Bonds — 9.0% | |
| Development Agency Rev., | | | | Astin Redevelopment LP, | | |
| (Powers Fasteners, Inc.), | | | | VRDN, 1.00%, 10/8/09 | 3,500,000 | 3,500,000 |
| VRDN, 1.25%, 10/1/09 | | | | Castleton United Methodist | | |
| (LOC: JPMorgan Chase | | | | Church, Inc., VRDN, | | |
| Bank N.A.)(2) | 2,185,000 | 2,185,000 | | 0.75%, 10/7/09 (LOC: | | |
| St. Paul Sales Tax Rev., | | | | U.S. Bank N.A.) | 3,000,000 | 3,000,000 |
| Series 2009 A, (Rivercentre | | | | Cypress Bend Real Estate | | |
| Arena), VRDN, 0.35%, | | | | Development Co. LLC, | | |
| 10/1/09 (LOC: U.S. | | | | VRDN, 0.45%, 10/1/09 | 9,000,000 | 9,000,000 |
| Bank N.A.) | 6,000,000 | 6,000,000 | | D & I Properties LLC, VRDN, | | |
| Tahoe Forest Hospital | | | | 0.60%, 10/7/09 | 1,400,000 | 1,400,000 |
| District Rev., VRDN, 0.35%, | | | | DCC Development Corp., | | |
| 10/1/09 (LOC: U.S. | | | | VRDN, 0.47%, 10/1/09 | 3,765,000 | 3,765,000 |
| Bank N.A.) | 1,400,000 | 1,400,000 | | | | |
| | | | | First Baptist Church of | | |
| Texas GO, Series 2002 IB, | | | | Opelika, VRDN, 1.00%, | | |
| (Veterans Housing), VRDN, | | | | 10/9/09 (LOC: FHLB) | 6,535,000 | 6,535,000 |
| 0.90%, 10/7/09 (SBBPA: | | | | | | |
| Landesbank Hessen- | | | | Flatley Hospitality LLC, | | |
| Thuringen Girozentrale) | 5,000,000 | 5,000,000 | | VRDN, 0.47%, 10/1/09 | 1,070,000 | 1,070,000 |
| University of Kansas Hospital | | | | Grace Community Church | | |
| Auth. Rev., (Health System), | | | | of Amarillo, VRDN, 1.00%, | | |
| VRDN, 0.35%, 10/1/09 | | | | 10/1/09 (LOC: Wells Fargo | | |
| (LOC: U.S. Bank N.A.) | 14,000,000 | 14,000,000 | | Bank N.A.) | 1,670,000 | 1,670,000 |
| | | | | High Track LLC, VRDN, | | |
| | | | | 0.45%, 10/7/09 | 8,625,000 | 8,625,000 |
10
| | | | | |
| Premium Money Market | | | |
| |
| |
| | Principal | | | Notes to Schedule of Investments |
| | Amount | Value | | COP = Certificates of Participation |
| Jaxon Arbor LLC, VRDN, | | | | Equivalent = Security whose principal payments are backed by the full |
| 0.47%, 10/1/09 | $ 1,015,000 | $ 1,015,000 | | faith and credit of the United States |
| JBR, Inc., VRDN, | | | | FFCB = Federal Farm Credit Bank |
| 1.05%, 10/1/09 | 5,790,000 | 5,790,000 | | FHLB = Federal Home Loan Bank |
| Manse on Marsh LP, VRDN, | | | | | |
| 0.65%, 10/1/09 | 11,355,000 | 11,355,000 | | FNMA = Federal National Mortgage Association |
| Ness Family Partners LP, | | | | GO = General Obligation |
| VRDN, 0.63%, 10/7/09 | 1,580,000 | 1,580,000 | | LIBOR = London Interbank Offered Rate |
| Procter & Gamble | | | | LIQ FAC = Liquidity Facilities |
| International Funding SCA, | | | | LOC = Letter of Credit |
| VRN, 0.48%, 11/9/09, resets | | | | | |
| quarterly off the 3-month | | | | resets = The frequency with which a security’s coupon changes, |
| LIBOR plus 0.01% with | | | | based on current market conditions or an underlying index. The more |
| no caps | 5,000,000 | 5,000,000 | | frequently a security resets, the less risk the investor is taking that the |
| | | | | coupon will vary significantly from current market rates. |
| Relay Relay LLC, VRDN, | | | | | |
| 1.50%, 10/1/09 | 7,740,000 | 7,740,000 | | SBBPA = Standby Bond Purchase Agreement |
| Roman Catholic Bishop of | | | | SCSDE = South Carolina School District Enhancement |
| San Jose, VRDN, 2.55%, | | | | VRDN = Variable Rate Demand Note. Interest reset date is indicated. |
| 10/1/09 (LOC: Allied Irish | | | | Rate shown is effective at the period end. |
| Bank plc) | 4,875,000 | 4,875,000 | | VRN = Variable Rate Note. Interest reset date is indicated. Rate shown |
| Rupert E. Phillips, | | | | is effective at the period end. |
| VRDN, 1.00%, 10/9/09 | | | | (1) | The rate indicated is the yield to maturity at purchase for non- |
| (LOC: FHLB) | 5,940,000 | 5,940,000 | | | interest bearing securities. For interest bearing securities, the |
| Salvation Army (The), VRN, | | | | | stated coupon rate is shown. |
| 1.25%, 10/1/09 (LOC: Bank | | | | (2) | Security was purchased under Rule 144A or Section 4(2) of |
| of New York) | 2,000,000 | 2,000,000 | | | the Securities Act of 1933 or is a private placement and, unless |
| Salvation Army (The), VRN, | | | | | registered under the Act or exempted from registration, may only |
| 1.25%, 10/1/09 (LOC: Bank | | | | | be sold to qualified institutional investors. The aggregate value |
| of New York) | 7,500,000 | 7,500,000 | | | of these securities at the period end was $282,569,063, which |
| Zehnder’s of Frankenmuth, | | | | | represented 27.0% of total net assets. None of the restricted |
| VRDN, 0.47%, 10/1/09 | 2,450,000 | 2,450,000 | | | securities are considered to be illiquid. |
| TOTAL CORPORATE BONDS | | 93,810,000 | | (3) | The debt is guaranteed under the Federal Deposit Insurance |
| | | | | | Corporation’s (FDIC) Temporary Liquidity Guarantee Program and |
| Certificates of Deposit — 1.0% | | | | is backed by the full faith and credit of the United States. The |
| BNP Paribas, | | | | | expiration date of the FDIC’s guarantee is the earlier of the maturity |
| 0.34%, 10/7/09 | 10,000,000 | 10,000,000 | | | date of the debt or June 30, 2012. |
| TOTAL INVESTMENT | | | | (4) | Category is less than 0.05% of total net assets. |
| SECURITIES — 100.0% | | 1,045,257,142 | | | |
| OTHER ASSETS | | | | | |
| AND LIABILITIES(4) | | 354,989 | | See Notes to Financial Statements. |
| TOTAL NET ASSETS — 100.0% | $1,045,612,131 | | | |
11
|
| Statement of Assets and Liabilities |
| |
| SEPTEMBER 30, 2009 (UNAUDITED) | |
| Assets | |
| Investment securities, at value (amortized cost and cost for federal income tax purposes) | $1,045,257,142 |
| Receivable for investments sold | 650,012 |
| Receivable for capital shares sold | 2,346,797 |
| Interest receivable | 1,445,279 |
| | 1,049,699,230 |
| | |
| Liabilities | |
| Disbursements in excess of demand deposit cash | 468,169 |
| Payable for capital shares redeemed | 3,177,570 |
| Accrued management fees | 391,521 |
| Dividends payable | 49,839 |
| | 4,087,099 |
| | |
| Net Assets | $1,045,612,131 |
| | |
| Capital Shares | |
| Outstanding (unlimited number of shares authorized) | 1,045,996,101 |
| | |
| Net Asset Value Per Share | $1.00 |
| | |
| Net Assets Consist of: | |
| Capital paid in | $1,045,991,293 |
| Accumulated net realized loss on investment transactions | (379,162) |
| | $1,045,612,131 |
| |
| |
| See Notes to Financial Statements. | |
12
| |
| FOR THE SIX MONTHS ENDED SEPTEMBER 30, 2009 (UNAUDITED) | |
| Investment Income (Loss) | |
| Income: | |
| Interest | $4,929,161 |
| | |
| Expenses: | |
| Management fees | 2,471,288 |
| Temporary guarantee program fees | 210,286 |
| Trustees’ fees and expenses | 25,091 |
| Other expenses | 290 |
| | 2,706,955 |
| Fees waived | (74,267) |
| | 2,632,688 |
| | |
| Net investment income (loss) | 2,296,473 |
| | |
| Net realized gain (loss) on investment transactions | (7,408) |
| | |
| Net Increase (Decrease) in Net Assets Resulting from Operations | $2,289,065 |
| |
| |
| See Notes to Financial Statements. | |
13
|
| Statement of Changes in Net Assets |
| | |
| SIX MONTHS ENDED SEPTEMBER 30, 2009 (UNAUDITED) AND YEAR ENDED MARCH 31, 2009 | |
| Increase (Decrease) in Net Assets | Sept. 30, 2009 | March 31, 2009 |
| Operations | | |
| Net investment income (loss) | $ 2,296,473 | $ 25,156,808 |
| Net realized gain (loss) | (7,408) | (327,383) |
| Net increase (decrease) in net assets resulting from operations | 2,289,065 | 24,829,425 |
| | | |
| Distributions to Shareholders | | |
| From net investment income | (2,296,473) | (25,156,808) |
| | | |
| Capital Share Transactions | | |
| Proceeds from shares sold | 227,964,044 | 784,282,486 |
| Proceeds from reinvestment of distributions | 1,653,240 | 19,312,365 |
| Payments for shares redeemed | (313,496,386) | (865,514,974) |
| Net increase (decrease) in net assets from capital share transactions | (83,879,102) | (61,920,123) |
| | | |
| Net increase (decrease) in net assets | (83,886,510) | (62,247,506) |
| | | |
| Net Assets | | |
| Beginning of period | 1,129,498,641 | 1,191,746,147 |
| End of period | $1,045,612,131 | $1,129,498,641 |
| | | |
| Transactions in Shares of the Fund | | |
| Sold | 227,964,044 | 784,282,486 |
| Issued in reinvestment of distributions | 1,653,240 | 19,312,365 |
| Redeemed | (313,496,386) | (865,514,974) |
| Net increase (decrease) in shares of the fund | (83,879,102) | (61,920,123) |
| |
| |
| See Notes to Financial Statements. | | |
14
|
| Notes to Financial Statements |
SEPTEMBER 30, 2009 (UNAUDITED)
1. Organization and Summary of Significant Accounting Policies
Organization — American Century Investment Trust (the trust) is registered under the Investment Company Act of 1940 (the 1940 Act) as an open-end management investment company. Premium Money Market Fund (the fund) is one fund in a series issued by the trust. The fund is diversified under Rule 2a-7 of the 1940 Act. The fund’s investment objective is to earn the highest level of current income while preserving the value of your investment. The fund invests most of its assets in high-quality, very short-term debt securities issued by corporations, banks and governments. The following is a summary of the fund’s significant accounting policies.
Security Valuations — Securities are generally valued at amortized cost, which approximates current market value. Investments in open-end management investment companies are valued at the reported net asset value. When such valuations do not reflect market value, securities may be valued as determined by the Board of Trustees or its designee, in accordance with procedures adopted by the Board of Trustees.
Security Transactions — For financial reporting purposes, security transactions are accounted for as of the trade date. Net realized gains and losses are determined on the identified cost basis, which is also used for federal income tax purposes.
Investment Income — Interest income is recorded on the accrual basis and includes accretion of discounts and amortization of premiums.
Repurchase Agreements — The fund may enter into repurchase agreements with institutions that American Century Investment Management, Inc. (ACIM) (the investment advisor) has determined are creditworthy pursuant to criteria adopted by the Board of Trustees. Each repurchase agreement is recorded at cost. The fund requires that the collateral, represented by securities, received in a repurchase transaction be transferred to the custodian in a manner sufficient to enable the fund to obtain those securities in the event of a default under the repurchase agreement. ACIM monitors, on a daily basis, the securities transferred to ensure the value, including accrued interest, of the securities under each repurchase agreement is equal to or greater than amounts owed to the fund under each repurchase agreement.
Joint Trading Account — Pursuant to an Exemptive Order issued by the Securities and Exchange Commission, the fund, along with certain other funds in the American Century Investments family of funds, may transfer uninvested cash balances into a joint trading account. These balances are invested in one or more repurchase agreements that are collateralized by U.S. Treasury or Agency obligations.
Income Tax Status — It is the fund’s policy to distribute substantially all net investment income and net realized gains to shareholders and to otherwise qualify as a regulated investment company under provisions of the Internal Revenue Code. The fund is no longer subject to examination by tax authorities for years prior to 2006. At this time, management believes there are no uncertain tax positions which, based on their technical merit, would not be sustained upon examination and for which it is reasonably possible that the total amounts of unrecognized tax benefits will significantly change in the next twelve months. Accordingly, no provision has been made for federal or state income taxes. Interest and penalties associated with any federal or state income tax obligations, if any, are recorded as interest expense.
Distributions to Shareholders — Distributions from net investment income and short-term capital gains, if any, are declared daily and paid monthly. The fund does not expect to realize any long-term capital gains, and accordingly, does not expect to pay any capital gains distributions.
15
Indemnifications — Under the trust’s organizational documents, its officers and trustees are indemnified against certain liabilities arising out of the performance of their duties to the fund. In addition, in the normal course of business, the fund enters into contracts that provide general indemnifications. The maximum exposure under these arrangements is unknown as this would involve future claims that may be made against a fund. The risk of material loss from such claims is considered by management to be remote.
Use of Estimates — The financial statements are prepared in conformity with accounting principles generally accepted in the United States of America, which may require management to make certain estimates and assumptions at the date of the financial statements. Actual results could differ from these estimates.
Subsequent Events — Management has evaluated events or transactions that may have occurred since September 30, 2009, that would merit recognition or disclosure in the financial statements. This evaluation was completed through November 27, 2009, the date the financial statements were issued.
2. Fees and Transactions with Related Parties
Management Fees — The trust has entered into a Management Agreement with ACIM, under which ACIM provides the fund with investment advisory and management services in exchange for a single, unified management fee (the fee). The Agreement provides that all expenses of the fund, except brokerage commissions, taxes, portfolio insurance, interest, fees and expenses of those trustees who are not considered “interested persons” as defined in the 1940 Act (including counsel fees) and extraordinary expenses, will be paid by ACIM. The fee is computed and accrued daily based on the daily net assets of the specific class of shares of the fund and paid monthly in arrears. The fee consists of (1) an Investment Category Fee based on the daily net assets of the fund and certain other accounts managed by the investment advisor that are in th e same broad investment category as the fund and (2) a Complex Fee based on the assets of all the funds in the American Century Investments family of funds. The rates for the Investment Category Fee range from 0.1170% to 0.2300% and the rates for the Complex Fee range from 0.2500% to 0.3100%. The investment advisor voluntarily agreed to waive 0.02% of its management fee from April 1, 2009 through July 31, 2009 at which time the waiver was terminated. The effective annual management fee before waiver for the fund for the six months ended September 30, 2009, was 0.45%. The effective annual management fee after waiver for the fund for the six months ended September 30, 2009, was 0.44%.
Temporary Guarantee Program — On October 3, 2008, the Board of Trustees approved the fund to participate in the U.S. Treasury Department’s Temporary Guarantee Program for Money Market Funds (the program). The program provides coverage to guarantee the account values of shareholders in the event the fund’s net asset value falls below $0.995 and the Trustees liquidate the fund. The program covers the lesser of a shareholder’s account value on September 19, 2008, or on the date of liquidation. Participation in the program requires the fund to pay a fee based on the net assets of the fund as of the close of business on September 19, 2008, which is amortized daily over the period. The fund participated in the program from September 19, 2008 through December 19, 2008 and paid a fee of 0.01% of its net assets as of Septemb er 19, 2008. The fund continued its participation in the program from December 20, 2008 through April 30, 2009 and paid a fee of 0.015% of its net assets as of September 19, 2008. The fund continued its participation in a program extension from May 1, 2009 through September 18, 2009 and paid a fee of 0.015% of its net assets as of September 19, 2008. The program expired on September 18, 2009. For the six months ended September 30, 2009, the annualized ratio of the program fee to average net assets was 0.038%.
16
Related Parties — Certain officers and trustees of the trust are also officers and/or directors of American Century Companies, Inc. (ACC), the parent of the trust’s investment advisor, ACIM, the distributor of the trust, American Century Investment Services, Inc., and the trust’s transfer agent, American Century Services, LLC.
The fund is eligible to invest in a money market fund for temporary purposes, which is managed by J.P. Morgan Investment Management, Inc. (JPMIM). The fund has a Mutual Funds Services Agreement with J.P. Morgan Investor Services Co. (JPMIS). JPMorgan Chase Bank (JPMCB) is a custodian of the fund. JPMIM, JPMIS and JPMCB are wholly owned subsidiaries of JPMorgan Chase & Co. (JPM). JPM is an equity investor in ACC.
3. Fair Value Measurements
The fund’s securities valuation process is based on several considerations and may use multiple inputs to determine the fair value of the positions held by the fund. In conformity with accounting principles generally accepted in the United States of America, the inputs used to determine a valuation are classified into three broad levels as follows:
• Level 1 valuation inputs consist of actual quoted prices in an active market for identical securities;
• Level 2 valuation inputs consist of significant direct or indirect observable market data (including quoted prices for similar securities, evaluations of subsequent market events, interest rates, prepayment speeds, credit risk, etc.); or
• Level 3 valuation inputs consist of significant unobservable inputs (including a fund’s own assumptions).
The level classification is based on the lowest level input that is significant to the fair valuation measurement. The valuation inputs are not an indication of the risks associated with investing in these securities or other financial instruments.
As of September 30, 2009, the valuation inputs used to determine the fair value of the fund’s investment securities were classified as Level 2.
4. Interfund Lending
The fund, along with certain other funds in the American Century Investments family of funds, may participate in an interfund lending program, pursuant to an Exemptive Order issued by the Securities and Exchange Commission (SEC). This program provides an alternative credit facility allowing the fund to borrow from or lend to other funds in the American Century Investments family of funds that permit such transactions. Interfund lending transactions are subject to each fund’s investment policies and borrowing and lending limits. The interfund loan rate earned/paid on interfund lending transactions is determined daily based on the average of certain current market rates. Interfund lending transactions normally extend only overnight, but can have a maximum duration of seven days. The program is subject to annual approval by the Board of Trustees. During the six months ended September 30, 2009, the fund did not utilize the pro gram.
17
5. Federal Tax Information
The book-basis character of distributions made during the year from net investment income or net realized gains may differ from their ultimate characterization for federal income tax purposes. These differences reflect the differing character of certain income items and net realized gains and losses for financial statement and tax purposes, and may result in reclassification among certain capital accounts on the financial statements.
As of March 31, 2009, the fund had accumulated net realized capital loss carryovers for federal income tax purposes of $(371,754), which may be used to offset future taxable realized gains. Future capital loss carryover utilization in any given year may be subject to Internal Revenue Code limitations. Capital loss carryovers of $(446), $(885), $(3,164), $(10,427) and $(356,832) expire in 2013, 2014, 2015, 2016 and 2017, respectively.
6. Recently Issued Accounting Standards
In March 2008, the Financial Accounting Standards Board (FASB) issued Accounting Standards Codification (ASC) Section 815-10 (formerly Statement of Financial Accounting Standards No. 161, “Disclosures about Derivative Instruments and Hedging Activities —an amendment of FASB Statement No. 133”). ASC Section 815-10 is effective for interim periods beginning after November 15, 2008 and has been adopted by the fund. ASC Section 815-10 amends and expands disclosures about derivative instruments and hedging activities. ASC Section 815-10 requires qualitative disclosures about the objectives and strategies of derivative instruments, quantitative disclosures about the fair value amounts of and gains and losses on derivative instruments, and disclosures of credit-risk-related contingent features in hedging activities.
18
| | | | | | | |
| Premium Money Market | | | | |
| |
| For a Share Outstanding Throughout the Years Ended March 31 (except as noted) | | |
| | | 2009(1) | 2009 | 2008 | 2007 | 2006 | 2005 |
| Per-Share Data | | | | | | |
| Net Asset Value, | | | | | | |
| Beginning of Period | $1.00 | $1.00 | $1.00 | $1.00 | $1.00 | $1.00 |
| Income From | | | | | | |
| Investment Operations | | | | | | |
| Net Investment | | | | | | |
| Income (Loss) | —(2) | 0.02 | 0.05 | 0.05 | 0.03 | 0.01 |
| Distributions | | | | | | |
| From Net | | | | | | |
| Investment Income | —(2) | (0.02) | (0.05) | (0.05) | (0.03) | (0.01) |
| Net Asset Value, | | | | | | |
| End of Period | $1.00 | $1.00 | $1.00 | $1.00 | $1.00 | $1.00 |
| |
| Total Return(3) | 0.21% | 2.20% | 4.70% | 4.98% | 3.41% | 1.33% |
| | | | | | | |
| Ratios/Supplemental Data | | | | | | |
| Ratio of Operating | | | | | | |
| Expenses to | | | | | | |
| Average Net Assets | 0.48%(4)(5) | 0.47%(4) | 0.43%(4) | 0.41%(4) | 0.45%(4) | 0.48% |
| Ratio of Operating | | | | | | |
| Expenses to | | | | | | |
| Average Net Assets | | | | | | |
| (Before Expense Waiver) | 0.49%(5) | 0.49% | 0.47% | 0.47% | 0.47% | 0.48% |
| Ratio of Net Investment | | | | | | |
| Income (Loss) to | | | | | | |
| Average Net Assets | 0.42%(4)(5) | 2.18%(4) | 4.58%(4) | 4.89%(4) | 3.41%(4) | 1.31% |
| Ratio of Net Investment | | | | | | |
| Income (Loss) to | | | | | | |
| Average Net Assets | | | | | | |
| (Before Expense Waiver) | 0.41%(5) | 2.16% | 4.54% | 4.83% | 3.39% | 1.31% |
| Net Assets, End of Period | | | | | | |
| (in thousands) | $1,045,612 | $1,129,499 | $1,191,746 | $917,778 | $641,249 | $472,954 |
| | | | | |
| (1) | Six months ended September 30, 2009 (unaudited). | | | | |
| (2) | Per-share amount was less than $0.005. | | | | | |
| (3) | Total return assumes reinvestment of net investment income and capital gains distributions, if any. Total returns for periods less than one year |
| | are not annualized. | | | | | | |
| (4) | Effective July 29, 2005, the investment advisor voluntarily agreed to waive a portion of its management fee. | | |
| (5) | Annualized. | | | | | | |
| |
| |
| See Notes to Financial Statements. | | | | | | |
19
|
| Approval of Management Agreement |
Under Section 15(c) of the Investment Company Act, contracts for investment advisory services to a mutual fund are required to be reviewed, evaluated and approved each year by the fund’s board of directors/ trustees, including a majority of a fund’s independent directors/trustees (the “Directors”). At American Century Investments, this process is referred to as the “15(c) Process.” The board oversees on a continuous basis and evaluates at its quarterly meetings, directly and through the committees of the board, the nature and quality of significant services provided by the advisor, the investment performance of the funds, shareholder services, audit and compliance functions and a variety of other matters relating to fund operations. Each year, it also holds a special meeting in connection with determining whether to renew the contracts for advisory services, to review fund performance, shareholder services, adviser profitability, audit and compliance matters, and other fund operational matters.
Under a Securities and Exchange Commission rule, each fund is required to disclose in its annual or semiannual report, as appropriate, the material factors and conclusions that formed the basis for the board’s approval or renewal of any advisory agreements within the fund’s most recently completed fiscal half-year period.
Annual Contract Review Process
As part of the annual 15(c) Process, the Directors requested and reviewed extensive data and information compiled by the advisor and certain independent providers of evaluative data (the “15(c) Providers”) concerning Premium Money Market (the “fund”) and the services provided to the fund under the management agreement. The information considered and the discussions held at the meetings included, but were not limited to:
• the nature, extent and quality of investment management, shareholder services and other services that the advisor provides to the fund;
• the wide range of programs and services the advisor provides to the fund and its shareholders on a routine and non-routine basis;
• the compliance policies, procedures, and regulatory experience of the advisor;
• data comparing the cost of owning the fund to the cost of owning a similar fund;
• data comparing the fund’s performance to appropriate benchmarks and/ or a peer group of other mutual funds with similar investment objectives and strategies;
• financial data showing the profitability of the fund to the advisor and the overall profitability of the advisor;
• data comparing services provided and charges to other non-fund invest-ment management clients of the advisor; and
20
• collateral or “fall-out” benefits derived by the advisor from the manage-ment of the fund, and potential sharing of economies of scale in connection with the management of the fund.
In keeping with its practice, the Directors at a special meeting and at a regularly scheduled quarterly meeting reviewed and discussed the information provided by the advisor throughout the year and to negotiate with the advisor the renewal of the management agreement, including the setting of the applicable management fee. The Directors had the benefit of the advice of their independent counsel throughout the period.
Factors Considered
The Directors considered all of the information provided by the advisor, independent data providers, and the board’s independent counsel, and evaluated such information for each fund the board oversees. The Directors did not identify any single factor as being all-important or controlling, and each Director may have attributed different levels of importance to different factors. In deciding to renew the agreement under the terms ultimately determined by the board to be appropriate, the Directors’ decision was based on a number of factors, including the following.
Nature, Extent and Quality of Services — Generally. Under the management agreement, the advisor is responsible for providing or arranging for all services necessary for the operation of the fund. The board noted that under the management agreement, the advisor provides or arranges at its own expense a wide variety of services including:
• fund construction and design
• initial capitalization/funding
• portfolio research and security selection
• securities trading
• fund administration
• custody of fund assets
• daily valuation of the fund’s portfolio
• shareholder servicing and transfer agency, including shareholder
confirmations, recordkeeping and communications
• legal services
• regulatory and portfolio compliance
• financial reporting
• marketing and distribution
21
The Directors noted that many of these services have expanded over time both in terms of quantity and complexity in response to shareholder demands, competition in the industry, changing distribution channels and the changing regulatory environment. In performing their evaluation, the Directors considered information received in connection with the annual review, as well as information provided on an ongoing basis throughout the year and at their regularly scheduled board and committee meetings.
Investment Management Services. The nature of the investment management services provided is quite complex and allows fund shareholders access to professional money management, instant diversification of their investments within an asset class, the opportunity to easily diversify among asset classes, and liquidity. In evaluating investment performance, the board expects the advisor to manage the fund in accordance with its investment objectives and approved strategies. In providing these services, the advisor utilizes teams of investment professionals (portfolio managers, analysts, research assistants, and securities traders) who require extensive information technology, research, training, compliance and other systems to conduct their business. At each quarterly meeting and at the special meeting to consider renewal of the management agre ement, the Directors, directly and through its Portfolio Committee, review investment performance information for the fund, together with comparative information for appropriate benchmarks and/or peer groups of similarly-managed funds, over different time horizons. If performance concerns are identified, the underperforming fund receives special reviews until performance improves, during which Directors discuss with the advisor the reasons for such underperformance (e.g., market conditions, security and sector selection) and any efforts being undertaken to improve performance. The Fund’s performance for both the one- and three-year periods was in the top quartile of its peer group.
Shareholder and Other Services. The advisor provides the fund with a comprehensive package of transfer agency, shareholder, and other services. The Directors, directly and through the various Committees of the Board, review reports and evaluations of such services at their regular quarterly meetings and at their special meeting to consider renewal of the management agreement, including the annual meeting concerning contract review, and other reports to the board. These reports include, but are not limited to, information regarding the operational efficiency and accuracy of the shareholder and transfer agency services provided, staffing levels, shareholder satisfaction (as measured by external as well as internal sources), technology support, new products and services offered to fund shareholders, securities trading activities, portfolio va luation services, auditing services, and legal and operational compliance activities. Certain aspects of shareholder and transfer agency service level efficiency and the quality of securities trading activities are measured by independent third party providers and are presented in comparison to other fund groups not managed by the advisor.
22
Costs of Services Provided and Profitability. The advisor provides detailed information concerning its cost of providing various services to the fund, its profitability in managing the fund, its overall profitability, and its financial condition. The Directors have reviewed with the advisor the methodology used to prepare this financial information. The Directors have also reviewed with the advisor its methodology for compensating the investment professionals that provide services to the fund. This financial information regarding the advisor is considered in order to evaluate the advisor’s financial condition, its ability to continue to provide services under the management agreement, and the reasonableness of the current management fee.
Ethics. The Directors generally consider the advisor’s commitment to providing quality services to shareholders and to conducting its business ethically. They noted that the advisor’s practices generally meet or exceed industry best practices.
Economies of Scale. The Directors review information provided by the advisor regarding the existence of economies of scale in connection with the investment management of the funds. The Directors concluded that economies of scale are difficult to measure and predict with precision, especially on a fund-by-fund basis. The analysis of economies of scale is further complicated by the additional services and content provided by the advisor and its reinvestment in its ability to provide and expand those services. Accordingly, the Directors seek to evaluate economies of scale by reviewing information, such as year-over-year profitability of the advisor generally, the profitability of its management of the fund specifically, and the expenses incurred by the advisor in providing various functions to the fund. The Directors believe the advisor is a ppropriately sharing economies of scale through its competitive fee structure, fee breakpoints as the fund complex and the fund increases in size, and through reinvestment in its business to provide shareholders additional services and enhancements to existing services. In particular, separate breakpoint schedules based on the size of the entire fund complex and on the size of the fund reflect the complexity of assessing economies of scale.
Comparison to Other Funds’ Fees. The fund pays the advisor a single, all-inclusive (or unified) management fee for providing all services necessary for the management and operation of the fund, other than brokerage expenses, taxes, interest, extraordinary expenses, and the fees and expenses of the fund’s independent directors (including their independent legal counsel). Under the unified fee structure, the advisor is responsible for providing all investment advisory, custody, audit, administrative, compliance, recordkeeping, marketing and shareholder services, or arranging and supervising third parties to provide such services. By contrast, most other funds are charged a variety of fees, including an investment advisory fee, a transfer agency fee, an administrative fee, distribution charges and other expenses. Other than their in vestment advisory fees and Rule 12b-1 distribution fees, the components of the total fees charged by these other funds may be increased without shareholder approval. The board believes the unified fee structure is a benefit to fund shareholders because it clearly discloses to shareholders the cost of owning fund shares, and, since the unified fee cannot be increased without a vote of fund shareholders, it shifts to the advisor the
23
risk of increased costs of operating the fund and provides a direct incentive to minimize administrative inefficiencies. Part of the Directors’ analysis of fee levels involves reviewing certain evaluative data compiled by an independent provider and comparing the fund’s unified fee to the total expense ratio of other funds in the fund’s peer group. The Directors also reviewed updated fee level data provided by the advisor, but recognized that comparative data was particularly difficult to evaluate given the significant market developments during the past year impacting fund assets. The unified fee charged to shareholders of the fund was below the median of the total expense ratios of its peer group.
Comparison to Fees and Services Provided to Other Clients of the Advisor. The Directors also requested and received information from the advisor concerning the nature and extent of the services, fees, and profitability of its advisory services to advisory clients other than the fund. They observed that these varying types of client accounts require different services and involve different regulatory and entrepreneurial risks than the management of the fund. The Directors analyzed this information and concluded that the fees charged and services provided to the fund were reasonable by comparison.
Collateral or “Fall-Out” Benefits Derived by the Advisor. The Directors considered the existence of collateral benefits the advisor may receive as a result of its relationship with the fund. They concluded that the advisor’s primary business is managing mutual funds and it generally does not use fund or shareholder information to generate profits in other lines of business, and therefore does not derive any significant collateral benefits from them. The Directors noted that the advisor receives proprietary research from broker dealers that execute fund portfolio transactions but concluded that this research is likely to benefit fund shareholders. The Directors also determined that the advisor is able to provide investment management services to certain clients other than the fund, at least in part, due to its existing infras tructure built to serve the fund complex. The Directors concluded, however, that the assets of those other clients are not material to the analysis and, in any event, are included with the assets of the fund to determine breakpoints in the fund’s fee schedule, provided they are managed using the same investment team and strategy.
Conclusions of the Directors
As a result of this process, the Directors, in the absence of particular circumstances and assisted by the advice of their independent legal counsel, taking into account all of the factors discussed above and the information provided by the advisor and others, concluded that the investment management agreement between the fund and the advisor, including the management fee, is fair and reasonable in light of the services provided and should be renewed for a one-year term.
24
Retirement Account Information
As required by law, distributions you receive from certain IRAs, or 403(b), 457 and qualified plans are subject to federal income tax withholding, unless you elect not to have withholding apply. Tax will be withheld on the total amount withdrawn even though you may be receiving amounts that are not subject to withholding, such as nondeductible contributions. In such case, excess amounts of withholding could occur. You may adjust your withholding election so that a greater or lesser amount will be withheld.
If you don’t want us to withhold on this amount, you must notify us to not withhold the federal income tax. You may notify us in writing or in certain situations by telephone or through other electronic means. You have the right to revoke your withholding election at any time and any election you make may remain in effect until revoked by filing a new election.
Remember, even if you elect not to have income tax withheld, you are liable for paying income tax on the taxable portion of your withdrawal. If you elect not to have income tax withheld or you don’t have enough income tax withheld, you may be responsible for payment of estimated tax. You may incur penalties under the estimated tax rules if your withholding and estimated tax payments are not sufficient. You can reduce or defer the income tax on a distribution by directly or indirectly rolling such distribution over to another IRA or eligible plan. You should consult your tax advisor for additional information.
State tax will be withheld if, at the time of your distribution, your address is within one of the mandatory withholding states and you have federal income tax withheld. State taxes will be withheld from your distribution in accordance with the respective state rules.
Proxy Voting Guidelines
American Century Investment Management, Inc., the fund’s investment advisor, is responsible for exercising the voting rights associated with the securities purchased and/or held by the fund. A description of the policies and procedures the advisor uses in fulfilling this responsibility is available without charge, upon request, by calling 1-800-345-2021. It is also available on American Century Investments’ website at americancentury.com and on the Securities and Exchange Commission’s website at sec.gov. Information regarding how the investment advisor voted proxies relating to portfolio securities during the most recent 12-month period ended June 30 is available on the “About Us” page at americancentury.com. It is also available at sec.gov.
Quarterly Portfolio Disclosure
The fund files its complete schedule of portfolio holdings with the Securities and Exchange Commission (SEC) for the first and third quarters of each fiscal year on Form N-Q. The fund’s Form N-Q is available on the SEC’s website at sec.gov, and may be reviewed and copied at the SEC’s Public Reference Room in Washington, DC. Information on the operation of the Public Reference Room may be obtained by calling 1-800-SEC-0330. The fund also makes its complete schedule of portfolio holdings for the most recent quarter of its fiscal year available on its website at americancentury.com and, upon request, by calling 1-800-345-2021.
25
The following indices are used to illustrate investment market, sector, or style performance or to serve as fund performance comparisons. They are not investment products available for purchase.
The 90-Day U.S. Treasury Bill Index is derived from secondary market interest rates for three-month instruments as published by the Federal Reserve Bank.
The Citigroup Agency Index is a market-capitalization-weighted index that includes US government sponsored agencies with a remaining maturity of at least one year.
The Citigroup Credit Index includes US and non-US corporate securities and non-US sovereign and provincial securities.
The Citigroup High-Yield Cash-Pay Index is composed of those cash-pay securities included in the Citigroup US High-Yield Market Index with remaining maturities of at least one year.
The Citigroup Mortgage Index measures the mortgage component of the US BIG Bond Index, comprising 15- and 30-year GNMA, FNMA, and FHLMC pass-throughs and FNMA and FHLMC balloon mortgages.
The Citigroup Treasury Index is comprised of US Treasury securities with an amount outstanding of at least $5 billion and a remaining maturity of at least one year.
The Citigroup US Broad Investment-Grade (BIG) Bond Index is a market-capitalization-weighted index that includes fixed-rate Treasury, government-sponsored, mortgage, asset-backed, and investment-grade issues with a maturity of one year or longer.
The Citigroup US High-Yield Market Index captures the performance of below-investment-grade debt issued by corporations domiciled in the United States or Canada. This index includes cash-pay and deferred-interest securities that are publicly placed, have a fixed coupon, and are nonconvertible.
The Citigroup US Inflation-Linked Securities Index (ILSI)SM measures the return of bonds with fixed-rate coupon payments that adjust for inflation as measured by the Consumer Price Index (CPI).
26
27
28

| |
| |
| Contact Us | |
| americancentury.com | |
| Automated Information Line | 1-800-345-8765 |
| Investor Services Representative | 1-800-345-2021 or |
| | 816-531-5575 |
| Business, Not-For-Profit, Employer-Sponsored | |
| Retirement Plans | 1-800-345-3533 |
| Banks and Trust Companies, Broker-Dealers, | |
| Financial Professionals, Insurance Companies | 1-800-345-6488 |
| Telecommunications Device for the Deaf | 1-800-634-4113 |
| American Century Investment Trust | |
| Investment Advisor: | |
| American Century Investment Management, Inc. | |
| Kansas City, Missouri | |
This report and the statements it contains are submitted for the general
information of our shareholders. The report is not authorized for distribution to
prospective investors unless preceded or accompanied by an effective prospectus.
American Century Investment Services, Inc., Distributor
©2009 American Century Proprietary Holdings, Inc. All rights reserved.
0911
CL-SAN-66871N
|
| Semiannual Report |
| September 30, 2009 |

|
| American Century Investments |
Inflation Protection Bond Fund

Dear Investor:
Thank you for your investment with us during the financial reporting period ended September 30, 2009. We appreciate your trust in American Century Investments® at this volatile, transitional time in the economy and investment markets.
As the upheavals associated with the “Great Recession” gradually subside, our senior management team has put considerable thought into how the investment environment has changed and what new challenges and opportunities await us. Critical factors that we are anticipating in the coming year include marked shifts in investment and spending behavior, along with consolidation in our industry.
Most importantly, we think the economic recovery will be slow and extended. The economy and capital markets have come a long way since Lehman Brothers collapsed over a year ago, but 2010 will likely bring continuing challenges. The stock market’s rebound since last March and the third-quarter economic surge this year were fueled largely by corporate cost-cutting and unprecedented monetary and fiscal stimulus, including some key programs that have since expired or been scaled back.
Meanwhile, the resilient but struggling consumer sector still faces rising unemployment, heavy debt burdens, tight credit conditions, and a housing market that is starting to stabilize, but remains vulnerable. Much of our investment positioning in 2009 has cautiously reflected these still unstable economic fundamentals, leading to underperformance, in some cases, versus market benchmarks buoyed by the rally of riskier assets. We still support our fundamentally based positioning because we believe strongly that some markets—driven more by technical factors than fundamentals—have advanced further than underlying economic conditions warrant, and remain susceptible to the possibility of more volatility ahead.
For more detailed information from our portfolio management team about the performance and positioning of your investment, please review the following pages, or visit our website, americancentury.com.
Thank you for your continued confidence in us.
Sincerely,

Jonathan Thomas
President and Chief Executive Officer
American Century Investments
| |
| Market Perspective | 2 |
| U.S. Fixed-Income Total Returns | 2 |
| |
| Inflation Protection Bond | |
| |
| Performance | 3 |
| Portfolio Commentary | 5 |
| Portfolio at a Glance | 7 |
| Yields | 7 |
| Portfolio Composition by Weighted Average Life | 7 |
| Types of Investments in Portfolio | 7 |
| |
| Shareholder Fee Example | 8 |
| |
| Financial Statements | |
| |
| Schedule of Investments | 10 |
| Statement of Assets and Liabilities | 15 |
| Statement of Operations | 17 |
| Statement of Changes in Net Assets | 18 |
| Notes to Financial Statements | 19 |
| Financial Highlights | 26 |
| |
| Other Information | |
| |
| Approval of Management Agreement | 32 |
| Additional Information | 37 |
| Index Definitions | 38 |
The opinions expressed in the Market Perspective and the Portfolio Commentary reflect those of the portfolio management team as of the date of the report, and do not necessarily represent the opinions of American Century Investments or any other person in the American Century Investments organization. Any such opinions are subject to change at any time based upon market or other conditions and American Century Investments disclaims any responsibility to update such opinions. These opinions may not be relied upon as investment advice and, because investment decisions made by American Century Investments funds are based on numerous factors, may not be relied upon as an indication of trading intent on behalf of any American Century Investments fund. Security examples are used for representational purposes only and are not intended as recommendations to purchase or sell securities. Performance information for comparative i ndices and securities is provided to American Century Investments by third party vendors. To the best of American Century Investments’ knowledge, such information is accurate at the time of printing.
Market Perspective

By David MacEwen, Chief Investment Officer, Fixed Income
Economy Stabilized, Credit Crisis Eased
The six months ended September 30, 2009, witnessed a remarkable rebound by U.S. financial markets, made possible by the easing of the credit crisis and signs of stabilization in the economy. The government’s stimulus package and “cash for clunkers” program directly boosted consumer spending; home prices stabilized; big financial institutions passed the government’s “stress tests”; and liquidity returned to U.S. credit markets. Add it all up, and the economy expanded at a 3.5% annual rate in the third quarter. That marked the first positive reading on growth since the second quarter of 2008. But even as the economy stabilized, the unemployment rate rose to 9.8% in September, raising the prospect of a weak, “jobless” recovery.
Slack in the labor market and a still-weak economy meant a continued decline in measures of inflation, as the government’s Consumer Price Index fell by 1.3% for the year ended in September. In that environment, the Federal Reserve (the Fed) continued to hold its short-term rate target at 0%–0.25%.
Risk Reigned Supreme
The realization that financial and economic Armageddon had been averted caused a dramatic reversal of the trading that defined 2008, when Treasuries performed best by a wide margin. For the six months ended September 30, 2009, risk assets (securities such as stocks and bonds that offer potentially higher yields and returns than Treasuries) posted very strong returns while intermediate- and long-term Treasury bond prices actually fell (see the accompanying table). This resulted in historic outperformance by some segments of credit markets compared with Treasuries for the six months.
Rates Edged Up
With signs of stability in the economy and financial markets, the Fed began to look ahead to an end to its support of the market for government agency and mortgage-backed securities; nevertheless, to ensure the recovery, the Fed’s policy making arm said it would keep rates low for the foreseeable future. In that environment, investors sold Treasuries, sending their prices down and yields up.
| | | | |
| U.S. Fixed-Income Total Returns | | | | |
| For the six months ended September 30, 2009* | | | |
| Treasury Securities | | | Citigroup U.S. Bond Market Indices | |
| 3-Month Bill | 0.09% | | High-Yield Cash-Pay (corporate) | 37.81% |
| 2-Year Note | 0.73% | | Credit (investment-grade corporate) | 16.39% |
| 10-Year Note | –3.82% | | Broad Investment-Grade (multi-sector) | 4.80% |
| 30-Year Bond | –6.62% | | Inflation-Linked Securities | 3.47% |
| | | | Mortgage (mortgage-backed)�� | 2.89% |
| | | | Agency | 1.51% |
| | | | Treasury | -1.03% |
| | | | *Total returns for periods less than one year are not annualized. |
2
| | | | | |
| Inflation Protection Bond | | | |
| |
| Total Returns as of September 30, 2009 | | | |
| | | | | Average Annual | |
| | | | | Returns | |
| | | | | Since | Inception |
| | | 6 months(1) | 1 year | Inception | Date |
| Investor Class | 3.96% | 6.22% | 4.20% | 5/31/05 |
| Citigroup US Inflation-Linked | | | | |
| Securities Index(2) | 3.47% | 5.41% | 4.33% | — |
| Institutional Class | 4.04% | 6.40% | 4.50% | 5/31/05 |
| A Class | | | | 5/31/05 |
| No sales charge* | 3.77% | 5.93% | 3.97% | |
| With sales charge* | -0.88% | 1.19% | 2.87% | |
| B Class | | | | 5/31/05 |
| No sales charge* | 3.38% | 5.22% | 3.20% | |
| With sales charge* | -1.62% | 1.22% | 2.78% | |
| C Class | | | | 5/31/05 |
| No sales charge* | 3.38% | 5.11% | 3.24% | |
| With sales charge* | 2.38% | 5.11% | 3.24% | |
| R Class | 3.69% | 5.69% | 3.74% | 5/31/05 |
|
| *Sales charges include initial sales charges and contingent deferred sales charges (CDSCs), as applicable. A Class shares have a 4.50% |
| maximum initial sales charge for fixed-income funds and may be subject to a maximum CDSC of 1.00%. B Class shares redeemed |
| within six years of purchase are subject to a CDSC that declines from 5.00% during the first year after purchase to 0.00% the sixth |
| year after purchase. C Class shares redeemed within 12 months of purchase are subject to a maximum CDSC of 1.00%. The SEC |
| requires that mutual funds provide performance information net of maximum sales charges in all cases where charges could be applied. |
| |
| (1) | Total returns for periods less than one year are not annualized. | | | |
| (2) | The Citigroup US Inflation-Linked Securities Index is not subject to the tax code diversification and other regulatory requirements limiting the |
| | type and amount of securities that the fund may own. | | | |
Data presented reflect past performance. Past performance is no guarantee of future results. Current performance may be higher or lower than the performance shown. Investment return and principal value will fluctuate, and redemption value may be more or less than original cost. To obtain performance data current to the most recent month end, please call 1-800-345-2021 or visit americancentury.com. As interest rates rise, bond values will decline.
Unless otherwise indicated, performance reflects Investor Class shares; performance for other share classes will vary due to differences in fee structure. For information about other share classes available, please consult the prospectus. Data assumes reinvestment of dividends and capital gains, and none of the charts reflect the deduction of taxes that a shareholder would pay on fund distributions or the redemption of fund shares. Returns for the index are provided for comparison. The fund’s total returns include operating expenses (such as transaction costs and management fees) that reduce returns, while the total returns of the index do not.
3
Inflation Protection Bond
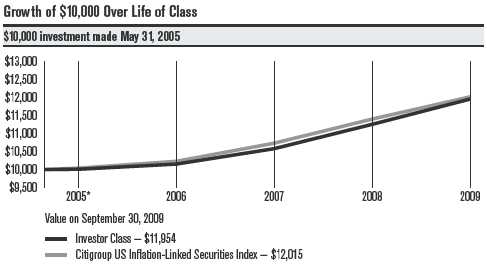
| | | | | | |
| One-Year Returns Over Life of Class | | | | |
| Periods ended September 30 | | | | | |
| | | 2005* | 2006 | 2007 | 2008 | 2009 |
| Investor Class | | 0.08% | 1.43% | 4.21% | 6.37% | 6.22% |
| Citigroup US Inflation-Linked | | | | | |
| Securities Index | | 0.39% | 1.88% | 4.91% | 6.22% | 5.41% |
| *From 5/31/05, the Investor Class’s inception date. Not annualized. | | | | |
| |
| Total Annual Fund Operating | | | | | |
| | Institutional | | | | | |
| Investor Class | Class | A Class | B Class | C Class | R Class |
| 0.59% | 0.39% | 0.84% | 1.59% | 1.59% | 1.09% |
| | | | | | | |
The total annual fund operating expenses shown is as stated in the fund’s prospectus current as of the date of this report. The prospectus may vary from the expense ratio shown elsewhere in this report because it is based on a different time period, includes acquired fund fees and expenses, and, if applicable, does not include fee waivers or expense reimbursements.
Data presented reflect past performance. Past performance is no guarantee of future results. Current performance may be higher or lower than the performance shown. Investment return and principal value will fluctuate, and redemption value may be more or less than original cost. To obtain performance data current to the most recent month end, please call 1-800-345-2021 or visit americancentury.com. As interest rates rise, bond values will decline.
Unless otherwise indicated, performance reflects Investor Class shares; performance for other share classes will vary due to differences in fee structure. For information about other share classes available, please consult the prospectus. Data assumes reinvestment of dividends and capital gains, and none of the charts reflect the deduction of taxes that a shareholder would pay on fund distributions or the redemption of fund shares. Returns for the index are provided for comparison. The fund’s total returns include operating expenses (such as transaction costs and management fees) that reduce returns, while the total returns of the index do not.
4
Inflation Protection Bond
Portfolio Managers: Bob Gahagan, Brian Howell, and Jim Platz
Performance Summary
Inflation Protection Bond returned 3.96%* for the six months ended September 30, 2009. By comparison, the fund’s benchmark, the Citigroup US Inflation-Linked Securities Index, returned 3.47%. Portfolio returns reflect operating expenses, while index returns do not.
The portfolio’s performance benefited from the generally favorable climate for TIPS (Treasury inflation-protected securities), which, unlike longer-term traditional Treasury notes and bonds, showed positive results for the six-month period. This was primarily due to the market’s longer-term expectations for rising inflation and a relatively tight supply of inflation-linked securities. In addition, our strategy of investing a portion of the portfolio’s assets in out-of-benchmark, high-quality “spread” (non-Treasury) sectors drove the portfolio’s outperformance versus the index. Most spread sectors benefited from the market’s renewed appetite for risk and outperformed TIPS during the period.
Oil Prices Jumped, but Near-Term Inflation Remained Tame
Select economic data in the manufacturing and housing industries showed signs of modest improvement during the six-month period, which led to expectations for growing worldwide demand for commodities. Oil prices reflected this sentiment, increasing from $50 a barrel on March 31, 2009, to $71 a barrel at the end of September. Other commodity prices also advanced, as indicated by the 18.64% six-month gain for the Rogers International Commodities Index, a measure of energy, agricultural, and metals products.
Nevertheless, these rising prices did not have a significant impact on the current inflation data. Despite the financial market’s optimism that the economic downturn was stabilizing, the overall economy remained weak, primarily due to rising unemployment and sluggish consumer spending. This helped maintain more of a deflationary than inflationary environment in the near term. “Headline” inflation, as measured by the overall change in the Consumer Price Index, was down 1.3% for the 12 months ended September 30, as oil prices, though higher for the six-month period, remained well below their 12-month highs. This helps explain the fund’s negative SEC yield as of September 30.
Looking ahead, inflation expectations remained on the rise. The yield difference (or breakeven rate) between 10-year TIPS and nominal 10-year Treasuries increased modestly during the period, from 1.31 percentage points at the end of March to 1.77 percentage points at the end of September. The breakeven rate estimates the market’s inflation expectation for the next 10 years. In addition, the U.S. dollar tumbled versus other major currencies—another inflationary warning sign.
*All fund returns and yields referenced in this commentary are for Investor Class shares. Total returns for periods less than one year are not annualized
5
Inflation Protection Bond
Portfolio Strategy
We continued to invest most of the portfolio in TIPS (approximately 87% as of September 30, 2009). The portfolio’s outperformance relative to the benchmark primarily was due to our non-TIPS positioning.
Specifically, allocations to investment-grade corporate and long-term municipal bonds drove the portfolio’s outperformance. These securities significantly outperformed traditional Treasuries and TIPS, as the market’s renewed emphasis on risk pushed returns on non-Treasury sectors higher. In the second half of the period, we took profits in the municipal sector and increased exposure to high-quality corporate bonds, which we believe should continue to offer good relative value. The portfolio also held a small position in high-yield bonds, which were the best-performing fixed-income securities during the period. Small allocations to mortgage and agency securities generated positive returns for the portfolio, but these sectors generally lagged TIPS.
Additionally, early in the period, we complemented our spread-sector investments with a small position in inflation swaps, or strategies that synthetically create inflation-linked exposure. We believe the combination of TIPS, spread securities, and inflation swaps may enhance the portfolio’s results and outperform traditional Treasury securities over time.
Outlook
Near-term inflation concerns remain subdued, primarily due to still-weak global economic fundamentals. Longer term, we believe inflationary pressures are likely to build, given historical patterns (the average annual inflation rate for the last 30 years was approximately 3.25%) and the amount of inflationary economic stimulus from the government and Federal Reserve. Therefore, the long-term inflation outlook, along with a relatively low 10-year breakeven rate, suggest TIPS continue to offer attractive long-term value.
6
| | |
| Inflation Protection Bond | | |
| |
| Portfolio at a Glance | | |
| | As of 9/30/09 | As of 3/31/09 |
| Weighted Average Life | 9.4 years | 9.3 years |
| Average Duration (static real yield beta) | 6.0 years | 5.8 years(1) |
| (1) The calculation as of March 31, 2009, was based on effective average duration. | | |
| |
| Yields as of September 30, 2009 | | |
| 30-Day SEC Yield(2) | | |
| Investor Class | -0.20% | |
| Institutional Class | 0.00% | |
| A Class | -0.42% | |
| B Class | -1.18% | |
| C Class | -1.18% | |
| R Class | -0.69% | |
| (2) Yields would have been lower if a portion of fees had not been waived. | | |
| |
| Portfolio Composition by Weighted Average Life | | |
| | % of fund | % of fund |
| | investments | investments |
| | as of 9/30/09 | as of 3/31/09 |
| 0 - 5-Year Notes(3) | 31.8% | 36.4% |
| 5 - 10-Year Notes | 36.1% | 31.5% |
| 10 - 30-Year Bonds | 32.1% | 32.1% |
| (3) Includes temporary cash investments. | | |
| | | |
| Types of Investments in Portfolio | | |
| | % of fund | % of fund |
| | investments | investments |
| | as of 9/30/09 | as of 3/31/09 |
| U.S. Treasury Securities | 87.7% | 88.1% |
| Corporate Bonds | 8.3% | 2.6% |
| Commercial Paper | 2.6% | 2.4% |
| Municipal Securities | 0.8% | 2.5% |
| Commercial Mortgage-Backed Securities | 0.5% | 0.4% |
| Asset-Backed Securities | 0.1% | 0.2% |
| U.S. Government Agency Securities and Equivalents | — | 2.8% |
| U.S. Government Agency Mortgage-Backed Securities | — | 0.9% |
| Temporary Cash Investments | —(4) | 0.1% |
| (4) Category is less than 0.05% of fund investments. | | |
7
|
| Shareholder Fee Example (Unaudited) |
Fund shareholders may incur two types of costs: (1) transaction costs, including sales charges (loads) on purchase payments and redemption/ exchange fees; and (2) ongoing costs, including management fees; distribution and service (12b-1) fees; and other fund expenses. This example is intended to help you understand your ongoing costs (in dollars) of investing in your fund and to compare these costs with the ongoing cost of investing in other mutual funds.
The example is based on an investment of $1,000 made at the beginning of the period and held for the entire period from April 1, 2009 to September 30, 2009.
Actual Expenses
The table provides information about actual account values and actual expenses for each class. You may use the information, together with the amount you invested, to estimate the expenses that you paid over the period. First, identify the share class you own. Then simply divide your account value by $1,000 (for example, an $8,600 account value divided by $1,000 = 8.6), then multiply the result by the number under the heading “Expenses Paid During Period” to estimate the expenses you paid on your account during this period.
If you hold Investor Class shares of any American Century Investments fund, or Institutional Class shares of the American Century Diversified Bond Fund, in an American Century Investments account (i.e., not a financial intermediary or retirement plan account), American Century Investments may charge you a $12.50 semiannual account maintenance fee if the value of those shares is less than $10,000. We will redeem shares automatically in one of your accounts to pay the $12.50 fee. In determining your total eligible investment amount, we will include your investments in all personal accounts (including American Century Investments Brokerage accounts) registered under your Social Security number. Personal accounts include individual accounts, joint accounts, UGMA/UTMA accounts, personal trusts, Coverdell Education Savings Accounts and IRAs (including traditional, Roth, Rollover, SEP-, SARSEP- and SIMPLE-IRAs), and certain other retirement accounts. If you have only business, business retirement, employer-sponsored or Amer-ican Century Investments Brokerage accounts, you are currently not subject to this fee. We will not charge the fee as long as you choose to manage your accounts exclusively online. If you are subject to the Account Maintenance Fee, your account value could be reduced by the fee amount.
Hypothetical Example for Comparison Purposes
The table also provides information about hypothetical account values and hypothetical expenses based on the actual expense ratio of each class of your fund and an assumed rate of return of 5% per year before expenses, which is not the actual return of a fund’s share class. The hypothetical account values and expenses may not be used to estimate the actual ending account balance or expenses you paid for the period. You may use this information to compare the ongoing costs of investing in your fund and other funds. To do so, compare this 5% hypothetical example with the 5% hypothetical examples that appear in the shareholder reports of the other funds.
8
Please note that the expenses shown in the table are meant to highlight your ongoing costs only and do not reflect any transactional costs, such as sales charges (loads) or redemption/exchange fees. Therefore, the table is useful in comparing ongoing costs only, and will not help you determine the relative total costs of owning different funds. In addition, if these transactional costs were included, your costs would have been higher.
| | | | | |
| | | Beginning | Ending | Expenses Paid | |
| | | Account Value | Account Value | During Period(1) | Annualized |
| | | 4/1/09 | 9/30/09 | 4/1/09 - 9/30/09 | Expense Ratio(1) |
| Actual | | | | |
| Investor Class (after waiver)(2) | $1,000 | $1,039.60 | $2.81 | 0.55% |
| Investor Class (before waiver) | $1,000 | $1,039.60(3) | $3.02 | 0.59% |
| Institutional Class | $1,000 | $1,040.40 | $1.79 | 0.35% |
| (after waiver)(2) | | | | |
| Institutional Class | $1,000 | $1,040.40(3) | $1.99 | 0.39% |
| (before waiver) | | | | |
| A Class (after waiver)(2) | $1,000 | $1,037.70 | $4.09 | 0.80% |
| A Class (before waiver) | $1,000 | $1,037.70(3) | $4.29 | 0.84% |
| B Class (after waiver)(2) | $1,000 | $1,033.80 | $7.90 | 1.55% |
| B Class (before waiver) | $1,000 | $1,033.80(3) | $8.11 | 1.59% |
| C Class (after waiver)(2) | $1,000 | $1,033.80 | $7.90 | 1.55% |
| C Class (before waiver) | $1,000 | $1,033.80(3) | $8.11 | 1.59% |
| R Class (after waiver)(2) | $1,000 | $1,036.90 | $5.36 | 1.05% |
| R Class (before waiver) | $1,000 | $1,036.90(3) | $5.57 | 1.09% |
| Hypothetical | | | | |
| Investor Class (after waiver)(2) | $1,000 | $1,022.31 | $2.79 | 0.55% |
| Investor Class (before waiver) | $1,000 | $1,022.11 | $2.99 | 0.59% |
| Institutional Class | $1,000 | $1,023.31 | $1.78 | 0.35% |
| (after waiver)(2) | | | | |
| Institutional Class | $1,000 | $1,023.11 | $1.98 | 0.39% |
| (before waiver) | | | | |
| A Class (after waiver)(2) | $1,000 | $1,021.06 | $4.05 | 0.80% |
| A Class (before waiver) | $1,000 | $1,020.86 | $4.26 | 0.84% |
| B Class (after waiver)(2) | $1,000 | $1,017.30 | $7.84 | 1.55% |
| B Class (before waiver) | $1,000 | $1,017.10 | $8.04 | 1.59% |
| C Class (after waiver)(2) | $1,000 | $1,017.30 | $7.84 | 1.55% |
| C Class (before waiver) | $1,000 | $1,017.10 | $8.04 | 1.59% |
| R Class (after waiver)(2) | $1,000 | $1,019.85 | $5.32 | 1.05% |
| R Class (before waiver) | $1,000 | $1,019.60 | $5.52 | 1.09% |
| |
| (1) | Expenses are equal to the class’s annualized expense ratio listed in the table above, multiplied by the average account value over the period, |
| | multiplied by 183, the number of days in the most recent fiscal half-year, divided by 365, to reflect the one-half year period. |
| (2) | During the six months ended September 30, 2009, the class received a partial waiver of its management fee. | |
| (3) | Ending account value assumes the return earned after waiver. The return would have been lower had fees not been waived and would have |
| | resulted in a lower ending account value. | | | |
9
| | | | | | |
| Inflation Protection Bond | | | | |
| |
| SEPTEMBER 30, 2009 (UNAUDITED) | | | | | |
| |
| | Principal | | | | Principal | |
| | Amount | Value | | | Amount | Value |
| U.S. Treasury Securities — 87.1% | | | U.S. Treasury Inflation | | |
| | | | | Indexed Notes, | | |
| U.S. Treasury Inflation | | | | 0.625%, 4/15/13(1) | $ 5,807,445 | $ 5,801,998 |
| Indexed Bonds, | | | | U.S. Treasury Inflation | | |
| 2.375%, 1/15/25(1) | $ 21,922,857 | $ 23,005,298 | | | | |
| | | | | Indexed Notes, | | |
| U.S. Treasury Inflation | | | | 1.875%, 7/15/13(1) | 16,034,211 | 16,585,387 |
| Indexed Bonds, | | | | U.S. Treasury Inflation | | |
| 2.00%, 1/15/26(1) | 14,105,260 | 14,100,859 | | | | |
| | | | | Indexed Notes, | | |
| U.S. Treasury Inflation | | | | 2.00%, 1/15/14(1) | 11,538,252 | 11,967,336 |
| Indexed Bonds, | | | | U.S. Treasury Inflation | | |
| 2.375%, 1/15/27(1) | 9,893,816 | 10,416,328 | | | | |
| | | | | Indexed Notes, | | |
| U.S. Treasury Inflation | | | | 2.00%, 7/15/14(1) | 10,053,736 | 10,459,022 |
| Indexed Bonds, | | | | U.S. Treasury Inflation | | |
| 1.75%, 1/15/28(1) | 6,912,964 | 6,640,766 | | | | |
| | | | | Indexed Notes, | | |
| U.S. Treasury Inflation | | | | 1.625%, 1/15/15(1) | 16,240,608 | 16,560,353 |
| Indexed Bonds, | | | | U.S. Treasury Inflation | | |
| 3.625%, 4/15/28(1) | 9,924,703 | 12,288,023 | | | | |
| | | | | Indexed Notes, | | |
| U.S. Treasury Inflation | | | | 1.875%, 7/15/15(1) | 14,005,448 | 14,486,885 |
| Indexed Bonds, | | | | U.S. Treasury Inflation | | |
| 2.50%, 1/15/29(1) | 14,316,247 | 15,425,756 | | | | |
| | | | | Indexed Notes, | | |
| U.S. Treasury Inflation | | | | 2.00%, 1/15/16(1) | 17,902,830 | 18,596,565 |
| Indexed Bonds, | | | | U.S. Treasury Inflation | | |
| 3.875%, 4/15/29(1) | 11,606,334 | 14,997,566 | | | | |
| | | | | Indexed Notes, | | |
| U.S. Treasury Inflation | | | | 2.50%, 7/15/16(1) | 7,966,701 | 8,544,287 |
| Indexed Bonds, | | | | U.S. Treasury Inflation | | |
| 3.375%, 4/15/32(1) | 4,749,874 | 5,885,388 | | | | |
| | | | | Indexed Notes, | | |
| U.S. Treasury Inflation | | | | 2.375%, 1/15/17(1) | 8,836,624 | 9,411,005 |
| Indexed Notes, | | | | U.S. Treasury Inflation | | |
| 4.25%, 1/15/10(1) | 1,689,574 | 1,705,942 | | | | |
| | | | | Indexed Notes, | | |
| U.S. Treasury Inflation | | | | 2.625%, 7/15/17(1) | 6,052,525 | 6,578,338 |
| Indexed Notes, | | | | U.S. Treasury Inflation | | |
| 0.875%, 4/15/10(1) | 3,666,019 | 3,671,745 | | | | |
| | | | | Indexed Notes, | | |
| U.S. Treasury Inflation | | | | 1.625%, 1/15/18(1) | 2,544,176 | 2,572,004 |
| Indexed Notes, | | | | U.S. Treasury Inflation | | |
| 3.50%, 1/15/11(1) | 2,350,927 | 2,450,841 | | | | |
| | | | | Indexed Notes, | | |
| U.S. Treasury Inflation | | | | 1.375%, 7/15/18(1) | 8,987,940 | 8,909,296 |
| Indexed Notes, | | | | U.S. Treasury Inflation | | |
| 2.375%, 4/15/11(1) | 7,025,116 | 7,244,651 | | | | |
| | | | | Indexed Notes, | | |
| U.S. Treasury Inflation | | | | 2.125%, 1/15/19(1) | 7,221,816 | 7,589,681 |
| Indexed Notes, | | | | U.S. Treasury Inflation | | |
| 3.375%, 1/15/12(1) | 2,061,760 | 2,195,774 | | | | |
| | | | | Indexed Notes, | | |
| U.S. Treasury Inflation | | | | 1.875%, 7/15/19(1) | 9,884,084 | 10,186,784 |
| Indexed Notes, | | | | TOTAL U.S. TREASURY SECURITIES | |
| 2.00%, 4/15/12(1) | 9,339,000 | 9,689,212 | | | | |
| | | | | (Cost $287,739,260) | | 294,557,556 |
| U.S. Treasury Inflation | | | | | | |
| Indexed Notes, | | | | | | |
| 3.00%, 7/15/12(1) | 15,582,467 | 16,590,466 | | | | |
10
| | | | | | |
| Inflation Protection Bond | | | | |
| |
| |
| | Principal | | | | Principal | |
| | Amount | Value | | | Amount | Value |
| Corporate Bonds — 8.2% | | | CONSUMER FINANCE — 0.4% | |
| | | | | Capital One Bank USA N.A., | | |
| BEVERAGES — 0.5% | | | | 8.80%, 7/15/19(1) | $ 330,000 | $ 382,113 |
| Anheuser-Busch InBev | | | | Ford Motor Credit Co. LLC, | | |
| Worldwide, Inc., | | | | 7.50%, 8/1/12 | 330,000 | 317,105 |
| 6.875%, 11/15/19(2) | $ 530,000 | $ 599,756 | | | | |
| | | | | General Electric Capital | | |
| Coca-Cola Co. (The), | | | | Corp., 5.90%, 5/13/14(1) | 460,000 | 493,951 |
| 3.625%, 3/15/14(1) | 240,000 | 249,083 | | | | |
| | | | | General Electric Capital | | |
| Coca-Cola Enterprises, Inc., | | | | Corp., 6.00%, 8/7/19(1) | 300,000 | 304,894 |
| 4.25%, 3/1/15(1) | 260,000 | 275,361 | | | | |
| | | | | | | 1,498,063 |
| Dr Pepper Snapple Group, | | | | | | |
| Inc., 6.82%, 5/1/18(1) | 450,000 | 512,399 | | CONTAINERS & PACKAGING — 0.2% | |
| | | 1,636,599 | | Ball Corp., 6.875%, | | |
| | | | | 12/15/12(1) | 750,000 | 759,375 |
| BIOTECHNOLOGY — 0.1% | | | | DIVERSIFIED FINANCIAL SERVICES — 0.1% | |
| Amgen, Inc., | | | | | | |
| 5.85%, 6/1/17(1) | 300,000 | 330,540 | | Bank of America Corp., | | |
| | | | | 6.50%, 8/1/16(1) | 290,000 | 305,394 |
| CAPITAL MARKETS — 0.5% | | | | BP Capital Markets plc, | | |
| Credit Suisse (New York), | | | | 3.125%, 3/10/12(1) | 170,000 | 175,730 |
| 5.50%, 5/1/14(1) | 390,000 | 419,681 | | | | |
| | | | | | | 481,124 |
| Credit Suisse (New York), | | | | | | |
| 5.30%, 8/13/19(1) | 360,000 | 369,831 | | DIVERSIFIED TELECOMMUNICATION | |
| | | | | SERVICES — 0.4% | | |
| Goldman Sachs Group, Inc. | | | | | | |
| (The), 7.50%, 2/15/19(1) | 280,000 | 320,764 | | AT&T, Inc., | | |
| | | | | 6.70%, 11/15/13(1) | 180,000 | 204,155 |
| Jefferies Group, Inc., | | | | | | |
| 8.50%, 7/15/19(1) | 80,000 | 84,811 | | Cellco Partnership/Verizon | | |
| | | | | Wireless Capital LLC, | | |
| Morgan Stanley, | | | | 8.50%, 11/15/18(1)(2) | 160,000 | 200,167 |
| 7.30%, 5/13/19(1) | 330,000 | 363,726 | | | | |
| | | | | Telecom Italia Capital SA, | | |
| | | 1,558,813 | | 6.175%, 6/18/14(1) | 550,000 | 597,344 |
| CHEMICALS — 0.2% | | | | Telefonica Emisiones SAU, | | |
| Dow Chemical Co. (The), | | | | 5.88%, 7/15/19(1) | 340,000 | 370,220 |
| 4.85%, 8/15/12(1) | 160,000 | 166,522 | | | | 1,371,886 |
| Dow Chemical Co. (The), | | | | ELECTRIC UTILITIES(3) | | |
| 8.55%, 5/15/19(1) | 360,000 | 405,371 | | | | |
| | | | | Niagara Mohawk Power | | |
| | | 571,893 | | Corp., 4.88%, 8/15/19(2) | 160,000 | 163,269 |
| COMMERCIAL SERVICES & SUPPLIES — 0.3% | | ELECTRONIC EQUIPMENT, INSTRUMENTS | |
| Corrections Corp. of | | | | & COMPONENTS — 0.3% | | |
| America, 7.75%, 6/1/17(1) | 400,000 | 415,000 | | Corning, Inc., | | |
| Waste Management, Inc., | | | | 6.625%, 5/15/19(1) | 600,000 | 657,566 |
| 7.375%, 3/11/19(1) | 500,000 | 582,889 | | Jabil Circuit, Inc., | | |
| | | 997,889 | | 7.75%, 7/15/16(1) | 300,000 | 306,000 |
| COMPUTERS & PERIPHERALS — 0.2% | | | | | 963,566 |
| Dell, Inc., 3.375%, 6/15/12 | 200,000 | 207,394 | | ENERGY EQUIPMENT & SERVICES — 0.1% | |
| Dell, Inc., 5.875%, 6/15/19 | 400,000 | 429,619 | | Pride International, Inc., | | |
| | | 637,013 | | 8.50%, 6/15/19(1) | 400,000 | 442,000 |
11
| | | | | | |
| Inflation Protection Bond | | | | |
| |
| | Principal | | | | Principal | |
| | Amount | Value | | | Amount | Value |
| FOOD & STAPLES RETAILING — 0.1% | | | METALS & MINING — 0.4% | | |
| CVS Caremark Corp., | | | | Anglo American Capital plc, | | |
| 6.60%, 3/15/19(1) | $ 250,000 | $ 282,322 | | 9.375%, 4/8/19(1)(2) | $ 300,000 | $ 365,102 |
| FOOD PRODUCTS(3) | | | | ArcelorMittal, | | |
| Kraft Foods, Inc., | | | | 6.125%, 6/1/18(1) | 200,000 | 197,410 |
| 6.125%, 2/1/18(1) | 90,000 | 95,527 | | BHP Billiton Finance USA | | |
| HEALTH CARE EQUIPMENT & SUPPLIES — 0.1% | | Ltd., 6.50%, 4/1/19(1) | 150,000 | 174,346 |
| St. Jude Medical, Inc., | | | | Rio Tinto Finance USA Ltd., | | |
| 4.875%, 7/15/19(1) | 230,000 | 237,395 | | 5.875%, 7/15/13(1) | 450,000 | 485,336 |
| HEALTH CARE PROVIDERS & SERVICES — 0.3% | | | | 1,222,194 |
| HCA, Inc., 7.875%, | | | | MULTI-UTILITIES — 0.2% | | |
| 2/15/20(1)(2) | 300,000 | 301,875 | | Dominion Resources, Inc., | | |
| Medco Health Solutions, | | | | 6.40%, 6/15/18(1) | 250,000 | 280,405 |
| Inc., 6.125%, 3/15/13(1) | 712,000 | 771,746 | | Pacific Gas & Electric Co., | | |
| | | 1,073,621 | | 6.25%, 12/1/13(1) | 180,000 | 202,388 |
| INDUSTRIAL CONGLOMERATES — 0.1% | | | PG&E Corp., | | |
| | | | | 5.75%, 4/1/14(1) | 120,000 | 131,178 |
| General Electric Co., | | | | | | |
| 5.25%, 12/6/17(1) | 200,000 | 205,589 | | Sempra Energy, | | |
| | | | | 6.50%, 6/1/16(1) | 130,000 | 143,935 |
| INSURANCE — 0.4% | | | | | | |
| | | | | | | 757,906 |
| Allstate Corp. (The), | | | | | | |
| 7.45%, 5/16/19 | 300,000 | 358,204 | | OIL, GAS & CONSUMABLE FUELS — 0.9% | |
| MetLife, Inc., | | | | Anadarko Petroleum Corp., | | |
| 6.75%, 6/1/16(1) | 500,000 | 558,963 | | 6.95%, 6/15/19(1) | 300,000 | 335,065 |
| Prudential Financial, Inc., | | | | Enterprise Products | | |
| 7.375%, 6/15/19(1) | 400,000 | 447,192 | | Operating LLC, | | |
| | | | | 4.60%, 8/1/12(1) | 530,000 | 549,622 |
| | | 1,364,359 | | | | |
| | | | | Enterprise Products | | |
| MEDIA — 1.1% | | | | Operating LLC, | | |
| Comcast Corp., | | | | 6.30%, 9/15/17(1) | 250,000 | 269,701 |
| 5.90%, 3/15/16(1) | 250,000 | 269,094 | | Kerr-McGee Corp., | | |
| Interpublic Group | | | | 6.95%, 7/1/24(1) | 320,000 | 343,410 |
| of Cos., Inc. (The), | | | | Kinder Morgan Energy | | |
| 10.00%, 7/15/17(1)(2) | 600,000 | 651,000 | | Partners LP, | | |
| Omnicom Group, Inc., | | | | 6.75%, 3/15/11(1) | 450,000 | 477,381 |
| 6.25%, 7/15/19(1) | 280,000 | 302,610 | | Magellan Midstream | | |
| Time Warner Cable, Inc., | | | | Partners LP, | | |
| 5.40%, 7/2/12(1) | 500,000 | 534,684 | | 6.55%, 7/15/19(1) | 270,000 | 300,580 |
| Time Warner Cable, Inc., | | | | Shell International Finance | | |
| 8.25%, 2/14/14(1) | 120,000 | 139,995 | | BV, 4.30%, 9/22/19(1) | 390,000 | 392,827 |
| Time Warner Cable, Inc., | | | | XTO Energy, Inc., | | |
| 6.75%, 7/1/18(1) | 600,000 | 664,142 | | 6.50%, 12/15/18(1) | 200,000 | 221,179 |
| Time Warner, Inc., | | | | | | 2,889,765 |
| 6.875%, 5/1/12(1) | 400,000 | 440,652 | | PAPER & FOREST PRODUCTS — 0.2% | |
| Viacom, Inc., | | | | International Paper Co., | | |
| 6.25%, 4/30/16(1) | 600,000 | 648,149 | | 9.375%, 5/15/19(1) | 250,000 | 293,205 |
| Virgin Media Finance plc, | | | | International Paper Co., | | |
| 9.50%, 8/15/16(1) | 200,000 | 211,500 | | 7.50%, 8/15/21(1) | 240,000 | 254,800 |
| | | 3,861,826 | | | | 548,005 |
12
| | | | | | |
| Inflation Protection Bond | | | | |
| |
| |
| | Principal | | | | Principal | |
| | Amount | Value | | | Amount/ | |
| PHARMACEUTICALS — 0.1% | | | | | Shares | Value |
| |
| Roche Holdings, Inc., | | | | Commercial Mortgage-Backed | |
| 6.00%, 3/1/19(1)(2) | $ 370,000 | $ 412,613 | | | | |
| | | | | Securities(5) — 0.5% | | |
| REAL ESTATE INVESTMENT TRUSTS (REITs) — 0.3% | | | | |
| ProLogis, 5.50%, 4/1/12(1) | 400,000 | 395,466 | | Credit Suisse Mortgage | | |
| | | | | Capital Certificates, | | |
| Simon Property Group LP, | | | | Series 2007 TF2A, Class | | |
| 6.75%, 5/15/14(1) | 320,000 | 343,671 | | A1, VRN, 0.42%, 10/15/09, | | |
| Simon Property Group LP, | | | | resets monthly off the | | |
| 5.75%, 12/1/15(1) | 400,000 | 409,727 | | 1-month LIBOR plus 0.18% | | |
| | | 1,148,864 | | with no caps(1)(2) | $ 496,902 | $ 369,253 |
| ROAD & RAIL — 0.1% | | | | LB-UBS Commercial | | |
| | | | | Mortgage Trust, Series 2005 | | |
| CSX Corp., 7.375%, 2/1/19(1) | 340,000 | 400,802 | | C2, Class A2 SEQ, | | |
| SEMICONDUCTORS & SEMICONDUCTOR | | | 4.82%, 4/15/30(1) | 1,008,270 | 1,018,870 |
| EQUIPMENT — 0.1% | | | | Lehman Brothers Floating | | |
| Analog Devices, Inc., | | | | Rate Commercial Mortgage | | |
| 5.00%, 7/1/14(1) | 180,000 | 189,396 | | Trust, Series 2007 LLFA, | | |
| SOFTWARE — 0.1% | | | | Class A1, VRN, 0.54%, | | |
| | | | | 10/15/09, resets monthly | | |
| Oracle Corp., | | | | off the 1-month LIBOR plus | | |
| 6.125%, 7/8/39(1) | 360,000 | 406,833 | | | | |
| | | | | 0.30% with no caps(1)(2) | 380,396 | 307,982 |
| TOBACCO — 0.1% | | | | TOTAL COMMERCIAL | | |
| Altria Group, Inc., | | | | MORTGAGE-BACKED SECURITIES | |
| 9.25%, 8/6/19(1) | 380,000 | 465,132 | | (Cost $1,881,799) | | 1,696,105 |
| WIRELESS TELECOMMUNICATION SERVICES — 0.3% | | | | |
| | | | | Asset-Backed Securities(5) — 0.1% |
| American Tower Corp., | | | | | | |
| 7.25%, 5/15/19(1)(2) | 600,000 | 619,500 | | Public Service New | | |
| Vodafone Group plc, | | | | Hampshire Funding LLC, | | |
| 5.45%, 6/10/19(1) | 270,000 | 281,741 | | Series 2001-1, Class A3 | | |
| | | | | SEQ, 6.48%, 5/1/15(1) | | |
| | | 901,241 | | (Cost $308,667) | 298,625 | 325,709 |
| TOTAL CORPORATE BONDS | | | | | | |
| (Cost $26,018,072) | | 27,875,420 | | Temporary Cash Investments(3) | |
| |
| Commercial Paper(4) — 2.5% | | | JPMorgan U.S. Treasury | | |
| | | | | Plus Money Market Fund | | |
| BNP Paribas Finance, Inc., | | | | Agency Shares | | |
| 0.02%, 10/1/09(1) | | | | (Cost $29,079) | 29,079 | 29,079 |
| (Cost $8,600,000) | 8,600,000 | 8,600,000 | | TOTAL INVESTMENT | | |
| |
| Municipal Securities — 0.8% | | | SECURITIES — 99.2% | | |
| | | | | (Cost $326,676,616) | | 335,695,071 |
| California Educational | | | | OTHER ASSETS AND | | |
| Facilities Auth. Rev., | | | | LIABILITIES — 0.8% | | 2,665,844 |
| Series 2007 T1, | | | | | | |
| (Stanford University), | | | | TOTAL NET ASSETS — 100.0% | | $338,360,915 |
| 5.00%, 3/15/39(1) | 2,000,000 | 2,387,220 | | | | |
| California GO, (Building | | | | | | |
| Bonds), 7.55%, 4/1/39(1) | 200,000 | 223,982 | | | | |
| TOTAL MUNICIPAL SECURITIES | | | | | |
| (Cost $2,099,739) | | 2,611,202 | | | | |
13
| | | |
| Inflation Protection Bond | | |
| |
| Swap Agreements | | |
| Notional Amount | Description of Agreement | Premiums Paid (Received) | Value |
| CREDIT DEFAULT - SELL PROTECTION | | |
| $ 870,000 | Receive quarterly a fixed rate equal to 5.00% | $(155,584) | $ (44,287) |
| | multiplied by the notional amount and pay Barclays | | |
| | Bank plc upon each default event of one of the | | |
| | issues of CDX North America High Yield 11 Index, | | |
| | par value of the proportional notional amount. | | |
| | Expires December 2013.* | | |
| TOTAL RETURN | | | |
| 800,000 | Pay a fixed rate equal to 1.13% and receive the | — | (28,125) |
| | return of the U.S. CPI Urban Consumers NSA Index | | |
| | upon the termination date with Barclays Bank plc. | | |
| | Expires January 2012. | | |
| 6,800,000 | Pay a fixed rate equal to 1.08% and receive the | — | (200,147) |
| | return of the U.S. CPI Urban Consumers NSA Index | | |
| | upon the termination date with UBS AG. Expires | | |
| | November 2013. | | |
| 1,000,000 | Pay a fixed rate equal to 1.31% and receive the | — | (56,973) |
| | return of the U.S. CPI Urban Consumers NSA Index | | |
| | upon the termination date with Barclays Bank plc. | | |
| | Expires April 2017. | | |
| 5,000,000 | Pay a fixed rate equal to 1.31% and receive the | — | (335,328) |
| | return of the U.S. CPI Urban Consumers NSA Index | | |
| | upon the termination date with Barclays Bank plc. | | |
| | Expires April 2018. | | |
| 1,900,000 | Pay a fixed rate equal to 1.77% and receive the | — | (159,886) |
| | return of the U.S. CPI Urban Consumers NSA Index | | |
| | upon the termination date with Barclays Bank plc. | | |
| | Expires December 2027. | | |
| | | — | (780,459) |
| | | $(155,584) | $(824,746) |
| |
| *The maximum potential amount the fund could be required to deliver as a seller of credit protection if a credit event occurs as defined under the |
| terms of the agreement is the notional amount. The maximum potential amount may be partially offset by any recovery values of the referenced |
| obligations and upfront payments received upon entering into the agreement. | | |
| |
| The quoted market prices and resulting market value for credit default swap agreements on credit indices serve as an indicator of the current status |
| of the payment/performance risk and represent the likelihood of an expected liability or profit at the period end. Increasing market values in absolute |
| terms when compared to the notional amount of the credit default swap agreement represent a deterioration of the referenced entity’s credit |
| soundness and an increased likelihood or risk of a credit event occurring as defined in the agreement. | |
| | |
| Notes to Schedule of Investments | | |
| CDX = Credit Derivative Indexes | (1) | Security, or a portion thereof, has been segregated for swap |
| CPI = Consumer Price Index | | agreements. At the period end, the aggregate value of securities |
| | | pledged was $1,651,000. |
| GO = General Obligation | | |
| | (2) | Security was purchased under Rule 144A of the Securities Act of |
| LB-UBS = Lehman Brothers, Inc. — UBS AG | | 1933 or is a private placement and, unless registered under the |
| LIBOR = London Interbank Offered Rate | | Act or exempted from registration, may only be sold to qualified |
| NSA = Not Seasonally Adjusted | | institutional investors. The aggregate value of these securities at |
| | | the period end was $3,990,517, which represented 1.2% of total |
| resets = The frequency with which a security’s coupon changes, | | net assets. |
| based on current market conditions or an underlying index. The more | | |
| frequently a security resets, the less risk the investor is taking that the | (3) | Category is less than 0.05% of total net assets. |
| coupon will vary significantly from current market rates. | (4) | The rate indicated is the yield to maturity at purchase. |
| SEQ = Sequential Payer | (5) | Final maturity indicated, unless otherwise noted. |
| VRN = Variable Rate Note. Interest reset date is indicated. Rate shown | | |
| is effective at the period end. | | |
See Notes to Financial Statements.
14
|
| Statement of Assets and Liabilities |
| |
| SEPTEMBER 30, 2009 (UNAUDITED) | |
| |
| Assets | |
| Investment securities, at value (cost of $326,676,616) | $335,695,071 |
| Receivable for capital shares sold | 2,165,242 |
| Interest receivable | 2,152,991 |
| | 340,013,304 |
| |
| Liabilities | |
| Payable for capital shares redeemed | 600,048 |
| Payable for swap agreements, at value (including premiums paid (received) of $(155,584)) | 824,746 |
| Accrued management fees | 127,092 |
| Distribution fees payable | 47,237 |
| Service fees (and distribution fees – A Class and R Class) payable | 53,266 |
| | 1,652,389 |
| |
| Net Assets | $338,360,915 |
| |
| |
| See Notes to Financial Statements. | |
15
| |
| SEPTEMBER 30, 2009 (UNAUDITED) | |
| |
| Net Assets Consist of: | |
| Capital paid in | $327,893,966 |
| Undistributed net investment income | 5,288,912 |
| Accumulated net realized loss on investment transactions | (3,171,256) |
| Net unrealized appreciation on investments | 8,349,293 |
| | $338,360,915 |
| | |
| Investor Class | |
| Net assets | $63,802,770 |
| Shares outstanding | 6,223,861 |
| Net asset value per share | $10.25 |
| | |
| Institutional Class | |
| Net assets | $8,805,533 |
| Shares outstanding | 854,532 |
| Net asset value per share | $10.30 |
| | |
| A Class | |
| Net assets | $180,195,212 |
| Shares outstanding | 17,697,650 |
| Net asset value per share | $10.18 |
| Maximum offering price (net asset value divided by 0.955) | $10.66 |
| | |
| B Class | |
| Net assets | $6,532,688 |
| Shares outstanding | 648,159 |
| Net asset value per share | $10.08 |
| | |
| C Class | |
| Net assets | $75,039,711 |
| Shares outstanding | 7,442,099 |
| Net asset value per share | $10.08 |
| | |
| R Class | |
| Net assets | $3,985,001 |
| Shares outstanding | 383,152 |
| Net asset value per share | $10.40 |
| |
| |
| See Notes to Financial Statements. | |
16
| |
| FOR THE SIX MONTHS ENDED SEPTEMBER 30, 2009 (UNAUDITED) | |
| Investment Income (Loss) | |
| Income: | |
| Interest | $ 6,921,856 |
| | |
| Expenses: | |
| Management fees | 756,444 |
| Distribution fees: | |
| B Class | 21,313 |
| C Class | 196,957 |
| Service fees: | |
| B Class | 7,104 |
| C Class | 65,652 |
| Distribution and service fees: | |
| A Class | 184,014 |
| R Class | 5,780 |
| Trustees’ fees and expenses | 5,344 |
| Other expenses | 16 |
| | 1,242,624 |
| | |
| Fees waived | (49,627) |
| | 1,192,997 |
| Net investment income (loss) | 5,728,859 |
| | |
| Realized and Unrealized Gain (Loss) | |
| Net realized gain (loss) on: | |
| Investment transactions | 893,810 |
| Futures contract transactions | (49,122) |
| Swap agreement transactions | (25,910) |
| | 818,778 |
| | |
| Change in net unrealized appreciation (depreciation) on: | |
| Investments | 5,253,089 |
| Futures contracts | 117,976 |
| Swap agreements | 140,658 |
| | 5,511,723 |
| | |
| Net realized and unrealized gain (loss) | 6,330,501 |
| | |
| Net Increase (Decrease) in Net Assets Resulting from Operations | $12,059,360 |
| |
| |
| See Notes to Financial Statements. | |
17
|
| Statement of Changes in Net Assets |
| | |
| SIX MONTHS ENDED SEPTEMBER 30, 2009 (UNAUDITED) AND YEAR ENDED MARCH 31, 2009 | |
| Increase (Decrease) in Net Assets | September 30, 2009 | March 31, 2009 |
| Operations | | |
| Net investment income (loss) | $ 5,728,859 | $ 950,546 |
| Net realized gain (loss) | 818,778 | (3,653,244) |
| Change in net unrealized appreciation (depreciation) | 5,511,723 | (1,010,737) |
| Net increase (decrease) in net assets resulting from operations | 12,059,360 | (3,713,435) |
| | | |
| Distributions to Shareholders | | |
| From net investment income: | | |
| Investor Class | — | (907,844) |
| Institutional Class | — | (20,148) |
| A Class | — | (2,603,324) |
| B Class | — | (95,117) |
| C Class | — | (637,552) |
| R Class | — | (11,720) |
| From net realized gains: | | |
| Investor Class | — | (24,464) |
| Institutional Class | — | (543) |
| A Class | — | (70,153) |
| B Class | — | (2,563) |
| C Class | — | (17,181) |
| R Class | — | (316) |
| From return of capital: | | |
| Investor Class | — | (280,115) |
| Institutional Class | — | (6,217) |
| A Class | — | (803,252) |
| B Class | — | (29,348) |
| C Class | — | (196,716) |
| R Class | — | (3,616) |
| Decrease in net assets from distributions | — | (5,710,189) |
| | | |
| Capital Share Transactions | | |
| Net increase (decrease) in net assets from capital share transactions | 133,327,078 | 83,469,343 |
| |
| Net increase (decrease) in net assets | 145,386,438 | 74,045,719 |
| | | |
| Net Assets | | |
| Beginning of period | 192,974,477 | 118,928,758 |
| End of period | $338,360,915 | $192,974,477 |
| | | |
| Accumulated undistributed net investment income (loss) | $5,288,912 | $(439,947) |
| |
| |
| See Notes to Financial Statements. | | |
18
|
| Notes to Financial Statements |
SEPTEMBER 30, 2009 (UNAUDITED)
1. Organization and Summary of Significant Accounting Policies
Organization — American Century Investment Trust (the trust) is registered under the Investment Company Act of 1940 (the 1940 Act) as an open-end management investment company. Inflation Protection Bond Fund (the fund) is one fund in a series issued by the trust. The fund is nondiversified under the 1940 Act. The fund’s investment objective is to seek total return and protection against U.S. inflation. The fund invests primarily in inflation-linked debt securities. These securities include inflation-linked securities issued by the U.S. Treasury, by U.S. government agencies and instrumentalities, and by entities other than the U.S. Treasury or U.S. government agencies and instrumentalities. The following is a summary of the fund’s significant accounting policies.
Multiple Class — The fund is authorized to issue the Investor Class, the Institutional Class, the A Class, the B Class, the C Class, and the R Class. The A Class may incur an initial sales charge. The A Class, B Class, and C Class may be subject to a contingent deferred sales charge. The share classes differ principally in their respective sales charges and distribution and shareholder servicing expenses and arrangements. All shares of the fund represent an equal pro rata interest in the net assets of the class to which such shares belong, and have identical voting, dividend, liquidation and other rights and the same terms and conditions, except for class specific expenses and exclusive rights to vote on matters affecting only individual classes. Income, non-class specific expenses, and realized and unrealized capital gains and losses of t he fund are allocated to each class of shares based on their relative net assets.
Security Valuations — Debt securities maturing in greater than 60 days at the time of purchase are valued at current market value as provided by a commercial pricing service or at the mean of the most recent bid and asked prices. Debt securities maturing within 60 days at the time of purchase may be valued at cost, plus or minus any amortized discount or premium. Investments in open-end management investment companies are valued at the reported net asset value. Securities traded on foreign securities exchanges and over-the-counter markets are normally completed before the close of business on days that the New York Stock Exchange (the Exchange) is open and may also take place on days when the Exchange is not open. If an event occurs after the value of a security was established but before the net asset value per share was determined that w as likely to materially change the net asset value, that security would be valued as determined in accordance with procedures adopted by the Board of Trustees. If the fund determines that the market price of a portfolio security is not readily available, or that the valuation methods mentioned above do not reflect the security’s fair value, such security is valued as determined by the Board of Trustees or its designee, in accordance with procedures adopted by the Board of Trustees, if such determination would materially impact a fund’s net asset value. Certain other circumstances may cause the fund to use alternative procedures to value a security such as: a security has been declared in default; trading in a security has been halted during the trading day; or there is a foreign market holiday and no trading will commence.
Security Transactions — For financial reporting purposes, security transactions are accounted for as of the trade date. Net realized gains and losses are determined on the identified cost basis, which is also used for federal income tax purposes.
Investment Income— Interest income less foreign taxes withheld, if any, is recorded on the accrual basis and includes paydown gain (loss) and accretion of discounts and amortization of premiums. Inflation adjustments related to inflation-linked debt securities are reflected as interest income.
19
Foreign Currency Translations — All assets and liabilities initially expressed in foreign currencies are translated into U.S. dollars at prevailing exchange rates at period end. The fund may enter into spot foreign currency exchange contracts to facilitate transactions denominated in a foreign currency. Purchases and sales of investment securities, dividend and interest income, spot foreign currency exchange contracts, and certain expenses are translated at the rates of exchange prevailing on the respective dates of such transactions. For assets and liabilities, other than investments in securities, net realized and unrealized gains and losses from foreign currency translations arise from changes in currency exchange rates.
Net realized and unrealized foreign currency exchange gains or losses occurring during the holding period of investment securities are a component of realized gain (loss) on investment transactions and unrealized appreciation (depreciation) on investments, respectively. Certain countries may impose taxes on the contract amount of purchases and sales of foreign currency contracts in their currency. The fund records the foreign tax expense, if any, as a reduction to the net realized gain (loss) on foreign currency transactions.
Income Tax Status — It is the fund’s policy to distribute substantially all net investment income and net realized gains to shareholders and to otherwise qualify as a regulated investment company under provisions of the Internal Revenue Code. All tax years for the fund remain subject to examination by tax authorities. At this time, management believes there are no uncertain tax positions which, based on their technical merit, would not be sustained upon examination and for which it is reasonably possible that the total amounts of unrecognized tax benefits will significantly change in the next twelve months. Accordingly, no provision has been made for federal or state income taxes. Interest and penalties associated with any federal or state income tax obligations, if any, are recorded as interest expense.
Distributions to Shareholders — Distributions to shareholders are recorded on the ex-dividend date. Distributions from net investment income are declared and paid quarterly. Distributions from net realized gains, if any, are generally declared and paid annually.
Indemnifications — Under the trust’s organizational documents, its officers and trustees are indemnified against certain liabilities arising out of the performance of their duties to the fund. In addition, in the normal course of business, the fund enters into contracts that provide general indemnifications. The maximum exposure under these arrangements is unknown as this would involve future claims that may be made against a fund. The risk of material loss from such claims is considered by management to be remote.
Use of Estimates — The financial statements are prepared in conformity with accounting principles generally accepted in the United States of America, which may require management to make certain estimates and assumptions at the date of the financial statements. Actual results could differ from these estimates.
Subsequent Events — Management has evaluated events or transactions that may have occurred since September 30, 2009, that would merit recognition or disclosure in the financial statements. This evaluation was completed through November 27, 2009, the date the financial statements were issued.
20
2. Fees and Transactions with Related Parties
Management Fees — The trust has entered into a Management Agreement with American Century Investment Management, Inc. (ACIM) (the investment advisor), under which ACIM provides the fund with investment advisory and management services in exchange for a single, unified management fee (the fee) per class. The Agreement provides that all expenses of the fund, except brokerage commissions, taxes, interest, fees and expenses of those trustees who are not considered “interested persons” as defined in the 1940 Act (including counsel fees) and extraordinary expenses, will be paid by ACIM. The fee is computed and accrued daily based on the daily net assets of the specific class of shares of the fund and paid monthly in arrears. The fee consists of (1) an Investment Category Fee based on the daily net assets of the fund and certain ot her accounts managed by the investment advisor that are in the same broad investment category as the fund and (2) a Complex Fee based on the assets of all the funds in the American Century Investments family of funds. The rates for the Investment Category Fee range from 0.2625% to 0.3800% and the rates for the Complex Fee (Investor Class, A Class, B Class, C Class, and R Class) range from 0.2500% to 0.3100%. The Institutional Class is 0.2000% less at each point within the Complex Fee range. Effective August 1, 2009, the investment advisor voluntarily agreed to waive 0.096% of its management fee. The total amount of the waiver for each class of the fund for the six months ended September 30, 2009, was $9,175, $1,121, $27,135, $997, $10,641 and $558 for the Investor Class, Institutional Class, A Class, B Class, C Class and R Class, respectively. The investment advisor expects this fee waiver to continue for one year and cannot terminate it without consulting the Board of Trustees. The e ffective annual management fee before waiver for the fund for the six months ended September 30, 2009 was 0.58% for all classes except Institutional Class, which was 0.38%. The effective annual management fee after waiver for the fund for the six months ended September 30, 2009 was 0.54% for all classes except Institutional Class, which was 0.34%.
Distribution and Service Fees — The Board of Trustees has adopted a separate Master Distribution and Individual Shareholder Services Plan for each of the A Class, B Class, C Class and R Class (collectively the plans), pursuant to Rule 12b-1 of the 1940 Act. The plans provide that the A Class and the R Class will pay American Century Investment Services, Inc. (ACIS) an annual distribution and service fee of 0.25% for the A Class and 0.50% for the R Class. The plans provide that the B Class and C Class will each pay ACIS an annual distribution fee of 0.75% and service fee of 0.25%. The fees are computed and accrued daily based on each class’s daily net assets and paid monthly in arrears. The fees are used to pay financial intermediaries for distribution and individual shareholder services. Fees incurred under the plans during the s ix months ended September 30, 2009, are detailed in the Statement of Operations.
Related Parties — Certain officers and trustees of the trust are also officers and/or directors of American Century Companies, Inc. (ACC), the parent of the trust’s investment advisor, ACIM, the distributor of the trust, ACIS, and the trust’s transfer agent, American Century Services, LLC.
The fund is eligible to invest in a money market fund for temporary purposes, which is managed by J.P. Morgan Investment Management, Inc. (JPMIM). The fund has a Mutual Funds Services Agreement with J.P. Morgan Investor Services Co. (JPMIS). JPMorgan Chase Bank (JPMCB) is a custodian of the fund. JPMIM, JPMIS and JPMCB are wholly owned subsidiaries of JPMorgan Chase & Co. (JPM). JPM is an equity investor in ACC.
3. Investment Transactions
Purchases of investment securities, excluding short-term investments, for the six months ended September 30, 2009, totaled $151,236,277, of which $124,646,330 represented U.S. Treasury and Government Agency obligations. Sales of investment securities, excluding short-term investments, for the six months ended September 30, 2009, totaled $19,569,351, of which $11,965,499 represented U.S. Treasury and Government Agency obligations.
21
4. Capital Share Transactions
Transactions in shares of the fund were as follows (unlimited number of shares authorized):
| | | | |
| | Six months ended September 30, 2009 | Year ended March 31, 2009 |
| | Shares | Amount | Shares | Amount |
| Investor Class | | | | |
| Sold | 3,243,073 | $ 32,163,839 | 4,390,083 | $ 43,435,276 |
| Issued in reinvestment of distributions | — | — | 81,899 | 814,836 |
| Redeemed | (983,455) | (9,740,095) | (2,604,420) | (25,061,814) |
| | 2,259,618 | 22,423,744 | 1,867,562 | 19,188,298 |
| Institutional Class | | | | |
| Sold | 655,368 | 6,548,506 | 269,384 | 2,566,345 |
| Issued in reinvestment of distributions | — | — | 2,695 | 26,908 |
| Redeemed | (54,457) | (541,089) | (62,210) | (604,451) |
| | 600,911 | 6,007,417 | 209,869 | 1,988,802 |
| A Class | | | | |
| Sold | 8,355,161 | 81,957,233 | 9,095,653 | 88,913,570 |
| Issued in reinvestment of distributions | — | — | 328,908 | 3,261,792 |
| Redeemed | (2,079,899) | (20,464,140) | (4,940,405) | (46,776,740) |
| | 6,275,262 | 61,493,093 | 4,484,156 | 45,398,622 |
| B Class | | | | |
| Sold | 217,341 | 2,118,345 | 269,661 | 2,653,779 |
| Issued in reinvestment of distributions | — | — | 7,978 | 78,937 |
| Redeemed | (54,527) | (536,407) | (63,806) | (603,080) |
| | 162,814 | 1,581,938 | 213,833 | 2,129,636 |
| C Class | | | | |
| Sold | 4,399,408 | 42,899,501 | 2,446,142 | 23,830,891 |
| Issued in reinvestment of distributions | — | — | 46,698 | 462,067 |
| Redeemed | (396,393) | (3,864,773) | (1,068,805) | (10,312,170) |
| | 4,003,015 | 39,034,728 | 1,424,035 | 13,980,788 |
| R Class | | | | |
| Sold | 327,141 | 3,288,823 | 112,778 | 1,133,029 |
| Issued in reinvestment of distributions | — | — | 1,541 | 15,652 |
| Redeemed | (49,859) | (502,665) | (36,489) | (365,484) |
| | 277,282 | 2,786,158 | 77,830 | 783,197 |
| Net increase (decrease) | 13,578,902 | $133,327,078 | 8,277,285 | $ 83,469,343 |
5. Fair Value Measurements
The fund’s security valuation process is based on several considerations and may use multiple inputs to determine the fair value of the positions held by the fund. In conformity with accounting principles generally accepted in the United States of America, the inputs used to determine a valuation are classified into three broad levels as follows:
• Level 1 valuation inputs consist of actual quoted prices in an active market for identical securities;
• Level 2 valuation inputs consist of significant direct or indirect observable market data (including quoted prices for similar securities, evaluations of subsequent market events, interest rates, prepayment speeds, credit risk, etc.); or
• Level 3 valuation inputs consist of significant unobservable inputs (including a fund’s own assumptions).
22
The level classification is based on the lowest level input that is significant to the fair valuation measurement. The valuation inputs are not an indication of the risks associated with investing in these securities or other financial instruments.
The following is a summary of the valuation inputs used to determine the fair value of the fund’s securities and other financial instruments as of September 30, 2009:
| | | |
| | Level 1 | Level 2 | Level 3 |
| Investment Securities | | | |
| U.S. Treasury Securities | — | $294,557,556 | — |
| Corporate Bonds | — | 27,875,420 | — |
| Commercial Paper | — | 8,600,000 | — |
| Municipal Securities | — | 2,611,202 | — |
| Commercial Mortgage-Backed Securities | — | 1,696,105 | — |
| Asset-Backed Securities | — | 325,709 | — |
| Temporary Cash Investments | $29,079 | — | — |
| Total Value of Investment Securities | $29,079 | $335,665,992 | — |
| | | | |
| Other Financial Instruments | | | |
| Total Unrealized Gain (Loss) on | | | |
| Swap Agreements | — | $(669,162) | — |
6. Derivative Instruments
Credit Risk — The fund is subject to credit risk in the normal course of pursuing its investment objectives. The value of a bond generally declines as the credit quality of its issuer declines. Credit default swaps enable a fund to buy/sell protection against a credit event of a specific issuer or index. A fund may attempt to enhance returns by selling protection or attempt to mitigate credit risk by buying protection. The buyer/seller of credit protection against a security or basket of securities may pay/receive an up-front or periodic payment to compensate for/against potential default events. A fund will segregate cash, cash equivalents or other appropriate liquid securities on its records in amounts sufficient to meet requirements. Swap agreements are valued daily at current market value as provided by a commercial pricing service and /or independent brokers. Changes in value, including the periodic amounts of interest to be paid or received on swaps, are recorded as unrealized appreciation (depreciation) on swap agreements. Realized gain or loss is recorded upon receipt or payment of a periodic settlement or termination of swap agreements. Net realized and unrealized gains or losses occurring during the holding period of swap agreements are a component of net realized gain (loss) on swap agreement transactions and change in net unrealized appreciation (depreciation) on swap agreements, respectively. The risks of entering into swap agreements include the possible lack of liquidity, failure of the counterparty to meet its obligations, and that there may be unfavorable changes in the underlying investments or instruments. During the six months ended September 30, 2009, the fund participated in credit default swap agreements to sell protection.
Interest Rate Risk — The fund is subject to interest rate risk in the normal course of pursuing its investment objectives. The value of bonds generally declines as interest rates rise. A fund may enter into futures contracts based on a bond index or a specific underlying security. A fund may purchase futures contracts to gain exposure to increases in market value or sell futures contracts to protect against a decline in market value. Upon entering into a futures contract, a fund will segregate cash, cash equivalents or other appropriate liquid securities on its records in amounts sufficient to meet requirements. Subsequent payments (variation margin) are made or received daily, in cash, by a fund. The variation margin is equal to the daily change in the contract value and is recorded as unrealized gains and losses. A fund recognizes a real ized gain or loss when the futures contract is closed or expires. Net realized and net unrealized gains or losses occurring during the
23
holding period of futures contracts are a component of net realized gain (loss) on futures contract transactions and change in net unrealized appreciation (depreciation) on futures contracts, respectively. One of the risks of entering into futures contracts is the possibility that the change in value of the contract may not correlate with the changes in value of the underlying securities. During the six months ended September 30, 2009, the fund purchased and sold futures contracts.
Other Contracts — A fund may enter into total return swap agreements in order to attempt to obtain or preserve a particular return or spread at a lower cost than obtaining a return or spread through purchases and/or sales of instruments in other markets or gain exposure to certain markets in the most economical way possible. A fund will segregate cash, cash equivalents or other appropriate liquid securities on its records in amounts sufficient to meet requirements. Swap agreements are valued daily at current market value as provided by a commercial pricing service and/or independent brokers. Changes in value, including the periodic amounts of interest to be paid or received on swap agreements, are recorded as unrealized appreciation (depreciation) on swap agreements. Realized gain or loss is recorded upon receipt or payment of a periodic s ettlement or termination of swap agreements. Net realized and unrealized gains or losses occurring during the holding period of swap agreements are a component of net realized gain (loss) on swap agreement transactions and change in net unrealized appreciation (depreciation) on swap agreements, respectively. The risks of entering into swap agreements include the possible lack of liquidity, failure of the counterparty to meet its obligations, and that there may be unfavorable changes in the underlying investments or instruments. During the six months ended September 30, 2009, the fund participated in total return swap agreements.
Value of Derivative Instruments as of September 30, 2009
| | | | |
| | Asset Derivatives | | Liability Derivatives | |
| | Location on Statement | | Location on Statement | |
| Type of Derivative | of Assets and Liabilities | Value | of Assets and Liabilities | Value |
| Credit Risk | Receivable for swap | — | Payable for swap | $ 44,287 |
| | agreements, at value | | agreements, at value | |
| | | | | |
| | | | | |
| Other Contracts | Receivable for swap | — | Payable for swap | 780,459 |
| | agreements, at value | | agreements, at value | |
| | | — | | $824,746 |
| |
| Effect of Derivative Instruments on the Statement of Operations for the Six Months Ended |
| September 30, 2009 | | | |
| |
| | | | Change in Net Unrealized |
| | Net Realized Gain (Loss) | Appreciation (Depreciation) |
| | Location on Statement | | Location on Statement | |
| Type of Derivative | of Operations | | of Operations | |
| Credit Risk | Net realized gain (loss) on | $(25,910) | Change in net unrealized | $198,456 |
| | swap agreement transactions | | appreciation (depreciation) on | |
| | | | swap agreements | |
| Interest Rate Risk | Net realized gain (loss) on | (49,122) | Change in net unrealized | 117,976 |
| | futures contract transactions | | appreciation (depreciation) on | |
| | | | futures contracts | |
| Other Contracts | Net realized gain (loss) on | — | Change in net unrealized | (57,798) |
| | swap agreement transactions | | appreciation (depreciation) on | |
| | | | swap agreements | |
| | | $(75,032) | | $258,634 |
| |
| |
| The value of derivative instruments at period end and the effect of derivatives on the |
| Statement of Operations is indicative of the fund’s typical volume. | |
24
7. Interfund Lending
The fund, along with certain other funds in the American Century Investments family of funds, may participate in an interfund lending program, pursuant to an Exemptive Order issued by the Securities and Exchange Commission (SEC). This program provides an alternative credit facility allowing the fund to borrow from or lend to other funds in the American Century Investments family of funds that permit such transactions. Interfund lending transactions are subject to each fund’s investment policies and borrowing and lending limits. The interfund loan rate earned/paid on interfund lending transactions is determined daily based on the average of certain current market rates. Interfund lending transactions normally extend only overnight, but can have a maximum duration of seven days. The program is subject to annual approval by the Board of Trustees. During the six months ended September 30, 2009, the fund did not utilize the pro gram.
8. Federal Tax Information
The book-basis character of distributions made during the year from net investment income or net realized gains may differ from their ultimate characterization for federal income tax purposes. These differences reflect the differing character of certain income items and net realized gains and losses for financial statement and tax purposes, and may result in reclassification among certain capital accounts on the financial statements.
As of September 30, 2009, the components of investments for federal income tax purposes were as follows:
| |
| Federal tax cost of investments | $326,676,616 |
| Gross tax appreciation of investments | $9,229,637 |
| Gross tax depreciation of investments | (211,182) |
| Net tax appreciation (depreciation) of investments | $9,018,455 |
The cost of investments for federal income tax purposes was the same as the cost for financial reporting purposes.
As of March 31, 2009, the fund had accumulated capital losses of $(51,665), which represent net capital loss carryovers that may be used to offset future realized capital gains for federal income tax purposes. Future capital loss carryover utilization in any given year may be subject to Internal Revenue Code limitations. The capital loss carryovers expire in 2017.
The fund had capital loss deferrals of $(2,288,289) which represent net capital losses incurred in the five-month period ended March 31, 2009. The fund has elected to treat such losses as having been incurred in the following fiscal year for federal income tax purposes.
9. Recently Issued Accounting Standards
In March 2008, the Financial Accounting Standards Board (FASB) issued Accounting Standards Codification (ASC) Section 815-10 (formerly Statement of Financial Accounting Standards No. 161, “Disclosures about Derivative Instruments and Hedging Activities —an amendment of FASB Statement No. 133”). ASC Section 815-10 is effective for interim periods beginning after November 15, 2008 and has been adopted by the fund. ASC Section 815-10 amends and expands disclosures about derivative instruments and hedging activities. ASC Section 815-10 requires qualitative disclosures about the objectives and strategies of derivative instruments, quantitative disclosures about the fair value amounts of and gains and losses on derivative instruments, and disclosures of credit-risk-related contingent features in hedging activities.
25
| | | | | | |
| Inflation Protection Bond | | | | |
| |
| Investor Class | | | | | |
| For a Share Outstanding Throughout the Years Ended March 31 (except as noted) | | |
| | | 2009(1) | 2009 | 2008 | 2007 | 2006(2) |
| Per-Share Data | | | | | |
| Net Asset Value, Beginning of Period | $9.86 | $10.48 | $9.57 | $9.47 | $10.00 |
| Income From Investment Operations | | | | | |
| Net Investment Income (Loss) | 0.23(3) | 0.07(3) | 0.49(3) | 0.33(3) | 0.33 |
| Net Realized and Unrealized Gain (Loss) | 0.16 | (0.29) | 0.88 | 0.08 | (0.53) |
| Total From Investment Operations | 0.39 | (0.22) | 1.37 | 0.41 | (0.20) |
| Distributions | | | | | |
| From Net Investment Income | — | (0.30) | (0.46) | (0.31) | (0.33) |
| From Net Realized Gains | — | (0.01) | — | — | — |
| From Return of Capital | — | (0.09) | — | —(4) | — |
| Total Distributions | — | (0.40) | (0.46) | (0.31) | (0.33) |
| Net Asset Value, End of Period | $10.25 | $9.86 | $10.48 | $9.57 | $9.47 |
| |
| Total Return(5) | 3.96% | (2.13)% | 14.87% | 4.46% | (2.09)% |
| | | | | | |
| Ratios/Supplemental Data | | | | | |
| Ratio of Operating Expenses | | | | | |
| to Average Net Assets | 0.55%(6)(7) | 0.59% | 0.59% | 0.59% | 0.59%(7) |
| Ratio of Operating Expenses to Average | | | | | |
| Net Assets (Before Expense Waiver) | 0.59%(7) | 0.59% | 0.59% | 0.59% | 0.59%(7) |
| Ratio of Net Investment Income (Loss) | | | | | |
| to Average Net Assets | 4.73%(6)(7) | 0.97% | 4.95% | 3.26% | 3.97%(7) |
| Ratio of Net Investment Income | | | | | |
| (Loss) to Average Net Assets | | | | | |
| (Before Expense Waiver) | 4.69%(7) | 0.97% | 4.95% | 3.26% | 3.97%(7) |
| Portfolio Turnover Rate | 8% | 37% | 31% | 52% | 51% |
| Net Assets, End of Period (in thousands) | $63,803 | $39,101 | $21,968 | $596 | $375 |
| | | | | |
| (1) | Six months ended September 30, 2009 (unaudited). | | | | |
| (2) | May 31, 2005 (fund inception) through March 31, 2006. | | | | |
| (3) | Computed using average shares outstanding throughout the period. | | | | |
| (4) | Per-share amount was less than $0.005. | | | | | |
| (5) | Total return assumes reinvestment of net investment income and capital gains distributions, if any. Total returns for periods less than one year |
| | are not annualized. The total return of the classes may not precisely reflect the class expense differences because of the impact of calculating |
| | the net asset values to two decimal places. If net asset values were calculated to three decimal places, the total return differences would |
| | more closely reflect the class expense differences. The calculation of net asset values to two decimal places is made in accordance with SEC |
| | guidelines and does not result in any gain or loss of value between one class and another. | | | |
| (6) | Effective August 1, 2009, the investment advisor voluntarily agreed to waive a portion of its management fee. | | |
| (7) | Annualized. | | | | �� | |
| |
| |
| See Notes to Financial Statements. | | | | | |
26
| | | | | | |
| Inflation Protection Bond | | | | |
| |
| Institutional Class | | | | | |
| For a Share Outstanding Throughout the Years Ended March 31 (except as noted) | | |
| | | 2009(1) | 2009 | 2008 | 2007 | 2006(2) |
| Per-Share Data | | | | | |
| Net Asset Value, Beginning of Period | $9.90 | $10.51 | $9.57 | $9.47 | $10.00 |
| Income From Investment Operations | | | | | |
| Net Investment Income (Loss) | 0.24(3) | (0.20)(3) | 0.49(3) | 0.35(3) | 0.34 |
| Net Realized and Unrealized Gain (Loss) | 0.16 | —(4) | 0.93 | 0.11 | (0.53) |
| Total From Investment Operations | 0.40 | (0.20) | 1.42 | 0.46 | (0.19) |
| Distributions | | | | | |
| From Net Investment Income | — | (0.31) | (0.48) | (0.36) | (0.34) |
| From Net Realized Gains | — | (0.01) | — | — | — |
| From Return of Capital | — | (0.09) | — | — | — |
| Total Distributions | — | (0.41) | (0.48) | (0.36) | (0.34) |
| Net Asset Value, End of Period | $10.30 | $9.90 | $10.51 | $9.57 | $9.47 |
| |
| Total Return(5) | 4.04% | (1.93)% | 15.43% | 4.81% | (1.97)% |
| | | | | | |
| Ratios/Supplemental Data | | | | | |
| Ratio of Operating Expenses | | | | | |
| to Average Net Assets | 0.35%(6)(7) | 0.39% | 0.39% | 0.39% | 0.39%(7) |
| Ratio of Operating Expenses to Average | | | | | |
| Net Assets (Before Expense Waiver) | 0.39%(7) | 0.39% | 0.39% | 0.39% | 0.39%(7) |
| Ratio of Net Investment Income (Loss) | | | | | |
| to Average Net Assets | 4.93%(6)(7) | 1.17% | 5.15% | 3.46% | 4.17%(7) |
| Ratio of Net Investment Income | | | | | |
| (Loss) to Average Net Assets | | | | | |
| (Before Expense Waiver) | 4.89%(7) | 1.17% | 5.15% | 3.46% | 4.17%(7) |
| Portfolio Turnover Rate | 8% | 37% | 31% | 52% | 51% |
| Net Assets, End of Period (in thousands) | $8,806 | $2,512 | $460 | $43 | $38 |
| | | | | |
| (1) | Six months ended September 30, 2009 (unaudited). | | | | |
| (2) | May 31, 2005 (fund inception) through March 31, 2006. | | | | |
| (3) | Computed using average shares outstanding throughout the period. | | | | |
| (4) | Per-share amount was less than $0.005. | | | | | |
| (5) | Total return assumes reinvestment of net investment income and capital gains distributions, if any. Total returns for periods less than one year |
| | are not annualized. The total return of the classes may not precisely reflect the class expense differences because of the impact of calculating |
| | the net asset values to two decimal places. If net asset values were calculated to three decimal places, the total return differences would |
| | more closely reflect the class expense differences. The calculation of net asset values to two decimal places is made in accordance with SEC |
| | guidelines and does not result in any gain or loss of value between one class and another. | | | |
| (6) | Effective August 1, 2009, the investment advisor voluntarily agreed to waive a portion of its management fee. | | |
| (7) | Annualized. | | | | | |
| |
| |
| See Notes to Financial Statements. | | | | | |
27
| | | | | | |
| Inflation Protection Bond | | | | |
| |
| A Class | | | | | |
| For a Share Outstanding Throughout the Years Ended March 31 (except as noted) | | |
| | | 2009(1) | 2009 | 2008 | 2007 | 2006(2) |
| Per-Share Data | | | | | |
| Net Asset Value, Beginning of Period | $9.81 | $10.43 | $9.52 | $9.45 | $10.00 |
| Income From Investment Operations | | | | | |
| Net Investment Income (Loss) | 0.22(3) | 0.08(3) | 0.46(3) | 0.28(3) | 0.33 |
| Net Realized and Unrealized Gain (Loss) | 0.15 | (0.31) | 0.89 | 0.11 | (0.55) |
| Total From Investment Operations | 0.37 | (0.23) | 1.35 | 0.39 | (0.22) |
| Distributions | | | | | |
| From Net Investment Income | — | (0.29) | (0.44) | (0.30) | (0.33) |
| From Net Realized Gains | — | (0.01) | — | — | — |
| From Return of Capital | — | (0.09) | — | (0.02) | — |
| Total Distributions | — | (0.39) | (0.44) | (0.32) | (0.33) |
| Net Asset Value, End of Period | $10.18 | $9.81 | $10.43 | $9.52 | $9.45 |
| |
| Total Return(4) | 3.77% | (2.27)% | 14.66% | 4.25% | (2.35)% |
| | | | | | |
| Ratios/Supplemental Data | | | | | |
| Ratio of Operating Expenses | | | | | |
| to Average Net Assets | 0.80%(5)(6) | 0.84% | 0.84% | 0.84% | 0.84%(6) |
| Ratio of Operating Expenses to Average | | | | | |
| Net Assets (Before Expense Waiver) | 0.84%(6) | 0.84% | 0.84% | 0.84% | 0.84%(6) |
| Ratio of Net Investment Income (Loss) | | | | | |
| to Average Net Assets | 4.48%(5)(6) | 0.72% | 4.70% | 3.01% | 3.72%(6) |
| Ratio of Net Investment Income | | | | | |
| (Loss) to Average Net Assets | | | | | |
| (Before Expense Waiver) | 4.44%(6) | 0.72% | 4.70% | 3.01% | 3.72%(6) |
| Portfolio Turnover Rate | 8% | 37% | 31% | 52% | 51% |
| Net Assets, End of Period (in thousands) | $180,195 | $112,039 | $72,397 | $12,402 | $8,164 |
| | | | | |
| (1) | Six months ended September 30, 2009 (unaudited). | | | | |
| (2) | May 31, 2005 (fund inception) through March 31, 2006. | | | | |
| (3) | Computed using average shares outstanding throughout the period. | | | | |
| (4) | Total return assumes reinvestment of net investment income and capital gains distributions, if any, and does not reflect applicable sales charges. |
| | Total returns for periods less than one year are not annualized. The total return of the classes may not precisely reflect the class expense |
| | differences because of the impact of calculating the net asset values to two decimal places. If net asset values were calculated to three decimal |
| | places, the total return differences would more closely reflect the class expense differences. The calculation of net asset values to two decimal |
| | places is made in accordance with SEC guidelines and does not result in any gain or loss of value between one class and another. | |
| (5) | Effective August 1, 2009, the investment advisor voluntarily agreed to waive a portion of its management fee. | | |
| (6) | Annualized. | | | | | |
| |
| |
| See Notes to Financial Statements. | | | | | |
28
| | | | | | |
| Inflation Protection Bond | | | | |
| |
| B Class | | | | | |
| For a Share Outstanding Throughout the Years Ended March 31 (except as noted) | | |
| | | 2009(1) | 2009 | 2008 | 2007 | 2006(2) |
| Per-Share Data | | | | | |
| Net Asset Value, Beginning of Period | $9.75 | $10.41 | $9.50 | $9.45 | $10.00 |
| Income From Investment Operations | | | | | |
| Net Investment Income (Loss) | 0.19(3) | (0.04)(3) | 0.41(3) | 0.21(3) | 0.27 |
| Net Realized and Unrealized Gain (Loss) | 0.14 | (0.27) | 0.86 | 0.11 | (0.55) |
| Total From Investment Operations | 0.33 | (0.31) | 1.27 | 0.32 | (0.28) |
| Distributions | | | | | |
| From Net Investment Income | — | (0.26) | (0.36) | (0.23) | (0.27) |
| From Net Realized Gains | — | (0.01) | — | — | — |
| From Return of Capital | — | (0.08) | — | (0.04) | — |
| Total Distributions | — | (0.35) | (0.36) | (0.27) | (0.27) |
| Net Asset Value, End of Period | $10.08 | $9.75 | $10.41 | $9.50 | $9.45 |
| |
| Total Return(4) | 3.38% | (3.04)% | 13.86% | 3.41% | (2.87)% |
| | | | | | |
| Ratios/Supplemental Data | | | | | |
| Ratio of Operating Expenses | | | | | |
| to Average Net Assets | 1.55%(5)(6) | 1.59% | 1.59% | 1.59% | 1.59%(6) |
| Ratio of Operating Expenses to Average | | | | | |
| Net Assets (Before Expense Waiver) | 1.59%(6) | 1.59% | 1.59% | 1.59% | 1.59%(6) |
| Ratio of Net Investment Income (Loss) | | | | | |
| to Average Net Assets | 3.73%(5)(6) | (0.03)% | 3.95% | 2.26% | 2.97%(6) |
| Ratio of Net Investment Income | | | | | |
| (Loss) to Average Net Assets | | | | | |
| (Before Expense Waiver) | 3.69%(6) | (0.03)% | 3.95% | 2.26% | 2.97%(6) |
| Portfolio Turnover Rate | 8% | 37% | 31% | 52% | 51% |
| Net Assets, End of Period (in thousands) | $6,533 | $4,731 | $2,826 | $1,132 | $830 |
| | | | | |
| (1) | Six months ended September 30, 2009 (unaudited). | | | | |
| (2) | May 31, 2005 (fund inception) through March 31, 2006. | | | | |
| (3) | Computed using average shares outstanding throughout the period. | | | | |
| (4) | Total return assumes reinvestment of net investment income and capital gains distributions, if any, and does not reflect applicable sales charges. |
| | Total returns for periods less than one year are not annualized. The total return of the classes may not precisely reflect the class expense |
| | differences because of the impact of calculating the net asset values to two decimal places. If net asset values were calculated to three decimal |
| | places, the total return differences would more closely reflect the class expense differences. The calculation of net asset values to two decimal |
| | places is made in accordance with SEC guidelines and does not result in any gain or loss of value between one class and another. | |
| (5) | Effective August 1, 2009, the investment advisor voluntarily agreed to waive a portion of its management fee. | | |
| (6) | Annualized. | | | | | |
| |
| |
| See Notes to Financial Statements. | | | | | |
29
| | | | | | |
| Inflation Protection Bond | | | | |
| |
| C Class | | | | | |
| For a Share Outstanding Throughout the Years Ended March 31 (except as noted) | | |
| | | 2009(1) | 2009 | 2008 | 2007 | 2006(2) |
| Per-Share Data | | | | | |
| Net Asset Value, Beginning of Period | $9.75 | $10.41 | $9.49 | $9.44 | $10.00 |
| Income From Investment Operations | | | | | |
| Net Investment Income (Loss) | 0.18(3) | 0.02(3) | 0.41(3) | 0.21(3) | 0.27 |
| Net Realized and Unrealized Gain (Loss) | 0.15 | (0.33) | 0.87 | 0.12 | (0.56) |
| Total From Investment Operations | 0.33 | (0.31) | 1.28 | 0.33 | (0.29) |
| Distributions | | | | | |
| From Net Investment Income | — | (0.26) | (0.36) | (0.23) | (0.27) |
| From Net Realized Gains | — | (0.01) | — | — | — |
| From Return of Capital | — | (0.08) | — | (0.05) | — |
| Total Distributions | — | (0.35) | (0.36) | (0.28) | (0.27) |
| Net Asset Value, End of Period | $10.08 | $9.75 | $10.41 | $9.49 | $9.44 |
| |
| Total Return(4) | 3.38% | (3.04)% | 13.98% | 3.54% | (2.95)% |
| | | | | | |
| Ratios/Supplemental Data | | | | | |
| Ratio of Operating Expenses | | | | | |
| to Average Net Assets | 1.55%(5)(6) | 1.59% | 1.59% | 1.59% | 1.59%(6) |
| Ratio of Operating Expenses to Average | | | | | |
| Net Assets (Before Expense Waiver) | 1.59%(6) | 1.59% | 1.59% | 1.59% | 1.59%(6) |
| Ratio of Net Investment Income (Loss) | | | | | |
| to Average Net Assets | 3.73%(5)(6) | (0.03)% | 3.95% | 2.26% | 2.97%(6) |
| Ratio of Net Investment Income | | | | | |
| (Loss) to Average Net Assets | | | | | |
| (Before Expense Waiver) | 3.69%(6) | (0.03)% | 3.95% | 2.26% | 2.97%(6) |
| Portfolio Turnover Rate | 8% | 37% | 31% | 52% | 51% |
| Net Assets, End of Period (in thousands) | $75,040 | $33,530 | $20,978 | $6,682 | $5,215 |
| | | | | |
| (1) | Six months ended September 30, 2009 (unaudited). | | | | |
| (2) | May 31, 2005 (fund inception) through March 31, 2006. | | | | |
| (3) | Computed using average shares outstanding throughout the period. | | | | |
| (4) | Total return assumes reinvestment of net investment income and capital gains distributions, if any, and does not reflect applicable sales charges. |
| | Total returns for periods less than one year are not annualized. The total return of the classes may not precisely reflect the class expense |
| | differences because of the impact of calculating the net asset values to two decimal places. If net asset values were calculated to three decimal |
| | places, the total return differences would more closely reflect the class expense differences. The calculation of net asset values to two decimal |
| | places is made in accordance with SEC guidelines and does not result in any gain or loss of value between one class and another. | |
| (5) | Effective August 1, 2009, the investment advisor voluntarily agreed to waive a portion of its management fee. | | |
| (6) | Annualized. | | | | | |
| |
| |
| See Notes to Financial Statements. | | | | | |
30
| | | | | | |
| Inflation Protection Bond | | | | |
| |
| R Class | | | | | |
| For a Share Outstanding Throughout the Years Ended March 31 (except as noted) | | |
| | | 2009(1) | 2009 | 2008 | 2007 | 2006(2) |
| Per-Share Data | | | | | |
| Net Asset Value, Beginning of Period | $10.03 | $10.68 | $9.74 | $9.46 | $10.00 |
| Income From Investment Operations | | | | | |
| Net Investment Income (Loss) | 0.21(3) | (0.01)(3) | 0.46(3) | 0.15(3) | 0.30 |
| Net Realized and Unrealized Gain (Loss) | 0.16 | (0.26) | 0.90 | 0.23 | (0.54) |
| Total From Investment Operations | 0.37 | (0.27) | 1.36 | 0.38 | (0.24) |
| Distributions | | | | | |
| From Net Investment Income | — | (0.28) | (0.42) | (0.10) | (0.30) |
| From Net Realized Gains | — | (0.01) | — | — | — |
| From Return of Capital | — | (0.09) | — | — | — |
| Total Distributions | — | (0.38) | (0.42) | (0.10) | (0.30) |
| Net Asset Value, End of Period | $10.40 | $10.03 | $10.68 | $9.74 | $9.46 |
| |
| Total Return(4) | 3.69% | (2.62)% | 14.47% | 4.03% | (2.48)% |
| | | | | | |
| Ratios/Supplemental Data | | | | | |
| Ratio of Operating Expenses | | | | | |
| to Average Net Assets | 1.05%(5)(6) | 1.09% | 1.09% | 1.09% | 1.09%(6) |
| Ratio of Operating Expenses to Average | | | | | |
| Net Assets (Before Expense Waiver) | 1.09%(6) | 1.09% | 1.09% | 1.09% | 1.09%(6) |
| Ratio of Net Investment Income (Loss) | | | | | |
| to Average Net Assets | 4.23%(5)(6) | 0.47% | 4.45% | 2.76% | 3.47%(6) |
| Ratio of Net Investment Income | | | | | |
| (Loss) to Average Net Assets | | | | | |
| (Before Expense Waiver) | 4.19%(6) | 0.47% | 4.45% | 2.76% | 3.47%(6) |
| Portfolio Turnover Rate | 8% | 37% | 31% | 52% | 51% |
| Net Assets, End of Period (in thousands) | $3,985 | $1,062 | $299 | $123 | $26 |
| | | | | |
| (1) | Six months ended September 30, 2009 (unaudited). | | | | |
| (2) | May 31, 2005 (fund inception) through March 31, 2006. | | | | |
| (3) | Computed using average shares outstanding throughout the period. | | | | |
| (4) | Total return assumes reinvestment of net investment income and capital gains distributions, if any. Total returns for periods less than one year |
| | are not annualized. The total return of the classes may not precisely reflect the class expense differences because of the impact of calculating |
| | the net asset values to two decimal places. If net asset values were calculated to three decimal places, the total return differences would |
| | more closely reflect the class expense differences. The calculation of net asset values to two decimal places is made in accordance with SEC |
| | guidelines and does not result in any gain or loss of value between one class and another. | | | |
| (5) | Effective August 1, 2009, the investment advisor voluntarily agreed to waive a portion of its management fee. | | |
| (6) | Annualized. | | | | | |
| |
| |
| See Notes to Financial Statements. | | | | | |
31
|
| Approval of Management Agreement |
Under Section 15(c) of the Investment Company Act, contracts for investment advisory services to a mutual fund are required to be reviewed, evaluated and approved each year by the fund’s board of directors/ trustees, including a majority of a fund’s independent directors/trustees (the “Directors”). At American Century Investments, this process is referred to as the “15(c) Process.” The board oversees on a continuous basis and evaluates at its quarterly meetings, directly and through the committees of the board, the nature and quality of significant services provided by the advisor, the investment performance of the funds, shareholder services, audit and compliance functions and a variety of other matters relating to fund operations. Each year, it also holds a special meeting in connection with determining whether to renew the contracts for advisory services, to review fund performance, shareholder services, adviser profitability, audit and compliance matters, and other fund operational matters.
Under a Securities and Exchange Commission rule, each fund is required to disclose in its annual or semiannual report, as appropriate, the material factors and conclusions that formed the basis for the board’s approval or renewal of any advisory agreements within the fund’s most recently completed fiscal half-year period.
Annual Contract Review Process
As part of the annual 15(c) Process, the Directors requested and reviewed extensive data and information compiled by the advisor and certain independent providers of evaluative data (the “15(c) Providers”) concerning Inflation Protection Bond (the “fund”) and the services provided to the fund under the management agreement. The information considered and the discussions held at the meetings included, but were not limited to:
• the nature, extent and quality of investment management, shareholder services and other services that the advisor provides to the fund;
• the wide range of programs and services the advisor provides to the fund and its shareholders on a routine and non-routine basis;
• the compliance policies, procedures, and regulatory experience of the advisor;
• data comparing the cost of owning the fund to the cost of owning a similar fund;
• data comparing the fund’s performance to appropriate benchmarks and/ or a peer group of other mutual funds with similar investment objectives and strategies;
• financial data showing the profitability of the fund to the advisor and the overall profitability of the advisor;
32
• data comparing services provided and charges to other non-fund investment management clients of the advisor; and
• collateral or “fall-out” benefits derived by the advisor from the management of the fund, and potential sharing of economies of scale in connection with the management of the fund.
In keeping with its practice, the Directors at a special meeting and at a regularly scheduled quarterly meeting reviewed and discussed the information provided by the advisor throughout the year and to negotiate with the advisor the renewal of the management agreement, including the setting of the applicable management fee. The Directors had the benefit of the advice of their independent counsel throughout the period.
Factors Considered
The Directors considered all of the information provided by the advisor, independent data providers, and the board’s independent counsel, and evaluated such information for each fund the board oversees. The Directors did not identify any single factor as being all-important or controlling, and each Director may have attributed different levels of importance to different factors. In deciding to renew the agreement under the terms ultimately determined by the board to be appropriate, the Directors’ decision was based on a number of factors, including the following.
Nature, Extent and Quality of Services — Generally. Under the management agreement, the advisor is responsible for providing or arranging for all services necessary for the operation of the fund. The board noted that under the management agreement, the advisor provides or arranges at its own expense a wide variety of services including:
• fund construction and design
• initial capitalization/funding
• portfolio research and security selection
• securities trading
• fund administration
• custody of fund assets
• daily valuation of the fund’s portfolio
• shareholder servicing and transfer agency, including shareholder confir-
mations, recordkeeping and communications
• legal services
• regulatory and portfolio compliance
33
• financial reporting
• marketing and distribution
The Directors noted that many of these services have expanded over time both in terms of quantity and complexity in response to shareholder demands, competition in the industry, changing distribution channels and the changing regulatory environment. In performing their evaluation, the Directors considered information received in connection with the annual review, as well as information provided on an ongoing basis throughout the year and at their regularly scheduled board and committee meetings.
Investment Management Services. The nature of the investment management services provided is quite complex and allows fund shareholders access to professional money management, instant diversification of their investments within an asset class, the opportunity to easily diversify among asset classes, and liquidity. In evaluating investment performance, the board expects the advisor to manage the fund in accordance with its investment objectives and approved strategies. In providing these services, the advisor utilizes teams of investment professionals (portfolio managers, analysts, research assistants, and securities traders) who require extensive information technology, research, training, compliance and other systems to conduct their business. At each quarterly meeting and at the special meeting to consider renewal of the management agreement , the Directors, directly and through its Portfolio Committee, review investment performance information for the fund, together with comparative information for appropriate benchmarks and/or peer groups of similarly-managed funds, over different time horizons. If performance concerns are identified, the underperforming fund receives special reviews until performance improves, during which Directors discuss with the advisor the reasons for such underperformance (e.g., market conditions, security and sector selection) and any efforts being undertaken to improve performance. The fund’s performance for both the one- and three-year periods was above its benchmark.
Shareholder and Other Services. The advisor provides the fund with a comprehensive package of transfer agency, shareholder, and other services. The Directors, directly and through the various Committees of the Board, review reports and evaluations of such services at their regular quarterly meetings and at their special meeting to consider renewal of the management agreement, including the annual meeting concerning contract review, and other reports to the board. These reports include, but are not limited to, information regarding the operational efficiency and accuracy of the shareholder and transfer agency services provided, staffing levels, shareholder satisfaction (as measured by external as well as internal sources), technology support, new products and services offered to fund shareholders, securities trading activities, portfolio valuati on services, auditing services, and legal and operational compliance activities. Certain aspects of shareholder and transfer agency service level efficiency and the quality of securities trading activities are measured by independent third party providers and are presented in comparison to other fund groups not managed by the advisor.
34
Costs of Services Provided and Profitability. The advisor provides detailed information concerning its cost of providing various services to the fund, its profitability in managing the fund, its overall profitability, and its financial condition. The Directors have reviewed with the advisor the methodology used to prepare this financial information. The Directors have also reviewed with the advisor its methodology for compensating the investment professionals that provide services to the fund. This financial information regarding the advisor is considered in order to evaluate the advisor’s financial condition, its ability to continue to provide services under the management agreement, and the reasonableness of the current management fee.
Ethics. The Directors generally consider the advisor’s commitment to providing quality services to shareholders and to conducting its business ethically. They noted that the advisor’s practices generally meet or exceed industry best practices.
Economies of Scale. The Directors review information provided by the advisor regarding the existence of economies of scale in connection with the investment management of the fund. The Directors concluded that economies of scale are difficult to measure and predict with precision, especially on a fund-by-fund basis. The analysis of economies of scale is further complicated by the additional services and content provided by the advisor and its reinvestment in its ability to provide and expand those services. Accordingly, the Directors seek to evaluate economies of scale by reviewing information, such as year-over-year profitability of the advisor generally, the profitability of its management of the fund specifically, and the expenses incurred by the advisor in providing various functions to the fund. The Directors believe the advisor is ap propriately sharing economies of scale through its competitive fee structure, fee breakpoints as the fund complex and the fund increases in size, and through reinvestment in its business to provide shareholders additional services and enhancements to existing services. In particular, separate breakpoint schedules based on the size of the entire fund complex and on the size of the fund reflect the complexity of assessing economies of scale.
Comparison to Other Funds’ Fees. The fund pays the advisor a single, all-inclusive (or unified) management fee for providing all services necessary for the management and operation of the fund, other than brokerage expenses, taxes, interest, extraordinary expenses, and the fees and expenses of the fund’s independent directors (including their independent legal counsel). Under the unified fee structure, the advisor is responsible for providing all investment advisory, custody, audit, administrative, compliance, record-keeping, marketing and shareholder services, or arranging and supervising third parties to provide such services. By contrast, most other funds are charged a variety of fees, including an investment advisory fee, a transfer agency fee, an administrative fee, distribution charges and other expenses. Other than their i nvestment advisory fees and Rule 12b-1 distribution fees, the components of the total fees charged by these other funds may be increased without shareholder approval. The board believes the unified fee structure is a benefit to fund shareholders because it clearly discloses to shareholders the cost of owning fund shares, and, since the unified fee cannot be increased without a vote of fund shareholders, it shifts to the
35
advisor the risk of increased costs of operating the fund and provides a direct incentive to minimize administrative inefficiencies. Part of the Directors’ analysis of fee levels involves reviewing certain evaluative data compiled by an independent provider and comparing the fund’s unified fee to the total expense ratio of other funds in the fund’s peer group. The Directors also reviewed updated fee level data provided by the advisor, but recognized that comparative data was particularly difficult to evaluate given the significant market developments during the past year impacting fund assets. The unified fee charged to shareholders of the fund was below the median of the total expense ratios of its peer group.
Comparison to Fees and Services Provided to Other Clients of the Advisor. The Directors also requested and received information from the advisor concerning the nature and extent of the services, fees, and profitability of its advisory services to advisory clients other than the fund. They observed that these varying types of client accounts require different services and involve different regulatory and entrepreneurial risks than the management of the fund. The Directors analyzed this information and concluded that the fees charged and services provided to the fund were reasonable by comparison.
Collateral or “Fall-Out” Benefits Derived by the Advisor. The Directors considered the existence of collateral benefits the advisor may receive as a result of its relationship with the fund. They concluded that the advisor’s primary business is managing mutual funds and it generally does not use fund or shareholder information to generate profits in other lines of business, and therefore does not derive any significant collateral benefits from them. The Directors noted that the advisor receives proprietary research from broker-dealers that execute fund portfolio transactions but concluded that this research is likely to benefit fund shareholders. The Directors also determined that the advisor is able to provide investment management services to certain clients other than the fund, at least in part, due to its existing infras tructure built to serve the fund complex. The Directors concluded, however, that the assets of those other clients are not material to the analysis and, in any event, are included with the assets of the fund to determine breakpoints in the fund’s fee schedule, provided they are managed using the same investment team and strategy.
Conclusions of the Directors
As a result of this process, the Directors, in the absence of particular circumstances and assisted by the advice of their independent legal counsel, taking into account all of the factors discussed above and the information provided by the advisor and others, concluded that the investment management agreement between the fund and the advisor, including the management fee, is fair and reasonable in light of the services provided and should be renewed for a one-year term. In addition, the Directors negotiated a one-year waiver by the advisor of a portion of the management fee. This change was proposed by the Directors based on their review of the percentile rank of the fund’s fees within the fund’s peer universe and the fact that the Directors seek, as a general rule, to have total expense ratios of existing fixed income and money market funds in the lowest 25th percentile of the fees of comparable funds.
36
Retirement Account Information
As required by law, distributions you receive from certain IRAs, or 403(b), 457 and qualified plans are subject to federal income tax withholding, unless you elect not to have withholding apply. Tax will be withheld on the total amount withdrawn even though you may be receiving amounts that are not subject to withholding, such as nondeductible contributions. In such case, excess amounts of withholding could occur. You may adjust your withholding election so that a greater or lesser amount will be withheld.
If you don’t want us to withhold on this amount, you must notify us to not withhold the federal income tax. You may notify us in writing or in certain situations by telephone or through other electronic means. You have the right to revoke your withholding election at any time and any election you make may remain in effect until revoked by filing a new election.
Remember, even if you elect not to have income tax withheld, you are liable for paying income tax on the taxable portion of your withdrawal. If you elect not to have income tax withheld or you don’t have enough income tax withheld, you may be responsible for payment of estimated tax. You may incur penalties under the estimated tax rules if your withholding and estimated tax payments are not sufficient. You can reduce or defer the income tax on a distribution by directly or indirectly rolling such distribution over to another IRA or eligible plan. You should consult your tax advisor for additional information.
State tax will be withheld if, at the time of your distribution, your address is within one of the mandatory withholding states and you have federal income tax withheld. State taxes will be withheld from your distribution in accordance with the respective state rules.
Proxy Voting Guidelines
American Century Investment Management, Inc., the fund’s investment advisor, is responsible for exercising the voting rights associated with the securities purchased and/or held by the fund. A description of the policies and procedures the advisor uses in fulfilling this responsibility is available without charge, upon request, by calling 1-800-345-2021. It is also available on American Century Investments’ website at americancentury.com and on the Securities and Exchange Commission’s website at sec.gov. Information regarding how the investment advisor voted proxies relating to portfolio securities during the most recent 12-month period ended June 30 is available on the “About Us” page at americancentury.com. It is also available at sec.gov.
Quarterly Portfolio Disclosure
The fund files its complete schedule of portfolio holdings with the Securities and Exchange Commission (SEC) for the first and third quarters of each fiscal year on Form N-Q. The fund’s Form N-Q is available on the SEC’s website at sec.gov, and may be reviewed and copied at the SEC’s Public Reference Room in Washington, DC. Information on the operation of the Public Reference Room may be obtained by calling 1-800-SEC-0330. The fund also makes its complete schedule of portfolio holdings for the most recent quarter of its fiscal year available on its website at americancentury.com and, upon request, by calling 1-800-345-2021.
37
The following indices are used to illustrate investment market, sector, or style performance or to serve as fund performance comparisons. They are not investment products available for purchase.
The Citigroup Agency Index is a market-capitalization-weighted index that includes US government sponsored agencies with a remaining maturity of at least one year.
The Citigroup Credit Index includes US and non-US corporate securities and non-US sovereign and provincial securities.
The Citigroup High-Yield Cash-Pay Index is composed of those cash-pay securities included in the Citigroup US High-Yield Market Index with remaining maturities of at least one year.
The Citigroup Mortgage Index measures the mortgage component of the US BIG Bond Index, comprising 15- and 30-year GNMA, FNMA, and FHLMC pass-throughs and FNMA and FHLMC balloon mortgages.
The Citigroup Treasury Index is comprised of US Treasury securities with an amount outstanding of at least $5 billion and a remaining maturity of at least one year.
The Citigroup US Broad Investment-Grade (BIG) Bond Index is a market-capitalization-weighted index that includes fixed-rate Treasury, government-sponsored, mortgage, asset-backed, and investment-grade issues with a maturity of one year or longer.
The Citigroup US High-Yield Market Index captures the performance of below-investment-grade debt issued by corporations domiciled in the United States or Canada. This index includes cash-pay and deferred-interest securities that are publicly placed, have a fixed coupon, and are nonconvertible.
The Citigroup US Inflation-Linked Securities Index (ILSI)SM measures the return of bonds with fixed-rate coupon payments that adjust for inflation as measured by the Consumer Price Index (CPI).
The Rogers International Commodities Index (RICI) was developed by Jim Rogers in 1998. It represents the value of a basket of 35 commodities used in the global economy, including agricultural and energy products, metals, and minerals.
38
39
40

| |
| |
| Contact Us | |
| americancentury.com | |
| Automated Information Line | 1-800-345-8765 |
| Investor Services Representative | 1-800-345-2021 or |
| | 816-531-5575 |
| Investors Using Advisors | 1-800-378-9878 |
| Business, Not-For-Profit, Employer-Sponsored | |
| Retirement Plans | 1-800-345-3533 |
| Banks and Trust Companies, Broker-Dealers, | |
| Financial Professionals, Insurance Companies | 1-800-345-6488 |
| Telecommunications Device for the Deaf | 1-800-634-4113 |
| American Century Investment Trust | |
| Investment Advisor: | |
| American Century Investment Management, Inc. | |
| Kansas City, Missouri | |
This report and the statements it contains are submitted for the general
information of our shareholders. The report is not authorized for distribution to
prospective investors unless preceded or accompanied by an effective prospectus.
American Century Investment Services, Inc., Distributor
©2009 American Century Proprietary Holdings, Inc. All rights reserved.
0911
CL-SAN-66873N
|
| Semiannual Report |
| September 30, 2009 |

|
| American Century Investments |
NT Diversified Bond Fund

Dear Investor:
Thank you for your investment with us during the financial reporting period ended September 30, 2009. We appreciate your trust in American Century Invest ments® at this volatile, transitional time in the economy and investment markets.
As the upheavals associated with the “Great Recession” gradually subside, our senior management team has put considerable thought into how the investment environment has changed and what new challenges and opportunities await us Critical factors that we are anticipating in the coming year include marked shifts in investment and spending behavior, along with consolidation in our industry.
Most importantly, we think the economic recovery will be slow and extended. The economy and capital markets have come a long way since Lehman Brothers collapsed over a year ago, but 2010 will likely bring continuing challenges. The stock market’s rebound since last March and the third-quarter economic surge this year were fueled largely by corporate cost-cutting and unprecedented monetary and fiscal stimulus, including some key programs that have since expired or been scaled back.
Meanwhile, the resilient but struggling consumer sector still faces rising unemployment, heavy debt burdens, tight credit conditions, and a housing market that is starting to stabilize, but remains vulnerable. Much of our investment positioning in 2009 has cautiously reflected these still unstable economic fundamentals, leading to underperformance, in some cases, versus market benchmarks buoyed by the rally of riskier assets. We still support our fundamentally based positioning because we believe strongly that some markets—driven more by technical factors than fundamentals—have advanced further than underlying economic conditions warrant, and remain susceptible to the possibility of more volatility ahead.
For more detailed information from our portfolio management team about the performance and positioning of your investment, please review the following pages, or visit our website, americancentury.com.
Thank you for your continued confidence in us.
Sincerely,

Jonathan Thomas
President and Chief Executive Officer
American Century Investments
| |
| Market Perspective | 2 |
| U.S. Fixed-Income Total Returns | 2 |
| |
| NT Diversified Bond | |
| |
| Performance | 3 |
| Portfolio Commentary | 4 |
| Portfolio at a Glance | 6 |
| Yields | 6 |
| Portfolio Composition by Credit Rating | 6 |
| Types of Investments in Portfolio | 6 |
| |
| Shareholder Fee Example | 7 |
| |
| Financial Statements | |
| |
| Schedule of Investments | 9 |
| Statement of Assets and Liabilities | 21 |
| Statement of Operations | 22 |
| Statement of Changes in Net Assets | 23 |
| Notes to Financial Statements | 24 |
| Financial Highlights | 31 |
| |
| Other Information | |
| |
| Approval of Management Agreement | 32 |
| Additional Information | 37 |
| Index Definitions | 38 |
The opinions expressed in the Market Perspective and the Portfolio Commentary reflect those of the portfolio management team as of the date of the report, and do not necessarily represent the opinions of American Century Investments or any other person in the American Century Investments organization. Any such opinions are subject to change at any time based upon market or other conditions and American Century Investments disclaims any responsibility to update such opinions. These opinions may not be relied upon as investment advice and, because investment decisions made by American Century Investments funds are based on numerous factors, may not be relied upon as an indication of trading intent on behalf of any American Century Investments fund. Security examples are used for representational purposes only and are not intended as recommendations to purchase or sell securities. Performance information for comparative i ndices and securities is provided to American Century Investments by third party vendors. To the best of American Century Investments’ knowledge, such information is accurate at the time of printing.

By David MacEwen, Chief Investment Officer, Fixed Income
Economy Stabilized, Credit Crisis Eased
The six months ended September 30, 2009, witnessed a remarkable rebound by U.S. financial markets, made possible by the easing of the credit crisis and signs of stabilization in the economy. The government’s stimulus package and “cash for clunkers” program directly boosted consumer spending; home prices stabilized; big financial institutions passed the government’s “stress tests”; and liquidity returned to U.S. credit markets. Add it all up, and the economy expanded at a 3.5% annual rate in the third quarter. That marked the first positive reading on growth since the second quarter of 2008. But even as the economy stabilized, the unemployment rate rose to 9.8% in September, raising the prospect of a weak, “jobless” recovery.
Slack in the labor market and a still-weak economy meant a continued decline in measures of inflation, as the government’s Consumer Price Index fell by 1.3% for the year ended in September. In that environment, the Federal Reserve (the Fed) continued to hold its short-term rate target at 0%–0.25%.
Risk Reigned Supreme
The realization that financial and economic Armageddon had been averted caused a dramatic reversal of the trading that defined 2008, when Treasuries performed best by a wide margin. For the six months ended September 30, 2009, risk assets (securities such as stocks and bonds that offer potentially higher yields and returns than Treasuries) posted very strong returns while intermediate- and long-term Treasury bond prices actually fell (see the accompanying table). This resulted in historic outperformance by some segments of credit markets compared with Treasuries for the six months.
Rates Edged Up
With signs of stability in the economy and financial markets, the Fed began to look ahead to an end to its support of the market for government agency and mortgage-backed securities; nevertheless, to ensure the recovery, the Fed’s policy making arm said it would keep rates low for the foreseeable future. In that environment, investors sold Treasuries, sending their prices down and yields up.
| | | | |
| U.S. Fixed-Income Total Returns | | | | |
| For the six months ended September 30, 2009* | | | |
| Treasury Securities | | | Citigroup U.S. Bond Market Indices | |
| 3-Month Bill | 0.09% | | High-Yield Cash-Pay (corporate) | 37.81% |
| 2-Year Note | 0.73% | | Credit (investment-grade corporate) | 16.39% |
| 10-Year Note | –3.82% | | Broad Investment-Grade (multi-sector) | 4.80% |
| 30-Year Bond | –6.62% | | Inflation-Linked Securities | 3.47% |
| | | | Mortgage (mortgage-backed) | 2.89% |
| | | | Agency | 1.51% |
| *Total returns for periods less than one year are not annualized. | | Treasury | –1.03% |
2
| | | | |
| Performance | | | | |
| NT Diversified Bond | | | | |
| |
| Total Returns as of September 30, 2009 | | | |
| | | | Average | |
| | | | Annual Returns | |
| | 6 months(1) | 1 year | Since Inception | Inception Date |
| Institutional Class | 5.91% | 10.64% | 7.56% | 5/12/06 |
| Citigroup US Broad | | | | |
| Investment-Grade Bond Index | 4.80% | 10.98% | 7.42% | — |
| (1) Total returns for periods less than one year are not annualized. | | | |
| | | |
| Growth of $10,000 Over Life of Class | | | |
| $10,000 investment made May 12, 2006 | | | |
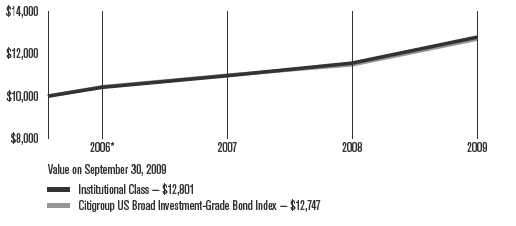
| | | | | |
| One-Year Returns Over Life of Class | | | |
| Periods ended September 30 | | | | |
| | | 2006* | 2007 | 2008 | 2009 |
| Institutional Class | | 4.20% | 5.27% | 5.48% | 10.64% |
| Citigroup US Broad | | | | | |
| Investment-Grade Bond Index | 4.48% | 5.25% | 4.48% | 10.98% |
| *From 5/12/06, the Institutional Class’s inception date. Not annualized. | | | |
| | | |
| Total Annual Fund Operating Expenses | | | |
| Institutional Class | 0.42% | | | | |
The total annual fund operating expenses shown is as stated in the fund’s prospectus current as of the date of this report. The prospectus may vary from the expense ratio shown elsewhere in this report because it is based on a different time period, includes acquired fund fees and expenses, and, if applicable, does not include fee waivers or expense reimbursements.
Data presented reflect past performance. Past performance is no guarantee of future results. Current performance may be higher or lower than the performance shown. Investment return and principal value will fluctuate, and redemption value may be more or less than original cost. To obtain performance data current to the most recent month end, please call 1-800-345-2021 or visit americancentury.com. As interest rates rise, bond values will decline.
Data assumes reinvestment of dividends and capital gains, and none of the charts reflect the deduction of taxes that a shareholder would pay on fund distributions or the redemption of fund shares. Returns for the index are provided for comparison. The fund’s total returns include operating expenses (such as transaction costs and management fees) that reduce returns, while the total returns of the index do not.
3
|
| Portfolio Commentary |
| NT Diversified Bond |
Portfolio Managers: David MacEwen, Bob Gahagan, Jeff Houston, Brian Howell, and Hando Aguilar
Performance Summary
NT Diversified Bond returned 5.91%* for the six months ended September 30, 2009. By comparison, the Citigroup US Broad Investment-Grade (BIG) Bond Index returned 4.80%. See page 3 for additional performance comparisons. Portfolio returns reflect operating expenses, while Citigroup index returns do not.
Underweight Treasuries, Mortgages Helped
We continued to keep the portfolio’s duration and yield curve exposure neutral relative to the BIG Index, believing we could make better use of our risk budget through higher-confidence sector and security selection decisions. We were underweight Treasuries because of the combination of low current yields and record government budget deficits, which we believe argues for higher yields (and lower prices) down the road. That positioning added value for the six months, when Treasuries were the poorest-performing segment of the market.
In addition, we took some profits and moved to an underweight position in securitized bonds after a period of outperformance. The appeal of these bonds was further diminished as it became clear the Federal Reserve would end its active support of this market in early 2010. So even though mortgage-backed securities outperformed Treasuries, it was beneficial to trim this position and put those profits to work in corporates, which did best for the six months. What’s more, within the securitized slice it helped to favor collateralized mortgage obligations and commercial mortgage-backed securities over traditional passthrough mortgages.
Overweight Municipals, Corporates Benefited
We also took profits in the last six months from our overweight stakes in inflation-indexed and municipal bonds. Municipal and inflation-adjusted securities performed very well early in 2009, so we closed out some of these positions and added select corporate securities we believed offered attractive yields relative to the securities’ risk. We also liked the fact that corporate health has improved since the height of the credit crisis, though we believe that careful credit analysis and security selection remains essential. It also helped to hold a small allocation to BB-rated corporate bonds, which outperformed investment-grade securities.
Within the corporate slice, we favored companies in stable, non-cyclical sectors and industries that we thought could do well or improve profitability through innovation or cost cuts, rather than requiring top-line economic growth. Examples of sectors and industries we favored were pharmaceuticals, technology, cable, media, and energy. At the same time, we tended to avoid insurance companies and regional banks in particular
*Total returns for periods less than one year are not annualized.
4
NT Diversified Bond
and finance in general. But we should point out that while it helped to add corporate bonds in the last six months, the portfolio’s performance would have been even better had we not been underrepresented in finance sector bonds, which rebounded sharply.
Other Changes
Late in the reporting period we put in place a trade using long-term municipal bonds and 30-year Treasury futures designed to capitalize on the changing yield relationship between municipals and Treasuries. The trade was based on the expectation that the yield difference between the two would move toward its normal historical relationship—with municipals yielding less than Treasuries—which it did. Finally, in September we began to add German government bonds in the first step of what we view as a longer-term trade intended to increase the portfolio’s non-dollar exposure.
Outlook
“While we believe the worst of the financial crisis is behind us, the economy remains weak with a ‘jobless’ recovery likely,” said Portfolio Manager Bob Gahagan. “We believe the government’s massive monetary and fiscal stimulus could eventually result in higher inflation and lower purchasing power for the dollar. As a result, we expect to continue to evaluate opportunities to add inflation-adjusted securities and non-dollar-denominated bonds. In the meantime, we’ll continue to evaluate sectors and individual securities that we believe are attractively valued and have the potential to outperform going forward.”
5
| | |
| NT Diversified Bond | |
| |
| Portfolio at a Glance | | |
| | As of 9/30/09 | As of 3/31/09 |
| Average Duration (effective) | 4.5 years | 4.1 years |
| Weighted Average Life | 6.0 years | 5.3 years |
| |
| Yields as of September 30, 2009 | |
| 30-day SEC Yield | | |
| Institutional Class | 3.28% | |
| |
| Portfolio Composition by Credit Rating | |
| | % of fund | % of fund |
| | investments | investments |
| | as of 9/30/09 | as of 3/31/09 |
| AAA | 72% | 77% |
| AA | 3% | 4% |
| A | 11% | 12% |
| BBB | 12% | 7% |
| BB or lower | 2% | — |
Ratings provided by independent research companies. These ratings are listed in Standard & Poor’s format even if they were provided by other sources. The letter ratings indicate the credit worthiness of the underlying bonds in the portfolio and generally range from AAA (highest) to D (lowest).
| | |
| Types of Investments in Portfolio | | |
| | % of fund | % of fund |
| | investments | investments |
| | as of 9/30/09 | as of 3/31/09 |
| U.S. Government Agency Mortgage-Backed Securities | 29.6% | 30.6% |
| U.S. Treasury Securities | 28.1% | 19.5% |
| Corporate Bonds | 25.7% | 20.7% |
| U.S. Government Agency Securities and Equivalents | 5.9% | 7.9% |
| Collateralized Mortgage Obligations | 2.7% | 3.6% |
| Commercial Mortgage-Backed Securities | 2.4% | 5.2% |
| Municipal Securities | 1.6% | 4.8% |
| Sovereign Governments & Agencies | 1.5% | 0.3% |
| Asset-Backed Securities | 0.3% | 0.6% |
| Temporary Cash Investments | 2.2% | 3.3% |
| Temporary Cash Investments — Securities Lending Collateral | — | 3.5% |
6
|
| Shareholder Fee Example (Unaudited) |
Fund shareholders may incur two types of costs: (1) transaction costs, including sales charges (loads) on purchase payments and redemption/ exchange fees; and (2) ongoing costs, including management fees; distribution and service (12b-1) fees; and other fund expenses. This example is intended to help you understand your ongoing costs (in dollars) of investing in your fund and to compare these costs with the ongoing cost of investing in other mutual funds.
The example is based on an investment of $1,000 made at the beginning of the period and held for the entire period from April 1, 2009 to September 30, 2009.
Actual Expenses
The table provides information about actual account values and actual expenses for each class. You may use the information, together with the amount you invested, to estimate the expenses that you paid over the period. First, identify the share class you own. Then simply divide your account value by $1,000 (for example, an $8,600 account value divided by $1,000 = 8.6), then multiply the result by the number under the heading “Expenses Paid During Period” to estimate the expenses you paid on your account during this period.
If you hold Investor Class shares of any American Century Investments fund, or Institutional Class shares of the American Century Diversified Bond Fund, in an American Century Investments account (i.e., not a financial intermediary or retirement plan account), American Century Investments may charge you a $12.50 semiannual account maintenance fee if the value of those shares is less than $10,000. We will redeem shares automatically in one of your accounts to pay the $12.50 fee. In determining your total eligible investment amount, we will include your investments in all personal accounts (including American Century Investments Brokerage accounts) registered under your Social Security number. Personal accounts include individual accounts, joint accounts, UGMA/UTMA accounts, personal trusts, Coverdell Education Savings Accounts and IRAs (including traditional, Roth, Rollover, SEP-, SARSEP- and SIMPLE-IRAs), and certain other retirement accounts. If you have only business, business retirement, employer-sponsored or American Century Investments Brokerage accounts, you are currently not subject to this fee. We will not charge the fee as long as you choose to manage your accounts exclusively online. If you are subject to the Account Maintenance Fee, your account value could be reduced by the fee amount.
Hypothetical Example for Comparison Purposes
The table also provides information about hypothetical account values and hypothetical expenses based on the actual expense ratio of each class of your fund and an assumed rate of return of 5% per year before expenses, which is not the actual return of a fund’s share class. The hypothetical account values and expenses may not be used to estimate the actual ending account balance or expenses you paid for the period. You may use this information to compare the ongoing costs of investing in your fund and other funds. To do so, compare this 5% hypothetical example with the 5% hypothetical examples that appear in the shareholder reports of the other funds.
7
Please note that the expenses shown in the table are meant to highlight your ongoing costs only and do not reflect any transactional costs, such as sales charges (loads) or redemption/exchange fees. Therefore, the table is useful in comparing ongoing costs only, and will not help you determine the relative total costs of owning different funds. In addition, if these transactional costs were included, your costs would have been higher.
| | | | |
| | Beginning | Ending | Expenses Paid | Annualized |
| | Account Value | Account Value | During Period(1) | Expense |
| | 4/1/09 | 9/30/09 | 4/1/09 – 9/30/09 | Ratio(1) |
| Actual (after waiver)(2) | $1,000 | $1,059.10 | $2.06 | 0.40% |
| Actual (before waiver) | $1,000 | $1,059.10(3) | $2.17 | 0.42% |
| Hypothetical (after waiver)(2) | $1,000 | $1,023.06 | $2.03 | 0.40% |
| Hypothetical (before waiver) | $1,000 | $1,022.96 | $2.13 | 0.42% |
| (1) | Expenses are equal to the fund’s annualized expense ratio listed in the table above, multiplied by the average account value over the period, multiplied by 183, the number of days in the most recent fiscal half-year, divided by 365, to reflect the one-half year period. |
| (2) | During the six months ended September 30, 2009, the fund received a partial waiver of its management fee. |
| (3) | Ending account value assumes the return earned after waiver. The return would have been lower had fees not been waived and would have resulted in a lower ending account value. |
8
|
| Schedule of Investments |
| NT Diversified Bond |
| SEPTEMBER 30, 2009 (UNAUDITED) |
| | | | | | | |
| | Principal | | | | Principal | |
| | Amount | Value | | | Amount | Value |
| U.S. Government Agency | | | | FNMA, 7.00%, 12/1/27(2) | $ 1,050 | $ 1,160 |
| Mortgage-Backed Securities(1) — 29.9% | | FNMA, 6.50%, 1/1/28(2) | 703 | 758 |
| | | | | | FNMA, 7.00%, 1/1/28(2) | 663 | 732 |
| FHLMC, 6.50%, 12/1/12(2) | $ 477 | $ 509 | | | | |
| | | | | | FNMA, 7.50%, 4/1/28(2) | 3,020 | 3,382 |
| FHLMC, 6.00%, 1/1/13(2) | | 5,879 | 6,274 | | | | |
| | | | | | FNMA, 7.00%, 5/1/28(2) | 9,222 | 10,197 |
| FHLMC, 7.00%, 11/1/13(2) | | 2,028 | 2,153 | | | | |
| | | | | | FNMA, 7.00%, 6/1/28(2) | 483 | 534 |
| FHLMC, 7.00%, 6/1/14(2) | | 4,003 | 4,278 | | | | |
| | | | | | FNMA, 6.50%, 1/1/29(2) | 2,014 | 2,178 |
| FHLMC, 6.50%, 6/1/16(2) | | 7,478 | 8,006 | | | | |
| | | | | | FNMA, 6.50%, 4/1/29(2) | 6,501 | 7,027 |
| FHLMC, 6.50%, 6/1/16(2) | | 13,672 | 14,697 | | | | |
| | | | | | FNMA, 7.00%, 7/1/29(2) | 3,829 | 4,234 |
| FHLMC, 5.00%, 4/1/19 | 5,035,881 | 5,356,453 | | | | |
| | | | | | FNMA, 7.00%, 7/1/29(2) | 4,481 | 4,956 |
| FHLMC, 7.00%, 9/1/27(2) | | 1,622 | 1,785 | | | | |
| | | | | | FNMA, 7.50%, 7/1/29(2) | 11,965 | 13,407 |
| FHLMC, 6.50%, 1/1/28(2) | | 2,774 | 2,992 | | | | |
| | | | | | FNMA, 7.50%, 8/1/30(2) | 6,667 | 7,472 |
| FHLMC, 7.00%, 2/1/28(2) | | 414 | 456 | | | | |
| | | | | | FNMA, 7.50%, 9/1/30(2) | 4,180 | 4,684 |
| FHLMC, 6.50%, 3/1/29(2) | | 15,382 | 16,591 | | | | |
| | | | | | FNMA, 7.00%, 9/1/31(2) | 27,082 | 29,912 |
| FHLMC, 6.50%, 6/1/29(2) | | 10,867 | 11,715 | | | | |
| | | | | | FNMA, 6.50%, 1/1/32(2) | 12,516 | 13,507 |
| FHLMC, 7.00%, 8/1/29(2) | | 1,686 | 1,854 | | | | |
| | | | | | FNMA, 7.00%, 6/1/32(2) | 123,948 | 136,631 |
| FHLMC, 7.50%, 8/1/29(2) | | 3,049 | 3,424 | | | | |
| | | | | | FNMA, 6.50%, 8/1/32(2) | 46,974 | 50,697 |
| FHLMC, 6.50%, 5/1/31(2) | | 313 | 337 | | | | |
| | | | | | FNMA, 5.50%, 6/1/33(2) | 282,803 | 297,577 |
| FHLMC, 6.50%, 5/1/31(2) | | 7,009 | 7,547 | | | | |
| | | | | | FNMA, 5.50%, 7/1/33(2) | 1,342,840 | 1,412,990 |
| FHLMC, 6.50%, 6/1/31(2) | | 98 | 106 | | | | |
| | | | | | FNMA, 5.50%, 8/1/33(2) | 254,616 | 267,917 |
| FHLMC, 6.50%, 6/1/31(2) | | 447 | 482 | | | | |
| | | | | | FNMA, 5.50%, 9/1/33(2) | 325,671 | 342,684 |
| FHLMC, 6.50%, 6/1/31(2) | | 1,070 | 1,153 | | | | |
| | | | | | FNMA, 5.00%, 11/1/33(2) | 2,398,995 | 2,490,932 |
| FHLMC, 6.50%, 6/1/31(2) | | 5,447 | 5,865 | | | | |
| | | | | | FNMA, 5.50%, 1/1/34(2) | 701,070 | 738,432 |
| FHLMC, 5.50%, 12/1/33(2) | | 213,046 | 224,242 | | | | |
| | | | | | FNMA, 5.50%, 12/1/34(2) | 1,738,263 | 1,826,896 |
| FHLMC, 5.50%, 1/1/38(2) | 3,517,077 | 3,689,817 | | | | |
| FHLMC, 5.50%, 4/1/38(2) | 3,092,279 | 3,241,739 | | FNMA, 4.50%, 1/1/35 | 935,987 | 954,025 |
| | | | | | FNMA, 5.00%, 8/1/35(2) | 1,756,215 | 1,820,774 |
| FHLMC, 6.00%, 5/1/38 | 4,134,264 | 4,374,181 | | | | |
| | | | | | FNMA, 4.50%, 9/1/35(2) | 1,709,371 | 1,740,176 |
| FHLMC, 6.00%, 8/1/38(2) | | 580,382 | 613,395 | | | | |
| FHLMC, 5.50%, 9/1/38 | 14,278,201 | 14,967,511 | | FNMA, 5.00%, 2/1/36(2) | 9,645,304 | 9,999,870 |
| FHLMC, 6.50%, 7/1/47(2) | | 89,046 | 94,587 | | FNMA, 5.50%, 7/1/36(2) | 1,040,524 | 1,091,466 |
| FNMA, 6.00%, | | | | | FNMA, 5.50%, 2/1/37(2) | 421,237 | 441,860 |
| settlement date 10/15/09(3) | 4,399,672 | 4,640,968 | | FNMA, 6.50%, 8/1/37(2) | 1,644,250 | 1,753,250 |
| FNMA, 6.50%, | | | | | FNMA, 6.00%, 11/1/37 | 1,774,878 | 1,876,213 |
| settlement date 10/15/09(3) | 1,304,000 | 1,393,040 | | | | |
| | | | | | FNMA, 5.50%, 2/1/38(2) | 16,541,437 | 17,330,602 |
| FNMA, 6.00%, 5/1/13(2) | | 686 | 734 | | FNMA, 5.50%, 6/1/38 | 4,233,526 | 4,435,501 |
| FNMA, 6.00%, 5/1/13(2) | | 1,393 | 1,493 | | FNMA, 5.00%, 1/1/39 | 2,376,943 | 2,459,358 |
| FNMA, 6.00%, 7/1/13(2) | | 4,067 | 4,360 | | FNMA, 4.50%, 2/1/39 | 6,755,313 | 6,852,392 |
| FNMA, 6.00%, 12/1/13(2) | | 5,801 | 6,218 | | FNMA, 6.50%, 6/1/47(2) | 66,119 | 70,358 |
| FNMA, 6.00%, 1/1/14(2) | | 4,906 | 5,259 | | FNMA, 6.50%, 8/1/47(2) | 177,282 | 188,647 |
| FNMA, 6.00%, 2/1/14(2) | | 7,925 | 8,496 | | FNMA, 6.50%, 8/1/47(2) | 222,343 | 236,596 |
| FNMA, 6.00%, 4/1/14(2) | | 9,090 | 9,744 | | FNMA, 6.50%, 9/1/47(2) | 26,682 | 28,392 |
| FNMA, 5.50%, 12/1/16(2) | | 37,248 | 39,835 | | FNMA, 6.50%, 9/1/47(2) | 193,220 | 205,606 |
| FNMA, 5.50%, 12/1/16(2) | | 71,810 | 76,797 | | FNMA, 6.50%, 9/1/47(2) | 215,935 | 229,777 |
| FNMA, 6.50%, 1/1/26(2) | | 9,429 | 10,176 | | FNMA, 6.50%, 9/1/47(2) | 641,171 | 682,273 |
9
| | | | | | | |
| NT Diversified Bond | | | | | | |
| |
| | Principal | | | | | Principal | |
| | Amount | | Value | | | Amount | Value |
| GNMA, 7.50%, 8/20/17(2) | $ 4,278 | $ 4,646 | | U.S. Treasury Notes, | | |
| | | | | | 2.375%, 8/31/14(2) | $ 16,200,000 | $ 16,269,611 |
| GNMA, 7.00%, 11/15/22(2) | 5,485 | | 6,037 | | | | |
| GNMA, 8.75%, 3/15/25(2) | 5,368 | | 6,153 | | U.S. Treasury Notes, | | |
| | | | | | 3.00%, 8/31/16(2) | 10,400,000 | 10,468,255 |
| GNMA, 7.00%, 4/20/26(2) | 1,134 | | 1,240 | | | | |
| | | | | | U.S. Treasury Notes, | | |
| GNMA, 7.50%, 8/15/26(2) | 2,190 | | 2,451 | | 4.75%, 8/15/17(2) | 1,907,000 | 2,126,156 |
| GNMA, 8.00%, 8/15/26(2) | 1,152 | | 1,308 | | TOTAL U.S. TREASURY SECURITIES | |
| GNMA, 7.50%, 4/15/27(2) | 150 | | 169 | | (Cost $103,661,194) | | 105,057,295 |
| GNMA, 7.50%, 5/15/27(2) | 2,445 | | 2,739 | | Corporate Bonds — 26.1% | |
| GNMA, 8.00%, 6/15/27(2) | 2,179 | | 2,475 | | AEROSPACE & DEFENSE — 0.8% | |
| GNMA, 7.50%, 11/15/27(2) | 257 | | 288 | | BAE Systems Holdings, Inc., | | |
| | | | | | 6.375%, 6/1/19(2)(4) | 350,000 | 386,899 |
| GNMA, 7.00%, 2/15/28(2) | 1,166 | | 1,285 | | | | |
| GNMA, 7.50%, 2/15/28(2) | 1,799 | | 2,016 | | Honeywell International, Inc., | | |
| | | | | | 5.30%, 3/15/17(2) | 160,000 | 173,111 |
| GNMA, 6.50%, 3/15/28(2) | 1,778 | | 1,923 | | | | |
| | | | | | Honeywell International, Inc., | | |
| GNMA, 7.00%, 4/15/28(2) | 318 | | 350 | | 5.30%, 3/1/18(2) | 130,000 | 140,178 |
| GNMA, 6.50%, 5/15/28(2) | 688 | | 744 | | L-3 Communications Corp., | | |
| GNMA, 6.50%, 5/15/28(2) | 4,752 | | 5,138 | | 5.20%, 10/15/19(4)(5) | 270,000 | 271,350 |
| GNMA, 7.00%, 12/15/28(2) | 1,910 | | 2,106 | | Lockheed Martin Corp., | | |
| | | | | | 7.65%, 5/1/16(2) | 220,000 | 265,907 |
| GNMA, 7.00%, 5/15/31(2) | 11,203 | | 12,379 | | | | |
| | | | | | Lockheed Martin Corp., | | |
| GNMA, 4.50%, 8/15/33 | 5,054,386 | | 5,168,110 | | 6.15%, 9/1/36(2) | 469,000 | 538,734 |
| GNMA, 5.00%, 4/20/36 | 2,281,688 | | 2,367,108 | | Northrop Grumman Corp., | | |
| GNMA, 5.00%, 5/20/36(2) | 3,184,789 | | 3,304,019 | | 3.70%, 8/1/14(2) | 170,000 | 173,232 |
| GNMA, 6.00%, 1/20/39 | 565,808 | | 599,929 | | United Technologies Corp., | | |
| TOTAL U.S. GOVERNMENT AGENCY | | | | 6.125%, 2/1/19(2) | 410,000 | 469,940 |
| MORTGAGE-BACKED SECURITIES | | | | United Technologies Corp., | | |
| (Cost $107,849,582) | | | 110,407,914 | | 6.05%, 6/1/36(2) | 230,000 | 265,519 |
| U.S. Treasury Securities — 28.5% | | | United Technologies Corp., | | |
| | | | | | 6.125%, 7/15/38(2) | 220,000 | 254,367 |
| U.S. Treasury Bonds, | | | | | | | 2,939,237 |
| 10.625%, 8/15/15(2) | 2,200,000 | | 3,157,000 | | | | |
| U.S. Treasury Bonds, | | | | | AUTOMOBILES — 0.1% | | |
| 5.25%, 2/15/29(2) | 3,500,000 | | 4,065,471 | | American Honda Finance | | |
| U.S. Treasury Bonds, | | | | | Corp., 7.625%, 10/1/18(2)(4) | 170,000 | 196,851 |
| 5.375%, 2/15/31(2) | 2,000,000 | | 2,378,126 | | Daimler Finance N.A. LLC, | | |
| U.S. Treasury Bonds, | | | | | 5.875%, 3/15/11(2) | 150,000 | 155,711 |
| 4.75%, 2/15/37(2) | 800,000 | | 893,126 | | | | 352,562 |
| U.S. Treasury Bonds, | | | | | BEVERAGES — 0.6% | | |
| 4.25%, 5/15/39(2) | 500,000 | | 517,579 | | Anheuser-Busch InBev | | |
| U.S. Treasury Notes, | | | | | Worldwide, Inc., | | |
| 0.875%, 12/31/10(2) | 20,000,000 | | 20,094,540 | | 6.875%, 11/15/19(4) | 560,000 | 633,704 |
| U.S. Treasury Notes, | | | | | Diageo Capital plc, | | |
| 1.00%, 8/31/11(2) | 7,900,000 | | 7,917,901 | | 5.20%, 1/30/13(2) | 280,000 | 300,391 |
| U.S. Treasury Notes, | | | | | Dr Pepper Snapple Group, | | |
| 1.875%, 6/15/12(2) | 20,500,000 | | 20,831,526 | | Inc., 6.82%, 5/1/18(2) | 540,000 | 614,879 |
| U.S. Treasury Notes, | | | | | PepsiAmericas, Inc., | | |
| 4.25%, 9/30/12(2) | 1,390,000 | | 1,506,739 | | 4.375%, 2/15/14(2) | 170,000 | 177,597 |
| U.S. Treasury Notes, | | | | | SABMiller plc, | | |
| 1.875%, 4/30/14(2) | 15,000,000 | | 14,831,265 | | 6.20%, 7/1/11(2)(4) | 360,000 | 384,104 |
10
| | | | | | |
| NT Diversified Bond | | | | | |
| |
| | Principal | | | | Principal | |
| | Amount | Value | | | Amount | Value |
| BIOTECHNOLOGY — 0.2% | | | | Mosaic Co. (The), | | |
| Amgen, Inc., | | | | 7.625%, 12/1/16(2)(4) | $ 200,000 | $ 213,465 |
| 5.85%, 6/1/17(2) | $ 400,000 | $ 440,720 | | Rohm & Haas Co., | | |
| Amgen, Inc., | | | | 5.60%, 3/15/13(2) | 130,000 | 135,878 |
| 6.40%, 2/1/39(2) | 360,000 | 414,122 | | | | 1,135,894 |
| | | 854,842 | | COMMERCIAL BANKS — 0.6% | |
| CAPITAL MARKETS — 2.2% | | | | Barclays Bank plc, | | |
| Bank of New York Mellon | | | | 5.00%, 9/22/16(2) | 180,000 | 182,669 |
| Corp. (The), 4.30%, 5/15/14 | 400,000 | 424,201 | | BB&T Corp., | | |
| Bear Stearns Cos., Inc. | | | | 5.70%, 4/30/14(2) | 250,000 | 271,121 |
| (The), 6.40%, 10/2/17(2) | 630,000 | 686,437 | | PNC Bank N.A., | | |
| Credit Suisse (New York), | | | | 4.875%, 9/21/17(2) | 128,000 | 122,532 |
| 5.00%, 5/15/13(2) | 610,000 | 646,321 | | PNC Bank N.A., | | |
| Credit Suisse (New York), | | | | 6.00%, 12/7/17(2) | 160,000 | 163,873 |
| 5.50%, 5/1/14(2) | 340,000 | 365,875 | | SunTrust Bank, | | |
| Credit Suisse (New York), | | | | 7.25%, 3/15/18(2) | 100,000 | 104,612 |
| 5.30%, 8/13/19(2) | 420,000 | 431,470 | | Wachovia Bank N.A., | | |
| Deutsche Bank AG | | | | 4.80%, 11/1/14(2) | 339,000 | 344,561 |
| (London), | | | | Wachovia Bank N.A., | | |
| 4.875%, 5/20/13(2) | 270,000 | 287,930 | | 4.875%, 2/1/15(2) | 198,000 | 203,371 |
| Goldman Sachs Group, Inc. | | | | Wells Fargo & Co., | | |
| (The), 6.00%, 5/1/14(2) | 230,000 | 250,485 | | 4.375%, 1/31/13(2) | 410,000 | 423,835 |
| Goldman Sachs Group, Inc. | | | | Wells Fargo Bank N.A., | | |
| (The), 5.125%, 1/15/15(2) | 840,000 | 879,123 | | 6.45%, 2/1/11(2) | 190,000 | 200,200 |
| Goldman Sachs Group, Inc. | | | | | | 2,016,774 |
| (The), 6.15%, 4/1/18(2) | 340,000 | 358,242 | | COMMERCIAL SERVICES & SUPPLIES — 0.4% |
| Goldman Sachs Group, Inc. | | | | Allied Waste North America, | | |
| (The), 7.50%, 2/15/19(2) | 1,030,000 | 1,179,955 | | Inc., 6.375%, 4/15/11(2) | 260,000 | 271,362 |
| Jefferies Group, Inc., | | | | Corrections Corp. of | | |
| 8.50%, 7/15/19(2) | 260,000 | 275,635 | | America, 6.25%, 3/15/13(2) | 550,000 | 544,500 |
| Merrill Lynch & Co., Inc., | | | | Republic Services, Inc., | | |
| 6.15%, 4/25/13(2) | 475,000 | 503,158 | | 5.50%, 9/15/19(2)(4) | 260,000 | 268,435 |
| Morgan Stanley, | | | | Waste Management, Inc., | | |
| 6.00%, 4/28/15(2) | 200,000 | 212,087 | | 7.375%, 3/11/19(2) | 280,000 | 326,418 |
| Morgan Stanley, | | | | | | 1,410,715 |
| 6.625%, 4/1/18(2) | 210,000 | 222,420 | | | | |
| Morgan Stanley, | | | | COMMUNICATIONS EQUIPMENT — 0.1% | |
| 7.30%, 5/13/19(2) | 660,000 | 727,453 | | Cisco Systems, Inc., | | |
| Morgan Stanley, | | | | 4.95%, 2/15/19(2) | 350,000 | 368,603 |
| 5.625%, 9/23/19(2) | 550,000 | 541,832 | | COMPUTERS & PERIPHERALS — 0.2% | |
| UBS AG (Stamford Branch), | | | | Dell, Inc., 3.375%, 6/15/12 | 200,000 | 207,394 |
| 5.75%, 4/25/18(2) | 260,000 | 264,675 | | Dell, Inc., 5.875%, 6/15/19 | 450,000 | 483,321 |
| | | 8,257,299 | | | | 690,715 |
| CHEMICALS — 0.3% | | | | CONSUMER FINANCE — 0.9% | |
| Dow Chemical Co. (The), | | | | American Express Centurion | | |
| 4.85%, 8/15/12(2) | 210,000 | 218,559 | | Bank, 5.55%, 10/17/12(2) | 250,000 | 265,229 |
| Dow Chemical Co. (The), | | | | American Express Co., | | |
| 8.55%, 5/15/19(2) | 360,000 | 405,371 | | 7.25%, 5/20/14(2) | 380,000 | 427,549 |
| E.I. du Pont de Nemours | | | | Capital One Bank USA N.A., | | |
| & Co., 5.00%, 1/15/13(2) | 150,000 | 162,621 | | 8.80%, 7/15/19(2) | 400,000 | 463,167 |
11
| | | | | | |
| NT Diversified Bond | | | | | |
| |
| |
| | Principal | | | | Principal | |
| | Amount | Value | | | Amount | Value |
| Capital One Capital V, | | | | JPMorgan Chase & Co., | | |
| 10.25%, 8/15/39(2) | $ 200,000 | $ 221,558 | | 6.00%, 1/15/18(2) | $ 830,000 | $ 892,321 |
| General Electric Capital | | | | JPMorgan Chase Bank | | |
| Corp., 5.90%, 5/13/14(2) | 440,000 | 472,475 | | National Association, | | |
| General Electric Capital | | | | 5.875%, 6/13/16(2) | 250,000 | 262,330 |
| Corp., 5.625%, 9/15/17(2) | 250,000 | 253,543 | | | | 7,259,476 |
| General Electric Capital | | | | DIVERSIFIED TELECOMMUNICATION | |
| Corp., 6.00%, 8/7/19(2) | 450,000 | 457,341 | | SERVICES — 2.3% | | |
| General Electric Capital | | | | Alltel Corp., | | |
| Corp., 6.875%, 1/10/39(2) | 290,000 | 304,706 | | 7.875%, 7/1/32(2) | 180,000 | 222,284 |
| John Deere Capital Corp., | | | | AT&T, Inc., | | |
| 4.50%, 4/3/13(2) | 130,000 | 137,600 | | 6.25%, 3/15/11(2) | 360,000 | 383,944 |
| John Deere Capital Corp., | | | | AT&T, Inc., | | |
| 4.90%, 9/9/13(2) | 250,000 | 267,660 | | 6.70%, 11/15/13(2) | 770,000 | 873,329 |
| | | 3,270,828 | | AT&T, Inc., | | |
| CONTAINERS & PACKAGING — 0.1% | | | 5.10%, 9/15/14(2) | 100,000 | 107,959 |
| Ball Corp., | | | | AT&T, Inc., | | |
| 6.875%, 12/15/12(2) | 376,000 | 380,700 | | 6.80%, 5/15/36(2) | 195,000 | 217,776 |
| DIVERSIFIED CONSUMER SERVICES — 0.1% | | | AT&T, Inc., | | |
| Board of Trustees of The | | | | 6.55%, 2/15/39(2) | 680,000 | 744,096 |
| Leland Stanford Junior | | | | Cellco Partnership/Verizon | | |
| University (The), | | | | Wireless Capital LLC, | | |
| 3.625%, 5/1/14(2) | 310,000 | 321,237 | | 5.55%, 2/1/14(2)(4) | 340,000 | 367,857 |
| DIVERSIFIED FINANCIAL SERVICES — 2.0% | | | Cellco Partnership/Verizon | | |
| | | | | Wireless Capital LLC, | | |
| Bank of America Corp., | | | | 8.50%, 11/15/18(2)(4) | 570,000 | 713,096 |
| 4.90%, 5/1/13(2) | 600,000 | 615,802 | | CenturyTel, Inc., | | |
| Bank of America Corp., | | | | 7.60%, 9/15/39(2) | 370,000 | 369,887 |
| 6.50%, 8/1/16(2) | 820,000 | 863,528 | | | | |
| Bank of America Corp., | | | | Deutsche Telekom | | |
| 5.65%, 5/1/18(2) | 150,000 | 148,357 | | International Finance BV, | | |
| | | | | 6.75%, 8/20/18(2) | 190,000 | 213,149 |
| Bank of America Corp., | | | | | | |
| 7.625%, 6/1/19(2) | 270,000 | 304,765 | | Deutsche Telekom | | |
| | | | | International Finance BV, | | |
| Bank of America N.A., | | | | 8.75%, 6/15/30(2) | 160,000 | 207,810 |
| 5.30%, 3/15/17(2) | 720,000 | 691,975 | | | | |
| | | | | Embarq Corp., | | |
| Bank of America N.A., | | | | 7.08%, 6/1/16(2) | 82,000 | 89,236 |
| 6.00%, 10/15/36(2) | 200,000 | 197,754 | | | | |
| | | | | France Telecom SA, | | |
| BP Capital Markets plc, | | | | 4.375%, 7/8/14(2) | 420,000 | 440,847 |
| 5.25%, 11/7/13(2) | 480,000 | 526,487 | | | | |
| | | | | Koninklijke KPN NV, | | |
| Citigroup, Inc., | | | | 8.375%, 10/1/30(2) | 130,000 | 168,027 |
| 5.50%, 4/11/13(2) | 820,000 | 840,060 | | | | |
| | | | | Qwest Corp., | | |
| Citigroup, Inc., | | | | 7.875%, 9/1/11(2) | 60,000 | 62,175 |
| 5.50%, 10/15/14(2) | 180,000 | 180,010 | | | | |
| | | | | Qwest Corp., | | |
| Citigroup, Inc., | | | | 7.50%, 10/1/14(2) | 120,000 | 121,800 |
| 6.125%, 5/15/18(2) | 490,000 | 483,271 | | | | |
| | | | | Sprint Capital Corp., | | |
| Citigroup, Inc., | | | | 7.625%, 1/30/11(2) | 400,000 | 411,500 |
| 8.50%, 5/22/19(2) | 160,000 | 180,918 | | | | |
| | | | | Telecom Italia Capital SA, | | |
| Citigroup, Inc., | | | | 4.00%, 1/15/10(2) | 227,000 | 228,568 |
| 8.125%, 7/15/39(2) | 350,000 | 392,966 | | | | |
| | | | | Telecom Italia Capital SA, | | |
| JPMorgan Chase & Co., | | | | 6.18%, 6/18/14(2) | 600,000 | 651,648 |
| 4.65%, 6/1/14(2) | 650,000 | 678,932 | | | | |
| | | | | Telefonica Emisiones SAU, | | |
| | | | | 5.98%, 6/20/11(2) | 150,000 | 159,919 |
12
| | | | | | | |
| NT Diversified Bond | | | | | | |
| |
| |
| | Principal | | | | | Principal | |
| | Amount | Value | | | | Amount | Value |
| Telefonica Emisiones SAU, | | | | ELECTRONIC EQUIPMENT, | | |
| 5.88%, 7/15/19(2) | $ 400,000 | $ 435,553 | | INSTRUMENTS & COMPONENTS — 0.2% | |
| Telefonica Emisiones SAU, | | | | Corning, Inc., | | | |
| 7.05%, 6/20/36(2) | 220,000 | 261,272 | | 6.625%, 5/15/19(2) | $ 630,000 | $ 690,445 |
| Verizon Communications, | | | | ENERGY EQUIPMENT & SERVICES — 0.3% | |
| Inc., 8.75%, 11/1/18(2) | 670,000 | 838,596 | | Pride International, Inc., | | | |
| Verizon Communications, | | | | 8.50%, 6/15/19(2) | | 390,000 | 430,950 |
| Inc., 6.25%, 4/1/37(2) | 90,000 | 93,982 | | Weatherford International | | | |
| Verizon Communications, | | | | Ltd., 9.625%, 3/1/19(2) | | 440,000 | 551,707 |
| Inc., 6.40%, 2/15/38(2) | 190,000 | 203,757 | | | | | 982,657 |
| | | 8,588,067 | | FOOD & STAPLES RETAILING — 0.9% | |
| ELECTRIC UTILITIES — 1.2% | | | | CVS Caremark Corp., | | | |
| Carolina Power & Light Co., | | | | 6.60%, 3/15/19(2) | | 640,000 | 722,743 |
| 5.15%, 4/1/15(2) | 160,000 | 172,748 | | Delhaize Group SA, | | | |
| Carolina Power & Light Co., | | | | 5.875%, 2/1/14(2) | | 360,000 | 388,230 |
| 5.25%, 12/15/15(2) | 90,000 | 98,227 | | Kroger Co. (The), | | | |
| Carolina Power & Light Co., | | | | 6.80%, 4/1/11(2) | | 280,000 | 299,981 |
| 5.30%, 1/15/19(2) | 180,000 | 195,361 | | Kroger Co. (The), | | | |
| Cleveland Electric | | | | 5.00%, 4/15/13(2) | | 350,000 | 369,627 |
| Illuminating Co. (The), | | | | Safeway, Inc., | | | |
| 5.70%, 4/1/17(2) | 260,000 | 274,072 | | 5.00%, 8/15/19 | | 250,000 | 256,143 |
| Duke Energy Carolinas LLC, | | | | SYSCO Corp., | | | |
| 7.00%, 11/15/18(2) | 420,000 | 503,663 | | 4.20%, 2/12/13(2) | | 160,000 | 166,656 |
| Duke Energy Corp., | | | | Wal-Mart Stores, Inc., | | | |
| 6.30%, 2/1/14(2) | 360,000 | 398,715 | | 3.00%, 2/3/14(2) | | 520,000 | 528,676 |
| Duke Energy Corp., | | | | Wal-Mart Stores, Inc., | | | |
| 3.95%, 9/15/14(2) | 260,000 | 264,202 | | 5.875%, 4/5/27(2) | | 235,000 | 254,637 |
| Exelon Generation Co. LLC, | | | | Wal-Mart Stores, Inc., | | | |
| 5.20%, 10/1/19(2) | 330,000 | 334,361 | | 6.50%, 8/15/37(2) | | 200,000 | 234,234 |
| FirstEnergy Corp., | | | | Wal-Mart Stores, Inc., | | | |
| 6.45%, 11/15/11(2) | 22,000 | 23,811 | | 6.20%, 4/15/38(2) | | 140,000 | 159,895 |
| FirstEnergy Solutions Corp., | | | | | | | 3,380,822 |
| 6.05%, 8/15/21(2)(4) | 480,000 | 497,233 | | | | | |
| | | | | FOOD PRODUCTS — 0.7% | | |
| Florida Power Corp., | | | | | | | |
| 5.65%, 6/15/18(2) | 180,000 | 198,421 | | General Mills, Inc., | | | |
| | | | | 5.65%, 9/10/12(2) | | 330,000 | 360,483 |
| Florida Power Corp., | | | | | | | |
| 6.35%, 9/15/37(2) | 130,000 | 153,144 | | General Mills, Inc., | | | |
| | | | | 5.25%, 8/15/13(2) | | 430,000 | 468,391 |
| Niagara Mohawk Power | | | | | | | |
| Corp., 4.88%, 8/15/19(4) | 200,000 | 204,086 | | General Mills, Inc., | | | |
| | | | | 5.65%, 2/15/19(2) | | 270,000 | 292,954 |
| Pacificorp, | | | | | | | |
| 6.00%, 1/15/39(2) | 570,000 | 640,736 | | Kellogg Co., | | | |
| | | | | 4.45%, 5/30/16(2) | | 320,000 | 335,291 |
| Southern California Edison | | | | | | | |
| Co., 5.625%, 2/1/36(2) | 179,000 | 194,654 | | Kraft Foods, Inc., | | | |
| | | | | 6.00%, 2/11/13(2) | | 200,000 | 214,753 |
| Toledo Edison Co. (The), | | | | | | | |
| 6.15%, 5/15/37(2) | 80,000 | 83,803 | | Kraft Foods, Inc., | | | |
| | | | | 6.75%, 2/19/14(2) | | 300,000 | 335,133 |
| | | 4,237,237 | | Kraft Foods, Inc., | | | |
| ELECTRICAL EQUIPMENT — 0.1% | | | 6.125%, 2/1/18(2) | | 250,000 | 265,353 |
| Roper Industries, Inc., | | | | Ralcorp Holdings, Inc., | | | |
| 6.25%, 9/1/19(2) | 170,000 | 176,796 | | 6.625%, 8/15/39(2)(4) | | 310,000 | 327,572 |
| | | | | | | | 2,599,930 |
13
| | | | | | |
| NT Diversified Bond | | | | | |
| |
| | Principal | | | | Principal | |
| | Amount | Value | | | Amount | Value |
| HEALTH CARE EQUIPMENT & SUPPLIES — 0.3% | | INSURANCE — 0.7% | | |
| Baxter International, Inc., | | | | Allstate Corp. (The), | | |
| 4.00%, 3/1/14(2) | $ 330,000 | $ 344,418 | | 7.45%, 5/16/19 | $ 410,000 | $ 489,546 |
| Baxter International, Inc., | | | | Berkshire Hathaway Finance | | |
| 5.90%, 9/1/16(2) | 130,000 | 146,364 | | Corp., 5.00%, 8/15/13(2) | 180,000 | 195,741 |
| Baxter International, Inc., | | | | MetLife Global Funding I, | | |
| 5.375%, 6/1/18(2) | 200,000 | 217,121 | | 5.125%, 4/10/13(2)(4) | 340,000 | 352,917 |
| Baxter International, Inc., | | | | MetLife, Inc., | | |
| 6.25%, 12/1/37(2) | 130,000 | 151,661 | | 6.75%, 6/1/16(2) | 520,000 | 581,322 |
| St. Jude Medical, Inc., | | | | New York Life Global | | |
| 4.875%, 7/15/19(2) | 310,000 | 319,967 | | Funding, 4.65%, 5/9/13(2)(4) | 250,000 | 263,490 |
| | | 1,179,531 | | Prudential Financial, Inc., | | |
| HEALTH CARE PROVIDERS & SERVICES — 0.3% | | 7.375%, 6/15/19(2) | 380,000 | 424,832 |
| Express Scripts, Inc., | | | | Prudential Financial, Inc., | | |
| 5.25%, 6/15/12(2) | 300,000 | 318,696 | | 5.40%, 6/13/35(2) | 100,000 | 83,677 |
| Express Scripts, Inc., | | | | Travelers Cos., Inc. (The), | | |
| 7.25%, 6/15/19(2) | 250,000 | 294,140 | | 5.90%, 6/2/19(2) | 180,000 | 202,076 |
| Medco Health Solutions, | | | | | | 2,593,601 |
| Inc., 7.25%, 8/15/13(2) | 550,000 | 616,176 | | IT SERVICES — 0.1% | | |
| | | 1,229,012 | | International Business | | |
| HOTELS, RESTAURANTS & LEISURE — 0.4% | | | Machines Corp., 5.70%, | | |
| McDonald’s Corp., | | | | 9/14/17(2) | 400,000 | 441,556 |
| 5.35%, 3/1/18(2) | 270,000 | 295,087 | | LEISURE EQUIPMENT & PRODUCTS — 0.1% | |
| McDonald’s Corp., | | | | Hasbro, Inc., 6.125%, | | |
| 6.30%, 10/15/37(2) | 130,000 | 152,803 | | 5/15/14(2) | 200,000 | 217,856 |
| Yum! Brands, Inc., | | | | MACHINERY — 0.1% | | |
| 8.875%, 4/15/11(2) | 150,000 | 164,216 | | | | |
| | | | | Caterpillar Financial | | |
| Yum! Brands, Inc., | | | | Services Corp., | | |
| 6.25%, 3/15/18(2) | 280,000 | 302,159 | | 4.85%, 12/7/12(2) | 130,000 | 138,143 |
| Yum! Brands, Inc., | | | | Caterpillar Financial | | |
| 5.30%, 9/15/19(2) | 330,000 | 332,122 | | Services Corp., | | |
| Yum! Brands, Inc., | | | | 5.45%, 4/15/18(2) | 340,000 | 353,776 |
| 6.875%, 11/15/37(2) | 125,000 | 138,934 | | | | 491,919 |
| | | 1,385,321 | | MEDIA — 1.8% | | |
| HOUSEHOLD DURABLES — 0.1% | | | British Sky Broadcasting | | |
| Toll Brothers Finance Corp., | | | | Group plc, 9.50%, | | |
| 6.75%, 11/1/19(2) | 210,000 | 209,734 | | 11/15/18(2)(4) | 420,000 | 538,391 |
| HOUSEHOLD PRODUCTS — 0.1% | | | Comcast Corp., | | |
| Kimberly-Clark Corp., | | | | 5.90%, 3/15/16(2) | 330,000 | 355,205 |
| 6.125%, 8/1/17(2) | 120,000 | 136,882 | | Comcast Corp., | | |
| Kimberly-Clark Corp., | | | | 6.40%, 5/15/38(2) | 140,000 | 148,159 |
| 7.50%, 11/1/18(2) | 140,000 | 174,609 | | Comcast Corp., | | |
| | | 311,491 | | 6.55%, 7/1/39(2) | 350,000 | 375,389 |
| INDUSTRIAL CONGLOMERATES — 0.4% | | | DirecTV Holdings LLC/ | | |
| | | | DirecTV Financing Co., Inc., | | |
| General Electric Co., | | | | 4.75%, 10/1/14(2)(4) | 550,000 | 551,375 |
| 5.00%, 2/1/13(2) | 652,000 | 688,533 | | | | |
| General Electric Co., | | | | News America, Inc., | | |
| 5.25%, 12/6/17(2) | 350,000 | 359,781 | | 6.90%, 8/15/39(2)(4) | 350,000 | 373,824 |
| Hutchison Whampoa | | | | Omnicom Group, Inc., | | |
| International 09/16 Ltd., | | | | 6.25%, 7/15/19(2) | 520,000 | 561,990 |
| 4.625%, 9/11/15(2)(4) | 460,000 | 457,865 | | Pearson Dollar Finance Two | | |
| | | 1,506,179 | | plc, 6.25%, 5/6/18(2)(4) | 210,000 | 222,271 |
14
| | | | | | |
| NT Diversified Bond | | | | | |
| |
| |
| | Principal | | | | Principal | |
| | Amount | Value | | | Amount | Value |
| Rogers Cable, Inc., | | | | Dominion Resources, Inc., | | |
| 6.25%, 6/15/13(2) | $ 340,000 | $ 367,950 | | 4.75%, 12/15/10(2) | $ 96,000 | $ 99,359 |
| Time Warner Cable, Inc., | | | | Dominion Resources, Inc., | | |
| 5.40%, 7/2/12(2) | 290,000 | 310,117 | | 6.40%, 6/15/18(2) | 290,000 | 325,270 |
| Time Warner Cable, Inc., | | | | Georgia Power Co., | | |
| 6.75%, 7/1/18(2) | 560,000 | 619,866 | | 6.00%, 11/1/13(2) | 270,000 | 302,586 |
| Time Warner, Inc., | | | | NSTAR Electric Co., | | |
| 5.50%, 11/15/11(2) | 250,000 | 265,992 | | 5.625%, 11/15/17(2) | 280,000 | 306,569 |
| Time Warner, Inc., | | | | Pacific Gas & Electric Co., | | |
| 6.875%, 5/1/12(2) | 330,000 | 363,538 | | 4.20%, 3/1/11(2) | 310,000 | 321,049 |
| Time Warner, Inc., | | | | Pacific Gas & Electric Co., | | |
| 7.625%, 4/15/31(2) | 149,000 | 167,492 | | 5.80%, 3/1/37(2) | 100,000 | 108,676 |
| Time Warner, Inc., | | | | Pacific Gas & Electric Co., | | |
| 7.70%, 5/1/32(2) | 250,000 | 283,563 | | 6.35%, 2/15/38(2) | 130,000 | 151,992 |
| Viacom, Inc., | | | | PG&E Corp., | | |
| 6.25%, 4/30/16(2) | 680,000 | 734,569 | | 5.75%, 4/1/14(2) | 350,000 | 382,602 |
| Viacom, Inc., | | | | Public Service Co. of | | |
| 5.625%, 9/15/19(2) | 310,000 | 315,779 | | Colorado, 5.80%, 8/1/18(2) | 180,000 | 201,319 |
| | | 6,555,470 | | Sempra Energy, | | |
| METALS & MINING — 0.8% | | | | 8.90%, 11/15/13(2) | 500,000 | 584,967 |
| Anglo American Capital plc, | | | | Sempra Energy, | | |
| 9.375%, 4/8/19(2)(4) | 250,000 | 304,252 | | 6.50%, 6/1/16(2) | 160,000 | 177,151 |
| ArcelorMittal, 6.125%, | | | | Sempra Energy, | | |
| 6/1/18(2) | 250,000 | 246,762 | | 9.80%, 2/15/19(2) | 130,000 | 166,813 |
| Barrick Gold Corp., | | | | | | 3,400,211 |
| 6.95%, 4/1/19 | 190,000 | 222,901 | | OIL, GAS & CONSUMABLE FUELS — 2.7% | |
| BHP Billiton Finance USA | | | | Anadarko Petroleum Corp., | | |
| Ltd., 6.50%, 4/1/19(2) | 190,000 | 220,839 | | 5.95%, 9/15/16(2) | 560,000 | 594,522 |
| Newmont Mining Corp., | | | | Anadarko Petroleum Corp., | | |
| 5.125%, 10/1/19(2) | 550,000 | 550,822 | | 6.95%, 6/15/19(2) | 200,000 | 223,377 |
| Rio Tinto Finance USA Ltd., | | | | Anadarko Petroleum Corp., | | |
| 5.875%, 7/15/13(2) | 460,000 | 496,121 | | 6.45%, 9/15/36(2) | 480,000 | 497,201 |
| Rio Tinto Finance USA Ltd., | | | | Cenovus Energy, Inc., | | |
| 9.00%, 5/1/19(2) | 200,000 | 245,995 | | 4.50%, 9/15/14(2)(4) | 310,000 | 317,164 |
| Teck Resources Ltd., | | | | ConocoPhillips, | | |
| 10.75%, 5/15/19(2) | 390,000 | 455,325 | | 6.50%, 2/1/39(2) | 510,000 | 589,975 |
| Vale Overseas Ltd., | | | | El Paso Corp., | | |
| 5.625%, 9/15/19(2) | 185,000 | 189,160 | | 7.875%, 6/15/12(2) | 230,000 | 237,967 |
| Xstrata Finance Canada Ltd., | | | | Enbridge Energy Partners | | |
| 5.80%, 11/15/16(2)(4) | 80,000 | 78,806 | | LP, 6.50%, 4/15/18(2) | 180,000 | 194,278 |
| | | 3,010,983 | | Enterprise Products | | |
| MULTILINE RETAIL(6) | | | | Operating LLC, | | |
| | | | | 6.30%, 9/15/17(2) | 760,000 | 819,890 |
| Macy’s Retail Holdings, Inc., | | | | | | |
| 5.35%, 3/15/12(2) | 100,000 | 97,852 | | EOG Resources, Inc., | | |
| | | | | 5.625%, 6/1/19(2) | 240,000 | 263,306 |
| MULTI-UTILITIES — 0.9% | | | | | | |
| | | | | Kerr-McGee Corp., | | |
| CenterPoint Energy | | | | 6.95%, 7/1/24(2) | 380,000 | 407,799 |
| Resources Corp., | | | | | | |
| 6.125%, 11/1/17(2) | 130,000 | 136,702 | | Kinder Morgan | | |
| | | | | Energy Partners LP, | | |
| CenterPoint Energy | | | | 5.95%, 2/15/18(2) | 180,000 | 188,611 |
| Resources Corp., | | | | | | |
| 6.25%, 2/1/37(2) | 140,000 | 135,156 | | Kinder Morgan | | |
| | | | | Energy Partners LP, | | |
| | | | | 6.85%, 2/15/20(2) | 330,000 | 361,115 |
15
| | | | | | |
| NT Diversified Bond | | | | | |
| |
| | Principal | | | | Principal | |
| | Amount | Value | | | Amount | Value |
| Kinder Morgan | | | | GlaxoSmithKline Capital, | | |
| Energy Partners LP, | | | | Inc., 6.375%, 5/15/38(2) | $ 220,000 | $ 260,284 |
| 6.50%, 9/1/39(2) | $ 270,000 | $ 275,574 | | Merck & Co., Inc., | | |
| Magellan Midstream | | | | 5.85%, 6/30/39(2) | 200,000 | 225,323 |
| Partners LP, | | | | Pfizer, Inc., | | |
| 6.55%, 7/15/19(2) | 310,000 | 345,110 | | 6.20%, 3/15/19(2) | 720,000 | 813,015 |
| Marathon Oil Corp., | | | | Pfizer, Inc., | | |
| 7.50%, 2/15/19(2) | 350,000 | 404,397 | | 7.20%, 3/15/39(2) | 470,000 | 593,603 |
| Nexen, Inc., | | | | Roche Holdings, Inc., | | |
| 5.65%, 5/15/17(2) | 250,000 | 250,289 | | 6.00%, 3/1/19(2)(4) | 250,000 | 278,792 |
| Nexen, Inc., | | | | Watson Pharmaceuticals, | | |
| 6.20%, 7/30/19(2) | 330,000 | 342,999 | | Inc., 5.00%, 8/15/14(2) | 500,000 | 513,314 |
| Nexen, Inc., | | | | Watson Pharmaceuticals, | | |
| 6.40%, 5/15/37(2) | 350,000 | 341,909 | | Inc., 6.125%, 8/15/19(2) | 220,000 | 231,802 |
| Plains All American Pipeline | | | | Wyeth, 5.95%, 4/1/37(2) | 170,000 | 187,873 |
| LP, 8.75%, 5/1/19(2) | 580,000 | 697,411 | | | | |
| | | | | | | 4,757,746 |
| Shell International Finance | | | | | | |
| BV, 4.30%, 9/22/19(2) | 550,000 | 553,986 | | REAL ESTATE INVESTMENT TRUSTS (REITs) — 0.3% |
| Shell International Finance | | | | ProLogis, 7.625%, 8/15/14(2) | 250,000 | 255,850 |
| BV, 6.375%, 12/15/38(2) | 220,000 | 262,261 | | ProLogis, | | |
| Talisman Energy, Inc., | | | | 5.625%, 11/15/16(2) | 250,000 | 224,747 |
| 7.75%, 6/1/19(2) | 450,000 | 530,200 | | Simon Property Group LP, | | |
| Williams Cos., Inc. (The), | | | | 6.75%, 5/15/14(2) | 450,000 | 483,287 |
| 8.75%, 1/15/20(2) | 310,000 | 357,114 | | Simon Property Group LP, | | |
| XTO Energy, Inc., | | | | 5.75%, 12/1/15(2) | 300,000 | 307,295 |
| 5.30%, 6/30/15(2) | 138,000 | 146,441 | | | | 1,271,179 |
| XTO Energy, Inc., | | | | ROAD & RAIL — 0.4% | | |
| 6.50%, 12/15/18(2) | 550,000 | 608,244 | | CSX Corp., 7.375%, 2/1/19(2) | 350,000 | 412,590 |
| XTO Energy, Inc., | | | | Norfolk Southern Corp., | | |
| 6.10%, 4/1/36(2) | 102,000 | 105,342 | | 5.75%, 1/15/16(2)(4) | 250,000 | 273,564 |
| | | 9,916,482 | | Norfolk Southern Corp., | | |
| PAPER & FOREST PRODUCTS — 0.2% | | | 5.75%, 4/1/18(2) | 500,000 | 544,797 |
| International Paper Co., | | | | Norfolk Southern Corp., | | |
| 9.375%, 5/15/19(2) | 415,000 | 486,721 | | 5.90%, 6/15/19(2) | 180,000 | 200,491 |
| International Paper Co., | | | | Union Pacific Corp., 5.75%, | | |
| 7.50%, 8/15/21(2) | 300,000 | 318,499 | | 11/15/17(2) | 180,000 | 193,275 |
| | | 805,220 | | | | 1,624,717 |
| PHARMACEUTICALS — 1.3% | | | | SEMICONDUCTORS & SEMICONDUCTOR | |
| Abbott Laboratories, | | | | EQUIPMENT — 0.1% | | |
| 5.875%, 5/15/16(2) | 179,000 | 199,855 | | Analog Devices, Inc., | | |
| Abbott Laboratories, | | | | 5.00%, 7/1/14(2) | 220,000 | 231,484 |
| 5.60%, 11/30/17(2) | 140,000 | 154,574 | | SOFTWARE — 0.2% | | |
| Abbott Laboratories, | | | | Intuit, Inc., | | |
| 6.00%, 4/1/39(2) | 150,000 | 171,102 | | 5.75%, 3/15/17(2) | 400,000 | 419,072 |
| AstraZeneca plc, | | | | Oracle Corp., | | |
| 5.40%, 9/15/12(2) | 550,000 | 603,305 | | 6.125%, 7/8/39(2) | 400,000 | 452,037 |
| AstraZeneca plc, | | | | | | 871,109 |
| 5.90%, 9/15/17(2) | 190,000 | 212,985 | | | | |
| GlaxoSmithKline Capital, | | | | | | |
| Inc., 4.85%, 5/15/13(2) | 290,000 | 311,919 | | | | |
16
| | | | | | |
| NT Diversified Bond | | | | | |
| |
| |
| | Principal | | | | Principal | |
| | Amount | Value | | | Amount | Value |
| SPECIALTY RETAIL — 0.2% | | | | Collateralized Mortgage | |
| GSC Holdings Corp., | | | | Obligations(1) — 2.7% | | |
| 8.00%, 10/1/12(2) | $ 200,000 | $ 207,500 | | | | |
| Home Depot, Inc. (The), | | | | PRIVATE SPONSOR COLLATERALIZED | |
| 5.875%, 12/16/36(2) | 90,000 | 87,610 | | MORTGAGE OBLIGATIONS — 1.3% | |
| Staples, Inc., | | | | Banc of America Alternative | | |
| 9.75%, 1/15/14(2) | 440,000 | 529,209 | | Loan Trust, Series 2007-2, | | |
| | | | | Class 2A4, 5.75%, 6/25/37(2) | $ 670,300 | $ 557,040 |
| | | 824,319 | | | | |
| | | | | Chase Mortgage Finance | | |
| WIRELESS TELECOMMUNICATION SERVICES — 0.3% | | Corp., Series 2005 A1, | | |
| American Tower Corp., | | | | Class 2A2 SEQ, VRN, | | |
| 7.25%, 5/15/19(2)(4) | 400,000 | 413,000 | | 5.24%, 10/1/09(2) | 846,162 | 739,724 |
| Rogers Communications, | | | | Countrywide Home Loan | | |
| Inc., 6.80%, 8/15/18(2) | 200,000 | 224,892 | | Mortgage Pass-Through | | |
| Vodafone Group plc, | | | | Trust, Series 2005-17, Class | | |
| 5.00%, 12/16/13(2) | 270,000 | 288,277 | | 1A11, 5.50%, 9/25/35(2) | 1,213,739 | 1,121,602 |
| Vodafone Group plc, | | | | Countrywide Home Loan | | |
| 5.45%, 6/10/19(2) | 270,000 | 281,742 | | Mortgage Pass-Through | | |
| | | 1,207,911 | | Trust, Series 2007-16, Class | | |
| | | | | A1, 6.50%, 10/25/37(2) | 693,747 | 568,919 |
| TOTAL CORPORATE BONDS | | | | | | |
| (Cost $89,022,563) | | 96,166,394 | | Credit Suisse First Boston | | |
| | | | | Mortgage Securities Corp., | | |
| | Series 2003 AR28, Class | | |
| U.S. Government Agency Securities | | | 2A1, VRN, 4.40%, 10/1/09(2) | 481,277 | 448,717 |
| and Equivalents — 6.0% | | | | | |
| | | | | JP Morgan Mortgage Trust, | | |
| FIXED-RATE U.S. GOVERNMENT | | | Series 2004 A2, Class 1A1, | | |
| AGENCY SECURITIES — 2.1% | | | VRN, 4.20%, 10/1/09(2) | 327,337 | 300,937 |
| FHLMC, 5.50%, 8/23/17(2) | 3,000,000 | 3,422,793 | | MASTR Alternative Loans | | |
| FHLMC, 4.875%, 6/13/18(2) | 1,530,000 | 1,671,279 | | Trust, Series 2003-8, Class | | |
| | | | | 4A1, 7.00%, 12/25/33(2) | 10,938 | 10,298 |
| FNMA, 4.375%, 7/17/13(2) | 639,000 | 693,210 | | | | |
| FNMA, 5.00%, 2/13/17(2) | 1,650,000 | 1,828,099 | | Wells Fargo Mortgage | | |
| | | | | Backed Securities Trust, | | |
| | | 7,615,381 | | Series 2004 EE, Class 3A1, | | |
| GOVERNMENT-BACKED | | | | VRN, 4.22%, 10/1/09(2) | 216,622 | 210,318 |
| CORPORATE BONDS(7) — 3.9% | | | Wells Fargo Mortgage | | |
| Bank of America Corp., | | | | Backed Securities Trust, | | |
| 3.125%, 6/15/12(2) | 1,500,000 | 1,561,294 | | Series 2006-AR10, Class 5A5 | | |
| Citigroup Funding, Inc., | | | | SEQ, VRN, 5.59%, 10/1/09(2) | 1,050,000 | 723,380 |
| 1.875%, 10/22/12 | 5,000,000 | 5,014,855 | | | | 4,680,935 |
| General Electric Capital | | | | U.S. GOVERNMENT AGENCY COLLATERALIZED |
| Corp., 2.20%, 6/8/12(2) | 2,500,000 | 2,540,540 | | MORTGAGE OBLIGATIONS — 1.4% | |
| Goldman Sachs Group, Inc. | | | | FHLMC, Series 2926, Class | | |
| (The), 1.625%, 7/15/11(2) | 2,500,000 | 2,526,280 | | EW SEQ, 5.00%, 1/15/25(2) | 700,000 | 732,689 |
| Morgan Stanley, | | | | FHLMC, Series 3203, Class | | |
| 2.00%, 9/22/11(2) | 900,000 | 915,187 | | VN SEQ, 5.00%, 6/15/22(2) | 3,000,000 | 3,181,176 |
| US Bancorp, | | | | FNMA, Series 1989-35, | | |
| 1.80%, 5/15/12 | 2,000,000 | 2,011,264 | | Class G SEQ, 9.50%, | | |
| | | 14,569,420 | | 7/25/19(2) | 2,643 | 2,893 |
| TOTAL U.S. GOVERNMENT AGENCY | | | FNMA, Series 2003-10, | | |
| SECURITIES AND EQUIVALENTS | | | Class HW SEQ, 5.00%, | | |
| (Cost $21,657,833) | | 22,184,801 | | 11/25/16(2) | 1,430,013 | 1,469,525 |
| | | | | | | 5,386,283 |
| | | | | TOTAL COLLATERALIZED | | |
| | | | | MORTGAGE OBLIGATIONS | | |
| | | | | (Cost $9,734,466) | | 10,067,218 |
17
| | | | | | |
| NT Diversified Bond | | | | | |
| |
| |
| | Principal | | | | Principal | |
| | Amount | Value | | | Amount | Value |
| Commercial Mortgage-Backed | | | Merrill Lynch Floating Trust, | | |
| Securities(1) — 2.4% | | | | Series 2006-1, Class A1, | | |
| | | | | VRN, 0.31%, 10/15/09, | | |
| Banc of America | | | | resets monthly off the | | |
| Commercial Mortgage, Inc., | | | | 1-month LIBOR plus | | |
| Series 2004-1, Class A3 | | | | 0.07% with no caps(2)(4) | $ 221,648 | $ 170,114 |
| SEQ, 4.43%, 11/10/39(2) | $ 1,860,000 | $ 1,855,454 | | Prudential Securities | | |
| Banc of America Large Loan, | | | | Secured Financing Corp., | | |
| Series 2005 MIB1, Class | | | | Series 2000 C1, Class A2 | | |
| A1, VRN, 0.39%, 10/15/09, | | | | SEQ, VRN, 7.73%, 10/1/09(2) | 2,379,937 | 2,403,736 |
| resets monthly off the | | | | TOTAL COMMERCIAL | | |
| 1-month LIBOR plus 0.15% | | | | MORTGAGE-BACKED SECURITIES | |
| with no caps(2)(4) | 113,525 | 97,398 | | (Cost $9,263,450) | | 8,941,143 |
| Bear Stearns Commercial | | | | Municipal Securities — 1.7% | |
| Mortgage Securities Trust, | | | | | | |
| Series 2006 BBA7, Class | | | | California Educational | | |
| A1, VRN, 0.35%, 10/15/09, | | | | Facilities Auth. Rev., | | |
| resets monthly off the | | | | Series 2007 T1, | | |
| 1-month LIBOR plus 0.11% | | | | (Stanford University), | | |
| with no caps(2)(4) | 390,263 | 323,000 | | 5.00%, 3/15/39(2) | 930,000 | 1,110,057 |
| Commercial Mortgage Pass- | | | | California GO, (Building | | |
| Through Certificates, Series | | | | Bonds), 7.55%, 4/1/39(2) | 400,000 | 447,964 |
| 2005 F10A, Class A1, VRN, | | | | Illinois GO, (Taxable | | |
| 0.34%, 10/15/09, resets | | | | Pension), 5.10%, 6/1/33(2) | 673,000 | 633,905 |
| monthly off the 1-month | | | | Metropolitan Water | | |
| LIBOR plus 0.10% with | | | | Reclamation District of | | |
| no caps(2)(4) | 13,691 | 13,596 | | Greater Chicago GO, | | |
| Credit Suisse Mortgage | | | | (Building Bonds), | | |
| Capital Certificates, Series | | | | 5.72%, 12/1/38(2) | 250,000 | 275,813 |
| 2007 TF2A, Class A1, VRN, | | | | Missouri Highways & | | |
| 0.42%, 10/15/09, resets | | | | Transportation Commission | | |
| monthly off the 1-month | | | | Rev., (Building Bonds), | | |
| LIBOR plus 0.18% with | | | | 5.45%, 5/1/33(2) | 280,000 | 291,192 |
| no caps(2)(4) | 1,590,086 | 1,181,611 | | | | |
| | | | | New Jersey State Turnpike | | |
| GMAC Commercial | | | | Auth. Rev., Series 2009 F, | | |
| Mortgage Securities, Inc., | | | | (Building Bonds), | | |
| Series 2005 C1, Class A2 | | | | 7.41%, 1/1/40(2) | 560,000 | 695,660 |
| SEQ, 4.47%, 5/10/43(2) | 739,332 | 743,735 | | | | |
| | | | | New York State Dormitory | | |
| Greenwich Capital | | | | Auth. Rev., (Building Bonds), | | |
| Commercial Funding Corp., | | | | 5.63%, 3/15/39(2) | 340,000 | 359,944 |
| Series 2006 FL4A, Class A1, | | | | | | |
| VRN, 0.34%, 10/5/09, resets | | | | San Antonio Electric & Gas | | |
| monthly off the 1-month | | | | Rev., (Building Bonds), | | |
| LIBOR plus 0.09% with | | | | 5.99%, 2/1/39(2) | 250,000 | 281,640 |
| no caps(2)(4) | 224,887 | 187,053 | | Texas GO, (Building Bonds), | | |
| Heller Financial Commercial | | | | 5.52%, 4/1/39(2) | 630,000 | 670,856 |
| Mortgage Asset, Series 2000 | | | | University of California Rev., | | |
| PH1, Class D, VRN, | | | | (Building Bonds), 5.77%, | | |
| 8.36%, 10/1/09 | 550,000 | 554,229 | | 5/15/43(2) | 420,000 | 453,797 |
| LB-UBS Commercial | | | | Utah GO, Series 2009 D, | | |
| Mortgage Trust, Series 2005 | | | | (Building Bonds), 4.55%, | | |
| C2, Class A2 SEQ, | | | | 7/1/24(2) | 830,000 | 861,183 |
| 4.82%, 4/15/30(2) | 730,902 | 738,586 | | TOTAL MUNICIPAL SECURITIES | |
| LB-UBS Commercial | | | | (Cost $5,573,572) | | 6,082,011 |
| Mortgage Trust, Series 2005 | | | | | | |
| C3, Class A3 SEQ, | | | | | | |
| 4.65%, 7/15/30(2) | 671,000 | 672,631 | | | | |
18
| | | | | | | | |
| NT Diversified Bond | | | | | |
| |
| |
| | | Principal | | | | Principal | |
| | | | Amount | Value | | | Amount | Value |
| Sovereign Governments | | | SLM Student Loan Trust, | | |
| & Agencies — 1.5% | | | | | Series 2006-10, Class A2, | | |
| | | | | | VRN, 0.51%, 10/26/09, | | |
| Brazilian Government | | | | | | resets quarterly off the | | |
| International Bond, | | | | | | 3-month LIBOR plus 0.01% | | |
| 5.875%, 1/15/19(2) | | $ 540,000 | $ 583,200 | | with no caps(2) | $ 34,660 | $ 34,661 |
| German Federal Republic, | | | | | SLM Student Loan Trust, | | |
| 3.50%, 7/4/19 | EUR | | 2,400,000 | 3,594,043 | | Series 2007-8, Class A1, | | |
| Hydro Quebec, Series HY, | | | | | VRN, 0.73%, 10/26/09, | | |
| 8.40%, 1/15/22(2) | | $ 29,000 | 38,533 | | resets quarterly off the | | |
| | | | | | | 3-month LIBOR plus 0.23% | | |
| Poland Government | | | | | | with no caps(2) | 761,787 | 761,859 |
| International Bond, | | | | | | | |
| 6.375%, 7/15/19(2) | | | 200,000 | 225,751 | | TOTAL ASSET-BACKED SECURITIES | | |
| | | | | | | (Cost $1,134,671) | | 1,140,202 |
| Province of Ontario Canada, | | | | | | | |
| 5.45%, 4/27/16(2) | | | 300,000 | 335,719 | | Temporary Cash Investments — 2.2% |
| United Mexican States, | | | | | Repurchase Agreement, Bank of America | |
| 5.95%, 3/19/19(2) | | | 750,000 | 791,250 | | Securities, LLC, (collateralized by various | |
| TOTAL SOVEREIGN | | | | | | U.S. Treasury obligations, 0.27%, 7/15/10, | |
| GOVERNMENTS & AGENCIES | | | | valued at $8,239,242), in a joint trading | |
| (Cost $5,433,720) | | | | 5,568,496 | | account at 0.02%, dated 9/30/09, due | |
| | | | | | | 10/1/09 (Delivery value $8,077,004) | |
| Asset-Backed Securities(1) — 0.3% | | | (Cost $8,077,000) | | 8,077,000 |
| CNH Equipment Trust, Series | | | | | TOTAL INVESTMENT | | |
| 2007 C, Class A3A SEQ, | | | | | SECURITIES — 101.3% | | |
| 5.21%, 12/15/11(2) | | | 225,290 | 227,320 | | (Cost $361,408,051) | | 373,692,474 |
| Detroit Edison Securitization | | | | | OTHER ASSETS | | |
| Funding LLC, Series 2001-1, | | | | | AND LIABILITIES — (1.3)% | | (4,665,786) |
| Class A4 SEQ, 6.19%, | | | | | | TOTAL NET ASSETS — 100.0% | $369,026,688 |
| 3/1/13(2) | | | 72,122 | 75,700 | | | | |
| SLM Student Loan Trust, | | | | | | | |
| Series 2006-5, Class A2, | | | | | | | |
| VRN, 0.49%, 10/26/09, | | | | | | | |
| resets quarterly off the | | | | | | | |
| 3-month LIBOR minus | | | | | | | |
| 0.01% with no caps(2) | | 40,687 | 40,662 | | | | |
| | | | |
| Forward Foreign Currency Exchange Contracts | | |
| Contracts to Sell | Settlement Date | Value | Unrealized Gain (Loss) |
| 2,469,038 EUR for USD | 10/30/09 | $3,613,067 | $16,308 |
| (Value on Settlement Date $3,629,375) | | | |
| |
| Swap Agreements | | | |
| Notional Amount | Description of Agreement | Premiums Paid (Received) | Value |
| CREDIT DEFAULT — BUY PROTECTION | | |
| $1,100,000 | Pay quarterly a fixed rate equal to 0.12% | | |
| | multiplied by the notional amount and | | |
| | receive from Barclays Bank plc upon each | | |
| | default event of Pfizer, Inc., par value of the | | |
| | proportional notional amount of Pfizer, Inc., | | |
| | 4.65%, 3/1/18. Expires March 2017. | — | $26,718 |
19
|
| NT Diversified Bond |
| Notes to Schedule of Investments |
Equivalent = Security whose principal payments are backed by the full faith and credit of the United States
EUR = Euro
FHLMC = Federal Home Loan Mortgage Corporation
FNMA = Federal National Mortgage Association
GMAC = General Motors Acceptance Corporation
GNMA = Government National Mortgage Association
GO = General Obligation
LB-UBS = Lehman Brothers, Inc. — UBS AG
LIBOR = London Interbank Offered Rate
MASTR = Mortgage Asset Securitization Transactions, Inc.
resets = The frequency with which a security’s coupon changes, based on current market conditions or an underlying index. The more frequently a
security resets, the less risk the investor is taking that the coupon will vary significantly from current market rates.
SEQ = Sequential Payer
USD = United States Dollar
VRN = Variable Rate Note. Interest reset date is indicated. Rate shown is effective at the period end.
| (1) | Final maturity indicated, unless otherwise noted. |
| (2) | Security, or a portion thereof, has been segregated for forward commitments, when-issued securities and/or swap agreements. At the period end, the aggregate value of securities pledged was $6,333,000. |
| (3) | Forward commitment. |
| (4) | Security was purchased under Rule 144A of the Securities Act of 1933 or is a private placement and, unless registered under the Act or exempted from registration, may only be sold to qualified institutional investors. The aggregate value of these securities at the period end was $10,863,135, which represented 2.9% of total net assets. |
| (5) | When-issued security. |
| (6) | Industry is less than 0.05% of total net assets. |
| (7) | The debt is guaranteed under the Federal Deposit Insurance Corporation’s (FDIC) Temporary Liquidity Guarantee Program and is backed by the full faith and credit of the United States. The expiration date of the FDIC’s guarantee is the earlier of the maturity date of the debt or June 30, 2012. |
See Notes to Financial Statements.
20
|
| Statement of Assets and Liabilities |
| |
| SEPTEMBER 30, 2009 (UNAUDITED) | |
| Assets | |
| Investment securities, at value (cost of $361,408,051) | $373,692,474 |
| Cash | 603 |
| Receivable for investments sold | 369,848 |
| Receivable for capital shares sold | 410,480 |
| Receivable for forward foreign currency exchange contracts | 16,308 |
| Receivable for swap agreements, at value | 26,718 |
| Interest receivable | 2,610,490 |
| | 377,126,921 |
| | |
| Liabilities | |
| Payable for investments purchased | 6,910,862 |
| Payable for capital shares redeemed | 11,067 |
| Dividends payable | 1,074,055 |
| Accrued management fees | 104,249 |
| | 8,100,233 |
| | |
| Net Assets | $369,026,688 |
| | |
| Institutional Class Capital Shares | |
| Outstanding (unlimited number of shares authorized) | 35,083,965 |
| | |
| Net Asset Value Per Share | $10.52 |
| | |
| Net Assets Consist of: | |
| Capital paid-in | $356,509,014 |
| Accumulated net investment loss | (154,343) |
| Undistributed net realized gain on investment and foreign currency transactions | 344,631 |
| Net unrealized appreciation on investments and translation of assets and liabilities in foreign currencies | 12,327,386 |
| | $369,026,688 |
| |
| |
| See Notes to Financial Statements. | |
21
| |
| FOR THE SIX MONTHS ENDED SEPTEMBER 30, 2009 (UNAUDITED) | |
| Investment Income (Loss) | |
| Income: | |
| Interest | $ 6,201,441 |
| Securities lending, net | 3,114 |
| | 6,204,555 |
| | |
| Expenses: | |
| Management fees | 631,038 |
| Trustees’ fees and expenses | 6,442 |
| Other expenses | 136 |
| | 637,616 |
| Fees waived | (27,821) |
| | 609,795 |
| | |
| Net investment income (loss) | 5,594,760 |
| | |
| Realized and Unrealized Gain (Loss) | |
| Net realized gain (loss) on: | |
| Investment transactions | 1,981,561 |
| Swap agreement transactions | (670) |
| Foreign currency transactions | (11,111) |
| | 1,969,780 |
| | |
| Change in net unrealized appreciation (depreciation) on: | |
| Investments | 10,309,286 |
| Swap agreements | (46,508) |
| Translation of assets and liabilities in foreign currencies | 16,245 |
| | 10,279,023 |
| | |
| Net realized and unrealized gain (loss) | 12,248,803 |
| |
| Net Increase (Decrease) in Net Assets Resulting from Operations | $17,843,563 |
| |
| |
| See Notes to Financial Statements. | |
22
|
| Statement of Changes in Net Assets |
| | |
| SIX MONTHS ENDED SEPTEMBER 30, 2009 (UNAUDITED) AND YEAR ENDED MARCH 31, 2009 | |
| Increase (Decrease) in Net Assets | September 30, 2009 | March 31, 2009 |
| Operations | | |
| Net investment income (loss) | $ 5,594,760 | $ 7,929,487 |
| Net realized gain (loss) | 1,969,780 | (617,048) |
| Change in net unrealized appreciation (depreciation) | 10,279,023 | (1,313,943) |
| Net increase (decrease) in net assets resulting from operations | 17,843,563 | 5,998,496 |
| | | |
| Distributions to Shareholders | | |
| From net investment income | (5,744,476) | (8,479,164) |
| From net realized gains | — | (4,383,522) |
| Decrease in net assets from distributions | (5,744,476) | (12,862,686) |
| | | |
| Capital Share Transactions | | |
| Proceeds from shares sold | 112,234,341 | 192,365,339 |
| Payments for shares redeemed | (8,717,286) | (94,209,838) |
| Net increase (decrease) in net assets from capital share transactions | 103,517,055 | 98,155,501 |
| | | |
| Net increase (decrease) in net assets | 115,616,142 | 91,291,311 |
| | | |
| Net Assets | | |
| Beginning of period | 253,410,546 | 162,119,235 |
| End of period | $369,026,688 | $253,410,546 |
| | | |
| Accumulated net investment loss | $(154,343) | $(4,627) |
| | | |
| Transactions in Shares of the Fund | | |
| Sold | 10,902,133 | 19,000,859 |
| Redeemed | (849,518) | (9,324,807) |
| Net increase (decrease) in shares of the fund | 10,052,615 | 9,676,052 |
| |
| |
| See Notes to Financial Statements. | | |
23
|
| Notes to Financial Statements |
SEPTEMBER 30, 2009 (UNAUDITED)
1. Organization and Summary of Significant Accounting Policies
Organization — American Century Investment Trust (the trust) is registered under the Investment Company Act of 1940 (the 1940 Act) as an open-end management investment company. NT Diversified Bond Fund (NT Diversified Bond) (the fund) is one fund in a series issued by the trust. The fund is diversified under the 1940 Act. The fund’s investment objective is to seek a high level of income by investing in non-money market debt securities. The fund is not permitted to invest in any securities issued by companies assigned by the Global Industry Classification Standard to the tobacco industry. The following is a summary of the fund’s significant accounting policies.
Security Valuations — Debt securities maturing in greater than 60 days at the time of purchase are valued at current market value as provided by a commercial pricing service or at the mean of the most recent bid and asked prices. Debt securities maturing within 60 days at the time of purchase may be valued at cost, plus or minus any amortized discount or premium. Discount notes may be valued through a commercial pricing service or at amortized cost, which approximates fair value. Investments in open-end management investment companies are valued at the reported net asset value. Securities traded on foreign securities exchanges and over-the-counter markets are normally completed before the close of business on days that the New York Stock Exchange (the Exchange) is open and may also take place on days when the Exchange is not open. If an ev ent occurs after the value of a security was established but before the net asset value per share was determined that was likely to materially change the net asset value, that security would be valued as determined in accordance with procedures adopted by the Board of Trustees. If the fund determines that the market price of a portfolio security is not readily available, or that the valuation methods mentioned above do not reflect the security’s fair value, such security is valued as determined by the Board of Trustees or its designee, in accordance with procedures adopted by the Board of Trustees, if such determination would materially impact a fund’s net asset value. Certain other circumstances may cause the fund to use alternative procedures to value a security such as: a security has been declared in default; trading in a security has been halted during the trading day; or there is a foreign market holiday and no trading will commence.
Security Transactions — For financial reporting purposes, security transactions are accounted for as of the trade date. Net realized gains and losses are determined on the identified cost basis, which is also used for federal income tax purposes.
Investment Income — Interest income less foreign taxes withheld, if any, is recorded on the accrual basis and includes paydown gain (loss) and accretion of discounts and amortization of premiums.
Securities on Loan — The fund may lend portfolio securities through its lending agent to certain approved borrowers in order to earn additional income. The income earned, net of any rebates or fees, is included in the Statement of Operations. The fund continues to recognize any gain or loss in the market price of the securities loaned and records any interest earned or dividends declared.
Foreign Currency Translations —All assets and liabilities initially expressed in foreign currencies are translated into U.S. dollars at prevailing exchange rates at period end. The fund may enter into spot foreign currency exchange contracts to facilitate transactions denominated in a foreign currency. Purchases and sales of investment securities, dividend and interest income, spot foreign currency exchange contracts, and certain expenses are translated at the rates of exchange prevailing on the respective dates of such transactions. For assets and liabilities, other than investments in securities, net realized and unrealized gains and losses from foreign currency translations arise from changes in currency exchange rates.
24
Net realized and unrealized foreign currency exchange gains or losses occurring during the holding period of investment securities are a component of realized gain (loss) on investment transactions and unrealized appreciation (depreciation) on investments, respectively. Certain countries may impose taxes on the contract amount of purchases and sales of foreign currency contracts in their currency. The fund records the foreign tax expense, if any, as a reduction to the net realized gain (loss) on foreign currency transactions.
When-Issued and Forward Commitments — The fund may engage in securities transactions on a when-issued or forward commitment basis. In these transactions, the securities’ prices and yields are fixed on the date of the commitment. In a when-issued transaction, the payment and delivery are scheduled for a future date and during this period, securities are subject to market fluctuations. In a forward commitment transaction, the fund may sell a security and at the same time make a commitment to purchase the same security at a future date at a specified price. Conversely, the fund may purchase a security and at the same time make a commitment to sell the same security at a future date at a specified price. These types of transactions are executed simultaneously in what are known as “roll” transactions. The fund will segregate cash, cash equivalents or other appropriate liquid securities on its records in amounts sufficient to meet the purchase price. The fund accounts for “roll” transactions as purchases and sales; as such these transactions may increase portfolio turnover.
Repurchase Agreements — The fund may enter into repurchase agreements with institutions that American Century Investment Management, Inc. (ACIM) (the investment advisor) has determined are creditworthy pursuant to criteria adopted by the Board of Trustees. Each repurchase agreement is recorded at cost. The fund requires that the collateral, represented by securities, received in a repurchase transaction be transferred to the custodian in a manner sufficient to enable the fund to obtain those securities in the event of a default under the repurchase agreement. ACIM monitors, on a daily basis, the securities transferred to ensure the value, including accrued interest, of the securities under each repurchase agreement is equal to or greater than amounts owed to the fund under each repurchase agreement.
Joint Trading Account — Pursuant to an Exemptive Order issued by the Securities and Exchange Commission, the fund, along with certain other funds in the American Century Investments family of funds, may transfer uninvested cash balances into a joint trading account. These balances are invested in one or more repurchase agreements that are collateralized by U.S. Treasury or Agency obligations.
Income Tax Status — It is the fund’s policy to distribute substantially all net investment income and net realized gains to shareholders and to otherwise qualify as a regulated investment company under provisions of the Internal Revenue Code. All tax years for the fund remain subject to examination by tax authorities. At this time, management believes there are no uncertain tax positions which, based on their technical merit, would not be sustained upon examination and for which it is reasonably possible that the total amounts of unrecognized tax benefits will significantly change in the next twelve months. Accordingly, no provision has been made for federal or state income taxes. Interest and penalties associated with any federal or state income tax obligations, if any, are recorded as interest expense.
Distributions to Shareholders — Distributions from net investment income for the fund are declared daily and paid monthly. Distributions from net realized gains for the fund, if any, are generally declared and paid annually.
Indemnifications — Under the trust’s organizational documents, its officers and trustees are indemnified against certain liabilities arising out of the performance of their duties to the fund. In addition, in the normal course of business, the fund enters into contracts that provide general indemnifications. The maximum exposure under these arrangements is unknown as this would involve future claims that may be made against a fund. The risk of material loss from such claims is considered by management to be remote.
25
Use of Estimates — The financial statements are prepared in conformity with accounting principles generally accepted in the United States of America, which may require management to make certain estimates and assumptions at the date of the financial statements. Actual results could differ from these estimates.
Subsequent Events — Management has evaluated events or transactions that may have occurred since September 30, 2009, that would merit recognition or disclosure in the financial statements. This evaluation was completed through November 27, 2009, the date the financial statements were issued.
2. Fees and Transactions with Related Parties
Management Fees — The trust has entered into a Management Agreement with ACIM, under which ACIM provides the fund with investment advisory and management services in exchange for a single, unified management fee (the fee). The Agreement provides that all expenses of the fund, except brokerage commissions, taxes, interest, fees and expenses of those trustees who are not considered “interested persons” as defined in the 1940 Act (including counsel fees) and extraordinary expenses, will be paid by ACIM. The fee is computed and accrued daily based on the daily net assets of the specific class of shares of the fund and paid monthly in arrears. The fee consists of (1) an Investment Category Fee based on the daily net assets of the fund and certain other accounts managed by the investment advisor that are in the same broad investme nt category as the fund and (2) a Complex Fee based on the assets of all the funds in the American Century Investments family of funds. The rates for the Investment Category Fee range from 0.2925% to 0.4100% and the rates for the Complex Fee range from 0.0500% to 0.1100%. Effective August 1, 2009, the investment advisor voluntarily agreed to waive 0.049% of its management fee. The investment advisor expects this fee waiver to continue for one year and cannot terminate it without consulting the Board of Trustees. The effective annual management fee before waiver for the fund for the six months ended September 30, 2009 was 0.41%. The effective annual management fee after waiver for the fund for the six months ended September 30, 2009 was 0.39%.
Related Parties — Certain officers and trustees of the trust are also officers and/or directors of American Century Companies, Inc. (ACC), the parent of the trust’s investment advisor, ACIM, the distributor of the trust, American Century Investment Services, Inc., and the trust’s transfer agent, American Century Services, LLC. The fund is wholly owned, in aggregate, by various funds in a series issued by American Century Asset Allocation Portfolios, Inc. (ACAAP). ACAAP does not invest in the fund for the purpose of exercising management or control.
The fund is eligible to invest in a money market fund for temporary purposes, which is managed by J.P. Morgan Investment Management, Inc. (JPMIM). The fund has a Mutual Funds Services Agreement with J.P. Morgan Investor Services Co. (JPMIS) and a securities lending agreement with JPMorgan Chase Bank (JPMCB). JPMCB is a custodian of the fund. JPMIM, JPMIS and JPMCB are wholly owned subsidiaries of JPMorgan Chase & Co. (JPM). JPM is an equity investor in ACC.
3. Investment Transactions
Purchases of investment securities, excluding short-term investments, for the six months ended September 30, 2009, totaled $280,124,097, of which $222,325,396 represented U.S. Treasury and Government Agency obligations. Sales of investment securities, excluding short-term investments, for the six months ended September 30, 2009, totaled $180,784,721, of which $145,269,983 represented U.S. Treasury and Government Agency obligations.
26
4. Securities Lending
As of September 30, 2009, the fund did not have any securities on loan. JPMCB receives and maintains collateral in the form of cash and/or acceptable securities as approved by ACIM. Cash collateral is invested in authorized investments by the lending agent in a pooled account. Any deficiencies or excess of collateral must be delivered or transferred by the member firms no later than the close of business on the next business day. The fund’s risks in securities lending are that the borrower may not provide additional collateral when required or return the securities when due. If the borrower defaults, receipt of the collateral by the fund may be delayed or limited. Investments made with cash collateral may decline in value.
5. Fair Value Measurements
The fund’s security valuation process is based on several considerations and may use multiple inputs to determine the fair value of the positions held by the fund. In conformity with accounting principles generally accepted in the United States of America, the inputs used to determine a valuation are classified into three broad levels as follows:
|
| • Level 1 valuation inputs consist of actual quoted prices in an active market for |
| identical securities; |
| |
| • Level 2 valuation inputs consist of significant direct or indirect observable market data |
| (including quoted prices for similar securities, evaluations of subsequent market |
| interest rates, prepayment speeds, credit risk, etc.); or |
| |
| • Level 3 valuation inputs consist of significant unobservable inputs (including a fund’s |
| own assumptions). |
The level classification is based on the lowest level input that is significant to the fair valuation measurement. The valuation inputs are not an indication of the risks associated with investing in these securities or other financial instruments.
The following is a summary of the valuation inputs used to determine the fair value of the fund’s securities and other financial instruments as of September 30, 2009:
| | | |
| | Level 1 | Level 2 | Level 3 |
| Investment Securities | | | |
| U.S. Government Agency Mortgage-Backed Securities | — | $110,407,914 | — |
| U.S. Treasury Securities | — | 105,057,295 | — |
| Corporate Bonds | — | 96,166,394 | — |
| U.S. Government Agency Securities and Equivalents | — | 22,184,801 | — |
| Collateralized Mortgage Obligations | — | 10,067,218 | — |
| Commercial Mortgage-Backed Securities | — | 8,941,143 | — |
| Municipal Securities | — | 6,082,011 | — |
| Sovereign Governments & Agencies | — | 5,568,496 | — |
| Asset-Backed Securities | — | 1,140,202 | — |
| Temporary Cash Investments | — | 8,077,000 | — |
| Total Value of Investment Securities | — | $373,692,474 | — |
| | | | |
| Other Financial Instruments | | | |
| Forward Foreign Currency Exchange Contracts | — | $16,308 | — |
| Swap Agreements | — | 26,718 | — |
| Total Unrealized Gain (Loss) | | | |
| on Other Financial Instruments | — | $43,026 | — |
27
6. Derivative Instruments
Credit Risk — The fund is subject to credit risk in the normal course of pursuing its investment objectives. The value of a bond generally declines as the credit quality of its issuer declines. Credit default swaps enable a fund to buy/sell protection against a credit event of a specific issuer or index. A fund may attempt to enhance returns by selling protection or attempt to mitigate credit risk by buying protection. The buyer/seller of credit protection against a security or basket of securities may pay/receive an up-front or periodic payment to compensate for/against potential default events. A fund will segregate cash, cash equivalents or other appropriate liquid securities on its records in amounts sufficient to meet requirements. Swap agreements are valued daily at current market value as provided by a commercial pricing service and /or independent brokers. Changes in value, including the periodic amounts of interest to be paid or received on swaps, are recorded as unrealized appreciation (depreciation) on swap agreements. Realized gain or loss is recorded upon receipt or payment of a periodic settlement or termination of swap agreements. Net realized and unrealized gains or losses occurring during the holding period of swap agreements are a component of net realized gain (loss) on swap agreement transactions and change in net unrealized appreciation (depreciation) on swap agreements, respectively. The risks of entering into swap agreements include the possible lack of liquidity, failure of the counterparty to meet its obligations, and that there may be unfavorable changes in the underlying investments or instruments. During the six months ended September 30, 2009, the fund participated in credit default swap agreements to buy protection.
Foreign Currency Risk — The fund is subject to foreign currency exchange rate risk in the normal course of pursuing its investment objectives. The value of foreign investments held by a fund may be significantly affected by changes in foreign currency exchange rates. The dollar value of a foreign security generally decreases when the value of the dollar rises against the foreign currency in which the security is denominated and tends to increase when the value of the dollar declines against such foreign currency. A fund may enter into forward foreign currency exchange contracts to reduce a fund’s exposure to foreign currency exchange rate fluctuations. The net U.S. dollar value of foreign currency underlying all contractual commitments held by a fund and the resulting unrealized appreciation or depreciation are determined daily using prevailing exchange rates. Realized gain or loss is recorded upon the termination of the contract. Net realized and unrealized gains or losses occurring during the holding period of forward foreign currency exchange contracts are a component of net realized gain (loss) on foreign currency transactions and change in net unrealized appreciation (depreciation) on translation of assets and liabilities in foreign currencies, respectively. A fund bears the risk of an unfavorable change in the foreign currency exchange rate underlying the forward contract. Additionally, losses, up to the fair value, may arise if the counterparties do not perform under the contract terms. The risk of loss from non-performance by the counterparty may be reduced by the use of master netting agreements. During the six months ended September 30, 2009, the fund participated in forward foreign currency exchange contracts.
Value of Derivative Instruments as of September 30, 2009
| | | | |
| | Asset Derivatives | | Liability Derivatives | |
| | Location on Statement | | Location on Statement | |
| Type of Derivative | of Assets and Liabilities | Value | of Assets and Liabilities | Value |
| Credit Risk | Receivable for swap | $26,718 | Payable for swap | — |
| | agreements, at value | | agreements, at value | |
| Foreign Currency Risk | Receivable for forward foreign | 16,308 | Payable for forward foreign | — |
| | currency exchange contracts | | currency exchange contracts | |
| | | $43,026 | | — |
28
Effect of Derivative Instruments on the Statement of Operations for the Six Months Ended September 30, 2009
| | | | |
| | | | Change in Net Unrealized |
| | Net Realized Gain (Loss) | Appreciation (Depreciation) |
| | Location on Statement | | Location on Statement | |
| Type of Derivative | of Operations | | of Operations | |
| Credit Risk | Net realized gain (loss) on | $(670) | Change in net unrealized | $(46,508) |
| | swap agreement transactions | | appreciation (depreciation) | |
| | | | on swap agreements | |
| Foreign Currency Risk | Net realized gain (loss) on | — | Change in net unrealized | 16,308 |
| | foreign currency transactions | | appreciation (depreciation) | |
| | | | on translation of assets and | |
| | | | liabilities in foreign currencies | |
| | | $(670) | | $(30,200) |
The value of derivative instruments at period end and the effect of derivatives on the Statement of Operations is indicative of the fund’s typical volume.
7. Interfund Lending
The fund, along with certain other funds in the American Century Investments family of funds, may participate in an interfund lending program, pursuant to an Exemptive Order issued by the Securities and Exchange Commission (SEC). This program provides an alternative credit facility allowing the fund to borrow from or lend to other funds in the American Century Investments family of funds that permit such transactions. Interfund lending transactions are subject to each fund’s investment policies and borrowing and lending limits. The interfund loan rate earned/paid on interfund lending transactions is determined daily based on the average of certain current market rates. Interfund lending transactions normally extend only overnight, but can have a maximum duration of seven days. The program is subject to annual approval by the Board of Trustees. During the six months ended September 30, 2009, the fund did not utilize the pro gram.
8. Federal Tax Information
The book-basis character of distributions made during the year from net investment income or net realized gains may differ from their ultimate characterization for federal income tax purposes. These differences reflect the differing character of paydown losses, certain income items and net realized gains and losses for financial statement and tax purposes, and may result in reclassification among certain capital accounts on the financial statements.
As of September 30, 2009, the components of investments for federal income tax purposes were as follows:
| |
| Federal tax cost of investments | $361,408,051 |
| Gross tax appreciation of investments | $13,274,913 |
| Gross tax depreciation of investments | (990,490) |
| Net tax appreciation (depreciation) of investments | $12,284,423 |
The cost of investments for federal income tax purposes was the same as the cost for financial reporting purposes.
29
As of March 31, 2009, the fund had a capital loss deferral of $(1,060,397) which represents net capital losses incurred in the five-month period ended March 31, 2009. The fund has elected to treat such losses as having been incurred in the following fiscal year for federal income tax purposes.
9. Recently Issued Accounting Standards
In March 2008, the Financial Accounting Standards Board (FASB) issued Accounting Standards Codification (ASC) Section 815-10 (formerly Statement of Financial Accounting Standards No. 161, “Disclosures about Derivative Instruments and Hedging Activities —an amendment of FASB Statement No. 133”). ASC Section 815-10 is effective for interim periods beginning after November 15, 2008 and has been adopted by the fund. ASC Section 815-10 amends and expands disclosures about derivative instruments and hedging activities. ASC Section 815-10 requires qualitative disclosures about the objectives and strategies of derivative instruments, quantitative disclosures about the fair value amounts of and gains and losses on derivative instruments, and disclosures of credit-risk-related contingent features in hedging activities.
30
| | | | |
| Financial Highlights | | | | |
| NT Diversified Bond | | | | |
| |
| For a Share Outstanding Throughout the Years Ended March 31 (except as noted) | | |
| | 2009(1) | 2009 | 2008 | 2007(2) |
| Per-Share Data | | | | |
| Net Asset Value, Beginning of Period | $10.12 | $10.56 | $10.19 | $10.00 |
| Income From Investment Operations | | | | |
| Net Investment Income (Loss)(3) | 0.19 | 0.43 | 0.49 | 0.44 |
| Net Realized and Unrealized Gain (Loss) | 0.40 | (0.10) | 0.43 | 0.24 |
| Total From Investment Operations | 0.59 | 0.33 | 0.92 | 0.68 |
| Distributions | | | | |
| From Net Investment Income | (0.19) | (0.47) | (0.49) | (0.44) |
| From Net Realized Gains | — | (0.30) | (0.06) | (0.05) |
| Total Distributions | (0.19) | (0.77) | (0.55) | (0.49) |
| Net Asset Value, End of Period | $10.52 | $10.12 | $10.56 | $10.19 |
| | | | | |
| Total Return(4) | 5.91% | 3.36% | 9.32% | 6.96% |
| | | | | |
| Ratios/Supplemental Data | | | | |
| Ratio of Operating Expenses to Average Net Assets | 0.40%(5)(6) | 0.42% | 0.42% | 0.42%(5) |
| Ratio of Operating Expenses to Average Net Assets | | | | |
| (Before Expense Waiver) | 0.42%(5) | 0.42% | 0.42% | 0.42%(5) |
| Ratio of Net Investment Income (Loss) to Average Net Assets | 3.65%(5)(6) | 4.17% | 4.82% | 4.95%(5) |
| Ratio of Net Investment Income (Loss) | | | | |
| to Average Net Assets (Before Expense Waiver) | 3.63%(5) | 4.17% | 4.82% | 4.95%(5) |
| Portfolio Turnover Rate | 61% | 299% | 246% | 308% |
| Net Assets, End of Period (in thousands) | $369,027 | $253,411 | $162,119 | $113,454 |
| (1) | Six months ended September 30, 2009 (unaudited). |
| (2) | May 12, 2006 (fund inception) through March 31, 2007. |
| (3) | Computed using average shares outstanding throughout the period. |
| (4) | Total return assumes reinvestment of net investment income and capital gains distributions, if any. Total returns for periods less than one year are not annualized. |
| (5) | Annualized. |
| (6) | Effective August 1, 2009, the investment advisor voluntarily agreed to waive a portion of its management fee. |
See Notes to Financial Statements.
31
|
| Approval of Management Agreement |
Under Section 15(c) of the Investment Company Act, contracts for investment advisory services to a mutual fund are required to be reviewed, evaluated and approved each year by the fund’s board of directors/trustees, including a majority of a fund’s independent directors/trustees (the “Directors”).
At American Century Investments, this process is referred to as the “15(c) Process.” The board oversees on a continuous basis and evaluates at its quarterly meetings, directly and through the committees of the board, the nature and quality of significant services provided by the advisor, the investment performance of the funds, shareholder services, audit and compliance functions and a variety of other matters relating to fund operations. Each year, it also holds a special meeting in connection with determining whether to renew the contracts for advisory services, to review fund performance, shareholder services, adviser profitability, audit and compliance matters, and other fund operational matters.
Under a Securities and Exchange Commission rule, each fund is required to disclose in its annual or semiannual report, as appropriate, the material factors and conclusions that formed the basis for the board’s approval or renewal of any advisory agreements within the fund’s most recently completed fiscal half-year period.
Annual Contract Review Process
As part of the annual 15(c) Process, the Directors requested and reviewed extensive data and information compiled by the advisor and certain independent providers of evaluative data (the “15(c) Providers”) concerning NT Diversified Bond (the “fund”) and the services provided to the fund under the management agreement. The information considered and the discussions held at the meetings included, but were not limited to:
• the nature, extent and quality of investment management, shareholder services and other services that the advisor provides to the fund;
• the wide range of programs and services the advisor provides to the fund and its shareholders on a routine and non-routine basis;
• the compliance policies, procedures, and regulatory experience of the advisor;
• data comparing the cost of owning the fund to the cost of owning a similar fund;
• data comparing the fund’s performance to appropriate benchmarks and/ or a peer group of other mutual funds with similar investment objectives and strategies;
• financial data showing the profitability of the fund to the advisor and the overall profitability of the advisor;
• data comparing services provided and charges to other non-fund investment management clients of the advisor; and
32
• collateral or “fall-out” benefits derived by the advisor from the manage-ment of the fund, and potential sharing of economies of scale in connection with the management of the fund.
In keeping with its practice, the Directors at a special meeting and at a regularly scheduled quarterly meeting reviewed and discussed the information provided by the advisor throughout the year and to negotiate with the advisor the renewal of the management agreement, including the setting of the applicable management fee. The Directors had the benefit of the advice of their independent counsel throughout the period.
Factors Considered
The Directors considered all of the information provided by the advisor, independent data providers, and the board’s independent counsel, and evaluated such information for each fund the board oversees. The Directors did not identify any single factor as being all-important or controlling, and each Director may have attributed different levels of importance to different factors. In deciding to renew the agreement under the terms ultimately determined by the board to be appropriate, the Directors’ decision was based on a number of factors, including the following.
Nature, Extent and Quality of Services — Generally. Under the management agreement, the advisor is responsible for providing or arranging for all services necessary for the operation of the fund. The board noted that under the management agreement, the advisor provides or arranges at its own expense a wide variety of services including:
• fund construction and design
• initial capitalization/funding
• portfolio research and security selection
• securities trading
• fund administration
• custody of fund assets
• daily valuation of the fund’s portfolio
• shareholder servicing and transfer agency, including shareholder confirmations, recordkeeping and communications
• legal services
• regulatory and portfolio compliance
• financial reporting
• marketing and distribution
33
The Directors noted that many of these services have expanded over time both in terms of quantity and complexity in response to shareholder demands, competition in the industry, changing distribution channels and the changing regulatory environment. In performing their evaluation, the Directors considered information received in connection with the annual review, as well as information provided on an ongoing basis throughout the year and at their regularly scheduled board and committee meetings.
Investment Management Services. The nature of the investment management services provided is quite complex and allows fund shareholders access to professional money management, instant diversification of their investments within an asset class, the opportunity to easily diversify among asset classes, and liquidity. In evaluating investment performance, the board expects the advisor to manage the fund in accordance with its investment objectives and approved strategies. In providing these services, the advisor utilizes teams of investment professionals (portfolio managers, analysts, research assistants, and securities traders) who require extensive information technology, research, training, compliance and other systems to conduct their business. At each quarterly meeting and at the special meeting to consider renewal of the management agreement , the Directors, directly and through its Portfolio Committee, review investment performance information for the fund, together with comparative information for appropriate benchmarks and/ or peer groups of similarly-managed funds, over different time horizons. If performance concerns are identified, the underperforming fund receives special reviews until performance improves, during which Directors discuss with the advisor the reasons for such underperformance (e.g., market conditions, security and sector selection) and any efforts being undertaken to improve performance. The Fund’s performance was above its benchmark for the three-year period and below its benchmark for the one-year period.
Shareholder and Other Services. The advisor provides the fund with a comprehensive package of transfer agency, shareholder, and other services. The Directors, directly and through the various Committees of the Board, review reports and evaluations of such services at their regular quarterly meetings and at their special meeting to consider renewal of the management agreement, including the annual meeting concerning contract review, and other reports to the board. These reports include, but are not limited to, information regarding the operational efficiency and accuracy of the shareholder and transfer agency services provided, staffing levels, shareholder satisfaction (as measured by external as well as internal sources), technology support, new products and services offered to fund shareholders, securities trading activities, portfolio valuati on services, auditing services, and legal and operational compliance activities. Certain aspects of shareholder and transfer agency service level efficiency and the quality of securities trading activities are measured by independent third party providers and are presented in comparison to other fund groups not managed by the advisor.
34
Costs of Services Provided and Profitability. The advisor provides detailed information concerning its cost of providing various services to the fund, its profitability in managing the fund, its overall profitability, and its financial condition. The Directors have reviewed with the advisor the methodology used to prepare this financial information. The Directors have also reviewed with the advisor its methodology for compensating the investment professionals that provide services to the fund. This financial information regarding the advisor is considered in order to evaluate the advisor’s financial condition, its ability to continue to provide services under the management agreement, and the reasonableness of the current management fee.
Ethics. The Directors generally consider the advisor’s commitment to providing quality services to shareholders and to conducting its business ethically. They noted that the advisor’s practices generally meet or exceed industry best practices.
Economies of Scale. The Directors review information provided by the advisor regarding the existence of economies of scale in connection with the investment management of the funds. The Directors concluded that economies of scale are difficult to measure and predict with precision, especially on a fund-by-fund basis. The analysis of economies of scale is further complicated by the additional services and content provided by the advisor and its reinvestment in its ability to provide and expand those services. Accordingly, the Directors seek to evaluate economies of scale by reviewing information, such as year-over-year profitability of the advisor generally, the profitability of its management of the fund specifically, and the expenses incurred by the advisor in providing various functions to the fund. The Directors believe the advisor is a ppropriately sharing economies of scale through its competitive fee structure, fee breakpoints as the fund complex and the fund increases in size, and through reinvestment in its business to provide shareholders additional services and enhancements to existing services. In particular, separate breakpoint schedules based on the size of the entire fund complex and on the size of the fund reflect the complexity of assessing economies of scale.
Comparison to Other Funds’ Fees. The fund pays the advisor a single, all-inclusive (or unified) management fee for providing all services necessary for the management and operation of the fund, other than brokerage expenses, taxes, interest, extraordinary expenses, and the fees and expenses of the fund’s independent directors (including their independent legal counsel). Under the unified fee structure, the advisor is responsible for providing all investment advisory, custody, audit, administrative, compliance, record-keeping, marketing and shareholder services, or arranging and supervising third parties to provide such services. By contrast, most other funds are charged a variety of fees, including an investment advisory fee, a transfer agency fee, an administrative fee, distribution charges and other expenses. Other than their i nvestment advisory fees and Rule 12b-1 distribution fees, the components of the total fees charged by these other funds may be increased without shareholder approval. The board believes the unified fee structure is a benefit to fund shareholders because it clearly discloses to shareholders the cost of owning fund shares, and, since the unified fee cannot be increased without a vote of fund shareholders, it shifts to the
35
advisor the risk of increased costs of operating the fund and provides a direct incentive to minimize administrative inefficiencies. Part of the Directors’ analysis of fee levels involves reviewing certain evaluative data compiled by an independent provider and comparing the fund’s unified fee to the total expense ratio of other funds in the fund’s peer group. The Directors also reviewed updated fee level data provided by the advisor, but recognized that comparative data was particularly difficult to evaluate given the significant market developments during the past year impacting fund assets. The unified fee charged to shareholders of the fund was below the median of the total expense ratios of its peer group.
Comparison to Fees and Services Provided to Other Clients of the Advisor. The Directors also requested and received information from the advisor concerning the nature and extent of the services, fees, and profitability of its advisory services to advisory clients other than the fund. They observed that these varying types of client accounts require different services and involve different regulatory and entrepreneurial risks than the management of the fund. The Directors analyzed this information and concluded that the fees charged and services provided to the fund were reasonable by comparison.
Collateral or “Fall-Out” Benefits Derived by the Advisor. The Directors considered the existence of collateral benefits the advisor may receive as a result of its relationship with the fund. They concluded that the advisor’s primary business is managing mutual funds and it generally does not use fund or shareholder information to generate profits in other lines of business, and therefore does not derive any significant collateral benefits from them. The Directors noted that the advisor receives proprietary research from broker-dealers that execute fund portfolio transactions but concluded that this research is likely to benefit fund shareholders. The Directors also determined that the advisor is able to provide investment management services to certain clients other than the fund, at least in part, due to its existing infras tructure built to serve the fund complex. The Directors concluded, however, that the assets of those other clients are not material to the analysis and, in any event, are included with the assets of the fund to determine breakpoints in the fund’s fee schedule, provided they are managed using the same investment team and strategy.
Conclusions of the Directors
As a result of this process, the Directors, in the absence of particular circumstances and assisted by the advice of their independent legal counsel, taking into account all of the factors discussed above and the information provided by the advisor and others, concluded that the investment management agreement between the fund and the advisor, including the management fee, is fair and reasonable in light of the services provided and should be renewed for a one-year term. In addition, the Directors negotiated a one-year waiver by the advisor of a portion of the management fee. This change was proposed by the Directors based on their review of the percentile rank of the fund’s fees within the fund’s peer universe and the fact that the Directors seek, as a general rule, to have total expense ratios of existing fixed income and money market funds in the lowest 25th percentile of the fees of comparable funds.
36
Retirement Account Information
As required by law, distributions you receive from certain IRAs, or 403(b), 457 and qualified plans are subject to federal income tax withholding, unless you elect not to have withholding apply. Tax will be withheld on the total amount withdrawn even though you may be receiving amounts that are not subject to withholding, such as nondeductible contributions. In such case, excess amounts of withholding could occur. You may adjust your withholding election so that a greater or lesser amount will be withheld.
If you don’t want us to withhold on this amount, you must notify us to not withhold the federal income tax. You may notify us in writing or in certain situations by telephone or through other electronic means. You have the right to revoke your withholding election at any time and any election you make may remain in effect until revoked by filing a new election.
Remember, even if you elect not to have income tax withheld, you are liable for paying income tax on the taxable portion of your withdrawal. If you elect not to have income tax withheld or you don’t have enough income tax withheld, you may be responsible for payment of estimated tax. You may incur penalties under the estimated tax rules if your withholding and estimated tax payments are not sufficient. You can reduce or defer the income tax on a distribution by directly or indirectly rolling such distribution over to another IRA or eligible plan. You should consult your tax advisor for additional information.
State tax will be withheld if, at the time of your distribution, your address is within one of the mandatory withholding states and you have federal income tax withheld. State taxes will be withheld from your distribution in accordance with the respective state rules.
Proxy Voting Guidelines
American Century Investment Management, Inc., the fund’s investment advisor, is responsible for exercising the voting rights associated with the securities purchased and/or held by the fund. A description of the policies and procedures the advisor uses in fulfilling this responsibility is available without charge, upon request, by calling 1-800-345-2021. It is also available on American Century Investments’ website at americancentury.com and on the Securities and Exchange Commission’s website at sec.gov. Information regarding how the investment advisor voted proxies relating to portfolio securities during the most recent 12-month period ended June 30 is available on the “About Us” page at americancentury.com. It is also available at sec.gov.
Quarterly Portfolio Disclosure
The fund files its complete schedule of portfolio holdings with the Securities and Exchange Commission (SEC) for the first and third quarters of each fiscal year on Form N-Q. The fund’s Form N-Q is available on the SEC’s website at sec.gov, and may be reviewed and copied at the SEC’s Public Reference Room in Washington, DC. Information on the operation of the Public Reference Room may be obtained by calling 1-800-SEC-0330. The fund also makes its complete schedule of portfolio holdings for the most recent quarter of its fiscal year available on its website at americancentury.com and, upon request, by calling 1-800-345-2021.
37
The following indices are used to illustrate investment market, sector, or style performance or to serve as fund performance comparisons. They are not investment products available for purchase.
The Citigroup Agency Index is a market-capitalization-weighted index that includes US government sponsored agencies with a remaining maturity of at least one year.
The Citigroup Credit Index includes US and non-US corporate securities and non-US sovereign and provincial securities.
The Citigroup High-Yield Cash-Pay Index is composed of those cash-pay securities included in the Citigroup US High-Yield Market Index with remaining maturities of at least one year.
The Citigroup Mortgage Index measures the mortgage component of the US BIG Bond Index, comprising 15- and 30-year GNMA, FNMA, and FHLMC pass-throughs and FNMA and FHLMC balloon mortgages.
The Citigroup Treasury Index is comprised of US Treasury securities with an amount outstanding of at least $5 billion and a remaining maturity of at least one year.
The Citigroup US Broad Investment-Grade (BIG) Bond Index is a market-capitalization-weighted index that includes fixed-rate Treasury, government-sponsored, mortgage, asset-backed, and investment-grade issues with a maturity of one year or longer.
The Citigroup US High-Yield Market Index captures the performance of below-investment-grade debt issued by corporations domiciled in the United States or Canada. This index includes cash-pay and deferred-interest securities that are publicly placed, have a fixed coupon, and are nonconvertible.
The Citigroup US Inflation-Linked Securities Index (ILSI)SM measures the return of bonds with fixed-rate coupon payments that adjust for inflation as measured by the Consumer Price Index (CPI).
38
39
40

| |
| |
| Contact Us | |
| americancentury.com | |
| Automated Information Line | 1-800-345-8765 |
| Investor Services Representative | 1-800-345-2021 or |
| | 816-531-5575 |
| Business, Not-For-Profit, Employer-Sponsored | |
| Retirement Plans | 1-800-345-3533 |
| Banks and Trust Companies, Broker-Dealers, | |
| Financial Professionals, Insurance Companies | 1-800-345-6488 |
| Telecommunications Device for the Deaf | 1-800-634-4113 |
| American Century Investment Trust | |
| Investment Advisor: | |
| American Century Investment Management, Inc. | |
| Kansas City, Missouri | |
This report and the statements it contains are submitted for the general
information of our shareholders. The report is not authorized for distribution to
prospective investors unless preceded or accompanied by an effective prospectus.
American Century Investment Services, Inc., Distributor
©2009 American Century Proprietary Holdings, Inc. All rights reserved.
0911
CL-SAN-66868N
|
| Semiannual Report |
| September 30, 2009 |

|
| American Century Investments |
Short Duration Fund
Core Plus Fund

Dear Investor:
Thank you for your investment with us during the financial reporting period ended September 30, 2009. We appreciate your trust in American Century Invest ments® at this volatile, transitional time in the economy and investment markets.
As the upheavals associated with the “Great Recession” gradually subside, our senior management team has put considerable thought into how the investment environment has changed and what new challenges and opportunities await us. Critical factors that we are anticipating in the coming year include marked shifts in investment and spending behavior, along with consolidation in our industry.
Most importantly, we think the economic recovery will be slow and extended. The economy and capital markets have come a long way since Lehman Brothers collapsed over a year ago, but 2010 will likely bring continuing challenges. The stock market’s rebound since last March and the third-quarter economic surge this year were fueled largely by corporate cost-cutting and unprecedented mone tary and fiscal stimulus, including some key programs that have since expired or been scaled back.
Meanwhile, the resilient but struggling consumer sector still faces rising unemployment, heavy debt burdens, tight credit conditions, and a housing market that is starting to stabilize, but remains vulnerable. Much of our investment positioning in 2009 has cautiously reflected these still unstable economic fundamentals, leading to underperformance, in some cases, versus market benchmarks buoyed by the rally of riskier assets. We still support our fundamentally based positioning because we believe strongly that some markets—driven more by technical factors than fundamentals—have advanced further than underlying economic conditions warrant, and remain susceptible to the possibility of more volatility ahead.
For more detailed information from our portfolio management team about the performance and positioning of your investment, please review the following pages, or visit our website, americancentury.com.
Thank you for your continued confidence in us.
Sincerely,

Jonathan Thomas
President and Chief Executive Officer
American Century Investments
| |
| Market Perspective | 2 |
| U.S. Fixed-Income Total Returns | 2 |
| |
| Short Duration | |
| |
| Performance | 3 |
| Portfolio Commentary | 5 |
| Portfolio at a Glance | 7 |
| Portfolio Composition by Credit Rating | 7 |
| Types of Investments in Portfolio | 7 |
| Yields | 7 |
| |
| Core Plus | |
| |
| Performance | 8 |
| Portfolio Commentary | 10 |
| Portfolio at a Glance | 12 |
| Portfolio Composition by Credit Rating | 12 |
| Types of Investments in Portfolio | 12 |
| Yields | 12 |
| |
| Shareholder Fee Examples | 13 |
| |
| Financial Statements | |
| |
| Schedule of Investments | 15 |
| Statement of Assets and Liabilities | 33 |
| Statement of Operations | 35 |
| Statement of Changes in Net Assets | 36 |
| Notes to Financial Statements | 37 |
| Financial Highlights | 48 |
| |
| Other Information | |
| |
| Approval of Management Agreements | 60 |
| Additional Information | 65 |
| Index Definitions | 66 |
The opinions expressed in the Market Perspective and each of the Portfolio Commentaries reflect those of the portfolio management team as of the date of the report, and do not necessarily represent the opinions of American Century Investments or any other person in the American Century Investments organization. Any such opinions are subject to change at any time based upon market or other conditions and American Century Investments disclaims any responsibility to update such opinions. These opinions may not be relied upon as investment advice and, because investment decisions made by American Century Investments funds are based on numerous factors, may not be relied upon as an indication of trading intent on behalf of any American Century Investments fund. Security examples are used for representational purposes only and are not intended as recommendations to purchase or sell securities. Performance information for com parative indices and securities is provided to American Century Investments by third party vendors. To the best of American Century Investments’ knowledge, such information is accurate at the time of printing.

By David MacEwen, Chief Investment Officer, Fixed Income
Economy Stabilized, Credit Crisis Eased
The six months ended September 30, 2009, witnessed a remarkable rebound by U.S. financial markets, made possible by the easing of the credit crisis and signs of stabilization in the economy. The government’s stimulus package and “cash for clunkers” program directly boosted consumer spending; home prices stabilized; big financial institutions passed the government’s “stress tests”; and liquidity returned to U.S. credit markets. Add it all up, and the economy expanded at a 3.5% annual rate in the third quarter. That marked the first positive reading on growth since the second quarter of 2008. But even as the economy stabilized, the unemployment rate rose to 9.8% in September, raising the prospect of a weak, “jobless” recovery.
Slack in the labor market and a still-weak economy meant a continued decline in measures of inflation, as the government’s Consumer Price Index fell by 1.3% for the year ended in September. In that environment, the Federal Reserve (the Fed) continued to hold its short-term rate target at 0%–0.25%.
Risk Reigned Supreme
The realization that financial and economic Armageddon had been averted caused a dramatic reversal of the trading that defined 2008, when Treasuries performed best by a wide margin. For the six months ended September 30, 2009, risk assets (securities such as stocks and bonds that offer potentially higher yields and returns than Treasuries) posted very strong returns while intermediate- and long-term Treasury bond prices actually fell (see the accompanying table). This resulted in historic outperformance by some segments of credit markets compared with Treasuries for the six months.
Rates Edged Up
With signs of stability in the economy and financial markets, the Fed began to look ahead to an end to its support of the market for government agency and mortgage-backed securities; nevertheless, to ensure the recovery, the Fed’s policy making arm said it would keep rates low for the foreseeable future. In that environment, investors sold Treasuries, sending their prices down and yields up.
| | | | |
| U.S. Fixed-Income Total Returns | | | | |
| For the six months ended September 30, 2009* | | | |
| Treasury Securities | | | Citigroup U.S. Bond Market Indices | |
| 3-Month Bill | 0.09% | | High-Yield Cash-Pay (corporate) | 37.81% |
| 2-Year Note | 0.73% | | Credit (investment-grade corporate) | 16.39% |
| 10-Year Note | –3.82% | | Broad Investment-Grade (multi-sector) | 4.80% |
| 30-Year Bond | –6.62% | | Inflation-Linked Securities | 3.47% |
| | | | Mortgage (mortgage-backed) | 2.89% |
| | | | Agency | 1.51% |
| | | | Treasury | –1.03% |
| | | | *Total returns for periods less than one year are not annualized. |
2
| | | | |
| Short Duration | | | | |
| |
| Total Returns as of September 30, 2009 | | | |
| | | | Average Annual | |
| | | | Returns | |
| | | | Since | Inception |
| | 6 months(1) | 1 year | Inception | Date |
| Investor Class | 3.28% | 6.86% | 5.73% | 11/30/06 |
| Citigroup Government/Corporate | | | | |
| 1- to 3-Year Index | 2.83% | 6.39% | 5.43% | — |
| Institutional Class | 3.38% | 7.07% | 5.94% | 11/30/06 |
| A Class | | | | 11/30/06 |
| No sales charge* | 3.15% | 6.59% | 5.47% | |
| With sales charge* | 0.80% | 4.22% | 4.63% | |
| B Class | | | | 11/30/06 |
| No sales charge* | 2.67% | 5.70% | 4.65% | |
| With sales charge* | -2.33% | 1.70% | 3.67% | |
| C Class | | | | 11/30/06 |
| No sales charge* | 2.77% | 5.69% | 4.68% | |
| With sales charge* | 1.77% | 5.69% | 4.68% | |
| R Class | 3.03% | 6.22% | 5.20% | 11/30/06 |
| *Sales charges include initial sales charges and contingent deferred sales charges (CDSCs), as applicable. A Class shares have |
| a 2.25% maximum initial sales charge and may be subject to a maximum CDSC of 1.00%. B Class shares redeemed within six |
| years of purchase are subject to a CDSC that declines from 5.00% during the first year after purchase to 0.00% the sixth year after |
| purchase. C Class shares redeemed within 12 months of purchase are subject to a maximum CDSC of 1.00%. The SEC requires that |
| mutual funds provide performance information net of maximum sales charges in all cases where charges could be applied. |
| | | |
| (1) Total returns for periods less than one year are not annualized. | | | |
Data presented reflect past performance. Past performance is no guarantee of future results. Current performance may be higher or lower than the performance shown. Investment return and principal value will fluctuate, and redemption value may be more or less than original cost. To obtain performance data current to the most recent month end, please call 1-800-345-2021 or visit americancentury.com. As interest rates rise, bond values will decline.
Unless otherwise indicated, performance reflects Investor Class shares; performance for other share classes will vary due to differences in fee structure. For information about other share classes available, please consult the prospectus. Data assumes reinvestment of dividends and capital gains, and none of the charts reflect the deduction of taxes that a shareholder would pay on fund distributions or the redemption of fund shares. Returns for the index are provided for comparison. The fund’s total returns include operating expenses (such as transaction costs and management fees) that reduce returns, while the total returns of the index do not.
3
Short Duration
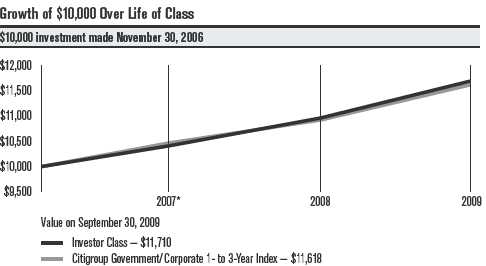
| | | | | |
| One-Year Returns Over Life of Class | | | |
| Periods ended September 30 | | | | |
| | | | 2007* | 2008 | 2009 |
| Investor Class | | | 4.09% | 5.29% | 6.86% |
| Citigroup Government/Corporate | | | | |
| 1- to 3-Year Index | | | 4.66% | 4.34% | 6.39% |
| *From 11/30/06, the Investor Class’s inception date. Not annualized. | | | |
| |
| Total Annual Fund Operating Expenses | | | |
| | Institutional | | | | |
| Investor Class | Class | A Class | B Class | C Class | R Class |
| 0.62% | 0.42% | 0.87% | 1.62% | 1.62% | 1.12% |
The total annual fund operating expenses shown is as stated in the fund’s prospectus current as of the date of this report. The prospectus may vary from the expense ratio shown elsewhere in this report because it is based on a different time period, includes acquired fund fees and expenses, and, if applicable, does not include fee waivers or expense reimbursements.
Data presented reflect past performance. Past performance is no guarantee of future results. Current performance may be higher or lower than the performance shown. Investment return and principal value will fluctuate, and redemption value may be more or less than original cost. To obtain performance data current to the most recent month end, please call 1-800-345-2021 or visit americancentury.com. As interest rates rise, bond values will decline.
Unless otherwise indicated, performance reflects Investor Class shares; performance for other share classes will vary due to differences in fee structure. For information about other share classes available, please consult the prospectus. Data assumes reinvestment of dividends and capital gains, and none of the charts reflect the deduction of taxes that a shareholder would pay on fund distributions or the redemption of fund shares. Returns for the index are provided for comparison. The fund’s total returns include operating expenses (such as transaction costs and management fees) that reduce returns, while the total returns of the index do not.
4
Short Duration
Portfolio Managers: David MacEwen, Bob Gahagan, Jeff Houston, Hando Aguilar, and Jim Platz
Performance Summary
Short Duration returned 3.28%* for the six months ended September 30, 2009. By comparison, the Citigroup Government/Corporate 1- to 3-Year Index returned 2.83%. See page 3 for additional performance comparisons. Portfolio returns reflect operating expenses, while Citigroup index returns do not.
Corporate Positioning Was Key
We continued to keep the portfolio’s duration and yield curve exposure neutral relative to the benchmark, believing we could make better use of our risk budget through higher-confidence sector and security selection decisions. In particular, we took some profits and reduced our overweight stakes in government agency, inflation-indexed, and municipal bonds.
In their place we added select corporate securities we believed offered attractive yields relative to the securities’ risk. First, we liked the fact that corporate health has improved since the height of the credit crisis. Second, we were able to find select corporate securities we believed offered attractive yields relative to the securities’ risk. This positioning contributed performance compared with the benchmark, because corporate bonds were the best-performing portion of the market. In addition, it also helped to hold a small allocation to BB- and B-rated corporates, which outperformed investment-grade securities.
However, while it was beneficial to add corporate bonds in the last six months, the portfolio’s performance would have been even better had we not been underrepresented in finance sector bonds—which rebounded sharply—and the highest-beta, lowest-quality securities that did best for the six months. While we generally avoided finance sector bonds, instead we favored companies in stable, non-cyclical sectors and industries that we thought could do well or improve profitability through innovation or cost cuts, rather than requiring top-line economic growth. Examples of sectors and industries we favored were pharmaceuticals, technology, cable, media, and energy.
Underweight Treasuries, Mortgages Helped
We were underweight Treasuries because of the combination of low current yields and record government budget deficits, which we believe argues for higher yields (and lower prices) down the road. That positioning added value for the six months, when Treasuries were the poorest-performing segment of the market.
In addition, we took some profits and moved to an underweight position in securitized bonds after a period of outperformance. The appeal of these bonds was further diminished as it became clear the Federal Reserve would end its active support of this market in early 2010. So even though mortgage-backed securities outperformed Treasuries, it was beneficial to trim this
*All fund returns referenced in this commentary are for Investor Class shares. Total returns for periods less than one year are not annualized.
5
Short Duration
position and put those profits to work in corporates, which did best for the six months. What’s more, within the securitized slice it helped to favor collateralized mortgage obligations and commercial mortgage-backed securities over traditional passthrough mortgages.
Other Contributors
Late in the reporting period we put in place a trade using long-term municipal bonds and 30-year Treasury futures designed to capitalize on the changing yield relationship between municipals and Treasuries. The trade was based on the expectation that the yield difference between the two would move toward its normal historical relationship—with municipals yielding less than Treasuries—which it did.
Outlook
“While we believe the worst of the financial crisis is behind us, the economy remains weak with a ‘jobless’ recovery likely,“ said Portfolio Manager Bob Gahagan. “We believe the government’s massive monetary and fiscal stimulus could eventually result in higher inflation and lower purchasing power for the dollar. As a result, we expect to continue to evaluate opportunities to add inflation-adjusted securities and non-dollar-denominated bonds. In the meantime, we’ll continue to evaluate sectors and individual securities that we believe are attractively valued and have the potential to outperform going forward.”
6
| | |
| Short Duration | | |
| |
| Portfolio at a Glance | | |
| | As of 9/30/09 | As of 3/31/09 |
| Average Duration (effective) | 1.9 years | 1.9 years |
| Weighted Average Life | 2.1 years | 2.0 years |
| |
| Portfolio Composition by Credit Rating | | |
| | % of | % of |
| | fund investments | fund investments |
| | as of 9/30/09 | as of 3/31/09 |
| AAA | 67% | 87% |
| AA | 4% | 2% |
| A | 10% | 6% |
| BBB | 17% | 4% |
| BB or lower | 2% | 1% |
| Ratings provided by independent research companies. These ratings are listed in Standard & Poor’s format even if they were provided by other sources. |
| The letter ratings indicate the credit worthiness of the underlying bonds in the portfolio and generally range from AAA (highest) to D (lowest). |
| |
| Types of Investments in Portfolio | | |
| | % of | % of |
| | fund investments | fund investments |
| | as of 9/30/09 | as of 3/31/09 |
| Corporate Bonds | 33.7% | 14.5% |
| U.S. Treasury Securities | 31.1% | 32.6% |
| U.S. Government Agency Securities and Equivalents | 22.9% | 26.3% |
| Commercial Mortgage-Backed Securities | 4.4% | 9.8% |
| Collateralized Mortgage Obligations | 2.8% | 4.6% |
| U.S. Government Agency Mortgage-Backed Securities | 1.6% | 3.0% |
| Municipal Securities | 0.8% | 2.7% |
| Asset-Backed Securities | 0.2% | 1.2% |
| Temporary Cash Investments | 2.5% | 5.3% |
| | | | | | |
| Yields as of September 30, 2009 | | | | |
| | | Institutional | | | | |
| | Investor Class | Class | A Class | B Class | C Class | R Class |
| 30-day SEC Yield | 1.39% | 1.58% | 1.11% | 0.40% | 0.40% | 0.89% |
7
| | | | |
| Core Plus | | | | |
| |
| Total Returns as of September 30, 2009 | | | |
| | | | Average Annual | |
| | | | Returns | |
| | | | Since | Inception |
| | 6 months(1) | 1 year | Inception | Date |
| Investor Class | 7.22% | 12.42% | 7.56% | 11/30/06 |
| Citigroup US Broad | | | | |
| Investment-Grade Bond Index | 4.80% | 10.98% | 6.59% | — |
| Institutional Class | 7.22% | 12.54% | 7.73% | 11/30/06 |
| A Class | | | | 11/30/06 |
| No sales charge* | 6.98% | 12.04% | 7.25% | |
| With sales charge* | 2.21% | 7.02% | 5.53% | |
| B Class | | | | 11/30/06 |
| No sales charge* | 6.59% | 11.21% | 6.46% | |
| With sales charge* | 1.59% | 7.21% | 5.51% | |
| C Class | | | | 11/30/06 |
| No sales charge* | 6.59% | 11.21% | 6.46% | |
| With sales charge* | 5.59% | 11.21% | 6.46% | |
| R Class | 6.85% | 11.76% | 6.99% | 11/30/06 |
| *Sales charges include initial sales charges and contingent deferred sales charges (CDSCs), as applicable. A Class shares have |
| a 4.50% maximum initial sales charge and may be subject to a maximum CDSC of 1.00%. B Class shares redeemed within six |
| years of purchase are subject to a CDSC that declines from 5.00% during the first year after purchase to 0.00% the sixth year after |
| purchase. C Class shares redeemed within 12 months of purchase are subject to a maximum CDSC of 1.00%. The SEC requires that |
| mutual funds provide performance information net of maximum sales charges in all cases where charges could be applied. |
| | | |
| (1) Total returns for periods less than one year are not annualized. | | | |
Data presented reflect past performance. Past performance is no guarantee of future results. Current performance may be higher or lower than the performance shown. Investment return and principal value will fluctuate, and redemption value may be more or less than original cost. To obtain performance data current to the most recent month end, please call 1-800-345-2021 or visit americancentury.com. As interest rates rise, bond values will decline.
Unless otherwise indicated, performance reflects Investor Class shares; performance for other share classes will vary due to differences in fee structure. For information about other share classes available, please consult the prospectus. Data assumes reinvestment of dividends and capital gains, and none of the charts reflect the deduction of taxes that a shareholder would pay on fund distributions or the redemption of fund shares. Returns for the index are provided for comparison. The fund’s total returns include operating expenses (such as transaction costs and management fees) that reduce returns, while the total returns of the index do not.
8
Core Plus

| | | | | |
| One-Year Returns Over Life of Class | | | |
| Periods ended September 30 | | | | |
| | | | 2007* | 2008 | 2009 |
| Investor Class | | | 3.51% | 5.65% | 12.42% |
| Citigroup US Broad | | | | | |
| Investment-Grade Bond Index | | 3.33% | 4.48% | 10.98% |
| *From 11/30/06, the Investor Class’s inception date. Not annualized. | | | |
| |
| Total Annual Fund Operating Expenses | | | |
| | Institutional | | | | |
| Investor Class | Class | A Class | B Class | C Class | R Class |
| 0.67% | 0.47% | 0.92% | 1.67% | 1.67% | 1.17% |
The total annual fund operating expenses shown is as stated in the fund’s prospectus current as of the date of this report. The prospectus may vary from the expense ratio shown elsewhere in this report because it is based on a different time period, includes acquired fund fees and expenses, and, if applicable, does not include fee waivers or expense reimbursements.
Data presented reflect past performance. Past performance is no guarantee of future results. Current performance may be higher or lower than the performance shown. Investment return and principal value will fluctuate, and redemption value may be more or less than original cost. To obtain performance data current to the most recent month end, please call 1-800-345-2021 or visit americancentury.com. As interest rates rise, bond values will decline.
Unless otherwise indicated, performance reflects Investor Class shares; performance for other share classes will vary due to differences in fee structure. For information about other share classes available, please consult the prospectus. Data assumes reinvestment of dividends and capital gains, and none of the charts reflect the deduction of taxes that a shareholder would pay on fund distributions or the redemption of fund shares. Returns for the index are provided for comparison. The fund’s total returns include operating expenses (such as transaction costs and management fees) that reduce returns, while the total returns of the index do not.
9
Core Plus
Portfolio Managers: David MacEwen, Bob Gahagan, Jeff Houston, Brian Howell, and Hando Aguilar
Performance Summary
Core Plus returned 7.22%* for the six months ended September 30, 2009. By comparison, the Citigroup US Broad Investment-Grade (BIG) Bond Index returned 4.80%. See page 8 for additional performance comparisons. Portfolio returns reflect operating expenses, while Citigroup index returns do not.
Corporate Positioning Was Key
We continued to keep the portfolio’s duration and yield curve exposure neutral relative to the BIG Index, believing we could make better use of our risk budget through higher-confidence sector and security selection decisions. In particular, we took profits in the last six months from our overweight stakes in inflation-indexed and municipal bonds, which performed very well early in 2009. In their place we added select corporate securities we believed offered attractive yields relative to the securities’ risk. First, we liked the fact that corporate health has improved since the height of the credit crisis. Second, we were able to find select corporate securities we believed offered attractive yields relative to the securities’ risk. This positioning contributed to performance compared with the benchmark, because corporate bonds were the best-performing portion of the market. In addition, it also helped to hold a small allocation to BB- and B-rated corporates, which outperformed investment-grade securities.
Within the corporate slice, we favored companies in stable, non-cyclical sectors and industries that we thought could do well or improve profitability through innovation or cost cuts, rather than requiring top-line economic growth. Examples of sectors and industries we favored were pharmaceuticals, technology, cable, media, and energy. At the same time, we tended to avoid insurance companies and regional banks in particular and finance in general. But we should point out that while it helped to add corporate bonds in the last six months, the portfolio’s performance would have been even better had we not been underrepresented in finance sector bonds—which rebounded sharply—and the highest-beta, lowest-quality securities that did best for the six months.
Underweight Treasuries, Mortgages Helped
We were underweight Treasuries because of the combination of low current yields and record government budget deficits, which we believe argues for higher yields (and lower prices) down the road. That positioning added value for the six months, when Treasuries were the poorest-performing segment of the market.
In addition, we took some profits and moved to an underweight position in securitized bonds after a period of outperformance. The appeal of these bonds was further diminished as it became clear the Federal Reserve would end its active support of this market in early 2010. So even though
*All fund returns referenced in this commentary are for Investor Class shares. Total returns for periods less than one year are not annualized.
10
Core Plus
mortgage-backed securities outperformed Treasuries, it was beneficial to trim this position and put those profits to work in corporates, which did best for the six months. What’s more, within the securitized slice it helped to favor collateralized mortgage obligations and commercial mortgage-backed securities over traditional passthrough mortgages.
Other Contributors
Late in the reporting period we put in place a trade using long-term municipal bonds and 30-year Treasury futures designed to capitalize on the changing yield relationship between municipals and Treasuries. The trade was based on the expectation that the yield difference between the two would move toward its normal historical relationship—with municipals yielding less than Treasuries—which it did. Finally, in September we began to add German government bonds in the first step of what we view as a longer-term trade intended to increase the portfolio’s non-dollar exposure.
Outlook
“While we believe the worst of the financial crisis is behind us, the economy remains weak with a ‘jobless’ recovery likely,“ said Portfolio Manager Bob Gahagan. “We believe the government’s massive monetary and fiscal stimulus could eventually result in higher inflation and lower purchasing power for the dollar. As a result, we expect to continue to evaluate opportunities to add inflation-adjusted securities and non-dollar-denominated bonds. In the meantime, we’ll continue to evaluate sectors and individual securities that we believe are attractively valued and have the potential to outperform going forward.”
11
| | |
| Core Plus | | |
| |
| Portfolio at a Glance | | |
| | As of 9/30/09 | As of 3/31/09 |
| Average Duration (effective) | 4.5 years | 3.8 years |
| Weighted Average Life | 6.0 years | 4.7 years |
| |
| Portfolio Composition by Credit Rating | | |
| | % of | % of |
| | fund investments | fund investments |
| | as of 9/30/09 | as of 3/31/09 |
| AAA | 61% | 76% |
| AA | 4% | 4% |
| A | 13% | 10% |
| BBB | 17% | 8% |
| BB or lower | 5% | 2% |
| Ratings provided by independent research companies. These ratings are listed in Standard & Poor’s format even if they were provided by other sources. |
| The letter ratings indicate the credit worthiness of the underlying bonds in the portfolio and generally range from AAA (highest) to D (lowest). |
| |
| Types of Investments in Portfolio | | |
| | % of | % of |
| | fund investments | fund investments |
| | as of 9/30/09 | as of 3/31/09 |
| Corporate Bonds | 34.9% | 20.9% |
| U.S. Government Agency Mortgage-Backed Securities | 28.8% | 31.7% |
| U.S. Treasury Securities | 11.6% | 10.1% |
| U.S. Government Agency Securities and Equivalents | 5.2% | 6.2% |
| Collateralized Mortgage Obligations | 3.9% | 5.5% |
| Commercial Mortgage-Backed Securities | 3.6% | 8.1% |
| Municipal Securities | 1.8% | 3.6% |
| Sovereign Governments & Agencies | 1.7% | 0.4% |
| Asset-Backed Securities | 0.4% | 1.0% |
| Temporary Cash Investments | 8.1% | 10.1% |
| Temporary Cash Investments — Securities Lending Collateral | — | 2.4% |
| | | | | | |
| Yields as of September 30, 2009 | | | | |
| | | Institutional | | | | |
| | Investor Class | Class | A Class | B Class | C Class | R Class |
| 30-day SEC Yield | 3.48% | 3.67% | 3.09% | 2.48% | 2.49% | 2.99% |
12
|
| Shareholder Fee Examples (Unaudited) |
Fund shareholders may incur two types of costs: (1) transaction costs, including sales charges (loads) on purchase payments and redemption/ exchange fees; and (2) ongoing costs, including management fees; distribution and service (12b-1) fees; and other fund expenses. This example is intended to help you understand your ongoing costs (in dollars) of investing in your fund and to compare these costs with the ongoing cost of investing in other mutual funds.
The example is based on an investment of $1,000 made at the beginning of the period and held for the entire period from April 1, 2009 to September 30, 2009.
Actual Expenses
The table provides information about actual account values and actual expenses for each class. You may use the information, together with the amount you invested, to estimate the expenses that you paid over the period. First, identify the share class you own. Then simply divide your account value by $1,000 (for example, an $8,600 account value divided by $1,000 = 8.6), then multiply the result by the number under the heading “Expenses Paid During Period” to estimate the expenses you paid on your account during this period.
If you hold Investor Class shares of any American Century Investments fund, or Institutional Class shares of the American Century Diversified Bond Fund, in an American Century Investments account (i.e., not a financial intermediary or retirement plan account), American Century Investments may charge you a $12.50 semiannual account maintenance fee if the value of those shares is less than $10,000. We will redeem shares automatically in one of your accounts to pay the $12.50 fee. In determining your total eligible investment amount, we will include your investments in all personal accounts (including American Century Investments Brokerage accounts) registered under your Social Security number. Personal accounts include individual accounts, joint accounts, UGMA/UTMA accounts, personal trusts, Coverdell Education Savings Accounts and IRAs (including traditional, Roth, Rollover, SEP-, SARSEP- and SIMPLE-IRAs), and certain other retirement accounts. If you have only business, business retirement, employer-sponsored or American Century Investments Brokerage accounts, you are currently not subject to this fee. We will not charge the fee as long as you choose to manage your accounts exclusively online. If you are subject to the Account Maintenance Fee, your account value could be reduced by the fee amount.
Hypothetical Example for Comparison Purposes
The table also provides information about hypothetical account values and hypothetical expenses based on the actual expense ratio of each class of your fund and an assumed rate of return of 5% per year before expenses, which is not the actual return of a fund’s share class. The hypothetical account values and expenses may not be used to estimate the actual ending account balance or expenses you paid for the period. You may use this information to compare the ongoing costs of investing in your fund and other funds. To do so, compare this 5% hypothetical example with the 5% hypothetical examples that appear in the shareholder reports of the other funds.
13
Please note that the expenses shown in the table are meant to highlight your ongoing costs only and do not reflect any transactional costs, such as sales charges (loads) or redemption/exchange fees. Therefore, the table is useful in comparing ongoing costs only, and will not help you determine the relative total costs of owning different funds. In addition, if these transactional costs were included, your costs would have been higher.
| | | | |
| | Beginning | Ending | Expenses Paid | |
| | Account Value | Account Value | During Period* | Annualized |
| | 4/1/09 | 9/30/09 | 4/1/09 – 9/30/09 | Expense Ratio* |
| Short Duration | | | | |
| Actual | | | | |
| Investor Class | $1,000 | $1,032.80 | $3.16 | 0.62% |
| Institutional Class | $1,000 | $1,033.80 | $2.14 | 0.42% |
| A Class | $1,000 | $1,031.50 | $4.43 | 0.87% |
| B Class | $1,000 | $1,026.70 | $8.23 | 1.62% |
| C Class | $1,000 | $1,027.70 | $8.23 | 1.62% |
| R Class | $1,000 | $1,030.30 | $5.70 | 1.12% |
| Hypothetical | | | | |
| Investor Class | $1,000 | $1,021.96 | $3.14 | 0.62% |
| Institutional Class | $1,000 | $1,022.96 | $2.13 | 0.42% |
| A Class | $1,000 | $1,020.71 | $4.41 | 0.87% |
| B Class | $1,000 | $1,016.95 | $8.19 | 1.62% |
| C Class | $1,000 | $1,016.95 | $8.19 | 1.62% |
| R Class | $1,000 | $1,019.45 | $5.67 | 1.12% |
| Core Plus | | | | |
| Actual | | | | |
| Investor Class | $1,000 | $1,072.20 | $3.48 | 0.67% |
| Institutional Class | $1,000 | $1,072.20 | $2.44 | 0.47% |
| A Class | $1,000 | $1,069.80 | $4.77 | 0.92% |
| B Class | $1,000 | $1,065.90 | $8.65 | 1.67% |
| C Class | $1,000 | $1,065.90 | $8.65 | 1.67% |
| R Class | $1,000 | $1,068.50 | $6.07 | 1.17% |
| Hypothetical | | | | |
| Investor Class | $1,000 | $1,021.71 | $3.40 | 0.67% |
| Institutional Class | $1,000 | $1,022.71 | $2.38 | 0.47% |
| A Class | $1,000 | $1,020.46 | $4.66 | 0.92% |
| B Class | $1,000 | $1,016.70 | $8.44 | 1.67% |
| C Class | $1,000 | $1,016.70 | $8.44 | 1.67% |
| R Class | $1,000 | $1,019.20 | $5.92 | 1.17% |
| *Expenses are equal to the class’s annualized expense ratio listed in the table above, multiplied by the average account value over the period, |
| multiplied by 183, the number of days in the most recent fiscal half-year, divided by 365, to reflect the one-half year period. |
14
| | | | | | |
| Short Duration | | | | | | |
| |
| SEPTEMBER 30, 2009 (UNAUDITED) | | | | | |
| |
| | Principal | | | | Principal | |
| | Amount | Value | | | Amount | Value |
| Corporate Bonds — 32.2% | | | CHEMICALS — 0.9% | | |
| AEROSPACE & DEFENSE — 1.5% | | | Dow Chemical Co. (The), | | |
| | | | | 4.85%, 8/15/12(2) | $ 900,000 | $ 936,683 |
| BAE Systems Holdings, Inc., | | | | E.I. du Pont de Nemours | | |
| 6.40%, 12/15/11(1)(2) | $ 500,000 | $ 535,713 | | | | |
| | | | | & Co., 5.00%, 1/15/13(2) | 100,000 | 108,414 |
| L-3 Communications Corp., | | | | Mosaic Co. (The), | | |
| 6.125%, 7/15/13(2) | 400,000 | 407,000 | | | | |
| | | | | 7.625%, 12/1/16(1)(2) | 200,000 | 213,466 |
| Northrop Grumman Corp., | | | | | | 1,258,563 |
| 3.70%, 8/1/14(2) | 500,000 | 509,506 | | | | |
| Raytheon Co., | | | | COMMERCIAL BANKS — 2.6% | |
| 4.85%, 1/15/11(2) | 600,000 | 625,677 | | BB&T Corp., | | |
| | | | | 5.70%, 4/30/14(2) | 100,000 | 108,449 |
| | | 2,077,896 | | | | |
| AUTOMOBILES — 0.4% | | | | National Australia Bank Ltd., | | |
| | | | | 2.55%, 1/13/12(1)(2) | 1,200,000 | 1,223,866 |
| Daimler Finance N.A. LLC, | | | | PNC Funding Corp., | | |
| 5.875%, 3/15/11(2) | 100,000 | 103,808 | | | | |
| | | | | 4.50%, 3/10/10(2) | 150,000 | 151,698 |
| Daimler Finance N.A. LLC, | | | | US Bank N.A., | | |
| 5.75%, 9/8/11(2) | 400,000 | 420,401 | | | | |
| | | | | 6.375%, 8/1/11(2) | 260,000 | 281,029 |
| | | 524,209 | | Wells Fargo & Co., | | |
| BEVERAGES — 1.0% | | | | 4.375%, 1/31/13(2) | 300,000 | 310,123 |
| Anheuser-Busch Cos., Inc., | | | | Wells Fargo Bank N.A., | | |
| 6.00%, 4/15/11(2) | 480,000 | 504,639 | | 6.45%, 2/1/11(2) | 400,000 | 421,473 |
| Coca-Cola Enterprises, Inc., | | | | Westpac Banking Corp., | | |
| 3.75%, 3/1/12(2) | 300,000 | 313,309 | | 3.25%, 12/16/11(1)(2) | 1,000,000 | 1,036,680 |
| SABMiller plc, | | | | | | 3,533,318 |
| 6.20%, 7/1/11(1)(2) | 540,000 | 576,155 | | | | |
| | | | | COMMERCIAL SERVICES & SUPPLIES — 0.4% |
| | | 1,394,103 | | Allied Waste North America, | | |
| CAPITAL MARKETS — 1.6% | | | | Inc., 6.375%, 4/15/11(2) | 200,000 | 208,740 |
| Bank of New York Mellon | | | | Corrections Corp. of | | |
| Corp. (The), 4.30%, 5/15/14 | 200,000 | 212,100 | | America, 6.25%, 3/15/13(2) | 400,000 | 396,000 |
| Credit Suisse (New York), | | | | | | 604,740 |
| 5.00%, 5/15/13(2) | 200,000 | 211,909 | | | | |
| | | | | COMPUTERS & PERIPHERALS — 0.4% | |
| Credit Suisse (New York), | | | | Dell, Inc., 3.375%, 6/15/12 | 600,000 | 622,183 |
| 5.50%, 5/1/14(2) | 100,000 | 107,610 | | | | |
| Credit Suisse USA, Inc., | | | | CONSUMER FINANCE — 0.4% | |
| 6.125%, 11/15/11(2) | 250,000 | 270,047 | | General Electric Capital | | |
| | | | | Corp., 5.50%, 4/28/11(2) | 500,000 | 525,875 |
| Goldman Sachs Group, Inc. | | | | | | |
| (The), 5.70%, 9/1/12(2) | 300,000 | 323,983 | | CONTAINERS & PACKAGING — 0.4% | |
| Goldman Sachs Group, Inc. | | | | Ball Corp., | | |
| (The), 5.45%, 11/1/12(2) | 300,000 | 321,612 | | 6.875%, 12/15/12(2) | 600,000 | 607,500 |
| Goldman Sachs Group, Inc. | | | | DIVERSIFIED FINANCIAL SERVICES — 1.7% | |
| (The), 6.00%, 5/1/14(2) | 200,000 | 217,813 | | Bank of America Corp., | | |
| Morgan Stanley, | | | | 4.25%, 10/1/10(2) | 100,000 | 101,235 |
| 5.05%, 1/21/11(2) | 300,000 | 310,416 | | Bank of America Corp., | | |
| Morgan Stanley, | | | | 5.375%, 9/11/12(2) | 400,000 | 419,119 |
| 5.625%, 1/9/12(2) | 200,000 | 212,053 | | Bank of America Corp., | | |
| | | 2,187,543 | | 4.90%, 5/1/13(2) | 200,000 | 205,267 |
| | | | | BP Capital Markets plc, | | |
| | | | | 3.125%, 3/10/12(2) | 200,000 | 206,742 |
15
| | | | | | |
| Short Duration | | | | | | |
| |
| |
| | Principal | | | | Principal | |
| | Amount | Value | | | Amount | Value |
| Citigroup, Inc., | | | | FOOD PRODUCTS — 1.1% | | |
| 4.125%, 2/22/10(2) | $ 150,000 | $ 151,525 | | General Mills, Inc., | | |
| Citigroup, Inc., | | | | 5.65%, 9/10/12(2) | $ 590,000 | $ 644,501 |
| 5.50%, 4/11/13(2) | 450,000 | 461,008 | | General Mills, Inc., | | |
| JPMorgan Chase & Co., | | | | 5.25%, 8/15/13(2) | 100,000 | 108,928 |
| 5.60%, 6/1/11(2) | 200,000 | 212,262 | | Kellogg Co., 6.60%, 4/1/11(2) | 150,000 | 160,817 |
| JPMorgan Chase & Co., | | | | Kraft Foods, Inc., | | |
| 5.375%, 10/1/12(2) | 500,000 | 538,516 | | 5.625%, 11/1/11(2) | 500,000 | 532,335 |
| | | 2,295,674 | | Smithfield Foods, Inc., | | |
| DIVERSIFIED TELECOMMUNICATION | | | 10.00%, 7/15/14(1)(2) | 100,000 | 105,500 |
| SERVICES — 2.7% | | | | | | 1,552,081 |
| AT&T, Inc., 6.25%, 3/15/11(2) | 613,000 | 653,771 | | GAS UTILITIES — 0.1% | | |
| Deutsche Telekom | | | | Southern California Gas Co., | | |
| International Finance BV, | | | | 4.375%, 1/15/11(2) | 150,000 | 154,904 |
| 5.375%, 3/23/11(2) | 453,000 | 474,824 | | | | |
| | | | | HEALTH CARE PROVIDERS & SERVICES — 1.5% |
| Koninklijke KPN NV, | | | | | | |
| 8.00%, 10/1/10(2) | 300,000 | 318,688 | | CareFusion Corp., | | |
| | | | | 4.125%, 8/1/12(1)(2) | 500,000 | 513,680 |
| Qwest Corp., | | | | | | |
| 7.875%, 9/1/11(2) | 300,000 | 310,875 | | Express Scripts, Inc., | | |
| | | | | 5.25%, 6/15/12(2) | 900,000 | 956,087 |
| Sprint Capital Corp., | | | | | | |
| 7.625%, 1/30/11(2) | 400,000 | 411,500 | | Medco Health Solutions, | | |
| | | | | Inc., 6.125%, 3/15/13(2) | 500,000 | 541,957 |
| Telecom Italia Capital SA, | | | | | | |
| 6.20%, 7/18/11(2) | 300,000 | 319,671 | | | | 2,011,724 |
| Telefonica Emisiones SAU, | | | | HOTELS, RESTAURANTS & LEISURE — 0.2% | |
| 5.98%, 6/20/11(2) | 300,000 | 319,839 | | Yum! Brands, Inc., | | |
| | | | | 8.875%, 4/15/11(2) | 200,000 | 218,954 |
| Verizon Communications, | | | | | | |
| Inc., 5.35%, 2/15/11(2) | 200,000 | 210,543 | | HOUSEHOLD DURABLES — 0.2% | |
| Verizon Wireless Capital | | | | Whirlpool Corp., | | |
| LLC, 3.75%, 5/20/11(1)(2) | 700,000 | 722,619 | | 8.60%, 5/1/14(2) | 200,000 | 223,981 |
| | | 3,742,330 | | INSURANCE — 0.8% | | |
| ELECTRIC UTILITIES — 0.7% | | | | Metropolitan Life Global | | |
| Duke Energy Carolinas LLC, | | | | Funding I, 4.625%, | | |
| | | | | 8/19/10(1)(2) | 165,000 | 168,404 |
| 5.625%, 11/30/12(2) | 250,000 | 276,305 | | | | |
| FirstEnergy Corp., | | | | Metropolitan Life Global | | |
| 6.45%, 11/15/11(2) | 7,000 | 7,576 | | Funding I, 2.875%, | | |
| | | | | 9/17/12(1)(2) | 400,000 | 398,721 |
| Progress Energy, Inc., | | | | | | |
| 6.85%, 4/15/12(2) | 500,000 | 544,556 | | Prudential Financial, Inc., | | |
| | | | | 3.625%, 9/17/12(2) | 300,000 | 302,139 |
| Virginia Electric and Power | | | | | | |
| Co., 4.50%, 12/15/10(2) | 85,000 | 87,725 | | Travelers Cos., Inc. (The), | | |
| | | | | 5.375%, 6/15/12(2) | 200,000 | 211,442 |
| | | 916,162 | | | | 1,080,706 |
| ENERGY EQUIPMENT & SERVICES — 0.3% | | | LEISURE EQUIPMENT & PRODUCTS — 0.2% | |
| Weatherford International, | | | | | | |
| Inc., 6.625%, 11/15/11(2) | 400,000 | 427,651 | | Hasbro, Inc., | | |
| | | | | 6.125%, 5/15/14(2) | 200,000 | 217,856 |
| FOOD & STAPLES RETAILING — 1.1% | | | MACHINERY — 0.1% | | |
| CVS Caremark Corp., | | | | | | |
| 5.75%, 8/15/11(2) | 300,000 | 320,924 | | Caterpillar Financial | | |
| | | | | Services Corp., | | |
| Kroger Co. (The), | | | | 5.05%, 12/1/10(2) | 150,000 | 155,371 |
| 6.80%, 4/1/11(2) | 700,000 | 749,953 | | | | |
| Safeway, Inc., | | | | | | |
| 5.80%, 8/15/12(2) | 400,000 | 433,936 | | | | |
| | | 1,504,813 | | | | |
16
| | | | | | |
| Short Duration | | | | | | |
| |
| |
| | Principal | | | | Principal | |
| | Amount | Value | | | Amount | Value |
| MEDIA — 2.1% | | | | Plains All American Pipeline | | |
| Comcast Cable | | | | LP/PAA Finance Corp., | | |
| Communications LLC, | | | | 4.25%, 9/1/12(2) | $ 500,000 | $ 514,476 |
| 6.75%, 1/30/11(2) | $ 540,000 | $ 574,505 | | Sabine Pass LNG LP, | | |
| Gannett Co., Inc., | | | | 7.25%, 11/30/13(2) | 100,000 | 89,750 |
| 8.75%, 11/15/14(1)(3) | 300,000 | 294,750 | | Shell International Finance | | |
| Shaw Communications, Inc., | | | | BV, 1.30%, 9/22/11(2) | 1,000,000 | 1,003,408 |
| 7.25%, 4/6/11(2) | 225,000 | 237,375 | | XTO Energy, Inc., | | |
| Time Warner Cable, Inc., | | | | 5.90%, 8/1/12(2) | 790,000 | 853,893 |
| 5.40%, 7/2/12(2) | 750,000 | 802,026 | | | | 5,379,839 |
| Time Warner, Inc., | | | | PHARMACEUTICALS — 1.8% | | |
| 5.50%, 11/15/11(2) | 900,000 | 957,572 | | AstraZeneca plc, | | |
| | | 2,866,228 | | 5.40%, 9/15/12(2) | 500,000 | 548,459 |
| MULTILINE RETAIL — 0.2% | | | | Merck & Co., Inc., | | |
| Nordstrom, Inc., | | | | 1.875%, 6/30/11(2) | 500,000 | 505,799 |
| 6.75%, 6/1/14(2) | 300,000 | 329,561 | | Pfizer, Inc., | | |
| MULTI-UTILITIES — 0.8% | | | | 4.45%, 3/15/12(2) | 1,000,000 | 1,062,861 |
| Dominion Resources, Inc., | | | | Roche Holdings, Inc., | | |
| 6.25%, 6/30/12(2) | 404,000 | 439,287 | | 5.00%, 3/1/14(1)(2) | 200,000 | 216,516 |
| Pacific Gas & Electric Co., | | | | Wyeth, 6.95%, 3/15/11(2) | 200,000 | 214,958 |
| 4.20%, 3/1/11(2) | 527,000 | 545,783 | | | | 2,548,593 |
| Sempra Energy, | | | | REAL ESTATE INVESTMENT TRUSTS (REITs) — 0.4% |
| 8.90%, 11/15/13(2) | 100,000 | 116,993 | | | | |
| | | | | ProLogis, 5.50%, 4/1/12(2) | 250,000 | 247,166 |
| | | 1,102,063 | | Simon Property Group LP, | | |
| OIL, GAS & CONSUMABLE FUELS — 3.9% | | | 5.60%, 9/1/11(2) | 350,000 | 364,550 |
| Burlington Resources | | | | | | 611,716 |
| Finance Co., 6.68%, | | | | ROAD & RAIL — 0.5% | | |
| 2/15/11(2) | 150,000 | 160,411 | | | | |
| | | | | CSX Corp., | | |
| Cenovus Energy, Inc., | | | | 5.75%, 3/15/13(2) | 400,000 | 426,999 |
| 4.50%, 9/15/14(1)(2) | 200,000 | 204,622 | | | | |
| | | | | Norfolk Southern Corp., | | |
| Devon Financing Corp. ULC, | | | | 6.75%, 2/15/11(2) | 100,000 | 106,732 |
| 6.875%, 9/30/11(2) | 200,000 | 217,729 | | | | |
| | | | | Union Pacific Corp., | | |
| El Paso Corp., | | | | 3.625%, 6/1/10(2) | 200,000 | 203,331 |
| 7.75%, 6/15/10(2) | 150,000 | 151,351 | | | | |
| El Paso Corp., | | | | | | 737,062 |
| 7.875%, 6/15/12(2) | 200,000 | 206,928 | | SOFTWARE — 0.1% | | |
| EnCana Corp., | | | | Intuit, Inc., | | |
| 6.30%, 11/1/11(2) | 325,000 | 352,090 | | 5.75%, 3/15/17(2) | 200,000 | 209,536 |
| Enterprise Products | | | | SPECIALTY RETAIL — 1.0% | | |
| Operating LLC, | | | | GSC Holdings Corp., | | |
| 4.60%, 8/1/12(2) | 600,000 | 622,214 | | 8.00%, 10/1/12(2) | 325,000 | 337,188 |
| Forest Oil Corp., | | | | Home Depot, Inc. (The), | | |
| 8.50%, 2/15/14(1)(2) | 50,000 | 50,625 | | 4.625%, 8/15/10(2) | 150,000 | 154,349 |
| Hess Corp., | | | | Home Depot, Inc. (The), | | |
| 6.65%, 8/15/11(2) | 300,000 | 322,116 | | 5.20%, 3/1/11(2) | 500,000 | 519,602 |
| Kerr-McGee Corp., | | | | Staples, Inc., | | |
| 6.875%, 9/15/11(2) | 100,000 | 107,430 | | 9.75%, 1/15/14(2) | 300,000 | 360,824 |
| Kinder Morgan Energy | | | | | | 1,371,963 |
| Partners LP, 6.75%, | | | | THRIFTS & MORTGAGE FINANCE — 0.2% | |
| 3/15/11(2) | 350,000 | 371,296 | | | | |
| | | | | HSBC Finance Corp., | | |
| Kinder Morgan Finance Co. | | | | 6.375%, 10/15/11(2) | 300,000 | 318,419 |
| ULC, 5.35%, 1/5/11(2) | 150,000 | 151,500 | | | | |
17
| | | | | | |
| Short Duration | | | | | | |
| |
| |
| | Principal | | | | Principal | |
| | Amount | Value | | | Amount | Value |
| TOBACCO — 0.3% | | | | GOVERNMENT-BACKED | | |
| UST, Inc., 6.625%, 7/15/12(2) | $ 400,000 | $ 438,346 | | CORPORATE BONDS(4) — 9.4% | |
| WIRELESS TELECOMMUNICATION SERVICES — 0.6% | | Bank of America Corp., | | |
| | | | | 3.125%, 6/15/12(2) | $ 1,100,000 | $ 1,144,949 |
| American Tower Corp., | | | | | | |
| 7.25%, 5/15/19(1)(2) | 100,000 | 103,250 | | Citibank N.A., | | |
| | | | | 1.25%, 9/22/11(2) | 1,000,000 | 1,000,798 |
| Vodafone Group plc, | | | | | | |
| 5.50%, 6/15/11(2) | 341,000 | 362,402 | | Citigroup Funding, Inc., | | |
| | | | | 1.375%, 5/5/11(2) | 500,000 | 503,485 |
| Vodafone Group plc, | | | | | | |
| 5.00%, 12/16/13(2) | 300,000 | 320,308 | | Citigroup Funding, Inc., | | |
| | | | | 1.25%, 6/3/11 | 1,000,000 | 1,003,677 |
| | | 785,960 | | | | |
| | | | | General Electric Capital | | |
| TOTAL CORPORATE BONDS | | | | Corp., 1.80%, 3/11/11(2) | 500,000 | 506,390 |
| (Cost $43,214,786) | | 44,537,423 | | | | |
| | | | | General Electric Capital | | |
| U.S. Treasury Securities — 29.7% | | | Corp., 2.625%, 12/28/12(2) | 500,000 | 512,831 |
| U.S. Treasury Notes, | | | | GMAC LLC, | | |
| 2.875%, 6/30/10(2) | 2,500,000 | 2,548,340 | | 2.20%, 12/19/12(2) | 1,500,000 | 1,517,466 |
| U.S. Treasury Notes, | | | | Goldman Sachs Group, | | |
| 1.50%, 10/31/10(2) | 1,600,000 | 1,618,501 | | Inc. (The), VRN, 0.71%, | | |
| | | | | 11/9/09(2) | 500,000 | 504,053 |
| U.S. Treasury Notes, | | | | | | |
| 4.50%, 2/28/11(2) | 2,300,000 | 2,426,771 | | Goldman Sachs Group, Inc. | | |
| | | | | (The), 1.625%, 7/15/11(2) | 400,000 | 404,205 |
| U.S. Treasury Notes, | | | | | | |
| 0.875%, 4/30/11(2) | 14,900,000 | 14,947,740 | | Goldman Sachs Group, Inc. | | |
| | | | | (The), 3.25%, 6/15/12(2) | 500,000 | 522,209 |
| U.S. Treasury Notes, | | | | | | |
| 1.125%, 6/30/11(2) | 3,000,000 | 3,018,870 | | HSBC USA, Inc., | | |
| | | | | 3.125%, 12/16/11(2) | 1,000,000 | 1,039,164 |
| U.S. Treasury Notes, | | | | | | |
| 1.00%, 8/31/11(2) | 5,500,000 | 5,512,463 | | JPMorgan Chase & Co., | | |
| | | | | 1.65%, 2/23/11(2) | 700,000 | 707,893 |
| U.S. Treasury Notes, | | | | | | |
| 1.00%, 9/30/11 | 2,000,000 | 2,002,658 | | Morgan Stanley, | | |
| | | | | 2.00%, 9/22/11(2) | 1,000,000 | 1,016,874 |
| U.S. Treasury Notes, | | | | | | |
| 1.75%, 11/15/11(2) | 1,000,000 | 1,015,626 | | Morgan Stanley, | | |
| | | | | 3.25%, 12/1/11(2) | 500,000 | 520,483 |
| U.S. Treasury Notes, | | | | | | |
| 1.125%, 1/15/12(2) | 8,000,000 | 8,004,376 | | State Street Corp., | | |
| | | | | 2.15%, 4/30/12(2) | 500,000 | 508,235 |
| TOTAL U.S. TREASURY SECURITIES | | | | | |
| (Cost $40,860,584) | | 41,095,345 | | US Bancorp, | | |
| | | | | 1.80%, 5/15/12 | 1,000,000 | 1,005,632 |
| U.S. Government Agency | | | Wells Fargo & Co., | | |
| Securities and Equivalents — 21.9% | | 3.00%, 12/9/11(2) | 500,000 | 518,150 |
| FIXED-RATE U.S. GOVERNMENT | | | | | 12,936,494 |
| AGENCY SECURITIES — 12.5% | | | TOTAL U.S. GOVERNMENT AGENCY | |
| FHLB, 1.625%, 7/27/11(2) | 2,000,000 | 2,024,204 | | SECURITIES AND EQUIVALENTS | |
| FHLB, 1.625%, 9/26/12(2) | 1,000,000 | 998,480 | | (Cost $29,876,781) | | 30,309,768 |
| FHLMC, 2.875%, 6/28/10(2) | 1,000,000 | 1,018,675 | | Commercial Mortgage-Backed | |
| FHLMC, 2.125%, 3/23/12(2) | 4,750,000 | 4,842,060 | | Securities(5) — 4.2% | | |
| FHLMC, 1.75%, 6/15/12 | 3,000,000 | 3,018,618 | | Banc of America | | |
| FHLMC, 2.125%, 9/21/12(2) | 1,000,000 | 1,013,765 | | Commercial Mortgage, Inc., | | |
| | | | | Series 2002 PB2, Class A3 | | |
| FNMA, 2.50%, 4/9/10(2) | 1,500,000 | 1,517,395 | | SEQ, 6.09%, 6/11/35(2) | 29,797 | 30,299 |
| FNMA, 2.375%, 5/20/10(2) | 1,400,000 | 1,418,480 | | Banc of America | | |
| FNMA, 1.875%, 4/20/12(2) | 1,500,000 | 1,521,597 | | Commercial Mortgage, Inc., | | |
| | | 17,373,274 | | Series 2004-1, Class A3 | | |
| | | | | SEQ, 4.43%, 11/10/39(2) | 720,000 | 718,240 |
18
| | | | | | |
| Short Duration | | | | | | |
| |
| |
| | Principal | | | | Principal | |
| | Amount | Value | | | Amount | Value |
| Chase Commercial | | | | Credit Suisse First Boston | | |
| Mortgage Securities Corp., | | | | Mortgage Securities Corp., | | |
| Series 2000-2, Class C, VRN, | | | | Series 2003 AR28, Class | | |
| 7.93%, 10/1/09(2) | $ 900,000 | $ 920,173 | | 2A1, VRN, 4.40%, 10/1/09(2) | $ 96,255 | $ 89,744 |
| Chase Manhattan Bank-First | | | | J.P. Morgan Mortgage Trust, | | |
| Union National Bank, Series | | | | Series 2004 A2, Class 1A1, | | |
| 1999-1, Class C, VRN, | | | | VRN, 4.20%, 10/1/09(2) | 58,259 | 53,560 |
| 7.625%, 10/1/09(2) | 600,000 | 604,671 | | J.P. Morgan Mortgage Trust, | | |
| GMAC Commercial | | | | Series 2005 A8, Class 6A2, | | |
| Mortgage Securities, Inc., | | | | VRN, 5.12%, 10/1/09(2) | 375,388 | 337,915 |
| Series 2005 C1, Class A2 | | | | J.P. Morgan Mortgage Trust, | | |
| SEQ, 4.47%, 5/10/43(2) | 975,249 | 981,057 | | Series 2006 A3, Class 2A1 | | |
| Heller Financial Commercial | | | | SEQ, VRN, 5.59%, 10/1/09 | 135,092 | 120,011 |
| Mortgage Asset, Series | | | | Wells Fargo Mortgage | | |
| 2000 PH1, Class D, VRN, | | | | Backed Securities Trust, | | |
| 8.36%, 10/1/09 | 250,000 | 251,922 | | Series 2004 EE, Class 3A1, | | |
| LB-UBS Commercial | | | | VRN, 4.22%, 10/1/09(2) | 130,876 | 127,067 |
| Mortgage Trust, Series | | | | | | 1,426,110 |
| 2003 C3, Class A3 SEQ, | | | | | | |
| 3.85%, 5/15/27(2) | 188,390 | 188,548 | | U.S. GOVERNMENT AGENCY | | |
| | | | | COLLATERALIZED MORTGAGE OBLIGATIONS — 1.7% |
| LB-UBS Commercial | | | | | | |
| Mortgage Trust, Series | | | | Class FHLMC, QC, Series 5.50%, 2430, 2/15/17(2) | 602,240 | 639,450 |
| 2005 C2, Class A2 SEQ, | | | | | | |
| 4.82%, 4/15/30(2) | 599,714 | 606,019 | | FHLMC, Series 2522, Class | | |
| | | | | XA SEQ, 5.00%, 8/15/16(2) | 48,414 | 49,145 |
| LB-UBS Commercial | | | | | | |
| Mortgage Trust, Series | | | | FHLMC, Series 2750, Class | | |
| 2005 C3, Class A3 SEQ, | | | | WD SEQ, 4.50%, 9/15/15(2) | 12,464 | 12,482 |
| 4.65%, 7/15/30(2) | 750,000 | 751,823 | | FHLMC, Series 3101, Class | | |
| Lehman Brothers | | | | PA, 5.50%, 10/15/25(2) | 258,022 | 265,525 |
| Commercial Conduit | | | | FHLMC, Series 3370, Class | | |
| Mortgage Trust, Series | | | | FB SEQ, VRN, 0.49%, | | |
| 1999 C1, Class B, | | | | 10/15/09, resets monthly | | |
| 6.93%, 6/15/31(2) | 123,238 | 123,136 | | off the 1-month LIBOR plus | | |
| Morgan Stanley Capital I, | | | | 0.25% with a cap of 7.00% | 277,101 | 276,118 |
| Series 2004 HQ3, Class A2 | | | | FNMA, Series 2002-74, | | |
| SEQ, 4.05%, 1/13/41(2) | 558,278 | 563,422 | | Class PD, 5.00%, 11/25/15(2) | 87,342 | 87,603 |
| TOTAL COMMERCIAL | | | | FNMA, Series 2003-54, | | |
| MORTGAGE-BACKED SECURITIES | | | Class TC, 4.50%, 5/25/15(2) | 80,077 | 81,171 |
| (Cost $5,501,063) | | 5,739,310 | | FNMA, Series 2005-47, Class | | |
| Collateralized Mortgage | | | AN SEQ, 5.00%, 12/25/16(2) | 89,902 | 92,595 |
| Obligations(5) — 2.7% | | | | FNMA, Series 2006-4, Class | | |
| | | | | A SEQ, 6.00%, 11/25/22(2) | 131,937 | 135,941 |
| PRIVATE SPONSOR COLLATERALIZED | | | FNMA, Series 2006-77, Class | | |
| MORTGAGE OBLIGATIONS — 1.0% | | | PD, 6.50%, 10/25/30(2) | 352,040 | 367,504 |
| Chase Mortgage Finance | | | | GNMA, Series 2003-51, | | |
| Corp., Series 2005 A1, | | | | Class KA, 3.50%, | | |
| Class 2A2 SEQ, VRN, | | | | 10/20/28(2) | 77,745 | 78,095 |
| 5.24%, 10/1/09(2) | 221,156 | 193,337 | | | | |
| | | | | GNMA, Series 2009-61, | | |
| Countrywide Home Loan | | | | Class PA, 5.00%, 2/16/32 | 213,433 | 225,877 |
| Mortgage Pass-Through | | | | | | |
| Trust, Series 2003-37, Class | | | | | | 2,311,506 |
| 2A2, VRN, 3.68%, 10/1/09(2) | 194,295 | 94,660 | | TOTAL COLLATERALIZED | | |
| Countrywide Home Loan | | | | MORTGAGE OBLIGATIONS | | |
| Mortgage Pass-Through | | | | (Cost $3,683,544) | | 3,737,616 |
| Trust, Series 2005-17, Class | | | | | | |
| 1A11, 5.50%, 9/25/35(2) | 443,481 | 409,816 | | | | |
19
| | | | | | |
| Short Duration | | | | | | |
| |
| | Principal | | | | Shares | Value |
| | Amount | Value | | Temporary Cash Investments — 2.4% |
| U.S. Government Agency | | | JPMorgan U.S. Treasury | | |
| Mortgage-Backed Securities(5) — 1.5% | | Plus Money Market | | |
| ADJUSTABLE-RATE U.S. GOVERNMENT | | | Fund Agency Shares | 429,415 | $ 429,415 |
| AGENCY MORTGAGE-BACKED SECURITIES(6) | | | Repurchase Agreement, Bank of America | |
| FNMA, VRN, | | | | Securities, LLC, (collateralized by various | |
| 5.63%, 3/1/12(2) | $ 79,800 | $ 84,152 | | U.S. Treasury obligations, 0.27%, 7/15/10, | |
| | | | | valued at $2,911,328), in a joint trading | |
| FIXED-RATE U.S. GOVERNMENT | | | account at 0.02%, dated 9/30/09, due | |
| AGENCY MORTGAGE-BACKED SECURITIES — 1.5% | | 10/1/09 (Delivery value $2,854,002)(2) | 2,854,000 |
| FHLMC, 5.00%, 10/1/10(2) | 209,233 | 215,494 | | TOTAL TEMPORARY | | |
| FHLMC, 5.50%, 12/1/36(2) | 137,060 | 143,792 | | CASH INVESTMENTS | | |
| FHLMC, 5.50%, 1/1/38(2) | 154,597 | 162,190 | | (Cost $3,283,415) | | 3,283,415 |
| FNMA, 5.00%, 7/1/20(2) | 262,914 | 278,053 | | TOTAL INVESTMENT | | |
| | | | | SECURITIES — 95.6% | | |
| FNMA, 5.00%, 2/1/36(2) | 416,751 | 432,071 | | (Cost $129,751,118) | | 132,153,858 |
| FNMA, 5.50%, 7/1/36(2) | 80,041 | 83,959 | | OTHER ASSETS | | |
| GNMA, 6.00%, 8/20/38 | 684,468 | 725,719 | | AND LIABILITIES — 4.4% | | 6,078,782 |
| | | 2,041,278 | | TOTAL NET ASSETS — 100.0% | $138,232,640 |
| TOTAL U.S. GOVERNMENT AGENCY | | | | | |
| MORTGAGE-BACKED SECURITIES | | | | | |
| (Cost $2,055,484) | | 2,125,430 | | | | |
| Municipal Securities — 0.8% | | | | | |
| California GO, | | | | | | |
| 5.25%, 4/1/14(2) | | | | | | |
| (Cost $1,004,883) | 1,000,000 | 1,049,070 | | | | |
| Asset-Backed Securities(5) — 0.2% | | | | | |
| CNH Equipment Trust, | | | | | | |
| Series 2007 C, Class A3A | | | | | | |
| SEQ, 5.21%, 12/15/11(2) | 180,232 | 181,856 | | | | |
| Detroit Edison Securitization | | | | | | |
| Funding LLC, Series 2001-1, | | | | | | |
| Class A4 SEQ, 6.19%, | | | | | | |
| 3/1/13(2) | 90,153 | 94,625 | | | | |
| TOTAL ASSET-BACKED SECURITIES | | | | | |
| (Cost $270,578) | | 276,481 | | | | |
20
| | | | |
| Short Duration | | | |
| |
| Futures Contracts | | | |
| | | | Underlying Face | |
| | Contracts Purchased | Expiration Date | Amount at Value | Unrealized Gain (Loss) |
| 15 | U.S. Treasury 2-Year Notes | December 2009 | $3,254,531 | $4,185 |
| |
| | | | Underlying Face | |
| | Contracts Sold | Expiration Date | Amount at Value | Unrealized Gain (Loss) |
| 30 | U.S. Treasury 5-Year Notes | December 2009 | $3,482,813 | $ (8,739) |
| 10 | U.S. Treasury 10-Year Notes | December 2009 | 1,183,281 | (9,085) |
| | | | $4,666,094 | $(17,824) |
| | | |
| Swap Agreements | | |
| Notional Amount | Description of Agreement | Premiums Paid (Received) | Value |
| CREDIT DEFAULT — SELL PROTECTION | | |
| $261,000 | Receive quarterly a fixed rate equal to 5.00% | | |
| | multiplied by the notional amount and pay | | |
| | Barclays Bank plc upon each default event of | | |
| | one of the issues of CDX North America High | | |
| | Yield 11 Index, par value of the proportional | | |
| | notional amount. Expires December 2013.* | $(46,675) | $(13,286) |
*The maximum potential amount the fund could be required to deliver as a seller of credit protection if a credit event occurs as defined under the terms of the agreement is the notional amount. The maximum potential amount may be partially offset by any recovery values of the referenced obligations and upfront payments received upon entering into the agreement.
The quoted market prices and resulting market value for credit default swap agreements on credit indices serve as an indicator of the current status of the payment/performance risk and represent the likelihood of an expected liability or profit at the period end. Increasing market values in absolute terms when compared to the notional amount of the credit default swap agreement represent a deterioration of the referenced entity’s credit soundness and an increased likelihood or risk of a credit event occurring as defined in the agreement.
| | | |
| Notes to Schedule of Investments | | (1) | Security was purchased under Rule 144A of the Securities Act of |
| | | | 1933 or is a private placement and, unless registered under the |
| CDX = Credit Derivative Indexes | | | Act or exempted from registration, may only be sold to qualified |
| Equivalent = Security whose principal payments are backed by the full | | | institutional investors. The aggregate value of these securities at |
| faith and credit of the United States | | | the period end was $6,364,567, which represented 4.6% of total |
| FHLB = Federal Home Loan Bank | | | net assets. |
| FHLMC = Federal Home Loan Mortgage Corporation | | (2) | Security, or a portion thereof, has been segregated for when-issued |
| FNMA = Federal National Mortgage Association | | | securities, futures contracts and/or swap agreements. At |
| | | | the period end, the aggregate value of securities pledged |
| GMAC = General Motors Acceptance Corporation | | | was $8,477,000. |
| GNMA = Government National Mortgage Association | | (3) | When-issued security. |
| GO = General Obligation | | (4) | The debt is guaranteed under the Federal Deposit Insurance |
| LB-UBS = Lehman Brothers, Inc. — UBS AG | | | Corporation’s (FDIC) Temporary Liquidity Guarantee Program and |
| LIBOR = London Interbank Offered Rate | | | is backed by the full faith and credit of the United States. The |
| | | | expiration date of the FDIC’s guarantee is the earlier of the maturity |
| resets = The frequency with which a security’s coupon changes, | | | date of the debt or June 30, 2012. |
| based on current market conditions or an underlying index. The more | | | |
| frequently a security resets, the less risk the investor is taking that the | | (5) | Final maturity indicated, unless otherwise noted. |
| coupon will vary significantly from current market rates. | | (6) | Category is less than 0.05% of total net assets. |
| SEQ = Sequential Payer | | | |
| VRN = Variable Rate Note. Interest reset date is indicated. Rate shown | | | |
| is effective at the period end. | | See Notes to Financial Statements. |
21
| | | | | | |
| Core Plus | | | | | | |
| |
| SEPTEMBER 30, 2009 (UNAUDITED) | | | | | |
| |
| | Principal | | | | Principal | |
| | Amount | Value | | | Amount | Value |
| Corporate Bonds — 36.2% | | | Amgen, Inc., | | |
| | | | | 6.40%, 2/1/39(2) | $ 60,000 | $ 69,020 |
| AEROSPACE & DEFENSE — 1.1% | | | | | 113,092 |
| BAE Systems Holdings, Inc., | | | | CAPITAL MARKETS — 2.7% | | |
| 6.375%, 6/1/19(1)(2) | $ 80,000 | $ 88,434 | | | | |
| | | | | Bank of New York Mellon | | |
| Honeywell International, Inc., | | | | Corp. (The), 4.30%, 5/15/14 | 80,000 | 84,840 |
| 5.30%, 3/15/17(2) | 30,000 | 32,458 | | | | |
| Honeywell International, Inc., | | | | Bear Stearns Cos., Inc. | | |
| | | | | (The), 6.40%, 10/2/17(2) | 110,000 | 119,854 |
| 5.30%, 3/1/18(2) | 30,000 | 32,349 | | | | |
| L-3 Communications Corp., | | | | Credit Suisse (New York), | | |
| | | | | 5.00%, 5/15/13(2) | 70,000 | 74,168 |
| 6.125%, 7/15/13(2) | 105,000 | 106,838 | | | | |
| L-3 Communications Corp., | | | | Credit Suisse (New York), | | |
| | | | | 5.50%, 5/1/14(2) | 100,000 | 107,610 |
| 5.20%, 10/15/19(1)(3) | 50,000 | 50,250 | | | | |
| Lockheed Martin Corp., | | | | Credit Suisse (New York), | | |
| | | | | 5.30%, 8/13/19(2) | 100,000 | 102,731 |
| 7.65%, 5/1/16(2) | 50,000 | 60,433 | | | | |
| | | | | Deutsche Bank AG | | |
| Lockheed Martin Corp., | | | | (London), 4.875%, | | |
| 6.15%, 9/1/36(2) | 60,000 | 68,921 | | | | |
| | | | | 5/20/13(2) | 40,000 | 42,656 |
| Northrop Grumman Corp., | | | | Goldman Sachs Group, Inc. | | |
| 3.70%, 8/1/14(2) | 30,000 | 30,570 | | | | |
| | | | | (The), 6.00%, 5/1/14(2) | 50,000 | 54,453 |
| United Technologies Corp., | | | | Goldman Sachs Group, Inc. | | |
| 6.125%, 2/1/19(2) | 80,000 | 91,696 | | | | |
| | | | | (The), 5.125%, 1/15/15(2) | 120,000 | 125,589 |
| United Technologies Corp., | | | | Goldman Sachs Group, Inc. | | |
| 6.05%, 6/1/36(2) | 95,000 | 109,671 | | | | |
| | | | | (The), 6.15%, 4/1/18(2) | 60,000 | 63,219 |
| United Technologies Corp., | | | | Goldman Sachs Group, Inc. | | |
| 6.125%, 7/15/38(2) | 30,000 | 34,686 | | | | |
| | | | | (The), 7.50%, 2/15/19(2) | 190,000 | 217,662 |
| | | 706,306 | | Jefferies Group, Inc., | | |
| AUTO COMPONENTS — 0.1% | | | | 8.50%, 7/15/19(2) | 80,000 | 84,811 |
| Goodyear Tire & Rubber Co. | | | | Merrill Lynch & Co., Inc., | | |
| (The), 9.00%, 7/1/15(2) | 50,000 | 52,125 | | 6.15%, 4/25/13(2) | 60,000 | 63,557 |
| AUTOMOBILES(4) | | | | Morgan Stanley, | | |
| American Honda Finance | | | | 6.00%, 4/28/15(2) | 200,000 | 212,087 |
| Corp., 7.625%, 10/1/18(1)(2) | 30,000 | 34,738 | | Morgan Stanley, | | |
| BEVERAGES — 0.6% | | | | 7.30%, 5/13/19(2) | 200,000 | 220,440 |
| Anheuser-Busch InBev | | | | Morgan Stanley, | | |
| Worldwide, Inc., | | | | 5.625%, 9/23/19(2) | 100,000 | 98,515 |
| 6.875%, 11/15/19(1) | 110,000 | 124,478 | | UBS AG (Stamford Branch), | | |
| Diageo Capital plc, | | | | 5.75%, 4/25/18(2) | 60,000 | 61,079 |
| 5.20%, 1/30/13(2) | 40,000 | 42,913 | | | | 1,733,271 |
| Dr Pepper Snapple Group, | | | | CHEMICALS — 0.5% | | |
| Inc., 6.82%, 5/1/18(2) | 135,000 | 153,720 | | | | |
| | | | | Dow Chemical Co. (The), | | |
| PepsiAmericas, Inc., | | | | 4.85%, 8/15/12(2) | 40,000 | 41,630 |
| 4.375%, 2/15/14(2) | 30,000 | 31,341 | | | | |
| | | | | Dow Chemical Co. (The), | | |
| SABMiller plc, | | | | 8.55%, 5/15/19(2) | 80,000 | 90,083 |
| 6.20%, 7/1/11(1)(2) | 30,000 | 32,008 | | | | |
| | | | | E.I. du Pont de Nemours | | |
| | | 384,460 | | & Co., 5.00%, 1/15/13(2) | 50,000 | 54,207 |
| BIOTECHNOLOGY — 0.2% | | | | Mosaic Co. (The), | | |
| Amgen, Inc., | | | | 7.625%, 12/1/16(1)(2) | 100,000 | 106,733 |
| 5.85%, 6/1/17(2) | 40,000 | 44,072 | | Rohm & Haas Co., | | |
| | | | | 5.60%, 3/15/13(2) | 20,000 | 20,904 |
| | | | | | | 313,557 |
22
| | | | | | |
| Core Plus | | | | | | |
| |
| |
| | Principal | | | | Principal | |
| | Amount | Value | | | Amount | Value |
| COMMERCIAL BANKS — 0.6% | | | CONTAINERS & PACKAGING — 0.3% | |
| BB&T Corp., | | | | Ball Corp., | | |
| 5.70%, 4/30/14(2) | $ 50,000 | $ 54,224 | | 6.875%, 12/15/12(2) | $ 200,000 | $ 202,500 |
| PNC Bank N.A., | | | | DIVERSIFIED CONSUMER SERVICES — 0.1% | |
| 4.875%, 9/21/17(2) | 60,000 | 57,437 | | Board of Trustees of The | | |
| PNC Bank N.A., | | | | Leland Stanford Junior | | |
| 6.00%, 12/7/17(2) | 30,000 | 30,726 | | University (The), 3.625%, | | |
| Wachovia Bank N.A., | | | | 5/1/14(2) | 70,000 | 72,537 |
| 4.80%, 11/1/14(2) | 50,000 | 50,820 | | DIVERSIFIED FINANCIAL SERVICES — 2.1% | |
| Wells Fargo & Co., | | | | Bank of America Corp., | | |
| 4.375%, 1/31/13(2) | 80,000 | 82,700 | | 4.90%, 5/1/13(2) | 120,000 | 123,160 |
| Wells Fargo Bank N.A., | | | | Bank of America Corp., | | |
| 6.45%, 2/1/11(2) | 80,000 | 84,295 | | 6.50%, 8/1/16(2) | 150,000 | 157,963 |
| | | 360,202 | | Bank of America Corp., | | |
| COMMERCIAL SERVICES & SUPPLIES — 0.7% | | | 5.65%, 5/1/18(2) | 50,000 | 49,452 |
| Allied Waste North America, | | | | Bank of America Corp., | | |
| Inc., 6.375%, 4/15/11(2) | 60,000 | 62,622 | | 7.625%, 6/1/19(2) | 50,000 | 56,438 |
| Corrections Corp. of | | | | Bank of America N.A., | | |
| America, 7.75%, 6/1/17(2) | 200,000 | 207,500 | | 5.30%, 3/15/17(2) | 100,000 | 96,108 |
| Republic Services, Inc., | | | | Bank of America N.A., | | |
| 5.50%, 9/15/19(1)(2) | 50,000 | 51,622 | | 6.00%, 10/15/36(2) | 75,000 | 74,158 |
| Waste Management, Inc., | | | | BP Capital Markets plc, | | |
| 7.375%, 3/11/19(2) | 100,000 | 116,578 | | 5.25%, 11/7/13(2) | 70,000 | 76,779 |
| | | 438,322 | | Citigroup, Inc., | | |
| | | | | 5.50%, 4/11/13(2) | 170,000 | 174,159 |
| COMMUNICATIONS EQUIPMENT — 0.1% | | | | | |
| | | | | Citigroup, Inc., | | |
| Cisco Systems, Inc., | | | | 5.50%, 10/15/14(2) | 30,000 | 30,002 |
| 4.95%, 2/15/19(2) | 50,000 | 52,658 | | | | |
| | | | | Citigroup, Inc., | | |
| COMPUTERS & PERIPHERALS — 0.2% | | | 6.125%, 5/15/18(2) | 70,000 | 69,039 |
| Dell, Inc., 5.875%, 6/15/19 | 150,000 | 161,107 | | Citigroup, Inc., | | |
| CONSUMER FINANCE — 1.3% | | | 8.50%, 5/22/19(2) | 40,000 | 45,229 |
| American Express Co., | | | | Citigroup, Inc., | | |
| 7.25%, 5/20/14(2) | 70,000 | 78,759 | | 8.125%, 7/15/39(2) | 50,000 | 56,138 |
| Capital One Bank USA N.A., | | | | JPMorgan Chase & Co., | | |
| 8.80%, 7/15/19(2) | 250,000 | 289,479 | | 4.65%, 6/1/14(2) | 110,000 | 114,896 |
| Ford Motor Credit Co. LLC, | | | | JPMorgan Chase & Co., | | |
| 7.50%, 8/1/12 | 70,000 | 67,265 | | 6.00%, 1/15/18(2) | 190,000 | 204,266 |
| General Electric Capital | | | | | | 1,327,787 |
| Corp., 5.90%, 5/13/14(2) | 100,000 | 107,381 | | | | |
| | | | | DIVERSIFIED TELECOMMUNICATION | |
| General Electric Capital | | | | SERVICES — 3.0% | | |
| Corp., 5.625%, 9/15/17(2) | 50,000 | 50,709 | | | | |
| | | | | Alltel Corp., | | |
| General Electric Capital | | | | 7.875%, 7/1/32(2) | 30,000 | 37,047 |
| Corp., 6.00%, 8/7/19(2) | 100,000 | 101,631 | | | | |
| | | | | AT&T, Inc., 6.25%, 3/15/11(2) | 60,000 | 63,991 |
| General Electric Capital | | | | AT&T, Inc., | | |
| Corp., 6.875%, 1/10/39(2) | 40,000 | 42,028 | | | | |
| | | | | 6.70%, 11/15/13(2) | 60,000 | 68,052 |
| John Deere Capital Corp., | | | | AT&T, Inc., 5.10%, 9/15/14(2) | 30,000 | 32,388 |
| 4.50%, 4/3/13(2) | 20,000 | 21,169 | | | | |
| John Deere Capital Corp., | | | | AT&T, Inc., | | |
| | | | | 6.80%, 5/15/36(2) | 70,000 | 78,176 |
| 4.90%, 9/9/13(2) | 50,000 | 53,532 | | | | |
| | | 811,953 | | AT&T, Inc., | | |
| | | | | 6.55%, 2/15/39(2) | 110,000 | 120,368 |
23
| | | | | | |
| Core Plus | | | | | | |
| |
| |
| | Principal | | | | Principal | |
| | Amount | Value | | | Amount | Value |
| Cellco Partnership/Verizon | | | | Exelon Generation Co. LLC, | | |
| Wireless Capital LLC, | | | | 5.20%, 10/1/19(2) | $ 60,000 | $ 60,793 |
| 5.55%, 2/1/14(1)(2) | $ 70,000 | $ 75,735 | | FirstEnergy Corp., | | |
| Cellco Partnership/Verizon | | | | 6.45%, 11/15/11(2) | 5,000 | 5,412 |
| Wireless Capital LLC, | | | | FirstEnergy Solutions Corp., | | |
| 8.50%, 11/15/18(1)(2) | 110,000 | 137,615 | | 6.05%, 8/15/21(1)(2) | 80,000 | 82,872 |
| CenturyTel, Inc., | | | | Florida Power Corp., | | |
| 7.60%, 9/15/39(2) | 60,000 | 59,982 | | 5.65%, 6/15/18(2) | 30,000 | 33,070 |
| Deutsche Telekom | | | | Florida Power Corp., | | |
| International Finance BV, | | | | 6.35%, 9/15/37(2) | 20,000 | 23,561 |
| 6.75%, 8/20/18(2) | 100,000 | 112,184 | | | | |
| | | | | Niagara Mohawk Power | | |
| Deutsche Telekom | | | | Corp., 4.88%, 8/15/19(1) | 40,000 | 40,817 |
| International Finance BV, | | | | | | |
| 8.75%, 6/15/30(2) | 40,000 | 51,952 | | Pacificorp, | | |
| | | | | 6.00%, 1/15/39(2) | 90,000 | 101,169 |
| Embarq Corp., | | | | | | |
| 7.08%, 6/1/16(2) | 50,000 | 54,412 | | Progress Energy, Inc., | | |
| | | | | 6.05%, 3/15/14(2) | 50,000 | 54,902 |
| France Telecom SA, | | | | | | |
| 4.375%, 7/8/14(2) | 80,000 | 83,971 | | Southern California Edison | | |
| | | | | Co., 5.625%, 2/1/36(2) | 70,000 | 76,122 |
| Koninklijke KPN NV, | | | | | | |
| 8.375%, 10/1/30(2) | 30,000 | 38,775 | | | | 763,738 |
| Qwest Corp., | | | | ELECTRICAL EQUIPMENT — 0.1% | |
| 7.875%, 9/1/11(2) | 50,000 | 51,812 | | Roper Industries, Inc., | | |
| | | | | 6.25%, 9/1/19(2) | 50,000 | 51,999 |
| Qwest Corp., | | | | | | |
| 7.50%, 10/1/14(2) | 80,000 | 81,200 | | ELECTRONIC EQUIPMENT, | | |
| Sprint Capital Corp., | | | | INSTRUMENTS & COMPONENTS — 0.4% | |
| 7.625%, 1/30/11(2) | 100,000 | 102,875 | | Corning, Inc., | | |
| | | | | 6.625%, 5/15/19(2) | 130,000 | 142,473 |
| Sprint Capital Corp., | | | | | | |
| 6.90%, 5/1/19(2) | 100,000 | 90,000 | | Jabil Circuit, Inc., | | |
| | | | | 7.75%, 7/15/16(2) | 100,000 | 102,000 |
| Telecom Italia Capital SA, | | | | | | |
| 6.175%, 6/18/14(2) | 120,000 | 130,330 | | | | 244,473 |
| Telefonica Emisiones SAU, | | | | ENERGY EQUIPMENT & SERVICES — 0.4% | |
| 5.98%, 6/20/11(2) | 100,000 | 106,613 | | Pride International, Inc., | | |
| Telefonica Emisiones SAU, | | | | 8.50%, 6/15/19(2) | 120,000 | 132,600 |
| 5.88%, 7/15/19(2) | 80,000 | 87,111 | | Weatherford International | | |
| Telefonica Emisiones SAU, | | | | Ltd., 9.625%, 3/1/19(2) | 120,000 | 150,466 |
| 7.05%, 6/20/36(2) | 40,000 | 47,504 | | | | 283,066 |
| Verizon Communications, | | | | FOOD & STAPLES RETAILING — 1.2% | |
| Inc., 8.75%, 11/1/18(2) | 110,000 | 137,680 | | CVS Caremark Corp., | | |
| Verizon Communications, | | | | 6.60%, 3/15/19(2) | 130,000 | 146,807 |
| Inc., 6.40%, 2/15/38(2) | 40,000 | 42,896 | | Delhaize Group SA, | | |
| | | 1,892,669 | | 5.875%, 2/1/14(2) | 80,000 | 86,273 |
| ELECTRIC UTILITIES — 1.2% | | | | Kroger Co. (The), | | |
| Carolina Power & Light Co., | | | | 6.80%, 4/1/11(2) | 57,000 | 61,068 |
| 5.30%, 1/15/19(2) | 30,000 | 32,560 | | Kroger Co. (The), | | |
| Cleveland Electric | | | | 5.00%, 4/15/13(2) | 70,000 | 73,926 |
| Illuminating Co. (The), | | | | Safeway, Inc., | | |
| 5.70%, 4/1/17(2) | 60,000 | 63,247 | | 5.80%, 8/15/12(2) | 100,000 | 108,484 |
| Duke Energy Carolinas LLC, | | | | SYSCO Corp., | | |
| 7.00%, 11/15/18(2) | 60,000 | 71,952 | | 4.20%, 2/12/13(2) | 50,000 | 52,080 |
| Duke Energy Corp., | | | | Wal-Mart Stores, Inc., | | |
| 6.30%, 2/1/14(2) | 60,000 | 66,453 | | 3.00%, 2/3/14(2) | 80,000 | 81,335 |
| Duke Energy Corp., | | | | Wal-Mart Stores, Inc., | | |
| 3.95%, 9/15/14(2) | 50,000 | 50,808 | | 5.875%, 4/5/27(2) | 95,000 | 102,938 |
24
| | | | | | |
| Core Plus | | | | | | |
| |
| | Principal | | | | Principal | |
| | Amount | Value | | | Amount | Value |
| Wal-Mart Stores, Inc., | | | | HOTELS, RESTAURANTS & LEISURE — 0.5% | |
| 6.50%, 8/15/37(2) | $ 30,000 | $ 35,135 | | McDonald’s Corp., | | |
| Wal-Mart Stores, Inc., | | | | 5.35%, 3/1/18(2) | $ 60,000 | $ 65,575 |
| 6.20%, 4/15/38(2) | 30,000 | 34,263 | | McDonald’s Corp., | | |
| | | 782,309 | | 6.30%, 10/15/37(2) | 20,000 | 23,508 |
| FOOD PRODUCTS — 0.9% | | | | Yum! Brands, Inc., | | |
| General Mills, Inc., | | | | 8.875%, 4/15/11(2) | 50,000 | 54,739 |
| 5.65%, 9/10/12(2) | 60,000 | 65,542 | | Yum! Brands, Inc., | | |
| General Mills, Inc., | | | | 6.25%, 3/15/18(2) | 70,000 | 75,540 |
| 5.25%, 8/15/13(2) | 60,000 | 65,357 | | Yum! Brands, Inc., | | |
| General Mills, Inc., | | | | 5.30%, 9/15/19(2) | 50,000 | 50,321 |
| 5.65%, 2/15/19(2) | 50,000 | 54,251 | | Yum! Brands, Inc., | | |
| Kellogg Co., | | | | 6.875%, 11/15/37(2) | 25,000 | 27,787 |
| 4.45%, 5/30/16(2) | 70,000 | 73,345 | | | | 297,470 |
| Kraft Foods, Inc., | | | | HOUSEHOLD DURABLES — 0.1% | |
| 6.00%, 2/11/13(2) | 40,000 | 42,950 | | Toll Brothers Finance Corp., | | |
| Kraft Foods, Inc., | | | | 6.75%, 11/1/19(2) | 60,000 | 59,924 |
| 6.75%, 2/19/14(2) | 10,000 | 11,171 | | HOUSEHOLD PRODUCTS — 0.1% | |
| Kraft Foods, Inc., | | | | Kimberly-Clark Corp., | | |
| 6.125%, 2/1/18(2) | 60,000 | 63,685 | | 6.125%, 8/1/17(2) | 20,000 | 22,814 |
| Ralcorp Holdings, Inc., | | | | Kimberly-Clark Corp., | | |
| 6.625%, 8/15/39(1)(2) | 60,000 | 63,401 | | 7.50%, 11/1/18(2) | 40,000 | 49,888 |
| Smithfield Foods, Inc., | | | | | | 72,702 |
| 10.00%, 7/15/14(1)(2) | 150,000 | 158,250 | | | | |
| | | | | INDUSTRIAL CONGLOMERATES — 0.7% | |
| | | 597,952 | | General Electric Co., | | |
| HEALTH CARE EQUIPMENT & SUPPLIES — 0.3% | | 5.00%, 2/1/13(2) | 250,000 | 264,008 |
| Baxter International, Inc., | | | | General Electric Co., | | |
| 4.00%, 3/1/14(2) | 50,000 | 52,185 | | 5.25%, 12/6/17(2) | 70,000 | 71,956 |
| Baxter International, Inc., | | | | Hutchison Whampoa | | |
| 5.90%, 9/1/16(2) | 50,000 | 56,294 | | International 09/16 Ltd., | | |
| Baxter International, Inc., | | | | 4.625%, 9/11/15(1)(2) | 100,000 | 99,536 |
| 5.375%, 6/1/18(2) | 30,000 | 32,568 | | | | 435,500 |
| Baxter International, Inc., | | | | INSURANCE — 0.9% | | |
| 6.25%, 12/1/37(2) | 20,000 | 23,332 | | | | |
| | | | | Allstate Corp. (The), | | |
| St. Jude Medical, Inc., | | | | 7.45%, 5/16/19 | 70,000 | 83,581 |
| 4.875%, 7/15/19(2) | 60,000 | 61,929 | | | | |
| | | | | Berkshire Hathaway Finance | | |
| | | 226,308 | | Corp., 5.00%, 8/15/13(2) | 30,000 | 32,624 |
| HEALTH CARE PROVIDERS & SERVICES — 0.6% | | International Lease Finance | | |
| Express Scripts, Inc., | | | | Corp., 5.30%, 5/1/12(2) | 50,000 | 42,050 |
| 5.25%, 6/15/12(2) | 50,000 | 53,116 | | MetLife Global Funding I, | | |
| Express Scripts, Inc., | | | | 5.125%, 4/10/13(1)(2) | 70,000 | 72,659 |
| 7.25%, 6/15/19(2) | 50,000 | 58,828 | | MetLife, Inc., | | |
| HCA, Inc., 7.875%, | | | | 6.75%, 6/1/16(2) | 100,000 | 111,793 |
| 2/15/20(1)(2) | 70,000 | 70,437 | | New York Life Global | | |
| Medco Health Solutions, | | | | Funding, 4.65%, 5/9/13(1)(2) | 50,000 | 52,698 |
| Inc., 6.125%, 3/15/13(2) | 150,000 | 162,587 | | Prudential Financial, Inc., | | |
| Medco Health Solutions, | | | | 7.375%, 6/15/19(2) | 70,000 | 78,259 |
| Inc., 7.25%, 8/15/13(2) | 50,000 | 56,016 | | Travelers Cos., Inc. (The), | | |
| | | 400,984 | | 5.90%, 6/2/19(2) | 80,000 | 89,811 |
| | | | | | | 563,475 |
25
| | | | | | |
| Core Plus | | | | | | |
| |
| |
| | Principal | | | | Principal | |
| | Amount | Value | | | Amount | Value |
| IT SERVICES — 0.2% | | | | Time Warner, Inc., | | |
| International Business | | | | 7.625%, 4/15/31(2) | $ 30,000 | $ 33,723 |
| Machines Corp., | | | | Time Warner, Inc., | | |
| 5.70%, 9/14/17(2) | $ 100,000 | $ 110,389 | | 7.70%, 5/1/32(2) | 60,000 | 68,055 |
| LEISURE EQUIPMENT & PRODUCTS — 0.2% | | | Viacom, Inc., | | |
| Hasbro, Inc., | | | | 6.25%, 4/30/16(2) | 140,000 | 151,235 |
| 6.125%, 5/15/14(2) | 100,000 | 108,928 | | Viacom, Inc., | | |
| MACHINERY — 0.2% | | | | 5.625%, 9/15/19(2) | 50,000 | 50,932 |
| Caterpillar Financial | | | | Virgin Media Finance plc, | | |
| Services Corp., | | | | 9.50%, 8/15/16(2) | 100,000 | 105,750 |
| 4.85%, 12/7/12(2) | 20,000 | 21,253 | | | | 1,933,302 |
| Caterpillar Financial | | | | METALS & MINING — 1.5% | | |
| Services Corp., | | | | AK Steel Corp., | | |
| 5.45%, 4/15/18(2) | 70,000 | 72,836 | | 7.75%, 6/15/12(2) | 50,000 | 50,438 |
| SPX Corp., 7.625%, | | | | Anglo American Capital plc, | | |
| 12/15/14(2) | 50,000 | 50,625 | | 9.375%, 4/8/19(1)(2) | 100,000 | 121,701 |
| | | 144,714 | | ArcelorMittal, | | |
| MEDIA — 3.0% | | | | 6.125%, 6/1/18(2) | 80,000 | 78,964 |
| British Sky Broadcasting | | | | Barrick Gold Corp., | | |
| Group plc, 9.50%, | | | | 6.95%, 4/1/19 | 50,000 | 58,658 |
| 11/15/18(1)(2) | 90,000 | 115,370 | | BHP Billiton Finance USA | | |
| Comcast Corp., | | | | Ltd., 6.50%, 4/1/19(2) | 40,000 | 46,492 |
| 5.90%, 3/15/16(2) | 100,000 | 107,638 | | Freeport-McMoRan Copper | | |
| Comcast Corp., | | | | & Gold, Inc., 8.25%, | | |
| 6.40%, 5/15/38(2) | 30,000 | 31,748 | | 4/1/15(2) | 50,000 | 53,246 |
| Comcast Corp., | | | | Newmont Mining Corp., | | |
| 6.55%, 7/1/39(2) | 70,000 | 75,078 | | 5.125%, 10/1/19(2) | 100,000 | 100,149 |
| DirecTV Holdings LLC / | | | | Rio Tinto Finance USA Ltd., | | |
| DirecTV Financing Co., Inc., | | | | 5.875%, 7/15/13(2) | 80,000 | 86,282 |
| 4.75%, 10/1/14(1)(2) | 100,000 | 100,250 | | Rio Tinto Finance USA Ltd., | | |
| Gannett Co., Inc., | | | | 9.00%, 5/1/19(2) | 50,000 | 61,499 |
| 8.75%, 11/15/14(1)(3) | 200,000 | 196,500 | | Teck Resources Ltd., | | |
| Interpublic Group | | | | 10.75%, 5/15/19(2) | 200,000 | 233,500 |
| of Cos., Inc. (The), | | | | Vale Overseas Ltd., | | |
| 10.00%, 7/15/17(1)(2) | 150,000 | 162,750 | | 5.625%, 9/15/19(2) | 50,000 | 51,124 |
| News America, Inc., | | | | | | 942,053 |
| 6.90%, 8/15/39(1)(2) | 70,000 | 74,765 | | | | |
| | | | | MULTILINE RETAIL(4) | | |
| Omnicom Group, Inc., | | | | | | |
| 6.25%, 7/15/19(2) | 60,000 | 64,845 | | Macy’s Retail Holdings, Inc., | | |
| | | | | 5.35%, 3/15/12(2) | 20,000 | 19,570 |
| Pearson Dollar Finance Two | | | | | | |
| plc, 6.25%, 5/6/18(1)(2) | 100,000 | 105,843 | | MULTI-UTILITIES — 1.1% | | |
| Rogers Cable, Inc., | | | | CenterPoint Energy | | |
| 6.25%, 6/15/13(2) | 70,000 | 75,754 | | Resources Corp., | | |
| | | | | 6.125%, 11/1/17(2) | 20,000 | 21,031 |
| Time Warner Cable, Inc., | | | | | | |
| 5.40%, 7/2/12(2) | 100,000 | 106,937 | | CenterPoint Energy | | |
| | | | | Resources Corp., | | |
| Time Warner Cable, Inc., | | | | 6.25%, 2/1/37(2) | 40,000 | 38,616 |
| 6.75%, 7/1/18(2) | 130,000 | 143,897 | | | | |
| | | | | Dominion Resources, Inc., | | |
| Time Warner, Inc., | | | | 6.40%, 6/15/18(2) | 60,000 | 67,297 |
| 5.50%, 11/15/11(2) | 80,000 | 85,118 | | | | |
| | | | | Georgia Power Co., | | |
| Time Warner, Inc., | | | | 6.00%, 11/1/13(2) | 60,000 | 67,241 |
| 6.875%, 5/1/12(2) | 70,000 | 77,114 | | | | |
| | | | | NSTAR Electric Co., | | |
| | | | | 5.625%, 11/15/17(2) | 60,000 | 65,694 |
26
| | | | | | |
| Core Plus | | | | | | |
| |
| |
| | Principal | | | | Principal | |
| | Amount | Value | | | Amount | Value |
| Pacific Gas & Electric Co., | | | | Kinder Morgan Energy | | |
| 4.20%, 3/1/11(2) | $ 50,000 | $ 51,782 | | Partners LP, 6.50%, | | |
| Pacific Gas & Electric Co., | | | | 9/1/39(2) | $ 50,000 | $ 51,032 |
| 5.80%, 3/1/37(2) | 20,000 | 21,735 | | Kinder Morgan Finance Co. | | |
| Pacific Gas & Electric Co., | | | | ULC, 5.35%, 1/5/11(2) | 50,000 | 50,500 |
| 6.35%, 2/15/38(2) | 20,000 | 23,384 | | Magellan Midstream | | |
| PG&E Corp., | | | | Partners LP, 6.55%, | | |
| 5.75%, 4/1/14(2) | 90,000 | 98,384 | | 7/15/19(2) | 70,000 | 77,928 |
| Public Service Co. of | | | | Marathon Oil Corp., | | |
| Colorado, 5.80%, 8/1/18(2) | 30,000 | 33,553 | | 7.50%, 2/15/19(2) | 50,000 | 57,771 |
| Sempra Energy, | | | | Nexen, Inc., | | |
| 8.90%, 11/15/13(2) | 100,000 | 116,993 | | 5.65%, 5/15/17(2) | 50,000 | 50,058 |
| Sempra Energy, | | | | Nexen, Inc., | | |
| 6.50%, 6/1/16(2) | 30,000 | 33,216 | | 6.20%, 7/30/19(2) | 60,000 | 62,363 |
| Sempra Energy, | | | | Nexen, Inc., | | |
| 9.80%, 2/15/19(2) | 30,000 | 38,495 | | 6.40%, 5/15/37(2) | 70,000 | 68,382 |
| | | 677,421 | | Plains All American Pipeline | | |
| | | | | LP, 8.75%, 5/1/19(2) | 140,000 | 168,341 |
| OIL, GAS & CONSUMABLE FUELS — 3.8% | | | | | |
| | | | | Sabine Pass LNG LP, | | |
| Anadarko Petroleum Corp., | | | | 7.25%, 11/30/13(2) | 100,000 | 89,750 |
| 5.95%, 9/15/16(2) | 100,000 | 106,165 | | | | |
| | | | | Shell International Finance | | |
| Anadarko Petroleum Corp., | | | | BV, 4.30%, 9/22/19(2) | 100,000 | 100,725 |
| 6.95%, 6/15/19(2) | 50,000 | 55,844 | | | | |
| | | | | Shell International Finance | | |
| Anadarko Petroleum Corp., | | | | BV, 6.375%, 12/15/38(2) | 30,000 | 35,763 |
| 6.45%, 9/15/36(2) | 90,000 | 93,225 | | | | |
| | | | | Talisman Energy, Inc., | | |
| Cenovus Energy, Inc., | | | | 7.75%, 6/1/19(2) | 70,000 | 82,475 |
| 4.50%, 9/15/14(1)(2) | 50,000 | 51,156 | | | | |
| | | | | Williams Cos., Inc. (The), | | |
| ConocoPhillips, | | | | 8.75%, 1/15/20(2) | 60,000 | 69,119 |
| 6.50%, 2/1/39(2) | 80,000 | 92,545 | | | | |
| | | | | XTO Energy, Inc., | | |
| El Paso Corp., | | | | 5.90%, 8/1/12(2) | 90,000 | 97,279 |
| 7.75%, 6/15/10(2) | 50,000 | 50,450 | | | | |
| | | | | XTO Energy, Inc., | | |
| El Paso Corp., | | | | 6.50%, 12/15/18(2) | 150,000 | 165,885 |
| 7.875%, 6/15/12(2) | 150,000 | 155,196 | | | | |
| El Paso Corp., | | | | | | 2,406,781 |
| 6.875%, 6/15/14(2) | 50,000 | 49,266 | | PAPER & FOREST PRODUCTS — 0.3% | |
| Enbridge Energy Partners | | | | International Paper Co., | | |
| LP, 6.50%, 4/15/18(2) | 50,000 | 53,966 | | 9.375%, 5/15/19(2) | 140,000 | 164,195 |
| Enterprise Products | | | | International Paper Co., | | |
| Operating LLC, | | | | 7.50%, 8/15/21(2) | 60,000 | 63,700 |
| 6.30%, 9/15/17(2) | 140,000 | 151,032 | | | | 227,895 |
| EOG Resources, Inc., | | | | PHARMACEUTICALS — 1.7% | | |
| 5.625%, 6/1/19(2) | 60,000 | 65,827 | | Abbott Laboratories, | | |
| Forest Oil Corp., | | | | 5.875%, 5/15/16(2) | 65,000 | 72,573 |
| 8.50%, 2/15/14(1)(2) | 50,000 | 50,625 | | Abbott Laboratories, | | |
| Kerr-McGee Corp., | | | | 5.60%, 11/30/17(2) | 30,000 | 33,123 |
| 6.95%, 7/1/24(2) | 70,000 | 75,121 | | Abbott Laboratories, | | |
| Kinder Morgan Energy | | | | 6.00%, 4/1/39(2) | 40,000 | 45,627 |
| Partners LP, 5.95%, | | | | AstraZeneca plc, | | |
| 2/15/18(2) | 50,000 | 52,392 | | 5.40%, 9/15/12(2) | 100,000 | 109,692 |
| Kinder Morgan Energy | | | | AstraZeneca plc, | | |
| Partners LP, 6.85%, | | | | 5.90%, 9/15/17(2) | 40,000 | 44,839 |
| 2/15/20(2) | 70,000 | 76,600 | | | | |
| | | | | GlaxoSmithKline Capital, | | |
| | | | | Inc., 4.85%, 5/15/13(2) | 70,000 | 75,291 |
27
| | | | | | |
| Core Plus | | | | | | |
| |
| |
| | Principal | | | | Principal | |
| | Amount | Value | | | Amount | Value |
| GlaxoSmithKline Capital, | | | | Home Depot, Inc. (The), | | |
| Inc., 6.375%, 5/15/38(2) | $ 40,000 | $ 47,324 | | 5.875%, 12/16/36(2) | $ 40,000 | $ 38,938 |
| Merck & Co., Inc., | | | | Staples, Inc., | | |
| 5.85%, 6/30/39(2) | 50,000 | 56,331 | | 9.75%, 1/15/14(2) | 120,000 | 144,330 |
| Pfizer, Inc., | | | | | | 622,079 |
| 6.20%, 3/15/19(2) | 190,000 | 214,546 | | TOBACCO — 0.3% | | |
| Pfizer, Inc., | | | | Altria Group, Inc., | | |
| 7.20%, 3/15/39(2) | 60,000 | 75,779 | | 9.25%, 8/6/19(2) | 150,000 | 183,605 |
| Roche Holdings, Inc., | | | | WIRELESS TELECOMMUNICATION SERVICES — 0.6% |
| 5.00%, 3/1/14(1)(2) | 50,000 | 54,129 | | | | |
| | | | | American Tower Corp., | | |
| Roche Holdings, Inc., | | | | 7.25%, 5/15/19(1)(2) | 200,000 | 206,500 |
| 6.00%, 3/1/19(1)(2) | 80,000 | 89,213 | | | | |
| | | | | Rogers Communications, | | |
| Watson Pharmaceuticals, | | | | Inc., 6.80%, 8/15/18(2) | 50,000 | 56,223 |
| Inc., 5.00%, 8/15/14(2) | 90,000 | 92,396 | | | | |
| | | | | Vodafone Group plc, | | |
| Watson Pharmaceuticals, | | | | 5.00%, 12/16/13(2) | 40,000 | 42,708 |
| Inc., 6.125%, 8/15/19(2) | 40,000 | 42,146 | | | | |
| | | | | Vodafone Group plc, | | |
| Wyeth, 5.95%, 4/1/37(2) | 30,000 | 33,154 | | 5.45%, 6/10/19(2) | 50,000 | 52,174 |
| | | 1,086,163 | | | | 357,605 |
| REAL ESTATE INVESTMENT TRUSTS (REITs) — 0.4% | | TOTAL CORPORATE BONDS | | |
| ProLogis, 7.625%, 8/15/14(2) | 30,000 | 30,702 | | (Cost $21,323,005) | | 23,111,120 |
| |
| ProLogis, 5.625%, | | | | U.S. Government Agency | |
| 11/15/16(2) | 90,000 | 80,909 | | | | |
| | | | | Mortgage-Backed Securities(5) — 29.9% |
| Simon Property Group LP, | | | | | | |
| 6.75%, 5/15/14(2) | 110,000 | 118,137 | | FHLMC, 5.00%, 10/1/10(2) | 523,081 | 538,736 |
| Simon Property Group LP, | | | | FHLMC, 4.50%, 6/1/21(2) | 293,699 | 307,498 |
| 5.75%, 12/1/15(2) | 50,000 | 51,216 | | FHLMC, 5.50%, 1/1/38(2) | 216,436 | 227,066 |
| | | 280,964 | | FHLMC, 5.50%, 4/1/38(2) | 1,236,911 | 1,296,695 |
| ROAD & RAIL — 0.5% | | | | FHLMC, 6.50%, 7/1/47(2) | 16,037 | 17,035 |
| CSX Corp., 7.375%, 2/1/19(2) | 100,000 | 117,883 | | FNMA, 6.00%, | | |
| Norfolk Southern Corp., | | | | settlement date 10/15/09(6) | 1,700,000 | 1,793,235 |
| 5.75%, 4/1/18(2) | 100,000 | 108,959 | | FNMA, 6.50%, | | |
| Norfolk Southern Corp., | | | | settlement date 10/15/09(6) | 657,000 | 701,861 |
| 5.90%, 6/15/19(2) | 30,000 | 33,415 | | | | |
| | | | | FNMA, 5.00%, 7/1/20(2) | 569,635 | 602,434 |
| Union Pacific Corp., | | | | FNMA, 4.50%, 10/1/33 | 2,335,813 | 2,382,286 |
| 5.75%, 11/15/17(2) | 60,000 | 64,425 | | | | |
| | | | | FNMA, 5.00%, 11/1/33(2) | 361,906 | 375,775 |
| | | 324,682 | | | | |
| | | | | FNMA, 5.00%, 8/1/34(2) | 710,622 | 737,875 |
| SEMICONDUCTORS & | | | | | | |
| SEMICONDUCTOR EQUIPMENT — 0.1% | | | FNMA, 5.50%, 8/1/34 | 1,486,244 | 1,562,026 |
| Analog Devices, Inc., | | | | FNMA, 5.00%, 8/1/35(2) | 394,655 | 409,163 |
| 5.00%, 7/1/14(2) | 50,000 | 52,610 | | FNMA, 4.50%, 9/1/35(2) | 407,179 | 414,516 |
| SOFTWARE — 0.3% | | | | FNMA, 5.50%, 7/1/36(2) | 498,651 | 523,064 |
| Intuit, Inc., | | | | FNMA, 5.50%, 12/1/36(2) | 825,285 | 865,690 |
| 5.75%, 3/15/17(2) | 100,000 | 104,768 | | | | |
| | | | | FNMA, 6.50%, 8/1/37(2) | 296,137 | 315,768 |
| Oracle Corp., | | | | | | |
| 6.125%, 7/8/39(2) | 80,000 | 90,407 | | FNMA, 6.00%, 11/1/37 | 1,156,573 | 1,222,606 |
| | | 195,175 | | FNMA, 5.00%, 3/1/38 | 1,989,088 | 2,058,055 |
| SPECIALTY RETAIL — 1.0% | | | | FNMA, 6.50%, 6/1/47(2) | 11,908 | 12,671 |
| GSC Holdings Corp., | | | | FNMA, 6.50%, 8/1/47(2) | 31,930 | 33,976 |
| 8.00%, 10/1/12(2) | 175,000 | 181,562 | | FNMA, 6.50%, 8/1/47(2) | 40,045 | 42,612 |
| Home Depot, Inc. (The), | | | | FNMA, 6.50%, 9/1/47(2) | 4,805 | 5,113 |
| 4.625%, 8/15/10(2) | 250,000 | 257,249 | | | | |
28
| | | | | | |
| Core Plus | | | | | | |
| |
| |
| | Principal | | | | Principal | |
| | Amount | Value | | | Amount | Value |
| FNMA, 6.50%, 9/1/47(2) | $ 34,800 | $ 37,031 | | Collateralized Mortgage | |
| FNMA, 6.50%, 9/1/47(2) | 38,891 | 41,384 | | | | |
| | | | Obligations(5) — 4.0% | | |
| FNMA, 6.50%, 9/1/47(2) | 115,478 | 122,880 | | | | |
| | | | | PRIVATE SPONSOR COLLATERALIZED | |
| GNMA, 6.00%, 9/20/38(2) | 680,234 | 721,230 | | MORTGAGE OBLIGATIONS — 2.4% | |
| GNMA, 5.50%, 12/20/38 | 1,648,559 | 1,735,574 | | Banc of America Alternative | | |
| TOTAL U.S. GOVERNMENT AGENCY | | | Loan Trust, Series | | |
| MORTGAGE-BACKED SECURITIES | | | 2007-2, Class 2A4, | | |
| (Cost $18,581,449) | | 19,103,855 | | 5.75%, 6/25/37(2) | $ 134,060 | $ 111,408 |
| | | | | Chase Mortgage Finance | | |
| U.S. Treasury Securities — 12.1% | | | Corp., Series 2005 A1, | | |
| U.S. Treasury Bonds, | | | | Class 2A2 SEQ, VRN, | | |
| 5.25%, 2/15/29(2) | 500,000 | 580,781 | | 5.24%, 10/1/09(2) | 153,848 | 134,495 |
| U.S. Treasury Bonds, | | | | Countrywide Home Loan | | |
| 3.50%, 2/15/39(2) | 300,000 | 271,969 | | Mortgage Pass-Through | | |
| U.S. Treasury Bonds, | | | | Trust, Series 2003-37, Class | | |
| 4.25%, 5/15/39(2) | 200,000 | 207,031 | | 2A2, VRN, 3.68%, 10/1/09(2) | 359,806 | 175,297 |
| U.S. Treasury Notes, | | | | Countrywide Home Loan | | |
| 1.00%, 8/31/11(2) | 250,000 | 250,567 | | Mortgage Pass-Through | | |
| | | | | Trust, Series 2005-17, Class | | |
| U.S. Treasury Notes, | | | | 1A11, 5.50%, 9/25/35(2) | 210,070 | 194,123 |
| 1.875%, 6/15/12(2) | 2,500,000 | 2,540,430 | | | | |
| | | | | Countrywide Home Loan | | |
| U.S. Treasury Notes, | | | | Mortgage Pass-Through | | |
| 4.25%, 9/30/12(2) | 280,000 | 303,516 | | | | |
| | | | | Trust, Series 2007-16, Class | | |
| U.S. Treasury Notes, | | | | A1, 6.50%, 10/25/37(2) | 146,052 | 119,772 |
| 2.375%, 8/31/14(2) | 3,370,000 | 3,384,481 | | | | |
| | | | | Credit Suisse First Boston | | |
| U.S. Treasury Notes, | | | | Mortgage Securities Corp., | | |
| 4.75%, 8/15/17(2) | 185,000 | 206,261 | | Series 2003 AR28, Class | | |
| TOTAL U.S. TREASURY SECURITIES | | | 2A1, VRN, 4.40%, 10/1/09(2) | 137,508 | 128,205 |
| (Cost $7,633,219) | | 7,745,036 | | J.P. Morgan Mortgage Trust, | | |
| |
| U.S. Government Agency | | | Series 2004 A2, Class 1A1, | | |
| | | | | VRN, 4.20%, 10/1/09(2) | 138,312 | 127,157 |
| Securities and Equivalents — 5.4% | | J.P. Morgan Mortgage Trust, | | |
| FIXED-RATE U.S. GOVERNMENT | | | Series 2005 A4, Class 2A1, | | |
| AGENCY SECURITIES — 3.7% | | | | VRN, 5.06%, 10/1/09(2) | 144,097 | 121,938 |
| FHLMC, 5.00%, 1/30/14(2) | 800,000 | 878,751 | | J.P. Morgan Mortgage Trust, | | |
| FNMA, 4.375%, 7/17/13(2) | 239,000 | 259,276 | | Series 2005 A8, Class 6A2, | | |
| | | | | VRN, 5.12%, 10/1/09(2) | 204,015 | 183,650 |
| FNMA, 2.75%, 3/13/14(2) | 875,000 | 889,809 | | | | |
| | | | | J.P. Morgan Mortgage Trust, | | |
| FNMA, 5.00%, 2/13/17(2) | 295,000 | 326,842 | | Series 2006 A3, Class 2A1 | | |
| | | 2,354,678 | | SEQ, VRN, 5.59%, 10/1/09 | 67,546 | 60,006 |
| GOVERNMENT-BACKED CORPORATE BONDS(7) — 1.7% | | Wells Fargo Mortgage | | |
| | | | | Backed Securities Trust, | | |
| Bank of America Corp., | | | | Series 2006-AR10, Class 5A5 | | |
| 3.125%, 6/15/12(2) | 400,000 | 416,345 | | | | |
| | | | | SEQ, VRN, 5.59%, 10/1/09(2) | 200,000 | 137,787 |
| General Electric Capital | | | | Wells Fargo Mortgage | | |
| Corp., 2.20%, 6/8/12(2) | 400,000 | 406,486 | | | | |
| | | | | Backed Securities Trust, | | |
| Morgan Stanley, | | | | Series 2006-AR15, Class A1, | | |
| 2.00%, 9/22/11(2) | 250,000 | 254,219 | | VRN, 5.66%, 10/1/09 | 86,283 | 67,047 |
| | | 1,077,050 | | | | 1,560,885 |
| TOTAL U.S. GOVERNMENT AGENCY | | | | | |
| SECURITIES AND EQUIVALENTS | | | | | |
| (Cost $3,304,604) | | 3,431,728 | | | | |
29
| | | | | | |
| Core Plus | | | | | | |
| |
| |
| | Principal | | | | Principal | |
| | Amount | Value | | | Amount | Value |
| U.S. GOVERNMENT AGENCY | | | | LB-UBS Commercial | | |
| COLLATERALIZED MORTGAGE OBLIGATIONS — 1.6% | | Mortgage Trust, Series | | |
| FHLMC, Series 2522, Class | | | | 2005 C3, Class A3 SEQ, | | |
| XA SEQ, 5.00%, 8/15/16(2) | $ 121,036 | $ 122,863 | | 4.65%, 7/15/30(2) | $ 680,000 | $ 681,652 |
| FHLMC, Series 3203, Class | | | | Lehman Brothers | | |
| VN SEQ, 5.00%, 6/15/22(2) | 200,000 | 212,078 | | Commercial Conduit | | |
| | | | | Mortgage Trust, Series | | |
| FNMA, Series 2003-10, | | | | 1999 C1, Class B, | | |
| Class HW SEQ, | | | | 6.93%, 6/15/31(2) | 68,429 | 68,373 |
| 5.00%, 11/25/16(2) | 275,003 | 282,601 | | | | |
| | | | | Morgan Stanley Capital I, | | |
| FNMA, Series 2003-52, | | | | Series 2004 HQ3, Class | | |
| Class KF SEQ, VRN, 0.65%, | | | | A2 SEQ, 4.05%, 1/13/41(2) | 279,139 | 281,711 |
| 10/25/09, resets monthly | | | | | | |
| off the 1-month LIBOR | | | | TOTAL COMMERCIAL | | |
| plus 0.40% with a cap | | | | MORTGAGE-BACKED SECURITIES | |
| of 7.50%(2) | 65,699 | 65,047 | | (Cost $2,325,907) | | 2,394,125 |
| |
| FNMA, Series 2003-54, | | | | Municipal Securities — 1.9% | |
| Class TC, 4.50%, 5/25/15(2) | 80,077 | 81,171 | | | | |
| | | | | California Educational | | |
| FNMA, Series 2005-47, Class | | | | Facilities Auth. Rev., | | |
| AN SEQ, 5.00%, 12/25/16(2) | 224,754 | 231,486 | | Series 2007 T1, | | |
| | | 995,246 | | (Stanford University), | | |
| TOTAL COLLATERALIZED | | | | 5.00%, 3/15/39(2) | 170,000 | 202,914 |
| MORTGAGE OBLIGATIONS | | | | California GO, (Building | | |
| (Cost $2,672,537) | | 2,556,131 | | Bonds), 7.55%, 4/1/39(2) | 100,000 | 111,991 |
| |
| Commercial Mortgage-Backed | | | Illinois GO, (Taxable | | |
| | | | | Pension), 5.10%, 6/1/33(2) | 150,000 | 141,286 |
| Securities(5) — 3.7% | | | | Metropolitan Water | | |
| Banc of America | | | | Reclamation District | | |
| Commercial Mortgage, Inc., | | | | of Greater Chicago GO, | | |
| Series 2002 PB2, Class A3 | | | | (Building Bonds), | | |
| SEQ, 6.09%, 6/11/35(2) | 29,797 | 30,299 | | 5.72%, 12/1/38(2) | 50,000 | 55,162 |
| Banc of America | | | | Missouri Highways & | | |
| Commercial Mortgage, Inc., | | | | Transportation Commission | | |
| Series 2004-1, Class A3 | | | | Rev., (Building Bonds), | | |
| SEQ, 4.43%, 11/10/39(2) | 330,000 | 329,193 | | 5.45%, 5/1/33(2) | 50,000 | 51,998 |
| Chase Commercial | | | | New Jersey State Turnpike | | |
| Mortgage Securities Corp., | | | | Auth. Rev., Series 2009 F, | | |
| Series 2000-2, Class C, VRN, | | | | (Building Bonds), 7.41%, | | |
| 7.93%, 10/1/09(2) | 525,000 | 536,768 | | 1/1/40(2) | 120,000 | 149,070 |
| Greenwich Capital | | | | New York State Dormitory | | |
| Commercial Funding Corp., | | | | Auth. Rev., (Building Bonds), | | |
| Series 2006 FL4A, Class A1, | | | | 5.63%, 3/15/39(2) | 60,000 | 63,520 |
| VRN, 0.34%, 10/5/09, resets | | | | San Antonio Electric & Gas | | |
| monthly off the 1-month | | | | Rev., (Building Bonds), | | |
| LIBOR plus 0.09% with | | | | 5.99%, 2/1/39(2) | 50,000 | 56,328 |
| no caps(1)(2) | 74,962 | 62,351 | | | | |
| | | | | Texas GO, (Building Bonds), | | |
| Heller Financial Commercial | | | | 5.52%, 4/1/39(2) | 120,000 | 127,782 |
| Mortgage Asset, Series | | | | | | |
| 2000 PH1, Class D, VRN, | | | | University of California Rev., | | |
| 8.36%, 10/1/09 | 100,000 | 100,769 | | (Building Bonds), 5.77%, | | |
| | | | | 5/15/43(2) | 80,000 | 86,438 |
| LB-UBS Commercial | | | | | | |
| Mortgage Trust, Series | | | | Utah GO, Series 2009 D, | | |
| 2005 C2, Class A2 SEQ, | | | | (Building Bonds), 4.55%, | | |
| | | | | 7/1/24(2) | 140,000 | 145,260 |
| 4.82%, 4/15/30(2) | 299,857 | 303,009 | | | | |
| | | | | TOTAL MUNICIPAL SECURITIES | |
| | | | | (Cost $1,086,427) | | 1,191,749 |
30
| | | | | |
| Core Plus | | | | | |
| |
| |
| | Principal | | | | Value |
| | Amount | Value | | Temporary Cash Investments — 8.4% |
| Sovereign Governments | | | Repurchase Agreement, Bank of America | |
| & Agencies — 1.7% | | | | Securities, LLC, (collateralized by various | |
| Brazilian Government | | | | U.S. Treasury obligations, 0.27%, 7/15/10, | |
| International Bond, | | | | valued at $2,247,251), in a joint trading | |
| 5.875%, 1/15/19(2) | $ 200,000 | $ 216,000 | | account at 0.02%, dated 9/30/09, due | |
| | | | | 10/1/09 (Delivery value $2,203,001)(2) | $ 2,203,000 |
| German Federal Republic, | | | | | |
| 3.50%, 7/4/19 | EUR 400,000 | 599,007 | | Repurchase Agreement, Deutsche Bank | |
| | | | | Securities, Inc., (collateralized by various | |
| Poland Government | | | | U.S. Treasury obligations, 3.375%, 6/30/13, | |
| International Bond, | | | | valued at $3,244,626), in a joint trading | |
| 6.375%, 7/15/19(2) | $ 50,000 | 56,438 | | account at 0.03%, dated 9/30/09, due | |
| Province of Ontario Canada, | | | | 10/1/09 (Delivery value $3,181,003)(2) | 3,181,000 |
| 5.45%, 4/27/16(2) | 50,000 | 55,953 | | TOTAL TEMPORARY | |
| United Mexican States, | | | | CASH INVESTMENTS | |
| 5.95%, 3/19/19(2) | 170,000 | 179,350 | | (Cost $5,384,000) | 5,384,000 |
| TOTAL SOVEREIGN | | | | TOTAL INVESTMENT | |
| GOVERNMENTS & AGENCIES | | | SECURITIES — 103.8% | |
| (Cost $1,071,323) | | 1,106,748 | | (Cost $63,676,850) | 66,320,880 |
| |
| Asset-Backed Securities(5) — 0.5% | | | OTHER ASSETS | |
| | | | | AND LIABILITIES — (3.8)% | (2,430,139) |
| CNH Equipment Trust, Series | | | | | |
| 2007 C, Class A3A SEQ, | | | | TOTAL NET ASSETS — 100.0% | $ 63,890,741 |
| 5.21%, 12/15/11(2) | 234,753 | 236,868 | | | |
| SLM Student Loan Trust, | | | | | |
| Series 2007-8, Class A1, | | | | | |
| VRN, 0.73%, 10/26/09, | | | | | |
| resets quarterly off the | | | | | |
| 3-month LIBOR plus 0.23% | | | | | |
| with no caps(2) | 59,515 | 59,520 | | | |
| TOTAL ASSET-BACKED SECURITIES | | | | |
| (Cost $294,379) | | 296,388 | | | |
31
| | | |
| Core Plus | | | |
| |
| Forward Foreign Currency Exchange Contracts | | |
| Contracts to Sell | Settlement Date | Value | Unrealized Gain (Loss) |
| 411,507 EUR for USD | 10/30/09 | $602,179 | $2,718 |
| |
| (Value on Settlement Date $604,897) | | | |
| |
| Swap Agreements | | | |
| Notional Amount Description of Agreement | Premiums Paid (Received) | Value |
| CREDIT DEFAULT — BUY PROTECTION | | |
| $250,000 Pay quarterly a fixed rate equal to 0.12% | — | $6,072 |
| multiplied by the notional amount and receive | | |
| from Barclays Bank plc upon each default event | | |
| of Pfizer, Inc., par value of the proportional | | |
| notional amount of Pfizer, Inc., 4.65%, 3/1/18. | | |
| Expires March 2017. | | |
| CREDIT DEFAULT — SELL PROTECTION | | |
| 609,000 Receive quarterly a fixed rate equal to 5.00% | $(108,909) | (31,001) |
| multiplied by the notional amount and pay | | |
| Barclays Bank plc upon each default event of | | |
| one of the issues of CDX North America High | | |
| Yield 11 Index, par value of the proportional | | |
| notional amount. Expires December 2013.* | | |
| | | $(108,909) | $(24,929) |
| |
| *The maximum potential amount the fund could be required to deliver as a seller of credit protection if a credit event occurs as defined under the |
| terms of the agreement is the notional amount. The maximum potential amount may be partially offset by any recovery values of the referenced |
| obligations and upfront payments received upon entering into the agreement. | | |
| |
| The quoted market prices and resulting market value for credit default swap agreements on credit indices serve as an indicator of the current status |
| of the payment/performance risk and represent the likelihood of an expected liability or profit at the period end. Increasing market values in absolute |
| terms when compared to the notional amount of the credit default swap agreement represent a deterioration of the referenced entity’s credit |
| soundness and an increased likelihood or risk of a credit event occurring as defined in the agreement. | |
| | |
| Notes to Schedule of Investments | | |
| CDX = Credit Derivative Indexes | (1) Security was purchased under Rule 144A of the Securities Act of |
| Equivalent = Security whose principal payments are backed by the full | | 1933 or is a private placement and, unless registered under the |
| faith and credit of the United States | | Act or exempted from registration, may only be sold to qualified |
| | | institutional investors. The aggregate value of these securities at |
| EUR = Euro | | the period end was $2,733,436, which represented 4.3% of total |
| FHLMC = Federal Home Loan Mortgage Corporation | | net assets. |
| FNMA = Federal National Mortgage Association | (2) | Security, or a portion thereof, has been segregated for forward |
| GNMA = Government National Mortgage Association | | commitments, when-issued securities, and/or swap agreements. |
| GO = General Obligation | | At the period end, the aggregate value of securities pledged |
| | | was $3,357,000. |
| LB-UBS = Lehman Brothers, Inc. — UBS AG | (3) | When-issued security. |
| LIBOR = London Interbank Offered Rate | (4) | Industry is less than 0.05% of total net assets. |
| resets = The frequency with which a security’s coupon changes, | | |
| based on current market conditions or an underlying index. The more | (5) | Final maturity indicated, unless otherwise noted. |
| frequently a security resets, the less risk the investor is taking that the | (6) | Forward commitment. |
| coupon will vary significantly from current market rates. | (7) | The debt is guaranteed under the Federal Deposit Insurance |
| SEQ = Sequential Payer | | Corporation’s (FDIC) Temporary Liquidity Guarantee Program and |
| USD = United States Dollar | | is backed by the full faith and credit of the United States. The |
| | | expiration date of the FDIC’s guarantee is the earlier of the maturity |
| VRN = Variable Rate Note. Interest reset date is indicated. Rate shown | | date of the debt or June 30, 2012. |
| is effective at the period end. | | |
| |
| |
| | See Notes to Financial Statements. |
32
|
| Statement of Assets and Liabilities |
| | |
| SEPTEMBER 30, 2009 (UNAUDITED) | | |
| | Short Duration | Core Plus |
| Assets | | |
| Investment securities, at value (cost of $129,751,118 and $63,676,850, respectively) | $132,153,858 | $66,320,880 |
| Cash | — | 303 |
| Receivable for investments sold | — | 59,975 |
| Receivable for capital shares sold | 6,084,362 | 76,110 |
| Receivable for forward foreign currency exchange contracts | — | 2,718 |
| Receivable for swap agreements, at value | — | 6,072 |
| Interest receivable | 902,264 | 533,838 |
| | 139,140,484 | 66,999,896 |
| |
| Liabilities | | |
| Payable for investments purchased | 504,533 | 2,958,060 |
| Payable for capital shares redeemed | 266,754 | 44,855 |
| Payable for variation margin on futures contracts | 1,719 | — |
| Payable for swap agreements, at value (including premiums | | |
| paid (received) of $(46,675) and $(108,909), respectively) | 13,286 | 31,001 |
| Accrued management fees | 63,236 | 33,746 |
| Distribution fees payable | 10,219 | 6,298 |
| Service fees (and distribution fees — A Class and R Class) payable | 18,829 | 9,812 |
| Dividends payable | 29,268 | 25,383 |
| | 907,844 | 3,109,155 |
| |
| Net Assets | $138,232,640 | $63,890,741 |
| |
| |
| See Notes to Financial Statements. | | |
33
| | |
| SEPTEMBER 30, 2009 (UNAUDITED) | | |
| | Short Duration | Core Plus |
| Net Assets Consist of: | | |
| Capital paid in | $135,005,857 | $60,861,033 |
| Accumulated net investment loss | (22,415) | (60,642) |
| Undistributed net realized gain on investment and foreign currency transactions | 826,708 | 359,631 |
| Net unrealized appreciation on investments and translation of assets and liabilities in | | |
| foreign currencies | 2,422,490 | 2,730,719 |
| | $138,232,640 | $63,890,741 |
| | | |
| Investor Class | | |
| Net assets | $41,840,875 | $12,447,628 |
| Shares outstanding | 3,996,915 | 1,177,041 |
| Net asset value per share | $10.47 | $10.58 |
| | | |
| Institutional Class | | |
| Net assets | $431,966 | $4,144,034 |
| Shares outstanding | 41,254 | 391,879 |
| Net asset value per share | $10.47 | $10.57 |
| | | |
| A Class | | |
| Net assets | $77,745,941 | $36,256,553 |
| Shares outstanding | 7,426,947 | 3,428,535 |
| Net asset value per share | $10.47 | $10.57 |
| Maximum offering price (net asset value divided by 0.9775 and 0.9550) | $10.71 | $11.07 |
| | | |
| B Class | | |
| Net assets | $1,226,084 | $1,253,611 |
| Shares outstanding | 117,167 | 118,566 |
| Net asset value per share | $10.46 | $10.57 |
| | | |
| C Class | | |
| Net assets | $16,724,247 | $8,896,819 |
| Shares outstanding | 1,597,204 | 841,410 |
| Net asset value per share | $10.47 | $10.57 |
| | | |
| R Class | | |
| Net assets | $263,527 | $892,096 |
| Shares outstanding | 25,161 | 84,363 |
| Net asset value per share | $10.47 | $10.57 |
| |
| |
| See Notes to Financial Statements. | | |
34
| | |
| FOR THE SIX MONTHS ENDED SEPTEMBER 30, 2009 (UNAUDITED) | | |
| | Short Duration | Core Plus |
| Investment Income (Loss) | | |
| Income: | | |
| Interest (net of foreign taxes withheld of $909 and $646, respectively) | $1,586,864 | $1,342,520 |
| Securities lending, net | — | 345 |
| | 1,586,864 | 1,342,865 |
| | | |
| Expenses: | | |
| Management fees | 326,453 | 190,912 |
| Distribution fees: | | |
| B Class | 4,167 | 7,514 |
| C Class | 47,075 | 35,490 |
| Service fees: | | |
| B Class | 1,389 | 2,505 |
| C Class | 15,692 | 11,830 |
| Distribution and service fees: | | |
| A Class | 84,823 | 38,544 |
| R Class | 306 | 4,478 |
| Trustees’ fees and expenses | 2,226 | 1,281 |
| | 482,131 | 292,554 |
| | | |
| Net investment income (loss) | 1,104,733 | 1,050,311 |
| |
| Realized and Unrealized Gain (Loss) | | |
| Net realized gain (loss) on: | | |
| Investment transactions | 582,241 | 368,959 |
| Futures contract transactions | 10,245 | — |
| Swap agreement transactions | (7,692) | (18,368) |
| Foreign currency transactions | — | (1,852) |
| | 584,794 | 348,739 |
| | | |
| Change in net unrealized appreciation (depreciation) on: | | |
| Investments | 1,602,642 | 2,488,575 |
| Futures contracts | (30,715) | — |
| Swap agreements | 59,537 | 128,349 |
| Translation of assets and liabilities in foreign currencies | — | 2,709 |
| | 1,631,464 | 2,619,633 |
| | | |
| Net realized and unrealized gain (loss) | 2,216,258 | 2,968,372 |
| | | |
| Net Increase (Decrease) in Net Assets Resulting from Operations | $3,320,991 | $4,018,683 |
| |
| |
| See Notes to Financial Statements. | | |
35
|
| Statement of Changes in Net Assets |
| | | | |
| SIX MONTHS ENDED SEPTEMBER 30, 2009 (UNAUDITED) AND YEAR ENDED MARCH 31, 2009 | |
| | Short Duration | Core Plus |
| Increase (Decrease) in Net Assets | September 30, 2009 | March 31, 2009 | September 30, 2009 | March 31, 2009 |
| Operations | | | | |
| Net investment income (loss) | $ 1,104,733 | $ 1,023,274 | $ 1,050,311 | $ 1,460,384 |
| Net realized gain (loss) | 584,794 | 526,126 | 348,739 | 447,647 |
| Change in net unrealized | | | | |
| appreciation (depreciation) | 1,631,464 | 594,282 | 2,619,633 | (467,232) |
| Net increase (decrease) in net assets | | | | |
| resulting from operations | 3,320,991 | 2,143,682 | 4,018,683 | 1,440,799 |
| | | | | |
| Distributions to Shareholders | | | | |
| From net investment income: | | | | |
| Investor Class | (297,269) | (168,424) | (208,147) | (279,064) |
| Institutional Class | (3,062) | (55,269) | (104,975) | (237,396) |
| A Class | (729,929) | (660,413) | (589,855) | (543,025) |
| B Class | (7,818) | (35,652) | (30,876) | (178,125) |
| C Class | (87,589) | (100,762) | (146,060) | (275,807) |
| R Class | (1,139) | (38,716) | (32,194) | (196,575) |
| From net realized gains: | | | | |
| Investor Class | — | (56,328) | — | (93,148) |
| Institutional Class | — | (13,655) | — | (103,040) |
| A Class | — | (280,380) | — | (334,673) |
| B Class | — | (4,225) | — | (102,725) |
| C Class | — | (35,803) | — | (166,954) |
| R Class | — | (6,032) | — | (101,624) |
| Decrease in net assets from | | | | |
| distributions | (1,126,806) | (1,455,659) | (1,112,107) | (2,612,156) |
| | | | | |
| Capital Share Transactions | | | | |
| Net increase (decrease) in net assets | | | | |
| from capital share transactions | 49,378,751 | 70,652,446 | 8,060,926 | 21,928,202 |
| | | | | |
| Net increase (decrease) in | | | | |
| net assets | 51,572,936 | 71,340,469 | 10,967,502 | 20,756,845 |
| | | | | |
| Net Assets | | | | |
| Beginning of period | 86,659,704 | 15,319,235 | 52,923,239 | 32,166,394 |
| End of period | $138,232,640 | $86,659,704 | $63,890,741 | $52,923,239 |
| | | | | |
| Accumulated undistributed net | | | | |
| investment income (loss) | $(22,415) | $(342) | $(60,642) | $1,154 |
| |
| |
| See Notes to Financial Statements. | | | | |
36
|
| Notes to Financial Statements |
SEPTEMBER 30, 2009 (UNAUDITED)
1. Organization and Summary of Significant Accounting Policies
Organization — American Century Investment Trust (the trust) is registered under the Investment Company Act of 1940 (the 1940 Act) as an open-end management investment company. Short Duration Fund (Short Duration) and Core Plus Fund (Core Plus) (the funds) are two funds in a series issued by the trust. The funds are diversified under the 1940 Act. The funds’ investment objective is to seek to maximize total return by investing in non-money market debt securities. As a secondary objective, the funds seek a high level of income. The following is a summary of the funds’ significant accounting policies.
Multiple Class — The funds are authorized to issue the Investor Class, the Institutional Class, the A Class, the B Class, the C Class and the R Class. The A Class may incur an initial sales charge. The A Class, B Class and C Class may be subject to a contingent deferred sales charge. The share classes differ principally in their respective sales charges and distribution and shareholder servicing expenses and arrangements. All shares of the funds represent an equal pro rata interest in the net assets of the class to which such shares belong, and have identical voting, dividend, liquidation and other rights and the same terms and conditions, except for class specific expenses and exclusive rights to vote on matters affecting only individual classes. Income, non-class specific expenses, and realized and unrealized capital gains and losses of the funds are allocated to each class of shares based on their relative net assets.
Security Valuations — Debt securities maturing in greater than 60 days at the time of purchase are valued at current market value as provided by a commercial pricing service or at the mean of the most recent bid and asked prices. Debt securities maturing within 60 days at the time of purchase may be valued at cost, plus or minus any amortized discount or premium. Discount notes may be valued through a commercial pricing service or at amortized cost, which approximates fair value. Investments in open-end management investment companies are valued at the reported net asset value. Securities traded on foreign securities exchanges and over-the-counter markets are normally completed before the close of business on days that the New York Stock Exchange (the Exchange) is open and may also take place on days when the Exchange is not open. If an ev ent occurs after the value of a security was established but before the net asset value per share was determined that was likely to materially change the net asset value, that security would be valued as determined in accordance with procedures adopted by the Board of Trustees. If the funds determine that the market price of a portfolio security is not readily available, or that the valuation methods mentioned above do not reflect the security’s fair value, such security is valued as determined by the Board of Trustees or its designee, in accordance with procedures adopted by the Board of Trustees, if such determination would materially impact a fund’s net asset value. Certain other circumstances may cause the funds to use alternative procedures to value a security such as: a security has been declared in default; trading in a security has been halted during the trading day; or there is a foreign market holiday and no trading will commence.
Security Transactions — For financial reporting purposes, security transactions are accounted for as of the trade date. Net realized gains and losses are determined on the identified cost basis, which is also used for federal income tax purposes.
Investment Income — Interest income less foreign taxes withheld, if any, is recorded on the accrual basis and includes paydown gain (loss) and accretion of discounts and amortization of premiums.
Securities on Loan — The funds may lend portfolio securities through their lending agent to certain approved borrowers in order to earn additional income. The income earned, net of any rebates or fees, is included in the Statement of Operations. The funds continue to recognize any gain or loss in the market price of the securities loaned and record any interest earned or dividends declared.
37
Foreign Currency Translations — All assets and liabilities initially expressed in foreign currencies are translated into U.S. dollars at prevailing exchange rates at period end. The funds may enter into spot foreign currency exchange contracts to facilitate transactions denominated in a foreign currency. Purchases and sales of investment securities, dividend and interest income, spot foreign currency exchange contracts, and certain expenses are translated at the rates of exchange prevailing on the respective dates of such transactions. For assets and liabilities, other than investments in securities, net realized and unrealized gains and losses from foreign currency translations arise from changes in currency exchange rates.
Net realized and unrealized foreign currency exchange gains or losses occurring during the holding period of investment securities are a component of realized gain (loss) on investment transactions and unrealized appreciation (depreciation) on investments, respectively. Certain countries may impose taxes on the contract amount of purchases and sales of foreign currency contracts in their currency. The funds record the foreign tax expense, if any, as a reduction to the net realized gain (loss) on foreign currency transactions.
When-Issued and Forward Commitments — The funds may engage in securities transactions on a when-issued or forward commitment basis. In these transactions, the securities’ prices and yields are fixed on the date of the commitment. In a when-issued transaction, the payment and delivery are scheduled for a future date and during this period, securities are subject to market fluctuations. In a forward commitment transaction, the funds may sell a security and at the same time make a commitment to purchase the same security at a future date at a specified price. Conversely, the funds may purchase a security and at the same time make a commitment to sell the same security at a future date at a specified price. These types of transactions are executed simultaneously in what are known as “roll” transactions. The funds will segre gate cash, cash equivalents or other appropriate liquid securities on their records in amounts sufficient to meet the purchase price. The funds account for “roll” transactions as purchases and sales; as such these transactions may increase portfolio turnover.
Repurchase Agreements — The funds may enter into repurchase agreements with institutions that American Century Investment Management, Inc. (ACIM) (the investment advisor) has determined are creditworthy pursuant to criteria adopted by the Board of Trustees. Each repurchase agreement is recorded at cost. Each fund requires that the collateral, represented by securities, received in a repurchase transaction be transferred to the custodian in a manner sufficient to enable each fund to obtain those securities in the event of a default under the repurchase agreement. ACIM monitors, on a daily basis, the securities transferred to ensure the value, including accrued interest, of the securities under each repurchase agreement is equal to or greater than amounts owed to each fund under each repurchase agreement.
Joint Trading Account — Pursuant to an Exemptive Order issued by the Securities and Exchange Commission, each fund, along with certain other funds in the American Century Investments family of funds, may transfer uninvested cash balances into a joint trading account. These balances are invested in one or more repurchase agreements that are collateralized by U.S. Treasury or Agency obligations.
Income Tax Status — It is each fund’s policy to distribute substantially all net investment income and net realized gains to shareholders and to otherwise qualify as a regulated investment company under provisions of the Internal Revenue Code. All tax years for the funds remain subject to examination by tax authorities. At this time, management believes there are no uncertain tax positions which, based on their technical merit, would not be sustained upon examination and for which it is reasonably possible that the total amounts of unrecognized tax benefits will significantly change in the next twelve months. Accordingly, no provision has been made for federal or state income taxes. Interest and penalties associated with any federal or state income tax obligations, if any, are recorded as interest expense.
38
Distributions to Shareholders — Distributions from net investment income for the funds are declared daily and paid monthly. Distributions from net realized gains for the funds, if any, are generally declared and paid annually.
Indemnifications — Under the trust’s organizational documents, its officers and trustees are indemnified against certain liabilities arising out of the performance of their duties to the funds. In addition, in the normal course of business, the funds enter into contracts that provide general indemnifications. The maximum exposure under these arrangements is unknown as this would involve future claims that may be made against a fund. The risk of material loss from such claims is considered by management to be remote.
Use of Estimates — The financial statements are prepared in conformity with accounting principles generally accepted in the United States of America, which may require management to make certain estimates and assumptions at the date of the financial statements. Actual results could differ from these estimates.
Subsequent Events — Management has evaluated events or transactions that may have occurred since September 30, 2009, that would merit recognition or disclosure in the financial statements. This evaluation was completed through November 27, 2009, the date the financial statements were issued.
2. Fees and Transactions with Related Parties
Management Fees — The trust has entered into a Management Agreement with ACIM, under which ACIM provides the funds with investment advisory and management services in exchange for a single, unified management fee (the fee) per class. The Agreement provides that all expenses of the funds, except brokerage commissions, taxes, interest, fees and expenses of those trustees who are not considered “interested persons” as defined in the 1940 Act (including counsel fees) and extraordinary expenses, will be paid by ACIM. The fee is computed and accrued daily based on the daily net assets of each specific class of shares of each fund and paid monthly in arrears. The fee consists of (1) an Investment Category Fee based on the daily net assets of the funds and certain other accounts managed by the investment advisor that are in the same broa d investment category as each fund and (2) a Complex Fee based on the assets of all the funds in the American Century Investments family of funds. The rates for the Investment Category Fee range from 0.2925% to 0.4100% for Short Duration and from 0.3425% to 0.4600% for Core Plus. The rates for the Complex Fee (Investor Class, A Class, B Class, C Class and R Class) range from 0.2500% to 0.3100%. The Institutional Class is 0.2000% less at each point within the Complex Fee range.
The effective annual management fee for each class of each fund for the six months ended September 30, 2009, was as follows:
| | |
| | Investor, A, B, C & R | Institutional |
| Short Duration | 0.61% | 0.41% |
| Core Plus | 0.66% | 0.46% |
Distribution and Service Fees — The Board of Trustees has adopted a separate Master Distribution and Individual Shareholder Services Plan for each of the A Class, B Class, C Class and R Class (collectively the plans), pursuant to Rule 12b-1 of the 1940 Act. The plans provide that the A Class and the R Class will pay American Century Investment Services, Inc. (ACIS) an annual distribution and service fee of 0.25% for the A Class and 0.50% for the R Class. The plans provide that the B Class and C Class will each pay ACIS an annual distribution fee of 0.75% and service fee of 0.25%. The fees are computed and accrued daily based on each class’s daily net assets and paid monthly in arrears. The fees are used to pay financial intermediaries for distribution and individual shareholder services. Fees incurred under the plans during the six mo nths ended September 30, 2009, are detailed in the Statement of Operations.
39
Related Parties — Certain officers and trustees of the trust are also officers and/or directors of American Century Companies, Inc. (ACC), the parent of the trust’s investment advisor, ACIM, the distributor of the trust, ACIS, and the trust’s transfer agent, American Century Services, LLC. ACIM owns 11% of the shares outstanding of Core Plus.
The funds are eligible to invest in a money market fund for temporary purposes, which is managed by J.P. Morgan Investment Management, Inc. (JPMIM). The funds have a Mutual Funds Services Agreement with J.P. Morgan Investor Services Co. (JPMIS) and a securities lending agreement with JPMorgan Chase Bank (JPMCB). JPMCB is a custodian of the funds. JPMIM, JPMIS and JPMCB are wholly owned subsidiaries of JPMorgan Chase & Co. (JPM). JPM is an equity investor in ACC.
3. Investment Transactions
Investment transactions, excluding short-term investments, for the six months ended September 30, 2009, were as follows:
| | |
| | Short Duration | Core Plus |
| Purchases | | |
| U.S. Treasury & Government | | |
| Agency Obligations | $64,023,880 | $38,309,774 |
| Investment securities other than U.S. | | |
| Treasury & Government Agency Obligations | $39,375,146 | $15,268,772 |
| Sales | | |
| U.S. Treasury & Government | | |
| Agency Obligations | $44,088,956 | $37,497,158 |
| Investment securities other than U.S. | | |
| Treasury & Government Agency Obligations | $12,535,823 | $9,035,400 |
40
4. Capital Share Transactions
Transactions in shares of the funds were as follows (unlimited number of shares authorized):
| | | | |
| | Six months ended September 30, 2009 | Year ended March 31, 2009 |
| | Shares | Amount | Shares | Amount |
| |
| Short Duration | | | | |
| Investor Class | | | | |
| Sold | 3,668,294 | $ 38,064,782 | 1,500,400 | $ 15,250,841 |
| Issued in reinvestment of distributions | 23,251 | 241,716 | 19,908 | 202,173 |
| Redeemed | (1,067,165) | (11,075,880) | (371,980) | (3,771,344) |
| | 2,624,380 | 27,230,618 | 1,148,328 | 11,681,670 |
| Institutional Class | | | | |
| Sold | 37,510 | 388,899 | 1,470 | 15,065 |
| Issued in reinvestment of distributions | 294 | 3,062 | 6,811 | 68,924 |
| Redeemed | (4,778) | (50,000) | (177,192) | (1,806,720) |
| | 33,026 | 341,961 | (168,911) | (1,722,731) |
| A Class | | | | |
| Sold | 4,361,490 | 45,197,744 | 7,522,032 | 76,450,287 |
| Issued in reinvestment of distributions | 63,948 | 664,143 | 87,268 | 885,752 |
| Redeemed | (2,974,825) | (30,812,688) | (2,077,141) | (21,158,220) |
| | 1,450,613 | 15,049,199 | 5,532,159 | 56,177,819 |
| B Class | | | | |
| Sold | 37,742 | 392,065 | 105,171 | 1,069,281 |
| Issued in reinvestment of distributions | 343 | 3,567 | 3,524 | 35,716 |
| Redeemed | (25,749) | (266,848) | (182,558) | (1,859,604) |
| | 12,336 | 128,784 | (73,863) | (754,607) |
| C Class | | | | |
| Sold | 855,580 | 8,885,045 | 971,460 | 9,891,590 |
| Issued in reinvestment of distributions | 5,234 | 54,389 | 10,097 | 102,405 |
| Redeemed | (242,141) | (2,511,540) | (295,939) | (3,002,621) |
| | 618,673 | 6,427,894 | 685,618 | 6,991,374 |
| R Class | | | | |
| Sold | 19,704 | 205,329 | 2,781 | 28,539 |
| Issued in reinvestment of distributions | 110 | 1,139 | 4,422 | 44,748 |
| Redeemed | (593) | (6,173) | (176,764) | (1,794,366) |
| | 19,221 | 200,295 | (169,561) | (1,721,079) |
| Net increase (decrease) | 4,758,249 | $ 49,378,751 | 6,953,770 | $ 70,652,446 |
41
| | | | |
| | Six months ended September 30, 2009 | Year ended March 31, 2009 |
| | Shares | Amount | Shares | Amount |
| |
| Core Plus | | | | |
| Investor Class | | | | |
| Sold | 786,936 | $ 8,075,827 | 732,880 | $ 7,411,245 |
| Issued in reinvestment of distributions | 16,324 | 169,086 | 31,336 | 314,429 |
| Redeemed | (376,276) | (3,872,804) | (570,724) | (5,756,889) |
| | 426,984 | 4,372,109 | 193,492 | 1,968,785 |
| Institutional Class | | | | |
| Issued in reinvestment of distributions | 10,156 | 104,975 | 34,075 | 340,436 |
| Redeemed | (95,057) | (999,984) | — | — |
| | (84,901) | (895,009) | 34,075 | 340,436 |
| A Class | | | | |
| Sold | 1,634,791 | 16,769,528 | 2,452,010 | 24,549,828 |
| Issued in reinvestment of distributions | 53,327 | 552,063 | 83,368 | 829,500 |
| Redeemed | (827,418) | (8,456,671) | (579,920) | (5,814,668) |
| | 860,700 | 8,864,920 | 1,955,458 | 19,564,660 |
| B Class | | | | |
| Sold | 21,296 | 216,681 | 30,657 | 308,138 |
| Issued in reinvestment of distributions | 2,652 | 27,379 | 28,085 | 280,166 |
| Redeemed | (96,605) | (1,012,591) | (307,950) | (3,078,229) |
| | (72,657) | (768,531) | (249,208) | (2,489,925) |
| C Class | | | | |
| Sold | 282,075 | 2,899,817 | 471,278 | 4,743,805 |
| Issued in reinvestment of distributions | 7,840 | 80,769 | 33,449 | 333,448 |
| Redeemed | (449,381) | (4,600,929) | (83,668) | (831,674) |
| | (159,466) | (1,620,343) | 421,059 | 4,245,579 |
| R Class | | | | |
| Sold | 11,702 | 117,887 | 46 | 473 |
| Issued in reinvestment of distributions | 3,126 | 32,194 | 29,874 | 298,199 |
| Redeemed | (198,530) | (2,042,301) | (200,502) | (2,000,005) |
| | (183,702) | (1,892,220) | (170,582) | (1,701,333) |
| Net increase (decrease) | 786,958 | $ 8,060,926 | 2,184,294 | $21,928,202 |
5. Securities Lending
As of September 30, 2009, the funds did not have any securities on loan. JPMCB receives and maintains collateral in the form of cash and/or acceptable securities as approved by ACIM. Cash collateral is invested in authorized investments by the lending agent in a pooled account. Any deficiencies or excess of collateral must be delivered or transferred by the member firms no later than the close of business on the next business day. The funds’ risks in securities lending are that the borrower may not provide additional collateral when required or return the securities when due. If the borrower defaults, receipt of the collateral by the funds may be delayed or limited. Investments made with cash collateral may decline in value.
42
6. Fair Value Measurements
The funds’ securities valuation process is based on several considerations and may use multiple inputs to determine the fair value of the positions held by the funds. In conformity with accounting principles generally accepted in the United States of America, the inputs used to determine a valuation are classified into three broad levels as follows:
• Level 1 valuation inputs consist of actual quoted prices in an active market for identical securities;
• Level 2 valuation inputs consist of significant direct or indirect observable market data (including quoted prices for similar securities, evaluations of subsequent market events, interest rates, prepayment speeds, credit risk, etc.); or
• Level 3 valuation inputs consist of significant unobservable inputs (including a fund’s own assumptions).
The level classification is based on the lowest level input that is significant to the fair valuation measurement. The valuation inputs are not an indication of the risks associated with investing in these securities or other financial instruments.
The following is a summary of the valuation inputs used to determine the fair value of the funds’ securities and other financial instruments as of September 30, 2009.
| | | |
| | Level 1 | Level 2 | Level 3 |
| |
| Short Duration | | | |
| Investment Securities | | | |
| Corporate Bonds | — | $ 44,537,423 | — |
| U.S. Treasury Securities | — | 41,095,345 | — |
| U.S. Government Agency Securities and Equivalents | — | 30,309,768 | — |
| Commercial Mortgage-Backed Securities | — | 5,739,310 | — |
| Collateralized Mortgage Obligations | — | 3,737,616 | — |
| U.S. Government Agency Mortgage-Backed Securities | — | 2,125,430 | — |
| Municipal Securities | — | 1,049,070 | — |
| Asset-Backed Securities | — | 276,481 | — |
| Temporary Cash Investments | $429,415 | 2,854,000 | — |
| Total Value of Investment Securities | $429,415 | $131,724,443 | — |
| | | | |
| Other Financial Instruments | | | |
| Futures Contracts | $(13,639) | — | — |
| Swap Agreements | — | $33,389 | — |
| Total Unrealized Gain (Loss) | | | |
| on Other Financial Instruments | $(13,639) | $33,389 | — |
43
| | | |
| | Level 1 | Level 2 | Level 3 |
| |
| Core Plus | | | |
| Investment Securities | | | |
| Corporate Bonds | — | $23,111,120 | — |
| U.S. Government Agency Mortgage-Backed Securities | — | 19,103,855 | — |
| U.S. Treasury Securities | — | 7,745,036 | — |
| U.S. Government Agency Securities and Equivalents | — | 3,431,728 | — |
| Collateralized Mortgage Obligations | — | 2,556,131 | — |
| Commercial Mortgage-Backed Securities | — | 2,394,125 | — |
| Municipal Securities | — | 1,191,749 | — |
| Sovereign Governments & Agencies | — | 1,106,748 | — |
| Asset-Backed Securities | — | 296,388 | — |
| Temporary Cash Investments | — | 5,384,000 | — |
| Total Value of Investment Securities | — | $66,320,880 | — |
| | | | |
| Other Financial Instruments | | | |
| Forward Foreign Currency Exchange Contracts | — | $ 2,718 | — |
| Swap Agreements | — | 83,980 | — |
| Total Unrealized Gain (Loss) | | | |
| on Other Financial Instruments | — | $86,698 | — |
7. Derivative Instruments
Credit Risk — The funds are subject to credit risk in the normal course of pursuing their investment objectives. The value of a bond generally declines as the credit quality of its issuer declines. Credit default swaps enable a fund to buy/sell protection against a credit event of a specific issuer or index. A fund may attempt to enhance returns by selling protection or attempt to mitigate credit risk by buying protection. The buyer/seller of credit protection against a security or basket of securities may pay/receive an up-front or periodic payment to compensate for/against potential default events. A fund will segregate cash, cash equivalents or other appropriate liquid securities on its records in amounts sufficient to meet requirements. Swap agreements are valued daily at current market value as provided by a commercial pricing service and/or independent brokers. Changes in value, including the periodic amounts of interest to be paid or received on swap agreements, are recorded as unrealized appreciation (depreciation) on swap agreements. Realized gain or loss is recorded upon receipt or payment of a periodic settlement or termination of swap agreements. Net realized and unrealized gains or losses occurring during the holding period of swap agreements are a component of net realized gain (loss) on swap agreement transactions and change in net unrealized appreciation (depreciation) on swap agreements, respectively. The risks of entering into swap agreements include the possible lack of liquidity, failure of the counterparty to meet its obligations, and that there may be unfavorable changes in the underlying investments or instruments. During the six months ended September 30, 2009, the funds participated in credit default swap agreements to buy and sell protection.
Interest Rate Risk — Short Duration is subject to interest rate risk in the normal course of pursuing its investment objectives. The value of bonds generally declines as interest rates rise. A fund may enter into futures contracts based on a bond index or a specific underlying security. A fund may purchase futures contracts to gain exposure to increases in market value or sell futures contracts to protect against a decline in market value. Upon entering into a futures contract, a fund will segregate cash, cash equivalents or other appropriate liquid securities on its records in amounts sufficient to meet requirements. Subsequent payments (variation margin) are made or received daily, in cash, by a fund. The variation margin is equal to the daily change in the contract value and is recorded as unrealized gains and losses. A fund recognizes a realized gain or loss when the futures
44
contract is closed or expires. Net realized and unrealized gains or losses occurring during the holding period of futures contracts are a component of net realized gain (loss) on futures contract transactions and change in net unrealized appreciation (depreciation) on futures contracts, respectively. One of the risks of entering into futures contracts is the possibility that the change in value of the contract may not correlate with the changes in value of the underlying securities. During the six months ended September 30, 2009, the fund purchased and sold futures contracts.
Foreign Currency Risk — Core Plus is subject to foreign currency exchange rate risk in the normal course of pursuing its investment objectives. The value of foreign investments held by a fund may be significantly affected by changes in foreign currency exchange rates. The dollar value of a foreign security generally decreases when the value of the dollar rises against the foreign currency in which the security is denominated and tends to increase when the value of the dollar declines against such foreign currency. A fund may enter into forward foreign currency exchange contracts to reduce a fund’s exposure to foreign currency exchange rate fluctuations. The net U.S. dollar value of foreign currency underlying all contractual commitments held by a fund and the resulting unrealized appreciation or depreciation are determined daily using prevailing exchange rates. Realized gain or loss is recorded upon the termination of the contract. Net realized and unrealized gains or losses occurring during the holding period of forward foreign currency exchange contracts are a component of net realized gain (loss) on foreign currency transactions and change in net unrealized appreciation (depreciation) on translation of assets and liabilities in foreign currencies, respectively. A fund bears the risk of an unfavorable change in the foreign currency exchange rate underlying the forward contract. Additionally, losses, up to the fair value, may arise if the counterparties do not perform under the contract terms. The risk of loss from non-performance by the counterparty may be reduced by the use of master netting agreements. During the six months ended September 30, 2009, the fund participated in forward foreign currency exchange contracts.
Value of Derivative Instruments as of September 30, 2009
| | | | |
| | Asset Derivatives | | Liability Derivatives | |
| Fund/Type | Location on Statement | | Location on Statement | |
| of Derivative | of Assets and Liabilities | Value | of Assets and Liabilities | Value |
| |
| Short Duration | | | | |
| Credit Risk | Receivable for swap | — | Payable for swap agreements, | $13,286 |
| | agreements, at value | | at value | |
| Interest Rate Risk | Receivable for variation | — | Payable for variation margin | 1,719 |
| | margin on futures contracts | | on futures contracts | |
| | | — | | $15,005 |
| | | | | |
| | | | | |
| Core Plus | | | | |
| Credit Risk | Receivable for swap | $6,072 | Payable for swap agreements, | $31,001 |
| | agreements, at value | | at value | |
| Foreign Currency Risk | Receivable for forward foreign | 2,718 | Payable for forward foreign | — |
| | currency exchange contracts | | currency exchange contracts | |
| | | $8,790 | | $31,001 |
45
Effect of Derivative Instruments on the Statement of Operations for the Six Months Ended September 30, 2009
| | | | |
| | | | Change in Net Unrealized |
| | Net Realized Gain (Loss) | Appreciation (Depreciation) |
| Fund/Type | Location on | | Location on | |
| of Derivative | Statement of Operations | | Statement of Operations | |
| |
| Short Duration | | | | |
| Credit Risk | Net realized gain (loss) on | $(7,692) | Change in net unrealized | $ 59,537 |
| | swap agreement transactions | | appreciation (depreciation) | |
| | | | on swap agreements | |
| Interest Rate Risk | Net realized gain (loss) on | 10,245 | Change in net unrealized | (30,715) |
| | futures contract transactions | | appreciation (depreciation) | |
| | | | on futures contracts | |
| | | $ 2,553 | | $ 28,822 |
| | | | | |
| | | | | |
| Core Plus | | | | |
| Credit Risk | Net realized gain (loss) on | $(18,368) | Change in net unrealized | $128,349 |
| | swap agreement transactions | | appreciation (depreciation) | |
| | | | on swap agreements | |
| Foreign Currency Risk | Net realized gain (loss) on | — | Change in net unrealized | 2,718 |
| | foreign currency transactions | | appreciation (depreciation) | |
| | | | on translation of assets and | |
| | | | liabilities in foreign currencies | |
| | | $(18,368) | | $131,067 |
The value of derivative instruments at period end and the effect of derivatives on the Statement of Operations is indicative of each fund’s typical volume.
8. Interfund Lending
The funds, along with certain other funds in the American Century Investments family of funds, may participate in an interfund lending program, pursuant to an Exemptive Order issued by the Securities and Exchange Commission (SEC). This program provides an alternative credit facility allowing the funds to borrow from or lend to other funds in the American Century Investments family of funds that permit such transactions. Interfund lending transactions are subject to each fund’s investment policies and borrowing and lending limits. The interfund loan rate earned/paid on interfund lending transactions is determined daily based on the average of certain current market rates. Interfund lending transactions normally extend only overnight, but can have a maximum duration of seven days. The program is subject to annual approval by the Board of Trustees. During the six months ended September 30, 2009, the funds did not utilize the program.
46
9. Federal Tax Information
The book-basis character of distributions made during the year from net investment income or net realized gains may differ from their ultimate characterization for federal income tax purposes. These differences reflect the differing character of paydown losses, certain income items and net realized gains and losses for financial statement and tax purposes, and may result in reclassification among certain capital accounts on the financial statements.
As of September 30, 2009, the components of investments for federal income tax purposes were as follows:
| | |
| | Short Duration | Core Plus |
| Federal tax cost of investments | $129,755,288 | $63,676,850 |
| Gross tax appreciation of investments | $2,510,078 | $2,948,041 |
| Gross tax depreciation of investments | (111,508) | (304,011) |
| Net tax appreciation (depreciation) of investments | $2,398,570 | $2,644,030 |
The difference between book-basis and tax-basis cost and unrealized appreciation (depreciation) is attributable primarily to the tax deferral of losses on wash sales.
Core Plus had a capital loss deferral of $(140,573) which represents net capital losses incurred in the five-month period ended March 31, 2009. The fund has elected to treat such losses as having been incurred in the following fiscal year for federal income tax purposes.
10. Recently Issued Accounting Standards
In March 2008, the Financial Accounting Standards Board (FASB) issued Accounting Standards Codification (ASC) Section 815-10 (formerly Statement of Financial Accounting Standards No. 161, “Disclosures about Derivative Instruments and Hedging Activities —an amendment of FASB Statement No. 133”). ASC Section 815-10 is effective for interim periods beginning after November 15, 2008 and has been adopted by the funds. ASC Section 815-10 amends and expands disclosures about derivative instruments and hedging activities. ASC Section 815-10 requires qualitative disclosures about the objectives and strategies of derivative instruments, quantitative disclosures about the fair value amounts of and gains and losses on derivative instruments, and disclosures of credit-risk-related contingent features in hedging activities.
47
| | | | | |
| Short Duration | | | | |
| |
| Investor Class | | | | |
| For a Share Outstanding Throughout the Years Ended March 31 (except as noted) | | |
| | | 2009(1) | 2009 | 2008 | 2007(2) |
| Per-Share Data | | | | |
| Net Asset Value, Beginning of Period | $10.26 | $10.26 | $10.00 | $10.00 |
| Income From Investment Operations | | | | |
| Net Investment Income (Loss)(3) | 0.12 | 0.29 | 0.45 | 0.15 |
| Net Realized and Unrealized Gain (Loss) | 0.21 | 0.14 | 0.25 | —(4) |
| Total From Investment Operations | 0.33 | 0.43 | 0.70 | 0.15 |
| Distributions | | | | |
| From Net Investment Income | (0.12) | (0.35) | (0.44) | (0.15) |
| From Net Realized Gains | — | (0.08) | — | — |
| Total Distributions | (0.12) | (0.43) | (0.44) | (0.15) |
| Net Asset Value, End of Period | $10.47 | $10.26 | $10.26 | $10.00 |
| |
| Total Return(5) | 3.28% | 4.29% | 7.17% | 1.46% |
| | | | | |
| Ratios/Supplemental Data | | | | |
| Ratio of Operating Expenses to Average Net Assets | 0.62%(6) | 0.62% | 0.62% | 0.62%(6) |
| Ratio of Net Investment Income (Loss) to Average Net Assets | 2.34%(6) | 2.90% | 4.42% | 4.48%(6) |
| Portfolio Turnover Rate | 57% | 182% | 113% | 157% |
| Net Assets, End of Period (in thousands) | $41,841 | $14,083 | $2,301 | $1,700 |
| (1) | Six months ended September 30, 2009 (unaudited). | | | | |
| (2) | November 30, 2006 (fund inception) through March 31, 2007. | | | | |
| (3) | Computed using average shares outstanding throughout the period. | | | | |
| (4) | Per-share amount was less than $0.005. | | | | |
| (5) | Total return assumes reinvestment of net investment income and capital gains distributions, if any. Total returns for periods less than one year |
| | are not annualized. The total return of the classes may not precisely reflect the class expense differences because of the impact of calculating |
| | the net asset values to two decimal places. If net asset values were calculated to three decimal places, the total return differences would |
| | more closely reflect the class expense differences. The calculation of net asset values to two decimal places is made in accordance with SEC |
| | guidelines and does not result in any gain or loss of value between one class and another. | | | |
| (6) | Annualized. | | | | |
| |
| |
| See Notes to Financial Statements. | | | | |
48
| | | | | |
| Short Duration | | | | |
| |
| Institutional Class | | | | |
| For a Share Outstanding Throughout the Years Ended March 31 (except as noted) | | |
| | | 2009(1) | 2009 | 2008 | 2007(2) |
| Per-Share Data | | | | |
| Net Asset Value, Beginning of Period | $10.26 | $10.26 | $10.00 | $10.00 |
| Income From Investment Operations | | | | |
| Net Investment Income (Loss)(3) | 0.13 | 0.37 | 0.47 | 0.15 |
| Net Realized and Unrealized Gain (Loss) | 0.22 | 0.08 | 0.25 | —(4) |
| Total From Investment Operations | 0.35 | 0.45 | 0.72 | 0.15 |
| Distributions | | | | |
| From Net Investment Income | (0.14) | (0.37) | (0.46) | (0.15) |
| From Net Realized Gains | — | (0.08) | — | — |
| Total Distributions | (0.14) | (0.45) | (0.46) | (0.15) |
| Net Asset Value, End of Period | $10.47 | $10.26 | $10.26 | $10.00 |
| |
| Total Return(5) | 3.38% | 4.49% | 7.38% | 1.52% |
| | | | | |
| Ratios/Supplemental Data | | | | |
| Ratio of Operating Expenses to Average Net Assets | 0.42%(6) | 0.42% | 0.42% | 0.42%(6) |
| Ratio of Net Investment Income (Loss) to Average Net Assets | 2.54%(6) | 3.10% | 4.62% | 4.68%(6) |
| Portfolio Turnover Rate | 57% | 182% | 113% | 157% |
| Net Assets, End of Period (in thousands) | $432 | $84 | $1,818 | $1,693 |
| (1) | Six months ended September 30, 2009 (unaudited). | | | | |
| (2) | November 30, 2006 (fund inception) through March 31, 2007. | | | | |
| (3) | Computed using average shares outstanding throughout the period. | | | | |
| (4) | Per-share amount was less than $0.005. | | | | |
| (5) | Total return assumes reinvestment of net investment income and capital gains distributions, if any. Total returns for periods less than one year |
| | are not annualized. The total return of the classes may not precisely reflect the class expense differences because of the impact of calculating |
| | the net asset values to two decimal places. If net asset values were calculated to three decimal places, the total return differences would |
| | more closely reflect the class expense differences. The calculation of net asset values to two decimal places is made in accordance with SEC |
| | guidelines and does not result in any gain or loss of value between one class and another. | | | |
| (6) | Annualized. | | | | |
| |
| |
| See Notes to Financial Statements. | | | | |
49
| | | | | |
| Short Duration | | | | |
| |
| A Class | | | | |
| For a Share Outstanding Throughout the Years Ended March 31 (except as noted) | | |
| | | 2009(1) | 2009 | 2008 | 2007(2) |
| Per-Share Data | | | | |
| Net Asset Value, Beginning of Period | $10.26 | $10.26 | $10.00 | $10.00 |
| Income From Investment Operations | | | | |
| Net Investment Income (Loss)(3) | 0.11 | 0.26 | 0.42 | 0.14 |
| Net Realized and Unrealized Gain (Loss) | 0.21 | 0.15 | 0.25 | —(4) |
| Total From Investment Operations | 0.32 | 0.41 | 0.67 | 0.14 |
| Distributions | | | | |
| From Net Investment Income | (0.11) | (0.33) | (0.41) | (0.14) |
| From Net Realized Gains | — | (0.08) | — | — |
| Total Distributions | (0.11) | (0.41) | (0.41) | (0.14) |
| Net Asset Value, End of Period | $10.47 | $10.26 | $10.26 | $10.00 |
| |
| Total Return(5) | 3.15% | 4.03% | 6.91% | 1.37% |
| | | | | |
| Ratios/Supplemental Data | | | | |
| Ratio of Operating Expenses to Average Net Assets | 0.87%(6) | 0.87% | 0.87% | 0.87%(6) |
| Ratio of Net Investment Income (Loss) to Average Net Assets | 2.09%(6) | 2.65% | 4.17% | 4.23%(6) |
| Portfolio Turnover Rate | 57% | 182% | 113% | 157% |
| Net Assets, End of Period (in thousands) | $77,746 | $61,314 | $4,559 | $1,690 |
| (1) | Six months ended September 30, 2009 (unaudited). | | | | |
| (2) | November 30, 2006 (fund inception) through March 31, 2007. | | | | |
| (3) | Computed using average shares outstanding throughout the period. | | | | |
| (4) | Per-share amount was less than $0.005. | | | | |
| (5) | Total return assumes reinvestment of net investment income and capital gains distributions, if any, and does not reflect applicable sales charges. |
| | Total returns for periods less than one year are not annualized. The total return of the classes may not precisely reflect the class expense |
| | differences because of the impact of calculating the net asset values to two decimal places. If net asset values were calculated to three decimal |
| | places, the total return differences would more closely reflect the class expense differences. The calculation of net asset values to two decimal |
| | places is made in accordance with SEC guidelines and does not result in any gain or loss of value between one class and another. | |
| (6) | Annualized. | | | | |
| |
| |
| See Notes to Financial Statements. | | | | |
50
| | | | | |
| Short Duration | | | | |
| |
| B Class | | | | |
| For a Share Outstanding Throughout the Years Ended March 31 (except as noted) | | |
| | | 2009(1) | 2009 | 2008 | 2007(2) |
| Per-Share Data | | | | |
| Net Asset Value, Beginning of Period | $10.26 | $10.26 | $10.00 | $10.00 |
| Income From Investment Operations | | | | |
| Net Investment Income (Loss)(3) | 0.07 | 0.27 | 0.35 | 0.11 |
| Net Realized and Unrealized Gain (Loss) | 0.20 | 0.06 | 0.25 | —(4) |
| Total From Investment Operations | 0.27 | 0.33 | 0.60 | 0.11 |
| Distributions | | | | |
| From Net Investment Income | (0.07) | (0.25) | (0.34) | (0.11) |
| From Net Realized Gains | — | (0.08) | — | — |
| Total Distributions | (0.07) | (0.33) | (0.34) | (0.11) |
| Net Asset Value, End of Period | $10.46 | $10.26 | $10.26 | $10.00 |
| |
| Total Return(5) | 2.67% | 3.25% | 6.11% | 1.13% |
| | | | | |
| Ratios/Supplemental Data | | | | |
| Ratio of Operating Expenses to Average Net Assets | 1.62%(6) | 1.62% | 1.62% | 1.62%(6) |
| Ratio of Net Investment Income (Loss) to Average Net Assets | 1.34%(6) | 1.90% | 3.42% | 3.48%(6) |
| Portfolio Turnover Rate | 57% | 182% | 113% | 157% |
| Net Assets, End of Period (in thousands) | $1,226 | $1,075 | $1,834 | $1,686 |
| (1) | Six months ended September 30, 2009 (unaudited). | | | | |
| (2) | November 30, 2006 (fund inception) through March 31, 2007. | | | | |
| (3) | Computed using average shares outstanding throughout the period. | | | | |
| (4) | Per-share amount was less than $0.005. | | | | |
| (5) | Total return assumes reinvestment of net investment income and capital gains distributions, if any, and does not reflect applicable sales charges. |
| | Total returns for periods less than one year are not annualized. The total return of the classes may not precisely reflect the class expense |
| | differences because of the impact of calculating the net asset values to two decimal places. If net asset values were calculated to three decimal |
| | places, the total return differences would more closely reflect the class expense differences. The calculation of net asset values to two decimal |
| | places is made in accordance with SEC guidelines and does not result in any gain or loss of value between one class and another. | |
| (6) | Annualized. | | | | |
| |
| |
| See Notes to Financial Statements. | | | | |
51
| | | | | |
| Short Duration | | | | |
| |
| C Class | | | | |
| For a Share Outstanding Throughout the Years Ended March 31 (except as noted) | | |
| | | 2009(1) | 2009 | 2008 | 2007(2) |
| Per-Share Data | | | | |
| Net Asset Value, Beginning of Period | $10.26 | $10.26 | $10.00 | $10.00 |
| Income From Investment Operations | | | | |
| Net Investment Income (Loss)(3) | 0.07 | 0.21 | 0.34 | 0.11 |
| Net Realized and Unrealized Gain (Loss) | 0.21 | 0.12 | 0.26 | —(4) |
| Total From Investment Operations | 0.28 | 0.33 | 0.60 | 0.11 |
| Distributions | | | | |
| From Net Investment Income | (0.07) | (0.25) | (0.34) | (0.11) |
| From Net Realized Gains | — | (0.08) | — | — |
| Total Distributions | (0.07) | (0.33) | (0.34) | (0.11) |
| Net Asset Value, End of Period | $10.47 | $10.26 | $10.26 | $10.00 |
| |
| Total Return(5) | 2.77% | 3.25% | 6.11% | 1.13% |
| | | | | |
| Ratios/Supplemental Data | | | | |
| Ratio of Operating Expenses to Average Net Assets | 1.62%(6) | 1.62% | 1.62% | 1.62%(6) |
| Ratio of Net Investment Income (Loss) to Average Net Assets | 1.34%(6) | 1.90% | 3.42% | 3.48%(6) |
| Portfolio Turnover Rate | 57% | 182% | 113% | 157% |
| Net Assets, End of Period (in thousands) | $16,724 | $10,042 | $3,006 | $1,686 |
| (1) | Six months ended September 30, 2009 (unaudited). | | | | |
| (2) | November 30, 2006 (fund inception) through March 31, 2007. | | | | |
| (3) | Computed using average shares outstanding throughout the period. | | | | |
| (4) | Per-share amount was less than $0.005. | | | | |
| (5) | Total return assumes reinvestment of net investment income and capital gains distributions, if any, and does not reflect applicable sales charges. |
| | Total returns for periods less than one year are not annualized. The total return of the classes may not precisely reflect the class expense |
| | differences because of the impact of calculating the net asset values to two decimal places. If net asset values were calculated to three decimal |
| | places, the total return differences would more closely reflect the class expense differences. The calculation of net asset values to two decimal |
| | places is made in accordance with SEC guidelines and does not result in any gain or loss of value between one class and another. | |
| (6) | Annualized. | | | | |
| |
| |
| See Notes to Financial Statements. | | | | |
52
| | | | | |
| Short Duration | | | | |
| |
| R Class | | | | |
| For a Share Outstanding Throughout the Years Ended March 31 (except as noted) | | |
| | | 2009(1) | 2009 | 2008 | 2007(2) |
| Per-Share Data | | | | |
| Net Asset Value, Beginning of Period | $10.26 | $10.26 | $10.00 | $10.00 |
| Income From Investment Operations | | | | |
| Net Investment Income (Loss)(3) | 0.09 | 0.33 | 0.40 | 0.13 |
| Net Realized and Unrealized Gain (Loss) | 0.22 | 0.05 | 0.25 | —(4) |
| Total From Investment Operations | 0.31 | 0.38 | 0.65 | 0.13 |
| Distributions | | | | |
| From Net Investment Income | (0.10) | (0.30) | (0.39) | (0.13) |
| From Net Realized Gains | — | (0.08) | — | — |
| Total Distributions | (0.10) | (0.38) | (0.39) | (0.13) |
| Net Asset Value, End of Period | $10.47 | $10.26 | $10.26 | $10.00 |
| |
| Total Return(5) | 3.03% | 3.77% | 6.64% | 1.29% |
| | | | | |
| Ratios/Supplemental Data | | | | |
| Ratio of Operating Expenses to Average Net Assets | 1.12%(6) | 1.12% | 1.12% | 1.12%(6) |
| Ratio of Net Investment Income (Loss) to Average Net Assets | 1.84%(6) | 2.40% | 3.92% | 3.98%(6) |
| Portfolio Turnover Rate | 57% | 182% | 113% | 157% |
| Net Assets, End of Period (in thousands) | $264 | $61 | $1,801 | $1,689 |
| (1) | Six months ended September 30, 2009 (unaudited). | | | | |
| (2) | November 30, 2006 (fund inception) through March 31, 2007. | | | | |
| (3) | Computed using average shares outstanding throughout the period. | | | | |
| (4) | Per-share amount was less than $0.005. | | | | |
| (5) | Total return assumes reinvestment of net investment income and capital gains distributions, if any. Total returns for periods less than one year |
| | are not annualized. The total return of the classes may not precisely reflect the class expense differences because of the impact of calculating |
| | the net asset values to two decimal places. If net asset values were calculated to three decimal places, the total return differences would |
| | more closely reflect the class expense differences. The calculation of net asset values to two decimal places is made in accordance with SEC |
| | guidelines and does not result in any gain or loss of value between one class and another. | | | |
| (6) | Annualized. | | | | |
| |
| |
| See Notes to Financial Statements. | | | | |
53
| | | | | |
| Core Plus | | | | |
| |
| Investor Class | | | | |
| For a Share Outstanding Throughout the Years Ended March 31 (except as noted) | | |
| | | 2009(1) | 2009 | 2008 | 2007(2) |
| Per-Share Data | | | | |
| Net Asset Value, Beginning of Period | $10.07 | $10.48 | $9.96 | $10.00 |
| Income From Investment Operations | | | | |
| Net Investment Income (Loss)(3) | 0.20 | 0.43 | 0.45 | 0.14 |
| Net Realized and Unrealized Gain (Loss) | 0.52 | (0.12) | 0.51 | (0.03) |
| Total From Investment Operations | 0.72 | 0.31 | 0.96 | 0.11 |
| Distributions | | | | |
| From Net Investment Income | (0.21) | (0.50) | (0.44) | (0.15) |
| From Net Realized Gains | — | (0.22) | — | — |
| Total Distributions | (0.21) | (0.72) | (0.44) | (0.15) |
| Net Asset Value, End of Period | $10.58 | $10.07 | $10.48 | $9.96 |
| |
| Total Return(4) | 7.22% | 3.28% | 9.88% | 1.04% |
| | | | | |
| Ratios/Supplemental Data | | | | |
| Ratio of Operating Expenses to Average Net Assets | 0.67%(5) | 0.67% | 0.67% | 0.67%(5) |
| Ratio of Net Investment Income (Loss) to Average Net Assets | 3.86%(5) | 4.17% | 4.46% | 4.44%(5) |
| Portfolio Turnover Rate | 84% | 255% | 232% | 133% |
| Net Assets, End of Period (in thousands) | $12,448 | $7,555 | $5,830 | $4,211 |
| (1) | Six months ended September 30, 2009 (unaudited). | | | | |
| (2) | November 30, 2006 (fund inception) through March 31, 2007. | | | | |
| (3) | Computed using average shares outstanding throughout the period. | | | | |
| (4) | Total return assumes reinvestment of net investment income and capital gains distributions, if any. Total returns for periods less than one year |
| | are not annualized. The total return of the classes may not precisely reflect the class expense differences because of the impact of calculating |
| | the net asset values to two decimal places. If net asset values were calculated to three decimal places, the total return differences would |
| | more closely reflect the class expense differences. The calculation of net asset values to two decimal places is made in accordance with SEC |
| | guidelines and does not result in any gain or loss of value between one class and another. | | | |
| (5) | Annualized. | | | | |
| |
| |
| See Notes to Financial Statements. | | | | |
54
| | | | | |
| Core Plus | | | | |
| |
| Institutional Class | | | | |
| For a Share Outstanding Throughout the Years Ended March 31 (except as noted) | | |
| | | 2009(1) | 2009 | 2008 | 2007(2) |
| Per-Share Data | | | | |
| Net Asset Value, Beginning of Period | $10.07 | $10.48 | $9.96 | $10.00 |
| Income From Investment Operations | | | | |
| Net Investment Income (Loss)(3) | 0.21 | 0.45 | 0.47 | 0.15 |
| Net Realized and Unrealized Gain (Loss) | 0.51 | (0.12) | 0.51 | (0.04) |
| Total From Investment Operations | 0.72 | 0.33 | 0.98 | 0.11 |
| Distributions | | | | |
| From Net Investment Income | (0.22) | (0.52) | (0.46) | (0.15) |
| From Net Realized Gains | — | (0.22) | — | — |
| Total Distributions | (0.22) | (0.74) | (0.46) | (0.15) |
| Net Asset Value, End of Period | $10.57 | $10.07 | $10.48 | $9.96 |
| |
| Total Return(4) | 7.22% | 3.48% | 10.10% | 1.11% |
| | | | | |
| Ratios/Supplemental Data | | | | |
| Ratio of Operating Expenses to Average Net Assets | 0.47%(5) | 0.47% | 0.47% | 0.47%(5) |
| Ratio of Net Investment Income (Loss) to Average Net Assets | 4.06%(5) | 4.37% | 4.66% | 4.64%(5) |
| Portfolio Turnover Rate | 84% | 255% | 232% | 133% |
| Net Assets, End of Period (in thousands) | $4,144 | $4,802 | $4,638 | $4,214 |
| (1) | Six months ended September 30, 2009 (unaudited). | | | | |
| (2) | November 30, 2006 (fund inception) through March 31, 2007. | | | | |
| (3) | Computed using average shares outstanding throughout the period. | | | | |
| (4) | Total return assumes reinvestment of net investment income and capital gains distributions, if any. Total returns for periods less than one year |
| | are not annualized. The total return of the classes may not precisely reflect the class expense differences because of the impact of calculating |
| | the net asset values to two decimal places. If net asset values were calculated to three decimal places, the total return differences would |
| | more closely reflect the class expense differences. The calculation of net asset values to two decimal places is made in accordance with SEC |
| | guidelines and does not result in any gain or loss of value between one class and another. | | | |
| (5) | Annualized. | | | | |
| |
| |
| See Notes to Financial Statements. | | | | |
55
| | | | | |
| Core Plus | | | | |
| |
| A Class | | | | |
| For a Share Outstanding Throughout the Years Ended March 31 (except as noted) | | |
| | | 2009(1) | 2009 | 2008 | 2007(2) |
| Per-Share Data | | | | |
| Net Asset Value, Beginning of Period | $10.07 | $10.48 | $9.96 | $10.00 |
| Income From Investment Operations | | | | |
| Net Investment Income (Loss)(3) | 0.19 | 0.39 | 0.42 | 0.14 |
| Net Realized and Unrealized Gain (Loss) | 0.51 | (0.10) | 0.51 | (0.04) |
| Total From Investment Operations | 0.70 | 0.29 | 0.93 | 0.10 |
| Distributions | | | | |
| From Net Investment Income | (0.20) | (0.48) | (0.41) | (0.14) |
| From Net Realized Gains | — | (0.22) | — | — |
| Total Distributions | (0.20) | (0.70) | (0.41) | (0.14) |
| Net Asset Value, End of Period | $10.57 | $10.07 | $10.48 | $9.96 |
| |
| Total Return(4) | 6.98% | 3.02% | 9.61% | 0.96% |
| | | | | |
| Ratios/Supplemental Data | | | | |
| Ratio of Operating Expenses to Average Net Assets | 0.92%(5) | 0.92% | 0.92% | 0.92%(5) |
| Ratio of Net Investment Income (Loss) to Average Net Assets | 3.61%(5) | 3.92% | 4.21% | 4.19%(5) |
| Portfolio Turnover Rate | 84% | 255% | 232% | 133% |
| Net Assets, End of Period (in thousands) | $36,257 | $25,863 | $6,415 | $4,207 |
| (1) | Six months ended September 30, 2009 (unaudited). | | | | |
| (2) | November 30, 2006 (fund inception) through March 31, 2007. | | | | |
| (3) | Computed using average shares outstanding throughout the period. | | | | |
| (4) | Total return assumes reinvestment of net investment income and capital gains distributions, if any, and does not reflect applicable sales charges. |
| | Total returns for periods less than one year are not annualized. The total return of the classes may not precisely reflect the class expense |
| | differences because of the impact of calculating the net asset values to two decimal places. If net asset values were calculated to three decimal |
| | places, the total return differences would more closely reflect the class expense differences. The calculation of net asset values to two decimal |
| | places is made in accordance with SEC guidelines and does not result in any gain or loss of value between one class and another. | |
| (5) | Annualized. | | | | |
| |
| |
| See Notes to Financial Statements. | | | | |
56
| | | | | |
| Core Plus | | | | |
| |
| B Class | | | | |
| For a Share Outstanding Throughout the Years Ended March 31 (except as noted) | | |
| | | 2009(1) | 2009 | 2008 | 2007(2) |
| Per-Share Data | | | | |
| Net Asset Value, Beginning of Period | $10.07 | $10.48 | $9.96 | $10.00 |
| Income From Investment Operations | | | | |
| Net Investment Income (Loss)(3) | 0.15 | 0.33 | 0.35 | 0.11 |
| Net Realized and Unrealized Gain (Loss) | 0.51 | (0.12) | 0.51 | (0.04) |
| Total From Investment Operations | 0.66 | 0.21 | 0.86 | 0.07 |
| Distributions | | | | |
| From Net Investment Income | (0.16) | (0.40) | (0.34) | (0.11) |
| From Net Realized Gains | — | (0.22) | — | — |
| Total Distributions | (0.16) | (0.62) | (0.34) | (0.11) |
| Net Asset Value, End of Period | $10.57 | $10.07 | $10.48 | $9.96 |
| |
| Total Return(4) | 6.59% | 2.25% | 8.80% | 0.71% |
| | | | | |
| Ratios/Supplemental Data | | | | |
| Ratio of Operating Expenses to Average Net Assets | 1.67%(5) | 1.67% | 1.67% | 1.67%(5) |
| Ratio of Net Investment Income (Loss) to Average Net Assets | 2.86%(5) | 3.17% | 3.46% | 3.44%(5) |
| Portfolio Turnover Rate | 84% | 255% | 232% | 133% |
| Net Assets, End of Period (in thousands) | $1,254 | $1,926 | $4,614 | $4,197 |
| (1) | Six months ended September 30, 2009 (unaudited). | | | | |
| (2) | November 30, 2006 (fund inception) through March 31, 2007. | | | | |
| (3) | Computed using average shares outstanding throughout the period. | | | | |
| (4) | Total return assumes reinvestment of net investment income and capital gains distributions, if any, and does not reflect applicable sales charges. |
| | Total returns for periods less than one year are not annualized. The total return of the classes may not precisely reflect the class expense |
| | differences because of the impact of calculating the net asset values to two decimal places. If net asset values were calculated to three decimal |
| | places, the total return differences would more closely reflect the class expense differences. The calculation of net asset values to two decimal |
| | places is made in accordance with SEC guidelines and does not result in any gain or loss of value between one class and another. | |
| (5) | Annualized. | | | | |
| |
| |
| See Notes to Financial Statements. | | | | |
57
| | | | | |
| Core Plus | | | | |
| |
| C Class | | | | |
| For a Share Outstanding Throughout the Years Ended March 31 (except as noted) | | |
| | | 2009(1) | 2009 | 2008 | 2007(2) |
| Per-Share Data | | | | |
| Net Asset Value, Beginning of Period | $10.07 | $10.48 | $9.96 | $10.00 |
| Income From Investment Operations | | | | |
| Net Investment Income (Loss)(3) | 0.15 | 0.32 | 0.35 | 0.11 |
| Net Realized and Unrealized Gain (Loss) | 0.51 | (0.11) | 0.51 | (0.04) |
| Total From Investment Operations | 0.66 | 0.21 | 0.86 | 0.07 |
| Distributions | | | | |
| From Net Investment Income | (0.16) | (0.40) | (0.34) | (0.11) |
| From Net Realized Gains | — | (0.22) | — | — |
| Total Distributions | (0.16) | (0.62) | (0.34) | (0.11) |
| Net Asset Value, End of Period | $10.57 | $10.07 | $10.48 | $9.96 |
| |
| Total Return(4) | 6.59% | 2.25% | 8.00% | 0.71% |
| | | | | |
| Ratios/Supplemental Data | | | | |
| Ratio of Operating Expenses to Average Net Assets | 1.67%(5) | 1.67% | 1.67% | 1.67%(5) |
| Ratio of Net Investment Income (Loss) to Average Net Assets | 2.86%(5) | 3.17% | 3.46% | 3.44%(5) |
| Portfolio Turnover Rate | 84% | 255% | 232% | 133% |
| Net Assets, End of Period (in thousands) | $8,897 | $10,080 | $6,074 | $4,197 |
| (1) | Six months ended September 30, 2009 (unaudited). | | | | |
| (2) | November 30, 2006 (fund inception) through March 31, 2007. | | | | |
| (3) | Computed using average shares outstanding throughout the period. | | | | |
| (4) | Total return assumes reinvestment of net investment income and capital gains distributions, if any, and does not reflect applicable sales charges. |
| | Total returns for periods less than one year are not annualized. The total return of the classes may not precisely reflect the class expense |
| | differences because of the impact of calculating the net asset values to two decimal places. If net asset values were calculated to three decimal |
| | places, the total return differences would more closely reflect the class expense differences. The calculation of net asset values to two decimal |
| | places is made in accordance with SEC guidelines and does not result in any gain or loss of value between one class and another. | |
| (5) | Annualized. | | | | |
| |
| |
| See Notes to Financial Statements. | | | | |
58
| | | | | |
| Core Plus | | | | |
| |
| R Class | | | | |
| For a Share Outstanding Throughout the Years Ended March 31 (except as noted) | | |
| | | 2009(1) | 2009 | 2008 | 2007(2) |
| Per-Share Data | | | | |
| Net Asset Value, Beginning of Period | $10.07 | $10.48 | $9.96 | $10.00 |
| Income From Investment Operations | | | | |
| Net Investment Income (Loss)(3) | 0.17 | 0.38 | 0.40 | 0.13 |
| Net Realized and Unrealized Gain (Loss) | 0.51 | (0.12) | 0.51 | (0.04) |
| Total From Investment Operations | 0.68 | 0.26 | 0.91 | 0.09 |
| Distributions | | | | |
| From Net Investment Income | (0.18) | (0.45) | (0.39) | (0.13) |
| From Net Realized Gains | — | (0.22) | — | — |
| Total Distributions | (0.18) | (0.67) | (0.39) | (0.13) |
| Net Asset Value, End of Period | $10.57 | $10.07 | $10.48 | $9.96 |
| |
| Total Return(4) | 6.85% | 2.76% | 9.34% | 0.88% |
| | | | | |
| Ratios/Supplemental Data | | | | |
| Ratio of Operating Expenses to Average Net Assets | 1.17%(5) | 1.17% | 1.17% | 1.17%(5) |
| Ratio of Net Investment Income (Loss) to Average Net Assets | 3.36%(5) | 3.67% | 3.96% | 3.94%(5) |
| Portfolio Turnover Rate | 84% | 255% | 232% | 133% |
| Net Assets, End of Period (in thousands) | $892 | $2,699 | $4,595 | $4,204 |
| (1) | Six months ended September 30, 2009 (unaudited). | | | | |
| (2) | November 30, 2006 (fund inception) through March 31, 2007. | | | | |
| (3) | Computed using average shares outstanding throughout the period. | | | | |
| (4) | Total return assumes reinvestment of net investment income and capital gains distributions, if any. Total returns for periods less than one year |
| | are not annualized. The total return of the classes may not precisely reflect the class expense differences because of the impact of calculating |
| | the net asset values to two decimal places. If net asset values were calculated to three decimal places, the total return differences would |
| | more closely reflect the class expense differences. The calculation of net asset values to two decimal places is made in accordance with SEC |
| | guidelines and does not result in any gain or loss of value between one class and another. | | | |
| (5) | Annualized. | | | | |
| |
| |
| See Notes to Financial Statements. | | | | |
59
|
| Approval of Management Agreements |
Under Section 15(c) of the Investment Company Act, contracts for investment advisory services to a mutual fund are required to be reviewed, evaluated and approved each year by the fund’s board of directors/ trustees, including a majority of a fund’s independent directors/trustees (the “Directors”). At American Century Investments, this process is referred to as the “15(c) Process.” The board oversees on a continuous basis and evaluates at its quarterly meetings, directly and through the committees of the board, the nature and quality of significant services provided by the advisor, the investment performance of the funds, shareholder services, audit and compliance functions and a variety of other matters relating to fund operations. Each year, it also holds a special meeting in connection with determining whether to renew the contracts for advisory services, to review fund performance, shareholder services, adviser profitability, audit and compliance matters, and other fund operational matters.
Under a Securities and Exchange Commission rule, each fund is required to disclose in its annual or semiannual report, as appropriate, the material factors and conclusions that formed the basis for the board’s approval or renewal of any advisory agreements within the fund’s most recently completed fiscal half-year period.
Annual Contract Review Process
As part of the annual 15(c) Process, the Directors requested and reviewed extensive data and information compiled by the advisor and certain independent providers of evaluative data (the “15(c) Providers”) concerning Short Duration and Core Plus (the “funds”) and the services provided to the funds under the management agreement. The information considered and the discussions held at the meetings included, but were not limited to:
• the nature, extent and quality of investment management, shareholder services and other services that the advisor provides to the funds;
• the wide range of programs and services the advisor provides to the funds and their shareholders on a routine and non-routine basis;
• the compliance policies, procedures, and regulatory experience of the advisor;
• data comparing the cost of owning each fund to the cost of owning a similar fund;
• data comparing each fund’s performance to appropriate benchmarks and/or a peer group of other mutual funds with similar investment objectives and strategies;
• financial data showing the profitability of each fund to the advisor and the overall profitability of the advisor;
• data comparing services provided and charges to other non-fund invest-ment management clients of the advisor; and
60
• collateral or “fall-out” benefits derived by the advisor from the manage-ment of the funds, and potential sharing of economies of scale in connection with the management of the funds.
In keeping with its practice, the Directors at a special meeting and at a regularly scheduled quarterly meeting reviewed and discussed the information provided by the advisor throughout the year and to negotiate with the advisor the renewal of the management agreement, including the setting of the applicable management fee. The Directors had the benefit of the advice of their independent counsel throughout the period.
Factors Considered
The Directors considered all of the information provided by the advisor, independent data providers, and the board’s independent counsel, and evaluated such information for each fund the board oversees. The Directors did not identify any single factor as being all-important or controlling, and each Director may have attributed different levels of importance to different factors. In deciding to renew each fund’s management agreement under the terms ultimately determined by the board to be appropriate, the Directors based their decision on a number of factors, including the following.
Nature, Extent and Quality of Services — Generally. Under the management agreement, the advisor is responsible for providing or arranging for all services necessary for the operation of the funds. The board noted that under the management agreement, the advisor provides or arranges at its own expense a wide variety of services including:
• fund construction and design
• initial capitalization/funding
• portfolio research and security selection
• securities trading
• fund administration
• custody of fund assets
• daily valuation of fund portfolios
• shareholder servicing and transfer agency, including shareholder
confirmations, recordkeeping and communications
• legal services
• regulatory and portfolio compliance
• financial reporting
• marketing and distribution
61
The Directors noted that many of these services have expanded over time both in terms of quantity and complexity in response to shareholder demands, competition in the industry, changing distribution channels and the changing regulatory environment. In performing their evaluation, the Directors considered information received in connection with the annual review, as well as information provided on an ongoing basis throughout the year and at their regularly scheduled board and committee meetings.
Investment Management Services. The nature of the investment management services provided is quite complex and allows fund shareholders access to professional money management, instant diversification of their investments within an asset class, the opportunity to easily diversify among asset classes, and liquidity. In evaluating investment performance, the board expects the advisor to manage each fund in accordance with its investment objectives and approved strategies. In providing these services, the advisor utilizes teams of investment professionals (portfolio managers, analysts, research assistants, and securities traders) who require extensive information technology, research, training, compliance and other systems to conduct their business. At each quarterly meeting and at the special meeting to consider renewal of the management agr eement, the Directors, directly and through its Portfolio Committee, review investment performance information for each fund, together with comparative information for appropriate benchmarks and/or peer groups of similarly-managed funds, over different time horizons. If performance concerns are identified, the underperforming fund receives special reviews until performance improves, during which Directors discuss with the advisor the reasons for such underperformance (e.g., market conditions, security and sector selection) and any efforts being undertaken to improve performance. Short Duration’s performance for the one-year period was above the median for its benchmark. Core Plus’s performance fell below the median for its peer group for the one-year period during the past year. The board discussed Core Plus’s performance with the advisor and was satisfied with the efforts being undertaken by the advisor. The board will continue to monitor these efforts and the performance of the fund.
Shareholder and Other Services. The advisor provides the funds with a comprehensive package of transfer agency, shareholder, and other services. The Directors, directly and through the various Committees of the Board, review reports and evaluations of such services at their regular quarterly meetings and at their special meeting to consider renewal of the management agreement, including the annual meeting concerning contract review, and other reports to the board. These reports include, but are not limited to, information regarding the operational efficiency and accuracy of the shareholder and transfer agency services provided, staffing levels, shareholder satisfaction (as measured by external as well as internal sources), technology support, new products and services offered to fund shareholders, securities trading activities, portfolio v aluation services, auditing services, and legal and operational compliance activities. Certain aspects of shareholder and transfer agency service level efficiency and the quality of securities trading activities are measured by independent third party providers and are presented in comparison to other fund groups not managed by the advisor.
62
Costs of Services Provided and Profitability. The advisor provides detailed information concerning its cost of providing various services to the funds, its profitability in managing each fund, its overall profitability, and its financial condition. The Directors have reviewed with the advisor the methodology used to prepare this financial information. The Directors have also reviewed with the advisor its methodology for compensating the investment professionals that provide services to the funds. This financial information regarding the advisor is considered in order to evaluate the advisor’s financial condition, its ability to continue to provide services under the management agreement, and the reasonableness of the current management fee.
Ethics. The Directors generally consider the advisor’s commitment to providing quality services to shareholders and to conducting its business ethically. They noted that the advisor’s practices generally meet or exceed industry best practices.
Economies of Scale. The Directors review information provided by the advisor regarding the existence of economies of scale in connection with the investment management of the funds. The Directors concluded that economies of scale are difficult to measure and predict with precision, especially on a fund-by-fund basis. The analysis of economies of scale is further complicated by the additional services and content provided by the advisor and its reinvestment in its ability to provide and expand those services. Accordingly, the Directors seek to evaluate economies of scale by reviewing information, such as year-over-year profitability of the advisor generally, the profitability of its management of each fund specifically, and the expenses incurred by the advisor in providing various functions to the funds. The Directors believe the advisor is appropriately sharing economies of scale through its competitive fee structure, fee breakpoints as the fund complex and the fund increase in size, and through reinvestment in its business to provide shareholders additional services and enhancements to existing services. In particular, separate breakpoint schedules based on the size of the entire fund complex and on the size of each fund reflect the complexity of assessing economies of scale.
Comparison to Other Funds’ Fees. Each fund pays the advisor a single, all-inclusive (or unified) management fee for providing all services necessary for the management and operation of the fund, other than brokerage expenses, taxes, interest, extraordinary expenses, and the fees and expenses of the fund’s independent directors (including their independent legal counsel). Under the unified fee structure, the advisor is responsible for providing all investment advisory, custody, audit, administrative, compliance, record-keeping, marketing and shareholder services, or arranging and supervising third parties to provide such services. By contrast, most other funds are charged a variety of fees, including an investment advisory fee, a transfer agency fee, an administrative fee, distribution charges and other expenses. Other than their investment advisory fees and Rule 12b-1 distribution fees, the components of the total fees charged by these other funds may be increased without shareholder approval. The board believes the unified fee structure is a benefit to fund shareholders because it clearly discloses to shareholders the cost of owning fund shares, and, since the unified fee
63
cannot be increased without a vote of fund shareholders, it shifts to the advisor the risk of increased costs of operating the fund and provides a direct incentive to minimize administrative inefficiencies. Part of the Directors’ analysis of fee levels involves reviewing certain evaluative data compiled by an independent provider and comparing the fund’s unified fee to the total expense ratio of other funds in the fund’s peer group. The Directors also reviewed updated fee level data provided by the advisor, but recognized that comparative data was particularly difficult to evaluate given the significant market developments during the past year impacting fund assets. The unified fee charged to shareholders of Short Duration was below the median of the total expense ratios of its peer group. The unified fee charged to shareholders of Core Plus was slightly above the median of the total expense ratios of its peer group.
Comparison to Fees and Services Provided to Other Clients of the Advisor. The Directors also requested and received information from the advisor concerning the nature and extent of the services, fees, and profitability of its advisory services to advisory clients other than the funds. They observed that these varying types of client accounts require different services and involve different regulatory and entrepreneurial risks than the management of the funds. The Directors analyzed this information and concluded that the fees charged and services provided to the funds were reasonable by comparison.
Collateral or “Fall-Out” Benefits Derived by the Advisor. The Directors considered the existence of collateral benefits the advisor may receive as a result of its relationship with the funds. They concluded that the advisor’s primary business is managing mutual funds and it generally does not use fund or shareholder information to generate profits in other lines of business, and therefore does not derive any significant collateral benefits from them. The Directors noted that the advisor receives proprietary research from broker dealers that execute fund portfolio transactions but concluded that this research is likely to benefit fund shareholders. The Directors also determined that the advisor is able to provide investment management services to certain clients other than the funds, at least in part, due to its existing infr astructure built to serve the fund complex. The Directors concluded, however, that the assets of those other clients are not material to the analysis and, in any event, are included with the assets of each fund to determine breakpoints in the fund’s fee schedule, provided they are managed using the same investment team and strategy.
Conclusions of the Directors
As a result of this process, the Directors, in the absence of particular circumstances and assisted by the advice of their independent legal counsel, taking into account all of the factors discussed above and the information provided by the advisor and others, concluded that the investment management agreement between each fund and the advisor, including the management fee, is fair and reasonable in light of the services provided and should be renewed for a one-year term.
64
Retirement Account Information
As required by law, distributions you receive from certain IRAs, or 403(b), 457 and qualified plans are subject to federal income tax withholding, unless you elect not to have withholding apply. Tax will be withheld on the total amount withdrawn even though you may be receiving amounts that are not subject to withholding, such as nondeductible contributions. In such case, excess amounts of withholding could occur. You may adjust your withholding election so that a greater or lesser amount will be withheld.
If you don’t want us to withhold on this amount, you must notify us to not withhold the federal income tax. You may notify us in writing or in certain situations by telephone or through other electronic means. You have the right to revoke your withholding election at any time and any election you make may remain in effect until revoked by filing a new election.
Remember, even if you elect not to have income tax withheld, you are liable for paying income tax on the taxable portion of your withdrawal. If you elect not to have income tax withheld or you don’t have enough income tax withheld, you may be responsible for payment of estimated tax. You may incur penalties under the estimated tax rules if your withholding and estimated tax payments are not sufficient. You can reduce or defer the income tax on a distribution by directly or indirectly rolling such distribution over to another IRA or eligible plan. You should consult your tax advisor for additional information.
State tax will be withheld if, at the time of your distribution, your address is within one of the mandatory withholding states and you have federal income tax withheld. State taxes will be withheld from your distribution in accordance with the respective state rules.
Proxy Voting Guidelines
American Century Investment Management, Inc., the funds’ investment advisor, is responsible for exercising the voting rights associated with the securities purchased and/or held by the funds. A description of the policies and procedures the advisor uses in fulfilling this responsibility is available without charge, upon request, by calling 1-800-345-2021. It is also available on American Century Investments’ website at americancentury.com and on the Securities and Exchange Commission’s website at sec.gov. Information regarding how the investment advisor voted proxies relating to portfolio securities during the most recent 12-month period ended June 30 is available on the “About Us” page at americancentury.com. It is also available at sec.gov.
Quarterly Portfolio Disclosure
The funds file their complete schedule of portfolio holdings with the Securities and Exchange Commission (SEC) for the first and third quarters of each fiscal year on Form N-Q. The funds’ Forms N-Q are available on the SEC’s website at sec.gov, and may be reviewed and copied at the SEC’s Public Reference Room in Washington, DC. Information on the operation of the Public Reference Room may be obtained by calling 1-800-SEC-0330. The funds also make their complete schedule of portfolio holdings for the most recent quarter of their fiscal year available on their website at americancentury.com and, upon request, by calling 1-800-345-2021.
65
The following indices are used to illustrate investment market, sector, or style performance or to serve as fund performance comparisons. They are not investment products available for purchase.
The Citigroup Agency Index is a market-capitalization-weighted index that includes US government sponsored agencies with a remaining maturity of at least one year.
The Citigroup Credit Index includes US and non-US corporate securities and non-US sovereign and provincial securities.
The Citigroup Government/Corporate 1- to 3-Year Index is a market-capitalization-weighted index that includes fixed-rate government and corporate issues with maturities between one and three years.
The Citigroup High-Yield Cash-Pay Index is composed of those cash-pay securities included in the Citigroup US High-Yield Market Index with remaining maturities of at least one year.
The Citigroup Mortgage Index measures the mortgage component of the US BIG Bond Index, comprising 15- and 30-year GNMA, FNMA, and FHLMC pass-throughs and FNMA and FHLMC balloon mortgages.
The Citigroup Treasury Index is comprised of US Treasury securities with an amount outstanding of at least $5 billion and a remaining maturity of at least one year.
The Citigroup US Broad Investment-Grade (BIG) Bond Index is a market-capitalization-weighted index that includes fixed-rate Treasury, government-sponsored, mortgage, asset-backed, and investment-grade issues with a maturity of one year or longer.
The Citigroup US High-Yield Market Index captures the performance of below-investment-grade debt issued by corporations domiciled in the United States or Canada. This index includes cash-pay and deferred-interest securities that are publicly placed, have a fixed coupon, and are nonconvertible.
The Citigroup US Inflation-Linked Securities Index (ILSI)SM measures the return of bonds with fixed-rate coupon payments that adjust for inflation as measured by the Consumer Price Index (CPI).
66
67
68

| |
| |
| Contact Us | |
| americancentury.com | |
| Automated Information Line | 1-800-345-8765 |
| Investor Services Representative | 1-800-345-2021 or |
| | 816-531-5575 |
| Investors Using Advisors | 1-800-378-9878 |
| Business, Not-For-Profit, Employer-Sponsored | |
| Retirement Plans | 1-800-345-3533 |
| Banks and Trust Companies, Broker-Dealers, | |
| Financial Professionals, Insurance Companies | 1-800-345-6488 |
| Telecommunications Device for the Deaf | 1-800-634-4113 |
| American Century Investment Trust | |
| Investment Advisor: | |
| American Century Investment Management, Inc. | |
| Kansas City, Missouri | |
This report and the statements it contains are submitted for the general
information of our shareholders. The report is not authorized for distribution to
prospective investors unless preceded or accompanied by an effective prospectus.
American Century Investment Services, Inc., Distributor
©2009 American Century Proprietary Holdings, Inc. All rights reserved.
0911
CL-SAN-66867N
| |
| ITEM 2. CODE OF ETHICS. |
| Not applicable for semiannual report filings. |
| |
| ITEM 3. AUDIT COMMITTEE FINANCIAL EXPERT. |
| Not applicable for semiannual report filings. |
|
| ITEM 4. PRINCIPAL ACCOUNTANT FEES AND SERVICES. |
| Not applicable for semiannual report filings. |
|
| ITEM 5. AUDIT COMMITTEE OF LISTED REGISTRANTS. |
| Not applicable. |
|
| ITEM 6. INVESTMENTS. |
| (a) | The schedule of investments is included as part of the report to stockholders filed under Item 1 |
| | of this Form. |
| (b) | Not applicable. |
|
| ITEM 7. DISCLOSURE OF PROXY VOTING POLICIES AND PROCEDURES FOR |
| CLOSED-END MANAGEMENT INVESTMENT COMPANIES. |
| Not applicable. |
|
| ITEM 8. PORTFOLIO MANAGERS OF CLOSED-END MANAGEMENT |
| INVESTMENT COMPANIES. |
| Not applicable. |
|
| ITEM 9. PURCHASES OF EQUITY SECURITIES BY CLOSED-END MANAGEMENT |
| INVESTMENT COMPANY AND AFFILIATED PURCHASERS. |
| Not applicable. |
|
| ITEM 10. SUBMISSION OF MATTERS TO A VOTE OF SECURITY HOLDERS. |
| During the reporting period, there were no material changes to the procedures by which shareholders may |
| recommend nominees to the registrant’s board. |
|
| ITEM 11. CONTROLS AND PROCEDURES. |
| (a) | The registrant's principal executive officer and principal financial officer have concluded that |
| | the registrant's disclosure controls and procedures (as defined in Rule 30a-3(c) under the |
| | Investment Company Act of 1940) are effective based on their evaluation of these controls and |
| | procedures as of a date within 90 days of the filing date of this report. |
| |
| (b) | There were no changes in the registrant's internal control over financial reporting (as defined in |
| | Rule 30a-3(d) under the Investment Company Act of 1940) that occurred during the registrant's |
| | second fiscal quarter of the period covered by this report that have materially affected, or are |
| | reasonably likely to materially affect, the registrant's internal control over financial reporting. |
| |
| ITEM 12. EXHIBITS. |
| (a)(1) | Not applicable for semiannual report filings. |
| |
| (a)(2) | Separate certifications by the registrant’s principal executive officer and principal financial |
| | officer, pursuant to Section 302 of the Sarbanes-Oxley Act of 2002 and Rule 30a-2(a) under the |
| | Investment Company Act of 1940, are filed and attached hereto as EX-99.CERT. |
| |
| (a)(3) | Not applicable. |
| |
| (b) | A certification by the registrant’s chief executive officer and chief financial officer, pursuant to |
| | Section 906 of the Sarbanes-Oxley Act of 2002, is furnished and attached hereto as EX- |
| | 99.906CERT. |
SIGNATURES
Pursuant to the requirements of the Securities Exchange Act of 1934 and the Investment Company Act of 1940, the registrant has duly caused this report to be signed on its behalf by the undersigned, thereunto duly authorized.
| | |
| Registrant: | American Century Investment Trust |
| |
| |
| By: | /s/ Jonathan S. Thomas |
| | Name: | Jonathan S. Thomas |
| | Title: | President |
| |
| Date: | November 27, 2009 |
Pursuant to the requirements of the Securities Exchange Act of 1934 and the Investment Company Act of 1940, this report has been signed below by the following persons on behalf of the registrant and in the capacities and on the dates indicated.
| | |
| By: | /s/ Jonathan S. Thomas |
| | Name: | Jonathan S. Thomas |
| | Title: | President |
| | | (principal executive officer) |
| |
| Date: | November 27, 2009 |
| | |
| | |
| By: | /s/ Robert J. Leach |
| | Name: | Robert J. Leach |
| | Title: | Vice President, Treasurer, and |
| | | Chief Financial Officer |
| | | (principal financial officer) |
| |
| Date: | November 27, 2009 |