UNITED STATES
SECURITIES AND EXCHANGE COMMISSION
Washington, D.C. 20549
FORM N-CSR
CERTIFIED SHAREHOLDER REPORT OF REGISTERED
MANAGEMENT INVESTMENT COMPANIES
Investment Company Act file number: | 811-07852 | |||||||
| ||||||||
USAA Mutual Funds Trust | ||||||||
(Exact name of registrant as specified in charter) | ||||||||
| ||||||||
15935 La Cantera Pkwy, Building Two, San Antonio, Texas |
| 78256 | ||||||
(Address of principal executive offices) |
| (Zip code) | ||||||
| ||||||||
Citi Fund Services Ohio, Inc., 4400 Easton Commons, Suite 200, Columbus, Ohio 43219 | ||||||||
(Name and address of agent for service) | ||||||||
| ||||||||
Registrant’s telephone number, including area code: | 800-235-8396 |
| ||||||
| ||||||||
Date of fiscal year end: | March 31 |
| ||||||
| ||||||||
Date of reporting period: | March 31, 2020 |
| ||||||
Item 1. Reports to Stockholders.

MARCH 31, 2020
Annual Report
USAA California Bond Fund
Beginning January 1, 2021, as permitted by regulations adopted by the Securities and Exchange Commission, paper copies of the Fund's shareholder reports like this one will no longer be sent by mail, unless you specifically request paper copies of the reports from the Fund or from your financial intermediary, such as a broker-dealer or bank. Instead, the reports will be made available on usaa.com, and you will be notified by mail each time a report is posted and provided with a website link to access the report.
If you already elected to receive shareholder reports electronically, you will not be affected by this change and you need not take any action. You may elect to receive shareholder reports and other communications from the Fund or your financial intermediary electronically by notifying your financial intermediary directly, or if you are a direct investor, by calling (800) 235-8396 or logging on to usaa.com.
You may elect to receive all future reports in paper free of charge. You can inform the Fund or your financial intermediary that you wish to continue receiving paper copies of your shareholder reports by notifying your financial intermediary directly, or if you are a direct investor, by calling (800) 235-8396 or logging on to usaa.com. Your election to receive reports in paper will apply to all funds held with the USAA family of funds or your financial intermediary.
Victory Capital means Victory Capital Management Inc., the investment adviser of the USAA Mutual Funds. USAA Mutual Funds are distributed by Victory Capital Services, Inc., member FINRA, an affiliate of Victory Capital. Victory Capital and its affiliates are not affiliated with United Services Automobile Association or its affiliates. USAA and the USAA logo are registered trademarks and the USAA Mutual Funds and USAA Investments logos are trademarks of United Services Automobile Association and is being used by Victory Capital and its affiliates under license.
USAA Mutual Funds Trust
TABLE OF CONTENTS
Shareholder Letter (Unaudited) | 2 | ||||||
Managers' Commentary (Unaudited) | 4 | ||||||
Investment Overview (Unaudited) | 6 | ||||||
| Investment Objective & Portfolio Holdings (Unaudited) | 8 | ||||||
Financial Statements | |||||||
Schedule of Portfolio Investments | 10 | ||||||
Statement of Assets and Liabilities | 18 | ||||||
Statement of Operations | 19 | ||||||
Statements of Changes in Net Assets | 20 | ||||||
Financial Highlights | 22 | ||||||
Notes to Financial Statements | 24 | ||||||
| Report of Independent Registered Public Accounting Firm | 35 | ||||||
Supplemental Information (Unaudited) | 36 | ||||||
Expense Example | 36 | ||||||
Proxy Voting and Portfolio Holdings Information | 36 | ||||||
Trustees' and Officers' Information | 37 | ||||||
Additional Federal Income Tax Information | 43 | ||||||
Privacy Policy (inside back cover) | |||||||
This report is for the information of the shareholders and others who have received a copy of the currently effective prospectus of the Fund, managed by Victory Capital Management Inc. It may be used as sales literature only when preceded or accompanied by a current prospectus, which provides further details about the Fund.
IRA DISTRIBUTION WITHHOLDING DISCLOSURE
We generally must withhold federal income tax at a rate of 10% of the taxable portion of your distribution and, if you live in a state that requires state income tax withholding, at your state's tax rate. However, you may elect not to have withholding apply or to have income tax withheld at a higher rate. Any withholding election that you make will apply to any subsequent distribution unless and until you change or revoke the election. If you wish to make a withholding election, or change or revoke a prior withholding election, call (800) 235-8396.
If you do not have a withholding election in place by the date of a distribution, federal income tax will be withheld from the taxable portion of your distribution at a rate of 10%. If you must pay estimated taxes, you may be subject to estimated tax penalties if your estimated tax payments are not sufficient and sufficient tax is not withheld from your distribution.
For more specific information, please consult your tax adviser.
1
(Unaudited)
Dear Shareholder,
If there were ever a time that illustrated the dynamic and unpredictable nature of financial markets—and life in general—it would be the strange days of early 2020. The spread of COVID-19 throughout the United States and the world has been an unprecedented event that, among so many other impacts, rendered virtually any economic forecasts unreliable. Seemingly overnight, the sentiment pendulum swung from risk-on to risk-off. We all became familiar with unusual concepts like "social distancing" and "flattening the curve."
Given that wide swaths of the global economy came to an all-stop—an event that has no real precedent—there remains tremendous uncertainty as to the depth and extent of the economic downturn. Making assumptions about the extent of the virus' reach, its impact on consumer behavior and employment, and the speed at which the U.S. government and U.S. Federal Reserve (the "Fed") can revive the economy is educated guesswork at best.
Fortunately, it's not all bad news. We did see markets stabilize as this annual reporting period drew to a close (and in the early weeks of April immediately following). As of the writing of this letter, the array of new lending facilities and programs launched by the Fed generally appear to have had their intended effect of improving liquidity and trading, at least in the short-term. Credit spreads across corporate, high-yield, structured, and municipal bond markets were coaxed down from their highs. Trading in equity markets also appeared to stabilize.
The USAA tax-exempt funds generally performed as would be expected given the unusual market environment. Our tax-exempt funds tend to be more credit heavy, holding more BBB-category rated bonds than the average in our peer groups. Typically, we overweight these credits to provide additional tax-free income to our investors, and these securities tend to underperform in periods of market dislocation when credit spreads widen significantly.
We believe that the volatility in the tax-exempt market reflected the lack of liquidity, rather than any significant credit deterioration. It's important to underscore that the USAA tax-exempt funds entered the crisis with ample liquidity and none have yet had to sell portfolio securities at an inopportune price to achieve a fund's desired level of exposure.
Looking ahead, the economy and the markets remain unpredictable. Yet our investment philosophy—and our resolve—is steadfast. A priority of our fixed-income portfolio managers and analysts is to maintain substantial liquidity, as no one can predict when the crisis will abate and what liquidity needs might be in the meantime.
Through it all, we remain committed to our core competency of evaluating, taking and managing credit risk, and we continue to build portfolios bond-by-bond. We believe the recent environment, though breathtaking in its volatility, provides extraordinary buying opportunities that may help us lock in higher tax-free yields for our investors.
2
If you have questions about the current market dynamics or your specific portfolio or investment plan, please give one of our financial representatives a call. They can help ensure that you are properly diversified based on your long-term goals, time horizon, and risk tolerance.
From all of us here at USAA Funds, thank you for letting us help you work toward your investment goals.

Christopher K. Dyer, CFA
President,
USAA Funds
3
USAA Mutual Funds Trust
USAA California Bond Fund
Managers' Commentary
(Unaudited)
John C. Bonnell, CFA
Regina G. Conklin, CPA, CFA
Andrew R. Hattman, CFA, CAIA
• What were the market conditions during the reporting period?
Tax-exempt bonds generated positive returns during the reporting period ended March 31, 2020, due in part to falling municipal bond yields. (Bond prices and yields move in opposite directions.) However, market conditions changed drastically during the reporting period.
For the first approximate 11 months of the reporting period, tax-exempt bonds generated strong positive returns. In the second half of calendar year 2019, due to intensifying U.S.-China trade tensions and global economic weakness, the U.S. Federal Reserve (the "Fed") cut the target federal funds rate from a range of 2.25% - 2.50% to a target range of 1.50% - 1.75%. Municipal bond AAA rates followed suit by generally falling for the majority of the reporting period, reaching their lows on March 9, 2020. Tax-exempt bonds also benefited from supply-and-demand dynamics during the first approximate 11 months of the reporting period. Supply was tight, as new issuance failed to keep pace with demand. Demand was intense, as municipal bond mutual funds saw inflows every week during the reporting period up to early March. In late February and early March, as the emergence of a novel coronavirus (COVID-19) raised fears about a potential U.S. economic slowdown, municipal bonds held up well compared to other segments of the fixed income market.
That all changed on March 10, 2020. For the next 10 days, interest rates rose quickly and significantly along the municipal yield curve amid record outflows from municipal bond mutual funds. The trend reversed on March 20, and municipal bond yields fell sharply, finishing the reporting period below their starting points. Over this period , the 3-year AAA municipal bond rate started at 0.50% on March 9, rose to 2.75% on March 20, and fell to 1.11% on March 31 (after starting the reporting period at 1.54% on April 1, 2019). Municipal bond credit spreads (yield differentials between municipal bonds with similar maturities but different credit ratings) widened in March 2020, with spreads on lower-rated municipal securities widening the most. Rating agencies placed entire municipal bond sectors on credit watch because of a potential economic slowdown driven by the shutdowns, lockdowns, and self-quarantines that had been instituted to slow the spread of COVID-19. The Fed responded with unprecedented actions, slashing the target federal funds rate to a range of between zero and 0.25%, implementing quantitative easing and credit support programs, and offering assistance to state and municipal governments. The Fed also has said it will do what it takes to keep financial markets—including the municipal bond market—fully functioning.
• How did the USAA California Bond Fund (the "Fund") perform during the reporting period?
The Fund has two share classes: Fund Shares and Adviser Shares. For the reporting period ended March 31, 2020, the Fund Shares and Adviser Shares had a total return of
4
USAA Mutual Funds Trust
USAA California Bond Fund (continued)
3.62% and 3.36%, respectively, versus an average return of 2.47% for the funds in the Lipper California Municipal Debt Funds category. This compares to returns of 2.60% for the Lipper California Municipal Debt Funds Index and 3.85% for the Bloomberg Barclays Municipal Bond Index. The Fund Shares' and Adviser Shares' tax-exempt distributions over the reporting period produced a dividend yield of 2.70% and 2.44%, respectively, compared to the Lipper category average of 2.72%.
• What are the conditions in the state of California?
California's economy of nearly 40 million people, the largest among the 50 states, is broad, diverse, and considerable. However, the health risks posed by the novel coronavirus ("COVID-19") pandemic have resulted in unprecedented business shutdowns and economic stress that will translate into financial stress for state and local governments to varying degrees. The financial impact to the state of California will be substantial due to expected higher unemployment and the negative impact to personal income and sales tax collections. The ultimate impact on California's fiscal position will depend both on the duration of the unprecedented economic shutdown, and the amount California receives from the $2 trillion COVID-19 rescue bill passed by Congress. On a positive note, following the 2008 recession, California made significant structural changes to its fiscal operations that have contributed to an improved financial position. Areas of improvement include timely budgets, restrained spending, and the creation of "rainy-day" reserve funds that result in strengthened state liquidity. The state currently maintains strong ratings of Aa2, AA-, AA from Moody's, S&P, and Fitch respectively with stable outlooks from all three rating agencies.
• What strategies did you employ during the reporting period?
In keeping with our investment approach, we continued to focus on income generation. The Fund's long-term income distribution, not its price appreciation, accounts for most of its total return.
Our commitment to independent credit research continued to help us identify attractive opportunities for the Fund. We employ fundamental analysis that emphasizes an issuer's ability and willingness to repay its debt. Through our credit research, we strive both to recognize relative value and to avoid potential pitfalls, which is especially important in volatile times like the present. As always, we worked with our in-house team of analysts to select investments for the Fund on a bond-by-bond basis. Our team continuously monitors all the holdings in the Fund's portfolio.
The Fund continues to hold a diversified portfolio of longer-term, primarily investment-grade municipal bonds. To limit exposure to an unexpected event, the Fund is diversified by sector, issuer, and geography. In addition, we avoid bonds subject to the federal alternative minimum tax for individuals.
Thank you for allowing us to assist you with your investment needs.
5
USAA Mutual Funds Trust
USAA California Bond Fund
Investment Overview
(Unaudited)
Average Annual Total Return
Year Ended March 31, 2020
Fund Shares | Adviser Shares | ||||||||||||||||||
INCEPTION DATE | 10/10/90 | 8/1/10 | |||||||||||||||||
Net Asset Value | Net Asset Value | Bloomberg Barclays Municipal Bond Index1 | Lipper California Municipal Debt Funds Index2 | ||||||||||||||||
One Year | 3.62 | % | 3.36 | % | 3.85 | % | 2.60 | % | |||||||||||
Five Year | 3.11 | % | 2.86 | % | 3.19 | % | 2.96 | % | |||||||||||
Ten Year | 5.03 | % | NA | 4.14 | % | 4.64 | % | ||||||||||||
Since Inception | NA | 4.51 | % | NA | NA | ||||||||||||||
Past performance is not indicative of future results. The performance data quoted represents past performance and current returns may be lower or higher. The investment return and principal value will fluctuate so that an investor's shares, when redeemed, may be worth more or less than the original cost. To obtain performance information current to the most recent month's end, please visit www.usaa.com.
Total return measures the price change in a share assuming the reinvestment of all net investment income and realized capital gain distributions, if any. The total returns quoted do not reflect adjustments made to the enclosed financial statements in accordance with U.S. generally accepted accounting principles or the deduction of taxes that a shareholder would pay on net investment income and realized capital gain distributions, including reinvested distributions, or redemptions of shares. The total return figures set forth above include all waivers of fees for various periods since inception. Without such fee waivers, the total returns would have been lower.
USAA California Bond Fund — Growth of $10,000
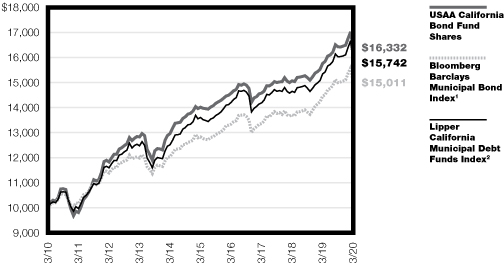
1 The unmanaged, broad-based Bloomberg Barclays Municipal Bond Index tracks total return performance for the long-term, investment-grade, tax-exempt bond market. All tax-exempt bond funds will find it difficult to outperform the Index because the Index does not reflect any deduction for fees, expenses, or taxes. It is not possible to invest directly in an index.
2 The unmanaged Lipper California Municipal Debt Funds Index measures the Fund's performance to that of the Lipper California Municipal Debt Funds category that limit their assets to those securities exempt from taxation in the state of California.There are no expenses associated with the index, while there are expenses associated with the Fund. It is not possible to invest directly in an index.
The graph reflects investment of growth of a hypothetical $10,000 investment in the Fund. Past performance is no guarantee of future results.
The graph and table do not reflect the deduction of taxes that a shareholder would pay on Fund distributions or the redemption of Fund shares.
6
USAA Mutual Funds Trust
USAA California Bond Fund (continued)
Average Annual Compounded Returns with Reinvestment of Dividends — Periods Ended March 31, 2020
Total Return | = | Dividend Return | + | Price Change | |||||||||||||||||||
| 10 Years | 5.03 | % | = | 3.86 | % | + | 1.17 | % | |||||||||||||||
| 5 Years | 3.11 | % | = | 3.29 | % | + | –0.18 | % | |||||||||||||||
| 1 Year | 3.62 | % | = | 2.72 | % | + | 0.90 | % | |||||||||||||||
The performance data quoted represents past performance and is no guarantee of future results. Current performance may be higher or lower than the performance data quoted. The return and principal value of an investment will fluctuate, so that an investor's shares, when redeemed, may be worth more or less than their original cost. For performance data current to the most recent month-end, visit usaa.com.
Annual Total Returns and Compounded Dividend Returns for the
One-Year Periods Ended March 31, 2011 — March 31, 2020

Note the role that dividend returns play in the Fund Shares' total return over time. Share prices and dividend rates will vary from period to period. However, dividend returns generally are more consistent and less volatile than share prices.
Total return measures the price change in a share assuming the reinvestment of all net investment income and realized capital gain distributions, if any. Dividend return is the net investment income dividends received over the period, assuming reinvestment of all dividends. Share price change is the change in net asset value over the period adjusted for realized capital gain distributions. The returns quoted do not reflect adjustments made to the enclosed financial statements in accordance with U.S. generally accepted accounting principles or the deduction of taxes that a shareholder would pay on distributions (including capital gain distributions), redemptions of shares, or reinvested net investment income.
7
| USAA Mutual Funds Trust USAA California Bond Fund | March 31, 2020 | ||||||
(Unaudited)
Investment Objective & Portfolio Holdings:
The Fund's investment objective seeks to provide California investors with a high level of current interest income that is exempt from federal and California state income taxes.
Top 10 Industries
March 31, 2020
(% of Net Assets)
General Obligation | 21.2 | % | |||||
Hospital | 15.1 | % | |||||
Appropriated Debt | 12.9 | % | |||||
Water/Sewer Utility | 11.0 | % | |||||
Special Assessment/Tax/Fee | 7.7 | % | |||||
Toll Road | 5.5 | % | |||||
Education | 5.3 | % | |||||
Nursing/CCRC | 4.2 | % | |||||
Real Estate Tax/Fee | 4.2 | % | |||||
Multifamily Housing | 4.0 | % | |||||
Refer to the Schedule of Portfolio Investments for a complete list of securities.
8
| USAA Mutual Funds Trust USAA California Bond Fund (continued) | March 31, 2020 | ||||||
(Unaudited)
Portfolio Ratings Mix*
March 31, 2020
(% of Net Assets)
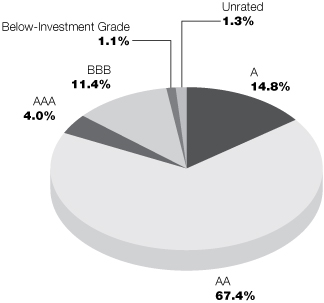
This chart reflects the highest long-term rating from a Nationally Recognized Statistical Rating Organization ("NRSRO"), with the four highest long-term credit ratings labeled, in descending order of credit quality, AAA, AA, A, and BBB. These categories represent investment-grade quality. NRSRO ratings are shown because they provide independent analysis of the credit quality of the Fund's investments. Victory Capital Management, Inc. ("Adviser") also performs its own fundamental credit analysis of each security. As part of its fundamental credit analysis, the Adviser considers various criteria, including industry specific actions, peer comparisons, payment ranking, and structure specific characteristics. Any of the Fund's securities that are not rated by an NRSRO appear in the chart above as "Unrated," but these securities are analyzed and monitored by the Adviser on an ongoing basis. Government securities that are issued or guaranteed as to principal and interest by the U.S. government and prerefunded and escrowed-to-maturity municipal bonds that are not rated are treated as AAA for credit quality purposes.
* Does not include futures and money market instruments.
9
| USAA Mutual Funds Trust USAA California Bond Fund | Schedule of Portfolio Investments March 31, 2020 | ||||||
(Amounts in Thousands, Except for Shares)
Security Description | Principal Amount | Value | |||||||||
Municipal Bonds (99.5%) | |||||||||||
California (96.7%): | |||||||||||
| Abag Finance Authority for Nonprofit Corp. Revenue, 5.00%, 7/1/42, Continuously Callable @100 | $ | 1,500 | $ | 1,580 | |||||||
| Abag Finance Authority for Nonprofit Corp. Revenue (NBGA — California Health Insurance Construction Loan Insurance Program), 5.00%, 1/1/33, Continuously Callable @101 | 4,235 | 4,612 | |||||||||
| Adelanto Public Utility Authority Revenue (INS — Assured Guaranty Municipal Corp.), 5.00%, 7/1/39, Continuously Callable @100 | 2,000 | 2,400 | |||||||||
| Alameda Corridor Transportation Authority Revenue, Series B, 5.00%, 10/1/37, Continuously Callable @100 | 2,000 | 2,361 | |||||||||
Albany Unified School District, GO | |||||||||||
Series B, 5.00%, 8/1/43, Continuously Callable @100 | 2,000 | 2,372 | |||||||||
Series B, 4.00%, 8/1/46, Continuously Callable @100 | 1,500 | 1,641 | |||||||||
| Anaheim Public Financing Authority Revenue, Series A, 5.00%, 5/1/46, Continuously Callable @100 | 1,500 | 1,656 | |||||||||
Bay Area Toll Authority Revenue | |||||||||||
5.96% (MUNIPSA+125bps), 4/1/36, (Put Date 4/1/27) (a) (b) (c) | 15,000 | 15,331 | |||||||||
Series H, 5.00%, 4/1/49, Continuously Callable @100 | 4,000 | 4,752 | |||||||||
| Burbank Unified School District, GO 8/1/33, Continuously Callable @100 (c) (d) (h) | 3,085 | 3,278 | |||||||||
8/1/34, Continuously Callable @100 (c) (d) (i) | 3,000 | 3,180 | |||||||||
California Educational Facilities Authority Revenue | |||||||||||
5.38%, 4/1/34, Pre-refunded 4/1/20 @ 100 | 6,000 | 6,000 | |||||||||
5.00%, 10/1/43, Continuously Callable @100 | 2,000 | 2,463 | |||||||||
5.00%, 10/1/48, Continuously Callable @100 | 2,000 | 2,446 | |||||||||
5.00%, 10/1/49, Continuously Callable @100 | 3,100 | 3,646 | |||||||||
Series A, 5.00%, 10/1/37, Continuously Callable @100 | 1,000 | 1,149 | |||||||||
California Enterprise Development Authority Revenue | |||||||||||
4.00%, 11/1/49, Continuously Callable @100 | 1,900 | 2,082 | |||||||||
4.00%, 11/1/50, Continuously Callable @100 | 680 | 745 | |||||||||
| California Enterprise Development Authority Revenue (LOC — Federal Home Loan Bank of San Francisco), 5.27%, 12/1/42, Continuously Callable @100 (c) (e) | 10,000 | 10,000 | |||||||||
California Health Facilities Financing Authority Revenue | |||||||||||
4.00%, 3/1/39, Continuously Callable @100 | 8,105 | 8,576 | |||||||||
4.00%, 10/1/47, Continuously Callable @100 (f) | 10,000 | 10,823 | |||||||||
Series A, 5.00%, 7/1/33, Continuously Callable @100 | 5,000 | 5,551 | |||||||||
Series A, 5.00%, 11/15/39, Continuously Callable @100 | 2,100 | 2,308 | |||||||||
Series A, 5.00%, 8/15/42, Continuously Callable @100 | 1,000 | 1,144 | |||||||||
Series A, 4.00%, 8/15/50, Continuously Callable @100 (g) | 2,000 | 2,197 | |||||||||
Series A-2, 5.00%, 11/1/47 | 10,000 | 14,116 | |||||||||
Series B, 4.00%, 11/15/41, Continuously Callable @100 (f) | 14,000 | 14,965 | |||||||||
| California Health Facilities Financing Authority Revenue (NBGA — California Health Insurance Construction Loan Insurance Program) | |||||||||||
5.00%, 7/1/39, Continuously Callable @100 | 1,050 | 1,178 | |||||||||
5.00%, 6/1/42, Continuously Callable @100 | 7,805 | 8,378 | |||||||||
5.00%, 7/1/44, Continuously Callable @100 | 2,300 | 2,551 | |||||||||
California Municipal Finance Authority Revenue | |||||||||||
5.00%, 6/1/43, Continuously Callable @100 | 2,500 | 3,048 | |||||||||
Series A, 5.00%, 2/1/37, Continuously Callable @100 | 750 | 886 | |||||||||
See notes to financial statements.
10
| USAA Mutual Funds Trust USAA California Bond Fund | Schedule of Portfolio Investments — continued March 31, 2020 | ||||||
(Amounts in Thousands, Except for Shares)
Security Description | Principal Amount | Value | |||||||||
Series A, 5.00%, 2/1/42, Continuously Callable @100 | $ | 1,000 | $ | 1,169 | |||||||
Series A, 4.00%, 10/1/44, Continuously Callable @100 | 2,000 | 2,127 | |||||||||
Series A, 5.00%, 2/1/47, Continuously Callable @100 | 1,000 | 1,155 | |||||||||
Series A, 5.00%, 7/1/47, Continuously Callable @100 | 1,000 | 1,084 | |||||||||
Series A, 5.00%, 6/1/50, Continuously Callable @100 | 1,000 | 1,114 | |||||||||
| California Municipal Finance Authority Revenue (NBGA — California Health Insurance Construction Loan Insurance Program) | |||||||||||
4.13%, 5/15/39, Continuously Callable @100 | 1,900 | 2,041 | |||||||||
4.13%, 5/15/46, Continuously Callable @100 | 2,100 | 2,216 | |||||||||
Series B, 5.00%, 5/15/47, Continuously Callable @102 | 2,500 | 2,771 | |||||||||
California Pollution Control Financing Authority Revenue | |||||||||||
5.00%, 7/1/39, Continuously Callable @100 (e) | 6,000 | 6,263 | |||||||||
5.25%, 8/1/40, Continuously Callable @100 (e) | 4,000 | 4,049 | |||||||||
5.00%, 11/21/45, Continuously Callable @100 (e) | 2,000 | 2,042 | |||||||||
California Public Finance Authority Revenue | |||||||||||
5.00%, 10/15/37, Continuously Callable @100 | 1,000 | 1,144 | |||||||||
5.00%, 10/15/47, Continuously Callable @100 | 3,000 | 3,319 | |||||||||
California School Finance Authority Revenue | |||||||||||
5.00%, 8/1/41, Continuously Callable @100 (e) | 1,750 | 1,843 | |||||||||
5.00%, 8/1/46, Continuously Callable @100 (e) | 2,250 | 2,343 | |||||||||
Series A, 5.00%, 7/1/47, Continuously Callable @100 (e) | 1,370 | 1,543 | |||||||||
Series A, 5.00%, 7/1/49, Continuously Callable @100 (e) | 1,000 | 1,154 | |||||||||
Series A, 5.00%, 7/1/54, Continuously Callable @100 (e) | 2,150 | 2,473 | |||||||||
| California State Educational Facilities Authority Revenue, Claremont Graduate University, Series B (LIQ — Deutsche Bank AG), Series 2017-7007, 4.75%, 3/1/42, Callable 5/6/20 @ 100 (c) (e) | 17,400 | 17,400 | |||||||||
| California State Public Works Board Revenue, Series C, 5.00%, 4/1/31, Continuously Callable @100 | 6,875 | 6,896 | |||||||||
California Statewide Communities Development Authority Revenue | |||||||||||
5.00%, 5/15/40, Continuously Callable @100 | 2,000 | 2,279 | |||||||||
5.00%, 5/15/42, Continuously Callable @100 | 1,500 | 1,587 | |||||||||
5.00%, 11/1/43, Pre-refunded 11/1/24 @ 100 | 500 | 586 | |||||||||
5.00%, 10/1/46, Continuously Callable @100 | 2,750 | 3,158 | |||||||||
5.00%, 5/15/47, Continuously Callable @100 | 1,000 | 1,129 | |||||||||
5.00%, 5/15/47, Continuously Callable @100 | 1,500 | 1,583 | |||||||||
5.00%, 1/1/48, Continuously Callable @100 | 1,995 | 2,290 | |||||||||
5.00%, 7/1/48, Continuously Callable @100 | 4,000 | 4,727 | |||||||||
5.00%, 5/15/50, Continuously Callable @100 | 1,000 | 1,123 | |||||||||
Series A, 4.00%, 8/15/51, Continuously Callable @100 | 3,000 | 3,263 | |||||||||
Series A, 5.00%, 12/1/53, Continuously Callable @100 | 1,000 | 1,190 | |||||||||
Series A, 5.00%, 12/1/57, Continuously Callable @100 | 2,500 | 2,967 | |||||||||
| California Statewide Communities Development Authority Revenue (NBGA — California Health Insurance Construction Loan Insurance Program) | |||||||||||
4.00%, 11/1/46, Continuously Callable @100 | 4,000 | 4,209 | |||||||||
Series S, 5.00%, 8/1/44, Continuously Callable @102 | 2,400 | 2,594 | |||||||||
| Centinela Valley Union High School District, GO, Series B, 4.00%, 8/1/50, Continuously Callable @100 (f) | 9,500 | 10,247 | |||||||||
| City of Atwater Wastewater Revenue (INS — Assured Guaranty Municipal Corp.), Series A, 5.00%, 5/1/43, Continuously Callable @100 | 1,300 | 1,520 | |||||||||
City of Chula Vista Revenue, 5.88%, 1/1/34, Continuously Callable @100 | 5,000 | 5,019 | |||||||||
See notes to financial statements.
11
| USAA Mutual Funds Trust USAA California Bond Fund | Schedule of Portfolio Investments — continued March 31, 2020 | ||||||
(Amounts in Thousands, Except for Shares)
Security Description | Principal Amount | Value | |||||||||
| City of Fillmore Wastewater Revenue, 5.00%, 5/1/47, Continuously Callable @100 | $ | 2,000 | $ | 2,360 | |||||||
| City of Santa Clara Electric Revenue, Series A, 5.25%, 7/1/32, Continuously Callable @100 | 2,000 | 2,102 | |||||||||
City of Tulare Sewer Revenue (INS — Assured Guaranty Municipal Corp.) | |||||||||||
4.00%, 11/15/41, Continuously Callable @100 | 5,710 | 6,236 | |||||||||
4.00%, 11/15/44, Continuously Callable @100 | 5,000 | 5,402 | |||||||||
City of Upland Certificate of Participation | |||||||||||
4.00%, 1/1/42, Continuously Callable @100 | 3,000 | 3,125 | |||||||||
5.00%, 1/1/47, Continuously Callable @100 | 2,000 | 2,196 | |||||||||
| Corona-Norco Unified School District Special Tax, 5.00%, 9/1/32, Continuously Callable @100 | 1,350 | 1,509 | |||||||||
| County of Sacramento Airport System Revenue, Series B, 5.00%, 7/1/41, Continuously Callable @100 | 1,100 | 1,311 | |||||||||
| East Bay Municipal Utility District Wastewater System Revenue, Series A-2, 5.00%, 6/1/38 | 9,000 | 12,585 | |||||||||
| Elk Grove Finance Authority Special Tax (INS — Build America Mutual Assurance Co.), 5.00%, 9/1/38, Continuously Callable @100 | 1,500 | 1,739 | |||||||||
| Foothill-Eastern Transportation Corridor Agency Revenue, Series B-2, 3.50%, 1/15/53 (c) | 1,500 | 1,502 | |||||||||
| Foothill-Eastern Transportation Corridor Agency Revenue (INS — Assured Guaranty Municipal Corp.) | |||||||||||
1/15/34 (d) | 15,000 | 10,867 | |||||||||
1/15/35 (d) | 7,500 | 5,276 | |||||||||
| Golden State Tobacco Securitization Corp. Revenue, Series A, 5.00%, 6/1/35, Continuously Callable @100 | 5,500 | 5,939 | |||||||||
| Grass Valley School District, GO (INS — Build America Mutual Assurance Co.), 5.00%, 8/1/45, Continuously Callable @100 | 2,400 | 2,757 | |||||||||
| Hayward Unified School District, GO (INS — Build America Mutual Assurance Co.), Series A, 5.00%, 8/1/44, Continuously Callable @100 | 3,000 | 3,569 | |||||||||
| Indio Redevelopment Agency Successor Agency Tax Allocation, Series A, 5.25%, 8/15/31, Continuously Callable @100 | 2,940 | 2,948 | |||||||||
Inglewood Unified School District, GO (INS — Build America Mutual Assurance Co.) | |||||||||||
Series B, 5.00%, 8/1/38, Continuously Callable @100 | 750 | 862 | |||||||||
Series C, 4.00%, 8/1/36, Continuously Callable @100 | 220 | 246 | |||||||||
Series C, 4.00%, 8/1/37, Continuously Callable @100 | 450 | 500 | |||||||||
Series C, 4.00%, 8/1/39, Continuously Callable @100 | 450 | 498 | |||||||||
| Inland Empire Tobacco Securitization Corp. Revenue, Series B, 5.75%, 6/1/26, Pre-refunded 6/1/20 @ 100 | 1,910 | 1,925 | |||||||||
Irvine Unified School District Special Tax | |||||||||||
5.00%, 9/1/45, Continuously Callable @100 | 1,000 | 1,124 | |||||||||
5.00%, 9/1/49, Continuously Callable @100 | 2,000 | 2,235 | |||||||||
Series A, 4.00%, 9/1/39, Continuously Callable @100 | 1,020 | 1,120 | |||||||||
Series B, 5.00%, 9/1/42, Continuously Callable @100 | 1,000 | 1,135 | |||||||||
Series B, 5.00%, 9/1/47, Continuously Callable @100 | 1,000 | 1,120 | |||||||||
Series C, 5.00%, 9/1/42, Continuously Callable @100 | 1,000 | 1,135 | |||||||||
Series C, 5.00%, 9/1/47, Continuously Callable @100 | 525 | 588 | |||||||||
Series D, 5.00%, 9/1/49, Continuously Callable @100 | 1,000 | 1,117 | |||||||||
| Irvine Unified School District Special Tax (INS — Build America Mutual Assurance Co.), 5.00%, 9/1/56, Continuously Callable @100 | 6,000 | 6,803 | |||||||||
See notes to financial statements.
12
| USAA Mutual Funds Trust USAA California Bond Fund | Schedule of Portfolio Investments — continued March 31, 2020 | ||||||
(Amounts in Thousands, Except for Shares)
Security Description | Principal Amount | Value | |||||||||
| Jurupa Public Financing Authority Special Tax, Series A, 5.00%, 9/1/42, Continuously Callable @100 | $ | 1,000 | $ | 1,113 | |||||||
| Local Public Schools Funding Authority School Improvement District No. 2016-1, GO (INS — Build America Mutual Assurance Co.), Series A, 4.00%, 8/1/52, Continuously Callable @100 | 1,500 | 1,631 | |||||||||
Long Beach Bond Finance Authority Revenue, Series A, 5.00%, 11/15/35 | 3,875 | 4,645 | |||||||||
| Los Angeles County Facilities Inc. Revenue, 5.00%, 12/1/51, Continuously Callable @100 | 4,000 | 4,796 | |||||||||
Los Angeles County Public Works Financing Authority Revenue | |||||||||||
Series A, 5.00%, 12/1/44, Continuously Callable @100 | 2,000 | 2,279 | |||||||||
Series D, 5.00%, 12/1/45, Continuously Callable @100 | 6,000 | 6,902 | |||||||||
| March Joint Powers Redevelopment Agency Successor Agency Tax Allocation (INS — Build America Mutual Assurance Co.), 4.00%, 8/1/41, Continuously Callable @100 | 5,790 | 6,164 | |||||||||
| Metropolitan Water District of Southern California Revenue, Series D, 4.13%, 7/1/35 (c) | 2,415 | 2,415 | |||||||||
Middle Fork Project Finance Authority Revenue | |||||||||||
5.00%, 4/1/34, Continuously Callable @100 | 1,175 | 1,306 | |||||||||
5.00%, 4/1/35, Continuously Callable @100 | 1,255 | 1,387 | |||||||||
5.00%, 4/1/36, Continuously Callable @100 | 1,830 | 2,009 | |||||||||
| Monrovia Financing Authority Revenue, 5.00%, 12/1/45, Continuously Callable @100 | 3,435 | 3,937 | |||||||||
| Monrovia Financing Authority Revenue (INS — Assured Guaranty Municipal Corp.), 5.00%, 12/1/45, Continuously Callable @100 | 2,345 | 2,724 | |||||||||
| Moreno Valley Unified School District, GO (INS — Assured Guaranty Municipal Corp.), Series B, 5.00%, 8/1/47, Continuously Callable @100 | 6,500 | 7,847 | |||||||||
| Mountain View School District/Los Angeles County, GO (INS — Build America Mutual Assurance Co.), Series B, 5.00%, 8/1/48, Continuously Callable @100 | 3,315 | 3,817 | |||||||||
| Mountain View Shoreline Regional Park Community Tax Allocation, Series A, 5.63%, 8/1/35, Continuously Callable @100 | 2,000 | 2,090 | |||||||||
| Norwalk Redevelopment Agency Tax Allocation (INS — National Public Finance Guarantee Corp.) | |||||||||||
Series A, 5.00%, 10/1/30, Continuously Callable @100 | 5,000 | 5,014 | |||||||||
Series A, 5.00%, 10/1/35, Continuously Callable @100 | 3,500 | 3,509 | |||||||||
| Norwalk-La Mirada Unified School District, GO (INS — Assured Guaranty Municipal Corp.), Series C, 8/1/30 (d) | 7,500 | 6,063 | |||||||||
| Palomar Health, GO (INS — Assured Guaranty Municipal Corp.), Series A, 8/1/31 (d) | 12,230 | 9,412 | |||||||||
Palomar Health, GO (INS — National Public Finance Guarantee Corp.), 8/1/26 (d) | 5,500 | 4,844 | |||||||||
| Perris Union High School District, GO (INS — Assured Guaranty Corp.), Series A, 4.00%, 9/1/48, Continuously Callable @100 | 5,000 | 5,283 | |||||||||
| Pittsburg Successor Agency Redevelopment Agency Tax Allocation (INS — Assured Guaranty Municipal Corp.), Series A, 5.00%, 9/1/29, Continuously Callable @100 | 2,000 | 2,404 | |||||||||
| Pomona Unified School District, GO (INS — Build America Mutual Assurance Co.), Series F, 5.00%, 8/1/39, Continuously Callable @100 | 1,500 | 1,708 | |||||||||
| Regents of the University of California Medical Center Pooled Revenue, Series L, 4.00%, 5/15/44, Continuously Callable @100 | 2,000 | 2,152 | |||||||||
| Rio Elementary School District, GO (INS — Assured Guaranty Municipal Corp.), Series B, 4.00%, 8/1/45, Continuously Callable @100 | 2,800 | 2,913 | |||||||||
See notes to financial statements.
13
| USAA Mutual Funds Trust USAA California Bond Fund | Schedule of Portfolio Investments — continued March 31, 2020 | ||||||
(Amounts in Thousands, Except for Shares)
Security Description | Principal Amount | Value | |||||||||
| Riverside County Public Financing Authority Tax Allocation (INS — Build America Mutual Assurance Co.) | |||||||||||
4.00%, 10/1/36, Continuously Callable @100 | $ | 1,250 | $ | 1,351 | |||||||
4.00%, 10/1/37, Continuously Callable @100 | 1,625 | 1,748 | |||||||||
| Riverside County Redevelopment Successor Agency Tax Allocation (INS — Build America Mutual Assurance Co.), 4.00%, 10/1/37, Continuously Callable @100 | 2,000 | 2,147 | |||||||||
| Riverside County Transportation Commission Revenue, Series A, 5.25%, 6/1/39, Pre-refunded 6/1/23 @ 100 | 2,000 | 2,266 | |||||||||
| RNR School Financing Authority Special Tax (INS — Build America Mutual Assurance Co.), Series A, 5.00%, 9/1/41, Continuously Callable @100 | 2,000 | 2,302 | |||||||||
| Sacramento Area Flood Control Agency Special Assessment, 5.00%, 10/1/44, Continuously Callable @100 | 2,000 | 2,209 | |||||||||
Sacramento City Financing Authority Revenue (LIQ — Deutsche Bank A.G.) | |||||||||||
Series 2016-XG0067, 4.82%, 12/1/30 (c) (e) | 5,355 | 5,355 | |||||||||
Series XG0100, 4.81%, 12/1/33 (c) (e) | 17,765 | 17,765 | |||||||||
| Sacramento City Unified School District, GO (INS — Build America Mutual Assurance Co.), Series S, 5.00%, 7/1/38, Continuously Callable @100 | 1,020 | 1,128 | |||||||||
| San Bernardino County Flood Control District Revenue (LOC — Bank of America Corp.), 5.00%, 8/1/37, Continuously Callable @100 (c) | 9,700 | 9,700 | |||||||||
| San Bruno Park Elementary School District, GO, Series A, 5.00%, 8/1/48, Continuously Callable @100 | 3,000 | 3,512 | |||||||||
San Diego County Regional Airport Authority Revenue | |||||||||||
Series A, 4.00%, 7/1/38, Continuously Callable @100 | 2,000 | 2,299 | |||||||||
Series A, 5.00%, 7/1/40, Continuously Callable @100 | 2,000 | 2,019 | |||||||||
Series A, 5.00%, 7/1/47, Continuously Callable @100 | 1,500 | 1,762 | |||||||||
Series A, 5.00%, 7/1/49, Continuously Callable @100 | 2,000 | 2,427 | |||||||||
San Diego Public Facilities Financing Authority Revenue | |||||||||||
Series A, 5.25%, 5/15/29, Pre-refunded 5/15/20 @ 100 | 1,000 | 1,005 | |||||||||
Series A, 5.00%, 10/15/44, Continuously Callable @100 | 2,500 | 2,873 | |||||||||
| San Francisco City Housing Revenue, 1500 Mission Street Apts., Series E (LIQ — Deutsche Bank A.G.), Series DBE-8038, 4.90%, 12/1/52, Callable 12/1/20 @ 100 (c) (e) | 21,400 | 21,400 | |||||||||
| San Jose Financing Authority Revenue, Series A, 5.00%, 6/1/39, Continuously Callable @100 | 10,000 | 11,074 | |||||||||
| San Leandro Unified School District, GO (INS — Build America Mutual Assurance Co.), Series B, 5.00%, 8/1/43, Continuously Callable @100 | 2,750 | 3,298 | |||||||||
| San Luis & Delta Mendota Water Authority Revenue (INS — Build America Mutual Assurance Co.), Series A, 5.00%, 3/1/38, Continuously Callable @100 | 1,500 | 1,654 | |||||||||
| San Marcos Schools Financing Authority Revenue (INS — Assured Guaranty Municipal Corp.), 5.00%, 8/15/35, Pre-refunded 8/15/20 @ 100 | 3,000 | 3,045 | |||||||||
| San Ramon Redevelopment Agency Successor Agency Tax Allocation (INS — Build America Mutual Assurance Co.), Series A, 5.00%, 2/1/38, Continuously Callable @100 | 5,000 | 5,792 | |||||||||
| Santa Clarita Community College District, GO, 4.00%, 8/1/46, Continuously Callable @100 | 5,250 | 5,747 | |||||||||
| Santa Cruz County Redevelopment Agency Tax Allocation (INS — Assured Guaranty Municipal Corp.), Series A, 5.00%, 9/1/35, Continuously Callable @100 | 6,000 | 7,023 | |||||||||
| Santa Rosa High School District, GO (INS — Assured Guaranty Municipal Corp.), Series C, 5.00%, 8/1/43, Continuously Callable @100 | 1,000 | 1,182 | |||||||||
See notes to financial statements.
14
| USAA Mutual Funds Trust USAA California Bond Fund | Schedule of Portfolio Investments — continued March 31, 2020 | ||||||
(Amounts in Thousands, Except for Shares)
Security Description | Principal Amount | Value | |||||||||
State of California, GO | |||||||||||
5.25%, 2/1/30, Continuously Callable @100 | $ | 4,000 | $ | 4,288 | |||||||
5.00%, 2/1/43, Continuously Callable @100 | 3,000 | 3,287 | |||||||||
4.00%, 10/1/44, Continuously Callable @100 | 1,000 | 1,121 | |||||||||
5.00%, 9/1/45, Continuously Callable @100 | 2,500 | 2,970 | |||||||||
5.00%, 8/1/46, Continuously Callable @100 | 9,500 | 11,151 | |||||||||
5.00%, 11/1/47, Continuously Callable @100 | 7,000 | 8,205 | |||||||||
| Stockton Public Financing Authority Revenue, 5.00%, 3/1/47, Continuously Callable @100 | 1,760 | 2,075 | |||||||||
| Tahoe-Truckee Unified School District Certificate of Participation (INS — Build America Mutual Assurance Co.), 4.00%, 6/1/43, Continuously Callable @100 | 1,000 | 1,058 | |||||||||
| Temecula Valley Unified School District Financing Authority Special Tax (INS — Build America Mutual Assurance Co.), 5.00%, 9/1/40, Continuously Callable @100 | 1,575 | 1,786 | |||||||||
| Temecula Valley Unified School District, GO (INS — Assured Guaranty Municipal Corp.), Series B, 4.00%, 8/1/45, Continuously Callable @100 | 7,500 | 8,195 | |||||||||
Tobacco Securitization Authority of Southern California Revenue | |||||||||||
5.00%, 6/1/48, Continuously Callable @100 | 1,000 | 1,014 | |||||||||
5.00%, 6/1/48, Continuously Callable @100 | 1,000 | 1,073 | |||||||||
Tulare Local Health Care District, GO (INS-Build America Mutual Assurance Co.) | |||||||||||
4.00%, 8/1/35, Continuously Callable @100 | 650 | 757 | |||||||||
4.00%, 8/1/39, Continuously Callable @100 | 1,900 | 2,177 | |||||||||
| Twin Rivers Unified School District Certificate of Participation (INS — Assured Guaranty Municipal Corp.), 3.20%, 6/1/41, (Put Date 6/1/20) (b) (c) | 8,485 | 8,497 | |||||||||
| Val Verde Unified School District Certificate of Participation (INS — Build America Mutual Assurance Co.) | |||||||||||
Series A, 5.00%, 8/1/34, Continuously Callable @100 | 1,105 | 1,290 | |||||||||
Series A, 5.00%, 8/1/35, Continuously Callable @100 | 1,530 | 1,780 | |||||||||
| Val Verde Unified School District, GO (INS — Assured Guaranty Municipal Corp.), Series C, 4.00%, 8/1/45, Continuously Callable @100 | 4,475 | 4,861 | |||||||||
| Val Verde Unified School District, GO (INS — Build America Mutual Assurance Co.), Series B, 5.00%, 8/1/44, Continuously Callable @100 | 4,000 | 4,614 | |||||||||
| Victor Valley Union High School District, GO (INS — Assured Guaranty Municipal Corp.), Series B, 4.00%, 8/1/37, Continuously Callable @100 | 5,000 | 5,593 | |||||||||
| Washington Township Health Care District Revenue, Series A, 5.00%, 7/1/42, Continuously Callable @100 | 1,000 | 1,153 | |||||||||
| West Kern Water District Certificate of Participation, 5.00%, 6/1/28, Continuously Callable @100 | 4,585 | 4,794 | |||||||||
| Western Placer Unified School District Certificate of Participation (INS — Assured Guaranty Municipal Corp.), 4.00%, 8/1/41, Continuously Callable @100 | 6,000 | 6,515 | |||||||||
661,564 | |||||||||||
Guam (2.2%): | |||||||||||
Guam Government Waterworks Authority Revenue | |||||||||||
5.50%, 7/1/43, Continuously Callable @100 | 4,000 | 4,061 | |||||||||
5.00%, 1/1/46, Continuously Callable @100 | 7,000 | 6,885 | |||||||||
Guam Power Authority Revenue | |||||||||||
Series A, 5.00%, 10/1/34, Continuously Callable @100 | 1,000 | 1,008 | |||||||||
Series A, 5.00%, 10/1/40, Continuously Callable @100 | 2,800 | 2,818 | |||||||||
14,772 | |||||||||||
See notes to financial statements.
15
| USAA Mutual Funds Trust USAA California Bond Fund | Schedule of Portfolio Investments — continued March 31, 2020 | ||||||
(Amounts in Thousands, Except for Shares)
Security Description | Principal Amount | Value | |||||||||
Virgin Islands (0.6%): | |||||||||||
Virgin Islands Public Finance Authority Revenue | |||||||||||
5.00%, 9/1/33, Continuously Callable @100 (e) | $ | 3,000 | $ | 3,282 | |||||||
Series A, 4.00%, 10/1/22 | 925 | 897 | |||||||||
4,179 | |||||||||||
Total Municipal Bonds (Cost $653,402) | 680,515 | ||||||||||
Total Investments (Cost $653,402) — 99.5% | 680,515 | ||||||||||
Other assets in excess of liabilities — 0.5% | 3,651 | ||||||||||
NET ASSETS — 100.00% | $ | 684,166 | |||||||||
(a) Variable or Floating-Rate Security. Rate disclosed is as of March 31, 2020.
(b) Put Bond.
(c) Variable Rate Demand Notes that provide the rights to sell the security at face value on either that day or within the rate-reset period. The interest rate is reset on the put date at a stipulated daily, weekly, monthly, quarterly, or other specified time interval to reflect current market conditions. These securities do not indicate a reference rate and spread in their description.
(d) Zero-coupon bond.
(e) Rule 144A security or other security that is restricted as to resale to institutional investors. The Fund's Adviser has deemed this security to be liquid based upon procedures approved by the Board of Trustees. As of March 31, 2020, the fair value of these securities was $96,912 (thousands) and amounted to 14.2% of net assets.
(f) All or a portion of this security has been designated as collateral for securities purchased on a when-issued basis.
(g) Security purchased on a when-issued basis.
(h) Stepped-coupon security converts to coupon form on 08/01/23 with a rate of 4.30%.
(i) Stepped-coupon security converts to coupon form on 08/01/23 with a rate of 4.35%.
bps — Basis points
GO — General Obligation
LOC — Line Letter of Credit
MUNIPSA — Municipal Swap Index
Credit Enhancements — Adds the financial strength of the provider of the enhancement to support the issuer's ability to repay the principal and interest payments when due. The enhancement may be provided by a high-quality bank, insurance company or other corporation, or a collateral trust. The enhancements do not guarantee the market values of the securities.
INS Principal and interest payments are insured by the name listed. Although bond insurance reduces the risk of loss due to default by an issuer, such bonds remain subject to the risk that value may fluctuate for other reasons, and there is no assurance that the insurance company will meet its obligations.
LIQ Liquidity enhancement that may, under certain circumstances, provide for repayment of principal and interest upon demand from the name listed.
See notes to financial statements.
16
| USAA Mutual Funds Trust USAA California Bond Fund | Schedule of Portfolio Investments — continued March 31, 2020 | ||||||
LOC Principal and interest payments are guaranteed by a bank letter of credit or other bank credit agreement.
NBGA Principal and interest payments or, under certain circumstances, underlying mortgages, are guaranteed by a nonbank guarantee agreement from the name listed.
See notes to financial statements.
17
USAA Mutual Funds Trust | Statement of Assets and Liabilities March 31, 2020 | ||||||
(Amounts in Thousands, Except Per Share Amounts)
| USAA California Bond Fund | |||||||
Assets: | |||||||
Investments, at value (Cost $653,402) | $ | 680,515 | |||||
Cash | 66 | ||||||
Receivables: | |||||||
Interest | 6,702 | ||||||
Capital shares issued | 3 | ||||||
Prepaid expenses | 2 | ||||||
Total assets | 687,288 | ||||||
Liabilities: | |||||||
Payables: | |||||||
Distributions | 288 | ||||||
Investments purchased | 2,234 | ||||||
Capital shares redeemed | 279 | ||||||
Accrued expenses and other payables: | |||||||
Investment advisory fees | 191 | ||||||
Administration fees | 89 | ||||||
Transfer agent fees | 17 | ||||||
Compliance fees | — | (a) | |||||
Trustees' fees | 2 | ||||||
| 12b-1 fees | 1 | ||||||
Other accrued expenses | 21 | ||||||
Total liabilities | 3,122 | ||||||
Net Assets: | |||||||
Capital | 661,054 | ||||||
Total distributable earnings | 23,112 | ||||||
Net assets | $ | 684,166 | |||||
Net Assets | |||||||
Fund Shares | $ | 677,785 | |||||
Adviser Shares | 6,381 | ||||||
Total | $ | 684,166 | |||||
Shares (unlimited number of shares authorized with no par value): | |||||||
Fund Shares | 60,672 | ||||||
Adviser Shares | 572 | ||||||
Total | 61,244 | ||||||
Net asset value, offering and redemption price per share: (b) | |||||||
Fund Shares | $ | 11.17 | |||||
Adviser Shares | $ | 11.16 | |||||
(a) Rounds to less than $1 thousand.
(b) Per share amount may not recalculate due to rounding of net assets and/or shares outstanding.
See notes to financial statements.
18
USAA Mutual Funds Trust | Statement of Operations For the Year Ended March 31, 2020 | ||||||
(Amounts in Thousands)
| USAA California Bond Fund | |||||||
Investment Income: | |||||||
Interest | $ | 22,813 | |||||
Total income | 22,813 | ||||||
Expenses: | |||||||
Investment advisory fees | 2,320 | ||||||
Professional fees | 3 | ||||||
Sub-Administration fees | 15 | ||||||
Administration fees — Adviser Shares | 11 | ||||||
Administration fees — Fund Shares | 1,063 | ||||||
12b-1 fees — Adviser Shares | 18 | ||||||
Custodian fees | 52 | ||||||
Transfer agent fees — Fund Shares | 156 | ||||||
Transfer agent fees — Adviser Shares | 1 | ||||||
Trustees' fees | 44 | ||||||
Compliance fees | 3 | ||||||
Legal and audit fees | 69 | ||||||
State registration and filing fees | 1 | ||||||
Interest expense on interfund lending | 1 | ||||||
Other expenses | 40 | ||||||
Total expenses | 3,797 | ||||||
Net Investment Income (Loss) | 19,016 | ||||||
Realized/Unrealized Gains (Losses) from Investments: | |||||||
Net realized gains (losses) from investment securities | 795 | ||||||
Net change in unrealized appreciation/depreciation on investment securities | 4,404 | ||||||
Net realized/unrealized gains (losses) on investments | 5,199 | ||||||
Change in net assets resulting from operations | $ | 24,215 | |||||
See notes to financial statements.
19
USAA Mutual Funds Trust | Statements of Changes in Net Assets | ||||||
(Amounts in Thousands)
USAA California Bond Fund | |||||||||||
| Year Ended March 31, 2020 | Year Ended March 31, 2019 | ||||||||||
From Investments: | |||||||||||
Operations: | |||||||||||
Net investment income (loss) | $ | 19,016 | $ | 21,496 | |||||||
Net realized gains (losses) from investments | 795 | 762 | |||||||||
| Net change in unrealized appreciation/depreciation on investments | 4,404 | 8,728 | |||||||||
Change in net assets resulting from operations | 24,215 | 30,986 | |||||||||
Distributions to Shareholders: | |||||||||||
Fund Shares | (18,841 | ) | (21,287 | ) | |||||||
Adviser Shares | (172 | ) | (201 | ) | |||||||
Change in net assets resulting from distributions to shareholders | (19,013 | ) | (21,488 | ) | |||||||
Change in net assets resulting from capital transactions | (19,432 | ) | 7,415 | ||||||||
Change in net assets | (14,230 | ) | 16,913 | ||||||||
Net Assets: | |||||||||||
Beginning of period | 698,396 | 681,483 | |||||||||
End of period | $ | 684,166 | $ | 698,396 | |||||||
Capital Transactions: | |||||||||||
Fund Shares | |||||||||||
Proceeds from shares issued | $ | 74,813 | $ | 67,106 | |||||||
Distributions reinvested | 15,317 | 16,937 | |||||||||
Cost of shares redeemed | (108,864 | ) | (76,552 | ) | |||||||
Total Fund Shares | $ | (18,734 | ) | $ | 7,491 | ||||||
Adviser Shares | |||||||||||
Proceeds from shares issued | $ | 341 | $ | 895 | |||||||
Distributions reinvested | 29 | 37 | |||||||||
Cost of shares redeemed | (1,068 | ) | (1,008 | ) | |||||||
Total Adviser Shares | $ | (698 | ) | $ | (76 | ) | |||||
Change in net assets resulting from capital transactions | $ | (19,432 | ) | $ | 7,415 | ||||||
Share Transactions: | |||||||||||
Fund Shares | |||||||||||
Issued | 6,614 | 6,162 | |||||||||
Reinvested | 1,352 | 1,554 | |||||||||
Redeemed | (9,723 | ) | (7,042 | ) | |||||||
Total Fund Shares | (1,757 | ) | 674 | ||||||||
Adviser Shares | |||||||||||
Issued | 30 | 82 | |||||||||
Reinvested | 3 | 4 | |||||||||
Redeemed | (94 | ) | (93 | ) | |||||||
Total Adviser Shares | (61 | ) | (7 | ) | |||||||
Change in Shares | (1,818 | ) | 667 | ||||||||
See notes to financial statements.
20
This page is intentionally left blank.
21
USAA Mutual Funds Trust | Financial Highlights | ||||||
For a Share Outstanding Throughout Each Period
Investment Activities | Distributions to Shareholders From | ||||||||||||||||||||||||||
| Net Asset Value, Beginning of Period | Net Investment Income (Loss) | Net Realized and Unrealized Gains (Losses) on Investments | Total from Investment Activities | Net Investment Income | Total Distributions | ||||||||||||||||||||||
USAA California Bond Fund | |||||||||||||||||||||||||||
Fund Shares | |||||||||||||||||||||||||||
| Year Ended March 31, 2020 | $ | 11.07 | 0.30 | (c) | 0.10 | 0.40 | (0.30 | ) | (0.30 | ) | |||||||||||||||||
| Year Ended March 31, 2019 | $ | 10.92 | 0.34 | 0.15 | 0.49 | (0.34 | ) | (0.34 | ) | ||||||||||||||||||
| Year Ended March 31, 2018 | $ | 10.92 | 0.37 | — | (d) | 0.37 | (0.37 | ) | (0.37 | ) | |||||||||||||||||
| Year Ended March 31, 2017 | $ | 11.29 | 0.37 | (0.37 | ) | — | (d) | (0.37 | ) | (0.37 | ) | ||||||||||||||||
| Year Ended March 31, 2016 | $ | 11.27 | 0.42 | 0.02 | 0.44 | (0.42 | ) | (0.42 | ) | ||||||||||||||||||
Adviser Shares | |||||||||||||||||||||||||||
| Year Ended March 31, 2020 | $ | 11.06 | 0.27 | (c) | 0.10 | 0.37 | (0.27 | ) | (0.27 | ) | |||||||||||||||||
| Year Ended March 31, 2019 | $ | 10.91 | 0.32 | 0.15 | 0.47 | (0.32 | ) | (0.32 | ) | ||||||||||||||||||
| Year Ended March 31, 2018 | $ | 10.91 | 0.34 | — | (d) | 0.34 | (0.34 | ) | (0.34 | ) | |||||||||||||||||
| Year Ended March 31, 2017 | $ | 11.28 | 0.35 | (0.37 | ) | (0.02 | ) | (0.35 | ) | (0.35 | ) | ||||||||||||||||
| Year Ended March 31, 2016 | $ | 11.26 | 0.39 | 0.02 | 0.41 | (0.39 | ) | (0.39 | ) | ||||||||||||||||||
* Assumes reinvestment of all net investment income and realized capital gain distributions, if any, during the period. Includes adjustments in accordance with U.S. generally accepted accounting principles and could differ from the Lipper reported return.
^ The net expense ratio may not correlate to the applicable expense limits in place during the period since the current contractual expense limitation is applied for a two year period beginning July 1, 2019 and in effect through June 30, 2021, instead of coinciding with the Fund's fiscal year end. Details of the current contractual expense limitation in effect can be found in Note 4 of the accompanying Notes to Financial Statements.
(a) Reflects total annual operating expenses for reductions of expenses paid indirectly for the March 31 fiscal years ended 2017 and 2016. Expenses paid indirectly decreased the expense ratio for each of these respective years by less than 0.01%.
(b) Portfolio turnover is calculated on the basis of the Fund as a whole without distinguishing between the classes of shares issued.
(c) Per share net investment income (loss) has been calculated using the average daily shares method.
(d) Amount is less than $0.005 per share.
See notes to financial statements.
22
USAA Mutual Funds Trust | Financial Highlights — continued | ||||||
For a Share Outstanding Throughout Each Period
Ratios to Average Net Assets | Supplemental Data | ||||||||||||||||||||||||||||||||||
| Redemption fees added to beneficial interests | Net Asset Value, End of Period | Total Return* | Net Expenses^(a) | Net Investment Income (Loss) | Gross Expenses(a) | Net Assets, End of Period (000's) | Portfolio Turnover(b) | ||||||||||||||||||||||||||||
USAA California Bond Fund | |||||||||||||||||||||||||||||||||||
Fund Shares | |||||||||||||||||||||||||||||||||||
| Year Ended March 31, 2020 | — | $ | 11.17 | 3.62 | % | 0.53 | % | 2.66 | % | 0.53 | % | $ | 677,785 | 33 | % | ||||||||||||||||||||
| Year Ended March 31, 2019 | — | $ | 11.07 | 4.61 | % | 0.52 | % | 3.15 | % | 0.52 | % | $ | 691,391 | 18 | % | ||||||||||||||||||||
| Year Ended March 31, 2018 | — | $ | 10.92 | 3.37 | % | 0.51 | % | 3.32 | % | 0.51 | % | $ | 674,498 | 6 | % | ||||||||||||||||||||
| Year Ended March 31, 2017 | — | $ | 10.92 | 0.01 | % | 0.51 | % | 3.34 | % | 0.51 | % | $ | 669,435 | 26 | % | ||||||||||||||||||||
| Year Ended March 31, 2016 | — | $ | 11.29 | 3.98 | % | 0.56 | % | 3.74 | % | 0.56 | % | $ | 698,731 | 9 | % | ||||||||||||||||||||
Adviser Shares | |||||||||||||||||||||||||||||||||||
| Year Ended March 31, 2020 | — | $ | 11.16 | 3.36 | % | 0.78 | % | 2.41 | % | 0.78 | % | $ | 6,381 | 33 | % | ||||||||||||||||||||
| Year Ended March 31, 2019 | — | $ | 11.06 | 4.37 | % | 0.76 | % | 2.92 | % | 0.76 | % | $ | 7,005 | 18 | % | ||||||||||||||||||||
| Year Ended March 31, 2018 | — | $ | 10.91 | 3.12 | % | 0.75 | % | 3.08 | % | 0.75 | % | $ | 6,985 | 6 | % | ||||||||||||||||||||
| Year Ended March 31, 2017 | — | (d) | $ | 10.91 | (0.24 | )% | 0.75 | % | 3.09 | % | 0.75 | % | $ | 7,083 | 26 | % | |||||||||||||||||||
| Year Ended March 31, 2016 | — | $ | 11.28 | 3.73 | % | 0.80 | % | 3.49 | % | 0.80 | % | $ | 8,303 | 9 | % | ||||||||||||||||||||
See notes to financial statements.
23
USAA Mutual Funds Trust | Notes to Financial Statements March 31, 2020 | ||||||
1. Organization:
USAA Mutual Funds Trust (the "Trust") is organized as a Delaware statutory trust and is registered under the Investment Company Act of 1940, as amended (the "1940 Act"), as an open-end investment company. The Trust is comprised of 47 funds and is authorized to issue an unlimited number of shares, which are units of beneficial interest with no par value.
The accompanying financial statements are those of the USAA California Bond Fund (the "Fund"). The Fund offers two classes of shares: Fund Shares and Adviser Shares. The Fund is classified as diversified under the 1940 Act.
Each class of shares of the Fund has substantially identical rights and privileges except with respect to fees paid under distribution plans, expenses allocable exclusively to each class of shares, voting rights on matters solely affecting a single class of shares, and the exchange privilege of each class of shares.
On November 6, 2018, United Services Automobile Association ("USAA"), the parent company of USAA Asset Management Company ("AMCO"), the investment adviser to the Fund, and USAA Transfer Agency Company, d/b/a USAA Shareholder Account Services ("SAS"), the transfer agent to the Fund, announced that AMCO and SAS would be acquired by Victory Capital Holdings Inc., a global investment management firm headquartered in Cleveland, Ohio (the "Transaction"). The Transaction closed on July 1, 2019. A special shareholder meeting was held on April 18, 2019, at which shareholders of the Fund approved a new investment advisory agreement between the Trust, on behalf of the Fund, and Victory Capital Management Inc. ("VCM" or "Adviser"). Effective July 1, 2019, VCM replaced AMCO as the investment adviser to the Fund and Victory Capital Transfer Agency Company replaced SAS as the Fund's transfer agent. In addition, effective on that same date, shareholders of the Fund also elected the following two new directors to the Board of the Trust to serve upon the closing of the Transaction: (1) David C. Brown, to serve as an Interested Trustee; and (2) John C. Walters, to serve as an Independent Trustee.
Under the Trust's organizational documents, its officers and trustees are indemnified against certain liabilities arising out of the performance of their duties to the Fund. In addition, in the normal course of business, the Fund enters into contracts with its vendors and others that provide for general indemnifications. The Fund's maximum exposure under these arrangements is unknown, as this would involve future claims that may be made against the Fund. However, based on experience, the Fund expects that risk of loss to be remote.
2. Significant Accounting Policies:
The following is a summary of significant accounting policies followed by the Trust in the preparation of its financial statements. The policies are in conformity with generally accepted accounting principles in the United States of America ("GAAP"). The preparation of financial statements in accordance with GAAP requires management to make estimates and assumptions that affect the reported amounts of assets and liabilities and disclosure of contingent assets and liabilities at the date of the financial statements and the reported amounts of income and expenses for the period. Actual results could differ from those estimates. The Fund follows the specialized accounting and reporting requirements under GAAP that are applicable to investment companies under Accounting Standards Codification Topic 946.
Investment Valuation:
The Fund records investments at fair value. Fair value is defined as the price that would be received to sell an asset or paid to transfer a liability in an orderly transaction between market participants at the measurement date.
The valuation techniques described below maximize the use of observable inputs and minimize the use of unobservable inputs in determining fair value. The inputs used for valuing the Fund's investments are summarized in the three broad levels listed below:
• Level 1 — quoted prices in active markets for identical securities
• Level 2 — other significant observable inputs (including quoted prices for similar securities or interest rates applicable to those securities, etc.)
24
USAA Mutual Funds Trust | Notes to Financial Statements — continued March 31, 2020 | ||||||
• Level 3 — significant unobservable inputs (including the Fund's own assumptions in determining the fair value of investments)
Changes in valuation techniques may result in transfers in or out of an assigned level within the disclosure hierarchy. The inputs or methodologies used for valuation techniques are not necessarily an indication of the risk associated with entering into those investments.
The Trust's Adviser has established the Pricing and Liquidity Committee (the "Committee"), and subject to the Trust's Board of Trustees (the "Board") oversight, the Committee administers and oversees the Fund's valuation policies and procedures, which are approved by the Board.
Debt securities of United States ("U.S.") issuers, along with corporate and municipal securities, including short-term investments maturing in 60 days or less, may be valued using evaluated bid or the last sales price to price securities by dealers or an independent pricing service approved by the Board. These valuations are typically categorized as Level 2 in the fair value hierarchy.
Effective July 1, 2019, the valuation methodology applied to certain debt securities changed. Securities that were previously valued at an evaluated mean are now valued at the evaluated bid or the last sales price.
In the event that price quotations or valuations are not readily available, are not reflective of market value, or a significant event has been recognized in relation to a security or class of securities, the securities are valued in good faith by the Committee in accordance with valuation procedures approved by the Board. These valuations typically are categorized as Level 2 or Level 3 in the fair value hierarchy, based on the observability of inputs used to determine the fair value. The effect of fair value pricing is that securities may not be priced on the basis of quotations from the primary market in which they are traded and the actual price realized from the sale of a security may differ materially from the fair value price. Valuing these securities at fair value is intended to cause the Fund's net asset value ("NAV") to be more reliable than it otherwise would be.
A summary of the valuations as of March 31, 2020, based upon the three levels defined above, is included in the table below while the breakdown, by category, of investments is disclosed in the Schedule of Portfolio Investments (amounts in thousands):
Level 1 | Level 2 | Level 3 | Total | ||||||||||||||||
Municipal Bonds | $ | — | $ | 680,515 | $ | — | $ | 680,515 | |||||||||||
Total | $ | — | $ | 680,515 | $ | — | $ | 680,515 | |||||||||||
For the year ended March 31, 2020, there were no transfers in or out of the Level 3 fair value hierarchy.
Securities Purchased on a Delayed-Delivery or When-Issued Basis:
The Fund may purchase securities on a delayed-delivery or when-issued basis. Delivery and payment for securities that have been purchased by the Fund on a delayed-delivery or when-issued basis or for delayed draws on loans can take place a month or more after the trade date. At the time the Fund makes the commitment to purchase a security on a delayed-delivery or when-issued basis, the Fund records the transaction and reflects the value of the security in determining net asset value. No interest accrues to the Fund until the transaction settles and payment takes place. A segregated account is established and the Fund maintains cash and/or marketable securities at least equal in value to commitments for delayed-delivery or when-issued securities. If the Fund owns delayed-delivery or when-issued securities, these values are included in Payable for investments purchased on the accompanying Statement of Assets and Liabilities and the segregated assets are identified in the Schedule of Portfolio Investments.
Municipal Obligations:
The values of municipal obligations can fluctuate and may be affected by adverse tax, legislative, or political changes, and by financial developments affecting municipal issuers. Payment of municipal obligations may depend on a relatively limited source of revenue, resulting in greater credit risk.
25
USAA Mutual Funds Trust | Notes to Financial Statements — continued March 31, 2020 | ||||||
Future changes in federal tax laws or the activity of an issuer may adversely affect the tax-exempt status of municipal obligations.
Investment Transactions and Related Income:
Changes in holdings of investments are accounted for no later than one business day following the trade date. For financial reporting purposes, however, investment transactions are accounted for on trade date on the last business day of the reporting period. Interest income is determined on the basis of coupon interest accrued using the effective interest method which adjusts, where applicable, the amortization of premiums or accretion of discount. Gains or losses realized on sales of securities are determined by comparing the identified cost of the security lot sold with the net sales proceeds.
Federal Income Taxes:
It is the Fund's policy to continue to qualify as a regulated investment company by complying with the provisions available to certain investment companies, as defined in applicable sections of the Internal Revenue Code, and to make distributions of net investment income and net realized gains sufficient to relieve it from all, or substantially all, federal income taxes. Accordingly, no provision for federal income taxes is required in the financial statements. The Fund has a tax year end of March 31.
Management of the Fund has reviewed tax positions taken in tax years that remain subject to examination by all major tax jurisdictions, including federal (i.e., the last four tax years which includes the current fiscal tax year end). Management believes that there is no tax liability resulting from unrecognized tax benefits related to uncertain tax positions taken.
Allocations:
Expenses directly attributable to the Fund are charged to the Fund, while expenses which are attributable to more than one fund in the Trust, or jointly with an affiliated trust, are allocated among the respective funds in the Trust and/or affiliated trust based upon net assets or another appropriate basis.
Income, expenses (other than class-specific expenses such as transfer agent fees, state registration fees, distribution and service 12b-1 fees, and printing fees), and realized and unrealized gains or losses on investments are allocated to each class of shares based on its relative net assets on the date income is earned or expenses and realized and unrealized gains and losses are incurred.
Cross-Trade Transactions:
Pursuant to Rule 17a-7 under the 1940 Act, the Fund may engage in cross-trades which are securities transactions with affiliated investment companies and advisory accounts managed by the Adviser and any applicable sub-adviser. Any such purchase or sale transaction must be effected without brokerage commission or other remuneration, except for customary transfer fees. The transaction must be effected at the current market price, which is either the security's last sale price on an exchange or, if there are no transactions in the security that day, at the average of the highest bid and lowest asked price. For the year ended March 31, 2020, the Fund engaged in the following securities transactions with affiliated funds, which resulted in the following net realized gains (losses)(amounts in thousands):
| Purchases | Sales | Net Realized Gains (Losses) | |||||||||
| $ | 51,990 | $ | 7,485 | $ | — | ||||||
Fees Paid Indirectly:
Expense offsets to custody fees that arise from credits on cash balances maintained on deposit are reflected on the Statement of Operations, as applicable, as "Fees paid indirectly."
26
USAA Mutual Funds Trust | Notes to Financial Statements — continued March 31, 2020 | ||||||
3. Purchases and Sales:
Cost of purchases and proceeds from sales/maturities of securities (excluding securities maturing less than one year from acquisition) for the year ended March 31, 2020, were as follows for the Fund (amounts in thousands):
| Excluding U.S. Government Securities | |||||||
Purchases | Sales | ||||||
$ | 224,555 | $ | 271,808 | ||||
There were no purchases and sales of U.S. government securities during the year ended March 31, 2020.
4. Fees and Transactions with Affiliates and Related Parties:
Investment Advisory and Management Fees:
Effective with the Transaction on July 1, 2019, investment advisory services are provided to the Fund by the Adviser, a New York corporation registered as an investment adviser with the Securities and Exchange Commission ("SEC"). The Adviser is a wholly-owned indirect subsidiary of Victory Capital Holdings, Inc., a publicly traded Delaware corporation, and a wholly-owned direct subsidiary of Victory Capital Operating, LLC. Under the terms of the Investment Advisory Agreement, the Adviser is entitled to receive a base fee and a performance adjustment. The Fund's base fee is accrued daily and paid monthly, is computed as a percentage of the Fund's average daily net assets at annualized rates of 0.50% of the first $50 million of average daily net assets, 0.40% of that portion of average daily net assets over $50 million but not over $100 million, and 0.30% of that portion of average daily net assets over $100 million. The amount incurred and paid to VCM from July 1, 2019 through March 31, 2020, are $1,756 thousand and is reflected on the Statement of Operations as Investment Advisory fees.
Prior to the Transaction on July 1, 2019, AMCO provided investment management services to the Fund pursuant to an Advisory Agreement. Under this agreement, AMCO was responsible for managing the business and affairs of the Fund, and for directly managing day-to-day investment of the Fund's assets, subject to the authority of and supervision by the Board. The investment management fee for the Fund was comprised of a base fee and a performance adjustment. The Fund's base fee was accrued daily and paid monthly, was computed as a percentage of the Fund's average daily net assets at annualized rates of 0.50% of the first $50 million of average daily net assets, 0.40% of that portion of average daily net assets over $50 million but not over $100 million, and 0.30% of that portion of average daily net assets over $100 million.
Effective with the Transaction on July 1, 2019, no performance adjustments will be made for periods beginning July 1, 2019 through June 30, 2020. Only performance beginning as of July 1, 2019, and thereafter will be utilized in calculating future performance adjustments. Prior to the Transaction on July 1, 2019, the performance adjustment for each share class was calculated monthly by comparing the Fund's performance to that of the Lipper California Municipal Debt Funds Index.
The performance period for each share class consists of the current month plus the previous 35 months (or the number of months beginning July 1, 2019, if fewer). The following table is utilized to determine the extent of the performance adjustment:
| Over/Under Performance Relative to Index (in basis points)(a) | Annual Adjustment Rate (in basis points)(a) | ||||||
+/- 20 to 50 | +/- 4 | ||||||
+/- 51 to 100 | +/- 5 | ||||||
+/- 101 and greater | +/- 6 | ||||||
(a) Based on the difference between average annual performance of the relevant share class of the Fund and its relevant index, rounded to the nearest basis point. Average daily net assets of the share class are calculated over a rolling 36-month period.
27
USAA Mutual Funds Trust | Notes to Financial Statements — continued March 31, 2020 | ||||||
Each class' annual performance adjustment rate is multiplied by the average daily net assets of each respective class over the entire performance period, which is then multiplied by a fraction, the numerator of which is the number of days in the month and the denominator of which is 365 (366 in leap years). The resulting amount is then added to (in the case of overperformance), or subtracted from (in the case of underperformance) the base fee.
Under the performance fee arrangement, each class pays a positive performance fee adjustment for a performance period whenever the class outperforms the Lipper California Municipal Debt Funds Index over that period, even if the class has overall negative returns during the performance period.
For the period April 1, 2019 through June 30, 2019, the performance adjustment for Fund Shares was $22 thousand and less than 0.01% of net assets. The Advisor Shares did not incur any performance adjustments. Base fees incurred and paid to AMCO from April 1, 2019 through June 30, 2019, were $564 thousand and reflected on the Statement of Operations as Investment Advisory fees.
Administration and Servicing Fees:
Effective with the Transaction on July 1, 2019, VCM serves as the Fund's administrator and fund accountant. Under the Fund Administration, Servicing and Accounting Agreement, VCM is paid for its services an annual fee at a rate of 0.15% of average daily net assets for both the Fund Shares and Adviser Shares. Amounts incurred from July 1, 2019 through March 31, 2020, are $802 and $8 thousand for Fund Shares and Adviser Shares, respectively. These amounts are reflected on the Statement of Operations as Administration fees.
Prior to the Transaction on July 1, 2019, AMCO provided certain administration and servicing functions for the Fund. For such services, AMCO received a fee accrued daily and paid monthly at an annualized rate of 0.15% of average daily net assets for both the Fund Shares and Adviser Shares. Amounts incurred from April 1, 2019 through June 30, 2019, were $261and $3 thousand for Fund Shares and Adviser Shares, respectively. These amounts are reflected on the Statement of Operations as Administration fees.
Effective with the Transaction on July 1, 2019, the Fund (as part of the Trust) has entered into an agreement to provide compliance services with the Adviser, pursuant to which the Adviser furnishes its compliance personnel, including the services of the Chief Compliance Officer ("CCO"), and other resources reasonably necessary to provide the Trust with compliance oversight services related to the design, administration and oversight of a compliance program for the Trust in accordance with Rule 38a-1 under the 1940 Act. The CCO is an employee of the Adviser, which pays the compensation of the CCO and support staff. Funds in the Trust, Victory Variable Insurance Funds, Victory Portfolios and Victory Portfolios II (collectively, the "Victory Funds Complex") in the aggregate, compensates the Adviser for these services. The amount incurred during the period from July 1, 2019 through March 31, 2020, is reflected on the Statement of Operations as Compliance fees.
Effective with the Transaction on July 1, 2019, Citi Fund Services Ohio, Inc. ("Citi"), an affiliate of Citibank, acts as sub-administrator and sub-fund accountant to the Fund pursuant to a Sub- Administration and Sub-Fund Accounting Services Agreement between VCM and Citi. VCM pays Citi a fee for providing these services. The Trust reimburses VCM and Citi for all of their reasonable out-of- pocket expenses incurred in providing these services and certain other expenses specifically allocated to the Funds, under the Fund Administration, Servicing, and Accounting Agreement. The amount incurred during the period from July 1, 2019 through March 31, 2020, is reflected on the Statement of Operations as Sub-Administration fees.
In addition to the services provided under its Administration and Servicing Agreement with the Fund, AMCO also provided certain compliance and legal services for the benefit of the Fund prior to the Transaction on July 1, 2019. The Board approved the reimbursement of a portion of these expenses incurred by AMCO. Amounts reimbursed by the Fund to AMCO for these compliance and legal services are presented on the Statement of Operations as Professional fees.
Transfer Agency Fees:
Effective with the Transaction on July 1, 2019, Victory Capital Transfer Agency, Inc. ("VCTA"), (formerly, USAA Shareholder Account Services ("SAS")), provides transfer agency services to the Fund. VCTA, an
28
USAA Mutual Funds Trust | Notes to Financial Statements — continued March 31, 2020 | ||||||
affiliate of the Adviser, provides transfer agent services to the Fund Shares and Adviser Shares based on an annual charge of $25.50 per shareholder account plus out-of-pocket expenses. VCTA pays a portion of these fees to certain intermediaries for the administration and servicing of accounts that are held with such intermediaries. Amounts incurred and paid to VCTA from July 1, 2019 through March 31, 2020, was $118 and $1 thousand for the Fund Shares and Adviser Shares, respectively. Amounts incurred and paid to SAS from April 1, 2019 through June 30, 2019, was $38 and less than $1 thousand for the Fund Shares and Adviser Shares, respectively. These amounts are reflected on the Statement of Operations as Transfer agent fees.
Effective with the Transaction on July 1, 2019, FIS Investor Services LLC serves as sub-transfer agent and dividend disbursing agent for the Fund pursuant to a Sub-Transfer Agent agreement between VCTA and FIS Investor Services LLC. VCTA provides FIS Investor Services LLC a fee for providing these services.
Distribution and Service 12b-1 Fees:
Effective with the Transaction on July 1, 2019, Victory Capital Advisers, Inc. (the "Distributor"), an affiliate of the Adviser, serves as distributor for the continuous offering of the Adviser Shares pursuant to a Distribution Agreement between the Distributor and the Trust. Effective on or about June 30, 2020, the Distributor's name will change to Victory Capital Services, Inc. Pursuant to the Distribution and Service Plans adopted in accordance with Rule 12b-1 under the 1940 Act, the Distributor may receive a monthly distribution and service fee, at an annual rate of up to 0.25% of the average daily net assets of the Adviser Shares. Amounts incurred and paid to the Distributor from July 1, 2019 through March 31, 2020, are $14 thousand and reflected on the Statement of Operations as 12b-1 fees.
Adviser Shares are offered and sold without imposition of an initial sales charge or a contingent deferred sales charge.
Prior to the Transaction on July 1, 2019, the Fund adopted a plan pursuant to Rule 12b-1 under the 1940 Act with respect to the Adviser Shares. Under the plan, the Adviser Shares paid fees to USAA Investment Management Company ("IMCO"), the distributor, for distribution and shareholder services. IMCO paid all or a portion of such fees to intermediaries that made the Adviser Shares available for investment by their customers. The fee was accrued daily and paid monthly at an annual rate of 0.25% of the Adviser Shares' average daily net assets. IMCO also provided exclusive underwriting and distribution of the Fund's shares on a continuing best-efforts basis and received no fee or other compensation for these services, but may have received 12b-1 fees as described above, with respect to Adviser Shares. Amounts incurred and paid to IMCO from April 1, 2019 through June 30, 2019, were $4 thousand and reflected on the Statement of Operations as 12b-1 fees.
Other Fees:
Prior to the Transaction on July 1, 2019, State Street Bank and Trust Company served as the Fund's accounting agent and custodian.
Effective August 5, 2019, Citibank, N.A., serves as the Fund's custodian.
K&L Gates LLP provides legal services to the Trust.
Effective with the Transaction on July 1, 2019, the Adviser has entered into an expense limitation agreement with the Fund until at least June 30, 2021. Under the terms of the agreement, the Adviser has agreed to waive fees or reimburse certain expenses to the extent that ordinary operating expenses incurred by certain classes of the Fund in any fiscal year exceed the expense limit for such classes of the Fund. Such excess amounts will be the liability of the Adviser. Interest, taxes, brokerage commissions, other expenditures which are capitalized in accordance with GAAP, and other extraordinary expenses not incurred in the ordinary course of the Fund's business are excluded from the expense limits. Effective July 1, 2019 through March 31, 2020, the expense limit (excluding voluntary waivers) is 0.54% and 0.80% for the Fund Shares and Adviser Shares, respectively.
29
USAA Mutual Funds Trust | Notes to Financial Statements — continued March 31, 2020 | ||||||
Under this expense limitation agreement, the Fund has agreed to repay fees and expenses that were waived or reimbursed by the Adviser for a period up to three years after the fiscal year in which the waiver or reimbursement took place, subject to the lesser of any operating expense limits in effect at the time of: (a) the original waiver or expense reimbursement; or (b) the recoupment, after giving effect to the recoupment amount. As of March 31, 2020, there are no amounts available to be repaid to the Adviser.
The Adviser, may voluntarily waive or reimburse additional fees to assist the Fund in maintaining competitive expense ratios. Voluntary waivers and reimbursements applicable to the Fund are not available to be recouped at a future time. There were no voluntary waivers or reimbursements for the year ended March 31, 2020.
Certain officers and/or interested trustees of the Fund are also officers and/or employees of the Adviser, Administrator, Sub-Administrator, Sub-Fund Accountant, and Legal.
5. Risks:
The Fund may be subject to other risks in addition to these identified risks.
The Fund may be subject to various risks as described in the Fund's prospectus. A widespread health crisis such as a global pandemic could cause substantial market volatility, exchange trading suspensions and closures, impact the ability to complete redemptions, and affect Fund performance. For example, the novel coronavirus disease (COVID-19) has resulted in significant disruptions to global business activity that may continue, worsen and/or trigger other factors impacting the liquidity or value of investments. The impact of health crises and other epidemics and pandemics may affect the global economy in ways that cannot necessarily be foreseen at the present time. Health crises may exacerbate other pre-existing political, social, and economic risks. Any such impact could adversely affect the Funds' performance, resulting in losses to your investment. For more information, please refer to the "Principal risks" section of the Fund's prospectus.
The fixed-income securities in the Fund's portfolio are subject to credit risk, which is the possibility that an issuer of a fixed-income security will fail to make timely interest and/or principal payments on its securities or that negative market perceptions of the issuer's ability to make such payments will cause the price of that security to decline. The Fund accepts some credit risk as a recognized means to enhance an investor's return. All fixed-income securities, varying from the highest quality to the very speculative, have some degree of credit risk. Fixed-income securities rated below investment grade, also known as "junk" or high-yield bonds, generally entail greater economic, credit, and liquidity risk than investment-grade securities. Their prices may be more volatile, especially during economic downturns, financial setbacks, or liquidity events.
The Fund is subject to the risk that the market value of the bonds in its portfolio will fluctuate because of changes in interest rates, changes in the supply of and demand for tax-exempt securities, and other market factors. Bond prices generally are linked to the prevailing market interest rates. In general, when interest rates rise, bond prices fall; conversely, when interest rates fall, bond prices rise. The price volatility of a bond also depends on its duration. Generally, the longer the duration of a bond, the greater is its sensitivity to interest rates. To compensate investors for this higher interest rate risk, bonds with longer durations generally offer higher yields than bonds with shorter durations. Decisions by the U.S. Federal Reserve regarding interest rate and monetary policy can have a significant effect on the value of debt securities as well as the overall strength of the U.S. economy. Precise interest rate predictions are difficult to make, and interest rates may change unexpectedly and dramatically in response to extreme changes in market or economic conditions. Interest rates have been unusually low in recent years in the U.S. and abroad, and central banks have reduced rates further in an effort to combat the economic effects of the COVID-19 pandemic. Extremely low or negative interest rates may become more prevalent or may not work as intended, and the impact on various markets that interest rate or other significant policy changes may have is unknown. The ability of an issuer of a debt security to repay principal prior to a security's maturity can increase the security's sensitivity to interest rate changes.
30
USAA Mutual Funds Trust | Notes to Financial Statements — continued March 31, 2020 | ||||||
During a period of declining interest rates, many municipal bonds may be "called," or redeemed, by the issuer before the stated maturity. An issuer might call, or refinance, a higher-yielding bond for the same reason that a homeowner would refinance a home mortgage. When bonds are called, the Fund is affected in several ways. Most likely, the Fund will reinvest the bond-call proceeds in bonds with lower interest rates. The Fund's income may drop as a result. The Fund also may realize a taxable capital gain (or loss).
Because the Fund invests primarily in California tax-exempt securities, the Fund is more susceptible to adverse economic, political, and regulatory changes affecting tax-exempt securities issuers in that state. For more information, see the SAI.
6. Borrowing and Interfund Lending:
Line of Credit:
Effective with the Transaction on July 1, 2019, the Victory Funds Complex participates in a short-term, demand note "Line of Credit" agreement with Citibank. Under the agreement with Citibank, the Victory Funds Complex could borrow up to $600 million, of which $300 million is committed and $300 million is uncommitted. $40 million of the Line of Credit is reserved for use by the Victory Floating Rate Fund, another series of the Victory Funds Complex, with that Fund paying the related commitment fees for that amount. The purpose of the agreement is to meet temporary or emergency cash needs. Citibank receives an annual commitment fee of 0.15% on $300 million for providing the Line of Credit. Each fund in the Victory Funds Complex pays a pro-rata portion of the commitment fees plus any interest (one month LIBOR plus one percent) on amounts borrowed. Interest charged to the Fund, if any, during the period is presented on the Statements of Operations under line of credit fees.
Prior to the Transaction on July 1, 2019, the line of credit among the Trust, with respect to its funds, and USAA Capital Corporation ("CAPCO") terminated. For the period from April 1, 2019 to June 30, 2019, the Fund paid CAPCO facility fees of $1 thousand.
The average borrowing for the days outstanding and average interest rate for the Fund during the year ended March 31, 2020 were as follows (amounts in thousands):
| Amount Outstanding at March 31, 2020 | Average Borrowing* | Days Borrowings Outstanding | Average Interest Rate* | Maximum Borrowing During the Period | |||||||||||||||
$ | — | $ | 16,500 | 1 | 2.97 | % | $ | 16,500 | |||||||||||
* For the year ended March 31, 2020, based on the number of days borrowings were outstanding.
Interfund Lending:
Effective with the Transaction on July 1, 2019, the Trust and Adviser rely on an exemptive order granted by the SEC in March 2017 (the "Order"), permitting the establishment and operation of an Interfund Lending Facility (the "Facility"). The Facility allows the Fund to directly lend and borrow money to or from any other Fund in the Victory Fund Complex relying upon the Order at rates beneficial to both the borrowing and lending funds. Advances under the Facility are allowed for temporary or emergency purposes. The interfund loan rate is determined, as specified in the Order, by averaging the current repurchase agreement rate and the current bank loan rate. As a Borrower, interest charged to the Fund, if any, during the period is presented on the Statement of Operations under Interest expense on Interfund lending. As a Lender, interest earned by the Fund, if any, during the period is presented on the Statement of Operations under Income on Interfund lending.
31
USAA Mutual Funds Trust | Notes to Financial Statements — continued March 31, 2020 | ||||||
The average borrowing and lending for the days outstanding and average interest rate for the Fund during the year ended March 31, 2020 were as follows (amounts in thousands):
| Borrower or Lender | Amount Outstanding at March 31, 2020 | Average Borrowing* | Days Borrowing Outstanding | Average Interest Rate* | Maximum Borrowing During the Period | ||||||||||||||||||||||
Borrower | $ | — | $ | 3,558 | 7 | 0.97 | % | $ | 5,184 | ||||||||||||||||||
* For the year ended March 31, 2020, based on the number of days borrowings were outstanding.
7. Federal Income Tax Information:
The Fund intends to declare daily and distribute any net investment income monthly. Distributable net realized gains, if any, are declared and paid at least annually.
The amounts of dividends from net investment income and distributions from net realized gains (collectively distributions to shareholders) are determined in accordance with federal income tax regulations, which may differ from GAAP. To the extent these "book/tax" differences are permanent in nature (e.g., net operating loss and distribution reclassification,), such amounts are reclassified within the components of net assets based on their federal tax-basis treatment; temporary differences (e.g., wash sales) do not require reclassification. To the extent dividends and distributions exceed net investment income and net realized gains for tax purposes, they are reported as distributions of capital. Net investment losses incurred by the Fund may be reclassified as an offset to capital on the accompanying Statement of Assets and Liabilities.
As of March 31, 2020, on the Statement of Assets and Liabilities, there were no permanent book-to-tax difference reclassification adjustments.
The tax character of distributions paid during the tax years ended as noted below were as follows (total distributions paid may differ from the Statement of Changes in Net Assets because, for tax purposes, dividends are recognized when actually paid) (amounts in thousands):
Year Ended March 31, 2020 | Year Ended March 31, 2019 | ||||||||||||||||||
Distributions paid from | Distributions paid from | ||||||||||||||||||
| Tax-Exempt Income | Total Distributions Paid | Tax-Exempt Income | Total Distributions Paid | ||||||||||||||||
$ | 19,013 | $ | 19,013 | $ | 21,488 | $ | 21,488 | ||||||||||||
As of the tax year ended March 31, 2020, the components of accumulated earnings (deficit) on a tax basis were as follows (amounts in thousands):
| Undistributed Tax Exempt Income | Distributions Payable | Accumulated Capital and Other Losses | Unrealized Appreciation (Depreciation) | Total Accumulated Earnings (Deficit) | |||||||||||||||
| $ | 1,574 | $ | (1,589 | ) | $ | (3,986 | ) | $ | 27,113 | $ | 23,112 | ||||||||
At March 31, 2020, the Fund had net capital loss carryforwards as shown in the table below (amounts in thousands). It is unlikely that the Board will authorize a distribution of capital gains realized in the future until the capital loss carryforwards have been used.
| Short-Term Amount | Long-Term Amount | Total | |||||||||
| $ | 34 | $ | 3,952 | $ | 3,986 | ||||||
32
USAA Mutual Funds Trust | Notes to Financial Statements — continued March 31, 2020 | ||||||
As of March 31, 2020, the cost basis for federal income tax purposes, gross unrealized appreciation, gross unrealized depreciation, and net unrealized appreciation (depreciation) for investments were as follows (amounts in thousands):
| Cost of Investments for Federal Tax Purposes | Gross Unrealized Appreciation | Gross Unrealized Depreciation | Net Unrealized Appreciation (Depreciation) | ||||||||||||
| $ | 653,402 | $ | 31,849 | $ | (4,736 | ) | $ | 27,113 | |||||||
8. Liquidity Risk Management Program:
The USAA Funds have adopted and implemented a written liquidity risk management program (the "LRMP") as required by Rule 22e-4 under the Investment Company Act of 1940, as amended. The LRMP is reasonably designed to assess and manage the Fund's liquidity risk, taking into consideration the Fund's investment strategy and the liquidity of its portfolio investments during normal and reasonably foreseeable stressed market conditions; its short and long-term cash flow projections; and its cash holdings and access to other liquidity management tools such as available funding sources including the Victory Funds Complex Interfund Lending Facility and Line of Credit (discussed in the Notes to Financial Statements). The USAA Funds' Board of Trustees approved the appointment of the Fund's investment adviser, Victory Capital Management Inc. ("Victory Capital"), as the administrator of the LRMP. At an in-person meeting held on February 26, 2020, Victory Capital provided an oral and written report to the Trustees on the operation and effectiveness of the LRMP during the previous year.
Victory Capital manages liquidity risks associated with the Fund's investments by monitoring, among other things, cash and cash equivalents, any use of derivatives, the concentration of investments, the appropriateness of the Fund's investment strategy, and by classifying every fund investment as either highly liquid, moderately liquid, less liquid or illiquid on at least a monthly basis. To assist with the classification of Fund investments, Victory Capital has retained a third-party provider of liquidity evaluation services. This provider determines preliminary liquidity classifications for all portfolio holdings based upon portfolio-level data and certain assumptions provided by Victory Capital. Victory Capital reviews the preliminary liquidity classifications, and, when appropriate, considers other information including input from the Fund's portfolio managers (including the portfolio managers employed by any investment sub-advisers) in determining final liquidity classifications.
The report from Victory Capital concluded that the Fund did not experience any significant liquidity challenges during the covered period, and the Fund's LRMP is reasonably designed to assess and manage its liquidity risk. The report also concluded that the LRMP continues to operate adequately and effectively to enable Victory Capital to oversee and manage liquidity risk and ensure the Fund is able to meet redemption requests without significant dilution to the remaining investors' interest in the Fund. During the review period, the Fund's portfolio consisted primarily of highly liquid investments, which are defined as cash and any investments reasonably expected to be converted to cash in current market conditions in three business days or less without significantly changing the market value of the investment. Therefore, the Fund has not adopted a Highly Liquid Investment Minimum. The Fund's investments were below the limitation on illiquid investments during the review period. Additionally, Victory Capital indicated that no events occurred that would require the filing of Form N-LIQUID and recommended no material changes to the LRMP.
9. Subsequent Event:
An outbreak of respiratory disease called COVID-19 was first detected in China in December 2019 and subsequently spread internationally. The transmission of COVID-19 and efforts to contain its spread have resulted in international, national and local border closings and other significant travel restrictions and disruptions, significant disruptions to business operations, supply chains and consumer activity, significant challenges in healthcare service preparation and delivery, and quarantines, as well as general concern and uncertainty that has negatively affected the economic environment and that
33
USAA Mutual Funds Trust | Notes to Financial Statements — continued March 31, 2020 | ||||||
occurred subsequent to year end may have a significant negative impact on the operations and profitability of the Funds' investments. These impacts have caused significant volatility and declines in global financial markets, which have caused losses for investors. The impact of the COVID-19 pandemic may be short term or may last for an extended period of time, and in either case could result in a substantial economic downturn or recession. Public health crises may exacerbate other pre-existing political, social, economic, market and financial risks. The extent of the impact to the financial performance of the Funds' investments will depend on future developments, including (i) the duration and spread of the outbreak, (ii) the restrictions and advisories, (iii) the effects on the financial markets, and (iv) the effects on the economy overall, all of which are highly uncertain and cannot be predicted.
The Board of Trustees of USAA Mutual Funds Trust has approved redesignating the Fund's current Adviser Shares as "Class A" shares ("Redesignation"). This change is expected to be effective in late June 2020 ("Redesignation Date").
Class A shares will be available for purchase through financial intermediaries and the Fund will pay ongoing distribution and/or service (12b-1) fees at annual rate of up to 0.25% of the average daily net assets of its Class A shares. In addition, the Transfer Agency fee will convert to an annual basis point rate of 0.10% of daily net assets of its Class A shares from its current flat per account fee. Class A shares will be offered and sold at their public offering price, which is the net asset value per share plus any applicable initial sales charge, also referred to as a "front-end sales load." For purchases on or after the Redesignation Date, Class A Shares will be offered and sold with the imposition of a maximum initial sales charge of up to 2.25% of the offering price of the Fund. A contingent deferred sales charge of up to 0.75% may be imposed on redemptions of Class A shares purchased without an initial sales charge if shares are redeemed within 12 months of purchase.
The Redesignation will be made without the imposition of any sales loads, fees, or other charges to Adviser Shares held in shareholder accounts on the Redesignation Date. The Redesignation will not be considered a taxable event for federal income tax purposes.
34
REPORT OF INDEPENDENT REGISTERED PUBLIC ACCOUNTING FIRM
To the Shareholders and the Board of Trustees of USAA California Bond Fund:
Opinion on the Financial Statements
We have audited the accompanying statement of assets and liabilities of USAA California Bond Fund (the "Fund") (one of the funds constituting USAA Mutual Funds Trust (the "Trust")), including the schedule of portfolio investments, as of March 31, 2020, and the related statement of operations for the year then ended, the statements of changes in net assets for each of the two years in the period then ended, the financial highlights for each of the five years in the period then ended and the related notes (collectively referred to as the "financial statements"). In our opinion, the financial statements present fairly, in all material respects, the financial position of the Fund at March 31, 2020, the results of its operations for the year then ended, the changes in its net assets for each of the two years in the period then ended and its financial highlights for each of the five years in the period then ended, in conformity with U.S. generally accepted accounting principles.
Basis for Opinion
These financial statements are the responsibility of the Trust's management. Our responsibility is to express an opinion on the Fund's financial statements based on our audits. We are a public accounting firm registered with the Public Company Accounting Oversight Board (United States) ("PCAOB") and are required to be independent with respect to the Trust in accordance with the U.S. federal securities laws and the applicable rules and regulations of the Securities and Exchange Commission and the PCAOB.
We conducted our audits in accordance with the standards of the PCAOB. Those standards require that we plan and perform the audit to obtain reasonable assurance about whether the financial statements are free of material misstatement, whether due to error or fraud. The Trust is not required to have, nor were we engaged to perform, an audit of the Trust's internal control over financial reporting. As part of our audits we are required to obtain an understanding of internal control over financial reporting, but not for the purpose of expressing an opinion on the effectiveness of the Trust's internal control over financial reporting. Accordingly, we express no such opinion.
Our audits included performing procedures to assess the risks of material misstatement of the financial statements, whether due to error or fraud, and performing procedures that respond to those risks. Such procedures included examining, on a test basis, evidence regarding the amounts and disclosures in the financial statements. Our procedures included confirmation of securities owned as of March 31, 2020, by correspondence with the custodian and brokers. Our audits also included evaluating the accounting principles used and significant estimates made by management, as well as evaluating the overall presentation of the financial statements. We believe that our audits provide a reasonable basis for our opinion.

We have served as the auditor of one or more Victory Capital investment companies since 1995.
San Antonio, Texas
May 27, 2020
35
USAA Mutual Funds Trust | Supplemental Information March 31, 2020 | ||||||
(Unaudited)
Expense Examples
As a shareholder of the Fund, you may incur two types of costs: (1) transaction costs, and (2) ongoing costs, including management fees and other Fund expenses. These examples are intended to help you understand your ongoing costs (in dollars) of investing in the Fund and to compare these costs with the ongoing costs of investing in other mutual funds.
These examples are based on an investment of $1,000 invested at the beginning of the period and held for the entire period from October 1, 2019, through March 31, 2020.
The Actual Expense figures in the table below provide information about actual account values and actual expenses. You may use the information below, together with the amount you invested, to estimate the expenses that you paid over the period. Simply divide your account value by $1,000 (for example, an $8,600 account value divided by $1,000 = 8.6), then multiply the result by the number in the table under the heading entitled "Actual Expenses Paid During Period" to estimate the expenses you paid on your account during this period.
The Hypothetical Expense figures in the table below provide information about hypothetical account values and hypothetical expenses based on the Fund's actual expense ratio and an assumed rate of return of 5% per year before expenses, which is not the Fund's actual return. The hypothetical account values and expenses may not be used to estimate the actual ending account balance or expenses you paid for the period. You may use this information to compare this 5% hypothetical example with the 5% hypothetical examples that appear in shareholder reports of other funds.
Please note the expenses shown in the table below are meant to highlight your ongoing costs only and do not reflect any transactional costs. If these transactional costs were included, your costs would have been higher.
| Beginning Account Value 10/1/19 | Actual Ending Account Value 3/31/20 | Hypothetical Ending Account Value 3/31/20 | Actual Expenses Paid During Period 10/1/19- 3/31/20* | Hypothetical Expenses Paid During Period 10/1/19- 3/31/20* | Annualized Expense Ratio During Period 10/1/19- 3/31/20* | ||||||||||||||||||||||
Fund Shares | $ | 1,000.00 | $ | 994.20 | $ | 1,022.35 | $ | 2.64 | $ | 2.68 | 0.53 | % | |||||||||||||||
Advisor Shares | 1,000.00 | 992.90 | 1,021.05 | 3.94 | 3.99 | 0.79 | % | ||||||||||||||||||||
* Expenses are equal to the average account value multiplied by the Fund's annualized expense ratio multiplied by 183/366 (the number of days in the most recent fiscal half-year divided by the number of days in the fiscal year).
Proxy Voting and Portfolio Holdings Information
Proxy Voting:
Information regarding the policies and procedures the Fund uses to determine how to vote proxies relating to portfolio securities is available without charge, upon request, by calling (800) 539-3863. The information is also included in the Fund's Statement of Additional Information, which is available on the SEC's website at www.sec.gov.
Information relating to how the Fund voted proxies relating to portfolio securities held during the most recent 12 months ended June 30 is available on the SEC's website at www.sec.gov.
Availability of Schedules of Portfolio Investments:
The Trust files a complete list of Schedules of Portfolio Investments with the SEC for the first and third quarter of each fiscal year on Form N-PORT. Forms N-PORT are available on the SEC's website at www.sec.gov.
36
USAA Mutual Funds Trust | Supplemental Information — continued March 31, 2020 | ||||||
(Unaudited)
Trustee and Officer Information
Board of Trustees:
Overall responsibility for management of the Trust rests with the Board. The Trust is managed by the Board in accordance with the laws of the state of Delaware. There are currently 10 Trustees, eight of whom are not "interested persons" of the Trust within the meaning of that term under the 1940 Act ("Independent Trustees") and two of whom is an "interested person" of the Trust within the meaning of that term under the 1940 Act ("Interested Trustee"). The Trustees, in turn, elect the officers of the Trust to actively supervise its day-to-day operations.
The following tables list the Trustees, their ages, position with the Trust, commencement of service, principal occupations during the past five years and any directorships of other investment companies or companies whose securities are registered under the Securities Exchange Act of 1934, as amended, or who file reports under that Act. Each Trustee oversees 47 portfolios in the Trust. Each Trustee's address is 15935 La Cantera Pkwy, Building Two, San Antonio, TX, 78256. Pursuant to a policy adopted by the Board, the term of office for each Trustee shall be until the Independent Trustee reaches age 75 or an Interested Trustee reaches age 75. The Board may change or grant exceptions from this policy at any time without shareholder approval. A Trustee may resign or be removed by a vote of the other Trustees or the holders of a majority of the outstanding shares of the Trust at any time. Vacancies on the Board can be filled by the action of a majority of the Trustees, provided that after filling such vacancy at least two-thirds of the Trustees have been elected by the shareholders.
Name and Date of Birth | Position Held with the Trust | Year Commenced Service | Principal Occupation During Past 5 Years | Other Directorships Held During Past 5 Years | |||||||||||||||
Independent Trustees. | |||||||||||||||||||
| Jefferson C. Boyce, Born September 1957 | Lead Independent Trustee, and Vice Chairman | 2013 | Senior Managing Director, New York Life Investments, LLC (1992-2012) | Westhab, Inc. | |||||||||||||||
| John C. Walters, Born February 1962 | Trustee | 2019 | Retired. Mr. Walters brings significant Board experience including active involvement with the board of a Fortune 500 company, and a proven record of leading large, complex financial organizations. He has a demonstrated record of success in distribution, manufacturing, investment brokerage, and investment management in both the retail and institutional investment businesses. He has substantial experience in the investment management business with a demonstrated ability to develop and drive strategy while managing operation, financial, and investment risk. | Guardian Variable Products Trust (16 series), Lead Independent Director; Amerilife Holdings LLC, Director; Stadion Money Management; Director; University of North Carolina (Chapel Hill), Member Board of Governors. | |||||||||||||||
37
USAA Mutual Funds Trust | Supplemental Information — continued March 31, 2020 | ||||||
(Unaudited)
Name and Date of Birth | Position Held with the Trust | Year Commenced Service | Principal Occupation During Past 5 Years | Other Directorships Held During Past 5 Years | |||||||||||||||
| Robert L. Mason, Ph.D., Born July 1946 | Trustee | 1997 | Adjunct Professor in the Department of Management Science and Statistics in the College of Business at the University of Texas at San Antonio (since 2001); Institute Analyst, Southwest Research Institute (March 2002-January 2016) | None | |||||||||||||||
| Dawn M. Hawley, Born February 1954 | Trustee | 2014 | Manager of Finance, Menil Foundation, Inc. (May 2007-June 2011), which is a private foundation that oversees the assemblage of sculptures, prints, drawings, photographs, and rare books. Director of Financial Planning and Analysis and Chief Financial Officer, AIM Management Group, Inc. (October 1987-January 2006) | None | |||||||||||||||
| Paul L. McNamara, Born July 1948 | Trustee | 2012 | Director, Cantor Opportunistic Alternatives Fund, LLC (March 2010-February 2014) , which is a closed-end fund of funds by Cantor Fitzgerald Investment Advisors, LLC | None | |||||||||||||||
38
USAA Mutual Funds Trust | Supplemental Information — continued March 31, 2020 | ||||||
(Unaudited)
Name and Date of Birth | Position Held with the Trust | Year Commenced Service | Principal Occupation During Past 5 Years | Other Directorships Held During Past 5 Years | |||||||||||||||
| Richard Y. Newton III, Born January 1956 | Trustee | 2017 | Director, Elta North America (01/18-present), which is a global leader in the design, manufacture, and support of innovative electronic systems in the ground, maritime, airborne, and security domains for the nation's warfighters, security personnel, and first responders; Managing Partner, Pioneer Partnership Development Group (December 2015-present)); Executive Director, The Union League Club of New York (June 2014-November 2015): Executive Vice President, Air Force Association (August 2012-May 2014); Lieutenant General, United States Air Force (January 2008-June 2012) | None | |||||||||||||||
| Barbara B. Ostdiek, Ph.D., Born March 1964 | Trustee | 2008 | Senior Associate Dean of Degree Programs at Jesse H. Jones Graduate School of Business at Rice University (since 2013); Associate Professor of Finance at Jessie H. Jones Graduate School of Business at Rice University (since 2001) | None | |||||||||||||||
| Michael F. Reimherr, Born August 1945 | Trustee | 2000 | President of Reimherr Business Consulting (May 1995-December 2017); St. Mary's University Investment Committee overseeing University Endowment (since 2014) | None | |||||||||||||||
39
USAA Mutual Funds Trust | Supplemental Information — continued March 31, 2020 | ||||||
(Unaudited)
Name and Date of Birth | Position Held with the Trust | Year Commenced Service | Principal Occupation During Past 5 Years | Other Directorships Held During Past 5 Years | |||||||||||||||
Interested Trustees. | |||||||||||||||||||
| David C. Brown, ** Born May 1972 | Trustee | 2019 | Chairman and Chief Executive Officer (since 2013), Co-Chief Executive Officer (2011-2013), Victory Capital Management Inc.; Chairman and Chief Executive Officer, Victory Capital Holdings, Inc. (since 2013). Mr. Brown brings to the Board extensive business, finance and leadership skills gained and developed through years of experience in the financial services industry, including his tenure overseeing the strategic direction as CEO of Victory Capital. These skills, combined with Mr. Brown's extensive knowledge of the financial services industry and demonstrated success in the development and distribution of investment strategies and products, enable him to provide valuable insights to the Board and strategic direction for the Funds | Trustee, Victory Portfolios (42 series), Victory Portfolios II (26 series), Victory Variable Insurance Funds (9 series) | |||||||||||||||
40
USAA Mutual Funds Trust | Supplemental Information — continued March 31, 2020 | ||||||
(Unaudited)
Name and Date of Birth | Position Held with the Trust | Year Commenced Service | Principal Occupation During Past 5 Years | Other Directorships Held During Past 5 Years | |||||||||||||||
| Daniel S. McNamara, ** Born June 1966 | Trustee and Chair of the Board of Trustees | 2012 | Trustee, President, and Vice Chairman of USAA ETF Trust (June 2017-June 2019); President of Financial Advice & Solutions Group (FASG), USAA (since 2013); Director, IMCO (September 2009-April 2014); President, AMCO (August, 2011-April 2013); Senior Vice President of USAA Financial Planning Services Insurance Agency, Inc. (FPS) (since 2011); Director of USAA Investment Management Company (IMCO) (since 2009); Chairman of Board of IMCO (since 2013); Director of USAA Asset Management Company (AMCO), (August 2011-June 2019); President and Director of USAA Shareholder Account Services (SAS)(October 2009-June 2019); Director and Vice Chairman of FPS (since 2013); President and Director of USAA Investment Corporation (ICORP) (since 2010); Chairman of Board of ICORP (since 2013); Director of USAA Financial Advisors, Inc. (FAI) (since 2013); Chairman of Board of FAI (since 2015). Mr. McNamara brings to the Board extensive experience in the financial services industry, including experience as an officer of the Trust. | None | |||||||||||||||
** Mr. McNamara and Mr. Brown are "Interested Persons" by reason of their relationships with the Adviser.
The Statement of Additional Information includes additional information about the Trustees of the Trust and is available, without charge, on the SEC's website at www.sec.gov and/or by calling (800)-539-3863.
41
USAA Mutual Funds Trust | Supplemental Information — continued March 31, 2020 | ||||||
(Unaudited)
Officers:
The officers of the Trust, their ages, commencement of service and their principal occupations during the past five years, are detailed in the following table. Each officer serves until the earlier of his or her resignation, removal, retirement, death, or the election of a successor. The mailing address of each officer of the Trust is 15935 La Cantera Pkwy, Building Two, San Antonio, TX, 78256. The officers of the Trust receive no compensation directly from the Trust for performing the duties of their offices.
Name and Date of Birth | Position with the Trust | Year Commenced Service | Principal Occupation During Past 5 Years | ||||||||||||
Interested Officers. | |||||||||||||||
| Christopher K. Dyer, Born February 1962 | President | 2019 | Director of Fund Administration, Victory Capital (2004-present) | ||||||||||||
| Scott A Stahorsky, Born July 1969 | Vice President | 2019 | Manager, Fund Administration, Victory Capital (since 2015); Senior Analyst, Fund Administration, Victory Capital (prior to 2015) | ||||||||||||
| James K. De Vries, Born April 1969 | Treasurer, Principal Financial Officer | 2018 | Executive Director, Victory Capital Management Inc. (since 2019); Treasurer, USAA ETF Trust (September 2018-June 2019); Executive Director, Investment and Financial Administration, USAA (April 2012-June 2019); Assistant Treasurer, USAA ETF Trust (June 2017-September 2018); Assistant Treasurer, USAA Mutual Funds Trust (December 2013-February 2018) | ||||||||||||
| Allan Shaer, Born March 1965 | Assistant Treasurer | 2019 | Senior Vice President, Financial Administration, Citi Fund Services Ohio, Inc. (since 2016); Vice President, Mutual Fund Administration, JP Morgan Chase (2011-2016) | ||||||||||||
| Carol D. Trevino, Born October 1965 | Assistant Treasurer | 2018 | Director, Accounting and Finance, Victory Capital Management Inc. (since 2019); Accounting/Financial Director, USAA (December 2013-June 2019); Assistant Treasurer, USAA ETF Trust (September 2018-June 2019). | ||||||||||||
| Erin G. Wagner, Born February 1974 | Secretary | 2019 | Deputy General Counsel, the Adviser (since 2013) | ||||||||||||
| Charles Booth, Born April 1960 | Anti-Money Laundering Compliance Officer and Identity Theft Officer | 2019 | Director, Regulatory Administration and CCO Support Services, Citi Fund Services Ohio, Inc. (2007-present) | ||||||||||||
| Amy Campos, Born July 1976 | Chief Compliance Officer | 2019 | Chief Compliance Officer, USAA Mutual Funds Trust (since 2019); Executive Director, Deputy Chief Compliance Officer, USAA Mutual Funds Trust and USAA ETF Trust (July 2017-June 2019); Compliance Director, USAA Mutual Funds Trust (2014-July 2017) | ||||||||||||
42
USAA Mutual Funds Trust | Supplemental Information — continued March 31, 2020 | ||||||
(Unaudited)
Additional Federal Income Tax Information
The following federal tax information related to the Fund's fiscal year ended March 31, 2020, is provided for information purposes only and should not be used for reporting to federal or state revenue agencies. Federal tax information for the calendar year will be reported to you on Form 1099-DIV in January 2021.
With respect to distributions paid, the Fund designates the following amounts (or, if subsequently determined to be different, the maximum amount allowable) for the fiscal year ended March 31, 2020.
| Tax Exempt Income Amount* | |||||||
100.00 | % | ||||||
* Presented as a percentage of net investment income and excludes short-term capital gain distributions paid, if any. All or a portion of these amounts may be exempt from taxation at the state level.
43
Privacy Policy
Protecting the Privacy of Information
The Trust respects your right to privacy. We also know that you expect us to conduct and process your business in an accurate and efficient manner. To do so, we must collect and maintain certain personal information about you. This is the information we collect from you on applications or other forms, and from the transactions you make with us or third parties. It may include your name, address, social security number, account transactions and balances, and information about investment goals and risk tolerance.
We do not disclose any information about you or about former customers to anyone except as permitted or required by law. Specifically, we may disclose the information we collect to companies that perform services on our behalf, such as the transfer agent that processes shareholder accounts and printers and mailers that assist us in the distribution of investor materials. We may also disclose this information to companies that perform marketing services on our behalf. This allows us to continue to offer you Victory investment products and services that meet your investing needs, and to effect transactions that you request or authorize. These companies will use this information only in connection with the services for which we hired them. They are not permitted to use or share this information for any other purpose.
To protect your personal information internally, we permit access only by authorized employees and maintain physical, electronic and procedural safeguards to guard your personal information.*
* You may have received communications regarding information about privacy policies from other financial institutions which gave you the opportunity to "opt-out" of certain information sharing with companies which are not affiliated with that financial institution. The Trust does not share information with other companies for purposes of marketing solicitations for products other than the Trust. Therefore, the Trust does not provide opt-out options to their shareholders.
15935 La Cantera Pkwy
Building Two
San Antonio, Texas 78256

Visit our website at: | Call | ||||||
usaa.com | (800) 235-8396 | ||||||
40860-0520

MARCH 31, 2020
Annual Report
USAA Global Equity Income Fund
Beginning January 1, 2021, as permitted by regulations adopted by the Securities and Exchange Commission, paper copies of the Fund's shareholder reports like this one will no longer be sent by mail, unless you specifically request paper copies of the reports from the Fund or from your financial intermediary, such as a broker-dealer or bank. Instead, the reports will be made available on usaa.com, and you will be notified by mail each time a report is posted and provided with a website link to access the report.
If you already elected to receive shareholder reports electronically, you will not be affected by this change and you need not take any action. You may elect to receive shareholder reports and other communications from the Fund or your financial intermediary electronically by notifying your financial intermediary directly, or if you are a direct investor, by calling (800) 235-8396 or logging on to usaa.com.
You may elect to receive all future reports in paper free of charge. You can inform the Fund or your financial intermediary that you wish to continue receiving paper copies of your shareholder reports by notifying your financial intermediary directly, or if you are a direct investor, by calling (800) 235-8396 or logging on to usaa.com. Your election to receive reports in paper will apply to all funds held with the USAA family of funds or your financial intermediary.
Victory Capital means Victory Capital Management Inc., the investment manager of the USAA Mutual Funds. USAA Mutual Funds are distributed by Victory Capital Services, Inc., member FINRA, an affiliate of Victory Capital. Victory Capital and its affiliates are not affiliated with United Services Automobile Association or its affiliates. USAA and the USAA logo are registered trademarks and the USAA Mutual Funds and USAA Investments logos are trademarks of United Services Automobile Association and are being used by Victory Capital and its affiliates under license.
USAA Mutual Funds Trust
TABLE OF CONTENTS
Shareholder Letter (Unaudited) | 2 | ||||||
Managers' Commentary (Unaudited) | 4 | ||||||
Investment Overview (Unaudited) | 6 | ||||||
| Investment Objective & Portfolio Holdings (Unaudited) | 7 | ||||||
Financial Statements | |||||||
Schedule of Portfolio Investments | 9 | ||||||
Statement of Assets and Liabilities | 19 | ||||||
Statement of Operations | 20 | ||||||
Statements of Changes in Net Assets | 21 | ||||||
Financial Highlights | 22 | ||||||
Notes to Financial Statements | 24 | ||||||
| Report of Independent Registered Public Accounting Firm | 35 | ||||||
Supplemental Information (Unaudited) | 36 | ||||||
Expense Example | 36 | ||||||
Proxy Voting and Portfolio Holdings Information | 36 | ||||||
Trustees' and Officers' Information | 37 | ||||||
Additional Federal Income Tax Information | 43 | ||||||
Privacy Policy (inside back cover) | |||||||
This report is for the information of the shareholders and others who have received a copy of the currently effective prospectus of the Fund, managed by Victory Capital Management Inc. It may be used as sales literature only when preceded or accompanied by a current prospectus, which provides further details about the Fund.
IRA DISTRIBUTION WITHHOLDING DISCLOSURE
We generally must withhold federal income tax at a rate of 10% of the taxable portion of your distribution and, if you live in a state that requires state income tax withholding, at your state's tax rate. However, you may elect not to have withholding apply or to have income tax withheld at a higher rate. Any withholding election that you make will apply to any subsequent distribution unless and until you change or revoke the election. If you wish to make a withholding election, or change or revoke a prior withholding election, call (800) 235-8396.
If you do not have a withholding election in place by the date of a distribution, federal income tax will be withheld from the taxable portion of your distribution at a rate of 10%. If you must pay estimated taxes, you may be subject to estimated tax penalties if your estimated tax payments are not sufficient and sufficient tax is not withheld from your distribution.
For more specific information, please consult your tax adviser.
1
(Unaudited)
Dear Shareholder,
If there were ever a time that illustrated the dynamic and unpredictable nature of financial markets—and life in general—it would be the strange days of early 2020. The spread of COVID-19 throughout the United States and the world has been an unprecedented event that, among so many other impacts, rendered virtually any economic forecasts unreliable. Seemingly overnight, the sentiment pendulum swung from risk-on to risk-off. We all became familiar with unusual concepts like "social distancing" and "flattening the curve."
Given that wide swaths of the global economy came to an all-stop—an event that has no real precedent—there remains tremendous uncertainty as to the depth and extent of the economic downturn. Making assumptions about the extent of the virus' reach, its impact on consumer behavior and employment, and the speed at which the U.S. government and U.S. Federal Reserve (the "Fed") can revive the economy is educated guesswork at best.
Fortunately, it's not all bad news. We did see markets stabilize as this annual reporting period drew to a close (and in the early weeks of April immediately following). As of the writing of this letter, the array of new lending facilities and programs launched by the Fed generally appear to have had their intended effect of improving liquidity and trading, at least in the short-term. Credit spreads across corporate, high-yield, structured, and municipal bond markets were coaxed down from their highs. Trading in equity markets also appeared to stabilize.
The USAA tax-exempt funds generally performed as would be expected given the unusual market environment. Our tax-exempt funds tend to be more credit heavy, holding more BBB-category rated bonds than the average in our peer groups. Typically, we overweight these credits to provide additional tax-free income to our investors, and these securities tend to underperform in periods of market dislocation when credit spreads widen significantly.
We believe that the volatility in the tax-exempt market reflected the lack of liquidity, rather than any significant credit deterioration. It's important to underscore that the USAA tax-exempt funds entered the crisis with ample liquidity and none have yet had to sell portfolio securities at an inopportune price to achieve a fund's desired level of exposure.
Looking ahead, the economy and the markets remain unpredictable. Yet our investment philosophy—and our resolve—is steadfast. A priority of our fixed-income portfolio managers and analysts is to maintain substantial liquidity, as no one can predict when the crisis will abate and what liquidity needs might be in the meantime.
Through it all, we remain committed to our core competency of evaluating, taking and managing credit risk, and we continue to build portfolios bond-by-bond. We believe the recent environment, though breathtaking in its volatility, provides extraordinary buying opportunities that may help us lock in higher tax-free yields for our investors.
2
If you have questions about the current market dynamics or your specific portfolio or investment plan, please give one of our financial representatives a call. They can help ensure that you are properly diversified based on your long-term goals, time horizon, and risk tolerance.
From all of us here at USAA Funds, thank you for letting us help you work toward your investment goals.

Christopher K. Dyer, CFA
President,
USAA Funds
3
USAA Mutual Funds Trust
USAA Global Equity Income Fund
Manager's Commentary
(Unaudited)
Victory Solutions
Mannik S. Dhillon, CFA, CAIA
Wasif A. Latif
• What were the market conditions during the reporting period?
The reporting period began following on the heels of the strong first quarter of 2019 in equities, which had rebounded from the sharp selloff to end 2018. Quarters two and three of 2019 marked mostly flat performance as concerns related to trade negotiations with China, an inverted yield curve, and deteriorating economic indicators cast doubt into how much more longest bull market in history had to run.
The U.S. Federal Reserve (the "Fed") came to the rescue with accommodating monetary policy, cutting interest rates three times throughout 2019. Investor sentiment turned bullish in the fourth quarter of 2019 as economic indicators became more supportive and trade negotiations improved as tariffs that were scheduled to go into effect were averted. As a result, equities finished the fourth quarter of 2019 much the way they started the year with solid gains.
Trade negotiations with China and the 2020 U.S. Presidential election were top of mind to start the first quarter of 2020. A phase one deal between the United States and China was reached in early January, which the market welcomed, but political uncertainty surrounding the U.S. Presidential election and the economic impact of the novel coronavirus ("COVID-19") outbreak in China took hold.
In late February, concerns about the spread of COVID-19 led to a sharp sell-off in equities, with volatility spiking to levels not seen since the 2008 financial crisis. The COVID-19 pandemic led to containment efforts, which all but brought the global economy to a halt. Equities recovered some of the lost ground in the final days of the reporting period through concerted fiscal and monetary stimulus efforts. In the United States, the Fed cut its benchmark overnight lending rate to zero and announced the revival of a range of crisis-era lending facilities and asset-purchase programs. On the fiscal side, Congress passed a $2.2 trillion stimulus package. However, markets remained highly volatile into quarter-end given the uncertainty around the scope and duration of the impact of COVID-19 on the global economy.
For the 12-month period ended March 31, 2020, U.S. stocks returned -6.98% as represented by the S&P 500 Index, while international stocks as represented by the MSCI EAFE Index declined 14.38%. From a sector perspective, Information Technology, Health Care, and Utilities performed the best over the period while Financials, Energy, and Industrials performed the worst. Dividend oriented stocks underperformed the overall market, with the benchmark MSCI World High Dividend Yield Index returning -12.73% vs. -10.39% for the broad MSCI World Index.
4
USAA Mutual Funds Trust
USAA Global Equity Income Fund (continued)
• How did the USAA Global Equity Income Fund (the "Fund") perform during the reporting period?
The Fund has two share classes: Fund Shares and Institutional Shares. For the fiscal year ended March 31, 2020, the Fund Shares and Institutional Shares had a total return of -14.02% and -13.90%, respectively. This compares to returns of -12.73% for the MSCI World High Dividend Yield Index (the "Index").
• What strategies did you employ during the reporting period?
The Fund focuses on income-oriented global equities and normally will have roughly equal weights in U.S. and international stocks, although this will vary to some degree depending on where we see the better value. In selecting stocks, we emphasize not only the current dividend but also a company's likely ability to grow its dividend. As a result, the average current dividend of companies held by the Fund generally will be somewhat lower than the benchmark. However, our view is that a focus on dividend growers should provide an improved total return profile as we invest within the global dividend stock universe.
For the 12-month periods ended March 31, 2020, allocation effects negatively impacted relative performance while stock selection was overall positive. An underweight to Health Care along with an overweight to Consumer Discretionary and Financials dragged on returns, while an underweight to Energy contributed to relative performance. Selection effects in Health Care and Real Estate detracted from relative performance, while stock selection within Information Technology and Consumer Discretionary was supportive.
From a country perspective, stock selection largely detracted from returns while allocation decisions slightly contributed to relative performance against the benchmark. An underweight to Switzerland relative to the benchmark along with negative stock selection in the United Kingdom detracted from performance, while an underweight to Germany modestly contributed to performance relative to the benchmark.
Looking ahead to the Fund's new fiscal year, the global community's united efforts to flatten the coronavirus curve and the duration of the pandemic are central to how quickly the global economy will recover. On a long-term basis, we believe that focusing on quality companies with attractive valuations and dividend income is a sound strategy from a total return perspective.
Thank you for allowing us to assist you with your investment needs.
5
USAA Mutual Funds Trust
USAA Global Equity Income Fund
Investment Overview
(Unaudited)
Average Annual Total Return
Year Ended March 31, 2020
Fund Shares | Institutional Shares | ||||||||||||||||||
INCEPTION DATE | 8/7/15 | 8/7/15 | |||||||||||||||||
Net Asset Value | Net Asset Value | MSCI World High Dividend Yield Index1 | Lipper Global Equity Income Funds Index2 | ||||||||||||||||
One Year | -14.02 | % | -13.90 | % | -12.73 | % | -13.86 | % | |||||||||||
Since Inception | 0.53 | % | 0.59 | % | 2.08 | % | 0.80 | % | |||||||||||
Past performance is not indicative of future results. The performance data quoted represents past performance and current returns may be lower or higher. The investment return and principal value will fluctuate so that an investor's shares, when redeemed, may be worth more or less than the original cost. To obtain performance information current to the most recent month's end, please visit www.usaa.com.
Total return measures the price change in a share assuming the reinvestment of all net investment income and realized capital gain distributions, if any. The total returns
quoted do not reflect adjustments made to the enclosed financial statements in accordance with U.S. generally accepted accounting principles or the deduction of
taxes that a shareholder would pay on net investment income and realized capital gain distributions, including reinvested distributions, or redemptions of shares.
The total return figures set forth above include all waivers of fees for various periods since inception. Without such fee waivers, the total returns would have been
lower.
USAA Global Equity Income Fund — Growth of $10,000
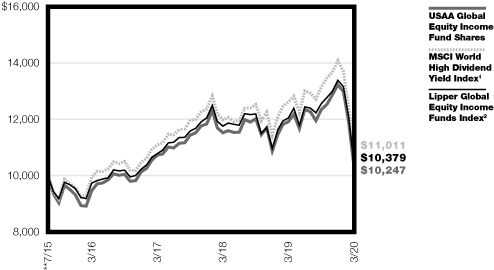
**The performance of the MSCI World High Dividend Yield Index and Lipper Global Equity Income Funds Index are calculated from the end of the month, July 31, 2015, while the inception date of the USAA Global Equity Income Fund is August 7, 2015. There may be a slight variation of performance numbers because of this difference.
1The unmanaged MSCI World High Dividend Yield Index is a free float-adjusted market capitalization weighed index that is designed to measure the equity market performance of developed and emerging markets. There are no expenses associated with the index, while there are expenses associated with the Fund. It is not possible to invest directly in an index.
2The unmanaged Lipper Global Equity Income Funds Index measures the Fund's performance to that of the Lipper Global Equity Income Funds category. There are no expenses associated with the index, while there are expenses associated with the Fund. It is not possible to invest directly in an index.
The graph reflects investment of growth of a hypothetical $10,000 investment in the Fund. Past performance is no guarantee of future results.
The graph and table do not reflect the deduction of taxes that a shareholder would pay on Fund distributions or the redemption of Fund shares.
6
| USAA Mutual Funds Trust USAA Global Equity Income Fund | March 31, 2020 | ||||||
(Unaudited)
Investment Objective & Portfolio Holdings:
The Fund's investment objective seeks total return with an emphasis on current income.
Top 10 Holdings*
March 31, 2020
(% of Net Assets)
Apple, Inc. | 4.3 | % | |||||
The Procter & Gamble Co. | 2.0 | % | |||||
Microsoft Corp. | 1.8 | % | |||||
Walmart, Inc. | 1.7 | % | |||||
Roche Holding AG | 1.5 | % | |||||
Visa, Inc. Class A | 1.5 | % | |||||
The Home Depot, Inc. | 1.5 | % | |||||
AbbVie, Inc. | 1.4 | % | |||||
International Business Machines Corp. | 1.3 | % | |||||
Toyota Motor Corp. | 1.3 | % | |||||
*Does not include futures, money market instruments, and short-term investments purchased with cash collateral from securities loaned.
Refer to the Schedule of Portfolio Investments for a complete list of securities.
7
| USAA Mutual Funds Trust USAA Global Equity Income Fund (continued) | March 31, 2020 | ||||||
(Unaudited)
Sector Allocation*:
March 31, 2020
(% of Net Assets)
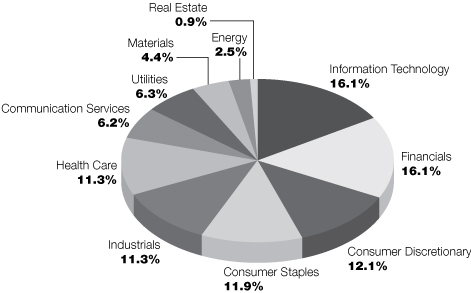
*Does not include futures, money market instruments, and short-term investments purchased with cash collateral from securities loaned.
Percentages are of the net assets of the Fund and may not equal 100%.
8
| USAA Mutual Funds Trust USAA Global Equity Income Fund | Schedule of Portfolio Investments March 31, 2020 | ||||||
(Amounts in Thousands, Except for Shares)
Security Description | Shares | Value | |||||||||
Common Stocks (99.1%) | |||||||||||
Australia (2.3%): | |||||||||||
Financials (0.6%): | |||||||||||
ASX Ltd. | 3,543 | $ | 166 | ||||||||
Insurance Australia Group Ltd. | 42,828 | 162 | |||||||||
National Australia Bank Ltd. | 6,616 | 68 | |||||||||
396 | |||||||||||
Industrials (0.3%): | |||||||||||
Aurizon Holdings Ltd. | 32,737 | 85 | |||||||||
Brambles Ltd. | 13,726 | 88 | |||||||||
173 | |||||||||||
Materials (1.3%): | |||||||||||
BHP Group Ltd. | 41,092 | 745 | |||||||||
Fortescue Metals Group Ltd. | 19,988 | 123 | |||||||||
868 | |||||||||||
Real Estate (0.1%): | |||||||||||
Stockland | 42,395 | 65 | |||||||||
1,502 | |||||||||||
Bermuda (0.2%): | |||||||||||
Industrials (0.2%): | |||||||||||
Jardine Matheson Holdings Ltd. | 2,000 | 101 | |||||||||
Canada (2.1%): | |||||||||||
Communication Services (0.2%): | |||||||||||
Shaw Communications, Inc. Class B | 6,100 | 99 | |||||||||
Consumer Discretionary (0.3%): | |||||||||||
Magna International, Inc. | 5,571 | 178 | |||||||||
Energy (0.2%): | |||||||||||
Canadian Natural Resources Ltd. | 6,562 | 90 | |||||||||
Pembina Pipeline Corp. | 3,300 | 62 | |||||||||
152 | |||||||||||
Financials (1.1%): | |||||||||||
Bank of Montreal | 5,065 | 256 | |||||||||
Manulife Financial Corp. | 13,254 | 166 | |||||||||
Sun Life Financial, Inc. | 3,000 | 96 | |||||||||
The Bank of Nova Scotia | 4,500 | 184 | |||||||||
702 | |||||||||||
Industrials (0.3%): | |||||||||||
Thomson Reuters Corp. | 2,824 | 192 | |||||||||
1,323 | |||||||||||
Denmark (0.2%): | |||||||||||
Health Care (0.2%): | |||||||||||
Novo Nordisk A/S Class B | 2,618 | 156 | |||||||||
See notes to financial statements.
9
| USAA Mutual Funds Trust USAA Global Equity Income Fund | Schedule of Portfolio Investments — continued March 31, 2020 | ||||||
(Amounts in Thousands, Except for Shares)
Security Description | Shares | Value | |||||||||
France (2.1%): | |||||||||||
Communication Services (0.1%): | |||||||||||
Publicis Groupe SA | 2,351 | $ | 67 | ||||||||
Consumer Discretionary (0.4%): | |||||||||||
Cie Generale des Etablissements Michelin SCA | 978 | 86 | |||||||||
Kering SA | 308 | 160 | |||||||||
246 | |||||||||||
Energy (0.3%): | |||||||||||
Total SA | 4,509 | 170 | |||||||||
Financials (1.0%): | |||||||||||
AXA SA | 15,302 | 259 | |||||||||
BNP Paribas SA | 9,453 | 276 | |||||||||
Credit Agricole SA | 20,027 | 142 | |||||||||
677 | |||||||||||
Utilities (0.3%): | |||||||||||
Veolia Environnement SA | 9,907 | 209 | |||||||||
1,369 | |||||||||||
Germany (2.3%): | |||||||||||
Consumer Discretionary (0.3%): | |||||||||||
adidas AG | 841 | 187 | |||||||||
Financials (1.5%): | |||||||||||
Allianz SE | 4,142 | 705 | |||||||||
Deutsche Boerse AG | 1,412 | 194 | |||||||||
Muenchener Rueckversicherungs-Gesellschaft AG Class R | 492 | 99 | |||||||||
998 | |||||||||||
Health Care (0.2%): | |||||||||||
Fresenius SE & Co. KGaA | 3,214 | 120 | |||||||||
Information Technology (0.2%): | |||||||||||
SAP SE | 1,304 | 146 | |||||||||
Materials (0.1%): | |||||||||||
HeidelbergCement AG | 1,533 | 65 | |||||||||
1,516 | |||||||||||
Hong Kong (0.9%): | |||||||||||
Financials (0.6%): | |||||||||||
BOC Hong Kong Holdings Ltd. | 66,500 | 182 | |||||||||
Hang Seng Bank Ltd. | 12,600 | 215 | |||||||||
397 | |||||||||||
Industrials (0.1%): | |||||||||||
Jardine Strategic Holdings Ltd. | 3,300 | 74 | |||||||||
Utilities (0.2%): | |||||||||||
Power Assets Holdings Ltd. | 17,000 | 101 | |||||||||
572 | |||||||||||
See notes to financial statements.
10
| USAA Mutual Funds Trust USAA Global Equity Income Fund | Schedule of Portfolio Investments — continued March 31, 2020 | ||||||
(Amounts in Thousands, Except for Shares)
Security Description | Shares | Value | |||||||||
Ireland (0.9%): | |||||||||||
Communication Services (0.2%): | |||||||||||
WPP PLC | 21,226 | $ | 144 | ||||||||
Health Care (0.2%): | |||||||||||
STERIS PLC | 800 | 112 | |||||||||
Industrials (0.5%): | |||||||||||
Eaton Corp. PLC | 4,044 | 314 | |||||||||
570 | |||||||||||
Italy (0.5%): | |||||||||||
Financials (0.3%): | |||||||||||
Assicurazioni Generali SpA | 16,026 | 217 | |||||||||
Utilities (0.2%): | |||||||||||
Terna Rete Elettrica Nazionale SpA | 19,485 | 122 | |||||||||
339 | |||||||||||
Japan (9.8%): | |||||||||||
Communication Services (2.6%): | |||||||||||
KDDI Corp. | 14,400 | 425 | |||||||||
Nippon Telegraph & Telephone Corp. | 19,200 | 459 | |||||||||
NTT DOCOMO, Inc. | 22,800 | 713 | |||||||||
SoftBank Group Corp. Class C | 3,300 | 117 | |||||||||
1,714 | |||||||||||
Consumer Discretionary (2.3%): | |||||||||||
Bridgestone Corp. | 10,600 | 324 | |||||||||
Honda Motor Co. Ltd. | 8,300 | 186 | |||||||||
Sekisui House Ltd. | 7,500 | 124 | |||||||||
Toyota Motor Corp. | 14,300 | 862 | |||||||||
1,496 | |||||||||||
Consumer Staples (0.2%): | |||||||||||
Seven & i Holdings Co. Ltd. | 4,700 | 155 | |||||||||
Energy (0.4%): | |||||||||||
Inpex Corp. | 19,700 | 111 | |||||||||
JXTG Holdings, Inc. | 34,100 | 116 | |||||||||
227 | |||||||||||
Financials (1.5%): | |||||||||||
ORIX Corp. | 9,100 | 109 | |||||||||
Resona Holdings, Inc. | 29,800 | 89 | |||||||||
Sumitomo Mitsui Financial Group, Inc. | 10,300 | 250 | |||||||||
Tokio Marine Holdings, Inc. | 10,900 | 499 | |||||||||
947 | |||||||||||
Health Care (0.6%): | |||||||||||
Hoya Corp. | 1,300 | 111 | |||||||||
Shionogi & Co. Ltd. | 5,000 | 246 | |||||||||
357 | |||||||||||
See notes to financial statements.
11
| USAA Mutual Funds Trust USAA Global Equity Income Fund | Schedule of Portfolio Investments — continued March 31, 2020 | ||||||
(Amounts in Thousands, Except for Shares)
Security Description | Shares | Value | |||||||||
Industrials (1.0%): | |||||||||||
ITOCHU Corp. | 10,600 | $ | 219 | ||||||||
Mitsubishi Corp. | 11,600 | 245 | |||||||||
Mitsubishi Heavy Industries Ltd. | 4,200 | 106 | |||||||||
Sumitomo Corp. | 8,200 | 94 | |||||||||
664 | |||||||||||
Information Technology (0.3%): | |||||||||||
Fujitsu Ltd. | 900 | 81 | |||||||||
Hitachi Ltd. | 3,700 | 106 | |||||||||
187 | |||||||||||
Materials (0.5%): | |||||||||||
Asahi Kasei Corp. | 24,400 | 171 | |||||||||
Mitsubishi Chemical Holdings Corp. | 24,600 | 146 | |||||||||
317 | |||||||||||
Real Estate (0.1%): | |||||||||||
Daito Trust Construction Co. Ltd. | 1,000 | 93 | |||||||||
Utilities (0.3%): | |||||||||||
Chubu Electric Power Co., Inc. | 12,300 | 174 | |||||||||
6,331 | |||||||||||
Netherlands (2.1%): | |||||||||||
Communication Services (0.1%): | |||||||||||
Koninklijke KPN NV | 40,414 | 97 | |||||||||
Consumer Staples (0.9%): | |||||||||||
Heineken NV | 2,918 | 248 | |||||||||
Koninklijke Ahold Delhaize NV | 14,985 | 349 | |||||||||
597 | |||||||||||
Health Care (0.2%): | |||||||||||
Koninklijke Philips NV | 2,858 | 117 | |||||||||
Industrials (0.4%): | |||||||||||
Randstad NV | 2,179 | 77 | |||||||||
Wolters Kluwer NV | 2,319 | 164 | |||||||||
241 | |||||||||||
Materials (0.5%): | |||||||||||
Akzo Nobel NV | 2,040 | 134 | |||||||||
LyondellBasell Industries NV Class A | 3,600 | 179 | |||||||||
313 | |||||||||||
1,365 | |||||||||||
Norway (0.3%): | |||||||||||
Communication Services (0.2%): | |||||||||||
Telenor ASA | 9,612 | 141 | |||||||||
Energy (0.1%): | |||||||||||
Equinor ASA | 6,285 | 78 | |||||||||
219 | |||||||||||
See notes to financial statements.
12
| USAA Mutual Funds Trust USAA Global Equity Income Fund | Schedule of Portfolio Investments — continued March 31, 2020 | ||||||
(Amounts in Thousands, Except for Shares)
Security Description | Shares | Value | |||||||||
Panama (0.2%): | |||||||||||
Consumer Discretionary (0.2%): | |||||||||||
Carnival Corp. | 7,897 | $ | 104 | ||||||||
Portugal (0.1%): | |||||||||||
Energy (0.1%): | |||||||||||
Galp Energia SGPS SA | 8,068 | 92 | |||||||||
Singapore (0.8%): | |||||||||||
Financials (0.8%): | |||||||||||
DBS Group Holdings Ltd. | 26,800 | 350 | |||||||||
Oversea-Chinese Banking Corp. Ltd. | 14,700 | 89 | |||||||||
United Overseas Bank Ltd. | 6,400 | 88 | |||||||||
527 | |||||||||||
Spain (0.9%): | |||||||||||
Consumer Discretionary (0.4%): | |||||||||||
Industria de Diseno Textil SA | 10,885 | 282 | |||||||||
Energy (0.1%): | |||||||||||
Repsol SA | 7,915 | 71 | |||||||||
Financials (0.2%): | |||||||||||
CaixaBank SA | 58,485 | 108 | |||||||||
Utilities (0.2%): | |||||||||||
Red Electrica Corp. SA | 8,099 | 145 | |||||||||
606 | |||||||||||
Sweden (0.8%): | |||||||||||
Financials (0.5%): | |||||||||||
Skandinaviska Enskilda Banken AB Class A | 24,767 | 166 | |||||||||
Svenska Handelsbanken AB Class A | 13,722 | 113 | |||||||||
279 | |||||||||||
Industrials (0.3%): | |||||||||||
Atlas Copco AB Class A (a) | 6,215 | 207 | |||||||||
486 | |||||||||||
Switzerland (4.5%): | |||||||||||
Consumer Discretionary (0.3%): | |||||||||||
Garmin Ltd. | 2,493 | 187 | |||||||||
Financials (0.7%): | |||||||||||
Zurich Insurance Group AG | 1,226 | 431 | |||||||||
Health Care (2.6%): | |||||||||||
Novartis AG Registered Shares | 8,016 | 661 | |||||||||
Roche Holding AG | 3,061 | 985 | |||||||||
1,646 | |||||||||||
Industrials (0.6%): | |||||||||||
ABB Ltd. Registered Shares | 6,186 | 108 | |||||||||
Geberit AG Registered Shares | 660 | 289 | |||||||||
397 | |||||||||||
See notes to financial statements.
13
| USAA Mutual Funds Trust USAA Global Equity Income Fund | Schedule of Portfolio Investments — continued March 31, 2020 | ||||||
(Amounts in Thousands, Except for Shares)
Security Description | Shares | Value | |||||||||
Materials (0.1%): | |||||||||||
LafargeHolcim Ltd. | 2,542 | $ | 93 | ||||||||
Real Estate (0.2%): | |||||||||||
Swiss Prime Site AG Registered Shares | 1,422 | 138 | |||||||||
2,892 | |||||||||||
United Kingdom (4.2%): | |||||||||||
Communication Services (0.2%): | |||||||||||
| BT Group PLC | 49,755 | 72 | |||||||||
Informa PLC | 11,705 | 64 | |||||||||
136 | |||||||||||
Consumer Discretionary (0.5%): | |||||||||||
Barratt Developments PLC | 17,376 | 94 | |||||||||
Compass Group PLC | 13,160 | 205 | |||||||||
Taylor Wimpey PLC | 38,975 | 56 | |||||||||
355 | |||||||||||
Consumer Staples (1.4%): | |||||||||||
Coca-Cola European Partners PLC | 2,200 | 83 | |||||||||
Imperial Brands PLC | 12,808 | 236 | |||||||||
Unilever NV | 11,764 | 578 | |||||||||
897 | |||||||||||
Energy (0.1%): | |||||||||||
| BP PLC | 17,818 | 73 | |||||||||
Financials (0.3%): | |||||||||||
Aviva PLC | 23,469 | 77 | |||||||||
Legal & General Group PLC | 36,269 | 86 | |||||||||
163 | |||||||||||
Health Care (0.2%): | |||||||||||
Smith & Nephew PLC | 5,733 | 101 | |||||||||
Industrials (0.5%): | |||||||||||
Ferguson PLC | 1,922 | 119 | |||||||||
RELX PLC | 8,774 | 187 | |||||||||
306 | |||||||||||
Information Technology (0.2%): | |||||||||||
The Sage Group PLC | 20,416 | 149 | |||||||||
Materials (0.6%): | |||||||||||
Amcor PLC | 10,800 | 88 | |||||||||
Rio Tinto PLC | 6,842 | 313 | |||||||||
401 | |||||||||||
Utilities (0.2%): | |||||||||||
United Utilities Group PLC | 12,487 | 140 | |||||||||
2,721 | |||||||||||
See notes to financial statements.
14
| USAA Mutual Funds Trust USAA Global Equity Income Fund | Schedule of Portfolio Investments — continued March 31, 2020 | ||||||
(Amounts in Thousands, Except for Shares)
Security Description | Shares | Value | |||||||||
United States (63.9%): | |||||||||||
Communication Services (2.6%): | |||||||||||
AT&T, Inc. | 17,780 | $ | 518 | ||||||||
Comcast Corp. Class A | 2,900 | 100 | |||||||||
Omnicom Group, Inc. | 3,537 | 194 | |||||||||
The Interpublic Group of Co., Inc. | 5,500 | 89 | |||||||||
The Walt Disney Co. | 1,000 | 97 | |||||||||
Verizon Communications, Inc. | 12,493 | 671 | |||||||||
1,669 | |||||||||||
Consumer Discretionary (7.4%): | |||||||||||
Best Buy Co., Inc. | 3,124 | 178 | |||||||||
D.R. Horton, Inc. | 3,396 | 115 | |||||||||
Darden Restaurants, Inc. | 2,301 | 125 | |||||||||
Ford Motor Co. | 46,505 | 225 | |||||||||
General Motors Co. Class C | 9,376 | 195 | |||||||||
Genuine Parts Co. | 1,200 | 81 | |||||||||
Hasbro, Inc. | 2,000 | 143 | |||||||||
Las Vegas Sands Corp. | 5,233 | 222 | |||||||||
Lowe's Cos., Inc. | 4,564 | 393 | |||||||||
McDonald's Corp. | 1,204 | 199 | |||||||||
Ross Stores, Inc. | 5,670 | 493 | |||||||||
Starbucks Corp. | 9,582 | 630 | |||||||||
Target Corp. | 3,579 | 333 | |||||||||
The Home Depot, Inc. | 5,060 | 945 | |||||||||
The TJX Cos., Inc. | 7,045 | 337 | |||||||||
Tractor Supply Co. | 2,234 | 189 | |||||||||
4,803 | |||||||||||
Consumer Staples (9.4%): | |||||||||||
Campbell Soup Co. | 3,100 | 143 | |||||||||
Church & Dwight Co., Inc. | 1,700 | 109 | |||||||||
Colgate-Palmolive Co. | 1,700 | 113 | |||||||||
General Mills, Inc. | 8,686 | 459 | |||||||||
Kimberly-Clark Corp. | 4,452 | 569 | |||||||||
Philip Morris International, Inc. | 5,276 | 385 | |||||||||
Sysco Corp. | 5,985 | 273 | |||||||||
The Clorox Co. | 2,356 | 408 | |||||||||
The Hershey Co. | 1,012 | 134 | |||||||||
The J.M. Smucker Co. | 2,137 | 237 | |||||||||
The Procter & Gamble Co. | 11,801 | 1,298 | |||||||||
Tyson Foods, Inc. Class A | 3,679 | 213 | |||||||||
Walgreens Boots Alliance, Inc. | 13,650 | 625 | |||||||||
Walmart, Inc. | 9,902 | 1,125 | |||||||||
6,091 | |||||||||||
Energy (1.2%): | |||||||||||
Chevron Corp. | 1,200 | 87 | |||||||||
Exxon Mobil Corp. | 2,700 | 103 | |||||||||
ONEOK, Inc. | 1,900 | 41 | |||||||||
See notes to financial statements.
15
| USAA Mutual Funds Trust USAA Global Equity Income Fund | Schedule of Portfolio Investments — continued March 31, 2020 | ||||||
(Amounts in Thousands, Except for Shares)
Security Description | Shares | Value | |||||||||
Phillips 66 | 6,899 | $ | 370 | ||||||||
Pioneer Natural Resources Co. | 2,154 | 151 | |||||||||
752 | |||||||||||
Financials (7.0%): | |||||||||||
Aflac, Inc. | 3,700 | 127 | |||||||||
Ameriprise Financial, Inc. | 2,265 | 232 | |||||||||
Bank of America Corp. | 33,245 | 706 | |||||||||
Capital One Financial Corp. | 2,400 | 121 | |||||||||
Citigroup, Inc. | 11,232 | 473 | |||||||||
Citizens Financial Group, Inc. | 3,500 | 66 | |||||||||
Comerica, Inc. | 1,700 | 50 | |||||||||
Discover Financial Services | 5,963 | 213 | |||||||||
Fifth Third Bancorp | 5,000 | 74 | |||||||||
Huntington Bancshares, Inc. | 13,600 | 112 | |||||||||
M&T Bank Corp. | 2,346 | 243 | |||||||||
MetLife, Inc. | 12,231 | 374 | |||||||||
Prudential Financial, Inc. | 1,700 | 89 | |||||||||
Regions Financial Corp. | 18,696 | 168 | |||||||||
S&P Global, Inc. | 983 | 241 | |||||||||
T. Rowe Price Group, Inc. | 3,535 | 345 | |||||||||
The Allstate Corp. | 2,959 | 271 | |||||||||
The PNC Financial Services Group, Inc. | 2,500 | 239 | |||||||||
The Progressive Corp. | 4,083 | 301 | |||||||||
The Travelers Cos., Inc. | 1,000 | 99 | |||||||||
4,544 | |||||||||||
Health Care (7.1%): | |||||||||||
Abbott Laboratories | 2,500 | 197 | |||||||||
AbbVie, Inc. | 11,767 | 896 | |||||||||
AmerisourceBergen Corp. | 1,500 | 133 | |||||||||
Amgen, Inc. | 761 | 154 | |||||||||
Anthem, Inc. | 951 | 216 | |||||||||
Bristol-Myers Squibb Co. | 3,733 | 208 | |||||||||
Cardinal Health, Inc. | 4,575 | 219 | |||||||||
Danaher Corp. | 1,200 | 166 | |||||||||
Johnson & Johnson | 2,324 | 305 | |||||||||
McKesson Corp. | 1,100 | 149 | |||||||||
Medtronic PLC | 1,900 | 171 | |||||||||
Pfizer, Inc. | 21,908 | 715 | |||||||||
Quest Diagnostics, Inc. | 2,523 | 203 | |||||||||
Stryker Corp. | 700 | 117 | |||||||||
UnitedHealth Group, Inc. | 2,886 | 720 | |||||||||
4,569 | |||||||||||
Industrials (7.1%): | |||||||||||
3M Co. | 3,648 | 498 | |||||||||
C.H. Robinson Worldwide, Inc. | 1,500 | 99 | |||||||||
Cummins, Inc. | 2,769 | 375 | |||||||||
Dover Corp. | 1,500 | 126 | |||||||||
Honeywell International, Inc. | 5,440 | 728 | |||||||||
See notes to financial statements.
16
| USAA Mutual Funds Trust USAA Global Equity Income Fund | Schedule of Portfolio Investments — continued March 31, 2020 | ||||||
(Amounts in Thousands, Except for Shares)
Security Description | Shares | Value | |||||||||
Illinois Tool Works, Inc. | 3,522 | $ | 500 | ||||||||
Ingersoll Rand, Inc. (b) | 2,048 | 51 | |||||||||
Lockheed Martin Corp. | 1,126 | 382 | |||||||||
Norfolk Southern Corp. | 600 | 88 | |||||||||
PACCAR, Inc. | 4,744 | 290 | |||||||||
Parker-Hannifin Corp. | 700 | 91 | |||||||||
Republic Services, Inc. | 1,400 | 105 | |||||||||
Rockwell Automation, Inc. | 2,162 | 326 | |||||||||
Snap-on, Inc. | 700 | 76 | |||||||||
The Boeing Co. | 524 | 78 | |||||||||
Trane Technologies PLC | 2,322 | 192 | |||||||||
Union Pacific Corp. | 3,057 | 431 | |||||||||
United Technologies Corp. | 1,000 | 94 | |||||||||
Waste Management, Inc. | 1,100 | 102 | |||||||||
4,632 | |||||||||||
Information Technology (15.4%): | |||||||||||
Apple, Inc. | 11,059 | 2,812 | |||||||||
Applied Materials, Inc. | 3,336 | 153 | |||||||||
Cisco Systems, Inc. | 18,241 | 717 | |||||||||
Fidelity National Information Services, Inc. | 2,370 | 288 | |||||||||
Intel Corp. | 10,576 | 572 | |||||||||
International Business Machines Corp. | 7,780 | 863 | |||||||||
Juniper Networks, Inc. | 4,700 | 90 | |||||||||
KLA Corp. | 1,000 | 144 | |||||||||
Lam Research Corp. | 1,810 | 434 | |||||||||
Maxim Integrated Products, Inc. | 2,100 | 102 | |||||||||
Microsoft Corp. | 7,546 | 1,190 | |||||||||
NetApp, Inc. | 2,000 | 83 | |||||||||
Oracle Corp. | 16,135 | 780 | |||||||||
Paychex, Inc. | 3,100 | 195 | |||||||||
Texas Instruments, Inc. | 5,638 | 564 | |||||||||
Visa, Inc. Class A | 5,955 | 960 | |||||||||
9,947 | |||||||||||
Materials (1.3%): | |||||||||||
Air Products & Chemicals, Inc. | 715 | 143 | |||||||||
Celanese Corp., Series A | 2,318 | 170 | |||||||||
Packaging Corp. of America | 1,300 | 113 | |||||||||
PPG Industries, Inc. | 1,600 | 134 | |||||||||
RPM International, Inc. | 2,429 | 144 | |||||||||
Westrock Co. | 4,822 | 136 | |||||||||
840 | |||||||||||
Real Estate (0.5%): | |||||||||||
Simon Property Group, Inc. | 3,777 | 207 | |||||||||
Ventas, Inc. | 4,400 | 118 | |||||||||
325 | |||||||||||
See notes to financial statements.
17
| USAA Mutual Funds Trust USAA Global Equity Income Fund | Schedule of Portfolio Investments — continued March 31, 2020 | ||||||
(Amounts in Thousands, Except for Shares)
Security Description | Shares | Value | |||||||||
Utilities (4.9%): | |||||||||||
AES Corp. | 7,400 | $ | 101 | ||||||||
Alliant Energy Corp. | 4,450 | 215 | |||||||||
American Electric Power Co., Inc. | 1,400 | 112 | |||||||||
American Water Works Co., Inc. | 1,100 | 131 | |||||||||
Duke Energy Corp. | 5,706 | 461 | |||||||||
Entergy Corp. | 1,200 | 113 | |||||||||
Eversource Energy | 5,131 | 401 | |||||||||
Exelon Corp. | 9,737 | 358 | |||||||||
OGE Energy Corp. | 2,900 | 89 | |||||||||
Sempra Energy | 1,237 | 140 | |||||||||
The Southern Co. | 2,200 | 119 | |||||||||
WEC Energy Group, Inc. | 4,001 | 353 | |||||||||
Xcel Energy, Inc. | 9,545 | 576 | |||||||||
3,169 | |||||||||||
41,341 | |||||||||||
Total Common Stocks (Cost $72,798) | 64,132 | ||||||||||
Collateral for Securities Loaned^ (0.3%) | |||||||||||
United States (0.3%): | |||||||||||
HSBC U.S. Government Money Market Fund, I Shares, 0.36% (c) | 212,859 | 213 | |||||||||
Total Collateral for Securities Loaned (Cost $213) | 213 | ||||||||||
Total Investments (Cost $73,011) — 99.4% | 64,345 | ||||||||||
Other assets in excess of liabilities — 0.6% | 361 | ||||||||||
NET ASSETS — 100.00% | $ | 64,706 | |||||||||
^ Purchased with cash collateral from securities on loan.
(a) All or a portion of this security is on loan.
(b) Non-income producing security.
(c) Rate disclosed is the daily yield on March 31, 2020.
PLC — Public Limited Company
See notes to financial statements.
18
USAA Mutual Funds Trust | Statement of Assets and Liabilities March 31, 2020 | ||||||
(Amounts in Thousands, Except Per Share Amounts)
| USAA Global Equity Income Fund | |||||||
Assets: | |||||||
Investments, at value (Cost $73,011) | $ | 64,345 | (a) | ||||
Foreign currency, at value (Cost $5) | 5 | ||||||
Cash and cash equivalents | 209 | ||||||
Receivables: | |||||||
Interest and dividends | 203 | ||||||
Capital shares issued | 35 | ||||||
Investments sold | 21 | ||||||
Reclaims | 218 | ||||||
From Adviser | 28 | ||||||
Total assets | 65,064 | ||||||
Liabilities: | |||||||
Payables: | |||||||
Collateral received on loaned securities | 213 | ||||||
Capital shares redeemed | 25 | ||||||
Accrued expenses and other payables: | |||||||
Investment advisory fees | 29 | ||||||
Administration fees | 8 | ||||||
Custodian fees | 2 | ||||||
Transfer agent fees | 4 | ||||||
Compliance fees | — | (b) | |||||
Trustees' fees | 2 | ||||||
Other accrued expenses | 75 | ||||||
Total liabilities | 358 | ||||||
Net Assets: | |||||||
Capital | 73,522 | ||||||
Total distributable earnings/(loss) | (8,816 | ) | |||||
Net assets | $ | 64,706 | |||||
Net Assets | |||||||
Fund Shares | $ | 60,491 | |||||
Institutional Shares | 4,215 | ||||||
Total | $ | 64,706 | |||||
Shares (unlimited number of shares authorized with no par value): | |||||||
Fund Shares | 7,184 | ||||||
Institutional Shares | 500 | ||||||
Total | 7,684 | ||||||
Net asset value, offering and redemption price per share: (c) | |||||||
Fund Shares | $ | 8.42 | |||||
Institutional Shares | $ | 8.43 | |||||
(a) Includes $205 of securities on loan.
(b) Rounds to less than $1 thousand.
(c) Per share amount may not recalculate due to rounding of net assets and/or shares outstanding.
See notes to financial statements.
19
USAA Mutual Funds Trust | Statement of Operations For the Year Ended March 31, 2020 | ||||||
(Amounts in Thousands)
| USAA Global Equity Income Fund | |||||||
Investment Income: | |||||||
Dividends | $ | 2,817 | |||||
Interest | 7 | ||||||
Securities lending (net of fees) | — | (a) | |||||
Foreign tax withholding | (147 | ) | |||||
Total income | 2,677 | ||||||
Expenses: | |||||||
Investment advisory fees | 407 | ||||||
Professional fees | — | (a) | |||||
Administration fees — Funds Shares | 114 | ||||||
Administration fees — Institutional Shares | 5 | ||||||
Sub-Administration fees | 15 | ||||||
Custodian fees | 53 | ||||||
Transfer agent fees — Fund Shares | 122 | ||||||
Transfer agent fees — Institutional Shares | 5 | ||||||
Trustees' fees | 44 | ||||||
Compliance fees | — | (a) | |||||
Legal and audit fees | 96 | ||||||
State registration and filing fees | 35 | ||||||
Other expenses | 51 | ||||||
Total expenses | 947 | ||||||
Expenses waived/reimbursed by Adviser | (93 | ) | |||||
Expenses waived/reimbursed by AMCO | (48 | ) | |||||
Net expenses | 806 | ||||||
Net Investment Income (Loss) | 1,871 | ||||||
Realized/Unrealized Gains (Losses) from Investments: | |||||||
| Net realized gains (losses) from investment securities and foreign currency translations | 4,817 | ||||||
| Net change in unrealized appreciation/depreciation on investment securities and foreign currency translations | (17,160 | ) | |||||
Net realized/unrealized gains (losses) on investments | (12,343 | ) | |||||
Change in net assets resulting from operations | $ | (10,472 | ) | ||||
(a) Rounds to less than $1 thousand.
See notes to financial statements.
20
USAA Mutual Funds Trust | Statements of Changes in Net Assets | ||||||
(Amounts in Thousands)
| USAA Global Equity Income Fund | |||||||||||
| Year Ended March 31, 2020 | Year Ended March 31, 2019 | ||||||||||
From Investments: | |||||||||||
Operations: | |||||||||||
Net investment income (loss) | $ | 1,871 | $ | 2,248 | |||||||
Net realized gains (losses) from investments | 4,817 | 1,605 | |||||||||
| Net change in unrealized appreciation/depreciation on investments | (17,160 | ) | (724 | ) | |||||||
Change in net assets resulting from operations | (10,472 | ) | 3,129 | ||||||||
Distributions to Shareholders: | |||||||||||
Fund Shares | (5,419 | ) | (5,165 | ) | |||||||
Institutional Shares | (391 | ) | (356 | ) | |||||||
Change in net assets resulting from distributions to shareholders | (5,810 | ) | (5,521 | ) | |||||||
Change in net assets resulting from capital transactions | 641 | (18,809 | ) | ||||||||
Change in net assets | (15,641 | ) | (21,201 | ) | |||||||
Net Assets: | |||||||||||
Beginning of period | 80,347 | 101,548 | |||||||||
End of period | $ | 64,706 | $ | 80,347 | |||||||
Capital Transactions: | |||||||||||
Fund Shares | |||||||||||
Proceeds from shares issued | $ | 10,388 | $ | 7,528 | |||||||
Distributions reinvested | 4,427 | 4,126 | |||||||||
Cost of shares redeemed | (14,174 | ) | (30,463 | ) | |||||||
Total Fund Shares | $ | 641 | $ | (18,809 | ) | ||||||
Institutional Shares | |||||||||||
Proceeds from shares issued | — | — | |||||||||
Distributions reinvested | — | — | |||||||||
Cost of shares redeemed | — | — | |||||||||
Total Institutional Shares | — | — | |||||||||
Change in net assets resulting from capital transactions | $ | 641 | $ | (18,809 | ) | ||||||
Share Transactions: | |||||||||||
Fund Shares | |||||||||||
Issued | 993 | 707 | |||||||||
Reinvested | 415 | 404 | |||||||||
Redeemed | (1,368 | ) | (2,797 | ) | |||||||
Total Fund Shares | 40 | (1,686 | ) | ||||||||
Institutional Shares | |||||||||||
Issued | — | — | |||||||||
Reinvested | — | — | |||||||||
Redeemed | — | — | |||||||||
Total Institutional Shares | — | — | |||||||||
Change in Shares | 40 | (1,686 | ) | ||||||||
See notes to financial statements.
21
USAA Mutual Funds Trust | Financial Highlights | ||||||
For a Share Outstanding Throughout Each Period
Investment Activities | Distributions to Shareholders From | ||||||||||||||||||||||||||
| Net Asset Value, Beginning of Period | Net Investment Income (Loss) | Net Realized and Unrealized Gains (Losses) on Investments | Total from Investment Activities | Net Investment Income | Net Realized Gains from Investments | ||||||||||||||||||||||
USAA Global Equity Income Fund | |||||||||||||||||||||||||||
Fund Shares | |||||||||||||||||||||||||||
| Year Ended March 31, 2020 | $ | 10.51 | 0.24 | (d) | (1.57 | ) | (1.33 | ) | (0.22 | ) | (0.54 | ) | |||||||||||||||
| Year Ended March 31, 2019 | $ | 10.88 | 0.27 | 0.06 | 0.33 | (0.27 | ) | (0.43 | ) | ||||||||||||||||||
| Year Ended March 31, 2018 | $ | 10.42 | 0.23 | 0.54 | 0.77 | (0.23 | ) | (0.08 | ) | ||||||||||||||||||
| Year Ended March 31, 2017 | $ | 9.39 | 0.21 | 1.03 | 1.24 | (0.21 | ) | — | |||||||||||||||||||
| August 7, 2015 (f) through March 31, 2016 | $ | 10.00 | 0.14 | (d) | (0.68 | ) | (0.54 | ) | (0.07 | ) | — | ||||||||||||||||
Institutional Shares | |||||||||||||||||||||||||||
| Year Ended March 31, 2020 | $ | 10.52 | 0.25 | (d) | (1.56 | ) | (1.31 | ) | (0.24 | ) | (0.54 | ) | |||||||||||||||
| Year Ended March 31, 2019 | $ | 10.89 | 0.27 | 0.07 | 0.34 | (0.28 | ) | (0.43 | ) | ||||||||||||||||||
| Year Ended March 31, 2018 | $ | 10.43 | 0.23 | 0.54 | 0.77 | (0.23 | ) | (0.08 | ) | ||||||||||||||||||
| Year Ended March 31, 2017 | $ | 9.39 | 0.23 | 1.02 | 1.25 | (0.21 | ) | — | |||||||||||||||||||
| August 7, 2015 (f) through March 31, 2016 | $ | 10.00 | 0.15 | (d) | (0.68 | ) | (0.53 | ) | (0.08 | ) | — | ||||||||||||||||
* Assumes reinvestment of all net investment income and realized capital gain distributions, if any, during the period. Includes adjustments in accordance with U.S. generally accepted accounting principles and could differ from the Lipper reported return.
^ The net expense ratio may not correlate to the applicable expense limits in place during the period since the current contractual expense limitation is applied for a two year period beginning July 1, 2019 and in effect through June 30, 2021, instead of coinciding with the Fund's fiscal year end. Details of the current contractual expense limitation in effect can be found in Note 4 of the accompanying Notes to Financial Statements.
(a) Not annualized for periods less than one year.
(b) Annualized for periods less than one year.
(c) Portfolio turnover is calculated on the basis of the Fund as a whole without distinguishing between the classes of shares issued.
(d) Per share net investment income (loss) has been calculated using the average daily shares method.
(e) Prior to August 1, 2018, AMCO voluntarily agreed to limit the annual expenses of the Fund Shares to 1.20% of the Fund Shares' average daily net assets.
(f) Commencement of operations.
(g) Prior to August 1, 2018, AMCO voluntarily agreed to limit the annual expenses of the Institutional Shares to 1.10% of the Institutional Shares' average daily net assets.
(h) Reflects increased trading activity due to current year transition or asset allocation shift.
See notes to financial statements.
22
USAA Mutual Funds Trust | Financial Highlights — continued | ||||||
For a Share Outstanding Throughout Each Period
Ratios to Average Net Assets | Supplemental Data | ||||||||||||||||||||||||||||||||||
| Total Distributions | Net Asset Value, End of Period | Total Return*(a) | Net Expenses^(b) | Net Investment Income (Loss)(b) | Gross Expenses(b) | Net Assets, End of Period (000's) | Portfolio Turnover(a)(c) | ||||||||||||||||||||||||||||
USAA Global Equity Income Fund | |||||||||||||||||||||||||||||||||||
Fund Shares | |||||||||||||||||||||||||||||||||||
| Year Ended March 31, 2020 | (0.76 | ) | $ | 8.42 | (14.02 | )% | 1.00 | % | 2.30 | % | 1.14 | % | $ | 60,491 | 109 | %(h) | |||||||||||||||||||
| Year Ended March 31, 2019 | (0.70 | ) | $ | 10.51 | 3.43 | % | 1.03 | %(e) | 2.56 | % | 1.10 | % | $ | 75,086 | 15 | % | |||||||||||||||||||
| Year Ended March 31, 2018 | (0.31 | ) | $ | 10.88 | 7.41 | % | 1.05 | % | 2.17 | % | 1.05 | % | $ | 96,101 | 22 | % | |||||||||||||||||||
| Year Ended March 31, 2017 | (0.21 | ) | $ | 10.42 | 13.33 | % | 1.20 | % | 2.28 | % | 1.26 | % | $ | 85,830 | 22 | % | |||||||||||||||||||
| August 7, 2015 (f) through March 31, 2016 | (0.07 | ) | $ | 9.39 | (5.35 | )% | 1.20 | % | 2.12 | % | 1.37 | % | $ | 42,080 | 16 | % | |||||||||||||||||||
Institutional Shares | |||||||||||||||||||||||||||||||||||
| Year Ended March 31, 2020 | (0.78 | ) | $ | 8.43 | (13.90 | )% | 0.90 | % | 2.40 | % | 1.51 | % | $ | 4,215 | 109 | %(h) | |||||||||||||||||||
| Year Ended March 31, 2019 | (0.71 | ) | $ | 10.52 | 3.47 | % | 0.97 | %(g) | 2.58 | % | 1.22 | % | $ | 5,261 | 15 | % | |||||||||||||||||||
| Year Ended March 31, 2018 | (0.31 | ) | $ | 10.89 | 7.35 | % | 1.10 | % | 2.14 | % | 1.29 | % | $ | 5,447 | 22 | % | |||||||||||||||||||
| Year Ended March 31, 2017 | (0.21 | ) | $ | 10.43 | 13.49 | % | 1.10 | % | 2.40 | % | 1.55 | % | $ | 5,214 | 22 | % | |||||||||||||||||||
| August 7, 2015 (f) through March 31, 2016 | (0.08 | ) | $ | 9.39 | (5.32 | )% | 1.10 | % | 2.20 | % | 1.79 | % | $ | 4,695 | 16 | % | |||||||||||||||||||
See notes to financial statements.
23
USAA Mutual Funds Trust | Notes to Financial Statements March 31, 2020 | ||||||
1. Organization:
USAA Mutual Funds Trust (the "Trust") is organized as a Delaware statutory trust and is registered under the Investment Company Act of 1940, as amended (the "1940 Act"), as an open-end investment company. The Trust is comprised of 47 funds and is authorized to issue an unlimited number of shares, which are units of beneficial interest with no par value.
The accompanying financial statements are those of the USAA Global Equity Income Fund (the "Fund"). The Fund offers two classes of shares: Fund Shares and Institutional Shares. The Fund is classified as diversified under the 1940 Act.
Each class of shares of the Fund has substantially identical rights and privileges except with respect to expenses allocable exclusively to each class of shares, voting rights on matters solely affecting a single class of shares, and the exchange privilege of each class of shares.
On November 6, 2018, United Services Automobile Association ("USAA"), the parent company of USAA Asset Management Company ("AMCO"), the investment adviser to the Fund, and USAA Transfer Agency Company, d/b/a USAA Shareholder Account Services ("SAS"), the transfer agent to the Fund, announced that AMCO and SAS would be acquired by Victory Capital Holdings Inc., a global investment management firm headquartered in Cleveland, Ohio (the "Transaction"). The Transaction closed on July 1, 2019. A special shareholder meeting was held on April 18, 2019, at which shareholders of the Fund approved a new investment advisory agreement between the Trust, on behalf of the Fund, and Victory Capital Management Inc. ("VCM" or "Adviser"). Effective July 1, 2019, VCM replaced AMCO as the investment adviser to the Fund and Victory Capital Transfer Agency Company replaced SAS as the Fund's transfer agent. In addition, effective on that same date shareholders of the Fund also elected the following two new directors to the Board of the Trust to serve upon the closing of the Transaction: (1) David C. Brown, to serve as an Interested Trustee; and (2) John C. Walters, to serve as an Independent Trustee.
Under the Trust's organizational documents, its officers and trustees are indemnified against certain liabilities arising out of the performance of their duties to the Fund. In addition, in the normal course of business, the Fund enters into contracts with its vendors and others that provide for general indemnifications. The Fund's maximum exposure under these arrangements is unknown, as this would involve future claims that may be made against the Fund. However, based on experience, the Fund expects that risk of loss to be remote.
2. Significant Accounting Policies:
The following is a summary of significant accounting policies followed by the Trust in the preparation of its financial statements. The policies are in conformity with generally accepted accounting principles in the United States of America ("GAAP"). The preparation of financial statements in accordance with GAAP requires management to make estimates and assumptions that affect the reported amounts of assets and liabilities and disclosure of contingent assets and liabilities at the date of the financial statements and the reported amounts of income and expenses for the period. Actual results could differ from those estimates. The Fund follows the specialized accounting and reporting requirements under GAAP that are applicable to investment companies under Accounting Standards Codification Topic 946.
Investment Valuation:
The Fund records investments at fair value. Fair value is defined as the price that would be received to sell an asset or paid to transfer a liability in an orderly transaction between market participants at the measurement date.
The valuation techniques described below maximize the use of observable inputs and minimize the use of unobservable inputs in determining fair value. The inputs used for valuing the Fund's investments are summarized in the three broad levels listed below:
• Level 1 — quoted prices in active markets for identical securities
• Level 2 — other significant observable inputs (including quoted prices for similar securities or interest rates applicable to those securities, etc.)
24
USAA Mutual Funds Trust | Notes to Financial Statements — continued March 31, 2020 | ||||||
• Level 3 — significant unobservable inputs (including the Fund's own assumptions in determining the fair value of investments)
Changes in valuation techniques may result in transfers in or out of an assigned level within the disclosure hierarchy. The inputs or methodologies used for valuation techniques are not necessarily an indication of the risk associated with entering into those investments.
The Adviser has established the Pricing and Liquidity Committee (the "Committee"), and subject to the Trust's Board of Trustees (the "Board") oversight, the Committee administers and oversees the Fund's valuation policies and procedures, which are approved by the Board.
Portfolio securities listed or traded on securities exchanges, including exchange-traded funds ("ETFs"), American Depositary Receipts ("ADRs") and Rights, are valued at the closing price on the exchange or system where the security is principally traded, if available, or at the Nasdaq Official Closing Price. If there have been no sales for that day on the exchange or system, then a security is valued at the last available bid quotation on the exchange or system where the security is principally traded. In each of these situations, valuations are typically categorized as Level 1 in the fair value hierarchy.
Investments in open-end investment companies are valued at net asset value. These valuations are typically categorized as Level 1 in the fair value hierarchy.
In accordance with procedures adopted by the Board, fair value pricing may be used if events materially affecting the value of foreign securities occur between the time the exchange on which they are traded closes and the time the Fund's net asset value is calculated. The Fund uses a systematic valuation model, provided daily by an independent third party to fair value its international equity securities. These valuations are considered as Level 2 in the fair value hierarchy.
A summary of the valuations as of March 31, 2020, based upon the three levels defined above, is included in the table below while the breakdown, by category, of investments is disclosed in the Schedule of Portfolio Investments (amounts in thousands):
Level 1 | Level 2 | Level 3 | Total | ||||||||||||||||
Common Stocks | $ | 43,730 | $ | 20,402 | $ | — | $ | 64,132 | |||||||||||
Collateral for Securities Loaned | 213 | — | — | 213 | |||||||||||||||
Total | $ | 43,943 | $ | 20,402 | $ | — | $ | 64,345 | |||||||||||
For the year ended March 31, 2020, there were no transfers in or out of the Level 3 fair value hierarchy.
Real Estate Investment Trusts ("REITs"):
The Fund may invest in REITs which report information on the source of their distributions annually. REITs are pooled investment vehicles that invest primarily in income producing real estate or real estate related loans or interests (such as mortgages). Certain distributions received from REITs during the year are recorded as realized gains or return of capital as estimated by the Fund or when such information becomes known.
Investment Companies:
Exchange-Traded Funds:
The Fund may invest in ETFs. ETFs are a type of index fund, the shares of which are bought and sold on a securities exchange. An ETF trades like common stock and represents a fixed portfolio of securities designed to track the performance and dividend yield of a particular domestic or foreign market index. A Fund may purchase shares of an ETF to temporarily gain exposure to a portion of the U.S. or a foreign market while awaiting purchase of underlying securities. The risks of owning an ETF generally reflect the risks of owning the underlying securities they are designed to track, although the lack of liquidity of an ETF could result in it being more volatile. Additionally, ETFs have fees and expenses that reduce their value.
25
USAA Mutual Funds Trust | Notes to Financial Statements — continued March 31, 2020 | ||||||
Open-End Funds:
The Fund may invest in portfolios of open-end investment companies. These investment companies value securities in their portfolios for which market quotations are readily available at their market values (generally the last reported sale price) and all other securities and assets at their fair value by the methods established by the board of directors of the underlying funds.
Investment Transactions and Related Income:
Changes in holdings of investments are accounted for no later than one business day following the trade date. For financial reporting purposes, however, investment transactions are accounted for on trade date on the last business day of the reporting period. Interest income is determined on the basis of coupon interest accrued using the effective interest method which adjusts, where applicable, the amortization of premiums or accretion of discount. Gains or losses realized on sales of securities are determined by comparing the identified cost of the security lot sold with the net sales proceeds.
Withholding taxes on interest, dividends and gains as a result of certain investments in ADRs by the Fund has been provided for in accordance with each investment's applicable country's tax rules and rates.
Securities Lending:
The Fund, through a securities lending agreement with Citibank, N.A. ("Citibank"), may lend its securities to qualified financial institutions, such as certain broker-dealers, to earn additional income, net of income retained by Citibank. Borrowers are required to secure their loans for collateral in the amount of at least 102% of the value of U.S. securities loaned or at least 105% of the value of non-U.S. securities loaned, marked-to-market daily. Any collateral shortfalls associated with increases in the valuation of the securities loaned are cured the next business day once the shortfall exceeds $100 thousand. Collateral may be cash, U.S. government securities, or other securities as permitted by SEC guidelines. Cash collateral may be invested in high-quality short-term investments, primarily open-end investment companies. Collateral requirements are determined daily based on the value of the Fund's securities on loan as of the end of the prior business day. During the time portfolio securities are on loan, the borrower will pay the Fund any dividends or interest paid on such securities plus any fee negotiated between the parties to the lending agreement. The Fund also earns a return from the collateral. The Fund pays Citibank various fees in connection with the investment of cash collateral and fees based on the investment income received from securities lending activities. Securities lending income (net of these fees) is disclosed on the Statement of Operations. Loans are terminable upon demand and the borrower must return the loaned securities within the lesser of one standard settlement period or five business days. Risks relating to securities-lending transactions include that the borrower may not provide additional collateral when required or return the securities when due, and that the value of the short-term investments will be less than the amount of cash collateral required to be returned to the borrower. The Fund's agreement with Citibank does not include master netting provisions. Non- cash collateral received by the Fund may not be sold or re-pledged except to satisfy borrower default. Cash collateral is listed in the Fund's Portfolio of Investments and Financial Statements while non-cash collateral is not included.
At March 31, 2020, the Fund's value of outstanding securities on loan and the value of collateral are as follows (amounts in thousands):
| Value of Securities on Loan | Non-Cash Collateral | Cash Collateral | |||||||||
| $ | 205 | $ | — | $ | 213 | ||||||
26
USAA Mutual Funds Trust | Notes to Financial Statements — continued March 31, 2020 | ||||||
Foreign Currency Translations:
The accounting records of the Fund are maintained in U.S. dollars. Investment securities and other assets and liabilities of a fund denominated in a foreign currency are translated into U.S. dollars at current exchange rates. Purchases and sales of securities, income receipts and expense payments are translated into U.S. dollars at the exchange rates on the date of the transactions. The Fund does not isolate the portion of the results of operations resulting from changes in foreign exchange rates on investments from fluctuations arising from changes in market prices of securities held. Such fluctuations are disclosed as net change in unrealized appreciation/depreciation on investments and foreign currency translations on the Statement of Operations. Any realized gains or losses from these fluctuations, including foreign currency arising from in-kind redemptions, are disclosed as net realized gains or losses from investment transactions and foreign currency translations on the Statement of Operations.
Foreign Taxes:
The Fund may be subject to foreign taxes related to foreign income received (a portion of which may be reclaimable), capital gains on the sale of securities, and certain foreign currency transactions. All foreign taxes are recorded in accordance with the applicable regulations and rates that exist in the foreign jurisdictions in which the Fund invests.
Federal Income Taxes:
It is the Fund's policy to continue to qualify as a regulated investment company by complying with the provisions available to certain investment companies, as defined in applicable sections of the Internal Revenue Code, and to make distributions of net investment income and net realized gains sufficient to relieve it from all, or substantially all, federal income taxes. Accordingly, no provision for federal income taxes is required in the financial statements. The Fund has a tax year end of March 31.
Management of the Fund has reviewed tax positions taken in tax years that remain subject to examination by all major tax jurisdictions, including federal (i.e., the last four tax years which includes the current fiscal tax year end). Management believes that there is no tax liability resulting from unrecognized tax benefits related to uncertain tax positions taken.
Allocations:
Expenses directly attributable to the Fund are charged to the Fund, while expenses that are attributable to more than one fund in the Trust, or jointly with an affiliated trust, are allocated among the respective funds in the Trust and/or affiliated trust based upon net assets or another appropriate basis.
Income, expenses (other than class-specific expenses such as transfer agent fees, state registration fees, and printing fees), and realized and unrealized gains or losses on investments are allocated to each class of shares based on its relative net assets on the date income is earned or expenses and realized and unrealized gains and losses are incurred.
Cross-Trade Transactions:
Pursuant to Rule 17a-7 under the 1940 Act, the Fund may engage in cross-trades which are securities transactions with affiliated investment companies and advisory accounts managed by the Adviser and any applicable sub-adviser. Any such purchase or sale transaction must be effected without brokerage commission or other remuneration, except for customary transfer fees. The transaction must be effected at the current market price, which is either the security's last sale price on an exchange or, if there are no transactions in the security that day, at the average of the highest bid and lowest asked price. For the year ended March 31, 2020, the Fund did not engage in any securities transactions with affiliated funds.
27
USAA Mutual Funds Trust | Notes to Financial Statements — continued March 31, 2020 | ||||||
3. Purchases and Sales:
Cost of purchases and proceeds from sales/maturities of securities (excluding securities maturing less than one year from acquisition) for the year ended March 31, 2020, were as follows for the Fund (amounts in thousands):
| Excluding U.S. Government Securities | |||||||||||
Purchases | Sales | ||||||||||
$ | 86,367 | $ | 89,285 | ||||||||
There were no purchases and sales of U.S. government securities during the year ended March 31, 2020.
4. Fees and Transactions with Affiliates and Related Parties:
Investment Advisory and Management Fees:
Effective with the Transaction on July 1, 2019, investment advisory services are provided to the Fund by the Adviser, a New York corporation registered as an investment adviser with the Securities and Exchange Commission ("SEC"). The Adviser is a wholly-owned indirect subsidiary of Victory Capital Holdings, Inc., a publicly traded Delaware corporation, and a wholly-owned direct subsidiary of Victory Capital Operating, LLC. Under the terms of the Investment Advisory Agreement, the Adviser is entitled to receive a base fee and a performance adjustment. The Fund's base fee is accrued daily and paid monthly at an annualized rate of 0.50% of the Fund's average daily net assets. The amount incurred and paid to VCM from July 1, 2019 through March 31, 2020, was $306 thousand and is reflected on the Statement of Operations as Investment Advisory fees.
Prior to the Transaction on July 1, 2019, AMCO provided investment management services to the Fund pursuant to an Advisory Agreement. Under this agreement, AMCO was responsible for managing the business and affairs of the Fund, and for directly managing day-to-day investment of the Fund's assets, subject to the authority of and supervision by the Board. The investment management fee for the Fund was comprised of a base fee and a performance adjustment. The Fund's base fee was accrued daily and paid monthly at an annualized rate of 0.50% of the Fund's average daily net assets. The amount incurred and paid to AMCO from April 1, 2019 through June 30, 2019, was $101 thousand and is reflected on the Statement of Operations as Investment Advisory fees.
Effective with the Transaction on July 1, 2019, no performance adjustments will be made for periods beginning July 1, 2019 through June 30, 2020. Only performance beginning as of July 1, 2019, and thereafter will be utilized in calculating future performance adjustments.
Prior to the Transaction on July 1, 2019, the performance adjustment for each share class was calculated monthly by comparing the Fund's performance to that of the Lipper Global Equity Income Funds Index. The Lipper Global Equity Income Funds Index tracks the total return performance of funds within the Lipper Global Equity Income Funds category.
The performance period for each share class consists of the current month plus the previous 35 months (or the number of months beginning July 1, 2019, if fewer). The following table was utilized to determine the extent of the performance adjustment:
| Over/Under Performance Relative to Index (in basis points)(1) | Annual Adjustment Rate (in basis points)(1) | ||||||
+/- 100 to 400 | +/- 4 | ||||||
+/- 401 to 700 | +/- 5 | ||||||
+/- 701 and greater | +/- 60 | ||||||
(1) Based on the difference between average annual performance of the relevant share class of the Fund and its relevant index, rounded to the nearest basis point. Average daily net assets of the share class are calculated over a rolling 36-month period.
28
USAA Mutual Funds Trust | Notes to Financial Statements — continued March 31, 2020 | ||||||
Each class' annual performance adjustment rate is multiplied by the average daily net assets of each respective class over the entire performance period, which is then multiplied by a fraction, the numerator of which is the number of days in the month and the denominator of which is 365 (366 in leap years). The resulting amount is then added to (in the case of overperformance), or subtracted from (in the case of underperformance) the base fee.
Under the performance fee arrangement, each class pays a positive performance fee adjustment for a performance period whenever the class outperforms the Lipper Global Equity Income Funds Index over that period, even if the class has overall negative returns during the performance period.
For the period April 1, 2019 through June 30, 2019, there were no performance adjustments for the Fund.
Effective with the Transaction on July 1, 2019, the Trust relies on an exemptive order granted to VCM and its affiliated funds by the SEC in March 2019 permitting the use of a "manager-of-managers" structure for certain funds. Prior to that date, the Trust relied on a similar exemptive order granted by the SEC to the Trust and its affiliated persons. Under a manager-of-managers structure, the investment adviser may select (with approval of the Board and without shareholder approval) one or more subadvisers to manage the day-to-day investment of a fund's assets. For the year ended March 31, 2020, the Fund had no subadvisers.
Administration and Servicing Fees:
Effective with the Transaction on July 1, 2019, VCM serves as the Fund's administrator and fund accountant. Under the Fund Administration, Servicing and Accounting Agreement, VCM is paid for its services an annual fee at a rate of 0.15% and 0.10% of average daily net assets of the Fund Shares and Institutional Shares, respectively. Amounts incurred from July 1, 2019 through March 31, 2020, are $86 and $4 thousand for Fund Shares and Institutional Shares, respectively. These amounts are reflected on the Statement of Operations as Administration fees.
Prior to the Transaction on July 1, 2019, AMCO provided certain administration and servicing functions for the Fund. For such services, AMCO received a fee accrued daily and paid monthly at an annualized rate of 0.15% and 0.10% of average daily net assets of the Fund Shares and Institutional Shares, respectively. Amounts incurred from April 1, 2019 through June 30, 2019, were $28 and $1 thousand for Fund Shares and Institutional Shares, respectively. These amounts are reflected on the Statement of Operations as Administration fees
Effective with the Transaction on July 1, 2019, the Fund (as part of the Trust) has entered into an agreement to provide compliance services with the Adviser, pursuant to which the Adviser furnishes its compliance personnel, including the services of the Chief Compliance Officer ("CCO"), and other resources reasonably necessary to provide the Trust with compliance oversight services related to the design, administration and oversight of a compliance program for the Trust in accordance with Rule 38a-1 under the 1940 Act. The CCO is an employee of the Adviser, which pays the compensation of the CCO and support staff. Funds in the Trust, Victory Variable Insurance Funds, Victory Portfolios and Victory Portfolios II (collectively, the "Victory Funds Complex") in the aggregate, compensate the Adviser for these services. The amount incurred during the period from July 1, 2019 through March 31, 2020, is reflected on the Statement of Operations as Compliance fees.
Effective with the Transaction on July 1, 2019, Citi Fund Services Ohio, Inc. ("Citi"), an affiliate of Citibank, acts as sub-administrator and sub-fund accountant to the Fund pursuant to a Sub-Administration and Sub-Fund Accounting Services Agreement between VCM and Citi. VCM pays Citi a fee for providing these services. The Trust reimburses VCM and Citi for all of their reasonable out-of-pocket expenses incurred in providing these services and certain other expenses specifically allocated to the Funds, under the Fund Administration, Servicing, and Accounting Agreement. The amount incurred during the period from July 1, 2019 through March 31, 2020, is reflected on the Statement of Operations as Sub-Administration fees.
In addition to the services provided under its Administration and Servicing Agreement with the Fund, AMCO also provided certain compliance and legal services for the benefit of the Fund prior to the
29
USAA Mutual Funds Trust | Notes to Financial Statements — continued March 31, 2020 | ||||||
Transaction on July 1, 2019. The Board approved the reimbursement of a portion of these expenses incurred by AMCO. Amounts reimbursed by the Fund to AMCO for these compliance and legal services are presented on the Statement of Operations as Professional fees.
Transfer Agency Fees:
Effective with the Transaction on July 1, 2019, Victory Capital Transfer Agency, Inc. ("VCTA"), (formerly, USAA Shareholder Account Services ("SAS")), provides transfer agency services to the Fund. VCTA, an affiliate of the Adviser, provides transfer agent services to the Fund Shares based on annual charge of $23.00 per shareholder account plus out-of-pocket expenses. VCTA pays a portion of these fees to certain intermediaries for the administration and servicing of accounts that are held with such intermediaries. Transfer agent's fees for Institutional Shares are paid monthly based on a fee accrued daily at an annualized rate of 0.10% of the Institutional Shares' average daily net assets, plus out of pocket expenses. Amounts incurred and paid to VCTA from July 1, 2019 through March 31, 2020, was $93 and $4 thousand for the Fund Shares and Institutional Shares, respectively. Amounts incurred and paid to SAS from April 1, 2019 through June 30, 2019, was $29 and $1 thousand for the Fund Shares and Institutional Shares, respectively. These amounts are reflected on the Statement of Operations as Transfer agent fees.
Effective with the Transaction on July 1, 2019, FIS Investor Services LLC serves as sub-transfer agent and dividend disbursing agent for the Fund pursuant to a Sub-Transfer Agent agreement between VCTA and FIS Investor Services LLC. VCTA provides FIS Investor Services LLC a fee for providing these services.
Distributor/Underwriting services:
Effective with the Transaction on July 1, 2019, Victory Capital Advisers, Inc. (the "Distributor"), an affiliate of the Adviser, serves as distributor for the continuous offering of the shares of the Fund pursuant to a Distribution Agreement between the Distributor and the Trust. Effective on or about June 30, 2020, the Distributor's name will change to Victory Capital Services, Inc.
Prior to the Transaction on July 1, 2019, USAA Investment Management Company provided exclusive underwriting and distribution of the Fund's shares on a continuing best-efforts basis.
Other Fees:
Prior to the Transaction on July 1, 2019, State Street Bank and Trust Company served as the Fund's accounting agent and custodian.
Effective August 5, 2019, Citibank, N.A., serves as the Fund's custodian.
K&L Gates LLP provides legal services to the Trust.
Effective with the Transaction on July 1, 2019, the Adviser has entered into an expense limitation agreement with the Fund until at least June 30, 2021. Under the terms of the agreement, the Adviser has agreed to waive fees or reimburse certain expenses to the extent that ordinary operating expenses incurred by certain classes of the Fund in any fiscal year exceed the expense limit for such classes of the Fund. Such excess amounts will be the liability of the Adviser. Interest, taxes, brokerage commissions, other expenditures which are capitalized in accordance with GAAP, and other extraordinary expenses not incurred in the ordinary course of the Fund's business are excluded from the expense limits. Effective July 1, 2019 through March 31, 2020, the expense limit (excluding voluntary waivers) is 1.00% and 0.90% for the Fund Shares and Institutional Shares, respectively.
Under this expense limitation agreement, the Fund has agreed to repay fees and expenses that were waived or reimbursed by the Adviser for a period up to three years after the fiscal year in which the waiver or reimbursement took place, subject to the lesser of any operating expense limits in effect at the time of: (a) the original waiver or expense reimbursement; or (b) the recoupment, after giving effect to the recoupment amount. As of March 31, 2020, the following amounts are available to be repaid to the Adviser (amounts in thousands).
Expires 03/31/2023 | |||||||
$ | 93 | ||||||
30
USAA Mutual Funds Trust | Notes to Financial Statements — continued March 31, 2020 | ||||||
The Adviser, may voluntarily waive or reimburse additional fees to assist the Fund in maintaining competitive expense ratios. Voluntary waivers and reimbursements applicable to the Fund are not available to be recouped at a future time. There were no voluntary waivers or reimbursements for the year ended March 31, 2020.
Prior to the Transaction on July 1, 2019, AMCO agreed, through July 31, 2019, to limit the total annual operating expenses of the Fund Shares and Institutional Shares to 1.00% and 0.90%, respectively, of their average daily net assets, excluding extraordinary expenses and before reductions of any expenses paid indirectly, and to reimburse the Fund Shares and Institutional Shares for all expenses in excess of those amounts. Effective with the Transaction on July 1, 2019, this expense limit is no longer in effect and is not available to be recouped by AMCO. For the period April 1, 2019 through June 30, 2019, the Fund Shares and Institutional Shares incurred reimbursements of $39 and $9 thousand, respectively. These amounts are reflected on the Statement of Operations as Expenses waived/reimbursed by AMCO.
Certain officers and/or interested trustees of the Fund are also officers and/or employees of the Adviser, Administrator, Sub-Administrator, Sub-Fund Accountant, and Legal.
5. Risks:
The Fund may be subject to other risks in addition to these identified risks.
The Fund may be subject to various risks as described in the Fund's prospectus. A widespread health crisis such as a global pandemic could cause substantial market volatility, exchange trading suspensions and closures, impact the ability to complete redemptions, and affect Fund performance. For example, the novel coronavirus disease (COVID-19) has resulted in significant disruptions to global business activity that may continue, worsen and/or trigger other factors impacting the liquidity or value of investments. The impact of health crises and other epidemics and pandemics may affect the global economy in ways that cannot necessarily be foreseen at the present time. Health crises may exacerbate other pre-existing political, social, and economic risks. Any such impact could adversely affect the Funds' performance, resulting in losses to your investment. For more information, please refer to the "Principal risks" section of the Fund's prospectus.
The Fund may invest in futures, options, and other types of derivatives. Risks associated with derivatives include the risk that the derivative is not well-correlated with the security, index, ETFs, or currency to which it relates; the risk that the use of derivatives may not have the intended effects and may result in losses, underperformance, or missed opportunities; the risk that the Fund will be unable to sell the derivative because of an illiquid secondary market; the risk that a counterparty is unwilling or unable to meet its obligation; the risk of interest rate movements; and the risk that the derivatives transaction could expose the Fund to the effects of leverage, which could increase the Fund's market exposure, magnify investment risks and losses, and cause losses to be realized more quickly. There is no guarantee that derivative techniques will be employed or that they will work as intended, and their use could lower returns or even result in losses to the Fund.
The Fund is subject to dividend payout risk, which is the possibility that a number of the companies in which the Fund invests will reduce or eliminate the dividend on the securities held by the Fund. Should many portfolio companies reduce or eliminate their dividend payments, the ability of the Fund to produce investment income to shareholders will be affected adversely.
The equity securities in the Fund's portfolio are subject to stock market risk. A company's stock price in general may decline over short or even extended periods, regardless of the success or failure of the company's operations. Stock markets tend to run in cycles, with periods when stock prices generally go up and periods when stock prices generally go down. Equity securities tend to be more volatile than debt securities. In addition, to the degree the Fund invests in foreign securities, there is a possibility that the value of the Fund's investments in foreign securities will decrease because of unique risks, such as currency exchange-rate fluctuations; foreign market illiquidity; emerging market risk; increased price volatility; uncertain political conditions; exchange control regulations; foreign ownership limits; different accounting, reporting, and disclosure requirements; difficulties in obtaining legal judgments;
31
USAA Mutual Funds Trust | Notes to Financial Statements — continued March 31, 2020 | ||||||
and foreign withholding taxes. These risks may be heightened to the extent the Fund invests in emerging market countries. Emerging market countries are less economically diverse and less mature than more developed countries and tend to be less politically stable.
6. Borrowing and Interfund Lending:
Line of Credit:
Effective with the Transaction on July 1, 2019, the Victory Funds Complex participates in a short-term, demand note "Line of Credit" agreement with Citibank. Under the agreement with Citibank, the Victory Funds Complex could borrow up to $600 million, of which $300 million is committed and $300 million is uncommitted. $40 million of the Line of Credit is reserved for use by the Victory Floating Rate Fund, another series of the Victory Funds Complex, with that Fund paying the related commitment fees for that amount. The purpose of the agreement is to meet temporary or emergency cash needs. Citibank receives an annual commitment fee of 0.15% on $300 million for providing the Line of Credit. Each fund in the Victory Funds Complex pays a pro-rata portion of the commitment fees plus any interest (one month LIBOR plus one percent) on amounts borrowed. Interest charged to the Fund, if any, during the period is presented on the Statement of Operations under line of credit fees.
Prior to the Transaction on July 1, 2019, the line of credit among the Trust, with respect to its funds, and USAA Capital Corporation ("CAPCO") terminated. For the period from April 1, 2019 to June 30, 2019, the Fund paid CAPCO facility fees of less than $1 thousand.
The Fund had no borrowings under either agreement with Citibank or CAPCO during the year ended March 31, 2020.
Interfund Lending:
Effective with the Transaction on July 1, 2019, the Trust and Adviser rely on an exemptive order granted by the SEC in March 2017 (the "Order"), permitting the establishment and operation of an Interfund Lending Facility (the "Facility"). The Facility allows the Fund to directly lend and borrow money to or from any other Fund in the Victory Fund Complex relying upon the Order at rates beneficial to both the borrowing and lending funds. Advances under the Facility are allowed for temporary or emergency purposes. The interfund loan rate is determined, as specified in the Order, by averaging the current repurchase agreement rate and the current bank loan rate. As a Borrower, interest charged to the Fund, if any, during the period is presented on the Statement of Operations under Interest expense on Interfund lending. As a Lender, interest earned by the Fund, if any, during the period is presented on the Statement of Operations under Income on Interfund lending.
The Fund did not utilize or participate in the Facility during the period July 1, 2019 through March 31, 2020.
7. Federal Income Tax Information:
The Fund intends to declare and distribute any net investment income quarterly. Distributable net realized gains, if any, are declared and paid at least annually.
The amounts of dividends from net investment income and distributions from net realized gains (collectively distributions to shareholders) are determined in accordance with federal income tax regulations, which may differ from GAAP. To the extent these "book/tax" differences are permanent in nature (e.g., net operating loss and distribution reclassification,), such amounts are reclassified within the components of net assets based on their federal tax-basis treatment; temporary differences (e.g., wash sales) do not require reclassification. To the extent dividends and distributions exceed net investment income and net realized gains for tax purposes, they are reported as distributions of capital. Net investment losses incurred by the Fund may be reclassified as an offset to capital on the accompanying Statement of Assets and Liabilities.
32
USAA Mutual Funds Trust | Notes to Financial Statements — continued March 31, 2020 | ||||||
As of March 31, 2020, on the Statement of Assets and Liabilities, there were no permanent book-to-tax difference reclassification adjustments.
The tax character of distributions paid during the tax years ended as noted below, were as follows (total distributions paid may differ from the Statement of Changes in Net Assets because, for tax purposes, dividends are recognized when actually paid) (amounts in thousands):
| Year Ended March 31, 2020 | Year Ended March 31, 2019 | ||||||||||||||||||||||
Distributions paid from | Distributions paid from | ||||||||||||||||||||||
| Ordinary Income | Net Long-Term Capital Gains | Total Distributions Paid | Ordinary Income | Net Long-Term Capital Gains | Total Distributions Paid | ||||||||||||||||||
| $ | 1,722 | $ | 4,088 | $ | 5,810 | $ | 2,577 | $ | 2,944 | $ | 5,521 | ||||||||||||
As of the tax year ended March 31, 2020, the components of accumulated earnings (deficit) on a tax basis were as follows (amounts in thousands):
| Undistributed Ordinary Income | Qualified Late- Year Losses* | Unrealized Appreciation (Depreciation)** | Total Accumulated Earnings (Deficit) | ||||||||||||
$ | 161 | $ | (320 | ) | $ | (8,657 | ) | $ | (8,816 | ) | |||||
* Qualified late-year losses are comprised of post-October capital losses incurred after October 31 and certain late-year ordinary losses. Late-year ordinary losses represent ordinary losses incurred after December 31 and specified losses incurred after October 31. These losses are deemed to arise on the first day of the Fund's next taxable year.
** The difference between the book-basis and tax-basis of unrealized appreciation/depreciation is attributable to the tax deferral of losses on wash sales and securities with nontaxable distributions.
At March 31, 2020, the Fund had no capital loss carryforwards for federal income tax purposes.
As of March 31, 2020, the cost basis for federal income tax purposes, gross unrealized appreciation, gross unrealized depreciation, and net unrealized appreciation (depreciation) for investments were as follows (amounts in thousands):
| Cost of Investments for Federal Tax Purposes | Gross Unrealized Appreciation | Gross Unrealized Depreciation | Net Unrealized Appreciation (Depreciation) | ||||||||||||
| $ | 73,000 | $ | 4,329 | $ | (12,984 | ) | $ | (8,655 | ) | ||||||
8. Liquidity Risk Management Program:
The USAA Funds have adopted and implemented a written liquidity risk management program (the "LRMP") as required by Rule 22e-4 under the Investment Company Act of 1940, as amended. The LRMP is reasonably designed to assess and manage the Fund's liquidity risk, taking into consideration the Fund's investment strategy and the liquidity of its portfolio investments during normal and reasonably foreseeable stressed market conditions; its short and long-term cash flow projections; and its cash holdings and access to other liquidity management tools such as available funding sources including the Victory Funds Complex Interfund Lending Facility and Line of Credit (discussed in the Notes to Financial Statements). The USAA Funds' Board of Trustees approved the appointment of the Fund's investment adviser, Victory Capital Management Inc. ("Victory Capital"), as the administrator of the LRMP. At an in-person meeting held on February 26, 2020, Victory Capital provided an oral and written report to the Trustees on the operation and effectiveness of the LRMP during the previous year.
33
USAA Mutual Funds Trust | Notes to Financial Statements — continued March 31, 2020 | ||||||
Victory Capital manages liquidity risks associated with the Fund's investments by monitoring, among other things, cash and cash equivalents, any use of derivatives, the concentration of investments, the appropriateness of the Fund's investment strategy, and by classifying every fund investment as either highly liquid, moderately liquid, less liquid or illiquid on at least a monthly basis. To assist with the classification of Fund investments, Victory Capital has retained a third-party provider of liquidity evaluation services. This provider determines preliminary liquidity classifications for all portfolio holdings based upon portfolio-level data and certain assumptions provided by Victory Capital. Victory Capital reviews the preliminary liquidity classifications, and, when appropriate, considers other information including input from the Fund's portfolio managers (including the portfolio managers employed by any investment sub-advisers) in determining final liquidity classifications.
The report from Victory Capital concluded that the Fund did not experience any significant liquidity challenges during the covered period, and the Fund's LRMP is reasonably designed to assess and manage its liquidity risk. The report also concluded that the LRMP continues to operate adequately and effectively to enable Victory Capital to oversee and manage liquidity risk and ensure the Fund is able to meet redemption requests without significant dilution to the remaining investors' interest in the Fund. During the review period, the Fund's portfolio consisted primarily of highly liquid investments, which are defined as cash and any investments reasonably expected to be converted to cash in current market conditions in three business days or less without significantly changing the market value of the investment. Therefore, the Fund has not adopted a Highly Liquid Investment Minimum. The Fund's investments were below the limitation on illiquid investments during the review period. Additionally, Victory Capital indicated that no events occurred that would require the filing of Form N-LIQUID and recommended no material changes to the LRMP.
9. Subsequent Events:
An outbreak of respiratory disease called COVID-19 was first detected in China in December 2019 and subsequently spread internationally. The transmission of COVID-19 and efforts to contain its spread have resulted in international, national and local border closings and other significant travel restrictions and disruptions, significant disruptions to business operations, supply chains and consumer activity, significant challenges in healthcare service preparation and delivery, and quarantines, as well as general concern and uncertainty that has negatively affected the economic environment and that occurred subsequent to year end may have a significant negative impact on the operations and profitability of the Funds' investments. These impacts have caused significant volatility and declines in global financial markets, which have caused losses for investors. The impact of the COVID-19 pandemic may be short term or may last for an extended period of time, and in either case could result in a substantial economic downturn or recession. Public health crises may exacerbate other pre-existing political, social, economic, market and financial risks. The extent of the impact to the financial performance of the Funds' investments will depend on future developments, including (i) the duration and spread of the outbreak, (ii) the restrictions and advisories, (iii) the effects on the financial markets, and (iv) the effects on the economy overall, all of which are highly uncertain and cannot be predicted.
34
REPORT OF INDEPENDENT REGISTERED PUBLIC ACCOUNTING FIRM
To the Shareholders and the Board of Trustees of USAA Global Equity Income Fund:
Opinion on the Financial Statements
We have audited the accompanying statement of assets and liabilities of USAA Global Equity Income Fund (the "Fund") (one of the funds constituting USAA Mutual Funds Trust (the "Trust")), including the schedule of portfolio investments, as of March 31, 2020, and the related statement of operations for the year then ended, the statements of changes in net assets for each of the two years in the period then ended, the financial highlights for each of the four years in the period then ended and the period from August 7, 2015 (commencement of operations) through March 31, 2016 and the related notes (collectively referred to as the "financial statements"). In our opinion, the financial statements present fairly, in all material respects, the financial position of the Fund at March 31, 2020, the results of its operations for the year then ended, the changes in its net assets for each of the two years in the period then ended and its financial highlights for each of the four years in the period then ended and the period from August 7, 2015 (commencement of operations) through March 31, 2016, in conformity with U.S. generally accepted accounting principles.
Basis for Opinion
These financial statements are the responsibility of the Trust's management. Our responsibility is to express an opinion on the Fund's financial statements based on our audits. We are a public accounting firm registered with the Public Company Accounting Oversight Board (United States) ("PCAOB") and are required to be independent with respect to the Trust in accordance with the U.S. federal securities laws and the applicable rules and regulations of the Securities and Exchange Commission and the PCAOB.
We conducted our audits in accordance with the standards of the PCAOB. Those standards require that we plan and perform the audit to obtain reasonable assurance about whether the financial statements are free of material misstatement, whether due to error or fraud. The Trust is not required to have, nor were we engaged to perform, an audit of the Trust's internal control over financial reporting. As part of our audits we are required to obtain an understanding of internal control over financial reporting, but not for the purpose of expressing an opinion on the effectiveness of the Trust's internal control over financial reporting. Accordingly, we express no such opinion.
Our audits included performing procedures to assess the risks of material misstatement of the financial statements, whether due to error or fraud, and performing procedures that respond to those risks. Such procedures included examining, on a test basis, evidence regarding the amounts and disclosures in the financial statements. Our procedures included confirmation of securities owned as of March 31, 2020, by correspondence with the custodian. Our audits also included evaluating the accounting principles used and significant estimates made by management, as well as evaluating the overall presentation of the financial statements. We believe that our audits provide a reasonable basis for our opinion.

We have served as the auditor of one or more Victory Capital investment companies since 1995.
San Antonio, Texas
May 27, 2020
35
USAA Mutual Funds Trust | Supplemental Information March 31, 2020 | ||||||
(Unaudited)
Expense Examples
As a shareholder of the Fund, you may incur two types of costs: (1) transaction costs, and (2) ongoing costs, including management fees and other Fund expenses. These examples are intended to help you understand your ongoing costs (in dollars) of investing in the Fund and to compare these costs with the ongoing costs of investing in other mutual funds.
These examples are based on an investment of $1,000 invested at the beginning of the period and held for the entire period from October 1, 2019, through March 31, 2020.
The Actual Expense figures in the table below provide information about actual account values and actual expenses. You may use the information below, together with the amount you invested, to estimate the expenses that you paid over the period. Simply divide your account value by $1,000 (for example, an $8,600 account value divided by $1,000 = 8.6), then multiply the result by the number in the table under the heading entitled "Actual Expenses Paid During Period" to estimate the expenses you paid on your account during this period.
The Hypothetical Expense figures in the table below provide information about hypothetical account values and hypothetical expenses based on the Fund's actual expense ratio and an assumed rate of return of 5% per year before expenses, which is not the Fund's actual return. The hypothetical account values and expenses may not be used to estimate the actual ending account balance or expenses you paid for the period. You may use this information to compare this 5% hypothetical example with the 5% hypothetical examples that appear in shareholder reports of other funds.
Please note the expenses shown in the table below are meant to highlight your ongoing costs only and do not reflect any transactional costs. If these transactional costs were included, your costs would have been higher.
| Beginning Account Value 10/1/19 | Actual Ending Account Value 3/31/20 | Hypothetical Ending Account Value 3/31/20 | Actual Expenses Paid During Period 10/1/19- 3/31/20* | Hypothetical Expenses Paid During Period 10/1/19- 3/31/20* | Annualized Expense Ratio During Period 10/1/19- 3/31/20 | ||||||||||||||||||||||
Fund Shares | $ | 1,000.00 | $ | 830.10 | $ | 1,020.05 | $ | 4.53 | $ | 5.00 | 0.99 | % | |||||||||||||||
Institutional Shares | 1,000.00 | 830.70 | 1,020.50 | 4.12 | 4.55 | 0.90 | % | ||||||||||||||||||||
* Expenses are equal to the average account value multiplied by the Fund's annualized expense ratio multiplied by 183/366 (the number of days in the most recent fiscal half-year divided by the number of days in the fiscal year).
Proxy Voting and Portfolio Holdings Information
Proxy Voting:
Information regarding the policies and procedures the Fund uses to determine how to vote proxies relating to portfolio securities is available without charge, upon request, by calling (800) 539-3863. The information is also included in the Fund's Statement of Additional Information, which is available on the SEC's website at www.sec.gov.
Information relating to how the Fund voted proxies relating to portfolio securities held during the most recent 12 months ended June 30 is available on the SEC's website at www.sec.gov.
Availability of Schedules of Portfolio Investments:
The Trust files a complete list of Schedules of Portfolio Investments with the SEC for the first and third quarter of each fiscal year on Form N-PORT. Forms N-PORT are available on the SEC's website at www.sec.gov.
36
USAA Mutual Funds Trust | Supplemental Information — continued March 31, 2020 | ||||||
(Unaudited)
Trustee and Officer Information
Board of Trustees:
Overall responsibility for management of the Trust rests with the Board. The Trust is managed by the Board in accordance with the laws of the state of Delaware. There are currently 10 Trustees, eight of whom are not "interested persons" of the Trust within the meaning of that term under the 1940 Act ("Independent Trustees") and two of whom is an "interested person" of the Trust within the meaning of that term under the 1940 Act ("Interested Trustee"). The Trustees, in turn, elect the officers of the Trust to actively supervise its day-to-day operations.
The following tables list the Trustees, their ages, position with the Trust, commencement of service, principal occupations during the past five years and any directorships of other investment companies or companies whose securities are registered under the Securities Exchange Act of 1934, as amended, or who file reports under that Act. Each Trustee oversees 47 portfolios in the Trust. Each Trustee's address is 15935 La Cantera Pkwy, Building Two, San Antonio, TX, 78256. Pursuant to a policy adopted by the Board, the term of office for each Trustee shall be until the Independent Trustee reaches age 75 or an Interested Trustee reaches age 75. The Board may change or grant exceptions from this policy at any time without shareholder approval. A Trustee may resign or be removed by a vote of the other Trustees or the holders of a majority of the outstanding shares of the Trust at any time. Vacancies on the Board can be filled by the action of a majority of the Trustees, provided that after filling such vacancy at least two-thirds of the Trustees have been elected by the shareholders.
Name and Date of Birth | Position Held with the Trust | Year Commenced Service | Principal Occupation During Past 5 Years | Other Directorships Held During Past 5 Years | |||||||||||||||
Independent Trustees. | |||||||||||||||||||
| Jefferson C. Boyce, Born September 1957 | Lead Independent Trustee, and Vice Chairman | 2013 | Senior Managing Director, New York Life Investments, LLC (1992-2012) | Westhab, Inc. | |||||||||||||||
| John C. Walters, Born February 1962 | Trustee | 2019 | Retired. Mr. Walters brings significant Board experience including active involvement with the board of a Fortune 500 company, and a proven record of leading large, complex financial organizations. He has a demonstrated record of success in distribution, manufacturing, investment brokerage, and investment management in both the retail and institutional investment businesses. He has substantial experience in the investment management business with a demonstrated ability to develop and drive strategy while managing operation, financial, and investment risk. | Guardian Variable Products Trust (16 series), Lead Independent Director; Amerilife Holdings LLC, Director; Stadion Money Management; Director; University of North Carolina (Chapel Hill), Member Board of Governors. | |||||||||||||||
37
USAA Mutual Funds Trust | Supplemental Information — continued March 31, 2020 | ||||||
(Unaudited)
Name and Date of Birth | Position Held with the Trust | Year Commenced Service | Principal Occupation During Past 5 Years | Other Directorships Held During Past 5 Years | |||||||||||||||
| Robert L. Mason, Ph.D., Born July 1946 | Trustee | 1997 | Adjunct Professor in the Department of Management Science and Statistics in the College of Business at the University of Texas at San Antonio (since 2001); Institute Analyst, Southwest Research Institute (March 2002-January 2016) | None | |||||||||||||||
| Dawn M. Hawley, Born February 1954 | Trustee | 2014 | Manager of Finance, Menil Foundation, Inc. (May 2007-June 2011), which is a private foundation that oversees the assemblage of sculptures, prints, drawings, photographs, and rare books. Director of Financial Planning and Analysis and Chief Financial Officer, AIM Management Group, Inc. (October 1987-January 2006) | None | |||||||||||||||
| Paul L. McNamara, Born July 1948 | Trustee | 2012 | Director, Cantor Opportunistic Alternatives Fund, LLC (March 2010-February 2014) , which is a closed-end fund of funds by Cantor Fitzgerald Investment Advisors, LLC | None | |||||||||||||||
38
USAA Mutual Funds Trust | Supplemental Information — continued March 31, 2020 | ||||||
(Unaudited)
Name and Date of Birth | Position Held with the Trust | Year Commenced Service | Principal Occupation During Past 5 Years | Other Directorships Held During Past 5 Years | |||||||||||||||
| Richard Y. Newton III, Born January 1956 | Trustee | 2017 | Director, Elta North America (01/18-present), which is a global leader in the design, manufacture, and support of innovative electronic systems in the ground, maritime, airborne, and security domains for the nation's warfighters, security personnel, and first responders; Managing Partner, Pioneer Partnership Development Group (December 2015-present)); Executive Director, The Union League Club of New York (June 2014-November 2015): Executive Vice President, Air Force Association (August 2012-May 2014); Lieutenant General, United States Air Force (January 2008-June 2012) | None | |||||||||||||||
| Barbara B. Ostdiek, Ph.D., Born March 1964 | Trustee | 2008 | Senior Associate Dean of Degree Programs at Jesse H. Jones Graduate School of Business at Rice University (since 2013); Associate Professor of Finance at Jessie H. Jones Graduate School of Business at Rice University (since 2001) | None | |||||||||||||||
| Michael F. Reimherr, Born August 1945 | Trustee | 2000 | President of Reimherr Business Consulting (May 1995-December 2017); St. Mary's University Investment Committee overseeing University Endowment (since 2014) | None | |||||||||||||||
39
USAA Mutual Funds Trust | Supplemental Information — continued March 31, 2020 | ||||||
(Unaudited)
Name and Date of Birth | Position Held with the Trust | Year Commenced Service | Principal Occupation During Past 5 Years | Other Directorships Held During Past 5 Years | |||||||||||||||
Interested Trustees. | |||||||||||||||||||
| David C. Brown, ** Born May 1972 | Trustee | 2019 | Chairman and Chief Executive Officer (since 2013), Co-Chief Executive Officer (2011-2013), Victory Capital Management Inc.; Chairman and Chief Executive Officer, Victory Capital Holdings, Inc. (since 2013). Mr. Brown brings to the Board extensive business, finance and leadership skills gained and developed through years of experience in the financial services industry, including his tenure overseeing the strategic direction as CEO of Victory Capital. These skills, combined with Mr. Brown's extensive knowledge of the financial services industry and demonstrated success in the development and distribution of investment strategies and products, enable him to provide valuable insights to the Board and strategic direction for the Funds | Trustee, Victory Portfolios (42 series), Victory Portfolios II (26 series), Victory Variable Insurance Funds (9 series) | |||||||||||||||
40
USAA Mutual Funds Trust | Supplemental Information — continued March 31, 2020 | ||||||
(Unaudited)
Name and Date of Birth | Position Held with the Trust | Year Commenced Service | Principal Occupation During Past 5 Years | Other Directorships Held During Past 5 Years | |||||||||||||||
| Daniel S. McNamara, ** Born June 1966 | Trustee and Chair of the Board of Trustees | 2012 | Trustee, President, and Vice Chairman of USAA ETF Trust (June 2017-June 2019); President of Financial Advice & Solutions Group (FASG), USAA (since 2013); Director, IMCO (September 2009-April 2014); President, AMCO (August, 2011-April 2013); Senior Vice President of USAA Financial Planning Services Insurance Agency, Inc. (FPS) (since 2011); Director of USAA Investment Management Company (IMCO) (since 2009); Chairman of Board of IMCO (since 2013); Director of USAA Asset Management Company (AMCO), (August 2011-June 2019); President and Director of USAA Shareholder Account Services (SAS)(October 2009-June 2019); Director and Vice Chairman of FPS (since 2013); President and Director of USAA Investment Corporation (ICORP) (since 2010); Chairman of Board of ICORP (since 2013); Director of USAA Financial Advisors, Inc. (FAI) (since 2013); Chairman of Board of FAI (since 2015). Mr. McNamara brings to the Board extensive experience in the financial services industry, including experience as an officer of the Trust. | None | |||||||||||||||
** Mr. McNamara and Mr. Brown are "Interested Persons" by reason of their relationships with the Adviser.
The Statement of Additional Information includes additional information about the Trustees of the Trust and is available, without charge, on the SEC's website at www.sec.gov and/or by calling (800)-539-3863.
41
USAA Mutual Funds Trust | Supplemental Information — continued March 31, 2020 | ||||||
(Unaudited)
Officers:
The officers of the Trust, their ages, commencement of service and their principal occupations during the past five years, are detailed in the following table. Each officer serves until the earlier of his or her resignation, removal, retirement, death, or the election of a successor. The mailing address of each officer of the Trust is 15935 La Cantera Pkwy, Building Two, San Antonio, TX, 78256. The officers of the Trust receive no compensation directly from the Trust for performing the duties of their offices.
Name and Date of Birth | Position with the Trust | Year Commenced Service | Principal Occupation During Past 5 Years | ||||||||||||
Interested Officers. | |||||||||||||||
| Christopher K. Dyer, Born February 1962 | President | 2019 | Director of Fund Administration, Victory Capital (2004-present) | ||||||||||||
| Scott A Stahorsky, Born July 1969 | Vice President | 2019 | Manager, Fund Administration, Victory Capital (since 2015); Senior Analyst, Fund Administration, Victory Capital (prior to 2015) | ||||||||||||
| James K. De Vries, Born April 1969 | Treasurer, Principal Financial Officer | 2018 | Executive Director, Victory Capital Management Inc. (since 2019); Treasurer, USAA ETF Trust (September 2018-June 2019); Executive Director, Investment and Financial Administration, USAA (April 2012-June 2019); Assistant Treasurer, USAA ETF Trust (June 2017-September 2018); Assistant Treasurer, USAA Mutual Funds Trust (December 2013-February 2018) | ||||||||||||
| Allan Shaer, Born March 1965 | Assistant Treasurer | 2019 | Senior Vice President, Financial Administration, Citi Fund Services Ohio, Inc. (since 2016); Vice President, Mutual Fund Administration, JP Morgan Chase (2011-2016) | ||||||||||||
| Carol D. Trevino, Born October 1965 | Assistant Treasurer | 2018 | Director, Accounting and Finance, Victory Capital Management Inc. (since 2019); Accounting/Financial Director, USAA (December 2013-June 2019); Assistant Treasurer, USAA ETF Trust (September 2018-June 2019). | ||||||||||||
| Erin G. Wagner, Born February 1974 | Secretary | 2019 | Deputy General Counsel, the Adviser (since 2013) | ||||||||||||
| Charles Booth, Born April 1960 | Anti-Money Laundering Compliance Officer and Identity Theft Officer | 2019 | Director, Regulatory Administration and CCO Support Services, Citi Fund Services Ohio, Inc. (2007-present) | ||||||||||||
| Amy Campos, Born July 1976 | Chief Compliance Officer | 2019 | Chief Compliance Officer, USAA Mutual Funds Trust (since 2019); Executive Director, Deputy Chief Compliance Officer, USAA Mutual Funds Trust and USAA ETF Trust (July 2017-June 2019); Compliance Director, USAA Mutual Funds Trust (2014-July 2017) | ||||||||||||
42
USAA Mutual Funds Trust | Supplemental Information — continued March 31, 2020 | ||||||
(Unaudited)
Additional Federal Income Tax Information
The following federal tax information related to the Fund's fiscal year ended March 31, 2020, is provided for information purposes only and should not be used for reporting to federal or state revenue agencies. Federal tax information for the calendar year will be reported to you on Form 1099-DIV in January 2021.
With respect to distributions paid, the Fund designates the following amounts (or, if subsequently determined to be different, the maximum amount allowable) for the fiscal year ended March 31, 2020 (amounts in thousands):
| Dividend Received Deduction (corporate shareholders)* | Qualified Dividend Income (non-corporate shareholders)* | Long-Term Capital Gain Distributions(1) | |||||||||||||
77.18 | % | 98.95 | % | $ | 4,088 | ||||||||||
* Presented as a percentage of net investment income and excludes short-term capital gain distributions paid, if any. All or a portion of these amounts may be exempt from taxation at the state level.
(1) Pursuant to Section 852 of the Internal Revenue Code.
43
Privacy Policy
Protecting the Privacy of Information
The Trust respects your right to privacy. We also know that you expect us to conduct and process your business in an accurate and efficient manner. To do so, we must collect and maintain certain personal information about you. This is the information we collect from you on applications or other forms, and from the transactions you make with us or third parties. It may include your name, address, social security number, account transactions and balances, and information about investment goals and risk tolerance.
We do not disclose any information about you or about former customers to anyone except as permitted or required by law. Specifically, we may disclose the information we collect to companies that perform services on our behalf, such as the transfer agent that processes shareholder accounts and printers and mailers that assist us in the distribution of investor materials. We may also disclose this information to companies that perform marketing services on our behalf. This allows us to continue to offer you Victory investment products and services that meet your investing needs, and to effect transactions that you request or authorize. These companies will use this information only in connection with the services for which we hired them. They are not permitted to use or share this information for any other purpose.
To protect your personal information internally, we permit access only by authorized employees and maintain physical, electronic and procedural safeguards to guard your personal information.*
* You may have received communications regarding information about privacy policies from other financial institutions which gave you the opportunity to "opt-out" of certain information sharing with companies which are not affiliated with that financial institution. The Trust does not share information with other companies for purposes of marketing solicitations for products other than the Trust. Therefore, the Trust does not provide opt-out options to their shareholders.
15935 La Cantera Pkwy
Building Two
San Antonio, Texas 78256

Visit our website at: | Call | ||||||
usaa.com | (800) 235-8396 | ||||||
98354-0520

MARCH 31, 2020
Annual Report
USAA New York Bond Fund
Beginning January 1, 2021, as permitted by regulations adopted by the Securities and Exchange Commission, paper copies of the Fund's shareholder reports like this one will no longer be sent by mail, unless you specifically request paper copies of the reports from the Fund or from your financial intermediary, such as a broker-dealer or bank. Instead, the reports will be made available on usaa.com, and you will be notified by mail each time a report is posted and provided with a website link to access the report.
If you already elected to receive shareholder reports electronically, you will not be affected by this change and you need not take any action. You may elect to receive shareholder reports and other communications from the Fund or your financial intermediary electronically by notifying your financial intermediary directly, or if you are a direct investor, by calling (800) 235-8396 or logging on to usaa.com.
You may elect to receive all future reports in paper free of charge. You can inform the Fund or your financial intermediary that you wish to continue receiving paper copies of your shareholder reports by notifying your financial intermediary directly, or if you are a direct investor, by calling (800) 235-8396 or logging on to usaa.com. Your election to receive reports in paper will apply to all funds held with the USAA family of funds or your financial intermediary.
Victory Capital means Victory Capital Management Inc., the investment adviser of the USAA Mutual Funds. USAA Mutual Funds are distributed by Victory Capital Services, Inc., member FINRA, an affiliate of Victory Capital. Victory Capital and its affiliates are not affiliated with United Services Automobile Association or its affiliates. USAA and the USAA logo are registered trademarks and the USAA Mutual Funds and USAA Investments logos are trademarks of United Services Automobile Association and is being used by Victory Capital and its affiliates under license.
USAA Mutual Funds Trust
TABLE OF CONTENTS
Shareholder Letter (Unaudited) | 2 | ||||||
Managers' Commentary (Unaudited) | 4 | ||||||
Investment Overview (Unaudited) | 7 | ||||||
| Investment Objective & Portfolio Holdings (Unaudited) | 9 | ||||||
Financial Statements | |||||||
Schedule of Portfolio Investments | 11 | ||||||
Statement of Assets and Liabilities | 17 | ||||||
Statement of Operations | 18 | ||||||
Statements of Changes in Net Assets | 19 | ||||||
Financial Highlights | 20 | ||||||
Notes to Financial Statements | 22 | ||||||
| Report of Independent Registered Public Accounting Firm | 33 | ||||||
Supplemental Information (Unaudited) | |||||||
Expense Example | 34 | ||||||
Proxy Voting and Portfolio Holdings Information | 34 | ||||||
Trustees' and Officers' Information | 35 | ||||||
Additional Federal Income Tax Information | 41 | ||||||
Privacy Policy (inside back cover) | |||||||
This report is for the information of the shareholders and others who have received a copy of the currently effective prospectus of the Fund, managed by Victory Capital Management Inc. It may be used as sales literature only when preceded or accompanied by a current prospectus, which provides further details about the Fund.
IRA DISTRIBUTION WITHHOLDING DISCLOSURE
We generally must withhold federal income tax at a rate of 10% of the taxable portion of your distribution and, if you live in a state that requires state income tax withholding, at your state's tax rate. However, you may elect not to have withholding apply or to have income tax withheld at a higher rate. Any withholding election that you make will apply to any subsequent distribution unless and until you change or revoke the election. If you wish to make a withholding election, or change or revoke a prior withholding election, call (800) 235-8396.
If you do not have a withholding election in place by the date of a distribution, federal income tax will be withheld from the taxable portion of your distribution at a rate of 10%. If you must pay estimated taxes, you may be subject to estimated tax penalties if your estimated tax payments are not sufficient and sufficient tax is not withheld from your distribution.
For more specific information, please consult your tax adviser.
1
(Unaudited)
Dear Shareholder,
If there were ever a time that illustrated the dynamic and unpredictable nature of financial markets—and life in general—it would be the strange days of early 2020. The spread of COVID-19 throughout the United States and the world has been an unprecedented event that, among so many other impacts, rendered virtually any economic forecasts unreliable. Seemingly overnight, the sentiment pendulum swung from risk-on to risk-off. We all became familiar with unusual concepts like "social distancing" and "flattening the curve."
Given that wide swaths of the global economy came to an all-stop—an event that has no real precedent—there remains tremendous uncertainty as to the depth and extent of the economic downturn. Making assumptions about the extent of the virus' reach, its impact on consumer behavior and employment, and the speed at which the U.S. government and U.S. Federal Reserve (the "Fed") can revive the economy is educated guesswork at best.
Fortunately, it's not all bad news. We did see markets stabilize as this annual reporting period drew to a close (and in the early weeks of April immediately following). As of the writing of this letter, the array of new lending facilities and programs launched by the Fed generally appear to have had their intended effect of improving liquidity and trading, at least in the short-term. Credit spreads across corporate, high-yield, structured, and municipal bond markets were coaxed down from their highs. Trading in equity markets also appeared to stabilize.
The USAA tax-exempt funds generally performed as would be expected given the unusual market environment. Our tax-exempt funds tend to be more credit heavy, holding more BBB-category rated bonds than the average in our peer groups. Typically, we overweight these credits to provide additional tax-free income to our investors, and these securities tend to underperform in periods of market dislocation when credit spreads widen significantly.
We believe that the volatility in the tax-exempt market reflected the lack of liquidity, rather than any significant credit deterioration. It's important to underscore that the USAA tax-exempt funds entered the crisis with ample liquidity and none have yet had to sell portfolio securities at an inopportune price to achieve a fund's desired level of exposure.
Looking ahead, the economy and the markets remain unpredictable. Yet our investment philosophy—and our resolve—is steadfast. A priority of our fixed-income portfolio managers and analysts is to maintain substantial liquidity, as no one can predict when the crisis will abate and what liquidity needs might be in the meantime.
Through it all, we remain committed to our core competency of evaluating, taking and managing credit risk, and we continue to build portfolios bond-by-bond. We believe the recent environment, though breathtaking in its volatility, provides extraordinary buying opportunities that may help us lock in higher tax-free yields for our investors.
2
If you have questions about the current market dynamics or your specific portfolio or investment plan, please give one of our financial representatives a call. They can help ensure that you are properly diversified based on your long-term goals, time horizon, and risk tolerance.
From all of us here at USAA Funds, thank you for letting us help you work toward your investment goals.

Christopher K. Dyer, CFA
President,
USAA Funds
3
USAA Mutual Funds Trust
USAA New York Bond Fund
Manager's Commentary
(Unaudited)
Regina G. Conklin, CPA, CFA
John C. Bonnell, CFA
Andrew R. Hattman, CFA, CAIA
• What were the market conditions during the reporting period?
Tax-exempt bonds generated positive returns during the reporting period ended March 31, 2020, due in part to falling municipal bond yields. (Bond prices and yields move in opposite directions.) However, market conditions changed drastically during the reporting period.
For the first approximate 11 months of the reporting period, tax-exempt bonds generated strong positive returns. In the second half of calendar year 2019, due to intensifying U.S.-China trade tensions and global economic weakness, the U.S. Federal Reserve (the "Fed") cut the target federal funds rate from a range of 2.25% - 2.50% to a target range of 1.50% - 1.75%. Municipal bond AAA rates followed suit by generally falling for the majority of the reporting period, reaching their lows on March 9, 2020. Tax-exempt bonds also benefited from supply-and-demand dynamics during the first approximate 11 months of the reporting period. Supply was tight, as new issuance failed to keep pace with demand. Demand was intense, as municipal bond mutual funds saw inflows every week during the reporting period up to early March. In late February and early March, as the emergence of a novel coronavirus (COVID-19) raised fears about a potential U.S. economic slowdown, municipal bonds held up well compared to other segments of the fixed income market.
That all changed on March 10, 2020. For the next 10 days, interest rates rose quickly and significantly along the municipal yield curve amid record outflows from municipal bond mutual funds. The trend reversed on March 20, and municipal bond yields fell sharply, finishing the reporting period below their starting points. Over this period, the 3-year AAA municipal bond rate started at 0.50% on March 9, rose to 2.75% on March 20, and fell to 1.11% on March 31 (after starting the reporting period at 1.54% on April 1, 2019). Municipal bond credit spreads (yield differentials between municipal bonds with similar maturities but different credit ratings) widened in March 2020, with spreads on lower-rated municipal securities widening the most. Rating agencies placed entire municipal bond sectors on credit watch because of a potential economic slowdown driven by the shutdowns, lockdowns, and self-quarantines that had been instituted to slow the spread of COVID-19. The Fed responded with unprecedented actions, slashing the target federal funds rate to a range of between zero and 0.25%, implementing quantitative easing and credit support programs, and offering assistance to state and municipal governments. The Fed also has said it will do what it takes to keep financial markets—including the municipal bond market—fully functioning.
4
USAA Mutual Funds Trust
USAA New York Bond Fund (continued)
• How did the USAA New York Bond Fund (the "Fund") perform during the reporting period?
The Fund has two share classes: Fund Shares and Adviser Shares. For the reporting period ended March 31, 2020, the Fund Shares and Adviser Shares had a total return of 2.60% and 2.36%, respectively, versus an average return of 2.45% for the funds in the Lipper New York Municipal Debt Funds category. This compares to returns of 2.43% for the Lipper New York Municipal Debt Funds Index and 3.85% for the Bloomberg Barclays Municipal Bond Index. The Fund Shares' and Adviser Shares' tax-exempt distributions over the reporting period produced a dividend yield of 3.24% and 3.00%, respectively, compared to the Lipper category average of 2.59%.
• What are the conditions in the state of New York?
New York State (the "State") is currently enduring a severe COVID-19 outbreak, which has acutely impaired economic activity. Nevertheless, it is expected that New York will rebound at the conclusion of the pandemic. A substantial and diverse economic base that includes New York City, a center of world trade, finance, and culture, supports the State's strong credit quality. The State has historically employed a sound process of multi-year budgeting with quarterly adjustments. Undoubtedly, the State's financial performance will be pressured over the short-term by sizable tax revenue declines during the pandemic and increased expenditure requirements related to the COVID-19 emergency response. Sizable reserves and anticipated federal aid should mitigate some stress. Ultimately, we believe that the State will exercise appropriate fiscal judgement and return to budgetary balance following the end of the outbreak. Ratings continue to be sound at Aa1 by Moody's, AA+ by Standard and Poor's, and AA+ by Fitch. Depending on the duration of the COVID-19 outbreak, modest downgrades are possible.
• What strategies did you employ during the reporting period?
In keeping with our investment approach, we continued to focus on income generation. The Fund's long-term income distribution, not its price appreciation, accounts for most of its total return.
Our commitment to independent credit research continued to help us identify attractive opportunities for the Fund. We employ fundamental analysis that emphasizes an issuer's ability and willingness to repay its debt. Through our credit research, we strive both to recognize relative value and to avoid potential pitfalls, which is especially important in volatile times like the present. As always, we worked with our in-house team of credit analysts to select investments for the Fund on a bond-by-bond basis. Our team continuously monitors all the holdings in the Fund's portfolio.
5
USAA Mutual Funds Trust
USAA New York Bond Fund (continued)
The Fund continues to hold a diversified portfolio of longer-term, primarily investment-grade municipal bonds. To limit exposure to an unexpected event, the Fund is diversified by sector, issuer, and geography. In addition, we avoid bonds subject to the federal alternative minimum tax for individuals.
Thank you for allowing us to assist you with your investment needs.
6
USAA Mutual Funds Trust
USAA New York Bond Fund
Investment Overview
(Unaudited)
Average Annual Total Return
Year Ended March 31, 2020
Fund Shares | Adviser Shares | ||||||||||||||||||
INCEPTION DATE | 10/10/90 | 8/1/10 | |||||||||||||||||
Net Asset Value | Net Asset Value | Bloomberg Barclays Municipal Bond Index1 | Lipper New York Municipal Debt Funds Index2 | ||||||||||||||||
One Year | 2.60 | % | 2.36 | % | 3.85 | % | 2.43 | % | |||||||||||
Five Year | 2.60 | % | 2.37 | % | 3.19 | % | 3.05 | % | |||||||||||
Ten Year | 4.01 | % | NA | 4.14 | % | 3.87 | % | ||||||||||||
Since Inception | NA | 3.53 | % | NA | NA | ||||||||||||||
Past performance is not indicative of future results. The performance data quoted represents past performance and current returns may be lower or higher. The investment return and principal value will fluctuate so that an investor's shares, when redeemed, may be worth more or less than the original cost. To obtain performance information current to the most recent month's end, please visit www.usaa.com.
Total return measures the price change in a share assuming the reinvestment of all net investment income and realized capital gain distributions, if any. The total returns quoted do not reflect adjustments made to the enclosed financial statements in accordance with U.S. generally accepted accounting principles or the deduction of taxes that a shareholder would pay on net investment income and realized capital gain distributions, including reinvested distributions, or redemptions of shares. The total return figures set forth above include all waivers of fees for various periods since inception. Without such fee waivers, the total returns would have been lower.
USAA New York Bond Fund — Growth of $10,000

1 The unmanaged, broad-based Bloomberg Barclays Municipal Bond Index (the Index) tracks total return performance for the long-term, investment-grade, tax-exempt bond market. All tax-exempt bond funds will find it difficult to outperform the Index because the Index does not reflect any deduction for fees, expenses, or taxes. It is not possible to invest directly in an index.
2 The unmanaged Lipper New York Municipal Debt Funds Index measures the Fund's performance to that of the Lipper New York Municipal Debt Funds category.There are no expenses associated with the index, while there are expenses associated with the Fund. It is not possible to invest directly in an index.
The graph reflects investment of growth of a hypothetical $10,000 investment in the Fund. Past performance is no guarantee of future results.
The graph and table do not reflect the deduction of taxes that a shareholder would pay on Fund distributions or the redemption of Fund shares.
7
USAA Mutual Funds Trust
USAA New York Bond Fund (continued)
Average Annual Compounded Returns with Reinvestment of Dividends — Periods Ended March 31, 2020
Total Return | = | Dividend Return | + | Price Change | |||||||||||||||||||
| 10 Years | 4.01 | % | = | 3.68 | % | + | 0.33 | % | |||||||||||||||
| 5 Years | 2.60 | % | = | 3.41 | % | + | –0.81 | % | |||||||||||||||
| 1 Year | 2.60 | % | = | 3.19 | % | + | –0.59 | % | |||||||||||||||
The performance data quoted represents past performance and is no guarantee of future results. Current performance may be higher or lower than the performance data quoted. The return and principal value of an investment will fluctuate, so that an investor's shares, when redeemed, may be worth more or less than their original cost. For performance data current to the most recent month-end, visit usaa.com.
Annual Total Returns and Compounded Dividend Returns for
the One-Year Periods Ended March 31, 2011 — March 31, 2020
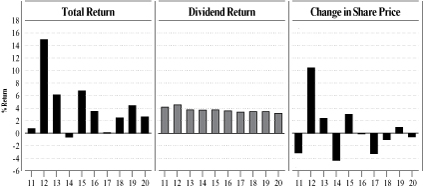
Note the role that dividend returns play in the Fund Shares' total return over time. Share prices and dividend rates will vary from period to period. However, dividend returns generally are more consistent and less volatile than share prices.
Total return measures the price change in a share assuming the reinvestment of all net investment income and realized capital gain distributions, if any. Dividend return is the net investment income dividends received over the period, assuming reinvestment of all dividends. Share price change is the change in net asset value over the period adjusted for realized capital gain distributions. The returns quoted do not reflect adjustments made to the enclosed financial statements in accordance with U.S. generally accepted accounting principles or the deduction of taxes that a shareholder would pay on distributions (including capital gain distributions), redemptions of shares, or reinvested net investment income.
8
| USAA Mutual Funds Trust USAA New York Bond Fund | March 31, 2020 | ||||||
(Unaudited)
Investment Objective & Portfolio Holdings:
The Fund's investment objective seeks to provide New York investors with a high level of current interest income that is exempt from federal income tax and New York State and New York City personal income taxes.
Top 10 Industries
March 31, 2020
(% of Net Assets)
Education | 23.1 | % | |||||
Special Assessment/Tax/Fee | 15.5 | % | |||||
Hospital | 13.4 | % | |||||
Escrowed Bonds | 10.6 | % | |||||
General Obligation | 7.6 | % | |||||
Water/Sewer Utility | 6.5 | % | |||||
Multifamily Housing | 3.8 | % | |||||
Buildings | 3.0 | % | |||||
Electric/Gas Utility | 2.7 | % | |||||
Nursing/CCRC | 2.7 | % | |||||
Refer to the Schedule of Portfolio Investments for a complete list of portfolio holdings.
9
| USAA Mutual Funds Trust USAA New York Bond Fund (continued) | March 31, 2020 | ||||||
(Unaudited)
Portfolio Ratings Mix*
March 31, 2020
(% of Net Assets)
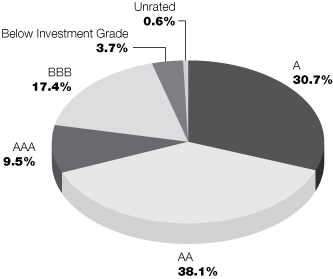
This chart reflects the highest long-term rating from a Nationally Recognized Statistical Rating Organization ("NRSRO"), with the four highest long-term credit ratings labeled, in descending order of credit quality, AAA, AA, A, and BBB. These categories represent investment-grade quality. NRSRO ratings are shown because they provide independent analysis of the credit quality of the Fund's investments. Victory Capital Management, Inc. ("Adviser") also performs its own fundamental credit analysis of each security. As part of its fundamental credit analysis, the Adviser considers various criteria, including industry specific actions, peer comparisons, payment ranking, and structure specific characteristics. Any of the Fund's securities that are not rated by an NRSRO appear in the chart above as "Unrated," but these securities are analyzed and monitored by the Adviser on an ongoing basis. Government securities that are issued or guaranteed as to principal and interest by the U.S. government and prerefunded and escrowed-to-maturity municipal bonds that are not rated are treated as AAA for credit quality purposes.
*Does not include futures and money market instruments.
10
| USAA Mutual Funds Trust USAA New York Bond Fund | Schedule of Portfolio Investments March 31, 2020 | ||||||
(Amounts in Thousands, Except for Shares)
Security Description | Shares or Principal Amount | Value | |||||||||
Common Stocks (0.2%) | |||||||||||
Utilities (0.2%): | |||||||||||
CMS Liquidating Trust (a) (b) | 200 | $ | 497 | ||||||||
Total Common Stock (Cost $499) | 497 | ||||||||||
Municipal Bonds (99.0%) | |||||||||||
New York (94.7%): | |||||||||||
| Albany Capital Resource Corp. Revenue 6.00%, 11/15/25, Pre-refunded 11/15/20 @ 100 | $ | 1,000 | 1,030 | ||||||||
5.00%, 6/1/49, Continuously Callable @100 | 1,500 | 1,462 | |||||||||
| Albany County Airport Authority Revenue, Series A, 5.00%, 12/15/48, Continuously Callable @100 | 1,000 | 1,183 | |||||||||
| Brookhaven Local Development Corp. Revenue, 5.25%, 11/1/36, Continuously Callable @100 | 1,500 | 1,602 | |||||||||
| Buffalo & Erie County Industrial Land Development Corp. Revenue 6.00%, 10/1/31, Pre-refunded 4/1/21 @ 100 | 500 | 525 | |||||||||
5.00%, 6/1/35, Continuously Callable @103 | 1,000 | 1,130 | |||||||||
5.00%, 7/1/40, Continuously Callable @100 | 2,000 | 2,204 | |||||||||
5.00%, 8/1/52, Continuously Callable @100 | 1,000 | 1,001 | |||||||||
| Build NYC Resource Corp. Revenue 5.00%, 6/1/40, Continuously Callable @100 | 700 | 793 | |||||||||
5.00%, 8/1/40, Continuously Callable @100 | 1,000 | 1,124 | |||||||||
5.00%, 7/1/41, Continuously Callable @100 | 500 | 518 | |||||||||
5.00%, 8/1/42, Pre-refunded 8/1/22 @ 100 | 1,500 | 1,640 | |||||||||
4.00%, 8/1/42, Continuously Callable @100 | 1,000 | 1,116 | |||||||||
5.50%, 4/1/43, Continuously Callable @100 | 1,000 | 1,069 | |||||||||
5.00%, 7/1/45, Continuously Callable @100 | 2,000 | 2,252 | |||||||||
5.00%, 11/1/47 | 2,000 | 2,778 | |||||||||
5.00%, 6/1/48, Continuously Callable @102 | 2,000 | 2,116 | |||||||||
4.00%, 7/1/49, Continuously Callable @100 | 500 | 536 | |||||||||
| Canton Capital Resource Corp. Revenue (INS — Assured Guaranty Municipal Corp.), Series A, 5.00%, 5/1/40, Pre-refunded 5/1/20 @ 100 | 1,000 | 1,003 | |||||||||
| City of New York, GO 4.90%, 10/1/46, Continuously Callable @100 (c) | 4,000 | 4,000 | |||||||||
Series D-1, 4.00%, 12/1/43, Continuously Callable @100 (d) | 4,000 | 4,448 | |||||||||
| City of Newburgh, GO Series A, 5.00%, 6/15/23, Continuously Callable @100 | 825 | 892 | |||||||||
Series A, 5.00%, 6/15/24, Continuously Callable @100 | 870 | 947 | |||||||||
City of Poughkeepsie, GO, 5.00%, 6/1/31, Continuously Callable @100 | 600 | 633 | |||||||||
| City of Yonkers, GO (INS — Assured Guaranty Municipal Corp.) Series A, 5.00%, 10/1/24, Continuously Callable @100 | 1,000 | 1,061 | |||||||||
Series A, 3.00%, 7/1/25, AGM, Continuously Callable @100 | 665 | 698 | |||||||||
County of Nassau, GO, Series A, 5.00%, 1/1/38, Continuously Callable @100 | 1,000 | 1,168 | |||||||||
| County of Nassau, GO (INS — Assured Guaranty Municipal Corp.), Series C, 5.00%, 4/1/38, Continuously Callable @100 | 1,000 | 1,099 | |||||||||
County of Rockland, GO | |||||||||||
3.75%, 10/1/25, Continuously Callable @100 | 1,265 | 1,281 | |||||||||
Series B, 5.00%, 12/15/21 | 600 | 638 | |||||||||
See notes to financial statements.
11
| USAA Mutual Funds Trust USAA New York Bond Fund | Schedule of Portfolio Investments — continued March 31, 2020 | ||||||
(Amounts in Thousands, Except for Shares)
Security Description | Principal Amount | Value | |||||||||
| Dutchess County Industrial Development Agency Revenue (INS — Assured Guaranty Corp.), 5.50%, 4/1/30, Pre-refunded 10/1/20 @ 100 | $ | 1,000 | $ | 1,021 | |||||||
| Dutchess County Local Development Corp. Revenue 5.00%, 7/1/46, Continuously Callable @100 | 600 | 658 | |||||||||
Series A, 5.75%, 7/1/40, Pre-refunded 7/1/20 @ 100 | 1,250 | 1,265 | |||||||||
Series A, 5.00%, 7/1/44, Pre-refunded 7/1/24 @ 100 | 1,000 | 1,163 | |||||||||
Series A, 5.00%, 7/1/45, Continuously Callable @100 | 2,000 | 2,305 | |||||||||
Series B, 4.00%, 7/1/41, Continuously Callable @100 | 2,000 | 2,132 | |||||||||
Series B, 4.00%, 7/1/49, Continuously Callable @100 | 1,750 | 1,878 | |||||||||
| Erie County Industrial Development Agency Revenue, Series A, 5.25%, 5/1/32, Continuously Callable @100 | 250 | 261 | |||||||||
| Hempstead Town Local Development Corp. Revenue 5.00%, 7/1/47, Continuously Callable @100 | 600 | 696 | |||||||||
5.00%, 7/1/48, Continuously Callable @100 | 300 | 334 | |||||||||
| Hudson Yards Infrastructure Corp. Revenue, Series A, 4.00%, 2/15/44, Continuously Callable @100 | 2,000 | 2,148 | |||||||||
| Jefferson County Civic Facility Development Corp. Revenue, 4.00%, 11/1/47, Continuously Callable @100 | 1,000 | 1,036 | |||||||||
| Long Island Power Authority Revenue Series A, 5.00%, 5/1/38, Pre-refunded 5/1/21 @ 100 | 2,000 | 2,082 | |||||||||
Series A, 5.00%, 9/1/44, Continuously Callable @100 | 2,000 | 2,273 | |||||||||
Series B, 5.00%, 9/1/41, Continuously Callable @100 | 1,000 | 1,190 | |||||||||
| Metropolitan Transportation Authority Revenue 5.21% (MUNIPSA+50bps), 11/15/42, (Put Date 3/1/22) (e) (f) | 1,000 | 992 | |||||||||
Series A, 5.25%, 11/15/38, Pre-refunded 11/15/21 @ 100 | 1,500 | 1,600 | |||||||||
Series A, 5.25%, 11/15/57, Continuously Callable @100 | 1,000 | 1,111 | |||||||||
Series A-1, 4.00%, 11/15/51, Continuously Callable @100 | 2,000 | 2,027 | |||||||||
Series B, 4.00%, 11/15/50, Continuously Callable @100 | 1,000 | 1,011 | |||||||||
Series C-1, 5.00%, 11/15/35, Continuously Callable @100 | 3,000 | 3,175 | |||||||||
Series D-2, 5.16% (MUNIPSA+45bps), 11/15/44, (Put Date 11/15/22) (e) (f) | 2,000 | 1,979 | |||||||||
| Monroe County Industrial Development Corp. Revenue 5.25%, 10/1/31, Pre-refunded 10/1/21 @ 100 | 500 | 532 | |||||||||
4.00%, 7/1/43, Continuously Callable @100 | 1,000 | 1,087 | |||||||||
5.00%, 12/1/46, Continuously Callable @100 | 1,000 | 1,120 | |||||||||
4.00%, 10/1/47, Continuously Callable @100 | 1,000 | 924 | |||||||||
Series A, 5.00%, 12/1/37, Continuously Callable @100 | 1,000 | 1,074 | |||||||||
Series A, 5.00%, 12/1/42, Continuously Callable @100 | 2,000 | 2,140 | |||||||||
| Monroe County Industrial Development Corp. Revenue (INS — Assured Guaranty Municipal Corp.), 5.00%, 1/15/38, Continuously Callable @100 | 500 | 550 | |||||||||
| Monroe County Industrial Development Corp. Revenue (INS — Federal Housing Administration), 5.50%, 8/15/40, Continuously Callable @100 | 2,100 | 2,174 | |||||||||
| Nassau County Local Economic Assistance Corp. Revenue, 5.00%, 7/1/37, Pre-refunded 7/1/22 @ 100 | 1,000 | 1,087 | |||||||||
| New York City Health & Hospital Corp. Revenue, Series A, 5.00%, 2/15/25, Continuously Callable @100 | 1,885 | 1,890 | |||||||||
| New York City Housing Development Corp. Revenue Series A, 5.00%, 11/1/42, Continuously Callable @100 | 1,000 | 1,003 | |||||||||
Series K, 4.20%, 11/1/58, Continuously Callable @100 | 3,000 | 3,223 | |||||||||
| New York City Industrial Development Agency Revenue (INS — Assured Guaranty Municipal Corp.), 2.25%, 10/1/29 | 1,425 | 1,402 | |||||||||
See notes to financial statements.
12
| USAA Mutual Funds Trust USAA New York Bond Fund | Schedule of Portfolio Investments — continued March 31, 2020 | ||||||
(Amounts in Thousands, Except for Shares)
Security Description | Principal Amount | Value | |||||||||
| New York City Transitional Finance Authority Building Aid Revenue Series S, 5.00%, 7/15/43, Continuously Callable @100 | $ | 1,250 | $ | 1,422 | |||||||
Series S, 4.00%, 7/15/45, Continuously Callable @100 | 2,000 | 2,202 | |||||||||
New York City Transitional Finance Authority Future Tax Secured Revenue | |||||||||||
4.00%, 8/1/41, Continuously Callable @100 | 1,000 | 1,096 | |||||||||
4.00%, 11/1/42, Continuously Callable @100 | 2,000 | 2,157 | |||||||||
0.88%, 2/1/44 (c) | 2,300 | 2,300 | |||||||||
Series B, 4.00%, 8/1/41, Continuously Callable @100 | 1,000 | 1,090 | |||||||||
Series B-1, 4.00%, 11/1/45, Continuously Callable @100 | 2,000 | 2,210 | |||||||||
| New York City Trust for Cultural Resources Revenue 5.00%, 8/1/43, Continuously Callable @100 | 1,000 | 1,087 | |||||||||
4.00%, 7/1/46, Continuously Callable @100 | 1,000 | 1,024 | |||||||||
New York City Water & Sewer System Revenue, Series D, 6/15/20 (g) | 12,090 | 12,040 | |||||||||
| New York Convention Center Development Corp. Revenue 5.00%, 11/15/45, Continuously Callable @100 | 500 | 562 | |||||||||
Series S, 11/15/37 (g) | 1,000 | 631 | |||||||||
| New York Counties Tobacco Trust VI Revenue, 5.00%, 6/1/45, Continuously Callable @100 | 500 | 473 | |||||||||
New York Liberty Development Corp. Revenue | |||||||||||
5.25%, 10/1/35 | 2,500 | 3,047 | |||||||||
5.50%, 10/1/37 | 560 | 708 | |||||||||
5.00%, 11/15/44, Continuously Callable @100 (h) | 1,000 | 1,017 | |||||||||
2.80%, 9/15/69, Continuously Callable @100 | 2,000 | 1,858 | |||||||||
| New York State Dormitory Authority Revenue 5.00%, 7/1/34, Continuously Callable @100 | 500 | 557 | |||||||||
5.25%, 7/1/35, Continuously Callable @100 | 1,000 | 1,001 | |||||||||
5.00%, 12/1/37, Continuously Callable @100 (h) | 1,300 | 1,454 | |||||||||
4.00%, 8/1/38, Continuously Callable @100 | 4,000 | 4,301 | |||||||||
5.50%, 7/1/40, Pre-refunded 7/1/20 @ 100 | 1,000 | 1,011 | |||||||||
5.00%, 7/1/42, Continuously Callable @100 | 250 | 266 | |||||||||
5.00%, 5/1/43, Continuously Callable @100 | 1,000 | 1,115 | |||||||||
5.75%, 7/1/43, Continuously Callable @100 | 1,000 | 1,114 | |||||||||
3.50%, 7/1/44, Continuously Callable @100 | 1,000 | 1,037 | |||||||||
4.00%, 7/1/45, Continuously Callable @100 | 2,000 | 2,070 | |||||||||
Series A, 5.00%, 7/1/26, Pre-refunded 7/1/20 @ 100 | 2,000 | 2,020 | |||||||||
Series A, 5.00%, 7/1/31, Pre-refunded 7/1/21 @ 100 | 1,000 | 1,044 | |||||||||
Series A, 5.00%, 5/1/38, Continuously Callable @100 | 500 | 509 | |||||||||
Series A, 5.00%, 5/1/41, Pre-refunded 5/1/21 @ 100 | 2,000 | 2,088 | |||||||||
Series A, 4.00%, 7/1/41, Continuously Callable @100 | 1,000 | 1,094 | |||||||||
Series A, 4.00%, 7/1/43, Continuously Callable @100 | 2,000 | 2,154 | |||||||||
Series A, 5.00%, 7/1/44, Continuously Callable @100 | 1,500 | 1,596 | |||||||||
Series A, 4.00%, 7/1/45, Continuously Callable @100 | 2,250 | 2,496 | |||||||||
Series A, 4.00%, 3/15/48, Continuously Callable @100 | 3,000 | 3,229 | |||||||||
Series A, 5.00%, 7/1/48, Continuously Callable @100 | 1,000 | 1,211 | |||||||||
Series A, 4.00%, 3/15/49, Continuously Callable @100 | 1,500 | 1,651 | |||||||||
Series A, 4.00%, 7/1/49, Continuously Callable @100 | 1,000 | 1,111 | |||||||||
Series A, 4.00%, 9/1/50, Continuously Callable @100 | 500 | 520 | |||||||||
Series A, 4.00%, 7/1/53, Continuously Callable @100 | 500 | 542 | |||||||||
Series C, 4.00%, 7/1/47, Continuously Callable @100 | 1,000 | 1,088 | |||||||||
Series D, 5.00%, 5/1/39, Continuously Callable @100 | 500 | 530 | |||||||||
See notes to financial statements.
13
| USAA Mutual Funds Trust USAA New York Bond Fund | Schedule of Portfolio Investments — continued March 31, 2020 | ||||||
(Amounts in Thousands, Except for Shares)
Security Description | Principal Amount | Value | |||||||||
| New York State Dormitory Authority Revenue (INS — AMBAC Assurance Corp.) Series 1, 5.50%, 7/1/40 | $ | 2,000 | $ | 2,822 | |||||||
Series A, 5.50%, 5/15/30 (d) | 3,275 | 4,424 | |||||||||
| New York State Dormitory Authority Revenue (INS — Assured Guaranty Municipal Corp.), 5.63%, 11/1/32, Pre-refunded 5/1/21 @ 100 | 500 | 526 | |||||||||
| New York State Dormitory Authority Revenue (NBGA — State of New York Mortgage Agency), 5.00%, 6/1/33, Continuously Callable @100 | 2,320 | 2,327 | |||||||||
| New York State Environmental Facilities Corp. Revenue, 4.00%, 8/15/46, Continuously Callable @100 | 1,000 | 1,100 | |||||||||
| New York State Thruway Authority Revenue Series A, 4.00%, 1/1/56, Continuously Callable @100 | 1,000 | 1,063 | |||||||||
Series B, 4.00%, 1/1/53, Continuously Callable @100 | 1,000 | 1,103 | |||||||||
| New York State Urban Development Corp. Revenue, 5.00%, 3/15/42, Continuously Callable @100 | 3,000 | 3,651 | |||||||||
| Niagara Area Development Corp. Revenue, Series B, 3.50%, 11/1/24, Continuously Callable @100 (h) | 2,000 | 1,932 | |||||||||
| Niagara Tobacco Asset Securitization Corp. Revenue, 5.25%, 5/15/40, Continuously Callable @100 | 750 | 796 | |||||||||
| Oneida County Local Development Corp. Revenue, 4.00%, 7/1/39, Continuously Callable @100 | 750 | 750 | |||||||||
| Onondaga Civic Development Corp. Revenue 4.00%, 7/1/40, Continuously Callable @100 (i) | 300 | 324 | |||||||||
5.38%, 7/1/40, Continuously Callable @100 | 1,500 | 1,511 | |||||||||
5.00%, 10/1/40, Continuously Callable @100 | 1,000 | 1,107 | |||||||||
5.00%, 7/1/42, Continuously Callable @100 | 1,000 | 1,066 | |||||||||
5.00%, 1/1/43, Continuously Callable @100 | 740 | 829 | |||||||||
| Onondaga County Trust for Cultural Resources Revenue 5.00%, 12/1/36, Continuously Callable @100 | 1,000 | 1,048 | |||||||||
5.00%, 5/1/40, Continuously Callable @100 | 800 | 950 | |||||||||
| Southold Local Development Corp. Revenue, 5.00%, 12/1/45, Continuously Callable @100 | 1,000 | 978 | |||||||||
| St. Lawrence County Industrial Development Agency Revenue 4.00%, 7/1/43, Continuously Callable @100 | 500 | 536 | |||||||||
5.00%, 9/1/47, Continuously Callable @100 | 1,770 | 1,997 | |||||||||
| State of New York Mortgage Agency Revenue, Series 211, 3.80%, 10/1/48, Continuously Callable @100 | 1,985 | 2,068 | |||||||||
| Suffolk County Economic Development Corp. Revenue 5.00%, 7/1/28, Pre-refunded 7/1/21 @ 100 | 220 | 231 | |||||||||
5.00%, 7/1/28, Continuously Callable @100 | 1,280 | 1,332 | |||||||||
Series C, 5.00%, 7/1/33, Continuously Callable @100 | 250 | 278 | |||||||||
| Suffolk Tobacco Asset Securitization Corp. Revenue, Series B, 5.00%, 6/1/32, Continuously Callable @100 | 1,450 | 1,497 | |||||||||
| Tompkins County Development Corp. Revenue, 5.00%, 7/1/44, Continuously Callable @100 | 1,375 | 1,414 | |||||||||
| Tompkins County Development Corp. Revenue (INS-Assured Guaranty Municipal Corp.), 5.50%, 7/1/33, Pre-refunded 1/1/21 @ 100 | 1,000 | 1,034 | |||||||||
Triborough Bridge & Tunnel Authority Revenue, Series B, 11/15/32 (g) | 1,000 | 716 | |||||||||
| Troy Capital Resource Corp. Revenue, Series A, 5.00%, 9/1/30, Continuously Callable @100 | 2,000 | 2,030 | |||||||||
See notes to financial statements.
14
| USAA Mutual Funds Trust USAA New York Bond Fund | Schedule of Portfolio Investments — continued March 31, 2020 | ||||||
(Amounts in Thousands, Except for Shares)
Security Description | Principal Amount | Value | |||||||||
| TSASC, Inc. Revenue Bonds, Series A, 5.00%, 6/1/41, Continuously Callable @100 | $ | 1,000 | $ | 1,047 | |||||||
| Westchester County Healthcare Corp. Revenue Series B, 6.00%, 11/1/30, Pre-refunded 11/1/20 @ 100 | 870 | 895 | |||||||||
Series B, 6.00%, 11/1/30, Continuously Callable @100 | 130 | 133 | |||||||||
| Westchester County Local Development Corp. Revenue 5.00%, 1/1/34, Continuously Callable @100 | 1,500 | 1,571 | |||||||||
5.00%, 7/1/42, Continuously Callable @104 | 450 | 501 | |||||||||
5.00%, 11/1/46, Continuously Callable @100 | 1,000 | 1,074 | |||||||||
5.00%, 6/1/47, Continuously Callable @100 | 1,000 | 1,114 | |||||||||
| Westchester Tobacco Asset Securitization Revenue, Series B, 5.00%, 6/1/41, Continuously Callable @100 | 500 | 547 | |||||||||
212,545 | |||||||||||
Guam (3.7%): | |||||||||||
| Antonio B. Won Pat International Airport Authority Revenue (INS — Assured Guaranty Municipal Corp.), Series B, 5.75%, 10/1/43, Continuously Callable @100 | 1,000 | 1,109 | |||||||||
| Guam Government Waterworks Authority Revenue 5.50%, 7/1/43, Continuously Callable @100 | 1,000 | 1,015 | |||||||||
Series A, 5.00%, 7/1/29, Continuously Callable @100 | 1,000 | 1,028 | |||||||||
Series A, 5.00%, 7/1/35, Continuously Callable @100 | 500 | 504 | |||||||||
| Guam Power Authority Revenue, Series A, 5.00%, 10/1/37, Continuously Callable @100 | 1,165 | 1,176 | |||||||||
| Guam Power Authority Revenue (INS — Assured Guaranty Municipal Corp.) Series A, 5.00%, 10/1/30, Continuously Callable @100 | 1,000 | 1,026 | |||||||||
Series A, 5.00%, 10/1/39, Continuously Callable @100 | 500 | 503 | |||||||||
| Territory of Guam Revenue Series A, 5.00%, 12/1/46, Continuously Callable @100 | 500 | 472 | |||||||||
Series B, 5.00%, 1/1/37, Continuously Callable @100 | 500 | 494 | |||||||||
Series D, 5.00%, 11/15/39, Continuously Callable @100 | 1,000 | 979 | |||||||||
8,306 | |||||||||||
Puerto Rico (0.6%): | |||||||||||
| Puerto Rico Industrial Tourist Educational Medical & Environmental Control Facilities Financing Authority Revenue, 5.13%, 4/1/32, Continuously Callable @100 | 1,390 | 1,318 | |||||||||
Total Municipal Bonds (Cost $214,805) | 222,169 | ||||||||||
Total Investments (Cost $215,304) — 99.2% | 222,666 | ||||||||||
Other assets in excess of liabilities — 0.8% | 1,898 | ||||||||||
NET ASSETS — 100.00% | $ | 224,564 | |||||||||
(a) Non-income producing security.
(b) The Fund's Adviser has deemed this security to be illiquid based upon procedures approved by the Board of Trustees. As of March 31, 2020, illiquid securities were 0.2% of the Fund's net assets. This security is classified as Level 3 within the fair value hierarchy. (See Note 2)
See notes to financial statements.
15
| USAA Mutual Funds Trust USAA New York Bond Fund | Schedule of Portfolio Investments — continued March 31, 2020 | ||||||
(c) Variable Rate Demand Notes that provide the rights to sell the security at face value on either that day or within the rate-reset period. The interest rate is reset on the put date at a stipulated daily, weekly, monthly, quarterly, or other specified time interval to reflect current market conditions. These securities do not indicate a reference rate and spread in their description.
(d) All or a portion of this security has been designated as collateral for securities purchased on a when-issued basis.
(e) Variable or Floating-Rate Security. Rate disclosed is as of March 31, 2020.
(f) Put Bond.
(g) Zero-coupon bond.
(h) Rule 144A security or other security that is restricted as to resale to institutional investors. The Fund's Adviser has deemed this security to be liquid based upon procedures approved by the Board of Trustees. As of March 31, 2020, the fair value of these securities was $4,403 (thousands) and amounted to 2.0% of net assets.
(i) Security purchased on a when-issued basis.
AGM — Assured Guaranty Municipal Corporation
AMBAC — American Municipal Bond Assurance Corporation
bps — Basis points
GO — General Obligation
MUNIPSA — Municipal Swap Index
Credit Enhancements — Adds the financial strength of the provider of the enhancement to support the issuer's ability to repay the principal and interest payments when due. The enhancement may be provided by a high-quality bank, insurance company or other corporation, or a collateral trust. The enhancements do not guarantee the market values of the securities.
INS Principal and interest payments are insured by the name listed. Although bond insurance reduces the risk of loss due to default by an issuer, such bonds remain subject to the risk that value may fluctuate for other reasons, and there is no assurance that the insurance company will meet its obligations.
NBGA Principal and interest payments or, under certain circumstances, underlying mortgages, are guaranteed by a nonbank guarantee agreement from the name listed.
See notes to financial statements.
16
USAA Mutual Funds Trust | Statement of Assets and Liabilities March 31, 2020 | ||||||
(Amounts in Thousands, Except Per Share Amounts)
| USAA New York Bond Fund | |||||||
Assets: | |||||||
Investments, at value (Cost $215,304) | $ | 222,666 | |||||
Cash | 14 | ||||||
Receivables: | |||||||
Interest | 2,560 | ||||||
Capital shares issued | 28 | ||||||
Prepaid expenses | 1 | ||||||
Total assets | 225,269 | ||||||
Liabilities: | |||||||
Payables: | |||||||
Distributions | 117 | ||||||
Investments purchased | 355 | ||||||
Capital shares redeemed | 99 | ||||||
Accrued expenses and other payables: | |||||||
Investment advisory fees | 71 | ||||||
Administration fees | 29 | ||||||
Transfer agent fees | 5 | ||||||
Compliance fees | — | (a) | |||||
Trustees' fees | 2 | ||||||
| 12b-1 fees | 1 | ||||||
Other accrued expenses | 26 | ||||||
Total liabilities | 705 | ||||||
Net Assets: | |||||||
Capital | 220,272 | ||||||
Total distributable earnings | 4,292 | ||||||
Net assets | $ | 224,564 | |||||
Net Assets | |||||||
Fund Shares | $ | 218,096 | |||||
Adviser Shares | 6,468 | ||||||
Total | $ | 224,564 | |||||
Shares (unlimited number of shares authorized with no par value): | |||||||
Fund Shares | 18,484 | ||||||
Adviser Shares | 550 | ||||||
Total | 19,034 | ||||||
Net asset value, offering and redemption price per share: (b) | |||||||
Fund Shares | $ | 11.80 | |||||
Adviser Shares | $ | 11.77 | |||||
(a) Rounds to less than $1 thousand.
(b) Per share amount may not recalculate due to rounding of net assets and/or shares outstanding.
See notes to financial statements.
17
USAA Mutual Funds Trust | Statement of Operations For the Year Ended March 31, 2020 | ||||||
(Amounts in Thousands)
| USAA New York Bond Fund | |||||||
Investment Income: | |||||||
Interest | $ | 8,725 | |||||
Total income | 8,725 | ||||||
Expenses: | |||||||
Investment advisory fees | 817 | ||||||
Administration fees — Fund Shares | 337 | ||||||
Administration fees — Adviser Shares | 10 | ||||||
Sub-Administration fees | 15 | ||||||
Professional fees | 1 | ||||||
12b-1 fees — Adviser Shares | 17 | ||||||
Custodian fees | 39 | ||||||
Transfer agent fees — Fund Shares | 50 | ||||||
Transfer agent fees — Adviser Shares | 1 | ||||||
Trustees' fees | 44 | ||||||
Compliance fees | 1 | ||||||
Legal and audit fees | 69 | ||||||
State registration and filing fees | 1 | ||||||
Other expenses | 25 | ||||||
Total expenses | 1,427 | ||||||
Net Investment Income (Loss) | 7,298 | ||||||
Realized/Unrealized Gains (Losses) from Investments: | |||||||
Net realized gains (losses) from investment securities | 274 | ||||||
Net change in unrealized appreciation/depreciation on investment securities | (1,752 | ) | |||||
Net realized/unrealized gains (losses) on investments | (1,478 | ) | |||||
Change in net assets resulting from operations | $ | 5,820 | |||||
See notes to financial statements.
18
USAA Mutual Funds Trust | Statements of Changes in Net Assets | ||||||
(Amounts in Thousands)
| USAA New York Bond Fund | |||||||||||
| Year Ended March 31, 2020 | Year Ended March 31, 2019 | ||||||||||
From Investments: | |||||||||||
Operations: | |||||||||||
Net investment income (loss) | $ | 7,298 | $ | 7,412 | |||||||
Net realized gains (losses) from investments | 274 | 31 | |||||||||
| Net change in unrealized appreciation/depreciation on investments | (1,752 | ) | 2,350 | ||||||||
Change in net assets resulting from operations | 5,820 | 9,793 | |||||||||
Distributions to Shareholders: | |||||||||||
Fund Shares | (7,103 | ) | (7,221 | ) | |||||||
Adviser Shares | (195 | ) | (190 | ) | |||||||
Change in net assets resulting from distributions to shareholders | (7,298 | ) | (7,411 | ) | |||||||
Change in net assets resulting from capital transactions | (7,226 | ) | 8,825 | ||||||||
Change in net assets | (8,704 | ) | 11,207 | ||||||||
Net Assets: | |||||||||||
Beginning of period | 233,268 | 222,061 | |||||||||
End of period | $ | 224,564 | $ | 233,268 | |||||||
Capital Transactions: | |||||||||||
Fund Shares | |||||||||||
Proceeds from shares issued | $ | 24,913 | $ | 29,922 | |||||||
Distributions reinvested | 5,877 | 5,930 | |||||||||
Cost of shares redeemed | (38,234 | ) | (27,286 | ) | |||||||
Total Fund Shares | $ | (7,444 | ) | $ | 8,566 | ||||||
Adviser Shares | |||||||||||
Proceeds from shares issued | 301 | 328 | |||||||||
Distributions reinvested | 34 | 30 | |||||||||
Cost of shares redeemed | (117 | ) | (99 | ) | |||||||
Total Adviser Shares | 218 | 259 | |||||||||
Change in net assets resulting from capital transactions | $ | (7,226 | ) | $ | 8,825 | ||||||
Share Transactions: | |||||||||||
Fund Shares | |||||||||||
Issued | 2,067 | 2,564 | |||||||||
Reinvested | 486 | 507 | |||||||||
Redeemed | (3,186 | ) | (2,333 | ) | |||||||
Total Fund Shares | (633 | ) | 738 | ||||||||
Adviser Shares | |||||||||||
Issued | 25 | 28 | |||||||||
Reinvested | 3 | 3 | |||||||||
Redeemed | (10 | ) | (8 | ) | |||||||
Total Adviser Shares | 18 | 23 | |||||||||
Change in Shares | (615 | ) | 761 | ||||||||
See notes to financial statements.
19
USAA Mutual Funds Trust | Financial Highlights | ||||||
For a Share Outstanding Throughout Each Period
Investment Activities | Distributions to Shareholders From | ||||||||||||||||||||||||||
| Net Asset Value, Beginning of Period | Net Investment Income (Loss) | Net Realized and Unrealized Gains (Losses) on Investments | Total from Investment Activities | Net Investment Income | Total Distributions | ||||||||||||||||||||||
USAA New York Bond Fund | |||||||||||||||||||||||||||
Fund Shares | |||||||||||||||||||||||||||
| Year Ended March 31, 2020 | $ | 11.87 | 0.38 | (c) | (0.07 | ) | 0.31 | (0.38 | ) | (0.38 | ) | ||||||||||||||||
| Year Ended March 31, 2019 | $ | 11.76 | 0.40 | 0.11 | 0.51 | (0.40 | ) | (0.40 | ) | ||||||||||||||||||
| Year Ended March 31, 2018 | $ | 11.88 | 0.41 | (0.12 | ) | 0.29 | (0.41 | ) | (0.41 | ) | |||||||||||||||||
| Year Ended March 31, 2017 | $ | 12.28 | 0.42 | (0.41 | ) | 0.01 | (0.41 | ) | (0.41 | ) | |||||||||||||||||
| Year Ended March 31, 2016 | $ | 12.29 | 0.43 | (0.01 | ) | 0.42 | (0.43 | ) | (0.43 | ) | |||||||||||||||||
Adviser Shares | |||||||||||||||||||||||||||
| Year Ended March 31, 2020 | $ | 11.84 | 0.35 | (c) | (0.07 | ) | 0.28 | (0.35 | ) | (0.35 | ) | ||||||||||||||||
| Year Ended March 31, 2019 | $ | 11.73 | 0.37 | 0.11 | 0.48 | (0.37 | ) | (0.37 | ) | ||||||||||||||||||
| Year Ended March 31, 2018 | $ | 11.85 | 0.38 | (0.12 | ) | 0.26 | (0.38 | ) | (0.38 | ) | |||||||||||||||||
| Year Ended March 31, 2017 | $ | 12.25 | 0.39 | (0.40 | ) | (0.01 | ) | (0.39 | ) | (0.39 | ) | ||||||||||||||||
| Year Ended March 31, 2016 | $ | 12.26 | 0.41 | (0.01 | ) | 0.40 | (0.41 | ) | (0.41 | ) | |||||||||||||||||
* Assumes reinvestment of all net investment income and realized capital gain distributions, if any, during the period. Includes adjustments in accordance with U.S. generally accepted accounting principles and could differ from the Lipper reported return.
^ The net expense ratio may not correlate to the applicable expense limits in place during the period since the current contractual expense limitation is applied for a two year period beginning July 1, 2019 and in effect through June 30, 2021, instead of coinciding with the Fund's fiscal year end. Details of the current contractual expense limitation in effect can be found in Note 4 of the accompanying Notes to Financial Statements.
(a) Reflects total annual operating expenses for reductions of expenses paid indirectly for the March 31 fiscal years ended 2017 and 2016. Expenses paid indirectly decreased the expense ratio for each of these respective years by less than 0.01%.
(b) Portfolio turnover is calculated on the basis of the Fund as a whole without distinguishing between the classes of shares issued.
(c) Per share net investment income (loss) has been calculated using the average daily shares method.
See notes to financial statements.
20
USAA Mutual Funds Trust | Financial Highlights — continued | ||||||
For a Share Outstanding Throughout Each Period
Ratios to Average Net Assets | Supplemental Data | ||||||||||||||||||||||||||||||
| Net Asset Value, End of Period | Total Return* | Net Expenses^(a) | Net Investment Income (Loss) | Gross Expenses(a) | Net Assets, End of Period (000's) | Portfolio Turnover(b) | |||||||||||||||||||||||||
USAA New York Bond Fund | |||||||||||||||||||||||||||||||
Fund Shares | |||||||||||||||||||||||||||||||
| Year Ended March 31, 2020 | $ | 11.80 | 2.60 | % | 0.61 | % | 3.17 | % | 0.61 | % | $ | 218,096 | 18 | % | |||||||||||||||||
| Year Ended March 31, 2019 | $ | 11.87 | 4.41 | % | 0.60 | % | 3.39 | % | 0.60 | % | $ | 226,973 | 15 | % | |||||||||||||||||
| Year Ended March 31, 2018 | $ | 11.76 | 2.45 | % | 0.59 | % | 3.43 | % | 0.59 | % | $ | 216,090 | 6 | % | |||||||||||||||||
| Year Ended March 31, 2017 | $ | 11.88 | 0.10 | % | 0.61 | % | 3.41 | % | 0.61 | % | $ | 208,513 | 10 | % | |||||||||||||||||
| Year Ended March 31, 2016 | $ | 12.28 | 3.50 | % | 0.66 | % | 3.53 | % | 0.66 | % | $ | 211,136 | 10 | % | |||||||||||||||||
Adviser Shares | |||||||||||||||||||||||||||||||
| Year Ended March 31, 2020 | $ | 11.77 | 2.36 | % | 0.85 | % | 2.93 | % | 0.85 | % | $ | 6,468 | 18 | % | |||||||||||||||||
| Year Ended March 31, 2019 | $ | 11.84 | 4.16 | % | 0.85 | % | 3.15 | % | 0.85 | % | $ | 6,295 | 15 | % | |||||||||||||||||
| Year Ended March 31, 2018 | $ | 11.73 | 2.19 | % | 0.84 | % | 3.18 | % | 0.84 | % | $ | 5,971 | 6 | % | |||||||||||||||||
| Year Ended March 31, 2017 | $ | 11.85 | (0.13 | )% | 0.83 | % | 3.19 | % | 0.83 | % | $ | 6,302 | 10 | % | |||||||||||||||||
| Year Ended March 31, 2016 | $ | 12.25 | 3.30 | % | 0.85 | % | 3.34 | % | 0.85 | % | $ | 5,856 | 10 | % | |||||||||||||||||
See notes to financial statements.
21
USAA Mutual Funds Trust | Notes to Financial Statements March 31, 2020 | ||||||
1. Organization:
USAA Mutual Funds Trust (the "Trust") is organized as a Delaware statutory trust and is registered under the Investment Company Act of 1940, as amended (the "1940 Act"), as an open-end investment company. The Trust is comprised of 47 funds and is authorized to issue an unlimited number of shares, which are units of beneficial interest with no par value.
The accompanying financial statements are those of the USAA New York Bond Fund (the "Fund"). The Fund offers two classes of shares: Fund Shares and Adviser Shares. The Fund is classified as diversified under the 1940 Act.
Each class of shares of the Fund has substantially identical rights and privileges except with respect to fees paid under distribution plans, expenses allocable exclusively to each class of shares, voting rights on matters solely affecting a single class of shares, and the exchange privilege of each class of shares.
On November 6, 2018, United Services Automobile Association ("USAA"), the parent company of USAA Asset Management Company ("AMCO"), the investment adviser to the Fund, and USAA Transfer Agency Company, d/b/a USAA Shareholder Account Services ("SAS"), the transfer agent to the Fund, announced that AMCO and SAS would be acquired by Victory Capital Holdings Inc., a global investment management firm headquartered in Cleveland, Ohio (the "Transaction"). The Transaction closed on July 1, 2019. A special shareholder meeting was held on April 18, 2019, at which shareholders of the Fund approved a new investment advisory agreement between the Trust, on behalf of the Fund, and Victory Capital Management Inc. ("VCM" or "Adviser"). Effective July 1, 2019, VCM replaced AMCO as the investment adviser to the Fund and Victory Capital Transfer Agency Company replaced SAS as the Fund's transfer agent. In addition, effective on that same date, shareholders of the Fund also elected the following two new directors to the Board of the Trust to serve upon the closing of the Transaction: (1) David C. Brown, to serve as an Interested Trustee; and (2) John C. Walters, to serve as an Independent Trustee.
Under the Trust's organizational documents, its officers and trustees are indemnified against certain liabilities arising out of the performance of their duties to the Fund. In addition, in the normal course of business, the Fund enters into contracts with its vendors and others that provide for general indemnifications. The Fund's maximum exposure under these arrangements is unknown, as this would involve future claims that may be made against the Fund. However, based on experience, the Fund expects that risk of loss to be remote.
2. Significant Accounting Policies:
The following is a summary of significant accounting policies followed by the Trust in the preparation of its financial statements. The policies are in conformity with generally accepted accounting principles in the United States of America ("GAAP"). The preparation of financial statements in accordance with GAAP requires management to make estimates and assumptions that affect the reported amounts of assets and liabilities and disclosure of contingent assets and liabilities at the date of the financial statements and the reported amounts of income and expenses for the period. Actual results could differ from those estimates. The Fund follows the specialized accounting and reporting requirements under GAAP that are applicable to investment companies under Accounting Standards Codification Topic 946.
Investment Valuation:
The Fund records investments at fair value. Fair value is defined as the price that would be received to sell an asset or paid to transfer a liability in an orderly transaction between market participants at the measurement date.
The valuation techniques described below maximize the use of observable inputs and minimize the use of unobservable inputs in determining fair value. The inputs used for valuing the Fund's investments are summarized in the three broad levels listed below:
• Level 1 — quoted prices in active markets for identical securities
• Level 2 — other significant observable inputs (including quoted prices for similar securities or interest rates applicable to those securities, etc.)
22
USAA Mutual Funds Trust | Notes to Financial Statements — continued March 31, 2020 | ||||||
• Level 3 — significant unobservable inputs (including the Fund's own assumptions in determining the fair value of investments)
Changes in valuation techniques may result in transfers in or out of an assigned level within the disclosure hierarchy. The inputs or methodologies used for valuation techniques are not necessarily an indication of the risk associated with entering into those investments.
The Adviser has established the Pricing and Liquidity Committee (the "Committee"), and subject to the Trust's Board of Trustees (the "Board") oversight, the Committee administers and oversees the Fund's valuation policies and procedures, which are approved by the Board.
Portfolio securities listed or traded on securities exchanges, including exchange-traded funds ("ETFs"), American Depositary Receipts ("ADRs") and Rights, are valued at the closing price on the exchange or system where the security is principally traded, if available, or at the Nasdaq Official Closing Price. If there have been no sales for that day on the exchange or system, then a security is valued at the last available bid quotation on the exchange or system where the security is principally traded. In each of these situations, valuations are typically categorized as Level 1 in the fair value hierarchy.
Debt securities of United States ("U.S.") issuers, along with corporate and municipal securities, including short-term investments maturing in 60 days or less, may be valued using evaluated bid or the last sales price to price securities by dealers or an independent pricing service approved by the Board. These valuations are typically categorized as Level 2 in the fair value hierarchy.
Effective July 1, 2019, the valuation methodology applied to certain debt securities changed. Securities that were previously valued at an evaluated mean are now valued at the evaluated bid or the last sales price.
In the event that price quotations or valuations are not readily available, are not reflective of market value, or a significant event has been recognized in relation to a security or class of securities, the securities are valued in good faith by the Committee in accordance with valuation procedures approved by the Board. These valuations typically are categorized as Level 2 or Level 3 in the fair value hierarchy, based on the observability of inputs used to determine the fair value. The effect of fair value pricing is that securities may not be priced on the basis of quotations from the primary market in which they are traded and the actual price realized from the sale of a security may differ materially from the fair value price. Valuing these securities at fair value is intended to cause the Fund's net asset value ("NAV") to be more reliable than it otherwise would be.
A summary of the valuations as of March 31, 2020, based upon the three levels defined above, is included in the table below while the breakdown, by category, of investments is disclosed in the Schedule of Portfolio Investments (amounts in thousands):
Level 1 | Level 2 | Level 3 | Total | ||||||||||||||||
Common Stocks | $ | — | $ | — | $ | 497 | $ | 497 | |||||||||||
Municipal Bonds | — | 222,169 | — | 222,169 | |||||||||||||||
Total | $ | — | $ | 222,169 | $ | 497 | $ | 222,666 | |||||||||||
For the year ended March 31, 2020, there were no transfers in or out of the Level 3 fair value hierarchy.
Securities Purchased on a Delayed-Delivery or When-Issued Basis:
The Fund may purchase securities on a delayed-delivery or when-issued basis. Delivery and payment for securities that have been purchased by the Fund on a delayed-delivery or when-issued basis, or for delayed draws on loans can take place a month or more after the trade date. At the time the Fund makes the commitment to purchase a security on a delayed-delivery or when-issued basis, the Fund records the transaction and reflects the value of the security in determining net asset value. No interest accrues to the Fund until the transaction settles and payment takes place. A segregated account is established and the Fund maintains cash and/or marketable securities at least equal in value to commitments for delayed-delivery or when-issued securities. If the Fund owns delayed-delivery or when-issued securities, these values are included in Payable for investments purchased on the accompanying Statement of Assets and Liabilities and the segregated assets are identified in the Schedule of Portfolio Investments.
23
USAA Mutual Funds Trust | Notes to Financial Statements — continued March 31, 2020 | ||||||
Municipal Obligations:
The values of municipal obligations can fluctuate and may be affected by adverse tax, legislative, or political changes, and by financial developments affecting municipal issuers. Payment of municipal obligations may depend on a relatively limited source of revenue, resulting in greater credit risk. Future changes in federal tax laws or the activity of an issuer may adversely affect the tax-exempt status of municipal obligations.
Investment Transactions and Related Income:
Changes in holdings of investments are accounted for no later than one business day following the trade date. For financial reporting purposes, however, investment transactions are accounted for on trade date on the last business day of the reporting period. Interest income is determined on the basis of coupon interest accrued using the effective interest method which adjusts, where applicable, the amortization of premiums or accretion of discount. Gains or losses realized on sales of securities are determined by comparing the identified cost of the security lot sold with the net sales proceeds.
Federal Income Taxes:
It is the Fund's policy to continue to qualify as a regulated investment company by complying with the provisions available to certain investment companies, as defined in applicable sections of the Internal Revenue Code, and to make distributions of net investment income and net realized gains sufficient to relieve it from all, or substantially all, federal income taxes. Accordingly, no provision for federal income taxes is required in the financial statements. The Fund has a tax year end of March 31.
Management of the Fund has reviewed tax positions taken in tax years that remain subject to examination by all major tax jurisdictions, including federal (i.e., the last four tax years which includes the current fiscal tax year end). Management believes that there is no tax liability resulting from unrecognized tax benefits related to uncertain tax positions taken.
Allocations:
Expenses directly attributable to the Fund are charged to the Fund, while expenses which are attributable to more than one fund in the Trust, or jointly with an affiliated trust, are allocated among the respective funds in the Trust and/or affiliated trust based upon net assets or another appropriate basis.
Income, expenses (other than class-specific expenses such as transfer agent fees, state registration fees, distribution and service 12b-1 fees, and printing fees), and realized and unrealized gains or losses on investments are allocated to each class of shares based on its relative net assets on the date income is earned or expenses and realized and unrealized gains and losses are incurred.
Cross-Trade Transactions:
Pursuant to Rule 17a-7 under the 1940 Act, the Fund may engage in cross-trades which are securities transactions with affiliated investment companies and advisory accounts managed by the Adviser and any applicable sub-adviser. Any such purchase or sale transaction must be effected without brokerage commission or other remuneration, except for customary transfer fees. The transaction must be effected at the current market price, which is either the security's last sale price on an exchange or, if there are no transactions in the security that day, at the average of the highest bid and lowest asked price. For the year ended March 31, 2020, the Fund engaged in the following securities transactions with affiliated funds, which resulted in the following net realized gains (losses) (amounts in thousands):
| Purchases | Sales | Net Realized Gains (Losses) | |||||||||
| $ | 15,755 | $ | 27,170 | $ | — | ||||||
24
USAA Mutual Funds Trust | Notes to Financial Statements — continued March 31, 2020 | ||||||
Fees Paid Indirectly:
Expense offsets to custody fees that arise from credits on cash balances maintained on deposit are reflected on the Statement of Operations, as applicable, as "Fees paid indirectly."
3. Purchases and Sales:
Cost of purchases and proceeds from sales/maturities of securities (excluding securities maturing less than one year from acquisition) for the year ended March 31, 2020, were as follows for the Fund (amounts in thousands):
| Excluding U.S. Government Securities | |||||||
Purchases | Sales | ||||||
$ | 42,245 | $ | 40,999 | ||||
There were no purchases and sales of U.S. government securities during the year ended March 31, 2020.
4. Fees and Transactions with Affiliates and Related Parties:
Investment Advisory and Management Fees:
Effective with the Transaction on July 1, 2019, investment advisory services are provided to the Fund by the Adviser, a New York corporation registered as an investment adviser with the Securities and Exchange Commission ("SEC"). The Adviser is a wholly-owned indirect subsidiary of Victory Capital Holdings, Inc., a publicly traded Delaware corporation, and a wholly-owned direct subsidiary of Victory Capital Operating, LLC. Under the terms of the Investment Advisory Agreement, the Adviser is entitled to receive a base fee and a performance adjustment. The Fund's base fee is accrued daily and paid monthly, is computed as a percentage of the Fund's average daily net assets at annualized rates of 0.50% of the first $50 million of average daily net assets, 0.40% of that portion of average daily net assets over $50 million but not over $100 million, and 0.30% of that portion of average daily net assets over $100 million. The amount incurred and paid to VCM from July 1, 2019 through March 31, 2020, are $607 thousands and is reflected on the Statement of Operations as Investment Advisory fees.
Prior to the Transaction on July 1, 2019, AMCO provided investment management services to the Fund pursuant to an Advisory Agreement. Under this agreement, AMCO was responsible for managing the business and affairs of the Fund, and for directly managing day-to-day investment of the Fund's assets, subject to the authority of and supervision by the Board. The investment management fee for the Fund was comprised of a base fee and a performance adjustment. The Fund's base fee was accrued daily and paid monthly, was computed as a percentage of the Fund's average daily net assets at annualized rates of 0.50% of the first $50 million of average daily net assets, 0.40% of that portion of average daily net assets over $50 million but not over $100 million, and 0.30% of that portion of average daily net assets over $100 million.
Effective with the Transaction on July 1, 2019, no performance adjustments will be made for periods beginning July 1, 2019, through June 30, 2020. Only performance beginning as of July 1, 2019, and thereafter will be utilized in calculating future performance adjustments.
Prior to the Transaction on July 1, 2019, the performance adjustment for each share class was calculated monthly by comparing the Fund's performance to that of the Lipper New York Municipal Debt Funds Index. The Lipper New York Municipal Debt Funds Index tracks the total return performance of funds within the Lipper New York Municipal Debt Funds category.
25
USAA Mutual Funds Trust | Notes to Financial Statements — continued March 31, 2020 | ||||||
The performance period for each share class consists of the current month plus the previous 35 months (or the number of months beginning July 1, 2019, if fewer). The following table is utilized to determine the extent of the performance adjustment:
| Over/Under Performance Relative to Index (in basis Rate points)(a) | Annual Adjustment Rate (in basis points)(a) | ||||||
+/- 20 to 50 | +/- 4 | ||||||
+/- 51 to 100 | +/- 5 | ||||||
+/- 101 and greater | +/- 6 | ||||||
(a) Based on the difference between average annual performance of the relevant share class of the Fund and its relevant index, rounded to the nearest basis point. Average daily net assets of the share class are calculated over a rolling 36-month period.
Each class' annual performance adjustment rate is multiplied by the average daily net assets of each respective class over the entire performance period, which is then multiplied by a fraction, the numerator of which is the number of days in the month and the denominator of which is 365 (366 in leap years). The resulting amount is then added to (in the case of overperformance), or subtracted from (in the case of underperformance) the base fee.
Under the performance fee arrangement, each class pays a positive performance fee adjustment for a performance period whenever the class outperforms the Lipper New York Municipal Debt Funds Index over that period, even if the class has overall negative returns during the performance period.
For the period April 1, 2019 through June 30, 2019, performance adjustments for the Fund Shares and Adviser Shares were $(27) and $(1) thousand, respectively, and (0.01%) and (0.01%) of net assets, respectively. Base fees incurred and paid to AMCO from April 1, 2019 through June 30, 2019, were $210 thousand and reflected on the Statement of Operations as Investment Advisory fees.
Administration and Servicing Fees:
Effective with the Transaction on July 1, 2019, VCM serves as the Fund's administrator and fund accountant. Under the Fund Administration, Servicing and Accounting Agreement, VCM is paid for its services an annual fee at a rate of 0.15% of average daily net assets for both the Fund Shares and Adviser Shares. Amounts incurred from July 1, 2019 through March 31, 2020, are $253 and $8 thousand for Fund Shares and Adviser Shares, respectively. These amounts are reflected on the Statement of Operations as Administration fees.
Prior to the Transaction on July 1, 2019, AMCO provided certain administration and servicing functions for the Fund. For such services, AMCO received a fee accrued daily and paid monthly at an annualized rate of 0.15% of average daily net assets for both the Fund Shares and Adviser Shares. Amounts incurred from April 1, 2019 through June 30, 2019, were $84 and $2 thousand for Fund Shares and Adviser Shares, respectively. These amounts are reflected on the Statement of Operations as Administration fees.
Effective with the Transaction on July 1, 2019, the Fund (as part of the Trust) has entered into an agreement to provide compliance services with the Adviser, pursuant to which the Adviser furnishes its compliance personnel, including the services of the Chief Compliance Officer ("CCO"), and other resources reasonably necessary to provide the Trust with compliance oversight services related to the design, administration and oversight of a compliance program for the Trust in accordance with Rule 38a-1 under the 1940 Act. The CCO is an employee of the Adviser, which pays the compensation of the CCO and support staff. Funds in the Trust, Victory Variable Insurance Funds, Victory Portfolios and Victory Portfolios II (collectively, the "Victory Funds Complex") in the aggregate, compensate the Adviser for these services. The amount incurred during the period from July 1, 2019 through March 31, 2020, is reflected on the Statement of Operations as Compliance fees.
26
USAA Mutual Funds Trust | Notes to Financial Statements — continued March 31, 2020 | ||||||
Effective with the Transaction on July 1, 2019, Citi Fund Services Ohio, Inc. ("Citi"), an affiliate of Citibank, acts as sub-administrator and sub-fund accountant to the Fund pursuant to a Sub- Administration and Sub-Fund Accounting Services Agreement between VCM and Citi. VCM pays Citi a fee for providing these services. The Trust reimburses VCM and Citi for all of their reasonable out-of- pocket expenses incurred in providing these services and certain other expenses specifically allocated to the Funds, under the Fund Administration, Servicing, and Accounting Agreement. The amount incurred during the period from July 1, 2019 through March 31, 2020, is reflected on the Statement of Operations as Sub-Administration fees.
In addition to the services provided under its Administration and Servicing Agreement with the Fund, AMCO also provided certain compliance and legal services for the benefit of the Fund prior to the Transaction on July 1, 2019. The Board approved the reimbursement of a portion of these expenses incurred by AMCO. Amounts reimbursed by the Fund to AMCO for these compliance and legal services are presented on the Statement of Operations as Professional fees.
Transfer Agency Fees:
Effective with the Transaction on July 1, 2019, Victory Capital Transfer Agency, Inc. ("VCTA"), (formerly, USAA Shareholder Account Services ("SAS")), provides transfer agency services to the Fund. VCTA, an affiliate of the Adviser, provides transfer agent services to the Fund Shares and Adviser Shares based on an annual charge of $25.50 per shareholder account plus out-of-pocket expenses. VCTA pays a portion of these fees to certain intermediaries for the administration and servicing of accounts that are held with such intermediaries. Amounts incurred and paid to VCTA from July 1, 2019 through March 31, 2020, was $38 and $1 thousand for the Fund Shares and Adviser Shares, respectively. Amounts incurred and paid to SAS from April 1, 2019 through June 30, 2019, was $12 and less than $1 thousand for the Fund Shares and Adviser Shares, respectively. These amounts are reflected on the Statement of Operations as Transfer agent fees.
Effective with the Transaction on July 1, 2019, FIS Investor Services LLC serves as sub-transfer agent and dividend disbursing agent for the Fund pursuant to a Sub-Transfer Agent agreement between VCTA and FIS Investor Services LLC. VCTA provides FIS Investor Services LLC a fee for providing these services.
Distribution and Service 12b-1 Fees:
Effective with the Transaction on July 1, 2019, Victory Capital Advisers, Inc. (the "Distributor"), an affiliate of the Adviser, serves as distributor for the continuous offering of the Adviser Shares pursuant to a Distribution Agreement between the Distributor and the Trust. Effective on or about June 30, 2020, the Distributor's name will change to Victory Capital Services, Inc. Pursuant to the Distribution and Service Plans adopted in accordance with Rule 12b-1 under the 1940 Act, the Distributor may receive a monthly distribution and service fee, at an annual rate of up to 0.25% of the average daily net assets of the Adviser Shares. Amounts incurred and paid to the Distributor from July 1, 2019 through March 31, 2020, are $13 thousand and reflected on the Statement of Operations as 12b-1 fees.
Adviser Shares are offered and sold without imposition of an initial sales charge or a contingent deferred sales charge.
Prior to the Transaction on July 1, 2019, the Fund adopted a plan pursuant to Rule 12b-1 under the 1940 Act with respect to the Adviser Shares. Under the plan, the Adviser Shares paid fees to USAA Investment Management Company ("IMCO"), the distributor, for distribution and shareholder services. IMCO paid all or a portion of such fees to intermediaries that made the Adviser Shares available for investment by their customers. The fee was accrued daily and paid monthly at an annual rate of 0.25% of the Adviser Shares' average daily net assets. IMCO also provided exclusive underwriting and distribution of the Fund's shares on a continuing best-efforts basis and received no fee or other compensation for these services, but may have received 12b-1 fees as described above, with respect to Adviser Shares. Amounts incurred and paid to IMCO from April 1, 2019 through June 30, 2019, were $4 thousand and reflected on the Statement of Operations as 12b-1 fees.
27
USAA Mutual Funds Trust | Notes to Financial Statements — continued March 31, 2020 | ||||||
Other Fees:
Prior to the Transaction on July 1, 2019, State Street Bank and Trust Company served as the Fund's accounting agent and custodian.
Effective August 5, 2019, Citibank, N.A., serves as the Fund's custodian.
K&L Gates LLP provides legal services to the Trust.
Effective with the Transaction on July 1, 2019, the Adviser has entered into an expense limitation agreement with the Fund until at least June 30, 2021. Under the terms of the agreement, the Adviser has agreed to waive fees or reimburse certain expenses to the extent that ordinary operating expenses incurred by certain classes of the Fund in any fiscal year exceed the expense limit for such classes of the Fund. Such excess amounts will be the liability of the Adviser. Interest, taxes, brokerage commissions, other expenditures which are capitalized in accordance with GAAP, and other extraordinary expenses not incurred in the ordinary course of the Fund's business are excluded from the expense limits. Effective July 1, 2019 through March 31, 2020, the expense limits (excluding voluntary waivers) are 0.65% and 0.90% for the Fund Shares and Adviser Shares, respectively.
Under this expense limitation agreement, the Fund has agreed to repay fees and expenses that were waived or reimbursed by the Adviser for a period up to three years after the fiscal year in which the waiver or reimbursement took place, subject to the lesser of any operating expense limits in effect at the time of: (a) the original waiver or expense reimbursement; or (b) the recoupment, after giving effect to the recoupment amount. As of March 31, 2020, there were no amounts available to be repaid to the Adviser.
The Adviser, may voluntarily waive or reimburse additional fees to assist the Fund in maintaining competitive expense ratios. Voluntary waivers and reimbursements applicable to the Fund are not available to be recouped at a future time. There were no voluntary waivers or reimbursements for the year ended March 31, 2020.
Certain officers and/or interested trustees of the Fund are also officers and/or employees of the Adviser, Administrator, Sub-Administrator, Sub-Fund Accountant, and Legal.
5. Risks:
The Fund may be subject to other risks in addition to these identified risks.
The Fund may be subject to various risks as described in the Fund's prospectus. A widespread health crisis such as a global pandemic could cause substantial market volatility, exchange trading suspensions and closures, impact the ability to complete redemptions, and affect Fund performance. For example, the novel coronavirus disease (COVID-19) has resulted in significant disruptions to global business activity that may continue, worsen and/or trigger other factors impacting the liquidity or value of investments. The impact of health crises and other epidemics and pandemics may affect the global economy in ways that cannot necessarily be foreseen at the present time. Health crises may exacerbate other pre-existing political, social, and economic risks. Any such impact could adversely affect the Funds' performance, resulting in losses to your investment. For more information, please refer to the "Principal risks" section of the Fund's prospectus.
The fixed-income securities in the Fund's portfolio are subject to credit risk, which is the possibility that an issuer of a fixed-income security will fail to make timely interest and/or principal payments on its securities or that negative market perceptions of the issuer's ability to make such payments will cause the price of that security to decline. The Fund accepts some credit risk as a recognized means to enhance an investor's return. All fixed-income securities, varying from the highest quality to the very speculative, have some degree of credit risk. Fixed-income securities rated below investment grade, also known as "junk" or high-yield bonds, generally entail greater economic, credit, and liquidity risk than investment-grade securities. Their prices may be more volatile, especially during economic downturns, financial setbacks, or liquidity events.
28
USAA Mutual Funds Trust | Notes to Financial Statements — continued March 31, 2020 | ||||||
The Fund is subject to the risk that the market value of the bonds in its portfolio will fluctuate because of changes in interest rates, changes in the supply of and demand for tax-exempt securities, and other market factors. Bond prices generally are linked to the prevailing market interest rates. In general, when interest rates rise, bond prices fall; conversely, when interest rates fall, bond prices rise. The price volatility of a bond also depends on its duration. Generally, the longer the duration of a bond, the greater is its sensitivity to interest rates. To compensate investors for this higher interest rate risk, bonds with longer durations generally offer higher yields than bonds with shorter durations. Decisions by the U.S. Federal Reserve regarding interest rate and monetary policy can have a significant effect on the value of debt securities as well as the overall strength of the U.S. economy. Precise interest rate predictions are difficult to make, and interest rates may change unexpectedly and dramatically in response to extreme changes in market or economic conditions. Interest rates have been unusually low in recent years in the U.S. and abroad, and central banks have reduced rates further in an effort to combat the economic effects of the COVID-19 pandemic. Extremely low or negative interest rates may become more prevalent or may not work as intended, and the impact on various markets that interest rate or other significant policy changes may have is unknown. The ability of an issuer of a debt security to repay principal prior to a security's maturity can increase the security's sensitivity to interest rate changes.
During a period of declining interest rates, many municipal bonds may be "called," or redeemed, by the issuer before the stated maturity. An issuer might call, or refinance, a higher-yielding bond for the same reason that a homeowner would refinance a home mortgage. When bonds are called, the Fund is affected in several ways. Most likely, the Fund will reinvest the bond-call proceeds in bonds with lower interest rates. The Fund's income may drop as a result. The Fund also may realize a taxable capital gain (or loss).
Because the Fund invests primarily in New York tax-exempt securities, the Fund is more susceptible to adverse economic, political, and regulatory changes affecting tax-exempt securities issuers in New York to pay interest or repay principal, which may impact the Fund's performance. The Fund is more vulnerable to unfavorable developments in New York than are funds that invest in municipal securities of many states. While New York State's economy is broad, it does have concentrations in the financial services industry and may be sensitive to economic problems affecting that industry. Certain issuers of New York municipal bonds have experienced serious financial difficulties in the past, and reoccurrence of these difficulties may impair the ability of certain New York issuers to pay principal or interest on their obligations. The financial health of New York City affects that of New York State; and when New York City experiences financial difficulty, it may have an adverse effect on New York municipal bonds held by the Fund. The growth rate of New York State has at times been somewhat slower than the nation overall. The economic and financial condition of New York State also may be affected by various financial, social, economic, and political factors.
6. Borrowing and Interfund Lending:
Line of Credit:
Effective with the Transaction on July 1, 2019, the Victory Funds Complex participates in a short-term, demand note "Line of Credit" agreement with Citibank. Under the agreement with Citibank, the Victory Funds Complex could borrow up to $600 million, of which $300 million is committed and $300 million is uncommitted. $40 million of the Line of Credit is reserved for use by the Victory Floating Rate Fund, another series of the Victory Funds Complex, with that Fund paying the related commitment fees for that amount. The purpose of the agreement is to meet temporary or emergency cash needs. Citibank receives an annual commitment fee of 0.15% on $300 million for providing the Line of Credit. Each fund in the Victory Funds Complex pays a pro-rata portion of the commitment fees plus any interest (one month LIBOR plus one percent) on amounts borrowed. Interest charged to the Fund, if any, during the period is presented on the Statement of Operations under line of credit fees.
Prior to the Transaction on July 1, 2019, the line of credit among the Trust, with respect to its funds, and USAA Capital Corporation ("CAPCO") terminated. For the period from April 1, 2019 to June 30, 2019, the Fund paid CAPCO facility fees of less than $1 thousand.
29
USAA Mutual Funds Trust | Notes to Financial Statements — continued March 31, 2020 | ||||||
The Fund had no borrowings under either agreement with Citibank or CAPCO during the year ended March 31, 2020.
Interfund Lending:
Effective with the Transaction on July 1, 2019, the Trust and Adviser rely on an exemptive order granted by the SEC in March 2017 (the "Order"), permitting the establishment and operation of an Interfund Lending Facility (the "Facility"). The Facility allows the Fund to directly lend and borrow money to or from any other Fund in the Victory Fund Complex relying upon the Order at rates beneficial to both the borrowing and lending funds. Advances under the Facility are allowed for temporary or emergency purposes. The interfund loan rate is determined, as specified in the Order, by averaging the current repurchase agreement rate and the current bank loan rate. As a Borrower, interest charged to the Fund, if any, during the period is presented on the Statement of Operations under Interest expense on Interfund lending. As a Lender, interest earned by the Fund, if any, during the period is presented on the Statement of Operations under Income on Interfund lending.
The Fund did not utilize or participate in the Facility during the period July 1, 2019 through March 31, 2020.
7. Federal Income Tax Information:
The Fund intends to declare daily and distribute any net investment income monthly. Distributable net realized gains, if any, are declared and paid at least annually.
The amounts of dividends from net investment income and distributions from net realized gains (collectively distributions to shareholders) are determined in accordance with federal income tax regulations, which may differ from GAAP. To the extent these "book/tax" differences are permanent in nature (e.g., net operating loss and distribution reclassification,), such amounts are reclassified within the components of net assets based on their federal tax-basis treatment; temporary differences (e.g., wash sales) do not require reclassification. To the extent dividends and distributions exceed net investment income and net realized gains for tax purposes, they are reported as distributions of capital. Net investment losses incurred by the Fund may be reclassified as an offset to capital on the accompanying Statement of Assets and Liabilities.
As of March 31, 2020, on the Statement of Assets and Liabilities, there were no permanent book-to-tax difference reclassification adjustments.
The tax character of distributions paid during the tax years ended as noted below, were as follows (total distributions paid may differ from the Statement of Changes in Net Assets because, for tax purposes, dividends are recognized when actually paid) (amounts in thousands):
Year Ended March 31, 2020 | Year Ended March 31, 2019 | ||||||||||||||||||||||||||
Distributions Paid From | Distributions Paid From | ||||||||||||||||||||||||||
Ordinary Income | Tax-Exempt Income | Total Distributions Paid | Ordinary Income | Tax-Exempt Income | Total Distributions Paid | ||||||||||||||||||||||
$ | 4 | $ | 7,294 | $ | 7,298 | $ | 13 | $ | 7,398 | $ | 7,411 | ||||||||||||||||
As of the tax year ended March 31, 2020, the components of accumulated earnings (deficit) on a tax basis were as follows (amounts in thousands):
| Undistributed Tax Exempt Income | Distributions Payable | Accumulated Capital and Other Losses | Unrealized Appreciation (Depreciation)* | Total Accumulated Earnings (Deficit) | |||||||||||||||||||
$ | 675 | $ | (609 | ) | $ | (3,069 | ) | $ | 7,295 | $ | 4,292 | ||||||||||||
* The difference between the book-basis and tax-basis of unrealized appreciation/depreciation is attributable to the basis adjustment on partnership investments.
30
USAA Mutual Funds Trust | Notes to Financial Statements — continued March 31, 2020 | ||||||
At March 31, 2020, the Fund had net capital loss carryforwards as shown in the table below (amounts in thousands). It is unlikely that the Board will authorize a distribution of capital gains realized in the future until the capital loss carryforwards have been used:
| Short-Term Amount | Long-Term Amount | Total | |||||||||
| $ | 816 | $ | 2,253 | $ | 3,069 | ||||||
As of March 31, 2020, the cost basis for federal income tax purposes, gross unrealized appreciation, gross unrealized depreciation, and net unrealized appreciation (depreciation) for investments were as follows (amounts in thousands):
| Cost of Investments for Federal Tax Purposes | Gross Unrealized Appreciation | Gross Unrealized Depreciation | Net Unrealized Appreciation (Depreciation) | ||||||||||||
| $ | 215,371 | $ | 9,182 | $ | (1,887 | ) | $ | 7,295 | |||||||
8. Liquidity Risk Management Program:
The USAA Funds have adopted and implemented a written liquidity risk management program (the "LRMP") as required by Rule 22e-4 under the Investment Company Act of 1940, as amended. The LRMP is reasonably designed to assess and manage the Fund's liquidity risk, taking into consideration the Fund's investment strategy and the liquidity of its portfolio investments during normal and reasonably foreseeable stressed market conditions; its short and long-term cash flow projections; and its cash holdings and access to other liquidity management tools such as available funding sources including the Victory Funds Complex Interfund Lending Facility and Line of Credit (discussed in the Notes to Financial Statements). The USAA Funds' Board of Trustees approved the appointment of the Fund's investment adviser, Victory Capital Management Inc. ("Victory Capital"), as the administrator of the LRMP. At an in-person meeting held on February 26, 2020, Victory Capital provided an oral and written report to the Trustees on the operation and effectiveness of the LRMP during the previous year.
Victory Capital manages liquidity risks associated with the Fund's investments by monitoring, among other things, cash and cash equivalents, any use of derivatives, the concentration of investments, the appropriateness of the Fund's investment strategy, and by classifying every fund investment as either highly liquid, moderately liquid, less liquid or illiquid on at least a monthly basis. To assist with the classification of Fund investments, Victory Capital has retained a third-party provider of liquidity evaluation services. This provider determines preliminary liquidity classifications for all portfolio holdings based upon portfolio-level data and certain assumptions provided by Victory Capital. Victory Capital reviews the preliminary liquidity classifications, and, when appropriate, considers other information including input from the Fund's portfolio managers (including the portfolio managers employed by any investment sub-advisers) in determining final liquidity classifications.
The report from Victory Capital concluded that the Fund did not experience any significant liquidity challenges during the covered period, and the Fund's LRMP is reasonably designed to assess and manage its liquidity risk. The report also concluded that the LRMP continues to operate adequately and effectively to enable Victory Capital to oversee and manage liquidity risk and ensure the Fund is able to meet redemption requests without significant dilution to the remaining investors' interest in the Fund. During the review period, the Fund's portfolio consisted primarily of highly liquid investments, which are defined as cash and any investments reasonably expected to be converted to cash in current market conditions in three business days or less without significantly changing the market value of the investment. Therefore, the Fund has not adopted a Highly Liquid Investment Minimum. The Fund's investments were below the limitation on illiquid investments during the review period. Additionally, Victory Capital indicated that no events occurred that would require the filing of Form N-LIQUID and recommended no material changes to the LRMP.
31
USAA Mutual Funds Trust | Notes to Financial Statements — continued March 31, 2020 | ||||||
9. Subsequent Event:
An outbreak of respiratory disease called COVID-19 was first detected in China in December 2019 and subsequently spread internationally. The transmission of COVID-19 and efforts to contain its spread have resulted in international, national and local border closings and other significant travel restrictions and disruptions, significant disruptions to business operations, supply chains and consumer activity, significant challenges in healthcare service preparation and delivery, and quarantines, as well as general concern and uncertainty that has negatively affected the economic environment and that occurred subsequent to year end may have a significant negative impact on the operations and profitability of the Funds' investments. These impacts have caused significant volatility and declines in global financial markets, which have caused losses for investors. The impact of the COVID-19 pandemic may be short term or may last for an extended period of time, and in either case could result in a substantial economic downturn or recession. Public health crises may exacerbate other pre-existing political, social, economic, market and financial risks. The extent of the impact to the financial performance of the Funds' investments will depend on future developments, including (i) the duration and spread of the outbreak, (ii) the restrictions and advisories, (iii) the effects on the financial markets, and (iv) the effects on the economy overall, all of which are highly uncertain and cannot be predicted.
The Board of Trustees of USAA Mutual Funds Trust has approved redesignating the Fund's current Adviser Shares as "Class A" shares ("Redesignation"). This change is expected to be effective in late June 2020 ("Redesignation Date").
Class A shares will be available for purchase through financial intermediaries and the Fund will pay ongoing distribution and/or service (12b-1) fees at annual rate of up to 0.25% of the average daily net assets of its Class A shares. In addition, the Transfer Agency fee will convert to an annual basis point rate of 0.10% of daily net assets of its Class A shares from its current flat per account fee. Class A shares will be offered and sold at their public offering price, which is the net asset value per share plus any applicable initial sales charge, also referred to as a "front-end sales load." For purchases on or after the Redesignation Date, Class A Shares will be offered and sold with the imposition of a maximum initial sales charge of up to 2.25% of the offering price of the Fund. A contingent deferred sales charge of up to 0.75% may be imposed on redemptions of Class A shares purchased without an initial sales charge if shares are redeemed within 12 months of purchase.
The Redesignation will be made without the imposition of any sales loads, fees, or other charges to Adviser Shares held in shareholder accounts on the Redesignation Date. The Redesignation will not be considered a taxable event for federal income tax purposes.
32
REPORT OF INDEPENDENT REGISTERED PUBLIC ACCOUNTING FIRM
To the Shareholders and the Board of Trustees of USAA New York Bond Fund:
Opinion on the Financial Statements
We have audited the accompanying statement of assets and liabilities of USAA New York Bond Fund (the "Fund") (one of the funds constituting USAA Mutual Funds Trust (the "Trust")), including the schedule of portfolio investments, as of March 31, 2020, and the related statement of operations for the year then ended, the statements of changes in net assets for each of the two years in the period then ended, the financial highlights for each of the five years in the period then ended and the related notes (collectively referred to as the "financial statements"). In our opinion, the financial statements present fairly, in all material respects, the financial position of the Fund at March 31, 2020, the results of its operations for the year then ended, the changes in its net assets for each of the two years in the period then ended and its financial highlights for each of the five years in the period then ended, in conformity with U.S. generally accepted accounting principles.
Basis for Opinion
These financial statements are the responsibility of the Trust's management. Our responsibility is to express an opinion on the Fund's financial statements based on our audits. We are a public accounting firm registered with the Public Company Accounting Oversight Board (United States) ("PCAOB") and are required to be independent with respect to the Trust in accordance with the U.S. federal securities laws and the applicable rules and regulations of the Securities and Exchange Commission and the PCAOB.
We conducted our audits in accordance with the standards of the PCAOB. Those standards require that we plan and perform the audit to obtain reasonable assurance about whether the financial statements are free of material misstatement, whether due to error or fraud. The Trust is not required to have, nor were we engaged to perform, an audit of the Trust's internal control over financial reporting. As part of our audits we are required to obtain an understanding of internal control over financial reporting, but not for the purpose of expressing an opinion on the effectiveness of the Trust's internal control over financial reporting. Accordingly, we express no such opinion.
Our audits included performing procedures to assess the risks of material misstatement of the financial statements, whether due to error or fraud, and performing procedures that respond to those risks. Such procedures included examining, on a test basis, evidence regarding the amounts and disclosures in the financial statements. Our procedures included confirmation of securities owned as of March 31, 2020, by correspondence with the custodian and brokers or by other appropriate auditing procedures where replies from brokers were not received. Our audits also included evaluating the accounting principles used and significant estimates made by management, as well as evaluating the overall presentation of the financial statements. We believe that our audits provide a reasonable basis for our opinion.

We have served as the auditor of one or more Victory Capital investment companies since 1995.
San Antonio, Texas
May 27, 2020
33
USAA Mutual Funds Trust | Supplemental Information March 31, 2020 | ||||||
(Unaudited)
Expense Examples
As a shareholder of the Fund, you may incur two types of costs: (1) transaction costs, and (2) ongoing costs, including management fees and other Fund expenses. These examples are intended to help you understand your ongoing costs (in dollars) of investing in the Fund and to compare these costs with the ongoing costs of investing in other mutual funds.
These examples are based on an investment of $1,000 invested at the beginning of the period and held for the entire period from October 1, 2019, through March 31, 2020.
The Actual Expense figures in the table below provide information about actual account values and actual expenses. You may use the information below, together with the amount you invested, to estimate the expenses that you paid over the period. Simply divide your account value by $1,000 (for example, an $8,600 account value divided by $1,000 = 8.6), then multiply the result by the number in the table under the heading entitled "Actual Expenses Paid During Period" to estimate the expenses you paid on your account during this period.
The Hypothetical Expense figures in the table below provide information about hypothetical account values and hypothetical expenses based on the Fund's actual expense ratio and an assumed rate of return of 5% per year before expenses, which is not the Fund's actual return. The hypothetical account values and expenses may not be used to estimate the actual ending account balance or expenses you paid for the period. You may use this information to compare this 5% hypothetical example with the 5% hypothetical examples that appear in shareholder reports of other funds.
Please note the expenses shown in the table below are meant to highlight your ongoing costs only and do not reflect any transactional costs. If these transactional costs were included, your costs would have been higher.
| Beginning Account Value 10/1/19 | Actual Ending Account Value 3/31/20 | Hypothetical Ending Account Value 3/31/20 | Actual Expenses Paid During Period 10/1/19- 3/31/20* | Hypothetical Expenses Paid During Period 10/1/19- 3/31/20* | Annualized Expense Ratio During Period 10/1/19- 3/31/20 | ||||||||||||||||||||||
Fund Shares | $ | 1,000.00 | $ | 986.60 | $ | 1,021.90 | $ | 3.08 | $ | 3.13 | 0.62 | % | |||||||||||||||
Adviser Shares | 1,000.00 | 985.30 | 1,020.65 | 4.32 | 4.39 | 0.87 | % | ||||||||||||||||||||
* Expenses are equal to the average account value multiplied by the Fund's annualized expense ratio multiplied by 183/366 (the number of days in the most recent fiscal half-year divided by the number of days in the fiscal year).
Proxy Voting and Portfolio Holdings Information
Proxy Voting:
Information regarding the policies and procedures the Fund uses to determine how to vote proxies relating to portfolio securities is available without charge, upon request, by calling (800) 539-3863. The information is also included in the Fund's Statement of Additional Information, which is available on the SEC's website at www.sec.gov.
Information relating to how the Fund voted proxies relating to portfolio securities held during the most recent 12 months ended June 30 is available on the SEC's website at www.sec.gov.
Availability of Schedules of Portfolio Investments:
The Trust files a complete list of Schedules of Portfolio Investments with the SEC for the first and third quarter of each fiscal year on Form N-PORT. Forms N-PORT are available on the SEC's website at www.sec.gov.
34
USAA Mutual Funds Trust | Supplemental Information — continued March 31, 2020 | ||||||
(Unaudited)
Trustee and Officer Information
Board of Trustees:
Overall responsibility for management of the Trust rests with the Board. The Trust is managed by the Board in accordance with the laws of the state of Delaware. There are currently 10 Trustees, eight of whom are not "interested persons" of the Trust within the meaning of that term under the 1940 Act ("Independent Trustees") and two of whom is an "interested person" of the Trust within the meaning of that term under the 1940 Act ("Interested Trustee"). The Trustees, in turn, elect the officers of the Trust to actively supervise its day-to-day operations.
The following tables list the Trustees, their ages, position with the Trust, commencement of service, principal occupations during the past five years and any directorships of other investment companies or companies whose securities are registered under the Securities Exchange Act of 1934, as amended, or who file reports under that Act. Each Trustee oversees 47 portfolios in the Trust. Each Trustee's address is 15935 La Cantera Pkwy, Building Two, San Antonio, TX, 78256. Pursuant to a policy adopted by the Board, the term of office for each Trustee shall be until the Independent Trustee reaches age 75 or an Interested Trustee reaches age 75. The Board may change or grant exceptions from this policy at any time without shareholder approval. A Trustee may resign or be removed by a vote of the other Trustees or the holders of a majority of the outstanding shares of the Trust at any time. Vacancies on the Board can be filled by the action of a majority of the Trustees, provided that after filling such vacancy at least two-thirds of the Trustees have been elected by the shareholders.
Name and Date of Birth | Position Held with the Trust | Year Commenced Service | Principal Occupation During Past 5 Years | Other Directorships Held During Past 5 Years | |||||||||||||||
Independent Trustees. | |||||||||||||||||||
| Jefferson C. Boyce, Born September 1957 | Lead Independent Trustee, and Vice Chairman | 2013 | Senior Managing Director, New York Life Investments, LLC (1992-2012) | Westhab, Inc. | |||||||||||||||
| John C. Walters, Born February 1962 | Trustee | 2019 | Retired. Mr. Walters brings significant Board experience including active involvement with the board of a Fortune 500 company, and a proven record of leading large, complex financial organizations. He has a demonstrated record of success in distribution, manufacturing, investment brokerage, and investment management in both the retail and institutional investment businesses. He has substantial experience in the investment management business with a demonstrated ability to develop and drive strategy while managing operation, financial, and investment risk. | Guardian Variable Products Trust (16 series), Lead Independent Director; Amerilife Holdings LLC, Director; Stadion Money Management; Director; University of North Carolina (Chapel Hill), Member Board of Governors. | |||||||||||||||
35
USAA Mutual Funds Trust | Supplemental Information — continued March 31, 2020 | ||||||
(Unaudited)
Name and Date of Birth | Position Held with the Trust | Year Commenced Service | Principal Occupation During Past 5 Years | Other Directorships Held During Past 5 Years | |||||||||||||||
| Robert L. Mason, Ph.D., Born July 1946 | Trustee | 1997 | Adjunct Professor in the Department of Management Science and Statistics in the College of Business at the University of Texas at San Antonio (since 2001); Institute Analyst, Southwest Research Institute (March 2002-January 2016) | None | |||||||||||||||
| Dawn M. Hawley, Born February 1954 | Trustee | 2014 | Manager of Finance, Menil Foundation, Inc. (May 2007-June 2011), which is a private foundation that oversees the assemblage of sculptures, prints, drawings, photographs, and rare books. Director of Financial Planning and Analysis and Chief Financial Officer, AIM Management Group, Inc. (October 1987-January 2006) | None | |||||||||||||||
| Paul L. McNamara, Born July 1948 | Trustee | 2012 | Director, Cantor Opportunistic Alternatives Fund, LLC (March 2010-February 2014) , which is a closed-end fund of funds by Cantor Fitzgerald Investment Advisors, LLC | None | |||||||||||||||
36
USAA Mutual Funds Trust | Supplemental Information — continued March 31, 2020 | ||||||
(Unaudited)
Name and Date of Birth | Position Held with the Trust | Year Commenced Service | Principal Occupation During Past 5 Years | Other Directorships Held During Past 5 Years | |||||||||||||||
| Richard Y. Newton III, Born January 1956 | Trustee | 2017 | Director, Elta North America (01/18-present), which is a global leader in the design, manufacture, and support of innovative electronic systems in the ground, maritime, airborne, and security domains for the nation's warfighters, security personnel, and first responders; Managing Partner, Pioneer Partnership Development Group (December 2015-present)); Executive Director, The Union League Club of New York (June 2014-November 2015): Executive Vice President, Air Force Association (August 2012-May 2014); Lieutenant General, United States Air Force (January 2008-June 2012) | None | |||||||||||||||
| Barbara B. Ostdiek, Ph.D., Born March 1964 | Trustee | 2008 | Senior Associate Dean of Degree Programs at Jesse H. Jones Graduate School of Business at Rice University (since 2013); Associate Professor of Finance at Jessie H. Jones Graduate School of Business at Rice University (since 2001) | None | |||||||||||||||
| Michael F. Reimherr, Born August 1945 | Trustee | 2000 | President of Reimherr Business Consulting (May 1995-December 2017); St. Mary's University Investment Committee overseeing University Endowment (since 2014) | None | |||||||||||||||
37
USAA Mutual Funds Trust | Supplemental Information — continued March 31, 2020 | ||||||
(Unaudited)
Name and Date of Birth | Position Held with the Trust | Year Commenced Service | Principal Occupation During Past 5 Years | Other Directorships Held During Past 5 Years | |||||||||||||||
Interested Trustees. | |||||||||||||||||||
| David C. Brown, ** Born May 1972 | Trustee | 2019 | Chairman and Chief Executive Officer (since 2013), Co-Chief Executive Officer (2011-2013), Victory Capital Management Inc.; Chairman and Chief Executive Officer, Victory Capital Holdings, Inc. (since 2013). Mr. Brown brings to the Board extensive business, finance and leadership skills gained and developed through years of experience in the financial services industry, including his tenure overseeing the strategic direction as CEO of Victory Capital. These skills, combined with Mr. Brown's extensive knowledge of the financial services industry and demonstrated success in the development and distribution of investment strategies and products, enable him to provide valuable insights to the Board and strategic direction for the Funds | Trustee, Victory Portfolios (42 series), Victory Portfolios II (26 series), Victory Variable Insurance Funds (9 series) | |||||||||||||||
38
USAA Mutual Funds Trust | Supplemental Information — continued March 31, 2020 | ||||||
(Unaudited)
Name and Date of Birth | Position Held with the Trust | Year Commenced Service | Principal Occupation During Past 5 Years | Other Directorships Held During Past 5 Years | |||||||||||||||
| Daniel S. McNamara, ** Born June 1966 | Trustee and Chair of the Board of Trustees | 2012 | Trustee, President, and Vice Chairman of USAA ETF Trust (June 2017-June 2019); President of Financial Advice & Solutions Group (FASG), USAA (since 2013); Director, IMCO (September 2009-April 2014); President, AMCO (August, 2011-April 2013); Senior Vice President of USAA Financial Planning Services Insurance Agency, Inc. (FPS) (since 2011); Director of USAA Investment Management Company (IMCO) (since 2009); Chairman of Board of IMCO (since 2013); Director of USAA Asset Management Company (AMCO), (August 2011-June 2019); President and Director of USAA Shareholder Account Services (SAS)(October 2009-June 2019); Director and Vice Chairman of FPS (since 2013); President and Director of USAA Investment Corporation (ICORP) (since 2010); Chairman of Board of ICORP (since 2013); Director of USAA Financial Advisors, Inc. (FAI) (since 2013); Chairman of Board of FAI (since 2015). Mr. McNamara brings to the Board extensive experience in the financial services industry, including experience as an officer of the Trust. | None | |||||||||||||||
** Mr. McNamara and Mr. Brown are "Interested Persons" by reason of their relationships with the Adviser.
The Statement of Additional Information includes additional information about the Trustees of the Trust and is available, without charge, on the SEC's website at www.sec.gov and/or by calling (800)-539-3863.
39
USAA Mutual Funds Trust | Supplemental Information — continued March 31, 2020 | ||||||
(Unaudited)
Officers:
The officers of the Trust, their ages, commencement of service and their principal occupations during the past five years, are detailed in the following table. Each officer serves until the earlier of his or her resignation, removal, retirement, death, or the election of a successor. The mailing address of each officer of the Trust is 15935 La Cantera Pkwy, Building Two, San Antonio, TX, 78256. The officers of the Trust receive no compensation directly from the Trust for performing the duties of their offices.
Name and Date of Birth | Position with the Trust | Year Commenced Service | Principal Occupation During Past 5 Years | ||||||||||||
Interested Officers. | |||||||||||||||
| Christopher K. Dyer, Born February 1962 | President | 2019 | Director of Fund Administration, Victory Capital (2004-present) | ||||||||||||
| Scott A Stahorsky, Born July 1969 | Vice President | 2019 | Manager, Fund Administration, Victory Capital (since 2015); Senior Analyst, Fund Administration, Victory Capital (prior to 2015) | ||||||||||||
| James K. De Vries, Born April 1969 | Treasurer, Principal Financial Officer | 2018 | Executive Director, Victory Capital Management Inc. (since 2019); Treasurer, USAA ETF Trust (September 2018-June 2019); Executive Director, Investment and Financial Administration, USAA (April 2012-June 2019); Assistant Treasurer, USAA ETF Trust (June 2017-September 2018); Assistant Treasurer, USAA Mutual Funds Trust (December 2013-February 2018) | ||||||||||||
| Allan Shaer, Born March 1965 | Assistant Treasurer | 2019 | Senior Vice President, Financial Administration, Citi Fund Services Ohio, Inc. (since 2016); Vice President, Mutual Fund Administration, JP Morgan Chase (2011-2016) | ||||||||||||
| Carol D. Trevino, Born October 1965 | Assistant Treasurer | 2018 | Director, Accounting and Finance, Victory Capital Management Inc. (since 2019); Accounting/Financial Director, USAA (December 2013-June 2019); Assistant Treasurer, USAA ETF Trust (September 2018-June 2019). | ||||||||||||
| Erin G. Wagner, Born February 1974 | Secretary | 2019 | Deputy General Counsel, the Adviser (since 2013) | ||||||||||||
| Charles Booth, Born April 1960 | Anti-Money Laundering Compliance Officer and Identity Theft Officer | 2019 | Director, Regulatory Administration and CCO Support Services, Citi Fund Services Ohio, Inc. (2007-present). | ||||||||||||
| Amy Campos, Born July 1976 | Chief Compliance Officer | 2019 | Chief Compliance Officer, USAA Mutual Funds Trust (since 2019); Executive Director, Deputy Chief Compliance Officer, USAA Mutual Funds Trust and USAA ETF Trust (July 2017-June 2019); Compliance Director, USAA Mutual Funds Trust (2014-July 2017) | ||||||||||||
40
USAA Mutual Funds Trust | Supplemental Information — continued March 31, 2020 | ||||||
(Unaudited)
Additional Federal Income Tax Information
The following federal tax information related to the Fund's fiscal year ended March 31, 2020, is provided for information purposes only and should not be used for reporting to federal or state revenue agencies. Federal tax information for the calendar year will be reported to you on Form 1099-DIV in January 2021.
With respect to distributions paid, the Fund designates the following amounts (or, if subsequently determined to be different, the maximum amount allowable) for the fiscal year ended March 31, 2020 (amounts in thousands):
| Tax Exempt Income Amount* | |||||||
99.94 | % | ||||||
* Presented as a percentage of net investment income and excludes short-term capital gain distributions paid, if any. All or a portion of these amounts may be exempt from taxation at the state level.
41
Privacy Policy
Protecting the Privacy of Information
The Trust respects your right to privacy. We also know that you expect us to conduct and process your business in an accurate and efficient manner. To do so, we must collect and maintain certain personal information about you. This is the information we collect from you on applications or other forms, and from the transactions you make with us or third parties. It may include your name, address, social security number, account transactions and balances, and information about investment goals and risk tolerance.
We do not disclose any information about you or about former customers to anyone except as permitted or required by law. Specifically, we may disclose the information we collect to companies that perform services on our behalf, such as the transfer agent that processes shareholder accounts and printers and mailers that assist us in the distribution of investor materials. We may also disclose this information to companies that perform marketing services on our behalf. This allows us to continue to offer you Victory investment products and services that meet your investing needs, and to effect transactions that you request or authorize. These companies will use this information only in connection with the services for which we hired them. They are not permitted to use or share this information for any other purpose.
To protect your personal information internally, we permit access only by authorized employees and maintain physical, electronic and procedural safeguards to guard your personal information.*
* You may have received communications regarding information about privacy policies from other financial institutions which gave you the opportunity to "opt-out" of certain information sharing with companies which are not affiliated with that financial institution. The Trust does not share information with other companies for purposes of marketing solicitations for products other than the Trust. Therefore, the Trust does not provide opt-out options to their shareholders.
15935 La Cantera Pkwy
Building Two
San Antonio, Texas 78256

Visit our website at: | Call | ||||||
usaa.com | (800) 235-8396 | ||||||
40864-0520

MARCH 31, 2020
Annual Report
USAA Target Managed Allocation Fund
Beginning January 1, 2021, as permitted by regulations adopted by the Securities and Exchange Commission, paper copies of the Fund's shareholder reports like this one will no longer be sent by mail, unless you specifically request paper copies of the reports from the Fund or from your financial intermediary, such as a broker-dealer or bank. Instead, the reports will be made available on usaa.com, and you will be notified by mail each time a report is posted and provided with a website link to access the report.
If you already elected to receive shareholder reports electronically, you will not be affected by this change and you need not take any action. You may elect to receive shareholder reports and other communications from the Fund or your financial intermediary electronically by notifying your financial intermediary directly, or if you are a direct investor, by calling (800) 235-8396 or logging on to usaa.com.
You may elect to receive all future reports in paper free of charge. You can inform the Fund or your financial intermediary that you wish to continue receiving paper copies of your shareholder reports by notifying your financial intermediary directly, or if you are a direct investor, by calling (800) 235-8396 or logging on to usaa.com. Your election to receive reports in paper will apply to all funds held with the USAA family of funds or your financial intermediary.
Victory Capital means Victory Capital Management Inc., the investment adviser of the USAA Mutual Funds. USAA Mutual Funds are distributed by Victory Capital Services, Inc., member FINRA, an affiliate of Victory Capital. Victory Capital and its affiliates are not affiliated with United Services Automobile Association or its affiliates. USAA and the USAA logo are registered trademarks and the USAA Mutual Funds and USAA Investments logos are trademarks of United Services Automobile Association and is being used by Victory Capital and its affiliates under license.
USAA Mutual Funds Trust
TABLE OF CONTENTS
Shareholder Letter (Unaudited) | 2 | ||||||
Managers' Commentary (Unaudited) | 4 | ||||||
Investment Overview (Unaudited) | 6 | ||||||
| Investment Objective & Portfolio Holdings (Unaudited) | 7 | ||||||
Financial Statements | |||||||
Schedule of Portfolio Investments | 8 | ||||||
Statement of Assets and Liabilities | 9 | ||||||
Statement of Operations | 10 | ||||||
Statements of Changes in Net Assets | 11 | ||||||
Financial Highlights | 12 | ||||||
Notes to Financial Statements | 14 | ||||||
| Report of Independent Registered Public Accounting Firm | 26 | ||||||
Supplemental Information (Unaudited) | 27 | ||||||
Expense Example | 27 | ||||||
Proxy Voting and Portfolio Holdings Information | 27 | ||||||
Trustees' and Officers' Information | 28 | ||||||
Additional Federal Income Tax Information | 34 | ||||||
Privacy Policy (inside back cover) | |||||||
This report is for the information of the shareholders and others who have received a copy of the currently effective prospectus of the Fund, managed by Victory Capital Management Inc. It may be used as sales literature only when preceded or accompanied by a current prospectus, which provides further details about the Fund.
IRA DISTRIBUTION WITHHOLDING DISCLOSURE
We generally must withhold federal income tax at a rate of 10% of the taxable portion of your distribution and, if you live in a state that requires state income tax withholding, at your state's tax rate. However, you may elect not to have withholding apply or to have income tax withheld at a higher rate. Any withholding election that you make will apply to any subsequent distribution unless and until you change or revoke the election. If you wish to make a withholding election, or change or revoke a prior withholding election, call (800) 235-8396.
If you do not have a withholding election in place by the date of a distribution, federal income tax will be withheld from the taxable portion of your distribution at a rate of 10%. If you must pay estimated taxes, you may be subject to estimated tax penalties if your estimated tax payments are not sufficient and sufficient tax is not withheld from your distribution.
For more specific information, please consult your tax adviser.
1
(Unaudited)
Dear Shareholder,
If there were ever a time that illustrated the dynamic and unpredictable nature of financial markets—and life in general—it would be the strange days of early 2020. The spread of COVID-19 throughout the United States and the world has been an unprecedented event that, among so many other impacts, rendered virtually any economic forecasts unreliable. Seemingly overnight, the sentiment pendulum swung from risk-on to risk-off. We all became familiar with unusual concepts like "social distancing" and "flattening the curve."
Given that wide swaths of the global economy came to an all-stop—an event that has no real precedent—there remains tremendous uncertainty as to the depth and extent of the economic downturn. Making assumptions about the extent of the virus' reach, its impact on consumer behavior and employment, and the speed at which the U.S. government and U.S. Federal Reserve (the "Fed") can revive the economy is educated guesswork at best.
Fortunately, it's not all bad news. We did see markets stabilize as this annual reporting period drew to a close (and in the early weeks of April immediately following). As of the writing of this letter, the array of new lending facilities and programs launched by the Fed generally appear to have had their intended effect of improving liquidity and trading, at least in the short-term. Credit spreads across corporate, high-yield, structured, and municipal bond markets were coaxed down from their highs. Trading in equity markets also appeared to stabilize.
The USAA tax-exempt funds generally performed as would be expected given the unusual market environment. Our tax-exempt funds tend to be more credit heavy, holding more BBB-category rated bonds than the average in our peer groups. Typically, we overweight these credits to provide additional tax-free income to our investors, and these securities tend to underperform in periods of market dislocation when credit spreads widen significantly.
We believe that the volatility in the tax-exempt market reflected the lack of liquidity, rather than any significant credit deterioration. It's important to underscore that the USAA tax-exempt funds entered the crisis with ample liquidity and none have yet had to sell portfolio securities at an inopportune price to achieve a fund's desired level of exposure.
Looking ahead, the economy and the markets remain unpredictable. Yet our investment philosophy—and our resolve—is steadfast. A priority of our fixed-income portfolio managers and analysts is to maintain substantial liquidity, as no one can predict when the crisis will abate and what liquidity needs might be in the meantime.
Through it all, we remain committed to our core competency of evaluating, taking and managing credit risk, and we continue to build portfolios bond-by-bond. We believe the recent environment, though breathtaking in its volatility, provides extraordinary buying opportunities that may help us lock in higher tax-free yields for our investors.
2
If you have questions about the current market dynamics or your specific portfolio or investment plan, please give one of our financial representatives a call. They can help ensure that you are properly diversified based on your long-term goals, time horizon, and risk tolerance.
From all of us here at USAA Funds, thank you for letting us help you work toward your investment goals.

Christopher K. Dyer, CFA
President,
USAA Funds
3
USAA Mutual Funds Trust
USAA Target Managed Allocation Fund
Manager's Commentary
(Unaudited)
Wasif A. Latif
Mannik S. Dhillon
Lance Humphrey, CFA
• What were the market conditions during the reporting period?
The reporting period began on the heels of a strong first quarter in equities which rebounded from the sharp selloff to end 2018. The second and third quarters marked mostly flat performance as concerns related to trade negotiations with China, an inverted yield curve, and deteriorating economic indicators cast doubt into how much more longest bull market in history had to run.
The U.S. Federal Reserve (the "Fed") came to the rescue with accommodating monetary policy, cutting interest rates three times throughout 2019. Investor sentiment turned bullish in the fourth quarter as economic indicators became more supportive and trade negotiations improved as tariffs that were scheduled to go into effect were averted. As a result, equities finished the fourth quarter much the way they started the year with solid gains.
Trade negotiations with China and the 2020 U.S. Presidential election were top of mind to start the first quarter of 2020. A phase one deal between the U.S. and China was reached in early January which the market welcomed, but political uncertainty surrounding the U.S. Presidential election and the economic impact of the novel coronavirus ("COVID 19") outbreak in China took hold.
In late February, concerns about the spread of the a novel COVID-19 led to a sharp sell-off in equities, with volatility spiking to levels not seen since the 2008 financial crisis. The COVID-19 pandemic led to containment efforts which all but brought the global economy to a halt. Equities recovered some of the lost ground in the final days of the quarter through concerted fiscal and monetary stimulus efforts. In the U.S., the Fed cut its benchmark overnight lending rate to zero and announced the revival of a range of crisis-era lending facilities and asset-purchase programs. On the fiscal side, Congress passed a $2.2 trillion stimulus package. However, markets remained highly volatile into quarter-end given the uncertainty around the scope and duration of the impact of the virus on the global economy.
• How did the USAA Target Managed Allocation Fund (the "Fund") perform during the reporting period?
For the reporting period ended March 31, 2020, the Fund had a total return of -8.20%. This compares to total returns of -11.26% for the MSCI All-Country World Index and 7.15% for the Bloomberg Barclays U.S. Universal Index.
4
USAA Mutual Funds Trust
USAA Target Managed Allocation Fund (continued)
• What strategies did you employ during the reporting period?
USAA Funds offers six funds in the Target Retirement Series, each of which has a different strategic asset allocation based on investors' risk tolerance and time horizon. Depending on our continuous assessment of market opportunities and risks, we apply tactical asset allocation decisions by overweighting or underweighting the various asset classes in each fund versus our respective strategic allocations. The Target Managed Allocation Fund allows us to make allocation changes to the Target Retirement Series more quickly and with less disruption to the underlying funds in the portfolios. The Fund's asset allocation therefore reflects the need to round out the portfolios of the Target Retirement Series, rather than representing an active strategy. We primarily use exchange-traded funds ("ETFs") and futures to implement our asset allocation views, since they are highly liquid vehicles that allow us to apply our decisions more quickly and efficiently than investing in individual securities.
With this in mind, the Fund was generally well positioned for the environment of the past 12 months. A substantial portion of the portfolio was invested in U.S. equities, which outperformed the broader global equity markets. Additionally, the Fund had higher than average defensive positions in various fixed income asset classes that were invested tactically throughout the period. For example, the portfolio held a position in an ETF that tracks U.S. long term treasury bonds, which proved to be one of the best performing major asset classes over the period. This particularly benefitted the portfolio on a relative basis during the sharp downturn in the first quarter of 2020. These benefits were slightly offset by long positions in ETFs that track indices that invest in companies in international developed markets such as Europe.
The Fund also employs a tactically-oriented equity futures strategy designed to provide incremental return on top of the underlying ETF positions. This strategy added value over the period primarily driven by long positions in U.S. large cap equities and short positions in U.S. small cap equities. Short positions in futures tracking the MSCI Emerging Markets Index also contributed to the strong performance of the strategy.
Thank you for allowing us to assist you with your investment needs.
5
USAA Mutual Funds Trust
USAA Target Managed Allocation Fund
Investment Overview
(Unaudited)
Average Annual Total Return
Year Ended March 31, 2020
INCEPTION DATE | 8/7/15 | ||||||||||||||
Net Asset Value | MSCI All-Country World Index1 | Bloomberg Barclays U.S. Universal Index2 | |||||||||||||
One Year | -8.20 | % | -11.26 | % | 7.15 | % | |||||||||
Since Inception+ | 1.73 | % | 2.79 | % | 3.78 | % | |||||||||
Past performance is not indicative of future results. The performance data quoted represents past performance and current returns may be lower or higher. The investment return and principal value will fluctuate so that an investor's shares, when redeemed, may be worth more or less than the original cost. To obtain performance information current to the most recent month's end, please visit www.usaa.com.
+The since inception performance of the MSCI All-Country World Index and the Bloomberg Barclays U.S. Universal Index is calculated from July 31, 2015 through March 31, 2020.
Total return measures the price change in a share assuming the reinvestment of all net investment income and realized capital gain distributions, if any. The total returns quoted do not reflect adjustments made to the enclosed financial statements in accordance with U.S. generally accepted accounting principles or the deduction of taxes that a shareholder would pay on net investment income and realized capital gain distributions, including reinvested distributions, or redemptions of shares.
The total return figures set forth above include all waivers of fees for various periods since inception. Without such fee waivers, the total returns would have been lower.
USAA Target Managed Allocation Fund — Growth of $10,000
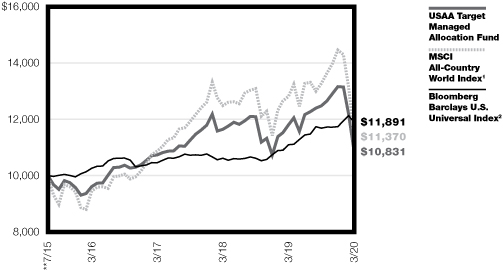
**The performance of the MSCI All-Country World Index and Bloomber Barclays U.S. Universal Index are calculated from the end of the month, July 31, 2015, while the inception date of the USAA Target Managed Allocation Fund is August 7, 2015. There may be a slight variation of performance numbers because of this difference.
1The unmanaged MSCI All-Country World Index is a free float-adjusted market capitalization weighted index that is designed to measure the equity market performance of developed and emerging markets. There are no expenses associated with the index, while there are expenses associated with the Fund. It is not possible to invest directly in an index.
2The unmanaged Bloomberg Barclays U.S. Universal Bond Index is comprised of U.S. dollar denominated, taxable bonds that are related investment-grade or below investment-grade. There are no expenses associated with the index, while there are expenses associated with the Fund. It is not possible to invest directly in an index.
The graph reflects investment of growth of a hypothetical $10,000 investment in the Fund. Past performance is no guarantee of future results.
The graph and table do not reflect the deduction of taxes that a shareholder would pay on Fund distributions or the redemption of Fund shares.
6
| USAA Mutual Funds Trust USAA Target Managed Allocation Fund | March 31, 2020 | ||||||
(Unaudited)
Investment Objective & Portfolio Holdings:
The Fund's investment objective seeks to maximum total return primarily through capital appreciation.
Asset Allocation*:
3/31/2020
(% of Net Assets)
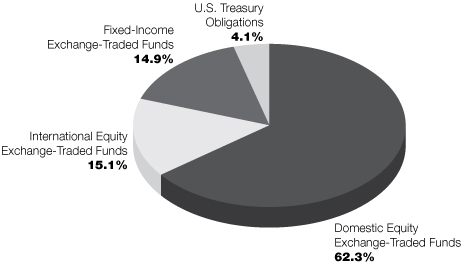
*Does not include futures, money market instruments, and short-term investments purchased with cash collateral from securities loaned.
Percentages are of the net assets of the Fund and may not equal 100%.
7
| USAA Mutual Funds Trust USAA Target Managed Allocation Fund | Schedule of Portfolio Investments March 31, 2020 | ||||||
(Amounts in Thousands, Except for Shares)
Security Description | Shares or Principal Amount | Value* | |||||||||
U.S. Treasury Obligations (4.1%) | |||||||||||
U.S. Treasury Note, 1.88%, 4/30/22 (a) | $ | 17,600 | $ | 18,186 | |||||||
Total U.S. Treasury Obligations (Cost $17,374) | 18,186 | ||||||||||
Exchange-Traded Funds (92.3%) | |||||||||||
iShares 20+ Year Treasury Bond ETF | 129,969 | 21,441 | |||||||||
iShares iBoxx $ Investment Grade Corporate Bond ETF | 299,825 | 37,031 | |||||||||
SPDR Gold Shares | 202,941 | 30,045 | |||||||||
Vanguard FTSE All-World ex-US ETF | 1,640,234 | 67,282 | |||||||||
Vanguard S&P 500 ETF (a) | 994,548 | 235,530 | |||||||||
Vanguard Short-Term Bond ETF | 97,666 | 8,026 | |||||||||
Vanguard Total Stock Market ETF (a) | 102,188 | 13,173 | |||||||||
Total Exchange-Traded Funds (Cost $444,214) | 412,528 | ||||||||||
Total Investments (Cost $461,588) — 96.4% | 430,714 | ||||||||||
Other assets in excess of liabilities — 3.6% | 15,902 | ||||||||||
NET ASSETS — 100.00% | $ | 446,616 | |||||||||
* At March 31, 2020 the Fund's investments in foreign securities were 15.1% of net assets.
(a) All or a portion of this security has been designated as collateral for futures contracts.
ETF — Exchange-Traded Fund
Futures Contracts Purchased
(Amounts not in thousands)
| Number of Contracts | Expiration Date | Notional Amount | Value | Unrealized Appreciation (Depreciation) | |||||||||||||||||||
E-Mini S&P 500 Future | 566 | 6/19/20 | $ | 74,628,744 | $ | 72,722,510 | $ | (1,906,234 | ) | ||||||||||||||
FTSE 100 Index Future | 434 | 6/19/20 | 27,263,927 | 30,379,299 | 2,658,787 | ||||||||||||||||||
Swiss Market Index Future | 191 | 6/19/20 | 16,393,798 | 18,087,948 | 1,383,543 | ||||||||||||||||||
$ | 2,136,096 | ||||||||||||||||||||||
Futures Contracts Sold
(Amounts not in thousands)
| Number of Contracts | Expiration Date | Notional Amount | Value | Unrealized Appreciation (Depreciation) | |||||||||||||||||||
| Mini MSCI Emerging Markets Index Future | 813 | 6/19/20 | $ | 33,329,503 | $ | 34,263,885 | $ | (934,382 | ) | ||||||||||||||
Russell 2000 Mini Index Future | 699 | 6/19/20 | 40,901,092 | 40,108,620 | 792,472 | ||||||||||||||||||
Tokyo Price Index Future | 361 | 6/11/20 | 45,148,533 | 47,103,743 | (2,670,416 | ) | |||||||||||||||||
$ | (2,812,326 | ) | |||||||||||||||||||||
Total unrealized appreciation | $ | 4,834,802 | |||||||||||||||||||||
Total unrealized depreciation | (5,511,032 | ) | |||||||||||||||||||||
Total net unrealized appreciation (depreciation) | $ | (676,230 | ) | ||||||||||||||||||||
See notes to financial statements.
8
USAA Mutual Funds Trust | Statement of Assets and Liabilities March 31, 2020 | ||||||
(Amounts in Thousands, Except Per Share Amounts)
| USAA Target Managed Allocation Fund | |||||||
Assets: | |||||||
Investments, at value (Cost $461,588) | $ | 430,714 | |||||
Cash and cash equivalents | 6,448 | ||||||
Deposits with brokers for futures contracts | 10,682 | ||||||
Receivables: | |||||||
Interest and dividends | 150 | ||||||
Variation margin on open futures contracts | 1,387 | ||||||
Prepaid expenses | 2 | ||||||
Total Assets | 449,383 | ||||||
Liabilities: | |||||||
Payables: | |||||||
Capital shares redeemed | 1,011 | ||||||
Variation margin on open futures contracts | 1,479 | ||||||
Accrued expenses and other payables: | |||||||
Investment advisory fees | 196 | ||||||
Administration fees | 20 | ||||||
Custodian fees | 3 | ||||||
Transfer agent fees | 21 | ||||||
Compliance fees | — | (a) | |||||
Trustees' fees | 2 | ||||||
Other accrued expenses | 35 | ||||||
Total Liabilities | 2,767 | ||||||
Net Assets: | |||||||
Capital | 486,472 | ||||||
Total distributable earnings/(loss) | (39,856 | ) | |||||
Net Assets | $ | 446,616 | |||||
Shares (unlimited number of shares authorized with no par value): | 49,741 | ||||||
Net asset value, offering and redemption price per share: (b) | $ | 8.98 | |||||
(a) Rounds to less than $1 thousand.
(b) Per share amount may not recalculate due to rounding of net assets and/or shares outstanding.
See notes to financial statements.
9
USAA Mutual Funds Trust | Statement of Operations For the Year Ended March 31, 2020 | ||||||
(Amounts in Thousands)
| USAA Target Managed Allocation Fund | |||||||
Investment Income: | |||||||
Dividends | $ | 12,907 | |||||
Interest | 474 | ||||||
Securities lending (net of fees) | 14 | ||||||
Total Income | 13,395 | ||||||
Expenses: | |||||||
Investment advisory fees | 2,653 | ||||||
Professional fees | 2 | ||||||
Administration fees | 265 | ||||||
Sub-Administration fees | 12 | ||||||
Custodian fees | 55 | ||||||
Transfer agent fees | 265 | ||||||
Trustees' fees | 44 | ||||||
Compliance fees | 2 | ||||||
Legal and audit fees | 74 | ||||||
State registration and filing fees | 1 | ||||||
Interest expense on interfund lending | 14 | ||||||
Other expenses | 24 | ||||||
Total Expenses | 3,411 | ||||||
Net Investment Income (Loss) | 9,984 | ||||||
Realized/Unrealized Gains (Losses) from Investments: | |||||||
Net realized gains (losses) from investment securities | (234 | ) | |||||
Net realized gains (losses) on foreign currency transactions | 252 | ||||||
Net realized gains (losses) from futures contracts | 9,420 | ||||||
Net change in unrealized appreciation/depreciation on investment securities | (54,982 | ) | |||||
Net change in unrealized appreciation/depreciation on foreign currency translations | (45 | ) | |||||
Net change in unrealized appreciation/depreciation on futures contracts | (2,360 | ) | |||||
Net realized/unrealized gains (losses) on investments | (47,949 | ) | |||||
Change in net assets resulting from operations | $ | (37,965 | ) | ||||
See notes to financial statements.
10
USAA Mutual Funds Trust | Statements of Changes in Net Assets | ||||||
(Amounts in Thousands)
| USAA Target Managed Allocation Fund | |||||||||||
| Year Ended March 31, 2020 | Year Ended March 31, 2019 | ||||||||||
From Investments: | |||||||||||
Operations: | |||||||||||
Net investment income (loss) | $ | 9,984 | $ | 8,356 | |||||||
Net realized gains (losses) from investments | 9,438 | 33,339 | |||||||||
| Net change in unrealized appreciation/depreciation on investments | (57,387 | ) | (34,260 | ) | |||||||
Change in net assets resulting from operations | (37,965 | ) | 7,435 | ||||||||
Change in net assets resulting from distributions to shareholders | (25,937 | ) | (45,385 | ) | |||||||
Change in net assets resulting from capital transactions | (1,689 | ) | 62,558 | ||||||||
Change in net assets | (65,591 | ) | 24,608 | ||||||||
Net Assets: | |||||||||||
Beginning of period | 512,207 | 487,599 | |||||||||
End of period | $ | 446,616 | $ | 512,207 | |||||||
Capital Transactions: | |||||||||||
Proceeds from shares issued | $ | 5,264 | $ | 139,156 | |||||||
Distributions reinvested | 25,937 | 45,385 | |||||||||
Cost of shares redeemed | (32,890 | ) | (121,983 | ) | |||||||
Change in net assets resulting from capital transactions | $ | (1,689 | ) | $ | 62,558 | ||||||
Share Transactions: | |||||||||||
Issued | 590 | 12,530 | |||||||||
Reinvested | 2,372 | 4,694 | |||||||||
Redeemed | (3,127 | ) | (10,761 | ) | |||||||
Change in Shares | (165 | ) | 6,463 | ||||||||
See notes to financial statements.
11
USAA Mutual Funds Trust | Financial Highlights | ||||||
For a Share Outstanding Throughout Each Period
Investment Activities | Distributions to Shareholders From | ||||||||||||||||||||||||||
| Net Asset Value, Beginning of Period | Net Investment Income (Loss) | Net Realized and Unrealized Gains (Losses) on Investments | Total from Investment Activities | Net Investment Income | Net Realized Gains From Investments | ||||||||||||||||||||||
USAA Target Managed Allocation Fund | |||||||||||||||||||||||||||
| Year Ended March 31, 2020 | $ | 10.26 | 0.20 | (c) | (0.96 | ) | (0.76 | ) | (0.22 | ) | (0.30 | ) | |||||||||||||||
| Year Ended March 31, 2019 | $ | 11.22 | 0.17 | (0.10 | ) | 0.07 | (0.15 | ) | (0.88 | ) | |||||||||||||||||
| Year Ended March 31, 2018 | $ | 10.46 | 0.16 | 0.73 | 0.89 | (0.13 | ) | — | (e) | ||||||||||||||||||
| Year Ended March 31, 2017 | $ | 9.49 | 0.14 | 0.97 | 1.11 | (0.14 | ) | — | |||||||||||||||||||
| August 7, 2015 (i) through March 31, 2016 | $ | 10.00 | 0.12 | (c) | (0.51 | ) | (0.39 | ) | (0.12 | ) | — | ||||||||||||||||
* Assumes reinvestment of all net investment income and realized capital gain distributions, if any, during the period. Includes adjustments in accordance with U.S. generally accepted accounting principles and could differ from the Lipper reported return.
^ The net expense ratio may not correlate to the applicable expense limits in place during the period since the current contractual expense limitation is applied for a two year period beginning July 1, 2019 and in effect through June 30, 2021, instead of coinciding with the Fund's fiscal year end. Details of the current contractual expense limitation in effect can be found in Note 5 of the accompanying Notes to Financial Statements.
(a) Not annualized for periods less than one year.
(b) Annualized for periods less than one year.
(c) Per share net investment income (loss) has been calculated using the average daily shares method.
(d) Reflects an increase in trading activity due to asset allocation shifts.
(e) Amount is less than $0.005 per share.
(f) Reflects overall decrease in purchases and sales of securities.
(g) Prior to August 1, 2016, AMCO had voluntarily agreed to limit the annual expenses of the Fund to 0.70% of the Fund's average daily net assets.
(h) Reflects that the Fund did not have a full year of operations in 2016.
(i) Commencement of operations.
See notes to financial statements.
12
USAA Mutual Funds Trust | Financial Highlights — continued | ||||||
For a Share Outstanding Throughout Each Period
Ratios to Average Net Assets | Supplemental Data | ||||||||||||||||||||||||||||||||||
| Total Distributions | Net Asset Value, End of Period | Total Return*(a) | Net Expenses^(b) | Net Investment Income (Loss)(b) | Gross Expenses(b) | Net Assets, End of Period (000's) | Portfolio Turnover(a) | ||||||||||||||||||||||||||||
USAA Target Managed Allocation Fund | |||||||||||||||||||||||||||||||||||
| Year Ended March 31, 2020 | (0.52 | ) | $ | 8.98 | (8.20 | )% | 0.64 | % | 1.88 | % | 0.64 | % | $ | 446,616 | 298 | %(d) | |||||||||||||||||||
| Year Ended March 31, 2019 | (1.03 | ) | $ | 10.26 | 1.32 | % | 0.65 | % | 1.83 | % | 0.65 | % | $ | 512,207 | 195 | %(d) | |||||||||||||||||||
| Year Ended March 31, 2018 | (0.13 | ) | $ | 11.22 | 8.48 | % | 0.65 | % | 1.50 | % | 0.65 | % | $ | 487,599 | 75 | %(f) | |||||||||||||||||||
| Year Ended March 31, 2017 | (0.14 | ) | $ | 10.46 | 11.72 | % | 0.64 | %(g) | 1.37 | % | 0.64 | % | $ | 462,794 | 125 | %(h) | |||||||||||||||||||
| August 7, 2015 (i) through March 31, 2016 | (0.12 | ) | $ | 9.49 | (3.91 | )% | 0.65 | % | 1.88 | % | 0.65 | % | $ | 415,896 | 84 | % | |||||||||||||||||||
See notes to financial statements.
13
USAA Mutual Funds Trust | Notes to Financial Statements March 31, 2020 | ||||||
1. Organization:
USAA Mutual Funds Trust (the "Trust") is organized as a Delaware statutory trust and is registered under the Investment Company Act of 1940, as amended (the "1940 Act"), as an open-end investment company. The Trust is comprised of 47 funds and is authorized to issue an unlimited number of shares, which are units of beneficial interest with no par value.
The accompanying financial statements are those of the USAA Target Managed Allocation Fund (the "Fund"). The Fund is classified as diversified under the 1940 Act.
The Fund is not offered for sale directly to the general public and is available currently for investment only to other USAA funds participating in a fund-of-funds investment strategy or other persons or legal entities that the Fund may approve from time to time.
On November 6, 2018, United Services Automobile Association ("USAA"), the parent company of USAA Asset Management Company ("AMCO"), the investment adviser to the Fund, and USAA Transfer Agency Company, d/b/a USAA Shareholder Account Services ("SAS"), the transfer agent to the Fund, announced that AMCO and SAS would be acquired by Victory Capital Holdings Inc., a global investment management firm headquartered in Cleveland, Ohio (the "Transaction"). The Transaction closed on July 1, 2019. A special shareholder meeting was held on April 18, 2019, at which shareholders of the Fund approved a new investment advisory agreement between the Trust, on behalf of the Fund, and Victory Capital Management Inc. ("VCM" or "Adviser"). Effective July 1, 2019, VCM replaced AMCO as the investment adviser to the Fund and Victory Capital Transfer Agency Company replaced SAS as the Fund's transfer agent. In addition, effective on that same date, shareholders of the Fund also elected the following two new directors to the Board of the Trust to serve upon the closing of the Transaction: (1) David C. Brown, to serve as an Interested Trustee; and (2) John C. Walters, to serve as an Independent Trustee.
Under the Trust's organizational documents, its officers and trustees are indemnified against certain liabilities arising out of the performance of their duties to the Fund. In addition, in the normal course of business, the Fund enters into contracts with its vendors and others that provide for general indemnifications. The Fund's maximum exposure under these arrangements is unknown, as this would involve future claims that may be made against the Fund. However, based on experience, the Fund expects that risk of loss to be remote.
2. Significant Accounting Policies:
The following is a summary of significant accounting policies followed by the Trust in the preparation of its financial statements. The policies are in conformity with generally accepted accounting principals in the United States of America ("GAAP"). The preparation of financial statements in accordance with GAAP requires management to make estimates and assumptions that affect the reported amounts of assets and liabilities and disclosure of contingent assets and liabilities at the date of the financial statements and the reported amounts of income and expenses for the period. Actual results could differ from those estimates. The Fund follows the specialized accounting and reporting requirements under GAAP that are applicable to investment companies under Accounting Standards Codification Topic 946.
Investment Valuation:
The Fund records investments at fair value. Fair value is defined as the price that would be received to sell an asset or paid to transfer a liability in an orderly transaction between market participants at the measurement date.
The valuation techniques described below maximize the use of observable inputs and minimize the use of unobservable inputs in determining fair value. The inputs used for valuing the Fund's investments are summarized in the three broad levels listed below:
• Level 1 — quoted prices in active markets for identical securities
• Level 2 — other significant observable inputs (including quoted prices for similar securities or interest rates applicable to those securities, etc.)
• Level 3 — significant unobservable inputs (including the Fund's own assumptions in determining the fair value of investments)
14
USAA Mutual Funds Trust | Notes to Financial Statements — continued March 31, 2020 | ||||||
Changes in valuation techniques may result in transfers in or out of an assigned level within the disclosure hierarchy. The inputs or methodologies used for valuation techniques are not necessarily an indication of the risk associated with entering into those investments.
The Adviser has established the Pricing and Liquidity Committee (the "Committee"), and subject to the Trust's Board of Trustees (the "Board") oversight, the Committee administers and oversees the Fund's valuation policies and procedures, which are approved by the Board.
Portfolio securities listed or traded on securities exchanges, including exchange-traded funds ("ETFs"), are valued at the closing price on the exchange or system where the security is principally traded, if available, or at the Nasdaq Official Closing Price. If there have been no sales for that day on the exchange or system, then a security is valued at the last available bid quotation on the exchange or system where the security is principally traded. In each of these situations, valuations are typically categorized as Level 1 in the fair value hierarchy.
Investments in open-end investment companies are valued at net asset value. These valuations are typically categorized as Level 1 in the fair value hierarchy.
Futures contracts are valued at the settlement price established each day by the board of trade or an exchange on which they are traded. These valuations are typically categorized as Level 1 in the fair value hierarchy.
Debt securities of United States ("U.S.") issuers, along with corporate and municipal securities, including short-term investments maturing in 60 days or less, may be valued using evaluated bid or the last sales price to price securities by dealers or an independent pricing service approved by the Board. These valuations are typically categorized as Level 2 in the fair value hierarchy.
Effective July 1, 2019, the valuation methodology applied to certain debt securities changed. Securities that were previously valued at an evaluated mean are now valued at the evaluated bid or the last sales price.
In the event that price quotations or valuations are not readily available, are not reflective of market value, or a significant event has been recognized in relation to a security or class of securities, the securities are valued in good faith by the Committee in accordance with valuation procedures approved by the Board. These valuations typically are categorized as Level 2 or Level 3 in the fair value hierarchy, based on the observability of inputs used to determine the fair value. The effect of fair value pricing is that securities may not be priced on the basis of quotations from the primary market in which they are traded and the actual price realized from the sale of a security may differ materially from the fair value price. Valuing these securities at fair value is intended to cause the Fund's net asset value ("NAV") to be more reliable than it otherwise would be.
A summary of the valuations as of March 31, 2020, based upon the three levels defined above, is included in the table below while the breakdown, by category, of investments is disclosed in the Schedule of Portfolio Investments (amounts in thousands):
Level 1 | Level 2 | Level 3 | Total | ||||||||||||||||
U.S. Treasury Obligations | $ | — | $ | 18,186 | $ | — | $ | 18,186 | |||||||||||
Exchange-Traded Funds | 412,528 | — | — | 412,528 | |||||||||||||||
Total | $ | 412,528 | $ | 18,186 | $ | — | $ | 430,714 | |||||||||||
Other Financial Investments^: | |||||||||||||||||||
Assets: | |||||||||||||||||||
| Futures Contracts | 4,835 | — | — | 4,835 | |||||||||||||||
Liabilities: | |||||||||||||||||||
| Futures Contracts | (5,511 | ) | — | — | (5,511 | ) | |||||||||||||
Total | $ | (676 | ) | $ | — | $ | — | $ | (676 | ) | |||||||||
^ Futures Contracts are valued at the unrealized appreciation (depreciation) on the investment.
15
USAA Mutual Funds Trust | Notes to Financial Statements — continued March 31, 2020 | ||||||
For the year ended March 31, 2020, there were no transfers in or out of the Level 3 fair value hierarchy.
Real Estate Investment Trusts ("REITs"):
The Fund may invest in REITs which report information on the source of their distributions annually. REITs are pooled investment vehicles that invest primarily in income producing real estate or real estate related loans or interests (such as mortgages). Certain distributions received from REITs during the year are recorded as realized gains or return of capital as estimated by the Fund or when such information becomes known.
Investment Companies:
Exchange-Traded Funds:
The Fund may invest in ETFs. ETFs are a type of index fund, the shares of which are bought and sold on a securities exchange. An ETF trades like common stock and represents a fixed portfolio of securities designed to track the performance and dividend yield of a particular domestic or foreign market index. The Fund may purchase shares of an ETF to temporarily gain exposure to a portion of the U.S. or a foreign market while awaiting purchase of underlying securities. The risks of owning an ETF generally reflect the risks of owning the underlying securities they are designed to track, although the lack of liquidity of an ETF could result in it being more volatile. Additionally, ETFs have fees and expenses that reduce their value.
Open-End Funds:
The Fund may invest in portfolios of open-end investment companies. These investment companies value securities in their portfolios for which market quotations are readily available at their market values (generally the last reported sale price) and all other securities and assets at their fair value by the methods established by the board of directors of the underlying funds.
Derivative Instruments:
Futures Contracts:
The Fund may enter into contracts for the future delivery of securities or foreign currencies and futures contracts based on a specific security, class of securities, foreign currency or an index, and purchase or sell options on any such futures contracts. A futures contract on a securities index is an agreement obligating either party to pay, and entitling the other party to receive, while the contract is outstanding, cash payments based on the level of a specified securities index. No physical delivery of the underlying asset is made. The Fund may enter into futures contracts in an effort to hedge against market risks. The acquisition of put and call options on futures contracts will give the Fund the right (but not the obligation), for a specified price, to sell or to purchase the underlying futures contract, upon exercise of the option, at any time during the option period. Futures transactions involve brokerage costs and require the Fund to segregate assets to cover contracts that would require it to purchase securities or currencies. A good faith margin deposit, known as initial margin, of cash or government securities with a broker or custodian is required to initiate and maintain open positions in futures contracts. Subsequent payments, known as variation margin, are made or received by the Fund based on the change in the market value of the position and are recorded as unrealized appreciation or depreciation until the contract is closed out, at which time the gain or loss is realized. The Fund may lose the expected benefit of futures transactions if interest rates, exchange rates or securities prices change in an unanticipated manner. Such unanticipated changes may also result in lower overall performance than if the Fund had not entered into any futures transactions. In addition, the value of the Fund's futures positions may not prove to be perfectly or even highly correlated with the value of its portfolio securities or foreign currencies, limiting the Fund's ability to hedge effectively against interest rate, exchange rate and/or market risk and giving rise to additional risks. There is no assurance of liquidity in the secondary market for purposes of closing out futures positions. The collateral held by the Fund is presented on the Statement of Assets and Liabilities under Deposit with broker for futures contracts.
16
USAA Mutual Funds Trust | Notes to Financial Statements — continued March 31, 2020 | ||||||
As of March 31, 2020, the Fund entered into futures contracts primarily to aid in achieving the Fund's investment objective.
Summary of Derivative Instruments:
The following table summarizes the fair values of derivative instruments on the Statement of Assets and Liabilities, categorized by risk exposure, as of March 31, 2020 (amounts in thousands):
Assets | Liabilities | ||||||||||
| Variation Margin Receivable On Open Futures Contracts* | Variation Margin Payable On Open Futures Contracts* | ||||||||||
Equity Risk Exposure: | $ | 4,835 | $ | 5,511 | |||||||
* Includes cumulative appreciation/(depreciation) of futures contracts as reported on the Schedule of Portfolio Investments. Only current day's variation margin for futures contracts are reported within the Statement of Assets and Liabilities.
The following table presents the effect of derivative instruments on the Statement of Operations, categorized by risk exposure, for the year ended March 31, 2020 (amounts in thousands):
| Net Realized Gains (Losses) on Derivatives Recognized as a Result from Operations | Net Change in Unrealized Appreciation/Depreciation on Derivatives Recognized as a Result of Operations | ||||||||||
| Net Realized Gains (Losses) from Futures Contracts | Net Change in Unrealized Appreciation/Depreciation on Futures Contracts | ||||||||||
Equity Risk Exposure: | $ | 9,420 | $ | (2,360 | ) | ||||||
All open derivative positions at year end are reflected in the Fund's Schedule of Portfolio Investments. The underlying face value of open derivative positions relative to the Fund's net assets at year end is generally representative of the notional amount of open positions to net assets throughout the year.
Investment Transactions and Related Income:
Changes in holdings of investments are accounted for no later than one business day following the trade date. For financial reporting purposes, however, investment transactions are accounted for on trade date on the last business day of the reporting period. Interest income is determined on the basis of coupon interest accrued using the effective interest method which adjusts, where applicable, the amortization of premiums or accretion of discount. Gains or losses realized on sales of securities are determined by comparing the identified cost of the security lot sold with the net sales proceeds.
Securities Lending:
The Fund, through a securities lending agreement with Citibank, N.A. ("Citibank"), may lend its securities to qualified financial institutions, such as certain broker-dealers, to earn additional income, net of income retained by Citibank. Borrowers are required to secure their loans for collateral in the amount of at least 102% of the value of U.S. securities loaned or at least 105% of the value of non-U.S. securities loaned, marked-to-market daily. Any collateral shortfalls associated with increases in the valuation of the securities loaned are cured the next business day once the shortfall exceeds $100 thousand. Collateral may be cash, U.S. government securities, or other securities as permitted by SEC guidelines. Cash collateral may be invested in high-quality short-term investments, primarily open-end investment companies. Collateral requirements are determined daily based on the value of the Fund's securities on loan as of the end of the prior business day. During the time portfolio securities are on loan, the borrower will pay the Fund any dividends or interest paid on such securities plus any fee negotiated between the parties to the lending agreement. The Fund also earns a return from the collateral. The Fund pays Citibank various fees in connection with the investment of cash collateral and fees based on the investment income received from securities lending activities. Securities lending income (net of
17
USAA Mutual Funds Trust | Notes to Financial Statements — continued March 31, 2020 | ||||||
these fees) is disclosed on the Statement of Operations. Loans are terminable upon demand and the borrower must return the loaned securities within the lesser of one standard settlement period or five business days. Risks relating to securities-lending transactions include that the borrower may not provide additional collateral when required or return the securities when due, and that the value of the short-term investments will be less than the amount of cash collateral required to be returned to the borrower. The Fund's agreement with Citibank does not include master netting provisions. Non- cash collateral received by the Fund may not be sold or re-pledged except to satisfy borrower default. Cash collateral is listed in the Fund's Portfolio of Investments and Financial Statements while non-cash collateral is not included.
At March 31, 2020, the Fund had no securities on loan.
Foreign Currency Translations:
The accounting records of the Fund are maintained in U.S. dollars. Investment securities and other assets and liabilities of the Fund denominated in a foreign currency are translated into U.S. dollars at current exchange rates. Purchases and sales of securities, income receipts and expense payments are translated into U.S. dollars at the exchange rates on the date of the transactions. The Fund does not isolate the portion of the results of operations resulting from changes in foreign exchange rates on investments from fluctuations arising from changes in market prices of securities held. Such fluctuations are disclosed as net change in unrealized appreciation/depreciation on foreign currency translations on the Statement of Operations. Any realized gains or losses from these fluctuations, including foreign currency arising from in-kind redemptions, are disclosed as net realized gains or losses on foreign currency transactions on the Statement of Operations.
Federal Income Taxes:
It is the Fund's policy to continue to qualify as a regulated investment company by complying with the provisions available to certain investment companies, as defined in applicable sections of the Internal Revenue Code, and to make distributions of net investment income and net realized gains sufficient to relieve it from all, or substantially all, federal income taxes. Accordingly, no provision for federal income taxes is required in the financial statements. The Fund has a tax year end of March 31.
Management of the Fund has reviewed tax positions taken in tax years that remain subject to examination by all major tax jurisdictions, including federal (i.e., the last four tax years which includes the current fiscal tax year end). Management believes that there is no tax liability resulting from unrecognized tax benefits related to uncertain tax positions taken.
Allocations:
Expenses directly attributable to the Fund are charged to the Fund, while expenses that are attributable to more than one fund in the Trust, or jointly with an affiliated trust, are allocated among the respective funds in the Trust and/or affiliated trust based upon net assets or another appropriate basis.
3. Purchases and Sales:
Cost of purchases and proceeds from sales/maturities of securities (excluding securities maturing less than one year from acquisition) for the year ended March 31, 2020, were as follows for the Fund (amounts in thousands):
| Excluding U.S. Government Securities | |||||||||||
Purchases | Sales | ||||||||||
$ | 1,546,359 | $ | 1,567,654 | ||||||||
18
USAA Mutual Funds Trust | Notes to Financial Statements — continued March 31, 2020 | ||||||
There were no purchases and sales of U.S. government securities during the year ended March 31, 2020.
4. USAA Affiliated Fund Ownership:
The Fund offers its shares for investment by other USAA funds. The USAA fund-of-funds do not invest in the underlying funds for the purpose of exercising management or control, and the affiliated fund-of-funds' annual and semi-annual reports may be viewed at usaa.com. As of March 31, 2020, certain USAA fund-of funds owned total outstanding shares of the Fund:
Affiliated USAA Fund | Ownership % | ||||||
Cornerstone Conservative Fund | 0.8 | ||||||
Cornerstone Equity Fund | 2.6 | ||||||
USAA Target Income | 3.5 | ||||||
USAA Target 2020 | 5.8 | ||||||
USAA Target 2030 | 26.8 | ||||||
USAA Target 2040 | 35.4 | ||||||
USAA Target 2050 | 22.2 | ||||||
USAA Target 2060 | 2.9 | ||||||
5. Fees and Transactions with Affiliates and Related Parties:
Investment Advisory and Management Fees:
Effective with the Transaction on July 1, 2019, investment advisory services are provided to the Fund by the Adviser, a New York corporation registered as an investment adviser with the Securities and Exchange Commission ("SEC"). The Adviser is a wholly-owned indirect subsidiary of Victory Capital Holdings, Inc., a publicly traded Delaware corporation, and a wholly-owned direct subsidiary of Victory Capital Operating, LLC. Under the terms of the Investment Advisory Agreement, the Adviser is entitled to receive fees accrued daily and paid monthly at an annualized rate of 0.50% of the Fund's average daily net assets. The amount incurred and paid to VCM from July 1, 2019 through March 31, 2020, was $2,013 thousand and is reflected on the Statement of Operations as Investment Advisory fees.
Prior to the Transaction on July 1, 2019, AMCO provided investment management services to the Fund pursuant to an Advisory Agreement. Under this agreement, AMCO was responsible for managing the business and affairs of the Fund, and for directly managing day-to-day investment of the Fund's assets, subject to the authority of and supervision by the Board. The investment management fee for the Fund was comprised of fees accrued daily and paid monthly at an annualized rate of 0.50% of the Fund's average daily net assets. The amount incurred and paid to AMCO from April 1, 2019 through June 30, 2019, was $640 thousand and is reflected on the Statement of Operations as Investment Advisory fees.
Effective with the Transaction on July 1, 2019, the Trust relies on an exemptive order granted to VCM and its affiliated funds by the SEC in March 2019 permitting the use of a "manager-of-managers" structure for certain funds. Prior to that date, the Trust relied on a similar exemptive order granted by the SEC to the Trust and its affiliated persons. Under a manager-of-managers structure, the investment adviser may select (with approval of the Board and without shareholder approval) one or more subadvisers to manage the day-to-day investment of a fund's assets. For the year ended March 31, 2020, the Fund had no subadvisers.
Administration and Servicing Fees:
Effective with the Transaction on July 1, 2019, VCM serves as the Fund's administrator and fund accountant. Under the Fund Administration, Servicing and Accounting Agreement, VCM is paid for its services an annual fee at a rate of 0.05% of average daily net assets of the Fund. Amounts incurred from July 1, 2019 through March 31, 2020, are $201 thousand and reflected on the Statement of Operations as Administration fees.
Prior to the Transaction on July 1, 2019, AMCO provided certain administration and servicing functions for the Fund. For such services, AMCO received a fee accrued daily and paid monthly at an annualized
19
USAA Mutual Funds Trust | Notes to Financial Statements — continued March 31, 2020 | ||||||
rate of 0.05% of average daily net assets of the Fund. Amounts incurred from April 1, 2019 through June 30, 2019, were $64 thousand and reflected on the Statement of Operations as Administration fees.
Effective with the Transaction on July 1, 2019, the Fund (as part of the Trust) has entered into an agreement to provide compliance services with the Adviser, pursuant to which the Adviser furnishes its compliance personnel, including the services of the Chief Compliance Officer ("CCO"), and other resources reasonably necessary to provide the Trust with compliance oversight services related to the design, administration and oversight of a compliance program for the Trust in accordance with Rule 38a-1 under the 1940 Act. The CCO is an employee of the Adviser, which pays the compensation of the CCO and support staff. Funds in the Trust, Victory Variable Insurance Funds, Victory Portfolios and Victory Portfolios II (collectively, the "Victory Funds Complex") in the aggregate, compensate the Adviser for these services. The amount incurred during the period from July 1, 2019 through March 31, 2020, is reflected on the Statement of Operations as Compliance fees.
Effective with the Transaction on July 1, 2019, Citi Fund Services Ohio, Inc. ("Citi"), an affiliate of Citibank, acts as sub-administrator and sub-fund accountant to the Fund pursuant to a Sub- Administration and Sub-Fund Accounting Services Agreement between VCM and Citi. VCM pays Citi a fee for providing these services. The Trust reimburses VCM and Citi for all of their reasonable out-of-pocket expenses incurred in providing these services and certain other expenses specifically allocated to the Funds, under the Fund Administration, Servicing, and Accounting Agreement. The amount incurred during the period from July 1, 2019 through March 31, 2020, is reflected on the Statement of Operations as Sub-Administration fees.
In addition to the services provided under its Administration and Servicing Agreement with the Fund, AMCO also provided certain compliance and legal services for the benefit of the Fund prior to the Transaction on July 1, 2019. The Board approved the reimbursement of a portion of these expenses incurred by AMCO. Amounts reimbursed by the Fund to AMCO for these compliance and legal services are presented on the Statement of Operations as Professional fees.
Transfer Agency Fees:
Effective with the Transaction on July 1, 2019, Victory Capital Transfer Agency, Inc. ("VCTA"), (formerly USAA Shareholder Account Services ("SAS")), provides transfer agency services to the Fund. VCTA, an affiliate of the Adviser, provides transfer agent services based on a fee accrued daily at an annualized rate of 0.05% of the Fund's average daily net assets, plus out of pocket expenses. Amounts incurred and paid to VCTA from July 1, 2019 through March 31, 2020, are $201 thousand. Amounts incurred and paid to SAS during the period April 1, 2019 through June 30, 2019, are $64 thousand. These amounts are reflected on the Statement of Operations as Transfer agent fees.
Effective with the Transaction on July 1, 2019, FIS Investor Services LLC serves as sub-transfer agent and dividend disbursing agent for the Fund pursuant to a Sub-Transfer Agent agreement between VCTA and FIS Investor Services LLC. VCTA provides FIS Investor Services LLC a fee for providing these services.
Distributor/Underwriting services:
Effective with the Transaction on July 1, 2019, Victory Capital Advisers, Inc. (the "Distributor"), an affiliate of the Adviser, serves as distributor for the continuous offering of the shares of the Fund pursuant to a Distribution Agreement between the Distributor and the Trust. Effective on or about June 30, 2020, the Distributor's name will change to Victory Capital Services, Inc.
Prior to the Transaction on July 1, 2019, USAA Investment Management Company provided exclusive underwriting and distribution of the Fund's shares on a continuing best-efforts basis.
Other Fees:
Prior to the Transaction on July 1, 2019, State Street Bank and Trust Company served as the Fund's accounting agent and custodian.
Effective August 5, 2019, Citibank, N.A., serves as the Fund's custodian.
K&L Gates LLP provides legal services to the Trust.
20
USAA Mutual Funds Trust | Notes to Financial Statements — continued March 31, 2020 | ||||||
Effective with the Transaction on July 1, 2019, the Adviser has entered into an expense limitation agreement with the Fund until at least June 30, 2021. Under the terms of the agreement, the Adviser has agreed to waive fees or reimburse certain expenses to the extent that ordinary operating expenses incurred by the Fund in any fiscal year exceed the expense limit for the Fund. Such excess amounts will be the liability of the Adviser. Interest, taxes, brokerage commissions, other expenditures which are capitalized in accordance with GAAP, and other extraordinary expenses not incurred in the ordinary course of the Fund's business are excluded from the expense limit. Effective July 1, 2019 through March 31, 2020, the expense limit (excluding voluntary waivers) is 0.65%.
Under this expense limitation agreement, the Fund has agreed to repay fees and expenses that were waived or reimbursed by the Adviser for a period up to three fiscal years after such waiver or reimbursement was made to the extent such payments or repayments would not cause the expenses of the Fund to exceed the original expense limitation in place at time of the waiver or reimbursement or any expense limitation agreement in place at the time of repayment. As of March 31, 2020, there are no amounts available to be repaid to the Adviser.
The Adviser, may voluntarily waive or reimburse additional fees to assist the Fund in maintaining competitive expense ratios. Voluntary waivers and reimbursements applicable to the Fund are not available to be recouped at a future time. There were no voluntary waivers or reimbursements for the year ended March 31, 2020.
Certain officers and/or interested trustees of the Fund are also officers and/or employees of the Adviser, Administrator, Sub-Administrator, Sub-Fund Accountant, and Legal.
6. Risks:
The Fund may be subject to other risks in addition to these identified risks.
The Fund may be subject to various risks as described in the Fund's prospectus. A widespread health crisis such as a global pandemic could cause substantial market volatility, exchange trading suspensions and closures, impact the ability to complete redemptions, and affect Fund performance. For example, the novel coronavirus disease (COVID-19) has resulted in significant disruptions to global business activity that may continue, worsen and/or trigger other factors impacting the liquidity or value of investments. The impact of health crises and other epidemics and pandemics may affect the global economy in ways that cannot necessarily be foreseen at the present time. Health crises may exacerbate other pre-existing political, social, and economic risks. Any such impact could adversely affect the Funds' performance, resulting in losses to your investment. For more information, please refer to the "Principal risks" section of the Fund's prospectus.
The Fund may change the allocation of its portfolio holdings on a frequent basis, which may result in higher portfolio turnover. In purchasing and selling securities in order to reallocate the portfolio, the Fund will pay more brokerage commissions than it would without a reallocation policy. In addition, the Fund may have a higher proportion of capital gains and a potentially lower return than a fund that does not reallocate from time to time.
ETFs, which generally are registered investment companies, incur their own management and other fees and expenses, such as trustees' fees, operating expenses, registration fees, and marketing expenses, a proportionate share of which will be borne indirectly by the Fund as a shareholder in an ETF. As a result, the Fund's investment in an ETF will cause the Fund to indirectly bear the fees and expenses of the ETF and, in turn, the Fund's performance may be lower than if the Fund were to invest directly in the underlying securities held by the ETF. For investments in affiliated ETFs, the Fund's management fee is reimbursed by the Adviser to the extent of the indirect management fee incurred through the Fund's investment in the affiliated ETFs. The Adviser may have conflicts of interest in allocating assets among affiliated and unaffiliated ETFs, because the Adviser also manages and administers the affiliated ETFs, and the Adviser and its affiliates receive other fees from the affiliated ETFs. In addition, the Fund also will be subject to the risks associated with the securities or other investments held by the ETFs.
The Fund is subject to the risk that the market value of the bonds in its portfolio will fluctuate because of changes in interest rates, changes in the supply of and demand for debt securities, and other market factors. Bond prices generally are linked to the prevailing market interest rates. In general, when interest rates rise, bond prices fall; conversely, when interest rates fall, bond prices rise. The price
21
USAA Mutual Funds Trust | Notes to Financial Statements — continued March 31, 2020 | ||||||
volatility of a bond also depends on its duration. Generally, the longer the duration of a bond, the greater is its sensitivity to interest rates. To compensate investors for this higher interest rate risk, bonds with longer durations generally offer higher yields than bonds with shorter durations. Decisions by the U.S. Federal Reserve regarding interest rate and monetary policy can have a significant effect on the value of debt securities as well as the overall strength of the U.S. economy. Precise interest rate predictions are difficult to make, and interest rates may change unexpectedly and dramatically in response to extreme changes in market or economic conditions. Interest rates have been unusually low in recent years in the U.S. and abroad, and central banks have reduced rates further in an effort to combat the economic effects of the COVID-19 pandemic. Extremely low or negative interest rates may become more prevalent or may not work as intended, and the impact on various markets that interest rate or other significant policy changes may have is unknown. The ability of an issuer of a debt security to repay principal prior to a security's maturity can increase the security's sensitivity to interest rate changes.
7. Borrowing and Interfund Lending:
Line of Credit:
Effective with the Transaction on July 1, 2019, the Victory Funds Complex participates in a short-term, demand note "Line of Credit" agreement with Citibank. Under the agreement with Citibank, the Victory Funds Complex could borrow up to $600 million, of which $300 million is committed and $300 million is uncommitted. $40 million of the Line of Credit is reserved for use by the Victory Floating Rate Fund, another series of the Victory Funds Complex, with that Fund paying the related commitment fees for that amount. The purpose of the agreement is to meet temporary or emergency cash needs. Citibank receives an annual commitment fee of 0.15% on $300 million for providing the Line of Credit. Each fund in the Victory Funds Complex pays a pro-rata portion of the commitment fees plus any interest (one month LIBOR plus one percent) on amounts borrowed. Interest charged to the Fund, if any, during the period is presented on the Statement of Operations under line of credit fees.
Prior to the Transaction on July 1, 2019, the line of credit among the Trust, with respect to its funds, and USAA Capital Corporation ("CAPCO") terminated. For the period from April 1, 2019 to June 30, 2019, the Fund paid CAPCO facility fees of $1 thousand.
The Fund had no borrowings under either agreement with Citibank or CAPCO during the year ended March 31, 2020.
Interfund Lending:
Effective with the Transaction on July 1, 2019, the Trust and Adviser rely on an exemptive order granted by the SEC in March 2017 (the "Order"), permitting the establishment and operation of an Interfund Lending Facility (the "Facility"). The Facility allows the Fund to directly lend and borrow money to or from any other Fund in the Victory Fund Complex relying upon the Order at rates beneficial to both the borrowing and lending funds. Advances under the Facility are allowed for temporary or emergency purposes. The interfund loan rate is determined, as specified in the Order, by averaging the current repurchase agreement rate and the current bank loan rate. As a Borrower, interest charged to the Fund, if any, during the period is presented on the Statement of Operations under Interest expense on Interfund lending. As a Lender, interest earned by the Fund, if any, during the period is presented on the Statement of Operations under Income on Interfund lending.
22
USAA Mutual Funds Trust | Notes to Financial Statements — continued March 31, 2020 | ||||||
The average borrowing for the days outstanding and average interest rate for the Fund during the year ended March 31, 2020 were as follows (amounts in thousands):
| Borrower or Lender | Amount Outstanding at March 31, 2020 | Average Borrowing* | Days Borrowing Outstanding | Average Interest Rate* | Maximum Borrowing During the Period | ||||||||||||||||||
| Borrower | $ | — | $ | 33,380 | 8 | 1.54 | % | $ | 52,102 | ||||||||||||||
* For the six months ended March 31, 2020, based on the number of days borrowings were outstanding.
8. Federal Income Tax Information:
The Fund intends to declare and distribute any net investment income annually. Distributable net realized gains, if any, are declared and paid at least annually.
The amounts of dividends from net investment income and distributions from net realized gains (collectively distributions to shareholders) are determined in accordance with federal income tax regulations, which may differ from GAAP. To the extent these "book/tax" differences are permanent in nature (e.g., net operating loss and distribution reclassification), such amounts are reclassified within the components of net assets based on their federal tax-basis treatment; temporary differences (e.g., wash sales) do not require reclassification. To the extent dividends and distributions exceed net investment income and net realized gains for tax purposes, they are reported as distributions of capital. Net investment losses incurred by the Fund may be reclassified as an offset to capital on the accompanying Statement of Assets and Liabilities.
As of March 31, 2020 on the Statement of Assets and Liabilities, there were no permanent book-to-tax difference reclassification adjustments.
The tax character of distributions paid during the tax years ended as noted below were as follows (total distributions paid may differ from the Statement of Changes in Net Assets because, for tax purposes, dividends are recognized when actually paid) (amounts in thousands):
Year Ended March 31, 2020 | Year Ended March 31, 2019 | ||||||||||||||||||||||||||
Distributions Paid From | Distributions Paid From | ||||||||||||||||||||||||||
| Ordinary Income | Net Long-Term Capital Gains | Total Distributions Paid | Ordinary Income | Net Long-Term Capital Gains | Total Distributions Paid | ||||||||||||||||||||||
$ | 24,166 | $ | 1,771 | $ | 25,937 | $ | 9,983 | $ | 35,402 | $ | 45,385 | ||||||||||||||||
As of the tax year ended March 31, 2020, the components of accumulated earnings (deficit) on a tax basis were as follows (amounts in thousands):
| Undistributed Long-Term Capital Gains | Qualified Late-Year Losses* | Unrealized Appreciation (Depreciation)** | Total Accumulated Earnings (Deficit) | ||||||||||||||||
$ | 4,798 | $ | (2,229 | ) | $ | (42,425 | ) | $ | (39,856 | ) | |||||||||
* Qualified late-year losses are comprised of post-October capital losses incurred after October 31 and certain late-year ordinary losses. Late-year ordinary losses represent ordinary losses incurred after December 31 and specified losses incurred after October 31. These losses are deemed to arise on the first day of the Fund's next taxable year.
** The difference between the book-basis and tax-basis of unrealized appreciation/depreciation is attributable to the tax deferral of losses on wash sales.
23
USAA Mutual Funds Trust | Notes to Financial Statements — continued March 31, 2020 | ||||||
As of the tax year ended March 31, 2020, the Fund had no net capital loss carryforwards for federal income tax purposes.
As of March 31, 2020, the cost basis for federal income tax purposes, gross unrealized appreciation, gross unrealized depreciation, and net unrealized appreciation (depreciation) for investments were as follows (amounts in thousands):
| Cost of Investments for Federal Tax Purposes | Gross Unrealized Appreciation | Gross Unrealized Depreciation | Net Unrealized Appreciation (Depreciation) | ||||||||||||||||
$ | 470,364 | $ | 8,912 | $ | (48,562 | ) | $ | (39,650 | ) | ||||||||||
9. Liquidity Risk Management Program:
The USAA Funds have adopted and implemented a written liquidity risk management program (the "LRMP") as required by Rule 22e-4 under the Investment Company Act of 1940, as amended. The LRMP is reasonably designed to assess and manage the Fund's liquidity risk, taking into consideration the Fund's investment strategy and the liquidity of its portfolio investments during normal and reasonably foreseeable stressed market conditions; its short and long-term cash flow projections; and its cash holdings and access to other liquidity management tools such as available funding sources including the Victory Funds Complex Interfund Lending Facility and Line of Credit (discussed in the Notes to Financial Statements). The USAA Funds' Board of Trustees approved the appointment of the Fund's investment adviser, Victory Capital Management Inc. ("Victory Capital"), as the administrator of the LRMP. At an in-person meeting held on February 26, 2020, Victory Capital provided an oral and written report to the Trustees on the operation and effectiveness of the LRMP during the previous year.
Victory Capital manages liquidity risks associated with the Fund's investments by monitoring, among other things, cash and cash equivalents, any use of derivatives, the concentration of investments, the appropriateness of the Fund's investment strategy, and by classifying every fund investment as either highly liquid, moderately liquid, less liquid or illiquid on at least a monthly basis. To assist with the classification of Fund investments, Victory Capital has retained a third-party provider of liquidity evaluation services. This provider determines preliminary liquidity classifications for all portfolio holdings based upon portfolio-level data and certain assumptions provided by Victory Capital. Victory Capital reviews the preliminary liquidity classifications, and, when appropriate, considers other information including input from the Fund's portfolio managers (including the portfolio managers employed by any investment sub-advisers) in determining final liquidity classifications.
The report from Victory Capital concluded that the Fund did not experience any significant liquidity challenges during the covered period, and the Fund's LRMP is reasonably designed to assess and manage its liquidity risk. The report also concluded that the LRMP continues to operate adequately and effectively to enable Victory Capital to oversee and manage liquidity risk and ensure the Fund is able to meet redemption requests without significant dilution to the remaining investors' interest in the Fund. During the review period, the Fund's portfolio consisted primarily of highly liquid investments, which are defined as cash and any investments reasonably expected to be converted to cash in current market conditions in three business days or less without significantly changing the market value of the investment. Therefore, the Fund has not adopted a Highly Liquid Investment Minimum. The Fund's investments were below the limitation on illiquid investments during the review period. Additionally, Victory Capital indicated that no events occurred that would require the filing of Form N-LIQUID and recommended no material changes to the LRMP.
10. Subsequent Events:
An outbreak of respiratory disease called COVID-19 was first detected in China in December 2019 and subsequently spread internationally. The transmission of COVID-19 and efforts to contain its spread have resulted in international, national and local border closings and other significant travel restrictions and disruptions, significant disruptions to business operations, supply chains and consumer activity,
24
USAA Mutual Funds Trust | Notes to Financial Statements — continued March 31, 2020 | ||||||
significant challenges in healthcare service preparation and delivery, and quarantines, as well as general concern and uncertainty that has negatively affected the economic environment and that occurred subsequent to year end may have a significant negative impact on the operations and profitability of the Funds' investments. These impacts have caused significant volatility and declines in global financial markets, which have caused losses for investors. The impact of the COVID-19 pandemic may be short term or may last for an extended period of time, and in either case could result in a substantial economic downturn or recession. Public health crises may exacerbate other pre-existing political, social, economic, market and financial risks. The extent of the impact to the financial performance of the Funds' investments will depend on future developments, including (i) the duration and spread of the outbreak, (ii) the restrictions and advisories, (iii) the effects on the financial markets, and (iv) the effects on the economy overall, all of which are highly uncertain and cannot be predicted.
25
REPORT OF INDEPENDENT REGISTERED PUBLIC ACCOUNTING FIRM
To the Shareholders and the Board of Trustees of USAA Target Managed Allocation Fund:
Opinion on the Financial Statements
We have audited the accompanying statement of assets and liabilities of USAA Target Managed Allocation Fund (the "Fund") (one of the funds constituting USAA Mutual Funds Trust (the "Trust")), including the schedule of portfolio investments, as of March 31, 2020, and the related statement of operations for the year then ended, the statements of changes in net assets for each of the two years in the period then ended, the financial highlights for each of the four years in the period then ended and the period from August 7, 2015 (commencement of operations) through March 31, 2016 and the related notes (collectively referred to as the "financial statements"). In our opinion, the financial statements present fairly, in all material respects, the financial position of the Fund (one of the funds constituting USAA Mutual Funds Trust) at March 31, 2020, the results of its operations for the year then ended, the changes in its net assets for each of the two years in the period then ended and its financial highlights for each of the four years in the period then ended and the period from August 7, 2015 (commencement of operations) through March 31, 2016, in conformity with U.S. generally accepted accounting principles.
Basis for Opinion
These financial statements are the responsibility of the Trust's management. Our responsibility is to express an opinion on the Fund's financial statements based on our audits. We are a public accounting firm registered with the Public Company Accounting Oversight Board (United States) ("PCAOB") and are required to be independent with respect to the Trust in accordance with the U.S. federal securities laws and the applicable rules and regulations of the Securities and Exchange Commission and the PCAOB.
We conducted our audits in accordance with the standards of the PCAOB. Those standards require that we plan and perform the audit to obtain reasonable assurance about whether the financial statements are free of material misstatement, whether due to error or fraud. The Trust is not required to have, nor were we engaged to perform, an audit of the Trust's internal control over financial reporting. As part of our audits we are required to obtain an understanding of internal control over financial reporting, but not for the purpose of expressing an opinion on the effectiveness of the Trust's internal control over financial reporting. Accordingly, we express no such opinion.
Our audits included performing procedures to assess the risks of material misstatement of the financial statements, whether due to error or fraud, and performing procedures that respond to those risks. Such procedures included examining, on a test basis, evidence regarding the amounts and disclosures in the financial statements. Our procedures included confirmation of securities owned as of March 31, 2020, by correspondence with the custodian. Our audits also included evaluating the accounting principles used and significant estimates made by management, as well as evaluating the overall presentation of the financial statements. We believe that our audits provide a reasonable basis for our opinion.

We have served as the auditor of one or more Victory Capital investment companies since 1995.
San Antonio, Texas
May 27, 2020
26
USAA Mutual Funds Trust | Supplemental Information March 31, 2020 | ||||||
(Unaudited)
Expense Examples
As a shareholder of the Fund, you may incur two types of costs: (1) transaction costs, and (2) ongoing costs, including management fees and other Fund expenses. These examples are intended to help you understand your ongoing costs (in dollars) of investing in the Fund and to compare these costs with the ongoing costs of investing in other mutual funds.
These examples are based on an investment of $1,000 invested at the beginning of the period and held for the entire period from October 1, 2019, through March 31, 2020.
The Actual Expense figures in the table below provide information about actual account values and actual expenses. You may use the information below, together with the amount you invested, to estimate the expenses that you paid over the period. Simply divide your account value by $1,000 (for example, an $8,600 account value divided by $1,000 = 8.6), then multiply the result by the number in the table under the heading entitled "Actual Expenses Paid During Period" to estimate the expenses you paid on your account during this period
The Hypothetical Expense figures in the table below provide information about hypothetical account values and hypothetical expenses based on the Fund's actual expense ratio and an assumed rate of return of 5% per year before expenses, which is not the Fund's actual return. The hypothetical account values and expenses may not be used to estimate the actual ending account balance or expenses you paid for the period. You may use this information to compare this 5% hypothetical example with the 5% hypothetical examples that appear in shareholder reports of other funds.
Please note the expenses shown in the table below are meant to highlight your ongoing costs only and do not reflect any transactional costs. If these transactional costs were included, your costs would have been higher.
| Beginning Account Value 10/1/19 | Actual Ending Account Value 3/31/20 | Hypothetical Ending Account Value 3/31/20 | Actual Expenses Paid During Period 10/1/19- 3/31/20* | Hypothetical Expenses Paid During Period 10/1/19- 3/31/20* | Annualized Expense Ratio During Period 10/1/19- 3/31/20 | ||||||||||||||||||
| $ | 1,000.00 | $ | 868.10 | $ | 1,021.80 | $ | 2.99 | $ | 3.23 | 0.64 | % | ||||||||||||
* Expenses are equal to the average account value multiplied by the Fund's annualized expense ratio multiplied by 183/366 (the number of days in the most recent fiscal half-year divided by the number of days in the fiscal year).
Proxy Voting and Portfolio Holdings Information
Proxy Voting:
Information regarding the policies and procedures the Fund uses to determine how to vote proxies relating to portfolio securities is available without charge, upon request, by calling (800) 539-3863. The information is also included in the Fund's Statement of Additional Information, which is available on the SEC's website at www.sec.gov.
Information relating to how the Fund voted proxies relating to portfolio securities held during the most recent 12 months ended June 30 is available on the SEC's website at www.sec.gov.
Availability of Schedules of Portfolio Investments:
The Trust files a complete list of Schedules of Portfolio Investments with the SEC for the first and third quarter of each fiscal year on Form N-PORT. Forms N-PORT are available on the SEC's web site at www.sec.gov.
27
USAA Mutual Funds Trust | Supplemental Information — continued March 31, 2020 | ||||||
(Unaudited)
Trustee and Officer Information
Board of Trustees:
Overall responsibility for management of the Trust rests with the Board. The Trust is managed by the Board in accordance with the laws of the state of Delaware. There are currently 10 Trustees, eight of whom are not "interested persons" of the Trust within the meaning of that term under the 1940 Act ("Independent Trustees") and two of whom is an "interested person" of the Trust within the meaning of that term under the 1940 Act ("Interested Trustee"). The Trustees, in turn, elect the officers of the Trust to actively supervise its day-to-day operations.
The following tables list the Trustees, their ages, position with the Trust, commencement of service, principal occupations during the past five years and any directorships of other investment companies or companies whose securities are registered under the Securities Exchange Act of 1934, as amended, or who file reports under that Act. Each Trustee oversees 47 portfolios in the Trust. Each Trustee's address is 15935 La Cantera Pkwy, Building Two, San Antonio, TX, 78256. Pursuant to a policy adopted by the Board, the term of office for each Trustee shall be until the Independent Trustee reaches age 75 or an Interested Trustee reaches age 75. The Board may change or grant exceptions from this policy at any time without shareholder approval. A Trustee may resign or be removed by a vote of the other Trustees or the holders of a majority of the outstanding shares of the Trust at any time. Vacancies on the Board can be filled by the action of a majority of the Trustees, provided that after filling such vacancy at least two-thirds of the Trustees have been elected by the shareholders.
Name and Date of Birth | Position Held with the Trust | Year Commenced Service | Principal Occupation During Past 5 Years | Other Directorships Held During Past 5 Years | |||||||||||||||
Independent Trustees. | |||||||||||||||||||
| Jefferson C. Boyce, Born September 1957 | Lead Independent Trustee, and Vice Chairman | 2013 | Senior Managing Director, New York Life Investments, LLC (1992-2012) | Westhab, Inc. | |||||||||||||||
| John C. Walters, Born February 1962 | Trustee | 2019 | Retired. Mr. Walters brings significant Board experience including active involvement with the board of a Fortune 500 company, and a proven record of leading large, complex financial organizations. He has a demonstrated record of success in distribution, manufacturing, investment brokerage, and investment management in both the retail and institutional investment businesses. He has substantial experience in the investment management business with a demonstrated ability to develop and drive strategy while managing operation, financial, and investment risk. | Guardian Variable Products Trust (16 series), Lead Independent Director; Amerilife Holdings LLC, Director; Stadion Money Management; Director; University of North Carolina (Chapel Hill), Member Board of Governors. | |||||||||||||||
28
USAA Mutual Funds Trust | Supplemental Information — continued March 31, 2020 | ||||||
(Unaudited)
Name and Date of Birth | Position Held with the Trust | Year Commenced Service | Principal Occupation During Past 5 Years | Other Directorships Held During Past 5 Years | |||||||||||||||
| Robert L. Mason, Ph.D., Born July 1946 | Trustee | 1997 | Adjunct Professor in the Department of Management Science and Statistics in the College of Business at the University of Texas at San Antonio (since 2001); Institute Analyst, Southwest Research Institute (March 2002-January 2016) | None | |||||||||||||||
| Dawn M. Hawley, Born February 1954 | Trustee | 2014 | Manager of Finance, Menil Foundation, Inc. (May 2007-June 2011), which is a private foundation that oversees the assemblage of sculptures, prints, drawings, photographs, and rare books. Director of Financial Planning and Analysis and Chief Financial Officer, AIM Management Group, Inc. (October 1987-January 2006) | None | |||||||||||||||
| Paul L. McNamara, Born July 1948 | Trustee | 2012 | Director, Cantor Opportunistic Alternatives Fund, LLC (March 2010-February 2014) , which is a closed-end fund of funds by Cantor Fitzgerald Investment Advisors, LLC | None | |||||||||||||||
29
USAA Mutual Funds Trust | Supplemental Information — continued March 31, 2020 | ||||||
(Unaudited)
Name and Date of Birth | Position Held with the Trust | Year Commenced Service | Principal Occupation During Past 5 Years | Other Directorships Held During Past 5 Years | |||||||||||||||
| Richard Y. Newton III, Born January 1956 | Trustee | 2017 | Director, Elta North America (01/18-present), which is a global leader in the design, manufacture, and support of innovative electronic systems in the ground, maritime, airborne, and security domains for the nation's warfighters, security personnel, and first responders; Managing Partner, Pioneer Partnership Development Group (December 2015-present)); Executive Director, The Union League Club of New York (June 2014-November 2015): Executive Vice President, Air Force Association (August 2012-May 2014); Lieutenant General, United States Air Force (January 2008-June 2012) | None | |||||||||||||||
| Barbara B. Ostdiek, Ph.D., Born March 1964 | Trustee | 2008 | Senior Associate Dean of Degree Programs at Jesse H. Jones Graduate School of Business at Rice University (since 2013); Associate Professor of Finance at Jessie H. Jones Graduate School of Business at Rice University (since 2001) | None | |||||||||||||||
| Michael F. Reimherr, Born August 1945 | Trustee | 2000 | President of Reimherr Business Consulting (May 1995-December 2017); St. Mary's University Investment Committee overseeing University Endowment (since 2014) | None | |||||||||||||||
30
USAA Mutual Funds Trust | Supplemental Information — continued March 31, 2020 | ||||||
(Unaudited)
Name and Date of Birth | Position Held with the Trust | Year Commenced Service | Principal Occupation During Past 5 Years | Other Directorships Held During Past 5 Years | |||||||||||||||
Interested Trustees. | |||||||||||||||||||
| David C. Brown, ** Born May 1972 | Trustee | 2019 | Chairman and Chief Executive Officer (since 2013), Co-Chief Executive Officer (2011-2013), Victory Capital Management Inc.; Chairman and Chief Executive Officer, Victory Capital Holdings, Inc. (since 2013). Mr. Brown brings to the Board extensive business, finance and leadership skills gained and developed through years of experience in the financial services industry, including his tenure overseeing the strategic direction as CEO of Victory Capital. These skills, combined with Mr. Brown's extensive knowledge of the financial services industry and demonstrated success in the development and distribution of investment strategies and products, enable him to provide valuable insights to the Board and strategic direction for the Funds | Trustee, Victory Portfolios (42 series), Victory Portfolios II (26 series), Victory Variable Insurance Funds (9 series) | |||||||||||||||
31
USAA Mutual Funds Trust | Supplemental Information — continued March 31, 2020 | ||||||
(Unaudited)
Name and Date of Birth | Position Held with the Trust | Year Commenced Service | Principal Occupation During Past 5 Years | Other Directorships Held During Past 5 Years | |||||||||||||||
| Daniel S. McNamara, ** Born June 1966 | Trustee and Chair of the Board of Trustees | 2012 | Trustee, President, and Vice Chairman of USAA ETF Trust (June 2017-June 2019); President of Financial Advice & Solutions Group (FASG), USAA (since 2013); Director, IMCO (September 2009-April 2014); President, AMCO (August, 2011-April 2013); Senior Vice President of USAA Financial Planning Services Insurance Agency, Inc. (FPS) (since 2011); Director of USAA Investment Management Company (IMCO) (since 2009); Chairman of Board of IMCO (since 2013); Director of USAA Asset Management Company (AMCO), (August 2011-June 2019); President and Director of USAA Shareholder Account Services (SAS)(October 2009-June 2019); Director and Vice Chairman of FPS (since 2013); President and Director of USAA Investment Corporation (ICORP) (since 2010); Chairman of Board of ICORP (since 2013); Director of USAA Financial Advisors, Inc. (FAI) (since 2013); Chairman of Board of FAI (since 2015). Mr. McNamara brings to the Board extensive experience in the financial services industry, including experience as an officer of the Trust. | None | |||||||||||||||
** Mr. McNamara and Mr. Brown are "Interested Persons" by reason of their relationships with the Adviser.
The Statement of Additional Information includes additional information about the Trustees of the Trust and is available, without charge, on the SEC's website at www.sec.gov and/or by calling (800)-539-3863.
32
USAA Mutual Funds Trust | Supplemental Information — continued March 31, 2020 | ||||||
(Unaudited)
Officers:
The officers of the Trust, their ages, commencement of service and their principal occupations during the past five years, are detailed in the following table. Each officer serves until the earlier of his or her resignation, removal, retirement, death, or the election of a successor. The mailing address of each officer of the Trust is 15935 La Cantera Pkwy, Building Two, San Antonio, TX, 78256. The officers of the Trust receive no compensation directly from the Trust for performing the duties of their offices.
Name and Date of Birth | Position with the Trust | Year Commenced Service | Principal Occupation During Past 5 Years | ||||||||||||
Interested Officers. | |||||||||||||||
| Christopher K. Dyer, Born February 1962 | President | 2019 | Director of Fund Administration, Victory Capital (2004-present) | ||||||||||||
| Scott A Stahorsky, Born July 1969 | Vice President | 2019 | Manager, Fund Administration, Victory Capital (since 2015); Senior Analyst, Fund Administration, Victory Capital (prior to 2015) | ||||||||||||
| James K. De Vries, Born April 1969 | Treasurer, Principal Financial Officer | 2018 | Executive Director, Victory Capital Management Inc. (since 2019); Treasurer, USAA ETF Trust (September 2018-June 2019); Executive Director, Investment and Financial Administration, USAA (April 2012-June 2019); Assistant Treasurer, USAA ETF Trust (June 2017-September 2018); Assistant Treasurer, USAA Mutual Funds Trust (December 2013-February 2018) | ||||||||||||
| Allan Shaer, Born March 1965 | Assistant Treasurer | 2019 | Senior Vice President, Financial Administration, Citi Fund Services Ohio, Inc. (since 2016); Vice President, Mutual Fund Administration, JP Morgan Chase (2011-2016) | ||||||||||||
| Carol D. Trevino, Born October 1965 | Assistant Treasurer | 2018 | Director, Accounting and Finance, Victory Capital Management Inc. (since 2019); Accounting/Financial Director, USAA (December 2013-June 2019); Assistant Treasurer, USAA ETF Trust (September 2018-June 2019). | ||||||||||||
| Erin G. Wagner, Born February 1974 | Secretary | 2019 | Deputy General Counsel, the Adviser (since 2013) | ||||||||||||
| Charles Booth, Born April 1960 | Anti-Money Laundering Compliance Officer and Identity Theft Officer | 2019 | Director, Regulatory Administration and CCO Support Services, Citi Fund Services Ohio, Inc. (2007-Present). | ||||||||||||
| Amy Campos, Born July 1976 | Chief Compliance Officer | 2019 | Chief Compliance Officer, USAA Mutual Funds Trust (since 2019); Executive Director, Deputy Chief Compliance Officer, USAA Mutual Funds Trust and USAA ETF Trust (July 2017-June 2019); Compliance Director, USAA Mutual Funds Trust (2014-July 2017) | ||||||||||||
33
USAA Mutual Funds Trust | Supplemental Information — continued March 31, 2020 | ||||||
(Unaudited)
Additional Federal Income Tax Information
The following federal tax information related to the Fund's fiscal year ended March 31, 2020, is provided for information purposes only and should not be used for reporting to federal or state revenue agencies. Federal tax information for the calendar year will be reported to you on Form 1099-DIV in January 2021.
With respect to distributions paid, the Fund designates the following amounts (or, if subsequently determined to be different, the maximum amount allowable) for the fiscal year ended March 31, 2020 (amounts in thousands):
| Dividend Received Deduction (corporate shareholders)(1) | Short-Term Capital Gain Distributions(2) | Long-Term Capital Gain Distributions(2) | |||||||||||||
1.51 | % | $ | 11,106 | $ | 1,771 | ||||||||||
(1) Presented as a percentage of net investment income.
(2) Pursuant to Section 852 of the Internal Revenue Code.
34
Privacy Policy
Protecting the Privacy of Information
The Trust respects your right to privacy. We also know that you expect us to conduct and process your business in an accurate and efficient manner. To do so, we must collect and maintain certain personal information about you. This is the information we collect from you on applications or other forms, and from the transactions you make with us or third parties. It may include your name, address, social security number, account transactions and balances, and information about investment goals and risk tolerance.
We do not disclose any information about you or about former customers to anyone except as permitted or required by law. Specifically, we may disclose the information we collect to companies that perform services on our behalf, such as the transfer agent that processes shareholder accounts and printers and mailers that assist us in the distribution of investor materials. We may also disclose this information to companies that perform marketing services on our behalf. This allows us to continue to offer you Victory investment products and services that meet your investing needs, and to effect transactions that you request or authorize. These companies will use this information only in connection with the services for which we hired them. They are not permitted to use or share this information for any other purpose.
To protect your personal information internally, we permit access only by authorized employees and maintain physical, electronic and procedural safeguards to guard your personal information.*
* You may have received communications regarding information about privacy policies from other financial institutions which gave you the opportunity to "opt-out" of certain information sharing with companies which are not affiliated with that financial institution. The Trust does not share information with other companies for purposes of marketing solicitations for products other than the Trust. Therefore, the Trust does not provide opt-out options to their shareholders.
15935 La Cantera Pkwy
Building Two
San Antonio, Texas 78256

Visit our website at: | Call | ||||||
usaa.com | (800) 235-8396 | ||||||
98358-0520

MARCH 31, 2020
Annual Report
USAA Tax Exempt Intermediate-Term Fund
Beginning January 1, 2021, as permitted by regulations adopted by the Securities and Exchange Commission, paper copies of the Fund's shareholder reports like this one will no longer be sent by mail, unless you specifically request paper copies of the reports from the Fund or from your financial intermediary, such as a broker-dealer or bank. Instead, the reports will be made available on usaa.com, and you will be notified by mail each time a report is posted and provided with a website link to access the report.
If you already elected to receive shareholder reports electronically, you will not be affected by this change and you need not take any action. You may elect to receive shareholder reports and other communications from the Fund or your financial intermediary electronically by notifying your financial intermediary directly, or if you are a direct investor, by calling (800) 235-8396 or logging on to usaa.com.
You may elect to receive all future reports in paper free of charge. You can inform the Fund or your financial intermediary that you wish to continue receiving paper copies of your shareholder reports by notifying your financial intermediary directly, or if you are a direct investor, by calling (800) 235-8396 or logging on to usaa.com. Your election to receive reports in paper will apply to all funds held with the USAA family of funds or your financial intermediary.
Victory Capital means Victory Capital Management Inc., the investment adviser of the USAA Mutual Funds. USAA Mutual Funds are distributed by Victory Capital Services, Inc., member FINRA, an affiliate of Victory Capital. Victory Capital and its affiliates are not affiliated with United Services Automobile Association or its affiliates. USAA and the USAA logo are registered trademarks and the USAA Mutual Funds and USAA Investments logos are trademarks of United Services Automobile Association and is being used by Victory Capital and its affiliates under license.
USAA Mutual Funds Trust
TABLE OF CONTENTS
Shareholder Letter (Unaudited) | 2 | ||||||
Managers' Commentary (Unaudited) | 4 | ||||||
Investment Overview (Unaudited) | 6 | ||||||
| Investment Objective & Portfolio Holdings (Unaudited) | 8 | ||||||
Financial Statements | |||||||
Schedule of Portfolio Investments | 10 | ||||||
Statement of Assets and Liabilities | 45 | ||||||
Statement of Operations | 46 | ||||||
Statements of Changes in Net Assets | 47 | ||||||
Financial Highlights | 48 | ||||||
Notes to Financial Statements | 50 | ||||||
| Report of Independent Registered Public Accounting Firm | 61 | ||||||
Supplemental Information (Unaudited) | 62 | ||||||
Expense Example | 62 | ||||||
Proxy Voting and Portfolio Holdings Information | 62 | ||||||
Trustees' and Officers' Information | 63 | ||||||
Additional Federal Income Tax Information | 69 | ||||||
Privacy Policy (inside back cover) | |||||||
This report is for the information of the shareholders and others who have received a copy of the currently effective prospectus of the Fund, managed by Victory Capital Management Inc. It may be used as sales literature only when preceded or accompanied by a current prospectus, which provides further details about the Fund.
IRA DISTRIBUTION WITHHOLDING DISCLOSURE
We generally must withhold federal income tax at a rate of 10% of the taxable portion of your distribution and, if you live in a state that requires state income tax withholding, at your state's tax rate. However, you may elect not to have withholding apply or to have income tax withheld at a higher rate. Any withholding election that you make will apply to any subsequent distribution unless and until you change or revoke the election. If you wish to make a withholding election, or change or revoke a prior withholding election, call (800) 235-8396.
If you do not have a withholding election in place by the date of a distribution, federal income tax will be withheld from the taxable portion of your distribution at a rate of 10%. If you must pay estimated taxes, you may be subject to estimated tax penalties if your estimated tax payments are not sufficient and sufficient tax is not withheld from your distribution.
For more specific information, please consult your tax adviser.
1
(Unaudited)
Dear Shareholder,
If there were ever a time that illustrated the dynamic and unpredictable nature of financial markets—and life in general—it would be the strange days of early 2020. The spread of COVID-19 throughout the United States and the world has been an unprecedented event that, among so many other impacts, rendered virtually any economic forecasts unreliable. Seemingly overnight, the sentiment pendulum swung from risk-on to risk-off. We all became familiar with unusual concepts like "social distancing" and "flattening the curve."
Given that wide swaths of the global economy came to an all-stop—an event that has no real precedent—there remains tremendous uncertainty as to the depth and extent of the economic downturn. Making assumptions about the extent of the virus' reach, its impact on consumer behavior and employment, and the speed at which the U.S. government and U.S. Federal Reserve (the "Fed") can revive the economy is educated guesswork at best.
Fortunately, it's not all bad news. We did see markets stabilize as this annual reporting period drew to a close (and in the early weeks of April immediately following). As of the writing of this letter, the array of new lending facilities and programs launched by the Fed generally appear to have had their intended effect of improving liquidity and trading, at least in the short-term. Credit spreads across corporate, high-yield, structured, and municipal bond markets were coaxed down from their highs. Trading in equity markets also appeared to stabilize.
The USAA tax-exempt funds generally performed as would be expected given the unusual market environment. Our tax-exempt funds tend to be more credit heavy, holding more BBB-category rated bonds than the average in our peer groups. Typically, we overweight these credits to provide additional tax-free income to our investors, and these securities tend to underperform in periods of market dislocation when credit spreads widen significantly.
We believe that the volatility in the tax-exempt market reflected the lack of liquidity, rather than any significant credit deterioration. It's important to underscore that the USAA tax-exempt funds entered the crisis with ample liquidity and none have yet had to sell portfolio securities at an inopportune price to achieve a fund's desired level of exposure.
Looking ahead, the economy and the markets remain unpredictable. Yet our investment philosophy—and our resolve—is steadfast. A priority of our fixed-income portfolio managers and analysts is to maintain substantial liquidity, as no one can predict when the crisis will abate and what liquidity needs might be in the meantime.
Through it all, we remain committed to our core competency of evaluating, taking and managing credit risk, and we continue to build portfolios bond-by-bond. We believe the recent environment, though breathtaking in its volatility, provides extraordinary buying opportunities that may help us lock in higher tax-free yields for our investors.
2
If you have questions about the current market dynamics or your specific portfolio or investment plan, please give one of our financial representatives a call. They can help ensure that you are properly diversified based on your long-term goals, time horizon, and risk tolerance.
From all of us here at USAA Funds, thank you for letting us help you work toward your investment goals.

Christopher K. Dyer, CFA
President,
USAA Funds
3
USAA Mutual Funds Trust
USAA Tax Exempt Intermediate-Term Fund
Manager's Commentary
(Unaudited)
Regina G. Conklin, CPA, CFA
John C. Bonnell, CFA
Andrew R. Hattman, CFA, CAIA
• What were the market conditions during the reporting period?
Tax-exempt bonds generated positive returns during the reporting period ended March 31, 2020, due in part to falling municipal bond yields. (Bond prices and yields move in opposite directions.) However, market conditions changed drastically during the reporting period.
For the first approximate 11 months of the reporting period, tax-exempt bonds generated strong positive returns. In the second half of calendar year 2019, due to intensifying U.S.-China trade tensions and global economic weakness, the U.S. Federal Reserve (the "Fed") cut the target federal funds rate from a range of 2.25% — 2.50% to a target range of 1.50% — 1.75%. Municipal bond AAA rates followed suit by generally falling for the majority of the reporting period, reaching their lows on March 9, 2020. Tax-exempt bonds also benefited from supply-and-demand dynamics during the first approximate 11 months of the reporting period. Supply was tight, as new issuance failed to keep pace with demand. Demand was intense, as municipal bond mutual funds saw inflows every week during the reporting period up to early March. In late February and early March, as the emergence of a novel coronavirus ("COVID-19") raised fears about a potential U.S. economic slowdown, municipal bonds held up well compared to other segments of the fixed income market.
That all changed on March 10, 2020. For the next 10 days, interest rates rose quickly and significantly along the municipal yield curve amid record outflows from municipal bond mutual funds. The trend reversed on March 20, and municipal bond yields fell sharply, finishing the reporting period below their starting points. Over this period, the 10-year AAA municipal bond rate started at 0.81% on March 9, rose to 2.88% on March 20, and fell to 1.44% on March 31 (after starting the reporting period at 1.91% on April 1, 2019). Municipal bond credit spreads (yield differentials between municipal bonds with similar maturities but different credit ratings) widened in March 2020, with spreads on lower-rated municipal securities widening the most. Rating agencies placed entire municipal bond sectors on credit watch because of a potential economic slowdown driven by the shutdowns, lockdowns, and self-quarantines that had been instituted to slow the spread of COVID-19. The Fed responded with unprecedented actions, slashing the target federal funds rate to a range of between zero and 0.25%, implementing quantitative easing and credit support programs, and offering assistance to state and municipal governments. The Fed also has said it will do what it takes to keep financial markets — including the municipal bond market — fully functioning.
4
USAA Mutual Funds Trust
USAA Tax Exempt Intermediate-Term Fund (continued)
• How did the USAA Tax Exempt Intermediate-Term Fund (the "Fund") perform during the reporting period?
The Fund has two share classes: Fund Shares and Adviser Shares. For the reporting period ended March 31, 2020, the Fund Shares and Adviser Shares had a total return of 2.56% and 2.37%, respectively, versus an average return of 2.13% amongst the funds in the Lipper Intermediate Municipal Debt Funds category. This compares to returns of 2.56% for the Lipper Intermediate Municipal Debt Funds Index, and 3.31% for the Bloomberg Barclays Municipal 1-15 Years Blend. The Fund Shares' and Adviser Shares' tax-exempt distributions over the reporting period produced a dividend yield of 2.89% and 2.62%, respectively, compared to the Lipper category average of 2.30%.
• What strategies did you employ during the reporting period?
In keeping with our investment approach, we continued to focus on income generation. The Fund's long-term income distribution, not its price appreciation, accounts for most of its total return. Because of the Fund's income orientation, it has a higher allocation to BBB and A rated categories when compared to its peer group.
Our commitment to independent credit research continued to help us identify attractive opportunities for the Fund. We employ fundamental analysis that emphasizes an issuer's ability and willingness to repay its debt. Through our credit research, we strive both to recognize relative value and to avoid potential pitfalls, which is especially important in volatile times like the present. As always, we worked with our in-house team of analysts to select investments for the Fund on a bond-by-bond basis. Our team continuously monitors all the holdings in the Fund's portfolio.
The Fund continues to hold a diversified portfolio of longer-term, primarily investment-grade municipal bonds. To limit exposure to an unexpected event, the Fund is diversified by sector, issuer, and geography. In addition, we avoid bonds subject to the federal alternative minimum tax for individuals.
Thank you for allowing us to assist you with your investment needs.
5
USAA Mutual Funds Trust
USAA Tax Exempt Intermediate-Term Fund
Investment Overview
(Unaudited)
Average Annual Total Return
Year Ended March 31, 2020
Fund Shares | Adviser Shares | ||||||||||||||||||
INCEPTION DATE | 3/19/82 | 8/1/10 | |||||||||||||||||
Net Asset Value | Net Asset Value | Bloomberg Barclays 1-15 Years Municipal Blend Index1 | Lipper Intermediate Municipal Debt Funds Index2 | ||||||||||||||||
One Year | 2.56 | % | 2.37 | % | 3.31 | % | 2.56 | % | |||||||||||
Five Year | 2.73 | % | 2.48 | % | 2.74 | % | 2.45 | % | |||||||||||
Ten Year | 3.91 | % | NA | 3.51 | % | 3.29 | % | ||||||||||||
Since Inception | NA | 3.46 | % | NA | NA | ||||||||||||||
Past performance is not indicative of future results. The performance data quoted represents past performance and current returns may be lower or higher. The investment return and principal value will fluctuate so that an investor's shares, when redeemed, may be worth more or less than the original cost. To obtain performance information current to the most recent month's end, please visit www.usaa.com.
Total return measures the price change in a share assuming the reinvestment of all net investment income and realized capital gain distributions, if any. The total returns quoted do not reflect adjustments made to the enclosed financial statements in accordance with U.S. generally accepted accounting principles or the deduction of taxes that a shareholder would pay on net investment income and realized capital gain distributions, including reinvested distributions, or redemptions of shares.
The total return figures set forth above include all waivers of fees for various periods since inception. Without such fee waivers, the total returns would have been lower.
USAA Tax Exempt Intermediate-Term Fund — Growth of $10,000
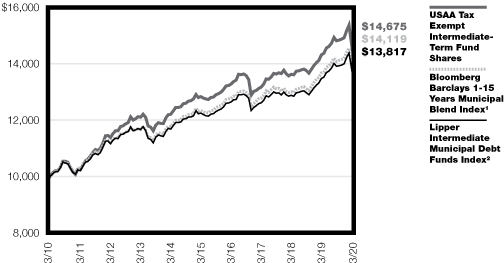
1The unmanaged Bloomberg Barclays 1-15 Years Municipal Blend Index is a market value-weighted index which covers the short and intermediate components of the Bloomberg Barclays Municipal Bond Index. There are no expenses associated with the index, while there are expenses associated with the Fund. It is not possible to invest directly in an index.
2The unmanaged Lipper Intermediate Municipal Debt Funds Index measures the Fund's performance to that of the Lipper Intermediate Municipal Debt Funds category. There are no expenses associated with the index, while there are expenses associated with the Fund. It is not possible to invest directly in an index.
The graph reflects investment of growth of a hypothetical $10,000 investment in the Fund. Past performance is no guarantee of future results.
The graph and table do not reflect the deduction of taxes that a shareholder would pay on Fund distributions or the redemption of Fund shares.
6
USAA Mutual Funds Trust
USAA Tax Exempt Intermediate-Term Fund (continued)
Average Annual Compounded Returns with Reinvestment of Dividends — Periods Ended March 31, 2020
Total Return | = | Dividend Return | + | Price Change | |||||||||||||||||||
| 10 Years | 3.91 | % | = | 3.53 | % | + | 0.38 | % | |||||||||||||||
| 5 Years | 2.73 | % | = | 3.12 | % | + | -0.39 | % | |||||||||||||||
| 1 Year | 2.56 | % | = | 2.86 | % | + | -0.30 | % | |||||||||||||||
The performance data quoted represents past performance and is no guarantee of future results. Current performance may be higher or lower than the performance data quoted. The return and principal value of an investment will fluctuate, so that an investor's shares, when redeemed, may be worth more or less than their original cost. For performance data current to the most recent month-end, visit usaa.com.
Annual Total Returns and Compounded Dividend Returns for
the One-Year Periods Ended March 31, 2011 — March 31, 2020
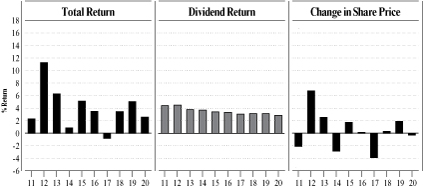
Note the role that dividend returns play in the Fund Shares' total return over time. Share prices and dividend rates will vary from period to period. However, dividend returns generally are more consistent and less volatile than share prices.
Total return measures the price change in a share assuming the reinvestment of all net investment income and realized capital gain distributions, if any. Dividend return is the net investment income dividends received over the period, assuming reinvestment of all dividends. Share price change is the change in net asset value over the period adjusted for realized capital gain distributions. The returns quoted do not reflect adjustments made to the enclosed financial statements in accordance with U.S. generally accepted accounting principles or the deduction of taxes that a shareholder would pay on distributions (including capital gain distributions), redemptions of shares, or reinvested net investment income.
7
| USAA Mutual Funds Trust USAA Tax Exempt Intermediate-Term Fund | March 31, 2020 | ||||||
(Unaudited)
Investment Objective & Portfolio Holdings:
The Fund's investment objective seeks to provide investors with interest income that is exempt from federal income tax.
Top 10 Industries
March 31, 2020
(% of Net Assets)
Hospital | 19.2 | % | |||||
Special Assessment/Tax/Fee | 11.1 | % | |||||
General Obligation | 10.9 | % | |||||
Education | 9.2 | % | |||||
Toll Road | 7.2 | % | |||||
Appropriated Debt | 6.2 | % | |||||
Electric/Gas Utility | 5.4 | % | |||||
Electric Utilities | 5.2 | % | |||||
Escrowed Bonds | 4.2 | % | |||||
Airport/Port | 3.3 | % | |||||
Refer to the Schedule of Portfolio of Investments for a complete list of securities.
8
| USAA Mutual Funds Trust USAA Tax Exempt Intermediate-Term Fund (continued) | March 31, 2020 | ||||||
(Unaudited)
Portfolio Ratings Mix*
March 31, 2020
(% of Net Assets)
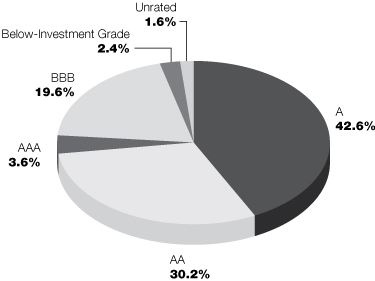
This chart reflects the highest long-term rating from a Nationally Recognized Statistical Rating Organization ("NRSRO"), with the four highest long-term credit ratings labeled, in descending order of credit quality, AAA, AA, A, and BBB. These categories represent investment-grade quality. NRSRO ratings are shown because they provide independent analysis of the credit quality of the Fund's investments. Victory Capital Management, Inc. ("Adviser") also performs its own fundamental credit analysis of each security. As part of its fundamental credit analysis, the Adviser considers various criteria, including industry specific actions, peer comparisons, payment ranking, and structure specific characteristics. Any of the Fund's securities that are not rated by an NRSRO appear in the chart above as "Unrated," but these securities are analyzed and monitored by the Adviser on an ongoing basis. Government securities that are issued or guaranteed as to principal and interest by the U.S. government and pre-refunded and escrowed-to-maturity municipal bonds that are not rated are treated as AAA for credit quality purposes.
*Does not include futures and money market instruments.
9
| USAA Mutual Funds Trust USAA Tax Exempt Intermediate-Term Fund | Schedule of Portfolio Investments March 31, 2020 | ||||||
(Amounts in Thousands, Except for Shares)
Security Description | Shares or Principal Amount | Value | |||||||||
Common Stocks (0.2%) | |||||||||||
Utilities (0.2%): | |||||||||||
Energy Harbor Corp. (a) | 837,140 | $ | 10,674 | ||||||||
Total Common Stock (Cost $20,929) | 10,674 | ||||||||||
Municipal Bonds (98.6%) | |||||||||||
Alabama (1.5%): | |||||||||||
| Infirmary Health System Special Care Facilities Financing Authority of Mobile Revenue, 5.00%, 2/1/36, Continuously Callable @100 | $ | 8,000 | 8,962 | ||||||||
| Lower Alabama Gas District Revenue Series A, 5.00%, 9/1/27 | 5,000 | 5,568 | |||||||||
Series A, 5.00%, 9/1/28 | 7,000 | 7,879 | |||||||||
Series A, 5.00%, 9/1/34 (b) | 35,000 | 40,851 | |||||||||
| Montgomery Medical Clinic Board Revenue 5.00%, 3/1/33, Continuously Callable @100 | 5,955 | 6,588 | |||||||||
5.00%, 3/1/36, Continuously Callable @100 | 1,750 | 1,914 | |||||||||
71,762 | |||||||||||
Arizona (2.4%): | |||||||||||
| Apache County IDA Revenue, Series A, 4.50%, 3/1/30, Continuously Callable @100 | 20,310 | 20,517 | |||||||||
| Arizona Health Facilities Authority Revenue 5.00%, 2/1/27, Continuously Callable @100 | 6,000 | 6,370 | |||||||||
6.56% (MUNIPSA+185bps), 2/1/48, (Put Date 2/1/23) (c) (d) | 30,000 | 31,144 | |||||||||
| City of Phoenix Civic Improvement Corp. Revenue (INS — National Public Finance Guarantee Corp.) 5.50%, 7/1/24 (e) | 3,270 | 3,818 | |||||||||
5.50%, 7/1/25 (e) | 2,115 | 2,544 | |||||||||
| Maricopa County IDA Revenue 5.28% (MUNIPSA+57bps), 1/1/35, Callable 10/18/23 @ 100 (c) | 2,430 | 2,437 | |||||||||
5.00%, 7/1/39, Continuously Callable @100 (f) | 2,000 | 1,971 | |||||||||
| Pinal County IDA Revenue (INS — ACA Financial Guaranty Corp.) 5.25%, 10/1/20, Continuously Callable @100 | 2,000 | 2,006 | |||||||||
5.25%, 10/1/22, Continuously Callable @100 | 1,250 | 1,254 | |||||||||
4.50%, 10/1/25, Continuously Callable @100 | 2,000 | 2,005 | |||||||||
| The City of Phoenix IDA Revenue 3.75%, 7/1/24 | 5,585 | 5,771 | |||||||||
5.00%, 7/1/34, Continuously Callable @100 | 11,100 | 12,043 | |||||||||
5.00%, 7/1/36, Continuously Callable @100 | 1,675 | 1,823 | |||||||||
5.00%, 10/1/36, Continuously Callable @100 | 4,250 | 4,851 | |||||||||
| The City of Phoenix IDA Revenue (LIQ — Barclays Bank PLC), Series 2016-XF2337, 5.00%, 6/1/36 (e) (f) | 4,000 | 4,000 | |||||||||
| The Pima County IDA Revenue, 4.13%, 6/15/29, Continuously Callable @100 (f) | 4,900 | 4,565 | |||||||||
| The Prima County IDA Revenue 4.00%, 6/15/22 (f) | 695 | 690 | |||||||||
Series A, 4.50%, 6/1/30, Continuously Callable @100 | 2,680 | 2,708 | |||||||||
See notes to financial statements.
10
| USAA Mutual Funds Trust USAA Tax Exempt Intermediate-Term Fund | Schedule of Portfolio Investments — continued March 31, 2020 | ||||||
(Amounts in Thousands, Except for Shares)
Security Description | Principal Amount | Value | |||||||||
| The Yavapai County IDA Revenue 1.10%, 4/1/29, (Put Date 6/1/20) (d) (e) | $ | 3,000 | $ | 2,984 | |||||||
4.00%, 8/1/38, Continuously Callable @100 | 1,000 | 1,110 | |||||||||
114,611 | |||||||||||
Arkansas (0.7%): | |||||||||||
| Arkansas Development Finance Authority Revenue, 6.26% (MUNIPSA+155bps), 9/1/44, (Put Date 9/1/22) (c) (d) | 29,000 | 29,038 | |||||||||
| University of Arkansas — Pulaski Technical College Revenue (INS — Build America Mutual Assurance Co.), 5.00%, 9/1/30, Continuously Callable @100 | 4,290 | 5,060 | |||||||||
34,098 | |||||||||||
California (6.1%): | |||||||||||
| Anaheim Public Financing Authority Revenue Series A, 5.00%, 5/1/28, Continuously Callable @100 | 500 | 562 | |||||||||
Series A, 5.00%, 5/1/29, Continuously Callable @100 | 500 | 562 | |||||||||
Series A, 5.00%, 5/1/30, Continuously Callable @100 | 1,000 | 1,123 | |||||||||
| Bay Area Toll Authority Revenue 5.81% (MUNIPSA+110bps), 4/1/45, (Put Date 4/1/24) (c) (d) | 17,000 | 17,291 | |||||||||
5.61% (MUNIPSA+90bps), 4/1/45, (Put Date 5/1/23) (c) (d) | 10,000 | 10,090 | |||||||||
| California Health Facilities Financing Authority Revenue 2.00%, 10/1/36, (Put Date 10/1/25) (d) (e) | 8,500 | 8,653 | |||||||||
Series D, 5.00%, 8/15/27, Continuously Callable @100 | 2,000 | 2,086 | |||||||||
Series D, 5.25%, 8/15/31, Continuously Callable @100 | 5,000 | 5,241 | |||||||||
| California School Finance Authority Revenue 5.00%, 8/1/31, Continuously Callable @100 (f) | 500 | 545 | |||||||||
5.00%, 8/1/36, Continuously Callable @100 (f) | 1,600 | 1,713 | |||||||||
| California State Public Works Board Revenue Series A, 5.00%, 3/1/25, Continuously Callable @100 | 1,250 | 1,381 | |||||||||
Series A, 5.00%, 3/1/26, Continuously Callable @100 | 1,365 | 1,508 | |||||||||
Series A, 5.00%, 4/1/28, Continuously Callable @100 | 10,000 | 10,619 | |||||||||
Series A, 5.00%, 4/1/29, Continuously Callable @100 | 5,000 | 5,310 | |||||||||
Series B, 5.00%, 10/1/31, Continuously Callable @100 | 11,465 | 13,206 | |||||||||
Series B-1, 5.13%, 3/1/23, Continuously Callable @100 | 3,000 | 3,009 | |||||||||
Series B-1, 5.25%, 3/1/24, Continuously Callable @100 | 2,500 | 2,508 | |||||||||
Series B-1, 5.38%, 3/1/25, Continuously Callable @100 | 2,000 | 2,007 | |||||||||
Series G, 5.00%, 11/1/23, Continuously Callable @100 | 1,185 | 1,299 | |||||||||
Series G, 5.00%, 11/1/24, Continuously Callable @100 | 2,000 | 2,192 | |||||||||
Series G, 5.00%, 11/1/28, Continuously Callable @100 | 7,000 | 7,672 | |||||||||
| California State University Revenue Series A, 5.00%, 11/1/29, Continuously Callable @100 | 10,000 | 11,603 | |||||||||
Series A, 5.00%, 11/1/33, Continuously Callable @100 | 10,000 | 11,808 | |||||||||
| California Statewide Communities Development Authority Revenue 5.13%, 5/15/31, Continuously Callable @100 | 1,000 | 1,042 | |||||||||
5.00%, 5/15/32, Continuously Callable @100 | 1,250 | 1,459 | |||||||||
5.00%, 5/15/33, Continuously Callable @100 | 2,000 | 2,329 | |||||||||
5.00%, 5/15/34, Continuously Callable @100 | 1,250 | 1,451 | |||||||||
5.00%, 5/15/35, Continuously Callable @100 | 2,000 | 2,315 | |||||||||
See notes to financial statements.
11
| USAA Mutual Funds Trust USAA Tax Exempt Intermediate-Term Fund | Schedule of Portfolio Investments — continued March 31, 2020 | ||||||
(Amounts in Thousands, Except for Shares)
Security Description | Principal Amount | Value | |||||||||
| Cerritos Community College District, GO Series D, 8/1/25 (g) | $ | 1,510 | $ | 1,398 | |||||||
Series D, 8/1/27 (g) | 1,000 | 887 | |||||||||
Series D, 8/1/28 (g) | 1,000 | 866 | |||||||||
| Chula Vista Municipal Financing Authority Special Tax Series B, 5.00%, 9/1/27, Continuously Callable @100 | 1,520 | 1,789 | |||||||||
Series B, 5.00%, 9/1/28, Continuously Callable @100 | 1,700 | 1,996 | |||||||||
Series B, 5.00%, 9/1/29, Continuously Callable @100 | 1,785 | 2,093 | |||||||||
Series B, 5.00%, 9/1/30, Continuously Callable @100 | 2,635 | 3,083 | |||||||||
Series B, 5.00%, 9/1/31, Continuously Callable @100 | 2,095 | 2,445 | |||||||||
City of Irvine Special Assessment, 5.00%, 9/2/29, Callable 9/2/23 @ 100 | 1,000 | 1,116 | |||||||||
| City of San Diego Tobacco Settlement Revenue Funding Corp. Revenue, Series C, 4.00%, 6/1/32, Continuously Callable @100 | 900 | 912 | |||||||||
| City of Tulare Sewer Revenue (INS — Assured Guaranty Municipal Corp.) 5.00%, 11/15/32, Continuously Callable @100 | 1,605 | 1,913 | |||||||||
5.00%, 11/15/33, Continuously Callable @100 | 1,570 | 1,865 | |||||||||
5.00%, 11/15/34, Continuously Callable @100 | 3,655 | 4,329 | |||||||||
5.00%, 11/15/35, Continuously Callable @100 | 2,340 | 2,765 | |||||||||
| City of Upland Certificate of Participation, 6.00%, 1/1/26, Pre-refunded 1/1/21 @ 100 | 10,000 | 10,338 | |||||||||
County of Los Angeles Certificate of Participation, 5.00%, 3/1/23 | 1,300 | 1,442 | |||||||||
| El Camino Community College District, GO Series C, 8/1/26 (g) | 6,810 | 6,233 | |||||||||
Series C, 8/1/27 (g) | 7,665 | 6,903 | |||||||||
Series C, 8/1/28 (g) | 5,500 | 4,848 | |||||||||
| Foothill-Eastern Transportation Corridor Agency Revenue (INS — Assured Guaranty Municipal Corp.), 1/15/35 (g) | 5,500 | 3,869 | |||||||||
| Fresno Joint Powers Financing Authority Revenue (INS — Assured Guaranty Municipal Corp.) Series A, 5.00%, 4/1/32, Continuously Callable @100 | 1,000 | 1,217 | |||||||||
Series A, 5.00%, 4/1/35, Continuously Callable @100 | 1,000 | 1,210 | |||||||||
Series A, 5.00%, 4/1/36, Continuously Callable @100 | 420 | 507 | |||||||||
| Golden State Tobacco Securitization Corp. Revenue (INS — Assured Guaranty Municipal Corp.), Series A, 6/1/25 (g) | 46,605 | 42,536 | |||||||||
| Irvine Unified School District Special Tax (INS — Assured Guaranty Municipal Corp.), 4.50%, 9/1/20, Continuously Callable @100 | 2,500 | 2,506 | |||||||||
| Pittsburg Successor Agency Redevelopment Agency Tax Allocation (INS — Assured Guaranty Municipal Corp.) Series A, 5.00%, 9/1/27, Continuously Callable @100 | 3,500 | 4,227 | |||||||||
Series A, 5.00%, 9/1/28, Continuously Callable @100 | 2,640 | 3,180 | |||||||||
| Sacramento City Financing Authority Revenue (LIQ — Deutsche Bank A.G.), Series XG0100, 4.81%, 12/1/33 (e) (f) | 10,000 | 10,000 | |||||||||
| San Diego Public Facilities Financing Authority Revenue Series A, 5.00%, 10/15/33, Continuously Callable @100 | 1,635 | 1,915 | |||||||||
Series A, 5.00%, 10/15/34, Continuously Callable @100 | 1,000 | 1,169 | |||||||||
Series A, 5.00%, 10/15/35, Continuously Callable @100 | 1,250 | 1,460 | |||||||||
Series B, 5.00%, 10/15/30, Continuously Callable @100 | 775 | 914 | |||||||||
Series B, 5.00%, 10/15/31, Continuously Callable @100 | 1,000 | 1,177 | |||||||||
Series B, 5.00%, 10/15/32, Continuously Callable @100 | 1,000 | 1,174 | |||||||||
See notes to financial statements.
12
| USAA Mutual Funds Trust USAA Tax Exempt Intermediate-Term Fund | Schedule of Portfolio Investments — continued March 31, 2020 | ||||||
(Amounts in Thousands, Except for Shares)
Security Description | Principal Amount | Value | |||||||||
State of California, GO, 4.00%, 10/1/34, Continuously Callable @100 | $ | 20,615 | $ | 24,136 | |||||||
| Washington Township Health Care District Revenue, Series A, 5.00%, 7/1/25, Continuously Callable @100 | 3,500 | 3,530 | |||||||||
292,532 | |||||||||||
Colorado (2.5%): | |||||||||||
Adams & Arapahoe Joint School District 28J Aurora, GO, 12/1/22 (g) | 5,000 | 4,762 | |||||||||
| Colorado Health Facilities Authority Revenue 5.00%, 6/1/28, Pre-refunded 6/1/23 @ 100 | 2,750 | 3,070 | |||||||||
5.00%, 12/1/28, Continuously Callable @100 | 1,000 | 1,141 | |||||||||
5.00%, 12/1/29, Continuously Callable @100 | 1,500 | 1,701 | |||||||||
5.00%, 6/1/31, Pre-refunded 6/1/25 @ 100 | 2,310 | 2,720 | |||||||||
5.00%, 6/1/32, Pre-refunded 6/1/25 @ 100 | 2,000 | 2,349 | |||||||||
5.00%, 6/1/33, Pre-refunded 6/1/25 @ 100 | 2,470 | 2,908 | |||||||||
5.00%, 6/1/34, Pre-refunded 6/1/25 @ 100 | 6,385 | 7,501 | |||||||||
5.00%, 6/1/34, Pre-refunded 6/1/27 @ 100 | 4,455 | 5,537 | |||||||||
5.00%, 6/1/35, Pre-refunded 6/1/25 @ 100 | 3,385 | 3,976 | |||||||||
5.00%, 6/1/35, Pre-refunded 6/1/27 @ 100 | 2,000 | 2,486 | |||||||||
5.00%, 12/1/35, Continuously Callable @100 | 4,000 | 4,385 | |||||||||
5.00%, 6/1/36, Pre-refunded 6/1/27 @ 100 | 4,000 | 4,971 | |||||||||
Series A, 4.00%, 8/1/38, Continuously Callable @100 | 1,000 | 1,007 | |||||||||
Series A, 4.00%, 8/1/39, Continuously Callable @100 | 1,250 | 1,255 | |||||||||
Series A, 4.00%, 11/1/39, Continuously Callable @100 | 3,500 | 3,890 | |||||||||
| Denver Health & Hospital Authority Revenue Series A, 5.00%, 12/1/34, Continuously Callable @100 (f) | 7,355 | 8,638 | |||||||||
Series A, 4.00%, 12/1/37, Continuously Callable @100 | 1,250 | 1,360 | |||||||||
Series A, 4.00%, 12/1/38, Continuously Callable @100 | 1,250 | 1,347 | |||||||||
Series A, 4.00%, 12/1/39, Continuously Callable @100 | 1,000 | 1,069 | |||||||||
| Park Creek Metropolitan District Revenue 5.00%, 12/1/32, Continuously Callable @100 | 1,250 | 1,460 | |||||||||
5.00%, 12/1/34, Continuously Callable @100 | 1,000 | 1,160 | |||||||||
| Regional Transportation District Certificate of Participation Series A, 5.00%, 6/1/25, Pre-refunded 6/1/20 @ 100 | 9,135 | 9,194 | |||||||||
Series A, 5.00%, 6/1/25, Pre-refunded 6/1/20 @ 100 | 865 | 871 | |||||||||
Series A, 5.00%, 6/1/29, Continuously Callable @100 | 7,585 | 8,458 | |||||||||
Series A, 5.00%, 6/1/30, Continuously Callable @100 | 14,175 | 15,808 | |||||||||
Series A, 5.00%, 6/1/31, Continuously Callable @100 | 15,005 | 16,734 | |||||||||
119,758 | |||||||||||
Connecticut (4.3%): | |||||||||||
| City of Bridgeport, GO Series B, 5.00%, 8/15/27 | 335 | 420 | |||||||||
Series B, 5.00%, 8/15/27 | 4,485 | 5,385 | |||||||||
Series B, 5.00%, 8/15/27 | 180 | 225 | |||||||||
| City of New Haven, GO Series A, 5.00%, 8/1/28 | 1,000 | 1,114 | |||||||||
Series A, 5.50%, 8/1/30, Continuously Callable @100 | 1,000 | 1,145 | |||||||||
Series A, 5.50%, 8/1/32, Continuously Callable @100 | 1,200 | 1,360 | |||||||||
Series A, 5.50%, 8/1/36, Continuously Callable @100 | 1,810 | 2,022 | |||||||||
See notes to financial statements.
13
| USAA Mutual Funds Trust USAA Tax Exempt Intermediate-Term Fund | Schedule of Portfolio Investments — continued March 31, 2020 | ||||||
(Amounts in Thousands, Except for Shares)
Security Description | Principal Amount | Value | |||||||||
| City of New Haven, GO (INS — Assured Guaranty Municipal Corp.) Series A, 5.00%, 8/15/30, Continuously Callable @100 | $ | 1,000 | $ | 1,125 | |||||||
Series A, 5.00%, 8/15/32, Continuously Callable @100 | 1,000 | 1,112 | |||||||||
Series A, 5.00%, 8/15/33, Continuously Callable @100 | 1,000 | 1,107 | |||||||||
Series A, 5.00%, 8/15/34, Continuously Callable @100 | 1,350 | 1,486 | |||||||||
| City of West Haven, GO Series B, 5.00%, 11/1/32, Continuously Callable @100 | 400 | 459 | |||||||||
Series B, 5.00%, 11/1/37, Continuously Callable @100 | 350 | 395 | |||||||||
| Connecticut State Health & Educational Facilities Authority Revenue 5.00%, 7/1/32, Continuously Callable @100 | 1,950 | 2,129 | |||||||||
5.00%, 7/1/34, Continuously Callable @100 | 725 | 788 | |||||||||
5.00%, 7/1/35, Continuously Callable @100 | 1,170 | 1,271 | |||||||||
5.00%, 7/1/36, Continuously Callable @100 | 1,125 | 1,222 | |||||||||
5.00%, 7/1/37, Continuously Callable @100 | 1,275 | 1,385 | |||||||||
Series A, 4.00%, 7/1/38, Continuously Callable @100 | 7,000 | 7,676 | |||||||||
Series A, 4.00%, 7/1/38, Continuously Callable @100 | 2,000 | 2,229 | |||||||||
Series A, 4.00%, 7/1/39, Continuously Callable @100 | 2,000 | 2,222 | |||||||||
Series A, 4.00%, 7/1/40, Continuously Callable @100 | 2,000 | 2,193 | |||||||||
Series A, 4.00%, 7/1/41, Continuously Callable @100 | 7,425 | 8,067 | |||||||||
Series E, 5.00%, 7/1/34, Continuously Callable @100 | 10,000 | 11,139 | |||||||||
| Harbor Point Infrastructure Improvement District Tax Allocation, 5.00%, 4/1/30, Continuously Callable @100 (f) | 10,000 | 10,757 | |||||||||
Mashantucket Western Pequot Tribe Revenue PIK, 2.05%, 7/1/31 (n) | 8,432 | 295 | |||||||||
| Metropolitan District, GO 5.00%, 7/15/33, Continuously Callable @100 | 750 | 932 | |||||||||
5.00%, 7/15/34, Continuously Callable @100 | 1,000 | 1,240 | |||||||||
5.00%, 7/15/35, Continuously Callable @100 | 750 | 928 | |||||||||
5.00%, 7/15/36, Continuously Callable @100 | 1,000 | 1,233 | |||||||||
4.00%, 7/15/37, Continuously Callable @100 | 1,000 | 1,147 | |||||||||
| State of Connecticut Special Tax Revenue 5.00%, 1/1/34, Continuously Callable @100 | 20,000 | 23,357 | |||||||||
5.00%, 1/1/35, Continuously Callable @100 | 20,000 | 23,261 | |||||||||
Series B, 5.00%, 10/1/37, Continuously Callable @100 | 6,000 | 7,000 | |||||||||
Series B, 5.00%, 10/1/38, Continuously Callable @100 | 4,000 | 4,653 | |||||||||
| State of Connecticut, GO Series A, 5.00%, 4/15/33, Continuously Callable @100 | 5,000 | 5,935 | |||||||||
Series A, 5.00%, 4/15/34, Continuously Callable @100 | 5,575 | 6,572 | |||||||||
Series A, 5.00%, 4/15/35, Continuously Callable @100 | 5,000 | 5,853 | |||||||||
Series A, 4.00%, 1/15/37, Continuously Callable @100 | 6,500 | 6,974 | |||||||||
Series A, 4.00%, 4/15/37, Continuously Callable @100 | 1,825 | 1,986 | |||||||||
Series C, 5.00%, 6/15/33, Continuously Callable @100 | 1,100 | 1,307 | |||||||||
Series C, 5.00%, 6/15/34, Continuously Callable @100 | 2,625 | 3,097 | |||||||||
Series C, 5.00%, 6/15/35, Continuously Callable @100 | 2,500 | 2,929 | |||||||||
Series E, 5.00%, 9/15/35, Continuously Callable @100 | 2,000 | 2,347 | |||||||||
Series E, 5.00%, 9/15/37, Continuously Callable @100 | 2,000 | 2,326 | |||||||||
Series G, 5.00%, 11/15/35, Continuously Callable @100 | 5,000 | 5,699 | |||||||||
| Town of Hamden, GO (INS — Build America Mutual Assurance Co.), Series A, 5.00%, 8/15/30, Continuously Callable @100 | 1,200 | 1,472 | |||||||||
See notes to financial statements.
14
| USAA Mutual Funds Trust USAA Tax Exempt Intermediate-Term Fund | Schedule of Portfolio Investments — continued March 31, 2020 | ||||||
(Amounts in Thousands, Except for Shares)
Security Description | Principal Amount | Value | |||||||||
| University of Connecticut Revenue Series A, 5.00%, 4/15/34, Continuously Callable @100 | $ | 6,805 | $ | 8,107 | |||||||
Series A, 5.00%, 4/15/35, Continuously Callable @100 | 6,500 | 7,709 | |||||||||
Series A, 5.00%, 4/15/36, Continuously Callable @100 | 11,175 | 13,171 | |||||||||
207,963 | |||||||||||
District of Columbia (0.5%): | |||||||||||
| District of Columbia Revenue 5.00%, 7/1/23 | 375 | 396 | |||||||||
6.00%, 7/1/33, Pre-refunded 7/1/23 @ 100 | 1,280 | 1,458 | |||||||||
5.00%, 7/1/39, Continuously Callable @100 | 800 | 945 | |||||||||
4.00%, 7/1/39, Continuously Callable @100 | 1,000 | 1,072 | |||||||||
Series A, 5.63%, 10/1/25, Continuously Callable @100 | 3,870 | 3,937 | |||||||||
Series A, 5.75%, 10/1/26, Continuously Callable @100 | 5,000 | 5,088 | |||||||||
Series A, 5.75%, 10/1/27, Pre-refunded 4/1/21 @ 100 | 6,000 | 6,285 | |||||||||
| Metropolitan Washington Airports Authority Dulles Toll Road Revenue 4.00%, 10/1/35, Continuously Callable @100 | 1,000 | 1,024 | |||||||||
4.00%, 10/1/36, Continuously Callable @100 | 1,250 | 1,278 | |||||||||
4.00%, 10/1/37, Continuously Callable @100 | 1,500 | 1,532 | |||||||||
4.00%, 10/1/38, Continuously Callable @100 | 1,000 | 1,019 | |||||||||
24,034 | |||||||||||
Florida (5.5%): | |||||||||||
| City of Cape Coral Water & Sewer Revenue 4.00%, 10/1/35, Continuously Callable @100 | 1,485 | 1,683 | |||||||||
4.00%, 10/1/36, Continuously Callable @100 | 1,400 | 1,581 | |||||||||
4.00%, 10/1/37, Continuously Callable @100 | 3,000 | 3,380 | |||||||||
| City of Jacksonville Revenue, 5.00%, 10/1/28, Continuously Callable @100 | 3,500 | 3,816 | |||||||||
| City of Port St. Lucie Special Assessment 4.00%, 7/1/31, Continuously Callable @100 | 3,195 | 3,573 | |||||||||
4.00%, 7/1/32, Continuously Callable @100 | 2,000 | 2,231 | |||||||||
4.00%, 7/1/33, Continuously Callable @100 | 2,785 | 3,099 | |||||||||
| City of Port St. Lucie Utility System Revenue, 4.00%, 9/1/31, Continuously Callable @100 | 1,000 | 1,121 | |||||||||
| Cityplace Community Development District Special Assessment (INS — Assured Guaranty Municipal Corp.) 5/1/33 (e) (g) (h) | 3,470 | 3,241 | |||||||||
5/1/38, Continuously Callable @100 (e) (g) (i) | 7,900 | 7,904 | |||||||||
| County of Lee Airport Revenue, 5.00%, 10/1/33, Continuously Callable @100 | 4,000 | 4,542 | |||||||||
| County of Lee Revenue 5.00%, 10/1/23 | 2,500 | 2,817 | |||||||||
5.00%, 10/1/24 | 2,700 | 3,131 | |||||||||
| County of Lee Tourist Development Tax Revenue Series B, 4.00%, 10/1/36, Continuously Callable @100 | 4,685 | 5,354 | |||||||||
Series B, 4.00%, 10/1/37, Continuously Callable @100 | 4,970 | 5,661 | |||||||||
Series B, 4.00%, 10/1/38, Continuously Callable @100 | 5,230 | 5,933 | |||||||||
| County of Martin Revenue, 1.20%, 7/15/22, Continuously Callable @100 (e) | 8,000 | 8,000 | |||||||||
See notes to financial statements.
15
| USAA Mutual Funds Trust USAA Tax Exempt Intermediate-Term Fund | Schedule of Portfolio Investments — continued March 31, 2020 | ||||||
(Amounts in Thousands, Except for Shares)
Security Description | Principal Amount | Value | |||||||||
| County of Miami-Dade Aviation Revenue Series B, 5.00%, 10/1/26, Pre-refunded 10/1/20 @ 100 | $ | 6,440 | $ | 6,566 | |||||||
Series B, 5.00%, 10/1/27, Pre-refunded 10/1/20 @ 100 | 7,000 | 7,137 | |||||||||
| County of Miami-Dade Revenue, Series A, 5.00%, 10/1/25, Continuously Callable @100 | 2,000 | 2,151 | |||||||||
| County of St Lucie Sales Tax Revenue (INS — Assured Guaranty Municipal Corp.), Series A, 5.00%, 10/1/28, Continuously Callable @100 | 7,370 | 8,244 | |||||||||
| Escambia County Health Facilities Authority Revenue 5.00%, 8/15/33, Continuously Callable @100 | 1,400 | 1,651 | |||||||||
5.00%, 8/15/35, Continuously Callable @100 | 1,290 | 1,515 | |||||||||
4.00%, 8/15/45, Continuously Callable @100 | 5,250 | 5,445 | |||||||||
| Florida Higher Educational Facilities Financial Authority Revenue 5.00%, 10/1/35, Continuously Callable @100 | 1,250 | 1,481 | |||||||||
5.00%, 10/1/36, Continuously Callable @100 | 1,000 | 1,184 | |||||||||
4.00%, 10/1/37, Continuously Callable @100 | 1,000 | 1,078 | |||||||||
4.00%, 10/1/38, Continuously Callable @100 | 750 | 805 | |||||||||
5.00%, 3/1/39, Continuously Callable @100 | 7,055 | 8,032 | |||||||||
4.00%, 10/1/39, Continuously Callable @100 | 800 | 855 | |||||||||
| Halifax Hospital Medical Center Revenue 5.00%, 6/1/35, Continuously Callable @100 | 2,325 | 2,617 | |||||||||
5.00%, 6/1/36, Continuously Callable @100 | 2,750 | 3,136 | |||||||||
| Lake County School Board Certificate of Participation (INS — Assured Guaranty Municipal Corp.) Series A, 5.00%, 6/1/29, Continuously Callable @100 | 1,250 | 1,421 | |||||||||
Series A, 5.00%, 6/1/30, Continuously Callable @100 | 2,225 | 2,526 | |||||||||
| Lee County IDA Revenue 5.00%, 10/1/28, Continuously Callable @100 | 7,245 | 7,344 | |||||||||
5.00%, 11/15/39, Continuously Callable @103 | 1,500 | 1,594 | |||||||||
| Lee County School Board Certificate of Participation, Series A, 5.00%, 8/1/28, Continuously Callable @100 | 3,750 | 4,293 | |||||||||
| Lee Memorial Health System Revenue, Series A-1, 4.00%, 4/1/37, Continuously Callable @100 | 5,000 | 5,577 | |||||||||
| Miami Beach Health Facilities Authority Revenue, 5.00%, 11/15/29, Continuously Callable @100 | 6,560 | 7,093 | |||||||||
| Miami-Dade County Expressway Authority Revenue Series A, 5.00%, 7/1/28, Continuously Callable @100 | 10,000 | 10,774 | |||||||||
Series A, 5.00%, 7/1/29, Continuously Callable @100 | 7,000 | 7,538 | |||||||||
Series A, 5.00%, 7/1/29, Continuously Callable @100 | 1,000 | 1,140 | |||||||||
Series A, 5.00%, 7/1/30, Continuously Callable @100 | 1,610 | 1,833 | |||||||||
Series A, 5.00%, 7/1/31, Continuously Callable @100 | 1,255 | 1,428 | |||||||||
Series A, 5.00%, 7/1/32, Continuously Callable @100 | 2,000 | 2,273 | |||||||||
Series A, 5.00%, 7/1/33, Continuously Callable @100 | 2,000 | 2,272 | |||||||||
Series A, 5.00%, 7/1/34, Continuously Callable @100 | 2,000 | 2,270 | |||||||||
Series B, 5.00%, 7/1/30, Continuously Callable @100 | 2,000 | 2,277 | |||||||||
Series B, 5.00%, 7/1/31, Continuously Callable @100 | 2,000 | 2,276 | |||||||||
| Miami-Dade County Health Facilities Authority Revenue 5.00%, 8/1/27, Continuously Callable @100 | 4,750 | 5,217 | |||||||||
5.00%, 8/1/28, Continuously Callable @100 | 4,950 | 5,433 | |||||||||
5.00%, 8/1/29, Continuously Callable @100 | 5,250 | 5,758 | |||||||||
5.00%, 8/1/30, Continuously Callable @100 | 3,500 | 3,836 | |||||||||
5.00%, 8/1/31, Continuously Callable @100 | 5,780 | 6,329 | |||||||||
See notes to financial statements.
16
| USAA Mutual Funds Trust USAA Tax Exempt Intermediate-Term Fund | Schedule of Portfolio Investments — continued March 31, 2020 | ||||||
(Amounts in Thousands, Except for Shares)
Security Description | Principal Amount | Value | |||||||||
| Orange County Health Facilities Authority Revenue, Series A, 5.00%, 10/1/35, Continuously Callable @100 | $ | 4,000 | $ | 4,592 | |||||||
| Osceola County School Board Certificate of Participation, Series A, 5.00%, 6/1/28, Continuously Callable @100 | 3,055 | 3,359 | |||||||||
| Palm Beach County Health Facilities Authority Revenue, 5.00%, 11/15/23, Continuously Callable @100 | 7,595 | 7,873 | |||||||||
| Pinellas County Educational Facilities Authority Revenue 5.00%, 10/1/21 | 1,995 | 2,101 | |||||||||
4.00%, 10/1/22 | 1,080 | 1,148 | |||||||||
4.00%, 10/1/23, Continuously Callable @100 | 1,415 | 1,503 | |||||||||
5.38%, 10/1/26, Continuously Callable @100 | 2,045 | 2,163 | |||||||||
5.00%, 10/1/27, Continuously Callable @100 | 1,895 | 2,055 | |||||||||
6.50%, 10/1/31, Continuously Callable @100 | 2,615 | 2,804 | |||||||||
Pinellas County IDA Revenue, 5.00%, 7/1/29 | 1,000 | 1,075 | |||||||||
| School District of Broward County Certificate of Participation Series A, 5.00%, 7/1/29, Continuously Callable @100 | 2,000 | 2,338 | |||||||||
Series A, 5.00%, 7/1/30, Continuously Callable @100 | 2,000 | 2,310 | |||||||||
| Southeast Overtown Park West Community Redevelopment Agency Tax Allocation, Series A-1, 5.00%, 3/1/30, Continuously Callable @100 (f) | 3,195 | 3,538 | |||||||||
| St. Lucie County School Board Certificate of Participation Series A, 5.00%, 7/1/25, Continuously Callable @100 | 2,045 | 2,259 | |||||||||
Series A, 5.00%, 7/1/26, Continuously Callable @100 | 1,500 | 1,656 | |||||||||
| Sunshine State Governmental Financing Commission Revenue, 5.00%, 9/1/20 | 5,525 | 5,612 | |||||||||
| Sunshine State Governmental Financing Commission Revenue (INS — Assured Guaranty Municipal Corp.), Series A, 5.00%, 9/1/21 | 1,055 | 1,102 | |||||||||
| Volusia County Educational Facility Authority Revenue Series B, 5.00%, 10/15/28, Continuously Callable @100 | 1,000 | 1,154 | |||||||||
Series B, 5.00%, 10/15/29, Continuously Callable @100 | 1,000 | 1,153 | |||||||||
Series B, 5.00%, 10/15/30, Continuously Callable @100 | 1,500 | 1,726 | |||||||||
Series B, 5.00%, 10/15/32, Continuously Callable @100 | 1,560 | 1,792 | |||||||||
262,779 | |||||||||||
Georgia (2.4%): | |||||||||||
| Appling County Development Authority Revenue, 1.02%, 9/1/41, Continuously Callable @100 (e) | 15,500 | 15,500 | |||||||||
| Cobb County Development Authority Revenue, Series A, 2.25%, 4/1/33, (Put Date 10/1/29) (d) (e) | 4,975 | 4,670 | |||||||||
| Glynn-Brunswick Memorial Hospital Authority Revenue 4.00%, 8/1/36, Continuously Callable @100 | 1,840 | 2,087 | |||||||||
4.00%, 8/1/37, Continuously Callable @100 | 1,500 | 1,693 | |||||||||
| Main Street Natural Gas, Inc. Revenue 4.00%, 8/1/48, (Put Date 12/1/23) (d) (e) | 15,000 | 15,312 | |||||||||
Series A, 5.00%, 5/15/37 | 1,500 | 1,731 | |||||||||
Series A, 5.00%, 5/15/38 | 2,500 | 2,861 | |||||||||
Series C, 4.00%, 3/1/50, (Put Date 9/1/26) (d) (e) | 27,500 | 28,888 | |||||||||
| Monroe County Development Authority Revenue, 1.02%, 11/1/48, Continuously Callable @100 (e) | 24,650 | 24,650 | |||||||||
| Private Colleges & Universities Authority Revenue Series A, 5.25%, 10/1/27, Continuously Callable @100 | 3,000 | 3,150 | |||||||||
Series C, 5.25%, 10/1/27, Continuously Callable @100 | 2,000 | 2,162 | |||||||||
See notes to financial statements.
17
| USAA Mutual Funds Trust USAA Tax Exempt Intermediate-Term Fund | Schedule of Portfolio Investments — continued March 31, 2020 | ||||||
(Amounts in Thousands, Except for Shares)
Security Description | Principal Amount | Value | |||||||||
| Savannah Hospital Authority Revenue, 4.00%, 7/1/39, Continuously Callable @100 | $ | 2,500 | $ | 2,733 | |||||||
| The Burke County Development Authority Revenue, 1.10%, 7/1/49, Continuously Callable @100 (e) | 11,000 | 11,000 | |||||||||
116,437 | |||||||||||
Guam (0.4%): | |||||||||||
| Guam Government Waterworks Authority Revenue 5.00%, 7/1/28, Continuously Callable @100 | 1,000 | 1,016 | |||||||||
5.25%, 7/1/33, Continuously Callable @100 | 3,000 | 3,051 | |||||||||
5.00%, 7/1/36, Continuously Callable @100 | 1,250 | 1,261 | |||||||||
5.00%, 7/1/36, Continuously Callable @100 | 1,000 | 1,013 | |||||||||
Series A, 5.00%, 7/1/23 | 750 | 768 | |||||||||
Series A, 5.00%, 7/1/24 | 600 | 616 | |||||||||
Series A, 5.00%, 7/1/25, Continuously Callable @100 | 750 | 769 | |||||||||
Series A, 5.00%, 7/1/29, Continuously Callable @100 | 1,000 | 1,028 | |||||||||
| Guam Power Authority Revenue Series A, 5.00%, 10/1/29, Continuously Callable @100 | 1,000 | 1,027 | |||||||||
Series A, 5.00%, 10/1/30, Continuously Callable @100 | 1,000 | 1,024 | |||||||||
Series A, 5.00%, 10/1/31, Continuously Callable @100 | 695 | 710 | |||||||||
| Guam Power Authority Revenue (INS — Assured Guaranty Municipal Corp.) Series A, 5.00%, 10/1/27, Continuously Callable @100 | 1,000 | 1,034 | |||||||||
Series A, 5.00%, 10/1/30, Continuously Callable @100 | 1,000 | 1,026 | |||||||||
Series A, 5.00%, 10/1/32, Continuously Callable @100 | 1,000 | 1,023 | |||||||||
| Territory of Guam Revenue Series A, 5.00%, 12/1/30, Continuously Callable @100 | 1,500 | 1,534 | |||||||||
Series A, 5.00%, 12/1/31, Continuously Callable @100 | 2,000 | 2,040 | |||||||||
18,940 | |||||||||||
Idaho (0.3%): | |||||||||||
| Idaho Health Facilities Authority Revenue 5.00%, 3/1/35, Continuously Callable @100 | 5,805 | 6,851 | |||||||||
5.00%, 3/1/36, Continuously Callable @100 | 4,085 | 4,801 | |||||||||
5.00%, 3/1/37, Continuously Callable @100 | 3,000 | 3,521 | |||||||||
15,173 | |||||||||||
Illinois (14.7%): | |||||||||||
| Champaign County Community Unit School District No. 4 Champaign, GO 4.00%, 6/1/34, Continuously Callable @100 | 1,000 | 1,145 | |||||||||
4.00%, 6/1/35, Continuously Callable @100 | 1,290 | 1,463 | |||||||||
4.00%, 6/1/36, Continuously Callable @100 | 1,575 | 1,777 | |||||||||
| Chicago Board of Education, GO Series A, 12/1/25 (g) | 1,600 | 1,425 | |||||||||
Series A, 12/1/26 (g) | 3,700 | 3,216 | |||||||||
| Chicago Midway International Airport Revenue Series B, 5.00%, 1/1/27, Continuously Callable @100 | 6,525 | 7,118 | |||||||||
Series B, 5.00%, 1/1/29, Continuously Callable @100 | 11,750 | 13,138 | |||||||||
Series B, 5.00%, 1/1/30, Continuously Callable @100 | 5,175 | 5,782 | |||||||||
Series B, 5.00%, 1/1/31, Continuously Callable @100 | 8,910 | 9,944 | |||||||||
Series B, 5.00%, 1/1/32, Continuously Callable @100 | 6,000 | 6,688 | |||||||||
Series B, 5.25%, 1/1/33, Continuously Callable @100 | 1,635 | 1,786 | |||||||||
See notes to financial statements.
18
| USAA Mutual Funds Trust USAA Tax Exempt Intermediate-Term Fund | Schedule of Portfolio Investments — continued March 31, 2020 | ||||||
(Amounts in Thousands, Except for Shares)
Security Description | Principal Amount | Value | |||||||||
Series B, 4.00%, 1/1/34, Continuously Callable @100 | $ | 3,500 | $ | 3,693 | |||||||
Series B, 4.00%, 1/1/35, Continuously Callable @100 | 3,000 | 3,149 | |||||||||
| Chicago O'Hare International Airport Revenue 5.00%, 1/1/33, Continuously Callable @100 | 11,560 | 12,734 | |||||||||
5.00%, 1/1/34, Continuously Callable @100 | 5,675 | 6,235 | |||||||||
Series B, 5.25%, 1/1/29, Continuously Callable @100 | 13,480 | 14,540 | |||||||||
Series C, 5.25%, 1/1/24, Continuously Callable @100 | 9,000 | 9,023 | |||||||||
| Chicago O'Hare International Airport Revenue (INS — Assured Guaranty Municipal Corp.) | |||||||||||
5.00%, 1/1/28, Continuously Callable @100 | 3,620 | 3,895 | |||||||||
5.00%, 1/1/29, Continuously Callable @100 | 1,500 | 1,613 | |||||||||
5.13%, 1/1/30, Continuously Callable @100 | 2,150 | 2,318 | |||||||||
| City of Chicago Special Assessment, 6.63%, 12/1/22, Continuously Callable @100 | 1,747 | 1,749 | |||||||||
| City of Chicago Wastewater Transmission Revenue 5.00%, 1/1/31, Continuously Callable @100 | 1,000 | 1,103 | |||||||||
5.00%, 1/1/32, Continuously Callable @100 | 1,000 | 1,102 | |||||||||
Series B, 5.00%, 1/1/35, Continuously Callable @100 | 8,000 | 9,301 | |||||||||
Series C, 5.00%, 1/1/33, Continuously Callable @100 | 3,500 | 3,950 | |||||||||
Series C, 5.00%, 1/1/35, Continuously Callable @100 | 1,250 | 1,405 | |||||||||
| City of Chicago Wastewater Transmission Revenue Bonds, Series C, 5.00%, 1/1/34, Continuously Callable @100 | 1,000 | 1,126 | |||||||||
| City of Chicago Waterworks Revenue 5.00%, 11/1/28, Continuously Callable @100 | 1,500 | 1,781 | |||||||||
5.00%, 11/1/29, Continuously Callable @100 | 725 | 860 | |||||||||
5.00%, 11/1/30, Continuously Callable @100 | 2,000 | 2,373 | |||||||||
5.00%, 11/1/31, Continuously Callable @100 | 2,000 | 2,273 | |||||||||
5.00%, 11/1/33, Continuously Callable @100 | 2,000 | 2,268 | |||||||||
5.00%, 11/1/36, Continuously Callable @100 | 2,665 | 3,190 | |||||||||
Series A-1, 5.00%, 11/1/29, Continuously Callable @100 | 1,000 | 1,187 | |||||||||
Series A-1, 5.00%, 11/1/31, Continuously Callable @100 | 1,000 | 1,185 | |||||||||
City of Chicago Waterworks Revenue (INS — Assured Guaranty Municipal Corp.) | |||||||||||
5.25%, 11/1/34, Continuously Callable @100 | 2,105 | 2,408 | |||||||||
5.25%, 11/1/35, Continuously Callable @100 | 1,635 | 1,850 | |||||||||
Series 2017-2, 5.00%, 11/1/36, Continuously Callable @100 | 3,145 | 3,488 | |||||||||
Series 2017-2, 5.00%, 11/1/37, Continuously Callable @100 | 2,500 | 2,766 | |||||||||
City of Chicago, GO (INS — National Public Finance Guarantee Corp.), 1/1/23 (g) | 30,000 | 27,917 | |||||||||
| City of Springfield Electric Revenue (INS — Assured Guaranty Municipal Corp.), 5.00%, 3/1/34, Continuously Callable @100 | 3,000 | 3,402 | |||||||||
City of Springfield, GO, 5.00%, 12/1/30, Continuously Callable @100 | 8,500 | 9,758 | |||||||||
| County of Cook Sales Tax Revenue 4.00%, 11/15/34, Continuously Callable @100 | 3,750 | 4,156 | |||||||||
5.00%, 11/15/35, Continuously Callable @100 | 7,000 | 8,258 | |||||||||
5.00%, 11/15/36, Continuously Callable @100 | 5,000 | 5,879 | |||||||||
| County of Cook, GO 5.00%, 11/15/34, Continuously Callable @100 | 2,000 | 2,096 | |||||||||
5.00%, 11/15/35, Continuously Callable @100 | 2,000 | 2,087 | |||||||||
Series A, 5.00%, 11/15/31, Continuously Callable @100 | 2,500 | 2,662 | |||||||||
See notes to financial statements.
19
| USAA Mutual Funds Trust USAA Tax Exempt Intermediate-Term Fund | Schedule of Portfolio Investments — continued March 31, 2020 | ||||||
(Amounts in Thousands, Except for Shares)
Security Description | Principal Amount | Value | |||||||||
| Illinois Educational Facilities Authority Revenue 4.00%, 11/1/36, Continuously Callable @102 | $ | 9,750 | $ | 10,609 | |||||||
4.45%, 11/1/36, Continuously Callable @102 | 4,500 | 4,981 | |||||||||
3.90%, 11/1/36, Continuously Callable @102 | 2,220 | 2,417 | |||||||||
| Illinois Finance Authority Revenue 3.25%, 5/15/22 | 1,670 | 1,673 | |||||||||
5.00%, 2/15/27 | 7,650 | 7,374 | |||||||||
5.40%, 4/1/27, Continuously Callable @100 | 1,435 | 1,436 | |||||||||
4.00%, 5/15/27 | 3,065 | 3,158 | |||||||||
5.50%, 7/1/28, Continuously Callable @100 | 8,250 | 9,182 | |||||||||
3.90%, 3/1/30, Continuously Callable @100 | 20,000 | 21,654 | |||||||||
5.00%, 5/15/30, Continuously Callable @100 | 1,000 | 1,056 | |||||||||
5.00%, 5/15/31, Continuously Callable @100 | 1,875 | 1,923 | |||||||||
5.00%, 8/15/32, Continuously Callable @100 | 1,500 | 1,726 | |||||||||
5.00%, 8/15/33, Continuously Callable @100 | 1,155 | 1,326 | |||||||||
5.00%, 8/15/34, Continuously Callable @100 | 1,000 | 1,145 | |||||||||
5.00%, 12/1/34, Continuously Callable @100 | 3,500 | 4,000 | |||||||||
5.00%, 5/15/35, Continuously Callable @100 | 1,100 | 1,135 | |||||||||
5.00%, 8/15/35, Continuously Callable @100 | 4,000 | 4,464 | |||||||||
5.00%, 10/1/35, Continuously Callable @100 | 600 | 733 | |||||||||
4.00%, 12/1/35, Continuously Callable @100 | 5,000 | 5,324 | |||||||||
5.00%, 5/15/36, Continuously Callable @100 | 1,400 | 1,368 | |||||||||
4.00%, 12/1/36, Continuously Callable @100 | 3,000 | 3,194 | |||||||||
5.00%, 2/15/37, Continuously Callable @100 | 1,000 | 1,141 | |||||||||
5.00%, 10/1/37, Continuously Callable @100 | 700 | 850 | |||||||||
2.45%, 10/1/39, (Put Date 10/1/29) (d) (e) | 14,000 | 14,215 | |||||||||
5.00%, 10/1/39, Continuously Callable @100 | 700 | 844 | |||||||||
Series A, 4.50%, 5/15/25, Continuously Callable @100 | 8,210 | 8,682 | |||||||||
Series A, 5.38%, 8/15/26, Continuously Callable @100 | 7,665 | 8,067 | |||||||||
Series A, 4.00%, 10/1/31, Continuously Callable @100 | 1,000 | 1,135 | |||||||||
Series A, 4.00%, 10/1/32, Continuously Callable @100 | 1,000 | 1,132 | |||||||||
Series A, 5.00%, 9/1/34, Continuously Callable @100 | 3,385 | 3,877 | |||||||||
Series A, 4.00%, 10/1/34, Continuously Callable @100 | 1,000 | 1,124 | |||||||||
Series A, 5.00%, 11/15/34, Continuously Callable @100 | 3,700 | 4,220 | |||||||||
Series A, 5.00%, 11/15/35, Continuously Callable @100 | 3,000 | 3,415 | |||||||||
Series C, 4.00%, 2/15/36, Continuously Callable @100 | 18,000 | 19,546 | |||||||||
| Illinois Municipal Electric Agency Revenue, Series A, 4.00%, 2/1/33, Continuously Callable @100 | 14,650 | 15,944 | |||||||||
| Illinois Sports Facilities Authority Revenue 5.25%, 6/15/30, Continuously Callable @100 | 3,000 | 3,435 | |||||||||
5.00%, 6/15/30, Continuously Callable @100 | 1,025 | 1,078 | |||||||||
5.25%, 6/15/31, Continuously Callable @100 | 5,000 | 5,717 | |||||||||
5.25%, 6/15/32, Continuously Callable @100 | 5,000 | 5,708 | |||||||||
| Illinois State Toll Highway Authority Revenue Series A, 5.00%, 12/1/32, Continuously Callable @100 | 5,000 | 5,751 | |||||||||
Series A, 5.00%, 1/1/34, Continuously Callable @100 | 5,870 | 6,678 | |||||||||
Series A, 5.00%, 1/1/35, Continuously Callable @100 | 5,600 | 6,361 | |||||||||
Series A, 5.00%, 1/1/36, Continuously Callable @100 | 7,000 | 7,941 | |||||||||
See notes to financial statements.
20
| USAA Mutual Funds Trust USAA Tax Exempt Intermediate-Term Fund | Schedule of Portfolio Investments — continued March 31, 2020 | ||||||
(Amounts in Thousands, Except for Shares)
Security Description | Principal Amount | Value | |||||||||
| Kane Cook & DuPage Counties School District No. U-46 Elgin, GO Series D, 5.00%, 1/1/32, Continuously Callable @100 | $ | 2,800 | $ | 3,144 | |||||||
Series D, 5.00%, 1/1/33, Continuously Callable @100 | 4,000 | 4,486 | |||||||||
| Kendall Kane & Will Counties Community Unit School District No. 308, GO 5.00%, 2/1/35, Continuously Callable @100 | 5,000 | 5,648 | |||||||||
5.00%, 2/1/36, Continuously Callable @100 | 6,000 | 6,758 | |||||||||
| Madison County Community Unit School District No. 7 Edwardsville, GO (INS — Build America Mutual Assurance Co.) 5.00%, 12/1/28, Continuously Callable @100 | 1,210 | 1,383 | |||||||||
5.00%, 12/1/29, Continuously Callable @100 | 1,250 | 1,423 | |||||||||
| Madison-Macoupin Etc Counties Community College District No. 536, GO (INS — Assured Guaranty Municipal Corp.) Series A, 5.00%, 11/1/31, Continuously Callable @100 | 1,000 | 1,168 | |||||||||
Series A, 5.00%, 11/1/32, Continuously Callable @100 | 2,000 | 2,330 | |||||||||
Series A, 5.00%, 11/1/33, Continuously Callable @100 | 750 | 872 | |||||||||
| Metropolitan Pier & Exposition Authority Revenue (INS — Assured Guaranty Municipal Corp.), 6/15/26 (g) | 5,000 | 4,217 | |||||||||
| Northern Illinois Municipal Power Agency Revenue Series A, 4.00%, 12/1/31, Continuously Callable @100 | 1,800 | 1,956 | |||||||||
Series A, 4.00%, 12/1/32, Continuously Callable @100 | 2,100 | 2,272 | |||||||||
Series A, 4.00%, 12/1/33, Continuously Callable @100 | 4,000 | 4,305 | |||||||||
Series A, 4.00%, 12/1/35, Continuously Callable @100 | 5,000 | 5,321 | |||||||||
| Northern Illinois University Revenue (INS-Build America Mutual Assurance Co.), Series B, 4.00%, 4/1/38, Continuously Callable @100 (j) | 1,150 | 1,085 | |||||||||
| Railsplitter Tobacco Settlement Authority Revenue, 5.50%, 6/1/23, Pre-refunded 6/1/21 @ 100 | 10,000 | 10,531 | |||||||||
| Regional Transportation Authority Revenue Series A, 4.00%, 7/1/34, Continuously Callable @100 | 23,160 | 25,943 | |||||||||
Series A, 4.00%, 7/1/35, Continuously Callable @100 | 11,650 | 12,970 | |||||||||
| Sales Tax Securitization Corp. Revenue Series A, 4.00%, 1/1/38, Continuously Callable @100 | 500 | 517 | |||||||||
Series A, 4.00%, 1/1/39, Continuously Callable @100 | 500 | 516 | |||||||||
| Sangamon County School District No. 186 Springfield, GO (INS — Build America Mutual Assurance Co.) Series B, 5.00%, 2/1/24 | 3,700 | 4,187 | |||||||||
Series B, 5.00%, 2/1/25, Continuously Callable @100 | 7,200 | 8,141 | |||||||||
Series B, 5.00%, 2/1/26, Continuously Callable @100 | 4,215 | 4,763 | |||||||||
| State of Illinois, GO 5.25%, 2/1/31, Continuously Callable @100 | 9,000 | 9,253 | |||||||||
5.00%, 11/1/32, Continuously Callable @100 | 10,000 | 10,234 | |||||||||
Series B, 5.00%, 9/1/25 | 11,000 | 11,545 | |||||||||
Series C, 5.00%, 11/1/29, Continuously Callable @100 | 15,500 | 16,134 | |||||||||
| State of Illinois, GO (INS — Assured Guaranty Municipal Corp.) 5.00%, 1/1/21, Continuously Callable @100 | 5,000 | 5,012 | |||||||||
4.00%, 2/1/30, Continuously Callable @100 | 7,000 | 6,836 | |||||||||
Series A, 5.00%, 4/1/29, Continuously Callable @100 | 10,000 | 10,221 | |||||||||
| State of Illinois, GO (INS — Build America Mutual Assurance Co.), Series D, 5.00%, 11/1/25 (b) | 10,000 | 10,432 | |||||||||
| State of Illinois, GO (LIQ — Barclays Bank PLC) Series 2015-XF1006, 5.00%, 4/1/37, Callable 4/1/24 @ 100 (e) (f) | 2,990 | 2,990 | |||||||||
Series 2015-XF1010, 5.00%, 2/1/39, Callable 2/1/24 @ 100 (e) (f) | 18,995 | 18,995 | |||||||||
See notes to financial statements.
21
| USAA Mutual Funds Trust USAA Tax Exempt Intermediate-Term Fund | Schedule of Portfolio Investments — continued March 31, 2020 | ||||||
(Amounts in Thousands, Except for Shares)
Security Description | Principal Amount | Value | |||||||||
| University of Illinois Revenue, Series A, 4.00%, 4/1/33, Continuously Callable @100 | $ | 12,475 | $ | 13,983 | |||||||
| Village of Bolingbrook, GO (INS — Assured Guaranty Municipal Corp.) Series A, 5.00%, 1/1/29, Continuously Callable @100 | 1,750 | 2,096 | |||||||||
Series A, 5.00%, 1/1/30, Continuously Callable @100 | 1,500 | 1,788 | |||||||||
Series A, 5.00%, 1/1/31, Continuously Callable @100 | 2,400 | 2,845 | |||||||||
Series A, 5.00%, 1/1/32, Continuously Callable @100 | 2,350 | 2,775 | |||||||||
Series A, 5.00%, 1/1/33, Continuously Callable @100 | 1,450 | 1,706 | |||||||||
Series A, 5.00%, 1/1/38, Continuously Callable @100 | 1,500 | 1,734 | |||||||||
| Village of Gilberts Special Tax (INS — Build America Mutual Assurance Co.), 5.00%, 3/1/30, Continuously Callable @100 | 5,225 | 6,035 | |||||||||
| Village of Rosemont, GO (INS — Assured Guaranty Municipal Corp.) Series A, 5.00%, 12/1/25 | 2,010 | 2,335 | |||||||||
Series A, 5.00%, 12/1/26 | 2,110 | 2,505 | |||||||||
| Volo Village Special Service Area No. 3 & 6 Special Tax (INS — Assured Guaranty Municipal Corp.) 5.00%, 3/1/34, Continuously Callable @100 | 2,997 | 3,363 | |||||||||
4.00%, 3/1/36, Continuously Callable @100 | 1,250 | 1,319 | |||||||||
| Will County Community High School District No 210 Lincoln-Way, GO, 4.00%, 1/1/34, Continuously Callable @100 | 650 | 722 | |||||||||
| Williamson Jackson Etc Counties Community Unit School District No. 4, GO (INS — Assured Guaranty Municipal Corp.) 5.00%, 12/1/28, Continuously Callable @100 | 1,835 | 2,164 | |||||||||
5.00%, 12/1/29, Continuously Callable @100 | 1,925 | 2,269 | |||||||||
5.00%, 12/1/30, Continuously Callable @100 | 2,025 | 2,385 | |||||||||
5.00%, 12/1/34, Continuously Callable @100 | 6,000 | 6,996 | |||||||||
711,609 | |||||||||||
Indiana (1.6%): | |||||||||||
City of Rockport Revenue, Series A, 3.05%, 6/1/25 | 5,750 | 6,172 | |||||||||
| Hammond Multi-School Building Corp. Revenue 5.00%, 7/15/33, Continuously Callable @100 | 1,165 | 1,377 | |||||||||
5.00%, 7/15/34, Continuously Callable @100 | 1,000 | 1,177 | |||||||||
5.00%, 7/15/35, Continuously Callable @100 | 1,250 | 1,464 | |||||||||
5.00%, 7/15/38, Continuously Callable @100 | 3,000 | 3,479 | |||||||||
| Indiana Bond Bank Revenue 1/15/30, Continuously Callable @97 (g) | 740 | 569 | |||||||||
7/15/30, Continuously Callable @96 (g) | 750 | 566 | |||||||||
7/15/31, Continuously Callable @93 (g) | 1,490 | 1,080 | |||||||||
7/15/32, Continuously Callable @91 (g) | 1,400 | 975 | |||||||||
| Indiana Finance Authority Revenue 3.13%, 12/1/24 | 6,000 | 6,411 | |||||||||
1.10%, 5/1/28, (Put Date 6/1/20) (d) (e) | 10,000 | 9,948 | |||||||||
5.00%, 9/1/30, Continuously Callable @100 | 1,250 | 1,483 | |||||||||
5.00%, 9/1/31, Continuously Callable @100 | 1,500 | 1,773 | |||||||||
5.00%, 11/15/33, Continuously Callable @103 | 2,000 | 2,194 | |||||||||
4.00%, 7/1/36, Continuously Callable @100 | 3,660 | 4,085 | |||||||||
4.00%, 7/1/38, Continuously Callable @100 | 4,030 | 4,475 | |||||||||
5.00%, 11/15/38, Continuously Callable @103 | 3,000 | 3,228 | |||||||||
4.00%, 7/1/39, Continuously Callable @100 | 3,605 | 3,990 | |||||||||
Series A, 5.00%, 5/1/24, Continuously Callable @100 | 1,470 | 1,608 | |||||||||
See notes to financial statements.
22
| USAA Mutual Funds Trust USAA Tax Exempt Intermediate-Term Fund | Schedule of Portfolio Investments — continued March 31, 2020 | ||||||
(Amounts in Thousands, Except for Shares)
Security Description | Principal Amount | Value | |||||||||
Series A, 5.00%, 5/1/27, Continuously Callable @100 | $ | 1,200 | $ | 1,310 | |||||||
Series A, 5.00%, 6/1/32, Continuously Callable @100 | 10,500 | 9,985 | |||||||||
| Richmond Hospital Authority Revenue, 5.00%, 1/1/35, Continuously Callable @100 | 6,500 | 7,275 | |||||||||
74,624 | |||||||||||
Iowa (0.5%): | |||||||||||
City of Waverly Revenue, 2.50%, 12/31/22, Continuously Callable @100 | 2,000 | 2,022 | |||||||||
| Iowa Finance Authority Revenue Series E, 4.00%, 8/15/35, Continuously Callable @100 | 5,425 | 5,908 | |||||||||
Series E, 4.00%, 8/15/36, Continuously Callable @100 | 15,105 | 16,379 | |||||||||
24,309 | |||||||||||
Kansas (0.3%): | |||||||||||
| City of Wichita Revenue 4.20%, 9/1/27, Continuously Callable @100 | 3,000 | 2,883 | |||||||||
4.63%, 9/1/33, Continuously Callable @100 | 10,000 | 9,444 | |||||||||
12,327 | |||||||||||
Kentucky (3.1%): | |||||||||||
| City of Ashland Revenue 4.00%, 2/1/35, Continuously Callable @100 | 470 | 497 | |||||||||
4.00%, 2/1/36, Continuously Callable @100 | 2,410 | 2,480 | |||||||||
4.00%, 2/1/37, Continuously Callable @100 | 1,115 | 1,166 | |||||||||
| City of Pikeville Revenue 5.75%, 3/1/26, Pre-refunded 3/1/21 @ 100 | 795 | 826 | |||||||||
5.75%, 3/1/26, Continuously Callable @100 | 2,930 | 3,043 | |||||||||
| County of Trimble Revenue, 3.75%, 6/1/33, Continuously Callable @100 | 15,000 | 16,593 | |||||||||
| Kentucky Economic Development Finance Authority Revenue 5.00%, 5/15/26 | 6,750 | 6,652 | |||||||||
1.10%, 4/1/31, (Put Date 6/1/20) (d) (e) | 10,045 | 9,992 | |||||||||
5.00%, 5/15/31, Continuously Callable @100 | 7,205 | 6,748 | |||||||||
5.00%, 5/15/36, Continuously Callable @100 | 2,500 | 2,310 | |||||||||
Series B, 10/1/24 (g) | 6,130 | 5,589 | |||||||||
| Kentucky Municipal Power Agency Revenue, Series A, 3.45%, 9/1/42, (Put Date 3/1/26) (d) (e) | 7,000 | 7,345 | |||||||||
| Kentucky Public Energy Authority Revenue Series B, 4.00%, 1/1/49, (Put Date 1/1/25) (d) (e) | 14,285 | 14,174 | |||||||||
Series C-1, 4.00%, 12/1/49, (Put Date 6/1/25) (d) (e) | 20,000 | 20,332 | |||||||||
Series C-3, 5.76% (MUNIPSA+105bps), 12/1/49, (Put Date 6/1/25) (c) (d) | 20,000 | 19,627 | |||||||||
| Kentucky State Property & Building Commission Revenue 5.00%, 5/1/35, Continuously Callable @100 | 1,000 | 1,171 | |||||||||
5.00%, 5/1/36, Continuously Callable @100 | 1,000 | 1,165 | |||||||||
5.00%, 5/1/37, Continuously Callable @100 | 3,000 | 3,488 | |||||||||
Series A, 5.00%, 2/1/32, Continuously Callable @100 | 2,000 | 2,295 | |||||||||
Series A, 5.00%, 2/1/33, Continuously Callable @100 | 2,250 | 2,575 | |||||||||
Series A, 4.00%, 11/1/35, Continuously Callable @100 | 565 | 633 | |||||||||
Series A, 4.00%, 11/1/36, Continuously Callable @100 | 750 | 841 | |||||||||
Series A, 4.00%, 11/1/37, Continuously Callable @100 | 750 | 839 | |||||||||
Series A, 4.00%, 11/1/38, Continuously Callable @100 | 500 | 557 | |||||||||
See notes to financial statements.
23
| USAA Mutual Funds Trust USAA Tax Exempt Intermediate-Term Fund | Schedule of Portfolio Investments — continued March 31, 2020 | ||||||
(Amounts in Thousands, Except for Shares)
Security Description | Principal Amount | Value | |||||||||
| Louisville/Jefferson County Metropolitan Government Revenue 5.00%, 12/1/22, Pre-refunded 6/1/22 @ 100 | $ | 3,830 | $ | 4,119 | |||||||
5.00%, 12/1/23, Pre-refunded 6/1/22 @ 100 | 2,760 | 2,968 | |||||||||
5.00%, 12/1/24, Pre-refunded 6/1/22 @ 100 | 7,160 | 7,699 | |||||||||
1.75%, 2/1/35, (Put Date 7/1/26) (d) (e) | 5,000 | 5,018 | |||||||||
150,742 | |||||||||||
Louisiana (4.6%): | |||||||||||
| Calcasieu Parish Memorial Hospital Service District Revenue, 5.00%, 12/1/39, Continuously Callable @100 | 1,000 | 1,050 | |||||||||
| City of New Orleans Sewerage Service Revenue 5.00%, 6/1/31, Continuously Callable @100 | 700 | 814 | |||||||||
5.00%, 6/1/32, Continuously Callable @100 | 1,150 | 1,334 | |||||||||
5.00%, 6/1/34, Continuously Callable @100 | 1,500 | 1,734 | |||||||||
| City of New Orleans Water System Revenue 5.00%, 12/1/33, Continuously Callable @100 | 1,500 | 1,732 | |||||||||
5.00%, 12/1/35, Continuously Callable @100 | 1,500 | 1,725 | |||||||||
| City of Shreveport Water & Sewer Revenue Series B, 5.00%, 12/1/31, Continuously Callable @100 | 5,330 | 6,086 | |||||||||
Series B, 5.00%, 12/1/32, Continuously Callable @100 | 5,125 | 5,846 | |||||||||
| City of Shreveport Water & Sewer Revenue (INS — Assured Guaranty Municipal Corp.) 5.00%, 12/1/33, Continuously Callable @100 | 1,515 | 1,757 | |||||||||
5.00%, 12/1/34, Continuously Callable @100 | 1,500 | 1,736 | |||||||||
5.00%, 12/1/35, Continuously Callable @100 | 1,510 | 1,745 | |||||||||
| City of Shreveport Water & Sewer Revenue (INS — Build America Mutual Assurance Co.) Series C, 5.00%, 12/1/30, Continuously Callable @100 | 1,000 | 1,240 | |||||||||
Series C, 5.00%, 12/1/31, Continuously Callable @100 | 2,000 | 2,465 | |||||||||
| Jefferson Parish Hospital Service District No. 1 Revenue (INS — Assured Guaranty Municipal Corp.) Series A, 5.50%, 1/1/26, Pre-refunded 1/1/21 @ 100 | 2,750 | 2,838 | |||||||||
Series A, 5.38%, 1/1/31, Pre-refunded 1/1/21 @ 100 | 3,000 | 3,093 | |||||||||
| Louisiana Local Government Environmental Facilities & Community Development Authority Revenue 3.50%, 11/1/32, Continuously Callable @100 | 18,750 | 19,867 | |||||||||
Series A, 6.50%, 8/1/29, Continuously Callable @100 | 3,750 | 3,811 | |||||||||
| Louisiana Public Facilities Authority Revenue 5.00%, 7/1/33, Pre-refunded 7/1/25 @ 100 | 55 | 65 | |||||||||
5.00%, 7/1/33, Continuously Callable @100 | 8,940 | 10,147 | |||||||||
5.00%, 5/15/34, Continuously Callable @100 | 2,975 | 3,461 | |||||||||
5.00%, 5/15/34, Pre-refunded 5/15/26 @ 100 | 25 | 30 | |||||||||
5.00%, 5/15/34, Continuously Callable @100 | 2,225 | 2,550 | |||||||||
5.00%, 7/1/34, Pre-refunded 7/1/25 @ 100 | 85 | 101 | |||||||||
5.00%, 7/1/34, Continuously Callable @100 | 13,465 | 15,259 | |||||||||
5.00%, 5/15/35, Continuously Callable @100 | 2,000 | 2,317 | |||||||||
4.00%, 5/15/35, Pre-refunded 5/15/26 @ 100 | 35 | 40 | |||||||||
4.00%, 5/15/35, Continuously Callable @100 | 3,465 | 3,734 | |||||||||
5.00%, 5/15/36, Continuously Callable @100 | 1,560 | 1,803 | |||||||||
4.00%, 5/15/36, Pre-refunded 5/15/26 @ 100 | 15 | 17 | |||||||||
4.00%, 5/15/36, Continuously Callable @100 | 1,485 | 1,592 | |||||||||
See notes to financial statements.
24
| USAA Mutual Funds Trust USAA Tax Exempt Intermediate-Term Fund | Schedule of Portfolio Investments — continued March 31, 2020 | ||||||
(Amounts in Thousands, Except for Shares)
Security Description | Principal Amount | Value | |||||||||
Series A, 4.00%, 12/15/32, Continuously Callable @100 | $ | 2,735 | $ | 3,133 | |||||||
Series A, 4.00%, 12/15/33, Continuously Callable @100 | 3,095 | 3,536 | |||||||||
Series B, 3.50%, 6/1/30, Continuously Callable @100 | 14,000 | 14,308 | |||||||||
| Louisiana Public Facilities Authority Revenue (INS — Assured Guaranty Municipal Corp.), 5.00%, 6/1/36, Continuously Callable @100 | 2,000 | 2,264 | |||||||||
| Louisiana State University & Agricultural & Mechanical College Revenue Series A, 4.00%, 7/1/31, Continuously Callable @100 | 1,000 | 1,118 | |||||||||
Series A, 4.00%, 7/1/32, Continuously Callable @100 | 1,000 | 1,116 | |||||||||
Series A, 4.00%, 7/1/33, Continuously Callable @100 | 1,000 | 1,114 | |||||||||
| New Orleans Aviation Board Revenue (INS — Assured Guaranty Municipal Corp.) 5.00%, 1/1/35, Continuously Callable @100 | 1,840 | 2,186 | |||||||||
5.00%, 1/1/36, Continuously Callable @100 | 1,250 | 1,482 | |||||||||
5.00%, 1/1/37, Continuously Callable @100 | 1,500 | 1,773 | |||||||||
5.00%, 10/1/37, Continuously Callable @100 | 2,000 | 2,396 | |||||||||
5.00%, 1/1/38, Continuously Callable @100 | 1,300 | 1,535 | |||||||||
Parish of St. Charles Revenue, 4.00%, 12/1/40, (Put Date 6/1/22) (d) (e) | 16,750 | 17,317 | |||||||||
| Parish of St. James Revenue, Series A-1, 7.50%, 11/1/40, Continuously Callable @100 (e) | 33,500 | 33,500 | |||||||||
Parish of St. John the BaptiSt. Revenue, 2.20%, 6/1/37 (e) | 11,750 | 9,369 | |||||||||
| Terrebonne Parish Hospital Service District No.1 Revenue 5.00%, 4/1/22, Pre-refunded 4/1/20 @ 100 | 875 | 875 | |||||||||
5.00%, 4/1/22, Continuously Callable @100 | 1,565 | 1,565 | |||||||||
5.00%, 4/1/23, Pre-refunded 4/1/20 @ 100 | 925 | 925 | |||||||||
5.00%, 4/1/23, Continuously Callable @100 | 1,645 | 1,645 | |||||||||
4.65%, 4/1/24, Pre-refunded 4/1/20 @ 100 | 720 | 720 | |||||||||
4.65%, 4/1/24, Continuously Callable @100 | 1,280 | 1,280 | |||||||||
5.00%, 4/1/28, Pre-refunded 4/1/20 @ 100 | 1,535 | 1,535 | |||||||||
5.00%, 4/1/28, Continuously Callable @100 | 2,715 | 2,715 | |||||||||
| Tobacco Settlement Financing Corp. Revenue Series A, 5.00%, 5/15/23 | 5,000 | 5,114 | |||||||||
Series A, 5.25%, 5/15/31, Continuously Callable @100 | 10,000 | 10,276 | |||||||||
222,786 | |||||||||||
Maine (0.3%): | |||||||||||
| Maine Health & Higher Educational Facilities Authority Revenue 5.00%, 7/1/24, Continuously Callable @100 | 1,635 | 1,775 | |||||||||
6.00%, 7/1/26, Continuously Callable @100 | 11,500 | 11,849 | |||||||||
5.00%, 7/1/26, Continuously Callable @100 | 1,000 | 1,084 | |||||||||
5.00%, 7/1/27, Continuously Callable @100 | 1,000 | 1,082 | |||||||||
15,790 | |||||||||||
Maryland (1.0%): | |||||||||||
| City of Gaithersburg Revenue 5.00%, 1/1/33, Continuously Callable @104 | 3,000 | 3,267 | |||||||||
5.00%, 1/1/36, Continuously Callable @104 | 1,000 | 1,078 | |||||||||
| Maryland Economic Development Corp. Revenue Series A, 5.00%, 6/1/30, Continuously Callable @100 | 1,250 | 1,392 | |||||||||
Series A, 5.00%, 6/1/31, Continuously Callable @100 | 1,000 | 1,100 | |||||||||
Series A, 5.00%, 6/1/32, Continuously Callable @100 | 1,000 | 1,098 | |||||||||
Series A, 5.00%, 6/1/35, Continuously Callable @100 | 2,000 | 2,186 | |||||||||
See notes to financial statements.
25
| USAA Mutual Funds Trust USAA Tax Exempt Intermediate-Term Fund | Schedule of Portfolio Investments — continued March 31, 2020 | ||||||
(Amounts in Thousands, Except for Shares)
Security Description | Principal Amount | Value | |||||||||
| Maryland Health & Higher Educational Facilities Authority Revenue 5.50%, 1/1/29, Continuously Callable @100 | $ | 1,415 | $ | 1,657 | |||||||
5.50%, 1/1/30, Continuously Callable @100 | 1,750 | 2,040 | |||||||||
5.50%, 1/1/31, Continuously Callable @100 | 1,585 | 1,838 | |||||||||
5.00%, 7/1/31, Continuously Callable @100 | 3,190 | 3,612 | |||||||||
5.00%, 7/1/32, Continuously Callable @100 | 6,505 | 7,332 | |||||||||
5.00%, 7/1/33, Continuously Callable @100 | 1,000 | 1,125 | |||||||||
5.00%, 7/1/33, Continuously Callable @100 | 3,600 | 4,041 | |||||||||
5.00%, 7/1/34, Continuously Callable @100 | 2,200 | 2,473 | |||||||||
5.00%, 7/1/34, Continuously Callable @100 | 2,500 | 2,792 | |||||||||
5.50%, 1/1/36, Continuously Callable @100 | 5,000 | 5,691 | |||||||||
Series A, 5.00%, 7/1/33, Continuously Callable @100 | 1,000 | 1,139 | |||||||||
Series A, 5.00%, 7/1/34, Continuously Callable @100 | 1,000 | 1,134 | |||||||||
Series A, 5.00%, 7/1/35, Continuously Callable @100 | 1,310 | 1,478 | |||||||||
Series A, 5.00%, 7/1/36, Continuously Callable @100 | 1,000 | 1,124 | |||||||||
47,597 | |||||||||||
Massachusetts (1.6%): | |||||||||||
| Massachusetts Clean Water Trust Revenue, Series 11, 4.75%, 8/1/25, Continuously Callable @100 | 110 | 110 | |||||||||
| Massachusetts Development Finance Agency Revenue 6.25%, 1/1/27, Pre-refunded 1/1/21 @ 100 | 2,700 | 2,807 | |||||||||
5.00%, 7/1/30, Pre-refunded 7/1/20 @ 100 | 2,000 | 2,020 | |||||||||
5.00%, 7/1/30, Continuously Callable @100 | 2,000 | 2,318 | |||||||||
5.00%, 7/1/31, Continuously Callable @100 | 1,675 | 1,931 | |||||||||
5.00%, 7/1/32, Continuously Callable @100 | 1,250 | 1,475 | |||||||||
4.00%, 10/1/32, Continuously Callable @105 (f) | 3,600 | 3,496 | |||||||||
5.00%, 4/15/33, Continuously Callable @100 | 2,155 | 2,362 | |||||||||
5.00%, 7/1/33, Continuously Callable @100 | 1,250 | 1,470 | |||||||||
5.00%, 7/1/34, Continuously Callable @100 | 1,000 | 1,170 | |||||||||
5.00%, 7/1/36, Continuously Callable @100 | 895 | 1,067 | |||||||||
5.00%, 7/1/36, Continuously Callable @100 | 1,000 | 1,190 | |||||||||
5.00%, 7/1/36, Continuously Callable @100 | 2,000 | 2,260 | |||||||||
5.00%, 7/1/37, Continuously Callable @100 | 1,215 | 1,443 | |||||||||
5.00%, 7/1/37, Continuously Callable @100 | 800 | 950 | |||||||||
5.00%, 10/1/37, Continuously Callable @105 (f) | 1,000 | 1,030 | |||||||||
5.00%, 7/1/38, Continuously Callable @100 | 600 | 711 | |||||||||
5.00%, 7/1/38, Continuously Callable @100 | 335 | 396 | |||||||||
Series A, 5.00%, 7/1/20 | 640 | 646 | |||||||||
Series A, 5.00%, 7/1/22 | 1,480 | 1,595 | |||||||||
Series A, 5.00%, 7/1/27, Continuously Callable @100 | 1,720 | 1,850 | |||||||||
Series A, 5.00%, 1/1/31, Continuously Callable @100 | 450 | 529 | |||||||||
Series A, 5.00%, 1/1/32, Continuously Callable @100 | 645 | 756 | |||||||||
Series A, 5.00%, 1/1/33, Continuously Callable @100 | 535 | 625 | |||||||||
Series A, 5.00%, 1/1/34, Continuously Callable @100 | 700 | 815 | |||||||||
Series A, 5.00%, 1/1/35, Continuously Callable @100 | 735 | 853 | |||||||||
Series A, 5.00%, 1/1/36, Continuously Callable @100 | 1,000 | 1,156 | |||||||||
Series A, 5.00%, 7/1/36, Continuously Callable @100 | 2,000 | 2,328 | |||||||||
Series A, 5.00%, 7/1/38, Continuously Callable @100 | 1,000 | 1,155 | |||||||||
Series A, 5.00%, 7/1/39, Continuously Callable @100 | 2,250 | 2,589 | |||||||||
Series E, 5.00%, 7/1/35, Continuously Callable @100 | 1,500 | 1,727 | |||||||||
See notes to financial statements.
26
| USAA Mutual Funds Trust USAA Tax Exempt Intermediate-Term Fund | Schedule of Portfolio Investments — continued March 31, 2020 | ||||||
(Amounts in Thousands, Except for Shares)
Security Description | Principal Amount | Value | |||||||||
Series E, 5.00%, 7/1/36, Continuously Callable @100 | $ | 1,000 | $ | 1,146 | |||||||
Series I, 6.25%, 1/1/27, Pre-refunded 1/1/21 @ 100 | 1,800 | 1,872 | |||||||||
Series J2, 5.00%, 7/1/35, Continuously Callable @100 | 5,375 | 6,320 | |||||||||
Series J2, 5.00%, 7/1/36, Continuously Callable @100 | 4,415 | 5,172 | |||||||||
Series J2, 5.00%, 7/1/37, Continuously Callable @100 | 5,285 | 6,181 | |||||||||
Series J2, 5.00%, 7/1/38, Continuously Callable @100 | 5,000 | 5,832 | |||||||||
| Massachusetts Health & Educational Facilities Authority Revenue, Series E, 5.00%, 7/15/27, Continuously Callable @100 | 4,000 | 4,000 | |||||||||
75,353 | |||||||||||
Michigan (2.2%): | |||||||||||
| Detroit Downtown Development Authority Tax Allocation (INS — Assured Guaranty Municipal Corp.) Series A, 5.00%, 7/1/36, Continuously Callable @100 | 1,000 | 1,048 | |||||||||
Series A, 5.00%, 7/1/37, Continuously Callable @100 | 2,000 | 2,093 | |||||||||
| Flint Hospital Building Authority Revenue 4.00%, 7/1/32, Continuously Callable @100 (j) | 2,525 | 2,702 | |||||||||
4.00%, 7/1/33, Continuously Callable @100 (j) | 2,620 | 2,786 | |||||||||
4.00%, 7/1/34, Continuously Callable @100 (j) | 2,730 | 2,885 | |||||||||
4.00%, 7/1/35, Continuously Callable @100 (j) | 1,635 | 1,717 | |||||||||
4.00%, 7/1/38, Continuously Callable @100 (j) | 1,855 | 1,915 | |||||||||
| Grand Traverse County Hospital Finance Authority Revenue, Series A, 5.00%, 7/1/29, Continuously Callable @100 | 10,000 | 10,419 | |||||||||
| Great Lakes Water Authority Water Supply System Revenue, Series D, 4.00%, 7/1/32, Continuously Callable @100 | 13,560 | 15,207 | |||||||||
| Kent Hospital Finance Authority Revenue, Series A, 5.00%, 11/15/29, Pre-refunded 11/15/21 @ 100 | 12,000 | 12,740 | |||||||||
| Livonia Public Schools, GO (INS — Assured Guaranty Municipal Corp.) 5.00%, 5/1/32, Continuously Callable @100 | 2,775 | 3,262 | |||||||||
5.00%, 5/1/33, Continuously Callable @100 | 2,875 | 3,373 | |||||||||
5.00%, 5/1/34, Continuously Callable @100 | 2,965 | 3,470 | |||||||||
5.00%, 5/1/35, Continuously Callable @100 | 3,065 | 3,579 | |||||||||
5.00%, 5/1/36, Continuously Callable @100 | 2,770 | 3,230 | |||||||||
| Michigan Finance Authority Revenue 5.00%, 11/1/34, Continuously Callable @100 | 1,000 | 1,229 | |||||||||
5.00%, 11/1/35, Continuously Callable @100 | 1,000 | 1,225 | |||||||||
4.00%, 11/15/35, Continuously Callable @100 | 6,000 | 6,394 | |||||||||
5.00%, 11/1/36, Continuously Callable @100 | 1,000 | 1,221 | |||||||||
4.00%, 11/15/36, Continuously Callable @100 | 1,000 | 1,064 | |||||||||
5.00%, 11/1/37, Continuously Callable @100 | 1,250 | 1,522 | |||||||||
Series 2016, 5.00%, 12/1/34, Continuously Callable @100 | 8,200 | 9,552 | |||||||||
Series 2016, 5.00%, 12/1/35, Continuously Callable @100 | 4,600 | 5,348 | |||||||||
| Michigan Finance Authority Revenue (NBGA — Michigan School Bond Qualification and Loan Program) Series A, 5.00%, 5/1/24 | 2,000 | 2,296 | |||||||||
Series A, 5.00%, 5/1/25 | 1,700 | 2,005 | |||||||||
| Michigan State Building Authority Revenue, Series I-A, 5.00%, 10/15/29, Continuously Callable @100 | 3,000 | 3,316 | |||||||||
See notes to financial statements.
27
| USAA Mutual Funds Trust USAA Tax Exempt Intermediate-Term Fund | Schedule of Portfolio Investments — continued March 31, 2020 | ||||||
(Amounts in Thousands, Except for Shares)
Security Description | Principal Amount | Value | |||||||||
| State of Michigan Trunk Line Revenue, 5.00%, 11/1/20, Continuously Callable @100 | $ | 2,000 | $ | 2,007 | |||||||
107,605 | |||||||||||
Minnesota (0.2%): | |||||||||||
| City of Minneapolis Revenue, Series A, 5.00%, 11/15/36, Continuously Callable @100 | 5,000 | 5,889 | |||||||||
| Housing & Redevelopment Authority of The City of St Paul Minnesota Revenue 5.00%, 11/15/29, Pre-refunded 11/15/25 @ 100 | 1,750 | 2,106 | |||||||||
5.00%, 11/15/30, Pre-refunded 11/15/25 @ 100 | 1,275 | 1,534 | |||||||||
9,529 | |||||||||||
Mississippi (0.5%): | |||||||||||
| Mississippi Business Finance Corp. Revenue, 3.20%, 9/1/28, Continuously Callable @100 | 6,000 | 6,346 | |||||||||
| Mississippi Development Bank Revenue, 5.00%, 4/1/28, Continuously Callable @100 | 1,840 | 2,005 | |||||||||
| Mississippi Development Bank Revenue (INS — Assured Guaranty Municipal Corp.), 5.00%, 9/1/30, Continuously Callable @100 | 7,000 | 7,256 | |||||||||
| Mississippi Hospital Equipment & Facilities Authority Revenue 4.00%, 1/1/36, Continuously Callable @100 | 2,240 | 2,509 | |||||||||
4.00%, 1/1/37, Continuously Callable @100 | 2,260 | 2,528 | |||||||||
4.00%, 1/1/39, Continuously Callable @100 | 1,850 | 2,059 | |||||||||
4.00%, 1/1/40, Continuously Callable @100 | 2,675 | 2,968 | |||||||||
25,671 | |||||||||||
Missouri (1.3%): | |||||||||||
| Cape Girardeau County IDA Revenue 5.00%, 3/1/32, Continuously Callable @100 | 500 | 541 | |||||||||
5.00%, 3/1/36, Continuously Callable @100 | 750 | 798 | |||||||||
Series A, 5.00%, 6/1/25, Continuously Callable @100 | 1,780 | 1,910 | |||||||||
Series A, 5.00%, 6/1/27, Continuously Callable @100 | 2,555 | 2,740 | |||||||||
Series A, 6.00%, 3/1/33, Continuously Callable @103 | 2,340 | 2,609 | |||||||||
| Health & Educational Facilities Authority of the State of Missouri Revenue 5.00%, 2/1/29, Continuously Callable @104 | 1,000 | 1,086 | |||||||||
5.00%, 5/1/30, Continuously Callable @100 | 2,310 | 2,491 | |||||||||
5.00%, 5/15/32, Continuously Callable @103 | 1,555 | 1,631 | |||||||||
5.25%, 5/1/33, Continuously Callable @100 | 2,350 | 2,540 | |||||||||
5.00%, 2/1/34, Continuously Callable @104 | 2,000 | 2,128 | |||||||||
5.00%, 5/15/36, Continuously Callable @103 | 4,565 | 4,683 | |||||||||
| Missouri Development Finance Board Revenue Series A, 5.00%, 6/1/30, Continuously Callable @100 | 1,000 | 1,101 | |||||||||
Series A, 5.00%, 6/1/31, Continuously Callable @100 | 4,215 | 4,638 | |||||||||
| Missouri State Environmental Improvement & Energy Resources Authority Revenue, Series A-R, 2.90%, 9/1/33, Continuously Callable @102 | 25,000 | 25,854 | |||||||||
| St. Louis County IDA Revenue 5.00%, 9/1/23 | 1,130 | 1,156 | |||||||||
5.50%, 9/1/33, Continuously Callable @100 | 2,750 | 2,857 | |||||||||
| Stoddard County IDA Revenue, Series B, 6.00%, 3/1/37, Continuously Callable @103 | 2,000 | 2,151 | |||||||||
60,914 | |||||||||||
See notes to financial statements.
28
| USAA Mutual Funds Trust USAA Tax Exempt Intermediate-Term Fund | Schedule of Portfolio Investments — continued March 31, 2020 | ||||||
(Amounts in Thousands, Except for Shares)
Security Description | Principal Amount | Value | |||||||||
Montana (0.2%): | |||||||||||
City of Forsyth Revenue, 3.90%, 3/1/31, Callable 3/1/23 @ 100 (e) | $ | 8,500 | $ | 8,731 | |||||||
Nebraska (0.4%): | |||||||||||
| Central Plains Energy Project Revenue Series A, 5.00%, 9/1/36 | 3,550 | 4,221 | |||||||||
| Douglas County Hospital Authority No. 3 Revenue 5.00%, 11/1/28, Continuously Callable @100 | 1,250 | 1,439 | |||||||||
5.00%, 11/1/30, Continuously Callable @100 | 1,600 | 1,837 | |||||||||
| Nebraska Educational Health Cultural & Social Services Finance Authority Revenue 4.00%, 1/1/35, Continuously Callable @102 | 795 | 880 | |||||||||
4.00%, 1/1/36, Continuously Callable @102 | 1,240 | 1,363 | |||||||||
4.00%, 1/1/37, Continuously Callable @102 | 1,000 | 1,093 | |||||||||
4.00%, 1/1/38, Continuously Callable @102 | 1,295 | 1,409 | |||||||||
4.00%, 1/1/39, Continuously Callable @102 | 1,800 | 1,948 | |||||||||
| Public Power Generation Agency Revenue, 5.00%, 1/1/37, Continuously Callable @100 | 2,400 | 2,814 | |||||||||
17,004 | |||||||||||
Nevada (1.7%): | |||||||||||
| City of Carson City Revenue 5.00%, 9/1/29, Continuously Callable @100 | 620 | 738 | |||||||||
5.00%, 9/1/31, Continuously Callable @100 | 1,000 | 1,180 | |||||||||
5.00%, 9/1/33, Continuously Callable @100 | 1,000 | 1,171 | |||||||||
5.00%, 9/1/37, Continuously Callable @100 | 1,950 | 2,253 | |||||||||
| City of North Las Vegas, GO (INS — Assured Guaranty Municipal Corp.) 4.00%, 6/1/35, Continuously Callable @100 | 1,870 | 2,095 | |||||||||
4.00%, 6/1/37, Continuously Callable @100 | 7,345 | 8,177 | |||||||||
4.00%, 6/1/38, Continuously Callable @100 | 6,135 | 6,812 | |||||||||
| City of Sparks Revenue Series A, 2.50%, 6/15/24 (f) | 1,000 | 977 | |||||||||
Series A, 2.75%, 6/15/28 (f) | 1,500 | 1,397 | |||||||||
| County of Clark Department of Aviation Revenue 5.00%, 7/1/26 | 3,660 | 4,309 | |||||||||
5.00%, 7/1/27 | 2,220 | 2,659 | |||||||||
Series A-2, 5.00%, 7/1/32, Continuously Callable @100 | 20,470 | 22,846 | |||||||||
Series A-2, 5.00%, 7/1/33, Continuously Callable @100 | 10,845 | 12,086 | |||||||||
| Las Vegas Convention & Visitors Authority Revenue Series C, 4.00%, 7/1/33, Continuously Callable @100 | 2,000 | 2,229 | |||||||||
Series C, 4.00%, 7/1/34, Continuously Callable @100 | 4,560 | 5,049 | |||||||||
Series C, 4.00%, 7/1/35, Continuously Callable @100 | 5,075 | 5,581 | |||||||||
79,559 | |||||||||||
New Hampshire (0.2%): | |||||||||||
| New Hampshire Health and Education Facilities Authority Act Revenue 5.00%, 8/1/34, Continuously Callable @100 | 2,880 | 3,459 | |||||||||
5.00%, 8/1/35, Continuously Callable @100 | 2,700 | 3,234 | |||||||||
5.00%, 8/1/36, Continuously Callable @100 | 2,000 | 2,390 | |||||||||
5.00%, 8/1/37, Continuously Callable @100 | 1,500 | 1,788 | |||||||||
10,871 | |||||||||||
See notes to financial statements.
29
| USAA Mutual Funds Trust USAA Tax Exempt Intermediate-Term Fund | Schedule of Portfolio Investments — continued March 31, 2020 | ||||||
(Amounts in Thousands, Except for Shares)
Security Description | Principal Amount | Value | |||||||||
New Jersey (6.2%): | |||||||||||
| Casino Reinvestment Development Authority Revenue (INS — Assured Guaranty Municipal Corp.) 5.00%, 11/1/29, Continuously Callable @100 | $ | 1,000 | $ | 1,147 | |||||||
5.00%, 11/1/30, Continuously Callable @100 | 1,000 | 1,145 | |||||||||
| City of Atlantic City , GO (INS — Assured Guaranty Municipal Corp.) Series B, 5.00%, 3/1/32, Continuously Callable @100 | 1,660 | 1,980 | |||||||||
Series B, 5.00%, 3/1/37, Continuously Callable @100 | 1,250 | 1,472 | |||||||||
| City of Atlantic City , GO (INS — Build America Mutual Assurance Co.), Series A, 5.00%, 3/1/32, Continuously Callable @100 | 630 | 751 | |||||||||
| City of Atlantic City, GO (INS — Build America Mutual Assurance Co.), Series A, 5.00%, 3/1/37, Continuously Callable @100 | 750 | 883 | |||||||||
| City of Bayonne, GO (INS — Build America Mutual Assurance Co.) 5.00%, 7/1/34, Continuously Callable @100 | 1,135 | 1,330 | |||||||||
5.00%, 7/1/35, Continuously Callable @100 | 1,000 | 1,169 | |||||||||
| Essex County Improvement Authority Revenue (INS — Assured Guaranty Municipal Corp.), Series A, 6.00%, 11/1/25, Pre-refunded 11/1/20 @ 100 | 4,535 | 4,668 | |||||||||
| New Brunswick Parking Authority Revenue (INS — Build America Mutual Assurance Co.) Series A, 5.00%, 9/1/35, Continuously Callable @100 | 1,455 | 1,721 | |||||||||
Series A, 5.00%, 9/1/36, Continuously Callable @100 | 2,000 | 2,359 | |||||||||
| New Jersey Building Authority Revenue Series A, 4.00%, 6/15/30, Pre-refunded 6/15/26 @ 100 | 400 | 468 | |||||||||
Series A, 4.00%, 6/15/30, Continuously Callable @100 | 600 | 600 | |||||||||
| New Jersey Economic Development Authority Revenue 5.25%, 9/1/22, Pre-refunded 3/1/21 @ 100 | 7,300 | 7,588 | |||||||||
5.25%, 9/1/22, Continuously Callable @100 | 2,700 | 2,743 | |||||||||
5.00%, 3/1/25, Continuously Callable @100 | 18,410 | 19,130 | |||||||||
5.00%, 6/15/26, Continuously Callable @100 | 2,500 | 2,577 | |||||||||
6.26% (MUNIPSA+155bps), 9/1/27, Callable 3/1/23 @ 100 (c) | 10,000 | 8,985 | |||||||||
6.31% (MUNIPSA+160bps), 3/1/28, Callable 3/1/23 @ 100 (c) | 10,000 | 9,220 | |||||||||
4.00%, 11/1/38, Continuously Callable @100 | 1,500 | 1,459 | |||||||||
4.00%, 11/1/39, Continuously Callable @100 | 2,000 | 1,939 | |||||||||
Series A, 4.45%, 6/1/23, Continuously Callable @100 | 3,500 | 3,517 | |||||||||
Series A, 5.00%, 6/15/25 | 5,125 | 5,444 | |||||||||
Series A, 3.13%, 7/1/29, Continuously Callable @100 | 1,085 | 1,080 | |||||||||
Series A, 3.38%, 7/1/30, Continuously Callable @100 | 1,000 | 937 | |||||||||
Series B, 5.00%, 6/15/36, Continuously Callable @100 | 16,455 | 17,624 | |||||||||
Series B, 5.00%, 6/15/37, Continuously Callable @100 | 16,280 | 17,408 | |||||||||
Series WW, 5.25%, 6/15/33, Continuously Callable @100 | 9,000 | 9,604 | |||||||||
| New Jersey Economic Development Authority Revenue (INS — Assured Guaranty Municipal Corp.), 5.00%, 6/15/25, Continuously Callable @100 | 10,000 | 10,589 | |||||||||
| New Jersey Educational Facilities Authority Revenue Series A, 5.00%, 7/1/39, Continuously Callable @100 | 2,080 | 2,280 | |||||||||
Series A, 5.00%, 7/1/40, Continuously Callable @100 | 2,080 | 2,271 | |||||||||
Series B, 5.50%, 9/1/28, Continuously Callable @100 | 5,740 | 6,315 | |||||||||
Series B, 5.50%, 9/1/29, Continuously Callable @100 | 4,000 | 4,392 | |||||||||
Series B, 5.50%, 9/1/30, Continuously Callable @100 | 3,000 | 3,286 | |||||||||
Series B, 5.50%, 9/1/31, Continuously Callable @100 | 4,590 | 5,027 | |||||||||
Series B, 5.50%, 9/1/32, Continuously Callable @100 | 8,075 | 8,848 | |||||||||
See notes to financial statements.
30
| USAA Mutual Funds Trust USAA Tax Exempt Intermediate-Term Fund | Schedule of Portfolio Investments — continued March 31, 2020 | ||||||
(Amounts in Thousands, Except for Shares)
Security Description | Principal Amount | Value | |||||||||
Series F, 4.00%, 7/1/33, Continuously Callable @100 | $ | 500 | $ | 559 | |||||||
Series F, 4.00%, 7/1/34, Continuously Callable @100 | 750 | 835 | |||||||||
Series F, 4.00%, 7/1/35, Continuously Callable @100 | 1,250 | 1,387 | |||||||||
| New Jersey Educational Facilities Authority Revenue (INS — Assured Guaranty Municipal Corp.) Series A, 5.00%, 7/1/34, Continuously Callable @100 | 3,000 | 3,631 | |||||||||
Series A, 5.00%, 7/1/35, Continuously Callable @100 | 3,350 | 4,038 | |||||||||
Series A, 4.00%, 7/1/36, Continuously Callable @100 | 1,800 | 1,965 | |||||||||
| New Jersey Health Care Facilities Financing Authority Revenue 5.00%, 10/1/33, Continuously Callable @100 | 2,000 | 2,141 | |||||||||
5.00%, 10/1/34, Continuously Callable @100 | 2,000 | 2,138 | |||||||||
5.00%, 10/1/35, Continuously Callable @100 | 2,620 | 2,797 | |||||||||
| New Jersey Health Care Facilities Financing Authority Revenue (INS — Assured Guaranty Municipal Corp.) Series A, 5.00%, 7/1/27, Continuously Callable @100 | 2,000 | 2,185 | |||||||||
Series A, 5.00%, 7/1/30, Continuously Callable @100 | 1,500 | 1,626 | |||||||||
| New Jersey Transportation Trust Fund Authority Revenue 5.00%, 6/15/30, Continuously Callable @100 | 3,000 | 3,335 | |||||||||
5.00%, 6/15/31, Continuously Callable @100 | 3,000 | 3,283 | |||||||||
5.91% (MUNIPSA+120bps), 6/15/34, (Put Date 12/15/21) (c) (d) | 10,000 | 9,706 | |||||||||
Series A, 12/15/25 (g) | 20,000 | 16,078 | |||||||||
Series A, 5.00%, 12/15/33, Continuously Callable @100 | 2,000 | 2,151 | |||||||||
Series A, 5.00%, 12/15/35, Continuously Callable @100 | 13,050 | 13,989 | |||||||||
Series AA, 5.25%, 6/15/33, Continuously Callable @100 | 2,000 | 2,122 | |||||||||
Series AA, 5.25%, 6/15/34, Continuously Callable @100 | 3,000 | 3,180 | |||||||||
Series BB, 5.00%, 6/15/31, Continuously Callable @100 | 2,500 | 2,695 | |||||||||
| New Jersey Transportation Trust Fund Authority Revenue (INS — AMBAC Assurance Corp.), Series B, 5.25%, 12/15/22 | 5,000 | 5,220 | |||||||||
| New Jersey Turnpike Authority Revenue Series A, 5.00%, 1/1/34, Continuously Callable @100 | 10,000 | 11,320 | |||||||||
Series A, 5.00%, 1/1/34, Continuously Callable @100 | 7,675 | 8,913 | |||||||||
Series A, 5.00%, 1/1/35, Continuously Callable @100 | 4,725 | 5,472 | |||||||||
Series B, 4.00%, 1/1/35, Continuously Callable @100 | 3,500 | 3,916 | |||||||||
| Newark Housing Authority Revenue (INS — Assured Guaranty Municipal Corp.) 4.00%, 12/1/29, Continuously Callable @100 | 500 | 570 | |||||||||
4.00%, 12/1/30, Continuously Callable @100 | 750 | 851 | |||||||||
4.00%, 12/1/31, Continuously Callable @100 | 500 | 564 | |||||||||
| South Jersey Transportation Authority Revenue Series A, 5.00%, 11/1/30, Continuously Callable @100 | 500 | 545 | |||||||||
Series A, 5.00%, 11/1/31, Continuously Callable @100 | 750 | 814 | |||||||||
Series A, 5.00%, 11/1/34, Continuously Callable @100 | 1,085 | 1,165 | |||||||||
| Tobacco Settlement Financing Corp. Revenue, Series A, 5.00%, 6/1/36, Continuously Callable @100 | 5,000 | 5,637 | |||||||||
296,784 | |||||||||||
New Mexico (1.2%): | |||||||||||
| City of Farmington Revenue 4.70%, 5/1/24, Continuously Callable @100 | 20,000 | 20,374 | |||||||||
1.88%, 4/1/33, (Put Date 10/1/21) (d) (e) | 12,000 | 11,749 | |||||||||
5.20%, 6/1/40, (Put Date 6/1/20) (d) (e) | 20,000 | 20,060 | |||||||||
See notes to financial statements.
31
| USAA Mutual Funds Trust USAA Tax Exempt Intermediate-Term Fund | Schedule of Portfolio Investments — continued March 31, 2020 | ||||||
(Amounts in Thousands, Except for Shares)
Security Description | Principal Amount | Value | |||||||||
| City of Santa Revenue 2.25%, 5/15/24, Continuously Callable @100 | $ | 600 | $ | 549 | |||||||
2.63%, 5/15/25, Continuously Callable @100 | 1,000 | 909 | |||||||||
5.00%, 5/15/34, Continuously Callable @103 | 625 | 616 | |||||||||
5.00%, 5/15/39, Continuously Callable @103 | 480 | 468 | |||||||||
| New Mexico Hospital Equipment Loan Council Revenue, 5.00%, 7/1/39, Continuously Callable @102 | 1,075 | 1,103 | |||||||||
55,828 | |||||||||||
New York (2.9%): | |||||||||||
| Chautauqua Tobacco Asset Securitization Corp. Revenue, 5.00%, 6/1/34, Continuously Callable @100 | 3,700 | 3,707 | |||||||||
City of Newburgh, GO, Series B, 5.00%, 6/15/23, Continuously Callable @100 | 575 | 622 | |||||||||
| City of Yonkers, GO (INS — Assured Guaranty Municipal Corp.), Series A, 5.00%, 10/1/23, Continuously Callable @100 | 2,600 | 2,759 | |||||||||
| County of Nassau, GO Series A, 5.00%, 1/1/35, Continuously Callable @100 | 1,100 | 1,293 | |||||||||
Series A, 5.00%, 1/1/36, Continuously Callable @100 | 1,150 | 1,348 | |||||||||
County of Rockland, GO | |||||||||||
3.50%, 10/1/21, Continuously Callable @100 | 1,585 | 1,603 | |||||||||
3.63%, 10/1/22, Continuously Callable @100 | 1,190 | 1,204 | |||||||||
3.63%, 10/1/23, Continuously Callable @100 | 1,560 | 1,579 | |||||||||
3.63%, 10/1/24, Continuously Callable @100 | 1,665 | 1,685 | |||||||||
| Erie County Industrial Development Agency Revenue, 5.00%, 5/1/28, Continuously Callable @100 | 2,000 | 2,228 | |||||||||
| Hudson Yards Infrastructure Corp. Revenue, Series A, 5.00%, 2/15/37, Continuously Callable @100 | 2,500 | 2,982 | |||||||||
| Metropolitan Transportation Authority Revenue 4.00%, 11/15/35, Continuously Callable @100 | 18,340 | 18,449 | |||||||||
Series C-1, 5.00%, 11/15/34, Continuously Callable @100 | 10,000 | 10,607 | |||||||||
Series C-1, 5.00%, 11/15/35, Continuously Callable @100 | 2,000 | 2,117 | |||||||||
Series F, 5.00%, 11/15/34, Continuously Callable @100 | 2,000 | 2,121 | |||||||||
Series F, 5.00%, 11/15/35, Continuously Callable @100 | 3,000 | 3,175 | |||||||||
| Metropolitan Transportation Authority Revenue (INS — Assured Guaranty Municipal Corp.), Series A-1, 4.00%, 11/15/41, Continuously Callable @100 | 9,820 | 10,956 | |||||||||
| Monroe County Industrial Development Corp. Revenue (INS — Federal Housing Administration), 5.75%, 8/15/30, Continuously Callable @100 | 5,000 | 5,196 | |||||||||
| New York Liberty Development Corp. Revenue 2.80%, 9/15/69, Continuously Callable @100 | 1,500 | 1,393 | |||||||||
2.63%, 9/15/69, Continuously Callable @100 | 3,350 | 3,108 | |||||||||
| New York State Dormitory Authority Revenue 5.00%, 12/1/35, Continuously Callable @100 (f) | 600 | 680 | |||||||||
Series A, 5.00%, 5/1/23 | 15 | 17 | |||||||||
Series A, 5.00%, 5/1/23 | 735 | 771 | |||||||||
Series A, 5.00%, 5/1/24, Pre-refunded 5/1/23 @ 100 | 15 | 17 | |||||||||
Series A, 5.00%, 5/1/24, Continuously Callable @100 | 735 | 770 | |||||||||
Series A, 5.00%, 5/1/25, Pre-refunded 5/1/23 @ 100 | 25 | 28 | |||||||||
Series A, 5.00%, 5/1/25, Continuously Callable @100 | 1,175 | 1,231 | |||||||||
Series A, 5.00%, 5/1/26, Pre-refunded 5/1/23 @ 100 | 20 | 22 | |||||||||
Series A, 5.00%, 5/1/26, Continuously Callable @100 | 980 | 1,025 | |||||||||
See notes to financial statements.
32
| USAA Mutual Funds Trust USAA Tax Exempt Intermediate-Term Fund | Schedule of Portfolio Investments — continued March 31, 2020 | ||||||
(Amounts in Thousands, Except for Shares)
Security Description | Principal Amount | Value | |||||||||
Series A, 4.00%, 9/1/36, Continuously Callable @100 | $ | 500 | $ | 555 | |||||||
Series A, 4.00%, 9/1/37, Continuously Callable @100 | 350 | 386 | |||||||||
Series A, 4.00%, 9/1/38, Continuously Callable @100 | 1,250 | 1,370 | |||||||||
Series A, 4.00%, 9/1/40, Continuously Callable @100 | 750 | 812 | |||||||||
Series B, 5.00%, 2/15/32, Continuously Callable @100 | 20,000 | 22,887 | |||||||||
| New York State Dormitory Authority Revenue (INS — Assured Guaranty Municipal Corp.) Series A, 5.00%, 10/1/27, Continuously Callable @100 | 1,000 | 1,162 | |||||||||
Series A, 5.00%, 10/1/28, Continuously Callable @100 | 1,000 | 1,161 | |||||||||
Series A, 5.00%, 10/1/29, Continuously Callable @100 | 1,300 | 1,507 | |||||||||
| Niagara Falls City School District Certificate of Participation (INS — Assured Guaranty Municipal Corp.) 5.00%, 6/15/23 | 1,670 | 1,847 | |||||||||
5.00%, 6/15/24 | 1,450 | 1,647 | |||||||||
5.00%, 6/15/25, Continuously Callable @100 | 1,670 | 1,895 | |||||||||
| Saratoga County Capital Resource Corp. Revenue, Series A, 5.00%, 12/1/28, Continuously Callable @100 | 790 | 874 | |||||||||
| Suffolk County Economic Development Corp. Revenue 5.00%, 7/1/28, Pre-refunded 7/1/21 @ 100 | 220 | 231 | |||||||||
5.00%, 7/1/28, Continuously Callable @100 | 1,280 | 1,332 | |||||||||
| Town of Oyster Bay, GO 4.00%, 2/15/24 | 5,415 | 5,857 | |||||||||
4.00%, 2/15/25 | 9,750 | 10,721 | |||||||||
4.00%, 2/15/26 | 3,000 | 3,349 | |||||||||
| Westchester County Local Development Corp. Revenue, 5.00%, 1/1/28, Continuously Callable @100 | 1,350 | 1,435 | |||||||||
141,721 | |||||||||||
North Carolina (0.6%): | |||||||||||
| North Carolina Capital Facilities Finance Agency Revenue, 1.10%, 7/1/34, (Put Date 6/1/20) (d) (e) | 20,000 | 19,898 | |||||||||
| North Carolina Medical Care Commission Revenue 5.00%, 10/1/25 | 1,500 | 1,499 | |||||||||
6.38%, 7/1/26, Pre-refunded 7/1/21 @ 100 | 4,805 | 5,129 | |||||||||
5.00%, 10/1/30, Continuously Callable @100 | 1,850 | 1,791 | |||||||||
28,317 | |||||||||||
North Dakota (0.3%): | |||||||||||
City of Grand Forks Revenue, 5.00%, 12/1/29, Continuously Callable @100 | 11,085 | 11,701 | |||||||||
County of Ward Revenue, Series C, 5.00%, 6/1/34, Continuously Callable @100 | 4,000 | 4,614 | |||||||||
16,315 | |||||||||||
Ohio (2.5%): | |||||||||||
City of Centerville Revenue, 5.25%, 11/1/37, Continuously Callable @100 | 2,250 | 2,305 | |||||||||
| City of Cleveland Airport System Revenue Series A, 5.00%, 1/1/30, Pre-refunded 1/1/22 @ 100 | 2,000 | 2,141 | |||||||||
Series A, 5.00%, 1/1/31, Pre-refunded 1/1/22 @ 100 | 1,000 | 1,071 | |||||||||
| County of Allen Hospital Facilities Revenue Series A, 4.00%, 8/1/36, Continuously Callable @100 | 5,000 | 5,491 | |||||||||
Series A, 4.00%, 8/1/37, Continuously Callable @100 | 10,800 | 11,859 | |||||||||
See notes to financial statements.
33
| USAA Mutual Funds Trust USAA Tax Exempt Intermediate-Term Fund | Schedule of Portfolio Investments — continued March 31, 2020 | ||||||
(Amounts in Thousands, Except for Shares)
Security Description | Principal Amount | Value | |||||||||
| County of Cuyahoga Revenue 4.00%, 2/15/29, Continuously Callable @100 | $ | 7,430 | $ | 7,956 | |||||||
5.00%, 2/15/37, Continuously Callable @100 | 4,000 | 4,363 | |||||||||
| County of Hamilton Revenue 5.00%, 1/1/31, Continuously Callable @100 | 1,350 | 1,411 | |||||||||
5.00%, 1/1/36, Continuously Callable @100 | 1,400 | 1,422 | |||||||||
| County of Hamilton Sales Tax Revenue (INS — AMBAC Assurance Corp.), Series B, 12/1/25 (g) | 4,365 | 4,035 | |||||||||
County of Hancock Revenue, 6.50%, 12/1/30, Pre-refunded 6/1/21 @ 100 | 9,000 | 9,583 | |||||||||
County of Montgomery Revenue, 3.00%, 11/15/36, Continuously Callable @100 | 7,000 | 6,747 | |||||||||
County of Ross Revenue, 5.00%, 12/1/39, Continuously Callable @100 | 2,405 | 2,854 | |||||||||
| Dayton City School District, GO 5.00%, 11/1/28 | 2,805 | 3,549 | |||||||||
5.00%, 11/1/29 | 3,655 | 4,696 | |||||||||
5.00%, 11/1/30 | 3,160 | 4,119 | |||||||||
5.00%, 11/1/31 | 2,000 | 2,621 | |||||||||
| Ohio Higher Educational Facility Commission Revenue 5.00%, 5/1/31, Continuously Callable @100 | 1,000 | 1,152 | |||||||||
5.00%, 5/1/33, Continuously Callable @100 | 500 | 573 | |||||||||
| Ohio Turnpike & Infrastructure Commission Revenue, 5.25%, 2/15/29, Continuously Callable @100 | 2,000 | 2,212 | |||||||||
Ohio Water Development Authority Revenue, 12/1/33 (a) (k) | 26,000 | — | (l) | ||||||||
| Port of Greater Cincinnati Development Authority Revenue, Series A, 3.00%, 5/1/23, Continuously Callable @100 | 9,535 | 9,361 | |||||||||
| Southeastern Ohio Port Authority Revenue 5.50%, 12/1/29, Continuously Callable @100 | 750 | 801 | |||||||||
5.00%, 12/1/35, Continuously Callable @100 | 750 | 771 | |||||||||
| State of Ohio Revenue 5.00%, 1/15/34, Continuously Callable @100 | 7,210 | 8,111 | |||||||||
5.00%, 1/15/35, Continuously Callable @100 | 6,000 | 6,735 | |||||||||
5.00%, 1/15/36, Continuously Callable @100 | 3,070 | 3,440 | |||||||||
Series A, 4.00%, 1/15/38, Continuously Callable @100 | 1,000 | 1,087 | |||||||||
Series A, 4.00%, 1/15/40, Continuously Callable @100 | 1,800 | 1,945 | |||||||||
| Village of Bluffton Revenue 5.00%, 12/1/31, Continuously Callable @100 | 1,500 | 1,782 | |||||||||
4.00%, 12/1/32, Continuously Callable @100 | 1,500 | 1,670 | |||||||||
4.00%, 12/1/33, Continuously Callable @100 | 1,600 | 1,773 | |||||||||
4.00%, 12/1/34, Continuously Callable @100 | 1,795 | 1,980 | |||||||||
119,616 | |||||||||||
Oklahoma (0.2%): | |||||||||||
| Comanche County Hospital Authority Revenue, Series A, 5.00%, 7/1/21 | 1,380 | 1,396 | |||||||||
| Oklahoma Development Finance Authority Revenue, Series B, 5.00%, 8/15/33, Continuously Callable @100 | 4,100 | 4,786 | |||||||||
| Tulsa County Industrial Authority Revenue 5.00%, 11/15/28, Continuously Callable @102 | 940 | 1,025 | |||||||||
5.00%, 11/15/30, Continuously Callable @102 | 1,780 | 1,892 | |||||||||
9,099 | |||||||||||
See notes to financial statements.
34
| USAA Mutual Funds Trust USAA Tax Exempt Intermediate-Term Fund | Schedule of Portfolio Investments — continued March 31, 2020 | ||||||
(Amounts in Thousands, Except for Shares)
Security Description | Principal Amount | Value | |||||||||
Oregon (0.0%): (m) | |||||||||||
| Clackamas County Hospital Facility Authority Revenue 5.00%, 11/15/32, Continuously Callable @102 | $ | 500 | $ | 542 | |||||||
5.00%, 11/15/37, Continuously Callable @102 | 500 | 532 | |||||||||
1,074 | |||||||||||
Pennsylvania (7.9%): | |||||||||||
| Allegheny County Higher Education Building Authority Revenue, Series A, 5.13%, 3/1/25, Pre-refunded 3/1/21 @ 100 | 1,410 | 1,462 | |||||||||
| Allegheny County Hospital Development Authority Revenue 5.00%, 4/1/35, Continuously Callable @100 | 7,315 | 8,380 | |||||||||
5.00%, 4/1/36, Continuously Callable @100 | 8,000 | 9,134 | |||||||||
4.00%, 7/15/37, Continuously Callable @100 | 2,000 | 2,225 | |||||||||
4.00%, 7/15/38, Continuously Callable @100 | 1,500 | 1,665 | |||||||||
4.00%, 7/15/39, Continuously Callable @100 | 1,440 | 1,593 | |||||||||
Allegheny County IDA Revenue, 4.88%, 11/1/24 | 3,150 | 2,864 | |||||||||
| Allegheny County Sanitary Authority Revenue (INS — Assured Guaranty Municipal Corp.) 4.00%, 12/1/33, Continuously Callable @100 | 1,500 | 1,697 | |||||||||
4.00%, 12/1/34, Continuously Callable @100 | 1,475 | 1,664 | |||||||||
| Berks County IDA Revenue 4.00%, 11/1/33, Continuously Callable @100 | 1,300 | 1,438 | |||||||||
5.00%, 11/1/34, Continuously Callable @100 | 2,000 | 2,348 | |||||||||
5.00%, 11/1/35, Continuously Callable @100 | 3,000 | 3,500 | |||||||||
Bethlehem Authority Revenue, 5.00%, 11/15/30, Continuously Callable @100 | 3,000 | 3,273 | |||||||||
| Bucks County IDA Revenue 5.00%, 10/1/30, Continuously Callable @103 | 325 | 352 | |||||||||
5.00%, 10/1/31, Continuously Callable @103 | 450 | 485 | |||||||||
5.00%, 10/1/32, Continuously Callable @103 | 790 | 848 | |||||||||
5.00%, 10/1/37, Continuously Callable @103 | 1,250 | 1,321 | |||||||||
| Butler County Hospital Authority Revenue, 5.00%, 7/1/35, Continuously Callable @100 | 1,885 | 2,135 | |||||||||
| Chester County IDA Revenue 5.00%, 10/1/34, Continuously Callable @100 | 1,000 | 1,076 | |||||||||
Series A, 5.13%, 10/15/37, Continuously Callable @100 | 2,750 | 2,749 | |||||||||
| Commonwealth Financing Authority Revenue 5.00%, 6/1/33, Continuously Callable @100 | 1,250 | 1,488 | |||||||||
5.00%, 6/1/34, Continuously Callable @100 | 2,000 | 2,377 | |||||||||
Series A, 5.00%, 6/1/34, Continuously Callable @100 | 5,000 | 5,594 | |||||||||
| Commonwealth of Pennsylvania Certificate of Participation Series A, 5.00%, 7/1/34, Continuously Callable @100 | 1,350 | 1,634 | |||||||||
Series A, 5.00%, 7/1/35, Continuously Callable @100 | 750 | 904 | |||||||||
Series A, 5.00%, 7/1/37, Continuously Callable @100 | 800 | 957 | |||||||||
| County of Beaver, GO (INS — Build America Mutual Assurance Co.) 4.00%, 4/15/28 | 2,890 | 3,372 | |||||||||
4.00%, 4/15/29, Continuously Callable @100 | 2,500 | 2,919 | |||||||||
4.00%, 4/15/30, Continuously Callable @100 | 5,000 | 5,729 | |||||||||
| County of Lehigh Revenue 4.00%, 7/1/37, Continuously Callable @100 | 2,000 | 2,202 | |||||||||
4.00%, 7/1/38, Continuously Callable @100 | 2,000 | 2,194 | |||||||||
4.00%, 7/1/39, Continuously Callable @100 | 2,000 | 2,185 | |||||||||
See notes to financial statements.
35
| USAA Mutual Funds Trust USAA Tax Exempt Intermediate-Term Fund | Schedule of Portfolio Investments — continued March 31, 2020 | ||||||
(Amounts in Thousands, Except for Shares)
Security Description | Principal Amount | Value | |||||||||
| County of Luzerne, GO (INS — Assured Guaranty Municipal Corp.), Series A, 5.00%, 11/15/29, Continuously Callable @100 | $ | 5,000 | $ | 5,858 | |||||||
| Cumberland County Municipal Authority Revenue 4.00%, 11/1/36, Continuously Callable @100 | 1,250 | 1,404 | |||||||||
4.00%, 11/1/37, Continuously Callable @100 | 2,130 | 2,386 | |||||||||
Series C-6, 4.00%, 12/1/26, Continuously Callable @102 | 6,500 | 6,445 | |||||||||
| Dauphin County General Authority Revenue 4.00%, 6/1/30, Continuously Callable @100 | 2,000 | 2,204 | |||||||||
4.00%, 6/1/31, Continuously Callable @100 | 1,000 | 1,082 | |||||||||
| Delaware County Authority Revenue, 5.00%, 10/1/25, Continuously Callable @100 | 1,000 | 1,014 | |||||||||
| Delaware River Joint Toll Bridge Commission Revenue, 5.00%, 7/1/34, Continuously Callable @100 | 3,000 | 3,650 | |||||||||
| Delaware River Port Authority Revenue, 5.00%, 1/1/25, Continuously Callable @100 | 2,720 | 2,943 | |||||||||
| Montgomery County Higher Education & Health Authority Revenue 5.00%, 9/1/34, Continuously Callable @100 | 1,750 | 2,019 | |||||||||
5.00%, 9/1/35, Continuously Callable @100 | 1,850 | 2,128 | |||||||||
4.00%, 9/1/36, Continuously Callable @100 | 1,100 | 1,182 | |||||||||
4.00%, 9/1/37, Continuously Callable @100 | 1,000 | 1,073 | |||||||||
5.00%, 9/1/37, Continuously Callable @100 | 1,750 | 2,006 | |||||||||
4.00%, 9/1/38, Continuously Callable @100 | 900 | 963 | |||||||||
4.00%, 9/1/39, Continuously Callable @100 | 1,000 | 1,067 | |||||||||
| Montgomery County IDA Revenue 5.00%, 11/15/23, Continuously Callable @100 | 1,200 | 1,244 | |||||||||
5.00%, 11/15/24, Continuously Callable @100 | 2,750 | 2,851 | |||||||||
| Montour School District, GO (INS — Assured Guaranty Municipal Corp.) Series B, 5.00%, 4/1/33, Continuously Callable @100 | 1,000 | 1,155 | |||||||||
Series B, 5.00%, 4/1/34, Continuously Callable @100 | 1,500 | 1,731 | |||||||||
Series B, 5.00%, 4/1/35, Continuously Callable @100 | 1,500 | 1,729 | |||||||||
| Northampton County General Purpose Authority Revenue, 2.15% (LIBOR01M+104bps), 8/15/48, (Put Date 8/15/24) (c) (d) | 4,645 | 4,595 | |||||||||
| Northeastern Pennsylvania Hospital & Education Authority Revenue, Series A, 5.00%, 3/1/37, Continuously Callable @100 | 1,525 | 1,674 | |||||||||
| Pennsylvania Economic Development Financing Authority Revenue 4.00%, 10/1/23, Continuously Callable @100 | 13,000 | 13,167 | |||||||||
3.00%, 4/1/39, Continuously Callable @100 | 30,000 | 30,468 | |||||||||
| Pennsylvania Higher Educational Facilities Authority Revenue 5.00%, 7/1/32, Pre-refunded 7/1/22 @ 100 | 1,625 | 1,767 | |||||||||
Series A, 5.25%, 7/15/25, Continuously Callable @100 | 1,730 | 1,933 | |||||||||
Series A, 5.25%, 7/15/26, Continuously Callable @100 | 2,020 | 2,255 | |||||||||
Series A, 5.25%, 7/15/27, Continuously Callable @100 | 2,125 | 2,370 | |||||||||
Series A, 5.25%, 7/15/28, Continuously Callable @100 | 2,245 | 2,501 | |||||||||
Series A, 5.00%, 7/15/30, Continuously Callable @100 | 2,415 | 2,666 | |||||||||
Series A, 5.25%, 7/15/33, Continuously Callable @100 | 1,965 | 2,176 | |||||||||
| Pennsylvania Turnpike Commission Revenue 5.00%, 6/1/35, Continuously Callable @100 | 10,655 | 12,279 | |||||||||
5.00%, 6/1/36, Continuously Callable @100 | 8,255 | 9,500 | |||||||||
Series A-1, 5.00%, 12/1/32, Continuously Callable @100 | 1,500 | 1,706 | |||||||||
Series A-1, 5.00%, 12/1/33, Continuously Callable @100 | 4,345 | 4,931 | |||||||||
See notes to financial statements.
36
| USAA Mutual Funds Trust USAA Tax Exempt Intermediate-Term Fund | Schedule of Portfolio Investments — continued March 31, 2020 | ||||||
(Amounts in Thousands, Except for Shares)
Security Description | Principal Amount | Value | |||||||||
Series A-1, 5.00%, 12/1/34, Continuously Callable @100 | $ | 3,000 | $ | 3,460 | |||||||
Series A-1, 5.00%, 12/1/35, Continuously Callable @100 | 3,320 | 3,824 | |||||||||
Series A-1, 5.00%, 12/1/36, Continuously Callable @100 | 3,690 | 4,244 | |||||||||
Series B, 5.00%, 12/1/32, Continuously Callable @100 | 3,500 | 4,052 | |||||||||
Series B, 5.00%, 12/1/33, Continuously Callable @100 | 7,145 | 8,258 | |||||||||
Series B, 4.00%, 6/1/34, Continuously Callable @100 | 20,000 | 22,043 | |||||||||
Series B, 5.00%, 12/1/34, Continuously Callable @100 | 6,250 | 7,209 | |||||||||
Series B, 5.00%, 12/1/34, Continuously Callable @100 | 2,000 | 2,324 | |||||||||
Series B, 5.00%, 12/1/35, Continuously Callable @100 | 5,700 | 6,565 | |||||||||
Series B, 5.00%, 12/1/35, Continuously Callable @100 | 2,000 | 2,321 | |||||||||
| Philadelphia IDA Revenue 5.00%, 5/1/35, Continuously Callable @100 | 750 | 908 | |||||||||
5.00%, 5/1/36, Continuously Callable @100 | 1,500 | 1,809 | |||||||||
5.00%, 5/1/38, Continuously Callable @100 | 1,000 | 1,197 | |||||||||
| Pittsburgh Water & Sewer Authority Revenue (INS — Assured Guaranty Municipal Corp.) Series B, 4.00%, 9/1/34, Continuously Callable @100 | 1,750 | 2,044 | |||||||||
Series B, 4.00%, 9/1/35, Continuously Callable @100 | 300 | 349 | |||||||||
| Reading School District, GO (INS — Assured Guaranty Municipal Corp.) 5.00%, 3/1/36, Continuously Callable @100 | 2,000 | 2,370 | |||||||||
5.00%, 3/1/37, Continuously Callable @100 | 1,500 | 1,774 | |||||||||
| School District of Philadelphia, GO Series A, 5.00%, 9/1/34, Continuously Callable @100 | 1,000 | 1,207 | |||||||||
Series A, 5.00%, 9/1/35, Continuously Callable @100 | 1,000 | 1,202 | |||||||||
Series A, 5.00%, 9/1/36, Continuously Callable @100 | 1,000 | 1,197 | |||||||||
Series A, 5.00%, 9/1/37, Continuously Callable @100 | 1,000 | 1,194 | |||||||||
Series A, 4.00%, 9/1/38, Continuously Callable @100 | 1,700 | 1,890 | |||||||||
Series A, 4.00%, 9/1/39, Continuously Callable @100 | 1,600 | 1,785 | |||||||||
Series F, 5.00%, 9/1/31, Continuously Callable @100 | 9,895 | 11,683 | |||||||||
Series F, 5.00%, 9/1/32, Continuously Callable @100 | 5,000 | 5,885 | |||||||||
Series F, 5.00%, 9/1/33, Continuously Callable @100 | 4,000 | 4,694 | |||||||||
Series F, 5.00%, 9/1/34, Continuously Callable @100 | 5,100 | 5,966 | |||||||||
| School District of the City of Erie, GO (INS — Assured Guaranty Municipal Corp.), Series A, 4.00%, 4/1/33, Continuously Callable @100 | 1,150 | 1,311 | |||||||||
| Scranton School District, GO (INS — Build America Mutual Assurance Co.) Series E, 5.00%, 12/1/32, Continuously Callable @100 | 1,000 | 1,209 | |||||||||
Series E, 5.00%, 12/1/33, Continuously Callable @100 | 1,600 | 1,929 | |||||||||
Series E, 5.00%, 12/1/35, Continuously Callable @100 | 750 | 899 | |||||||||
| State Public School Building Authority Revenue 5.00%, 4/1/23, Pre-refunded 4/1/22 @ 100 | 1,250 | 1,347 | |||||||||
5.00%, 6/1/29, Continuously Callable @100 | 10,000 | 11,954 | |||||||||
| State Public School Building Authority Revenue (INS — Assured Guaranty Municipal Corp.) 5.00%, 6/1/31, Continuously Callable @100 | 6,100 | 7,151 | |||||||||
4.00%, 12/1/31, Continuously Callable @100 | 15,380 | 17,197 | |||||||||
| The Berks County Municipal Authority Revenue, Series B, 5.00%, 2/1/40, (Put Date 2/1/30) (d) (e) | 3,300 | 3,673 | |||||||||
380,010 | |||||||||||
See notes to financial statements.
37
| USAA Mutual Funds Trust USAA Tax Exempt Intermediate-Term Fund | Schedule of Portfolio Investments — continued March 31, 2020 | ||||||
(Amounts in Thousands, Except for Shares)
Security Description | Principal Amount | Value | |||||||||
Puerto Rico (0.1%): | |||||||||||
| Puerto Rico Industrial Tourist Educational Medical & Environmental Control Facilities Authority Revenue, 5.00%, 4/1/27, Continuously Callable @100 | $ | 2,600 | $ | 2,529 | |||||||
Rhode Island (0.3%): | |||||||||||
| Rhode Island Health & Educational Building Corp. Revenue, 6.00%, 9/1/33, Pre-refunded 9/1/23 @ 100 | 2,000 | 2,302 | |||||||||
Rhode Island Turnpike & Bridge Authority Revenue | |||||||||||
Series A, 5.00%, 10/1/33, Continuously Callable @100 | 1,350 | 1,582 | |||||||||
Series A, 5.00%, 10/1/35, Continuously Callable @100 | 4,345 | 5,070 | |||||||||
Tobacco Settlement Financing Corp. Revenue | |||||||||||
Series A, 5.00%, 6/1/28, Continuously Callable @100 | 2,000 | 2,295 | |||||||||
Series A, 5.00%, 6/1/29, Continuously Callable @100 | 2,000 | 2,272 | |||||||||
Series A, 5.00%, 6/1/30, Continuously Callable @100 | 2,500 | 2,793 | |||||||||
16,314 | |||||||||||
South Carolina (1.1%): | |||||||||||
| Lexington County Health Services District, Inc. Revenue 4.00%, 11/1/31, Continuously Callable @100 | 1,000 | 1,129 | |||||||||
4.00%, 11/1/32, Continuously Callable @100 | 1,000 | 1,124 | |||||||||
| Patriots Energy Group Financing Agency Revenue, Series B, 1.92% (LIBOR01M+86bps), 10/1/48, (Put Date 2/1/24) (c) (d) | 20,000 | 19,201 | |||||||||
| Piedmont Municipal Power Agency Revenue (INS — Assured Guaranty Corp.) Series C, 5.00%, 1/1/28, Continuously Callable @100 | 7,200 | 7,529 | |||||||||
Series D, 5.00%, 1/1/28, Continuously Callable @100 | 2,700 | 2,823 | |||||||||
South Carolina Public Service Authority Revenue | |||||||||||
Series A, 5.00%, 12/1/34, Continuously Callable @100 | 9,835 | 11,165 | |||||||||
Series A, 5.00%, 12/1/35, Continuously Callable @100 | 7,000 | 7,917 | |||||||||
50,888 | |||||||||||
Tennessee (0.3%): | |||||||||||
| Greeneville Health & Educational Facilities Board Revenue 5.00%, 7/1/35, Continuously Callable @100 | 2,710 | 3,128 | |||||||||
5.00%, 7/1/36, Continuously Callable @100 | 3,000 | 3,447 | |||||||||
5.00%, 7/1/37, Continuously Callable @100 | 3,500 | 4,006 | |||||||||
| Metropolitan Government Nashville & Davidson County Health & Educational Facilities Board Revenue, 5.00%, 7/1/35, Continuously Callable @100 | 5,000 | 5,608 | |||||||||
16,189 | |||||||||||
Texas (10.9%): | |||||||||||
| Arlington Higher Education Finance Corp. Revenue (NBGA — Texas Permanent School Fund) 3.00%, 8/15/37, Continuously Callable @100 | 3,820 | 3,959 | |||||||||
3.00%, 8/15/38, Continuously Callable @100 | 3,935 | 4,065 | |||||||||
3.00%, 8/15/39, Continuously Callable @100 | 4,055 | 4,180 | |||||||||
| Austin Convention Enterprises, Inc. Revenue 5.00%, 1/1/34, Continuously Callable @100 | 550 | 541 | |||||||||
5.00%, 1/1/34, Continuously Callable @100 | 1,105 | 1,074 | |||||||||
| Board of Managers Joint Guadalupe County-City of Seguin Hospital Revenue 5.00%, 12/1/25 | 2,740 | 2,875 | |||||||||
5.00%, 12/1/27, Continuously Callable @100 | 2,990 | �� | 3,114 | ||||||||
5.00%, 12/1/28, Continuously Callable @100 | 1,640 | 1,702 | |||||||||
See notes to financial statements.
38
| USAA Mutual Funds Trust USAA Tax Exempt Intermediate-Term Fund | Schedule of Portfolio Investments — continued March 31, 2020 | ||||||
(Amounts in Thousands, Except for Shares)
Security Description | Principal Amount | Value | |||||||||
5.00%, 12/1/29, Continuously Callable @100 | $ | 1,600 | $ | 1,655 | |||||||
5.00%, 12/1/30, Continuously Callable @100 | 1,700 | 1,753 | |||||||||
5.25%, 12/1/35, Continuously Callable @100 | 5,150 | 5,285 | |||||||||
| Central Texas Regional Mobility Authority Revenue 5.00%, 1/1/21 | 700 | 717 | |||||||||
1/1/22 (g) | 885 | 856 | |||||||||
5.00%, 1/1/22 | 500 | 527 | |||||||||
5.00%, 1/1/23 | 500 | 542 | |||||||||
1/1/24 (g) | 7,000 | 6,447 | |||||||||
1/1/26 (g) | 2,535 | 2,187 | |||||||||
5.00%, 1/1/33, Continuously Callable @100 | 3,500 | 3,743 | |||||||||
Series A, 5.00%, 1/1/34, Continuously Callable @100 | 1,250 | 1,373 | |||||||||
Series A, 5.00%, 1/1/35, Continuously Callable @100 | 1,100 | 1,204 | |||||||||
| Central Texas Turnpike System Revenue Series C, 5.00%, 8/15/33, Continuously Callable @100 | 10,000 | 10,818 | |||||||||
Series C, 5.00%, 8/15/34, Continuously Callable @100 | 8,500 | 9,164 | |||||||||
| City of Arlington Special Tax (INS — Build America Mutual Assurance Co.) Series C, 5.00%, 2/15/34, Continuously Callable @100 | 1,500 | 1,820 | |||||||||
Series C, 5.00%, 2/15/35, Continuously Callable @100 | 1,500 | 1,813 | |||||||||
Series C, 5.00%, 2/15/36, Continuously Callable @100 | 3,100 | 3,736 | |||||||||
Series C, 5.00%, 2/15/37, Continuously Callable @100 | 3,305 | 3,965 | |||||||||
Series C, 5.00%, 2/15/38, Continuously Callable @100 | 4,380 | 5,242 | |||||||||
| City of Corpus Christi Utility System Revenue 4.00%, 7/15/32, Continuously Callable @100 | 1,800 | 2,021 | |||||||||
4.00%, 7/15/33, Continuously Callable @100 | 1,100 | 1,232 | |||||||||
4.00%, 7/15/34, Continuously Callable @100 | 1,050 | 1,171 | |||||||||
4.00%, 7/15/35, Continuously Callable @100 | 1,000 | 1,112 | |||||||||
| City of Houston Hotel Occupancy Tax & Special Revenue 5.00%, 9/1/29, Continuously Callable @100 | 2,300 | 2,599 | |||||||||
5.00%, 9/1/30, Continuously Callable @100 | 1,000 | 1,128 | |||||||||
5.00%, 9/1/32, Continuously Callable @100 | 5,615 | 6,305 | |||||||||
5.00%, 9/1/33, Continuously Callable @100 | 5,345 | 5,956 | |||||||||
5.00%, 9/1/34, Continuously Callable @100 | 2,150 | 2,396 | |||||||||
5.00%, 9/1/35, Continuously Callable @100 | 1,575 | 1,732 | |||||||||
| City of Laredo Waterworks & Sewer System Revenue 4.00%, 3/1/32, Continuously Callable @100 | 740 | 832 | |||||||||
4.00%, 3/1/33, Continuously Callable @100 | 1,000 | 1,122 | |||||||||
4.00%, 3/1/34, Continuously Callable @100 | 1,000 | 1,119 | |||||||||
4.00%, 3/1/36, Continuously Callable @100 | 1,500 | 1,669 | |||||||||
| Clifton Higher Education Finance Corp. Revenue (NBGA — Texas Permanent School Fund) 4.00%, 8/15/33, Continuously Callable @100 | 2,130 | 2,407 | |||||||||
4.00%, 8/15/34, Continuously Callable @100 | 2,275 | 2,545 | |||||||||
4.00%, 8/15/35, Continuously Callable @100 | 2,375 | 2,638 | |||||||||
4.00%, 8/15/36, Continuously Callable @100 | 3,710 | 4,099 | |||||||||
4.00%, 8/15/37, Continuously Callable @100 | 3,860 | 4,251 | |||||||||
4.00%, 8/15/38, Continuously Callable @100 | 4,015 | 4,407 | |||||||||
4.00%, 8/15/39, Continuously Callable @100 | 4,305 | 4,714 | |||||||||
Series A, 4.00%, 8/15/32, Continuously Callable @100 | 1,300 | 1,437 | |||||||||
See notes to financial statements.
39
| USAA Mutual Funds Trust USAA Tax Exempt Intermediate-Term Fund | Schedule of Portfolio Investments — continued March 31, 2020 | ||||||
(Amounts in Thousands, Except for Shares)
Security Description | Principal Amount | Value | |||||||||
| Dallas/Fort Worth International Airport Revenue Series D, 5.25%, 11/1/28, Continuously Callable @100 | $ | 2,000 | $ | 2,254 | |||||||
Series D, 5.25%, 11/1/29, Continuously Callable @100 | 7,500 | 8,444 | |||||||||
| Decatur Hospital Authority Revenue Series A, 5.25%, 9/1/29, Continuously Callable @100 | 1,000 | 1,113 | |||||||||
Series A, 5.00%, 9/1/34, Continuously Callable @100 | 1,000 | 1,081 | |||||||||
| Grand Parkway Transportation Corp. Revenue 4.00%, 10/1/39, Continuously Callable @100 | 2,500 | 2,776 | |||||||||
4.00%, 10/1/40, Continuously Callable @100 | 3,500 | 3,889 | |||||||||
| Harris County Cultural Education Facilities Finance Corp. Revenue 5.00%, 12/1/27, Pre-refunded 12/1/22 @ 100 | 4,710 | 5,198 | |||||||||
5.00%, 6/1/28, Continuously Callable @100 | 1,400 | 1,514 | |||||||||
5.28% (MUNIPSA+57bps), 12/1/49, (Put Date 12/4/24) (c) (d) | 3,330 | 3,334 | |||||||||
| Harris County Municipal Utility District No. 165, GO (INS — Build America Mutual Assurance Co.) 5.00%, 3/1/30, Continuously Callable @100 | 750 | 858 | |||||||||
5.00%, 3/1/31, Continuously Callable @100 | 2,030 | 2,317 | |||||||||
5.00%, 3/1/32, Continuously Callable @100 | 2,500 | 2,846 | |||||||||
| Houston Higher Education Finance Corp. Revenue Series A, 5.25%, 9/1/31, Continuously Callable @100 | 3,850 | 4,178 | |||||||||
Series A, 5.25%, 9/1/32, Continuously Callable @100 | 4,075 | 4,420 | |||||||||
| Karnes County Hospital District Revenue 5.00%, 2/1/29, Continuously Callable @100 | 4,000 | 4,442 | |||||||||
5.00%, 2/1/34, Continuously Callable @100 | 4,000 | 4,421 | |||||||||
| Main Street Market Square Redevelopment Authority Tax Allocation (INS — Build America Mutual Assurance Co.) 5.00%, 9/1/29, Continuously Callable @100 | 1,215 | 1,395 | |||||||||
5.00%, 9/1/30, Continuously Callable @100 | 1,380 | 1,581 | |||||||||
5.00%, 9/1/31, Continuously Callable @100 | 2,000 | 2,283 | |||||||||
5.00%, 9/1/32, Continuously Callable @100 | 1,500 | 1,706 | |||||||||
5.00%, 9/1/33, Continuously Callable @100 | 2,680 | 3,039 | |||||||||
| Matagorda County Navigation District No. 1 Revenue 2.60%, 11/1/29 | 14,010 | 14,581 | |||||||||
4.00%, 6/1/30, Continuously Callable @100 | 5,405 | 5,691 | |||||||||
| Mesquite Health Facilities Development Corp. Revenue 5.00%, 2/15/26 | 3,100 | 2,984 | |||||||||
5.00%, 2/15/35, Continuously Callable @100 | 1,075 | 914 | |||||||||
| New Hope Cultural Education Facilities Finance Corp. Revenue 5.00%, 11/1/31, Continuously Callable @102 | 1,000 | 1,070 | |||||||||
4.00%, 11/1/36, Continuously Callable @102 | 1,475 | 1,451 | |||||||||
Series A, 5.00%, 7/1/30, Continuously Callable @100 | 7,500 | 6,907 | |||||||||
Series A, 5.00%, 7/1/35, Continuously Callable @100 | 9,000 | 8,288 | |||||||||
| Newark Higher Education Finance Corp. Revenue 4.00%, 4/1/32, Continuously Callable @100 | 1,635 | 1,784 | |||||||||
4.00%, 4/1/33, Continuously Callable @100 | 2,000 | 2,173 | |||||||||
4.00%, 4/1/34, Continuously Callable @100 | 4,470 | 4,830 | |||||||||
4.00%, 4/1/35, Continuously Callable @100 | 1,650 | 1,773 | |||||||||
4.00%, 4/1/36, Continuously Callable @100 | 2,150 | 2,296 | |||||||||
See notes to financial statements.
40
| USAA Mutual Funds Trust USAA Tax Exempt Intermediate-Term Fund | Schedule of Portfolio Investments — continued March 31, 2020 | ||||||
(Amounts in Thousands, Except for Shares)
Security Description | Principal Amount | Value | |||||||||
| North East Texas Regional Mobility Authority Revenue 5.00%, 1/1/36, Continuously Callable @100 | $ | 7,000 | $ | 7,566 | |||||||
Series B, 5.00%, 1/1/36, Continuously Callable @100 | 5,485 | 5,817 | |||||||||
| North Texas Tollway Authority Revenue Series A, 5.00%, 1/1/32, Continuously Callable @100 | 8,000 | 9,176 | |||||||||
Series A, 5.00%, 1/1/34, Continuously Callable @100 | 1,515 | 1,743 | |||||||||
Series A, 4.00%, 1/1/39, Continuously Callable @100 | 14,620 | 16,046 | |||||||||
Series B, 5.00%, 1/1/31, Continuously Callable @100 | 1,500 | 1,691 | |||||||||
Series B, 5.00%, 1/1/34, Continuously Callable @100 | 7,500 | 8,482 | |||||||||
| North Texas Tollway Authority Revenue (INS — Assured Guaranty Corp.), 1/1/29 (g) | 20,000 | 17,015 | |||||||||
| North Texas Tollway Authority Revenue (INS — Assured Guaranty Municipal Corp.) Series B, 4.00%, 1/1/35, Continuously Callable @100 | 2,000 | 2,209 | |||||||||
Series B, 4.00%, 1/1/36, Continuously Callable @100 | 1,695 | 1,863 | |||||||||
| Permanent University Fund — University of Texas System Revenue 5.00%, 7/1/32, Continuously Callable @100 | 2,230 | 2,618 | |||||||||
5.00%, 7/1/33, Continuously Callable @100 | 3,250 | 3,808 | |||||||||
5.00%, 7/1/34, Continuously Callable @100 | 2,500 | 2,921 | |||||||||
| Port of Port Arthur Navigation District Revenue 1.50%, 4/1/40, Continuously Callable @100 (e) | 19,515 | 19,515 | |||||||||
6.25%, 11/1/40, Continuously Callable @100 (e) | 20,000 | 20,000 | |||||||||
Series B, 1.50%, 4/1/40, Continuously Callable @100 (e) | 13,270 | 13,270 | |||||||||
Series C, 1.54%, 4/1/40, Continuously Callable @100 (e) | 35,975 | 35,975 | |||||||||
| San Antonio Housing Trust Finance Corp. Revenue (NBGA — Federal Home Loan Mortagage Corp.), 3.50%, 4/1/43, (Put Date 10/1/28) (d) (e) | 14,935 | 15,757 | |||||||||
| Tarrant County Cultural Education Facilities Finance Corp. Revenue 5.00%, 11/15/30, Continuously Callable @100 | 2,145 | 2,531 | |||||||||
5.00%, 11/15/31, Continuously Callable @100 | 2,250 | 2,639 | |||||||||
5.00%, 11/15/32, Continuously Callable @100 | 2,365 | 2,759 | |||||||||
6.63%, 11/15/37, Continuously Callable @100 | 5,000 | 5,421 | |||||||||
5.00%, 11/15/37, Continuously Callable @100 | 2,175 | 2,490 | |||||||||
Series B, 5.00%, 7/1/37, Continuously Callable @100 | 18,225 | 21,138 | |||||||||
Series B, 5.00%, 7/1/38, Continuously Callable @100 | 19,115 | 22,094 | |||||||||
| Texas Transportation Commission State Highway Fund Revenue, 5.00%, 10/1/26 | 7,235 | 9,001 | |||||||||
| Trophy Club Public Improvement District No. 1 Special Assessment (INS — Assured Guaranty Municipal Corp.), 5.00%, 6/1/33, Continuously Callable @100 | 6,960 | 7,734 | |||||||||
| Tyler Health Facilities Development Corp. Revenue, 5.50%, 7/1/27, Pre-refunded 7/1/21 @ 100 | 10,000 | 10,554 | |||||||||
530,913 | |||||||||||
Utah (0.1%): | |||||||||||
| Jordanelle Special Service District Special Assessment Series A, 12.00%, 8/1/30, Continuously Callable @100 (f) | 4,188 | 3,555 | |||||||||
Series B, 12.00%, 8/1/30, Continuously Callable @100 (f) | 2,292 | 1,946 | |||||||||
5,501 | |||||||||||
See notes to financial statements.
41
| USAA Mutual Funds Trust USAA Tax Exempt Intermediate-Term Fund | Schedule of Portfolio Investments — continued March 31, 2020 | ||||||
(Amounts in Thousands, Except for Shares)
Security Description | Principal Amount | Value | |||||||||
Vermont (0.3%): | |||||||||||
Vermont Economic Development Authority Revenue, 5.00%, 12/15/20 | $ | 9,000 | $ | 9,194 | |||||||
| Vermont Educational & Health Buildings Financing Agency Revenue, Series A, 5.00%, 12/1/36, Continuously Callable @100 | 2,500 | 2,848 | |||||||||
12,042 | |||||||||||
Virgin Islands (0.1%): | |||||||||||
| Virgin Islands Public Finance Authority Revenue, 5.00%, 9/1/30, Continuously Callable @100 (f) | 6,500 | 7,219 | |||||||||
Virginia (1.0%): | |||||||||||
| Chesapeake Hospital Authority Revenue 4.00%, 7/1/36, Continuously Callable @100 | 1,175 | 1,309 | |||||||||
4.00%, 7/1/37, Continuously Callable @100 | 1,205 | 1,340 | |||||||||
| Fairfax County Economic Development Authority Revenue, Series A, 5.00%, 10/1/36, Continuously Callable @102 | 2,150 | 2,267 | |||||||||
| Roanoke Economic Development Authority Revenue, 5.00%, 7/1/25, Continuously Callable @100 | 10,000 | 10,088 | |||||||||
| Stafford County Economic Development Authority Revenue 5.00%, 6/15/33, Continuously Callable @100 | 750 | 863 | |||||||||
5.00%, 6/15/34, Continuously Callable @100 | 2,620 | 3,005 | |||||||||
5.00%, 6/15/35, Continuously Callable @100 | 1,930 | 2,207 | |||||||||
| Virginia College Building Authority Revenue 5.00%, 6/1/21, Continuously Callable @100 | 985 | 972 | |||||||||
5.00%, 6/1/26, Continuously Callable @100 | 11,280 | 10,321 | |||||||||
4.00%, 2/1/34, Continuously Callable @100 | 10,000 | 11,463 | |||||||||
4.00%, 2/1/36, Continuously Callable @100 | 3,000 | 3,417 | |||||||||
47,252 | |||||||||||
Washington (0.4%): | |||||||||||
| Tobacco Settlement Authority Revenue, 5.25%, 6/1/31, Continuously Callable @100 | 5,000 | 5,017 | |||||||||
| Washington Health Care Facilities Authority Revenue 5.00%, 8/15/33, Continuously Callable @100 | 3,090 | 3,641 | |||||||||
5.00%, 8/15/34, Continuously Callable @100 | 3,470 | 4,068 | |||||||||
5.00%, 7/1/35, Continuously Callable @100 | 2,355 | 2,773 | |||||||||
5.00%, 7/1/36, Continuously Callable @100 | 2,250 | 2,643 | |||||||||
4.00%, 7/1/37, Continuously Callable @100 | 3,125 | 3,425 | |||||||||
21,567 | |||||||||||
West Virginia (0.4%): | |||||||||||
| West Virginia Hospital Finance Authority Revenue 5.00%, 6/1/33, Continuously Callable @100 | 1,850 | 2,172 | |||||||||
5.00%, 1/1/34, Continuously Callable @100 | 2,360 | 2,768 | |||||||||
5.00%, 6/1/34, Continuously Callable @100 | 2,970 | 3,478 | |||||||||
5.00%, 1/1/35, Continuously Callable @100 | 2,920 | 3,404 | |||||||||
5.00%, 6/1/35, Continuously Callable @100 | 2,405 | 2,808 | |||||||||
5.00%, 9/1/38, Continuously Callable @100 | 1,000 | 1,156 | |||||||||
5.00%, 9/1/39, Continuously Callable @100 | 1,000 | 1,151 | |||||||||
16,937 | |||||||||||
See notes to financial statements.
42
| USAA Mutual Funds Trust USAA Tax Exempt Intermediate-Term Fund | Schedule of Portfolio Investments — continued March 31, 2020 | ||||||
(Amounts in Thousands, Except for Shares)
Security Description | Principal Amount | Value | |||||||||
Wisconsin (0.8%): | |||||||||||
| Public Finance Authority Revenue 3.00%, 4/1/25 (f) | $ | 425 | $ | 418 | |||||||
4.00%, 6/15/29, Continuously Callable @100 (f) | 325 | 310 | |||||||||
4.00%, 9/1/29, Continuously Callable @103 (f) | 1,250 | 1,218 | |||||||||
5.25%, 5/15/37, Continuously Callable @102 (f) | 1,000 | 1,041 | |||||||||
5.00%, 6/15/39, Continuously Callable @100 (f) | 410 | 403 | |||||||||
5.00%, 9/1/39, Continuously Callable @103 (f) | 2,230 | 2,228 | |||||||||
5.00%, 4/1/40, Continuously Callable @100 (f) | 1,175 | 1,194 | |||||||||
Series A, 5.25%, 10/1/38, Continuously Callable @100 | 3,250 | 3,769 | |||||||||
Series D, 4.05%, 11/1/30, Continuously Callable @100 | 1,500 | 1,446 | |||||||||
| Wisconsin Health & Educational Facilities Authority Revenue 5.00%, 8/15/34, Continuously Callable @100 | 1,000 | 1,123 | |||||||||
4.00%, 11/15/36, Continuously Callable @100 | 9,830 | 10,767 | |||||||||
4.00%, 3/15/40, Continuously Callable @100 | 750 | 831 | |||||||||
Series A, 5.00%, 7/15/28, Pre-refunded 7/15/21 @ 100 | 2,000 | 2,103 | |||||||||
Series A, 5.13%, 4/15/31, Pre-refunded 4/15/23 @ 100 | 5,000 | 5,595 | |||||||||
Series C, 5.00%, 8/15/26, Pre-refunded 8/15/22 @ 100 | 1,500 | 1,633 | |||||||||
Series C, 5.00%, 8/15/29, Pre-refunded 8/15/22 @ 100 | 1,935 | 2,106 | |||||||||
36,185 | |||||||||||
Total Municipal Bonds (Cost $4,580,870) | 4,745,408 | ||||||||||
Total Investments (Cost $4,601,799) — 98.8% | 4,756,082 | ||||||||||
Other assets in excess of liabilities — 1.2% | 57,243 | ||||||||||
NET ASSETS — 100.00% | $ | 4,813,325 | |||||||||
(a) The Fund's Adviser has deemed this security to be illiquid based upon procedures approved by the Board of Trustees. As of March 31, 2020, illiquid securities were 0.2% of the Fund's net assets.
(b) All or a portion of this security has been designated as collateral for securities purchased on a when-issued basis.
(c) Variable or Floating-Rate Security. Rate disclosed is as of March 31, 2020.
(d) Put Bond.
(e) Variable Rate Demand Notes that provide the rights to sell the security at face value on either that day or within the rate-reset period. The interest rate is reset on the put date at a stipulated daily, weekly, monthly, quarterly, or other specified time interval to reflect current market conditions. These securities do not indicate a reference rate and spread in their description.
(f) Rule 144A security or other security that is restricted as to resale to institutional investors. The Fund's Adviser has deemed this security to be liquid based upon procedures approved by the Board of Trustees. As of March 31, 2020, the fair value of these securities was $95, 515 (thousands) and amounted to 2.0% of net assets.
(g) Zero-coupon bond.
(h) Stepped-coupon security converts to coupon form on 11/01/25 with a rate of 4.00%.
(i) Stepped-coupon security converts to coupon form on 11/01/25 with a rate of 4.35%.
(j) Security purchased on a when-issued basis.
See notes to financial statements.
43
| USAA Mutual Funds Trust USAA Tax Exempt Intermediate-Term Fund | Schedule of Portfolio Investments — continued March 31, 2020 | ||||||
(k) Security was fair valued based upon procedures approved by the Board of Trustees and represents 0.0% of the Fund's net assets as of March 31, 2020. This security is classified as Level 3 within the fair value hierarchy. (See Note 2) .
(l) Rounds to less than $1.
(m) Amount represents less than 0.05% of net assets.
(n) Up to 2.05% of the coupon may be paid in kind.
AMBAC — American Municipal Bond Assurance Corporation
bps — Basis points
GO — General Obligation
IDA — Industrial Development Authority
LIBOR — London InterBank Offered Rate
LIBOR01M — 1 Month US Dollar LIBOR, rate disclosed as of March 31, 2020, based on the last reset date of the security
MUNIPSA — Municipal Swap Index
PIK — Payment in-kind
PLC — Public Limited Company
Credit Enhancements — Adds the financial strength of the provider of the enhancement to support the issuer's ability to repay the principal and interest payments when due. The enhancement may be provided by a high-quality bank, insurance company or other corporation, or a collateral trust. The enhancements do not guarantee the market values of the securities.
INS Principal and interest payments are insured by the name listed. Although bond insurance reduces the risk of loss due to default by an issuer, such bonds remain subject to the risk that value may fluctuate for other reasons, and there is no assurance that the insurance company will meet its obligations.
LIQ Liquidity enhancement that may, under certain circumstances, provide for repayment of principal and interest upon demand from the name listed.
NBGA Principal and interest payments or, under certain circumstances, underlying mortgages, are guaranteed by a nonbank guarantee agreement from the name listed.
See notes to financial statements.
44
USAA Mutual Funds Trust | Statement of Assets and Liabilities March 31, 2020 | ||||||
(Amounts in Thousands, Except Per Share Amounts)
| USAA Tax Exempt Intermediate-Term Fund | |||||||
Assets: | |||||||
Investments, at value (Cost $4,601,799) | $ | 4,756,082 | |||||
Cash | 50 | ||||||
Receivables: | |||||||
Interest and dividends | 51,768 | ||||||
Capital shares issued | 2,016 | ||||||
Investments sold | 33,299 | ||||||
From Adviser | 3 | ||||||
Prepaid expenses | 85 | ||||||
Total Assets | 4,843,303 | ||||||
Liabilities: | |||||||
Payables: | |||||||
Distributions | 1,403 | ||||||
Investments purchased | 17,459 | ||||||
Capital shares redeemed | 8,822 | ||||||
Accrued expenses and other payables: | |||||||
Investment advisory fees | 1,180 | ||||||
Administration fees | 632 | ||||||
Custodian fees | 45 | ||||||
Transfer agent fees | 287 | ||||||
Compliance fees | 3 | ||||||
Trustees' fees | 1 | ||||||
| 12b-1 fees | 3 | ||||||
Other accrued expenses | 143 | ||||||
Total Liabilities | 29,978 | ||||||
Net Assets: | |||||||
Capital | 4,746,530 | ||||||
Total distributable earnings/(loss) | 66,795 | ||||||
Net Assets | $ | 4,813,325 | |||||
Net Assets | |||||||
Fund Shares | $ | 4,788,060 | |||||
Adviser Shares | 25,265 | ||||||
Total | $ | 4,813,325 | |||||
Shares (unlimited number of shares authorized with no par value): | |||||||
Fund Shares | 359,219 | ||||||
Adviser Shares | 1,896 | ||||||
Total | 361,115 | ||||||
Net asset value, offering, and redemption price per share: (a) | |||||||
Fund Shares | $ | 13.33 | |||||
Adviser Shares | $ | 13.33 | |||||
(a) Per share amount may not recalculate due to rounding of net assets and/or shares outstanding.
See notes to financial statements.
45
USAA Mutual Funds Trust | Statement of Operations For the Year Ended March 31, 2020 | ||||||
(Amounts in Thousands)
| USAA Tax Exempt Intermediate-Term Fund | |||||||
Investment Income: | |||||||
Interest | $ | 165,223 | |||||
Total Income | 165,223 | ||||||
Expenses: | |||||||
Investment advisory fees | 14,434 | ||||||
Professional fees | 18 | ||||||
Administration Fees — Fund Shares | 7,455 | ||||||
Administration Fees — Adviser Shares | 36 | ||||||
Sub-Administration fees | 19 | ||||||
12b-1 fees — Adviser Shares | 60 | ||||||
Custodian fees | 249 | ||||||
Transfer agent fees — Fund Shares | 1,531 | ||||||
Transfer agent fees — Adviser Shares | 15 | ||||||
Trustees' fees | 44 | ||||||
Compliance fees | 22 | ||||||
Legal and audit fees | 74 | ||||||
State registration and filing fees | 125 | ||||||
Interest expense on interfund lending | 5 | ||||||
Other expenses | 417 | ||||||
Total Expenses | 24,504 | ||||||
Expenses waived/reimbursed by AMCO | (14 | ) | |||||
Expenses waived/reimbursed by Adviser | (16 | ) | |||||
Net Expenses | 24,474 | ||||||
Net Investment Income (Loss) | 140,749 | ||||||
Realized/Unrealized Gains (Losses) from Investments: | |||||||
Net realized gains (losses) from investment securities | (11,622 | ) | |||||
Net change in unrealized appreciation/depreciation on investment securities | (9,397 | ) | |||||
Net realized/unrealized gains (losses) on investments | (21,019 | ) | |||||
Change in net assets resulting from operations | $ | 119,730 | |||||
See notes to financial statements.
46
USAA Mutual Funds Trust | Statements of Changes in Net Assets | ||||||
(Amounts in Thousands)
| USAA Tax Exempt Intermediate-Term Fund | |||||||||||
| Year Ended March 31, 2020 | Year Ended March 31, 2019 | ||||||||||
From Investments: | |||||||||||
Operations: | |||||||||||
Net investment income (loss) | $ | 140,749 | $ | 143,593 | |||||||
Net realized gains (losses) from investments | (11,622 | ) | (26,355 | ) | |||||||
| Net change in unrealized appreciation/depreciation on investments | (9,397 | ) | 112,323 | ||||||||
Change in net assets resulting from operations | 119,730 | 229,561 | |||||||||
Distributions to Shareholders: | |||||||||||
Fund Shares | (140,378 | ) | (142,284 | ) | |||||||
Adviser Shares | (613 | ) | (753 | ) | |||||||
Change in net assets resulting from distributions to shareholders | (140,991 | ) | (143,037 | ) | |||||||
Change in net assets resulting from capital transactions | 57,378 | 58,744 | |||||||||
Change in net assets | 36,117 | 145,268 | |||||||||
Net Assets: | |||||||||||
Beginning of period | 4,777,208 | 4,631,940 | |||||||||
End of period | $ | 4,813,325 | $ | 4,777,208 | |||||||
Capital Transactions: | |||||||||||
Fund Shares | |||||||||||
Proceeds from shares issued | $ | 821,794 | $ | 885,615 | |||||||
Distributions reinvested | 120,977 | 121,052 | |||||||||
Cost of shares redeemed | (887,865 | ) | (943,830 | ) | |||||||
Total Fund Shares | $ | 54,906 | $ | 62,837 | |||||||
Adviser Shares | |||||||||||
Proceeds from shares issued | $ | 6,875 | $ | 9,970 | |||||||
Distributions reinvested | 512 | 679 | |||||||||
Cost of shares redeemed | (4,915 | ) | (14,742 | ) | |||||||
Total Adviser Shares | $ | 2,472 | $ | (4,093 | ) | ||||||
Change in net assets resulting from capital transactions | $ | 57,378 | $ | 58,744 | |||||||
Share Transactions: | |||||||||||
Fund Shares | |||||||||||
Issued | 60,384 | 67,541 | |||||||||
Reinvested | 8,878 | 9,222 | |||||||||
Redeemed | (65,764 | ) | (72,055 | ) | |||||||
Total Fund Shares | 3,498 | 4,708 | |||||||||
Adviser Shares | |||||||||||
Issued | 510 | 768 | |||||||||
Reinvested | 38 | 52 | |||||||||
Redeemed | (365 | ) | (1,119 | ) | |||||||
Total Adviser Shares | 183 | (299 | ) | ||||||||
Change in Shares | 3,681 | 4,409 | |||||||||
See notes to financial statements.
47
USAA Mutual Funds Trust | Financial Highlights | ||||||
For a Share Outstanding Throughout Each Period
Investment Activities | Distributions to Shareholders From | ||||||||||||||||||||||||||
| Net Asset Value, Beginning of Period | Net Investment Income (Loss) | Net Realized and Unrealized Gains (Losses) on Investments | Total from Investment Activities | Net Investment Income | Total Distributions | ||||||||||||||||||||||
USAA Tax Exempt Intermediate-Term Fund | |||||||||||||||||||||||||||
Fund Shares | |||||||||||||||||||||||||||
| Year Ended March 31, 2020 | $ | 13.37 | 0.38 | (c) | (0.03 | ) | 0.35 | (0.39 | ) | (0.39 | ) | ||||||||||||||||
| Year Ended March 31, 2019 | $ | 13.12 | 0.41 | 0.24 | 0.65 | (0.40 | ) | (0.40 | ) | ||||||||||||||||||
| Year Ended March 31, 2018 | $ | 13.08 | 0.41 | 0.04 | 0.45 | (0.41 | ) | (0.41 | ) | ||||||||||||||||||
| Year Ended March 31, 2017 | $ | 13.61 | 0.42 | (0.53 | ) | (0.11 | ) | (0.42 | ) | (0.42 | ) | ||||||||||||||||
| Year Ended March 31, 2016 | $ | 13.59 | 0.44 | 0.02 | 0.46 | (0.44 | ) | (0.44 | ) | ||||||||||||||||||
Adviser Shares | |||||||||||||||||||||||||||
| Year Ended March 31, 2020 | $ | 13.36 | 0.35 | (c) | (0.03 | ) | 0.32 | (0.35 | ) | (0.35 | ) | ||||||||||||||||
| Year Ended March 31, 2019 | $ | 13.12 | 0.38 | 0.23 | 0.61 | (0.37 | ) | (0.37 | ) | ||||||||||||||||||
| Year Ended March 31, 2018 | $ | 13.07 | 0.38 | 0.05 | 0.43 | (0.38 | ) | (0.38 | ) | ||||||||||||||||||
| Year Ended March 31, 2017 | $ | 13.61 | 0.38 | (0.54 | ) | (0.16 | ) | (0.38 | ) | (0.38 | ) | ||||||||||||||||
| Year Ended March 31, 2016 | $ | 13.58 | 0.41 | 0.03 | 0.44 | (0.41 | ) | (0.41 | ) | ||||||||||||||||||
* Assumes reinvestment of all net investment income and realized capital gain distributions, if any, during the period. Includes adjustments in accordance with U.S. generally accepted accounting principles and could differ from the Lipper reported return.
^ The net expense ratio may not correlate to the applicable expense limits in place during the period since the current contractual expense limitation is applied for a two year period beginning July 1, 2019 and in effect through June 30, 2021, instead of coinciding with the Fund's fiscal year end. Details of the current contractual expense limitation in effect can be found in Note 4 of the accompanying Notes to Financial Statements.
(a) Reflects total annual operating expenses for reductions of expenses paid indirectly for the March 31 fiscal years ended 2017 and 2016. Expenses paid indirectly decreased the expense ratio for each of these respective years by less than 0.01%.
(b) Portfolio turnover is calculated on the basis of the Fund as a whole without distinguishing between the classes of shares issued.
(c) Per share net investment income (loss) has been calculated using the average daily shares method.
(d) Amount is less than $0.005 per share.
(e) Effective August 1, 2017, AMCO voluntarily agreed to limit the annual expenses of the Adviser Shares to 0.75% of the Adviser Shares' average daily net assets. Prior to this date, the voluntary expense limit was 0.80%.
See notes to financial statements.
48
USAA Mutual Funds Trust | Financial Highlights — continued | ||||||
For a Share Outstanding Throughout Each Period
Ratios to Average Net Assets | Supplemental Data | ||||||||||||||||||||||||||||||||||
| Redemption fees added to beneficial interests | Net Asset Value, End of Period | Total Return* | Net Expenses^ | Net Investment Income (Loss) | Gross Expenses(a) | Net Assets, End of Period (000's) | Portfolio Turnover(b) | ||||||||||||||||||||||||||||
USAA Tax Exempt Intermediate-Term Fund | |||||||||||||||||||||||||||||||||||
Fund Shares | |||||||||||||||||||||||||||||||||||
| Year Ended March 31, 2020 | — | $ | 13.33 | 2.56 | % | 0.49 | % | 2.82 | % | 0.49 | % | $ | 4,788,060 | 26 | % | ||||||||||||||||||||
| Year Ended March 31, 2019 | — | $ | 13.37 | 5.06 | % | 0.52 | % | 3.07 | % | 0.52 | % | $ | 4,754,320 | 8 | % | ||||||||||||||||||||
| Year Ended March 31, 2018 | — | $ | 13.12 | 3.47 | % | 0.51 | % | 3.09 | % | 0.51 | % | $ | 4,605,543 | 11 | % | ||||||||||||||||||||
| Year Ended March 31, 2017 | — | (d) | $ | 13.08 | (0.84 | )% | 0.52 | % | 3.13 | % | 0.52 | % | $ | 4,280,892 | 16 | % | |||||||||||||||||||
| Year Ended March 31, 2016 | — | $ | 13.61 | 3.48 | % | 0.54 | % | 3.28 | % | 0.54 | % | $ | 4,332,360 | 10 | % | ||||||||||||||||||||
Adviser Shares | |||||||||||||||||||||||||||||||||||
| Year Ended March 31, 2020 | — | $ | 13.33 | 2.37 | % | 0.75 | % | 2.57 | % | 0.87 | % | $ | 25,265 | 26 | % | ||||||||||||||||||||
| Year Ended March 31, 2019 | — | $ | 13.36 | 4.75 | % | 0.75 | % | 2.85 | % | 0.84 | % | $ | 22,888 | 8 | % | ||||||||||||||||||||
| Year Ended March 31, 2018 | — | $ | 13.12 | 3.28 | % | 0.77 | %(e) | 2.83 | % | 0.85 | % | $ | 26,397 | 11 | % | ||||||||||||||||||||
| Year Ended March 31, 2017 | — | (d) | $ | 13.07 | (1.19 | )% | 0.80 | % | 2.84 | % | 0.83 | % | $ | 37,351 | 16 | % | |||||||||||||||||||
| Year Ended March 31, 2016 | — | (d) | $ | 13.61 | 3.28 | % | 0.80 | % | 3.02 | % | 0.88 | % | $ | 42,054 | 10 | % | |||||||||||||||||||
See notes to financial statements.
49
USAA Mutual Funds Trust | Notes to Financial Statements March 31, 2020 | ||||||
1. Organization:
USAA Mutual Funds Trust (the "Trust") is organized as a Delaware statutory trust and is registered under the Investment Company Act of 1940, as amended (the "1940 Act"), as an open-end investment company. The Trust is comprised of 47 funds and is authorized to issue an unlimited number of shares, which are units of beneficial interest with no par value.
The accompanying financial statements are those of the USAA Tax Exempt Intermediate-Term Fund (the "Fund"). The Fund offers two classes of shares: Fund Shares and Adviser Shares. The Fund is classified as diversified under the 1940 Act.
Each class of shares of the Fund has substantially identical rights and privileges except with respect to fees paid under distribution plans, expenses allocable exclusively to each class of shares, voting rights on matters solely affecting a single class of shares, and the exchange privilege of each class of shares.
On November 6, 2018, United Services Automobile Association ("USAA"), the parent company of USAA Asset Management Company ("AMCO"), the investment adviser to the Fund, and USAA Transfer Agency Company, d/b/a USAA Shareholder Account Services ("SAS"), the transfer agent to the Fund, announced that AMCO and SAS would be acquired by Victory Capital Holdings Inc., a global investment management firm headquartered in Cleveland, Ohio (the "Transaction"). The Transaction closed on July 1, 2019. A special shareholder meeting was held on April 18, 2019, at which shareholders of the Fund approved a new investment advisory agreement between the Trust, on behalf of the Fund, and Victory Capital Management Inc. ("VCM" or "Adviser"). Effective July 1, 2019, VCM replaced AMCO as the investment adviser to the Fund and Victory Capital Transfer Agency Company replaced SAS as the Fund's transfer agent. In addition, effective on that same date, shareholders of the Fund also elected the following two new directors to the Board of the Trust to serve upon the closing of the Transaction: (1) David C. Brown, to serve as an Interested Trustee; and (2) John C. Walters, to serve as an Independent Trustee.
Under the Trust's organizational documents, its officers and trustees are indemnified against certain liabilities arising out of the performance of their duties to the Fund. In addition, in the normal course of business, the Fund enters into contracts with its vendors and others that provide for general indemnifications. The Fund's maximum exposure under these arrangements is unknown, as this would involve future claims that may be made against the Fund. However, based on experience, the Fund expects that risk of loss to be remote.
2. Significant Accounting Policies:
The following is a summary of significant accounting policies followed by the Trust in the preparation of its financial statements. The policies are in conformity with generally accepted accounting principles in the United States of America ("GAAP"). The preparation of financial statements in accordance with GAAP requires management to make estimates and assumptions that affect the reported amounts of assets and liabilities and disclosure of contingent assets and liabilities at the date of the financial statements and the reported amounts of income and expenses for the period. Actual results could differ from those estimates. The Fund follows the specialized accounting and reporting requirements under GAAP that are applicable to investment companies under Accounting Standards Codification Topic 946.
Investment Valuation:
The Fund records investments at fair value. Fair value is defined as the price that would be received to sell an asset or paid to transfer a liability in an orderly transaction between market participants at the measurement date.
The valuation techniques described below maximize the use of observable inputs and minimize the use of unobservable inputs in determining fair value. The inputs used for valuing the Fund's investments are summarized in the three broad levels listed below:
• Level 1 — quoted prices in active markets for identical securities
• Level 2 — other significant observable inputs (including quoted prices for similar securities or interest rates applicable to those securities, etc. )
50
USAA Mutual Funds Trust | Notes to Financial Statements — continued March 31, 2020 | ||||||
• Level 3 — significant unobservable inputs (including the Fund's own assumptions in determining the fair value of investments)
Changes in valuation techniques may result in transfers in or out of an assigned level within the disclosure hierarchy. The inputs or methodologies used for valuation techniques are not necessarily an indication of the risk associated with entering into those investments.
The Adviser has established the Pricing and Liquidity Committee (the "Committee"), and subject to the Trust's Board of Trustees (the "Board") oversight, the Committee administers and oversees the Fund's valuation policies and procedures, which are approved by the Board.
Debt securities of United States ("U.S.") issuers, along with corporate and municipal securities, including short-term investments maturing in 60 days or less, may be valued using evaluated bid or the last sales price to price securities by dealers or an independent pricing service approved by the Board. These valuations are typically categorized as Level 2 in the fair value hierarchy.
Portfolio securities listed or traded on securities exchanges, including exchange-traded funds ("ETFs"), American Depositary Receipts ("ADRs") and Rights, are valued at the closing price on the exchange or system where the security is principally traded, if available, or at the Nasdaq Official Closing Price. If there have been no sales for that day on the exchange or system, then a security is valued at the last available bid quotation on the exchange or system where the security is principally traded. In each of these situations, valuations are typically categorized as Level 1 in the fair value hierarchy.
Effective July 1, 2019, the valuation methodology applied to certain debt securities changed. Securities that were previously valued at an evaluated mean are now valued at the evaluated bid or the last sales price.
In the event that price quotations or valuations are not readily available, are not reflective of market value, or a significant event has been recognized in relation to a security or class of securities, the securities are valued in good faith by the Committee in accordance with valuation procedures approved by the Board. These valuations typically are categorized as Level 2 or Level 3 in the fair value hierarchy, based on the observability of inputs used to determine the fair value. The effect of fair value pricing is that securities may not be priced on the basis of quotations from the primary market in which they are traded and the actual price realized from the sale of a security may differ materially from the fair value price. Valuing these securities at fair value is intended to cause the Fund's net asset value ("NAV") to be more reliable than it otherwise would be.
A summary of the valuations as of March 31, 2020, based upon the three levels defined above, is included in the table below while the breakdown, by category, of investments is disclosed in the Schedule of Portfolio Investments (amounts in thousands):
Level 1 | Level 2 | Level 3 | Total | ||||||||||||||||
Common Stocks | $ | 10,674 | $ | — | $ | — | $ | 10,674 | |||||||||||
Municipal Bonds | — | 4,745,408 | — | (a) | 4,745,408 | ||||||||||||||
Total | $ | 10,674 | $ | 4,745,408 | $ | — | $ | 4,756,082 | |||||||||||
(a) Amount is less than $1.
For the year ended March 31, 2020, there were no transfers in or out of the Level 3 fair value hierarchy.
Securities Purchased on a Delayed-Delivery or When-Issued Basis:
The Fund may purchase securities on a delayed-delivery or when-issued basis. Delivery and payment for securities that have been purchased by the Fund on a delayed-delivery, or when-issued basis, or for delayed draws on loans can take place a month or more after the trade date. At the time the Fund makes the commitment to purchase a security on a delayed-delivery or when-issued basis, the Fund records the transaction and reflects the value of the security in determining net asset value. No interest accrues to the Fund until the transaction settles and payment takes place. A segregated account is established and the Fund maintains cash and/or marketable securities at least equal in value to commitments for delayed-delivery or when-issued securities. If the Fund owns delayed-delivery or when-issued securities, these values are included in Payable for investments purchased on the
51
USAA Mutual Funds Trust | Notes to Financial Statements — continued March 31, 2020 | ||||||
accompanying Statement of Assets and Liabilities and the segregated assets are identified in the Schedule of Portfolio Investments.
Municipal Obligations:
The values of municipal obligations can fluctuate and may be affected by adverse tax, legislative, or political changes, and by financial developments affecting municipal issuers. Payment of municipal obligations may depend on a relatively limited source of revenue, resulting in greater credit risk. Future changes in federal tax laws or the activity of an issuer may adversely affect the tax-exempt status of municipal obligations.
Investment Transactions and Related Income:
Changes in holdings of investments are accounted for no later than one business day following the trade date. For financial reporting purposes, however, investment transactions are accounted for on trade date on the last business day of the reporting period. Interest income is determined on the basis of coupon interest accrued using the effective interest method which adjusts, where applicable, the amortization of premiums or accretion of discount. Gains or losses realized on sales of securities are determined by comparing the identified cost of the security lot sold with the net sales proceeds.
Federal Income Taxes:
It is the Fund's policy to continue to qualify as a regulated investment company by complying with the provisions available to certain investment companies, as defined in applicable sections of the Internal Revenue Code, and to make distributions of net investment income and net realized gains sufficient to relieve it from all, or substantially all, federal income taxes. Accordingly, no provision for federal income taxes is required in the financial statements. The Fund has a tax year end of March 31.
Management of the Fund has reviewed tax positions taken in tax years that remain subject to examination by all major tax jurisdictions, including federal (i.e., the last four tax years which includes the current fiscal tax year end). Management believes that there is no tax liability resulting from unrecognized tax benefits related to uncertain tax positions taken.
Allocations:
Expenses directly attributable to the Fund are charged to the Fund, while expenses that are attributable to more than one fund in the Trust, or jointly with an affiliated trust, are allocated among the respective funds in the Trust and/or affiliated trust based upon net assets or another appropriate basis.
Income, expenses (other than class-specific expenses such as transfer agent fees, state registration fees, distribution and 12/b-1 fees, and printing fees), and realized and unrealized gains or losses on investments are allocated to each class of shares based on its relative net assets on the date income is earned or expenses and realized and unrealized gains and losses are incurred.
Cross-Trade Transactions:
Pursuant to Rule 17a-7 under the 1940 Act, the Fund may engage in cross-trades which are securities transactions with affiliated investment companies and advisory accounts managed by the Adviser and any applicable sub-adviser. Any such purchase or sale transaction must be effected without brokerage commission or other remuneration, except for customary transfer fees. The transaction must be effected at the current market price, which is either the security's last sale price on an exchange or, if there are no transactions in the security that day, at the average of the highest bid and lowest asked price. For the year ended March 31, 2020, the Fund engaged in the following securities transactions with affiliated funds, which resulted in the following net realized gains (losses) (amounts in thousands):
| Purchases | Sales | Net Realized Gains (Losses) | |||||||||
| $ | 95,145 | $ | 78,515 | $ | — | ||||||
Fees Paid Indirectly:
Expense offsets to custody fees that arise from credits on cash balances maintained on deposit are reflected on the Statement of Operations, as applicable, as "Fees paid indirectly."
52
USAA Mutual Funds Trust | Notes to Financial Statements — continued March 31, 2020 | ||||||
3. Purchases and Sales:
Cost of purchases and proceeds from sales/maturities of securities (excluding securities maturing less than one year from acquisition) for the year ended March 31, 2020, were as follows for the Fund (amounts in thousands):
| Excluding U.S. Government Securities | |||||||
Purchases | Sales | ||||||
$ | 1,249,942 | $ | 1,323,774 | ||||
There were no purchases and sales of U.S. Government Securities during the year ended March 31, 2020.
4. Fees and Transactions with Affiliates and Related Parties:
Investment Advisory and Management Fees:
Effective with the Transaction on July 1, 2019, investment advisory services are provided to the Fund by the Adviser, a New York corporation registered as an investment adviser with the Securities and Exchange Commission ("SEC"). The Adviser is a wholly-owned indirect subsidiary of Victory Capital Holdings, Inc., a publicly traded Delaware corporation, and a wholly-owned direct subsidiary of Victory Capital Operating, LLC. Under the terms of the Investment Advisory Agreement, the Adviser is entitled to receive a base fee and a performance adjustment. The Fund's base fee is accrued daily and paid monthly at an annualized rate of 0.28% of the Fund's average daily net assets. The amount incurred and paid to VCM from July 1, 2019 through March 31, 2020, was $11,067 thousand and is reflected on the Statement of Operations as Investment Advisory fees.
Prior to the Transaction on July 1, 2019, AMCO provided investment management services to the Fund pursuant to an Advisory Agreement. Under this agreement, AMCO was responsible for managing the business and affairs of the Fund, and for directly managing day-to-day investment of the Fund's assets, subject to the authority of and supervision by the Board. The investment management fee for the Fund was comprised of a base fee and a performance adjustment. The Fund's base fee was accrued daily and paid monthly at an annualized rate of 0.28% of the Fund's average daily net assets.
Effective with the Transaction on July 1, 2019, no performance adjustments will be made for periods beginning July 1, 2019, through June 30, 2020. Only performance beginning as of July 1, 2019, and thereafter will be utilized in calculating future performance adjustments.
Prior to the Transaction on July 1, 2019, the performance adjustment for each share class was calculated monthly by comparing the Fund's performance to that of the Lipper Intermediate Municipal Debt Funds Index. The Lipper Intermediate Municipal Debt Funds Index tracks the total return performance of funds within the Lipper Intermediate Municipal Debt Funds category.
The performance period for each share class consists of the current month plus the previous 35 months (or the number of months beginning July 1, 2019, if fewer). The following table is utilized to determine the extent of the performance adjustment:
| Over/Under Performance Relative to Index (in basis points)(a) | Annual Adjustment Rate (in basis points)(a) | ||||||
+/- 20 to 50 | +/- 4 | ||||||
+/- 51 to 100 | +/- 5 | ||||||
+/- 101 and greater | +/- 6 | ||||||
(a) Based on the difference between average annual performance of the relevant share class of the Fund and its relevant index, rounded to the nearest basis point. Average daily net assets of the share class are calculated over a rolling 36-month period.
53
USAA Mutual Funds Trust | Notes to Financial Statements — continued March 31, 2020 | ||||||
Each class' annual performance adjustment rate is multiplied by the average daily net assets of each respective class over the entire performance period, which is then multiplied by a fraction, the numerator of which is the number of days in the month and the denominator of which is 365 (366 in leap years). The resulting amount is then added to (in the case of overperformance), or subtracted from (in the case of underperformance) the base fee.
Under the performance fee arrangement, each class pays a positive performance fee adjustment for a performance period whenever the class outperforms the Lipper Intermediate Municipal Debt Funds Index over that period, even if the class has overall negative returns during the performance period.
For the period April 1, 2019 through June 30, 2019, the performance adjustment for the Fund Shares was $452 thousand and 0.01% of net assets. The Adviser Shares did not incur any performance adjustment. Base fees incurred and paid to AMCO from April 1, 2019 through June 30, 2019, were $3,367 thousand and reflected on the Statement of Operations as Investment Advisory fees.
Administration and Servicing Fees:
Effective with the Transaction on July 1, 2019, VCM serves as the Fund's administrator and fund accountant. Under a Fund Administration Servicing, Servicing and Accounting Agreement, VCM is paid for its services an annual fee at a rate of 0.15% of average daily net assets for both the Fund Shares and Adviser Shares. Amounts incurred from July 1, 2019 through March 31, 2020, are $5,660 and $27 thousand for Fund Shares and Adviser Shares, respectively. These amounts are reflected on the Statement of Operations as Administration fees.
Prior to the Transaction on July 1, 2019, AMCO provided certain administration and servicing functions for the Fund. For such services, AMCO received a fee accrued daily and paid monthly at an annualized rate of 0.15% of average daily net assets for both the Fund Shares and Adviser Shares. Amounts incurred from April 1, 2019 through June 30, 2019, were $1,795 and $9 thousand for Fund Shares and Adviser Shares, respectively. These amounts are reflected on the Statement of Operations as Administration fees.
Effective with the Transaction on July 1, 2019, the Fund (as part of the Trust) has entered into an agreement to provide compliance services with the Adviser, pursuant to which the Adviser furnishes its compliance personnel, including the services of the Chief Compliance Officer ("CCO"), and other resources reasonably necessary to provide the Trust with compliance oversight services related to the design, administration and oversight of a compliance program for the Trust in accordance with Rule 38a-1 under the 1940 Act. The CCO is an employee of the Adviser, which pays the compensation of the CCO and support staff. Funds in the Trust, Victory Variable Insurance Funds, Victory Portfolios and Victory Portfolios II (collectively, the "Victory Funds Complex") in the aggregate, compensate the Adviser for these services. The amount incurred during the period from July 1, 2019 through March 31, 2020, is reflected on the Statement of Operations as Compliance fees.
Effective with the Transaction on July 1, 2019, Citi Fund Services Ohio, Inc. ("Citi"), an affiliate of Citibank, acts as sub-administrator and sub-fund accountant to the Fund pursuant to a Sub-Administration and Sub-Fund Accounting Services Agreement between VCM and Citi. The Trust reimburses VCM and Citi for all of their reasonable out-of-pocket expenses incurred in providing these services and certain other expenses specifically allocated to the Funds, under the Fund Administration, Servicing, and Accounting Agreement. The amount incurred during the period from July 1, 2019 through March 31, 2020, is reflected on the Statement of Operations as Sub-Administration fees.
In addition to the services provided under its Administration and Servicing Agreement with the Fund, AMCO also provided certain compliance and legal services for the benefit of the Fund prior to the Transaction on July 1, 2019. The Board approved the reimbursement of a portion of these expenses incurred by AMCO. Amounts reimbursed by the Fund to AMCO for these compliance and legal services are presented on the Statement of Operations as Professional fees.
54
USAA Mutual Funds Trust | Notes to Financial Statements — continued March 31, 2020 | ||||||
Transfer Agency Fees:
Effective with the Transaction on July 1, 2019, Victory Capital Transfer Agency, Inc. ("VCTA"), (formerly, USAA Shareholder Account Services ("SAS")), provides transfer agency services to the Fund. VCTA, an affiliate of the Adviser, provides transfer agent services to the Fund Shares and Adviser Shares based on an annual charge of $25.50 per shareholder account plus out-of-pocket expenses. VCTA pays a portion of these fees to certain intermediaries for the administration and servicing of accounts that are held with such intermediaries. Amounts incurred and paid to VCTA from July 1, 2019 through March 31, 2020, was $1,175 and $11 thousand for the Fund Shares and Adviser Shares, respectively. Amounts incurred and paid to SAS from April 1, 2019 through June 30, 2019, was $356 and $4 thousand for the Fund Shares and Adviser Shares, respectively. These amounts are reflected on the Statement of Operations as Transfer agent fees.
Effective with the Transaction on July 1, 2019, FIS Investor Services LLC serves as sub-transfer agent and dividend disbursing agent for the Fund pursuant to a Sub-Transfer Agent agreement between VCTA and FIS Investor Services LLC.VCTA provides FIS Investor Services LLC a fee for providing these services.
Distribution and Service 12b-1 Fees:
Effective with the Transaction on July 1, 2019, Victory Capital Advisers, Inc. (the "Distributor"), an affiliate of the Adviser, serves as distributor for the continuous offering of the Adviser Shares pursuant to a Distribution Agreement between the Distributor and the Trust. Effective on or about June 30, 2020, the Distributor's name will change to Victory Capital Services, Inc. Pursuant to the Distribution and Service Plans adopted in accordance with Rule 12b-1 under the 1940 Act, the Distributor may receive a monthly distribution and service fee, at an annual rate of up to 0.25% of the average daily net assets of the Adviser Shares. Amounts incurred and paid to the Distributor from July 1, 2019 through March 31, 2020, are $45 thousand and reflected on the Statement of Operations as 12b-1 fees.
Adviser Shares are offered and sold without imposition of an initial sales charge or a contingent deferred sales charge.
Prior to the Transaction on July 1, 2019, the Fund adopted a plan pursuant to Rule 12b-1 under the 1940 Act with respect to the Adviser Shares. Under the plan, the Adviser Shares paid fees to USAA Investment Management Company ("IMCO"), the distributor, for distribution and shareholder services. IMCO paid all or a portion of such fees to intermediaries that made the Adviser Shares available for investment by their customers. The fee was accrued daily and paid monthly at an annual rate of 0.25% of the Adviser Shares' average daily net assets. IMCO also provided exclusive underwriting and distribution of the Fund's shares on a continuing best-efforts basis and received no fee or other compensation for these services, but may have received 12b-1 fees as described above, with respect to Adviser Shares. Amounts incurred and paid to IMCO from April 1, 2019 through June 30, 2019, are $15 thousand and reflected on the Statement of Operations as 12b-1 fees.
Other Fees:
Prior to the Transaction on July 1, 2019, State Street Bank and Trust Company served as the Fund's accounting agent and custodian.
Effective August 5, 2019, Citibank, N.A., serves as the Fund's custodian.
K&L Gates LLP provides legal services to the Trust.
Effective with the Transaction on July 1, 2019, the Adviser has entered into an expense limitation agreement with the Fund until at least June 30, 2021. Under the terms of the agreement, the Adviser has agreed to waive fees or reimburse certain expenses to the extent that ordinary operating expenses incurred by certain classes of the Fund in any fiscal year exceed the expense limit for such classes of the Fund. Such excess amounts will be the liability of the Adviser. Interest, taxes, brokerage commissions, other expenditures which are capitalized in accordance with GAAP, and other extraordinary expenses not incurred in the ordinary course of the Fund's business are excluded from the expense limits. Effective July 1, 2019 through March 31, 2020, the expense limit (excluding voluntary waivers) is 0.48% and 0.75% for the Fund Shares and Adviser Shares, respectively.
55
USAA Mutual Funds Trust | Notes to Financial Statements — continued March 31, 2020 | ||||||
Under this expense limitation agreement, the Fund has agreed to repay fees and expenses that were waived or reimbursed by the Adviser for a period up to three years after the fiscal year in which the waiver or reimbursement took place, subject to the lesser of any operating expense limits in effect at the time of: (a) the original waiver or expense reimbursement; or (b) the recoupment, after giving effect to the recoupment amount. As of March 31, 2020, the following amounts are available to be repaid to the Adviser (amounts in thousands).
Expires 03/31/2023 | |||||||
$ | 16 | ||||||
The Adviser, may voluntarily waive or reimburse additional fees to assist the Fund in maintaining competitive expense ratios. Voluntary waivers and reimbursements applicable to the Fund are not available to be recouped at a future time. There were no voluntary waivers or reimbursements for the year ended March 31, 2020.
Prior to the Transaction on July 1, 2019, AMCO agreed, through July 31, 2019, to limit the total annual operating expenses of the Adviser Shares to 0.75% of average daily net assets, excluding extraordinary expenses and before reductions of any expenses paid indirectly, and to reimburse the Adviser Shares for all expenses in excess of those amounts. Effective with the Transaction on July 1, 2019, this expense limit is no longer in effect and is not available to be recouped by AMCO. For the period April 1, 2019 through June 30, 2019, amounts reimbursed by the Adviser Shares are reflected on the Statement of Operations as Expenses waived/reimbursed by AMCO.
Certain officers and/or interested trustees of the Fund are also officers and/or employees of the Adviser, Administrator, Sub-Administrator, Sub-Fund Accountant, and Legal.
5. Risks:
The Fund may be subject to other risks in addition to these identified risks.
The Fund may be subject to various risks as described in the Fund's prospectus. A widespread health crisis such as a global pandemic could cause substantial market volatility, exchange trading suspensions and closures, impact the ability to complete redemptions, and affect Fund performance. For example, the novel coronavirus disease (COVID-19) has resulted in significant disruptions to global business activity that may continue, worsen and/or trigger other factors impacting the liquidity or value of investments. The impact of health crises and other epidemics and pandemics may affect the global economy in ways that cannot necessarily be foreseen at the present time. Health crises may exacerbate other pre-existing political, social, and economic risks. Any such impact could adversely affect the Funds' performance, resulting in losses to your investment. For more information, please refer to the "Principal risks" section of the Fund's prospectus.
The fixed-income securities held in the Fund's portfolio are subject to credit risk, which is the possibility that an issuer of a fixed-income security will fail to make timely interest and/or principal payments on its securities or that negative market perceptions of the issuer's ability to make such payments will cause the price of that security to decline. The Fund accepts some credit risk as a recognized means to enhance an investor's return. All fixed-income securities, varying from the highest quality to the very speculative, have some degree of credit risk. Fixed-income securities rated below investment grade, also known as "junk" or high-yield bonds, generally entail greater economic, credit, and liquidity risk than investment-grade securities. Their prices may be more volatile, especially during economic downturns, financial setbacks, or liquidity events.
The Fund is subject to the risk that the market value of the bonds in its portfolio will fluctuate because of changes in interest rates, changes in the supply of and demand for tax-exempt securities, and other market factors. Bond prices generally are linked to the prevailing market interest rates. In general, when interest rates rise, bond prices fall; conversely, when interest rates fall, bond prices rise. The price volatility of a bond also depends on its duration. Generally, the longer the duration of a bond, the greater is its sensitivity to interest rates. To compensate investors for this higher interest rate risk, bonds with longer durations generally offer higher yields than bonds with shorter durations. Decisions
56
USAA Mutual Funds Trust | Notes to Financial Statements — continued March 31, 2020 | ||||||
by the U.S. Federal Reserve regarding interest rate and monetary policy can have a significant effect on the value of debt securities as well as the overall strength of the U.S. economy. Precise interest rate predictions are difficult to make, and interest rates may change unexpectedly and dramatically in response to extreme changes in market or economic conditions. Interest rates have been unusually low in recent years in the U.S. and abroad, and central banks have reduced rates further in an effort to combat the economic effects of the COVID-19 pandemic. Extremely low or negative interest rates may become more prevalent or may not work as intended, and the impact on various markets that interest rate or other significant policy changes may have is unknown. The ability of an issuer of a debt security to repay principal prior to a security's maturity can increase the security's sensitivity to interest rate changes.
During a period of declining interest rates, many municipal bonds may be "called," or redeemed, by the issuer before the stated maturity. An issuer might call, or refinance, a higher-yielding bond for the same reason that a homeowner would refinance a home mortgage. When bonds are called, the Fund is affected in several ways. Most likely, the Fund will reinvest the bond-call proceeds in bonds with lower interest rates. The Fund's income may drop as a result. The Fund also may realize a taxable capital gain(or loss).
6. Borrowing and Interfund Lending:
Line of Credit:
Effective with the Transaction on July 1, 2019, the Victory Funds Complex participates in a short-term, demand note "Line of Credit" agreement with Citibank. Under the agreement with Citibank, the Victory Funds Complex could borrow up to $600 million, of which $300 million is committed and $300 million is uncommitted. $40 million of the Line of Credit is reserved for use by the Victory Floating Rate Fund, another series of the Victory Funds Complex, with that Fund paying the related commitment fees for that amount. The purpose of the agreement is to meet temporary or emergency cash needs. Citibank receives an annual commitment fee of 0.15% on $300 million for providing the Line of Credit. Each fund in the Victory Funds Complex pays a pro-rata portion of the commitment fees plus any interest (one month LIBOR plus one percent) on amounts borrowed. Interest charged to the Fund, if any, during the period is presented on the Statement of Operations under line of credit fees.
Prior to the Transaction on July 1, 2019, the line of credit among the Trust, with respect to its funds, and USAA Capital Corporation ("CAPCO") terminated. For the period from April 1, 2019 to June 30, 2019, the Fund paid CAPCO facility fees of $10 thousand.
The Fund had no borrowings under either agreement with Citibank or CAPCO during the year ended March 31, 2020.
Interfund Lending:
Effective with the Transaction on July 1, 2019, the Trust and Adviser rely on an exemptive order granted by the SEC in March 2017 (the "Order"), permitting the establishment and operation of an Interfund Lending Facility (the "Facility"). The Facility allows the Fund to directly lend and borrow money to or from any other Fund in the Victory Fund Complex relying upon the Order at rates beneficial to both the borrowing and lending funds. Advances under the Facility are allowed for temporary or emergency purposes. The interfund loan rate is determined, as specified in the Order, by averaging the current repurchase agreement rate and the current bank loan rate. As a Borrower, interest charged to the Fund, if any, during the period is presented on the Statement of Operations under Interest expense on Interfund lending. As a Lender, interest earned by the Fund, if any, during the period is presented on the Statement of Operations under Income on Interfund lending.
57
USAA Mutual Funds Trust | Notes to Financial Statements — continued March 31, 2020 | ||||||
The average borrowing for the days outstanding and average interest rate for the Fund during the year ended March 31, 2020 were as follows (amounts in thousands):
| Borrower or Lender | Amount Outstanding at March 31, 2020 | Average Borrowing* | Days Borrowing Outstanding | Average Interest Rate | Maximum Borrowing During the Period | ||||||||||||||||||
Borrower | $ | — | $ | 10,003 | 13 | 1.80 | % | $ | 26,787 | ||||||||||||||
* For the year ended March 31, 2020, based on the number of days borrowings were outstanding.
7. Federal Income Tax Information:
The Fund intends to declare daily and distribute any net investment income monthly. Distributable net realized gains, if any, are declared and paid at least annually.
The amounts of dividends from net investment income and distributions from net realized gains (collectively distributions to shareholders) are determined in accordance with federal income tax regulations, which may differ from GAAP. To the extent these "book/tax" differences are permanent in nature (e.g., net operating loss and distribution reclassification,), such amounts are reclassified within the components of net assets based on their federal tax-basis treatment; temporary differences (e.g., wash sales) do not require reclassification. To the extent dividends and distributions exceed net investment income and net realized gains for tax purposes, they are reported as distributions of capital. Net investment losses incurred by the Fund may be reclassified as an offset to capital on the accompanying Statement of Assets and Liabilities.
As of March 31, 2020, on the Statement of Assets and Liabilities, there were no permanent book-to-tax difference reclassification adjustments.
The tax character of distributions paid during the tax years ended as noted below, were as follows (total distributions paid may differ from the Statement of Changes in Net Assets because, for tax purposes, dividends are recognized when actually paid) (amounts in thousands):
Year Ended March 31, 2020 | Year Ended March 31, 2019 | ||||||||||||||||||
Distributions paid from | Distributions paid from | ||||||||||||||||||
| Tax-Exempt Income | Total Distributions Paid | Tax-Exempt Income | Total Distributions Paid | ||||||||||||||||
$ | 140,991 | $ | 140,991 | $ | 143,037 | $ | 143,037 | ||||||||||||
As of the tax year ended March 31, 2020, the components of accumulated earnings (deficit) on a tax basis were as follows (amounts in thousands):
| Undistributed Tax Exempt Income | Distributions Payable | Accumulated Capital and Other Losses | Unrealized Appreciation (Depreciation)* | Total Accumulated Earnings (Deficit) | |||||||||||||||||||
$ | 14,184 | $ | (11,905 | ) | $ | (87,983 | ) | $ | 152,499 | $ | 66,795 | ||||||||||||
* The difference between the book-basis and tax-basis of unrealized appreciation/depreciation is attributable to the tax deferral of losses on wash sales and defaulted bond income accruals.
At March 31, 2020, the Fund had net capital loss carryforwards as shown in the table below (amounts in thousands). It is unlikely that the Board will authorize a distribution of capital gains realized in the future until the capital loss carryforwards have been used.
| Short-Term Amount | Long-Term Amount | Total | |||||||||
| $ | 28,161 | $ | 59,822 | $ | 87,983 | ||||||
58
USAA Mutual Funds Trust | Notes to Financial Statements — continued March 31, 2020 | ||||||
As of March 31, 2020, the cost basis for federal income tax purposes, gross unrealized appreciation, gross unrealized depreciation, and net unrealized appreciation (depreciation) for investments were as follows (amounts in thousands):
| Cost of Investments for Federal Tax Purposes | Gross Unrealized Appreciation | Gross Unrealized Depreciation | Net Unrealized Appreciation (Depreciation) | ||||||||||||
| $ | 4,603,583 | $ | 206,521 | $ | (54,022 | ) | $ | 152,499 | |||||||
8. Risk Management Program
The USAA Funds have adopted and implemented a written liquidity risk management program (the "LRMP") as required by Rule 22e-4 under the Investment Company Act of 1940, as amended. The LRMP is reasonably designed to assess and manage the Fund's liquidity risk, taking into consideration the Fund's investment strategy and the liquidity of its portfolio investments during normal and reasonably foreseeable stressed market conditions; its short and long-term cash flow projections; and its cash holdings and access to other liquidity management tools such as available funding sources including the Victory Funds Complex Interfund Lending Facility and Line of Credit (discussed in the Notes to Financial Statements). The USAA Funds' Board of Trustees approved the appointment of the Fund's investment adviser, Victory Capital Management Inc. ("Victory Capital"), as the administrator of the LRMP. At an in-person meeting held on February 26, 2020, Victory Capital provided an oral and written report to the Trustees on the operation and effectiveness of the LRMP during the previous year.
Victory Capital manages liquidity risks associated with the Fund's investments by monitoring, among other things, cash and cash equivalents, any use of derivatives, the concentration of investments, the appropriateness of the Fund's investment strategy, and by classifying every fund investment as either highly liquid, moderately liquid, less liquid or illiquid on at least a monthly basis. To assist with the classification of Fund investments, Victory Capital has retained a third-party provider of liquidity evaluation services. This provider determines preliminary liquidity classifications for all portfolio holdings based upon portfolio-level data and certain assumptions provided by Victory Capital. Victory Capital reviews the preliminary liquidity classifications, and, when appropriate, considers other information including input from the Fund's portfolio managers (including the portfolio managers employed by any investment sub-advisers) in determining final liquidity classifications.
The report from Victory Capital concluded that the Fund did not experience any significant liquidity challenges during the covered period, and the Fund's LRMP is reasonably designed to assess and manage its liquidity risk. The report also concluded that the LRMP continues to operate adequately and effectively to enable Victory Capital to oversee and manage liquidity risk and ensure the Fund is able to meet redemption requests without significant dilution to the remaining investors' interest in the Fund. During the review period, the Fund's portfolio consisted primarily of highly liquid investments, which are defined as cash and any investments reasonably expected to be converted to cash in current market conditions in three business days or less without significantly changing the market value of the investment. Therefore, the Fund has not adopted a Highly Liquid Investment Minimum. The Fund's investments were below the limitation on illiquid investments during the review period. Additionally, Victory Capital indicated that no events occurred that would require the filing of Form N-LIQUID and recommended no material changes to the LRMP.
9. Subsequent Event
An outbreak of respiratory disease called COVID-19 was first detected in China in December 2019 and subsequently spread internationally. The transmission of COVID-19 and efforts to contain its spread have resulted in international, national and local border closings and other significant travel restrictions and disruptions, significant disruptions to business operations, supply chains and consumer activity, significant challenges in healthcare service preparation and delivery, and quarantines, as well as general concern and uncertainty that has negatively affected the economic environment and that
59
USAA Mutual Funds Trust | Notes to Financial Statements — continued March 31, 2020 | ||||||
occurred subsequent to year end may have a significant negative impact on the operations and profitability of the Funds' investments. These impacts have caused significant volatility and declines in global financial markets, which have caused losses for investors. The impact of the COVID-19 pandemic may be short term or may last for an extended period of time, and in either case could result in a substantial economic downturn or recession. Public health crises may exacerbate other pre-existing political, social, economic, market and financial risks. The extent of the impact to the financial performance of the Funds' investments will depend on future developments, including (i) the duration and spread of the outbreak, (ii) the restrictions and advisories, (iii) the effects on the financial markets, and (iv) the effects on the economy overall, all of which are highly uncertain and cannot be predicted.
The Board of Trustees of USAA Mutual Funds Trust has approved redesignating the Fund's current Adviser Shares as "Class A" shares ("Redesignation"). This change is expected to be effective in late June 2020 ("Redesignation Date").
Class A shares will be available for purchase through financial intermediaries and the Fund will pay ongoing distribution and/or service (12b-1) fees at annual rate of up to 0.25% of the average daily net assets of its Class A shares. In addition, the Transfer Agency fee will convert to an annual basis point rate of 0.10% of daily net assets of its Class A shares from its current flat per account fee. Class A shares will be offered and sold at their public offering price, which is the net asset value per share plus any applicable initial sales charge, also referred to as a "front-end sales load." For purchases on or after the Redesignation Date, Class A Shares will be offered and sold with the imposition of a maximum initial sales charge of up to 2.25% of the offering price of the Fund. A contingent deferred sales charge of up to 0.75% may be imposed on redemptions of Class A shares purchased without an initial sales charge if shares are redeemed within 12 months of purchase.
The Redesignation will be made without the imposition of any sales loads, fees, or other charges to Adviser Shares held in shareholder accounts on the Redesignation Date. The Redesignation will not be considered a taxable event for federal income tax purposes.
60
REPORT OF INDEPENDENT REGISTERED PUBLIC ACCOUNTING FIRM
To the Shareholders and the Board of Trustees of USAA Tax Exempt Intermediate-Term Fund:
Opinion on the Financial Statements
We have audited the accompanying statement of assets and liabilities of USAA Tax Exempt Intermediate-Term Fund (the "Fund") (one of the funds constituting USAA Mutual Funds Trust (the "Trust")), including the schedule of portfolio investments, as of March 31, 2020, and the related statement of operations for the year then ended, the statements of changes in net assets for each of the two years in the period then ended, the financial highlights for each of the five years in the period then ended and the related notes (collectively referred to as the "financial statements"). In our opinion, the financial statements present fairly, in all material respects, the financial position of the Fund at March 31, 2020, the results of its operations for the year then ended, the changes in its net assets for each of the two years in the period then ended and its financial highlights for each of the five years in the period then ended, in conformity with U.S. generally accepted accounting principles.
Basis for Opinion
These financial statements are the responsibility of the Trust's management. Our responsibility is to express an opinion on the Fund's financial statements based on our audits. We are a public accounting firm registered with the Public Company Accounting Oversight Board (United States) ("PCAOB") and are required to be independent with respect to the Trust in accordance with the U.S. federal securities laws and the applicable rules and regulations of the Securities and Exchange Commission and the PCAOB.
We conducted our audits in accordance with the standards of the PCAOB. Those standards require that we plan and perform the audit to obtain reasonable assurance about whether the financial statements are free of material misstatement, whether due to error or fraud. The Trust is not required to have, nor were we engaged to perform, an audit of the Trust's internal control over financial reporting. As part of our audits we are required to obtain an understanding of internal control over financial reporting, but not for the purpose of expressing an opinion on the effectiveness of the Trust's internal control over financial reporting. Accordingly, we express no such opinion.
Our audits included performing procedures to assess the risks of material misstatement of the financial statements, whether due to error or fraud, and performing procedures that respond to those risks. Such procedures included examining, on a test basis, evidence regarding the amounts and disclosures in the financial statements. Our procedures included confirmation of securities owned as of March 31, 2020, by correspondence with the custodian and brokers or by other appropriate auditing procedures where replies from brokers were not received. Our audits also included evaluating the accounting principles used and significant estimates made by management, as well as evaluating the overall presentation of the financial statements. We believe that our audits provide a reasonable basis for our opinion.

We have served as the auditor of one or more Victory Capital investment companies since 1995.
San Antonio, Texas
May 27, 2020
61
USAA Mutual Funds Trust | Supplemental Information March 31, 2020 | ||||||
(Unaudited)
Expense Examples
As a shareholder of the Fund, you may incur two types of costs: (1) transaction costs, and (2) ongoing costs, including management fees and other Fund expenses. These examples are intended to help you understand your ongoing costs (in dollars) of investing in the Fund and to compare these costs with the ongoing costs of investing in other mutual funds.
These examples are based on an investment of $1,000 invested at the beginning of the period and held for the entire period from October 1, 2019, through March 31, 2020.
The Actual Expense figures in the table below provide information about actual account values and actual expenses. You may use the information below, together with the amount you invested, to estimate the expenses that you paid over the period. Simply divide your account value by $1,000 (for example, an $8,600 account value divided by $1,000 = 8.6), then multiply the result by the number in the table under the heading entitled "Actual Expenses Paid During Period" to estimate the expenses you paid on your account during this period.
The Hypothetical Expense figures in the table below provide information about hypothetical account values and hypothetical expenses based on the Fund's actual expense ratio and an assumed rate of return of 5% per year before expenses, which is not the Fund's actual return. The hypothetical account values and expenses may not be used to estimate the actual ending account balance or expenses you paid for the period. You may use this information to compare this 5% hypothetical example with the 5% hypothetical examples that appear in shareholder reports of other funds.
Please note the expenses shown in the table below are meant to highlight your ongoing costs only and do not reflect any transactional costs. If these transactional costs were included, your costs would have been higher.
| Beginning Account Value 10/1/19 | Actual Ending Account Value 3/31/20 | Hypothetical Ending Account Value 3/31/20 | Actual Expenses Paid During Period 10/1/19- 3/31/20* | Hypothetical Expenses Paid During Period 10/1/19- 3/31/20* | Annualized Expense Ratio During Period 10/1/19- 3/31/20 | ||||||||||||||||||||||
Fund Shares | $ | 1,000.00 | $ | 990.90 | $ | 1,022.65 | $ | 2.34 | $ | 2.38 | 0.47 | % | |||||||||||||||
Adviser Shares | 1,000.00 | 989.60 | 1,021.25 | 3.73 | 3.79 | 0.75 | % | ||||||||||||||||||||
* Expenses are equal to the average account value multiplied by the Fund's annualized expense ratio multiplied by 183/366 (the number of days in the most recent fiscal half-year divided by the number of days in the fiscal year).
Proxy Voting and Portfolio Holdings Information
Proxy Voting:
Information regarding the policies and procedures the Fund uses to determine how to vote proxies relating to portfolio securities is available without charge, upon request, by calling (800) 539-3863. The information is also included in the Fund's Statement of Additional Information, which is available on the SEC's website at www.sec.gov.
Information relating to how the Fund voted proxies relating to portfolio securities held during the most recent 12 months ended June 30 is available on the SEC's website at www.sec.gov.
Availability of Schedules of Portfolio Investments:
The Trust files a complete list of Schedules of Portfolio Investments with the SEC for the first and third quarter of each fiscal year on Form N-PORT. Forms N-PORT are available on the SEC's web site at www.sec.gov.
62
USAA Mutual Funds Trust | Supplemental Information March 31, 2020 | ||||||
(Unaudited)
Trustee and Officer Information
Board of Trustees:
Overall responsibility for management of the Trust rests with the Board. The Trust is managed by the Board in accordance with the laws of the state of Delaware. There are currently 10 Trustees, eight of whom are not "interested persons" of the Trust within the meaning of that term under the 1940 Act ("Independent Trustees") and two of whom is an "interested person" of the Trust within the meaning of that term under the 1940 Act ("Interested Trustee"). The Trustees, in turn, elect the officers of the Trust to actively supervise its day-to-day operations.
The following tables list the Trustees, their ages, position with the Trust, commencement of service, principal occupations during the past five years and any directorships of other investment companies or companies whose securities are registered under the Securities Exchange Act of 1934, as amended, or who file reports under that Act. Each Trustee oversees 47 portfolios in the Trust. Each Trustee's address is 15935 La Cantera Pkwy, Building Two, San Antonio, TX, 78256. Pursuant to a policy adopted by the Board, the term of office for each Trustee shall be until the Independent Trustee reaches age 75 or an Interested Trustee reaches age 75. The Board may change or grant exceptions from this policy at any time without shareholder approval. A Trustee may resign or be removed by a vote of the other Trustees or the holders of a majority of the outstanding shares of the Trust at any time. Vacancies on the Board can be filled by the action of a majority of the Trustees, provided that after filling such vacancy at least two-thirds of the Trustees have been elected by the shareholders.
Name and Date of Birth | Position Held with the Trust | Year Commenced Service | Principal Occupation During Past 5 Years | Other Directorships Held During Past 5 Years | |||||||||||||||
Independent Trustees. | |||||||||||||||||||
| Jefferson C. Boyce, Born September 1957 | Lead Independent Trustee, and Vice Chairman | 2013 | Senior Managing Director, New York Life Investments, LLC (1992-2012) | Westhab, Inc. | |||||||||||||||
| John C. Walters, Born February 1962 | Trustee | 2019 | Retired. Mr. Walters brings significant Board experience including active involvement with the board of a Fortune 500 company, and a proven record of leading large, complex financial organizations. He has a demonstrated record of success in distribution, manufacturing, investment brokerage, and investment management in both the retail and institutional investment businesses. He has substantial experience in the investment management business with a demonstrated ability to develop and drive strategy while managing operation, financial, and investment risk. | Guardian Variable Products Trust (16 series), Lead Independent Director; Amerilife Holdings LLC, Director; Stadion Money Management; Director; University of North Carolina (Chapel Hill), Member Board of Governors. | |||||||||||||||
63
USAA Mutual Funds Trust | Supplemental Information March 31, 2020 | ||||||
(Unaudited)
Name and Date of Birth | Position Held with the Trust | Year Commenced Service | Principal Occupation During Past 5 Years | Other Directorships Held During Past 5 Years | |||||||||||||||
| Robert L. Mason, Ph.D., Born July 1946 | Trustee | 1997 | Adjunct Professor in the Department of Management Science and Statistics in the College of Business at the University of Texas at San Antonio (since 2001); Institute Analyst, Southwest Research Institute (March 2002-January 2016) | None | |||||||||||||||
| Dawn M. Hawley, Born February 1954 | Trustee | 2014 | Manager of Finance, Menil Foundation, Inc. (May 2007-June 2011), which is a private foundation that oversees the assemblage of sculptures, prints, drawings, photographs, and rare books. Director of Financial Planning and Analysis and Chief Financial Officer, AIM Management Group, Inc. (October 1987-January 2006) | None | |||||||||||||||
| Paul L. McNamara, Born July 1948 | Trustee | 2012 | Director, Cantor Opportunistic Alternatives Fund, LLC (March 2010-February 2014) , which is a closed-end fund of funds by Cantor Fitzgerald Investment Advisors, LLC | None | |||||||||||||||
64
USAA Mutual Funds Trust | Supplemental Information March 31, 2020 | ||||||
(Unaudited)
Name and Date of Birth | Position Held with the Trust | Year Commenced Service | Principal Occupation During Past 5 Years | Other Directorships Held During Past 5 Years | |||||||||||||||
| Richard Y. Newton III, Born January 1956 | Trustee | 2017 | Director, Elta North America (01/18-present), which is a global leader in the design, manufacture, and support of innovative electronic systems in the ground, maritime, airborne, and security domains for the nation's warfighters, security personnel, and first responders; Managing Partner, Pioneer Partnership Development Group (December 2015-present)); Executive Director, The Union League Club of New York (June 2014-November 2015): Executive Vice President, Air Force Association (August 2012-May 2014); Lieutenant General, United States Air Force (January 2008-June 2012) | None | |||||||||||||||
| Barbara B. Ostdiek, Ph.D., Born March 1964 | Trustee | 2008 | Senior Associate Dean of Degree Programs at Jesse H. Jones Graduate School of Business at Rice University (since 2013); Associate Professor of Finance at Jessie H. Jones Graduate School of Business at Rice University (since 2001) | None | |||||||||||||||
| Michael F. Reimherr, Born August 1945 | Trustee | 2000 | President of Reimherr Business Consulting (May 1995-December 2017); St. Mary's University Investment Committee overseeing University Endowment (since 2014) | None | |||||||||||||||
65
USAA Mutual Funds Trust | Supplemental Information March 31, 2020 | ||||||
(Unaudited)
Name and Date of Birth | Position Held with the Trust | Year Commenced Service | Principal Occupation During Past 5 Years | Other Directorships Held During Past 5 Years | |||||||||||||||
Interested Trustees. | |||||||||||||||||||
| David C. Brown, ** Born May 1972 | Trustee | 2019 | Chairman and Chief Executive Officer (since 2013), Co-Chief Executive Officer (2011-2013), Victory Capital Management Inc.; Chairman and Chief Executive Officer, Victory Capital Holdings, Inc. (since 2013). Mr. Brown brings to the Board extensive business, finance and leadership skills gained and developed through years of experience in the financial services industry, including his tenure overseeing the strategic direction as CEO of Victory Capital. These skills, combined with Mr. Brown's extensive knowledge of the financial services industry and demonstrated success in the development and distribution of investment strategies and products, enable him to provide valuable insights to the Board and strategic direction for the Funds | Trustee, Victory Portfolios (42 series), Victory Portfolios II (26 series), Victory Variable Insurance Funds (9 series) | |||||||||||||||
66
USAA Mutual Funds Trust | Supplemental Information March 31, 2020 | ||||||
(Unaudited)
Name and Date of Birth | Position Held with the Trust | Year Commenced Service | Principal Occupation During Past 5 Years | Other Directorships Held During Past 5 Years | |||||||||||||||
| Daniel S. McNamara, ** Born June 1966 | Trustee and Chair of the Board of Trustees | 2012 | Trustee, President, and Vice Chairman of USAA ETF Trust (June 2017-June 2019); President of Financial Advice & Solutions Group (FASG), USAA (since 2013); Director, IMCO (September 2009-April 2014); President, AMCO (August, 2011-April 2013); Senior Vice President of USAA Financial Planning Services Insurance Agency, Inc. (FPS) (since 2011); Director of USAA Investment Management Company (IMCO) (since 2009); Chairman of Board of IMCO (since 2013); Director of USAA Asset Management Company (AMCO), (August 2011-June 2019); President and Director of USAA Shareholder Account Services (SAS)(October 2009-June 2019); Director and Vice Chairman of FPS (since 2013); President and Director of USAA Investment Corporation (ICORP) (since 2010); Chairman of Board of ICORP (since 2013); Director of USAA Financial Advisors, Inc. (FAI) (since 2013); Chairman of Board of FAI (since 2015). Mr. McNamara brings to the Board extensive experience in the financial services industry, including experience as an officer of the Trust. | None | |||||||||||||||
** Mr. McNamara and Mr. Brown are "Interested Persons" by reason of their relationships with the Adviser.
The Statement of Additional Information includes additional information about the Trustees of the Trust and is available, without charge, on the SEC's website at www.sec.gov and/or by calling (800)-539-3863.
67
USAA Mutual Funds Trust | Supplemental Information March 31, 2020 | ||||||
(Unaudited)
Officers:
The officers of the Trust, their ages, commencement of service and their principal occupations during the past five years, are detailed in the following table. Each officer serves until the earlier of his or her resignation, removal, retirement, death, or the election of a successor. The mailing address of each officer of the Trust is 15935 La Cantera Pkwy, Building Two, San Antonio, TX, 78256. The officers of the Trust receive no compensation directly from the Trust for performing the duties of their offices.
Name and Date of Birth | Position with the Trust | Year Commenced Service | Principal Occupation During Past 5 Years | ||||||||||||
Interested Officers. | |||||||||||||||
| Christopher K. Dyer, Born February 1962 | President | 2019 | Director of Fund Administration, Victory Capital (2004-present) | ||||||||||||
| Scott A Stahorsky, Born July 1969 | Vice President | 2019 | Manager, Fund Administration, Victory Capital (since 2015); Senior Analyst, Fund Administration, Victory Capital (prior to 2015) | ||||||||||||
| James K. De Vries, Born April 1969 | Treasurer, Principal Financial Officer | 2018 | Executive Director, Victory Capital Management Inc. (since 2019); Treasurer, USAA ETF Trust (September 2018-June 2019); Executive Director, Investment and Financial Administration, USAA (April 2012-June 2019); Assistant Treasurer, USAA ETF Trust (June 2017-September 2018); Assistant Treasurer, USAA Mutual Funds Trust (December 2013-February 2018) | ||||||||||||
| Allan Shaer, Born March 1965 | Assistant Treasurer | 2019 | Senior Vice President, Financial Administration, Citi Fund Services Ohio, Inc. (since 2016); Vice President, Mutual Fund Administration, JP Morgan Chase (2011-2016) | ||||||||||||
| Carol D. Trevino, Born October 1965 | Assistant Treasurer | 2018 | Director, Accounting and Finance, Victory Capital Management Inc. (since 2019); Accounting/Financial Director, USAA (December 2013-June 2019); Assistant Treasurer, USAA ETF Trust (September 2018-June 2019). | ||||||||||||
| Erin G. Wagner, Born February 1974 | Secretary | 2019 | Deputy General Counsel, the Adviser (since 2013) | ||||||||||||
| Charles Booth, Born April 1960 | Anti-Money Laundering Compliance Officer and Identity Theft Officer | 2019 | Director, Regulatory Administration and CCO Support Services, Citi Fund Services Ohio, Inc. (2007-present) | ||||||||||||
| Amy Campos, Born July 1976 | Chief Compliance Officer | 2019 | Chief Compliance Officer, USAA Mutual Funds Trust (since 2019); Executive Director, Deputy Chief Compliance Officer, USAA Mutual Funds Trust and USAA ETF Trust (July 2017-June 2019); Compliance Director, USAA Mutual Funds Trust (2014-July 2017) | ||||||||||||
68
USAA Mutual Funds Trust | Supplemental Information March 31, 2020 | ||||||
(Unaudited)
Additional Tax Information
The following federal tax information related to the Fund's fiscal year ended March 31, 2020, is provided for information purposes only and should not be used for reporting to federal or state revenue agencies. Federal tax information for the calendar year will be reported to you on Form 1099-DIV in January 2021.
With respect to distributions paid, the Fund designates the following amounts (or, if subsequently determined to be different, the maximum amount allowable) for the fiscal year ended March 31, 2020 :
| Tax Exempt Income Amount* | |||||||
100.00 | % | ||||||
* Presented as a percentage of net investment income and excludes short-term capital gain distributions paid, if any. All or a portion of these amounts may be exempt from taxation at the state level.
69
Privacy Policy
Protecting the Privacy of Information
The Trust respects your right to privacy. We also know that you expect us to conduct and process your business in an accurate and efficient manner. To do so, we must collect and maintain certain personal information about you. This is the information we collect from you on applications or other forms, and from the transactions you make with us or third parties. It may include your name, address, social security number, account transactions and balances, and information about investment goals and risk tolerance.
We do not disclose any information about you or about former customers to anyone except as permitted or required by law. Specifically, we may disclose the information we collect to companies that perform services on our behalf, such as the transfer agent that processes shareholder accounts and printers and mailers that assist us in the distribution of investor materials. We may also disclose this information to companies that perform marketing services on our behalf. This allows us to continue to offer you Victory investment products and services that meet your investing needs, and to effect transactions that you request or authorize. These companies will use this information only in connection with the services for which we hired them. They are not permitted to use or share this information for any other purpose.
To protect your personal information internally, we permit access only by authorized employees and maintain physical, electronic and procedural safeguards to guard your personal information.*
* You may have received communications regarding information about privacy policies from other financial institutions which gave you the opportunity to "opt-out" of certain information sharing with companies which are not affiliated with that financial institution. The Trust does not share information with other companies for purposes of marketing solicitations for products other than the Trust. Therefore, the Trust does not provide opt-out options to their shareholders.
15935 La Cantera Pkwy
Building Two
San Antonio, Texas 78256

Visit our website at: | Call | ||||||
usaa.com | (800) 235-8396 | ||||||
40857-0520

MARCH 31, 2020
Annual Report
USAA Tax Exempt Long-Term Fund
Beginning January 1, 2021, as permitted by regulations adopted by the Securities and Exchange Commission, paper copies of the Fund's shareholder reports like this one will no longer be sent by mail, unless you specifically request paper copies of the reports from the Fund or from your financial intermediary, such as a broker-dealer or bank. Instead, the reports will be made available on usaa.com, and you will be notified by mail each time a report is posted and provided with a website link to access the report.
If you already elected to receive shareholder reports electronically, you will not be affected by this change and you need not take any action. You may elect to receive shareholder reports and other communications from the Fund or your financial intermediary electronically by notifying your financial intermediary directly, or if you are a direct investor, by calling (800) 235-8396 or logging on to usaa.com.
You may elect to receive all future reports in paper free of charge. You can inform the Fund or your financial intermediary that you wish to continue receiving paper copies of your shareholder reports by notifying your financial intermediary directly, or if you are a direct investor, by calling (800) 235-8396 or logging on to usaa.com. Your election to receive reports in paper will apply to all funds held with the USAA family of funds or your financial intermediary.
Victory Capital means Victory Capital Management Inc., the investment adviser of the USAA Mutual Funds. USAA Mutual Funds are distributed by Victory Capital Services, Inc., member FINRA, an affiliate of Victory Capital. Victory Capital and its affiliates are not affiliated with United Services Automobile Association or its affiliates. USAA and the USAA logo are registered trademarks and the USAA Mutual Funds and USAA Investments logos are trademarks of United Services Automobile Association and is being used by Victory Capital and its affiliates under license.
USAA Mutual Funds Trust
TABLE OF CONTENTS
Shareholder Letter (Unaudited) | 2 | ||||||
Managers' Commentary (Unaudited) | 4 | ||||||
Investment Overview (Unaudited) | 6 | ||||||
| Investment Objective & Portfolio Holdings (Unaudited) | 8 | ||||||
Financial Statements | |||||||
Schedule of Portfolio Investments | 10 | ||||||
Statement of Assets and Liabilities | 30 | ||||||
Statement of Operations | 31 | ||||||
Statements of Changes in Net Assets | 32 | ||||||
Financial Highlights | 34 | ||||||
Notes to Financial Statements | 36 | ||||||
| Report of Independent Registered Public Accounting Firm | 47 | ||||||
Supplemental Information (Unaudited) | 48 | ||||||
Expense Example | 48 | ||||||
Proxy Voting and Portfolio Holdings Information | 48 | ||||||
Trustees' and Officers' Information | 49 | ||||||
Additional Federal Income Tax Information | 55 | ||||||
Privacy Policy (inside back cover) | |||||||
This report is for the information of the shareholders and others who have received a copy of the currently effective prospectus of the Fund, managed by Victory Capital Management Inc. It may be used as sales literature only when preceded or accompanied by a current prospectus, which provides further details about the Fund.
IRA DISTRIBUTION WITHHOLDING DISCLOSURE
We generally must withhold federal income tax at a rate of 10% of the taxable portion of your distribution and, if you live in a state that requires state income tax withholding, at your state's tax rate. However, you may elect not to have withholding apply or to have income tax withheld at a higher rate. Any withholding election that you make will apply to any subsequent distribution unless and until you change or revoke the election. If you wish to make a withholding election, or change or revoke a prior withholding election, call (800) 235-8396.
If you do not have a withholding election in place by the date of a distribution, federal income tax will be withheld from the taxable portion of your distribution at a rate of 10%. If you must pay estimated taxes, you may be subject to estimated tax penalties if your estimated tax payments are not sufficient and sufficient tax is not withheld from your distribution.
For more specific information, please consult your tax adviser.
1
(Unaudited)
Dear Shareholder,
If there were ever a time that illustrated the dynamic and unpredictable nature of financial markets—and life in general—it would be the strange days of early 2020. The spread of COVID-19 throughout the United States and the world has been an unprecedented event that, among so many other impacts, rendered virtually any economic forecasts unreliable. Seemingly overnight, the sentiment pendulum swung from risk-on to risk-off. We all became familiar with unusual concepts like "social distancing" and "flattening the curve."
Given that wide swaths of the global economy came to an all-stop—an event that has no real precedent—there remains tremendous uncertainty as to the depth and extent of the economic downturn. Making assumptions about the extent of the virus' reach, its impact on consumer behavior and employment, and the speed at which the U.S. government and U.S. Federal Reserve (the "Fed") can revive the economy is educated guesswork at best.
Fortunately, it's not all bad news. We did see markets stabilize as this annual reporting period drew to a close (and in the early weeks of April immediately following). As of the writing of this letter, the array of new lending facilities and programs launched by the Fed generally appear to have had their intended effect of improving liquidity and trading, at least in the short-term. Credit spreads across corporate, high-yield, structured, and municipal bond markets were coaxed down from their highs. Trading in equity markets also appeared to stabilize.
The USAA tax-exempt funds generally performed as would be expected given the unusual market environment. Our tax-exempt funds tend to be more credit heavy, holding more BBB-category rated bonds than the average in our peer groups. Typically, we overweight these credits to provide additional tax-free income to our investors, and these securities tend to underperform in periods of market dislocation when credit spreads widen significantly.
We believe that the volatility in the tax-exempt market reflected the lack of liquidity, rather than any significant credit deterioration. It's important to underscore that the USAA tax-exempt funds entered the crisis with ample liquidity and none have yet had to sell portfolio securities at an inopportune price to achieve a fund's desired level of exposure.
Looking ahead, the economy and the markets remain unpredictable. Yet our investment philosophy—and our resolve—is steadfast. A priority of our fixed-income portfolio managers and analysts is to maintain substantial liquidity, as no one can predict when the crisis will abate and what liquidity needs might be in the meantime.
Through it all, we remain committed to our core competency of evaluating, taking and managing credit risk, and we continue to build portfolios bond-by-bond. We believe the recent environment, though breathtaking in its volatility, provides extraordinary buying opportunities that may help us lock in higher tax-free yields for our investors.
2
If you have questions about the current market dynamics or your specific portfolio or investment plan, please give one of our financial representatives a call. They can help ensure that you are properly diversified based on your long-term goals, time horizon, and risk tolerance.
From all of us here at USAA Funds, thank you for letting us help you work toward your investment goals.

Christopher K. Dyer, CFA
President,
USAA Funds
3
USAA Mutual Funds Trust
USAA Tax Exempt Long-Term Fund
Manager's Commentary
(Unaudited)
John C. Bonnell, CFA
Regina G. Conklin, CPA, CFA
Andrew R. Hattman, CFA, CAIA
• What were the market conditions during the reporting period?
Tax-exempt bonds generated positive returns during the reporting period ended March 31, 2020, due in part to falling municipal bond yields. (Bond prices and yields move in opposite directions.) However, market conditions changed drastically during the reporting period.
For the first approximate 11 months of the reporting period, tax-exempt bonds generated strong positive returns. In the second half of calendar year 2019, due to intensifying U.S.-China trade tensions and global economic weakness, the U.S. Federal Reserve (the "Fed") cut the target federal funds rate from a range of 2.25%-2.50% to a target range of 1.50%-1.75%. Municipal bond AAA rates followed suit by generally falling for the majority of the reporting period, reaching their lows on March 9, 2020. Tax-exempt bonds also benefited from supply-and-demand dynamics during the first approximate 11 months of the reporting period. Supply was tight, as new issuance failed to keep pace with demand. Demand was intense, as municipal bond mutual funds saw inflows every week during the reporting period up to early March. In late February and early March, as the emergence of a novel coronavirus ("COVID-19") raised fears about a potential U.S. economic slowdown, municipal bonds held up well compared to other segments of the fixed income market.
That all changed on March 10, 2020. For the next 10 days, interest rates rose quickly and significantly along the municipal yield curve amid record outflows from municipal bond mutual funds. The trend reversed on March 20, and municipal bond yields fell sharply, finishing the reporting period below their starting points. Over this period, the 10-year AAA municipal bond rate started at 0.81% on March 9, rose to 2.88% on March 20, and fell to 1.44% on March 31 (after starting the reporting period at 1.91% on April 1, 2019). Municipal bond credit spreads (yield differentials between municipal bonds with similar maturities but different credit ratings) widened in March 2020, with spreads on lower-rated municipal securities widening the most. Rating agencies placed entire municipal bond sectors on credit watch because of a potential economic slowdown driven by the shutdowns, lockdowns, and self-quarantines that had been instituted to slow the spread of COVID-19. The Fed responded with unprecedented actions, slashing the target federal funds rate to a range of between zero and 0.25%, implementing quantitative easing and credit support programs, and offering assistance to state and municipal governments. The Fed also has said it will do what it takes to keep financial markets — including the municipal bond market — fully functioning.
4
USAA Mutual Funds Trust
USAA Tax Exempt Long-Term Fund (continued)
• How did the USAA Tax Exempt Long-Term Fund (the "Fund") perform during the reporting period?
The Fund has two share classes: Fund Shares and Adviser Shares. For the reporting period ended March 31, 2020, the Fund Shares and Adviser Shares had a total return of 2.83% and 2.61%, respectively, versus an average return of 2.50% amongst the funds in the Lipper General & Insured Municipal Debt Funds category. This compares to returns of 2.46% for the Lipper General & Insured Municipal Debt Funds Index and 3.85% for the Bloomberg Barclays Municipal Bond Index. The Fund Shares' and Adviser Shares' tax-exempt distributions over the reporting period produced a dividend yield of 3.41% and 3.19%, respectively, compared to the Lipper category average of 2.65%.
• What strategies did you employ during the reporting period?
In keeping with our investment approach, we continued to focus on income generation. The Fund's long-term income distribution, not its price appreciation, accounts for most of its total return. Because of the Fund's income orientation, it has a higher allocation to BBB and A rated categories when compared to its peer group.
Our commitment to independent credit research continued to help us identify attractive opportunities for the Fund. We employ fundamental analysis that emphasizes an issuer's ability and willingness to repay its debt. Through our credit research, we strive both to recognize relative value and to avoid potential pitfalls, which is especially important in volatile times like the present. As always, we worked with our in-house team of analysts to select investments for the Fund on a bond-by-bond basis. Our team continuously monitors all the holdings in the Fund's portfolio.
The Fund continues to hold a diversified portfolio of longer-term, primarily investment-grade municipal bonds. To limit exposure to an unexpected event, the Fund is diversified by sector, issuer, and geography. In addition, we avoid bonds subject to the federal alternative minimum tax for individuals.
Thank you for allowing us to assist you with your investment needs.
5
USAA Mutual Funds Trust
USAA Tax Exempt Long-Term Fund
Investment Overview
(Unaudited)
Average Annual Total Return
Year Ended March 31, 2020
Fund Shares | Adviser Shares | ||||||||||||||||||
INCEPTION DATE | 3/19/82 | 8/1/10 | |||||||||||||||||
Net Asset Value | Net Asset Value | Bloomberg Barclays Municipal Bond Index1 | Lipper General & Insured Municipal Debt Funds Index2 | ||||||||||||||||
One Year | 2.83 | % | 2.61 | % | 3.85 | % | 2.46 | % | |||||||||||
Five Year | 3.04 | % | 2.78 | % | 3.19 | % | 3.00 | % | |||||||||||
Ten Year | 4.52 | % | NA | 4.14 | % | 4.28 | % | ||||||||||||
Since Inception | NA | 4.03 | % | NA | NA | ||||||||||||||
Past performance is not indicative of future results. The performance data quoted represents past performance and current returns may be lower or higher. The investment return and principal value will fluctuate so that an investor's shares, when redeemed, may be worth more or less than the original cost. To obtain performance information current to the most recent month's end, please visit www.usaa.com.
Total return measures the price change in a share assuming the reinvestment of all net investment income and realized capital gain distributions, if any. The total returns quoted do not reflect adjustments made to the enclosed financial statements in accordance with U.S. generally accepted accounting principles or the deduction of taxes that a shareholder would pay on net investment income and realized capital gain distributions, including reinvested distributions, or redemptions of shares. The total return figures set forth above include all waivers of fees for various periods since inception. Without such fee waivers, the total returns would have been lower.
USAA Tax Exempt Long-Term Fund — Growth of $10,000
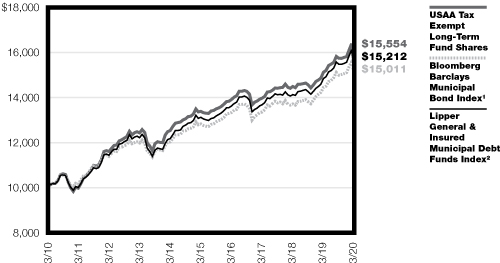
1 The unmanaged, broad-based Bloomberg Barclays Municipal Bond Index tracks total return performance for the long-term, investment-grade, tax-exempt bond market. All tax-exempt bond funds will find it difficult to outperform the Index because the Index does not reflect any deduction for fees, expenses, or taxes. It is not possible to invest directly in an index.
2 The unmanaged Lipper General & Insured Municipal Debt Funds Index measures the Fund's performance to that of the Lipper General & Insured Municipal Debt Funds category. There are no expenses associated with the index, while there are expenses associated with the Fund. It is not possible to invest directly in an index.
The graph reflects investment of growth of a hypothetical $10,000 investment in the Fund. Past performance is no guarantee of future results.
The graph and table do not reflect the deduction of taxes that a shareholder would pay on Fund distributions or the redemption of Fund shares.
6
USAA Mutual Funds Trust
USAA Tax Exempt Long-Term Fund (continued)
Average Annual Compounded Returns with Reinvestment of Dividends — Periods Ended March 31, 2020
Total Return | = | Dividend Return | + | Price Change | |||||||||||||||||||
| 10 Years | 4.52 | % | = | 4.18 | % | + | 0.34 | % | |||||||||||||||
| 5 Years | 3.04 | % | = | 3.87 | % | + | -0.83 | % | |||||||||||||||
| 1 Year | 2.83 | % | = | 3.36 | % | + | -0.53 | % | |||||||||||||||
The performance data quoted represents past performance and is no guarantee of future results. Current performance may be higher or lower than the performance data quoted. The return and principal value of an investment will fluctuate, so that an investor's shares, when redeemed, may be worth more or less than their original cost. For performance data current to the most recent month-end, visit usaa.com.
Annual Total Returns and Compounded Dividend Returns for the
One-Year Periods Ended March 31, 2011 — March 31, 2020

Note the role that dividend returns play in the Fund Shares' total return over time. Share prices and dividend rates will vary from period to period. However, dividend returns generally are more consistent and less volatile than share prices.
Total return measures the price change in a share assuming the reinvestment of all net investment income and realized capital gain distributions, if any. Dividend return is the net investment income dividends received over the period, assuming reinvestment of all dividends. Share price change is the change in net asset value over the period adjusted for realized capital gain distributions. The returns quoted do not reflect adjustments made to the enclosed financial statements in accordance with U.S. generally accepted accounting principles or the deduction of taxes that a shareholder would pay on distributions (including capital gain distributions), redemptions of shares, or reinvested net investment income.
7
| USAA Mutual Funds Trust USAA Tax Exempt Long-Term Fund | March 31, 2020 | ||||||
(Unaudited)
Investment Objective & Portfolio Holdings:
The Fund's investment objective seeks to provide investors with interest income that is exempt from federal income tax.
Top 10 Industries
March 31, 2020
(% of Net Assets)
Hospital | 17.0 | % | |||||
Education | 11.9 | % | |||||
General Obligation | 11.8 | % | |||||
Escrowed Bonds | 7.8 | % | |||||
Special Assessment/Tax/Fee | 7.5 | % | |||||
Nursing/CCRC | 7.4 | % | |||||
Toll Road | 6.4 | % | |||||
Water/Sewer Utility | 4.6 | % | |||||
Electric Utilities | 3.7 | % | |||||
Electric/Gas Utility | 3.3 | % | |||||
Refer to the Schedule of Portfolio Investments for a complete list of securities.
8
| USAA Mutual Funds Trust USAA Tax Exempt Long-Term Fund (continued) | March 31, 2020 | ||||||
(Unaudited)
Portfolio Ratings Mix*
March 31, 2020
(% of Net Assets)
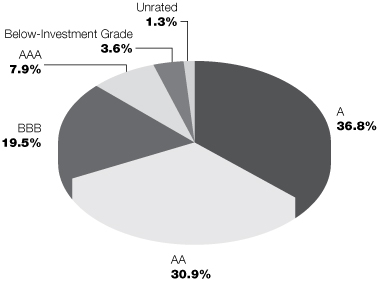
This chart reflects the highest long-term rating from a Nationally Recognized Statistical Rating Organization ("NRSRO"), with the four highest long-term credit ratings labeled, in descending order of credit quality, AAA, AA, A, and BBB. These categories represent investment-grade quality. NRSRO ratings are shown because they provide independent analysis of the credit quality of the Fund's investments. Victory Capital Management, Inc. ("Adviser") also performs its own fundamental credit analysis of each security. As part of its fundamental credit analysis, the Adviser considers various criteria, including industry specific actions, peer comparisons, payment ranking, and structure specific characteristics. Any of the Fund's securities that are not rated by an NRSRO appear in the chart above as "Unrated," but these securities are analyzed and monitored by the Adviser on an ongoing basis. Government securities that are issued or guaranteed as to principal and interest by the U.S. government and pre-refunded and escrowed-to-maturity municipal bonds that are not rated are treated as AAA for credit quality purposes.
*Does not include futures and money market instruments.
9
| USAA Mutual Funds Trust USAA Tax Exempt Long-Term Fund | Schedule of Portfolio Investments March 31, 2020 | ||||||
(Amounts in Thousands, Except for Shares)
Security Description | Shares or Principal Amount | Value | |||||||||
Common Stocks (0.1%) | |||||||||||
Utilities (0.1%): | |||||||||||
Energy Harbor Corp. (a) | 192,453 | $ | 2,454 | ||||||||
Total Common Stock (Cost $4,811) | 2,454 | ||||||||||
Municipal Bonds (99.1%) | |||||||||||
Alabama (1.4%): | |||||||||||
| Chatom Industrial Development Board Revenue (INS — Assured Guaranty Municipal Corp.), 5.00%, 8/1/37, Continuously Callable @ 100 | $ | 4,245 | 4,295 | ||||||||
| Homewood Educational Building Authority Revenue, 5.00%, 12/1/47, Continuously Callable @ 100 | 4,500 | 5,100 | |||||||||
| Montgomery Medical Clinic Board Revenue, 5.00%, 3/1/36, Continuously Callable @ 100 | 1,750 | 1,914 | |||||||||
| Selma Industrial Development Board Revenue, 5.80%, 5/1/34, Continuously Callable @ 100 | 2,000 | 2,000 | |||||||||
| State of Alabama Docks Department Revenue, 6.00%, 10/1/35, Pre-refunded 10/1/20 @ 100 | 7,000 | 7,174 | |||||||||
The Lower Alabama Gas District Revenue, Series A, 5.00%, 9/1/46 | 11,500 | 13,990 | |||||||||
34,473 | |||||||||||
Arizona (2.8%): | |||||||||||
| Apache County IDA Revenue, Series A, 4.50%, 3/1/30, Continuously Callable @ 100 | 5,000 | 5,051 | |||||||||
| Arizona Health Facilities Authority Revenue 5.00%, 2/1/42, Continuously Callable @ 100 | 6,000 | 6,325 | |||||||||
6.56% (MUNIPSA+185bps), 2/1/48, (Put Date 2/1/23) (b) (c) | 5,000 | 5,190 | |||||||||
Arizona IDA Revenue, 5.00%, 7/1/52, Continuously Callable @ 100 | 1,725 | 1,964 | |||||||||
| City of Goodyear Water & Sewer Revenue, 5.63%, 7/1/39, Continuously Callable @ 100 | 5,000 | 5,052 | |||||||||
| City of Phoenix Civic Improvement Corp. Revenue (INS — National Public Finance Guarantee Corp.) Series B, 5.50%, 7/1/29 (d) | 1,000 | 1,324 | |||||||||
Series B, 5.50%, 7/1/30 (d) | 1,500 | 2,023 | |||||||||
Maricopa County IDA Revenue, 5.00%, 7/1/47, Continuously Callable @ 100 | 1,600 | 1,684 | |||||||||
| Maricopa County Pollution Control Corp. Revenue, 5.00%, 6/1/35, Continuously Callable @ 100 | 7,000 | 7,028 | |||||||||
| Pinal County Electric District No. 3 Revenue, 4.00%, 7/1/41, Continuously Callable @ 100 | 10,000 | 10,917 | |||||||||
| The City of Phoenix IDA Revenue 5.00%, 7/1/41, Continuously Callable @ 100 | 1,200 | 1,279 | |||||||||
5.00%, 7/1/42, Continuously Callable @ 100 | 1,250 | 1,446 | |||||||||
5.00%, 7/1/44, Continuously Callable @ 100 | 6,000 | 6,322 | |||||||||
| The Pima County IDA Revenue 5.00%, 6/15/52, Continuously Callable @ 100 (e) | 2,000 | 1,656 | |||||||||
Series A, 5.25%, 10/1/40, Continuously Callable @ 100 | 3,000 | 3,022 | |||||||||
The Pima County IDA Revenue, 4.00%, 9/1/29, Continuously Callable @ 100 | 3,000 | 3,014 | |||||||||
| The Prima County IDA Revenue, Series A, 4.50%, 6/1/30, Continuously Callable @ 100 | 2,685 | 2,713 | |||||||||
| The Yavapai County IDA Revenue, 4.00%, 8/1/43, Continuously Callable @ 100 | 1,725 | 1,883 | |||||||||
67,893 | |||||||||||
See notes to financial statements.
10
| USAA Mutual Funds Trust USAA Tax Exempt Long-Term Fund | Schedule of Portfolio Investments — continued March 31, 2020 | ||||||
(Amounts in Thousands, Except for Shares)
Security Description | Principal Amount | Value | |||||||||
Arkansas (0.2%): | |||||||||||
| Arkansas Development Finance Authority Revenue (INS — AMBAC Assurance Corp.) 7/1/28 (f) | $ | 1,000 | $ | 829 | |||||||
7/1/29 (f) | 1,165 | 935 | |||||||||
7/1/30 (f) | 1,150 | 891 | |||||||||
7/1/36 (f) | 2,500 | 1,504 | |||||||||
4,159 | |||||||||||
California (6.5%): | |||||||||||
| California Health Facilities Financing Authority Revenue, 5.00%, 11/15/56, Continuously Callable @ 100 | 1,000 | 1,150 | |||||||||
| California Municipal Finance Authority Revenue (LIQ — Deutsche Bank A.G.), Series 2019-XF1088, 3.87%, 10/1/59, Callable 10/1/35 @ 100 (d) (e) | 3,600 | 3,600 | |||||||||
| California State Public Works Board Revenue 5.00%, 6/1/31, Continuously Callable @ 100 | 2,950 | 3,277 | |||||||||
Series B, 5.00%, 10/1/30, Pre-refunded 10/1/21 @ 100 | 2,000 | 2,121 | |||||||||
Series B, 5.00%, 10/1/31, Pre-refunded 10/1/21 @ 100 | 1,110 | 1,179 | |||||||||
Series B, 5.00%, 10/1/39, Continuously Callable @ 100 | 3,500 | 3,982 | |||||||||
Series D, 5.00%, 12/1/29, Continuously Callable @ 100 | 2,500 | 2,656 | |||||||||
Series D, 5.00%, 12/1/31, Continuously Callable @ 100 | 2,000 | 2,124 | |||||||||
| Cerritos Community College District, GO Series D, 8/1/31 (f) | 1,000 | 790 | |||||||||
Series D, 8/1/32 (f) | 2,500 | 1,910 | |||||||||
Series D, 8/1/33 (f) | 2,175 | 1,606 | |||||||||
Series D, 8/1/34 (f) | 1,000 | 712 | |||||||||
Series D, 8/1/35 (f) | 1,500 | 1,029 | |||||||||
Series D, 8/1/36 (f) | 2,200 | 1,456 | |||||||||
| Coachella Valley Unified School District, GO (INS — Assured Guaranty Municipal Corp.), Series D, 8/1/41 (f) | 8,500 | 4,509 | |||||||||
El Camino Community College District, GO | |||||||||||
Series C, 8/1/34 (f) | 3,000 | 2,191 | |||||||||
Series C, 8/1/38 (f) | 3,000 | 1,898 | |||||||||
| El Monte Union High School District, GO (INS — Assured Guaranty Municipal Corp.), 6/1/42 (f) | 10,000 | 4,989 | |||||||||
| Escondido Union High School District Certificate of Participation (INS — Assured Guaranty Municipal Corp.), 5.00%, 6/1/37, Continuously Callable @ 100 | 2,500 | 2,515 | |||||||||
| Golden State Tobacco Securitization Corp. Revenue, Series A, 5.00%, 6/1/30, Continuously Callable @ 100 | 2,000 | 2,207 | |||||||||
| Indio Redevelopment Agency Successor Agency Tax Allocation, Series A, 5.25%, 8/15/35, Continuously Callable @ 100 | 1,580 | 1,584 | |||||||||
| Inland Empire Tobacco Securitization Corp. Revenue, Series B, 5.75%, 6/1/26, Pre-refunded 6/1/20 @ 100 | 5,415 | 5,458 | |||||||||
| Jurupa Public Financing Authority Revenue (INS — Assured Guaranty Municipal Corp.), Series A, 5.00%, 9/1/33, Callable 9/1/20 @ 100 | 2,000 | 2,030 | |||||||||
| Los Alamitos Unified School District Certificate of Participation 0.0%, 8/1/34, Continuously Callable @ 100 (g) | 1,200 | 1,331 | |||||||||
| 0.0%, 8/1/42, Continuously Callable @ 100 (h) | 4,500 | 4,691 | |||||||||
| Monterey Peninsula Unified School District, GO (INS — Assured Guaranty Municipal Corp.), Series A, 5.50%, 8/1/34, Pre-refunded 8/1/21 @ 100 | 3,000 | 3,181 | |||||||||
See notes to financial statements.
11
| USAA Mutual Funds Trust USAA Tax Exempt Long-Term Fund | Schedule of Portfolio Investments — continued March 31, 2020 | ||||||
(Amounts in Thousands, Except for Shares)
Security Description | Principal Amount | Value | |||||||||
| Paramount Unified School District, GO 8/1/34 (f) | $ | 1,860 | $ | 1,312 | |||||||
8/1/35 (f) | 2,000 | 1,366 | |||||||||
8/1/36 (f) | 2,750 | 1,808 | |||||||||
8/1/37 (f) | 2,750 | 1,744 | |||||||||
| Sacramento City Schools Joint Powers Financing Authority Revenue (INS — Build America Mutual Assurance Co.) Series A, 5.00%, 3/1/36, Continuously Callable @ 100 | 2,560 | 2,703 | |||||||||
Series A, 5.00%, 3/1/40, Continuously Callable @ 100 | 2,000 | 2,093 | |||||||||
| San Diego Public Facilities Financing Authority Revenue, Series A, 5.00%, 10/15/44, Continuously Callable @ 100 | 2,500 | 2,873 | |||||||||
| San Francisco City Housing Revenue, 1500 Mission Street Apts., Series E (LIQ — Deutsche Bank A.G.), Series DBE-8038, 4.90%, 12/1/52, Callable 12/1/20 @ 100 (d) (e) | 3,600 | 3,600 | |||||||||
| San Marcos Schools Financing Authority Revenue (INS — Assured Guaranty Municipal Corp.), 5.00%, 8/15/40, Pre-refunded 8/15/20 @ 100 | 3,000 | 3,045 | |||||||||
| San Ysidro School District, GO (INS — Assured Guaranty Municipal Corp.) Series G, 8/1/36 (f) | 13,605 | 8,466 | |||||||||
Series G, 8/1/37 (f) | 14,285 | 8,567 | |||||||||
| Santa Ana Unified School District Certificate of Participation (INS — Assured Guaranty Municipal Corp.), 4/1/29 (f) | 15,000 | 11,267 | |||||||||
| Southern California Public Power Authority Revenue, Series A, 5.00%, 7/1/40, Continuously Callable @ 100 | 5,000 | 5,044 | |||||||||
| State of California, GO 5.25%, 4/1/35, Continuously Callable @ 100 | 8,000 | 8,627 | |||||||||
5.00%, 2/1/38, Continuously Callable @ 100 | 6,750 | 7,437 | |||||||||
5.00%, 10/1/47, Continuously Callable @ 100 | 5,000 | 5,865 | |||||||||
| Stockton Unified School District, GO (INS — Assured Guaranty Municipal Corp.), Series D, 8/1/34 (f) | 8,885 | 6,255 | |||||||||
Washington Township Health Care District Revenue | |||||||||||
Series A, 5.25%, 7/1/30, Continuously Callable @ 100 | 5,180 | 5,227 | |||||||||
Series A, 5.50%, 7/1/38, Continuously Callable @ 100 | 5,000 | 5,047 | |||||||||
156,522 | |||||||||||
Colorado (2.0%): | |||||||||||
| Colorado Educational & Cultural Facilities Authority Revenue 4.00%, 12/1/48, Continuously Callable @ 100 | 2,500 | 2,683 | |||||||||
5.00%, 4/1/53, Continuously Callable @ 100 | 750 | 856 | |||||||||
Series A, 5.25%, 4/1/43, Continuously Callable @ 100 | 2,500 | 2,699 | |||||||||
| Colorado Health Facilities Authority Revenue 5.00%, 12/1/42, Pre-refunded 6/1/22 @ 100 | 5,000 | 5,404 | |||||||||
5.00%, 6/1/45, Pre-refunded 6/1/25 @ 100 | 6,000 | 7,048 | |||||||||
5.00%, 6/1/47, Pre-refunded 6/1/27 @ 100 | 1,250 | 1,564 | |||||||||
Series A, 4.00%, 8/1/49, Continuously Callable @ 100 | 2,500 | 2,488 | |||||||||
| Denver Health & Hospital Authority Revenue, Series A, 4.00%, 12/1/40, Continuously Callable @ 100 | 750 | 796 | |||||||||
| E-470 Public Highway Authority Revenue, Series C, 5.38%, 9/1/26, Continuously Callable @ 100 | 2,000 | 2,033 | |||||||||
| E-470 Public Highway Authority Revenue (INS — National Public Finance Guarantee Corp.), Series B, 9/1/35, Continuously Callable @ 64 (f) | 10,000 | 5,087 | |||||||||
See notes to financial statements.
12
| USAA Mutual Funds Trust USAA Tax Exempt Long-Term Fund | Schedule of Portfolio Investments — continued March 31, 2020 | ||||||
(Amounts in Thousands, Except for Shares)
Security Description | Principal Amount | Value | |||||||||
| Park Creek Metropolitan District Revenue 5.00%, 12/1/45, Continuously Callable @ 100 | $ | 1,000 | $ | 1,120 | |||||||
5.00%, 12/1/46, Continuously Callable @ 100 | 2,500 | 2,797 | |||||||||
5.00%, 12/1/51, Continuously Callable @ 100 | 2,000 | 2,213 | |||||||||
| Rampart Range Metropolitan District No. 1 Revenue (INS — Assured Guaranty Municipal Corp.), 5.00%, 12/1/47, Continuously Callable @ 100 | 4,000 | 4,713 | |||||||||
| Regional Transportation District Certificate of Participation, Series A, 5.00%, 6/1/44, Continuously Callable @ 100 | 5,000 | 5,493 | |||||||||
| Southlands Metropolitan District No. 1, GO, Series A-1, 5.00%, 12/1/47, Continuously Callable @ 100 | 1,000 | 1,037 | |||||||||
48,031 | |||||||||||
Connecticut (0.6%): | |||||||||||
| Connecticut State Health & Educational Facilities Authority Revenue Series A, 4.00%, 7/1/49, Continuously Callable @ 100 | 3,000 | 3,214 | |||||||||
Series O, 5.00%, 7/1/35, Pre-refunded 7/1/20 @ 100 | 2,000 | 2,019 | |||||||||
Mashantucket Western Pequot Tribe Revenue PIK, 2.05%, 7/1/31 (i) | 59,585 | 2,085 | |||||||||
| State of Connecticut, GO Series A, 5.00%, 4/15/38, Continuously Callable @ 100 | 5,500 | 6,345 | |||||||||
Series A, 5.00%, 4/15/39, Continuously Callable @ 100 | 1,550 | 1,813 | |||||||||
15,476 | |||||||||||
Delaware (0.2%): | |||||||||||
| Delaware State Economic Development Authority Revenue, 5.40%, 2/1/31, Continuously Callable @ 100 | 4,000 | 4,041 | |||||||||
District of Columbia (1.4%): | |||||||||||
| District of Columbia Revenue 5.00%, 7/1/36, Continuously Callable @ 100 | 1,305 | 1,399 | |||||||||
5.00%, 7/1/42, Continuously Callable @ 100 | 1,500 | 1,603 | |||||||||
6.00%, 7/1/43, Pre-refunded 7/1/23 @ 100 | 1,700 | 1,973 | |||||||||
6.00%, 7/1/48, Pre-refunded 7/1/23 @ 100 | 1,450 | 1,686 | |||||||||
5.00%, 7/1/49, Continuously Callable @ 100 | 1,275 | 1,457 | |||||||||
5.00%, 7/1/54, Continuously Callable @ 100 | 1,140 | 1,290 | |||||||||
| Metropolitan Washington Airports Authority Dulles Toll Road Revenue, 5.00%, 10/1/53, Continuously Callable @ 100 | 10,000 | 10,261 | |||||||||
| Metropolitan Washington Airports Authority Revenue, Series A, 5.00%, 10/1/39, Continuously Callable @ 100 | 5,000 | 5,100 | |||||||||
| Washington Convention & Sports Authority Tax Allocation, 5.00%, 10/1/40, Continuously Callable @ 100 | 10,000 | 10,156 | |||||||||
34,925 | |||||||||||
Florida (9.5%): | |||||||||||
| Alachua County Health Facilities Authority Revenue, 4.00%, 12/1/49, Continuously Callable @ 100 | 7,000 | 7,372 | |||||||||
| City of Atlantic Beach Revenue Series A, 5.00%, 11/15/48, Continuously Callable @ 103 | 2,000 | 2,087 | |||||||||
Series B, 5.63%, 11/15/43, Continuously Callable @ 100 | 7,000 | 7,361 | |||||||||
| City of Gainesville Utilities System Revenue, Series C, 5.25%, 10/1/34, Continuously Callable @ 100 | 3,950 | 4,027 | |||||||||
City of Jacksonville Revenue, 5.00%, 10/1/29, Continuously Callable @ 100 | 2,270 | 2,475 | |||||||||
See notes to financial statements.
13
| USAA Mutual Funds Trust USAA Tax Exempt Long-Term Fund | Schedule of Portfolio Investments — continued March 31, 2020 | ||||||
(Amounts in Thousands, Except for Shares)
Security Description | Principal Amount | Value | |||||||||
| City of Lakeland Revenue 5.00%, 9/1/37, Continuously Callable @ 100 | $ | 500 | $ | 537 | |||||||
5.00%, 9/1/42, Continuously Callable @ 100 | 1,000 | 1,071 | |||||||||
| City of Miami Beach Parking Revenue, Series B, 5.00%, 9/1/40, Continuously Callable @ 100 | 2,000 | 2,029 | |||||||||
City of Miami Revenue (INS — Assured Guaranty Municipal Corp.) | |||||||||||
Series A, 5.25%, 7/1/35, Pre-refunded 7/1/20 @ 100 | 13,125 | 13,261 | |||||||||
Series A, 5.25%, 7/1/39, Pre-refunded 7/1/20 @ 100 | 4,000 | 4,041 | |||||||||
County of Miami-Dade Aviation Revenue | |||||||||||
5.00%, 10/1/29, Pre-refunded 10/1/20 @ 100 | 525 | 535 | |||||||||
5.00%, 10/1/29, Pre-refunded 10/1/20 @ 100 | 6,350 | 6,473 | |||||||||
5.38%, 10/1/35, Pre-refunded 10/1/20 @ 100 | 18,330 | 18,768 | |||||||||
5.38%, 10/1/35, Pre-refunded 10/1/20 @ 100 | 4,875 | 4,980 | |||||||||
| County of Miami-Dade Rickenbacker Causeway Revenue, 5.00%, 10/1/43, Continuously Callable @ 100 | 1,750 | 1,970 | |||||||||
County of Miami-Dade Water & Sewer System Revenue | |||||||||||
5.00%, 10/1/34, Pre-refunded 10/1/20 @ 100 | 3,950 | 4,027 | |||||||||
Series B, 4.00%, 10/1/49, Continuously Callable @ 100 | 22,000 | 24,714 | |||||||||
| County of Polk Florida Utility System Revenue, 4.00%, 10/1/43, Continuously Callable @ 100 | 2,000 | 2,209 | |||||||||
| Escambia County Health Facilities Authority Revenue, 4.00%, 8/15/50, Continuously Callable @ 100 | 11,315 | 11,899 | |||||||||
| Florida Department of Children & Families Certificate of Participation, 5.00%, 10/1/25, Continuously Callable @ 100 | 5,675 | 5,692 | |||||||||
Florida Higher Educational Facilities Financial Authority Revenue | |||||||||||
5.00%, 3/1/44, Continuously Callable @ 100 | 4,280 | 4,780 | |||||||||
4.00%, 10/1/44, Continuously Callable @ 100 | 1,400 | 1,464 | |||||||||
5.00%, 3/1/49, Continuously Callable @ 100 | 1,250 | 1,384 | |||||||||
4.00%, 10/1/49, Continuously Callable @ 100 | 1,150 | 1,193 | |||||||||
Series A, 5.00%, 4/1/32, Continuously Callable @ 100 | 600 | 627 | |||||||||
Series A, 5.25%, 4/1/42, Continuously Callable @ 100 | 1,500 | 1,597 | |||||||||
| Florida Municipal Loan Council Revenue (INS — Assured Guaranty Municipal Corp.), Series D, 5.25%, 10/1/33, Continuously Callable @ 100 | 2,500 | 2,638 | |||||||||
| Halifax Hospital Medical Center Revenue, 5.00%, 6/1/46, Continuously Callable @ 100 | 3,000 | 3,296 | |||||||||
Lee County IDA Revenue | |||||||||||
5.75%, 10/1/42, Continuously Callable @ 100 | 4,000 | 4,092 | |||||||||
5.00%, 11/15/44, Continuously Callable @ 103 | 3,750 | 3,926 | |||||||||
5.50%, 10/1/47, Continuously Callable @ 102 | 5,000 | 5,149 | |||||||||
5.00%, 11/15/49, Continuously Callable @ 103 | 8,600 | 8,933 | |||||||||
| Lee Memorial Health System Revenue, Series A-1, 4.00%, 4/1/49, Continuously Callable @ 100 | 4,500 | 4,876 | |||||||||
Miami-Dade County Expressway Authority Revenue | |||||||||||
Series A, 5.00%, 7/1/39, Continuously Callable @ 100 | 5,000 | 5,630 | |||||||||
Series A, 5.00%, 7/1/40, Continuously Callable @ 100 | 5,000 | 5,041 | |||||||||
| Miami-Dade County Health Facilities Authority Revenue, 4.00%, 8/1/47, Continuously Callable @ 100 | 2,000 | 2,136 | |||||||||
| Orange County Health Facilities Authority Revenue, Series B, 4.00%, 10/1/45, Continuously Callable @ 100 | 1,500 | 1,585 | |||||||||
See notes to financial statements.
14
| USAA Mutual Funds Trust USAA Tax Exempt Long-Term Fund | Schedule of Portfolio Investments — continued March 31, 2020 | ||||||
(Amounts in Thousands, Except for Shares)
Security Description | Principal Amount | Value | |||||||||
| Orlando-Orange County Expressway Authority Revenue Series A, 5.00%, 7/1/35, Pre-refunded 7/1/20 @ 100 | $ | 4,745 | $ | 4,787 | |||||||
Series A, 5.00%, 7/1/35, Pre-refunded 7/1/20 @ 100 | 1,255 | 1,265 | |||||||||
Series C, 5.00%, 7/1/35, Pre-refunded 7/1/20 @ 100 | 2,000 | 2,018 | |||||||||
Palm Beach County Health Facilities Authority Revenue | |||||||||||
5.00%, 5/15/41, Continuously Callable @ 100 | 5,000 | 5,079 | |||||||||
5.00%, 11/15/45, Continuously Callable @ 103 | 2,000 | 2,021 | |||||||||
Palm Beach County Solid Waste Authority Revenue | |||||||||||
5.00%, 10/1/31, Pre-refunded 10/1/21 @ 100 | 155 | 164 | |||||||||
5.00%, 10/1/31, Continuously Callable @ 100 | 9,845 | 10,369 | |||||||||
Pinellas County Educational Facilities Authority Revenue | |||||||||||
5.00%, 10/1/27, Continuously Callable @ 100 | 1,000 | 1,085 | |||||||||
5.25%, 10/1/30, Continuously Callable @ 100 | 1,000 | 1,088 | |||||||||
6.00%, 10/1/41, Continuously Callable @ 100 | 3,650 | 3,866 | |||||||||
Polk County IDA Revenue | |||||||||||
5.00%, 1/1/49, Continuously Callable @ 103 | 1,000 | 957 | |||||||||
5.00%, 1/1/55, Continuously Callable @ 103 | 1,000 | 943 | |||||||||
| Sarasota County Health Facilities Authority Revenue, 5.00%, 5/15/48, Continuously Callable @ 103 | 1,835 | 1,912 | |||||||||
Tampa Housing Authority Revenue, 4.85%, 7/1/36, Callable 5/1/20 @ 100 | 2,200 | 2,206 | |||||||||
| Tampa-Hillsborough County Expressway Authority Revenue, Series B, 5.00%, 7/1/42, Pre-refunded 7/1/22 @ 100 | 3,050 | 3,303 | |||||||||
| Volusia County Educational Facility Authority Revenue, Series B, 5.00%, 10/15/45, Pre-refunded 4/15/25 @ 100 | 2,000 | 2,381 | |||||||||
| Volusia County Educational Facility Authority Revenue (INS — Assured Guaranty Municipal Corp.), 5.00%, 10/15/29, Pre-refunded 10/15/21 @ 100 | 2,350 | 2,491 | |||||||||
229,810 | |||||||||||
Georgia (1.2%): | |||||||||||
| Dahlonega Downtown Development Authority Revenue (INS — Assured Guaranty Municipal Corp.), 5.00%, 7/1/40, Pre-refunded 7/1/20 @ 100 | 4,000 | 4,038 | |||||||||
| Gainesville & Hall County Hospital Authority Revenue, 4.00%, 2/15/45, Continuously Callable @ 100 | 15,000 | 16,334 | |||||||||
| Glynn-Brunswick Memorial Hospital Authority Revenue, 5.00%, 8/1/47, Continuously Callable @ 100 | 1,500 | 1,696 | |||||||||
Main Street Natural Gas, Inc. Revenue, Series A, 5.00%, 5/15/49 | 3,000 | 3,522 | |||||||||
| Private Colleges & Universities Authority Revenue, Series A, 5.00%, 10/1/32, Continuously Callable @ 100 | 1,600 | 1,670 | |||||||||
Thomasville Hospital Authority Revenue | |||||||||||
5.25%, 11/1/35, Pre-refunded 11/2/20 @ 100 | 1,000 | 1,024 | |||||||||
5.38%, 11/1/40, Pre-refunded 11/2/20 @ 100 | 1,250 | 1,281 | |||||||||
29,565 | |||||||||||
Idaho (0.1%): | |||||||||||
| Idaho Health Facilities Authority Revenue (INS — Assured Guaranty Municipal Corp.), 5.00%, 7/1/35, Pre-refunded 7/1/20 @ 100 | 1,500 | 1,514 | |||||||||
Illinois (13.6%): | |||||||||||
| Bureau County Township High School District No. 502, GO (INS — Build America Mutual Assurance Co.) | |||||||||||
Series A, 5.00%, 12/1/37, Continuously Callable @ 100 | 1,530 | 1,809 | |||||||||
Series A, 5.00%, 12/1/38, Continuously Callable @ 100 | 1,555 | 1,834 | |||||||||
Series A, 5.00%, 12/1/39, Continuously Callable @ 100 | 1,400 | 1,645 | |||||||||
See notes to financial statements.
15
| USAA Mutual Funds Trust USAA Tax Exempt Long-Term Fund | Schedule of Portfolio Investments — continued March 31, 2020 | ||||||
(Amounts in Thousands, Except for Shares)
Security Description | Principal Amount | Value | |||||||||
| Chicago Board of Education, GO, Series H, 5.00%, 12/1/36, Continuously Callable @ 100 | $ | 5,000 | $ | 4,926 | |||||||
Chicago Midway International Airport Revenue | |||||||||||
Series B, 5.00%, 1/1/41, Continuously Callable @ 100 | 2,500 | 2,749 | |||||||||
Series B, 5.00%, 1/1/46, Continuously Callable @ 100 | 3,500 | 3,833 | |||||||||
Chicago O'Hare International Airport Revenue | |||||||||||
5.75%, 1/1/39, Continuously Callable @ 100 | 800 | 819 | |||||||||
5.75%, 1/1/39, Pre-refunded 1/1/21 @ 100 | 4,200 | 4,348 | |||||||||
5.75%, 1/1/43, Continuously Callable @ 100 | 5,000 | 5,488 | |||||||||
Series C, 5.00%, 1/1/41, Continuously Callable @ 100 | 5,000 | 5,552 | |||||||||
Chicago Park District, GO, Series A, 5.00%, 1/1/40, Continuously Callable @ 100 | 3,000 | 3,147 | |||||||||
City of Chicago Special Assessment, 6.75%, 12/1/32, Continuously Callable @ 100 | 3,924 | 3,928 | |||||||||
City of Chicago Wastewater Transmission Revenue | |||||||||||
5.00%, 1/1/44, Continuously Callable @ 100 | 4,000 | 4,325 | |||||||||
Series C, 5.00%, 1/1/39, Continuously Callable @ 100 | 3,000 | 3,356 | |||||||||
| City of Chicago Wastewater Transmission Revenue Bonds, Series A, 5.00%, 1/1/47, Continuously Callable @ 100 | 3,000 | 3,388 | |||||||||
City of Chicago Waterworks Revenue, 5.00%, 11/1/44, Continuously Callable @ 100 | 3,000 | 3,367 | |||||||||
| City of Springfield Electric Revenue (INS — Assured Guaranty Municipal Corp.), 5.00%, 3/1/40, Continuously Callable @ 100 | 3,000 | 3,368 | |||||||||
| Cook County Community College District No. 508, GO (INS — Build America Mutual Assurance Co.), 5.00%, 12/1/47, Continuously Callable @ 100 | 9,500 | 11,048 | |||||||||
County of Cook Sales Tax Revenue, 5.00%, 11/15/38, Continuously Callable @ 100 | 7,750 | 9,058 | |||||||||
County of Will, GO, 4.00%, 11/15/47, Continuously Callable @ 100 | 2,000 | 2,207 | |||||||||
Illinois Finance Authority Revenue | |||||||||||
3.90%, 3/1/30, Continuously Callable @ 100 | 14,000 | 15,158 | |||||||||
5.50%, 4/1/32, Continuously Callable @ 100 | 7,065 | 7,067 | |||||||||
4.00%, 2/1/33, Continuously Callable @ 100 | 6,000 | 6,381 | |||||||||
5.00%, 5/15/37, Continuously Callable @ 100 | 700 | 714 | |||||||||
4.00%, 3/1/38, Continuously Callable @ 100 | 2,000 | 2,231 | |||||||||
4.00%, 2/15/41, Pre-refunded 2/15/27 @ 100 | 20 | 24 | |||||||||
5.00%, 8/1/42, Continuously Callable @ 100 | 750 | 833 | |||||||||
6.00%, 7/1/43, Continuously Callable @ 100 | 5,000 | 5,575 | |||||||||
5.00%, 1/1/44, Continuously Callable @ 100 | 10,000 | 11,513 | |||||||||
5.00%, 8/15/44, Continuously Callable @ 100 | 2,000 | 2,155 | |||||||||
4.00%, 12/1/46, Continuously Callable @ 100 | 4,500 | 4,736 | |||||||||
5.00%, 2/15/47, Continuously Callable @ 100 | 1,000 | 1,117 | |||||||||
5.00%, 5/15/47, Continuously Callable @ 100 | 1,155 | 1,120 | |||||||||
5.00%, 8/1/47, Continuously Callable @ 100 | 750 | 826 | |||||||||
5.00%, 12/1/47, Continuously Callable @ 100 | 2,000 | 2,233 | |||||||||
5.00%, 10/1/49, Continuously Callable @ 100 | 1,250 | 1,469 | |||||||||
5.00%, 2/15/50, Continuously Callable @ 100 | 500 | 557 | |||||||||
5.00%, 10/1/51, Continuously Callable @ 100 | 1,000 | 1,174 | |||||||||
Series A, 6.00%, 10/1/32, Pre-refunded 4/1/21 @ 100 | 8,000 | 8,390 | |||||||||
Series A, 4.00%, 7/1/38, Continuously Callable @ 100 | 5,000 | 5,387 | |||||||||
Series A, 4.00%, 10/1/40, Continuously Callable @ 100 | 12,395 | 13,633 | |||||||||
Series C, 4.00%, 2/15/41, Continuously Callable @ 100 | 10,495 | 11,350 | |||||||||
Series C, 4.00%, 2/15/41, Pre-refunded 2/15/27 @ 100 | 485 | 570 | |||||||||
| Illinois State Toll Highway Authority Revenue, Series A, 4.00%, 1/1/44, Continuously Callable @ 100 | 4,000 | 4,394 | |||||||||
See notes to financial statements.
16
| USAA Mutual Funds Trust USAA Tax Exempt Long-Term Fund | Schedule of Portfolio Investments — continued March 31, 2020 | ||||||
(Amounts in Thousands, Except for Shares)
Security Description | Principal Amount | Value | |||||||||
| Northern Illinois Municipal Power Agency Revenue, Series A, 4.00%, 12/1/41, Continuously Callable @ 100 | $ | 9,000 | $ | 9,423 | |||||||
| Northern Illinois University Revenue (INS — Build America Mutual Assurance Co.), Series B, 4.00%, 4/1/41, Continuously Callable @ 100 (j) | 600 | 557 | |||||||||
| Railsplitter Tobacco Settlement Authority Revenue, 5.50%, 6/1/23, Pre-refunded 6/1/21 @ 100 | 10,000 | 10,531 | |||||||||
| Regional Transportation Authority Revenue (INS — Assured Guaranty Municipal Corp.), 5.75%, 6/1/20 | 23,980 | 24,150 | |||||||||
| Regional Transportation Authority Revenue (INS — National Public Finance Guarantee Corp.), 6.50%, 7/1/30 (k) | 37,550 | 51,262 | |||||||||
Sangamon County Water Reclamation District, GO | |||||||||||
Series A, 4.00%, 1/1/49, Continuously Callable @ 100 | 15,000 | 16,309 | |||||||||
Series A, 5.75%, 1/1/53, Continuously Callable @ 100 | 2,000 | 2,361 | |||||||||
State of Illinois, GO, Series A, 5.00%, 10/1/33, Continuously Callable @ 100 | 2,000 | 2,056 | |||||||||
State of Illinois, GO (INS — Assured Guaranty Municipal Corp.) | |||||||||||
4.00%, 2/1/31, Continuously Callable @ 100 | 1,000 | 971 | |||||||||
4.00%, 2/1/32, Continuously Callable @ 100 | 1,000 | 965 | |||||||||
Series A, 5.00%, 4/1/29, Continuously Callable @ 100 | 8,000 | 8,177 | |||||||||
University of Illinois Revenue, Series A, 5.13%, 4/1/36, Continuously Callable @ 100 | 1,000 | 1,035 | |||||||||
| Village of Rosemont, GO (INS — Assured Guaranty Municipal Corp.), Series A, 5.00%, 12/1/46, Continuously Callable @ 100 | 10,000 | 11,368 | |||||||||
327,967 | |||||||||||
Indiana (1.6%): | |||||||||||
| Evansville Redevelopment Authority Revenue (INS — Build America Mutual Assurance Co.) | |||||||||||
4.00%, 2/1/38, Continuously Callable @ 100 | 5,540 | 6,046 | |||||||||
4.00%, 2/1/39, Continuously Callable @ 100 | 3,605 | 3,922 | |||||||||
Indiana Finance Authority Revenue | |||||||||||
5.00%, 2/1/40, Continuously Callable @ 100 | 1,495 | 1,649 | |||||||||
5.00%, 10/1/44, Continuously Callable @ 100 | 4,000 | 4,152 | |||||||||
5.00%, 11/15/53, Continuously Callable @ 103 | 6,000 | 6,235 | |||||||||
Series A, 5.00%, 6/1/39, Continuously Callable @ 100 | 5,000 | 4,456 | |||||||||
Series A, 5.50%, 4/1/46, Continuously Callable @ 100 | 5,000 | 5,117 | |||||||||
| Richmond Hospital Authority Revenue, 5.00%, 1/1/39, Continuously Callable @ 100 | 7,000 | 7,784 | |||||||||
39,361 | |||||||||||
Iowa (0.5%): | |||||||||||
Iowa Finance Authority Revenue | |||||||||||
5.00%, 5/15/41, Continuously Callable @ 100 | 6,235 | 6,333 | |||||||||
2.88%, 5/15/49, Continuously Callable @ 100 | 1,500 | 1,458 | |||||||||
Series B, 5.00%, 2/15/48, Continuously Callable @ 100 | 4,000 | 4,631 | |||||||||
12,422 | |||||||||||
Kansas (0.4%): | |||||||||||
| City of Coffeyville Electric System Revenue (INS — National Public Finance Guarantee Corp.), Series B, 5.00%, 6/1/42, Continuously Callable @ 100 (e) | 2,500 | 2,747 | |||||||||
City of Lawrence Revenue, 5.00%, 7/1/48, Continuously Callable @ 100 | 5,000 | 5,764 | |||||||||
| Wyandotte County-Kansas City Unified Government Utility System Revenue, Series A, 5.00%, 9/1/45, Continuously Callable @ 100 | 2,000 | 2,305 | |||||||||
10,816 | |||||||||||
See notes to financial statements.
17
| USAA Mutual Funds Trust USAA Tax Exempt Long-Term Fund | Schedule of Portfolio Investments — continued March 31, 2020 | ||||||
(Amounts in Thousands, Except for Shares)
Security Description | Principal Amount | Value | |||||||||
Kentucky (0.5%): | |||||||||||
City of Ashland Revenue, 5.00%, 2/1/40, Continuously Callable @ 100 | $ | 1,000 | $ | 1,076 | |||||||
Kentucky Economic Development Finance Authority Revenue | |||||||||||
5.00%, 5/15/46, Continuously Callable @ 100 | 5,500 | 4,785 | |||||||||
Series B, 5.00%, 8/15/41, Continuously Callable @ 100 | 3,000 | 3,342 | |||||||||
| Kentucky Economic Development Finance Authority Revenue (INS — Assured Guaranty Municipal Corp.) | |||||||||||
4.00%, 12/1/41, Continuously Callable @ 100 | 500 | 548 | |||||||||
Series A, 5.00%, 12/1/45, Continuously Callable @ 100 | 2,000 | 2,325 | |||||||||
12,076 | |||||||||||
Louisiana (4.1%): | |||||||||||
City of Shreveport Water & Sewer Revenue | |||||||||||
5.00%, 12/1/40, Continuously Callable @ 100 | 1,000 | 1,151 | |||||||||
Series B, 5.00%, 12/1/41, Continuously Callable @ 100 | 5,500 | 6,396 | |||||||||
Series B, 4.00%, 12/1/49, Continuously Callable @ 100 | 1,000 | 1,096 | |||||||||
| City of Shreveport Water & Sewer Revenue (INS — Assured Guaranty Municipal Corp.), Series B, 5.00%, 12/1/41, Continuously Callable @ 100 | 2,100 | 2,467 | |||||||||
| City of Shreveport Water & Sewer Revenue (INS — Build America Mutual Assurance Co.), Series B, 4.00%, 12/1/37, Continuously Callable @ 100 | 1,100 | 1,215 | |||||||||
| Jefferson Sales Tax District Revenue, Series B, 4.00%, 12/1/42, Continuously Callable @ 100 | 7,000 | 7,930 | |||||||||
| Lafayette Public Trust Financing Authority Revenue (INS — Assured Guaranty Municipal Corp.), 5.50%, 10/1/35, Pre-refunded 10/1/20 @ 100 | 2,500 | 2,553 | |||||||||
| Louisiana Local Government Environmental Facilities & Community Development Authority Revenue | |||||||||||
3.50%, 11/1/32, Continuously Callable @ 100 | 6,250 | 6,622 | |||||||||
Series A, 6.50%, 8/1/29, Continuously Callable @ 100 | 3,750 | 3,811 | |||||||||
| Louisiana Local Government Environmental Facilities & Community Development Authority Revenue (INS — Assured Guaranty Municipal Corp.) | |||||||||||
5.00%, 10/1/39, Continuously Callable @ 100 | 1,685 | 1,996 | |||||||||
4.00%, 10/1/46, Continuously Callable @ 100 | 8,210 | 8,980 | |||||||||
5.00%, 10/1/48, Continuously Callable @ 100 | 5,000 | 5,855 | |||||||||
Louisiana Public Facilities Authority Revenue | |||||||||||
4.00%, 5/15/41, Pre-refunded 5/15/26 @ 100 | 15 | 17 | |||||||||
4.00%, 5/15/41, Continuously Callable @ 100 | 1,235 | 1,310 | |||||||||
5.00%, 11/1/45, Continuously Callable @ 100 | 6,000 | 6,455 | |||||||||
5.00%, 5/15/46, Continuously Callable @ 100 | 5,000 | 5,636 | |||||||||
4.00%, 12/15/50, Continuously Callable @ 100 | 1,000 | 1,107 | |||||||||
5.00%, 7/1/52, Continuously Callable @ 100 | 400 | 461 | |||||||||
4.00%, 1/1/56, Continuously Callable @ 100 | 9,000 | 9,639 | |||||||||
5.00%, 7/1/57, Continuously Callable @ 100 | 2,000 | 2,302 | |||||||||
| Louisiana Public Facilities Authority Revenue (INS — Build America Mutual Assurance Co.), 5.25%, 6/1/51, Continuously Callable @ 100 | 5,000 | 5,567 | |||||||||
Parish of St. Charles Revenue, 4.00%, 12/1/40, (Put Date 6/1/22) (c) | 6,750 | 6,978 | |||||||||
| State of Louisiana Gasoline & Fuels Tax Revenue, Series C, 5.00%, 5/1/45, Continuously Callable @ 100 | 6,000 | 6,868 | |||||||||
| Tobacco Settlement Financing Corp. Revenue, Series A, 5.25%, 5/15/35, Continuously Callable @ 100 | 1,500 | 1,596 | |||||||||
98,008 | |||||||||||
See notes to financial statements.
18
| USAA Mutual Funds Trust USAA Tax Exempt Long-Term Fund | Schedule of Portfolio Investments — continued March 31, 2020 | ||||||
(Amounts in Thousands, Except for Shares)
Security Description | Principal Amount | Value | |||||||||
Maine (0.4%): | |||||||||||
| Maine Health & Higher Educational Facilities Authority Revenue, Series A, 4.00%, 7/1/46, Continuously Callable @ 100 | $ | 9,000 | $ | 9,007 | |||||||
Massachusetts (1.5%): | |||||||||||
Massachusetts Development Finance Agency Revenue | |||||||||||
5.00%, 4/15/40, Continuously Callable @ 100 | 1,000 | 1,071 | |||||||||
5.00%, 7/1/44, Continuously Callable @ 100 | 3,000 | 3,326 | |||||||||
5.00%, 7/1/46, Continuously Callable @ 100 | 1,000 | 1,090 | |||||||||
5.00%, 7/1/47, Continuously Callable @ 100 | 2,280 | 2,350 | |||||||||
Series A, 5.50%, 7/1/44, Continuously Callable @ 100 | 4,000 | 4,142 | |||||||||
Series A, 4.00%, 10/1/46, Continuously Callable @ 100 | 3,370 | 3,212 | |||||||||
Series A, 4.00%, 6/1/49, Continuously Callable @ 100 | 1,000 | 1,041 | |||||||||
Series D, 5.00%, 7/1/44, Continuously Callable @ 100 | 3,000 | 3,225 | |||||||||
Series E, 4.00%, 7/1/38, Continuously Callable @ 100 | 1,000 | 1,058 | |||||||||
Series J2, 5.00%, 7/1/53, Continuously Callable @ 100 | 10,000 | 11,437 | |||||||||
Massachusetts Health & Educational Facilities Authority Revenue | |||||||||||
Series E, 5.00%, 7/15/32, Continuously Callable @ 100 | 3,500 | 3,452 | |||||||||
Series E, 5.00%, 7/15/37, Continuously Callable @ 100 | 500 | 472 | |||||||||
35,876 | |||||||||||
Michigan (2.2%): | |||||||||||
County of Genesee, GO, Series B, 4.00%, 2/1/41, Continuously Callable @ 100 | 2,000 | 2,155 | |||||||||
| County of Genesee, GO (INS — Build America Mutual Assurance Co.), Series B, 5.00%, 2/1/46, Continuously Callable @ 100 | 2,900 | 3,291 | |||||||||
| Downriver Utility Wastewater Authority Revenue (INS — Assured Guaranty Municipal Corp.), 5.00%, 4/1/43, Continuously Callable @ 100 | 2,500 | 2,978 | |||||||||
| Flint Hospital Building Authority Revenue, 4.00%, 7/1/38, Continuously Callable @ 100 (j) | 2,500 | 2,580 | |||||||||
| Jackson Public Schools, GO (NBGA — Michigan School Bond Qualification and Loan Program) | |||||||||||
5.00%, 5/1/45, Continuously Callable @ 100 | 6,000 | 7,134 | |||||||||
5.00%, 5/1/48, Continuously Callable @ 100 | 3,000 | 3,563 | |||||||||
Karegnondi Water Authority Revenue, 5.00%, 11/1/45, Continuously Callable @ 100 | 2,750 | 3,071 | |||||||||
| Lansing Board of Water & Light Revenue, Series A, 5.00%, 7/1/37, Pre-refunded 7/1/21 @ 100 | 4,500 | 4,717 | |||||||||
| Livonia Public Schools, GO (INS — Assured Guaranty Municipal Corp.), 5.00%, 5/1/45, Continuously Callable @ 100 | 4,000 | 4,602 | |||||||||
Michigan Finance Authority Revenue | |||||||||||
5.00%, 11/1/43, Continuously Callable @ 100 | 1,000 | 1,197 | |||||||||
4.00%, 2/15/47, Continuously Callable @ 100 | 8,000 | 8,677 | |||||||||
Series A, 4.00%, 11/15/50, Continuously Callable @ 100 | 3,000 | 3,217 | |||||||||
| Michigan State Building Authority Revenue, 4.00%, 4/15/54, Continuously Callable @ 100 | 2,000 | 2,233 | |||||||||
Michigan Strategic Fund Revenue, 5.63%, 7/1/20 | 3,000 | 3,032 | |||||||||
52,447 | |||||||||||
Mississippi (0.1%): | |||||||||||
County of Warren Revenue, 5.38%, 12/1/35, Continuously Callable @ 100 | 3,000 | 3,070 | |||||||||
Missouri (2.5%): | |||||||||||
Cape Girardeau County IDA Revenue | |||||||||||
5.00%, 3/1/36, Continuously Callable @ 100 | 750 | 798 | |||||||||
Series A, 6.00%, 3/1/33, Continuously Callable @ 103 | 2,340 | 2,609 | |||||||||
See notes to financial statements.
19
| USAA Mutual Funds Trust USAA Tax Exempt Long-Term Fund | Schedule of Portfolio Investments — continued March 31, 2020 | ||||||
(Amounts in Thousands, Except for Shares)
Security Description | Principal Amount | Value | |||||||||
Hannibal IDA Revenue, 5.00%, 10/1/47, Continuously Callable @ 100 | $ | 3,000 | $ | 3,290 | |||||||
Health & Educational Facilities Authority of the State of Missouri Revenue | |||||||||||
5.00%, 5/15/40, Continuously Callable @ 103 | 5,510 | 5,552 | |||||||||
5.00%, 2/1/42, Continuously Callable @ 104 | 3,500 | 3,539 | |||||||||
4.00%, 2/1/48, Continuously Callable @ 100 | 10,000 | 8,356 | |||||||||
Series A, 5.00%, 11/15/43, Continuously Callable @ 100 | 1,000 | 1,157 | |||||||||
Series A, 4.00%, 2/15/54, Continuously Callable @ 100 | 2,500 | 2,673 | |||||||||
| Missouri Development Finance Board Revenue, 4.00%, 6/1/46, Continuously Callable @ 100 | 17,775 | 18,763 | |||||||||
St. Louis County IDA Revenue | |||||||||||
5.88%, 9/1/43, Continuously Callable @ 100 | 5,000 | 5,175 | |||||||||
5.00%, 9/1/48, Continuously Callable @ 100 | 2,000 | 1,961 | |||||||||
| St. Louis Municipal Finance Corp. Revenue (INS — Assured Guaranty Municipal Corp.), 5.00%, 10/1/38, Continuously Callable @ 100 | 3,065 | 3,515 | |||||||||
Stoddard County IDA Revenue, Series B, 6.00%, 3/1/37, Continuously Callable @ 103 | 2,000 | 2,151 | |||||||||
59,539 | |||||||||||
Montana (0.2%): | |||||||||||
City of Forsyth Revenue, 3.90%, 3/1/31, Callable 3/1/23 @ 100 (d) | 4,000 | 4,109 | |||||||||
Nebraska (0.6%): | |||||||||||
Central Plains Energy Project Revenue, Series A, 5.00%, 9/1/42 | 2,000 | 2,425 | |||||||||
| Douglas County Hospital Authority No. 3 Revenue, 5.00%, 11/1/48, Continuously Callable @ 100 | 3,400 | 3,765 | |||||||||
| Nebraska Educational Health Cultural & Social Services Finance Authority Revenue, 4.00%, 1/1/49, Continuously Callable @ 102 | 7,500 | 7,940 | |||||||||
14,130 | |||||||||||
Nevada (0.9%): | |||||||||||
City of Carson City Revenue, 5.00%, 9/1/47, Continuously Callable @ 100 | 2,775 | 3,138 | |||||||||
Las Vegas Convention & Visitors Authority Revenue | |||||||||||
Series C, 4.00%, 7/1/41, Continuously Callable @ 100 | 4,400 | 4,676 | |||||||||
Series C, 4.00%, 7/1/46, Continuously Callable @ 100 | 12,140 | 12,736 | |||||||||
20,550 | |||||||||||
New Jersey (4.7%): | |||||||||||
New Jersey Economic Development Authority Revenue | |||||||||||
6.31% (MUNIPSA+160bps), 3/1/28, Callable 3/1/23 @ 100 (b) | 20,000 | 18,440 | |||||||||
5.00%, 6/15/28, Continuously Callable @ 100 | 2,000 | 2,060 | |||||||||
5.00%, 6/15/40, Continuously Callable @ 100 | 8,125 | 8,407 | |||||||||
5.00%, 6/15/40, Pre-refunded 6/15/24 @ 100 | 1,875 | 2,183 | |||||||||
4.00%, 11/1/44, Continuously Callable @ 100 | 3,000 | 2,884 | |||||||||
4.00%, 6/15/49, Continuously Callable @ 100 | 4,000 | 3,833 | |||||||||
Series A, 5.00%, 6/15/47, Continuously Callable @ 100 | 3,000 | 3,175 | |||||||||
Series AAA, 5.00%, 6/15/41, Continuously Callable @ 100 | 4,000 | 4,209 | |||||||||
Series B, 5.00%, 6/15/43, Continuously Callable @ 100 | 3,500 | 3,724 | |||||||||
Series GG, 5.00%, 9/1/24, Continuously Callable @ 100 | 6,000 | 6,082 | |||||||||
Series WW, 5.25%, 6/15/40, Continuously Callable @ 100 | 2,835 | 2,988 | |||||||||
Series WW, 5.25%, 6/15/40, Pre-refunded 6/15/25 @ 100 | 165 | 200 | |||||||||
| New Jersey Economic Development Authority Revenue (INS — Assured Guaranty Municipal Corp.), 5.00%, 6/1/42, Continuously Callable @ 100 | 1,200 | 1,400 | |||||||||
New Jersey Educational Facilities Authority Revenue | |||||||||||
Series B, 5.00%, 9/1/36, Continuously Callable @ 100 | 5,000 | 5,258 | |||||||||
Series F, 5.00%, 7/1/47, Continuously Callable @ 100 | 3,000 | 3,336 | |||||||||
See notes to financial statements.
20
| USAA Mutual Funds Trust USAA Tax Exempt Long-Term Fund | Schedule of Portfolio Investments — continued March 31, 2020 | ||||||
(Amounts in Thousands, Except for Shares)
Security Description | Principal Amount | Value | |||||||||
New Jersey Health Care Facilities Financing Authority Revenue | |||||||||||
5.00%, 10/1/38, Continuously Callable @ 100 | $ | 2,250 | $ | 2,391 | |||||||
Series A, 5.63%, 7/1/32, Pre-refunded 7/1/21 @ 100 | 15,000 | 15,900 | |||||||||
| New Jersey Health Care Facilities Financing Authority Revenue (INS — Assured Guaranty Municipal Corp.), Series A, 5.00%, 7/1/46, Continuously Callable @ 100 | 1,250 | 1,313 | |||||||||
New Jersey Transportation Trust Fund Authority Revenue | |||||||||||
5.25%, 6/15/43, Continuously Callable @ 100 | 4,000 | 4,330 | |||||||||
Series A, 5.00%, 12/15/36, Continuously Callable @ 100 | 2,125 | 2,274 | |||||||||
Series AA, 5.25%, 6/15/41, Continuously Callable @ 100 | 2,000 | 2,107 | |||||||||
Series BB, 4.00%, 6/15/50, Continuously Callable @ 100 | 15,000 | 14,446 | |||||||||
| Tobacco Settlement Financing Corp. Revenue, Series A, 5.25%, 6/1/46, Continuously Callable @ 100 | 3,000 | 3,081 | |||||||||
114,021 | |||||||||||
New Mexico (0.4%): | |||||||||||
City of Farmington Revenue, 5.90%, 6/1/40, Continuously Callable @ 100 | 5,000 | 5,017 | |||||||||
| New Mexico Hospital Equipment Loan Council Revenue, Series LA, 5.00%, 7/1/49, Continuously Callable @ 102 | 5,750 | 5,679 | |||||||||
10,696 | |||||||||||
New York (1.9%): | |||||||||||
| Buffalo & Erie County Industrial Land Development Corp. Revenue, 5.38%, 10/1/41, Pre-refunded 4/1/21 @ 100 | 2,040 | 2,131 | |||||||||
Metropolitan Transportation Authority Revenue, Series A, 11/15/32 (f) | 5,000 | 3,500 | |||||||||
New York Liberty Development Corp. Revenue | |||||||||||
5.25%, 10/1/35 | 16,130 | 19,659 | |||||||||
2.80%, 9/15/69, Continuously Callable @ 100 | 1,500 | 1,393 | |||||||||
New York State Dormitory Authority Revenue | |||||||||||
5.25%, 7/1/29, Continuously Callable @ 100 | 2,250 | 2,257 | |||||||||
Series A, 4.00%, 9/1/50, Continuously Callable @ 100 | 3,000 | 3,119 | |||||||||
| New York State Thruway Authority Revenue, Series A, 5.00%, 1/1/51, Continuously Callable @ 100 | 2,000 | 2,237 | |||||||||
Triborough Bridge & Tunnel Authority Revenue | |||||||||||
Series A, 11/15/31 (f) | 5,000 | 3,752 | |||||||||
Series A, 11/15/32 (f) | 3,000 | 2,170 | |||||||||
Series B, 11/15/32 (f) | 2,500 | 1,790 | |||||||||
| Troy Capital Resource Corp. Revenue, Series A, 5.00%, 9/1/30, Continuously Callable @ 100 | 2,000 | 2,030 | |||||||||
| TSASC, Inc. Revenue Bonds, Series A, 5.00%, 6/1/41, Continuously Callable @ 100 | 1,000 | 1,047 | |||||||||
45,085 | |||||||||||
North Carolina (0.5%): | |||||||||||
| North Carolina Capital Facilities Finance Agency Revenue, 4.63%, 11/1/40, Continuously Callable @ 100 | 10,000 | 10,162 | |||||||||
| North Carolina Medical Care Commission Revenue, 5.00%, 1/1/49, Continuously Callable @ 104 | 2,725 | 2,816 | |||||||||
12,978 | |||||||||||
See notes to financial statements.
21
| USAA Mutual Funds Trust USAA Tax Exempt Long-Term Fund | Schedule of Portfolio Investments — continued March 31, 2020 | ||||||
(Amounts in Thousands, Except for Shares)
Security Description | Principal Amount | Value | |||||||||
North Dakota (0.7%): | |||||||||||
City of Fargo Revenue, 6.25%, 11/1/31, Continuously Callable @ 100 | $ | 4,685 | $ | 4,996 | |||||||
| County of McLean Revenue, Series A, 4.88%, 7/1/26, Continuously Callable @ 100 | 2,500 | 2,520 | |||||||||
County of Ward Revenue, Series C, 5.00%, 6/1/53, Continuously Callable @ 100 | 7,500 | 8,223 | |||||||||
15,739 | |||||||||||
Ohio (2.0%): | |||||||||||
City of Centerville Revenue, 5.25%, 11/1/47, Continuously Callable @ 100 | 2,700 | 2,717 | |||||||||
| City of Cleveland Airport System Revenue (INS — Assured Guaranty Municipal Corp.), Series A, 5.00%, 1/1/31, Pre-refunded 1/1/22 @ 100 | 1,000 | 1,071 | |||||||||
County of Cuyahoga Revenue, 4.75%, 2/15/47, Continuously Callable @ 100 | 9,000 | 9,344 | |||||||||
County of Hamilton Revenue, 5.00%, 1/1/51, Continuously Callable @ 100 | 2,500 | 2,349 | |||||||||
County of Lake Revenue, 5.63%, 8/15/29, Continuously Callable @ 100 | 320 | 321 | |||||||||
County of Lucas Revenue, 5.25%, 11/15/48, Continuously Callable @ 100 | 6,000 | 6,581 | |||||||||
County of Montgomery Revenue | |||||||||||
4.00%, 11/15/42, Continuously Callable @ 100 | 2,000 | 2,098 | |||||||||
4.00%, 11/15/45, Continuously Callable @ 100 | 2,000 | 2,074 | |||||||||
County of Ross Revenue | |||||||||||
5.00%, 12/1/44, Continuously Callable @ 100 | 3,100 | 3,625 | |||||||||
5.00%, 12/1/49, Continuously Callable @ 100 | 6,000 | 6,983 | |||||||||
Ohio Air Quality Development Authority Revenue, 8/1/30 (a) (l) | 6,000 | — | (m) | ||||||||
| Ohio Higher Educational Facility Commission Revenue, 5.25%, 1/1/48, Continuously Callable @ 104 | 1,000 | 906 | |||||||||
| Ohio Turnpike & Infrastructure Commission Revenue, 5.25%, 2/15/33, Continuously Callable @ 100 | 2,000 | 2,205 | |||||||||
State of Ohio Revenue, Series A, 4.00%, 1/15/50, Continuously Callable @ 100 | 7,000 | 7,308 | |||||||||
47,582 | |||||||||||
Oklahoma (1.0%): | |||||||||||
| Comanche County Hospital Authority Revenue, Series A, 5.00%, 7/1/32, Continuously Callable @ 100 | 4,200 | 4,264 | |||||||||
| Norman Regional Hospital Authority Revenue, 4.00%, 9/1/45, Continuously Callable @ 100 | 3,000 | 2,724 | |||||||||
| Oklahoma Development Finance Authority Revenue, Series B, 5.50%, 8/15/57, Continuously Callable @ 100 | 4,250 | 4,774 | |||||||||
| Oklahoma Municipal Power Authority Revenue, Series A, 4.00%, 1/1/47, Continuously Callable @ 100 | 10,000 | 10,681 | |||||||||
| Tulsa County Industrial Authority Revenue, 5.25%, 11/15/45, Continuously Callable @ 102 | 2,000 | 2,017 | |||||||||
24,460 | |||||||||||
Oregon (0.2%): | |||||||||||
City of Keizer Special Assessment, 5.20%, 6/1/31, Continuously Callable @ 100 | 925 | 928 | |||||||||
| Deschutes County Hospital Facilities Authority Revenue, 4.00%, 1/1/46, Continuously Callable @ 100 | 2,000 | 2,112 | |||||||||
| Salem Hospital Facility Authority Revenue, 5.00%, 5/15/48, Continuously Callable @ 102 | 1,000 | 1,042 | |||||||||
| Yamhill County Hospital Authority Revenue, 5.00%, 11/15/51, Continuously Callable @ 102 | 1,180 | 1,121 | |||||||||
5,203 | |||||||||||
See notes to financial statements.
22
| USAA Mutual Funds Trust USAA Tax Exempt Long-Term Fund | Schedule of Portfolio Investments — continued March 31, 2020 | ||||||
(Amounts in Thousands, Except for Shares)
Security Description | Principal Amount | Value | |||||||||
Pennsylvania (8.1%): | |||||||||||
| Allegheny County Higher Education Building Authority Revenue, Series A, 5.50%, 3/1/31, Pre-refunded 3/1/21 @ 100 | $ | 750 | $ | 780 | |||||||
| Allegheny County Hospital Development Authority Revenue, 5.00%, 4/1/47, Continuously Callable @ 100 | 6,500 | 7,246 | |||||||||
| Allegheny County Sanitary Authority Revenue, 5.00%, 6/1/43, Continuously Callable @ 100 | 3,170 | 3,823 | |||||||||
| Allegheny County Sanitary Authority Revenue (INS — Assured Guaranty Municipal Corp.), 5.00%, 6/1/40, Continuously Callable @ 100 | 4,000 | 4,092 | |||||||||
| Allentown Commercial & IDA Revenue, 6.25%, 7/1/47, Continuously Callable @ 100 (e) | 5,000 | 4,664 | |||||||||
Altoona Area School District, GO (INS — Build America Mutual Assurance Co.) | |||||||||||
5.00%, 12/1/45, Continuously Callable @ 100 | 1,000 | 1,143 | |||||||||
5.00%, 12/1/48, Continuously Callable @ 100 | 300 | 341 | |||||||||
Armstrong School District, GO | |||||||||||
Series A, 4.00%, 3/15/38, Continuously Callable @ 100 | 1,000 | 1,137 | |||||||||
Series A, 4.00%, 3/15/41, Continuously Callable @ 100 | 2,250 | 2,544 | |||||||||
Berks County IDA Revenue | |||||||||||
5.00%, 5/15/48, Continuously Callable @ 102 | 1,000 | 1,038 | |||||||||
5.00%, 11/1/50, Continuously Callable @ 100 | 8,500 | 9,281 | |||||||||
Bucks County IDA Revenue, 4.00%, 8/15/50, Continuously Callable @ 100 | 3,000 | 3,197 | |||||||||
Canon Mcmillan School District, GO | |||||||||||
4.00%, 6/1/48, Continuously Callable @ 100 | 4,605 | 5,015 | |||||||||
4.00%, 6/1/50, Continuously Callable @ 100 | 6,065 | 6,594 | |||||||||
| Chester County IDA Revenue, Series A, 5.25%, 10/15/47, Continuously Callable @ 100 | 3,250 | 3,146 | |||||||||
| Commonwealth Financing Authority Revenue, 5.00%, 6/1/35, Continuously Callable @ 100 | 500 | 591 | |||||||||
| Commonwealth of Pennsylvania Certificate of Participation, Series A, 5.00%, 7/1/43, Continuously Callable @ 100 | 1,000 | 1,171 | |||||||||
County of Lehigh Revenue, 4.00%, 7/1/49, Continuously Callable @ 100 | 15,000 | 15,879 | |||||||||
| Delaware River Joint Toll Bridge Commission Revenue, 5.00%, 7/1/47, Continuously Callable @ 100 | 5,000 | 5,875 | |||||||||
Erie Parking Authority Revenue (INS — Assured Guaranty Municipal Corp.) | |||||||||||
5.13%, 9/1/32, Pre-refunded 9/1/20 @ 100 | 480 | 488 | |||||||||
5.13%, 9/1/32, Continuously Callable @ 100 | 1,390 | 1,410 | |||||||||
5.20%, 9/1/35, Pre-refunded 9/1/20 @ 100 | 595 | 605 | |||||||||
5.20%, 9/1/35, Continuously Callable @ 100 | 1,700 | 1,725 | |||||||||
Montgomery County Higher Education & Health Authority Revenue | |||||||||||
4.00%, 9/1/49, Continuously Callable @ 100 | 2,500 | 2,607 | |||||||||
4.00%, 9/1/51, Continuously Callable @ 100 | 3,500 | 3,649 | |||||||||
Montgomery County IDA Revenue | |||||||||||
5.00%, 12/1/44, Continuously Callable @ 103 | 1,000 | 1,113 | |||||||||
5.00%, 12/1/48, Continuously Callable @ 102 | 2,000 | 2,078 | |||||||||
5.00%, 12/1/49, Continuously Callable @ 103 | 1,000 | 1,101 | |||||||||
Northampton County General Purpose Authority Revenue | |||||||||||
4.00%, 8/15/40, Continuously Callable @ 100 | 4,000 | 4,259 | |||||||||
5.00%, 8/15/48, Continuously Callable @ 100 | 2,440 | 2,794 | |||||||||
Northeastern Pennsylvania Hospital & Education Authority Revenue | |||||||||||
5.00%, 5/1/44, Continuously Callable @ 100 | 1,000 | 1,172 | |||||||||
5.00%, 5/1/49, Continuously Callable @ 100 | 1,350 | 1,573 | |||||||||
See notes to financial statements.
23
| USAA Mutual Funds Trust USAA Tax Exempt Long-Term Fund | Schedule of Portfolio Investments — continued March 31, 2020 | ||||||
(Amounts in Thousands, Except for Shares)
Security Description | Principal Amount | Value | |||||||||
| Pennsylvania Economic Development Financing Authority Revenue, 4.00%, 10/1/23, Continuously Callable @ 100 | $ | 7,000 | $ | 7,090 | |||||||
Pennsylvania Higher Educational Facilities Authority Revenue | |||||||||||
Series A, 5.25%, 7/15/33, Continuously Callable @ 100 | 1,970 | 2,182 | |||||||||
Series A, 5.50%, 7/15/38, Continuously Callable @ 100 | 2,750 | 3,047 | |||||||||
Pennsylvania Turnpike Commission Revenue | |||||||||||
5.00%, 12/1/37, Continuously Callable @ 100 | 1,000 | 1,183 | |||||||||
Series A, 4.00%, 12/1/49, Continuously Callable @ 100 | 5,000 | 5,409 | |||||||||
Series A-1, 5.00%, 12/1/46, Continuously Callable @ 100 | 3,000 | 3,365 | |||||||||
Series A-1, 5.00%, 12/1/47, Continuously Callable @ 100 | 4,000 | 4,631 | |||||||||
Series A-2, 5.00%, 12/1/33, Continuously Callable @ 100 (d) | 1,250 | 1,521 | |||||||||
Series B, 5.00%, 6/1/39, Continuously Callable @ 100 | 8,000 | 9,226 | |||||||||
Series B, 5.00%, 12/1/43, Continuously Callable @ 100 | 5,000 | 5,926 | |||||||||
Series B, 5.25%, 12/1/44, Continuously Callable @ 100 | 10,000 | 11,323 | |||||||||
Series B-1, 5.00%, 6/1/42, Continuously Callable @ 100 | 4,000 | 4,626 | |||||||||
| Philadelphia School District General Obligation Bonds, Series A, 5.00%, 9/1/44, Continuously Callable @ 100 | 10,000 | 11,871 | |||||||||
| Pittsburgh Water & Sewer Authority Revenue (INS — Assured Guaranty Municipal Corp.), Series A, 5.00%, 9/1/44, Continuously Callable @ 100 | 5,000 | 6,137 | |||||||||
| Reading School District, GO (INS — Build America Mutual Assurance Co.), Series A, 4.00%, 4/1/44, Continuously Callable @ 100 | 1,055 | 1,184 | |||||||||
School District of Philadelphia, GO | |||||||||||
Series B, 5.00%, 9/1/43, Continuously Callable @ 100 | 2,500 | 2,931 | |||||||||
Series F, 5.00%, 9/1/37, Continuously Callable @ 100 | 1,000 | 1,161 | |||||||||
Series F, 5.00%, 9/1/38, Continuously Callable @ 100 | 2,000 | 2,316 | |||||||||
| Scranton School District, GO (INS — Build America Mutual Assurance Co.), Series E, 4.00%, 12/1/37, Continuously Callable @ 100 | 1,025 | 1,148 | |||||||||
Washington County IDA Revenue, 5.00%, 11/1/36, Pre-refunded 5/1/20 @ 100 | 3,200 | 3,210 | |||||||||
| Wilkes-Barre Area School District, GO (INS — Build America Mutual Assurance Co.) 4.00%, 4/15/49, Continuously Callable @ 100 | 750 | 837 | |||||||||
5.00%, 4/15/59, Continuously Callable @ 100 | 3,000 | 3,579 | |||||||||
196,034 | |||||||||||
Puerto Rico (0.1%): | |||||||||||
| Puerto Rico Industrial Tourist Educational Medical & Environmental Control Facilities Authority Revenue, 5.38%, 4/1/42, Continuously Callable @ 100 | 2,000 | 1,822 | |||||||||
Rhode Island (0.1%): | |||||||||||
| Rhode Island Health & Educational Building Corp. Revenue, 6.00%, 9/1/33, Pre-refunded 9/1/23 @ 100 | 2,000 | 2,302 | |||||||||
| Rhode Island Housing & Mortgage Finance Corp. Revenue, Series 15-A, 6.85%, 10/1/24, Continuously Callable @ 100 | 180 | 181 | |||||||||
2,483 | |||||||||||
South Carolina (0.5%): | |||||||||||
| City of Rock Hill Combined Utility System Revenue, Series A, 4.00%, 1/1/49, Continuously Callable @ 100 | 2,500 | 2,789 | |||||||||
South Carolina Jobs-Economic Development Authority Revenue | |||||||||||
5.00%, 4/1/54, Continuously Callable @ 103 | 1,000 | 944 | |||||||||
4.00%, 4/1/54, Continuously Callable @ 103 | 1,165 | 925 | |||||||||
| South Carolina Public Service Authority Revenue, Series E, 5.25%, 12/1/55, Continuously Callable @ 100 | 7,000 | 7,621 | |||||||||
12,279 | |||||||||||
See notes to financial statements.
24
| USAA Mutual Funds Trust USAA Tax Exempt Long-Term Fund | Schedule of Portfolio Investments — continued March 31, 2020 | ||||||
(Amounts in Thousands, Except for Shares)
Security Description | Principal Amount | Value | |||||||||
South Dakota (0.2%): | |||||||||||
| Educational Enhancement Funding Corp. Revenue, Series B, 5.00%, 6/1/27, Continuously Callable @ 100 | $ | 500 | $ | 548 | |||||||
| South Dakota Health & Educational Facilities Authority Revenue, Series A, 5.00%, 7/1/42, Pre-refunded 7/1/21 @ 100 | 4,000 | 4,187 | |||||||||
4,735 | |||||||||||
Tennessee (0.5%): | |||||||||||
| Greeneville Health & Educational Facilities Board Revenue, 5.00%, 7/1/44, Continuously Callable @ 100 | 2,000 | 2,228 | |||||||||
| Johnson City Health & Educational Facilities Board Revenue, 5.00%, 8/15/42, Continuously Callable @ 100 | 2,000 | 2,110 | |||||||||
| Metropolitan Government Nashville & Davidson County Health & Educational Facilities Board Revenue | |||||||||||
5.00%, 10/1/45, Continuously Callable @ 100 | 1,500 | 1,681 | |||||||||
5.00%, 7/1/46, Continuously Callable @ 100 | 4,000 | 4,374 | |||||||||
| Metropolitan Nashville Airport Authority Revenue, Series A, 4.00%, 7/1/54, Continuously Callable @ 100 | 2,000 | 2,207 | |||||||||
12,600 | |||||||||||
Texas (17.7%): | |||||||||||
| Arlington Higher Education Finance Corp. Revenue (NBGA — Texas Permanent School Fund) | |||||||||||
4.00%, 8/15/43, Continuously Callable @ 100 | 10,000 | 11,128 | |||||||||
4.00%, 8/15/44, Continuously Callable @ 100 | 2,170 | 2,466 | |||||||||
Series A, 5.00%, 2/15/41, Continuously Callable @ 100 | 3,000 | 3,394 | |||||||||
Series A, 5.00%, 12/1/53, Continuously Callable @ 100 | 7,200 | 7,993 | |||||||||
Bexar County Health Facilities Development Corp. Revenue | |||||||||||
5.00%, 7/15/42, Continuously Callable @ 105 | 600 | 636 | |||||||||
4.00%, 7/15/45, Continuously Callable @ 100 | 8,450 | 7,697 | |||||||||
Central Texas Regional Mobility Authority Revenue | |||||||||||
5.75%, 1/1/31, Pre-refunded 1/1/21 @ 100 | 6,000 | 6,197 | |||||||||
4.00%, 1/1/41, Continuously Callable @ 100 | 5,000 | 5,043 | |||||||||
5.00%, 1/1/42, Continuously Callable @ 100 | 2,500 | 2,581 | |||||||||
Series A, 5.00%, 1/1/45, Continuously Callable @ 100 | 3,500 | 3,747 | |||||||||
Central Texas Turnpike System Revenue | |||||||||||
Series A, 5.00%, 8/15/41, Pre-refunded 8/15/22 @ 100 | 3,850 | 4,199 | |||||||||
Series C, 5.00%, 8/15/42, Continuously Callable @ 100 | 6,500 | 6,847 | |||||||||
| Central Texas Turnpike System Revenue (INS — AMBAC Assurance Corp.), Series A, 8/15/30 (f) | 18,530 | 14,780 | |||||||||
| City of Arlington Special Tax (INS — Assured Guaranty Municipal Corp.), Series A, 5.00%, 2/15/48, Continuously Callable @ 100 | 7,500 | 8,987 | |||||||||
| City of Corpus Christi Utility System Revenue, 4.00%, 7/15/39, Continuously Callable @ 100 | 5,900 | 6,473 | |||||||||
| City of Houston Hotel Occupancy Tax & Special Revenue, 5.00%, 9/1/40, Continuously Callable @ 100 | 3,715 | 4,017 | |||||||||
| City of Laredo Waterworks & Sewer System Revenue, 4.00%, 3/1/41, Continuously Callable @ 100 | 700 | 766 | |||||||||
Clifton Higher Education Finance Corp. Revenue | |||||||||||
6.00%, 8/15/33, Continuously Callable @ 100 | 1,000 | 1,132 | |||||||||
6.00%, 8/15/43, Continuously Callable @ 100 | 2,750 | 3,108 | |||||||||
See notes to financial statements.
25
| USAA Mutual Funds Trust USAA Tax Exempt Long-Term Fund | Schedule of Portfolio Investments — continued March 31, 2020 | ||||||
(Amounts in Thousands, Except for Shares)
Security Description | Principal Amount | Value | |||||||||
| Clifton Higher Education Finance Corp. Revenue (NBGA — Texas Permanent School Fund) | |||||||||||
5.00%, 8/15/39, Continuously Callable @ 100 | $ | 4,250 | $ | 4,724 | |||||||
4.00%, 8/15/44, Continuously Callable @ 100 | 11,000 | 11,889 | |||||||||
5.00%, 8/15/48, Continuously Callable @ 100 | 10,000 | 11,466 | |||||||||
County of Bexar Revenue | |||||||||||
4.00%, 8/15/44, Continuously Callable @ 100 | 500 | 579 | |||||||||
4.00%, 8/15/49, Continuously Callable @ 100 | 1,700 | 1,966 | |||||||||
| Dallas/Fort Worth International Airport Revenue, Series G, 5.00%, 11/1/34, Continuously Callable @ 100 | 4,000 | 4,078 | |||||||||
| Del Mar College District, GO, Series A, 5.00%, 8/15/48, Continuously Callable @ 100 | 6,500 | 7,409 | |||||||||
| Everman Independent School District, GO (NBGA — Texas Permanent School Fund), 4.00%, 2/15/50, Continuously Callable @ 100 | 4,500 | 5,096 | |||||||||
| Grand Parkway Transportation Corp. Revenue, 4.00%, 10/1/49, Continuously Callable @ 100 | 2,000 | 2,202 | |||||||||
| Harris County Cultural Education Facilities Finance Corp. Revenue, 5.00%, 6/1/38, Continuously Callable @ 100 | 6,100 | 6,466 | |||||||||
| Harris County Hospital District Revenue, 4.00%, 2/15/42, Continuously Callable @ 100 | 15,000 | 16,027 | |||||||||
| Houston Higher Education Finance Corp. Revenue, Series A, 5.00%, 9/1/42, Continuously Callable @ 100 | 10,000 | 10,722 | |||||||||
| Karnes County Hospital District Revenue, 5.00%, 2/1/44, Continuously Callable @ 100 | 6,000 | 6,568 | |||||||||
| Kerrville Health Facilities Development Corp. Revenue, 5.00%, 8/15/35, Continuously Callable @ 100 | 1,900 | 2,145 | |||||||||
| Laredo Community College District Revenue (INS — Assured Guaranty Municipal Corp.), 5.25%, 8/1/35, Pre-refunded 8/1/20 @ 100 | 3,000 | 3,041 | |||||||||
Matagorda County Navigation District No. 1 Revenue | |||||||||||
4.00%, 6/1/30, Continuously Callable @ 100 | 6,000 | 6,318 | |||||||||
4.00%, 6/1/30, Continuously Callable @ 100 | 9,615 | 10,235 | |||||||||
| Midlothian Independent School District, GO (NBGA — Texas Permanent School Fund), 5.00%, 2/15/47, Continuously Callable @ 100 | 15,000 | 17,731 | |||||||||
New Hope Cultural Education Facilities Finance Corp. Revenue | |||||||||||
5.00%, 4/1/48, Continuously Callable @ 100 | 1,250 | 1,083 | |||||||||
Series A, 5.00%, 7/1/47, Continuously Callable @ 100 | 6,000 | 5,524 | |||||||||
New Hope Cultural Education Facilities Finance Corp. Revenue Bonds | |||||||||||
5.00%, 7/1/47, Continuously Callable @ 102 | 1,000 | 730 | |||||||||
5.00%, 7/1/47, Continuously Callable @ 102 | 1,000 | 852 | |||||||||
| New Hope Cultural Education Facilities Finance Corp. Revenue (INS — Assured Guaranty Municipal Corp.), 5.00%, 7/1/48, Continuously Callable @ 100 | 1,000 | 1,135 | |||||||||
| North Fort Bend Water Authority Revenue, 5.00%, 12/15/36, Continuously Callable @ 100 | 5,000 | 5,269 | |||||||||
North Texas Tollway Authority Revenue | |||||||||||
5.00%, 1/1/48, Continuously Callable @ 100 | 2,000 | 2,297 | |||||||||
5.00%, 1/1/50, Continuously Callable @ 100 | 1,750 | 2,009 | |||||||||
Series B, 9/1/37, Pre-refunded 9/1/31 @ 64.1040 (f) | 3,000 | 1,525 | |||||||||
Series B, 5.00%, 1/1/45, Continuously Callable @ 100 | 5,000 | 5,573 | |||||||||
| North Texas Tollway Authority Revenue (INS — National Public Finance Guarantee Corp.), Series B, 5.00%, 1/1/48, Continuously Callable @ 100 | 5,000 | 5,673 | |||||||||
See notes to financial statements.
26
| USAA Mutual Funds Trust USAA Tax Exempt Long-Term Fund | Schedule of Portfolio Investments — continued March 31, 2020 | ||||||
(Amounts in Thousands, Except for Shares)
Security Description | Principal Amount | Value | |||||||||
Port of Port Arthur Navigation District Revenue | |||||||||||
7.50%, 11/1/40, Continuously Callable @ 100 (d) (k) | $ | 32,000 | $ | 32,000 | |||||||
Series C, 1.54%, 4/1/40, Continuously Callable @ 100 (d) | 26,560 | 26,560 | |||||||||
| Princeton Independent School District, GO (NBGA — Texas Permanent School Fund), 5.00%, 2/15/48, Continuously Callable @ 100 | 7,000 | 8,308 | |||||||||
| Prosper Independent School District, GO (NBGA — Texas Permanent School Fund), 5.00%, 2/15/48, Continuously Callable @ 100 | 15,000 | 18,132 | |||||||||
Red River Education Finance Corp. Revenue | |||||||||||
4.00%, 6/1/41, Continuously Callable @ 100 | 2,000 | 2,075 | |||||||||
5.50%, 10/1/46, Continuously Callable @ 100 | 3,000 | 3,330 | |||||||||
Tarrant County Cultural Education Facilities Finance Corp. Revenue | |||||||||||
5.63%, 11/15/27, Continuously Callable @ 100 (n) | 6,315 | 3,452 | |||||||||
5.75%, 11/15/37, Continuously Callable @ 100 (n) | 4,000 | 2,186 | |||||||||
5.00%, 11/15/46, Continuously Callable @ 100 | 1,000 | 1,128 | |||||||||
6.75%, 11/15/47, Continuously Callable @ 100 | 2,500 | 2,672 | |||||||||
6.75%, 11/15/52, Continuously Callable @ 100 | 4,000 | 4,256 | |||||||||
Series A, 5.00%, 11/15/45, Continuously Callable @ 100 | 4,500 | 3,718 | |||||||||
Series B, 5.00%, 11/15/36, Continuously Callable @ 100 | 3,600 | 3,162 | |||||||||
Series B, 5.00%, 11/15/46, Continuously Callable @ 100 | 7,000 | 7,791 | |||||||||
Series B, 5.00%, 7/1/48, Continuously Callable @ 100 | 10,000 | 11,199 | |||||||||
| Texas Transportation Commission Revenue, 5.00%, 8/1/57, Continuously Callable @ 100 | 5,000 | 5,559 | |||||||||
Uptown Development Authority Tax Allocation | |||||||||||
5.00%, 9/1/37, Continuously Callable @ 100 | 4,365 | 4,874 | |||||||||
5.00%, 9/1/40, Continuously Callable @ 100 | 2,490 | 2,751 | |||||||||
Series A, 5.00%, 9/1/39, Continuously Callable @ 100 | 1,645 | 1,841 | |||||||||
West Harris County Regional Water Authority Revenue | |||||||||||
4.00%, 12/15/45, Continuously Callable @ 100 | 1,600 | 1,821 | |||||||||
4.00%, 12/15/49, Continuously Callable @ 100 | 3,945 | 4,443 | |||||||||
| Wood County Central Hospital District Revenue, 6.00%, 11/1/41, Pre-refunded 11/1/21 @ 100 | 4,770 | 5,141 | |||||||||
| Ysleta Independent School District, GO (NBGA — Texas Permanent School Fund), 4.00%, 8/15/52, Continuously Callable @ 100 | 5,000 | 5,762 | |||||||||
423,684 | |||||||||||
Vermont (0.1%): | |||||||||||
| Vermont Educational & Health Buildings Financing Agency Revenue, 5.00%, 10/15/46, Continuously Callable @ 100 | 3,000 | 3,348 | |||||||||
Virginia (2.0%): | |||||||||||
Alexandria IDA Revenue, 5.00%, 10/1/50, Continuously Callable @ 100 | 5,000 | 5,127 | |||||||||
| Longwood University Student Housing Project (LIQ — Deutsche Bank A.G.), Series DBE-8039, 3.95%, 1/1/57, Callable 1/1/23 @ 100 (d) (e) | 23,400 | 23,400 | |||||||||
Lewistown Commerce Center Community Development Authority Tax Allocation | |||||||||||
3.63%, 3/1/44, Continuously Callable @ 103 | 3,575 | 2,723 | |||||||||
6.05%, 3/1/44, Continuously Callable @ 103 | 1,695 | 1,281 | |||||||||
Series C, 6.05%, 3/1/54, Continuously Callable @ 100 | 5,697 | 1,037 | |||||||||
Virginia College Building Authority Revenue | |||||||||||
5.00%, 6/1/26, Continuously Callable @ 100 | 11,280 | 10,321 | |||||||||
5.00%, 6/1/29, Continuously Callable @ 100 | 5,000 | 4,408 | |||||||||
48,297 | |||||||||||
See notes to financial statements.
27
| USAA Mutual Funds Trust USAA Tax Exempt Long-Term Fund | Schedule of Portfolio Investments — continued March 31, 2020 | ||||||
(Amounts in Thousands, Except for Shares)
Security Description | Principal Amount | Value | |||||||||
Washington (1.0%): | |||||||||||
| King County Public Hospital District No. 1, GO, 5.00%, 12/1/43, Continuously Callable @ 100 | $ | 9,000 | $ | 10,345 | |||||||
| King County Public Hospital District No. 2, GO, Series A, 4.00%, 12/1/45, Continuously Callable @ 100 | 4,000 | 4,374 | |||||||||
| Washington Health Care Facilities Authority Revenue, 4.00%, 7/1/42, Continuously Callable @ 100 | 5,500 | 5,948 | |||||||||
| Washington State Housing Finance Commission Revenue, 5.00%, 1/1/43, Continuously Callable @ 102 (e) | 3,055 | 3,188 | |||||||||
23,855 | |||||||||||
West Virginia (0.2%): | |||||||||||
| West Virginia Economic Development Authority Revenue, Series A, 5.38%, 12/1/38, Continuously Callable @ 100 | 2,000 | 2,028 | |||||||||
| West Virginia Hospital Finance Authority Revenue, 5.00%, 1/1/43, Continuously Callable @ 100 | 2,000 | 2,251 | |||||||||
4,279 | |||||||||||
Wisconsin (2.2%): | |||||||||||
| City of Kaukauna Electric System Revenue (INS — Assured Guaranty Municipal Corp.), Series A, 5.00%, 12/15/35, Pre-refunded 12/15/22 @ 100 | 7,800 | 8,579 | |||||||||
Public Finance Authority Revenue | |||||||||||
5.25%, 5/15/42, Continuously Callable @ 102 (e) | 2,200 | 2,260 | |||||||||
5.00%, 7/1/44, Continuously Callable @ 100 | 6,000 | 6,923 | |||||||||
5.00%, 11/15/44, Continuously Callable @ 103 | 1,460 | 1,522 | |||||||||
5.00%, 7/1/47, Continuously Callable @ 100 | 1,000 | 1,037 | |||||||||
5.00%, 6/15/49, Continuously Callable @ 100 (e) | 520 | 474 | |||||||||
5.00%, 6/15/49, Continuously Callable @ 100 | 1,480 | 1,594 | |||||||||
5.00%, 11/15/49, Continuously Callable @ 103 | 1,400 | 1,463 | |||||||||
5.00%, 7/1/52, Continuously Callable @ 100 | 1,000 | 1,034 | |||||||||
5.00%, 6/15/53, Continuously Callable @ 100 | 1,000 | 1,068 | |||||||||
5.00%, 6/15/54, Continuously Callable @ 100 (e) | 455 | 411 | |||||||||
Series A, 5.25%, 10/1/43, Continuously Callable @ 100 | 3,090 | 3,503 | |||||||||
Series A, 4.00%, 10/1/49, Continuously Callable @ 100 | 11,000 | 11,868 | |||||||||
Public Finance Authority Revenue (INS — Assured Guaranty Municipal Corp.) | |||||||||||
5.00%, 7/1/54, Continuously Callable @ 100 | 1,285 | 1,489 | |||||||||
5.00%, 7/1/58, Continuously Callable @ 100 | 1,500 | 1,735 | |||||||||
Wisconsin Health & Educational Facilities Authority Revenue | |||||||||||
5.00%, 7/1/49, Continuously Callable @ 100 | 1,000 | 1,118 | |||||||||
5.00%, 3/15/50, Continuously Callable @ 100 | 1,175 | 1,369 | |||||||||
Series A, 5.00%, 9/15/50, Continuously Callable @ 100 | 5,000 | 4,782 | |||||||||
Series B, 5.00%, 9/15/45, Continuously Callable @ 100 | 1,000 | 963 | |||||||||
53,192 | |||||||||||
Total Municipal Bonds (Cost $2,340,323) | 2,388,159 | ||||||||||
Total Investments (Cost $2,345,134) — 99.2% | 2,390,613 | ||||||||||
Other assets in excess of liabilities — 0.8% | 20,409 | ||||||||||
NET ASSETS — 100.00% | $ | 2,411,022 | |||||||||
See notes to financial statements.
28
| USAA Mutual Funds Trust USAA Tax Exempt Long-Term Fund | Schedule of Portfolio Investments — continued March 31, 2020 | ||||||
(a) The Fund's Adviser has deemed this security to be illiquid based upon procedures approved by the Board of Trustees. As of March 31, 2020, illiquid securities were 0.1% of the Fund's net assets.
(b) Variable or Floating-Rate Security. Rate disclosed is as of March 31, 2020.
(c) Put Bond.
(d) Variable Rate Demand Notes that provide the rights to sell the security at face value on either that day or within the rate-reset period. The interest rate is reset on the put date at a stipulated daily, weekly, monthly, quarterly, or other specified time interval to reflect current market conditions. These securities do not indicate a reference rate and spread in their description.
(e) Rule 144A security or other security that is restricted as to resale to institutional investors. The Fund's Adviser has deemed this security to be liquid based upon procedures approved by the Board of Trustees. As of March 31, 2020, the fair value of these securities was $46,000 (thousands) and amounted to 1.9% of net assets.
(f) Zero-coupon bond.
(g) Stepped-coupon security converts to coupon form on 08/01/24 with a rate of 5.95%.
(h) Stepped-coupon security converts to coupon form on 08/01/24 with a rate of 6.05%.
(i) Up to 2.05% of the coupon may be paid in kind.
(j) Security purchased on a when-issued basis.
(k) All or a portion of this security has been designated as collateral for securities purchased on a when-issued basis.
(l) Security was fair valued based upon procedures approved by the Board of Trustees and represents 0.0% of the Fund's net assets as of March 31, 2020. This security is classified as Level 3 within the fair value hierarchy. (See Note 2)
(m) Rounds to less than $1 thousand.
(n) Security is in default.
AMBAC — American Municipal Bond Assurance Corporation
bps — Basis points
GO — General Obligation
IDA — Industrial Development Authority
MUNIPSA — Municipal Swap Index
PIK — Payment in-kind
Credit Enhancements — Adds the financial strength of the provider of the enhancement to support the issuer's ability to repay the principal and interest payments when due. The enhancement may be provided by a high-quality bank, insurance company or other corporation, or a collateral trust. The enhancements do not guarantee the market values of the securities.
INS Principal and interest payments are insured by the name listed. Although bond insurance reduces the risk of loss due to default by an issuer, such bonds remain subject to the risk that value may fluctuate for other reasons, and there is no assurance that the insurance company will meet its obligations.
LIQ Liquidity enhancement that may, under certain circumstances, provide for repayment of principal and interest upon demand from the name listed.
NBGA Principal and interest payments or, under certain circumstances, underlying mortgages, are guaranteed by a nonbank guarantee agreement from the name listed.
See notes to financial statements.
29
USAA Mutual Funds Trust | Statement of Assets and Liabilities March 31, 2020 | ||||||
(Amounts in Thousands, Except Per Share Amounts)
| USAA Tax Exempt Long-Term Fund | |||||||
Assets: | |||||||
Investments, at value (Cost $2,345,134) | $ | 2,390,613 | |||||
Receivables: | |||||||
Interest and dividends | 29,278 | ||||||
Capital shares issued | 329 | ||||||
Investments sold | 2,580 | ||||||
From adviser | 2 | ||||||
Prepaid expenses | 11 | ||||||
Total assets | 2,422,813 | ||||||
Liabilities: | |||||||
Payables: | |||||||
Distributions | 1,233 | ||||||
Payable to custodian | 486 | ||||||
Investments purchased | 6,076 | ||||||
Capital shares redeemed | 2,980 | ||||||
Accrued expenses and other payables: | |||||||
Investment advisory fees | 584 | ||||||
Administration fees | 313 | ||||||
Transfer agent fees | 42 | ||||||
Compliance fees | 1 | ||||||
Trustees' fees | 2 | ||||||
| 12b-1 fees | 1 | ||||||
Other accrued expenses | 73 | ||||||
Total liabilities | 11,791 | ||||||
Net Assets: | |||||||
Capital | 2,427,151 | ||||||
Total distributable earnings/(loss) | (16,129 | ) | |||||
Net assets | $ | 2,411,022 | |||||
Net Assets | |||||||
Fund Shares | $ | 2,403,342 | |||||
Adviser Shares | 7,680 | ||||||
Total | $ | 2,411,022 | |||||
Shares (unlimited number of shares authorized with no par value): | |||||||
Fund Shares | 181,886 | ||||||
Adviser Shares | 582 | ||||||
Total | 182,468 | ||||||
Net asset value, offering and redemption price per share: (a) | |||||||
Fund Shares | $ | 13.21 | |||||
Adviser Shares | $ | 13.19 | |||||
(a) Per share amount may not recalculate due to rounding of net assets and/or shares outstanding.
See notes to financial statements.
30
USAA Mutual Funds Trust | Statement of Operations For the Year Ended March 31, 2020 | ||||||
(Amounts in Thousands)
| USAA Tax Exempt Long-Term Fund | |||||||
Investment Income: | |||||||
Interest | $ | 94,997 | |||||
Total income | 94,997 | ||||||
Expenses: | |||||||
Investment advisory fees | 6,935 | ||||||
Professional fees | 9 | ||||||
Administration fees — Fund Shares | 3,703 | ||||||
Administration fees — Adviser Shares | 12 | ||||||
Sub-Administration fees | 19 | ||||||
12b-1 fees — Adviser Shares | 20 | ||||||
Custodian fees | 131 | ||||||
Transfer agent fees — Fund Shares | 681 | ||||||
Transfer agent fees — Adviser Shares | 2 | ||||||
Trustees' fees | 44 | ||||||
Compliance fees | 11 | ||||||
Legal and audit fees | 82 | ||||||
State registration and filing fees | 67 | ||||||
Interest expense on interfund lending | 1 | ||||||
Other expenses | 132 | ||||||
Total expenses | 11,849 | ||||||
Expenses waived/reimbursed by Adviser | (14 | ) | |||||
Expenses waived/reimbursed by AMCO | (10 | ) | |||||
Net expenses | 11,825 | ||||||
Net Investment Income (Loss) | 83,172 | ||||||
Realized/Unrealized Gains (Losses) from Investments: | |||||||
Net realized gains (losses) from investment securities transactions | (937 | ) | |||||
Net change in unrealized appreciation/depreciation on investment securities | (16,375 | ) | |||||
Net realized/unrealized gains (losses) on investments | (17,312 | ) | |||||
Change in net assets resulting from operations | $ | 65,860 | |||||
See notes to financial statements.
31
USAA Mutual Funds Trust | Statements of Changes in Net Assets | ||||||
(Amounts in Thousands)
USAA Tax Exempt Long-Term Fund | |||||||||||
| Year Ended March 31, 2020 | Year Ended March 31, 2019 | ||||||||||
From Investments: | |||||||||||
Operations: | |||||||||||
Net investment income (loss) | $ | 83,172 | $ | 86,740 | |||||||
Net realized gains (losses) from investments | (937 | ) | (5,644 | ) | |||||||
| Net change in unrealized appreciation/depreciation on investments | (16,375 | ) | 19,735 | ||||||||
Change in net assets resulting from operations | 65,860 | 100,831 | |||||||||
Distributions to Shareholders: | |||||||||||
Fund Shares | (82,112 | ) | (87,489 | ) | |||||||
Adviser Shares | (249 | ) | (278 | ) | |||||||
Change in net assets resulting from distributions to shareholders | (82,361 | ) | (87,767 | ) | |||||||
Change in net assets resulting from capital transactions | 56,959 | (10,032 | ) | ||||||||
Change in net assets | 40,458 | 3,032 | |||||||||
Net Assets: | |||||||||||
Beginning of period | 2,370,564 | 2,367,532 | |||||||||
End of period | $ | 2,411,022 | $ | 2,370,564 | |||||||
Capital Transactions: | |||||||||||
Fund Shares | |||||||||||
Proceeds from shares issued | $ | 291,358 | $ | 189,996 | |||||||
Distributions reinvested | 66,585 | 69,306 | |||||||||
Cost of shares redeemed | (300,957 | ) | (268,474 | ) | |||||||
Total Fund Shares | $ | 56,986 | $ | (9,172 | ) | ||||||
Adviser Shares | |||||||||||
Proceeds from shares issued | $ | 325 | $ | 593 | |||||||
Distributions reinvested | 69 | 77 | |||||||||
Cost of shares redeemed | (421 | ) | (1,530 | ) | |||||||
Total Adviser Shares | $ | (27 | ) | $ | (860 | ) | |||||
Change in net assets resulting from capital transactions | $ | 56,959 | $ | (10,032 | ) | ||||||
Share Transactions: | |||||||||||
Fund Shares | |||||||||||
Issued | 21,540 | 14,499 | |||||||||
Reinvested | 4,911 | 5,289 | |||||||||
Redeemed | (22,454 | ) | (20,520 | ) | |||||||
Total Fund Shares | 3,997 | (732 | ) | ||||||||
Adviser Shares | |||||||||||
Issued | 23 | 45 | |||||||||
Reinvested | 5 | 6 | |||||||||
Redeemed | (30 | ) | (118 | ) | |||||||
Total Adviser Shares | (2 | ) | (67 | ) | |||||||
Change in Shares | 3,995 | (799 | ) | ||||||||
See notes to financial statements.
32
This page is intentionally left blank.
33
USAA Mutual Funds Trust | Financial Highlights | ||||||
For a Share Outstanding Throughout Each Period
Investment Activities | Distributions to Shareholders From | ||||||||||||||||||||||||||
| Net Asset Value, Beginning of Period | Net Investment Income (Loss) | Net Realized and Unrealized Gains (Losses) on Investments | Total from Investment Activities | Net Investment Income | Total Distributions | ||||||||||||||||||||||
USAA Tax Exempt Long-Term Fund | |||||||||||||||||||||||||||
Fund Shares | |||||||||||||||||||||||||||
| Year Ended March 31, 2020 | $ | 13.28 | 0.45 | (c) | (0.07 | ) | 0.38 | (0.45 | ) | (0.45 | ) | ||||||||||||||||
| Year Ended March 31, 2019 | $ | 13.21 | 0.49 | 0.07 | 0.56 | (0.49 | ) | (0.49 | ) | ||||||||||||||||||
| Year Ended March 31, 2018 | $ | 13.25 | 0.51 | (0.03 | ) | 0.48 | (0.52 | ) | (0.52 | ) | |||||||||||||||||
| Year Ended March 31, 2017 | $ | 13.73 | 0.54 | (0.48 | ) | 0.06 | (0.54 | ) | (0.54 | ) | |||||||||||||||||
| Year Ended March 31, 2016 | $ | 13.78 | 0.58 | (0.05 | ) | 0.53 | (0.58 | ) | (0.58 | ) | |||||||||||||||||
Adviser Shares | |||||||||||||||||||||||||||
| Year Ended March 31, 2020 | $ | 13.26 | 0.43 | (c) | (0.08 | ) | 0.35 | (0.42 | ) | (0.42 | ) | ||||||||||||||||
| Year Ended March 31, 2019 | $ | 13.19 | 0.46 | 0.08 | 0.54 | (0.47 | ) | (0.47 | ) | ||||||||||||||||||
| Year Ended March 31, 2018 | $ | 13.23 | 0.48 | (0.04 | ) | 0.44 | (0.48 | ) | (0.48 | ) | |||||||||||||||||
| Year Ended March 31, 2017 | $ | 13.71 | 0.49 | (0.48 | ) | 0.01 | (0.49 | ) | (0.49 | ) | |||||||||||||||||
| Year Ended March 31, 2016 | $ | 13.76 | 0.54 | (0.05 | ) | 0.49 | (0.54 | ) | (0.54 | ) | |||||||||||||||||
* Assumes reinvestment of all net investment income and realized capital gain distributions, if any, during the period. Includes adjustments in accordance with U.S. generally accepted accounting principles and could differ from the Lipper reported return.
^ The net expense ratio may not correlate to the applicable expense limits in place during the period since the current contractual expense limitation is applied for a two year period beginning July 1, 2019 and in effect through June 30, 2021, instead of coinciding with the Fund's fiscal year end. Details of the current contractual expense limitation in effect can be found in Note 4 of the accompanying Notes to Financial Statements.
(a) Reflects total annual operating expenses for reductions of expenses paid indirectly for the March 31 fiscal years ended 2017 and 2016. Expenses paid indirectly decreased the expense ratio for each of these respective years by less than 0.01%.
(b) Portfolio turnover is calculated on the basis of the Fund as a whole without distinguishing between the classes of shares issued.
(c) Per share net investment income (loss) has been calculated using the average daily shares method.
(d) Prior to August 1, 2017, AMCO voluntarily agreed to reimburse the Adviser Shares for expenses in excess of 0.80% of their annual average daily net assets.
See notes to financial statements.
34
USAA Mutual Funds Trust | Financial Highlights — continued | ||||||
For a Share Outstanding Throughout Each Period
Ratios to Average Net Assets | Supplemental Data | ||||||||||||||||||||||||||||||
| Net Asset Value, End of Period | Total Return* | Net Expenses^ | Net Investment Income (Loss) | Gross Expenses(a) | Net Assets, End of Period (000's) | Portfolio Turnover(b) | |||||||||||||||||||||||||
USAA Tax Exempt Long-Term Fund | |||||||||||||||||||||||||||||||
Fund Shares | |||||||||||||||||||||||||||||||
| Year Ended March 31, 2020 | $ | 13.21 | 2.74 | % | 0.48 | % | 3.36 | % | 0.48 | % | $ | 2,403,342 | 24 | % | |||||||||||||||||
| Year Ended March 31, 2019 | $ | 13.28 | 4.39 | % | 0.48 | % | 3.73 | % | 0.48 | % | $ | 2,362,819 | 13 | % | |||||||||||||||||
| Year Ended March 31, 2018 | $ | 13.21 | 3.62 | % | 0.47 | % | 3.83 | % | 0.47 | % | $ | 2,358,955 | 14 | % | |||||||||||||||||
| Year Ended March 31, 2017 | $ | 13.25 | 0.41 | % | 0.48 | % | 3.97 | % | 0.48 | % | $ | 2,343,165 | 15 | % | |||||||||||||||||
| Year Ended March 31, 2016 | $ | 13.73 | 3.94 | % | 0.51 | % | 4.23 | % | 0.51 | % | $ | 2,421,551 | 6 | % | |||||||||||||||||
Adviser Shares | |||||||||||||||||||||||||||||||
| Year Ended March 31, 2020 | $ | 13.19 | 2.53 | % | 0.70 | % | 3.15 | % | 1.01 | % | $ | 7,680 | 24 | % | |||||||||||||||||
| Year Ended March 31, 2019 | $ | 13.26 | 4.16 | % | 0.70 | % | 3.51 | % | 0.94 | % | $ | 7,745 | 13 | % | |||||||||||||||||
| Year Ended March 31, 2018 | $ | 13.19 | 3.36 | % | 0.74 | %(d) | 3.57 | % | 0.92 | % | $ | 8,577 | 14 | % | |||||||||||||||||
| Year Ended March 31, 2017 | $ | 13.23 | 0.07 | % | 0.80 | % | 3.64 | % | 0.87 | % | $ | 10,976 | 15 | % | |||||||||||||||||
| Year Ended March 31, 2016 | $ | 13.71 | 3.65 | % | 0.80 | % | 3.94 | % | 0.90 | % | $ | 11,249 | 6 | % | |||||||||||||||||
See notes to financial statements.
35
USAA Mutual Funds Trust | Notes to Financial Statements March 31, 2020 | ||||||
1. Organization:
USAA Mutual Funds Trust (the "Trust") is organized as a Delaware statutory trust and is registered under the Investment Company Act of 1940, as amended (the "1940 Act"), as an open-end investment company. The Trust is comprised of 47 funds and is authorized to issue an unlimited number of shares, which are units of beneficial interest with no par value.
The accompanying financial statements are those of the USAA Tax Exempt Long-Term Fund (the "Fund"). The Fund offers two classes of shares: Fund Shares and Adviser Shares. The Fund is classified as diversified under the 1940 Act.
Each class of shares of the Fund has substantially identical rights and privileges except with respect to fees paid under distribution plans, expenses allocable exclusively to each class of shares, voting rights on matters solely affecting a single class of shares, and the exchange privilege of each class of shares.
On November 6, 2018, United Services Automobile Association ("USAA"), the parent company of USAA Asset Management Company ("AMCO"), the investment adviser to the Fund, and USAA Transfer Agency Company, d/b/a USAA Shareholder Account Services ("SAS"), the transfer agent to the Fund, announced that AMCO and SAS would be acquired by Victory Capital Holdings Inc., a global investment management firm headquartered in Cleveland, Ohio (the "Transaction"). The Transaction closed on July 1, 2019. A special shareholder meeting was held on April 18, 2019, at which shareholders of the Fund approved a new investment advisory agreement between the Trust, on behalf of the Fund, and Victory Capital Management Inc. ("VCM" or "Adviser"). Effective July 1, 2019, VCM replaced AMCO as the investment adviser to the Fund and Victory Capital Transfer Agency Company replaced SAS as the Fund's transfer agent. In addition, effective on that same date, shareholders of the Fund also elected the following two new directors to the Board of the Trust to serve upon the closing of the Transaction: (1) David C. Brown, to serve as an Interested Trustee; and (2) John C. Walters, to serve as an Independent Trustee.
Under the Trust's organizational documents, its officers and trustees are indemnified against certain liabilities arising out of the performance of their duties to the Fund. In addition, in the normal course of business, the Fund enters into contracts with its vendors and others that provide for general indemnifications. The Fund's maximum exposure under these arrangements is unknown, as this would involve future claims that may be made against the Fund. However, based on experience, the Fund expects that risk of loss to be remote.
2. Significant Accounting Policies:
The following is a summary of significant accounting policies followed by the Trust in the preparation of its financial statements. The policies are in conformity with generally accepted accounting principles in the United States of America ("GAAP"). The preparation of financial statements in accordance with GAAP requires management to make estimates and assumptions that affect the reported amounts of assets and liabilities and disclosure of contingent assets and liabilities at the date of the financial statements and the reported amounts of income and expenses for the period. Actual results could differ from those estimates. The Fund follows the specialized accounting and reporting requirements under GAAP that are applicable to investment companies under Accounting Standards Codification Topic 946.
Investment Valuation:
The Fund records investments at fair value. Fair value is defined as the price that would be received to sell an asset or paid to transfer a liability in an orderly transaction between market participants at the measurement date.
The valuation techniques described below maximize the use of observable inputs and minimize the use of unobservable inputs in determining fair value. The inputs used for valuing the Fund's investments are summarized in the three broad levels listed below:
• Level 1 — quoted prices in active markets for identical securities
• Level 2 — other significant observable inputs (including quoted prices for similar securities or interest rates applicable to those securities, etc.)
• Level 3 — significant unobservable inputs (including the Fund's own assumptions in determining the fair value of investments)
36
USAA Mutual Funds Trust | Notes to Financial Statements — continued March 31, 2020 | ||||||
Changes in valuation techniques may result in transfers in or out of an assigned level within the disclosure hierarchy. The inputs or methodologies used for valuation techniques are not necessarily an indication of the risk associated with entering into those investments.
The Adviser has established the Pricing and Liquidity Committee (the "Committee"), and subject to Trust's Board of Trustees (the "Board") oversight, the Committee administers and oversees the Fund's valuation policies and procedures, which are approved by the Board.
Portfolio securities listed or traded on securities exchanges, American Depositary Receipts ("ADRs") and Rights, are valued at the closing price on the exchange or system where the security is principally traded, if available, or at the Nasdaq Official Closing Price. If there have been no sales for that day on the exchange or system, then a security is valued at the last available bid quotation on the exchange or system where the security is principally traded. In each of these situations, valuations are typically categorized as Level 1 in the fair value hierarchy.
Debt securities of United States ("U.S.") issuers, along with corporate and municipal securities, including short-term investments maturing in 60 days or less, may be valued using evaluated bid or the last sales price to price securities by dealers or an independent pricing service approved by the Board. These valuations are typically categorized as Level 2 in the fair value hierarchy.
Effective July 1, 2019, the valuation methodology applied to certain debt securities changed. Securities that were previously valued at an evaluated mean are now valued at the evaluated bid or the last sales price. In the event that price quotations or valuations are not readily available, are not reflective of market value, or a significant event has been recognized in relation to a security or class of securities, the securities are valued in good faith by the Committee in accordance with valuation procedures approved by the Board. These valuations typically are categorized as Level 2 or Level 3 in the fair value hierarchy, based on the observability of inputs used to determine the fair value. The effect of fair value pricing is that securities may not be priced on the basis of quotations from the primary market in which they are traded and the actual price realized from the sale of a security may differ materially from the fair value price. Valuing these securities at fair value is intended to cause the Fund's net asset value ("NAV") to be more reliable than it otherwise would be.
A summary of the valuations as of March 31, 2020, based upon the three levels defined above, is included in the table below while the breakdown, by category, of investments is disclosed in the Schedule of Portfolio Investments (amounts in thousands):
Level 1 | Level 2 | Level 3 | Total | ||||||||||||||||
Common Stocks | $ | 2,454 | $ | — | $ | — | $ | 2,454 | |||||||||||
Municipal Bonds | — | 2,388,159 | — | (a) | 2,388,159 | ||||||||||||||
Total | $ | 2,454 | $ | 2,388,159 | $ | — | $ | 2,390,613 | |||||||||||
(a) Amount is less than $1 thousand.
For the year ended March 31, 2020, there were no transfers in or out of the Level 3 fair value hierarchy.
Securities Purchased on a Delayed-Delivery or When-Issued Basis:
The Fund may purchase securities on a delayed-delivery or when-issued basis. Delivery and payment for securities that have been purchased by the Fund on a delayed-delivery, or when-issued basis or for delayed draws on loans can take place a month or more after the trade date. At the time the Fund makes the commitment to purchase a security on a delayed-delivery or when-issued basis, the Fund records the transaction and reflects the value of the security in determining net asset value. No interest accrues to the Fund until the transaction settles and payment takes place. A segregated account is established and the Fund maintains cash and/or marketable securities at least equal in value to commitments for delayed-delivery or when-issued securities. If the Fund owns delayed-delivery or when-issued securities, these values are included in Payable for investments purchased on the accompanying Statement of Assets and Liabilities and the segregated assets are identified in the Schedule of Portfolio Investments.
37
USAA Mutual Funds Trust | Notes to Financial Statements — continued March 31, 2020 | ||||||
Municipal Obligations:
The values of municipal obligations can fluctuate and may be affected by adverse tax, legislative, or political changes, and by financial developments affecting municipal issuers. Payment of municipal obligations may depend on a relatively limited source of revenue, resulting in greater credit risk. Future changes in federal tax laws or the activity of an issuer may adversely affect the tax-exempt status of municipal obligations.
Investment Transactions and Related Income:
Changes in holdings of investments are accounted for no later than one business day following the trade date. For financial reporting purposes, however, investment transactions are accounted for on trade date on the last business day of the reporting period. Interest income is determined on the basis of coupon interest accrued using the effective interest method which adjusts, where applicable, the amortization of premiums or accretion of discount. Gains or losses realized on sales of securities are determined by comparing the identified cost of the security lot sold with the net sales proceeds.
Federal Income Taxes:
It is the Fund's policy to continue to qualify as a regulated investment company by complying with the provisions available to certain investment companies, as defined in applicable sections of the Internal Revenue Code, and to make distributions of net investment income and net realized gains sufficient to relieve it from all, or substantially all, federal income taxes. Accordingly, no provision for federal income taxes is required in the financial statements. The Fund has a tax year end of March 31.
Management of the Fund has reviewed tax positions taken in tax years that remain subject to examination by all major tax jurisdictions, including federal (i.e., the last four tax years which includes the current fiscal tax year end). Management believes that there is no tax liability resulting from unrecognized tax benefits related to uncertain tax positions taken.
Allocations:
Expenses directly attributable to the Fund are charged to the Fund, while expenses that are attributable to more than one fund in the Trust, or jointly with an affiliated trust, are allocated among the respective funds in the Trust and/or affiliated trust based upon net assets or another appropriate basis.
Income, expenses (other than class-specific expenses such as transfer agent fees, state registration fees, distribution and service 12b-1 fees, and printing fees), and realized and unrealized gains or losses on investments are allocated to each class of shares based on its relative net assets on the date income is earned or expenses and realized and unrealized gains and losses are incurred.
Cross-Trade Transactions:
Pursuant to Rule 17a-7 under the 1940 Act, the Fund may engage in cross-trades which are securities transactions with affiliated investment companies and advisory accounts managed by the Adviser and any applicable sub-adviser. Any such purchase or sale transaction must be effected without brokerage commission or other remuneration, except for customary transfer fees. The transaction must be effected at the current market price, which is either the security's last sale price on an exchange or, if there are no transactions in the security that day, at the average of the highest bid and lowest asked price. For the year ended March 31, 2020, the Fund engaged in the following securities transactions with affiliated funds, which resulted in the following net realized gains (losses) (amounts in thousands):
| Purchases | Sales | Net Realized Gains (Losses) | |||||||||
| $ | 8,900 | $ | 72,340 | $ | — | ||||||
Fees Paid Indirectly:
Expense offsets to custody fees that arise from credits on cash balances maintained on deposit are reflected on the Statement of Operations, as applicable, as "Fees paid indirectly."
38
USAA Mutual Funds Trust | Notes to Financial Statements — continued March 31, 2020 | ||||||
3. Purchases and Sales:
Cost of purchases and proceeds from sales/maturities of securities (excluding securities maturing less than one year from acquisition) for the year ended March 31, 2020, were as follows for the Fund (amounts in thousands):
| Excluding U.S. Government Securities | |||||||||||
Purchases | Sales | ||||||||||
$ | 641,343 | $ | 574,960 | ||||||||
There were no purchases and sales of U.S. government securities during the year ended March 31, 2020.
4. Fees and Transactions with Affiliates and Related Parties:
Investment Advisory and Management Fees:
Effective with the Transaction on July 1, 2019, investment advisory services are provided to the Fund by the Adviser, a New York corporation registered as an investment adviser with the Securities and Exchange Commission ("SEC"). The Adviser is a wholly-owned indirect subsidiary of Victory Capital Holdings, Inc., a publicly traded Delaware corporation, and a wholly-owned direct subsidiary of Victory Capital Operating, LLC. Under the terms of the Investment Advisory Agreement, the Adviser is entitled to receive a base fee and a performance adjustment. The Fund's base fee is accrued daily and paid monthly at an annualized rate of 0.28% of the Fund's average daily net assets. The amount incurred and paid to VCM from July 1, 2019 through March 31, 2020, was $5,262 thousand and is reflected on the Statement of Operations as Investment Advisory fees.
Prior to the Transaction on July 1, 2019, AMCO provided investment management services to the Fund pursuant to an Advisory Agreement. Under this agreement, AMCO was responsible for managing the business and affairs of the Fund, and for directly managing day-to-day investment of the Fund's assets, subject to the authority of and supervision by the Board. The investment management fee for the Fund was comprised of a base fee and a performance adjustment. The Fund's base fee was accrued daily and paid monthly at an annualized rate of 0.28% of the Fund's average daily net assets. The amount incurred and paid to AMCO from April 1, 2019 through June 30, 2019, was $1,673 thousand and is reflected on the Statement of Operations as Investment Advisory fees.
Effective with the Transaction on July 1, 2019, no performance adjustments will be made for periods beginning July 1, 2019 through June 30, 2020. Only performance beginning as of July 1, 2019, and thereafter will be utilized in calculating future performance adjustments.
Prior to the Transaction on July 1, 2019, the performance adjustment for each share class was calculated monthly by comparing the Fund's performance to that of the Lipper General & Insured Municipal Debt Funds Index. The Lipper General & Insured Municipal Debt Funds Index tracks the total return performance of funds within the Lipper General & Insured Municipal Debt Funds category.
The performance period for each share class consists of the current month plus the previous 35 months (or the number of months beginning July 1, 2019, if fewer). The following table is utilized to determine the extent of the performance adjustment:
| Over/Under Performance Relative to Index (in basis points)(a) | Annual Adjustment Rate (in basis points)(a) | ||||||
+/- 20 to 50 | +/- 4 | ||||||
+/- 51 to 100 | +/- 5 | ||||||
+/- 101 and greater | +/- 6 | ||||||
(a) Based on the difference between average annual performance of the relevant share class of the Fund and its relevant index, rounded to the nearest basis point. Average daily net assets of the share class are calculated over a rolling 36-month period.
39
USAA Mutual Funds Trust | Notes to Financial Statements — continued March 31, 2020 | ||||||
Each class' annual performance adjustment rate is multiplied by the average daily net assets of each respective class over the entire performance period, which is then multiplied by a fraction, the numerator of which is the number of days in the month and the denominator of which is 365 (366 in leap years). The resulting amount is then added to (in the case of overperformance), or subtracted from (in the case of underperformance) the base fee.
Under the performance fee arrangement, each class pays a positive performance fee adjustment for a performance period whenever the class outperforms the Lipper General & Insured Municipal Debt Funds Index over that period, even if the class has overall negative returns during the performance period.
For the period April 1, 2019 through June 30, 2019, the performance adjustment for the Adviser Shares was $1 thousand and represented 0.01% of net assets. The Fund Shares did not incur any performance adjustment. Performance adjustments are reflected on the Statement of Operations as Investment Advisory fees.
Administration and Servicing Fees:
Effective with the Transaction on July 1, 2019, VCM serves as the Fund's administrator and fund accountant. Under the Fund Administration, Servicing and Accounting Agreement, VCM is paid for its services an annual fee at a rate of 0.15% of average daily net assets for both the Fund Shares and Adviser Shares. Amounts incurred from July 1, 2019 through March 31, 2020, are $2,809 and $9 thousand for Fund Shares and Adviser Shares, respectively. These amounts are reflected on the Statement of Operations as Administration fees.
Prior to the Transaction on July 1, 2019, AMCO provided certain administration and servicing functions for the Fund. For such services, AMCO received a fee accrued daily and paid monthly at an annualized rate of 0.15% of average daily net assets for both the Fund Shares and Adviser Shares. Amounts incurred from April 1, 2019 through June 30, 2019, were $894 and $3 thousand for Fund Shares and Adviser Shares, respectively. These amounts are reflected on the Statement of Operations as Administration fees.
Effective with the Transaction on July 1, 2019, the Fund (as part of the Trust) has entered into an agreement to provide compliance services with the Adviser, pursuant to which the Adviser furnishes its compliance personnel, including the services of the Chief Compliance Officer ("CCO"), and other resources reasonably necessary to provide the Trust with compliance oversight services related to the design, administration and oversight of a compliance program for the Trust in accordance with Rule 38a-1 under the 1940 Act. The CCO is an employee of the Adviser, which pays the compensation of the CCO and support staff. Funds in the Trust, Victory Variable Insurance Funds, Victory Portfolios and Victory Portfolios II (collectively, the "Victory Funds Complex") in the aggregate, compensate the Adviser for these services. The amount incurred during the period from July 1, 2019 through March 31, 2020, is reflected on the Statement of Operations as Compliance fees.
Effective with the Transaction on July 1, 2019, Citi Fund Services Ohio, Inc. ("Citi"), an affiliate of Citibank, acts as sub-administrator and sub-fund accountant to the Fund pursuant to a Sub- Administration and Sub-Fund Accounting Services Agreement between VCM and Citi. VCM pays Citi a fee for providing these services. The Trust reimburses VCM and Citi for all of their reasonable out-of- pocket expenses incurred in providing these services and certain other expenses specifically allocated to the Funds, under the Fund Administration, Servicing, and Accounting Agreement. The amount incurred during the period from July 1, 2019 through March 31, 2020, is reflected on the Statement of Operations as Sub-Administration fees.
In addition to the services provided under its Administration and Servicing Agreement with the Fund, AMCO also provided certain compliance and legal services for the benefit of the Fund prior to the Transaction on July 1, 2019. The Board approved the reimbursement of a portion of these expenses incurred by AMCO. Amounts reimbursed by the Fund to AMCO for these compliance and legal services are presented on the Statement of Operations as Professional fees.
40
USAA Mutual Funds Trust | Notes to Financial Statements — continued March 31, 2020 | ||||||
Transfer Agency Fees:
Effective with the Transaction on July 1, 2019, Victory Capital Transfer Agency, Inc. ("VCTA"), (formerly, USAA Shareholder Account Services ("SAS")), provides transfer agency services to the Fund. VCTA, an affiliate of the Adviser, provides transfer agent services to the Fund Shares and Adviser Shares based on an annual charge of $25.50 per shareholder account plus out-of-pocket expenses. VCTA pays a portion of these fees to certain intermediaries for the administration and servicing of accounts that are held with such intermediaries. Amounts incurred and paid to VCTA from July 1, 2019 through March 31, 2020, was $516 and $1 thousand for the Fund Shares and Adviser Shares, respectively. Amounts incurred and paid to SAS from April 1, 2019 through June 30, 2019, was $165 and $1 thousand for the Fund Shares and Adviser Shares, respectively. These amounts are reflected on the Statement of Operations as Transfer agent fees.
Effective with the Transaction on July 1, 2019, FIS Investor Services LLC serves as sub-transfer agent and dividend disbursing agent for the Fund pursuant to a Sub-Transfer Agent agreement between VCTA and FIS Investor Services LLC. VCTA provides FIS Investor Services LLC a fee for providing these services.
Distribution and Service 12b-1 Fees:
Effective with the Transaction on July 1, 2019, Victory Capital Advisers, Inc. (the "Distributor"), an affiliate of the Adviser, serves as distributor for the continuous offering of the Adviser Shares pursuant to a Distribution Agreement between the Distributor and the Trust. Effective on or about June 30, 2020, the Distributor's name will change to Victory Capital Services, Inc. Pursuant to the Distribution and Service Plans adopted in accordance with Rule 12b-1 under the 1940 Act, the Distributor may receive a monthly distribution and service fee, at an annual rate of up to 0.25% of the average daily net assets of the Adviser Shares. Amounts incurred and paid to the Distributor from July 1, 2019 through March 31, 2020, are $15 thousand and reflected on the Statement of Operations as 12b-1 fees.
Adviser Shares are offered and sold without imposition of an initial sales charge or a contingent deferred sales charge.
Prior to the Transaction on July 1, 2019, the Fund adopted a plan pursuant to Rule 12b-1 under the 1940 Act with respect to the Adviser Shares. Under the plan, the Adviser Shares paid fees to USAA Investment Management Company ("IMCO"), the distributor, for distribution and shareholder services. IMCO paid all or a portion of such fees to intermediaries that made the Adviser Shares available for investment by their customers. The fee was accrued daily and paid monthly at an annual rate of 0.25% of the Adviser Shares' average daily net assets. IMCO also provided exclusive underwriting and distribution of the Fund's shares on a continuing best-efforts basis and received no fee or other compensation for these services, but may have received 12b-1 fees as described above, with respect to Adviser Shares. Amounts incurred and paid to IMCO from April 1, 2019 through June 30, 2019, are $5 thousand and reflected on the Statement of Operations as 12b-1 fees.
Other Fees:
Prior to the Transaction on July 1, 2019, State Street Bank and Trust Company served as the Fund's accounting agent and custodian.
Effective August 5, 2019, Citibank, N.A., serves as the Fund's custodian.
K&L Gates LLP provides legal services to the Trust.
Effective with the Transaction on July 1, 2019, the Adviser has entered into an expense limitation agreement with the Fund until at least June 30, 2021. Under the terms of the agreement, the Adviser has agreed to waive fees or reimburse certain expenses to the extent that ordinary operating expenses incurred by certain classes of the Fund in any fiscal year exceed the expense limit for such classes of the Fund. Such excess amounts will be the liability of the Adviser. Interest, taxes, brokerage commissions, other expenditures which are capitalized in accordance with GAAP, and other extraordinary expenses not incurred in the ordinary course of the Fund's business are excluded from the expense limits. Effective July 1, 2019 through March 31, 2020, the expense limit (excluding voluntary waivers) is 0.48% and 0.70% for the Fund Shares and Adviser Shares, respectively.
41
USAA Mutual Funds Trust | Notes to Financial Statements — continued March 31, 2020 | ||||||
Under this expense limitation agreement, the Fund has agreed to repay fees and expenses that were waived or reimbursed by the Adviser for a period up to three years after the fiscal year in which the waiver or reimbursement took place, subject to the lesser of any operating expense limits in effect at the time of: (a) the original waiver or expense reimbursement; or (b) the recoupment, after giving effect to the recoupment amount. As of March 31, 2020, the following amounts are available to be repaid to the Adviser (amounts in thousands).
| Expires 03/31/2023 | |||
| $ | 14 | ||
The Adviser, may voluntarily waive or reimburse additional fees to assist the Fund in maintaining competitive expense ratios. Voluntary waivers and reimbursements applicable to the Fund are not available to be recouped at a future time. There were no voluntary waivers or reimbursements for the year ended March 31, 2020.
Prior to the Transaction on July 1, 2019, AMCO agreed, through July 31, 2019, to limit the total annual operating expenses of the Adviser Shares to 0.70% of average daily net assets, excluding extraordinary expenses and before reductions of any expenses paid indirectly, and to reimburse the Adviser Shares for all expenses in excess of those amounts. Effective with the Transaction on July 1, 2019, this expense limit is no longer in effect and is not available to be recouped by AMCO. For the period April 1, 2019 through June 30, 2019, amounts reimbursed by the Adviser Shares are reflected on the Statement of Operations as Expenses waived/reimbursed by AMCO.
Certain officers and/or interested trustees of the Fund are also officers and/or employees of the Adviser, Administrator, Sub-Administrator, Sub-Fund Accountant, and Legal.
5. Risks:
The Fund may be subject to other risks in addition to these identified risks.
The Fund may be subject to various risks as described in the Fund's prospectus. A widespread health crisis such as a global pandemic could cause substantial market volatility, exchange trading suspensions and closures, impact the ability to complete redemptions, and affect Fund performance. For example, the novel coronavirus disease (COVID-19) has resulted in significant disruptions to global business activity that may continue, worsen and/or trigger other factors impacting the liquidity or value of investments. The impact of health crises and other epidemics and pandemics may affect the global economy in ways that cannot necessarily be foreseen at the present time. Health crises may exacerbate other pre-existing political, social, and economic risks. Any such impact could adversely affect the Funds' performance, resulting in losses to your investment. For more information, please refer to the "Principal risks" section of the Fund's prospectus.
The fixed-income securities held in the Fund's portfolio are subject to credit risk, which is the possibility that an issuer of a fixed-income security will fail to make timely interest and/or principal payments on its securities or that negative market perceptions of the issuer's ability to make such payments will cause the price of that security to decline. The Fund accepts some credit risk as a recognized means to enhance an investor's return. All fixed-income securities, varying from the highest quality to the very speculative, have some degree of credit risk. Fixed-income securities rated below investment grade, also known as "junk" or high-yield bonds, generally entail greater economic, credit, and liquidity risk than investment-grade securities. Their prices may be more volatile, especially during economic downturns, financial setbacks, or liquidity events.
The Fund is subject to the risk that the market value of the bonds in its portfolio will fluctuate because of changes in interest rates, changes in the supply of and demand for tax-exempt securities, and other market factors. Bond prices generally are linked to the prevailing market interest rates. In general, when interest rates rise, bond prices fall; conversely, when interest rates fall, bond prices rise. The price volatility of a bond also depends on its duration. Generally, the longer the duration of a bond, the greater is its sensitivity to interest rates. To compensate investors for this higher interest rate risk, bonds with longer durations generally offer higher yields than bonds with shorter durations. Decisions by the U.S. Federal Reserve regarding interest rate and monetary policy can have a significant effect on the value of debt securities as well as the overall strength of the U.S. economy. Precise interest rate predictions
42
USAA Mutual Funds Trust | Notes to Financial Statements — continued March 31, 2020 | ||||||
are difficult to make, and interest rates may change unexpectedly and dramatically in response to extreme changes in market or economic conditions. Interest rates have been unusually low in recent years in the U.S. and abroad, and central banks have reduced rates further in an effort to combat the economic effects of the COVID-19 pandemic. Extremely low or negative interest rates may become more prevalent or may not work as intended, and the impact on various markets that interest rate or other significant policy changes may have is unknown. The ability of an issuer of a debt security to repay principal prior to a security's maturity can increase the security's sensitivity to interest rate changes.
During a period of declining interest rates, many municipal bonds may be "called," or redeemed, by the issuer before the stated maturity. An issuer might call, or refinance, a higher-yielding bond for the same reason that a homeowner would refinance a home mortgage. When bonds are called, the Fund is affected in several ways. Most likely, the Fund will reinvest the bond-call proceeds in bonds with lower interest rates. The Fund's income may drop as a result. The Fund also may realize a taxable capital gain (or loss).
6. Borrowing and Interfund Lending:
Line of Credit:
Effective with the Transaction on July 1, 2019, the Victory Funds Complex participates in a short-term, demand note "Line of Credit" agreement with Citibank. Under the agreement with Citibank, the Victory Funds Complex could borrow up to $600 million, of which $300 million is committed and $300 million is uncommitted. $40 million of the Line of Credit is reserved for use by the Victory Floating Rate Fund, another series of the Victory Funds Complex, with that Fund paying the related commitment fees for that amount. The purpose of the agreement is to meet temporary or emergency cash needs. Citibank receives an annual commitment fee of 0.15% on $300 million for providing the Line of Credit. Each fund in the Victory Funds Complex pays a pro-rata portion of the commitment fees plus any interest (one month LIBOR plus one percent) on amounts borrowed. Interest charged to the Fund, if any, during the period is presented on the Statement of Operations under line of credit fees.
Prior to the Transaction on July 1, 2019, the line of credit among the Trust, with respect to its funds, and USAA Capital Corporation ("CAPCO") terminated. For the period from April 1, 2019 to June 30, 2019, the Fund paid CAPCO facility fees of $5 thousand.
The Fund had no borrowings under either agreement with Citibank or CAPCO during the year ended March 31, 2020.
Interfund Lending:
Effective with the Transaction on July 1, 2019, the Trust and Adviser rely on an exemptive order granted by the SEC in March 2017 (the "Order"), permitting the establishment and operation of an Interfund Lending Facility (the "Facility"). The Facility allows the Fund to directly lend and borrow money to or from any other Fund in the Victory Fund Complex relying upon the Order at rates beneficial to both the borrowing and lending funds. Advances under the Facility are allowed for temporary or emergency purposes. The interfund loan rate is determined, as specified in the Order, by averaging the current repurchase agreement rate and the current bank loan rate. As a Borrower, interest charged to the Fund, if any, during the period is presented on the Statement of Operations under Interest expense on Interfund lending. As a Lender, interest earned by the Fund, if any, during the period is presented on the Statement of Operations under Income on Interfund lending.
The average borrowing for the days outstanding and average interest rate for the Fund during the year ended March 31, 2020 were as follows (amounts in thousands):
| Borrower or Lender | Amount Outstanding at March 31, 2020 | Average Borrowing* | Days Borrowing Outstanding | Average Interest Rate* | Maximum Borrowing During the Period | ||||||||||||||||||||||
Borrower | $ | — | $ | 7,330 | 4 | 0.94 | % | $ | 12,806 | ||||||||||||||||||
* For the year ended March 31, 2020, based on the number of days borrowings were outstanding.
43
USAA Mutual Funds Trust | Notes to Financial Statements — continued March 31, 2020 | ||||||
7. Federal Income Tax Information:
The Fund intends to declare daily and distribute any net investment income monthly. Distributable net realized gains, if any, are declared and paid at least annually.
The amounts of dividends from net investment income and distributions from net realized gains (collectively distributions to shareholders) are determined in accordance with federal income tax regulations, which may differ from GAAP. To the extent these "book/tax" differences are permanent in nature (e.g., net operating loss and distribution reclassification,), such amounts are reclassified within the components of net assets based on their federal tax-basis treatment; temporary differences (e.g., wash sales) do not require reclassification. To the extent dividends and distributions exceed net investment income and net realized gains for tax purposes, they are reported as distributions of capital. Net investment losses incurred by the Fund may be reclassified as an offset to capital on the accompanying Statement of Assets and Liabilities.
As of March 31, 2020, on the Statement of Assets and Liabilities, there were no permanent book-to-tax difference reclassification adjustments.
The tax character of distributions paid during the tax years ended as noted below, were as follows (total distributions paid may differ from the Statement of Changes in Net Assets because, for tax purposes, dividends are recognized when actually paid) (amounts in thousands):
Year Ended March 31, 2020 | Year Ended March 31, 2019 | ||||||||||||||||||
Distributions paid from | Distributions paid from | ||||||||||||||||||
| Tax-Exempt Income | Total Distributions Paid | Tax-Exempt Income | Total Distributions Paid | ||||||||||||||||
$ | 82,361 | $ | 82,361 | $ | 87,767 | $ | 87,767 | ||||||||||||
As of the tax year ended March 31, 2020, the components of accumulated earnings (deficit) on a tax basis were as follows (amounts in thousands):
| Undistributed Tax-Exempt Income | Distributions Payable | Accumulated Capital and Other Losses | Unrealized Appreciation (Depreciation)* | Total Accumulated Earnings (Deficit) | |||||||||||||||||||
$ | 10,911 | $ | (6,866 | ) | $ | (61,549 | ) | $ | 41,375 | $ | (16,129 | ) | |||||||||||
* The difference between the book-basis and tax-basis of unrealized appreciation/depreciation is attributable primarily to tax deferral of losses on wash sales.
At March 31, 2020, the Fund had net capital loss carryforwards as shown in the table below (amounts in thousands). It is unlikely that the Board will authorize a distribution of capital gains realized in the future until the capital loss carryforwards have been used.
Short-Term Amount | Long-Term Amount | Total | |||||||||||||
$ | 12,400 | $ | 49,149 | $ | 61,549 | ||||||||||
As of March 31, 2020, the cost basis for federal income tax purposes, gross unrealized appreciation, gross unrealized depreciation, and net unrealized appreciation (depreciation) for investments were as follows (amounts in thousands):
| Cost of Investments for Federal Tax Purposes | Gross Unrealized Appreciation | Gross Unrealized Depreciation | Net Unrealized Appreciation (Depreciation) | ||||||||||||||||
$ | 2,349,238 | $ | 122,785 | $ | (81,410 | ) | $ | 41,375 | |||||||||||
44
USAA Mutual Funds Trust | Notes to Financial Statements — continued March 31, 2020 | ||||||
8. Liquidity Risk Management Program:
The USAA Funds have adopted and implemented a written liquidity risk management program (the "LRMP") as required by Rule 22e-4 under the Investment Company Act of 1940, as amended. The LRMP is reasonably designed to assess and manage the Fund's liquidity risk, taking into consideration the Fund's investment strategy and the liquidity of its portfolio investments during normal and reasonably foreseeable stressed market conditions; its short and long-term cash flow projections; and its cash holdings and access to other liquidity management tools such as available funding sources including the Victory Funds Complex Interfund Lending Facility and Line of Credit (discussed in the Notes to Financial Statements). The USAA Funds' Board of Trustees approved the appointment of the Fund's investment adviser, Victory Capital Management Inc. ("Victory Capital"), as the administrator of the LRMP. At an in-person meeting held on February 26, 2020, Victory Capital provided an oral and written report to the Trustees on the operation and effectiveness of the LRMP during the previous year.
Victory Capital manages liquidity risks associated with the Fund's investments by monitoring, among other things, cash and cash equivalents, any use of derivatives, the concentration of investments, the appropriateness of the Fund's investment strategy, and by classifying every fund investment as either highly liquid, moderately liquid, less liquid or illiquid on at least a monthly basis. To assist with the classification of Fund investments, Victory Capital has retained a third-party provider of liquidity evaluation services. This provider determines preliminary liquidity classifications for all portfolio holdings based upon portfolio-level data and certain assumptions provided by Victory Capital. Victory Capital reviews the preliminary liquidity classifications, and, when appropriate, considers other information including input from the Fund's portfolio managers (including the portfolio managers employed by any investment sub-advisers) in determining final liquidity classifications.
The report from Victory Capital concluded that the Fund did not experience any significant liquidity challenges during the covered period, and the Fund's LRMP is reasonably designed to assess and manage its liquidity risk. The report also concluded that the LRMP continues to operate adequately and effectively to enable Victory Capital to oversee and manage liquidity risk and ensure the Fund is able to meet redemption requests without significant dilution to the remaining investors' interest in the Fund. During the review period, the Fund's portfolio consisted primarily of highly liquid investments, which are defined as cash and any investments reasonably expected to be converted to cash in current market conditions in three business days or less without significantly changing the market value of the investment. Therefore, the Fund has not adopted a Highly Liquid Investment Minimum. The Fund's investments were below the limitation on illiquid investments during the review period. Additionally, Victory Capital indicated that no events occurred that would require the filing of Form N-LIQUID and recommended no material changes to the LRMP.
9. Subsequent Events:
An outbreak of respiratory disease called COVID-19 was first detected in China in December 2019 and subsequently spread internationally. The transmission of COVID-19 and efforts to contain its spread have resulted in international, national and local border closings and other significant travel restrictions and disruptions, significant disruptions to business operations, supply chains and consumer activity, significant challenges in healthcare service preparation and delivery, and quarantines, as well as general concern and uncertainty that has negatively affected the economic environment and that occurred subsequent to year end may have a significant negative impact on the operations and profitability of the Funds' investments. These impacts have caused significant volatility and declines in global financial markets, which have caused losses for investors. The impact of the COVID-19 pandemic may be short term or may last for an extended period of time, and in either case could result in a substantial economic downturn or recession. Public health crises may exacerbate other pre-existing political, social, economic, market and financial risks. The extent of the impact to the financial performance of the Funds' investments will depend on future developments, including (i) the duration and spread of the outbreak, (ii) the restrictions and advisories, (iii) the effects on the financial markets, and (iv) the effects on the economy overall, all of which are highly uncertain and cannot be predicted.
45
USAA Mutual Funds Trust | Notes to Financial Statements — continued March 31, 2020 | ||||||
The Board of Trustees of USAA Mutual Funds Trust has approved redesignating the Fund's current Adviser Shares as "Class A" shares ("Redesignation"). This change is expected to be effective in late June 2020 ("Redesignation Date").
Class A shares will be available for purchase through financial intermediaries and the Fund will pay ongoing distribution and/or service (12b-1) fees at annual rate of up to 0.25% of the average daily net assets of its Class A shares. In addition, the Transfer Agency fee will convert to an annual basis point rate of 0.10% of daily net assets of its Class A shares from its current flat per account fee. Class A shares will be offered and sold at their public offering price, which is the net asset value per share plus any applicable initial sales charge, also referred to as a "front-end sales load." For purchases on or after the Redesignation Date, Class A Shares will be offered and sold with the imposition of a maximum initial sales charge of up to 2.25% of the offering price of the Fund. A contingent deferred sales charge of up to 0.75% may be imposed on redemptions of Class A shares purchased without an initial sales charge if shares are redeemed within 12 months of purchase.
The Redesignation will be made without the imposition of any sales loads, fees, or other charges to Adviser Shares held in shareholder accounts on the Redesignation Date. The Redesignation will not be considered a taxable event for federal income tax purposes.
46
REPORT OF INDEPENDENT REGISTERED PUBLIC ACCOUNTING FIRM
To the Shareholders and the Board of Trustees of USAA Tax Exempt Long-Term Fund:
Opinion on the Financial Statements
We have audited the accompanying statement of assets and liabilities of USAA Tax Exempt Long-Term Fund (the "Fund") (one of the funds constituting USAA Mutual Funds Trust (the "Trust")), including the schedule of portfolio investments, as of March 31, 2020, and the related statement of operations for the year then ended, the statements of changes in net assets for each of the two years in the period then ended, the financial highlights for each of the five years in the period then ended and the related notes (collectively referred to as the "financial statements"). In our opinion, the financial statements present fairly, in all material respects, the financial position of the Fund at March 31, 2020, the results of its operations for the year then ended, the changes in its net assets for each of the two years in the period then ended and its financial highlights for each of the five years in the period then ended, in conformity with U.S. generally accepted accounting principles.
Basis for Opinion
These financial statements are the responsibility of the Trust's management. Our responsibility is to express an opinion on the Fund's financial statements based on our audits. We are a public accounting firm registered with the Public Company Accounting Oversight Board (United States) ("PCAOB") and are required to be independent with respect to the Trust in accordance with the U.S. federal securities laws and the applicable rules and regulations of the Securities and Exchange Commission and the PCAOB.
We conducted our audits in accordance with the standards of the PCAOB. Those standards require that we plan and perform the audit to obtain reasonable assurance about whether the financial statements are free of material misstatement, whether due to error or fraud. The Trust is not required to have, nor were we engaged to perform, an audit of the Trust's internal control over financial reporting. As part of our audits we are required to obtain an understanding of internal control over financial reporting, but not for the purpose of expressing an opinion on the effectiveness of the Trust's internal control over financial reporting. Accordingly, we express no such opinion.
Our audits included performing procedures to assess the risks of material misstatement of the financial statements, whether due to error or fraud, and performing procedures that respond to those risks. Such procedures included examining, on a test basis, evidence regarding the amounts and disclosures in the financial statements. Our procedures included confirmation of securities owned as of March 31, 2020, by correspondence with the custodian and brokers or by other appropriate auditing procedures where replies from brokers were not received. Our audits also included evaluating the accounting principles used and significant estimates made by management, as well as evaluating the overall presentation of the financial statements. We believe that our audits provide a reasonable basis for our opinion.

We have served as the auditor of one or more Victory Capital investment companies since 1995.
San Antonio, Texas
May 27, 2020
47
USAA Mutual Funds Trust | Supplemental Information March 31, 2020 | ||||||
(Unaudited)
Expense Examples
As a shareholder of the Fund, you may incur two types of costs: (1) transaction costs, and (2) ongoing costs, including management fees and other Fund expenses. These examples are intended to help you understand your ongoing costs (in dollars) of investing in the Fund and to compare these costs with the ongoing costs of investing in other mutual funds.
These examples are based on an investment of $1,000 invested at the beginning of the period and held for the entire period from October 1, 2019, through March 31, 2020.
The Actual Expense figures in the table below provide information about actual account values and actual expenses. You may use the information below, together with the amount you invested, to estimate the expenses that you paid over the period. Simply divide your account value by $1,000 (for example, an $8,600 account value divided by $1,000 = 8.6), then multiply the result by the number in the table under the heading entitled "Actual Expenses Paid During Period" to estimate the expenses you paid on your account during this period.
The Hypothetical Expense figures in the table below provide information about hypothetical account values and hypothetical expenses based on the Fund's actual expense ratio and an assumed rate of return of 5% per year before expenses, which is not the Fund's actual return. The hypothetical account values and expenses may not be used to estimate the actual ending account balance or expenses you paid for the period. You may use this information to compare this 5% hypothetical example with the 5% hypothetical examples that appear in shareholder reports of other funds.
Please note the expenses shown in the table below are meant to highlight your ongoing costs only and do not reflect any transactional costs. If these transactional costs were included, your costs would have been higher.
| Beginning Account Value 10/1/19 | Actual Ending Account Value 3/31/20 | Hypothetical Ending Account Value 3/31/20 | Actual Expenses Paid During Period 10/1/19- 3/31/20* | Hypothetical Expenses Paid During Period 10/1/19- 3/31/20* | Annualized Expense Ratio During Period 10/1/19- 3/31/20 | ||||||||||||||||||||||
Fund Shares | $ | 1,000.00 | $ | 987.30 | $ | 1,022.60 | $ | 2.38 | $ | 2.43 | 0.48 | % | |||||||||||||||
Adviser Shares | 1,000.00 | 986.30 | 1,021.50 | 3.48 | 3.54 | 0.70 | % | ||||||||||||||||||||
* Expenses are equal to the average account value multiplied by the Fund's annualized expense ratio multiplied by 183/366 (the number of days in the most recent fiscal half-year divided by the number of days in the fiscal year).
Proxy Voting and Portfolio Holdings Information
Proxy Voting:
Information regarding the policies and procedures the Fund uses to determine how to vote proxies relating to portfolio securities is available without charge, upon request, by calling (800) 539-3863. The information is also included in the Fund's Statement of Additional Information, which is available on the SEC's website at www.sec.gov.
Information relating to how the Fund voted proxies relating to portfolio securities held during the most recent 12 months ended June 30 is available on the SEC's website at www.sec.gov.
Availability of Schedules of Portfolio Investments:
The Trust files a complete list of Schedules of Portfolio Investments with the SEC for the first and third quarter of each fiscal year on Form N-PORT. Forms N-PORT are available on the SEC's website at www.sec.gov.
48
USAA Mutual Funds Trust | Supplemental Information — continued March 31, 2020 | ||||||
(Unaudited)
Trustee and Officer Information
Board of Trustees:
Overall responsibility for management of the Trust rests with the Board. The Trust is managed by the Board in accordance with the laws of the state of Delaware. There are currently 10 Trustees, eight of whom are not "interested persons" of the Trust within the meaning of that term under the 1940 Act ("Independent Trustees") and two of whom is an "interested person" of the Trust within the meaning of that term under the 1940 Act ("Interested Trustee"). The Trustees, in turn, elect the officers of the Trust to actively supervise its day-to-day operations.
The following tables list the Trustees, their ages, position with the Trust, commencement of service, principal occupations during the past five years and any directorships of other investment companies or companies whose securities are registered under the Securities Exchange Act of 1934, as amended, or who file reports under that Act. Each Trustee oversees 47 portfolios in the Trust. Each Trustee's address is 15935 La Cantera Pkwy, Building Two, San Antonio, TX, 78256. Pursuant to a policy adopted by the Board, the term of office for each Trustee shall be until the Independent Trustee reaches age 75 or an Interested Trustee reaches age 75. The Board may change or grant exceptions from this policy at any time without shareholder approval. A Trustee may resign or be removed by a vote of the other Trustees or the holders of a majority of the outstanding shares of the Trust at any time. Vacancies on the Board can be filled by the action of a majority of the Trustees, provided that after filling such vacancy at least two-thirds of the Trustees have been elected by the shareholders.
Name and Date of Birth | Position Held with the Trust | Year Commenced Service | Principal Occupation During Past 5 Years | Other Directorships Held During Past 5 Years | |||||||||||||||
Independent Trustees. | |||||||||||||||||||
| Jefferson C. Boyce, Born September 1957 | Lead Independent Trustee, and Vice Chairman | 2013 | Senior Managing Director, New York Life Investments, LLC (1992-2012) | Westhab, Inc. | |||||||||||||||
| John C. Walters, Born February 1962 | Trustee | 2019 | Retired. Mr. Walters brings significant Board experience including active involvement with the board of a Fortune 500 company, and a proven record of leading large, complex financial organizations. He has a demonstrated record of success in distribution, manufacturing, investment brokerage, and investment management in both the retail and institutional investment businesses. He has substantial experience in the investment management business with a demonstrated ability to develop and drive strategy while managing operation, financial, and investment risk. | Guardian Variable Products Trust (16 series), Lead Independent Director; Amerilife Holdings LLC, Director; Stadion Money Management; Director; University of North Carolina (Chapel Hill), Member Board of Governors. | |||||||||||||||
49
USAA Mutual Funds Trust | Supplemental Information — continued March 31, 2020 | ||||||
(Unaudited)
Name and Date of Birth | Position Held with the Trust | Year Commenced Service | Principal Occupation During Past 5 Years | Other Directorships Held During Past 5 Years | |||||||||||||||
| Robert L. Mason, Ph.D., Born July 1946 | Trustee | 1997 | Adjunct Professor in the Department of Management Science and Statistics in the College of Business at the University of Texas at San Antonio (since 2001); Institute Analyst, Southwest Research Institute (March 2002-January 2016) | None | |||||||||||||||
| Dawn M. Hawley, Born February 1954 | Trustee | 2014 | Manager of Finance, Menil Foundation, Inc. (May 2007-June 2011), which is a private foundation that oversees the assemblage of sculptures, prints, drawings, photographs, and rare books. Director of Financial Planning and Analysis and Chief Financial Officer, AIM Management Group, Inc. (October 1987-January 2006) | None | |||||||||||||||
| Paul L. McNamara, Born July 1948 | Trustee | 2012 | Director, Cantor Opportunistic Alternatives Fund, LLC (March 2010-February 2014) , which is a closed-end fund of funds by Cantor Fitzgerald Investment Advisors, LLC | None | |||||||||||||||
50
USAA Mutual Funds Trust | Supplemental Information — continued March 31, 2020 | ||||||
(Unaudited)
Name and Date of Birth | Position Held with the Trust | Year Commenced Service | Principal Occupation During Past 5 Years | Other Directorships Held During Past 5 Years | |||||||||||||||
| Richard Y. Newton III, Born January 1956 | Trustee | 2017 | Director, Elta North America (01/18-present), which is a global leader in the design, manufacture, and support of innovative electronic systems in the ground, maritime, airborne, and security domains for the nation's warfighters, security personnel, and first responders; Managing Partner, Pioneer Partnership Development Group (December 2015-present)); Executive Director, The Union League Club of New York (June 2014-November 2015): Executive Vice President, Air Force Association (August 2012-May 2014); Lieutenant General, United States Air Force (January 2008-June 2012) | None | |||||||||||||||
| Barbara B. Ostdiek, Ph.D., Born March 1964 | Trustee | 2008 | Senior Associate Dean of Degree Programs at Jesse H. Jones Graduate School of Business at Rice University (since 2013); Associate Professor of Finance at Jessie H. Jones Graduate School of Business at Rice University (since 2001) | None | |||||||||||||||
| Michael F. Reimherr, Born August 1945 | Trustee | 2000 | President of Reimherr Business Consulting (May 1995-December 2017); St. Mary's University Investment Committee overseeing University Endowment (since 2014) | None | |||||||||||||||
51
USAA Mutual Funds Trust | Supplemental Information — continued March 31, 2020 | ||||||
(Unaudited)
Name and Date of Birth | Position Held with the Trust | Year Commenced Service | Principal Occupation During Past 5 Years | Other Directorships Held During Past 5 Years | |||||||||||||||
Interested Trustees. | |||||||||||||||||||
| David C. Brown, ** Born May 1972 | Trustee | 2019 | Chairman and Chief Executive Officer (since 2013), Co-Chief Executive Officer (2011-2013), Victory Capital Management Inc.; Chairman and Chief Executive Officer, Victory Capital Holdings, Inc. (since 2013). Mr. Brown brings to the Board extensive business, finance and leadership skills gained and developed through years of experience in the financial services industry, including his tenure overseeing the strategic direction as CEO of Victory Capital. These skills, combined with Mr. Brown's extensive knowledge of the financial services industry and demonstrated success in the development and distribution of investment strategies and products, enable him to provide valuable insights to the Board and strategic direction for the Funds | Trustee, Victory Portfolios (42 series), Victory Portfolios II (26 series), Victory Variable Insurance Funds (9 series) | |||||||||||||||
52
USAA Mutual Funds Trust | Supplemental Information — continued March 31, 2020 | ||||||
(Unaudited)
Name and Date of Birth | Position Held with the Trust | Year Commenced Service | Principal Occupation During Past 5 Years | Other Directorships Held During Past 5 Years | |||||||||||||||
| Daniel S. McNamara, ** Born June 1966 | Trustee and Chair of the Board of Trustees | 2012 | Trustee, President, and Vice Chairman of USAA ETF Trust (June 2017-June 2019); President of Financial Advice & Solutions Group (FASG), USAA (since 2013); Director, IMCO (September 2009-April 2014); President, AMCO (August, 2011-April 2013); Senior Vice President of USAA Financial Planning Services Insurance Agency, Inc. (FPS) (since 2011); Director of USAA Investment Management Company (IMCO) (since 2009); Chairman of Board of IMCO (since 2013); Director of USAA Asset Management Company (AMCO), (August 2011-June 2019); President and Director of USAA Shareholder Account Services (SAS)(October 2009-June 2019); Director and Vice Chairman of FPS (since 2013); President and Director of USAA Investment Corporation (ICORP) (since 2010); Chairman of Board of ICORP (since 2013); Director of USAA Financial Advisors, Inc. (FAI) (since 2013); Chairman of Board of FAI (since 2015). Mr. McNamara brings to the Board extensive experience in the financial services industry, including experience as an officer of the Trust. | None | |||||||||||||||
** Mr. McNamara and Mr. Brown are "Interested Persons" by reason of their relationships with the Adviser.
The Statement of Additional Information includes additional information about the Trustees of the Trust and is available, without charge, on the SEC's website at www.sec.gov and/or by calling (800)-539-3863.
53
USAA Mutual Funds Trust | Supplemental Information — continued March 31, 2020 | ||||||
(Unaudited)
Officers:
The officers of the Trust, their ages, commencement of service and their principal occupations during the past five years, are detailed in the following table. Each officer serves until the earlier of his or her resignation, removal, retirement, death, or the election of a successor. The mailing address of each officer of the Trust is 15935 La Cantera Pkwy, Building Two, San Antonio, TX, 78256. The officers of the Trust receive no compensation directly from the Trust for performing the duties of their offices.
Name and Date of Birth | Position with the Trust | Year Commenced Service | Principal Occupation During Past 5 Years | ||||||||||||
Interested Officers. | |||||||||||||||
| Christopher K. Dyer, Born February 1962 | President | 2019 | Director of Fund Administration, Victory Capital (2004-present) | ||||||||||||
| Scott A Stahorsky, Born July 1969 | Vice President | 2019 | Manager, Fund Administration, Victory Capital (since 2015); Senior Analyst, Fund Administration, Victory Capital (prior to 2015) | ||||||||||||
| James K. De Vries, Born April 1969 | Treasurer, Principal Financial Officer | 2018 | Executive Director, Victory Capital Management Inc. (since 2019); Treasurer, USAA ETF Trust (September 2018-June 2019); Executive Director, Investment and Financial Administration, USAA (April 2012-June 2019); Assistant Treasurer, USAA ETF Trust (June 2017-September 2018); Assistant Treasurer, USAA Mutual Funds Trust (December 2013-February 2018) | ||||||||||||
| Allan Shaer, Born March 1965 | Assistant Treasurer | 2019 | Senior Vice President, Financial Administration, Citi Fund Services Ohio, Inc. (since 2016); Vice President, Mutual Fund Administration, JP Morgan Chase (2011-2016) | ||||||||||||
| Carol D. Trevino, Born October 1965 | Assistant Treasurer | 2018 | Director, Accounting and Finance, Victory Capital Management Inc. (since 2019); Accounting/Financial Director, USAA (December 2013-June 2019); Assistant Treasurer, USAA ETF Trust (September 2018-June 2019). | ||||||||||||
| Erin G. Wagner, Born February 1974 | Secretary | 2019 | Deputy General Counsel, the Adviser (since 2013) | ||||||||||||
| Charles Booth, Born April 1960 | Anti-Money Laundering Compliance Officer and Identity Theft Officer | 2019 | Director, Regulatory Administration and CCO Support Services, Citi Fund Services Ohio, Inc. (2007-present) | ||||||||||||
| Amy Campos, Born July 1976 | Chief Compliance Officer | 2019 | Chief Compliance Officer, USAA Mutual Funds Trust (since 2019); Executive Director, Deputy Chief Compliance Officer, USAA Mutual Funds Trust and USAA ETF Trust (July 2017-June 2019); Compliance Director, USAA Mutual Funds Trust (2014-July 2017) | ||||||||||||
54
USAA Mutual Funds Trust | Supplemental Information — continued March 31, 2020 | ||||||
(Unaudited)
Additional Federal Income Tax Information
The following federal tax information related to the Fund's fiscal year ended March 31, 2020, is provided for information purposes only and should not be used for reporting to federal or state revenue agencies. Federal tax information for the calendar year will be reported to you on Form 1099-DIV in January 2021.
With respect to distributions paid, the Fund designates the following amounts (or, if subsequently determined to be different, the maximum amount allowable) for the fiscal year ended March 31, 2020:
| Tax Exempt Income Amount* | |||||||
100.00 | % | ||||||
* Presented as a percentage of net investment income and excludes short-term capital gain distributions paid, if any. All or a portion of these amounts may be exempt from taxation at the state level.
55
Privacy Policy
Protecting the Privacy of Information
The Trust respects your right to privacy. We also know that you expect us to conduct and process your business in an accurate and efficient manner. To do so, we must collect and maintain certain personal information about you. This is the information we collect from you on applications or other forms, and from the transactions you make with us or third parties. It may include your name, address, social security number, account transactions and balances, and information about investment goals and risk tolerance.
We do not disclose any information about you or about former customers to anyone except as permitted or required by law. Specifically, we may disclose the information we collect to companies that perform services on our behalf, such as the transfer agent that processes shareholder accounts and printers and mailers that assist us in the distribution of investor materials. We may also disclose this information to companies that perform marketing services on our behalf. This allows us to continue to offer you Victory investment products and services that meet your investing needs, and to effect transactions that you request or authorize. These companies will use this information only in connection with the services for which we hired them. They are not permitted to use or share this information for any other purpose.
To protect your personal information internally, we permit access only by authorized employees and maintain physical, electronic and procedural safeguards to guard your personal information.*
* You may have received communications regarding information about privacy policies from other financial institutions which gave you the opportunity to "opt-out" of certain information sharing with companies which are not affiliated with that financial institution. The Trust does not share information with other companies for purposes of marketing solicitations for products other than the Trust. Therefore, the Trust does not provide opt-out options to their shareholders.
15935 La Cantera Pkwy
Building Two
San Antonio, Texas 78256

Visit our website at: | Call | ||||||
usaa.com | (800) 235-8396 | ||||||
40858-0520

MARCH 31, 2020
Annual Report
USAA Tax Exempt Money Market Fund
Beginning January 1, 2021, as permitted by regulations adopted by the Securities and Exchange Commission, paper copies of the Fund's shareholder reports like this one will no longer be sent by mail, unless you specifically request paper copies of the reports from the Fund or from your financial intermediary, such as a broker-dealer or bank. Instead, the reports will be made available on usaa.com, and you will be notified by mail each time a report is posted and provided with a website link to access the report.
If you already elected to receive shareholder reports electronically, you will not be affected by this change and you need not take any action. You may elect to receive shareholder reports and other communications from the Fund or your financial intermediary electronically by notifying your financial intermediary directly, or if you are a direct investor, by calling (800) 235-8396 or logging on to usaa.com.
You may elect to receive all future reports in paper free of charge. You can inform the Fund or your financial intermediary that you wish to continue receiving paper copies of your shareholder reports by notifying your financial intermediary directly, or if you are a direct investor, by calling (800) 235-8396 or logging on to usaa.com. Your election to receive reports in paper will apply to all funds held with the USAA family of funds or your financial intermediary.
Victory Capital means Victory Capital Management Inc., the investment adviser of the USAA Mutual Funds. USAA Mutual Funds are distributed by Victory Capital Services, Inc., member FINRA, an affiliate of Victory Capital. Victory Capital and its affiliates are not affiliated with United Services Automobile Association or its affiliates. USAA and the USAA logo are registered trademarks and the USAA Mutual Funds and USAA Investments logos are trademarks of United Services Automobile Association and is being used by Victory Capital and its affiliates under license.
TABLE OF CONTENTS
USAA Mutual Funds Trust
Shareholder Letter (Unaudited) | 2 | ||||||
Managers' Commentary (Unaudited) | 4 | ||||||
Investment Overview (Unaudited) | 6 | ||||||
| Investment Objective & Portfolio Holdings (Unaudited) | 8 | ||||||
Financial Statements | |||||||
Schedule of Portfolio Investments | 9 | ||||||
Statement of Assets and Liabilities | 16 | ||||||
Statement of Operations | 17 | ||||||
Statements of Changes in Net Assets | 18 | ||||||
Financial Highlights | 20 | ||||||
Notes to Financial Statements | 22 | ||||||
| Report of Independent Registered Public Accounting Firm | 31 | ||||||
Supplemental Information (Unaudited) | 32 | ||||||
Expense Example | 32 | ||||||
Proxy Voting and Portfolio Holdings Information | 32 | ||||||
Trustees' and Officers' Information | 33 | ||||||
Additional Federal Income Tax Information | 39 | ||||||
Privacy Policy (inside back cover) | |||||||
This report is for the information of the shareholders and others who have received a copy of the currently effective prospectus of the Fund, managed by Victory Capital Management Inc. It may be used as sales literature only when preceded or accompanied by a current prospectus, which provides further details about the Fund.
IRA DISTRIBUTION WITHHOLDING DISCLOSURE
We generally must withhold federal income tax at a rate of 10% of the taxable portion of your distribution and, if you live in a state that requires state income tax withholding, at your state's tax rate. However, you may elect not to have withholding apply or to have income tax withheld at a higher rate. Any withholding election that you make will apply to any subsequent distribution unless and until you change or revoke the election. If you wish to make a withholding election, or change or revoke a prior withholding election, call (800) 235-8396.
If you do not have a withholding election in place by the date of a distribution, federal income tax will be withheld from the taxable portion of your distribution at a rate of 10%. If you must pay estimated taxes, you may be subject to estimated tax penalties if your estimated tax payments are not sufficient and sufficient tax is not withheld from your distribution.
For more specific information, please consult your tax adviser.
1
(Unaudited)
Dear Shareholder,
If there were ever a time that illustrated the dynamic and unpredictable nature of financial markets—and life in general—it would be the strange days of early 2020. The spread of COVID-19 throughout the United States and the world has been an unprecedented event that, among so many other impacts, rendered virtually any economic forecasts unreliable. Seemingly overnight, the sentiment pendulum swung from risk-on to risk-off. We all became familiar with unusual concepts like "social distancing" and "flattening the curve."
Given that wide swaths of the global economy came to an all-stop—an event that has no real precedent—there remains tremendous uncertainty as to the depth and extent of the economic downturn. Making assumptions about the extent of the virus' reach, its impact on consumer behavior and employment, and the speed at which the U.S. government and U.S. Federal Reserve (the "Fed") can revive the economy is educated guesswork at best.
Fortunately, it's not all bad news. We did see markets stabilize as this annual reporting period drew to a close (and in the early weeks of April immediately following). As of the writing of this letter, the array of new lending facilities and programs launched by the Fed generally appear to have had their intended effect of improving liquidity and trading, at least in the short-term. Credit spreads across corporate, high-yield, structured, and municipal bond markets were coaxed down from their highs. Trading in equity markets also appeared to stabilize.
The USAA tax-exempt funds generally performed as would be expected given the unusual market environment. Our tax-exempt funds tend to be more credit heavy, holding more BBB-category rated bonds than the average in our peer groups. Typically, we overweight these credits to provide additional tax-free income to our investors, and these securities tend to underperform in periods of market dislocation when credit spreads widen significantly.
We believe that the volatility in the tax-exempt market reflected the lack of liquidity, rather than any significant credit deterioration. It's important to underscore that the USAA tax-exempt funds entered the crisis with ample liquidity and none have yet had to sell portfolio securities at an inopportune price to achieve a fund's desired level of exposure.
Looking ahead, the economy and the markets remain unpredictable. Yet our investment philosophy—and our resolve—is steadfast. A priority of our fixed-income portfolio managers and analysts is to maintain substantial liquidity, as no one can predict when the crisis will abate and what liquidity needs might be in the meantime.
Through it all, we remain committed to our core competency of evaluating, taking and managing credit risk, and we continue to build portfolios bond-by-bond. We believe the recent environment, though breathtaking in its volatility, provides extraordinary buying opportunities that may help us lock in higher tax-free yields for our investors.
2
If you have questions about the current market dynamics or your specific portfolio or investment plan, please give one of our financial representatives a call. They can help ensure that you are properly diversified based on your long-term goals, time horizon, and risk tolerance.
From all of us here at USAA Funds, thank you for letting us help you work toward your investment goals.

Christopher K. Dyer, CFA
President,
USAA Funds
3
USAA Mutual Funds Trust
USAA Tax Exempt Money Market Fund
Manager's Commentary
(Unaudited)
Cody Perkins, CFA
Andrew Hattman, CFA, CAIA
• What were the market conditions during the reporting period?
When the reporting period began, the target federal funds ("fed funds") rate was at a range of between 2.25% and 2.50%, with most U.S. Federal Reserve (the "Fed") officials signaling no interest rate changes during the 2019 calendar year. However, due to intensifying U.S.-China trade tensions and global economic weakness, the Fed cut short-term interest rates three times in the second half of calendar year 2019 (to a range of 1.50%-1.75%). At the beginning of 2020, Fed policymakers maintained their monetary policy stance — holding short-term interest rates steady — and said that they were evaluating the economic impact of their three 2019 rate cuts. In February, as the emergence of a novel coronavirus ("COVID-19") raised concerns about a global economic slowdown, Fed Chair Jerome Powell said the U.S. central bank would "act as appropriate" to support the U.S. economy. In March, amid rising recession risks, the Fed implemented an emergency 0.50% cut to the fed funds rate. Just two weeks later, as the pandemic spread and major parts of the U.S. economy shut down, Fed officials made another emergency rate cut, slashing the fed funds rate by 1% to a range between 0% and 0.25%. The Fed also said it would keep the rate at that level "until it is confident that the economy has weathered recent events and is on track" to achieve its goals of stable prices and strong employment.
Interest rates on tax exempt money market securities fluctuated throughout the reporting period due to market dynamics and Fed actions. At the beginning of the reporting period, the SIFMA Municipal Swap Index, the index of seven-day variable rate demand notes ("VRDNs"), was 1.50%. The low for the period was 0.80% on January 15, 2020, due to seasonal inflows at the beginning of the calendar year. The high of the period, at 5.20%, came on March 18, as many money market and tax exempt mutual funds had to sell large amounts of VRDNs to meet investor redemptions. The SIFMA Municipal Swap Index closed the reporting period at 4.71%. (Note that on April 1, 2020, the index dropped to 1.83%).
• How did the USAA Tax Exempt Money Market Fund (the "Fund") perform during the reporting period?
For the reporting period ended March 31, 2020, the Fund had a return of 1.05%, compared to an average return of 1.08% for the tax-exempt money market funds category, according to iMoneyNet, Inc.
4
USAA Mutual Funds Trust
USAA Tax Exempt Money Market Fund (continued)
• What were your strategies in this environment?
We continued to focus on our two primary goals: preservation of capital and liquidity. The Fund invests the majority of its assets in VRDNs, which generally have interest rates that adjust daily/weekly to the market. The VRDNs owned by the Fund continued to provide both flexibility and liquidity because they can be sold at par value (100% of face value) upon seven days or less notice. They also offer the Fund a degree of safety as many of these VRDNs are guaranteed by a bank letter of credit for the payment of both principal and interest.
As always, we continued to work with our in-house team of analysts to help us identify attractive opportunities for the portfolio. They also continue to analyze and monitor every holding in the Fund.
Thank you for allowing us to assist you with your investment needs.
5
USAA Mutual Funds Trust
USAA Tax Exempt Money Market Fund
Investment Overview
(Unaudited)
Average Annual Total Return
Year Ended March 31, 2020
INCEPTION DATE | 2/6/84 | ||||||
Net Asset Value | |||||||
One Year | 1.05 | % | |||||
Five Year | 0.57 | % | |||||
Ten Year | 0.30 | % | |||||
Past performance is not indicative of future results. The performance data quoted represents past performance and current returns may be lower or higher. The investment return and principal value will fluctuate so that an investor's shares, when redeemed, may be worth more or less than the original cost. To obtain performance information current to the most recent month's end, please visit www.usaa.com.
You could lose money by investing in the Fund. Although the Fund seeks to preserve the value of your investment at $1 per share, it cannot guarantee it will do so. The Fund may impose a fee upon the sale of your shares or may temporarily suspend your ability to sell shares if the Fund's liquidity falls below required minimums because of market conditions or other factors. An investment in the Fund is not a deposit in USAA Federal Savings Bank, or any other bank, and is not insured or guaranteed by the Federal Deposit Insurance Corporation or any other government agency. The Fund's sponsor has no legal obligation to provide financial support to the Fund, and you should not expect that the sponsor will provide financial support to the Fund at any time.
Total return measures the price change in a share assuming the reinvestment of all net investment income and realized capital gain distributions, if any. The total returns quoted do not reflect adjustments made to the enclosed financial statements in accordance with U.S. generally accepted accounting principles or the deduction of taxes that a shareholder would pay on net investment income and realized capital gain distributions, including reinvested distributions, or redemptions of shares. The total return figures set forth above include all waivers of fees for various periods since inception. Without such fee waivers, the total returns would have been lower.
USAA Tax Exempt Money Market Fund — Growth of $10,000
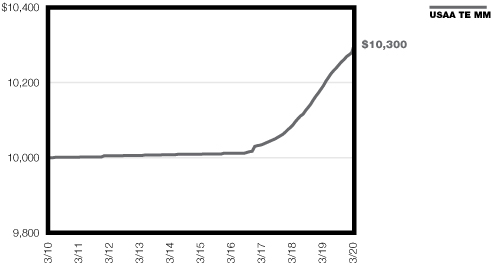
The graph reflects investment of growth of a hypothetical $10,000 investment in the Fund. Past performance is no guarantee of future results.
The graph and table do not reflect the deduction of taxes that a shareholder would pay on Fund distributions or the redemption of Fund shares.
6
USAA Mutual Funds Trust
USAA Tax Exempt Money Market Fund (continued)
n 7-DAY YIELD COMPARISON n
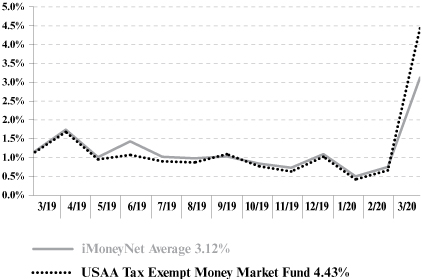
Data represents the last Monday of each month. Ending 3/30/2020.
The graph tracks the USAA Tax Exempt Money Market Fund's seven-day yield against an average of money market fund yields of all tax-free national retail money funds average of money market fund yields calculated by iMoneyNet, Inc. iMoneyNet, Inc. is an organization that tracks the performance of money market funds.
Past performance is no guarantee of future results.
7
| USAA Mutual Funds Trust USAA Tax Exempt Money Market Fund | March 31, 2020 | ||||||
Investment Objective & Portfolio Holdings:
The Fund's investment objective seeks to provide investors with interest income that is exempt from federal income tax and has a further objective of preserving capital and maintaining liquidity.
Top 10 Industries
March 31, 2020
(% of Net Assets)
Electric Utilities | 15.7 | % | |||||
Education | 8.5 | % | |||||
Hospital | 8.1 | % | |||||
Steel | 7.7 | % | |||||
General Obligation | 7.1 | % | |||||
Oil & Gas Refining & Marketing | 4.7 | % | |||||
Agricultural Products | 4.5 | % | |||||
Community Service | 4.1 | % | |||||
Integrated Oil & Gas | 3.8 | % | |||||
Electric/Gas Utility | 3.8 | % | |||||
Refer to the Schedule of Portfolio of Investments for a complete list of securities.
8
| USAA Mutual Funds Trust USAA Tax Exempt Money Market Fund | Schedule of Portfolio Investments March 31, 2020 | ||||||
(Amounts in Thousands, Except for Shares)
Security Description | Principal Amount | Value | |||||||||
Municipal Bonds (91.4%) | |||||||||||
Alabama (7.4%): | |||||||||||
| Columbia Industrial Development Board Revenue, 5.50%, 12/1/37, Continuously Callable @100 (a) | $ | 10,000 | $ | 10,000 | |||||||
| Huntsville-Oakwood College Educational Building Authority Revenue (LOC — BB&T Corp.), 1.75%, 12/1/22, Continuously Callable @100 (a) | 535 | 535 | |||||||||
| Industrial Development Board of the City of Mobile Alabama Revenue, 5.50%, 6/1/34, Callable 4/6/20 @ 100 (a) | 31,300 | 31,300 | |||||||||
| Mobile County IDA Revenue (LOC — Swedbank AB) Series A, 4.60%, 7/1/40, Continuously Callable @100 (a) | 32,500 | 32,500 | |||||||||
Series B, 4.60%, 7/1/40, Continuously Callable @100 (a) | 20,000 | 20,000 | |||||||||
| West Jefferson Industrial Development Board Revenue, 4.90%, 6/1/28, Continuously Callable @100 (a) | 5,190 | 5,190 | |||||||||
99,525 | |||||||||||
Arizona (0.7%): | |||||||||||
Maricopa County IDA Revenue, 4.35%, 1/1/49, Continuously Callable @100 (a) | 10,000 | 10,000 | |||||||||
Arkansas (0.4%): | |||||||||||
| City of Texarkana Revenue (LOC — PNC Financial Services Group), 5.59%, 3/1/21, Continuously Callable @100 (a) | 5,175 | 5,175 | |||||||||
California (0.4%): | |||||||||||
| City of Los Angeles Certificate of Participation (LOC — U.S. Bancorp), 6.30%, 8/1/35, Continuously Callable @100 (a) | 5,885 | 5,885 | |||||||||
Colorado (0.7%): | |||||||||||
| Colorado Educational & Cultural Facilities Authority Revenue (LOC — Fifth Third Bank), 1.25%, 1/1/29, Continuously Callable @100 (a) | 1,650 | 1,650 | |||||||||
| Sheridan Redevelopment Agency Tax Allocation (LOC — JPMorgan Chase & Co.), 5.25%, 12/1/29, Callable 5/1/20 @ 100 (a) | 7,785 | 7,785 | |||||||||
9,435 | |||||||||||
Connecticut (0.4%): | |||||||||||
| Connecticut State Health & Educational Facilities Authority Revenue (LOC — Bank of America Corp.), Series B, 4.24%, 7/1/30, Callable 5/1/20 @ 100 (a) | 5,000 | 5,000 | |||||||||
Florida (3.0%): | |||||||||||
County of Escambia Revenue, 1.75%, 4/1/39, Continuously Callable @100 (a) | 31,600 | 31,600 | |||||||||
County of Martin Revenue, 1.20%, 7/15/22, Continuously Callable @100 (a) | 9,300 | 9,300 | |||||||||
40,900 | |||||||||||
Georgia (2.0%): | |||||||||||
| Appling County Development Authority Revenue, 1.02%, 9/1/41, Continuously Callable @100 (a) | 5,900 | 5,900 | |||||||||
| Roswell Housing Authority Revenue (LOC — Northern Trust Corp.), Series A, 5.05%, 9/1/27 (a) | 12,600 | 12,600 | |||||||||
| The Burke County Development Authority Revenue, 1.10%, 7/1/49, Continuously Callable @100 (a) | 8,990 | 8,990 | |||||||||
27,490 | |||||||||||
Illinois (6.7%): | |||||||||||
| City of Galesburg Revenue (LOC — PNC Financial Services Group), 4.50%, 3/1/31, Continuously Callable @100 (a) | 10,900 | 10,900 | |||||||||
See notes to financial statements.
9
| USAA Mutual Funds Trust USAA Tax Exempt Money Market Fund | Schedule of Portfolio Investments — continued March 31, 2020 | ||||||
(Amounts in Thousands, Except for Shares)
Security Description | Principal Amount | Value | |||||||||
| Illinois Development Finance Authority Revenue (LOC — Northern Trust Corp.), 5.10%, 2/1/33, Continuously Callable @100 (a) | $ | 12,000 | $ | 12,000 | |||||||
| Illinois Finance Authority Revenue (LOC — Huntington National Bank), 5.08%, 10/1/33, Continuously Callable @100 (a) | 4,625 | 4,625 | |||||||||
| Illinois Finance Authority Revenue (LOC — Northern Trust Corp.), 5.50%, 4/1/33, Continuously Callable @100 (a) | 3,300 | 3,300 | |||||||||
| Illinois Finance Authority Revenue (LOC — PNC Financial Services Group), 4.50%, 4/1/37, Continuously Callable @100 (a) | 15,635 | 15,635 | |||||||||
| Illinois State Educational Facilities Revenue (LOC — Fifth Third Bank), 4.40%, 7/1/24, Continuously Callable @100 (a) | 1,170 | 1,170 | |||||||||
| Illinois State Educational Facilities Revenue (LOC — Huntington National Bank), Series A, 5.10%, 10/1/32, Continuously Callable @100 (a) | 14,165 | 14,165 | |||||||||
| Metropolitan Pier & Exposition Authority Revenue (LIQ — Barclays Bank PLC) Series 2015-XF1045, 5.00%, 6/15/52, Callable 6/15/22 @ 100 (a) (b) | 6,550 | 6,550 | |||||||||
Series 2015-XF1046, 5.00%, 6/15/50, Callable 6/15/20 @ 100 (a) (b) | 22,360 | 22,360 | |||||||||
90,705 | |||||||||||
Indiana (1.4%): | |||||||||||
| City of Berne Revenue (LOC — Federal Home Loan Bank of Indianapolis), 5.24%, 10/1/33, Continuously Callable @100 (a) | 4,755 | 4,755 | |||||||||
| City of Evansville Revenue (LOC — Fifth Third Bank), 4.40%, 1/1/25, Callable 4/10/20 @ 100 (a) | 2,330 | 2,330 | |||||||||
| Indiana Finance Authority Revenue (LOC — Federal Home Loan Bank of Indianapolis), 5.26%, 7/1/29, Continuously Callable @100 (a) | 7,450 | 7,450 | |||||||||
| Indiana Finance Authority Revenue (LOC — Fifth Third Bank), 4.50%, 9/1/31, Callable 4/10/20 @ 100 (a) | 3,745 | 3,745 | |||||||||
18,280 | |||||||||||
Iowa (6.2%): | |||||||||||
County of Louisa Revenue, 4.75%, 10/1/24, Continuously Callable @100 (a) | 33,400 | 33,400 | |||||||||
| Iowa Finance Authority Revenue 5.38%, 9/1/36, Continuously Callable @100 (a) | 31,763 | 31,763 | |||||||||
5.25%, 9/1/36, Callable 5/1/20 @ 100 (a) | 9,150 | 9,150 | |||||||||
5.38%, 6/1/39, Continuously Callable @100 (a) | 9,600 | 9,600 | |||||||||
83,913 | |||||||||||
Kansas (1.7%): | |||||||||||
City of Burlington Revenue, 5.18%, 9/1/35, Continuously Callable @100 (a) | 8,250 | 8,250 | |||||||||
City of St. Mary's Revenue, 6.00%, 4/15/32, Continuously Callable @100 (a) | 15,000 | 15,000 | |||||||||
23,250 | |||||||||||
Kentucky (0.9%): | |||||||||||
| City of Georgetown Revenue (LOC — Fifth Third Bank), 4.40%, 11/15/29, Callable 4/15/20 @ 100 (a) | 10,820 | 10,820 | |||||||||
| Lexington-Fayette Urban County Government Revenue (LOC — Federal Home Loan Bank of Cincinnati), 5.45%, 12/1/27, Callable 4/9/20 @ 100 (a) | 1,865 | 1,865 | |||||||||
12,685 | |||||||||||
Louisiana (5.2%): | |||||||||||
| City of New Orleans Revenue (LOC — Capital One, N.A.), 4.95%, 8/1/24, Continuously Callable @100 (a) | 3,940 | 3,940 | |||||||||
See notes to financial statements.
10
| USAA Mutual Funds Trust USAA Tax Exempt Money Market Fund | Schedule of Portfolio Investments — continued March 31, 2020 | ||||||
(Amounts in Thousands, Except for Shares)
Security Description | Principal Amount | Value | |||||||||
| Hammond Area Economic & Industrial Development District Revenue (LOC — Federal Home Loan Bank of Dallas), 4.60%, 3/1/33, Continuously Callable @100 (a) | $ | 1,300 | $ | 1,300 | |||||||
| Louisiana Local Government Environmental Facilities & Community Development Authority Revenue, Series B, 7.05%, 12/1/30, Callable 5/1/20 @ 100 (a) | 7,500 | 7,500 | |||||||||
| Parish of St. James Revenue Series A-1, 7.50%, 11/1/40, Continuously Callable @100 (a) | 41,305 | 41,305 | |||||||||
Series B-1, 7.50%, 11/1/40, Continuously Callable @100 (a) | 10,000 | 10,000 | |||||||||
| St. Tammany Corp. Revenue (LOC — Federal Home Loan Bank of Dallas), 4.60%, 3/1/33, Continuously Callable @100 (a) | 5,350 | 5,350 | |||||||||
69,395 | |||||||||||
Maryland (0.6%): | |||||||||||
| Town of Williamsport Revenue (LOC — Manufacturers & Traders Trust Co.), 4.58%, 11/1/37 (a) | 8,490 | 8,490 | |||||||||
Michigan (1.0%): | |||||||||||
| Michigan Finance Authority Revenue (LIQ — Barclays Bank PLC), Series 2019-XF2837, 5.00%, 11/15/50, Callable 11/2/29 @ 100 (a) (b) | 7,605 | 7,605 | |||||||||
| Michigan Finance Authority Revenue (LOC — Fifth Third Bank), 6.45%, 12/1/32, Callable 5/6/20 @ 100 (a) | 3,735 | 3,735 | |||||||||
| Michigan State Strategic Fund Revenue (LOC — Fifth Third Bank), 4.50%, 3/1/37, Continuously Callable @100 (a) | 2,400 | 2,400 | |||||||||
13,740 | |||||||||||
Minnesota (0.4%): | |||||||||||
| City of New ULM Revenue (LOC — Federal Home Loan Bank of Chicago), 5.33%, 10/1/40, Continuously Callable @100 (a) | 4,240 | 4,240 | |||||||||
| Sanford Canby Community Hospital District No. 1 Revenue, 6.00%, 11/1/26, Continuously Callable @100 (a) | 1,275 | 1,275 | |||||||||
5,515 | |||||||||||
Mississippi (0.6%): | |||||||||||
Mississippi Business Finance Corp. Revenue, Series D, 0.85%, 12/1/30, (a) | 3,800 | 3,800 | |||||||||
| Mississippi Business Finance Corp. Revenue (LOC — Federal Home Loan Bank of Dallas), 4.60%, 3/1/33, Continuously Callable @100 (a) | 3,775 | 3,775 | |||||||||
7,575 | |||||||||||
Missouri (3.5%): | |||||||||||
| Health & Educational Facilities Authority of the State of Missouri Revenue (LOC — Fifth Third Bank), 5.20%, 11/1/20, Continuously Callable @100 (a) | 1,300 | 1,300 | |||||||||
| Jackson County IDA Revenue (LOC — Commerce Bank, N.A.), 5.25%, 7/1/25, Continuously Callable @100 (a) | 20,000 | 20,000 | |||||||||
| RBC Municipal Products, Inc. Trust Revenue (LIQ — Royal Bank of Canada), 4.76%, 9/1/39 (a) (b) | 25,500 | 25,500 | |||||||||
46,800 | |||||||||||
Nebraska (2.7%): | |||||||||||
| Central Plains Energy Project Revenue (LIQ — Royal Bank of Canada), Series 2016-XM0185, 4.76%, 3/1/22 (a) (b) | 10,000 | 10,000 | |||||||||
| County of Custer Midwestern Disaster Revenue (LOC — U.S. Bancorp), 5.30%, 12/1/36, Callable 6/4/20 @ 100 (a) | 6,000 | 6,000 | |||||||||
See notes to financial statements.
11
| USAA Mutual Funds Trust USAA Tax Exempt Money Market Fund | Schedule of Portfolio Investments — continued March 31, 2020 | ||||||
(Amounts in Thousands, Except for Shares)
Security Description | Principal Amount | Value | |||||||||
| County of Washington Revenue, Series B, 5.25%, 12/1/40, Continuously Callable @100 (a) | $ | 19,700 | $ | 19,700 | |||||||
35,700 | |||||||||||
Nevada (1.7%): | |||||||||||
| County of Clark Revenue (LOC — Bank of America Corp.), 5.61%, 12/1/41, Continuously Callable @100 (a) | 23,255 | 23,255 | |||||||||
New Hampshire (2.6%): | |||||||||||
| New Hampshire Business Finance Authority Revenue (LOC — Landesbank Hessen-Thuringen), 5.38%, 9/1/30, Continuously Callable @100 (a) | 34,990 | 34,990 | |||||||||
New Mexico (0.4%): | |||||||||||
| New Mexico Hospital Equipment Loan Council Revenue (LOC — Fifth Third Bank), 5.30%, 7/1/25, Continuously Callable @100 (a) | 5,000 | 5,000 | |||||||||
New York (10.1%): | |||||||||||
| Build NYC Resource Corp. Revenue (LOC — Toronto-Dominion Bank), 5.75%, 12/1/45, Continuously Callable @100 (a) | 5,520 | 5,520 | |||||||||
Campbell-Savona Central School District, GO, 2.00%, 6/26/20 | 7,225 | 7,233 | |||||||||
Chenango Valley Central School District, GO, 2.00%, 6/26/20 | 10,000 | 10,012 | |||||||||
| County of Chautauqua Industrial Development Agency Revenue (LOC — Citizens Financial Group), Series A, 5.25%, 8/1/27, Continuously Callable @100 (a) | 1,745 | 1,745 | |||||||||
County of Washington, GO, Series A, 2.75%, 3/26/21 | 7,875 | 7,932 | |||||||||
| Guilderland Industrial Development Agency Revenue (LOC — Key Bank, N.A.), Series A, 4.85%, 7/1/32, Continuously Callable @100 (a) | 3,065 | 3,065 | |||||||||
Highland Falls-Fort Montgomery Central School District, GO, 2.00%, 6/26/20 | 10,500 | 10,512 | |||||||||
| Hudson Yards Infrastructure Corp. Revenue (LIQ — Royal Bank of Canada), Series 2016-ZF0463, 4.76%, 8/15/20 (a) (b) | 17,775 | 17,775 | |||||||||
| New York City Capital Resources Corp. Revenue (LOC — Manufacturers & Traders Trust Co.), 5.85%, 12/1/40, Continuously Callable @100 (a) | 7,500 | 7,500 | |||||||||
| New York Liberty Development Corp. Revenue (LIQ — Royal Bank of Canada), Series 2016-ZF0464, 4.76%, 5/15/21 (a) (b) | 15,000 | 15,000 | |||||||||
| Oneida County Industrial Development Agency Revenue (LOC — Citizens Financial Group), 5.52%, 7/1/37, Continuously Callable @100 (a) | 3,805 | 3,805 | |||||||||
| Onondaga County Industrial Development Agency Revenue (LOC — Manufacturers & Traders Trust Co.), 4.58%, 12/1/31, Continuously Callable @100 (a) | 5,520 | 5,520 | |||||||||
| Ramapo Housing Authority Revenue (LOC — Manufacturers & Traders Trust Co.), 4.58%, 12/1/29, Continuously Callable @100 (a) | 8,285 | 8,285 | |||||||||
| Seneca County Industrial Development Agency Revenue (LOC — Key Bank, N.A.), 4.85%, 4/1/20, Continuously Callable @100 (a) | 175 | 175 | |||||||||
| St. Lawrence County Industrial Development Agency Revenue (LOC — Citizens Financial Group), 6.50%, 7/1/37 (a) | 1,930 | 1,930 | |||||||||
Union Endicott Central School District, GO, 2.00%, 6/26/20 | 10,000 | 10,012 | |||||||||
Warsaw Central School District, GO, 2.00%, 6/26/20 | 9,400 | 9,412 | |||||||||
Wayland-Cohocton Central School District, GO, 2.00%, 6/26/20 | 9,500 | 9,512 | |||||||||
134,945 | |||||||||||
Ohio (0.4%): | |||||||||||
| Cincinnati & Hamilton County Port Authority Revenue (LOC — Fifth Third Bank), 1.25%, 9/1/25 (a) | 1,900 | 1,900 | |||||||||
County of Hamilton Revenue (LOC — Fifth Third Bank), 4.40%, 12/1/24 (a) | 2,450 | 2,450 | |||||||||
See notes to financial statements.
12
| USAA Mutual Funds Trust USAA Tax Exempt Money Market Fund | Schedule of Portfolio Investments — continued March 31, 2020 | ||||||
(Amounts in Thousands, Except for Shares)
Security Description | Principal Amount | Value | |||||||||
| Highland County Joint Township Hospital District Revenue (LOC — Fifth Third Bank), 4.50%, 8/1/24 (a) | $ | 910 | $ | 910 | |||||||
5,260 | |||||||||||
Oklahoma (4.3%): | |||||||||||
| Edmond Economic Development Authority Revenue (LOC — Bank of Oklahoma, N.A.), Series A, 5.00%, 6/1/31, Callable 5/1/20 @ 100 (a) | 5,600 | 5,600 | |||||||||
| Garfield County Industrial Authority Revenue, Series A, 4.75%, 1/1/25, Callable 5/6/20 @ 100 (a) | 26,700 | 26,700 | |||||||||
| Muskogee Industrial Trust Revenue, Series A, 4.75%, 6/1/27, Continuously Callable @100 (a) | 26,000 | 26,000 | |||||||||
58,300 | |||||||||||
Pennsylvania (2.2%): | |||||||||||
| Bucks County IDA Revenue (LOC — PNC Financial Services Group), Series B, 4.50%, 7/1/39, Continuously Callable @100 (a) | 12,160 | 12,160 | |||||||||
| County of Lehigh PA Revenue (LIQ — Barclays Bank PLC), Series 2019-XL0119, 5.00%, 7/1/49 (a) (b) | 5,000 | 5,000 | |||||||||
| Delaware Valley Regional Finance Authority Revenue (LOC — PNC Financial Services Group), Series B, 4.00%, 6/1/42, Continuously Callable @100 (a) | 12,385 | 12,385 | |||||||||
29,545 | |||||||||||
Rhode Island (0.7%): | |||||||||||
| Rhode Island Commerce Corp. Revenue (LOC — Citizens Financial Group), 5.08%, 3/1/38, Callable 5/1/20 @ 100 (a) | 3,595 | 3,595 | |||||||||
| Rhode Island Health & Educational Building Corp. Revenue (LOC — Citizens Financial Group), 1.00%, 6/1/35, Callable 5/1/20 @ 100 (a) | 5,680 | 5,680 | |||||||||
9,275 | |||||||||||
South Dakota (0.4%): | |||||||||||
| South Dakota Health & Educational Facilities Authority Revenue 6.00%, 11/1/25, Continuously Callable @100 (a) | 1,765 | 1,765 | |||||||||
6.00%, 11/1/27, Continuously Callable @100 (a) | 3,550 | 3,550 | |||||||||
5,315 | |||||||||||
Tennessee (2.7%): | |||||||||||
| Chattanooga Health Educational & Housing Facility Board Revenue (LIQ — Barclays Bank PLC), Series 2015-XF1023, 5.00%, 1/1/45 (a) (b) | 17,720 | 17,720 | |||||||||
| Metropolitan Government Nashville & Davidson County Health & Educational Facilities Board Revenue (LOC — Fifth Third Bank), 4.40%, 12/1/24, Callable 4/10/20 @ 100 (a) | 10,375 | 10,375 | |||||||||
| Wilson County Sports Authority Revenue (LOC — PNC Financial Services Group), 4.00%, 9/1/29, Continuously Callable @100 (a) | 8,825 | 8,825 | |||||||||
36,920 | |||||||||||
Texas (17.2%): | |||||||||||
| Atascosa County Industrial Development Corp. Revenue (LOC — National Rural Utilities Cooperative Finance Corp.), 4.80%, 6/30/20, Continuously Callable @100 (a) | 32,200 | 32,200 | |||||||||
| Brazos Harbor Industrial Development Corp. Revenue, 7.05%, 7/1/22, Callable 5/1/20 @ 100 (a) | 21,600 | 21,600 | |||||||||
See notes to financial statements.
13
| USAA Mutual Funds Trust USAA Tax Exempt Money Market Fund | Schedule of Portfolio Investments — continued March 31, 2020 | ||||||
(Amounts in Thousands, Except for Shares)
Security Description | Principal Amount | Value | |||||||||
| Port of Arthur Navigation District Industrial Development Corp. Revenue 7.05%, 6/1/41, Callable 5/1/20 @ 100 (a) | $ | 25,000 | $ | 25,000 | |||||||
7.05%, 3/1/42, Callable 6/1/20 @ 100 (a) | 7,000 | 7,000 | |||||||||
Series A, 7.05%, 12/1/40, Callable 5/1/20 @ 100 (a) | 16,000 | 16,000 | |||||||||
| Port of Port Arthur Navigation District Revenue 1.50%, 4/1/40, Continuously Callable @100 (a) | 1,570 | 1,570 | |||||||||
7.50%, 11/1/40, Continuously Callable @100 (a) | 28,750 | 28,750 | |||||||||
6.25%, 11/1/40, Continuously Callable @100 (a) | 14,500 | 14,500 | |||||||||
Series C, 1.54%, 4/1/40, Continuously Callable @100 (a) | 18,835 | 18,835 | |||||||||
| RIB Floater Trust Various States Revenue (LOC — Barclays Bank PLC), Series 2019-021, 5.00%, 8/1/50, (a) (b) | 39,375 | 39,375 | |||||||||
State of Texas Revenue, 4.00%, 8/27/20 | 25,000 | 25,189 | |||||||||
230,019 | |||||||||||
Virginia (1.5%): | |||||||||||
| Loudoun County Economic Development Authority Revenue, Series E, 5.00%, 2/15/38, Callable 5/1/20 @ 100 (a) | 12,700 | 12,700 | |||||||||
| Loudoun County Economic Development Authority Revenue (LOC — Northern Trust Corp.), 5.00%, 6/1/34, Callable 5/1/20 @ 100 (a) | 7,000 | 7,000 | |||||||||
19,700 | |||||||||||
Washington (0.6%): | |||||||||||
| Washington Higher Education Facilities Authority Revenue, 5.25%, 10/1/31, Callable 5/6/20 @ 100 (a) | 8,535 | 8,535 | |||||||||
West Virginia (0.7%): | |||||||||||
County of Marshall Revenue, 5.02%, 3/1/26, Continuously Callable @100 (a) | 9,630 | 9,630 | |||||||||
Total Municipal Bonds (Cost $1,230,147) | 1,230,147 | ||||||||||
Commercial Paper (6.9%) | |||||||||||
Texas (3.4%): | |||||||||||
| Houston Texas (LOC — Barclays Bank PLC) 1.20%, 6/10/20 | 10,000 | 10,000 | |||||||||
1.20%, 6/10/20 | 10,000 | 10,000 | |||||||||
University of Texas System, 1.02%, 4/2/20 | 25,000 | 25,000 | |||||||||
45,000 | |||||||||||
Virginia (3.5%): | |||||||||||
Stafford Country & Staunton (LOC — Bank of America Corp.), 1.14%, 4/2/20 | 47,320 | 47,320 | |||||||||
Total Commercial Paper (Cost $92,320) | 92,320 | ||||||||||
Total Investments (Cost $1,322,467) — 98.3% | 1,322,467 | ||||||||||
Other assets in excess of liabilities — 1.7% | 23,161 | ||||||||||
NET ASSETS — 100.00% | $ | 1,345,628 | |||||||||
(a) Variable Rate Demand Notes that provide the rights to sell the security at face value on either that day or within the rate-reset period. The interest rate is reset on the put date at a stipulated daily, weekly, monthly, quarterly, or other specified time interval to reflect current market conditions. These securities do not indicate a reference rate and spread in their description.
(b) Rule 144A security or other security that is restricted as to resale to institutional investors. The Fund's Adviser has deemed this security to be liquid based upon procedures approved by the Board of Trustees.
See notes to financial statements.
14
| USAA Mutual Funds Trust USAA Tax Exempt Money Market Fund | Schedule of Portfolio Investments — continued March 31, 2020 | ||||||
(Amounts in Thousands, Except for Shares)
As of March 31, 2020, the fair value of these securities was $166,885 (thousands) and amounted to 12.4% of net assets.
GO — General Obligation
IDA — Industrial Development Authority
LOC — Line Letter of Credit
PLC — Public Limited Company
Credit Enhancements — Adds the financial strength of the provider of the enhancement to support the issuer's ability to repay the principal and interest payments when due. The enhancement may be provided by a high-quality bank, insurance company or other corporation, or a collateral trust. The enhancements do not guarantee the market values of the securities.
LOC Principal and interest payments are guaranteed by a bank letter of credit or other bank credit agreement.
LIQ Liquidity enhancement that may, under certain circumstances, provide for repayment of principal and interest upon demand from the name listed.
See notes to financial statements.
15
USAA Mutual Funds Trust | Statement of Assets and Liabilities March 31, 2020 | ||||||
(Amounts in Thousands, Except Per Share Amounts)
| USAA Tax Exempt Money Market Fund | |||||||
Assets: | |||||||
Investments, at value (Cost $1,322,467) | $ | 1,322,467 | |||||
Cash | 62 | ||||||
Receivables: | |||||||
Interest | 5,090 | ||||||
Capital shares issued | 9,070 | ||||||
Investments sold | 17,950 | ||||||
From Adviser | 5 | ||||||
Prepaid expenses | 3 | ||||||
Total assets | 1,354,647 | ||||||
Liabilities: | |||||||
Payables: | |||||||
Capital shares redeemed | 8,298 | ||||||
Distributions | 24 | ||||||
Accrued expenses and other payables: | |||||||
Investment advisory fees | 320 | ||||||
Administration fees | 114 | ||||||
Custodian fees | 1 | ||||||
Transfer agent fees | 171 | ||||||
Compliance fees | 1 | ||||||
Trustees' fees | 2 | ||||||
Other accrued expenses | 88 | ||||||
Total liabilities | 9,019 | ||||||
Net Assets: | |||||||
Capital | 1,345,408 | ||||||
Total distributable earnings | 220 | ||||||
Net assets | $ | 1,345,628 | |||||
Shares (unlimited number of shares authorized with no par value): | 1,345,400 | ||||||
Net asset value, offering and redemption price per share: (a) | $ | 1.00 | |||||
(a) Per share amount may not recalculate due to rounding of net assets and/or shares outstanding.
See notes to financial statements.
16
USAA Mutual Funds Trust | Statement of Operations For the Year Ended March 31, 2020 | ||||||
(Amounts in Thousands)
| USAA Tax Exempt Money Market Fund | |||||||
Investment Income: | |||||||
Interest | $ | 23,179 | |||||
Total income | 23,179 | ||||||
Expenses: | |||||||
Investment advisory fees | 4,071 | ||||||
Professional fees | 6 | ||||||
Administration fees | 1,454 | ||||||
Sub-Administration fees | 18 | ||||||
Custodian fees | 93 | ||||||
Transfer agent fees | 2,182 | ||||||
Trustees' fees | 44 | ||||||
Compliance fees | 6 | ||||||
Legal and audit fees | 69 | ||||||
State registration and filing fees | 31 | ||||||
Interest expense on interfund lending | — | (a) | |||||
Other expenses | 170 | ||||||
Total expenses | 8,144 | ||||||
Expenses waived/reimbursed by Adviser | (19 | ) | |||||
Net expenses | 8,125 | ||||||
Net Investment Income | 15,054 | ||||||
Realized Gains from Investments: | |||||||
Net realized gains from investment securities | 251 | ||||||
Change in net assets resulting from operations | $ | 15,305 | |||||
(a) Amount is less than $1 thousand.
See notes to financial statements.
17
USAA Mutual Funds Trust | Statements of Changes in Net Assets | ||||||
(Amounts in Thousands)
USAA Tax Exempt Money Market Fund | |||||||||||
| Year Ended March 31, 2020 | Year Ended March 31, 2019 | ||||||||||
From Investments: | |||||||||||
Operations: | |||||||||||
Net investment income | $ | 15,054 | $ | 17,619 | |||||||
Net realized gains from investments | 251 | 167 | |||||||||
Change in net assets resulting from operations | 15,305 | 17,786 | |||||||||
Change in net assets resulting from distributions to shareholders | (15,244 | ) | (17,599 | ) | |||||||
Change in net assets resulting from capital transactions | (252,647 | ) | (163,622 | ) | |||||||
Change in net assets | (252,586 | ) | (163,435 | ) | |||||||
Net Assets: | |||||||||||
Beginning of period | 1,598,214 | 1,761,649 | |||||||||
End of period | $ | 1,345,628 | $ | 1,598,214 | |||||||
Capital Transactions: | |||||||||||
Proceeds from shares issued | $ | 1,014,473 | $ | 1,196,892 | |||||||
Distributions reinvested | 15,087 | 17,423 | |||||||||
Cost of shares redeemed | (1,282,207 | ) | (1,377,937 | ) | |||||||
Change in net assets resulting from capital transactions | $ | (252,647 | ) | $ | (163,622 | ) | |||||
Share Transactions: | |||||||||||
Issued | 1,014,473 | 1,196,892 | |||||||||
Reinvested | 15,087 | 17,423 | |||||||||
Redeemed | (1,282,207 | ) | (1,377,937 | ) | |||||||
Change in Shares | (252,647 | ) | (163,622 | ) | |||||||
See notes to financial statements.
18
This page is intentionally left blank.
19
USAA Mutual Funds Trust | Financial Highlights | ||||||
For a Share Outstanding Throughout Each Period
Investment Activities | Distributions to Shareholders From | ||||||||||||||||||||||||||
| Net Asset Value, Beginning of Period | Net Investment Income | Net Realized Gains on Investments(a) | Total from Investment Activities | Net Investment Income | Net Realized Gains from Investments | ||||||||||||||||||||||
USAA Tax Exempt Money Market Fund | |||||||||||||||||||||||||||
| Year Ended March 31, 2020 | $ | 1.00 | 0.01 | (c) | — | 0.01 | (0.01 | ) | — | (a) | |||||||||||||||||
| Year Ended March 31, 2019 | $ | 1.00 | 0.01 | — | 0.01 | (0.01 | ) | — | |||||||||||||||||||
| Year Ended March 31, 2018 | $ | 1.00 | 0.01 | — | 0.01 | (0.01 | ) | — | |||||||||||||||||||
| Year Ended March 31, 2017 | $ | 1.00 | — | (a) | — | — | (a) | — | (a) | — | (a) | ||||||||||||||||
| Year Ended March 31, 2016 | $ | 1.00 | — | (a) | — | — | (a) | — | (a) | — | (a) | ||||||||||||||||
* Assumes reinvestment of all net investment income and realized capital gain distributions, if any, during the period. Includes adjustments in accordance with U.S. generally accepted accounting principles and could differ from the Lipper reported return.
^ The net expense ratio may not correlate to the applicable expense limits in place during the period since the current contractual expense limitation is applied for a two year period beginning July 1, 2019 and in effect through June 30, 2021, instead of coinciding with the Fund's fiscal year end. Details of the current contractual expense limitation in effect can be found in Note 3 of the accompanying Notes to Financial Statements.
(a) Amount is less than $0.005 per share.
(b) Reflects total annual operating expenses for reductions of expenses paid indirectly for the March 31 fiscal years ended 2017 and 2016. Expenses paid indirectly decreased the expense ratio for each of these respective years by less than 0.01%.
(c) Per share net investment income has been calculated using the average daily shares method.
(d) Prior to August 1, 2017, AMCO voluntarily agreed, on a temporary basis, to reimburse management, administrative, or other fees to limit the Fund's expenses and attempt to prevent a negative yield.
See notes to financial statements.
20
USAA Mutual Funds Trust | Financial Highlights — continued | ||||||
For a Share Outstanding Throughout Each Period
Ratios to Average Net Assets | Supplemental Data | ||||||||||||||||||||||||||||||
| Total Distributions | Net Asset Value, End of Period | Total Return* | Net Expenses^(b) | Net Investment Income | Gross Expenses(b) | Net Assets, End of Period (000's) | |||||||||||||||||||||||||
USAA Tax Exempt Money Market Fund | |||||||||||||||||||||||||||||||
| Year Ended March 31, 2020 | (0.01 | ) | $ | 1.00 | 1.05 | % | 0.56 | % | 1.04 | % | 0.56 | % | $ | 1,345,628 | |||||||||||||||||
| Year Ended March 31, 2019 | (0.01 | ) | $ | 1.00 | 1.05 | % | 0.56 | % | 1.04 | % | 0.56 | % | $ | 1,598,214 | |||||||||||||||||
| Year Ended March 31, 2018 | (0.01 | ) | $ | 1.00 | 0.51 | %(d) | 0.56 | %(d) | 0.50 | % | 0.56 | % | $ | 1,761,649 | |||||||||||||||||
| Year Ended March 31, 2017 | — | (a) | $ | 1.00 | 0.23 | % | 0.54 | % | 0.11 | % | 0.58 | % | $ | 2,007,091 | |||||||||||||||||
| Year Ended March 31, 2016 | — | (a) | $ | 1.00 | 0.02 | % | 0.17 | % | 0.01 | % | 0.58 | % | $ | 2,634,454 | |||||||||||||||||
See notes to financial statements.
21
USAA Mutual Funds Trust | Notes to Financial Statements March 31, 2020 | ||||||
1. Organization:
USAA Mutual Funds Trust (the "Trust") is organized as a Delaware statutory trust and is registered under the Investment Company Act of 1940, as amended (the "1940 Act"), as an open-end investment company. The Trust is comprised of 47 funds and is authorized to issue an unlimited number of shares, which are units of beneficial interest with no par value.
The accompanying financial statements are those of the USAA Tax Exempt Money Market Fund (the "Fund"). The Fund is classified as diversified under the 1940 Act.
The Fund operates as a retail money market fund in compliance with the requirements of Rule 2a-7 under the 1940 Act; and as a retail money market fund, shares of the Fund are available for sale only to accounts that are beneficially owned by natural persons.
On November 6, 2018, United Services Automobile Association ("USAA"), the parent company of USAA Asset Management Company ("AMCO"), the investment adviser to the Fund, and USAA Transfer Agency Company, d/b/a USAA Shareholder Account Services ("SAS"), the transfer agent to the Fund, announced that AMCO and SAS would be acquired by Victory Capital Holdings, Inc., a global investment management firm headquartered in Cleveland, Ohio (the "Transaction"). The Transaction closed on July 1, 2019. A special shareholder meeting was held on April 18, 2019, at which shareholders of the Fund approved a new investment advisory agreement between the Trust, on behalf of the Fund, and Victory Capital Management Inc. ("VCM" or "Adviser"). Effective July 1, 2019, VCM replaced AMCO as the investment adviser to the Fund and Victory Capital Transfer Agency Company replaced SAS as the Fund's transfer agent. In addition, effective on that same date, shareholders of the Fund also elected the following two new directors to the Board of the Trust to serve upon the closing of the Transaction: (1) David C. Brown, to serve as an Interested Trustee; and (2) John C. Walters, to serve as an Independent Trustee.
Under the Trust's organizational documents, its officers and trustees are indemnified against certain liabilities arising out of the performance of their duties to the Fund. In addition, in the normal course of business, the Fund enters into contracts with its vendors and others that provide for general indemnifications. The Fund's maximum exposure under these arrangements is unknown, as this would involve future claims that may be made against the Fund. However, based on experience, the Fund expects that risk of loss to be remote.
2. Significant Accounting Policies:
The following is a summary of significant accounting policies followed by the Trust in the preparation of its financial statements. The policies are in conformity with generally accepted accounting principles in the United States of America ("GAAP"). The preparation of financial statements in accordance with GAAP requires management to make estimates and assumptions that affect the reported amounts of assets and liabilities and disclosure of contingent assets and liabilities at the date of the financial statements and the reported amounts of income and expenses for the period. Actual results could differ from those estimates. The Fund follows the specialized accounting and reporting requirements under GAAP that are applicable to investment companies under Accounting Standards Codification Topic 946.
Investment Valuation:
The inputs or methodologies used for valuing securities are not necessarily an indication of the risks associated with investing in those securities. For example, money market securities are valued using amortized cost, in accordance with rules under the 1940 Act. Generally, amortized cost approximates the current fair value of a security, but since the value is not obtained from a quoted price in an active market, such securities are reflected as Level 2.
The Fund records investments at fair value. Fair value is defined as the price that would be received to sell an asset or paid to transfer a liability in an orderly transaction between market participants at the measurement date.
22
USAA Mutual Funds Trust | Notes to Financial Statements — continued March 31, 2020 | ||||||
The valuation techniques described below maximize the use of observable inputs and minimize the use of unobservable inputs in determining fair value. The inputs used for valuing the Fund's investments are summarized in the three broad levels listed below:
• Level 1 — quoted prices in active markets for identical securities
• Level 2 — other significant observable inputs (including quoted prices for similar securities or interest rates applicable to those securities, etc.)
• Level 3 — significant unobservable inputs (including the Fund's own assumptions in determining the fair value of investments)
The Trust's Adviser has established the Pricing and Liquidity Committee (the "Committee"), and subject to the Trust's Board of Trustees (the "Board") oversight, the Committee administers and oversees the Fund's valuation policies and procedures, which are approved by the Board.
All securities held in the Fund are short-term debt securities, which are valued pursuant to Rule 2a-7 under the 1940 Act. This method values a security at its purchase price, and thereafter, assumes a constant amortization to maturity of any premiums or discounts.
Securities for which amortized cost valuations are considered unreliable or whose values have been materially affected by a significant event are valued in good faith, at fair value, using methods determined by the Committee, under procedures to stabilize net assets and valuation procedures approved by the Board.
Securities Purchased on a Delayed-Delivery or When-Issued Basis:
The Fund may purchase securities on a delayed-delivery or when-issued basis. Delivery and payment for securities that have been purchased by the Fund on a delayed-delivery, or when-issued basis or for delayed draws on loans can take place a month or more after the trade date. At the time the Fund makes the commitment to purchase a security on a delayed-delivery or when-issued basis, the Fund records the transaction and reflects the value of the security in determining net asset value. No interest accrues to the Fund until the transaction settles and payment takes place. A segregated account is established and the Fund maintains cash and/or marketable securities at least equal in value to commitments for delayed-delivery or when-issued securities. If the Fund owns delayed-delivery or when-issued securities, these values are included in Payable for investments purchased on the accompanying Statement of Assets and Liabilities and the segregated assets are identified in the Schedule of Portfolio Investments.
Municipal Obligations:
The values of municipal obligations can fluctuate and may be affected by adverse tax, legislative, or political changes, and by financial developments affecting municipal issuers. Payment of municipal obligations may depend on a relatively limited source of revenue, resulting in greater credit risk. Future changes in federal tax laws or the activity of an issuer may adversely affect the tax-exempt status of municipal obligations.
Investment Transactions and Related Income:
Changes in holdings of investments are accounted for no later than one business day following the trade date. For financial reporting purposes, however, investment transactions are accounted for on trade date on the last business day of the reporting period. Interest income is determined on the basis of coupon interest accrued using the effective interest method which adjusts, where applicable, the amortization of premiums or accretion of discount. Gains or losses realized on sales of securities are determined by comparing the identified cost of the security lot sold with the net sales proceeds.
Federal Income Taxes:
It is the Fund's policy to continue to qualify as a regulated investment company by complying with the provisions available to certain investment companies, as defined in applicable sections of the Internal
23
USAA Mutual Funds Trust | Notes to Financial Statements — continued March 31, 2020 | ||||||
Revenue Code, and to make distributions of net investment income and net realized gains sufficient to relieve it from all, or substantially all, federal income taxes. Accordingly, no provision for federal income taxes is required in the financial statements. The Fund has a tax year end of March 31.
Management of the Fund has reviewed tax positions taken in tax years that remain subject to examination by all major tax jurisdictions, including federal (i.e., the last four tax years which includes the current fiscal tax year end). Management believes that there is no tax liability resulting from unrecognized tax benefits related to uncertain tax positions taken.
Allocations:
Expenses directly attributable to the Fund are charged to the Fund, while expenses that are attributable to more than one fund in the Trust, or jointly with an affiliated trust, are allocated among the respective funds in the Trust and/or affiliated trust based upon net assets or another appropriate basis.
Cross-Trade Transactions:
Pursuant to Rule 17a-7 under the 1940 Act, the Fund may engage in cross-trades which are securities transactions with affiliated investment companies and advisory accounts managed by the Adviser and any applicable sub-adviser. Any such purchase or sale transaction must be effected without brokerage commission or other remuneration, except for customary transfer fees. The transaction must be effected at the current market price, which is either the security's last sale price on an exchange or, if there are no transactions in the security that day, at the average of the highest bid and lowest asked price. For the year ended March 31, 2020, the Fund engaged in the following securities transactions with affiliated funds, which resulted in the following net realized gains (losses) (amounts in thousands):
| Purchases | Sales | Net Realized Gains (Losses) | |||||||||
| $ | 57,285 | $ | 67,650 | $ | — | ||||||
Fees Paid Indirectly:
Expense offsets to custody fees that arise from credits on cash balances maintained on deposit are reflected on the Statement of Operations, as applicable, as "Fees paid indirectly."
3. Fees and Transactions with Affiliates and Related Parties:
Investment Advisory and Management Fees:
Effective with the Transaction on July 1, 2019, investment advisory services are provided to the Fund by the Adviser, a New York corporation registered as an investment adviser with the Securities and Exchange Commission ("SEC"). The Adviser is a wholly-owned indirect subsidiary of Victory Capital Holdings, Inc., a publicly traded Delaware corporation, and a wholly-owned direct subsidiary of Victory Capital Operating, LLC. Under the terms of the Investment Advisory Agreement, the Adviser is entitled to receive a base fee accrued daily and paid monthly at an annualized rate of 0.28% of the Fund's average daily net assets. The amount incurred and paid to VCM from July 1, 2019 through March 31, 2020, are $2,984 thousand and is reflected on the Statement of Operations as Investment Advisory fees.
Prior to the Transaction on July 1, 2019, AMCO provided investment management services to the Fund pursuant to an Advisory Agreement. Under this agreement, AMCO was responsible for managing the business and affairs of the Fund, and for directly managing day-to-day investment of the Fund's assets, subject to the authority of and supervision by the Board. The Fund's investment management fee was accrued daily and paid monthly at an annualized rate of 0.28% of the Fund's average daily net assets. The amount incurred and paid to AMCO from April 1, 2019 through June 30, 2019, are $1,087 thousand and is reflected on the Statement of Operations as Investment Advisory fees.
24
USAA Mutual Funds Trust | Notes to Financial Statements — continued March 31, 2020 | ||||||
Administration and Servicing Fees:
Effective with the Transaction on July 1, 2019, VCM serves as the Fund's administrator and fund accountant. Under the Fund Administration, Servicing and Accounting Agreement, VCM is paid for its services an annual fee at a rate of 0.10% of average daily net assets. Amounts incurred from July 1, 2019 through March 31, 2020, are $1,066 thousand and reflected on the Statement of Operations as Administration fees.
Prior to the Transaction on July 1, 2019, AMCO provided certain administration and servicing functions for the Fund. For such services, AMCO received a fee accrued daily and paid monthly at an annualized rate of 0.10% of average daily net assets. Amounts incurred from April 1, 2019 through June 30, 2019, were $388 and reflected on the Statement of Operations as Administration fees.
Effective with the Transaction on July 1, 2019, the Fund (as part of the Trust) has entered into an agreement to provide compliance services with the Adviser, pursuant to which the Adviser furnishes its compliance personnel, including the services of the Chief Compliance Officer ("CCO"), and other resources reasonably necessary to provide the Trust with compliance oversight services related to the design, administration and oversight of a compliance program for the Trust in accordance with Rule 38a-1 under the 1940 Act. The CCO is an employee of the Adviser, which pays the compensation of the CCO and support staff. Funds in the Trust, Victory Variable Insurance Funds, Victory Portfolios and Victory Portfolios II (collectively, the "Victory Funds Complex") in the aggregate, compensate the Adviser for these services. Amounts incurred during the period from July 1, 2019 to March 31, 2020 are reflected on the Statement of Operations as Compliance fees.
Effective with the Transaction on July 1, 2019, Citi Fund Services Ohio, Inc. ("Citi"), an affiliate of Citibank, acts as sub-administrator and sub-fund accountant to the Fund pursuant to a Sub- Administration and Sub-Fund Accounting Services Agreement between VCM and Citi. VCM pays Citi a fee for providing these services. The Trust reimburses VCM and Citi for all of their reasonable out-of- pocket expenses incurred in providing these services and certain other expenses specifically allocated to the Funds, under the Fund Administration, Servicing, and Accounting Agreement. The amount incurred during the period from July 1, 2019 through March 31, 2020, is reflected on the Statement of Operations as Sub-Administration fees.
In addition to the services provided under its Administration and Servicing Agreement with the Fund, AMCO also provided certain compliance and legal services for the benefit of the Fund prior to the Transaction on July 1, 2019. The Board approved the reimbursement of a portion of these expenses incurred by AMCO. Amounts reimbursed by the Fund to AMCO for these compliance and legal services are presented on the Statement of Operations as Professional fees.
Transfer Agency Fees:
Effective with the Transaction on July 1, 2019, Victory Capital Transfer Agency, Inc. ("VCTA"), (formerly, USAA Shareholder Account Services ("SAS")), an affiliate of the Adviser provides transfer agency services to the Fund. Fees for these services are accrued daily and paid monthly at an annualized rate of 0.15% of the Fund's average daily net assets. VCTA pays a portion of these fees to certain intermediaries for the administration and servicing of accounts that are held with such intermediaries. Amounts incurred and paid to VCTA from July 1, 2019 through March 31, 2020, was $1,600 thousand. Amounts incurred and paid to SAS from April 1, 2019 through June 30, 2019, was $582 thousand. These amounts are reflected on the Statement of Operations as Transfer agent fees.
Effective with the Transaction on July 1, 2019, FIS Investor Services LLC serves as sub-transfer agent and dividend disbursing agent for the Fund pursuant to a Sub-Transfer Agent agreement between VCTA and FIS Investor Services LLC. VCTA provides FIS Investor Services LLC a fee for providing these services.
25
USAA Mutual Funds Trust | Notes to Financial Statements — continued March 31, 2020 | ||||||
Distributor/Underwriting services:
Effective with the Transaction on July 1, 2019, Victory Capital Advisers, Inc. (the "Distributor"), an affiliate of the Adviser, serves as distributor for the continuous offering of the shares of the Fund pursuant to a Distribution Agreement between the Distributor and the Trust. Effective on or about June 30, 2020, the Distributor's name will change to Victory Capital Services, Inc.
Prior to the Transaction on July 1, 2019, USAA Investment Management Company provided exclusive underwriting and distribution of the Fund's shares on a continuing best-efforts basis.
Other Fees:
Prior to the Transaction on July 1, 2019, State Street Bank and Trust Company served as the Fund's accounting agent and custodian.
Effective August 5, 2019, Citibank, N.A., serves as the Fund's custodian.
K&L Gates LLP provides legal services to the Trust.
Effective with the Transaction on July 1, 2019, the Adviser has entered into an expense limitation agreement with the Fund until at least June 30, 2021. Under the terms of the agreement, the Adviser has agreed to waive fees or reimburse certain expenses to the extent that ordinary operating expenses incurred by the Fund in any fiscal year exceed the expense limit for the Fund. Such excess amounts will be the liability of the Adviser. Interest, taxes, brokerage commissions, other expenditures which are capitalized in accordance with GAAP, and other extraordinary expenses not incurred in the ordinary course of the Fund's business are excluded from the expense limit. Effective July 1, 2019 through March 31, 2020, the expense limit (excluding voluntary waivers) is 0.56%.
Under this expense limitation agreement, the Fund has agreed to repay fees and expenses that were waived or reimbursed by the Adviser for a period up to three years after the fiscal year in which the waiver or reimbursement took place, subject to the lesser of any operating expense limits in effect at the time of: (a) the original waiver or expense reimbursement; or (b) the recoupment, after giving effect to the recoupment amount. As of March 31, 2020, the following amounts are available to be repaid to the Adviser (amounts in thousands).
| Expires 03/31/2023 | |||
$ | 19 | ||
The Adviser, may voluntarily waive or reimburse additional fees to assist the Fund in maintaining competitive expense ratios. Voluntary waivers and reimbursements applicable to the Fund are not available to be recouped at a future time. There were no voluntary waivers or reimbursements for the year ended March 31, 2020.
Effective March 23, 2020 the Adviser agreed to further reimburse fees in excess of the Fund's expense limit agreement of 0.56% dated July 1, 2019. These voluntary reductions, to the extent necessary, are to maintain a certain minimum net yield of the Fund. Under this agreement to reimburse additional fees, the Fund has agreed to repay fees and expenses that were waived or reimbursed by the Adviser for a period up to three years after the fiscal year in which the waiver or reimbursement took place, to the extent any repayments would not cause the Fund's net yield to fall below the Fund's minimum yield at the time of: (a) the original waiver or expense reimbursement; or (b) the expense limit in effect at the time of the extra waiver. As of March 31, 2020, there were no amounts available to be repaid to the Adviser under this agreement.
Certain officers and/or interested trustees of the Fund are also officers and/or employees of the Adviser, Administrator, Sub-Administrator, Sub-Fund Accountant, and Legal.
4. Risks:
The Fund may be subject to other risks in addition to these identified risks.
The Fund may be subject to various risks as described in the Fund's prospectus. A widespread health crisis such as a global pandemic could cause substantial market volatility, exchange trading suspensions
26
USAA Mutual Funds Trust | Notes to Financial Statements — continued March 31, 2020 | ||||||
and closures, impact the ability to complete redemptions, and affect Fund performance. For example, the novel coronavirus disease (COVID-19) has resulted in significant disruptions to global business activity that may continue, worsen and/or trigger other factors impacting the liquidity or value of investments. The impact of health crises and other epidemics and pandemics may affect the global economy in ways that cannot necessarily be foreseen at the present time. Health crises may exacerbate other pre-existing political, social, and economic risks. Any such impact could adversely affect the Funds' performance, resulting in losses to your investment. For more information, please refer to the "Principal risks" section of the Fund's prospectus.
Although the Fund seeks to preserve the value of your investment at $1 per share, it cannot guarantee it will do so. The Fund may impose a fee upon the sale of your shares or may temporarily suspend your ability to sell shares if the Fund's liquidity falls below required minimums because of certain market conditions or other factors. The Fund's sponsor has no legal obligation to provide financial support to the Fund, and you should not expect that the sponsor will provide financial support to the Fund at any time.
Under applicable federal securities laws, the Fund qualifies as "retail" (retail money market funds) and is permitted to utilize amortized cost to value their portfolio securities and to transact at a stable $1 net asset value ("NAV") per share. The Fund operates as a retail money market fund in compliance with the requirements of Rule 2a-7.
In addition, as a retail money market fund, the Fund may impose liquidity fees on redemptions and/or temporarily suspend redemptions (gates) if the Fund's weekly liquid assets fall below certain thresholds, such as during times of market stress. The imposition of a liquidity fee would reduce the amount you would receive upon redemption of your shares of the Fund. The imposition of a redemption gate also would delay your ability to redeem your investments in the Fund.
The fixed-income securities held in the Fund's portfolio are subject to credit risk, which is the possibility that an issuer of a fixed-income security will fail to make timely interest and/or principal payments on its securities or that negative market perceptions of the issuer's ability to make such payments will cause the price of that security to decline. The Fund accepts some credit risk as a recognized means to enhance an investor's return. All fixed-income securities, varying from the highest quality to the very speculative, have some degree of credit risk. Fixed-income securities rated below investment grade, also known as "junk" or high-yield bonds, generally entail greater economic, credit, and liquidity risk than investment-grade securities. Their prices may be more volatile, especially during economic downturns, financial setbacks, or liquidity events.
The Fund also is subject to the possibility that the value of its investments will fluctuate because of changes in interest rates, changes in supply of and demand for tax-exempt securities, or other market factors. Decisions by the U.S. Federal Reserve regarding interest rate and monetary policy can have a significant effect on the value of debt securities as well as the overall strength of the U.S. economy. Precise interest rate predictions are difficult to make, and interest rates may change unexpectedly and dramatically in response to extreme changes in market or economic conditions. Interest rates have been unusually low in recent years in the U.S. and abroad, and central banks have reduced rates further in an effort to combat the economic effects of the COVID-19 pandemic. Extremely low or negative interest rates may become more prevalent or may not work as intended, and the impact on various markets that interest rate or other significant policy changes may have is unknown.
Some tax-exempt securities are subject to special risks due to their unique structure. For instance, variable-rate demand notes (VRDNs) generally are long-term municipal bonds combined with a demand feature, which represents the right to sell the instrument back to the remarketer or liquidity provider, usually a bank, for repurchase on short notice, normally one day or seven days. Because the demand feature is dependent upon the bank, the Fund will only purchase VRDNs of this type where it believes that the banks would be able to honor their guarantees on the demand feature. Some VRDNs, sometimes referred to as "structured instruments" or "synthetic instruments," are created by combining an intermediate- or long-term municipal bond with a right to sell the instrument back to the remarketer or liquidity provider for repurchase on short notice, referred to as a "tender option." However, the tender option usually is subject to a conditional guarantee, which means that the bank is not required to pay under the guarantee if there is a default by the municipality or if certain other events occur.
27
USAA Mutual Funds Trust | Notes to Financial Statements — continued March 31, 2020 | ||||||
Because there is the risk that the Fund will not be able to exercise the demand feature at all times, the Fund will not purchase a synthetic instrument of this type unless the Fund believes there is minimal risk that the Fund will not be able to exercise the tender option at all times. The Fund will not purchase a synthetic instrument unless counsel for the issuer has issued an opinion that interest paid on the instrument is entitled to tax-exempt treatment.
5. Line of Credit:
Effective with the Transaction on July 1, 2019, the Victory Funds Complex participates in a short-term, demand note "Line of Credit" agreement with Citibank. Under the agreement with Citibank, the Victory Funds Complex could borrow up to $600 million, of which $300 million is committed and $300 million is uncommitted. $40 million of the Line of Credit is reserved for use by the Victory Floating Rate Fund, another series of the Victory Funds Complex, with that Fund paying the related commitment fees for that amount. The purpose of the agreement is to meet temporary or emergency cash needs. Citibank receives an annual commitment fee of 0.15% on $300 million for providing the Line of Credit. Each fund in the Victory Funds Complex pays a pro-rata portion of the commitment fees plus any interest (one month LIBOR plus one percent) on amounts borrowed. Interest charged to the Fund, if any, during the period is presented on the Statement of Operations under line of credit fees.
Prior to the Transaction on July 1, 2019, the line of credit among the Trust, with respect to its funds, and USAA Capital Corporation ("CAPCO") terminated. For the period from April 1, 2019 to June 30, 2019, the Fund paid CAPCO facility fees of $3 thousand.
The average borrowing for the days outstanding and average interest rate for the Fund during the year ended March 31, 2020 were as follows (amounts in thousands):
| Amount Outstanding at March 31, 2020 | Average Borrowing* | Days Borrowings Outstanding | Average Interest Rate | Maximum Borrowing During the Period | |||||||||||||||
| $ | — | $ | 5,616 | 3 | 2.35 | % | 6,000 | ||||||||||||
* For the year ended March 31,2020, based on the number of days borrowings were outstanding.
6. Federal Income Tax Information:
The Fund intends to declare daily and distribute any net investment income monthly. Distributable net realized gains, if any, are declared and paid at least annually.
The amounts of dividends from net investment income and distributions from net realized gains (collectively distributions to shareholders) are determined in accordance with federal income tax regulations, which may differ from GAAP. To the extent these "book/tax" differences are permanent in nature (e.g., net operating loss and distribution reclassification,), such amounts are reclassified within the components of net assets based on their federal tax-basis treatment; temporary differences (e.g., wash sales) do not require reclassification. To the extent dividends and distributions exceed net investment income and net realized gains for tax purposes, they are reported as distributions of capital. Net investment losses incurred by the Fund may be reclassified as an offset to capital on the accompanying Statement of Assets and Liabilities.
As of March 31, 2020, on the Statement of Assets and Liabilities, there were no permanent book-to-tax difference reclassification adjustments.
28
USAA Mutual Funds Trust | Notes to Financial Statements — continued March 31, 2020 | ||||||
The tax character of distributions paid during the tax years ended as noted below were as follows (total distributions paid may differ from the Statement of Changes in Net Assets because, for tax purposes, dividends are recognized when actually paid) (amounts in thousands):
Year Ended March 31, 2020 | Year Ended March 31, 2019 | ||||||||||||||||||||||||||||||
Distributions paid from | Distributions paid from | ||||||||||||||||||||||||||||||
| Ordinary Income | Net Long-Term Capital Gains | Total Taxable Distributions | Tax-Exempt Income | Total Distributions Paid | Tax-Exempt Income | Total Distributions Paid | |||||||||||||||||||||||||
$ | 202 | $ | 32 | $ | 234 | $ | 15,010 | $ | 15,244 | $ | 17,599 | $ | 17,599 | ||||||||||||||||||
As of the tax year ended March 31, 2020, the components of accumulated earnings (deficit) on a tax basis were as follows (amounts in thousands):
| Undistributed Ordinary Income | Undistributed Tax Exempt Income | Undistributed Long-Term Capital Gains | Distributions Payable | Total Accumulated Earnings (Deficit) | |||||||||||||||
| $ | 75 | $ | 2,783 | $ | 101 | $ | (2,739 | ) | $ | 220 | |||||||||
At March 31, 2020, the Fund had no net capital loss carryforwards for federal income tax purposes.
As of March 31, 2020, the cost basis for federal income tax purposes, gross unrealized appreciation, gross unrealized depreciation, and net unrealized appreciation (depreciation) for investments were as follows (amounts in thousands):
| Cost of Investments for Federal Tax Purposes | Gross Unrealized Appreciation | Gross Unrealized Depreciation | Net Unrealized Appreciation (Depreciation) | ||||||||||||
| $ | 1,322,467 | $ | — | $ | — | $ | — | ||||||||
7. Liquidity Risk Management Program:
The USAA Funds have adopted and implemented a written liquidity risk management program (the "LRMP") as required by Rule 22e-4 under the Investment Company Act of 1940, as amended. The LRMP is reasonably designed to assess and manage the Fund's liquidity risk, taking into consideration the Fund's investment strategy and the liquidity of its portfolio investments during normal and reasonably foreseeable stressed market conditions; its short and long-term cash flow projections; and its cash holdings and access to other liquidity management tools such as available funding sources including the Victory Funds Complex Interfund Lending Facility and Line of Credit (discussed in the Notes to Financial Statements). The USAA Funds' Board of Trustees approved the appointment of the Fund's investment adviser, Victory Capital Management Inc. ("Victory Capital"), as the administrator of the LRMP. At an in-person meeting held on February 26, 2020, Victory Capital provided an oral and written report to the Trustees on the operation and effectiveness of the LRMP during the previous year.
Victory Capital manages liquidity risks associated with the Fund's investments by monitoring, among other things, cash and cash equivalents, any use of derivatives, the concentration of investments, the appropriateness of the Fund's investment strategy, and by classifying every fund investment as either highly liquid, moderately liquid, less liquid or illiquid on at least a monthly basis. To assist with the classification of Fund investments, Victory Capital has retained a third-party provider of liquidity evaluation services. This provider determines preliminary liquidity classifications for all portfolio holdings based upon portfolio-level data and certain assumptions provided by Victory Capital. Victory Capital reviews the preliminary liquidity classifications, and, when appropriate, considers other information including input from the Fund's portfolio managers (including the portfolio managers employed by any investment sub-advisers) in determining final liquidity classifications.
29
USAA Mutual Funds Trust | Notes to Financial Statements — continued March 31, 2020 | ||||||
The report from Victory Capital concluded that the Fund did not experience any significant liquidity challenges during the covered period, and the Fund's LRMP is reasonably designed to assess and manage its liquidity risk. The report also concluded that the LRMP continues to operate adequately and effectively to enable Victory Capital to oversee and manage liquidity risk and ensure the Fund is able to meet redemption requests without significant dilution to the remaining investors' interest in the Fund. During the review period, the Fund's portfolio consisted primarily of highly liquid investments, which are defined as cash and any investments reasonably expected to be converted to cash in current market conditions in three business days or less without significantly changing the market value of the investment. Therefore, the Fund has not adopted a Highly Liquid Investment Minimum. The Fund's investments were below the limitation on illiquid investments during the review period. Additionally, Victory Capital indicated that no events occurred that would require the filing of Form N-LIQUID and recommended no material changes to the LRMP.
8. Subsequent Events:
An outbreak of respiratory disease called COVID-19 was first detected in China in December 2019 and subsequently spread internationally. The transmission of COVID-19 and efforts to contain its spread have resulted in international, national and local border closings and other significant travel restrictions and disruptions, significant disruptions to business operations, supply chains and consumer activity, significant challenges in healthcare service preparation and delivery, and quarantines, as well as general concern and uncertainty that has negatively affected the economic environment and that occurred subsequent to year end may have a significant negative impact on the operations and profitability of the Funds' investments. These impacts have caused significant volatility and declines in global financial markets, which have caused losses for investors. The impact of the COVID-19 pandemic may be short term or may last for an extended period of time, and in either case could result in a substantial economic downturn or recession. Public health crises may exacerbate other pre-existing political, social, economic, market and financial risks. The extent of the impact to the financial performance of the Funds' investments will depend on future developments, including (i) the duration and spread of the outbreak, (ii) the restrictions and advisories, (iii) the effects on the financial markets, and (iv) the effects on the economy overall, all of which are highly uncertain and cannot be predicted.
The Fund has been notified by an omnibus account holder of its intent to redeem its entire position subsequent to year-end, which represents approximately 40-50 percent of the Fund. Management expects this redemption will occur on or about May 27, 2020.
30
REPORT OF INDEPENDENT REGISTERED PUBLIC ACCOUNTING FIRM
To the Shareholders and the Board of Trustees of USAA Tax Exempt Money Market Fund:
Opinion on the Financial Statements
We have audited the accompanying statement of assets and liabilities of USAA Tax Exempt Money Market Fund (the "Fund") (one of the funds constituting USAA Mutual Funds Trust (the "Trust")), including the schedule of portfolio investments, as of March 31, 2020, and the related statement of operations for the year then ended, the statements of changes in net assets for each of the two years in the period then ended, the financial highlights for each of the five years in the period then ended and the related notes (collectively referred to as the "financial statements"). In our opinion, the financial statements present fairly, in all material respects, the financial position of the Fund at March 31, 2020, the results of its operations for the year then ended, the changes in its net assets for each of the two years in the period then ended, and its financial highlights for each of the five years in the period then ended, in conformity with U.S. generally accepted accounting principles.
Basis for Opinion
These financial statements are the responsibility of the Trust's management. Our responsibility is to express an opinion on the Fund's financial statements based on our audits. We are a public accounting firm registered with the Public Company Accounting Oversight Board (United States) ("PCAOB") and are required to be independent with respect to the Trust in accordance with the U.S. federal securities laws and the applicable rules and regulations of the Securities and Exchange Commission and the PCAOB.
We conducted our audits in accordance with the standards of the PCAOB. Those standards require that we plan and perform the audit to obtain reasonable assurance about whether the financial statements are free of material misstatement, whether due to error or fraud. The Trust is not required to have, nor were we engaged to perform, an audit of the Trust's internal control over financial reporting. As part of our audits we are required to obtain an understanding of internal control over financial reporting, but not for the purpose of expressing an opinion on the effectiveness of the Trust's internal control over financial reporting. Accordingly, we express no such opinion.
Our audits included performing procedures to assess the risks of material misstatement of the financial statements, whether due to error or fraud, and performing procedures that respond to those risks. Such procedures included examining, on a test basis, evidence regarding the amounts and disclosures in the financial statements. Our procedures included confirmation of securities owned as of March 31, 2020, by correspondence with the custodian. Our audits also included evaluating the accounting principles used and significant estimates made by management, as well as evaluating the overall presentation of the financial statements. We believe that our audits provide a reasonable basis for our opinion.

We have served as the auditor of one or more Victory Capital investment companies since 1995.
San Antonio, Texas
May 27, 2020
31
USAA Mutual Funds Trust | Supplemental Information March 31, 2020 | ||||||
(Unaudited)
Expense Examples
As a shareholder of the Fund, you may incur two types of costs: (1) transaction costs, and (2) ongoing costs, including management fees and other Fund expenses. These examples are intended to help you understand your ongoing costs (in dollars) of investing in the Fund and to compare these costs with the ongoing costs of investing in other mutual funds.
These examples are based on an investment of $1,000 invested at the beginning of the period and held for the entire period from October 1, 2019, through March 31, 2020.
The Actual Expense figures in the table below provide information about actual account values and actual expenses. You may use the information below, together with the amount you invested, to estimate the expenses that you paid over the period. Simply divide your account value by $1,000 (for example, an $8,600 account value divided by $1,000 = 8.6), then multiply the result by the number in the table under the heading entitled "Actual Expenses Paid During Period" to estimate the expenses you paid on your account during this period.
The Hypothetical Expense figures in the table below provide information about hypothetical account values and hypothetical expenses based on the Fund's actual expense ratio and an assumed rate of return of 5% per year before expenses, which is not the Fund's actual return. The hypothetical account values and expenses may not be used to estimate the actual ending account balance or expenses you paid for the period. You may use this information to compare this 5% hypothetical example with the 5% hypothetical examples that appear in shareholder reports of other funds.
Please note the expenses shown in the table below are meant to highlight your ongoing costs only and do not reflect any transactional costs. If these transactional costs were included, your costs would have been higher.
| Beginning Account Value 10/1/19 | Actual Ending Account Value 3/31/20 | Hypothetical Ending Account Value 3/31/20 | Actual Expenses Paid During Period 10/1/19- 3/31/20* | Hypothetical Expenses Paid During Period 10/1/19- 3/31/20* | Annualized Expense Ratio During Period 10/1/19- 3/31/20 | ||||||||||||||||||
$ | 1,000.00 | $ | 1,005.10 | $ | 1,022.20 | $ | 2.81 | $ | 2.83 | 0.56 | % | ||||||||||||
* Expenses are equal to the average account value multiplied by the Fund's annualized expense ratio multiplied by 183/366 (the number of days in the most recent fiscal half-year divided by the number of days in the fiscal year).
Proxy Voting
Proxy Voting:
Information regarding the policies and procedures the Fund uses to determine how to vote proxies relating to portfolio securities is available without charge, upon request, by calling (800) 539-3863. The information is also included in the Fund's Statement of Additional Information, which is available on the SEC's website at www.sec.gov.
Information relating to how the Fund voted proxies relating to portfolio securities held during the most recent 12 months ended June 30 is available on the SEC's website at www.sec.gov.
32
USAA Mutual Funds Trust | Supplemental Information — continued March 31, 2020 | ||||||
(Unaudited)
Trustee and Officer Information
Board of Trustees:
Overall responsibility for management of the Trust rests with the Board. The Trust is managed by the Board in accordance with the laws of the state of Delaware. There are currently 10 Trustees, eight of whom are not "interested persons" of the Trust within the meaning of that term under the 1940 Act ("Independent Trustees") and two of whom is an "interested person" of the Trust within the meaning of that term under the 1940 Act ("Interested Trustee"). The Trustees, in turn, elect the officers of the Trust to actively supervise its day-to-day operations.
The following tables list the Trustees, their ages, position with the Trust, commencement of service, principal occupations during the past five years and any directorships of other investment companies or companies whose securities are registered under the Securities Exchange Act of 1934, as amended, or who file reports under that Act. Each Trustee oversees 47 portfolios in the Trust. Each Trustee's address is 15935 La Cantera Pkwy, Building Two, San Antonio, TX, 78256. Pursuant to a policy adopted by the Board, the term of office for each Trustee shall be until the Independent Trustee reaches age 75 or an Interested Trustee reaches age 75. The Board may change or grant exceptions from this policy at any time without shareholder approval. A Trustee may resign or be removed by a vote of the other Trustees or the holders of a majority of the outstanding shares of the Trust at any time. Vacancies on the Board can be filled by the action of a majority of the Trustees, provided that after filling such vacancy at least two-thirds of the Trustees have been elected by the shareholders.
Name and Date of Birth | Position Held with the Trust | Year Commenced Service | Principal Occupation During Past 5 Years | Other Directorships Held During Past 5 Years | |||||||||||||||
Independent Trustees. | |||||||||||||||||||
| Jefferson C. Boyce, Born September 1957 | Lead Independent Trustee, and Vice Chairman | 2013 | Senior Managing Director, New York Life Investments, LLC (1992-2012) | Westhab, Inc. | |||||||||||||||
| John C. Walters, Born February 1962 | Trustee | 2019 | Retired. Mr. Walters brings significant Board experience including active involvement with the board of a Fortune 500 company, and a proven record of leading large, complex financial organizations. He has a demonstrated record of success in distribution, manufacturing, investment brokerage, and investment management in both the retail and institutional investment businesses. He has substantial experience in the investment management business with a demonstrated ability to develop and drive strategy while managing operation, financial, and investment risk. | Guardian Variable Products Trust (16 series), Lead Independent Director; Amerilife Holdings LLC, Director; Stadion Money Management; Director; University of North Carolina (Chapel Hill), Member Board of Governors. | |||||||||||||||
33
USAA Mutual Funds Trust | Supplemental Information — continued March 31, 2020 | ||||||
(Unaudited)
Name and Date of Birth | Position Held with the Trust | Year Commenced Service | Principal Occupation During Past 5 Years | Other Directorships Held During Past 5 Years | |||||||||||||||
| Robert L. Mason, Ph.D., Born July 1946 | Trustee | 1997 | Adjunct Professor in the Department of Management Science and Statistics in the College of Business at the University of Texas at San Antonio (since 2001); Institute Analyst, Southwest Research Institute (March 2002-January 2016) | None | |||||||||||||||
| Dawn M. Hawley, Born February 1954 | Trustee | 2014 | Manager of Finance, Menil Foundation, Inc. (May 2007-June 2011), which is a private foundation that oversees the assemblage of sculptures, prints, drawings, photographs, and rare books. Director of Financial Planning and Analysis and Chief Financial Officer, AIM Management Group, Inc. (October 1987-January 2006) | None | |||||||||||||||
| Paul L. McNamara, Born July 1948 | Trustee | 2012 | Director, Cantor Opportunistic Alternatives Fund, LLC (March 2010-February 2014) , which is a closed-end fund of funds by Cantor Fitzgerald Investment Advisors, LLC | None | |||||||||||||||
34
USAA Mutual Funds Trust | Supplemental Information — continued March 31, 2020 | ||||||
(Unaudited)
Name and Date of Birth | Position Held with the Trust | Year Commenced Service | Principal Occupation During Past 5 Years | Other Directorships Held During Past 5 Years | |||||||||||||||
| Richard Y. Newton III, Born January 1956 | Trustee | 2017 | Director, Elta North America (01/18-present), which is a global leader in the design, manufacture, and support of innovative electronic systems in the ground, maritime, airborne, and security domains for the nation's warfighters, security personnel, and first responders; Managing Partner, Pioneer Partnership Development Group (December 2015-present)); Executive Director, The Union League Club of New York (June 2014-November 2015): Executive Vice President, Air Force Association (August 2012-May 2014); Lieutenant General, United States Air Force (January 2008-June 2012) | None | |||||||||||||||
| Barbara B. Ostdiek, Ph.D., Born March 1964 | Trustee | 2008 | Senior Associate Dean of Degree Programs at Jesse H. Jones Graduate School of Business at Rice University (since 2013); Associate Professor of Finance at Jessie H. Jones Graduate School of Business at Rice University (since 2001) | None | |||||||||||||||
| Michael F. Reimherr, Born August 1945 | Trustee | 2000 | President of Reimherr Business Consulting (May 1995-December 2017); St. Mary's University Investment Committee overseeing University Endowment (since 2014) | None | |||||||||||||||
35
USAA Mutual Funds Trust | Supplemental Information — continued March 31, 2020 | ||||||
(Unaudited)
Name and Date of Birth | Position Held with the Trust | Year Commenced Service | Principal Occupation During Past 5 Years | Other Directorships Held During Past 5 Years | |||||||||||||||
Interested Trustees. | |||||||||||||||||||
| David C. Brown, ** Born May 1972 | Trustee | 2019 | Chairman and Chief Executive Officer (since 2013), Co-Chief Executive Officer (2011-2013), Victory Capital Management Inc.; Chairman and Chief Executive Officer, Victory Capital Holdings, Inc. (since 2013). Mr. Brown brings to the Board extensive business, finance and leadership skills gained and developed through years of experience in the financial services industry, including his tenure overseeing the strategic direction as CEO of Victory Capital. These skills, combined with Mr. Brown's extensive knowledge of the financial services industry and demonstrated success in the development and distribution of investment strategies and products, enable him to provide valuable insights to the Board and strategic direction for the Funds | Trustee, Victory Portfolios (42 series), Victory Portfolios II (26 series), Victory Variable Insurance Funds (9 series) | |||||||||||||||
36
USAA Mutual Funds Trust | Supplemental Information — continued March 31, 2020 | ||||||
(Unaudited)
Name and Date of Birth | Position Held with the Trust | Year Commenced Service | Principal Occupation During Past 5 Years | Other Directorships Held During Past 5 Years | |||||||||||||||
| Daniel S. McNamara, ** Born June 1966 | Trustee and Chair of the Board of Trustees | 2012 | Trustee, President, and Vice Chairman of USAA ETF Trust (June 2017-June 2019); President of Financial Advice & Solutions Group (FASG), USAA (since 2013); Director, IMCO (September 2009-April 2014); President, AMCO (August, 2011-April 2013); Senior Vice President of USAA Financial Planning Services Insurance Agency, Inc. (FPS) (since 2011); Director of USAA Investment Management Company (IMCO) (since 2009); Chairman of Board of IMCO (since 2013); Director of USAA Asset Management Company (AMCO), (August 2011-June 2019); President and Director of USAA Shareholder Account Services (SAS)(October 2009-June 2019); Director and Vice Chairman of FPS (since 2013); President and Director of USAA Investment Corporation (ICORP) (since 2010); Chairman of Board of ICORP (since 2013); Director of USAA Financial Advisors, Inc. (FAI) (since 2013); Chairman of Board of FAI (since 2015). Mr. McNamara brings to the Board extensive experience in the financial services industry, including experience as an officer of the Trust. | None | |||||||||||||||
** Mr. McNamara and Mr. Brown are "Interested Persons" by reason of their relationships with the Adviser.
The Statement of Additional Information includes additional information about the Trustees of the Trust and is available, without charge, on the SEC's website at www.sec.gov and/or by calling (800)-539-3863.
37
USAA Mutual Funds Trust | Supplemental Information — continued March 31, 2020 | ||||||
(Unaudited)
Officers:
The officers of the Trust, their ages, commencement of service and their principal occupations during the past five years, are detailed in the following table. Each officer serves until the earlier of his or her resignation, removal, retirement, death, or the election of a successor. The mailing address of each officer of the Trust is 15935 La Cantera Pkwy, Building Two, San Antonio, TX, 78256. The officers of the Trust receive no compensation directly from the Trust for performing the duties of their offices.
Name and Date of Birth | Position with the Trust | Year Commenced Service | Principal Occupation During Past 5 Years | ||||||||||||
Interested Officers. | |||||||||||||||
| Christopher K. Dyer, Born February 1962 | President | 2019 | Director of Fund Administration, Victory Capital (2004-present) | ||||||||||||
| Scott A Stahorsky, Born July 1969 | Vice President | 2019 | Manager, Fund Administration, Victory Capital (since 2015); Senior Analyst, Fund Administration, Victory Capital (prior to 2015) | ||||||||||||
| James K. De Vries, Born April 1969 | Treasurer, Principal Financial Officer | 2018 | Executive Director, Victory Capital Management Inc. (since 2019); Treasurer, USAA ETF Trust (September 2018-June 2019); Executive Director, Investment and Financial Administration, USAA (April 2012-June 2019); Assistant Treasurer, USAA ETF Trust (June 2017-September 2018); Assistant Treasurer, USAA Mutual Funds Trust (December 2013-February 2018) | ||||||||||||
| Allan Shaer, Born March 1965 | Assistant Treasurer | 2019 | Senior Vice President, Financial Administration, Citi Fund Services Ohio, Inc. (since 2016); Vice President, Mutual Fund Administration, JP Morgan Chase (2011-2016) | ||||||||||||
| Carol D. Trevino, Born October 1965 | Assistant Treasurer | 2018 | Director, Accounting and Finance, Victory Capital Management Inc. (since 2019); Accounting/Financial Director, USAA (December 2013-June 2019); Assistant Treasurer, USAA ETF Trust (September 2018-June 2019). | ||||||||||||
| Erin G. Wagner, Born February 1974 | Secretary | 2019 | Deputy General Counsel, the Adviser (since 2013) | ||||||||||||
| Charles Booth, Born April 1960 | Anti-Money Laundering Compliance Officer and Identity Theft Officer | 2019 | Director, Regulatory Administration and CCO Support Services, Citi Fund Services Ohio, Inc. (2007-present) | ||||||||||||
| Amy Campos, Born July 1976 | Chief Compliance Officer | 2019 | Chief Compliance Officer, USAA Mutual Funds Trust (since 2019); Executive Director, Deputy Chief Compliance Officer, USAA Mutual Funds Trust and USAA ETF Trust (July 2017-June 2019); Compliance Director, USAA Mutual Funds Trust (2014-July 2017) | ||||||||||||
38
USAA Mutual Funds Trust | Supplemental Information — continued March 31, 2020 | ||||||
(Unaudited)
Additional Federal Income Tax Information
The following federal tax information related to the Fund's fiscal year ended March 31, 2020, is provided for information purposes only and should not be used for reporting to federal or state revenue agencies. Federal tax information for the calendar year will be reported to you on Form 1099-DIV in January 2021.
With respect to distributions paid, the Fund designates the following amounts (or, if subsequently determined to be different, the maximum amount allowable) for the fiscal year ended March 31, 2020 (amounts in thousands):
| Short-Term Capital Gain Distributions(1) | Long-Term Capital Gain Distributions(1) | Tax Exempt Income(2) | |||||||||||||
$ | 202 | $ | 32 | 100 | % | ||||||||||
(1) Pursuant to Section 852 of the Internal Revenue Code.
(2) Presented as a percentage of net investment income and excludes short-term capital gain distributions paid, if any. All or a portion of these amounts may be exempt from taxation at the state level.
39
Privacy Policy
Protecting the Privacy of Information
The Trust respects your right to privacy. We also know that you expect us to conduct and process your business in an accurate and efficient manner. To do so, we must collect and maintain certain personal information about you. This is the information we collect from you on applications or other forms, and from the transactions you make with us or third parties. It may include your name, address, social security number, account transactions and balances, and information about investment goals and risk tolerance.
We do not disclose any information about you or about former customers to anyone except as permitted or required by law. Specifically, we may disclose the information we collect to companies that perform services on our behalf, such as the transfer agent that processes shareholder accounts and printers and mailers that assist us in the distribution of investor materials. We may also disclose this information to companies that perform marketing services on our behalf. This allows us to continue to offer you Victory investment products and services that meet your investing needs, and to effect transactions that you request or authorize. These companies will use this information only in connection with the services for which we hired them. They are not permitted to use or share this information for any other purpose.
To protect your personal information internally, we permit access only by authorized employees and maintain physical, electronic and procedural safeguards to guard your personal information.*
* You may have received communications regarding information about privacy policies from other financial institutions which gave you the opportunity to "opt-out" of certain information sharing with companies which are not affiliated with that financial institution. The Trust does not share information with other companies for purposes of marketing solicitations for products other than the Trust. Therefore, the Trust does not provide opt-out options to their shareholders.
15935 La Cantera Pkwy
Building Two
San Antonio, Texas 78256

Visit our website at: | Call | ||||||
usaa.com | (800) 235-8396 | ||||||
40859-0520

MARCH 31, 2020
Annual Report
USAA Tax Exempt Short-Term Fund
Beginning January 1, 2021, as permitted by regulations adopted by the Securities and Exchange Commission, paper copies of the Fund's shareholder reports like this one will no longer be sent by mail, unless you specifically request paper copies of the reports from the Fund or from your financial intermediary, such as a broker-dealer or bank. Instead, the reports will be made available on usaa.com, and you will be notified by mail each time a report is posted and provided with a website link to access the report.
If you already elected to receive shareholder reports electronically, you will not be affected by this change and you need not take any action. You may elect to receive shareholder reports and other communications from the Fund or your financial intermediary electronically by notifying your financial intermediary directly, or if you are a direct investor, by calling (800) 235-8396 or logging on to usaa.com.
You may elect to receive all future reports in paper free of charge. You can inform the Fund or your financial intermediary that you wish to continue receiving paper copies of your shareholder reports by notifying your financial intermediary directly, or if you are a direct investor, by calling (800) 235-8396 or logging on to usaa.com. Your election to receive reports in paper will apply to all funds held with the USAA family of funds or your financial intermediary.
Victory Capital means Victory Capital Management Inc., the investment adviser of the USAA Mutual Funds. USAA Mutual Funds are distributed by Victory Capital Services, Inc., member FINRA, an affiliate of Victory Capital. Victory Capital and its affiliates are not affiliated with United Services Automobile Association or its affiliates. USAA and the USAA logo are registered trademarks and the USAA Mutual Funds and USAA Investments logos are trademarks of United Services Automobile Association and is being used by Victory Capital and its affiliates under license.
USAA Mutual Funds Trust
TABLE OF CONTENTS
Shareholder Letter (Unaudited) | 2 | ||||||
Managers' Commentary (Unaudited) | 4 | ||||||
Investment Overview (Unaudited) | 6 | ||||||
| Investment Objective & Portfolio Holdings (Unaudited) | 8 | ||||||
Financial Statements | |||||||
Schedule of Portfolio Investments | 10 | ||||||
Statement of Assets and Liabilities | 23 | ||||||
Statement of Operations | 24 | ||||||
Statements of Changes in Net Assets | 25 | ||||||
Financial Highlights | 26 | ||||||
Notes to Financial Statements | 28 | ||||||
| Report of Independent Registered Public Accounting Firm | 39 | ||||||
Supplemental Information (Unaudited) | 40 | ||||||
Expense Example | 40 | ||||||
Proxy Voting and Portfolio Holdings Information | 40 | ||||||
Trustees' and Officers' Information | 41 | ||||||
Additional Federal Income Tax Information | 47 | ||||||
Privacy Policy (inside back cover) | |||||||
This report is for the information of the shareholders and others who have received a copy of the currently effective prospectus of the Fund, managed by Victory Capital Management Inc. It may be used as sales literature only when preceded or accompanied by a current prospectus, which provides further details about the Fund.
IRA DISTRIBUTION WITHHOLDING DISCLOSURE
We generally must withhold federal income tax at a rate of 10% of the taxable portion of your distribution and, if you live in a state that requires state income tax withholding, at your state's tax rate. However, you may elect not to have withholding apply or to have income tax withheld at a higher rate. Any withholding election that you make will apply to any subsequent distribution unless and until you change or revoke the election. If you wish to make a withholding election, or change or revoke a prior withholding election, call (800) 235-8396.
If you do not have a withholding election in place by the date of a distribution, federal income tax will be withheld from the taxable portion of your distribution at a rate of 10%. If you must pay estimated taxes, you may be subject to estimated tax penalties if your estimated tax payments are not sufficient and sufficient tax is not withheld from your distribution.
For more specific information, please consult your tax adviser.
1
(Unaudited)
Dear Shareholder,
If there were ever a time that illustrated the dynamic and unpredictable nature of financial markets—and life in general—it would be the strange days of early 2020. The spread of COVID-19 throughout the United States and the world has been an unprecedented event that, among so many other impacts, rendered virtually any economic forecasts unreliable. Seemingly overnight, the sentiment pendulum swung from risk-on to risk-off. We all became familiar with unusual concepts like "social distancing" and "flattening the curve."
Given that wide swaths of the global economy came to an all-stop—an event that has no real precedent—there remains tremendous uncertainty as to the depth and extent of the economic downturn. Making assumptions about the extent of the virus' reach, its impact on consumer behavior and employment, and the speed at which the U.S. government and U.S. Federal Reserve (the "Fed") can revive the economy is educated guesswork at best.
Fortunately, it's not all bad news. We did see markets stabilize as this annual reporting period drew to a close (and in the early weeks of April immediately following). As of the writing of this letter, the array of new lending facilities and programs launched by the Fed generally appear to have had their intended effect of improving liquidity and trading, at least in the short-term. Credit spreads across corporate, high-yield, structured, and municipal bond markets were coaxed down from their highs. Trading in equity markets also appeared to stabilize.
The USAA tax-exempt funds generally performed as would be expected given the unusual market environment. Our tax-exempt funds tend to be more credit heavy, holding more BBB-category rated bonds than the average in our peer groups. Typically, we overweight these credits to provide additional tax-free income to our investors, and these securities tend to underperform in periods of market dislocation when credit spreads widen significantly.
We believe that the volatility in the tax-exempt market reflected the lack of liquidity, rather than any significant credit deterioration. It's important to underscore that the USAA tax-exempt funds entered the crisis with ample liquidity and none have yet had to sell portfolio securities at an inopportune price to achieve a fund's desired level of exposure.
Looking ahead, the economy and the markets remain unpredictable. Yet our investment philosophy—and our resolve—is steadfast. A priority of our fixed-income portfolio managers and analysts is to maintain substantial liquidity, as no one can predict when the crisis will abate and what liquidity needs might be in the meantime.
Through it all, we remain committed to our core competency of evaluating, taking and managing credit risk, and we continue to build portfolios bond-by-bond. We believe the recent environment, though breathtaking in its volatility, provides extraordinary buying opportunities that may help us lock in higher tax-free yields for our investors.
If you have questions about the current market dynamics or your specific portfolio or investment plan, please give one of our financial representatives a call. They can
2
help ensure that you are properly diversified based on your long-term goals, time horizon, and risk tolerance.
From all of us here at USAA Funds, thank you for letting us help you work toward your investment goals.

Christopher K. Dyer, CFA
President,
USAA Funds
3
USAA Mutual Funds Trust
USAA Tax Exempt Short-Term Fund
Manager's Commentary
(Unaudited)
Regina G. Conklin, CPA, CFA
John C. Bonnell, CFA
Andrew R. Hattman, CFA, CAIA
• What were the market conditions during the reporting period?
Tax-exempt bonds generated positive returns during the reporting period ended March 31, 2020, due in part to falling municipal bond yields. (Bond prices and yields move in opposite directions.) However, market conditions changed drastically during the reporting period.
For the first approximate11 months of the reporting period, tax-exempt bonds generated strong positive returns. In the second half of calendar year 2019, due to intensifying U.S.-China trade tensions and global economic weakness, the U.S. Federal Reserve (the "Fed") cut the target federal funds rate from a range of 2.25% - 2.50% to a target range of 1.50% - 1.75%. Municipal bond AAA rates followed suit by generally falling for the majority of the reporting period, reaching their lows on March 9, 2020. Tax-exempt bonds also benefited from supply-and-demand dynamics during the first approximate 11 months of the reporting period. Supply was tight, as new issuance failed to keep pace with demand. Demand was intense, as municipal bond mutual funds saw inflows every week during the reporting period up to early March. In late February and early March, as the emergence of a novel coronavirus ("COVID-19") raised fears about a potential U.S. economic slowdown, municipal bonds held up well compared to other segments of the fixed-income market.
That all changed on March 10, 2020. For the next 10 days, interest rates rose quickly and significantly along the municipal yield curve amid record outflows from municipal bond mutual funds. The trend reversed on March 20, and municipal bond yields fell sharply, finishing the reporting period below their starting points. Over this period, the 3-year AAA municipal bond rate started at 0.50% on March 9, rose to 2.75% on March 20, and fell to 1.11% on March 31 (after starting the reporting period at 1.54% on April 1, 2019). Municipal bond credit spreads (yield differentials between municipal bonds with similar maturities but different credit ratings) widened in March 2020, with spreads on lower-rated municipal securities widening the most. Rating agencies placed entire municipal bond sectors on credit watch because of a potential economic slowdown driven by the shutdowns, lockdowns, and self-quarantines that had been instituted to slow the spread of COVID-19. The Fed responded with unprecedented actions, slashing the target federal funds rate to a range of between zero and 0.25%, implementing quantitative easing and credit support programs, and offering assistance to state and municipal governments. The Fed also has said it will do what it takes to keep financial markets — including the municipal bond market — fully functioning.
4
USAA Mutual Funds Trust
USAA Tax Exempt Short-Term Fund (continued)
• How did the USAA Tax Exempt Short-Term Fund (the "Fund") perform during the reporting period?
The Fund has two share classes: Fund Shares and Adviser Shares. For the reporting period ended March 31, 2020, the Fund Shares and Adviser Shares had a total return of 0.23% and 0.09%, respectively, versus an average return of 1.17% amongst the funds in the Lipper Short Municipal Debt Funds category. This compares to returns of 1.04% for the Lipper Short Municipal Debt Funds Index, 1.88% for the Bloomberg Barclays Municipal Short (1-5 Years) Index, and 3.85% for the Bloomberg Barclays Municipal Bond Index. The Fund Shares' and Adviser Shares' tax-exempt distributions over the reporting period produced a dividend yield of 1.80% and 1.55%, respectively, compared to the Lipper category average of 1.49%.
• What strategies did you employ during the reporting period?
In keeping with our investment approach, we continued to focus on income generation. The Fund's long-term income distribution, not its price appreciation, accounts for most of its total return.
During the reporting period, we continued to invest a portion of the portfolio in variable rate demand notes ("VRDNs"). The VRDNs owned by the Fund have interest rates that adjust daily/weekly to the market. VRDNs also possess a "demand" feature that allows us to sell the bond at par value with notice of seven days or less, which helps us reduce share price volatility and also give us the flexibility to act when attractive opportunities arise.
Our commitment to independent credit research continued to help us identify attractive opportunities for the Fund. We employ fundamental analysis that emphasizes an issuer's ability and willingness to repay its debt. Through our credit research, we strive both to recognize relative value and to avoid potential pitfalls, which is especially important in volatile times like the present. As always, we worked with our in-house team of analysts to select investments for the Fund on a bond-by-bond basis. Our team continuously monitors all the holdings in the Fund's portfolio.
The Fund continues to hold a diversified portfolio of short-term, primarily investment-grade municipal bonds. To limit exposure to an unexpected event, the Fund is diversified by sector, issuer, and geography. In addition, we avoid bonds subject to the federal alternative minimum tax for individuals.
Thank you for allowing us to assist you with your investment needs.
5
USAA Mutual Funds Trust
USAA Tax Exempt Short-Term Fund
Investment Overview
(Unaudited)
Average Annual Total Return
Year Ended March 31, 2020
Fund Shares | Adviser Shares | ||||||||||||||||||
Inception Date | 3/19/82 | 8/1/10 | |||||||||||||||||
Net Asset Value | Net Asset Value | Bloomberg Barclays Municipal Bond Short (1-5) Index1 | Lipper Short Municipal Debt Funds Index2 | ||||||||||||||||
One Year | 0.23 | % | 0.09 | % | 1.88 | % | 1.04 | % | |||||||||||
Five Year | 0.93 | % | 0.73 | % | 1.49 | % | 0.99 | % | |||||||||||
Ten Year | 1.59 | % | NA | 1.70 | % | 1.15 | % | ||||||||||||
Since Inception | NA | 1.23 | % | NA | NA | ||||||||||||||
Past performance is not indicative of future results. The performance data quoted represents past performance and current returns may be lower or higher. The investment return and principal value will fluctuate so that an investor's shares, when redeemed, may be worth more or less than the original cost. To obtain performance information current to the most recent month's end, please visit www.usaa.com.
Total return measures the price change in a share assuming the reinvestment of all net investment income and realized capital gain distributions, if any. The total returns quoted do not reflect adjustments made to the enclosed financial statements in accordance with U.S. generally accepted accounting principles or the deduction of taxes that a shareholder would pay on net investment income and realized capital gain distributions, including reinvested distributions, or redemptions of shares.
The total return figures set forth above include all waivers of fees for various periods since inception. Without such fee waivers, the total returns would have been lower.
USAA Tax Exempt Short-Term Fund — Growth of $10,000

1The Bloomberg Barclays( 1-5) Years Municipal Blend Index is a market value-weighted index which covers the short components of the Bloomberg Barclays Municipal Bond Index. There are no expenses associated with the index, while there are expenses associated with the Fund. It is not possible to invest directly in an index.
2The unmanaged Lipper Short Municipal Debt Funds Index measures the Fund's performance to that of the Lipper Short Municipal Debt Funds category. There are no expenses associated with the index, while there are expenses associated with the Fund. It is not possible to invest directly in an index.
The graph reflects investment of growth of a hypothetical $10,000 investment in the Fund. Past performance is no guarantee of future results.
The graph and table do not reflect the deduction of taxes that a shareholder would pay on Fund distributions or the redemption of Fund shares.
6
USAA Mutual Funds Trust
USAA Tax Exempt Short-Term Fund (continued)
Average Annual Compounded Returns with Reinvestment of Dividends — Periods Ended March 31, 2020
Total Return | = | Dividend Return | + | Price Change | |||||||||||||||||||
| 10 Years | 1.59 | % | = | 1.88 | % | + | -0.29 | % | |||||||||||||||
| 5 Years | 0.93 | % | = | 1.61 | % | + | -0.68 | % | |||||||||||||||
| 1 Year | 0.23 | % | = | 1.76 | % | + | -1.53 | % | |||||||||||||||
The performance data quoted represents past performance and is no guarantee of future results. Current performance may be higher or lower than the performance data quoted. The return and principal value of an investment will fluctuate, so that an investor's shares, when redeemed, may be worth more or less than their original cost. For performance data current to the most recent month-end, visit usaa.com.
Annual Total Returns and Compounded Dividend Returns for
the One-Year Periods Ended March 31, 2011 — March 31, 2020
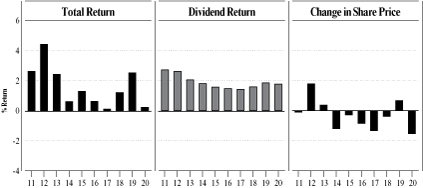
Note the role that dividend returns play in the Fund Shares' total return over time. Share prices and dividend rates will vary from period to period. However, dividend returns generally are more consistent and less volatile than share prices.
Total return measures the price change in a share assuming the reinvestment of all net investment income and realized capital gain distributions, if any. Dividend return is the net investment income dividends received over the period, assuming reinvestment of all dividends. Share price change is the change in net asset value over the period adjusted for realized capital gain distributions. The returns quoted do not reflect adjustments made to the enclosed financial statements in accordance with U.S. generally accepted accounting principles or the deduction of taxes that a shareholder would pay on distributions (including capital gain distributions), redemptions of shares, or reinvested net investment income.
7
| USAA Mutual Funds Trust USAA Tax Exempt Short-Term Fund | March 31, 2020 | ||||||
(Unaudited)
Investment Objective & Portfolio Holdings:
The Fund's investment objective seeks to provide investors with interest income that is exempt from federal income tax.
Top 10 Industries
March 31, 2020
(% of Net Assets)
General Obligation | 21.9 | % | |||||
Hospital | 17.0 | % | |||||
Electric Utilities | 10.9 | % | |||||
Electric/Gas Utility | 8.7 | % | |||||
Education | 8.4 | % | |||||
Special Assessment/Tax/Fee | 6.1 | % | |||||
Appropriated Debt | 3.4 | % | |||||
Environmental & Facilities Services | 2.9 | % | |||||
Oil & Gas Refining & Marketing | 2.5 | % | |||||
Paper Products | 2.3 | % | |||||
Refer to the Schedule of Portfolio of Investments for a complete list of securities.
8
| USAA Mutual Funds Trust USAA Tax Exempt Short-Term Fund (continued) | March 31, 2020 | ||||||
(Unaudited)
Portfolio Ratings Mix*
March 31, 2020
(% of Net Assets)
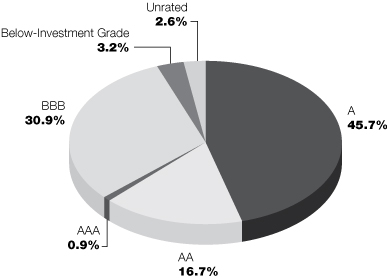
This chart reflects the highest long-term rating from a Nationally Recognized Statistical Rating Organization ("NRSRO"), with the four highest long-term credit ratings labeled, in descending order of credit quality, AAA, AA, A, and BBB. These categories represent investment-grade quality. NRSRO ratings are shown because they provide independent analysis of the credit quality of the Fund's investments. Victory Capital Management, Inc. ("Adviser") also performs its own fundamental credit analysis of each security. As part of its fundamental credit analysis, the Adviser considers various criteria, including industry specific actions, peer comparisons, payment ranking, and structure specific characteristics. Any of the Fund's securities that are not rated by an NRSRO appear in the chart above as "Unrated," but these securities are analyzed and monitored by the Adviser on an ongoing basis. Government securities that are issued or guaranteed as to principal and interest by the U.S. government and pre-refunded and escrowed-to-maturity municipal bonds that are not rated are treated as AAA for credit quality purposes.
*Does not include futures and money market instruments.
9
| USAA Mutual Funds Trust USAA Tax Exempt Short-Term Fund | Schedule of Portfolio Investments March 31, 2020 | ||||||
(Amounts in Thousands, Except for Shares)
Security Description | Shares or Principal Amount | Value | |||||||||
Common Stocks (0.2%) | |||||||||||
Utilities (0.2%): | |||||||||||
Energy Harbor Corp. (h) | 160,984 | $ | 2,053 | ||||||||
Total Common Stock (Cost $4,025) | 2,053 | ||||||||||
Municipal Bonds (98.3%) | |||||||||||
Alabama (2.3%): | |||||||||||
| Black Belt Energy Gas District Revenue, Series B-1, 1.96% (LIBOR01M+90bps), 1 2/1/48, (Put Date 12/1/23) (a) (b) | $ | 10,000 | 9,851 | ||||||||
| Columbia Industrial Development Board Revenue, Series A, 0.90%, 12/1/37, Continuously Callable @100 (c) | 12,300 | 12,300 | |||||||||
| Prattville Industrial Development Board Revenue 2.00%, 11/1/33, (Put Date 10/1/24) (b) (c) | 450 | 452 | |||||||||
2.00%, 11/1/33, (Put Date 10/1/24) (b) (c) | 425 | 427 | |||||||||
| Selma Industrial Development Board Revenue, 2.00%, 11/1/33, (Put Date 10/1/24) (b) (c) | 3,650 | 3,672 | |||||||||
| The Lower Alabama Gas District Revenue (LOC — Goldman Sachs Bank USA), 4.00%, 12/1/50, (Put Date 12/1/25) (b) (c) | 3,000 | 3,122 | |||||||||
29,824 | |||||||||||
Alaska (1.2%): | |||||||||||
| Alaska Industrial Development & Export Authority Revenue, 3.50%, 12/1/20, Continuously Callable @100 | 15,000 | 15,024 | |||||||||
Arizona (4.2%): | |||||||||||
| Arizona Health Facilities Authority Revenue, 6.56% (MUNIPSA+185bps), 2/1/48, (Put Date 2/1/23) (a) (b) | 25,000 | 25,951 | |||||||||
| Maricopa County IDA Revenue 4.00%, 7/1/29 (d) | 750 | 732 | |||||||||
5.28% (MUNIPSA+57bps), 1/1/35, Callable 10/18/23 @ 100 (a) | 2,435 | 2,442 | |||||||||
Series C, 5.51% (MUNIPSA+80bps), 9/1/48, (Put Date 9/1/24) (a) (b) | 7,735 | 7,725 | |||||||||
| The City of Phoenix IDA Revenue (LIQ — Barclays Bank PLC), Series 2016-XF2337, 5.00%, 6/1/36 (c) (d) | 16,000 | 16,000 | |||||||||
The Yavapai County IDA Revenue, Series A, 5.00%, 8/1/20 | 1,105 | 1,117 | |||||||||
53,967 | |||||||||||
California (2.5%): | |||||||||||
| Anaheim Public Financing Authority Revenue Series A, 5.00%, 5/1/22 | 500 | 533 | |||||||||
Series A, 5.00%, 5/1/24 | 250 | 282 | |||||||||
| California Infrastructure & Economic Development Bank Revenue, Series B, 5.91% (MUNIPSA+120bps), 8/1/37, (Put Date 6/1/22) (a) (b) | 8,000 | 7,992 | |||||||||
| California State Educational Facilities Authority Revenue, Claremont Graduate University, Series B (LIQ — Deutsche Bank AG), Series 2017-7007, 4.75%, 3/1/42, Callable 5/6/20 @ 100 (c) (d) | 12,005 | 12,005 | |||||||||
| California State Public Works Board Revenue Series A, 5.00%, 4/1/20 | 1,000 | 1,000 | |||||||||
Series A, 5.00%, 4/1/21 | 1,500 | 1,554 | |||||||||
City of Irvine Special Assessment, 5.00%, 9/2/21 | 1,125 | 1,182 | |||||||||
See notes to financial statements.
10
| USAA Mutual Funds Trust USAA Tax Exempt Short-Term Fund | Schedule of Portfolio Investments — continued March 31, 2020 | ||||||
(Amounts in Thousands, Except for Shares)
Security Description | Principal Amount | Value | |||||||||
| County of Los Angeles Certificate of Participation 5.00%, 3/1/21 | $ | 500 | $ | 517 | |||||||
5.00%, 9/1/21 | 1,000 | 1,054 | |||||||||
| San Francisco City Housing Revenue, 1500 Mission Street Apts., Series E (LIQ — Deutsche Bank A.G.), Series DBE-8049, 4.68%, 12/1/52, (b) (c) (d) | 5,000 | 5,000 | |||||||||
| Tobacco Securitization Authority of Southern California Revenue, 2.25%, 6/1/29 | 500 | 471 | |||||||||
31,590 | |||||||||||
Colorado (1.3%): | |||||||||||
| Arista Metropolitan District, GO (LOC — Compass Bank), 4.70%, 12/1/30, Callable 4/8/20 @ 100 (c) | 6,985 | 6,985 | |||||||||
| Colorado Health Facilities Authority Revenue Series A, 5.00%, 8/1/29 | 500 | 564 | |||||||||
Series A, 5.00%, 11/1/29 | 3,225 | 4,059 | |||||||||
Series A, 5.00%, 11/1/30, Continuously Callable @100 | 2,215 | 2,780 | |||||||||
Series B-2, 5.00%, 8/1/49, Callable 2/1/26 @ 100 (c) | 1,000 | 1,094 | |||||||||
| Southlands Metropolitan District No. 1, GO Series A-1, 3.00%, 12/1/22 | 208 | 207 | |||||||||
Series A-1, 3.50%, 12/1/27 | 1,000 | 991 | |||||||||
16,680 | |||||||||||
Connecticut (2.4%): | |||||||||||
City of Bridgeport, GO, Series B, 5.00%, 8/15/26 | 3,450 | 4,067 | |||||||||
| City of New Haven, GO Series A, 5.00%, 8/1/22 | 1,190 | 1,239 | |||||||||
Series A, 5.00%, 8/1/24 | 1,000 | 1,073 | |||||||||
Series A, 5.00%, 8/1/25 | 580 | 630 | |||||||||
Series A, 5.00%, 8/1/26 | 580 | 636 | |||||||||
Series A, 5.00%, 8/1/27 | 1,000 | 1,106 | |||||||||
| City of New Haven, GO (INS — Assured Guaranty Municipal Corp.) Series A, 5.00%, 8/1/27 | 2,500 | 2,891 | |||||||||
Series A, 5.00%, 8/1/28 | 1,000 | 1,167 | |||||||||
Series B, 5.00%, 2/1/27 | 600 | 690 | |||||||||
Series B, 5.00%, 2/1/28 | 525 | 610 | |||||||||
Series B, 5.00%, 2/1/29 | 550 | 644 | |||||||||
| City of West Haven, GO Series A, 4.00%, 11/1/21 | 800 | 820 | |||||||||
Series A, 5.00%, 11/1/23 | 800 | 871 | |||||||||
Series A, 5.00%, 11/1/24 | 815 | 906 | |||||||||
Series A, 5.00%, 11/1/27 | 650 | 758 | |||||||||
| City of West Haven, GO (INS — Assured Guaranty Municipal Corp.), 5.00%, 8/1/20 | 2,235 | 2,262 | |||||||||
| Connecticut State Health & Educational Facilities Authority Revenue Series A, 5.00%, 7/1/30, Continuously Callable @100 | 2,000 | 2,479 | |||||||||
Series B-2, 5.00%, 7/1/53, (Put Date 1/1/27) (b) (c) | 3,000 | 3,547 | |||||||||
| Harbor Point Infrastructure Improvement District Tax Allocation, 5.00%, 4/1/22 (d) | 4,250 | 4,365 | |||||||||
30,761 | |||||||||||
See notes to financial statements.
11
| USAA Mutual Funds Trust USAA Tax Exempt Short-Term Fund | Schedule of Portfolio Investments — continued March 31, 2020 | ||||||
(Amounts in Thousands, Except for Shares)
Security Description | Principal Amount | Value | |||||||||
District of Columbia (1.6%): | |||||||||||
| District of Columbia Revenue (LIQ — Deutsche Bank A.G.), Series 2016-XG0094, 4.94%, 10/1/41, Callable 4/1/21 @ 100 (c) (d) | $ | 20,000 | $ | 20,000 | |||||||
Florida (2.5%): | |||||||||||
| Alachua County Health Facilities Authority Revenue 4.00%, 12/1/23 | 1,100 | 1,175 | |||||||||
5.00%, 12/1/37, (Put Date 12/1/26) (b) (c) | 3,000 | 3,467 | |||||||||
| City of Atlantic Beach Revenue, Series B-2, 3.00%, 11/15/23, Continuously Callable @100 | 2,750 | 2,752 | |||||||||
City of Gulf Breeze Revenue, 3.10%, 12/1/20 | 4,500 | 4,547 | |||||||||
City of Jacksonville Revenue, 5.00%, 10/1/20 | 4,580 | 4,665 | |||||||||
| County of Escambia Revenue 2.00%, 11/1/33, (Put Date 10/1/24) (b) (c) | 775 | 787 | |||||||||
1.75%, 4/1/39, Continuously Callable @100 (c) | 700 | 700 | |||||||||
County of Martin Revenue, 1.20%, 7/15/22, Continuously Callable @100 (c) | 5,500 | 5,500 | |||||||||
| Florida Higher Educational Facilities Financial Authority Revenue 5.00%, 10/1/22 | 500 | 540 | |||||||||
5.00%, 10/1/24 | 500 | 566 | |||||||||
5.00%, 10/1/25 | 445 | 513 | |||||||||
Series A, 5.00%, 4/1/21 | 1,385 | 1,433 | |||||||||
Lee County IDA Revenue, 4.75%, 10/1/22 | 1,980 | 1,997 | |||||||||
Miami Beach Health Facilities Authority Revenue, 5.00%, 11/15/20 | 1,250 | 1,277 | |||||||||
Pinellas County Educational Facilities Authority Revenue, 4.00%, 10/1/20 | 975 | 987 | |||||||||
| Southeast Overtown Park West Community Redevelopment Agency Tax Allocation, Series A-1, 5.00%, 3/1/23 (d) | 1,000 | 1,089 | |||||||||
31,995 | |||||||||||
Georgia (5.3%): | |||||||||||
| Appling County Development Authority Revenue 1.02%, 9/1/29, Continuously Callable @100 (c) | 14,400 | 14,400 | |||||||||
2.40%, 1/1/38, (Put Date 4/1/20) (b) (c) | 10,000 | 10,000 | |||||||||
Burke County Development Authority Revenue, 1.70%, 12/1/49 (c) | 7,500 | 7,449 | |||||||||
| Cobb County Development Authority Revenue, Series A, 2.25%, 4/1/33, (Put Date 10/1/29) (b) (c) | 5,000 | 4,693 | |||||||||
| Heard County Development Authority Revenue, 1.07%, 9/1/26, Continuously Callable @100 (c) | 3,200 | 3,200 | |||||||||
| Main Street Natural Gas, Inc. Revenue 4.00%, 8/1/48, (Put Date 12/1/23) (b) (c) | 5,000 | 5,104 | |||||||||
Series A, 5.00%, 5/15/28 | 1,000 | 1,127 | |||||||||
Series A, 5.00%, 5/15/29 | 1,775 | 2,013 | |||||||||
Series C, 4.00%, 3/1/50, (Put Date 9/1/26) (b) (c) | 10,000 | 10,504 | |||||||||
Private Colleges & Universities Authority Revenue, Series A, 5.00%, 10/1/20 | 3,770 | 3,832 | |||||||||
| Savannah Economic Development Authority Revenue, 2.00%, 11/1/33, (Put Date 10/1/24) (b) (c) | 815 | 826 | |||||||||
| The Burke County Development Authority Revenue, 1.10%, 7/1/49, Continuously Callable @100 (c) | 3,900 | 3,900 | |||||||||
| The Monroe County Development Authority Revenue, 1.02%, 4/1/32, Continuously Callable @100 (c) | 1,400 | 1,400 | |||||||||
68,448 | |||||||||||
See notes to financial statements.
12
| USAA Mutual Funds Trust USAA Tax Exempt Short-Term Fund | Schedule of Portfolio Investments — continued March 31, 2020 | ||||||
(Amounts in Thousands, Except for Shares)
Security Description | Principal Amount | Value | |||||||||
Guam (0.5%): | |||||||||||
Guam Government Waterworks Authority Revenue, Series A, 5.00%, 7/1/20 | $ | 860 | $ | 862 | |||||||
| Guam Power Authority Revenue (INS — Assured Guaranty Municipal Corp.), Series A, 5.00%, 10/1/20 | 1,500 | 1,512 | |||||||||
| Territory of Guam Revenue Series A, 5.00%, 12/1/23 | 1,500 | 1,541 | |||||||||
Series A, 5.00%, 12/1/24 | 2,000 | 2,062 | |||||||||
5,977 | |||||||||||
Idaho (0.4%): | |||||||||||
County of Nez Perce Revenue, 2.75%, 10/1/24 | 5,000 | 5,218 | |||||||||
Illinois (11.0%): | |||||||||||
| Chicago Board of Education Special Tax (LIQ — Barclays Bank PLC), Series 2017-XG0108, 5.00%, 4/1/46, Callable 4/1/27 @ 100 (c) (d) | 14,300 | 14,300 | |||||||||
| Chicago Board of Education, GO Series A, 4.00%, 12/1/27 | 1,400 | 1,359 | |||||||||
Series B, 5.00%, 12/1/22 | 1,500 | 1,527 | |||||||||
| Chicago Board of Education, GO (LIQ — Deutsche Bank A.G.) Series 2016-XG0073, 5.00%, 12/1/39, Callable 12/1/21 @ 100 (c) (d) | 10,000 | 10,000 | |||||||||
Series 2017-XM0188, 5.04%, 12/1/39, Callable 12/1/21 @ 100 (c) (d) | 5,000 | 5,000 | |||||||||
| Chicago Park District, GO (INS — Build America Mutual Assurance Co.), Series SER 2015-XF2111, 5.20%, 1/1/22 (c) (d) | 10,200 | 10,200 | |||||||||
| Chicago Transit Authority Revenue 5.00%, 6/1/25 | 1,720 | 1,990 | |||||||||
5.00%, 6/1/26 | 1,000 | 1,181 | |||||||||
| City of Chicago Waterworks Revenue 5.00%, 11/1/25 | 4,000 | 4,665 | |||||||||
5.00%, 11/1/26 | 1,000 | 1,191 | |||||||||
Series A-1, 5.00%, 11/1/25 | 2,000 | 2,333 | |||||||||
Series A-1, 4.00%, 11/1/26 | 2,500 | 2,822 | |||||||||
| County of Cook, GO (LIQ-JPMorgan Chase & Co.), Series 2015-XF0124, 3.85%, 11/15/20 (c) (d) | 11,160 | 11,160 | |||||||||
| Illinois Finance Authority Revenue 5.00%, 7/1/20 | 1,420 | 1,431 | |||||||||
5.46% (MUNIPSA+75bps), 1/1/46, (Put Date 7/1/23) (a) (b) | 9,000 | 8,955 | |||||||||
Series C, 4.00%, 2/15/25 | 10,000 | 11,106 | |||||||||
Illinois Sports Facilities Authority Revenue, 5.00%, 6/15/28 | 1,000 | 1,055 | |||||||||
| Madison County Community Unit School District No. 7 Edwardsville, GO (INS — Build America Mutual Assurance Co.), 4.00%, 12/1/20 | 2,085 | 2,114 | |||||||||
| Northern Illinois University Revenue (INS — Build America Mutual Assurance Co.), Series B, 5.00%, 4/1/30 (e) | 250 | 274 | |||||||||
| Railsplitter Tobacco Settlement Authority Revenue 5.25%, 6/1/20 | 4,160 | 4,181 | |||||||||
5.25%, 6/1/21 | 1,090 | 1,138 | |||||||||
Sales Tax Securitization Corp. Revenue, Series A, 5.00%, 1/1/30 | 1,000 | 1,188 | |||||||||
| State of Illinois, GO Series A, 5.00%, 10/1/23 | 3,000 | 3,132 | |||||||||
Series B, 5.00%, 9/1/25 | 5,000 | 5,248 | |||||||||
Series C, 5.00%, 11/1/29, Continuously Callable @100 | 4,500 | 4,684 | |||||||||
Series D, 5.00%, 11/1/26 | 4,485 | 4,697 | |||||||||
See notes to financial statements.
13
| USAA Mutual Funds Trust USAA Tax Exempt Short-Term Fund | Schedule of Portfolio Investments — continued March 31, 2020 | ||||||
(Amounts in Thousands, Except for Shares)
Security Description | Principal Amount | Value | |||||||||
| State of Illinois, GO (INS — Build America Mutual Assurance Co.), Series D, 5.00%, 11/1/25 (f) | $ | 15,000 | $ | 15,647 | |||||||
| Village of Rosemont, GO (INS — Assured Guaranty Municipal Corp.) Series A, 5.00%, 12/1/22 | 1,735 | 1,870 | |||||||||
Series A, 5.00%, 12/1/23 | 1,825 | 2,018 | |||||||||
Series A, 5.00%, 12/1/24 | 1,915 | 2,171 | |||||||||
| Western Illinois University Revenue (INS — Build America Mutual Assurance Co.) 4.00%, 4/1/29 | 750 | 757 | |||||||||
4.00%, 4/1/30 | 750 | 753 | |||||||||
| Will County Community High School District No 210 Lincoln-Way, GO, 4.00%, 1/1/22 | 975 | 1,015 | |||||||||
141,162 | |||||||||||
Indiana (1.4%): | |||||||||||
| Hammond Local Public Improvement Bond Bank Revenue 2.25%, 6/30/20 | 2,405 | 2,411 | |||||||||
2.38%, 12/31/20 | 3,375 | 3,405 | |||||||||
| Indiana Bond Bank Revenue 1/15/27 (g) | 1,280 | 1,109 | |||||||||
1/15/28 (g) | 1,100 | 923 | |||||||||
1/15/29 (g) | 565 | 459 | |||||||||
7/15/29, Continuously Callable @99 (g) | 730 | 574 | |||||||||
| Indiana Finance Authority Revenue, 2.95%, 10/1/22, Continuously Callable @100 | 5,000 | 5,192 | |||||||||
| Indianapolis Local Public Improvement Bond Bank Revenue, Series B, 1.45%, 6/1/21, Continuously Callable @100 | 4,000 | 4,000 | |||||||||
18,073 | |||||||||||
Iowa (0.2%): | |||||||||||
City of Waverly Revenue, 2.50%, 12/31/22, Continuously Callable @100 | 2,000 | 2,022 | |||||||||
Kansas (1.9%): | |||||||||||
City of Burlington Revenue, 5.18%, 9/1/35, Continuously Callable @100 (c) | 8,250 | 8,250 | |||||||||
City of Wamego Revenue, 6.00%, 4/15/32, Continuously Callable @100 (c) | 15,000 | 15,000 | |||||||||
City of Wichita Revenue, 3.00%, 9/1/23, Continuously Callable @100 | 520 | 519 | |||||||||
23,769 | |||||||||||
Kentucky (5.0%): | |||||||||||
| City of Ashland Revenue 5.00%, 2/1/28 | 1,775 | 2,058 | |||||||||
5.00%, 2/1/30 | 740 | 872 | |||||||||
County of Carroll Revenue, 1.55%, 9/1/42 (c) | 5,000 | 4,967 | |||||||||
| County of Owen Revenue 2.45%, 6/1/39, (Put Date 10/1/29) (b) (c) | 10,000 | 10,093 | |||||||||
2.45%, 9/1/39, (Put Date 10/1/29) (b) (c) | 5,000 | 5,045 | |||||||||
| Kentucky Public Energy Authority Revenue Series B, 4.00%, 1/1/49, (Put Date 1/1/25) (b) (c) | 5,715 | 5,671 | |||||||||
Series C, 4.00%, 2/1/50, (Put Date 2/1/28) (b) | 10,000 | 10,444 | |||||||||
Series C-1, 4.00%, 12/1/49, (Put Date 6/1/25) (b) (c) | 10,000 | 10,166 | |||||||||
Series C-3, 5.76% (MUNIPSA+105bps), 12/1/49, (Put Date 6/1/25) (a) (b) | 10,000 | 9,813 | |||||||||
| Louisville/Jefferson County Metropolitan Government Revenue, 5.00%, 10/1/47, (Put Date 10/1/29) (b) (c) | 4,000 | 4,929 | |||||||||
64,058 | |||||||||||
See notes to financial statements.
14
| USAA Mutual Funds Trust USAA Tax Exempt Short-Term Fund | Schedule of Portfolio Investments — continued March 31, 2020 | ||||||
(Amounts in Thousands, Except for Shares)
Security Description | Principal Amount | Value | |||||||||
Louisiana (3.8%): | |||||||||||
| Louisiana Public Facilities Authority Revenue, 5.36% (MUNIPSA+65bps), 9/1/57, (Put Date 9/1/23) (a) (b) | $ | 10,000 | $ | 10,049 | |||||||
Parish of St. Charles Revenue, 4.00%, 12/1/40, (Put Date 6/1/22) (b) (c) | 4,000 | 4,135 | |||||||||
| Parish of St. James Revenue, Series B-1, 7.50%, 11/1/40, Continuously Callable @100 (c) | 22,100 | 22,100 | |||||||||
| Parish of St. John the Baptist. Revenue 2.10%, 6/1/37 (c) | 2,000 | 1,715 | |||||||||
2.20%, 6/1/37 (c) | 6,750 | 5,382 | |||||||||
Tobacco Settlement Financing Corp. Revenue, Series A, 5.00%, 5/15/22 | 5,000 | 5,090 | |||||||||
48,471 | |||||||||||
Maryland (0.4%): | |||||||||||
| Maryland Economic Development Corp. Revenue Series A, 5.00%, 6/1/25 | 1,500 | 1,691 | |||||||||
Series A, 5.00%, 6/1/26 | 2,000 | 2,263 | |||||||||
Series A, 5.00%, 6/1/27 | 1,340 | 1,515 | |||||||||
5,469 | |||||||||||
Massachusetts (0.4%): | |||||||||||
| Massachusetts Development Finance Agency Revenue 5.00%, 7/1/25 | 1,250 | 1,455 | |||||||||
5.00%, 7/1/26 | 1,500 | 1,780 | |||||||||
Series A, 5.00%, 7/1/29, Continuously Callable @100 | 1,425 | 1,732 | |||||||||
4,967 | |||||||||||
Michigan (1.2%): | |||||||||||
| Flint Hospital Building Authority Revenue 5.00%, 7/1/29 (e) | 1,995 | 2,318 | |||||||||
5.00%, 7/1/30 (e) | 2,290 | 2,679 | |||||||||
Michigan Finance Authority Revenue, 1.12%, 12/1/34, (Put Date 6/1/20) (b) (c) | 10,560 | 10,560 | |||||||||
15,557 | |||||||||||
Minnesota (0.2%): | |||||||||||
| Housing & Redevelopment Authority of The City of St Paul Minnesota Revenue 5.00%, 11/15/20 | 1,250 | 1,279 | |||||||||
5.00%, 11/15/21 | 1,575 | 1,669 | |||||||||
| Sanford Canby Community Hospital District No. 1 Revenue, 6.00%, 11/1/26, Continuously Callable @100 (c) | 200 | 200 | |||||||||
3,148 | |||||||||||
Mississippi (3.5%): | |||||||||||
| County of Perry Revenue (NBGA — Georgia-Pacific Corp.), 4.89%, 2/1/22, Continuously Callable @100 (c) (d) | 20,100 | 20,100 | |||||||||
County of Warren Revenue, 2.90%, 9/1/32, (Put Date 9/1/23) (b) (c) | 2,000 | 2,092 | |||||||||
| Mississippi Business Finance Corp. Revenue 3.20%, 9/1/28, Continuously Callable @100 | 4,000 | 4,231 | |||||||||
Series D, 0.44%, 12/1/30, (Put Date 4/22/20) (b) (c) | 600 | 600 | |||||||||
| Mississippi Hospital Equipment & Facilities Authority Revenue 5.00%, 9/1/24 | 10,000 | 11,404 | |||||||||
6.01% (MUNIPSA+130bps), 8/15/36, (Put Date 8/15/20) (a) (b) | 7,000 | 7,021 | |||||||||
45,448 | |||||||||||
See notes to financial statements.
15
| USAA Mutual Funds Trust USAA Tax Exempt Short-Term Fund | Schedule of Portfolio Investments — continued March 31, 2020 | ||||||
(Amounts in Thousands, Except for Shares)
Security Description | Principal Amount | Value | |||||||||
Missouri (0.4%): | |||||||||||
| City of Sikeston MO Electric System Revenue (INS — Build America Mutual Assurance Co.), 5.00%, 6/1/20 | $ | 5,000 | $ | 5,028 | |||||||
Montana (0.7%): | |||||||||||
City of Forsyth Revenue, 2.00%, 8/1/23 | 6,000 | 5,908 | |||||||||
| Montana State Board of Regents Revenue, Series F, 5.16% (MUNIPSA+45bps), 11/15/35, (Put Date 9/1/23) (a) (b) | 3,170 | 3,182 | |||||||||
9,090 | |||||||||||
Nevada (0.4%): | |||||||||||
County of Washoe Revenue, Series B, 3.00%, 3/1/36, (Put Date 6/1/22) (b) (c) | 4,400 | 4,543 | |||||||||
New Jersey (10.7%): | |||||||||||
Borough of Oceanport, GO, 1.25%, 2/25/21 | 9,877 | 9,866 | |||||||||
| Casino Reinvestment Development Authority Revenue (INS — Assured Guaranty Municipal Corp.), 5.00%, 11/1/24 | 1,000 | 1,154 | |||||||||
City of Orange Township, GO, Series A, 1.50%, 6/19/20 | 8,611 | 8,608 | |||||||||
Lyndhurst Township School District, GO, 2.00%, 9/11/20 | 11,974 | 11,961 | |||||||||
| New Jersey Building Authority Revenue Series A, 3.00%, 6/15/23 | 400 | 423 | |||||||||
Series A, 3.00%, 6/15/23 | 600 | 590 | |||||||||
Series A, 5.00%, 6/15/24 | 1,595 | 1,844 | |||||||||
Series A, 5.00%, 6/15/24 | 2,405 | 2,534 | |||||||||
| New Jersey Economic Development Authority Revenue 5.00%, 6/15/20 | 8,000 | 8,025 | |||||||||
5.00%, 6/15/21 | 7,000 | 7,124 | |||||||||
Series BBB, 5.00%, 6/15/23 | 7,000 | 7,305 | |||||||||
Series XX, 5.00%, 6/15/22 (f) | 20,000 | 20,621 | |||||||||
| New Jersey Economic Development Authority Revenue (LOC — Valley National Bank), 5.55%, 3/1/31, Continuously Callable @100 (c) | 1,575 | 1,575 | |||||||||
| New Jersey Educational Facilities Authority Revenue Series B, 5.00%, 9/1/22 | 4,735 | 4,895 | |||||||||
Series B, 5.00%, 9/1/23 | 4,000 | 4,183 | |||||||||
Series B, 4.00%, 9/1/24 | 4,730 | 4,783 | |||||||||
| New Jersey Health Care Facilities Financing Authority Revenue, 5.00%, 7/1/20 | 2,000 | 2,018 | |||||||||
| New Jersey Transportation Trust Fund Authority Revenue 5.00%, 6/15/24 | 5,095 | 5,549 | |||||||||
5.91% (MUNIPSA+120bps), 6/15/34, (Put Date 12/15/21) (a) (b) | 10,000 | 9,706 | |||||||||
Series AA, 5.00%, 6/15/22 | 1,500 | 1,547 | |||||||||
Series AA, 5.00%, 6/15/23 | 3,835 | 4,002 | |||||||||
| New Jersey Transportation Trust Fund Authority Revenue (INS — Assured Guaranty Municipal Corp.), Series A, 5.25%, 12/15/20 | 5,000 | 5,065 | |||||||||
| New Jersey Transportation Trust Fund Authority Revenue (INS — National Public Finance Guarantee Corp.), Series B, 5.50%, 12/15/20 | 3,160 | 3,204 | |||||||||
Tobacco Settlement Financing Corp. Revenue, Series B, 3.20%, 6/1/27 | 1,540 | 1,538 | |||||||||
Town of Kearny, GO, 2.50%, 4/24/20 | 9,235 | 9,241 | |||||||||
137,361 | |||||||||||
See notes to financial statements.
16
| USAA Mutual Funds Trust USAA Tax Exempt Short-Term Fund | Schedule of Portfolio Investments — continued March 31, 2020 | ||||||
(Amounts in Thousands, Except for Shares)
Security Description | Principal Amount | Value | |||||||||
New Mexico (1.9%): | |||||||||||
| City of Farmington Revenue 1.88%, 4/1/29, (Put Date 4/1/20) (b) (c) | $ | 5,000 | $ | 5,000 | |||||||
1.88%, 4/1/29, (Put Date 4/1/20) (b) (c) | 7,000 | 7,000 | |||||||||
1.88%, 4/1/33, (Put Date 10/1/21) (b) (c) | 6,000 | 5,876 | |||||||||
2.13%, 6/1/40, (Put Date 6/1/22) (b) (c) | 2,000 | 1,953 | |||||||||
Series A, 1.88%, 4/1/29, (Put Date 4/1/20) (b) (c) | 5,000 | 5,000 | |||||||||
24,829 | |||||||||||
New York (10.2%): | |||||||||||
City of New York, GO, 4.90%, 10/1/46, Continuously Callable @100 (c) | 10,000 | 10,000 | |||||||||
City of Poughkeepsie, GO, Series A, 3.00%, 5/2/20 | 1,410 | 1,410 | |||||||||
City of Yonkers, GO, 2.00%, 6/29/20 | 10,000 | 10,016 | |||||||||
County of Monroe, GO, 5.00%, 6/1/20 | 5,170 | 5,202 | |||||||||
County of Rockland, GO, 3.50%, 10/1/20 | 1,575 | 1,593 | |||||||||
| County of Rockland, GO (INS — Assured Guaranty Municipal Corp.) Series A, 5.00%, 3/1/23 | 2,500 | 2,781 | |||||||||
Series A, 5.00%, 3/1/24 | 1,600 | 1,838 | |||||||||
Hempstead Union Free School District, GO, 2.50%, 6/25/20 | 3,000 | 3,010 | |||||||||
| Long Island Power Authority Revenue Series B, 1.65%, 9/1/49, (Put Date 9/1/24) (b) (c) | 4,500 | 4,440 | |||||||||
Series C, 1.86% (LIBOR01M+75bps), 5/1/33, (Put Date 10/1/23) (a) (b) | 4,000 | 4,055 | |||||||||
Series C, 1.86% (LIBOR01M+75bps), 5/1/33, (Put Date 10/1/23) (a) (b) | 5,000 | 5,048 | |||||||||
| Metropolitan Transportation Authority Revenue 5.21% (MUNIPSA+50bps), 11/15/42, (Put Date 3/1/22) (a) (b) | 10,000 | 9,920 | |||||||||
Series D-2, 5.16% (MUNIPSA+45bps), 11/15/44, (Put Date 11/15/22) (a) (b) | 8,000 | 7,914 | |||||||||
| New York Liberty Development Corp. Revenue 2.80%, 9/15/69, Continuously Callable @100 | 1,000 | 929 | |||||||||
2.63%, 9/15/69, Continuously Callable @100 | 1,650 | 1,531 | |||||||||
| New York State Dormitory Authority Revenue 5.00%, 12/1/24 (d) | 1,200 | 1,360 | |||||||||
5.00%, 12/1/25 (d) | 1,200 | 1,385 | |||||||||
| New York State Energy Research & Development Authority Revenue, 2.00%, 2/1/29, (Put Date 5/1/20) (b) (c) | 6,000 | 6,003 | |||||||||
| Niagara Area Development Corp. Revenue, Series B, 3.50%, 11/1/24, Continuously Callable @100 (d) | 500 | 483 | |||||||||
Suffolk County Economic Development Corp. Revenue, 5.00%, 7/1/20 | 2,640 | 2,663 | |||||||||
Town of Oyster Bay, GO, Series B, 1.25%, 3/12/21 | 20,000 | 19,950 | |||||||||
Village of Johnson City, GO, Series B, 2.25%, 10/2/20 | 12,484 | 12,346 | |||||||||
Village of Valley Stream, GO, Series A, 3.00%, 5/21/20 | 3,050 | 3,058 | |||||||||
Wyandanch Union Free School District, GO, 2.50%, 6/26/20 | 13,950 | 13,992 | |||||||||
130,927 | |||||||||||
North Carolina (1.5%): | |||||||||||
| Columbus County Industrial Facilities & Pollution Control Financing Authority Revenue 2.00%, 11/1/33, (Put Date 10/1/24) (b) (c) | 825 | 837 | |||||||||
2.00%, 11/1/33, (Put Date 10/1/24) (b) (c) | 825 | 837 | |||||||||
North Carolina Capital Facilities Finance Agency Revenue, 1.10%, 7/1/34, (c) | 18,000 | 17,907 | |||||||||
19,581 | |||||||||||
See notes to financial statements.
17
| USAA Mutual Funds Trust USAA Tax Exempt Short-Term Fund | Schedule of Portfolio Investments — continued March 31, 2020 | ||||||
(Amounts in Thousands, Except for Shares)
Security Description | Principal Amount | Value | |||||||||
Ohio (2.9%): | |||||||||||
| American Municipal Power, Inc. Revenue, Series A, 2.25%, 2/15/48, (Put Date 8/15/21) (b) (c) | $ | 5,000 | $ | 5,046 | |||||||
| Ohio Air Quality Development Authority Revenue 1.90%, 5/1/26, (Put Date 10/01/24) (b) (c) | 3,500 | 3,342 | |||||||||
2.40%, 12/1/38, Callable 10/1/24 @ 100 (c) | 3,250 | 3,036 | |||||||||
| Ohio Higher Educational Facility Commission Revenue 5.00%, 5/1/21 | 1,000 | 1,037 | |||||||||
5.00%, 5/1/22 | 500 | 535 | |||||||||
5.00%, 5/1/23 | 550 | 607 | |||||||||
5.00%, 5/1/24 | 1,000 | 1,134 | |||||||||
| Ohio Water Development Authority Revenue 1.55%, 7/1/21 (c) | 1,800 | 1,798 | |||||||||
6/1/33 (g) (h) (j) | 5,000 | — | (i) | ||||||||
| Port of Greater Cincinnati Development Authority Revenue, Series A, 3.00%, 5/1/23, Continuously Callable @100 | 4,765 | 4,678 | |||||||||
| Southeastern Ohio Port Authority Revenue 5.00%, 12/1/21 | 1,150 | 1,177 | |||||||||
5.00%, 12/1/25, Continuously Callable @100 | 1,000 | 1,056 | |||||||||
| State of Ohio Revenue 1.10%, 11/1/35, (c) | 13,000 | 12,932 | |||||||||
Series A, 5.00%, 1/15/30 | 1,000 | 1,209 | |||||||||
37,587 | |||||||||||
Oklahoma (1.0%): | |||||||||||
| Muskogee Industrial Trust Revenue 4.00%, 9/1/28 | 2,500 | 2,862 | |||||||||
4.00%, 9/1/29 | 3,010 | 3,472 | |||||||||
| Oklahoma Development Finance Authority Revenue Series B, 5.00%, 8/15/23 | 500 | 552 | |||||||||
Series B, 5.00%, 8/15/24 | 600 | 677 | |||||||||
Series B, 5.00%, 8/15/25 | 550 | 632 | |||||||||
| Oklahoma Municipal Power Authority Revenue, Series A, 5.10% (MUNIPSA+39bps), 1/1/23 (a) | 4,570 | 4,577 | |||||||||
12,772 | |||||||||||
Pennsylvania (7.3%): | |||||||||||
| Bethlehem Authority Revenue (INS — Build America Mutual Assurance Co.), 5.00%, 11/15/20 | 1,000 | 1,023 | |||||||||
Chester County IDA Revenue, 3.75%, 10/1/24 | 595 | 617 | |||||||||
Coatesville School District, GO, 8/15/20 (g) | 5,305 | 5,271 | |||||||||
| Coatesville School District, GO (INS — Assured Guaranty Municipal Corp.) 5.00%, 8/1/24 | 1,000 | 1,137 | |||||||||
5.00%, 8/1/25 | 800 | 930 | |||||||||
Commonwealth Financing Authority Revenue, 5.00%, 6/1/26 | 2,000 | 2,349 | |||||||||
| County of Lehigh Revenue 5.00%, 7/1/28 | 1,750 | 2,123 | |||||||||
5.00%, 7/1/29 | 2,000 | 2,462 | |||||||||
| Cumberland County Municipal Authority Revenue, Series C-6, 3.25%, 12/1/22, Continuously Callable @101 | 1,715 | 1,720 | |||||||||
See notes to financial statements.
18
| USAA Mutual Funds Trust USAA Tax Exempt Short-Term Fund | Schedule of Portfolio Investments — continued March 31, 2020 | ||||||
(Amounts in Thousands, Except for Shares)
Security Description | Principal Amount | Value | |||||||||
| Geisinger Authority Revenue, 1.70% (LIBOR01M+107bps), 6/1/28, (Put Date 6/1/24) (a) (b) | $ | 7,000 | $ | 7,123 | |||||||
| General Authority of Southcentral Pennsylvania Revenue, 5.31% (MUNIPSA+60bps), 6/1/49, Callable 6/1/23 @ 100 (a) | 6,000 | 5,943 | |||||||||
| Hospitals & Higher Education Facilities Authority of Philadelphia Revenue, 5.00%, 7/1/22 | 1,595 | 1,661 | |||||||||
| Luzerne County IDA Revenue (INS — Assured Guaranty Municipal Corp.) 5.00%, 12/15/25 | 550 | 641 | |||||||||
5.00%, 12/15/26, Continuously Callable @100 | 500 | 581 | |||||||||
5.00%, 12/15/27, Continuously Callable @100 | 1,000 | 1,161 | |||||||||
| Montgomery County Higher Education & Health Authority Revenue, 5.43% (MUNIPSA+72bps), 9/1/51, (Put Date 9/1/23) (a) (b) | 6,250 | 6,250 | |||||||||
| Montgomery County IDA Revenue, Series A, 2.60%, 3/1/34, (Put Date 9/1/20) (b) (c) | 5,000 | 5,024 | |||||||||
| Northampton County General Purpose Authority Revenue 6.11% (MUNIPSA+140bps), 8/15/43, (Put Date 8/15/20) (a) (b) | 7,000 | 6,999 | |||||||||
2.15% (LIBOR01M+104bps), 8/15/48, (Put Date 8/15/24) (a) (b) | 1,855 | 1,835 | |||||||||
| Pennsylvania Higher Educational Facilities Authority Revenue Series A, 5.00%, 7/15/20 | 600 | 606 | |||||||||
Series A, 5.00%, 7/15/21 | 1,090 | 1,139 | |||||||||
| Pennsylvania Turnpike Commission Revenue Series B, 5.98% (MUNIPSA+127bps), 12/1/20, Callable 6/1/20 @ 100 (a) | 6,000 | 6,053 | |||||||||
Series B-1, 5.69% (MUNIPSA+98bps), 12/1/21, Callable 6/1/21 @ 100 (a) | 6,500 | 6,536 | |||||||||
| School District of Philadelphia, GO Series D, 5.00%, 9/1/21 | 5,000 | 5,257 | |||||||||
Series D, 5.00%, 9/1/22 | 5,500 | 5,977 | |||||||||
| Scranton School District, GO 1.92% (LIBOR01M+85bps), 4/1/31, (Put Date 4/1/21) (a) (b) | 6,715 | 6,749 | |||||||||
Series A, 5.00%, 6/1/23 | 2,435 | 2,696 | |||||||||
| The Berks County Municipal Authority Revenue, Series B, 5.00%, 2/1/40, (Put Date 2/1/30) (b) (c) | 1,700 | 1,892 | |||||||||
| West Mifflin School District, GO (INS — Assured Guaranty Municipal Corp.), 5.00%, 10/1/21 | 1,570 | 1,613 | |||||||||
93,368 | |||||||||||
Puerto Rico (0.1%): | |||||||||||
| Puerto Rico Industrial Tourist Educational Medical & Environmental Control Facilities Authority Revenue, 4.00%, 4/1/20 | 700 | 700 | |||||||||
South Carolina (0.7%): | |||||||||||
| Patriots Energy Group Financing Agency Revenue, Series B, 1.92% (LIBOR01M+86bps), 10/1/48, (Put Date 2/1/24) (a) (b) | 10,000 | 9,600 | |||||||||
South Dakota (0.3%): | |||||||||||
| South Dakota Health & Educational Facilities Authority Revenue, Series B, 6.00%, 11/1/20, Continuously Callable @100 (c) | 4,220 | 4,220 | |||||||||
Texas (5.2%): | |||||||||||
| Austin Convention Enterprises, Inc. Revenue 5.00%, 1/1/24 | 1,100 | 1,127 | |||||||||
5.00%, 1/1/25 | 400 | 411 | |||||||||
5.00%, 1/1/27 | 400 | 409 | |||||||||
See notes to financial statements.
19
| USAA Mutual Funds Trust USAA Tax Exempt Short-Term Fund | Schedule of Portfolio Investments — continued March 31, 2020 | ||||||
(Amounts in Thousands, Except for Shares)
Security Description | Principal Amount | Value | |||||||||
| Decatur Hospital Authority Revenue Series A, 5.00%, 9/1/21 | $ | 700 | $ | 728 | |||||||
Series A, 5.00%, 9/1/24 | 780 | 867 | |||||||||
| Harris County Cultural Education Facilities Finance Corp. Revenue 5.00%, 7/1/49, (Put Date 12/1/26) (b) (c) | 1,400 | 1,680 | |||||||||
5.28% (MUNIPSA+57bps), 12/1/49, (Put Date 12/4/24) (a) (b) | 1,670 | 1,672 | |||||||||
| Harris County Municipal Utility District No. 165, GO (INS — Build America Mutual Assurance Co.) 3.00%, 3/1/21 | 565 | 572 | |||||||||
3.00%, 3/1/22 | 650 | 667 | |||||||||
3.00%, 3/1/23 | 520 | 541 | |||||||||
| Irving Hospital Authority Revenue, 5.81% (MUNIPSA+110bps), 10/15/44, (Put Date 10/15/23) (a) (b) | 1,750 | 1,750 | |||||||||
Karnes County Hospital District Revenue, 5.00%, 2/1/24 | 2,455 | 2,632 | |||||||||
Matagorda County Navigation District No. 1 Revenue, 2.60%, 11/1/29 | 4,000 | 4,163 | |||||||||
| New Hope Cultural Education Facilities Finance Corp. Revenue Series A, 5.00%, 7/1/23 | 1,250 | 1,151 | |||||||||
Series A, 5.00%, 7/1/24 | 2,300 | 2,118 | |||||||||
Series A, 5.00%, 7/1/25 | 2,135 | 1,966 | |||||||||
| Northside Independent School District, GO (NBGA — Texas Permanent School Fund), 2.12%, 8/1/40, (Put Date 8/1/20) (b) (c) | 8,860 | 8,887 | |||||||||
| Port of Port Arthur Navigation District Revenue 1.50%, 4/1/40, Continuously Callable @100 (c) | 870 | 870 | |||||||||
7.50%, 11/1/40, Continuously Callable @100 (c) (f) | 7,000 | 7,000 | |||||||||
6.25%, 11/1/40, Continuously Callable @100 (c) | 20,105 | 20,105 | |||||||||
| Red River Authority Revenue (INS — National Public Finance Guarantee Corp.), 4.45%, 6/1/20 | 7,175 | 7,206 | |||||||||
66,522 | |||||||||||
Virginia (0.6%): | |||||||||||
Chesapeake Bay Bridge & Tunnel District Revenue, 5.00%, 11/1/23 | 5,140 | 5,610 | |||||||||
Marquis Community Development Authority Revenue, 9/1/45 (c) (d) (j) (k) | 1,074 | 456 | |||||||||
| Marquis Community Development Authority Tax Allocation Series A, 5.10%, 9/1/36 (j) | 3,506 | 1,481 | |||||||||
Series C, 9/1/41 (g) (h) (j) | 5,111 | 236 | |||||||||
7,783 | |||||||||||
Washington (0.4%): | |||||||||||
| Washington Health Care Facilities Authority Revenue 5.00%, 8/15/26 | 2,000 | 2,382 | |||||||||
5.00%, 8/15/27 | 2,175 | 2,632 | |||||||||
5,014 | |||||||||||
Wisconsin (0.8%): | |||||||||||
| Public Finance Authority Revenue 4.00%, 9/1/24 (d) | 1,395 | 1,410 | |||||||||
5.00%, 4/1/30 (d) | 500 | 541 | |||||||||
See notes to financial statements.
20
| USAA Mutual Funds Trust USAA Tax Exempt Short-Term Fund | Schedule of Portfolio Investments — continued March 31, 2020 | ||||||
(Amounts in Thousands, Except for Shares)
Security Description | Principal Amount | Value | |||||||||
| Wisconsin Health & Educational Facilities Authority Revenue 2.25%, 11/1/26, Continuously Callable @100 | $ | 3,000 | $ | 2,890 | |||||||
2.55%, 11/1/27, Continuously Callable @100 | 1,500 | 1,441 | |||||||||
4.00%, 3/15/30 | 400 | 467 | |||||||||
5.36% (MUNIPSA+65bps), 8/15/54, (Put Date 7/31/24) (a) (b) | 1,700 | 1,717 | |||||||||
Series C, 5.00%, 8/15/21 | 1,200 | 1,258 | |||||||||
9,724 | |||||||||||
Total Municipal Bonds (Cost $1,267,150) | 1,260,277 | ||||||||||
Total Investments (Cost $1,271,175) — 98.5% | 1,262,330 | ||||||||||
Other assets in excess of liabilities — 1.5% | 19,713 | ||||||||||
NET ASSETS — 100.00% | $ | 1,282,043 | |||||||||
(a) Variable or Floating-Rate Security. Rate disclosed is as of March 31, 2020.
(b) Put Bond.
(c) Variable Rate Demand Notes that provide the rights to sell the security at face value on either that day or within the rate-reset period. The interest rate is reset on the put date at a stipulated daily, weekly, monthly, quarterly, or other specified time interval to reflect current market conditions. These securities do not indicate a reference rate and spread in their description.
(d) Rule 144A security or other security that is restricted as to resale to institutional investors. The Fund's Adviser has deemed this security to be liquid based upon procedures approved by the Board of Trustees. As of March 31, 2020, the fair value of these securities was $135,586 (thousands) and amounted to 10.6% of net assets.
(e) Security purchased on a when-issued basis.
(f) All or a portion of this security has been designated as collateral for securities purchased on a when-issued basis.
(g) Zero-coupon bond.
(h) The Fund's Adviser has deemed this security to be illiquid based upon procedures approved by the Board of Trustees. As of March 31, 2020, illiquid securities were 0.2% of the Fund's net assets.
(i) Amount is less than $1 thousand.
(j) This security is classified as Level 3 within the fair value hierarchy (See Note 2)
(k) Stepped-coupon security converts to coupon form on September 21, 2021 with a rate of 7.5%.
bps — Basis points
GO — General Obligation
IDA — Industrial Development Authority
LIBOR — London InterBank Offered Rate
LIBOR01M — 1 Month US Dollar LIBOR, rate disclosed as of March 31, 2020, based on the last reset date of the security
LOC — Line Letter of Credit
See notes to financial statements.
21
| USAA Mutual Funds Trust USAA Tax Exempt Short-Term Fund | Schedule of Portfolio Investments — continued March 31, 2020 | ||||||
MUNIPSA — Municipal Swap Index
PLC — Public Limited Company
Credit Enhancements — Adds the financial strength of the provider of the enhancement to support the issuer's ability to repay the principal and interest payments when due. The enhancement may be provided by a high-quality bank, insurance company or other corporation, or a collateral trust. The enhancements do not guarantee the market values of the securities.
INS Principal and interest payments are insured by the name listed. Although bond insurance reduces the risk of loss due to default by an issuer, such bonds remain subject to the risk that value may fluctuate for other reasons, and there is no assurance that the insurance company will meet its obligations.
LIQ Liquidity enhancement that may, under certain circumstances, provide for repayment of principal and interest upon demand from the name listed.
LOC Principal and interest payments are guaranteed by a bank letter of credit or other bank credit agreement.
NBGA Principal and interest payments or, under certain circumstances, underlying mortgages, are guaranteed by a nonbank guarantee agreement from the name listed.
See notes to financial statements.
22
USAA Mutual Funds Trust | Statement of Assets and Liabilities March 31, 2020 | ||||||
(Amounts in Thousands, Except Per Share Amounts)
| USAA Tax Exempt Short-Term Fund | |||||||
Assets: | |||||||
Investments, at value (Cost $1,271,175) | $ | 1,262,330 | |||||
Cash | 106 | ||||||
Receivables: | |||||||
Interest and dividends | 9,836 | ||||||
Capital shares issued | 683 | ||||||
Investments sold | 16,850 | ||||||
From Adviser | 1 | ||||||
Prepaid expenses | 2 | ||||||
Total assets | 1,289,808 | ||||||
Liabilities: | |||||||
Payables: | |||||||
Distributions | 490 | ||||||
Investments purchased | 5,721 | ||||||
Capital shares redeemed | 929 | ||||||
Accrued expenses and other payables: | |||||||
Investment advisory fees | 313 | ||||||
Administration fees | 168 | ||||||
Custodian fees | 1 | ||||||
Transfer agent fees | 77 | ||||||
Compliance fees | 1 | ||||||
Trustees' fees | 2 | ||||||
| 12b-1 fees | 1 | ||||||
Other accrued expenses | 62 | ||||||
Total liabilities | 7,765 | ||||||
Net Assets: | |||||||
Capital | 1,316,996 | ||||||
Total distributable earnings/(loss) | (34,953 | ) | |||||
Net assets | $ | 1,282,043 | |||||
Net Assets | |||||||
Fund Shares | $ | 1,271,899 | |||||
Adviser Shares | 10,144 | ||||||
Total | $ | 1,282,043 | |||||
Shares (unlimited number of shares authorized with no par value): | |||||||
Fund Shares | 123,202 | ||||||
Adviser Shares | 981 | ||||||
Total | 124,183 | ||||||
Net asset value, offering and redemption price per share: (a) | |||||||
Fund Shares | $ | 10.32 | |||||
Adviser Shares | $ | 10.34 | |||||
(a) Per share amount may not recalculate due to rounding of net assets and/or shares outstanding.
See notes to financial statements.
23
USAA Mutual Funds Trust | Statement of Operations For the Year Ended March 31, 2020 | ||||||
(Amounts in Thousands)
| USAA Tax Exempt Short-Term Fund | |||||||
Investment Income: | |||||||
Interest | $ | 32,516 | |||||
Total income | 32,516 | ||||||
Expenses: | |||||||
Investment advisory fees | 4,102 | ||||||
Professional fees | 6 | ||||||
Administration fees — Fund Shares | 2,124 | ||||||
Administration fees — Adviser Shares | 16 | ||||||
Sub-Administration fees | 15 | ||||||
12b-1 fees — Adviser Shares | 27 | ||||||
Custodian fees | 91 | ||||||
Transfer agent fees — Fund Shares | 696 | ||||||
Transfer agent fees — Adviser Shares | 3 | ||||||
Trustees' fees | 44 | ||||||
Compliance fees | 6 | ||||||
Legal and audit fees | 66 | ||||||
State registration and filing fees | 50 | ||||||
Interest expense on interfund lending | — | (a) | |||||
Other expenses | 114 | ||||||
Total expenses | 7,360 | ||||||
Expenses waived/reimbursed by Adviser | (10 | ) | |||||
Expenses waived/reimbursed by AMCO | (10 | ) | |||||
Net expenses | 7,340 | ||||||
Net Investment Income (Loss) | 25,176 | ||||||
Realized/Unrealized Gains (Losses) from Investments: | |||||||
Net realized gains (losses) from investment securities transactions | (2,484 | ) | |||||
Net change in unrealized appreciation/depreciation on investment securities | (17,785 | ) | |||||
Net realized/unrealized gains (losses) on investments | (20,269 | ) | |||||
Change in net assets resulting from operations | $ | 4,907 | |||||
(a) Rounds to less than $1 thousand.
See notes to financial statements.
24
USAA Mutual Funds Trust | Statements of Changes in Net Assets | ||||||
(Amounts in Thousands)
| USAA Tax Exempt Short-Term Fund | |||||||||||
| Year Ended March 31, 2020 | Year Ended March 31, 2019 | ||||||||||
From Investments: | |||||||||||
Operations: | |||||||||||
Net investment income (loss) | $ | 25,176 | $ | 27,957 | |||||||
Net realized gains (losses) from investments | (2,484 | ) | (4,305 | ) | |||||||
| Net change in unrealized appreciation/depreciation on investments | (17,785 | ) | 14,543 | ||||||||
Change in net assets resulting from operations | 4,907 | 38,195 | |||||||||
Distributions to Shareholders: | |||||||||||
Fund Shares | (24,970 | ) | (27,546 | ) | |||||||
Adviser Shares | (167 | ) | (168 | ) | |||||||
Change in net assets resulting from distributions to shareholders | (25,137 | ) | (27,714 | ) | |||||||
Change in net assets resulting from capital transactions | (198,223 | ) | (72,328 | ) | |||||||
Change in net assets | (218,453 | ) | (61,847 | ) | |||||||
Net Assets: | |||||||||||
Beginning of period | 1,500,496 | 1,562,343 | |||||||||
End of period | $ | 1,282,043 | $ | 1,500,496 | |||||||
Capital Transactions: | |||||||||||
Fund Shares | |||||||||||
Proceeds from shares issued | $ | 175,721 | $ | 275,176 | |||||||
Distributions reinvested | 19,688 | 21,955 | |||||||||
Cost of shares redeemed | (393,239 | ) | (368,806 | ) | |||||||
Total Fund Shares | $ | (197,830 | ) | $ | (71,675 | ) | |||||
Adviser Shares | |||||||||||
Proceeds from shares issued | $ | 15,776 | $ | 20,399 | |||||||
Distributions reinvested | 127 | 139 | |||||||||
Cost of shares redeemed | (16,296 | ) | (21,191 | ) | |||||||
Total Adviser Shares | $ | (393 | ) | $ | (653 | ) | |||||
Change in net assets resulting from capital transactions | $ | (198,223 | ) | $ | (72,328 | ) | |||||
Share Transactions: | |||||||||||
Fund Shares | |||||||||||
Issued | 16,721 | 26,365 | |||||||||
Reinvested | 1,874 | 2,103 | |||||||||
Redeemed | (37,505 | ) | (35,346 | ) | |||||||
Total Fund Shares | (18,910 | ) | (6,878 | ) | |||||||
Adviser Shares | |||||||||||
Issued | 1,497 | 1,949 | |||||||||
Reinvested | 12 | 13 | |||||||||
Redeemed | (1,548 | ) | (2,031 | ) | |||||||
Total Adviser Shares | (39 | ) | (69 | ) | |||||||
Change in Shares | (18,949 | ) | (6,947 | ) | |||||||
See notes to financial statements.
25
USAA Mutual Funds Trust | Financial Highlights | ||||||
For a Share Outstanding Throughout Each Period
Investment Activities | Distributions to Shareholders From | ||||||||||||||||||||||||||
| Net Asset Value, Beginning of Period | Net Investment Income (Loss) | Net Realized and Unrealized Gains (Losses) on Investments | Total from Investment Activities | Net Investment Income | Total Distributions | ||||||||||||||||||||||
USAA Tax Exempt Short-Term Fund | |||||||||||||||||||||||||||
Fund Shares | |||||||||||||||||||||||||||
| Year Ended March 31, 2020 | $ | 10.48 | 0.19 | (c) | (0.16 | ) | 0.03 | (0.19 | ) | (0.19 | ) | ||||||||||||||||
| Year Ended March 31, 2019 | $ | 10.41 | 0.19 | 0.07 | 0.26 | (0.19 | ) | (0.19 | ) | ||||||||||||||||||
| Year Ended March 31, 2018 | $ | 10.45 | 0.16 | (0.03 | ) | 0.13 | (0.17 | ) | (0.17 | ) | |||||||||||||||||
| Year Ended March 31, 2017 | $ | 10.59 | 0.15 | (0.14 | ) | 0.01 | (0.15 | ) | (0.15 | ) | |||||||||||||||||
| Year Ended March 31, 2016 | $ | 10.68 | 0.16 | (0.09 | ) | 0.07 | (0.16 | ) | (0.16 | ) | |||||||||||||||||
Adviser Shares | |||||||||||||||||||||||||||
| Year Ended March 31, 2020 | $ | 10.49 | 0.16 | (c) | (0.15 | ) | 0.01 | (0.16 | ) | (0.16 | ) | ||||||||||||||||
| Year Ended March 31, 2019 | $ | 10.42 | 0.17 | 0.06 | 0.23 | (0.16 | ) | (0.16 | ) | ||||||||||||||||||
| Year Ended March 31, 2018 | $ | 10.46 | 0.13 | (0.03 | ) | 0.10 | (0.14 | ) | (0.14 | ) | |||||||||||||||||
| Year Ended March 31, 2017 | $ | 10.59 | 0.12 | (0.13 | ) | (0.01 | ) | (0.12 | ) | (0.12 | ) | ||||||||||||||||
| Year Ended March 31, 2016 | $ | 10.67 | 0.13 | (0.08 | ) | 0.05 | (0.13 | ) | (0.13 | ) | |||||||||||||||||
* Assumes reinvestment of all net investment income and realized capital gain distributions, if any, during the period. Includes adjustments in accordance with U.S. generally accepted accounting principles and could differ from the Lipper reported return.
^ The net expense ratio may not correlate to the applicable expense limits in place during the period since the current contractual expense limitation is applied for a two year period beginning July 1, 2019 and in effect through June 30, 2021, instead of coinciding with the Fund's fiscal year end. Details of the current contractual expense limitation in effect can be found in Note 4 of the accompanying Notes to Financial Statements.
(a) Reflects total annual operating expenses for reductions of expenses paid indirectly for the March 31 fiscal years ended 2017 and 2016. Expenses paid indirectly decreased the expense ratio for each of these respective years by less than 0.01%.
(b) Portfolio turnover is calculated on the basis of the Fund as a whole without distinguishing between the classes of shares issued.
(c) Per share net investment income (loss) has been calculated using the average shares method.
(d) Prior to August 1, 2018, AMCO voluntarily agreed to limit the annual expenses of the Adviser Shares to 0.80% of the Adviser Shares' average daily net assets.
(e) Amount is less than $0.005 per share.
See notes to financial statements.
26
USAA Mutual Funds Trust | Financial Highlights | ||||||
For a Share Outstanding Throughout Each Period
Ratios to Average Net Assets | Supplemental Data | ||||||||||||||||||||||||||||||||||
| Redemption Fees Added to Beneficial Interests | Net Asset Value, End of Period | Total Return* | Net Expenses^(a) | Net Investment Income (Loss) | Gross Expenses(a) | Net Assets, End of Period (000's) | Portfolio Turnover(b) | ||||||||||||||||||||||||||||
USAA Tax Exempt Short-Term Fund | |||||||||||||||||||||||||||||||||||
Fund Shares | |||||||||||||||||||||||||||||||||||
| Year Ended March 31, 2020 | — | $ | 10.32 | 0.23 | % | 0.51 | % | 1.77 | % | 0.51 | % | $ | 1,271,899 | 54 | % | ||||||||||||||||||||
| Year Ended March 31, 2019 | — | $ | 10.48 | 2.52 | % | 0.52 | % | 1.84 | % | 0.52 | % | $ | 1,489,789 | 31 | % | ||||||||||||||||||||
| Year Ended March 31, 2018 | — | $ | 10.41 | 1.21 | % | 0.51 | % | 1.57 | % | 0.51 | % | $ | 1,550,994 | 25 | % | ||||||||||||||||||||
| Year Ended March 31, 2017 | — | $ | 10.45 | 0.09 | % | 0.54 | % | 1.43 | % | 0.54 | % | $ | 1,669,691 | 34 | % | ||||||||||||||||||||
| Year Ended March 31, 2016 | — | $ | 10.59 | 0.62 | % | 0.55 | % | 1.47 | % | 0.55 | % | $ | 1,760,074 | 25 | % | ||||||||||||||||||||
Adviser Shares | |||||||||||||||||||||||||||||||||||
| Year Ended March 31, 2020 | — | $ | 10.34 | 0.09 | % | 0.75 | % | 1.54 | % | 0.93 | % | $ | 10,144 | 54 | % | ||||||||||||||||||||
| Year Ended March 31, 2019 | — | $ | 10.49 | 2.27 | % | 0.77 | %(d) | 1.56 | % | 0.92 | % | $ | 10,707 | 31 | % | ||||||||||||||||||||
| Year Ended March 31, 2018 | — | $ | 10.42 | 0.91 | % | 0.80 | % | 1.27 | % | 0.83 | % | $ | 11,349 | 25 | % | ||||||||||||||||||||
| Year Ended March 31, 2017 | — | $ | 10.46 | (0.08 | )% | 0.80 | % | 1.16 | % | 0.81 | % | $ | 32,191 | 34 | % | ||||||||||||||||||||
| Year Ended March 31, 2016 | — | (e) | $ | 10.59 | 0.46 | % | 0.80 | % | 1.17 | % | 0.83 | % | $ | 31,017 | 25 | % | |||||||||||||||||||
See notes to financial statements.
27
USAA Mutual Funds Trust | Notes to Financial Statements March 31, 2020 | ||||||
1. Organization:
USAA Mutual Funds Trust (the "Trust") is organized as a Delaware statutory trust and is registered under the Investment Company Act of 1940, as amended (the "1940 Act"), as an open-end investment company. The Trust is comprised of 47 funds and is authorized to issue an unlimited number of shares, which are units of beneficial interest with no par value.
The accompanying financial statements are those of the USAA Tax Exempt Short-Term Fund (the "Fund"). The Fund offers two classes of shares: Fund Shares and Adviser Shares. The Fund is classified as diversified under the 1940 Act.
Each class of shares of the Fund has substantially identical rights and privileges except with respect to fees paid under distribution plans, expenses allocable exclusively to each class of shares, voting rights on matters solely affecting a single class of shares, and the exchange privilege of each class of shares.
On November 6, 2018, United Services Automobile Association ("USAA"), the parent company of USAA Asset Management Company ("AMCO"), the investment adviser to the Fund, and USAA Transfer Agency Company, d/b/a USAA Shareholder Account Services ("SAS"), the transfer agent to the Fund, announced that AMCO and SAS would be acquired by Victory Capital Holdings Inc., a global investment management firm headquartered in Cleveland, Ohio (the "Transaction"). The Transaction closed on July 1, 2019. A special shareholder meeting was held on April 18, 2019, at which shareholders of the Fund approved a new investment advisory agreement between the Trust, on behalf of the Fund, and Victory Capital Management Inc. ("VCM" or "Adviser"). Effective July 1, 2019, VCM replaced AMCO as the investment adviser to the Fund and Victory Capital Transfer Agency Company replaced SAS as the Fund's transfer agent. In addition, effective on that same date, shareholders of the Fund also elected the following two new directors to the Board of the Trust to serve upon the closing of the Transaction: (1) David C. Brown, to serve as an Interested Trustee; and (2) John C. Walters, to serve as an Independent Trustee.
Under the Trust's organizational documents, its officers and trustees are indemnified against certain liabilities arising out of the performance of their duties to the Fund. In addition, in the normal course of business, the Fund enters into contracts with its vendors and others that provide for general indemnifications. The Fund's maximum exposure under these arrangements is unknown, as this would involve future claims that may be made against the Fund. However, based on experience, the Fund expects that risk of loss to be remote.
2. Significant Accounting Policies:
The following is a summary of significant accounting policies followed by the Trust in the preparation of its financial statements. The policies are in conformity with generally accepted accounting principles in the United States of America ("GAAP"). The preparation of financial statements in accordance with GAAP requires management to make estimates and assumptions that affect the reported amounts of assets and liabilities and disclosure of contingent assets and liabilities at the date of the financial statements and the reported amounts of income and expenses for the period. Actual results could differ from those estimates. The Fund follows the specialized accounting and reporting requirements under GAAP that are applicable to investment companies under Accounting Standards Codification Topic 946.
Investment Valuation:
The Fund records investments at fair value. Fair value is defined as the price that would be received to sell an asset or paid to transfer a liability in an orderly transaction between market participants at the measurement date.
The valuation techniques described below maximize the use of observable inputs and minimize the use of unobservable inputs in determining fair value. The inputs used for valuing the Fund's investments are summarized in the three broad levels listed below:
• Level 1 — quoted prices in active markets for identical securities
• Level 2 — other significant observable inputs (including quoted prices for similar securities or interest rates applicable to those securities, etc.)
• Level 3 — significant unobservable inputs (including the Fund's own assumptions in determining the fair value of investments)
28
USAA Mutual Funds Trust | Notes to Financial Statements — continued March 31, 2020 | ||||||
Changes in valuation techniques may result in transfers in or out of an assigned level within the disclosure hierarchy. The inputs or methodologies used for valuation techniques are not necessarily an indication of the risk associated with entering into those investments.
The Adviser has established the Pricing and Liquidity Committee (the "Committee"), and subject to the Trust's Board of Trustees (the "Board") oversight, the Committee administers and oversees the Fund's valuation policies and procedures, which are approved by the Board.
Debt securities of United States ("U.S.") issuers, along with corporate and municipal securities, including short-term investments maturing in 60 days or less, may be valued using evaluated bid or the last sales price to price securities by dealers or an independent pricing service approved by the Board. These valuations are typically categorized as Level 2 in the fair value hierarchy.
Portfolio securities listed or traded on securities exchanges, including exchange-traded funds ("ETFs"), American Depositary Receipts ("ADRs") and Rights, are valued at the closing price on the exchange or system where the security is principally traded, if available, or at the Nasdaq Official Closing Price. If there have been no sales for that day on the exchange or system, then a security is valued at the last available bid quotation on the exchange or system where the security is principally traded. In each of these situations, valuations are typically categorized as Level 1 in the fair value hierarchy.
Effective July 1, 2019, the valuation methodology applied to certain debt securities changed. Securities that were previously valued at an evaluated mean are now valued at the evaluated bid or the last sales price.
In the event that price quotations or valuations are not readily available, are not reflective of market value, or a significant event has been recognized in relation to a security or class of securities, the securities are valued in good faith by the Committee in accordance with valuation procedures approved by the Board. These valuations typically are categorized as Level 2 or Level 3 in the fair value hierarchy, based on the observability of inputs used to determine the fair value. The effect of fair value pricing is that securities may not be priced on the basis of quotations from the primary market in which they are traded and the actual price realized from the sale of a security may differ materially from the fair value price. Valuing these securities at fair value is intended to cause the Fund's net asset value ("NAV") to be more reliable than it otherwise would be.
A summary of the valuations as of March 31, 2020, based upon the three levels defined above, is included in the table below while the breakdown, by category, of investments is disclosed in the Schedule of Portfolio Investments (amounts in thousands):
Level 1 | Level 2 | Level 3 | Total | ||||||||||||||||
Common Stocks | $ | 2,053 | $ | — | $ | — | $ | 2,053 | |||||||||||
Municipal Bonds | — | 1,258,104 | 2,173 | 1,260,277 | |||||||||||||||
Total | $ | 2,053 | $ | 1,258,104 | $ | 2,173 | $ | 1,262,330 | |||||||||||
For the year ended March 31, 2020, there were no transfers in or out of the Level 3 fair value hierarchy.
Securities Purchased on a Delayed-Delivery or When-Issued Basis:
The Fund may purchase securities on a delayed-delivery or when-issued basis. Delivery and payment for securities that have been purchased by the Fund on a delayed-delivery, or when-issued basis, or for delayed draws on loans can take place a month or more after the trade date. At the time the Fund makes the commitment to purchase a security on a delayed-delivery or when-issued basis, the Fund records the transaction and reflects the value of the security in determining net asset value. No interest accrues to the Fund until the transaction settles and payment takes place. A segregated account is established and the Fund maintains cash and/or marketable securities at least equal in value to commitments for delayed-delivery or when-issued securities. If the Fund owns delayed-delivery or when-issued securities, these values are included in Payable for investments purchased on the accompanying Statement of Assets and Liabilities and the segregated assets are identified in the Schedule of Portfolio Investments.
29
USAA Mutual Funds Trust | Notes to Financial Statements — continued March 31, 2020 | ||||||
Municipal Obligations:
The values of municipal obligations can fluctuate and may be affected by adverse tax, legislative, or political changes, and by financial developments affecting municipal issuers. Payment of municipal obligations may depend on a relatively limited source of revenue, resulting in greater credit risk. Future changes in federal tax laws or the activity of an issuer may adversely affect the tax-exempt status of municipal obligations.
Investment Transactions and Related Income:
Changes in holdings of investments are accounted for no later than one business day following the trade date. For financial reporting purposes, however, investment transactions are accounted for on trade date on the last business day of the reporting period. Interest income is determined on the basis of coupon interest accrued using the effective interest method which adjusts, where applicable, the amortization of premiums or accretion of discount. Gains or losses realized on sales of securities are determined by comparing the identified cost of the security lot sold with the net sales proceeds.
Federal Income Taxes:
It is the Fund's policy to continue to qualify as a regulated investment company by complying with the provisions available to certain investment companies, as defined in applicable sections of the Internal Revenue Code, and to make distributions of net investment income and net realized gains sufficient to relieve it from all, or substantially all, federal income taxes. Accordingly, no provision for federal income taxes is required in the financial statements. The Fund has a tax year end of March 31.
Management of the Fund has reviewed tax positions taken in tax years that remain subject to examination by all major tax jurisdictions, including federal (i.e., the last four tax years which includes the current fiscal tax year end). Management believes that there is no tax liability resulting from unrecognized tax benefits related to uncertain tax positions taken.
Allocations:
Expenses directly attributable to the Fund are charged to the Fund, while expenses that are attributable to more than one fund in the Trust, or jointly with an affiliated trust, are allocated among the respective funds in the Trust and/or affiliated trust based upon net assets or another appropriate basis.
Income, expenses (other than class-specific expenses such as transfer agent fees, state registration fees, distribution and service 12b-1 fees, and printing fees), and realized and unrealized gains or losses on investments are allocated to each class of shares based on its relative net assets on the date income is earned or expenses and realized and unrealized gains and losses are incurred.
Cross-Trade Transactions:
Pursuant to Rule 17a-7 under the 1940 Act, the Fund may engage in cross-trades, which are securities transactions with affiliated investment companies and advisory accounts managed by the Adviser and any applicable sub-adviser. Any such purchase or sale transaction must be effected without brokerage commission or other remuneration, except for customary transfer fees. The transaction must be effected at the current market price, which is either the security's last sale price on an exchange or, if there are no transactions in the security that day, at the average of the highest bid and lowest asked price. For the year ended March 31, 2020, the Fund engaged in the following securities transactions with affiliated funds, which resulted in the following net realized gains (losses) (amounts in thousands):
| Purchases | Sales | Net Realized Gains (Losses) | |||||||||
| $ | 67,270 | $ | 104,625 | $ | — | ||||||
Fees Paid Indirectly:
Expense offsets to custody fees that arise from credits on cash balances maintained on deposit are reflected on the Statement of Operations, as applicable, as "Fees paid indirectly."
30
USAA Mutual Funds Trust | Notes to Financial Statements — continued March 31, 2020 | ||||||
3. Purchases and Sales:
Cost of purchases and proceeds from sales/maturities of securities (excluding securities maturing less than one year from acquisition) for the year ended March 31, 2020, were as follows for the Fund (amounts in thousands):
| Excluding U.S. Government Securities | |||||||
Purchases | Sales | ||||||
$ | 630,079 | $ | 859,715 | ||||
There were no purchases and sales of U.S. government securities during the year ended March 31, 2020.
4. Fees and Transactions with Affiliates and Related Parties:
Investment Advisory and Management Fees:
Effective with the Transaction on July 1, 2019, investment advisory services are provided to the Fund by the Adviser, a New York corporation registered as an investment adviser with the Securities and Exchange Commission ("SEC"). The Adviser is a wholly-owned indirect subsidiary of Victory Capital Holdings, Inc., a publicly traded Delaware corporation, and a wholly-owned direct subsidiary of Victory Capital Operating, LLC. Under the terms of the Investment Advisory Agreement, the Adviser is entitled to receive a base fee and a performance adjustment. The Fund's base fee is accrued daily and paid monthly at an annualized rate of 0.28% of the Fund's average daily net assets. The amount incurred and paid to VCM from July 1, 2019 through March 31, 2020, was $3,069 thousand and is reflected on the Statement of Operations as Investment Advisory fees.
Prior to the Transaction on July 1, 2019, AMCO provided investment management services to the Fund pursuant to an Advisory Agreement. Under this agreement, AMCO was responsible for managing the business and affairs of the Fund, and for directly managing day-to-day investment of the Fund's assets, subject to the authority of and supervision by the Board. The investment management fee for the Fund was comprised of a base fee and a performance adjustment. The Fund's base fee was accrued daily and paid monthly at an annualized rate of 0.28% of the Fund's average daily net assets.
Effective with the Transaction on July 1, 2019, no performance adjustments will be made for periods beginning July 1, 2019 through June 30, 2020. Only performance beginning as of July 1, 2019, and thereafter will be utilized in calculating future performance adjustments.
Prior to the Transaction on July 1, 2019, the performance adjustment for each share class was calculated monthly by comparing the Fund's performance to that of the Lipper Short Municipal Debt Funds Index. The Lipper Short Municipal Debt Funds Index tracks the total return performance of funds within the Lipper Short Municipal Debt Funds category.
The performance period for each share class consists of the current month plus the previous 35 months (or the number of months beginning July 1, 2019, if fewer). The following table is utilized to determine the extent of the performance adjustment:
| Over/Under Performance Relative to Index (in basis points)(a) | Annual Adjustment Rate (in basis points)(a) | ||||||
+/- 20 to 50 | +/- 4 | ||||||
+/- 51 to 100 | +/- 5 | ||||||
+/- 101 and greater | +/- 6 | ||||||
(a) Based on the difference between average annual performance of the relevant share class of the Fund and its relevant index, rounded to the nearest basis point. Average daily net assets of the share class are calculated over a rolling 36-month period.
31
USAA Mutual Funds Trust | Notes to Financial Statements — continued March 31, 2020 | ||||||
Each class' annual performance adjustment rate is multiplied by the average daily net assets of each respective class over the entire performance period, which is then multiplied by a fraction, the numerator of which is the number of days in the month and the denominator of which is 365 (366 in leap years). The resulting amount is then added to (in the case of overperformance), or subtracted from (in the case of underperformance) the base fee.
Under the performance fee arrangement, each class pays a positive performance fee adjustment for a performance period whenever the class outperforms the Lipper Short Municipal Debt Funds Index over that period, even if the class has overall negative returns during the performance period.
For the period April 1, 2019 through June 30, 2019, the performance adjustment for Fund Shares was $106 thousand and 0.01% of net assets. The Advisor Shares did not incur any performance adjustment. Base fees incurred and paid to AMCO from April 1, 2019 through June 30, 2019, were $1,033 thousand and reflected on the Statement of Operations as Investment Advisory fees.
Administration and Servicing Fees:
Effective with the Transaction on July 1, 2019, VCM serves as the Fund's administrator and fund accountant. Under the Fund Administration, Servicing and Accounting Agreement, VCM is paid for its services an annual fee at a rate of 0.15% of average daily net assets for both the Fund Shares and Adviser Shares. Amounts incurred from July 1, 2019 through March 31, 2020, are $1,575 and $11 thousand for Fund Shares and Adviser Shares, respectively. These amounts are reflected on the Statement of Operations as Administration fees.
Prior to the Transaction on July 1, 2019, AMCO provided certain administration and servicing functions for the Fund. For such services, AMCO received a fee accrued daily and paid monthly at an annualized rate of 0.15% of average daily net assets for both the Fund Shares and Adviser Shares. Amounts incurred from April 1, 2019 through June 30, 2019, were $549 and $5 thousand for Fund Shares and Adviser Shares, respectively. These amounts are reflected on the Statement of Operations as Administration fees
Effective with the Transaction on July 1, 2019, the Fund (as part of the Trust) has entered into an agreement to provide compliance services with the Adviser, pursuant to which the Adviser furnishes its compliance personnel, including the services of the Chief Compliance Officer ("CCO"), and other resources reasonably necessary to provide the Trust with compliance oversight services related to the design, administration and oversight of a compliance program for the Trust in accordance with Rule 38a-1 under the 1940 Act. The CCO is an employee of the Adviser, which pays the compensation of the CCO and support staff. Funds in the Trust, Victory Variable Insurance Funds, Victory Portfolios and Victory Portfolios II (collectively, the "Victory Funds Complex") in the aggregate, compensate the Adviser for these services. The amount incurred during the period from July 1, 2019 through March 31, 2020, is reflected on the Statement of Operations as Compliance fees.
Effective with the Transaction on July 1, 2019, Citi Fund Services Ohio, Inc. ("Citi"), an affiliate of Citibank, acts as sub-administrator and sub-fund accountant to the Fund pursuant to a Sub- Administration and Sub-Fund Accounting Services Agreement between VCM and Citi. VCM pays Citi a fee for providing these services. The Trust reimburses VCM and Citi for all of their reasonable out-of- pocket expenses incurred in providing these services and certain other expenses specifically allocated to the Funds, under the Fund Administration, Servicing, and Accounting Agreement. The amount incurred during the period from July 1, 2019 through March 31, 2020, is reflected on the Statement of Operations as Sub-Administration fees.
In addition to the services provided under its Administration and Servicing Agreement with the Fund, AMCO also provided certain compliance and legal services for the benefit of the Fund prior to the Transaction on July 1, 2019. The Board approved the reimbursement of a portion of these expenses incurred by AMCO. Amounts reimbursed by the Fund to AMCO for these compliance and legal services are presented on the Statement of Operations as Professional fees.
32
USAA Mutual Funds Trust | Notes to Financial Statements — continued March 31, 2020 | ||||||
Transfer Agency Fees:
Effective with the Transaction on July 1, 2019, Victory Capital Transfer Agency, Inc. ("VCTA"), (formerly, USAA Shareholder Account Services ("SAS")), provides transfer agency services to the Fund. VCTA, an affiliate of the Adviser, provides transfer agent services to the Fund Shares and Adviser Shares based on an annual charge of $25.50 per shareholder account plus out-of-pocket expenses. VCTA pays a portion of these fees to certain intermediaries for the administration and servicing of accounts that are held with such intermediaries. Amounts incurred and paid to VCTA from July 1, 2019 through March 31, 2020, was $554 and $2 thousand for the Fund Shares and Adviser Shares, respectively. Amounts incurred and paid to SAS from April 1, 2019 through June 30, 2019, was $163 and $1 thousand for the Fund Shares and Adviser Shares, respectively. These amounts are reflected on the Statement of Operations as Transfer agent fees.
Effective with the Transaction on July 1, 2019, FIS Investor Services LLC serves as sub-transfer agent and dividend disbursing agent for the Fund pursuant to a Sub-Transfer Agent agreement between VCTA and FIS Investor Services LLC. VCTA provides FIS Investor Services LLC a fee for providing these services.
Distribution and Service 12b-1 Fees:
Effective with the Transaction on July 1, 2019, Victory Capital Advisers, Inc. (the "Distributor"), an affiliate of the Adviser, serves as distributor for the continuous offering of the Adviser Shares pursuant to a Distribution Agreement between the Distributor and the Trust. Effective on or about June 30, 2020, the Distributor's name will change to Victory Capital Services, Inc. Pursuant to the Distribution and Service Plans adopted in accordance with Rule 12b-1 under the 1940 Act, the Distributor may receive a monthly distribution and service fee, at an annual rate of up to 0.25% of the average daily net assets of the Adviser Shares. Amounts incurred and paid to the Distributor from July 1, 2019 through March 31, 2020, are $20 thousand and reflected on the Statement of Operations as 12b-1 fees.
Adviser Shares are offered and sold without imposition of an initial sales charge or a contingent deferred sales charge.
Prior to the Transaction on July 1, 2019, the Fund adopted a plan pursuant to Rule 12b-1 under the 1940 Act with respect to the Adviser Shares. Under the plan, the Adviser Shares paid fees to USAA Investment Management Company ("IMCO"), the distributor, for distribution and shareholder services. IMCO paid all or a portion of such fees to intermediaries that made the Adviser Shares available for investment by their customers. The fee was accrued daily and paid monthly at an annual rate of 0.25% of the Adviser Shares' average daily net assets. IMCO also provided exclusive underwriting and distribution of the Fund's shares on a continuing best-efforts basis and received no fee or other compensation for these services, but may have received 12b-1 fees as described above, with respect to Adviser Shares. Amounts incurred and paid to IMCO from April 1, 2019 through June 30, 2019, were $7 thousand and reflected on the Statement of Operations as 12b-1 fees.
Other Fees:
Prior to the Transaction on July 1, 2019, State Street Bank and Trust Company served as the Fund's accounting agent and custodian.
Effective August 5, 2019, Citibank, N.A., serves as the Fund's custodian.
K&L Gates LLP provides legal services to the Trust.
Effective with the Transaction on July 1, 2019, the Adviser has entered into an expense limitation agreement with the Fund until at least June 30, 2021. Under the terms of the agreement, the Adviser has agreed to waive fees or reimburse certain expenses to the extent that ordinary operating expenses incurred by certain classes of the Fund in any fiscal year exceed the expense limit for such classes of the Fund. Such excess amounts will be the liability of the Adviser. Interest, taxes, brokerage commissions, other expenditures, which are capitalized in accordance with GAAP, and other extraordinary expenses not incurred in the ordinary course of the Fund's business are excluded from the expense limits.
33
USAA Mutual Funds Trust | Notes to Financial Statements — continued March 31, 2020 | ||||||
Effective July 1, 2019 through March 31, 2020, the expense limits (excluding voluntary waivers) are 0.51% and 0.75% for the Fund Shares and Adviser Shares, respectively.
Under this expense limitation agreement, the Fund has agreed to repay fees and expenses that were waived or reimbursed by the Adviser for a period up to three years after the fiscal year in which the waiver or reimbursement took place, subject to the lesser of any operating expense limits in effect at the time of: (a) the original waiver or expense reimbursement; or (b) the recoupment, after giving effect to the recoupment amount. As of March 31, 2020, the following amounts are available to be repaid to the Adviser (amounts in thousands).
Expires 03/31/2023 | |||||||
$ | 10 | ||||||
The Adviser, may voluntarily waive or reimburse additional fees to assist the Fund in maintaining competitive expense ratios. Voluntary waivers and reimbursements applicable to the Fund are not available to be recouped at a future time. There were no voluntary waivers or reimbursements for the year ended March 31, 2020.
Prior to the Transaction on July 1, 2019, AMCO agreed, through July 31, 2019, to limit the total annual operating expenses of the Adviser Shares to 0.75% of average daily net assets, excluding extraordinary expenses and before reductions of any expenses paid indirectly, and to reimburse the Adviser Shares for all expenses in excess of those amounts. Effective with the Transaction on July 1, 2019, this expense limit is no longer in effect and is not available to be recouped by AMCO. For the period April 1, 2019 through June 30, 2019, amounts reimbursed by the Adviser Shares are reflected on the Statement of Operations as Expenses waived/reimbursed by AMCO.
Certain officers and/or interested trustees of the Fund are also officers and/or employees of the Adviser, Administrator, Sub-Administrator, Sub-Fund Accountant, and Legal.
5. Risks:
The Fund may be subject to other risks in addition to these identified risks.
The Fund may be subject to various risks as described in the Fund's prospectus. A widespread health crisis such as a global pandemic could cause substantial market volatility, exchange trading suspensions and closures, impact the ability to complete redemptions, and affect Fund performance. For example, the novel coronavirus disease (COVID-19) has resulted in significant disruptions to global business activity that may continue, worsen and/or trigger other factors impacting the liquidity or value of investments. The impact of health crises and other epidemics and pandemics may affect the global economy in ways that cannot necessarily be foreseen at the present time. Health crises may exacerbate other pre-existing political, social, and economic risks. Any such impact could adversely affect the Funds' performance, resulting in losses to your investment. For more information, please refer to the "Principal risks" section of the Fund's prospectus.
The fixed-income securities held in the Fund's portfolio are subject to credit risk, which is the possibility that an issuer of a fixed-income security will fail to make timely interest and/or principal payments on its securities or that negative market perceptions of the issuer's ability to make such payments will cause the price of that security to decline. The Fund accepts some credit risk as a recognized means to enhance an investor's return. All fixed-income securities, varying from the highest quality to the very speculative, have some degree of credit risk. Fixed-income securities rated below investment grade, also known as "junk" or high-yield bonds, generally entail greater economic, credit, and liquidity risk than investment-grade securities. Their prices may be more volatile, especially during economic downturns, financial setbacks, or liquidity events.
The Fund is subject to the risk that the market value of the bonds in its portfolio will fluctuate because of changes in interest rates, changes in the supply of and demand for tax-exempt securities, and other market factors. Bond prices generally are linked to the prevailing market interest rates. In general, when interest rates rise, bond prices fall; conversely, when interest rates fall, bond prices rise. The price volatility of a bond also depends on its duration. Generally, the longer the duration of a bond, the
34
USAA Mutual Funds Trust | Notes to Financial Statements — continued March 31, 2020 | ||||||
greater is its sensitivity to interest rates. To compensate investors for this higher interest rate risk, bonds with longer durations generally offer higher yields than bonds with shorter durations. Decisions by the U.S. Federal Reserve regarding interest rate and monetary policy can have a significant effect on the value of debt securities as well as the overall strength of the U.S. economy. Precise interest rate predictions are difficult to make, and interest rates may change unexpectedly and dramatically in response to extreme changes in market or economic conditions. Interest rates have been unusually low in recent years in the U.S. and abroad, and central banks have reduced rates further in an effort to combat the economic effects of the COVID-19 pandemic. Extremely low or negative interest rates may become more prevalent or may not work as intended, and the impact on various markets that interest rate or other significant policy changes may have is unknown. The ability of an issuer of a debt security to repay principal prior to a security's maturity can increase the security's sensitivity to interest rate changes.
During a period of declining interest rates, many municipal bonds may be "called," or redeemed, by the issuer before the stated maturity. An issuer might call, or refinance, a higher-yielding bond for the same reason that a homeowner would refinance a home mortgage. When bonds are called, the Fund is affected in several ways. Most likely, the Fund will reinvest the bond-call proceeds in bonds with lower interest rates. The Fund's income may drop as a result. The Fund also may realize a taxable capital gain (or loss).
6. Borrowing and Interfund Lending:
Line of Credit:
Effective with the Transaction on July 1, 2019, the Victory Funds Complex participates in a short-term, demand note "Line of Credit" agreement with Citibank. Under the agreement with Citibank, the Victory Funds Complex could borrow up to $600 million, of which $300 million is committed and $300 million is uncommitted. $40 million of the Line of Credit is reserved for use by the Victory Floating Rate Fund, another series of the Victory Funds Complex, with that Fund paying the related commitment fees for that amount. The purpose of the agreement is to meet temporary or emergency cash needs. Citibank receives an annual commitment fee of 0.15% on $300 million for providing the Line of Credit. Each fund in the Victory Funds Complex pays a pro-rata portion of the commitment fees plus any interest (one month LIBOR plus one percent) on amounts borrowed. Interest charged to the Fund, if any, during the period is presented on the Statement of Operations under line of credit fees.
Prior to the Transaction on July 1, 2019, the line of credit among the Trust, with respect to its funds, and USAA Capital Corporation ("CAPCO") terminated. For the period from April 1, 2019 to June 30, 2019, the Fund paid CAPCO facility fees of $3 thousand.
The average borrowing for the days outstanding and average interest rate for the Fund during the year ended March 31, 2020 were as follows (amounts in thousands):
| Amount Outstanding at March 31, 2020 | Average Borrowing* | Days Borrowings Outstanding | Average Interest Rate | Maximum Borrowing During the Period | |||||||||||||||
$ | — | $ | 3,000 | 1 | 2.46 | % | $ | 3,000 | |||||||||||
* For the year ended March 31,2020, based on the number of days borrowings were outstanding.
Interfund Lending:
Effective with the Transaction on July 1, 2019, the Trust and Adviser rely on an exemptive order granted by the SEC in March 2017 (the "Order"), permitting the establishment and operation of an Interfund Lending Facility (the "Facility"). The Facility allows the Fund to directly lend and borrow money to or from any other Fund in the Victory Fund Complex relying upon the Order at rates beneficial to both the borrowing and lending funds. Advances under the Facility are allowed for temporary or emergency purposes. The interfund loan rate is determined, as specified in the Order, by averaging the current
35
USAA Mutual Funds Trust | Notes to Financial Statements — continued March 31, 2020 | ||||||
repurchase agreement rate and the current bank loan rate. As a Borrower, interest charged to the Fund, if any, during the period is presented on the Statement of Operations under Interest expense on Interfund lending. As a Lender, interest earned by the Fund, if any, during the period is presented on the Statement of Operations under Income on Interfund lending.
The average borrowing and lending for the days outstanding and average interest rate for the Fund during the year ended March 31, 2020 were as follows (amounts in thousands):
| Borrower or Lender | Amount Outstanding at March 31, 2020 | Average Borrowing* | Days Borrowing Outstanding | Average Interest Rate | Maximum Borrowing During the Period | ||||||||||||||||||||||
Borrower | $ | — | $ | 6,463 | 5 | 2.13 | % | $ | 9,821 | ||||||||||||||||||
*For the year ended March 31, 2020, based on the number of days borrowings were outstanding.
7. Federal Income Tax Information:
The Fund intends to declare daily and distribute any net investment income monthly. Distributable net realized gains, if any, are declared and paid at least annually.
The amounts of dividends from net investment income and distributions from net realized gains (collectively distributions to shareholders) are determined in accordance with federal income tax regulations, which may differ from GAAP. To the extent these "book/tax" differences are permanent in nature (e.g., net operating loss and distribution reclassification), such amounts are reclassified within the components of net assets based on their federal tax-basis treatment; temporary differences (e.g., wash sales) do not require reclassification. To the extent dividends and distributions exceed net investment income and net realized gains for tax purposes, they are reported as distributions of capital. Net investment losses incurred by the Fund may be reclassified as an offset to capital on the accompanying Statement of Assets and Liabilities.
As of March 31, 2020, on the Statement of Assets and Liabilities, there were no permanent book-to-tax difference reclassification adjustments.
The tax character of distributions paid during the tax years ended as noted below, were as follows (total distributions paid may differ from the Statement of Changes in Net Assets because, for tax purposes, dividends are recognized when actually paid) (amounts in thousands):
Year Ended March 31, 2020 | Year Ended March 31, 2019 | ||||||||||||||||||
Distributions Paid From | Distributions Paid From | ||||||||||||||||||
| Tax-Exempt Income | Total Distributions Paid | Tax-Exempt Income | Total Distributions Paid | ||||||||||||||||
$ | 25,137 | $ | 25,137 | $ | 27,714 | $ | 27,714 | ||||||||||||
As of the tax year ended March 31, 2020, the components of accumulated earnings (deficit) on a tax basis were as follows (amounts in thousands):
| Undistributed Tax Exempt Income | Distributions Payable | Accumulated Capital and Other Losses | Unrealized Appreciation (Depreciation) | Total Accumulated Earnings (Deficit) | |||||||||||||||||||
$ | 2,425 | $ | (2,445 | ) | $ | (26,088 | ) | $ | (8,845 | ) | $ | (34,953 | ) | ||||||||||
36
USAA Mutual Funds Trust | Notes to Financial Statements — continued March 31, 2020 | ||||||
At March 31, 2020, the Fund had net capital loss carryforwards as shown in the table below (amounts in thousands). It is unlikely that the Board will authorize a distribution of capital gains realized in the future until the capital loss carryforwards have been used.
| Short-Term Amount | Long-Term Amount | Total | |||||||||
| $ | 2,113 | $ | 23,975 | $ | 26,088 | ||||||
As of March 31, 2020, the cost basis for federal income tax purposes, gross unrealized appreciation, gross unrealized depreciation, and net unrealized appreciation (depreciation) for investments were as follows (amounts in thousands):
| Cost of Investments for Federal Tax Purposes | Gross Unrealized Appreciation | Gross Unrealized Depreciation | Net Unrealized Appreciation (Depreciation) | ||||||||||||
| 1,271,175 | 9,638 | (18,483 | ) | (8,845 | ) | ||||||||||
8. Liquidity Risk Management Program:
The USAA Funds have adopted and implemented a written liquidity risk management program (the "LRMP") as required by Rule 22e-4 under the Investment Company Act of 1940, as amended. The LRMP is reasonably designed to assess and manage the Fund's liquidity risk, taking into consideration the Fund's investment strategy and the liquidity of its portfolio investments during normal and reasonably foreseeable stressed market conditions; its short and long-term cash flow projections; and its cash holdings and access to other liquidity management tools such as available funding sources including the Victory Funds Complex Interfund Lending Facility and Line of Credit (discussed in the Notes to Financial Statements). The USAA Funds' Board of Trustees approved the appointment of the Fund's investment adviser, Victory Capital Management Inc. ("Victory Capital"), as the administrator of the LRMP. At an in-person meeting held on February 26, 2020, Victory Capital provided an oral and written report to the Trustees on the operation and effectiveness of the LRMP during the previous year.
Victory Capital manages liquidity risks associated with the Fund's investments by monitoring, among other things, cash and cash equivalents, any use of derivatives, the concentration of investments, the appropriateness of the Fund's investment strategy, and by classifying every fund investment as either highly liquid, moderately liquid, less liquid or illiquid on at least a monthly basis. To assist with the classification of Fund investments, Victory Capital has retained a third-party provider of liquidity evaluation services. This provider determines preliminary liquidity classifications for all portfolio holdings based upon portfolio-level data and certain assumptions provided by Victory Capital. Victory Capital reviews the preliminary liquidity classifications, and, when appropriate, considers other information including input from the Fund's portfolio managers (including the portfolio managers employed by any investment sub-advisers) in determining final liquidity classifications.
The report from Victory Capital concluded that the Fund did not experience any significant liquidity challenges during the covered period, and the Fund's LRMP is reasonably designed to assess and manage its liquidity risk. The report also concluded that the LRMP continues to operate adequately and effectively to enable Victory Capital to oversee and manage liquidity risk and ensure the Fund is able to meet redemption requests without significant dilution to the remaining investors' interest in the Fund. During the review period, the Fund's portfolio consisted primarily of highly liquid investments, which are defined as cash and any investments reasonably expected to be converted to cash in current market conditions in three business days or less without significantly changing the market value of the investment. Therefore, the Fund has not adopted a Highly Liquid Investment Minimum. The Fund's investments were below the limitation on illiquid investments during the review period. Additionally, Victory Capital indicated that no events occurred that would require the filing of Form N-LIQUID and recommended no material changes to the LRMP.
37
USAA Mutual Funds Trust | Notes to Financial Statements — continued March 31, 2020 | ||||||
9. Subsequent Events:
An outbreak of respiratory disease called COVID-19 was first detected in China in December 2019 and subsequently spread internationally. The transmission of COVID-19 and efforts to contain its spread have resulted in international, national and local border closings and other significant travel restrictions and disruptions, significant disruptions to business operations, supply chains and consumer activity, significant challenges in healthcare service preparation and delivery, and quarantines, as well as general concern and uncertainty that has negatively affected the economic environment and that occurred subsequent to year end may have a significant negative impact on the operations and profitability of the Funds' investments. These impacts have caused significant volatility and declines in global financial markets, which have caused losses for investors. The impact of the COVID-19 pandemic may be short term or may last for an extended period of time, and in either case could result in a substantial economic downturn or recession. Public health crises may exacerbate other pre-existing political, social, economic, market and financial risks. The extent of the impact to the financial performance of the Funds' investments will depend on future developments, including (i) the duration and spread of the outbreak, (ii) the restrictions and advisories, (iii) the effects on the financial markets, and (iv) the effects on the economy overall, all of which are highly uncertain and cannot be predicted.
The Board of Trustees of USAA Mutual Funds Trust has approved redesignating the Fund's current Adviser Shares as "Class A" shares ("Redesignation"). This change is expected to be effective in late June 2020 ("Redesignation Date").
Class A shares will be available for purchase through financial intermediaries and the Fund will pay ongoing distribution and/or service (12b-1) fees at annual rate of up to 0.25% of the average daily net assets of its Class A shares. In addition, the Transfer Agency fee will convert to an annual basis point rate of 0.10% of daily net assets of its Class A shares from its current flat per account fee. Class A shares will be offered and sold at their public offering price, which is the net asset value per share plus any applicable initial sales charge, also referred to as a "front-end sales load." For purchases on or after the Redesignation Date, Class A Shares will be offered and sold with the imposition of a maximum initial sales charge of up to 2.25% of the offering price of the Fund. A contingent deferred sales charge of up to 0.75% may be imposed on redemptions of Class A shares purchased without an initial sales charge if shares are redeemed within 12 months of purchase.
The Redesignation will be made without the imposition of any sales loads, fees, or other charges to Adviser Shares held in shareholder accounts on the Redesignation Date. The Redesignation will not be considered a taxable event for federal income tax purposes.
38
REPORT OF INDEPENDENT REGISTERED PUBLIC ACCOUNTING FIRM
To the Shareholders and the Board of Trustees of USAA Tax Exempt Short-Term Fund:
Opinion on the Financial Statements
We have audited the accompanying statement of assets and liabilities of USAA Tax Exempt Short-Term Fund (the "Fund") (one of the funds constituting USAA Mutual Funds Trust (the "Trust")), including the schedule of portfolio investments, as of March 31, 2020, and the related statement of operations for the year then ended, the statements of changes in net assets for each of the two years in the period then ended, the financial highlights for each of the five years in the period then ended and the related notes (collectively referred to as the "financial statements"). In our opinion, the financial statements present fairly, in all material respects, the financial position of the Fund at March 31, 2020, the results of its operations for the year then ended, the changes in its net assets for each of the two years in the period then ended and its financial highlights for each of the five years in the period then ended, in conformity with U.S. generally accepted accounting principles.
Basis for Opinion
These financial statements are the responsibility of the Trust's management. Our responsibility is to express an opinion on the Fund's financial statements based on our audits. We are a public accounting firm registered with the Public Company Accounting Oversight Board (United States) ("PCAOB") and are required to be independent with respect to the Trust in accordance with the U.S. federal securities laws and the applicable rules and regulations of the Securities and Exchange Commission and the PCAOB.
We conducted our audits in accordance with the standards of the PCAOB. Those standards require that we plan and perform the audit to obtain reasonable assurance about whether the financial statements are free of material misstatement, whether due to error or fraud. The Trust is not required to have, nor were we engaged to perform, an audit of the Trust's internal control over financial reporting. As part of our audits we are required to obtain an understanding of internal control over financial reporting, but not for the purpose of expressing an opinion on the effectiveness of the Trust's internal control over financial reporting. Accordingly, we express no such opinion.
Our audits included performing procedures to assess the risks of material misstatement of the financial statements, whether due to error or fraud, and performing procedures that respond to those risks. Such procedures included examining, on a test basis, evidence regarding the amounts and disclosures in the financial statements. Our procedures included confirmation of securities owned as of March 31, 2020, by correspondence with the custodian and brokers or by other appropriate auditing procedures where replies from brokers were not received. Our audits also included evaluating the accounting principles used and significant estimates made by management, as well as evaluating the overall presentation of the financial statements. We believe that our audits provide a reasonable basis for our opinion.

We have served as the auditor of one or more Victory Capital investment companies since 1995.
San Antonio, Texas
May 27, 2020
39
USAA Mutual Funds Trust | Supplemental Information March 31, 2020 | ||||||
(Unaudited)
Expense Examples
As a shareholder of the Fund, you may incur two types of costs: (1) transaction costs, and (2) ongoing costs, including management fees and other Fund expenses. These examples are intended to help you understand your ongoing costs (in dollars) of investing in the Fund and to compare these costs with the ongoing costs of investing in other mutual funds.
These examples are based on an investment of $1,000 invested at the beginning of the period and held for the entire period from October 1, 2019, through March 31, 2020.
The Actual Expense figures in the table below provide information about actual account values and actual expenses. You may use the information below, together with the amount you invested, to estimate the expenses that you paid over the period. Simply divide your account value by $1,000 (for example, an $8,600 account value divided by $1,000 = 8.6), then multiply the result by the number in the table under the heading entitled "Actual Expenses Paid During Period" to estimate the expenses you paid on your account during this period.
The Hypothetical Expense figures in the table below provide information about hypothetical account values and hypothetical expenses based on the Fund's actual expense ratio and an assumed rate of return of 5% per year before expenses, which is not the Fund's actual return. The hypothetical account values and expenses may not be used to estimate the actual ending account balance or expenses you paid for the period. You may use this information to compare this 5% hypothetical example with the 5% hypothetical examples that appear in shareholder reports of other funds.
Please note the expenses shown in the table below are meant to highlight your ongoing costs only and do not reflect any transactional costs. If these transactional costs were included, your costs would have been higher.
| Beginning Account Value 10/1/19 | Actual Ending Account Value 3/31/20 | Hypothetical Ending Account Value 3/31/20 | Actual Expenses Paid Period 10/1/19- 3/31/20* | Hypothetical Expenses Paid During Period 10/1/19- 3/31/20* | Annualized Expense Ratio During Period 10/1/19- 3/31/20 | ||||||||||||||||||||||
Fund Shares | $ | 1,000.00 | $ | 991.40 | $ | 1,022.45 | $ | 2.54 | $ | 2.58 | 0.51 | % | |||||||||||||||
Adviser Shares | 1,000.00 | 991.10 | 1,021.25 | 3.73 | 3.79 | 0.75 | % | ||||||||||||||||||||
* Expenses are equal to the average account value multiplied by the Fund's annualized expense ratio multiplied by 183/366 (the number of days in the most recent fiscal half-year divided by the number of days in the fiscal year).
Proxy Voting and Portfolio Holdings Information
Proxy Voting:
Information regarding the policies and procedures the Fund uses to determine how to vote proxies relating to portfolio securities is available without charge, upon request, by calling (800) 539-3863. The information is also included in the Fund's Statement of Additional Information, which is available on the SEC's website at www.sec.gov.
Information relating to how the Fund voted proxies relating to portfolio securities held during the most recent 12 months ended June 30 is available on the SEC's website at www.sec.gov.
Availability of Schedules of Portfolio Investments:
The Trust files a complete list of Schedules of Portfolio Investments with the SEC for the first and third quarter of each fiscal year on Form N-PORT. Forms N-PORT are available on the SEC's web site at www.sec.gov.
40
USAA Mutual Funds Trust | Supplemental Information — continued March 31, 2020 | ||||||
(Unaudited)
Trustee and Officer Information
Board of Trustees:
Overall responsibility for management of the Trust rests with the Board. The Trust is managed by the Board in accordance with the laws of the state of Delaware. There are currently 10 Trustees, eight of whom are not "interested persons" of the Trust within the meaning of that term under the 1940 Act ("Independent Trustees") and two of whom is an "interested person" of the Trust within the meaning of that term under the 1940 Act ("Interested Trustee"). The Trustees, in turn, elect the officers of the Trust to actively supervise its day-to-day operations.
The following tables list the Trustees, their ages, position with the Trust, commencement of service, principal occupations during the past five years and any directorships of other investment companies or companies whose securities are registered under the Securities Exchange Act of 1934, as amended, or who file reports under that Act. Each Trustee oversees 47 portfolios in the Trust. Each Trustee's address is 15935 La Cantera Pkwy, Building Two, San Antonio, TX, 78256. Pursuant to a policy adopted by the Board, the term of office for each Trustee shall be until the Independent Trustee reaches age 75 or an Interested Trustee reaches age 75. The Board may change or grant exceptions from this policy at any time without shareholder approval. A Trustee may resign or be removed by a vote of the other Trustees or the holders of a majority of the outstanding shares of the Trust at any time. Vacancies on the Board can be filled by the action of a majority of the Trustees, provided that after filling such vacancy at least two-thirds of the Trustees have been elected by the shareholders.
Name and Date of Birth | Position Held with the Trust | Year Commenced Service | Principal Occupation During Past 5 Years | Other Directorships Held During Past 5 Years | |||||||||||||||
Independent Trustees. | |||||||||||||||||||
| Jefferson C. Boyce, Born September 1957 | Lead Independent Trustee, and Vice Chairman | 2013 | Senior Managing Director, New York Life Investments, LLC (1992-2012) | Westhab, Inc. | |||||||||||||||
| John C. Walters, Born February 1962 | Trustee | 2019 | Retired. Mr. Walters brings significant Board experience including active involvement with the board of a Fortune 500 company, and a proven record of leading large, complex financial organizations. He has a demonstrated record of success in distribution, manufacturing, investment brokerage, and investment management in both the retail and institutional investment businesses. He has substantial experience in the investment management business with a demonstrated ability to develop and drive strategy while managing operation, financial, and investment risk. | Guardian Variable Products Trust (16 series), Lead Independent Director; Amerilife Holdings LLC, Director; Stadion Money Management; Director; University of North Carolina (Chapel Hill), Member Board of Governors. | |||||||||||||||
41
USAA Mutual Funds Trust | Supplemental Information — continued March 31, 2020 | ||||||
(Unaudited)
Name and Date of Birth | Position Held with the Trust | Year Commenced Service | Principal Occupation During Past 5 Years | Other Directorships Held During Past 5 Years | |||||||||||||||
| Robert L. Mason, Ph.D., Born July 1946 | Trustee | 1997 | Adjunct Professor in the Department of Management Science and Statistics in the College of Business at the University of Texas at San Antonio (since 2001); Institute Analyst, Southwest Research Institute (March 2002-January 2016) | None | |||||||||||||||
| Dawn M. Hawley, Born February 1954 | Trustee | 2014 | Manager of Finance, Menil Foundation, Inc. (May 2007-June 2011), which is a private foundation that oversees the assemblage of sculptures, prints, drawings, photographs, and rare books. Director of Financial Planning and Analysis and Chief Financial Officer, AIM Management Group, Inc. (October 1987-January 2006) | None | |||||||||||||||
| Paul L. McNamara, Born July 1948 | Trustee | 2012 | Director, Cantor Opportunistic Alternatives Fund, LLC (March 2010-February 2014) , which is a closed-end fund of funds by Cantor Fitzgerald Investment Advisors, LLC | None | |||||||||||||||
42
USAA Mutual Funds Trust | Supplemental Information — continued March 31, 2020 | ||||||
(Unaudited)
Name and Date of Birth | Position Held with the Trust | Year Commenced Service | Principal Occupation During Past 5 Years | Other Directorships Held During Past 5 Years | |||||||||||||||
| Richard Y. Newton III, Born January 1956 | Trustee | 2017 | Director, Elta North America (01/18-present), which is a global leader in the design, manufacture, and support of innovative electronic systems in the ground, maritime, airborne, and security domains for the nation's warfighters, security personnel, and first responders; Managing Partner, Pioneer Partnership Development Group (December 2015-present)); Executive Director, The Union League Club of New York (June 2014-November 2015): Executive Vice President, Air Force Association (August 2012-May 2014); Lieutenant General, United States Air Force (January 2008-June 2012) | None | |||||||||||||||
| Barbara B. Ostdiek, Ph.D., Born March 1964 | Trustee | 2008 | Senior Associate Dean of Degree Programs at Jesse H. Jones Graduate School of Business at Rice University (since 2013); Associate Professor of Finance at Jessie H. Jones Graduate School of Business at Rice University (since 2001) | None | |||||||||||||||
| Michael F. Reimherr, Born August 1945 | Trustee | 2000 | President of Reimherr Business Consulting (May 1995-December 2017); St. Mary's University Investment Committee overseeing University Endowment (since 2014) | None | |||||||||||||||
43
USAA Mutual Funds Trust | Supplemental Information — continued March 31, 2020 | ||||||
(Unaudited)
Name and Date of Birth | Position Held with the Trust | Year Commenced Service | Principal Occupation During Past 5 Years | Other Directorships Held During Past 5 Years | |||||||||||||||
Interested Trustees. | |||||||||||||||||||
| David C. Brown, ** Born May 1972 | Trustee | 2019 | Chairman and Chief Executive Officer (since 2013), Co-Chief Executive Officer (2011-2013), Victory Capital Management Inc.; Chairman and Chief Executive Officer, Victory Capital Holdings, Inc. (since 2013). Mr. Brown brings to the Board extensive business, finance and leadership skills gained and developed through years of experience in the financial services industry, including his tenure overseeing the strategic direction as CEO of Victory Capital. These skills, combined with Mr. Brown's extensive knowledge of the financial services industry and demonstrated success in the development and distribution of investment strategies and products, enable him to provide valuable insights to the Board and strategic direction for the Funds | Trustee, Victory Portfolios (42 series), Victory Portfolios II (26 series), Victory Variable Insurance Funds (9 series) | |||||||||||||||
44
USAA Mutual Funds Trust | Supplemental Information — continued March 31, 2020 | ||||||
(Unaudited)
Name and Date of Birth | Position Held with the Trust | Year Commenced Service | Principal Occupation During Past 5 Years | Other Directorships Held During Past 5 Years | |||||||||||||||
| Daniel S. McNamara, ** Born June 1966 | Trustee and Chair of the Board of Trustees | 2012 | Trustee, President, and Vice Chairman of USAA ETF Trust (June 2017-June 2019); President of Financial Advice & Solutions Group (FASG), USAA (since 2013); Director, IMCO (September 2009-April 2014); President, AMCO (August, 2011-April 2013); Senior Vice President of USAA Financial Planning Services Insurance Agency, Inc. (FPS) (since 2011); Director of USAA Investment Management Company (IMCO) (since 2009); Chairman of Board of IMCO (since 2013); Director of USAA Asset Management Company (AMCO), (August 2011-June 2019); President and Director of USAA Shareholder Account Services (SAS)(October 2009-June 2019); Director and Vice Chairman of FPS (since 2013); President and Director of USAA Investment Corporation (ICORP) (since 2010); Chairman of Board of ICORP (since 2013); Director of USAA Financial Advisors, Inc. (FAI) (since 2013); Chairman of Board of FAI (since 2015). Mr. McNamara brings to the Board extensive experience in the financial services industry, including experience as an officer of the Trust. | None | |||||||||||||||
** Mr. McNamara and Mr. Brown are "Interested Persons" by reason of their relationships with the Adviser.
The Statement of Additional Information includes additional information about the Trustees of the Trust and is available, without charge, on the SEC's website at www.sec.gov and/or by calling (800)-539-3863.
45
USAA Mutual Funds Trust | Supplemental Information — continued March 31, 2020 | ||||||
(Unaudited)
Officers:
The officers of the Trust, their ages, commencement of service and their principal occupations during the past five years, are detailed in the following table. Each officer serves until the earlier of his or her resignation, removal, retirement, death, or the election of a successor. The mailing address of each officer of the Trust is 15935 La Cantera Pkwy, Building Two, San Antonio, TX, 78256. The officers of the Trust receive no compensation directly from the Trust for performing the duties of their offices.
Name and Date of Birth | Position with the Trust | Year Commenced Service | Principal Occupation During Past 5 Years | ||||||||||||
Interested Officers. | |||||||||||||||
| Christopher K. Dyer, Born February 1962 | President | 2019 | Director of Fund Administration, Victory Capital (2004-present) | ||||||||||||
| Scott A Stahorsky, Born July 1969 | Vice President | 2019 | Manager, Fund Administration, Victory Capital (since 2015); Senior Analyst, Fund Administration, Victory Capital (prior to 2015) | ||||||||||||
| James K. De Vries, Born April 1969 | Treasurer, Principal Financial Officer | 2018 | Executive Director, Victory Capital Management Inc. (since 2019); Treasurer, USAA ETF Trust (September 2018-June 2019); Executive Director, Investment and Financial Administration, USAA (April 2012-June 2019); Assistant Treasurer, USAA ETF Trust (June 2017-September 2018); Assistant Treasurer, USAA Mutual Funds Trust (December 2013-February 2018) | ||||||||||||
| Allan Shaer, Born March 1965 | Assistant Treasurer | 2019 | Senior Vice President, Financial Administration, Citi Fund Services Ohio, Inc. (since 2016); Vice President, Mutual Fund Administration, JP Morgan Chase (2011-2016) | ||||||||||||
| Carol D. Trevino, Born October 1965 | Assistant Treasurer | 2018 | Director, Accounting and Finance, Victory Capital Management Inc. (since 2019); Accounting/Financial Director, USAA (December 2013-June 2019); Assistant Treasurer, USAA ETF Trust (September 2018-June 2019). | ||||||||||||
| Erin G. Wagner, Born February 1974 | Secretary | 2019 | Deputy General Counsel, the Adviser (since 2013) | ||||||||||||
| Charles Booth, Born April 1960 | Anti-Money Laundering Compliance Officer and Identity Theft Officer | 2019 | Director, Regulatory Administration and CCO Support Services, Citi Fund Services Ohio, Inc. (2007-present) | ||||||||||||
| Amy Campos, Born July 1976 | Chief Compliance Officer | 2019 | Chief Compliance Officer, USAA Mutual Funds Trust (since 2019); Executive Director, Deputy Chief Compliance Officer, USAA Mutual Funds Trust and USAA ETF Trust (July 2017-June 2019); Compliance Director, USAA Mutual Funds Trust (2014-July 2017) | ||||||||||||
46
USAA Mutual Funds Trust | Supplemental Information — continued March 31, 2020 | ||||||
(Unaudited)
Additional Federal Income Tax Information
The following federal tax information related to the Fund's fiscal year ended March 31, 2020, is provided for information purposes only and should not be used for reporting to federal or state revenue agencies. Federal tax information for the calendar year will be reported to you on Form 1099-DIV in January 2021.
With respect to distributions paid, the Fund designates the following amounts (or, if subsequently determined to be different, the maximum amount allowable) for the fiscal year ended March 31, 2020:
| Tax Exempt Income Amount* | |||||||
100.00 | % | ||||||
* Presented as a percentage of net investment income and excludes short-term capital gain distributions paid, if any. All or a portion of these amounts may be exempt from taxation at the state level.
47
Privacy Policy
Protecting the Privacy of Information
The Trust respects your right to privacy. We also know that you expect us to conduct and process your business in an accurate and efficient manner. To do so, we must collect and maintain certain personal information about you. This is the information we collect from you on applications or other forms, and from the transactions you make with us or third parties. It may include your name, address, social security number, account transactions and balances, and information about investment goals and risk tolerance.
We do not disclose any information about you or about former customers to anyone except as permitted or required by law. Specifically, we may disclose the information we collect to companies that perform services on our behalf, such as the transfer agent that processes shareholder accounts and printers and mailers that assist us in the distribution of investor materials. We may also disclose this information to companies that perform marketing services on our behalf. This allows us to continue to offer you Victory investment products and services that meet your investing needs, and to effect transactions that you request or authorize. These companies will use this information only in connection with the services for which we hired them. They are not permitted to use or share this information for any other purpose.
To protect your personal information internally, we permit access only by authorized employees and maintain physical, electronic and procedural safeguards to guard your personal information.*
* You may have received communications regarding information about privacy policies from other financial institutions which gave you the opportunity to "opt-out" of certain information sharing with companies which are not affiliated with that financial institution. The Trust does not share information with other companies for purposes of marketing solicitations for products other than the Trust. Therefore, the Trust does not provide opt-out options to their shareholders.
15935 La Cantera Pkwy
Building Two
San Antonio, Texas 78256

Visit our website at: | Call | ||||||
usaa.com | (800) 235-8396 | ||||||
40856-0520

MARCH 31, 2020
Annual Report
USAA Virginia Bond Fund
Beginning January 1, 2021, as permitted by regulations adopted by the Securities and Exchange Commission, paper copies of the Fund's shareholder reports like this one will no longer be sent by mail, unless you specifically request paper copies of the reports from the Fund or from your financial intermediary, such as a broker-dealer or bank. Instead, the reports will be made available on usaa.com, and you will be notified by mail each time a report is posted and provided with a website link to access the report.
If you already elected to receive shareholder reports electronically, you will not be affected by this change and you need not take any action. You may elect to receive shareholder reports and other communications from the Fund or your financial intermediary electronically by notifying your financial intermediary directly, or if you are a direct investor, by calling (800) 235-8396 or logging on to usaa.com.
You may elect to receive all future reports in paper free of charge. You can inform the Fund or your financial intermediary that you wish to continue receiving paper copies of your shareholder reports by notifying your financial intermediary directly, or if you are a direct investor, by calling (800) 235-8396 or logging on to usaa.com. Your election to receive reports in paper will apply to all funds held with the USAA family of funds or your financial intermediary.
Victory Capital means Victory Capital Management Inc., the investment adviser of the USAA Mutual Funds. USAA Mutual Funds are distributed by Victory Capital Services, Inc., member FINRA, an affiliate of Victory Capital. Victory Capital and its affiliates are not affiliated with United Services Automobile Association or its affiliates. USAA and the USAA logo are registered trademarks and the USAA Mutual Funds and USAA Investments logos are trademarks of United Services Automobile Association and is being used by Victory Capital and its affiliates under license.
USAA Mutual Funds Trust
TABLE OF CONTENTS
Shareholder Letter (Unaudited) | 2 | ||||||
Managers' Commentary (Unaudited) | 4 | ||||||
Investment Overview (Unaudited) | 7 | ||||||
| Investment Objective & Portfolio Holdings (Unaudited) | 9 | ||||||
Financial Statements | |||||||
Schedule of Portfolio Investments | 11 | ||||||
Statement of Assets and Liabilities | 18 | ||||||
Statement of Operations | 19 | ||||||
Statements of Changes in Net Assets | 20 | ||||||
Financial Highlights | 22 | ||||||
Notes to Financial Statements | 24 | ||||||
| Report of Independent Registered Public Accounting Firm | 35 | ||||||
Supplemental Information (Unaudited) | |||||||
Expense Example | 36 | ||||||
Proxy Voting and Portfolio Holdings Information | 36 | ||||||
Trustees' and Officers' Information | 37 | ||||||
Additional Federal Income Tax Information | 43 | ||||||
Privacy Policy (inside back cover) | |||||||
This report is for the information of the shareholders and others who have received a copy of the currently effective prospectus of the Fund, managed by Victory Capital Management Inc. It may be used as sales literature only when preceded or accompanied by a current prospectus, which provides further details about the Fund.
IRA DISTRIBUTION WITHHOLDING DISCLOSURE
We generally must withhold federal income tax at a rate of 10% of the taxable portion of your distribution and, if you live in a state that requires state income tax withholding, at your state's tax rate. However, you may elect not to have withholding apply or to have income tax withheld at a higher rate. Any withholding election that you make will apply to any subsequent distribution unless and until you change or revoke the election. If you wish to make a withholding election, or change or revoke a prior withholding election, call (800) 235-8396.
If you do not have a withholding election in place by the date of a distribution, federal income tax will be withheld from the taxable portion of your distribution at a rate of 10%. If you must pay estimated taxes, you may be subject to estimated tax penalties if your estimated tax payments are not sufficient and sufficient tax is not withheld from your distribution.
For more specific information, please consult your tax adviser.
1
(Unaudited)
Dear Shareholder,
If there were ever a time that illustrated the dynamic and unpredictable nature of financial markets—and life in general—it would be the strange days of early 2020. The spread of COVID-19 throughout the United States and the world has been an unprecedented event that, among so many other impacts, rendered virtually any economic forecasts unreliable. Seemingly overnight, the sentiment pendulum swung from risk-on to risk-off. We all became familiar with unusual concepts like "social distancing" and "flattening the curve."
Given that wide swaths of the global economy came to an all-stop—an event that has no real precedent—there remains tremendous uncertainty as to the depth and extent of the economic downturn. Making assumptions about the extent of the virus' reach, its impact on consumer behavior and employment, and the speed at which the U.S. government and U.S. Federal Reserve (the "Fed") can revive the economy is educated guesswork at best.
Fortunately, it's not all bad news. We did see markets stabilize as this annual reporting period drew to a close (and in the early weeks of April immediately following). As of the writing of this letter, the array of new lending facilities and programs launched by the Fed generally appear to have had their intended effect of improving liquidity and trading, at least in the short-term. Credit spreads across corporate, high-yield, structured, and municipal bond markets were coaxed down from their highs. Trading in equity markets also appeared to stabilize.
The USAA tax-exempt funds generally performed as would be expected given the unusual market environment. Our tax-exempt funds tend to be more credit heavy, holding more BBB-category rated bonds than the average in our peer groups. Typically, we overweight these credits to provide additional tax-free income to our investors, and these securities tend to underperform in periods of market dislocation when credit spreads widen significantly.
We believe that the volatility in the tax-exempt market reflected the lack of liquidity, rather than any significant credit deterioration. It's important to underscore that the USAA tax-exempt funds entered the crisis with ample liquidity and none have yet had to sell portfolio securities at an inopportune price to achieve a fund's desired level of exposure.
Looking ahead, the economy and the markets remain unpredictable. Yet our investment philosophy—and our resolve—is steadfast. A priority of our fixed-income portfolio managers and analysts is to maintain substantial liquidity, as no one can predict when the crisis will abate and what liquidity needs might be in the meantime.
Through it all, we remain committed to our core competency of evaluating, taking and managing credit risk, and we continue to build portfolios bond-by-bond. We believe the recent environment, though breathtaking in its volatility, provides extraordinary buying opportunities that may help us lock in higher tax-free yields for our investors.
If you have questions about the current market dynamics or your specific portfolio or investment plan, please give one of our financial representatives a call. They can
2
help ensure that you are properly diversified based on your long-term goals, time horizon, and risk tolerance.
From all of us here at USAA Funds, thank you for letting us help you work toward your investment goals.

Christopher K. Dyer, CFA
President,
USAA Funds
3
USAA Mutual Funds Trust
USAA Virginia Bond Fund
Manager's Commentary
(Unaudited)
John C. Bonnell, CFA
Regina G. Conklin, CPA, CFA
Andrew R. Hattman, CFA, CAIA
• What were the market conditions during the reporting period?
Tax-exempt bonds generated positive returns during the reporting period ended March 31, 2020, due in part to falling municipal bond yields. (Bond prices and yields move in opposite directions.) However, market conditions changed drastically during the reporting period.
For the first approximate 11 months of the reporting period, tax-exempt bonds generated strong positive returns. In the second half of calendar year 2019, due to intensifying U.S.-China trade tensions and global economic weakness, the U.S. Federal Reserve (the "Fed") cut the target federal funds rate from a range of 2.25%-2.50% to a target range of 1.50%-1.75%. Municipal bond AAA rates followed suit by generally falling for the majority of the reporting period, reaching their lows on March 9, 2020. Tax-exempt bonds also benefited from supply-and-demand dynamics during the first approximate 11 months of the reporting period. Supply was tight, as new issuance failed to keep pace with demand. Demand was intense, as municipal bond mutual funds saw inflows every week during the reporting period up to early March. In late February and early March, as the emergence of a novel coronavirus (COVID-19) raised fears about a potential U.S. economic slowdown, municipal bonds held up well compared to other segments of the fixed income market.
That all changed on March 10, 2020. For the next 10 days, interest rates rose quickly and significantly along the municipal yield curve amid record outflows from municipal bond mutual funds. The trend reversed on March 20, and municipal bond yields fell sharply, finishing the reporting period below their starting points. Over this period, the 3-year AAA municipal bond rate started at 0.50% on March 9, rose to 2.75% on March 20, and fell to 1.11% on March 31 (after starting the reporting period at 1.54% on April 1, 2019). Municipal bond credit spreads (yield differentials between municipal bonds with similar maturities but different credit ratings) widened in March 2020, with spreads on lower-rated municipal securities widening the most. Rating agencies placed entire municipal bond sectors on credit watch because of a potential economic slowdown driven by the shutdowns, lockdowns, and self-quarantines that had been instituted to slow the spread of COVID-19. The Fed responded with unprecedented actions, slashing the target federal funds rate to a range of between zero and 0.25%, implementing quantitative easing and credit support programs, and offering assistance to state and municipal governments. The Fed also has said it will do what it takes to keep financial markets — including the municipal bond market — fully functioning.
4
USAA Mutual Funds Trust
USAA Virginia Bond Fund (continued)
• How did the USAA Virginia Bond Fund (the "Fund") perform during the reporting period?
The Fund has two share classes: Fund Shares and Adviser Shares. For the reporting period ended March 31, 2020, the Fund Shares and Adviser Shares had a total return of 2.39% and 2.14%, respectively, versus an average return of 2.58% for the funds in the Lipper Virginia Municipal Debt Funds category. This compares to returns of 2.77% for the Lipper Virginia Municipal Debt Funds Index and 3.85% for the Bloomberg Barclays Municipal Bond Index. The Fund Shares' and Adviser Shares' tax-exempt distributions over the reporting period produced a dividend yield of 2.77% and 2.52%, respectively, compared to the Lipper category average of 2.49%.
• What are the conditions in the commonwealth of Virginia?
The Commonwealth of Virginia enjoyed strong revenue growth for the first half of fiscal 2020 (fiscal year ends June 30). Heading into the last half of the fiscal year the state was seemingly well positioned with ample reserves and a balanced upcoming biennium budget proposed. Now the commonwealth (along with the rest of the country) faces wide ranging economic and fiscal challenges related to COVID-19, from spikes in unemployment to major declines in key revenue streams. In response to COVID-19, Virginia Governor Ralph Northam issued a statewide Stay at Home Order and froze all new spending in the state budget. We believe that the ultimate impact on Virginia's fiscal position will depend on both the duration of this unprecedented economic shutdown, and the amount Virginia receives from the $2 trillion coronavirus financial rescue bill passed by Congress. The Commonwealth expects to receive roughly $2 billion and Virginia local governments $1.5 billion from the bill.
We believe that Virginia is well positioned to handle near term cash flow volatility given the very healthy level of reserves the state has been able to amass over the past several years, coupled with strong access to liquidity. As of mid-March, the state had an estimated $1.6 billion in operational reserves (equal to about 7% of the year's expenditures). Continued fiscal restraint and prudent management will be key to navigating the remainder of fiscal 2020 and beyond. Presently, Virginia remains rated AAA by all three credit-rating agencies.
• What strategies did you employ during the reporting period?
In keeping with our investment approach, we continued to focus on income generation. The Fund's long-term income distribution, not its price appreciation, accounts for most of its total return. Because of the Fund's income orientation, it has a higher allocation to BBB and A rated categories when compared to its peer group.
Our commitment to independent credit research continued to help us identify attractive opportunities for the Fund. We employ fundamental analysis that emphasizes an issuer's ability and willingness to repay its debt. Through our credit research, we strive both to
5
USAA Mutual Funds Trust
USAA Virginia Bond Fund (continued)
recognize relative value and to avoid potential pitfalls, which is especially important in volatile times like the present. As always, we worked with our in-house team of analysts to select investments for the Fund on a bond-by-bond basis. Our team continuously monitors all the holdings in the Fund's portfolio.
The Fund continues to hold a diversified portfolio of longer-term, primarily investment-grade municipal bonds. To limit exposure to an unexpected event, the Fund is diversified by sector, issuer, and geography. In addition, we avoid bonds subject to the federal alternative minimum tax for individuals.
Thank you for allowing us to assist you with your investment needs.
6
USAA Mutual Funds Trust
USAA Virginia Bond Fund
Investment Overview
(Unaudited)
Average Annual Total Return
Year Ended March 31, 2020
Fund Shares | Adviser Shares | ||||||||||||||||||
INCEPTION DATE | 10/10/90 | 8/1/10 | |||||||||||||||||
Net Asset Value | Net Asset Value | Bloomberg Barclays Municipal Bond Index1 | Lipper Virginia Municipal Debt Funds Index2 | ||||||||||||||||
One Year | 2.39 | % | 2.14 | % | 3.85 | % | 2.77 | % | |||||||||||
Five Year | 2.64 | % | 2.39 | % | 3.19 | % | 2.32 | % | |||||||||||
Ten Year | 3.89 | % | N/A | 4.15 | % | 3.34 | % | ||||||||||||
Since Inception | NA | 3.56 | % | NA | NA | ||||||||||||||
Past performance is not indicative of future results. The performance data quoted represents past performance and current returns may be lower or higher. The investment return and principal value will fluctuate so that an investor's shares, when redeemed, may be worth more or less than the original cost. To obtain performance information current to the most recent month's end, please visit www.usaa.com.
Total return measures the price change in a share assuming the reinvestment of all net investment income and realized capital gain distributions, if any. The total returns quoted do not reflect adjustments made to the enclosed financial statements in accordance with U.S. generally accepted accounting principles or the deduction of taxes that a shareholder would pay on net investment income and realized capital gain distributions, including reinvested distributions, or redemptions of shares. The total return figures set forth above include all waivers of fees for various periods since inception. Without such fee waivers, the total returns would have been lower.
USAA Virginia Bond Fund — Growth of $10,000
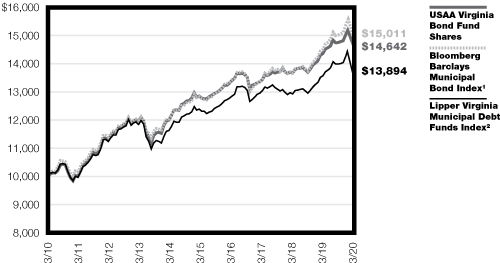
1The unmanaged, broad-based Bloomberg Barclays Municipal Bond Index tracks total return performance for the long-term, investment-grade, tax-exempt bond market. All tax-exempt bond funds will find it difficult to outperform the Index because the Index does not reflect any deduction for fees, expenses, or taxes. It is not possible to invest directly in an index.
2The unmanaged Lipper Virginia Municipal Debt Funds Index measures the Fund's performance to that of the Lipper Virginia Municipal Debt Funds category. There are no expenses associated with the index, while there are expenses associated with the Fund. It is not possible to invest directly in an index.
The graph reflects investment of growth of a hypothetical $10,000 investment in the Fund. Past performance is no guarantee of future results.
The graph and table do not reflect the deduction of taxes that a shareholder would pay on Fund distributions or the redemption of Fund shares.
7
USAA Mutual Funds Trust
USAA Virginia Bond Fund (continued)
Average Annual Compounded Returns with Reinvestment of Dividends — Periods Ended March 31, 2020
Total Return | = | Dividend Return | + | Price Change | |||||||||||||||||||
| 10 Years | 3.89 | % | = | 3.60 | % | + | 0.29 | % | |||||||||||||||
| 5 Years | 2.64 | % | = | 3.11 | % | + | –0.47 | % | |||||||||||||||
| 1 Year | 2.39 | % | = | 2.74 | % | + | –0.35 | % | |||||||||||||||
The performance data quoted represents past performance and is no guarantee of future results. Current performance may be higher or lower than the performance data quoted. The return and principal value of an investment will fluctuate, so that an investor's shares, when redeemed, may be worth more or less than their original cost. For performance data current to the most recent month-end, visit usaa.com.
Annual Total Returns and Compounded Dividend Returns for
the One-Year Periods Ended March 31, 2011-March 31, 2020

Note the role that dividend returns play in the Fund Shares' total return over time. Share prices and dividend rates will vary from period to period. However, dividend returns generally are more consistent and less volatile than share prices.
Total return measures the price change in a share assuming the reinvestment of all net investment income and realized capital gain distributions, if any. Dividend return is the net investment income dividends received over the period, assuming reinvestment of all dividends. Share price change is the change in net asset value over the period adjusted for realized capital gain distributions. The returns quoted do not reflect adjustments made to the enclosed financial statements in accordance with U.S. generally accepted accounting principles or the deduction of taxes that a shareholder would pay on distributions (including capital gain distributions), redemptions of shares, or reinvested net investment income.
8
| USAA Mutual Funds Trust USAA Virginia Bond Fund | March 31, 2020 | ||||||
(Unaudited)
Investment Objective & Portfolio Holdings:
The Fund's investment objective seeks to provide Virginia investors with a high level of current interest income that is exempt from federal and Virginia state income taxes.
Top 10 Industries
March 31, 2020
(% of Net Assets)
Hospital | 20.9 | % | |||||
Education | 15.8 | % | |||||
Appropriated Debt | 10.0 | % | |||||
Multifamily Housing | 8.8 | % | |||||
Escrowed Bonds | 7.4 | % | |||||
Water/Sewer Utility | 5.6 | % | |||||
Nursing/CCRC | 5.5 | % | |||||
Toll Road | 5.2 | % | |||||
General Obligation | 4.2 | % | |||||
Special Assessment/Tax/Fee | 3.9 | % | |||||
Refer to the Schedule of Portfolio of Investments for a complete list of securities.
9
| USAA Mutual Funds Trust USAA Virginia Bond Fund (continued) | March 31, 2020 | ||||||
(Unaudited)
Portfolio Ratings Mix*
March 31, 2020
(% of Net Assets)
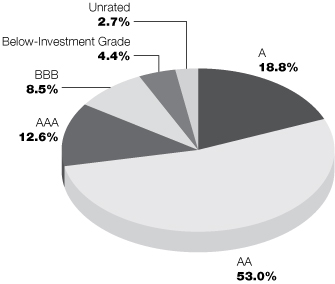
This chart reflects the highest long-term rating from a Nationally Recognized Statistical Rating Organization ("NRSRO"), with the four highest long-term credit ratings labeled, in descending order of credit quality, AAA, AA, A, and BBB. These categories represent investmentgrade quality. NRSRO ratings are shown because they provide independent analysis of the credit quality of the Fund's investments. Victory Capital Management, Inc. ("Adviser") also performs its own fundamental credit analysis of each security. As part of its fundamental credit analysis, the Adviser considers various criteria, including industry specific actions, peer comparisons, payment ranking, and structure specific characteristics. Any of the Fund's securities that are not rated by an NRSRO appear in the chart above as "Unrated," but these securities are analyzed and monitored by the Adviser on an ongoing basis. Government securities that are issued or guaranteed as to principal and interest by the U.S. government and pre-refunded and escrowed-to-maturity municipal bonds that are not rated are treated as AAA for credit quality purposes.
* Does not include futures and money market instruments.
10
| USAA Mutual Funds Trust USAA Virginia Bond Fund | Schedule of Portfolio Investments March 31, 2020 | ||||||
(Amounts in Thousands, Except for Shares)
Security Description | Principal Amount | Value | |||||||||
Municipal Bonds (101.8%) | |||||||||||
Virginia (93.9%): | |||||||||||
| Amherst IDA Revenue 5.00%, 9/1/26, Continuously Callable @100 | $ | 1,795 | $ | 1,751 | |||||||
4.75%, 9/1/30, Continuously Callable @100 | 2,000 | 1,869 | |||||||||
| Arlington County IDA Revenue 5.00%, 7/1/31, Continuously Callable @100 (a) | 15,000 | 15,125 | |||||||||
5.00%, 2/15/43, Continuously Callable @100 | 1,775 | 2,102 | |||||||||
| Capital Region Airport Commission Revenue Series A, 4.00%, 7/1/36, Continuously Callable @100 | 700 | 745 | |||||||||
Series A, 4.00%, 7/1/38, Continuously Callable @100 | 750 | 796 | |||||||||
| Charles City County Economic Development Authority Revenue, Series A, 2.88%, 2/1/29, Continuously Callable @101 | 10,000 | 10,057 | |||||||||
| Chesapeake Bay Bridge & Tunnel District Revenue 5.50%, 7/1/25 | 5,000 | 5,915 | |||||||||
5.00%, 7/1/51, Continuously Callable @100 | 9,240 | 10,252 | |||||||||
| Chesapeake Bay Bridge & Tunnel District Revenue (INS — Assured Guaranty Municipal Corp.), 5.00%, 7/1/41, Continuously Callable @100 | 5,000 | 5,636 | |||||||||
| Chesapeake Hospital Authority Revenue 4.00%, 7/1/39, Continuously Callable @100 | 1,000 | 1,106 | |||||||||
4.00%, 7/1/43, Continuously Callable @100 | 4,000 | 4,364 | |||||||||
| City of Chesapeake Expressway Toll Road Revenue 7/15/32, Continuously Callable @100 (c) | 6,520 | 6,214 | |||||||||
| 7/15/40, Continuously Callable @100 (d) | 3,000 | 2,813 | |||||||||
City of Lynchburg, GO, 4.00%, 6/1/44, Continuously Callable @100 | 5,000 | 5,342 | |||||||||
| City of Norfolk, GO Series A, 4.00%, 9/1/37, Continuously Callable @100 (e) | 2,040 | 2,419 | |||||||||
Series A, 4.00%, 9/1/39, Continuously Callable @100 (e) | 1,535 | 1,804 | |||||||||
| City of Portsmouth, GO 5.00%, 2/1/33, Pre-refunded 2/1/23 @ 100 | 880 | 976 | |||||||||
5.00%, 2/1/33, Continuously Callable @100 | 120 | 132 | |||||||||
| City of Richmond Public Utility Revenue 4.00%, 1/15/40, Continuously Callable @100 | 6,000 | 6,655 | |||||||||
Series A, 5.00%, 1/15/38, Continuously Callable @100 | 6,000 | 6,591 | |||||||||
| City of Richmond, GO Series D, 5.00%, 3/1/32 | 800 | 1,088 | |||||||||
Series D, 5.00%, 3/1/33 | 1,000 | 1,383 | |||||||||
| Eclipse Funding Trust, GO (LIQ — U.S. Bancorp), Series 2017-0069, 1.20%, 7/15/36, (b) (f) | 5,710 | 5,710 | |||||||||
| Fairfax County Economic Development Authority Revenue 5.00%, 4/1/47, Continuously Callable @100 | 4,000 | 4,557 | |||||||||
Series A, 5.00%, 10/1/29, Continuously Callable @100 | 2,000 | 2,295 | |||||||||
Series A, 5.00%, 10/1/30, Continuously Callable @100 | 2,000 | 2,292 | |||||||||
Series A, 5.00%, 10/1/31, Continuously Callable @100 | 2,000 | 2,289 | |||||||||
Series A, 5.00%, 10/1/32, Continuously Callable @100 | 1,500 | 1,716 | |||||||||
Series A, 5.00%, 12/1/32, Continuously Callable @100 | 1,500 | 1,558 | |||||||||
Series A, 5.00%, 10/1/33, Continuously Callable @100 | 2,200 | 2,515 | |||||||||
Series A, 5.00%, 10/1/34, Continuously Callable @100 | 2,000 | 2,284 | |||||||||
Series A, 5.00%, 10/1/42, Continuously Callable @102 | 2,250 | 2,340 | |||||||||
Series A, 4.00%, 10/1/42, Continuously Callable @102 | 2,750 | 2,612 | |||||||||
See notes to financial statements.
11
| USAA Mutual Funds Trust USAA Virginia Bond Fund | Schedule of Portfolio Investments — continued March 31, 2020 | ||||||
(Amounts in Thousands, Except for Shares)
Security Description | Principal Amount | Value | |||||||||
Series A, 5.00%, 12/1/42, Continuously Callable @100 | $ | 2,800 | $ | 2,863 | |||||||
Series B, 5.00%, 10/1/35, Continuously Callable @100 | 2,620 | 3,169 | |||||||||
Series B, 5.00%, 10/1/36, Continuously Callable @100 | 2,000 | 2,415 | |||||||||
| Fairfax County Economic Development Authority Revenue (LOC — SunTrust Bank), 5.02%, 6/1/37, Continuously Callable @100 (b) | 1,400 | 1,400 | |||||||||
| Fairfax County IDA Revenue 5.00%, 5/15/37, Continuously Callable @100 | 14,000 | 14,923 | |||||||||
4.00%, 5/15/42, Continuously Callable @100 | 1,000 | 1,037 | |||||||||
Series A, 4.00%, 5/15/44, Continuously Callable @100 | 6,900 | 7,244 | |||||||||
Series S, 4.00%, 5/15/48, Continuously Callable @100 | 1,500 | 1,615 | |||||||||
| Front Royal & Warren County IDA Revenue, 4.00%, 1/1/50, Continuously Callable @103 | 5,000 | 5,318 | |||||||||
| Greater Richmond Convention Center Authority Revenue, 5.00%, 6/15/32, Continuously Callable @100 | 1,500 | 1,756 | |||||||||
| Hampton Roads Sanitation District Revenue Series A, 5.00%, 8/1/43, Pre-refunded 8/1/26 @ 100 | 4,700 | 5,761 | |||||||||
Series B, 4.05%, 8/1/46, Continuously Callable @100 (b) | 1,750 | 1,750 | |||||||||
| Hampton Roads Transportation Accountability Commission Revenue, Series A, 5.00%, 7/1/52, Continuously Callable @100 (a) | 15,000 | 18,055 | |||||||||
| Hanover County Economic Development Authority Revenue 5.00%, 7/1/51, Continuously Callable @103 | 1,200 | 1,137 | |||||||||
Series A, 4.50%, 7/1/30, Continuously Callable @100 | 2,795 | 2,691 | |||||||||
Series A, 4.50%, 7/1/32, Continuously Callable @100 | 1,100 | 1,047 | |||||||||
Series A, 5.00%, 7/1/42, Continuously Callable @100 | 2,000 | 1,921 | |||||||||
| Henrico County Economic Development Authority Revenue 5.00%, 6/1/24, Continuously Callable @100 | 1,200 | 1,217 | |||||||||
4.25%, 6/1/26, Continuously Callable @100 | 140 | 140 | |||||||||
5.00%, 11/1/30, Pre-refunded 11/1/22 @ 100 | 2,105 | 2,308 | |||||||||
4.00%, 10/1/35, Continuously Callable @100 | 2,500 | 2,503 | |||||||||
5.00%, 10/1/37, Continuously Callable @103 | 2,500 | 2,789 | |||||||||
| Lewistown Commerce Center Community Development Authority Tax Allocation 3.63%, 3/1/44, Continuously Callable @103 | 1,468 | 1,118 | |||||||||
6.05%, 3/1/44, Continuously Callable @103 | 691 | 522 | |||||||||
Series C, 6.05%, 3/1/54, Continuously Callable @100 | 2,340 | 426 | |||||||||
| Lexington IDA Revenue 4.00%, 1/1/31, Continuously Callable @102 | 750 | 743 | |||||||||
4.00%, 1/1/37, Continuously Callable @102 | 1,000 | 927 | |||||||||
5.00%, 1/1/43, Pre-refunded 1/1/22 @ 100 | 2,000 | 2,140 | |||||||||
5.00%, 1/1/48, Continuously Callable @100 | 1,000 | 1,174 | |||||||||
Series A, 5.00%, 1/1/42, Continuously Callable @103 | 1,000 | 1,005 | |||||||||
Series A, 5.00%, 1/1/48, Continuously Callable @103 | 1,250 | 1,217 | |||||||||
| Longwood University Student Housing Project (LIQ — Deutsche Bank A.G.), Series DBE-8039, 3.95%, 1/1/57, Callable 1/1/23 @ 100 (b) (f) | 27,000 | 27,000 | |||||||||
| Loudoun County Economic Development Authority Revenue 5.00%, 12/1/31, Continuously Callable @100 | 1,135 | 1,303 | |||||||||
5.00%, 12/1/32, Continuously Callable @100 | 800 | 918 | |||||||||
5.00%, 12/1/33, Continuously Callable @100 | 775 | 888 | |||||||||
5.00%, 12/1/34, Continuously Callable @100 | 805 | 921 | |||||||||
Series C, 5.00%, 2/15/38, Callable 5/1/20 @ 100 (b) | 5,410 | 5,410 | |||||||||
See notes to financial statements.
12
| USAA Mutual Funds Trust USAA Virginia Bond Fund | Schedule of Portfolio Investments — continued March 31, 2020 | ||||||
(Amounts in Thousands, Except for Shares)
Security Description | Principal Amount | Value | |||||||||
Series D, 5.00%, 2/15/38, Callable 5/1/20 @ 100 (b) | $ | 4,320 | $ | 4,320 | |||||||
Series E, 5.00%, 2/15/38, Callable 5/1/20 @ 100 (b) | 2,100 | 2,100 | |||||||||
Series F, 5.00%, 2/15/38, Callable 5/1/20 @ 100 (b) | 9,100 | 9,100 | |||||||||
| Lynchburg Economic Development Authority Revenue 5.00%, 9/1/43, Continuously Callable @100 | 3,000 | 3,109 | |||||||||
Series A, 5.00%, 1/1/47, Continuously Callable @100 | 2,250 | 2,522 | |||||||||
| Lynchburg Economic Development Authority Revenue (LIQ — JPMorgan Chase & Co.), Series 2018-XL0075, 4.86%, 1/1/25 (b) (f) | 5,400 | 5,400 | |||||||||
| Marquis Community Development Authority of York County Virginia Tax Allocation, Series B, 5.63%, 9/1/41 (k) | 3,532 | 1,492 | |||||||||
Marquis Community Development Authority Revenue, 9/1/45 (f) (j) (k) | 1,093 | 464 | |||||||||
| Marquis Community Development Authority Tax Allocation, Series C, 9/1/41 (h) (i) (k) | 5,389 | 248 | |||||||||
| Montgomery County Economic Development Authority Revenue Series A, 5.00%, 6/1/35, Pre-refunded 6/1/20 @ 100 | 5,000 | 5,033 | |||||||||
Series A, 4.00%, 6/1/36, Continuously Callable @100 | 1,125 | 1,284 | |||||||||
Series A, 4.00%, 6/1/39, Continuously Callable @100 | 1,750 | 1,983 | |||||||||
Norfolk Airport Authority Revenue, 5.00%, 7/1/43, Continuously Callable @100 | 2,800 | 3,392 | |||||||||
| Norfolk Economic Development Authority Revenue 5.00%, 11/1/30, Pre-refunded 11/1/22 @ 100 | 1,000 | 1,100 | |||||||||
4.75%, 11/1/34, Continuously Callable @100 (b) | 5,000 | 5,000 | |||||||||
Series B, 5.00%, 11/1/43, Continuously Callable @100 | 3,500 | 3,727 | |||||||||
Series B, 5.00%, 11/1/48, (Put Date 11/1/28) (g) | 1,600 | 1,936 | |||||||||
Series B, 4.00%, 11/1/48, Continuously Callable @100 | 1,100 | 1,164 | |||||||||
| Prince Edward County IDA Revenue 4.00%, 9/1/43, Continuously Callable @100 | 2,250 | 2,485 | |||||||||
5.00%, 9/1/48, Continuously Callable @100 | 2,055 | 2,420 | |||||||||
| Prince William County IDA Revenue 5.50%, 9/1/31, Pre-refunded 9/1/21 @ 100 | 1,705 | 1,807 | |||||||||
5.50%, 9/1/31, Pre-refunded 9/1/21 @ 100 | 2,000 | 2,127 | |||||||||
5.50%, 9/1/34, Pre-refunded 9/1/21 @ 100 | 1,000 | 1,060 | |||||||||
5.00%, 11/1/46, Continuously Callable @100 | 10,000 | 10,745 | |||||||||
| Radford IDA Revenue (NBGA — Fannie Mae), 3.50%, 9/15/29, Continuously Callable @100 | 4,000 | 4,166 | |||||||||
| Rappahannock Regional Jail Authority Revenue 5.00%, 10/1/34, Continuously Callable @100 | 2,340 | 2,755 | |||||||||
5.00%, 10/1/35, Continuously Callable @100 | 1,165 | 1,369 | |||||||||
| Roanoke Economic Development Authority Revenue 5.00%, 7/1/33, Continuously Callable @100 | 1,150 | 1,160 | |||||||||
5.00%, 7/1/47 (e) | 6,250 | 8,283 | |||||||||
4.00%, 7/1/51, Continuously Callable @100 (e) | 5,000 | 5,409 | |||||||||
Series A, 5.00%, 9/1/36, Continuously Callable @100 | 1,640 | 1,774 | |||||||||
Series A, 5.00%, 9/1/43, Continuously Callable @100 | 4,060 | 4,407 | |||||||||
| Roanoke Economic Development Authority Revenue (INS — Assured Guaranty Municipal Corp.) 5.00%, 7/1/38, Pre-refunded 7/1/20 @ 100 | 110 | 111 | |||||||||
Series B, 5.00%, 7/1/38, Continuously Callable @100 | 6,890 | 6,951 | |||||||||
| Rockingham County Economic Development Authority Revenue 4.00%, 12/1/33, Continuously Callable @100 | 1,000 | 998 | |||||||||
5.00%, 12/1/39, Continuously Callable @100 | 2,000 | 2,121 | |||||||||
See notes to financial statements.
13
| USAA Mutual Funds Trust USAA Virginia Bond Fund | Schedule of Portfolio Investments — continued March 31, 2020 | ||||||
(Amounts in Thousands, Except for Shares)
Security Description | Principal Amount | Value | |||||||||
| Salem Economic Development Authority Revenue 4.00%, 4/1/38, Continuously Callable @100 | $ | 250 | $ | 281 | |||||||
4.00%, 4/1/39, Continuously Callable @100 | 225 | 251 | |||||||||
4.00%, 4/1/40, Continuously Callable @100 | 250 | 277 | |||||||||
4.00%, 4/1/45, Continuously Callable @100 | 750 | 813 | |||||||||
5.00%, 4/1/49, Continuously Callable @100 | 910 | 1,076 | |||||||||
| Stafford County Economic Development Authority Revenue 5.00%, 6/15/36, Continuously Callable @100 | 5,900 | 6,730 | |||||||||
4.00%, 6/15/37, Continuously Callable @100 | 6,495 | 6,951 | |||||||||
| Suffolk Redevelopment & Housing Authority Revenue (LIQ — Deutsche Bank A.G.), Series 2019-XF1086, 3.92%, 10/1/59, Callable 1/1/35 @ 101 (b) (f) | 20,000 | 20,000 | |||||||||
| Tobacco Settlement Financing Corp. Revenue, Series B-1, 5.00%, 6/1/47, Continuously Callable @100 | 10,000 | 9,993 | |||||||||
| University of Virginia Revenue Series A, 5.00%, 6/1/37, Pre-refunded 6/1/23 @ 100 | 4,405 | 4,955 | |||||||||
Series A, 5.00%, 4/1/42, Continuously Callable @100 | 4,000 | 4,861 | |||||||||
Series A, 5.00%, 4/1/47, Continuously Callable @100 | 5,000 | 6,031 | |||||||||
Series A-1, 4.00%, 4/1/45, Continuously Callable @100 | 5,000 | 5,456 | |||||||||
Series B, 5.00%, 4/1/46, Continuously Callable @100 | 5,000 | 6,046 | |||||||||
| Upper Occoquan Sewage Authority Revenue, 4.00%, 7/1/39, Continuously Callable @100 | 5,000 | 5,488 | |||||||||
| Virginia Beach Development Authority Revenue 5.00%, 9/1/40, Continuously Callable @103 | 3,250 | 3,642 | |||||||||
5.00%, 9/1/44, Continuously Callable @103 | 4,865 | 5,400 | |||||||||
Series A, 5.00%, 5/1/29, Continuously Callable @100 | 1,795 | 2,056 | |||||||||
| Virginia College Building Authority Revenue 5.00%, 6/1/29, Continuously Callable @100 | 5,000 | 4,408 | |||||||||
5.00%, 2/1/31, Continuously Callable @100 | 10,000 | 12,482 | |||||||||
5.00%, 2/1/32, Continuously Callable @100 | 4,000 | 4,979 | |||||||||
4.00%, 1/15/33, Continuously Callable @100 | 965 | 1,077 | |||||||||
4.00%, 1/15/35, Continuously Callable @100 | 545 | 594 | |||||||||
4.00%, 1/15/36, Continuously Callable @100 | 650 | 708 | |||||||||
5.00%, 6/1/36, Continuously Callable @100 | 11,710 | 9,915 | |||||||||
4.00%, 1/15/43, Continuously Callable @100 | 1,285 | 1,382 | |||||||||
Series A, 5.00%, 9/1/31, Continuously Callable @100 | 2,725 | 3,119 | |||||||||
Series A, 5.00%, 9/1/32, Continuously Callable @100 | 5,615 | 6,425 | |||||||||
Series A, 5.00%, 9/1/33, Continuously Callable @100 | 6,380 | 7,297 | |||||||||
Series A, 4.00%, 2/1/35, Continuously Callable @100 | 8,000 | 8,869 | |||||||||
| Virginia Commonwealth Transportation Board Revenue 5.00%, 3/15/32, Continuously Callable @100 | 3,350 | 4,146 | |||||||||
5.00%, 9/15/32, Continuously Callable @100 | 9,190 | 11,360 | |||||||||
4.00%, 5/15/42, Continuously Callable @100 | 10,000 | 11,059 | |||||||||
Series A, 4.00%, 5/15/36, Continuously Callable @100 | 2,000 | 2,282 | |||||||||
| Virginia Commonwealth University Health System Authority Revenue 4.75%, 7/1/36, Pre-refunded 7/1/21 @ 100 | 6,315 | 6,610 | |||||||||
4.75%, 7/1/41, Pre-refunded 7/1/21 @ 100 | 3,000 | 3,140 | |||||||||
5.00%, 7/1/46, Continuously Callable @100 | 5,500 | 6,263 | |||||||||
| Virginia Commonwealth University Revenue Series A, 4.00%, 11/1/37, Continuously Callable @100 | 750 | 854 | |||||||||
Series A, 5.00%, 11/1/38, Continuously Callable @100 | 350 | 426 | |||||||||
Series A, 4.00%, 5/1/48, Continuously Callable @100 | 2,475 | 2,752 | |||||||||
See notes to financial statements.
14
| USAA Mutual Funds Trust USAA Virginia Bond Fund | Schedule of Portfolio Investments — continued March 31, 2020 | ||||||
(Amounts in Thousands, Except for Shares)
Security Description | Principal Amount | Value | |||||||||
| Virginia Housing Development Authority Revenue Series B, 4.50%, 10/1/36, Continuously Callable @100 | $ | 3,175 | $ | 3,256 | |||||||
Series B, 3.60%, 5/1/46, Continuously Callable @100 | 7,000 | 7,351 | |||||||||
| Virginia Public Building Authority Revenue, Series A, 4.00%, 8/1/30, Continuously Callable @100 | 4,000 | 4,706 | |||||||||
Virginia Public School Authority Revenue, 5.00%, 8/1/24 | 10,000 | 11,624 | |||||||||
| Virginia Resources Authority Revenue 5.00%, 11/1/32, Continuously Callable @100 | 985 | 1,111 | |||||||||
5.00%, 11/1/32, Pre-refunded 11/1/23 @ 100 | 45 | 51 | |||||||||
5.00%, 11/1/40, Pre-refunded 11/1/20 @ 100 | 1,270 | 1,300 | |||||||||
5.00%, 11/1/40, Continuously Callable @100 | 165 | 169 | |||||||||
4.00%, 11/1/41, Continuously Callable @100 | 7,310 | 7,713 | |||||||||
4.00%, 11/1/49, Continuously Callable @100 | 6,700 | 7,749 | |||||||||
| Virginia Resources Authority Revenue (LIQ — JPMorgan Chase & Co.), Series 2016-XF0453, 4.76%, 5/1/21 (b) (f) | 5,000 | 5,000 | |||||||||
| Virginia Small Business Financing Authority Revenue 5.00%, 4/1/25, Continuously Callable @100 | 420 | 420 | |||||||||
5.25%, 4/1/26, Continuously Callable @100 | 185 | 185 | |||||||||
5.50%, 4/1/28, Continuously Callable @100 | 855 | 855 | |||||||||
5.50%, 4/1/33, Continuously Callable @100 | 750 | 750 | |||||||||
4.00%, 11/1/39, Continuously Callable @100 | 2,550 | 2,769 | |||||||||
5.00%, 11/1/40, Continuously Callable @100 | 11,945 | 11,975 | |||||||||
| Virginia Small Business Financing Authority Revenue (LOC — Bank of America Corp.), 0.90%, 7/1/30 (b) | 1,645 | 1,645 | |||||||||
| Virginia Small Business Financing Authority Revenue (LOC — Wells Fargo & Co.), 3.72%, 7/1/42, Continuously Callable @100 (b) | 2,500 | 2,500 | |||||||||
| Washington County IDA Revenue 5.25%, 8/1/30, Pre-refunded 8/1/20 @ 100 | 2,165 | 2,196 | |||||||||
5.50%, 8/1/40, Pre-refunded 8/1/20 @ 100 | 2,160 | 2,192 | |||||||||
| Western Regional Jail Authority Revenue 5.00%, 12/1/35, Continuously Callable @100 | 1,540 | 1,853 | |||||||||
5.00%, 12/1/35, Pre-refunded 12/1/26 @ 100 | 1,545 | 1,902 | |||||||||
5.00%, 12/1/38, Pre-refunded 12/1/26 @ 100 | 1,000 | 1,231 | |||||||||
5.00%, 12/1/38, Continuously Callable @100 | 1,000 | 1,196 | |||||||||
| Winchester Economic Development Authority Revenue 5.00%, 1/1/44, Continuously Callable @100 | 3,250 | 3,663 | |||||||||
Series S, 5.00%, 1/1/44, Continuously Callable @100 | 3,250 | 3,570 | |||||||||
| Wise County IDA Revenue, Series 2009-A, 2.15%, 10/1/40, (Put Date 9/1/20) (g) | 5,000 | 5,016 | |||||||||
661,998 | |||||||||||
District of Columbia (2.7%): | |||||||||||
| Metropolitan Washington Airports Authority Dulles Toll Road Revenue 5.00%, 10/1/53, Continuously Callable @100 | 4,000 | 4,105 | |||||||||
4.00%, 10/1/53, Continuously Callable @100 | 1,500 | 1,519 | |||||||||
Series A, 5.00%, 10/1/44, Continuously Callable @100 | 1,500 | 1,725 | |||||||||
| Metropolitan Washington Airports Authority Dulles Toll Road Revenue (INS — Assured Guaranty Municipal Corp.), Series B, 10/1/30 (i) | 5,500 | 4,144 | |||||||||
| Metropolitan Washington Airports Authority Revenue (LOC — TD Bank N.A.), Series D-2, 0.86%, 10/1/39, Continuously Callable @100 (b) | 1,800 | 1,800 | |||||||||
See notes to financial statements.
15
| USAA Mutual Funds Trust USAA Virginia Bond Fund | Schedule of Portfolio Investments — continued March 31, 2020 | ||||||
(Amounts in Thousands, Except for Shares)
Security Description | Principal Amount | Value | |||||||||
| Washington Metropolitan Area Transit Authority Revenue, 5.00%, 7/1/43, Continuously Callable @100 | $ | 5,000 | $ | 5,756 | |||||||
19,049 | |||||||||||
Guam (5.2%): | |||||||||||
| Antonio B. Won Pat International Airport Authority Revenue (INS — Assured Guaranty Municipal Corp.), Series B, 5.75%, 10/1/43, Continuously Callable @100 | 1,255 | 1,391 | |||||||||
| Guam Government Waterworks Authority Revenue 5.00%, 7/1/37, Continuously Callable @100 | 1,000 | 1,012 | |||||||||
5.00%, 7/1/40, Continuously Callable @100 | 3,250 | 3,266 | |||||||||
5.50%, 7/1/43, Continuously Callable @100 | 4,000 | 4,061 | |||||||||
Series A, 5.00%, 7/1/35, Continuously Callable @100 | 2,850 | 2,875 | |||||||||
| Guam Power Authority Revenue Series A, 5.00%, 10/1/31, Continuously Callable @100 | 500 | 511 | |||||||||
Series A, 5.00%, 10/1/34, Continuously Callable @100 | 1,000 | 1,008 | |||||||||
Series A, 5.00%, 10/1/40, Continuously Callable @100 | 4,000 | 4,025 | |||||||||
| Guam Power Authority Revenue (INS — Assured Guaranty Municipal Corp.) Series A, 5.00%, 10/1/39, Continuously Callable @100 | 750 | 754 | |||||||||
Series A, 5.00%, 10/1/44, Continuously Callable @100 | 1,000 | 997 | |||||||||
| Port Authority of Guam Revenue Bonds, Series A, 5.00%, 7/1/48, Continuously Callable @100 | 1,500 | 1,365 | |||||||||
| Territory of Guam Revenue Series A, 5.00%, 12/1/46, Continuously Callable @100 | 1,250 | 1,180 | |||||||||
Series B-1, 5.00%, 1/1/42, Continuously Callable @100 | 1,500 | 1,452 | |||||||||
Series D, 5.00%, 11/15/39, Continuously Callable @100 | 2,000 | 1,958 | |||||||||
| Territory of Guam Revenue (LOC — Barclays Bank PLC), Series 2017-XF2510, 5.00%, 12/1/46, Callable 12/1/26 @ 100 (b) (f) | 10,870 | 10,870 | |||||||||
36,725 | |||||||||||
Total Municipal Bonds (Cost $705,818) | 717,772 | ||||||||||
Total Investments (Cost $705,818) — 101.8% | 717,772 | ||||||||||
Liabilities in excess of other assets — (1.8%) | (12,593 | ) | |||||||||
NET ASSETS — 100.00% | $ | 705,179 | |||||||||
(a) All or a portion of this security has been designated as collateral for securities purchased on a when-issued basis.
(b) Variable Rate Demand Notes that provide the rights to sell the security at face value on either that day or within the rate-reset period. The interest rate is reset on the put date at a stipulated daily, weekly, monthly, quarterly, or other specified time interval to reflect current market conditions. These securities do not indicate a reference rate and spread in their description.
(c) Stepped-coupon security converts to coupon form on 07/15/23 with a rate of 4.88%.
(d) Stepped-coupon security converts to coupon form on 09/01/21 with a rate of 7.5%.
(e) Security purchased on a when-issued basis.
See notes to financial statements.
16
| USAA Mutual Funds Trust USAA Virginia Bond Fund | Schedule of Portfolio Investments — continued March 31, 2020 | ||||||
(f) Rule 144A security or other security that is restricted as to resale to institutional investors. The Fund's Adviser has deemed this security to be liquid based upon procedures approved by the Board of Trustees. As of March 31, 2020, the fair value of these securities was $74,444 (thousands) and amounted to 10.6% of net assets.
(g) Put Bond.
(h) The Fund's Adviser has deemed this security to be illiquid based upon procedures approved by the Board of Trustees. As of March 31, 2020, illiquid securities were less than 0.05% of the Fund's net assets.
(i) Zero-coupon bond.
(j) Stepped-coupon security converts to coupon form on 09/01/2020 with a rate of 7.50%.
(k) This security is classified as Level 3 within the fair value hierarchy. (See Note 2)
GO — General Obligation
IDA — Industrial Development Authority
LOC — Line Letter of Credit
PLC — Public Limited Company
Credit Enhancements — Adds the financial strength of the provider of the enhancement to support the issuer's ability to repay the principal and interest payments when due. The enhancement may be provided by a high-quality bank, insurance company or other corporation, or a collateral trust. The enhancements do not guarantee the market values of the securities.
INS Principal and interest payments are insured by the name listed. Although bond insurance reduces the risk of loss due to default by an issuer, such bonds remain subject to the risk that value may fluctuate for other reasons, and there is no assurance that the insurance company will meet its obligations.
LIQ Liquidity enhancement that may, under certain circumstances, provide for repayment of principal and interest upon demand from the name listed.
LOC Principal and interest payments are guaranteed by a bank letter of credit or other bank credit agreement.
NBGA Principal and interest payments or, under certain circumstances, underlying mortgages, are guaranteed by a nonbank guarantee agreement from the name listed.
See notes to financial statements.
17
USAA Mutual Funds Trust | Statement of Assets and Liabilities March 31, 2020 | ||||||
(Amounts in Thousands, Except Per Share Amounts)
| USAA Virginia Bond Fund | |||||||
Assets: | |||||||
Investments, at value (Cost $705,818) | $ | 717,772 | |||||
Cash | 2,585 | ||||||
Receivables: | |||||||
Interest | 7,683 | ||||||
Capital shares issued | 143 | ||||||
From Adviser | 1 | ||||||
Prepaid expenses | 2 | ||||||
Total Assets | 728,186 | ||||||
Liabilities: | |||||||
Payables: | |||||||
Distributions | 286 | ||||||
Investments purchased | 21,646 | ||||||
Capital shares redeemed | 676 | ||||||
Accrued expenses and other payables: | |||||||
Investment advisory fees | 196 | ||||||
Administration fees | 92 | ||||||
Custodian fees | 6 | ||||||
Transfer agent fees | 28 | ||||||
Compliance fees | — | (a) | |||||
Trustees' fees | 2 | ||||||
| 12b-1 fees | 2 | ||||||
Other accrued expenses | 73 | ||||||
Total Liabilities | 23,007 | ||||||
Net Assets: | |||||||
Capital | 702,730 | ||||||
Total distributable earnings/(loss) | 2,449 | ||||||
Net Assets | $ | 705,179 | |||||
Net Assets | |||||||
Fund Shares | $ | 685,508 | |||||
Adviser Shares | 19,671 | ||||||
Total | $ | 705,179 | |||||
Shares (unlimited number of shares authorized with no par value): | |||||||
Fund Shares | 60,886 | ||||||
Adviser Shares | 1,748 | ||||||
Total | 62,634 | ||||||
Net asset value, offering and redemption price per share: (b) | |||||||
Fund Shares | $ | 11.26 | |||||
Adviser Shares | $ | 11.25 | |||||
(a) Rounds to less than $1 thousand.
(b) Per share amount may not recalculate due to rounding of net assets and/or shares outstanding.
See notes to financial statements.
18
USAA Mutual Funds Trust | Statement of Operations For the Year Ended March 31, 2020 | ||||||
(Amounts in Thousands)
| USAA Virginia Bond Fund | |||||||
Investment Income: | |||||||
Interest | $ | 23,501 | |||||
Total Income | 23,501 | ||||||
Expenses: | |||||||
Investment advisory fees | 2,319 | ||||||
Professional fees | 3 | ||||||
Administration fees — Fund Shares | 1,055 | ||||||
Administration fees — Adviser Shares | 30 | ||||||
Sub-Administration fees | 15 | ||||||
12b-1 fees — Adviser Shares | 50 | ||||||
Custodian fees | 56 | ||||||
Transfer agent fees — Fund Shares | 200 | ||||||
Transfer agent fees — Adviser Shares | 9 | ||||||
Trustees' fees | 44 | ||||||
Compliance fees | 3 | ||||||
Legal and audit fees | 70 | ||||||
State registration and filing fees | 1 | ||||||
Interest expense on Interfund lending | 1 | ||||||
Other expenses | 175 | ||||||
Total Expenses | 4,031 | ||||||
Expenses waived/reimbursed by Adviser | (1 | ) | |||||
Expenses waived/reimbursed by AMCO | (3 | ) | |||||
Net Expenses | 4,027 | ||||||
Net Investment Income (Loss) | 19,474 | ||||||
Realized/Unrealized Gains (Losses) from Investments: | |||||||
Net realized gains (losses) from investment securities | 380 | ||||||
Net change in unrealized appreciation/depreciation on investment securities | (4,249 | ) | |||||
Net realized/unrealized gains (losses) on investments | (3,869 | ) | |||||
Change in net assets resulting from operations | $ | 15,605 | |||||
See notes to financial statements.
19
USAA Mutual Funds Trust | Statements of Changes in Net Assets | ||||||
(Amounts in Thousands)
USAA Virginia Bond Fund | |||||||||||
| Year Ended March 31, 2020 | Year Ended March 31, 2019 | ||||||||||
From Investments: | |||||||||||
Operations: | |||||||||||
Net investment income (loss) | $ | 19,474 | $ | 20,502 | |||||||
Net realized gains (losses) from investments | 380 | (3,552 | ) | ||||||||
| Net change in unrealized appreciation/depreciation on investments | (4,249 | ) | 11,703 | ||||||||
Change in net assets resulting from operations | 15,605 | 28,653 | |||||||||
Distributions to Shareholders: | |||||||||||
Fund Shares | (19,127 | ) | (19,922 | ) | |||||||
Adviser Shares | (493 | ) | (542 | ) | |||||||
Change in net assets resulting from distributions to shareholders | (19,620 | ) | (20,464 | ) | |||||||
Change in net assets resulting from capital transactions | 17,564 | (3,225 | ) | ||||||||
Change in net assets | 13,549 | 4,964 | |||||||||
Net Assets: | |||||||||||
Beginning of period | 691,630 | 686,666 | |||||||||
End of period | $ | 705,179 | $ | 691,630 | |||||||
Capital Transactions: | |||||||||||
Fund Shares | |||||||||||
Proceeds from shares issued | $ | 92,819 | $ | 72,506 | |||||||
Distributions reinvested | 15,757 | 16,145 | |||||||||
Cost of shares redeemed | (91,351 | ) | (91,196 | ) | |||||||
Total Fund Shares | $ | 17,225 | $ | (2,545 | ) | ||||||
Adviser Shares | |||||||||||
Proceeds from shares issued | $ | 3,929 | $ | 2,637 | |||||||
Distributions reinvested | 482 | 534 | |||||||||
Cost of shares redeemed | (4,072 | ) | (3,851 | ) | |||||||
Total Adviser Shares | $ | 339 | $ | (680 | ) | ||||||
Change in net assets resulting from capital transactions | $ | 17,564 | $ | (3,225 | ) | ||||||
Share Transactions: | |||||||||||
Fund Shares | |||||||||||
Issued | 8,111 | 6,513 | |||||||||
Reinvested | 1,374 | 1,451 | |||||||||
Redeemed | (8,081 | ) | (8,217 | ) | |||||||
Total Fund Shares | 1,404 | (253 | ) | ||||||||
Adviser Shares | |||||||||||
Issued | 343 | 237 | |||||||||
Reinvested | 42 | 48 | |||||||||
Redeemed | (358 | ) | (347 | ) | |||||||
Total Adviser Shares | 27 | (62 | ) | ||||||||
Change in Shares | 1,431 | (315 | ) | ||||||||
See notes to financial statements.
20
This page is intentionally left blank.
21
USAA Mutual Funds Trust | Financial Highlights | ||||||
For a Share Outstanding Throughout Each Period
Investment Activities | Distributions to Shareholders From | ||||||||||||||||||||||||||
| Net Asset Value, Beginning of Period | Net Investment Income (Loss) | Net Realized and Unrealized Gains (Losses) on Investments | Total from Investment Activities | Net Investment Income | Total Distributions | ||||||||||||||||||||||
USAA Virginia Bond Fund | |||||||||||||||||||||||||||
Fund Shares | |||||||||||||||||||||||||||
| Year Ended March 31, 2020 | $ | 11.30 | 0.31 | (c) | (0.04 | ) | 0.27 | (0.31 | ) | (0.31 | ) | ||||||||||||||||
| Year Ended March 31, 2019 | $ | 11.16 | 0.34 | 0.14 | 0.48 | (0.34 | ) | (0.34 | ) | ||||||||||||||||||
| Year Ended March 31, 2018 | $ | 11.21 | 0.34 | (0.05 | ) | 0.29 | (0.34 | ) | (0.34 | ) | |||||||||||||||||
| Year Ended March 31, 2017 | $ | 11.52 | 0.35 | (0.31 | ) | 0.04 | (0.35 | ) | (0.35 | ) | |||||||||||||||||
| Year Ended March 31, 2016 | $ | 11.53 | 0.41 | (0.01 | ) | 0.40 | (0.41 | ) | (0.41 | ) | |||||||||||||||||
Adviser Shares | |||||||||||||||||||||||||||
| Year Ended March 31, 2020 | $ | 11.29 | 0.28 | (c) | (0.04 | ) | 0.24 | (0.28 | ) | (0.28 | ) | ||||||||||||||||
| Year Ended March 31, 2019 | $ | 11.16 | 0.32 | 0.12 | 0.44 | (0.31 | ) | (0.31 | ) | ||||||||||||||||||
| Year Ended March 31, 2018 | $ | 11.20 | 0.31 | (0.04 | ) | 0.27 | (0.31 | ) | (0.31 | ) | |||||||||||||||||
| Year Ended March 31, 2017 | $ | 11.51 | 0.33 | (0.31 | ) | 0.02 | (0.33 | ) | (0.33 | ) | |||||||||||||||||
| Year Ended March 31, 2016 | $ | 11.53 | 0.38 | (0.02 | ) | 0.36 | (0.38 | ) | (0.38 | ) | |||||||||||||||||
* Assumes reinvestment of all net investment income and realized capital gain distributions, if any, during the period. Includes adjustments in accordance with U.S. generally accepted accounting principles and could differ from the Lipper reported return.
^ The net expense ratio may not correlate to the applicable expense limits in place during the period since the current contractual expense limitation is applied for a two year period beginning July 1, 2019 and in effect through June 30, 2021, instead of coinciding with the Fund's fiscal year end. Details of the current contractual expense limitation in effect can be found in Note 4 of the accompanying Notes to Financial Statements.
(a) Reflects total annual operating expenses for reductions of expenses paid indirectly for the March 31 fiscal years ended 2017 and 2016. Expenses paid indirectly decreased the expense ratio for each of these respective years by less than 0.01%.
(b) Portfolio turnover is calculated on the basis of the Fund as a whole without distinguishing between the classes of shares issued.
(c) Per share net investment income (loss) has been calculated using the average daily shares method.
(d) Amount is less than $0.005 per share.
(e) Effective October 12, 2017, AMCO voluntarily agreed to limit the annual expenses of the Adviser Shares to 0.80% of the Adviser Shares' average daily net assets.
See notes to financial statements.
22
USAA Mutual Funds Trust | Financial Highlights | ||||||
For a Share Outstanding Throughout Each Period
Ratios to Average Net Assets | Supplemental Data | ||||||||||||||||||||||||||||||||||
| Redemption fees added to beneficial interests | Net Asset Value, End of Period | Total Return* | Net Expenses^(a) | Net Investment Income (Loss) | Gross Expenses(a) | Net Assets, End of Period (000's) | Portfolio Turnover(b) | ||||||||||||||||||||||||||||
USAA Virginia Bond Fund | |||||||||||||||||||||||||||||||||||
Fund Shares | |||||||||||||||||||||||||||||||||||
| Year Ended March 31, 2020 | — | $ | 11.26 | 2.39 | % | 0.55 | % | 2.70 | % | 0.55 | % | $ | 685,508 | 24 | % | ||||||||||||||||||||
| Year Ended March 31, 2019 | — | $ | 11.30 | 4.36 | % | 0.59 | % | 3.03 | % | 0.59 | % | $ | 672,191 | 9 | % | ||||||||||||||||||||
| Year Ended March 31, 2018 | — | $ | 11.16 | 2.56 | % | 0.56 | % | 2.98 | % | 0.56 | % | $ | 666,772 | 11 | % | ||||||||||||||||||||
| Year Ended March 31, 2017 | — | $ | 11.21 | 0.36 | % | 0.58 | % | 3.10 | % | 0.58 | % | $ | 658,452 | 13 | % | ||||||||||||||||||||
| Year Ended March 31, 2016 | — | $ | 11.52 | 3.58 | % | 0.60 | % | 3.57 | % | 0.60 | % | $ | 648,913 | 3 | % | ||||||||||||||||||||
Adviser Shares | |||||||||||||||||||||||||||||||||||
| Year Ended March 31, 2020 | — | $ | 11.25 | 2.14 | % | 0.80 | % | 2.46 | % | 0.82 | % | $ | 19,671 | 24 | % | ||||||||||||||||||||
| Year Ended March 31, 2019 | — | $ | 11.29 | 4.05 | % | 0.80 | % | 2.82 | % | 0.86 | % | $ | 19,439 | 9 | % | ||||||||||||||||||||
| Year Ended March 31, 2018 | — | (d) | $ | 11.16 | 2.42 | % | 0.79 | %(e) | 2.76 | % | 0.81 | % | $ | 19,894 | 11 | % | |||||||||||||||||||
| Year Ended March 31, 2017 | — | $ | 11.20 | 0.12 | % | 0.81 | % | 2.85 | % | 0.81 | % | $ | 25,496 | 13 | % | ||||||||||||||||||||
| Year Ended March 31, 2016 | — | (d) | $ | 11.51 | 3.24 | % | 0.84 | % | 3.34 | % | 0.84 | % | $ | 22,951 | 3 | % | |||||||||||||||||||
See notes to financial statements.
23
USAA Mutual Funds Trust | Notes to Financial Statements March 31, 2020 | ||||||
1. Organization:
USAA Mutual Funds Trust (the "Trust") is organized as a Delaware statutory trust and is registered under the Investment Company Act of 1940, as amended (the "1940 Act"), as an open-end investment company. The Trust is comprised of 47 funds and is authorized to issue an unlimited number of shares, which are units of beneficial interest with no par value.
The accompanying financial statements are those of the USAA Virginia Bond Fund (the "Fund"). The Fund offers two classes of shares: Fund Shares and Adviser Shares. The Fund is classified as diversified under the 1940 Act.
Each class of shares of the Fund has substantially identical rights and privileges except with respect to fees paid under distribution plans, expenses allocable exclusively to each class of shares, voting rights on matters solely affecting a single class of shares, and the exchange privilege of each class of shares.
On November 6, 2018, United Services Automobile Association ("USAA"), the parent company of USAA Asset Management Company ("AMCO"), the investment adviser to the Fund, and USAA Transfer Agency Company, d/b/a USAA Shareholder Account Services ("SAS"), the transfer agent to the Fund, announced that AMCO and SAS would be acquired by Victory Capital Holdings Inc., a global investment management firm headquartered in Cleveland, Ohio (the "Transaction"). The Transaction closed on July 1, 2019. A special shareholder meeting was held on April 18, 2019, at which shareholders of the Fund approved a new investment advisory agreement between the Trust, on behalf of the Fund, and Victory Capital Management Inc. ("VCM" or "Adviser"). Effective July 1, 2019, VCM replaced AMCO as the investment adviser to the Fund and Victory Capital Transfer Agency Company replaced SAS as the Fund's transfer agent. In addition, effective on that same date, shareholders of the Fund also elected the following two new directors to the Board of the Trust to serve upon the closing of the Transaction: (1) David C. Brown, to serve as an Interested Trustee; and (2) John C. Walters, to serve as an Independent Trustee.
Under the Trust's organizational documents, its officers and trustees are indemnified against certain liabilities arising out of the performance of their duties to the Fund. In addition, in the normal course of business, the Fund enters into contracts with its vendors and others that provide for general indemnifications. The Fund's maximum exposure under these arrangements is unknown, as this would involve future claims that may be made against the Fund. However, based on experience, the Fund expects that risk of loss to be remote.
2. Significant Accounting Policies:
The following is a summary of significant accounting policies followed by the Trust in the preparation of its financial statements. The policies are in conformity with generally accepted accounting principles in the United States of America ("GAAP"). The preparation of financial statements in accordance with GAAP requires management to make estimates and assumptions that affect the reported amounts of assets and liabilities and disclosure of contingent assets and liabilities at the date of the financial statements and the reported amounts of income and expenses for the period. Actual results could differ from those estimates. The Fund follows the specialized accounting and reporting requirements under GAAP that are applicable to investment companies under Accounting Standards Codification Topic 946.
Investment Valuation:
The Fund records investments at fair value. Fair value is defined as the price that would be received to sell an asset or paid to transfer a liability in an orderly transaction between market participants at the measurement date.
The valuation techniques described below maximize the use of observable inputs and minimize the use of unobservable inputs in determining fair value. The inputs used for valuing the Fund's investments are summarized in the three broad levels listed below:
• Level 1 — quoted prices in active markets for identical securities
• Level 2 — other significant observable inputs (including quoted prices for similar securities or interest rates applicable to those securities, etc.)
• Level 3 — significant unobservable inputs (including the Fund's own assumptions in determining the fair value of investments)
24
USAA Mutual Funds Trust | Notes to Financial Statements — continued March 31, 2020 | ||||||
Changes in valuation techniques may result in transfers in or out of an assigned level within the disclosure hierarchy. The inputs or methodologies used for valuation techniques are not necessarily an indication of the risk associated with entering into those investments.
The Trust's Adviser has established the Pricing and Liquidity Committee (the "Committee"), and subject to the Trust's Board of Trustees (the "Board") oversight, the Committee administers and oversees the Fund's valuation policies and procedures, which are approved by the Board.
Debt securities of United States ("U.S.") issuers, along with corporate and municipal securities, including short-term investments maturing in 60 days or less, may be valued using evaluated bid or the last sales price to price securities by dealers or an independent pricing service approved by the Board. These valuations are typically categorized as Level 2 in the fair value hierarchy.
Effective July 1, 2019, the valuation methodology applied to certain debt securities changed. Securities that were previously valued at an evaluated mean are now valued at the evaluated bid or the last sales price.
In the event that price quotations or valuations are not readily available, are not reflective of market value, or a significant event has been recognized in relation to a security or class of securities, the securities are valued in good faith by the Committee in accordance with valuation procedures approved by the Board. These valuations typically are categorized as Level 2 or Level 3 in the fair value hierarchy, based on the observability of inputs used to determine the fair value. The effect of fair value pricing is that securities may not be priced on the basis of quotations from the primary market in which they are traded and the actual price realized from the sale of a security may differ materially from the fair value price. Valuing these securities at fair value is intended to cause the Fund's net asset value ("NAV") to be more reliable than it otherwise would be.
A summary of the valuations as of March 31, 2020, based upon the three levels defined above, is included in the table below while the breakdown, by category, of investments is disclosed in the Schedule of Portfolio Investments (amounts in thousands):
Level 1 | Level 2 | Level 3 | Total | ||||||||||||||||
Municipal Bonds | $ | — | $ | 715,568 | $ | 2,204 | $ | 717,772 | |||||||||||
Total | $ | — | $ | 715,568 | $ | 2,204 | $ | 717,772 | |||||||||||
For the year ended March 31, 2020, there were no transfers in or out of the Level 3 fair value hierarchy.
Securities Purchased on a Delayed-Delivery or When-Issued Basis:
The Fund may purchase securities on a delayed-delivery or when-issued basis. Delivery and payment for securities that have been purchased by the Fund on a delayed-delivery or when-issued basis, or for delayed draws on loans can take place a month or more after the trade date. At the time the Fund makes the commitment to purchase a security on a delayed-delivery or when-issued basis, the Fund records the transaction and reflects the value of the security in determining net asset value. No interest accrues to the Fund until the transaction settles and payment takes place. A segregated account is established and the Fund maintains cash and/or marketable securities at least equal in value to commitments for delayed-delivery or when-issued securities. If the Fund owns delayed-delivery or when-issued securities, these values are included in Payable for investments purchased on the accompanying Statement of Assets and Liabilities and the segregated assets are identified in the Schedule of Portfolio Investments.
Municipal Obligations:
The values of municipal obligations can fluctuate and may be affected by adverse tax, legislative, or political changes, and by financial developments affecting municipal issuers. Payment of municipal obligations may depend on a relatively limited source of revenue, resulting in greater credit risk. Future changes in federal tax laws or the activity of an issuer may adversely affect the tax-exempt status of municipal obligations.
25
USAA Mutual Funds Trust | Notes to Financial Statements — continued March 31, 2020 | ||||||
Investment Transactions and Related Income:
Changes in holdings of investments are accounted for no later than one business day following the trade date. For financial reporting purposes, however, investment transactions are accounted for on trade date on the last business day of the reporting period. Interest income is determined on the basis of coupon interest accrued using the effective interest method which adjusts, where applicable, the amortization of premiums or accretion of discount. Gains or losses realized on sales of securities are determined by comparing the identified cost of the security lot sold with the net sales proceeds.
Federal Income Taxes:
It is the Fund's policy to continue to qualify as a regulated investment company by complying with the provisions available to certain investment companies, as defined in applicable sections of the Internal Revenue Code, and to make distributions of net investment income and net realized gains sufficient to relieve it from all, or substantially all, federal income taxes. Accordingly, no provision for federal income taxes is required in the financial statements. The Fund has a tax year end of March 31.
Management of the Fund has reviewed tax positions taken in tax years that remain subject to examination by all major tax jurisdictions, including federal (i.e., the last four tax years which includes the current fiscal tax year end). Management believes that there is no tax liability resulting from unrecognized tax benefits related to uncertain tax positions taken.
Allocations:
Expenses directly attributable to the Fund are charged to the Fund, while expenses that are attributable to more than one fund in the Trust, or jointly with an affiliated trust, are allocated among the respective funds in the Trust and/or affiliated trust based upon net assets or another appropriate basis.
Income, expenses (other than class-specific expenses such as transfer agent fees, state registration fees, distribution and service 12b-1 fees, and printing fees), and realized and unrealized gains or losses on investments are allocated to each class of shares based on its relative net assets on the date income is earned or expenses and realized and unrealized gains and losses are incurred.
Cross-Trade Transactions:
Pursuant to Rule 17a-7 under the 1940 Act, the Fund may engage in cross-trades which are securities transactions with affiliated investment companies and advisory accounts managed by the Adviser and any applicable sub-adviser. Any such purchase or sale transaction must be effected without brokerage commission or other remuneration, except for customary transfer fees. The transaction must be effected at the current market price, which is either the security's last sale price on an exchange or, if there are no transactions in the security that day, at the average of the highest bid and lowest asked price. For the year ended March 31, 2020, the Fund engaged in the following securities transactions with affiliated funds, which resulted in the following net realized gains (losses) (amounts in thousands):
| Purchases | Sales | Net Realized Gains (Losses) | |||||||||
| $ | 13,840 | $ | — | $ | — | ||||||
3. Purchases and Sales:
Cost of purchases and proceeds from sales/maturities of securities (excluding securities maturing less than one year from acquisition) for the year ended March 31, 2020, were as follows for the Fund (amounts in thousands):
| Excluding U.S. Government Securities | |||||||||||
Purchases | Sales | ||||||||||
$ | 167,815 | $ | 164,469 | ||||||||
There were no purchases and sales of U.S. government securities during the year ended March 31, 2020.
26
USAA Mutual Funds Trust | Notes to Financial Statements — continued March 31, 2020 | ||||||
4. Fees and Transactions with Affiliates and Related Parties:
Investment Advisory and Management Fees:
Effective with the Transaction on July 1, 2019, investment advisory services are provided to the Fund by the Adviser, a New York corporation registered as an investment adviser with the Securities and Exchange Commission ("SEC"). The Adviser is a wholly-owned indirect subsidiary of Victory Capital Holdings, Inc., a publicly traded Delaware corporation, and a wholly-owned direct subsidiary of Victory Capital Operating, LLC. Under the terms of the Investment Advisory Agreement, the Adviser is entitled to receive a base fee and a performance adjustment. The Fund's base fee is accrued daily and paid monthly, is computed as a percentage of the Fund's average daily net assets at annualized rates of 0.50% of the first $50 million of average daily net assets, 0.40% of that portion of average daily net assets over $50 million but not over $100 million, and 0.30% of that portion of average daily net assets over $100 million. The amount incurred and paid to VCM from July 1, 2019 through March 31, 2020, are $1,759 thousand and is reflected on the Statement of Operations as Investment Advisory fees.
Prior to the Transaction on July 1, 2019, AMCO provided investment management services to the Fund pursuant to an Advisory Agreement. Under this agreement, AMCO was responsible for managing the business and affairs of the Fund, and for directly managing day-to-day investment of the Fund's assets, subject to the authority of and supervision by the Board. The investment management fee for the Fund was comprised of a base fee and a performance adjustment. The Fund's base fee was accrued daily and paid monthly, was computed as a percentage of the Fund's average daily net assets at annualized rates of 0.50% of the first $50 million of average daily net assets, 0.40% of that portion of average daily net assets over $50 million but not over $100 million, and 0.30% of that portion of average daily net assets over $100 million.
Effective with the Transaction on July 1, 2019, no performance adjustments will be made for periods beginning July 1, 2019 through June 30, 2020. Only performance beginning as of July 1, 2019, and thereafter will be utilized in calculating future performance adjustments.
Prior to the Transaction on July, 1, 2019, the performance adjustment for each share class was calculated monthly by comparing the Fund's performance to that of the Lipper Virginia Municipal Debt Funds Index. The Lipper Virginia Municipal Debt Funds Index tracks the total return performance of funds within the Lipper Virginia Municipal Debt Funds category.
The performance period for each share class consists of the current month plus the previous 35 months (or the number of months beginning July 1, 2019, if fewer). The following table is utilized to determine the extent of the performance adjustment:
| Over/Under Performance Relative to Index (in basis points)(a) | Annual Adjustment Rate (in basis points)(a) | ||||||
+/- 20 to 50 | +/- 4 | ||||||
+/- 51 to 100 | +/- 5 | ||||||
+/- 101 and greater | +/- 6 | ||||||
(a) Based on the difference between average annual performance of the relevant share class of the Fund and its relevant index, rounded to the nearest basis point. Average daily net assets of the share class are calculated over a rolling 36-month period.
Each class' annual performance adjustment rate is multiplied by the average daily net assets of each respective class over the entire performance period, which is then multiplied by a fraction, the numerator of which is the number of days in the month and the denominator of which is 365 (366 in leap years). The resulting amount is then added to (in the case of overperformance), or subtracted from (in the case of underperformance) the base fee.
Under the performance fee arrangement, each class pays a positive performance fee adjustment for a performance period whenever the class outperforms the Lipper Virginia Municipal Debt Funds Index over that period, even if the class has overall negative returns during the performance period.
27
USAA Mutual Funds Trust | Notes to Financial Statements — continued March 31, 2020 | ||||||
For the period April 1, 2019 through June 30, 2019, performance adjustments for Fund Shares and Adviser Shares were $72 and $2 thousand, respectively, and 0.01% and 0.01% of net assets, respectively. Base fees incurred and paid to AMCO from April 1, 2019 through June 30, 2019, were $560 thousand and reflected on the Statement of Operations as Investment Advisory fees.
Administration and Servicing Fees:
Effective with the Transaction on July 1, 2019, VCM serves as the Fund's administrator and fund accountant. Under the Fund Administration, Servicing and Accounting Agreement, VCM is paid for its services an annual fee at a rate of 0.15% of average daily net assets for both the Fund Shares and Adviser Shares. Amounts incurred from July 1, 2019 through March 31, 2020, are $801 and $23 thousand for Fund Shares and Adviser Shares, respectively. These amounts are reflected on the Statement of Operations as Administration fees.
Prior to the Transaction on July 1, 2019, AMCO provided certain administration and servicing functions for the Fund. For such services, AMCO received a fee accrued daily and paid monthly at an annualized rate of 0.15% of average daily net assets for both the Fund Shares and Adviser Shares. Amounts incurred from April 1, 2019 through June 30, 2019, were $254 and $7 thousand for Fund Shares and Adviser Shares, respectively. These amounts are reflected on the Statement of Operations as Administration fees.
Effective with the Transaction on July 1, 2019, the Fund (as part of the Trust) has entered into an agreement to provide compliance services with the Adviser, pursuant to which the Adviser furnishes its compliance personnel, including the services of the Chief Compliance Officer ("CCO"), and other resources reasonably necessary to provide the Trust with compliance oversight services related to the design, administration and oversight of a compliance program for the Trust in accordance with Rule 38a-1 under the 1940 Act. The CCO is an employee of the Adviser, which pays the compensation of the CCO and support staff. Funds in the Trust, Victory Variable Insurance Funds, Victory Portfolios and Victory Portfolios II (collectively, the "Victory Funds Complex") in the aggregate, compensate the Adviser for these services. The amount incurred during the period from July 1, 2019 through March 31, 2020, is reflected on the Statement of Operations as Compliance fees.
Effective with the Transaction on July 1, 2019, Citi Fund Services Ohio, Inc. ("Citi"), an affiliate of Citibank, acts as sub-administrator and sub-fund accountant to the Fund pursuant to a Sub-Administration and Sub-Fund Accounting Services Agreement between VCM and Citi. VCM pays Citi a fee for providing these services. The Trust reimburses VCM and Citi for all of their reasonable out-of-pocket expenses incurred in providing these services and certain other expenses specifically allocated to the Funds, under the Fund Administration, Servicing, and Accounting Agreement. The amount incurred during the period from July 1, 2019 through March 31, 2020, is reflected on the Statement of Operations as Sub-Administration fees.
In addition to the services provided under its Administration and Servicing Agreement with the Fund, AMCO also provided certain compliance and legal services for the benefit of the Fund prior to the Transaction on July 1, 2019. The Board approved the reimbursement of a portion of these expenses incurred by AMCO. Amounts reimbursed by the Fund to AMCO for these compliance and legal services are presented on the Statement of Operations as Professional fees.
Transfer Agency Fees:
Effective with the Transaction on July 1, 2019, Victory Capital Transfer Agency, Inc. ("VCTA"), (formerly, USAA Shareholder Account Services ("SAS")) provides transfer agency services to the Fund. VCTA, an affiliate of the Adviser, provides transfer agent services to the Fund Shares and Adviser Shares based on an annual charge of $25.50 per shareholder account plus out-of-pocket expenses. VCTA pays a portion of these fees to certain intermediaries for the administration and servicing of accounts that are held with such intermediaries. Amounts incurred and paid to VCTA from July 1, 2019 through March 31, 2020, was $151 and $7 thousand for the Fund Shares and Adviser Shares, respectively. Amounts incurred and paid to SAS from April 1, 2019 through June 30, 2019, was $49 and $2 thousand for the Fund Shares and Adviser Shares, respectively. These amounts are reflected on the Statement of Operations as Transfer agent fees.
28
USAA Mutual Funds Trust | Notes to Financial Statements — continued March 31, 2020 | ||||||
Effective with the Transaction on July 1, 2019, FIS Investor Services LLC serves as sub-transfer agent and dividend disbursing agent for the Fund pursuant to a Sub-Transfer Agent agreement between VCTA and FIS Investor Services LLC. VCTA provides FIS Investor Services LLC a fee for providing these services.
Distribution and Service 12b-1 Fees:
Effective with the Transaction on July 1, 2019, Victory Capital Advisers, Inc. (the "Distributor"), an affiliate of the Adviser, serves as distributor for the continuous offering of the Adviser Shares pursuant to a Distribution Agreement between the Distributor and the Trust. Effective on or about June 30, 2020, the Distributor's name will change to Victory Capital Services, Inc. Pursuant to the Distribution and Service Plans adopted in accordance with Rule 12b-1 under the 1940 Act, the Distributor may receive a monthly distribution and service fee, at an annual rate of up to 0.25% of the average daily net assets of the Adviser Shares. Amounts incurred and paid to the Distributor from July 1, 2019 through March 31, 2020, are $38 thousand and reflected on the Statement of Operations as 12b-1 Fees.
Adviser Shares are offered and sold without imposition of an initial sales charge or a contingent deferred sales charge.
Prior to the Transaction on July 1, 2019, the Fund adopted a plan pursuant to Rule 12b-1 under the 1940 Act with respect to the Adviser Shares. Under the plan, the Adviser Shares paid fees to USAA Investment Management Company (IMCO), the distributor, for distribution and shareholder services. IMCO paid all or a portion of such fees to intermediaries that made the Adviser Shares available for investment by their customers. The fee was accrued daily and paid monthly at an annual rate of 0.25% of the Adviser Shares' average daily net assets. IMCO also provided exclusive underwriting and distribution of the Fund's shares on a continuing best-efforts basis and received no fee or other compensation for these services, but may have received 12b-1 fees as described above, with respect to Adviser Shares. Amounts incurred and paid to IMCO from April 1, 2019 through June 30, 2019, were $12 thousand and reflected on the Statement of Operations as 12b-1 Fees.
Other Fees:
Prior to the Transaction on July 1, 2019, State Street Bank and Trust Company served as the Fund's accounting agent and custodian.
Effective August 5, 2019, Citibank, N.A., serves as the Fund's custodian.
K&L Gates LLP provides legal services to the Trust.
Effective with the Transaction on July 1, 2019, the Adviser has entered into an expense limitation agreement with the Fund until at least June 30, 2021. Under the terms of the agreement, the Adviser has agreed to waive fees or reimburse certain expenses to the extent that ordinary operating expenses incurred by certain classes of the Fund in any fiscal year exceed the expense limit for such classes of the Fund. Such excess amounts will be the liability of the Adviser. Interest, taxes, brokerage commissions, other expenditures which are capitalized in accordance with GAAP, and other extraordinary expenses not incurred in the ordinary course of the Fund's business are excluded from the expense limits. Effective July 1, 2019 through March 31, 2020, the expense limit (excluding voluntary waivers) is 0.54% and 0.80% for the Fund Shares and Adviser Shares, respectively.
Under this expense limitation agreement, the Fund has agreed to repay fees and expenses that were waived or reimbursed by the Adviser for a period up to three years after the fiscal year in which the waiver or reimbursement took place, subject to the lesser of any operating expense limits in effect at the time of: (a) the original waiver or expense reimbursement; or (b) the recoupment, after giving effect to the recoupment amount. As of March 31, 2020, the following amounts are available to be repaid to the Adviser (amounts in thousands).
Expires 03/31/2023 | |||||||
$ | 1 | ||||||
The Adviser, may voluntarily waive or reimburse additional fees to assist the Fund in maintaining competitive expense ratios. Voluntary waivers and reimbursements applicable to the Fund are not
29
USAA Mutual Funds Trust | Notes to Financial Statements — continued March 31, 2020 | ||||||
available to be recouped at a future time. There were no voluntary waivers or reimbursements for the year ended March 31, 2020.
Prior to the Transaction on July 1, 2019, AMCO agreed, through July 31, 2019, to limit the total annual operating expenses of the Adviser Shares to 0.80% of the average daily net assets, excluding extraordinary expenses and before reductions of any expenses paid indirectly, and to reimburse the Adviser Shares for all expenses in excess of those amounts. Effective with the Transaction on July 1, 2019, this expense limit is no longer in effect and is not available to be recouped by AMCO. For the period April 1, 2019 through June 30, 2019, amounts reimbursements from the Adviser Shares are reflected on the Statement of Operations as Expenses waived/reimbursed by AMCO.
Certain officers and/or interested trustees of the Fund are also officers and/or employees of the Adviser, Administrator, Sub-Administrator, Sub-Fund Accountant, and Legal.
5. Risks:
The Fund may be subject to other risks in addition to these identified risks.
The Fund may be subject to various risks as described in the Fund's prospectus. A widespread health crisis such as a global pandemic could cause substantial market volatility, exchange trading suspensions and closures, impact the ability to complete redemptions, and affect Fund performance. For example, the novel coronavirus disease (COVID-19) has resulted in significant disruptions to global business activity that may continue, worsen and/or trigger other factors impacting the liquidity or value of investments. The impact of health crises and other epidemics and pandemics may affect the global economy in ways that cannot necessarily be foreseen at the present time. Health crises may exacerbate other pre-existing political, social, and economic risks. Any such impact could adversely affect the Funds' performance, resulting in losses to your investment. For more information, please refer to the "Principal risks" section of the Fund's prospectus.
The fixed-income securities in the Fund's portfolio are subject to credit risk, which is the possibility that an issuer of a fixed-income security will fail to make timely interest and/or principal payments on its securities or that negative market perceptions of the issuer's ability to make such payments will cause the price of that security to decline. The Fund accepts some credit risk as a recognized means to enhance an investor's return. All fixed-income securities, varying from the highest quality to the very speculative, have some degree of credit risk. Fixed-income securities rated below investment grade, also known as "junk" or high-yield bonds, generally entail greater economic, credit, and liquidity risk than investment-grade securities. Their prices may be more volatile, especially during economic downturns, financial setbacks, or liquidity events.
The Fund is subject to the risk that the market value of the bonds in its portfolio will fluctuate because of changes in interest rates, changes in the supply of and demand for tax-exempt securities, and other market factors. Bond prices generally are linked to the prevailing market interest rates. In general, when interest rates rise, bond prices fall; conversely, when interest rates fall, bond prices rise. The price volatility of a bond also depends on its duration. Generally, the longer the duration of a bond, the greater is its sensitivity to interest rates. To compensate investors for this higher interest rate risk, bonds with longer durations generally offer higher yields than bonds with shorter durations. Decisions by the U.S. Federal Reserve regarding interest rate and monetary policy can have a significant effect on the value of debt securities as well as the overall strength of the U.S. economy. Precise interest rate predictions are difficult to make, and interest rates may change unexpectedly and dramatically in response to extreme changes in market or economic conditions. Interest rates have been unusually low in recent years in the U.S. and abroad, and central banks have reduced rates further in an effort to combat the economic effects of the COVID-19 pandemic. Extremely low or negative interest rates may become more prevalent or may not work as intended, and the impact on various markets that interest rate or other significant policy changes may have is unknown. The ability of an issuer of a debt security to repay principal prior to a security's maturity can increase the security's sensitivity to interest rate changes.
During a period of declining interest rates, many municipal bonds may be "called," or redeemed, by the issuer before the stated maturity. An issuer might call, or refinance, a higher-yielding bond for the same reason that a homeowner would refinance a home mortgage. When bonds are called, the Fund is
30
USAA Mutual Funds Trust | Notes to Financial Statements — continued March 31, 2020 | ||||||
affected in several ways. Most likely, the Fund will reinvest the bond-call proceeds in bonds with lower interest rates. The Fund's income may drop as a result. The Fund also may realize a taxable capital gain (or loss).
Because the Fund invests primarily in Virginia tax-exempt securities, the Fund is more susceptible to adverse economic, political, and regulatory changes affecting tax-exempt securities issuers in that state. For more information, see the SAI.
6. Borrowing and Interfund Lending:
Line of Credit:
Effective with the Transaction on July 1, 2019, the Victory Funds Complex participates in a short-term, demand note "Line of Credit" agreement with Citibank. Under the agreement with Citibank, the Victory Funds Complex could borrow up to $600 million, of which $300 million is committed and $300 million is uncommitted. $40 million of the Line of Credit is reserved for use by the Victory Floating Rate Fund, another series of the Victory Funds Complex, with that Fund paying the related commitment fees for that amount. The purpose of the agreement is to meet temporary or emergency cash needs. Citibank receives an annual commitment fee of 0.15% on $300 million for providing the Line of Credit. Each fund in the Victory Funds Complex pays a pro-rata portion of the commitment fees plus any interest (one month LIBOR plus one percent) on amounts borrowed. Interest charged to the Fund, if any, during the period is presented on the Statement of Operations under line of credit fees.
Prior to the Transaction on July 1, 2019, the line of credit among the Trust, with respect to its funds, and USAA Capital Corporation ("CAPCO") terminated. For the period from April 1, 2019 to June 30, 2019, the Fund paid CAPCO facility fees of $1 thousand.
The Fund had no borrowings under either agreement with Citibank or CAPCO during the year ended March 31, 2020.
Interfund Lending:
Effective with the Transaction on July 1, 2019, the Trust and Adviser rely on an exemptive order granted by the SEC in March 2017 (the "Order"), permitting the establishment and operation of an Interfund Lending Facility (the "Facility"). The Facility allows the Fund to directly lend and borrow money to or from any other Fund in the Victory Fund Complex relying upon the Order at rates beneficial to both the borrowing and lending funds. Advances under the Facility are allowed for temporary or emergency purposes. The interfund loan rate is determined, as specified in the Order, by averaging the current repurchase agreement rate and the current bank loan rate. As a Borrower, interest charged to the Fund, if any, during the period is presented on the Statement of Operations under Interest expense on Interfund lending. As a Lender, interest earned by the Fund, if any, during the period is presented on the Statement of Operations under Income on Interfund lending.
The average borrowing for the days outstanding and average interest rate for the Fund during the year ended March 31, 2020, were as follows (amounts in thousands):
| Borrower or Lender | Amount Outstanding at March 31, 2020 | Average Borrowing* | Days Borrowing Outstanding | Average Interest Rate | Maximum Borrowing During the Period | ||||||||||||||||||
Borrower | $ | — | $ | 4,469 | 6 | 0.93 | % | $ | 10,095 | ||||||||||||||
* For the year ended March 31, 2020, based on the number of days borrowings were outstanding.
7. Federal Income Tax Information:
The Fund intends to declare daily and distribute any net investment income monthly. Distributable net realized gains, if any, are declared and paid at least annually.
The amounts of dividends from net investment income and distributions from net realized gains (collectively distributions to shareholders) are determined in accordance with federal income tax
31
USAA Mutual Funds Trust | Notes to Financial Statements — continued March 31, 2020 | ||||||
regulations, which may differ from GAAP. To the extent these "book/tax" differences are permanent in nature (e.g., net operating loss and distribution reclassification,), such amounts are reclassified within the components of net assets based on their federal tax-basis treatment; temporary differences (e.g., wash sales) do not require reclassification. To the extent dividends and distributions exceed net investment income and net realized gains for tax purposes, they are reported as distributions of capital. Net investment losses incurred by the Fund may be reclassified as an offset to capital on the accompanying Statement of Assets and Liabilities.
As of March 31, 2020, on the Statement of Assets and Liabilities, there were no permanent book-to-tax difference reclassification adjustments.
The tax character of distributions paid during the tax years ended as noted below, were as follows (total distributions paid may differ from the Statement of Changes in Net Assets because, for tax purposes, dividends are recognized when actually paid) (amounts in thousands):
Year Ended March 31, 2020 | Year Ended March 31, 2019 | ||||||||||||||||||
Distributions paid from | Distributions paid from | ||||||||||||||||||
| Tax-Exempt Income | Total Distributions Paid | Tax-Exempt Income | Total Distributions Paid | ||||||||||||||||
$ | 19,620 | $ | 19,620 | $ | 20,464 | $ | 20,464 | ||||||||||||
As of the tax year ended March 31, 2020, the components of accumulated earnings (deficit) on a tax basis were as follows (amounts in thousands):
| Undistributed Tax Exempt Income | Distributions Payable | Accumulated Capital and Other Losses | Unrealized Appreciation (Depreciation)* | Total Accumulated Earnings (Deficit) | |||||||||||||||
$ | 2,591 | $ | (1,707 | ) | $ | (9,692 | ) | $ | 11,257 | $ | 2,449 | ||||||||
* The difference between the book-basis and tax-basis of unrealized appreciation/depreciation is attributable to defaulted bond income accruals.
At March 31, 2020, the Fund had net capital loss carryforwards as shown in the table below (amounts in thousands). It is unlikely that the Board will authorize a distribution of capital gains realized in the future until the capital loss carryforwards have been used.
| Short-Term Amount | Long-Term Amount | Total | |||||||||
| $ | 1,006 | $ | 8,686 | $ | 9,692 | ||||||
As of March 31, 2020, the cost basis for federal income tax purposes, gross unrealized appreciation, gross unrealized depreciation, and net unrealized appreciation (depreciation) for investments were as follows (amounts in thousands):
| Cost of Investments for Federal Tax Purposes | Gross Unrealized Appreciation | Gross Unrealized Depreciation | Net Unrealized Appreciation (Depreciation) | ||||||||||||
| $ | 706,515 | $ | 24,955 | $ | (13,698 | ) | $ | 11,257 | |||||||
8. Liquidity Risk Management Program:
The USAA Funds have adopted and implemented a written liquidity risk management program (the "LRMP") as required by Rule 22e-4 under the Investment Company Act of 1940, as amended. The LRMP is reasonably designed to assess and manage the Fund's liquidity risk, taking into consideration the Fund's investment strategy and the liquidity of its portfolio investments during normal and reasonably foreseeable stressed market conditions; its short and long-term cash flow projections; and its cash holdings and access to other liquidity management tools such as available funding sources including the Victory Funds Complex Interfund Lending Facility and Line of Credit (discussed in the Notes to
32
USAA Mutual Funds Trust | Notes to Financial Statements — continued March 31, 2020 | ||||||
Financial Statements). The USAA Funds' Board of Trustees approved the appointment of the Fund's investment adviser, Victory Capital Management Inc. ("Victory Capital"), as the administrator of the LRMP. At an in-person meeting held on February 26, 2020, Victory Capital provided an oral and written report to the Trustees on the operation and effectiveness of the LRMP during the previous year.
Victory Capital manages liquidity risks associated with the Fund's investments by monitoring, among other things, cash and cash equivalents, any use of derivatives, the concentration of investments, the appropriateness of the Fund's investment strategy, and by classifying every fund investment as either highly liquid, moderately liquid, less liquid or illiquid on at least a monthly basis. To assist with the classification of Fund investments, Victory Capital has retained a third-party provider of liquidity evaluation services. This provider determines preliminary liquidity classifications for all portfolio holdings based upon portfolio-level data and certain assumptions provided by Victory Capital. Victory Capital reviews the preliminary liquidity classifications, and, when appropriate, considers other information including input from the Fund's portfolio managers (including the portfolio managers employed by any investment sub-advisers) in determining final liquidity classifications.
The report from Victory Capital concluded that the Fund did not experience any significant liquidity challenges during the covered period, and the Fund's LRMP is reasonably designed to assess and manage its liquidity risk. The report also concluded that the LRMP continues to operate adequately and effectively to enable Victory Capital to oversee and manage liquidity risk and ensure the Fund is able to meet redemption requests without significant dilution to the remaining investors' interest in the Fund. During the review period, the Fund's portfolio consisted primarily of highly liquid investments, which are defined as cash and any investments reasonably expected to be converted to cash in current market conditions in three business days or less without significantly changing the market value of the investment. Therefore, the Fund has not adopted a Highly Liquid Investment Minimum. The Fund's investments were below the limitation on illiquid investments during the review period. Additionally, Victory Capital indicated that no events occurred that would require the filing of Form N-LIQUID and recommended no material changes to the LRMP.
9. Subsequent Events
An outbreak of respiratory disease called COVID-19 was first detected in China in December 2019 and subsequently spread internationally. The transmission of COVID-19 and efforts to contain its spread have resulted in international, national and local border closings and other significant travel restrictions and disruptions, significant disruptions to business operations, supply chains and consumer activity, significant challenges in healthcare service preparation and delivery, and quarantines, as well as general concern and uncertainty that has negatively affected the economic environment and that occurred subsequent to year end may have a significant negative impact on the operations and profitability of the Funds' investments. These impacts have caused significant volatility and declines in global financial markets, which have caused losses for investors. The impact of the COVID-19 pandemic may be short term or may last for an extended period of time, and in either case could result in a substantial economic downturn or recession. Public health crises may exacerbate other pre-existing political, social, economic, market and financial risks. The extent of the impact to the financial performance of the Funds' investments will depend on future developments, including (i) the duration and spread of the outbreak, (ii) the restrictions and advisories, (iii) the effects on the financial markets, and (iv) the effects on the economy overall, all of which are highly uncertain and cannot be predicted.
The Board of Trustees of USAA Mutual Funds Trust has approved redesignating the Fund's current Adviser Shares as "Class A" shares ("Redesignation"). This change is expected to be effective in late June 2020 ("Redesignation Date").
Class A shares will be available for purchase through financial intermediaries and the Fund will pay ongoing distribution and/or service (12b-1) fees at annual rate of up to 0.25% of the average daily net assets of its Class A shares. In addition, the Transfer Agency fee will convert to an annual basis point rate of 0.10% of daily net assets of its Class A shares from its current flat per account fee. Class A shares will be offered and sold at their public offering price, which is the net asset value per share plus any applicable initial sales charge, also referred to as a "front-end sales load." For purchases on or after the Redesignation Date, Class A Shares will be offered and sold with the imposition of a maximum
33
USAA Mutual Funds Trust | Notes to Financial Statements — continued March 31, 2020 | ||||||
initial sales charge of up to 2.25% of the offering price of the Fund. A contingent deferred sales charge of up to 0.75% may be imposed on redemptions of Class A shares purchased without an initial sales charge if shares are redeemed within 12 months of purchase.
The Redesignation will be made without the imposition of any sales loads, fees, or other charges to Adviser Shares held in shareholder accounts on the Redesignation Date. The Redesignation will not be considered a taxable event for federal income tax purposes.
34
REPORT OF INDEPENDENT REGISTERED PUBLIC ACCOUNTING FIRM
To the Shareholders and the Board of Trustees of USAA Virginia Bond Fund:
Opinion on the Financial Statements
We have audited the accompanying statement of assets and liabilities of USAA Virginia Bond Fund (the "Fund") (one of the funds constituting USAA Mutual Funds Trust (the "Trust")), including the schedule of portfolio investments, as of March 31, 2020, and the related statement of operations for the year then ended, the statements of changes in net assets for each of the two years in the period then ended, the financial highlights for each of the five years in the period then ended and the related notes (collectively referred to as the "financial statements"). In our opinion, the financial statements present fairly, in all material respects, the financial position of the Fund at March 31, 2020, the results of its operations for the year then ended, the changes in its net assets for each of the two years in the period then ended and its financial highlights for each of the five years in the period then ended, in conformity with U.S. generally accepted accounting principles.
Basis for Opinion
These financial statements are the responsibility of the Trust's management. Our responsibility is to express an opinion on the Fund's financial statements based on our audits. We are a public accounting firm registered with the Public Company Accounting Oversight Board (United States) ("PCAOB") and are required to be independent with respect to the Trust in accordance with the U.S. federal securities laws and the applicable rules and regulations of the Securities and Exchange Commission and the PCAOB.
We conducted our audits in accordance with the standards of the PCAOB. Those standards require that we plan and perform the audit to obtain reasonable assurance about whether the financial statements are free of material misstatement, whether due to error or fraud. The Trust is not required to have, nor were we engaged to perform, an audit of the Trust's internal control over financial reporting. As part of our audits we are required to obtain an understanding of internal control over financial reporting, but not for the purpose of expressing an opinion on the effectiveness of the Trust's internal control over financial reporting. Accordingly, we express no such opinion.
Our audits included performing procedures to assess the risks of material misstatement of the financial statements, whether due to error or fraud, and performing procedures that respond to those risks. Such procedures included examining, on a test basis, evidence regarding the amounts and disclosures in the financial statements. Our procedures included confirmation of securities owned as of March 31, 2020, by correspondence with the custodian and brokers or by other appropriate auditing procedures where replies from brokers were not received. Our audits also included evaluating the accounting principles used and significant estimates made by management, as well as evaluating the overall presentation of the financial statements. We believe that our audits provide a reasonable basis for our opinion.

We have served as the auditor of one or more Victory Capital investment companies since 1995.
San Antonio, Texas
May 27, 2020
35
USAA Mutual Funds Trust | Supplemental Information March 31, 2020 | ||||||
(Unaudited)
Expense Examples
As a shareholder of the Fund, you may incur two types of costs: (1) transaction costs, and (2) ongoing costs, including management fees and other Fund expenses. These examples are intended to help you understand your ongoing costs (in dollars) of investing in the Fund and to compare these costs with the ongoing costs of investing in other mutual funds.
These examples are based on an investment of $1,000 invested at the beginning of the period and held for the entire period from October 1, 2019, through March 31, 2020.
The Actual Expense figures in the table below provide information about actual account values and actual expenses. You may use the information below, together with the amount you invested, to estimate the expenses that you paid over the period. Simply divide your account value by $1,000 (for example, an $8,600 account value divided by $1,000 = 8.6), then multiply the result by the number in the table under the heading entitled "Actual Expenses Paid During Period" to estimate the expenses you paid on your account during this period.
The Hypothetical Expense figures in the table below provide information about hypothetical account values and hypothetical expenses based on the Fund's actual expense ratio and an assumed rate of return of 5% per year before expenses, which is not the Fund's actual return. The hypothetical account values and expenses may not be used to estimate the actual ending account balance or expenses you paid for the period. You may use this information to compare this 5% hypothetical example with the 5% hypothetical examples that appear in shareholder reports of other funds.
Please note the expenses shown in the table below are meant to highlight your ongoing costs only and do not reflect any transactional costs. If these transactional costs were included, your costs would have been higher.
| Beginning Account Value 10/1/19 | Actual Ending Account Value 3/31/20 | Hypothetical Ending Account Value 3/31/20 | Actual Expenses Paid During Period 10/1/19- 3/31/20* | Hypothetical Expenses Paid During Period 10/1/19- 3/31/20* | Annualized Expense Ratio During Period 10/1/19- 3/31/20 | ||||||||||||||||||||||
Fund Shares | $ | 1,000.00 | $ | 993.00 | $ | 1,022.35 | $ | 2.64 | $ | 2.68 | 0.53 | % | |||||||||||||||
Adviser Shares | 1,000.00 | 991.70 | 1,021.00 | 3.98 | 4.04 | 0.80 | % | ||||||||||||||||||||
* Expenses are equal to the average account value multiplied by the Fund's annualized expense ratio multiplied by 183/366 (the number of days in the most recent fiscal half-year divided by the number of days in the fiscal year).
Proxy Voting and Portfolio Holdings Information
Proxy Voting:
Information regarding the policies and procedures the Fund uses to determine how to vote proxies relating to portfolio securities is available without charge, upon request, by calling (800) 539-3863. The information is also included in the Fund's Statement of Additional Information, which is available on the SEC's website at www.sec.gov.
Information relating to how the Fund voted proxies relating to portfolio securities held during the most recent 12 months ended June 30 is available on the SEC's website at www.sec.gov.
Availability of Schedules of Portfolio Investments:
The Trust files a complete list of Schedules of Portfolio Investments with the SEC for the first and third quarter of each fiscal year on Form N-PORT. Forms N-PORT are available on the SEC's website at www.sec.gov.
36
USAA Mutual Funds Trust | Supplemental Information — continued March 31, 2020 | ||||||
(Unaudited)
Trustee and Officer Information
Board of Trustees:
Overall responsibility for management of the Trust rests with the Board. The Trust is managed by the Board in accordance with the laws of the state of Delaware. There are currently 10 Trustees, eight of whom are not "interested persons" of the Trust within the meaning of that term under the 1940 Act ("Independent Trustees") and two of whom is an "interested person" of the Trust within the meaning of that term under the 1940 Act ("Interested Trustee"). The Trustees, in turn, elect the officers of the Trust to actively supervise its day-to-day operations.
The following tables list the Trustees, their ages, position with the Trust, commencement of service, principal occupations during the past five years and any directorships of other investment companies or companies whose securities are registered under the Securities Exchange Act of 1934, as amended, or who file reports under that Act. Each Trustee oversees 47 portfolios in the Trust. Each Trustee's address is 15935 La Cantera Pkwy, Building Two, San Antonio, TX, 78256. Pursuant to a policy adopted by the Board, the term of office for each Trustee shall be until the Independent Trustee reaches age 75 or an Interested Trustee reaches age 75. The Board may change or grant exceptions from this policy at any time without shareholder approval. A Trustee may resign or be removed by a vote of the other Trustees or the holders of a majority of the outstanding shares of the Trust at any time. Vacancies on the Board can be filled by the action of a majority of the Trustees, provided that after filling such vacancy at least two-thirds of the Trustees have been elected by the shareholders.
Name and Date of Birth | Position Held with the Trust | Year Commenced Service | Principal Occupation During Past 5 Years | Other Directorships Held During Past 5 Years | |||||||||||||||
Independent Trustees. | |||||||||||||||||||
| Jefferson C. Boyce, Born September 1957 | Lead Independent Trustee, and Vice Chairman | 2013 | Senior Managing Director, New York Life Investments, LLC (1992-2012) | Westhab, Inc. | |||||||||||||||
| John C. Walters, Born February 1962 | Trustee | 2019 | Retired. Mr. Walters brings significant Board experience including active involvement with the board of a Fortune 500 company, and a proven record of leading large, complex financial organizations. He has a demonstrated record of success in distribution, manufacturing, investment brokerage, and investment management in both the retail and institutional investment businesses. He has substantial experience in the investment management business with a demonstrated ability to develop and drive strategy while managing operation, financial, and investment risk. | Guardian Variable Products Trust (16 series), Lead Independent Director; Amerilife Holdings LLC, Director; Stadion Money Management; Director; University of North Carolina (Chapel Hill), Member Board of Governors. | |||||||||||||||
37
USAA Mutual Funds Trust | Supplemental Information — continued March 31, 2020 | ||||||
(Unaudited)
Name and Date of Birth | Position Held with the Trust | Year Commenced Service | Principal Occupation During Past 5 Years | Other Directorships Held During Past 5 Years | |||||||||||||||
| Robert L. Mason, Ph.D., Born July 1946 | Trustee | 1997 | Adjunct Professor in the Department of Management Science and Statistics in the College of Business at the University of Texas at San Antonio (since 2001); Institute Analyst, Southwest Research Institute (March 2002-January 2016) | None | |||||||||||||||
| Dawn M. Hawley, Born February 1954 | Trustee | 2014 | Manager of Finance, Menil Foundation, Inc. (May 2007-June 2011), which is a private foundation that oversees the assemblage of sculptures, prints, drawings, photographs, and rare books. Director of Financial Planning and Analysis and Chief Financial Officer, AIM Management Group, Inc. (October 1987-January 2006) | None | |||||||||||||||
| Paul L. McNamara, Born July 1948 | Trustee | 2012 | Director, Cantor Opportunistic Alternatives Fund, LLC (March 2010-February 2014) , which is a closed-end fund of funds by Cantor Fitzgerald Investment Advisors, LLC | None | |||||||||||||||
38
USAA Mutual Funds Trust | Supplemental Information — continued March 31, 2020 | ||||||
(Unaudited)
Name and Date of Birth | Position Held with the Trust | Year Commenced Service | Principal Occupation During Past 5 Years | Other Directorships Held During Past 5 Years | |||||||||||||||
| Richard Y. Newton III, Born January 1956 | Trustee | 2017 | Director, Elta North America (01/18-present), which is a global leader in the design, manufacture, and support of innovative electronic systems in the ground, maritime, airborne, and security domains for the nation's warfighters, security personnel, and first responders; Managing Partner, Pioneer Partnership Development Group (December 2015-present)); Executive Director, The Union League Club of New York (June 2014-November 2015): Executive Vice President, Air Force Association (August 2012-May 2014); Lieutenant General, United States Air Force (January 2008-June 2012) | None | |||||||||||||||
| Barbara B. Ostdiek, Ph.D., Born March 1964 | Trustee | 2008 | Senior Associate Dean of Degree Programs at Jesse H. Jones Graduate School of Business at Rice University (since 2013); Associate Professor of Finance at Jessie H. Jones Graduate School of Business at Rice University (since 2001) | None | |||||||||||||||
| Michael F. Reimherr, Born August 1945 | Trustee | 2000 | President of Reimherr Business Consulting (May 1995-December 2017); St. Mary's University Investment Committee overseeing University Endowment (since 2014) | None | |||||||||||||||
39
USAA Mutual Funds Trust | Supplemental Information — continued March 31, 2020 | ||||||
(Unaudited)
Name and Date of Birth | Position Held with the Trust | Year Commenced Service | Principal Occupation During Past 5 Years | Other Directorships Held During Past 5 Years | |||||||||||||||
Interested Trustees. | |||||||||||||||||||
| David C. Brown, ** Born May 1972 | Trustee | 2019 | Chairman and Chief Executive Officer (since 2013), Co-Chief Executive Officer (2011-2013), Victory Capital Management Inc.; Chairman and Chief Executive Officer, Victory Capital Holdings, Inc. (since 2013). Mr. Brown brings to the Board extensive business, finance and leadership skills gained and developed through years of experience in the financial services industry, including his tenure overseeing the strategic direction as CEO of Victory Capital. These skills, combined with Mr. Brown's extensive knowledge of the financial services industry and demonstrated success in the development and distribution of investment strategies and products, enable him to provide valuable insights to the Board and strategic direction for the Funds | Trustee, Victory Portfolios (42 series), Victory Portfolios II (26 series), Victory Variable Insurance Funds (9 series) | |||||||||||||||
40
USAA Mutual Funds Trust | Supplemental Information — continued March 31, 2020 | ||||||
(Unaudited)
Name and Date of Birth | Position Held with the Trust | Year Commenced Service | Principal Occupation During Past 5 Years | Other Directorships Held During Past 5 Years | |||||||||||||||
| Daniel S. McNamara, ** Born June 1966 | Trustee and Chair of the Board of Trustees | 2012 | Trustee, President, and Vice Chairman of USAA ETF Trust (June 2017-June 2019); President of Financial Advice & Solutions Group (FASG), USAA (since 2013); Director, IMCO (September 2009-April 2014); President, AMCO (August, 2011-April 2013); Senior Vice President of USAA Financial Planning Services Insurance Agency, Inc. (FPS) (since 2011); Director of USAA Investment Management Company (IMCO) (since 2009); Chairman of Board of IMCO (since 2013); Director of USAA Asset Management Company (AMCO), (August 2011-June 2019); President and Director of USAA Shareholder Account Services (SAS)(October 2009-June 2019); Director and Vice Chairman of FPS (since 2013); President and Director of USAA Investment Corporation (ICORP) (since 2010); Chairman of Board of ICORP (since 2013); Director of USAA Financial Advisors, Inc. (FAI) (since 2013); Chairman of Board of FAI (since 2015). Mr. McNamara brings to the Board extensive experience in the financial services industry, including experience as an officer of the Trust. | None | |||||||||||||||
** Mr. McNamara and Mr. Brown are "Interested Persons" by reason of their relationships with the Adviser.
The Statement of Additional Information includes additional information about the Trustees of the Trust and is available, without charge, on the SEC's website at www.sec.gov and/or by calling (800)-539-3863.
41
USAA Mutual Funds Trust | Supplemental Information — continued March 31, 2020 | ||||||
(Unaudited)
Officers:
The officers of the Trust, their ages, commencement of service and their principal occupations during the past five years, are detailed in the following table. Each officer serves until the earlier of his or her resignation, removal, retirement, death, or the election of a successor. The mailing address of each officer of the Trust is 15935 La Cantera Pkwy, Building Two, San Antonio, TX, 78256. The officers of the Trust receive no compensation directly from the Trust for performing the duties of their offices.
Name and Date of Birth | Position with the Trust | Year Commenced Service | Principal Occupation During Past 5 Years | ||||||||||||
Interested Officers. | |||||||||||||||
| Christopher K. Dyer, Born February 1962 | President | 2019 | Director of Fund Administration, Victory Capital (2004-present) | ||||||||||||
| Scott A Stahorsky, Born July 1969 | Vice President | 2019 | Manager, Fund Administration, Victory Capital (since 2015); Senior Analyst, Fund Administration, Victory Capital (prior to 2015) | ||||||||||||
| James K. De Vries, Born April 1969 | Treasurer, Principal Financial Officer | 2018 | Executive Director, Victory Capital Management Inc. (since 2019); Treasurer, USAA ETF Trust (September 2018-June 2019); Executive Director, Investment and Financial Administration, USAA (April 2012-June 2019); Assistant Treasurer, USAA ETF Trust (June 2017-September 2018); Assistant Treasurer, USAA Mutual Funds Trust (December 2013-February 2018) | ||||||||||||
| Allan Shaer, Born March 1965 | Assistant Treasurer | 2019 | Senior Vice President, Financial Administration, Citi Fund Services Ohio, Inc. (since 2016); Vice President, Mutual Fund Administration, JP Morgan Chase (2011-2016) | ||||||||||||
| Carol D. Trevino, Born October 1965 | Assistant Treasurer | 2018 | Director, Accounting and Finance, Victory Capital Management Inc. (since 2019); Accounting/Financial Director, USAA (December 2013-June 2019); Assistant Treasurer, USAA ETF Trust (September 2018-June 2019). | ||||||||||||
| Erin G. Wagner, Born February 1974 | Secretary | 2019 | Deputy General Counsel, the Adviser (since 2013) | ||||||||||||
| Charles Booth, Born April 1960 | Anti-Money Laundering Compliance Officer and Identity Theft Officer | 2019 | Director, Regulatory Administration and CCO Support Services, Citi Fund Services Ohio, Inc. (2007-Present). | ||||||||||||
| Amy Campos, Born July 1976 | Chief Compliance Officer | 2019 | Chief Compliance Officer, USAA Mutual Funds Trust (since 2019); Executive Director, Deputy Chief Compliance Officer, USAA Mutual Funds Trust and USAA ETF Trust (July 2017-June 2019); Compliance Director, USAA Mutual Funds Trust (2014-July 2017) | ||||||||||||
42
USAA Mutual Funds Trust | Supplemental Information — continued March 31, 2020 | ||||||
(Unaudited)
Additional Federal Income Tax Information
The following federal tax information related to the Fund's fiscal year ended March 31, 2020, is provided for information purposes only and should not be used for reporting to federal or state revenue agencies. Federal tax information for the calendar year will be reported to you on Form 1099-DIV in January 2021.
With respect to distributions paid, the Fund designates the following amounts (or, if subsequently determined to be different, the maximum amount allowable) for the fiscal year ended March 31, 2020:
| Tax Exempt Income Amount* | |||||||
100.00 | % | ||||||
* Presented as a percentage of net investment income and excludes short-term capital gain distributions paid, if any. All or a portion of these amounts may be exempt from taxation at the state level.
43
Privacy Policy
Protecting the Privacy of Information
The Trust respects your right to privacy. We also know that you expect us to conduct and process your business in an accurate and efficient manner. To do so, we must collect and maintain certain personal information about you. This is the information we collect from you on applications or other forms, and from the transactions you make with us or third parties. It may include your name, address, social security number, account transactions and balances, and information about investment goals and risk tolerance.
We do not disclose any information about you or about former customers to anyone except as permitted or required by law. Specifically, we may disclose the information we collect to companies that perform services on our behalf, such as the transfer agent that processes shareholder accounts and printers and mailers that assist us in the distribution of investor materials. We may also disclose this information to companies that perform marketing services on our behalf. This allows us to continue to offer you Victory investment products and services that meet your investing needs, and to effect transactions that you request or authorize. These companies will use this information only in connection with the services for which we hired them. They are not permitted to use or share this information for any other purpose.
To protect your personal information internally, we permit access only by authorized employees and maintain physical, electronic and procedural safeguards to guard your personal information.*
* You may have received communications regarding information about privacy policies from other financial institutions which gave you the opportunity to "opt-out" of certain information sharing with companies which are not affiliated with that financial institution. The Trust does not share information with other companies for purposes of marketing solicitations for products other than the Trust. Therefore, the Trust does not provide opt-out options to their shareholders.
15935 La Cantera Pkwy
Building Two
San Antonio, Texas 78256

Visit our website at: | Call | ||||||
usaa.com | (800) 235-8396 | ||||||
40862-0520
(a) The registrant has adopted a code of ethics that applies to the registrant’s principal executive officer, principal financial officer, principal accounting officer or controller, or persons performing similar functions. This code of ethics in included as an Exhibit.
(b) During the period covered by the report, with respect to the registrant’s code of ethics that applies to its principal executive officer, principal financial officer, principal accounting officer or controller, or persons performing similar functions; on July 1, 2019, the Board of Trustees of USAA Mutual Funds Trust approved a Code of Ethics (“Sarbanes Code”) applicable solely to its senior financial officers, including its principal executive officer (President), as defined under the Sarbanes-Oxley Act of 2002 and implementing regulations of the Securities and Exchange Commission. A copy of the Sarbanes Code is attached as an Exhibit to this Form N-CSR.
No waivers (explicit or implicit) have been granted from a provision of the Sarbanes Code.
Item 3. Audit Committee Financial Expert.
(a)(1) The registrant’s board of trustees has determined that the registrant has at least one audit committee financial expert serving on its audit committee.
(a)(2) The audit committee financial experts are Dr. Barbara B. Ostdiek, Ph.D. and Dawn M. Hawley, who are “independent” for purposes of this Item 3 of Form N-CSR.
Dr. Ostdiek has served as an Associate Professor of Management at Rice University since 2001. Dr. Ostdiek also has served as an Academic Director at El Paso Corporation Finance Center since 2002. Ms. Hawley was Chief Financial Officer, Director of Financial Planning and Analysis for AIM Management Group Inc. from October 1987 through January 2006 and was Manager of Finance at Menil Foundation, Inc. from May 2007 through June 2011. Each of Dr. Ostdiek and Ms. Hawley is an independent trustee
who serves as a member of the Audit and Compliance Committee, Investments Committee, Product Management and Distribution Committee, and the Corporate Governance Committee of the Board of Trustees of USAA Mutual Funds Trust.
Item 4. Principal Accountant Fees and Services.
|
| 2020 |
| 2019 |
| ||
(a) Audit Fees (1) |
| $ | 195,700 |
| $ | 260,100 |
|
(b) Audit-Related Fees (2) |
| — |
| — |
| ||
(c) Tax Fees (3) |
| 2,174 |
| 3,773 |
| ||
(d) All Other Fees (4) |
| — |
| — |
| ||
(1) Audit fees include amounts related to the audit of the Registrant’s annual financial statements and services normally provided by the accountant in connection with statutory and regulatory filings. Audit fees billed were for professional services provided by Ernst & Young LLP for statutory and regulatory filings.
(2) For the fiscal years ended March 31, 2020 and March 31, 2019, there were no audit-related fees billed by Ernst & Young LLP to the Registrant.
(3) Represents the aggregate tax fee billed for professional services rendered by Ernst & Young LLP for assistance with PFIC Analyzer Service and tax consulting services.
(4) For the fiscal years ended March 31, 2020 and March 31, 2019, there were no other fees billed by Ernst & Young LLP to the Registrant.
(e)(1) All audit and non-audit services to be performed for the Registrant by Ernst & Young LLP must be pre-approved by the Audit and Compliance Committee. The Audit and Compliance Committee Charter also permits the Chair of the Audit and Compliance Committee to pre-approve any permissible non-audit service that must be commenced prior to a scheduled meeting of the Audit and Compliance Committee. All non-audit services were pre-approved by the Audit and Compliance Committee or its Chair, consistent with the Audit and Compliance Committee’s preapproval procedures.
(e)(2) There were no services performed under Rule 2.01 (c)(7)(i)(C).
(f) Not applicable.
(g) Aggregate non-audit fees for services rendered to the:
|
| Registrant |
| Adviser |
| ||
2020 |
| $ | 2,174 |
| $ | 209,662 |
|
2019 |
| $ | 3,773 |
| $ | 151,735 |
|
(h) The aggregate non-audit fees related to fees billed by Ernst & Young LLP for services rendered to the Registrant; the investment adviser, USAA Asset Management Company (AMCO) and its affiliate, USAA Investment Management Company (IMCO); and the Funds’ transfer agent, Victory Capital Transfer Agency Inc. and prior transfer agent, USAA Shareholder Account Services (SAS), which includes aggregate fees accrued or paid to Ernst & Young LLP for professional services rendered related to the annual study of internal controls of the transfer agent for fiscal years listed above. All services were preapproved by the Audit Committee.
Effective July 1, 2019, AMCO, the prior investment adviser to the Funds, and SAS, the prior transfer agent to the Funds, were acquired by Victory Capital Holdings, Inc. Effective July 1, 2019, Victory Capital Management Inc. is the new investment adviser and administrator to the Funds; SAS was renamed Victory Capital Transfer Agency, Inc. and is the new transfer agent to the Funds.
Ernst & Young LLP provided non-audit services to AMCO and IMCO in 2020 and 2019 and also provided certain tax services to Victory Capital Holdings, Inc. in 2019 that were not required to be pre-approved by the Registrant’s Audit and Compliance Committee because the services were not directly related to the operations of the Registrant’s Funds. The Board of Trustees will consider Ernst & Young LLP’s independence and will consider whether the provision of these non-audit services to AMCO is compatible with maintaining Ernst & Young LLP’s independence.
Item 5. Audit Committee of Listed Registrants.
Not applicable.
Item 6. Investments.
(a) Not applicable.
(b) Not applicable.
Item 7. Disclosure of Proxy Voting Policies and Procedures for Closed-End Management Investment Companies.
Not applicable.
Item 8. Portfolio Managers of Closed-End Management Investment Companies.
Not applicable.
Item 9. Purchases of Equity Securities by Closed-End Management Investment Company and Affiliated Purchasers.
Not applicable.
Item 10. Submission of Matters to a Vote of Security Holders.
The Corporate Governance Committee selects and nominates candidates for membership on the Board as independent trustees. The Corporate Governance Committee has adopted procedures to consider Board candidates suggested by shareholders. The procedures are initiated by the receipt of nominations submitted by a fund shareholder sent to Board member(s) at the address specified in fund disclosure documents or as received by the Adviser or a fund officer. Any recommendations for a nomination by a shareholder, to be considered by the Board, must include at least the following information: name; date of birth; contact information; education; business profession and other expertise; affiliations; experience relating to serving on the Board; and references. The Corporate Governance Committee gives shareholder recommendations the same consideration as any other candidate.
Item 11. Controls and Procedures.
(a)The registrant’s principal executive officer and principal financial officer have concluded, based on their evaluation of the registrant’s disclosure controls and procedures as conducted within 90 days of the filing date of this report, that these disclosure controls and procedures are adequately designed and are operating effectively to ensure that information required to be disclosed by the registrant on Form N-CSR is recorded, processed, summarized and reported within the time periods specified in the Securities and Exchange Commission’s rules and forms.
(b)There were no changes in the registrant’s internal control over financial reporting (as defined in Rule 30a-3(d) under the Investment Company Act of 1940 (17 CFR 270.30a-3(d)) that occurred during the period covered by this report that have materially affected or are reasonably likely to materially affect, the registrant’s internal control over financial reporting.
Item 12. Disclosure of Securities Lending Activities for Closed-End Management Investment Companies.
(a)(1) Not applicable.
(a)(2) Not applicable.
(a)(3) Not applicable.
(a)(4) Not applicable.
(b) Not applicable.
Item 13. Exhibits.
(a)(1) The code of ethics that is the subject of the disclosure required by Item 2 is attached hereto.
(a)(2) Certifications pursuant to Rule 30a-2(a) are attached hereto.
(a)(3) Not applicable.
(a)(4) Not applicable.
(b) Certifications pursuant to Rule 30a-2(b) are attached hereto.
SIGNATURES
Pursuant to the requirements of the Securities Exchange Act of 1934 and the Investment Company Act of 1940, the registrant has duly caused this report to be signed on its behalf by the undersigned, thereunto duly authorized.
(Registrant) | USAA Mutual Fund Trust |
|
By (Signature and Title)* | /s/ James K. De Vries |
|
| James K. De Vries, Principal Financial Officer |
|
Date | June 4, 2020 |
|
Pursuant to the requirements of the Securities Exchange Act of 1934 and the Investment Company Act of 1940, this report has been signed below by the following persons on behalf of the registrant and in the capacities and on the dates indicated.
By (Signature and Title)* | /s/ Christopher K. Dyer |
|
| Christopher K. Dyer, Principal Executive Officer |
|
Date | June 4, 2020 |
|
By (Signature and Title)* | /s/ James, K. De Vries |
|
| James K. De Vries, Principal Financial Officer |
|
Date | June 4, 2020 |
|