Table of Contents
UNITED STATES
SECURITIES AND EXCHANGE COMMISSION
Washington, D.C. 20549
FORM N-CSR
CERTIFIED SHAREHOLDER REPORT OF REGISTERED
MANAGEMENT INVESTMENT COMPANIES
Investment Company Act file number: 811-07874
JPMorgan Insurance Trust
(Exact name of registrant as specified in charter)
1111 Polaris Parkway
Columbus, Ohio 43240
(Address of principal executive offices) (Zip code)
Frank J. Nasta
270 Park Avenue
New York, NY 10017
(Name and Address of Agent for Service)
Registrant’s telephone number, including area code: (800) 480-4111
Date of fiscal year end: December 31
Date of reporting period: January 1, 2011 through December 31, 2011
Form N-CSR is to be used by management investment companies to file reports with the Commission not later than 10 days after the transmission to stockholders of any report that is required to be transmitted to stockholders under Rule 30e-1 under the Investment Company Act of 1940 (17 CFR 270.30e-1). The Commission may use the information provided on Form N-CSR in its regulatory, disclosure review, inspection, and policymaking roles.
A registrant is required to disclose the information specified by Form N-CSR, and the Commission will make this information public. A registrant is not required to respond to the collection of information contained in Form N-CSR unless the Form displays a currently valid Office of Management and Budget (“OMB”) control number. Please direct comments concerning the accuracy of the information collection burden estimate and any suggestions for reducing the burden to Secretary, Securities and Exchange Commission, 450 Fifth Street, NW, Washington, DC 20549-0609. The OMB has reviewed this collection of information under the clearance requirements of 44 U.S.C. Section 3507.
Table of Contents
ITEM 1. REPORTS TO STOCKHOLDERS.
The following is a copy of the report transmitted to shareholders pursuant to Rule 30e-1 under the Investment Company Act of 1940 (17 CFR 270.30e-1).
Table of Contents
Annual Report
JPMorgan Insurance Trust
December 31, 2011
JPMorgan Insurance Trust Core Bond Portfolio
NOT FDIC INSURED Ÿ NO BANK GUARANTEE Ÿ MAY LOSE VALUE
|  |
Table of Contents
Investments in the Portfolio are not bank deposits or obligations of, or guaranteed or endorsed by, any bank and are not insured or guaranteed by the FDIC, the Federal Reserve Board or any other government agency. You could lose money if you sell when the Portfolio’s share price is lower than when you invested.
Past performance is no guarantee for future performance. The general market views expressed in this report are opinions based on conditions through the end of the reporting period and are subject to change without notice based on market and other conditions. These views are not intended to predict the future performance of the Portfolio or the securities markets. References to specific securities and their issuers are for illustrative purposes only and are not intended to be, and should not be interpreted as, recommendations to purchase or sell such securities. Such views are not meant as investment advice and may not be relied on as an indication of trading intent on behalf of the Portfolio.
This Portfolio is intended to be a funding vehicle for variable annuity contracts and variable life insurance policies (collectively “Policies”) offered by separate accounts of participating insurance companies. Portfolio shares are also offered through qualified pension and retirement plans (“Eligible Plans”). Individuals may not purchase shares directly from the Portfolio.
Prospective investors should refer to the Portfolio’s prospectus for a discussion of the Portfolio’s investment objective, strategies and risks. Call J.P. Morgan Funds Service Center at 1-800-480-4111 for a prospectus containing more complete information about the Portfolio including management fees and other expenses. Please read it carefully before investing.
Table of Contents
January 25, 2012 (Unaudited)
Dear Shareholder:
Investors greeted 2011 in much the same way they welcomed 2010: with high hopes that an improving U.S. economy would finally get us back on course to recovery.
This optimism quickly faded as the European debt crisis and a host of other economic and geopolitical concerns cast a dark shadow on the prospects for future growth. The combination of weak global economic data, credit downgrades in the U.S. and in Europe, and escalating fears of contagion all resulted in a level of market volatility not seen since the financial crisis three years ago.
 |
“Investors greeted 2011 in much the same way they welcomed 2010: With high hopes that an improving U.S. economy would finally get us back on course to recovery.” |
Nonetheless, stocks have regained some of their footing, as positive fourth-quarter economic data on auto sales, payroll employment and manufacturing activity all appear to indicate that consumer confidence is improving and economic growth may be accelerating.
We remain cautious, however, since many of the same challenges that we experienced in 2011 — European debt concerns, uncertainty over monetary and fiscal stimulus, and soft economic data — will likely remain in place this year, laying the groundwork for continued market volatility.
Strong fourth quarter surge caps volatile year
The European debt crisis and other geopolitical and economic events created a generally volatile year for equities, culminating in major sell off in the third quarter. A strong fourth quarter comeback did little to reverse the losses, as the Standard & Poor’s 500 Index (“S&P500 Index”) ended the year with only slight gains. As of December 31, 2011, the Index had reached a level of 1,258, an increase of 2.1% from one year prior.
Large cap growth stocks lead style categories
Large cap stocks outpaced mid- and small-cap stocks over the 12-month period ended December 31, 2011 (the Russell 1000 Index returned 1.5% and the Russell Mid Cap Index returned -1.6%, compared to a return of -4.2% for the Russell 2000 Index). Overall, large-cap growth stocks fared better than large-cap value stocks as the Russell 1000 Growth Index returned 2.6% for the 12-month reporting period, compared to 0.4% for the Russell 1000 Value Index.
Euro zone uncertainty drives flight-to-quality sentiment
Investors’ lack of confidence in global economic growth prompted them to seek safe havens in U.S. Treasury securities, and high-quality corporate bonds. The Barclays Capital U.S. Aggregate Bond Index returned 7.8%. High yield bonds and emerging market debt securities also performed well, as the Barclays Capital High Yield Index returned 5.0%, and the Barclays Capital Emerging Markets Index returned 7.0% for the 12-month period ended December 31, 2011.
Similar economic concerns pushed yields of U.S. Treasury securities maturing in 10 years or more to historic lows throughout the year. As of the end of the 12-month period ended December 31, 2011, the yields on the benchmark 10-year U.S. Treasury bond dropped from 3.3% to 1.9%. In addition, yields on the 30-year U.S. Treasury bond declined from 4.3% to 2.9%, as did the two-year U.S. Treasury note, from 0.6% to 0.3%.
Lesson for 2012: Keep balance in mind in economic uncertainty
Last year offered its share of shocks to investors: geopolitical upheaval, natural disasters, sovereign-debt crises, and credit-rating downgrades were all among the events competing for the market’s attention. Against the backdrop of an election year, it’s likely that we will face continued global surprises —both on the upside and the downside.
As you reassess your investment strategy for the year ahead, it’s important to stick with a plan that focuses on diversification as well as long-term allocation. Trying to “time” market fluctuations can be risky business, especially given the ongoing uncertainty surrounding the direction of economic growth and the euro zone crisis in the months ahead.
On behalf of everyone at J.P. Morgan Asset Management, thank you for your continued confidence. We look forward to managing your investment needs for years to come. Should you have any questions, please visit www.jpmorganfunds.com or contact the J.P. Morgan Funds Service Center at 1-800-480-4111.
Sincerely yours,

George C.W. Gatch
CEO-Investment Management Americas
J.P. Morgan Asset Management
| DECEMBER 31, 2011 | JPMORGAN INSURANCE TRUST | 1 | ||||||
Table of Contents
JPMorgan Insurance Trust Core Bond Portfolio
PORTFOLIO COMMENTARY
TWELVE MONTHS ENDED DECEMBER 31, 2011 (Unaudited)
| REPORTING PERIOD RETURN: | ||||
| Fund (Class 1 Shares)* | 7.46% | |||
| Barclays Capital U.S. Aggregate Index | 7.84% | |||
| Net Assets as of 12/31/2011 | $ | 226,939,335 | ||
| Duration as of 12/31/2011 | 4.36 years | |||
INVESTMENT OBJECTIVE**
The JPMorgan Insurance Trust Core Bond Portfolio (the “Portfolio”) seeks to maximize total return by investing primarily in a diversified portfolio of intermediate- and long-term debt securities.
HOW DID THE MARKET PERFORM?
Strong corporate earnings and robust merger-and-acquisition activity helped support investors’ appetite for risk during the beginning of the reporting period. However, uncertainty surrounding global economic growth began to dampen investors’ risk appetite in April 2011. This negative mood among investors worsened as they seemed to lack confidence in the ability of European governments to combat the region’s debt crisis, stoking fear about economic contagion. Concerns about the credit downgrade of U.S.-issued debt exacerbated this negative sentiment among investors.
For the twelve months ended December 31, 2011, interest rates declined across the U.S. Treasury yield curve (the yield curve shows the relationship between yields and maturity dates for a set of similar bonds at a given point in time). Prices for these securities were higher and yields declined. The mortgage-backed securities market was volatile during the reporting period, as investors were uncertain how intervention from the federal government would impact mortgage prepayments.
WHAT WERE THE MAIN DRIVERS OF THE PORTFOLIO’S PERFORMANCE?
The Portfolio (Class 1 Shares) underperformed the Barclays Capital U.S. Aggregate Index (the “Benchmark”) for the twelve months ended December 31, 2011.
The Portfolio was underweight U.S. Treasury securities versus the Benchmark during the reporting period. This underweight positioning detracted from relative performance as U.S. Treasury securities performed strongly during the reporting period, supported by investors’ risk aversion. The Portfolio’s shorter duration versus the Benchmark also detracted from relative performance as interest rates declined during the reporting period (duration is used to measure the price sensitivity of a bond or a portfolio of bonds to relative changes in interest rates).
The Portfolio’s allocation to mortgage-backed securities contributed to relative performance. The Portfolio’s investments in agency collateralized mortgage obligations (“CMOs”) outperformed comparable duration mortgage pass-through securities held in the Benchmark. In addition, the Portfolio’s investments in non-agency principal only CMOs and inverse interest only CMOs contributed to relative performance. The Portfolio’s allocation to non-agency floating rate CMOs detracted from relative performance.
HOW WAS THE PORTFOLIO POSITIONED?
The Portfolio’s primary strategy continued to be security selection and relative value, which seeks to exploit pricing discrepancies between individual securities or market sectors. The Portfolio managers used bottom-up fundamental research to construct, in their view, a portfolio of undervalued fixed income securities. The Portfolio was overweight the intermediate part of the yield curve (U.S. Treasury securities with 5 to 10 year maturities) as the Portfolio managers believed that these U.S. Treasuries had the most attractive risk/reward profile.
PORTFOLIO COMPOSITION*** | ||||
| Collateralized Mortgage Obligations | 42.2 | % | ||
| U.S. Treasury Obligations | 19.0 | |||
| Corporate Bonds | 15.7 | |||
| U.S. Government Agency Securities | 11.6 | |||
| Mortgage Pass-Through Securities | 5.3 | |||
| Commercial Mortgage-Backed Securities | 2.0 | |||
| Asset-Backed Securities | 1.4 | |||
| Others (each less than 1.0%) | 0.4 | |||
| Short-Term Investment | 2.4 | |||
| * | The return shown is based on net asset value calculated for shareholder transactions and may differ from the return shown in the financial highlights, which reflects adjustments made to the net asset value in accordance with accounting principles generally accepted in the United States of America. |
| ** | The advisor seeks to achieve the Portfolio’s objective. There can be no guarantee it will be achieved. |
| *** | Percentages indicated are based upon total investments as of December 31, 2011. The Portfolio’s composition is subject to change. |
| 2 | JPMORGAN INSURANCE TRUST | DECEMBER 31, 2011 | ||||
Table of Contents
AVERAGE ANNUAL TOTAL RETURNS AS OF DECEMBER 31, 2011 | ||||||||||||||||
| INCEPTION DATE OF CLASS | 1 YEAR | 5 YEAR | 10 YEAR | |||||||||||||
CLASS 1 SHARES | 5/1/97 | 7.46 | % | 6.75 | % | 5.81 | % | |||||||||
CLASS 2 SHARES | 8/16/06 | 7.21 | 6.49 | 5.67 | ||||||||||||
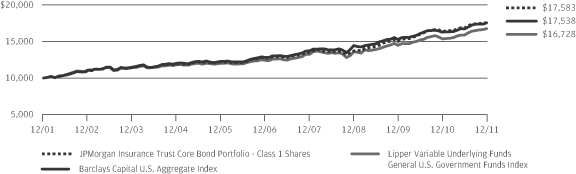
TEN YEAR PERFORMANCE (12/31/01 TO 12/31/11)
Source: Lipper, Inc. The performance quoted is past performance and is not a guarantee of future results. Mutual funds are subject to certain market risks. Investment returns and principal value of an investment will fluctuate so that an investor’s shares, when redeemed, may be worth more or less than their original cost. Current performance may be higher or lower than the performance data shown. For up-to-date month-end performance information please call 1-800-480-4111.
Returns for Class 2 Shares prior to their inception date are based on the performance of Class 1 Shares. The actual returns of Class 2 Shares would have been lower than shown because Class 2 Shares have higher expenses than Class 1 Shares.
The graph illustrates comparative performance for $10,000 invested in Class 1 Shares of the JPMorgan Insurance Trust Core Bond Portfolio, the Barclays Capital U.S. Aggregate Index and the Lipper Variable Underlying Funds General U.S. Government Funds Index from December 31, 2001 to December 31, 2011. The performance of the Portfolio assumes reinvestment of all dividends and capital gains, if any. The performance of the Barclays Capital U.S. Aggregate Index does not reflect the deduction of expenses associated with a mutual fund and has been adjusted to reflect reinvestment of all dividends and capital gains of the securities included in the benchmark. The performance of the Lipper Variable
Underlying Funds General U.S. Government Funds Index includes expenses associated with a mutual fund, such as investment management fees. These expenses are not identical to the expenses charged by the Portfolio. The Barclays Capital U.S. Aggregate Index is an unmanaged index that represents securities that are SEC-registered, taxable, and dollar denominated. The index covers the U.S. investment grade fixed rate bond market, with index components for government and corporate securities, mortgage pass-through securities, and asset-backed securities. The Lipper Variable Underlying Funds General U.S. Government Funds Index is an index based on the total returns of certain mutual funds within the Portfolio’s designated category as determined by Lipper, Inc. Investors cannot invest directly in an index.
The performance does not reflect any charges imposed by the Policies or Eligible Plans. If these charges were included, the returns would be lower than shown. Performance may reflect the waiver of the Portfolio’s fees and reimbursement of expenses for certain periods since the inception date. Without these waivers and reimbursements performance would have been lower. The returns shown are based on net asset values calculated for shareholder transactions and may differ from the returns shown in the financial highlights, which reflect adjustments made to the net asset values in accordance with accounting principles generally accepted in the United States of America.
| DECEMBER 31, 2011 | JPMORGAN INSURANCE TRUST | 3 | ||||||
Table of Contents
JPMorgan Insurance Trust Core Bond Portfolio
SCHEDULE OF PORTFOLIO INVESTMENTS
AS OF DECEMBER 31, 2011
| PRINCIPAL AMOUNT($) | SECURITY DESCRIPTION | VALUE($) | ||||||
| Asset-Backed Securities — 1.4% |
| ||||||
AH Mortgage Advance Trust, | ||||||||
| 178,286 | Series SART-1, Class A1, 2.630%, 05/10/42 (e) | 177,395 | ||||||
| 282,000 | Series SART-1, Class A2, 3.370%, 05/10/43 (e) | 280,872 | ||||||
AmeriCredit Automobile Receivables Trust, | ||||||||
| 14,081 | Series 2010-1, Class A3, 1.660%, 03/17/14 | 14,101 | ||||||
| 96,000 | Series 2011-3, Class A2, 0.840%, 11/10/14 | 95,855 | ||||||
Bank of America Auto Trust, | ||||||||
| 23,348 | Series 2009-1A, Class A3, 2.670%, 07/15/13 (e) | 23,400 | ||||||
| 100,000 | Series 2010-1A, Class A4, 2.180%, 02/15/17 (e) | 101,701 | ||||||
| 35,775 | Bear Stearns Asset-Backed Securities Trust, Series 2006-SD1, Class A, VAR, 0.664%, 04/25/36 | 26,913 | ||||||
| 43,934 | CarMax Auto Owner Trust, Series 2010-1, Class A3, 1.560%, 07/15/14 | 44,117 | ||||||
| 194,639 | Centex Home Equity, Series 2004-D, Class AF4, SUB, 4.680%, 06/25/32 | 184,440 | ||||||
| 450,000 | Citibank Credit Card Issuance Trust, Series 2002-C2, Class C2, 6.950%, 02/18/14 | 453,021 | ||||||
CNH Equipment Trust, | ||||||||
| 42,655 | Series 2010-A, Class A3, 1.540%, 07/15/14 | 42,767 | ||||||
| 87,000 | Series 2011-A, Class A3, 1.200%, 05/16/16 | 87,139 | ||||||
| 80,000 | Series 2011-A, Class A4, 2.040%, 10/17/16 | 81,779 | ||||||
Countrywide Asset-Backed Certificates, | ||||||||
| 1,056 | Series 2004-1, Class 3A, VAR, 0.854%, 04/25/34 | 822 | ||||||
| 120,000 | Series 2004-1, Class M1, VAR, 1.044%, 03/25/34 | 84,593 | ||||||
| 80,640 | Series 2004-1, Class M2, VAR, 1.119%, 03/25/34 | 69,103 | ||||||
| 19,668 | Countrywide Home Equity Loan Trust, Series 2004-K, Class 2A, VAR, 0.578%, 02/15/34 | 12,138 | ||||||
| 24,022 | Ford Credit Auto Owner Trust, Series 2009-B, Class A3, 2.790%, 08/15/13 | 24,141 | ||||||
| 136,029 | Fortress Opportunities Residential Transaction, Series 2011-1A, Class A1, VAR, 7.211%, 10/25/47 (e) | 136,029 | ||||||
| 100,000 | Honda Auto Receivables Owner Trust, Series 2009-2, Class A4, 4.430%, 07/15/15 | 101,899 | ||||||
| PRINCIPAL AMOUNT($) | SECURITY DESCRIPTION | VALUE($) | ||||||
| 116,687 | Lake Country Mortgage Loan Trust, Series 2006-HE1, Class A3, VAR, 0.644%, 07/25/34 (e) | 111,100 | ||||||
Long Beach Mortgage Loan Trust, | ||||||||
| 209,600 | Series 2003-4, Class M1, VAR, 1.314%, 08/25/33 | 153,359 | ||||||
| 190,000 | Series 2004-1, Class M1, VAR, 1.044%, 02/25/34 | 139,473 | ||||||
| 115,358 | Series 2004-1, Class M2, VAR, 1.119%, 02/25/34 | 101,755 | ||||||
| 30,297 | Series 2006-WL2, Class 2A3, VAR, 0.494%, 01/25/36 | 22,592 | ||||||
| 160,000 | MBNA Credit Card Master Note Trust, Series 2002-C1, Class C1, 6.800%, 07/15/14 | 161,091 | ||||||
| 125,000 | New Century Home Equity Loan Trust, Series 2005-1, Class M1, VAR, 0.744%, 03/25/35 | 85,075 | ||||||
| 10,628 | Residential Asset Securities Corp., Series 2003-KS9, Class A2B, VAR, 0.934%, 11/25/33 | 4,725 | ||||||
| 216,449 | Residential Credit Solutions Trust, Series 2011-1, Class A1, 6.000%, 03/25/41 (e) (f) (i) | 216,362 | ||||||
| 37,524 | Santander Drive Auto Receivables Trust, Series 2011-S2A, Class B, 2.060%, 06/15/17 (e) | 37,426 | ||||||
| 90,000 | World Omni Auto Receivables Trust, Series 2010-A, Class A4, 2.210%, 05/15/15 | 91,254 | ||||||
|
| |||||||
Total Asset-Backed Securities | 3,166,437 | |||||||
|
| |||||||
| Collateralized Mortgage Obligations — 42.6% |
| ||||||
Agency CMO — 32.2% |
| |||||||
| 229,059 | Federal Home Loan Mortgage Corp. - Government National Mortgage Association, Series 8, Class ZA, 7.000%, 03/25/23 | 256,894 | ||||||
Federal Home Loan Mortgage Corp. REMICS, | ||||||||
| 1,230 | Series 1065, Class J, 9.000%, 04/15/21 | 1,498 | ||||||
| 6,207 | Series 11, Class D, 9.500%, 07/15/19 | 6,643 | ||||||
| 135,356 | Series 1113, Class J, 8.500%, 06/15/21 | 149,842 | ||||||
| 7,910 | Series 1250, Class J, 7.000%, 05/15/22 | 9,483 | ||||||
| 14,021 | Series 1316, Class Z, 8.000%, 06/15/22 | 15,997 | ||||||
| 24,509 | Series 1324, Class Z, 7.000%, 07/15/22 | 27,654 | ||||||
| 107,556 | Series 1343, Class LA, 8.000%, 08/15/22 | 129,512 | ||||||
| 22,140 | Series 1343, Class LB, 7.500%, 08/15/22 | 26,684 | ||||||
| 15,308 | Series 1394, Class ID, IF, 9.566%, 10/15/22 | 17,159 | ||||||
| 14,562 | Series 1395, Class G, 6.000%, 10/15/22 | 16,246 | ||||||
| 10,755 | Series 1505, Class Q, 7.000%, 05/15/23 | 12,268 | ||||||
SEE NOTES TO FINANCIAL STATEMENTS.
| 4 | JPMORGAN INSURANCE TRUST | DECEMBER 31, 2011 | ||||
Table of Contents
| PRINCIPAL AMOUNT($) | SECURITY DESCRIPTION | VALUE($) | ||||||
| Collateralized Mortgage Obligations — Continued |
| ||||||
Agency CMO — Continued |
| |||||||
| 20,616 | Series 1518, Class G, IF, 8.895%, 05/15/23 | 24,048 | ||||||
| 20,143 | Series 1541, Class O, VAR, 1.340%, 07/15/23 | 20,288 | ||||||
| 399,959 | Series 1577, Class PV, 6.500%, 09/15/23 | 422,316 | ||||||
| 400,221 | Series 1584, Class L, 6.500%, 09/15/23 | 451,657 | ||||||
| 8,619 | Series 1596, Class D, 6.500%, 10/15/13 | 8,928 | ||||||
| 4,320 | Series 1607, Class SA, HB, IF , 20.332%, 10/15/13 | 4,725 | ||||||
| 13,364 | Series 1609, Class LG, IF, 16.656%, 11/15/23 | 15,986 | ||||||
| 412,011 | Series 1633, Class Z, 6.500%, 12/15/23 | 440,798 | ||||||
| 457,665 | Series 1638, Class H, 6.500%, 12/15/23 | 528,746 | ||||||
| 2,387 | Series 1671, Class QC, IF, 10.000%, 02/15/24 | 2,925 | ||||||
| 86,003 | Series 1694, Class PK, 6.500%, 03/15/24 | 91,982 | ||||||
| 14,277 | Series 1700, Class GA, PO, 02/15/24 | 12,968 | ||||||
| 53,601 | Series 1798, Class F, 5.000%, 05/15/23 | 58,490 | ||||||
| 110,091 | Series 1863, Class Z, 6.500%, 07/15/26 | 124,516 | ||||||
| 4,026 | Series 1865, Class D, PO, 02/15/24 | 3,230 | ||||||
| 37,442 | Series 1981, Class Z, 6.000%, 05/15/27 | 40,805 | ||||||
| 43,632 | Series 1987, Class PE, 7.500%, 09/15/27 | 50,566 | ||||||
| 186,052 | Series 1999, Class PU, 7.000%, 10/15/27 | 214,360 | ||||||
| 4,000 | Series 2025, Class PE, 6.300%, 01/15/13 | 3,999 | ||||||
| 278,363 | Series 2031, Class PG, 7.000%, 02/15/28 (m) | 321,916 | ||||||
| 11,734 | Series 2033, Class SN, HB, IF , 25.961%, 03/15/24 | 7,317 | ||||||
| 268,215 | Series 2035, Class PC, 6.950%, 03/15/28 | 309,334 | ||||||
| 19,365 | Series 2038, Class PN, IO, 7.000%, 03/15/28 | 3,146 | ||||||
| 61,184 | Series 2054, Class PV, 7.500%, 05/15/28 | 70,814 | ||||||
| 9,273 | Series 2055, Class OE, 6.500%, 05/15/13 | 9,270 | ||||||
| 305,477 | Series 2057, Class PE, 6.750%, 05/15/28 | 348,858 | ||||||
| 91,778 | Series 2064, Class TE, 7.000%, 06/15/28 | 106,114 | ||||||
| 67,961 | Series 2075, Class PH, 6.500%, 08/15/28 | 77,796 | ||||||
| 256,760 | Series 2095, Class PE, 6.000%, 11/15/28 | 288,609 | ||||||
| 19,064 | Series 2102, Class TU, 6.000%, 12/15/13 | 19,746 | ||||||
| 41,348 | Series 2115, Class PE, 6.000%, 01/15/14 | 42,036 | ||||||
| 14,246 | Series 2132, Class SB, HB, IF , 29.379%, 03/15/29 | 23,360 | ||||||
| 26,502 | Series 2134, Class PI, IO, 6.500%, 03/15/19 | 3,634 | ||||||
| 2,605 | Series 2135, Class UK, IO, 6.500%, 03/15/14 | 133 | ||||||
| 102,826 | Series 2178, Class PB, 7.000%, 08/15/29 | 117,842 | ||||||
| 147,062 | Series 2182, Class ZB, 8.000%, 09/15/29 | 170,272 | ||||||
| PRINCIPAL AMOUNT($) | SECURITY DESCRIPTION | VALUE($) | ||||||
Agency CMO — Continued |
| |||||||
| 5,831 | Series 22, Class C, 9.500%, 04/15/20 | 6,359 | ||||||
| 26,585 | Series 2247, Class Z, 7.500%, 08/15/30 | 30,936 | ||||||
| 311,876 | Series 2259, Class ZC, 7.350%, 10/15/30 | 362,112 | ||||||
| 6,169 | Series 2261, Class ZY, 7.500%, 10/15/30 | 7,185 | ||||||
| 117,611 | Series 2283, Class K, 6.500%, 12/15/23 | 125,527 | ||||||
| 13,474 | Series 2306, Class K, PO, 05/15/24 | 12,538 | ||||||
| 32,336 | Series 2306, Class SE, IF, IO, 8.580%, 05/15/24 | 6,991 | ||||||
| 43,176 | Series 2325, Class PM, 7.000%, 06/15/31 | 47,014 | ||||||
| 233,011 | Series 2344, Class ZD, 6.500%, 08/15/31 | 255,268 | ||||||
| 41,172 | Series 2344, Class ZJ, 6.500%, 08/15/31 | 45,170 | ||||||
| 21,580 | Series 2345, Class NE, 6.500%, 08/15/31 | 22,543 | ||||||
| 164,749 | Series 2345, Class PQ, 6.500%, 08/15/16 | 171,769 | ||||||
| 58,413 | Series 2355, Class BP, 6.000%, 09/15/16 | 61,985 | ||||||
| 165,746 | Series 2359, Class ZB, 8.500%, 06/15/31 | 194,538 | ||||||
| 319,770 | Series 2367, Class ME, 6.500%, 10/15/31 | 348,061 | ||||||
| 38,628 | Series 2390, Class DO, PO, 12/15/31 | 37,244 | ||||||
| 90,270 | Series 2391, Class QR, 5.500%, 12/15/16 | 96,288 | ||||||
| 81,467 | Series 2394, Class MC, 6.000%, 12/15/16 | 87,031 | ||||||
| 52,287 | Series 2410, Class OE, 6.375%, 02/15/32 | 56,927 | ||||||
| 64,557 | Series 2410, Class QS, IF, 18.776%, 02/15/32 | 81,117 | ||||||
| 52,081 | Series 2410, Class QX, IF, IO, 8.372%, 02/15/32 | 13,092 | ||||||
| 57,443 | Series 2412, Class SP, IF, 15.543%, 02/15/32 | 73,774 | ||||||
| 108,063 | Series 2423, Class MC, 7.000%, 03/15/32 | 125,574 | ||||||
| 182,460 | Series 2423, Class MT, 7.000%, 03/15/32 | 202,088 | ||||||
| 227,841 | Series 2435, Class CJ, 6.500%, 04/15/32 | 263,986 | ||||||
| 76,756 | Series 2444, Class ES, IF, IO, 7.672%, 03/15/32 | 15,856 | ||||||
| 51,171 | Series 2450, Class SW, IF, IO, 7.722%, 03/15/32 | 10,641 | ||||||
| 186,067 | Series 2455, Class GK, 6.500%, 05/15/32 | 211,984 | ||||||
| 120,976 | Series 2484, Class LZ, 6.500%, 07/15/32 | 139,765 | ||||||
| 642,964 | Series 2500, Class MC, 6.000%, 09/15/32 | 702,681 | ||||||
| 42,348 | Series 2503, Class BH, 5.500%, 09/15/17 | 45,533 | ||||||
| 64,354 | Series 2515, Class DE, 4.000%, 03/15/32 | 65,905 | ||||||
| 376,863 | Series 2527, Class BP, 5.000%, 11/15/17 | 403,019 | ||||||
| 196,364 | Series 2535, Class BK, 5.500%, 12/15/22 | 215,056 | ||||||
| 5,300,000 | Series 2543, Class YX, 6.000%, 12/15/32 (m) | 5,964,226 | ||||||
| 427,536 | Series 2544, Class HC, 6.000%, 12/15/32 | 474,751 | ||||||
| 500,000 | Series 2575, Class ME, 6.000%, 02/15/33 | 568,203 | ||||||
| 3,032,652 | Series 2578, Class PG, 5.000%, 02/15/18 | 3,243,674 | ||||||
SEE NOTES TO FINANCIAL STATEMENTS.
| DECEMBER 31, 2011 | JPMORGAN INSURANCE TRUST | 5 | ||||||
Table of Contents
JPMorgan Insurance Trust Core Bond Portfolio
SCHEDULE OF PORTFOLIO INVESTMENTS
AS OF DECEMBER 31, 2011 (continued)
| PRINCIPAL AMOUNT($) | SECURITY DESCRIPTION | VALUE($) | ||||||
| Collateralized Mortgage Obligations — Continued |
| ||||||
Agency CMO — Continued |
| |||||||
| 53,867 | Series 2586, Class WI, IO, 6.500%, 03/15/33 | 9,760 | ||||||
| 48,146 | Series 2594, Class VQ, 6.000%, 08/15/20 | 48,400 | ||||||
| 11,936 | Series 2597, Class DS, IF, IO, 7.272%, 02/15/33 | 555 | ||||||
| 14,190 | Series 2599, Class DS, IF, IO, 6.722%, 02/15/33 | 549 | ||||||
| 42,671 | Series 2610, Class DS, IF, IO, 6.822%, 03/15/33 | 1,025 | ||||||
| 18,052 | Series 2611, Class SH, IF, IO, 7.372%, 10/15/21 | 110 | ||||||
| 277,280 | Series 2626, Class NS, IF, IO, 6.272%, 06/15/23 | 21,229 | ||||||
| 177,821 | Series 2638, Class DS, IF, 8.322%, 07/15/23 | 195,142 | ||||||
| 242,660 | Series 2647, Class A, 3.250%, 04/15/32 | 250,292 | ||||||
| 1,564,196 | Series 2651, Class VZ, 4.500%, 07/15/18 | 1,661,958 | ||||||
| 2,438,000 | Series 2656, Class BG, 5.000%, 10/15/32 | 2,644,852 | ||||||
| 410,000 | Series 2682, Class LC, 4.500%, 07/15/32 | 436,840 | ||||||
| 94,173 | Series 2682, Class YS, IF, 8.595%, 10/15/33 | 96,179 | ||||||
| 13,638 | Series 2684, Class TO, PO, 10/15/33 | 13,603 | ||||||
| 45,811 | Series 2691, Class WS, IF, 8.583%, 10/15/33 | 46,912 | ||||||
| 46,198 | Series 2705, Class SC, IF, 8.583%, 11/15/33 | 47,380 | ||||||
| 70,521 | Series 2705, Class SD, IF, 8.642%, 11/15/33 | 72,351 | ||||||
| 462,033 | Series 2727, Class BS, IF, 8.658%, 01/15/34 | 473,141 | ||||||
| 417,108 | Series 2749, Class TD, 5.000%, 06/15/21 | 422,239 | ||||||
| 68,196 | Series 2755, Class SA, IF, 13.643%, 05/15/30 | 73,838 | ||||||
| 66,191 | Series 2780, Class JG, 4.500%, 04/15/19 | 68,674 | ||||||
| 625,000 | Series 2827, Class DG, 4.500%, 07/15/19 | 686,473 | ||||||
| 44,435 | Series 2989, Class PO, PO, 06/15/23 | 43,838 | ||||||
| 300,000 | Series 3047, Class OD, 5.500%, 10/15/35 | 363,204 | ||||||
| 420,753 | Series 3085, Class VS, HB, IF , 27.607%, 12/15/35 | 626,840 | ||||||
| 120,597 | Series 3117, Class EO, PO, 02/15/36 | 115,333 | ||||||
| 130,789 | Series 3260, Class CS, IF, IO, 5.862%, 01/15/37 | 17,592 | ||||||
| 571,035 | Series 3385, Class SN, IF, IO, 5.722%, 11/15/37 | 64,692 | ||||||
| 376,734 | Series 3387, Class SA, IF, IO, 6.142%, 11/15/37 | 60,935 | ||||||
| 596,932 | Series 3430, Class AI, IO, 1.417%, 09/15/12 | 4,036 | ||||||
| PRINCIPAL AMOUNT($) | SECURITY DESCRIPTION | VALUE($) | ||||||
Agency CMO — Continued |
| |||||||
| 551,027 | Series 3451, Class SA, IF, IO, 5.772%, 05/15/38 | 68,588 | ||||||
| 842,417 | Series 3455, Class SE, IF, IO, 5.922%, 06/15/38 | 127,748 | ||||||
| 781,461 | Series 3688, Class NI, IO, 5.000%, 04/15/32 | 98,019 | ||||||
| 280,959 | Series 3759, Class HI, IO, 4.000%, 08/15/37 | 36,004 | ||||||
| 622,178 | Series 3772, Class IO, IO, 3.500%, 09/15/24 | 35,935 | ||||||
| 1,061 | Series 47, Class F, 10.000%, 06/15/20 | 1,222 | ||||||
| 931 | Series 99, Class Z, 9.500%, 01/15/21 | 1,036 | ||||||
Federal Home Loan Mortgage Corp. STRIPS, | ||||||||
| 387,262 | Series 233, Class 11, IO, 5.000%, 09/15/35 | 59,791 | ||||||
| 669,957 | Series 239, Class S30, IF, IO, 7.422%, 08/15/36 | 107,766 | ||||||
Federal Home Loan Mortgage Corp. Structured Pass-Through Securities, | ||||||||
| 21,618 | Series T-41, Class 3A, VAR, 6.925%, 07/25/32 | 24,048 | ||||||
| 140,770 | Series T-54, Class 2A, 6.500%, 02/25/43 | 156,699 | ||||||
| 64,625 | Series T-54, Class 3A, 7.000%, 02/25/43 | 75,209 | ||||||
| 254,194 | Series T-56, Class APO, PO, 05/25/43 | 199,630 | ||||||
| 38,346 | Series T-58, Class APO, PO, 09/25/43 | 31,776 | ||||||
Federal National Mortgage Association REMICS, | ||||||||
| 11,619 | Series 1988-16, Class B, 9.500%, 06/25/18 | 13,037 | ||||||
| 5,733 | Series 1989-83, Class H, 8.500%, 11/25/19 | 6,486 | ||||||
| 1,374 | Series 1990-1, Class D, 8.800%, 01/25/20 | 1,561 | ||||||
| 7,813 | Series 1990-10, Class L, 8.500%, 02/25/20 | 8,848 | ||||||
| 1,036 | Series 1990-93, Class G, 5.500%, 08/25/20 | 1,138 | ||||||
| 28 | Series 1990-140, Class K, HB, 652.145%, 12/25/20 | 471 | ||||||
| 2,174 | Series 1990-143, Class J, 8.750%, 12/25/20 | 2,592 | ||||||
| 24,301 | Series 1992-101, Class J, 7.500%, 06/25/22 | 25,724 | ||||||
| 17,221 | Series 1992-143, Class MA, 5.500%, 09/25/22 | 18,867 | ||||||
| 52,519 | Series 1993-146, Class E, PO, 05/25/23 | 49,647 | ||||||
| 131,844 | Series 1993-155, Class PJ, 7.000%, 09/25/23 | 150,441 | ||||||
| 3,981 | Series 1993-165, Class SD, IF, 12.272%, 09/25/23 | 4,800 | ||||||
SEE NOTES TO FINANCIAL STATEMENTS.
| 6 | JPMORGAN INSURANCE TRUST | DECEMBER 31, 2011 | ||||
Table of Contents
| PRINCIPAL AMOUNT($) | SECURITY DESCRIPTION | VALUE($) | ||||||
| Collateralized Mortgage Obligations — Continued |
| ||||||
Agency CMO — Continued |
| |||||||
| 19,850 | Series 1993-165, Class SK, IF, 12.500%, 09/25/23 | 23,594 | ||||||
| 3,150 | Series 1993-167, Class GA, 7.000%, 09/25/23 | 3,164 | ||||||
| 176,713 | Series 1993-203, Class PL, 6.500%, 10/25/23 | 198,523 | ||||||
| 17,071 | Series 1993-205, Class H, PO, 09/25/23 | 15,394 | ||||||
| 1,090,758 | Series 1993-223, Class PZ, 6.500%, 12/25/23 | 1,224,215 | ||||||
| 164,473 | Series 1993-225, Class UB, 6.500%, 12/25/23 | 180,529 | ||||||
| 4,664 | Series 1993-230, Class FA, VAR, 0.913%, 12/25/23 | 4,698 | ||||||
| 324,534 | Series 1993-250, Class Z, 7.000%, 12/25/23 | 340,739 | ||||||
| 20,531 | Series 1993-257, Class C, PO, 06/25/23 | 20,322 | ||||||
| 421,997 | Series 1994-37, Class L, 6.500%, 03/25/24 | 488,135 | ||||||
| 3,728,017 | Series 1994-72, Class K, 6.000%, 04/25/24 | 4,146,804 | ||||||
| 32,298 | Series 1995-2, Class Z, 8.500%, 01/25/25 | 37,117 | ||||||
| 83,206 | Series 1995-19, Class Z, 6.500%, 11/25/23 | 99,336 | ||||||
| 8,093 | Series 1996-59, Class J, 6.500%, 08/25/22 | 8,917 | ||||||
| 19,042 | Series 1996-59, Class K, 6.500%, 07/25/23 | 19,342 | ||||||
| 250,407 | Series 1997-20, Class IB, IO, VAR, 1.840%, 03/25/27 | 8,731 | ||||||
| 27,067 | Series 1997-39, Class PD, 7.500%, 05/20/27 | 31,079 | ||||||
| 59,026 | Series 1997-46, Class PL, 6.000%, 07/18/27 | 65,266 | ||||||
| 147,957 | Series 1997-61, Class ZC, 7.000%, 02/25/23 | 166,009 | ||||||
| 45,601 | Series 1998-36, Class ZB, 6.000%, 07/18/28 | 51,181 | ||||||
| 61,568 | Series 1998-43, Class SA, IF, IO, 18.963%, 04/25/23 | 29,517 | ||||||
| 86,037 | Series 1998-46, Class GZ, 6.500%, 08/18/28 | 98,123 | ||||||
| 178,724 | Series 1998-58, Class PC, 6.500%, 10/25/28 | 198,354 | ||||||
| 377,412 | Series 1999-39, Class JH, IO, 6.500%, 08/25/29 | 72,200 | ||||||
| 10,372 | Series 2000-52, Class IO, IO, 8.500%, 01/25/31 | 2,037 | ||||||
| 135,484 | Series 2001-4, Class PC, 7.000%, 03/25/21 | 147,183 | ||||||
| 122,579 | Series 2001-30, Class PM, 7.000%, 07/25/31 | 142,422 | ||||||
| PRINCIPAL AMOUNT($) | SECURITY DESCRIPTION | VALUE($) | ||||||
Agency CMO — Continued |
| |||||||
| 565,055 | Series 2001-33, Class ID, IO, 6.000%, 07/25/31 | 98,033 | ||||||
| 181,120 | Series 2001-36, Class DE, 7.000%, 08/25/31 | 210,627 | ||||||
| 24,942 | Series 2001-44, Class PD, 7.000%, 09/25/31 | 28,988 | ||||||
| 71,270 | Series 2001-52, Class XN, 6.500%, 11/25/15 | 76,188 | ||||||
| 322,639 | Series 2001-61, Class Z, 7.000%, 11/25/31 | 375,133 | ||||||
| 98,881 | Series 2001-69, Class PG, 6.000%, 12/25/16 | 105,427 | ||||||
| 72,040 | Series 2001-71, Class QE, 6.000%, 12/25/16 | 76,822 | ||||||
| 3,000 | Series 2001-80, Class PE, 6.000%, 07/25/29 | 3,003 | ||||||
| 51,773 | Series 2002-1, Class HC, 6.500%, 02/25/22 | 55,223 | ||||||
| 14,983 | Series 2002-1, Class SA, HB, IF , 24.233%, 02/25/32 | 23,320 | ||||||
| 109,921 | Series 2002-2, Class UC, 6.000%, 02/25/17 | 117,584 | ||||||
| 118,566 | Series 2002-3, Class OG, 6.000%, 02/25/17 | 126,420 | ||||||
| 348,390 | Series 2002-13, Class SJ, IF, IO, 1.600%, 03/25/32 | 19,589 | ||||||
| 314,201 | Series 2002-15, Class PO, PO, 04/25/32 | 301,768 | ||||||
| 156,374 | Series 2002-28, Class PK, 6.500%, 05/25/32 | 178,998 | ||||||
| 618,990 | Series 2002-62, Class ZE, 5.500%, 11/25/17 | 665,157 | ||||||
| 374,858 | Series 2002-68, Class SH, IF, IO, 7.715%, 10/18/32 | 68,130 | ||||||
| 45,932 | Series 2002-77, Class S, IF, 13.945%, 12/25/32 | 53,003 | ||||||
| 5,032 | Series 2002-91, Class UH, IO, 5.500%, 06/25/22 | 168 | ||||||
| 447,783 | Series 2002-94, Class BK, 5.500%, 01/25/18 | 479,813 | ||||||
| 330,769 | Series 2003-7, Class A1, 6.500%, 12/25/42 | 384,872 | ||||||
| 293,000 | Series 2003-22, Class UD, 4.000%, 04/25/33 | 309,235 | ||||||
| 13,921 | Series 2003-35, Class MD, 5.000%, 11/25/16 | 13,915 | ||||||
| 135,767 | Series 2003-44, Class IU, IO, 7.000%, 06/25/33 | 23,500 | ||||||
| 100,000 | Series 2003-47, Class PE, 5.750%, 06/25/33 | 115,177 | ||||||
| 38,523 | Series 2003-64, Class SX, IF, 13.074%, 07/25/33 | 41,585 | ||||||
SEE NOTES TO FINANCIAL STATEMENTS.
| DECEMBER 31, 2011 | JPMORGAN INSURANCE TRUST | 7 | ||||||
Table of Contents
JPMorgan Insurance Trust Core Bond Portfolio
SCHEDULE OF PORTFOLIO INVESTMENTS
AS OF DECEMBER 31, 2011 (continued)
| PRINCIPAL AMOUNT($) | SECURITY DESCRIPTION | VALUE($) | ||||||
| Collateralized Mortgage Obligations — Continued |
| ||||||
Agency CMO — Continued |
| |||||||
| 74,020 | Series 2003-66, Class PA, 3.500%, 02/25/33 | 77,262 | ||||||
| 647,059 | Series 2003-68, Class LC, 3.000%, 07/25/22 | 658,132 | ||||||
| 102,315 | Series 2003-68, Class QP, 3.000%, 07/25/22 | 103,705 | ||||||
| 112,903 | Series 2003-71, Class DS, IF, 7.106%, 08/25/33 | 115,129 | ||||||
| 301,579 | Series 2003-71, Class IM, IO, 5.500%, 12/25/31 | 22,793 | ||||||
| 243,988 | Series 2003-80, Class SY, IF, IO, 7.356%, 06/25/23 | 27,831 | ||||||
| 3,600,000 | Series 2003-81, Class MC, 5.000%, 12/25/32 | 3,876,208 | ||||||
| 566,098 | Series 2003-82, Class VB, 5.500%, 08/25/33 | 617,394 | ||||||
| 56,105 | Series 2003-91, Class SD, IF, 12.011%, 09/25/33 | 60,244 | ||||||
| 24,060 | Series 2003-106, Class US, IF, 8.635%, 11/25/23 | 24,224 | ||||||
| 385,925 | Series 2003-116, Class SB, IF, IO, 7.306%, 11/25/33 | 75,531 | ||||||
| 2,901,667 | Series 2003-128, Class DY, 4.500%, 01/25/24 | 3,143,670 | ||||||
| 50,996 | Series 2003-130, Class SX, IF, 11.080%, 01/25/34 | 55,942 | ||||||
| 75,950 | Series 2003-132, Class OA, PO, 08/25/33 | 69,635 | ||||||
| 1,850,000 | Series 2004-2, Class OE, 5.000%, 05/25/23 | 1,995,263 | ||||||
| 175,568 | Series 2004-4, Class QM, IF, 13.613%, 06/25/33 | 205,960 | ||||||
| 106,297 | Series 2004-10, Class SC, HB, IF , 27.426%, 02/25/34 | 157,270 | ||||||
| 49,502 | Series 2004-14, Class SD, IF, 8.635%, 03/25/34 | 50,762 | ||||||
| 87,592 | Series 2004-21, Class CO, PO, 04/25/34 | 80,554 | ||||||
| 64,918 | Series 2004-22, Class A, 4.000%, 04/25/19 | 66,015 | ||||||
| 231,155 | Series 2004-36, Class SA, IF, 18.718%, 05/25/34 | 298,329 | ||||||
| 171,352 | Series 2004-46, Class SK, IF, 15.693%, 05/25/34 | 202,632 | ||||||
| 32,801 | Series 2004-51, Class SY, IF, 13.653%, 07/25/34 | 40,423 | ||||||
| 131,705 | Series 2004-61, Class SK, IF, 8.500%, 11/25/32 | 146,741 | ||||||
| 1,085,786 | Series 2004-75, Class VK, 4.500%, 09/25/22 | 1,155,567 | ||||||
| PRINCIPAL AMOUNT($) | SECURITY DESCRIPTION | VALUE($) | ||||||
Agency CMO — Continued |
| |||||||
| 195,382 | Series 2004-76, Class CL, 4.000%, 10/25/19 | 206,166 | ||||||
| 10,949 | Series 2004-92, Class JO, PO, 12/25/34 | 10,883 | ||||||
| 339,346 | Series 2005-45, Class DC, HB, IF , 23.233%, 06/25/35 | 494,957 | ||||||
| 118,682 | Series 2005-52, Class PA, 6.500%, 06/25/35 | 129,074 | ||||||
| 853,000 | Series 2005-68, Class BC, 5.250%, 06/25/35 | 941,006 | ||||||
| 457,678 | Series 2005-84, Class XM, 5.750%, 10/25/35 | 513,594 | ||||||
| 700,000 | Series 2005-110, Class MN, 5.500%, 06/25/35 | 788,194 | ||||||
| 127,094 | Series 2006-22, Class AO, PO, 04/25/36 | 120,770 | ||||||
| 87,004 | Series 2006-46, Class SW, HB, IF , 23.123%, 06/25/36 | 121,175 | ||||||
| 239,197 | Series 2006-59, Class QO, PO, 01/25/33 | 216,837 | ||||||
| 281,754 | Series 2006-110, Class PO, PO, 11/25/36 | 258,264 | ||||||
| 549,919 | Series 2006-117, Class GS, IF, IO, 6.356%, 12/25/36 | 97,753 | ||||||
| 282,055 | Series 2007-7, Class SG, IF, IO, 6.206%, 08/25/36 | 43,026 | ||||||
| 839,647 | Series 2007-53, Class SH, IF, IO, 5.806%, 06/25/37 | 112,912 | ||||||
| 409,770 | Series 2007-88, Class VI, IF, IO, 6.246%, 09/25/37 | 63,495 | ||||||
| 601,332 | Series 2007-100, Class SM, IF, IO, 6.156%, 10/25/37 | 89,408 | ||||||
| 620,403 | Series 2008-1, Class BI, IF, IO, 5.616%, 02/25/38 | 75,824 | ||||||
| 230,438 | Series 2008-16, Class IS, IF, IO, 5.906%, 03/25/38 | 32,165 | ||||||
| 253,188 | Series 2008-46, Class HI, IO, VAR, 6.571%, 06/25/38 | 16,700 | ||||||
| 222,997 | Series 2008-53, Class CI, IF, IO, 6.906%, 07/25/38 | 32,143 | ||||||
| 622,960 | Series 2009-112, Class ST, IF, IO, 5.956%, 01/25/40 | 78,512 | ||||||
| 333,814 | Series 2010-35, Class SB, IF, IO, 6.126%, 04/25/40 | 48,663 | ||||||
| 3,622 | Series G92-42, Class Z, 7.000%, 07/25/22 | 4,044 | ||||||
| 83,699 | Series G92-44, Class ZQ, 8.000%, 07/25/22 | 95,117 | ||||||
| 42,604 | Series G92-54, Class ZQ, 7.500%, 09/25/22 | 47,636 | ||||||
| 2,642 | Series G92-59, Class F, VAR, 1.918%, 10/25/22 | 2,697 | ||||||
| 7,090 | Series G92-61, Class Z, 7.000%, 10/25/22 | 8,405 | ||||||
| 16,084 | Series G92-66, Class KA, 6.000%, 12/25/22 | 17,549 | ||||||
SEE NOTES TO FINANCIAL STATEMENTS.
| 8 | JPMORGAN INSURANCE TRUST | DECEMBER 31, 2011 | ||||
Table of Contents
| PRINCIPAL AMOUNT($) | SECURITY DESCRIPTION | VALUE($) | ||||||
| Collateralized Mortgage Obligations — Continued |
| ||||||
Agency CMO — Continued |
| |||||||
| 76,073 | Series G92-66, Class KB, 7.000%, 12/25/22 | 85,289 | ||||||
| 20,912 | Series G93-1, Class KA, 7.900%, 01/25/23 | 23,704 | ||||||
| 22,417 | Series G93-17, Class SI, IF, 6.000%, 04/25/23 | 23,496 | ||||||
Federal National Mortgage Association STRIPS, | ||||||||
| 38,382 | Series 329, Class 1, PO, 01/01/33 | 36,727 | ||||||
| 178,821 | Series 365, Class 8, IO, 5.500%, 05/01/36 | 25,797 | ||||||
Federal National Mortgage Association Whole Loan, | ||||||||
| 80,631 | Series 1999-W1, Class PO, PO, 02/25/29 | 68,537 | ||||||
| 376,990 | Series 1999-W4, Class A9, 6.250%, 02/25/29 | 423,827 | ||||||
| 620,007 | Series 2002-W7, Class A4, 6.000%, 06/25/29 | 695,086 | ||||||
| 494,696 | Series 2003-W1, Class 1A1, VAR, 6.292%, 12/25/42 | 566,480 | ||||||
| 64,330 | Series 2003-W1, Class 2A, VAR, 7.122%, 12/25/42 | 74,824 | ||||||
| 79,289 | Series 2004-W2, Class 2A2, 7.000%, 02/25/44 | 90,509 | ||||||
Government National Mortgage Association, | ||||||||
| 65,307 | Series 1994-3, Class PQ, 7.488%, 07/16/24 | 79,356 | ||||||
| 271,525 | Series 1994-7, Class PQ, 6.500%, 10/16/24 | 319,203 | ||||||
| 67,816 | Series 1996-16, Class E, 7.500%, 08/16/26 | 77,428 | ||||||
| 65,151 | Series 1997-8, Class PN, 7.500%, 05/16/27 | 73,814 | ||||||
| 153,496 | Series 1998-22, Class PD, 6.500%, 09/20/28 | 166,590 | ||||||
| 74,560 | Series 1998-26, Class K, 7.500%, 09/17/25 | 85,226 | ||||||
| 48,856 | Series 1999-17, Class L, 6.000%, 05/20/29 | 53,099 | ||||||
| 59,559 | Series 1999-41, Class Z, 8.000%, 11/16/29 | 68,957 | ||||||
| 41,011 | Series 1999-44, Class PC, 7.500%, 12/20/29 | 47,150 | ||||||
| 50,055 | Series 1999-44, Class ZG, 8.000%, 12/20/29 | 57,959 | ||||||
| 34,408 | Series 2000-6, Class Z, 7.500%, 02/20/30 | 40,277 | ||||||
| 56,582 | Series 2000-14, Class PD, 7.000%, 02/16/30 | 66,817 | ||||||
| 230,130 | Series 2000-21, Class Z, 9.000%, 03/16/30 | 294,643 | ||||||
| 26,070 | Series 2000-26, Class Z, 7.750%, 09/20/30 | 30,088 | ||||||
| 4,164 | Series 2000-36, Class IK, IO, 9.000%, 11/16/30 | 1,811 | ||||||
| 726,426 | Series 2000-36, Class PB, 7.500%, 11/16/30 | 835,807 | ||||||
| PRINCIPAL AMOUNT($) | SECURITY DESCRIPTION | VALUE($) | ||||||
Agency CMO — Continued |
| |||||||
| 50,485 | Series 2000-37, Class B, 8.000%, 12/20/30 | 58,487 | ||||||
| 38,879 | Series 2001-4, Class SJ, IF, IO, 7.865%, 01/19/30 | 10,072 | ||||||
| 1,826,643 | Series 2001-10, Class PE, 6.500%, 03/16/31 (m) | 2,057,595 | ||||||
| 270,103 | Series 2001-22, Class PS, HB, IF , 20.268%, 03/17/31 | 384,746 | ||||||
| 96,917 | Series 2001-36, Class S, IF, IO, 7.767%, 08/16/31 | 23,526 | ||||||
| 214,447 | Series 2001-53, Class SR, IF, IO, 7.865%, 10/20/31 | 24,254 | ||||||
| 133,676 | Series 2001-64, Class MQ, 6.500%, 12/20/31 | 142,337 | ||||||
| 1,000,000 | Series 2001-64, Class PB, 6.500%, 12/20/31 | 1,093,695 | ||||||
| 17,515 | Series 2002-24, Class SB, IF, 11.501%, 04/16/32 | 20,548 | ||||||
| 80,777 | Series 2002-54, Class GB, 6.500%, 08/20/32 | 91,637 | ||||||
| 46,103 | Series 2003-4, Class NI, IO, 5.500%, 01/20/32 | 1,944 | ||||||
| 10,402 | Series 2003-24, Class PO, PO, 03/16/33 | 8,816 | ||||||
| 2,185,584 | Series 2003-59, Class XA, IO, VAR, 1.494%, 06/16/34 | 77,702 | ||||||
| 226,695 | Series 2003-75, Class BE, 6.000%, 04/16/28 | 226,741 | ||||||
| 135,403 | Series 2003-76, Class LS, IF, IO, 6.915%, 09/20/31 | 9,639 | ||||||
| 565,002 | Series 2004-11, Class SW, IF, IO, 5.215%, 02/20/34 | 73,215 | ||||||
| 51,493 | Series 2004-28, Class S, IF, 18.885%, 04/16/34 | 69,912 | ||||||
| 786,287 | Series 2004-62, Class VA, 5.500%, 07/20/15 | 811,349 | ||||||
| 467,449 | Series 2007-45, Class QA, IF, IO, 6.355%, 07/20/37 | 63,642 | ||||||
| 405,536 | Series 2007-76, Class SA, IF, IO, 6.245%, 11/20/37 | 60,729 | ||||||
| 360,366 | Series 2008-2, Class MS, IF, IO, 6.877%, 01/16/38 | 50,186 | ||||||
| 291,099 | Series 2008-55, Class SA, IF, IO, 5.915%, 06/20/38 | 42,195 | ||||||
| 230,023 | Series 2009-6, Class SA, IF, IO, 5.817%, 02/16/39 | 32,592 | ||||||
| 662,675 | Series 2009-6, Class SH, IF, IO, 5.755%, 02/20/39 | 91,712 | ||||||
| 397,623 | Series 2009-14, Class KI, IO, 6.500%, 03/20/39 | 79,311 | ||||||
SEE NOTES TO FINANCIAL STATEMENTS.
| DECEMBER 31, 2011 | JPMORGAN INSURANCE TRUST | 9 | ||||||
Table of Contents
JPMorgan Insurance Trust Core Bond Portfolio
SCHEDULE OF PORTFOLIO INVESTMENTS
AS OF DECEMBER 31, 2011 (continued)
| PRINCIPAL AMOUNT($) | SECURITY DESCRIPTION | VALUE($) | ||||||
| Collateralized Mortgage Obligations — Continued |
| ||||||
Agency CMO — Continued |
| |||||||
| 272,750 | Series 2009-14, Class NI, IO, 6.500%, 03/20/39 | 53,196 | ||||||
| 881,649 | Series 2009-22, Class SA, IF, IO, 5.985%, 04/20/39 | 111,881 | ||||||
| 888,797 | Series 2009-31, Class ST, IF, IO, 6.065%, 03/20/39 | 113,013 | ||||||
| 888,797 | Series 2009-31, Class TS, IF, IO, 6.015%, 03/20/39 | 112,141 | ||||||
| 1,030,164 | Series 2009-64, Class SN, IF, IO, 5.817%, 07/16/39 | 148,058 | ||||||
| 261,019 | Series 2009-79, Class OK, PO, 11/16/37 | 232,548 | ||||||
| 515,603 | Series 2009-102, Class SM, IF, IO, 6.117%, 06/16/39 | 62,970 | ||||||
| 1,151,323 | Series 2009-106, Class ST, IF, IO, 5.715%, 02/20/38 | 169,845 | ||||||
| 397,332 | Series 2010-130, Class CP, 7.000%, 10/16/40 | 462,257 | ||||||
| 1,008,728 | Series 2011-75, Class SM, IF, IO, 6.315%, 05/20/41 | 150,765 | ||||||
| 774,114 | NCUA Guaranteed Notes, Series 2010-C1, Class APT, 2.650%, 10/29/20 | 809,055 | ||||||
Vendee Mortgage Trust, | ||||||||
| 86,535 | Series 1994-1, Class 1, VAR, 5.628%, 02/15/24 | 94,105 | ||||||
| 200,997 | Series 1996-1, Class 1Z, 6.750%, 02/15/26 | 234,828 | ||||||
| 112,284 | Series 1996-2, Class 1Z, 6.750%, 06/15/26 | 131,178 | ||||||
| 404,732 | Series 1997-1, Class 2Z, 7.500%, 02/15/27 | 474,579 | ||||||
| 111,840 | Series 1998-1, Class 2E, 7.000%, 03/15/28 | 130,479 | ||||||
|
| |||||||
| 73,061,651 | ||||||||
|
| |||||||
Non-Agency CMO — 10.4% | ||||||||
| 4,492 | Adjustable Rate Mortgage Trust, Series 2004-1, Class 9A2, VAR, 1.094%, 01/25/35 | 4,327 | ||||||
| 200,000 | American General Mortgage Loan Trust, Series 2009-1, Class A7, VAR, 5.750%, 09/25/48 (e) | 202,666 | ||||||
| 500,000 | American Home Mortgage Investment Trust, Series 2005-3, Class 2A4, VAR, 2.426%, 09/25/35 | 181,043 | ||||||
Banc of America Alternative Loan Trust, | ||||||||
| 151,589 | Series 2003-9, Class 1CB2, 5.500%, 11/25/33 | 155,034 | ||||||
| 314,167 | Series 2004-5, Class 3A3, PO, 06/25/34 | 182,533 | ||||||
| 76,860 | Series 2004-6, Class 15PO, PO, 07/25/19 | 66,503 | ||||||
Banc of America Funding Corp., | ||||||||
| 94,600 | Series 2003-1, Class APO, PO, 05/20/33 | 79,476 | ||||||
| 81,779 | Series 2004-1, Class PO, PO, 03/25/34 | 65,423 | ||||||
| PRINCIPAL AMOUNT($) | SECURITY DESCRIPTION | VALUE($) | ||||||
Non-Agency CMO — Continued |
| |||||||
| 607,289 | Series 2005-6, Class 2A7, 5.500%, 10/25/35 | 586,358 | ||||||
| 101,251 | Series 2005-7, Class 30PO, PO, 11/25/35 | 73,376 | ||||||
| 306,074 | Series 2005-E, Class 4A1, VAR, 2.675%, 03/20/35 | 269,590 | ||||||
Banc of America Mortgage Securities, Inc., | ||||||||
| 29,276 | Series 2003-8, Class APO, PO, 11/25/33 | 24,363 | ||||||
| 200,000 | Series 2004-3, Class 1A26, 5.500%, 04/25/34 | 204,107 | ||||||
| 27,348 | Series 2004-4, Class APO, PO, 05/25/34 | 23,134 | ||||||
| 606,433 | Series 2004-5, Class 2A2, 5.500%, 06/25/34 | 627,212 | ||||||
| 232,596 | Series 2004-6, Class 2A5, PO, 07/25/34 | 176,503 | ||||||
| 91,249 | Series 2004-6, Class APO, PO, 07/25/34 | 74,999 | ||||||
| 263,352 | Series 2004-7, Class 1A19, PO, 08/25/34 | 197,541 | ||||||
| 216,859 | Series 2004-J, Class 3A1, VAR, 2.910%, 11/25/34 | 178,355 | ||||||
| 590,733 | Series 2005-5, Class 1A26, IO, 5.500%, 06/25/35 | 13,505 | ||||||
BCAP LLC Trust, | ||||||||
| 268,350 | Series 2011-RR5, Class 11A3, VAR, 0.407%, 05/28/36 (e) | 237,490 | ||||||
| 200,410 | Series 2011-RR5, Class 14A3, VAR, 2.818%, 07/26/36 (e) (f) (i) | 189,888 | ||||||
Bear Stearns Adjustable Rate Mortgage Trust, | ||||||||
| 96,291 | Series 2003-7, Class 3A, VAR, 2.625%, 10/25/33 | 89,708 | ||||||
| 189,970 | Series 2005-5, Class A1, VAR, 2.220%, 08/25/35 | 174,228 | ||||||
| 519,525 | Series 2006-1, Class A1, VAR, 2.520%, 02/25/36 | 432,532 | ||||||
| 173,358 | Citicorp Mortgage Securities, Inc., Series 2004-5, Class 2A5, 4.500%, 08/25/34 | 178,890 | ||||||
Citigroup Mortgage Loan Trust, Inc., | ||||||||
| 13,922 | Series 2003-UP3, Class A3, 7.000%, 09/25/33 | 14,275 | ||||||
| 63,536 | Series 2003-UST1, Class A1, 5.500%, 12/25/18 | 66,499 | ||||||
| 23,299 | Series 2003-UST1, Class PO1, PO, 12/25/18 | 21,335 | ||||||
| 17,070 | Series 2003-UST1, Class PO3, PO, 12/25/18 | 15,922 | ||||||
| 129,571 | Series 2005-1, Class 2A1A, VAR, 2.679%, 04/25/35 | 75,878 | ||||||
Countrywide Alternative Loan Trust, | ||||||||
| 111,635 | Series 2002-8, Class A4, 6.500%, 07/25/32 | 116,960 | ||||||
| 40,421 | Series 2003-J1, Class PO, PO, 10/25/33 | 33,481 | ||||||
SEE NOTES TO FINANCIAL STATEMENTS.
| 10 | JPMORGAN INSURANCE TRUST | DECEMBER 31, 2011 | ||||
Table of Contents
| PRINCIPAL AMOUNT($) | SECURITY DESCRIPTION | VALUE($) | ||||||
| Collateralized Mortgage Obligations — Continued |
| ||||||
Non-Agency CMO — Continued |
| |||||||
| 1,732,325 | Series 2004-2CB, Class 1A9, 5.750%, 03/25/34 | 1,647,105 | ||||||
| 139,397 | Series 2004-18CB, Class 2A4, 5.700%, 09/25/34 | 142,378 | ||||||
| 113,300 | Series 2005-5R, Class A1, 5.250%, 12/25/18 | 115,064 | ||||||
| 866,833 | Series 2005-20CB, Class 3A8, IF, IO, 4.456%, 07/25/35 | 96,733 | ||||||
| 20,243 | Series 2005-26CB, Class A10, IF, 12.518%, 07/25/35 | 20,271 | ||||||
| 1,125,085 | Series 2005-28CB, Class 1A4, 5.500%, 08/25/35 | 963,087 | ||||||
| 594,847 | Series 2005-54CB, Class 1A11, 5.500%, 11/25/35 | 457,205 | ||||||
| 1,337,985 | Series 2005-22T1, Class A2, IF, IO, 4.776%, 06/25/35 | 143,251 | ||||||
| 1,281,663 | Series 2005-J1, Class 1A4, IF, IO, 4.806%, 02/25/35 | 147,259 | ||||||
Countrywide Home Loan Mortgage Pass-Through Trust, | ||||||||
| 276,716 | Series 2003-26, Class 1A6, 3.500%, 08/25/33 | 274,554 | ||||||
| 37,387 | Series 2003-44, Class A6, PO, 10/25/33 | 36,990 | ||||||
| 53,552 | Series 2003-J7, Class 4A3, IF, 9.394%, 08/25/18 | 51,714 | ||||||
| 108,071 | Series 2004-7, Class 2A1, VAR, 2.279%, 06/25/34 | 91,180 | ||||||
| 66,274 | Series 2004-HYB1, Class 2A, VAR, 2.800%, 05/20/34 | 54,700 | ||||||
| 94,755 | Series 2004-HYB3, Class 2A, VAR, 2.560%, 06/20/34 | 71,173 | ||||||
| 207,745 | Series 2004-J8, Class 1A2, 4.750%, 11/25/19 | 211,870 | ||||||
| 60,614 | Series 2004-J8, Class POA, PO, 11/25/19 | 56,111 | ||||||
| 500,000 | Series 2005-16, Class A23, 5.500%, 09/25/35 | 491,396 | ||||||
| 470,759 | Series 2005-22, Class 2A1, VAR, 2.740%, 11/25/35 | 303,372 | ||||||
| 26,957 | Credit Suisse First Boston Mortgage Securities Corp., Series 2004-5, Class 5P, PO, 08/25/19 | 25,055 | ||||||
Credit Suisse Mortgage Capital Certificates, | ||||||||
| 290,523 | Series 2011-7R, Class A1, VAR, 1.544%, 08/28/47 (e) | 285,117 | ||||||
| 358,756 | Series 2011-9R, Class A1, VAR, 2.294%, 03/27/46 (e) | 350,684 | ||||||
| 359,321 | First Horizon Alternative Mortgage Securities, Series 2005-FA8, Class 1A19, 5.500%, 11/25/35 | 230,765 | ||||||
| PRINCIPAL AMOUNT($) | SECURITY DESCRIPTION | VALUE($) | ||||||
Non-Agency CMO — Continued |
| |||||||
First Horizon Asset Securities, Inc., | ||||||||
| 56,035 | Series 2004-AR7, Class 2A1, VAR, 2.630%, 02/25/35 | 53,093 | ||||||
| 300,000 | Series 2004-AR7, Class 2A2, VAR, 2.630%, 02/25/35 | 253,248 | ||||||
| 235,534 | Series 2005-AR1, Class 2A2, VAR, 2.747%, 04/25/35 | 210,362 | ||||||
GMAC Mortgage Corp. Loan Trust, | ||||||||
| 233,383 | Series 2003-AR1, Class A4, VAR, 3.030%, 10/19/33 | 219,500 | ||||||
| 234,335 | Series 2004-J5, Class A7, 6.500%, 01/25/35 | 246,645 | ||||||
| 650,000 | Series 2005-AR3, Class 3A4, VAR, 3.061%, 06/19/35 | 509,924 | ||||||
GSR Mortgage Loan Trust, | ||||||||
| 554,762 | Series 2004-6F, Class 1A2, 5.000%, 05/25/34 | 553,866 | ||||||
| 706,452 | Series 2004-6F, Class 3A4, 6.500%, 05/25/34 | 755,685 | ||||||
| 79,167 | Series 2004-10F, Class 2A1, 5.000%, 08/25/19 | 80,165 | ||||||
| 74,166 | Series 2004-13F, Class 3A3, 6.000%, 11/25/34 | 72,864 | ||||||
| 103,258 | Impac Secured Assets CMN Owner Trust, Series 2006-1, Class 2A1, VAR, 0.644%, 05/25/36 | 86,649 | ||||||
| 1,961,693 | Indymac Index Mortgage Loan Trust, Series 2005-AR11, Class A7, IO, VAR, 0.150%, 08/25/35 | 9,809 | ||||||
| 226,732 | JP Morgan Mortgage Trust, Series 2006-A2, Class 5A3, VAR, 2.648%, 11/25/33 | 207,776 | ||||||
MASTR Adjustable Rate Mortgages Trust, | ||||||||
| 153,633 | Series 2004-13, Class 2A1, VAR, 2.664%, 04/21/34 | 146,742 | ||||||
| 412,419 | Series 2004-13, Class 3A6, VAR, 2.718%, 11/21/34 | 403,640 | ||||||
MASTR Alternative Loans Trust, | ||||||||
| 197,555 | Series 2003-9, Class 8A1, 6.000%, 01/25/34 | 197,817 | ||||||
| 446,637 | Series 2004-4, Class 10A1, 5.000%, 05/25/24 | 460,349 | ||||||
| 307,167 | Series 2004-6, Class 7A1, 6.000%, 07/25/34 | 304,875 | ||||||
| 42,197 | Series 2004-7, Class 30PO, PO, 08/25/34 | 30,831 | ||||||
| 256,757 | Series 2004-8, Class 6A1, 5.500%, 09/25/19 | 260,625 | ||||||
| 249,956 | Series 2004-10, Class 1A1, 4.500%, 09/25/19 | 255,757 | ||||||
SEE NOTES TO FINANCIAL STATEMENTS.
| DECEMBER 31, 2011 | JPMORGAN INSURANCE TRUST | 11 | ||||||
Table of Contents
JPMorgan Insurance Trust Core Bond Portfolio
SCHEDULE OF PORTFOLIO INVESTMENTS
AS OF DECEMBER 31, 2011 (continued)
| PRINCIPAL AMOUNT($) | SECURITY DESCRIPTION | VALUE($) | ||||||
| Collateralized Mortgage Obligations — Continued |
| ||||||
Non-Agency CMO — Continued |
| |||||||
MASTR Asset Securitization Trust, | ||||||||
| 458,161 | Series 2003-11, Class 9A6, 5.250%, 12/25/33 | 473,850 | ||||||
| 69,918 | Series 2003-12, Class 15PO, PO, 12/25/18 | 64,077 | ||||||
| 107,955 | Series 2004-6, Class 15PO, PO, 05/25/19 | 98,676 | ||||||
| 80,114 | Series 2004-8, Class PO, PO, 08/25/19 | 74,377 | ||||||
| 179,933 | Series 2004-10, Class 15PO , PO, 10/25/19 | 165,918 | ||||||
| 352,095 | MASTR Resecuritization Trust, Series 2005-PO, Class 3PO, PO, 05/28/35 (e) | 257,029 | ||||||
| 83,550 | MortgageIT Trust, Series 2005-1, Class 1A1, VAR, 0.614%, 02/25/35 | 63,814 | ||||||
| 71,316 | Nomura Asset Acceptance Corp., Series 2004-R2, Class A1, VAR, 6.500%, 10/25/34 (e) | 71,789 | ||||||
| 590,331 | PHH Alternative Mortgage Trust, Series 2007-2, Class 2X, IO, 6.000%, 05/25/37 | 97,755 | ||||||
Residential Accredit Loans, Inc., |
| |||||||
| 112,556 | Series 2002-QS8, Class A5, 6.250%, 06/25/17 | 114,840 | ||||||
| 953,950 | Series 2003-QR19, Class CB4, 5.750%, 10/25/33 | 939,311 | ||||||
| 29,457 | Series 2003-QS3, Class A2, IF, 15.854%, 02/25/18 | 31,485 | ||||||
| 84,378 | Series 2003-QS3, Class A8, IF, IO, 7.306%, 02/25/18 | 8,363 | ||||||
| 216,594 | Series 2003-QS9, Class A3, IF, IO, 7.256%, 05/25/18 | 29,389 | ||||||
| 277,187 | Series 2003-QS14, Class A1, 5.000%, 07/25/18 | 281,765 | ||||||
| 87,656 | Series 2003-QS18, Class A1, 5.000%, 09/25/18 | 90,135 | ||||||
| 28,884 | Residential Asset Securitization Trust, Series 2003-A14, Class A1, 4.750%, 02/25/19 | 29,134 | ||||||
| 204,069 | Residential Funding Mortgage Securities I, Series 2005-SA4, Class 1A1, VAR, 2.876%, 09/25/35 | 133,159 | ||||||
| 8,267 | SACO I, Inc. (Bear Stearns), Series 1997-2, Class 1A5, 7.000%, 08/25/36 (e) | 8,453 | ||||||
Salomon Brothers Mortgage Securities VII, Inc., | ||||||||
| 139,479 | Series 2003-HYB1, Class A, VAR, 2.736%, 09/25/33 | 128,963 | ||||||
| 10,143 | Series 2003-UP2, Class PO1, PO, 12/25/18 | 8,904 | ||||||
| 90,888 | Springleaf Mortgage Loan Trust, Series 2011-1A, Class A1, VAR, 4.050%, 01/25/58 (e) | 90,773 | ||||||
| PRINCIPAL AMOUNT($) | SECURITY DESCRIPTION | VALUE($) | ||||||
Non-Agency CMO — Continued |
| |||||||
| 400,000 | Structured Adjustable Rate Mortgage Loan Trust, Series 2004-6, Class 5A4, VAR, 4.951%, 06/25/34 | 376,830 | ||||||
Structured Asset Securities Corp., |
| |||||||
| 118,952 | Series 2003-8, Class 1A2, 5.000%, 04/25/18 | 121,575 | ||||||
| 199,562 | Series 2003-33H, Class 1A1, 5.500%, 10/25/33 | 201,918 | ||||||
| 48,017 | Series 2004-20, Class 1A3, 5.250%, 11/25/34 | 48,253 | ||||||
WaMu Mortgage Pass-Through Certificates, |
| |||||||
| 33,850 | Series 2003-AR8, Class A, VAR, 2.485%, 08/25/33 | 31,754 | ||||||
| 173,120 | Series 2003-AR9, Class 1A6, VAR, 2.460%, 09/25/33 | 163,752 | ||||||
| 91,323 | Series 2003-S4, Class 3A, 5.500%, 06/25/33 | 95,269 | ||||||
| 123,895 | Series 2003-S8, Class A4, 4.500%, 09/25/18 | 125,291 | ||||||
| 3,564 | Series 2003-S10, Class A5, 5.000%, 10/25/18 | 3,557 | ||||||
| 274 | Series 2003-S10, Class A6, PO, 10/25/18 | 274 | ||||||
| 58,219 | Series 2003-S11, Class 2A5, IF, 16.243%, 11/25/33 | 61,213 | ||||||
| 62,105 | Series 2004-AR3, Class A2, VAR, 2.563%, 06/25/34 | 60,049 | ||||||
Washington Mutual Alternative Mortgage Pass-Through Certificates, | ||||||||
| 2,018,463 | Series 2005-2, Class 1A4, IF, IO, 4.756%, 04/25/35 | 244,156 | ||||||
| 694,493 | Series 2005-2, Class 2A3, IF, IO, 4.706%, 04/25/35 | 78,922 | ||||||
| 536,033 | Series 2005-3, Class CX, IO, 5.500%, 05/25/35 | 82,167 | ||||||
| 735,513 | Series 2005-4, Class CB7, 5.500%, 06/25/35 | 591,490 | ||||||
| 44,669 | Series 2005-4, Class DP, PO, 06/25/20 | 37,951 | ||||||
| 193,785 | Series 2005-6, Class 2A4, 5.500%, 08/25/35 | 151,119 | ||||||
Wells Fargo Mortgage-Backed Securities Trust, | ||||||||
| 80,088 | Series 2003-8, Class A9, 4.500%, 08/25/18 | 83,512 | ||||||
| 112,369 | Series 2003-11, Class 1A4, 4.750%, 10/25/18 | 112,131 | ||||||
| 23,834 | Series 2003-11, Class 1APO, PO, 10/25/18 | 22,171 | ||||||
| 84,628 | Series 2003-15, Class 1A1, 4.750%, 12/25/18 | 87,277 | ||||||
SEE NOTES TO FINANCIAL STATEMENTS.
| 12 | JPMORGAN INSURANCE TRUST | DECEMBER 31, 2011 | ||||
Table of Contents
| PRINCIPAL AMOUNT($) | SECURITY DESCRIPTION | VALUE($) | ||||||
| Collateralized Mortgage Obligations — Continued |
| ||||||
Non-Agency CMO — Continued |
| |||||||
| 80,830 | Series 2003-K, Class 1A1, VAR, 4.428%, 11/25/33 | 81,648 | ||||||
| 161,659 | Series 2003-K, Class 1A2, VAR, 4.428%, 11/25/33 | 166,484 | ||||||
| 82,362 | Series 2004-7, Class 2A2, 5.000%, 07/25/19 | 84,772 | ||||||
| 121,627 | Series 2004-EE, Class 3A1, VAR, 2.740%, 12/25/34 | 116,820 | ||||||
| 320,406 | Series 2004-P, Class 2A1, VAR, 2.677%, 09/25/34 | 304,025 | ||||||
| 180,706 | Series 2005-AR8, Class 2A1, VAR, 2.704%, 06/25/35 | 167,544 | ||||||
| 123,996 | Series 2005-AR16, Class 2A1, VAR, 2.690%, 02/25/34 | 109,229 | ||||||
|
| |||||||
| 23,693,502 | ||||||||
|
| |||||||
Total Collateralized Mortgage Obligations | 96,755,153 | |||||||
|
| |||||||
| Commercial Mortgage-Backed Securities — 2.0% |
| ||||||
Banc of America Merrill Lynch Commercial Mortgage, Inc., | ||||||||
| 125,000 | Series 2005-3, Class A4, 4.668%, 07/10/43 | 135,360 | ||||||
| 125,000 | Series 2005-3, Class AM, 4.727%, 07/10/43 | 127,957 | ||||||
| 448,942 | Series 2005-6, Class ASB, VAR, 5.193%, 09/10/47 | 469,578 | ||||||
| 250,000 | Series 2006-4, Class A4, 5.634%, 07/10/46 | 276,636 | ||||||
Bear Stearns Commercial Mortgage Securities, | ||||||||
| 250,000 | Series 2005-PWR8, Class A4, 4.674%, 06/11/41 | 268,917 | ||||||
| 170,846 | Series 2005-PWR9, Class AAB, 4.804%, 09/11/42 | 177,887 | ||||||
| 360,000 | Series 2006-PW11, Class A4, VAR, 5.441%, 03/11/39 | 399,097 | ||||||
Citigroup Commercial Mortgage Trust, | ||||||||
| 100,000 | Series 2005-C3, Class AM, VAR, 4.830%, 05/15/43 | 105,488 | ||||||
| 253 | Series 2006-C4, Class A1, VAR, 5.728%, 03/15/49 | 253 | ||||||
| 14,330,099 | Citigroup/Deutsche Bank Commercial Mortgage Trust, Series 2007-CD4, Class XC, IO, VAR, 0.169%, 12/11/49 (e) | 135,434 | ||||||
| 565,000 | Credit Suisse Mortgage Capital Certificates, Series 2006-C1, Class A4, VAR, 5.419%, 02/15/39 | 625,279 | ||||||
| PRINCIPAL AMOUNT($) | SECURITY DESCRIPTION | VALUE($) | ||||||
| 100,000 | GMAC Commercial Mortgage Securities, Inc., Series 2006-C1, Class A4, VAR, 5.238%, 11/10/45 | 107,658 | ||||||
| 200,000 | GS Mortgage Securities Corp. II, Series 2004-GG2, Class A6, VAR, 5.396%, 08/10/38 | 214,154 | ||||||
| 100,000 | JP Morgan Chase Commercial Mortgage Securities Corp., Series 2004-CB8, Class A4, 4.404%, 01/12/39 | 104,789 | ||||||
LB-UBS Commercial Mortgage Trust, | ||||||||
| 107,000 | Series 2004-C2, Class A4, 4.367%, 03/15/36 | 111,791 | ||||||
| 75,000 | Series 2005-C1, Class A4, 4.742%, 02/15/30 | 80,123 | ||||||
| 224,778 | Merrill Lynch Mortgage Trust, Series 2005-MCP1, Class ASB, VAR, 4.674%, 06/12/43 | 233,410 | ||||||
| 4,016,615 | Morgan Stanley Capital I, Series 2006-IQ12, Class X1, IO, VAR, 0.107%, 12/15/43 (e) | 57,650 | ||||||
| 238,528 | Morgan Stanley Reremic Trust, Series 2011-IO, Class A, 2.500%, 03/23/51 (e) | 238,155 | ||||||
| 400,000 | TIAA Seasoned Commercial Mortgage Trust, Series 2007-C4, Class A3, VAR, 5.739%, 08/15/39 | 432,561 | ||||||
| 116,000 | Wachovia Bank Commercial Mortgage Trust, Series 2004-C11, Class A5, VAR, 5.215%, 01/15/41 | 124,238 | ||||||
| 110,000 | WF-RBS Commercial Mortgage Trust, Series 2011-C3, Class A4, 4.375%, 03/15/44 (e) | 117,128 | ||||||
|
| |||||||
Total Commercial Mortgage-Backed Securities | 4,543,543 | |||||||
|
| |||||||
| Corporate Bonds — 15.9% |
| ||||||
Consumer Discretionary — 1.3% | ||||||||
Automobiles — 0.0% (g) | ||||||||
| 60,000 | Daimler Finance North America LLC, 7.300%, 01/15/12 | 60,146 | ||||||
|
| |||||||
Household Durables — 0.0% (g) | ||||||||
| 50,000 | Newell Rubbermaid, Inc., 4.700%, 08/15/20 | 52,815 | ||||||
|
| |||||||
Media — 1.2% | ||||||||
CBS Corp., | ||||||||
| 21,000 | 5.750%, 04/15/20 | 23,610 | ||||||
| 100,000 | 7.875%, 07/30/30 | 127,220 | ||||||
| 125,000 | Comcast Cable Communications LLC, 7.125%, 06/15/13 | 135,629 | ||||||
SEE NOTES TO FINANCIAL STATEMENTS.
| DECEMBER 31, 2011 | JPMORGAN INSURANCE TRUST | 13 | ||||||
Table of Contents
JPMorgan Insurance Trust Core Bond Portfolio
SCHEDULE OF PORTFOLIO INVESTMENTS
AS OF DECEMBER 31, 2011 (continued)
| PRINCIPAL AMOUNT($) | SECURITY DESCRIPTION | VALUE($) | ||||||
| Corporate Bonds — Continued |
| ||||||
Media — Continued | ||||||||
Comcast Cable Holdings LLC, | ||||||||
| 235,000 | 9.800%, 02/01/12 | 236,628 | ||||||
| 75,000 | 10.125%, 04/15/22 | 108,608 | ||||||
Comcast Corp., | ||||||||
| 50,000 | 5.900%, 03/15/16 | 57,230 | ||||||
| 50,000 | 6.450%, 03/15/37 | 60,612 | ||||||
| 30,000 | 6.500%, 01/15/17 | 35,285 | ||||||
| 35,000 | 6.500%, 11/15/35 | 42,189 | ||||||
Cox Communications, Inc., | ||||||||
| 30,000 | 5.450%, 12/15/14 | 33,301 | ||||||
| 20,000 | 8.375%, 03/01/39 (e) | 26,779 | ||||||
DIRECTV Holdings LLC/DIRECTV Financing Co., Inc., | ||||||||
| 125,000 | 4.600%, 02/15/21 | 129,969 | ||||||
| 67,000 | 5.000%, 03/01/21 | 71,705 | ||||||
| 125,000 | 6.000%, 08/15/40 | 136,359 | ||||||
| 78,000 | Discovery Communications LLC, 4.375%, 06/15/21 | 82,336 | ||||||
| 100,000 | Historic TW, Inc., 9.150%, 02/01/23 | 136,786 | ||||||
| 75,000 | NBC Universal Media LLC, 5.950%, 04/01/41 | 88,156 | ||||||
News America, Inc., | ||||||||
| 50,000 | 6.650%, 11/15/37 | 56,647 | ||||||
| 50,000 | 7.250%, 05/18/18 | 60,234 | ||||||
| 150,000 | 7.300%, 04/30/28 | 171,387 | ||||||
| 84,000 | Thomson Reuters Corp., (Canada), 3.950%, 09/30/21 | 86,932 | ||||||
Time Warner Cable, Inc., | ||||||||
| 50,000 | 6.550%, 05/01/37 | 56,871 | ||||||
| 50,000 | 6.750%, 07/01/18 | 59,385 | ||||||
| 50,000 | 7.300%, 07/01/38 | 60,758 | ||||||
| 70,000 | 8.250%, 02/14/14 | 78,901 | ||||||
Time Warner Entertainment Co. LP, | ||||||||
| 50,000 | 8.375%, 03/15/23 | 65,120 | ||||||
| 25,000 | 8.375%, 07/15/33 | 32,768 | ||||||
| 150,000 | 10.150%, 05/01/12 | 154,341 | ||||||
Time Warner, Inc., | ||||||||
| 35,000 | 4.750%, 03/29/21 | 37,956 | ||||||
| 75,000 | 6.200%, 03/15/40 | 88,343 | ||||||
| 22,000 | 6.250%, 03/29/41 | 26,377 | ||||||
| 43,000 | Viacom, Inc., 3.875%, 12/15/21 | 43,897 | ||||||
|
| |||||||
| 2,612,319 | ||||||||
|
| |||||||
Specialty Retail — 0.1% | ||||||||
| 30,000 | Gap, Inc. (The), 5.950%, 04/12/21 | 28,614 | ||||||
| 70,000 | Home Depot, Inc. (The), 5.400%, 03/01/16 | 80,848 | ||||||
| PRINCIPAL AMOUNT($) | SECURITY DESCRIPTION | VALUE($) | ||||||
Specialty Retail — Continued | ||||||||
| 75,000 | Lowe’s Cos., Inc., 7.110%, 05/15/37 | 98,728 | ||||||
| 35,000 | Staples, Inc., 9.750%, 01/15/14 | 40,021 | ||||||
|
| |||||||
| 248,211 | ||||||||
|
| |||||||
Total Consumer Discretionary | 2,973,491 | |||||||
|
| |||||||
Consumer Staples — 0.6% | ||||||||
Beverages — 0.2% | ||||||||
| 125,000 | Anheuser-Busch InBev Worldwide, Inc., 7.750%, 01/15/19 | 161,895 | ||||||
| 50,000 | Coca-Cola Enterprises, Inc., 8.500%, 02/01/12 | 50,310 | ||||||
| 95,000 | Diageo Capital plc, (United Kingdom), 5.750%, 10/23/17 | 111,476 | ||||||
| 20,000 | Diageo Finance B.V., (Netherlands), 5.300%, 10/28/15 | 22,754 | ||||||
| 15,000 | FBG Finance Ltd., (Australia), 5.125%, 06/15/15 (e) | 16,325 | ||||||
| 40,000 | SABMiller plc, (United Kingdom), 5.700%, 01/15/14 (e) | 43,379 | ||||||
|
| |||||||
| 406,139 | ||||||||
|
| |||||||
Food & Staples Retailing — 0.1% | ||||||||
CVS Caremark Corp., | ||||||||
| 60,000 | 5.750%, 05/15/41 | 71,444 | ||||||
| 30,000 | 6.125%, 09/15/39 | 36,506 | ||||||
Kroger Co. (The), | ||||||||
| 18,000 | 5.400%, 07/15/40 | 19,392 | ||||||
| 25,000 | 7.500%, 04/01/31 | 32,613 | ||||||
| 70,000 | Wal-Mart Stores, Inc., 6.500%, 08/15/37 | 96,704 | ||||||
|
| |||||||
| 256,659 | ||||||||
|
| |||||||
Food Products — 0.3% | ||||||||
Bunge Ltd. Finance Corp., | ||||||||
| 50,000 | 5.875%, 05/15/13 | 52,041 | ||||||
| 55,000 | 8.500%, 06/15/19 | 66,948 | ||||||
| 27,000 | Bunge N.A. Finance LP, 5.900%, 04/01/17 | 29,485 | ||||||
| 50,000 | Kellogg Co., 4.250%, 03/06/13 | 51,918 | ||||||
Kraft Foods, Inc., | ||||||||
| 127,000 | 5.375%, 02/10/20 | 146,539 | ||||||
| 165,000 | 6.125%, 02/01/18 | 193,407 | ||||||
| 100,000 | 6.875%, 02/01/38 | 132,417 | ||||||
|
| |||||||
| 672,755 | ||||||||
|
| |||||||
Household Products — 0.0% (g) | ||||||||
| 75,700 | Procter & Gamble - ESOP, 9.360%, 01/01/21 | 101,880 | ||||||
|
| |||||||
Total Consumer Staples | 1,437,433 | |||||||
|
| |||||||
SEE NOTES TO FINANCIAL STATEMENTS.
| 14 | JPMORGAN INSURANCE TRUST | DECEMBER 31, 2011 | ||||
Table of Contents
| PRINCIPAL AMOUNT($) | SECURITY DESCRIPTION | VALUE($) | ||||||
| Corporate Bonds — Continued |
| ||||||
Energy — 0.5% | ||||||||
Energy Equipment & Services — 0.1% | ||||||||
Transocean, Inc., (Cayman Islands), | ||||||||
| 18,000 | 6.375%, 12/15/21 | 19,132 | ||||||
| 75,000 | 6.500%, 11/15/20 | 77,474 | ||||||
| 14,000 | 7.350%, 12/15/41 | 15,552 | ||||||
|
| |||||||
| 112,158 | ||||||||
|
| |||||||
Oil, Gas & Consumable Fuels — 0.4% | ||||||||
| 50,000 | Apache Corp., 6.900%, 09/15/18 | 63,582 | ||||||
| 100,000 | Canadian Natural Resources Ltd., (Canada), 5.900%, 02/01/18 | 117,859 | ||||||
ConocoPhillips, | ||||||||
| 25,000 | 5.750%, 02/01/19 | 30,125 | ||||||
| 120,000 | 6.000%, 01/15/20 | 148,192 | ||||||
| 150,000 | Marathon Oil Corp., 6.000%, 10/01/17 | 174,527 | ||||||
| 60,000 | Petro-Canada, (Canada), 6.800%, 05/15/38 | 77,471 | ||||||
| 60,000 | Shell International Finance B.V., (Netherlands), 6.375%, 12/15/38 | 82,579 | ||||||
| 50,000 | Statoil ASA, (Norway), 3.125%, 08/17/17 | 52,735 | ||||||
| 45,000 | Suncor Energy, Inc., (Canada), 6.850%, 06/01/39 | 57,635 | ||||||
| 40,000 | Talisman Energy, Inc., (Canada), 7.750%, 06/01/19 | 49,322 | ||||||
| 150,000 | Total Capital S.A., (France), 2.300%, 03/15/16 | 153,949 | ||||||
|
| |||||||
| 1,007,976 | ||||||||
|
| |||||||
Total Energy | 1,120,134 | |||||||
|
| |||||||
Financials — 8.6% | ||||||||
Capital Markets — 2.0% | ||||||||
Bank of New York Mellon Corp. (The), | ||||||||
| 75,000 | 2.950%, 06/18/15 | 77,779 | ||||||
| 55,000 | 4.600%, 01/15/20 | 59,874 | ||||||
BlackRock, Inc., | ||||||||
| 80,000 | 3.500%, 12/10/14 | 85,426 | ||||||
| 130,000 | 5.000%, 12/10/19 | 141,869 | ||||||
| 65,000 | 6.250%, 09/15/17 | 75,622 | ||||||
| 100,000 | Blackstone Holdings Finance Co. LLC, 5.875%, 03/15/21 (e) | 97,580 | ||||||
| 50,000 | Credit Suisse USA, Inc., 4.875%, 01/15/15 | 52,241 | ||||||
Goldman Sachs Group, Inc. (The), | ||||||||
| 75,000 | 3.625%, 02/07/16 | 72,467 | ||||||
| 20,000 | 3.700%, 08/01/15 | 19,594 | ||||||
| 375,000 | 4.750%, 07/15/13 | 379,960 | ||||||
| 150,000 | 5.250%, 10/15/13 | 153,050 | ||||||
| 23,000 | 5.250%, 07/27/21 | 22,437 | ||||||
| PRINCIPAL AMOUNT($) | SECURITY DESCRIPTION | VALUE($) | ||||||
Capital Markets — Continued | ||||||||
| 156,000 | 5.375%, 03/15/20 | 153,976 | ||||||
| 100,000 | 5.500%, 11/15/14 | 103,027 | ||||||
| 150,000 | 5.950%, 01/18/18 | 153,633 | ||||||
| 75,000 | 5.950%, 01/15/27 | 70,300 | ||||||
| 100,000 | 6.250%, 09/01/17 | 104,544 | ||||||
| 80,000 | 6.750%, 10/01/37 | 74,441 | ||||||
| 125,000 | 7.500%, 02/15/19 | 138,051 | ||||||
Jefferies Group, Inc., | ||||||||
| 55,000 | 3.875%, 11/09/15 | 48,675 | ||||||
| 110,000 | 6.450%, 06/08/27 | 91,575 | ||||||
| 100,000 | 8.500%, 07/15/19 | 101,500 | ||||||
Lehman Brothers Holdings, Inc., | ||||||||
| 315,000 | 0.000%, 11/10/09 (d) (f) (i) # | 80,325 | ||||||
| 200,000 | 4.800%, 03/13/14 (d) (f) (i) # | 51,250 | ||||||
| 100,000 | 5.750%, 05/17/13 (d) (f) (i) # | 25,625 | ||||||
| 175,000 | 6.625%, 01/18/12 (d) (f) (i) # | 44,844 | ||||||
| 50,000 | Macquarie Group Ltd., (Australia), 7.300%, 08/01/14 (e) | 52,055 | ||||||
Merrill Lynch & Co., Inc., | ||||||||
| 120,000 | 5.450%, 07/15/14 | 118,989 | ||||||
| 274,000 | 6.150%, 04/25/13 | 276,567 | ||||||
| 135,000 | 6.400%, 08/28/17 | 130,721 | ||||||
| 90,000 | 6.875%, 04/25/18 | 88,734 | ||||||
Morgan Stanley, | ||||||||
| 100,000 | 4.200%, 11/20/14 | 96,444 | ||||||
| 400,000 | 4.750%, 04/01/14 | 394,035 | ||||||
| 300,000 | 5.300%, 03/01/13 | 303,672 | ||||||
| 35,000 | 5.500%, 07/28/21 | 32,362 | ||||||
| 200,000 | 5.625%, 09/23/19 | 185,216 | ||||||
| 130,000 | 6.250%, 08/28/17 | 127,224 | ||||||
| 136,000 | Nomura Holdings, Inc., (Japan), 6.700%, 03/04/20 | 143,199 | ||||||
|
| |||||||
| 4,428,883 | ||||||||
|
| |||||||
Commercial Banks — 2.2% | ||||||||
| 82,000 | Bank of Nova Scotia, (Canada), 3.400%, 01/22/15 | 86,131 | ||||||
Barclays Bank plc, (United Kingdom), | ||||||||
| 110,000 | 2.500%, 01/23/13 | 109,531 | ||||||
| 106,000 | 3.900%, 04/07/15 | 106,453 | ||||||
| 100,000 | 5.200%, 07/10/14 | 103,082 | ||||||
| 150,000 | 6.050%, 12/04/17 (e) | 135,638 | ||||||
BB&T Corp., | ||||||||
| 110,000 | 3.850%, 07/27/12 | 111,795 | ||||||
| 100,000 | 3.950%, 04/29/16 | 107,436 | ||||||
| 50,000 | 4.900%, 06/30/17 | 53,216 | ||||||
SEE NOTES TO FINANCIAL STATEMENTS.
| DECEMBER 31, 2011 | JPMORGAN INSURANCE TRUST | 15 | ||||||
Table of Contents
JPMorgan Insurance Trust Core Bond Portfolio
SCHEDULE OF PORTFOLIO INVESTMENTS
AS OF DECEMBER 31, 2011 (continued)
| PRINCIPAL AMOUNT($) | SECURITY DESCRIPTION | VALUE($) | ||||||
| Corporate Bonds — Continued |
| ||||||
Commercial Banks — Continued | ||||||||
| 50,000 | 5.700%, 04/30/14 | 54,699 | ||||||
| 75,000 | Branch Banking & Trust Co., 4.875%, 01/15/13 | 76,425 | ||||||
Credit Suisse, (Switzerland), | ||||||||
| 100,000 | 5.400%, 01/14/20 | 94,317 | ||||||
| 150,000 | 5.500%, 05/01/14 | 155,913 | ||||||
| 100,000 | 6.000%, 02/15/18 | 98,623 | ||||||
| 350,000 | Glitnir Banki HF, (Iceland)10/15/08 (d) (e) (f) (i) | 91,000 | ||||||
HSBC Bank plc, (United Kingdom), | ||||||||
| 100,000 | 3.500%, 06/28/15 (e) | 100,807 | ||||||
| 111,000 | 4.125%, 08/12/20 (e) | 109,531 | ||||||
| 100,000 | KeyCorp, 6.500%, 05/14/13 | 105,799 | ||||||
National Australia Bank Ltd., (Australia), | ||||||||
| 200,000 | 2.500%, 01/08/13 (e) | 201,022 | ||||||
| 200,000 | 2.750%, 09/28/15 (e) | 198,675 | ||||||
| 100,000 | 3.750%, 03/02/15 (e) | 103,195 | ||||||
| 100,000 | Nordea Bank AB, (Sweden), 1.750%, 10/04/13 (e) | 97,714 | ||||||
PNC Funding Corp., | ||||||||
| 150,000 | 5.125%, 02/08/20 | 169,496 | ||||||
| 25,000 | 5.250%, 11/15/15 | 27,191 | ||||||
| 25,000 | 5.625%, 02/01/17 | 27,222 | ||||||
| 25,000 | 6.700%, 06/10/19 | 30,501 | ||||||
| 200,000 | Rabobank Nederland N.V., (Netherlands), 3.200%, 03/11/15 (e) | 203,715 | ||||||
| 72,000 | Toronto-Dominion Bank (The), (Canada), 2.500%, 07/14/16 | 73,431 | ||||||
U.S. Bancorp, | ||||||||
| 90,000 | 2.450%, 07/27/15 | 92,236 | ||||||
| 100,000 | 7.500%, 06/01/26 | 129,396 | ||||||
UBS AG, (Switzerland), | ||||||||
| 250,000 | 3.875%, 01/15/15 | 249,312 | ||||||
| 100,000 | 5.750%, 04/25/18 | 103,608 | ||||||
Wachovia Bank N.A., | ||||||||
| 250,000 | 6.000%, 11/15/17 | 276,056 | ||||||
| 250,000 | 6.600%, 01/15/38 | 283,511 | ||||||
| 250,000 | VAR, 0.876%, 03/15/16 | 223,797 | ||||||
Wachovia Corp., | ||||||||
| 250,000 | 5.500%, 05/01/13 | 263,775 | ||||||
| 50,000 | 5.750%, 02/01/18 | 56,801 | ||||||
| 200,000 | Wells Fargo & Co., 3.676%, 06/15/16 | 209,000 | ||||||
Westpac Banking Corp., (Australia), | ||||||||
| 65,000 | 4.200%, 02/27/15 | 67,745 | ||||||
| 121,000 | 4.875%, 11/19/19 | 128,734 | ||||||
|
| |||||||
| 4,916,529 | ||||||||
|
| |||||||
| PRINCIPAL AMOUNT($) | SECURITY DESCRIPTION | VALUE($) | ||||||
Consumer Finance — 0.6% | ||||||||
| 50,000 | American Express Co., 7.000%, 03/19/18 | 60,421 | ||||||
| 50,000 | American Express Credit Corp., 7.300%, 08/20/13 | 54,263 | ||||||
Capital One Financial Corp., | ||||||||
| 100,000 | 6.750%, 09/15/17 | 112,051 | ||||||
| 185,000 | 7.375%, 05/23/14 | 203,262 | ||||||
HSBC Finance Corp., | ||||||||
| 13,000 | 4.750%, 07/15/13 | 13,275 | ||||||
| 150,000 | 5.000%, 06/30/15 | 152,309 | ||||||
| 150,000 | 5.250%, 01/15/14 | 153,173 | ||||||
| 50,000 | 7.350%, 11/27/32 | 48,020 | ||||||
| 100,000 | VAR, 0.653%, 01/15/14 | 92,120 | ||||||
John Deere Capital Corp., | ||||||||
| 42,000 | 3.150%, 10/15/21 | 42,805 | ||||||
| 20,000 | 4.500%, 04/03/13 | 20,954 | ||||||
| 100,000 | SLM Corp., 5.375%, 01/15/13 | 100,690 | ||||||
Toyota Motor Credit Corp., | ||||||||
| 100,000 | 2.000%, 09/15/16 | 100,995 | ||||||
| 87,000 | 3.200%, 06/17/15 | 91,508 | ||||||
|
| |||||||
| 1,245,846 | ||||||||
|
| |||||||
Diversified Financial Services — 2.2% | ||||||||
| 150,000 | BA Covered Bond Issuer, 5.500%, 06/14/12 (e) | 153,019 | ||||||
Bank of America Corp., | ||||||||
| 295,000 | 5.650%, 05/01/18 | 281,062 | ||||||
| 245,000 | 5.750%, 12/01/17 | 231,408 | ||||||
| 50,000 | 6.500%, 08/01/16 | 50,354 | ||||||
| 200,000 | 7.375%, 05/15/14 | 207,372 | ||||||
| 25,000 | 7.625%, 06/01/19 | 25,855 | ||||||
| 150,000 | BP Capital Markets plc, (United Kingdom), 4.742%, 03/11/21 | 169,898 | ||||||
Caterpillar Financial Services Corp., | ||||||||
| 80,000 | 5.450%, 04/15/18 | 93,519 | ||||||
| 100,000 | 6.200%, 09/30/13 | 109,011 | ||||||
| 100,000 | 7.050%, 10/01/18 | 126,833 | ||||||
| 50,000 | 7.150%, 02/15/19 | 64,039 | ||||||
Citigroup, Inc., | ||||||||
| 150,000 | 4.700%, 05/29/15 | 152,483 | ||||||
| 62,000 | 4.750%, 05/19/15 | 62,791 | ||||||
| 300,000 | 5.000%, 09/15/14 | 296,912 | ||||||
| 36,000 | 5.375%, 08/09/20 | 37,018 | ||||||
| 55,000 | 5.500%, 04/11/13 | 56,151 | ||||||
| 285,000 | 6.000%, 08/15/17 | 298,669 | ||||||
| 150,000 | 6.010%, 01/15/15 | 156,706 | ||||||
| 100,000 | 8.125%, 07/15/39 | 122,433 | ||||||
SEE NOTES TO FINANCIAL STATEMENTS.
| 16 | JPMORGAN INSURANCE TRUST | DECEMBER 31, 2011 | ||||
Table of Contents
| PRINCIPAL AMOUNT($) | SECURITY DESCRIPTION | VALUE($) | ||||||
| Corporate Bonds — Continued |
| ||||||
Diversified Financial Services — Continued | ||||||||
| 45,000 | 8.500%, 05/22/19 | 52,969 | ||||||
CME Group, Inc., | ||||||||
| 50,000 | 5.400%, 08/01/13 | 53,281 | ||||||
| 50,000 | 5.750%, 02/15/14 | 54,501 | ||||||
| 75,000 | ConocoPhillips Canada Funding Co. I, (Canada), 5.625%, 10/15/16 | 87,565 | ||||||
| 45,000 | ERAC USA Finance LLC, 4.500%, 08/16/21 (e) | 46,154 | ||||||
| 200,000 | FUEL Trust, 3.984%, 06/15/16 (e) | 199,973 | ||||||
General Electric Capital Corp., | ||||||||
| 200,000 | 4.750%, 09/15/14 | 215,669 | ||||||
| 100,000 | 5.250%, 10/19/12 | 103,497 | ||||||
| 190,000 | 5.500%, 01/08/20 | 209,056 | ||||||
| 400,000 | 5.625%, 05/01/18 | 448,001 | ||||||
| 100,000 | 5.875%, 01/14/38 | 105,959 | ||||||
| 115,000 | 5.900%, 05/13/14 | 125,942 | ||||||
| 110,000 | 6.000%, 06/15/12 | 112,473 | ||||||
| 200,000 | 6.750%, 03/15/32 | 234,188 | ||||||
| 125,000 | GTP Acquisition Partners I LLC, 4.347%, 06/15/16 (e) | 124,468 | ||||||
| 100,000 | MassMutual Global Funding II, 2.300%, 09/28/15 (e) | 100,398 | ||||||
National Rural Utilities Cooperative Finance Corp., | ||||||||
| 50,000 | 2.625%, 09/16/12 | 50,635 | ||||||
| 50,000 | 10.375%, 11/01/18 | 71,938 | ||||||
|
| |||||||
| 5,092,200 | ||||||||
|
| |||||||
FDIC Guaranteed Securities (~) — 0.0% (g) | ||||||||
| 105,000 | Goldman Sachs Group, Inc. (The), 3.250%, 06/15/12 | 106,494 | ||||||
|
| |||||||
Insurance — 1.2% | ||||||||
| 35,000 | ACE INA Holdings, Inc., 5.600%, 05/15/15 | 39,044 | ||||||
Aflac, Inc., | ||||||||
| 25,000 | 6.450%, 08/15/40 | 26,478 | ||||||
| 20,000 | 8.500%, 05/15/19 | 24,511 | ||||||
| 60,000 | Allstate Life Global Funding Trusts, 5.375%, 04/30/13 | 63,356 | ||||||
| 130,000 | American International Group, Inc., 4.250%, 05/15/13 | 129,822 | ||||||
Aon Corp., | ||||||||
| 40,000 | 3.125%, 05/27/16 | 40,454 | ||||||
| 23,000 | 3.500%, 09/30/15 | 23,602 | ||||||
| 18,000 | 6.250%, 09/30/40 | 22,162 | ||||||
| 300,000 | ASIF Global Financing XIX, 4.900%, 01/17/13 (e) | 302,506 | ||||||
| PRINCIPAL AMOUNT($) | SECURITY DESCRIPTION | VALUE($) | ||||||
Insurance — Continued | ||||||||
Berkshire Hathaway Finance Corp., | ||||||||
| 33,000 | 2.450%, 12/15/15 | 34,213 | ||||||
| 50,000 | 5.400%, 05/15/18 | 58,311 | ||||||
| 100,000 | 5.750%, 01/15/40 | 118,649 | ||||||
| 75,000 | CNA Financial Corp., 5.875%, 08/15/20 | 77,044 | ||||||
| 200,000 | Jackson National Life Global Funding, 6.125%, 05/30/12 (e) | 203,750 | ||||||
| 20,000 | Lincoln National Corp., 4.850%, 06/24/21 | 20,375 | ||||||
Metropolitan Life Global Funding I, | ||||||||
| 220,000 | 2.500%, 01/11/13 (e) | 222,665 | ||||||
| 175,000 | 3.650%, 06/14/18 (e) | 181,650 | ||||||
| 100,000 | 5.200%, 09/18/13 (e) | 106,029 | ||||||
| 75,000 | Nationwide Mutual Insurance Co., 9.375%, 08/15/39 (e) | 90,634 | ||||||
| 250,000 | New York Life Global Funding, 5.375%, 09/15/13 (e) | 266,687 | ||||||
| 100,000 | Pacific Life Global Funding, 5.000%, 05/15/17 (e) | 106,078 | ||||||
| 300,000 | Principal Life Global Funding I, 6.250%, 02/15/12 (e) | 301,735 | ||||||
Principal Life Income Funding Trusts, | ||||||||
| 35,000 | 5.100%, 04/15/14 | 36,971 | ||||||
| 80,000 | 5.300%, 04/24/13 | 83,934 | ||||||
| 150,000 | Prudential Insurance Co. of America (The), 8.300%, 07/01/25 (e) | 191,904 | ||||||
| 25,000 | Travelers Cos., Inc. (The), 5.800%, 05/15/18 | 29,386 | ||||||
|
| |||||||
| 2,801,950 | ||||||||
|
| |||||||
Real Estate Investment Trusts (REITs) — 0.3% |
| |||||||
CommonWealth REIT, | ||||||||
| 75,000 | 5.875%, 09/15/20 | 75,510 | ||||||
| 100,000 | 6.650%, 01/15/18 | 106,926 | ||||||
| 92,000 | HCP, Inc., 5.375%, 02/01/21 | 96,451 | ||||||
Simon Property Group LP, | ||||||||
| 8,000 | 4.200%, 02/01/15 | 8,483 | ||||||
| 20,000 | 4.375%, 03/01/21 | 21,163 | ||||||
| 50,000 | 5.625%, 08/15/14 | 54,550 | ||||||
| 50,000 | 5.650%, 02/01/20 | 57,303 | ||||||
| 45,000 | 6.100%, 05/01/16 | 51,149 | ||||||
| 30,000 | 6.750%, 05/15/14 | 33,037 | ||||||
| 102,000 | WEA Finance LLC/WT Finance Ltd., 6.750%, 09/02/19 (e) | 113,765 | ||||||
|
| |||||||
| 618,337 | ||||||||
|
| |||||||
SEE NOTES TO FINANCIAL STATEMENTS.
| DECEMBER 31, 2011 | JPMORGAN INSURANCE TRUST | 17 | ||||||
Table of Contents
JPMorgan Insurance Trust Core Bond Portfolio
SCHEDULE OF PORTFOLIO INVESTMENTS
AS OF DECEMBER 31, 2011 (continued)
| PRINCIPAL AMOUNT($) | SECURITY DESCRIPTION | VALUE($) | ||||||
| Corporate Bonds — Continued |
| ||||||
Thrifts & Mortgage Finance — 0.1% | ||||||||
| 75,000 | Countrywide Financial Corp., 6.250%, 05/15/16 | 70,660 | ||||||
| 250,000 | Stadshypotek AB, (Sweden), 1.450%, 09/30/13 (e) | 249,561 | ||||||
|
| |||||||
| 320,221 | ||||||||
|
| |||||||
Total Financials | 19,530,460 | |||||||
|
| |||||||
Health Care — 0.2% | ||||||||
Biotechnology — 0.1% | ||||||||
Amgen, Inc., | ||||||||
| 25,000 | 4.500%, 03/15/20 | 26,306 | ||||||
| 100,000 | 5.150%, 11/15/41 | 103,668 | ||||||
| 40,000 | 5.700%, 02/01/19 | 44,984 | ||||||
| 82,000 | 5.750%, 03/15/40 | 89,346 | ||||||
|
| |||||||
| 264,304 | ||||||||
|
| |||||||
Health Care Equipment & Supplies — 0.0% (g) |
| |||||||
| 10,000 | Baxter International, Inc., 4.000%, 03/01/14 | 10,647 | ||||||
|
| |||||||
Health Care Providers & Services — 0.0% (g) |
| |||||||
| 30,000 | Medco Health Solutions, Inc., 2.750%, 09/15/15 | 30,170 | ||||||
WellPoint, Inc., | ||||||||
| 13,000 | 5.875%, 06/15/17 | 14,979 | ||||||
| 9,000 | 7.000%, 02/15/19 | 10,859 | ||||||
|
| |||||||
| 56,008 | ||||||||
|
| |||||||
Pharmaceuticals — 0.1% | ||||||||
| 35,000 | AstraZeneca plc, (United Kingdom), 5.400%, 06/01/14 | 38,733 | ||||||
| 50,000 | GlaxoSmithKline Capital, Inc., 4.375%, 04/15/14 | 54,112 | ||||||
| 80,000 | Novartis Capital Corp., 4.125%, 02/10/14 | 85,594 | ||||||
|
| |||||||
| 178,439 | ||||||||
|
| |||||||
Total Health Care | 509,398 | |||||||
|
| |||||||
Industrials — 0.8% | ||||||||
Aerospace & Defense — 0.1% | ||||||||
| 51,000 | BAE Systems plc, (United Kingdom), 5.800%, 10/11/41 (e) | 52,360 | ||||||
Lockheed Martin Corp., | ||||||||
| 33,000 | 2.125%, 09/15/16 | 33,054 | ||||||
| 30,000 | 4.850%, 09/15/41 | 30,405 | ||||||
| 100,000 | United Technologies Corp., 6.125%, 02/01/19 | 123,568 | ||||||
|
| |||||||
| 239,387 | ||||||||
|
| |||||||
| PRINCIPAL AMOUNT($) | SECURITY DESCRIPTION | VALUE($) | ||||||
Airlines — 0.1% | ||||||||
| 31,953 | American Airlines 2011-1 Class A Pass-Through Trust, 5.250%, 01/31/21 | 29,716 | ||||||
| 35,000 | American Airlines 2011-2 Class A Pass-Through Trust, 8.625%, 10/15/21 | 35,700 | ||||||
| 52,427 | Delta Air Lines 2010-2 Class A Pass-Through Trust, 4.950%, 05/23/19 | 53,082 | ||||||
|
| |||||||
| 118,498 | ||||||||
|
| |||||||
Commercial Services & Supplies — 0.1% | ||||||||
| 55,000 | Allied Waste North America, Inc., 6.875%, 06/01/17 | 58,162 | ||||||
| 43,000 | Waste Management, Inc., 4.750%, 06/30/20 | 47,173 | ||||||
|
| |||||||
| 105,335 | ||||||||
|
| |||||||
Construction & Engineering — 0.0% (g) | ||||||||
| 44,000 | Fluor Corp., 3.375%, 09/15/21 | 44,552 | ||||||
|
| |||||||
Industrial Conglomerates — 0.2% | ||||||||
| 44,000 | Danaher Corp., 3.900%, 06/23/21 | 48,576 | ||||||
General Electric Co., | ||||||||
| 250,000 | 5.000%, 02/01/13 | 260,524 | ||||||
| 65,000 | 5.250%, 12/06/17 | 74,604 | ||||||
| 22,000 | Koninklijke Philips Electronics N.V., (Netherlands), 5.750%, 03/11/18 | 25,200 | ||||||
| 50,000 | Tyco International Finance S.A., (Luxembourg), 8.500%, 01/15/19 | 64,404 | ||||||
| 30,000 | Tyco International Ltd./Tyco International Finance S.A., (Switzerland), 7.000%, 12/15/19 | 36,967 | ||||||
|
| |||||||
| 510,275 | ||||||||
|
| |||||||
Machinery — 0.0% (g) | ||||||||
| 25,000 | Parker Hannifin Corp., 5.500%, 05/15/18 | 29,398 | ||||||
|
| |||||||
Road & Rail — 0.3% | ||||||||
Burlington Northern Santa Fe LLC, | ||||||||
| 25,000 | 3.600%, 09/01/20 | 25,898 | ||||||
| 75,000 | 5.400%, 06/01/41 | 86,701 | ||||||
| 100,000 | 5.650%, 05/01/17 | 115,405 | ||||||
| 85,000 | 5.750%, 05/01/40 | 101,695 | ||||||
CSX Corp., | ||||||||
| 33,000 | 4.250%, 06/01/21 | 35,261 | ||||||
| 50,000 | 5.500%, 04/15/41 | 56,635 | ||||||
| 25,000 | 7.375%, 02/01/19 | 31,160 | ||||||
| 78,000 | Norfolk Southern Corp., 6.000%, 05/23/11† | 90,543 | ||||||
| 35,000 | Ryder System, Inc., 3.600%, 03/01/16 | 36,108 | ||||||
SEE NOTES TO FINANCIAL STATEMENTS.
| 18 | JPMORGAN INSURANCE TRUST | DECEMBER 31, 2011 | ||||
Table of Contents
| PRINCIPAL AMOUNT($) | SECURITY DESCRIPTION | VALUE($) | ||||||
| Corporate Bonds — Continued |
| ||||||
Road & Rail — Continued | ||||||||
| 35,000 | United Parcel Service of America, Inc., 8.375%, 04/01/20 | 49,513 | ||||||
|
| |||||||
| 628,919 | ||||||||
|
| |||||||
Total Industrials | 1,676,364 | |||||||
|
| |||||||
Information Technology — 0.8% | ||||||||
Communications Equipment — 0.1% | ||||||||
Cisco Systems, Inc., | ||||||||
| 80,000 | 5.500%, 02/22/16 | 93,099 | ||||||
| 75,000 | 5.900%, 02/15/39 | 93,901 | ||||||
|
| |||||||
| 187,000 | ||||||||
|
| |||||||
Computers & Peripherals — 0.3% | ||||||||
Dell, Inc., | ||||||||
| 128,000 | 3.100%, 04/01/16 | 135,366 | ||||||
| 25,000 | 7.100%, 04/15/28 | 31,397 | ||||||
Hewlett-Packard Co., | ||||||||
| 50,000 | 4.300%, 06/01/21 | 51,271 | ||||||
| 75,000 | 4.750%, 06/02/14 | 79,204 | ||||||
| 200,000 | 6.000%, 09/15/41 | 221,325 | ||||||
International Business Machines Corp., | ||||||||
| 50,000 | 6.220%, 08/01/27 | 65,064 | ||||||
| 100,000 | 8.000%, 10/15/38 | 162,708 | ||||||
|
| |||||||
| 746,335 | ||||||||
|
| |||||||
Electronic Equipment, Instruments & Components — 0.1% |
| |||||||
Arrow Electronics, Inc., | ||||||||
| 10,000 | 3.375%, 11/01/15 | 10,013 | ||||||
| 25,000 | 6.000%, 04/01/20 | 26,804 | ||||||
| 85,000 | 6.875%, 07/01/13 | 91,385 | ||||||
|
| |||||||
| 128,202 | ||||||||
|
| |||||||
IT Services — 0.0% (g) | ||||||||
| 50,000 | HP Enterprise Services LLC, 7.450%, 10/15/29 | 62,315 | ||||||
|
| |||||||
Office Electronics — 0.1% | ||||||||
Pitney Bowes, Inc., | ||||||||
| 75,000 | 4.875%, 08/15/14 | 79,749 | ||||||
| 80,000 | 5.000%, 03/15/15 | 84,619 | ||||||
Xerox Corp., | ||||||||
| 17,000 | 4.500%, 05/15/21 | 17,229 | ||||||
| 35,000 | 5.625%, 12/15/19 | 38,233 | ||||||
| 50,000 | 6.750%, 02/01/17 | 57,274 | ||||||
|
| |||||||
| 277,104 | ||||||||
|
| |||||||
Semiconductors & Semiconductor Equipment — 0.1% |
| |||||||
| 110,000 | National Semiconductor Corp., 6.600%, 06/15/17 | 135,110 | ||||||
|
| |||||||
| PRINCIPAL AMOUNT($) | SECURITY DESCRIPTION | VALUE($) | ||||||
Software — 0.1% | ||||||||
| 75,000 | Microsoft Corp., 1.625%, 09/25/15 | 77,160 | ||||||
Oracle Corp., | ||||||||
| 50,000 | 5.250%, 01/15/16 | 57,735 | ||||||
| 50,000 | 5.750%, 04/15/18 | 60,674 | ||||||
| 100,000 | 6.500%, 04/15/38 | 135,128 | ||||||
|
| |||||||
| 330,697 | ||||||||
|
| |||||||
Total Information Technology | 1,866,763 | |||||||
|
| |||||||
Materials — 0.4% | ||||||||
Chemicals — 0.3% | ||||||||
Dow Chemical Co. (The), | ||||||||
| 110,000 | 6.000%, 10/01/12 | 114,237 | ||||||
| 30,000 | 7.375%, 11/01/29 | 38,074 | ||||||
E.I. du Pont de Nemours & Co., | ||||||||
| 58,000 | 1.950%, 01/15/16 | 59,595 | ||||||
| 25,000 | 4.900%, 01/15/41 | 28,266 | ||||||
Mosaic Co. (The), | ||||||||
| 24,000 | 3.750%, 11/15/21 | 24,249 | ||||||
| 8,000 | 4.875%, 11/15/41 | 8,270 | ||||||
| 50,000 | Potash Corp. of Saskatchewan, Inc., (Canada), 4.875%, 03/01/13 | 52,284 | ||||||
PPG Industries, Inc., | ||||||||
| 14,000 | 5.500%, 11/15/40 | 16,214 | ||||||
| 50,000 | 9.000%, 05/01/21 | 69,899 | ||||||
| 90,000 | Praxair, Inc., 5.250%, 11/15/14 | 101,011 | ||||||
| 100,000 | Union Carbide Corp., 7.500%, 06/01/25 | 118,023 | ||||||
|
| |||||||
| 630,122 | ||||||||
|
| |||||||
Construction Materials — 0.0% (g) | ||||||||
| 18,000 | CRH America, Inc., 6.000%, 09/30/16 | 19,228 | ||||||
|
| |||||||
Metals & Mining — 0.1% | ||||||||
BHP Billiton Finance USA Ltd., (Australia), | ||||||||
| 40,000 | 5.400%, 03/29/17 | 46,387 | ||||||
| 80,000 | 6.500%, 04/01/19 | 98,845 | ||||||
Rio Tinto Finance USA Ltd., (Australia), | ||||||||
| 12,000 | 3.500%, 11/02/20 | 12,265 | ||||||
| 60,000 | 8.950%, 05/01/14 | 70,171 | ||||||
|
| |||||||
| 227,668 | ||||||||
|
| |||||||
Total Materials | 877,018 | |||||||
|
| |||||||
Telecommunication Services — 1.3% | ||||||||
Diversified Telecommunication Services — 1.2% |
| |||||||
| 7,000 | AT&T Corp., 8.000%, 11/15/31 | 9,888 | ||||||
AT&T, Inc., | ||||||||
| 205,000 | 5.350%, 09/01/40 | 230,605 | ||||||
| 100,000 | 5.500%, 02/01/18 | 115,753 | ||||||
SEE NOTES TO FINANCIAL STATEMENTS.
| DECEMBER 31, 2011 | JPMORGAN INSURANCE TRUST | 19 | ||||||
Table of Contents
JPMorgan Insurance Trust Core Bond Portfolio
SCHEDULE OF PORTFOLIO INVESTMENTS
AS OF DECEMBER 31, 2011 (continued)
| PRINCIPAL AMOUNT($) | SECURITY DESCRIPTION | VALUE($) | ||||||
| Corporate Bonds — Continued |
| ||||||
Diversified Telecommunication Services — Continued |
| |||||||
| 70,000 | 5.600%, 05/15/18 | 81,337 | ||||||
| 70,000 | 5.800%, 02/15/19 | 82,602 | ||||||
| 45,000 | 6.300%, 01/15/38 | 55,248 | ||||||
| 145,000 | BellSouth Corp., 5.200%, 09/15/14 | 160,297 | ||||||
| 185,484 | BellSouth Telecommunications, Inc., 6.300%, 12/15/15 | 196,964 | ||||||
| 50,000 | Centel Capital Corp., 9.000%, 10/15/19 | 56,318 | ||||||
CenturyLink, Inc., | ||||||||
| 90,000 | 6.450%, 06/15/21 | 90,166 | ||||||
| 60,000 | 7.600%, 09/15/39 | 58,876 | ||||||
| 70,000 | Deutsche Telekom International Finance B.V., (Netherlands), 8.750%, 06/15/30 | 97,644 | ||||||
| 35,000 | France Telecom S.A., (France), 2.750%, 09/14/16 | 35,094 | ||||||
| 200,000 | GTE Corp., 6.840%, 04/15/18 | 239,564 | ||||||
Telecom Italia Capital S.A., (Luxembourg), | ||||||||
| 50,000 | 4.950%, 09/30/14 | 46,410 | ||||||
| 130,000 | 5.250%, 11/15/13 | 124,876 | ||||||
Telefonica Emisiones S.A.U., (Spain), | ||||||||
| 19,000 | 5.462%, 02/16/21 | 18,131 | ||||||
| 100,000 | 5.855%, 02/04/13 | 101,676 | ||||||
| 25,000 | 5.877%, 07/15/19 | 24,707 | ||||||
| 90,000 | Verizon Communications, Inc., 6.400%, 02/15/38 | 114,246 | ||||||
| 200,000 | Verizon Global Funding Corp., 7.750%, 12/01/30 | 278,543 | ||||||
| 150,000 | Verizon Maryland, Inc., 7.150%, 05/01/23 | 159,941 | ||||||
| 100,000 | Verizon Pennsylvania, Inc., 8.350%, 12/15/30 | 124,882 | ||||||
| 100,000 | Verizon Virginia, Inc., 4.625%, 03/15/13 | 104,117 | ||||||
|
| |||||||
| 2,607,885 | ||||||||
|
| |||||||
Wireless Telecommunication Services — 0.1% |
| |||||||
| 40,000 | Crown Castle Towers LLC, 3.214%, 08/15/15 (e) | 40,447 | ||||||
Rogers Communications, Inc., (Canada), | ||||||||
| 70,000 | 6.375%, 03/01/14 | 77,184 | ||||||
| 50,000 | 6.800%, 08/15/18 | 60,907 | ||||||
| 50,000 | Vodafone Group plc, (United Kingdom), 5.000%, 09/15/15 | 55,815 | ||||||
|
| |||||||
| 234,353 | ||||||||
|
| |||||||
Total Telecommunication Services | 2,842,238 | |||||||
|
| |||||||
Utilities — 1.4% | ||||||||
Electric Utilities — 1.1% | ||||||||
| 62,000 | Alabama Power Co., 6.125%, 05/15/38 | 82,553 | ||||||
| PRINCIPAL AMOUNT($) | SECURITY DESCRIPTION | VALUE($) | ||||||
Electric Utilities — Continued | ||||||||
Carolina Power & Light Co., | ||||||||
| 100,000 | 5.125%, 09/15/13 | 107,185 | ||||||
| 25,000 | 5.300%, 01/15/19 | 29,271 | ||||||
| 100,000 | CenterPoint Energy Houston Electric LLC, 5.750%, 01/15/14 | 109,180 | ||||||
| 40,000 | Columbus Southern Power Co., 6.050%, 05/01/18 | 47,047 | ||||||
| 38,000 | Consolidated Edison Co. of New York, Inc., 5.700%, 06/15/40 | 47,676 | ||||||
Duke Energy Carolinas LLC, | ||||||||
| 39,000 | 4.300%, 06/15/20 | 43,926 | ||||||
| 75,000 | 5.100%, 04/15/18 | 87,342 | ||||||
| 75,000 | 5.625%, 11/30/12 | 78,152 | ||||||
| 75,000 | 6.250%, 01/15/12 | 75,154 | ||||||
| 60,000 | Duke Energy Indiana, Inc., 6.350%, 08/15/38 | 79,220 | ||||||
Exelon Generation Co. LLC, | ||||||||
| 78,000 | 4.000%, 10/01/20 | 80,183 | ||||||
| 29,000 | 5.750%, 10/01/41 | 33,367 | ||||||
Florida Power & Light Co., | ||||||||
| 55,000 | 5.950%, 10/01/33 | 70,343 | ||||||
| 30,000 | 5.950%, 02/01/38 | 39,335 | ||||||
| 25,000 | Georgia Power Co., 5.950%, 02/01/39 | 32,209 | ||||||
| 18,000 | Great Plains Energy, Inc., 4.850%, 06/01/21 | 18,868 | ||||||
| 50,000 | Kansas City Power & Light Co., 5.300%, 10/01/41 | 53,817 | ||||||
| 40,000 | Niagara Mohawk Power Corp., 4.881%, 08/15/19 (e) | 44,731 | ||||||
| 25,000 | Northern States Power Co., 6.250%, 06/01/36 | 34,617 | ||||||
Oncor Electric Delivery Co. LLC, | ||||||||
| 15,000 | 5.950%, 09/01/13 | 16,050 | ||||||
| 30,000 | 6.800%, 09/01/18 | 36,483 | ||||||
Pacific Gas & Electric Co., | ||||||||
| 24,000 | 4.500%, 12/15/41 | 24,541 | ||||||
| 75,000 | 5.625%, 11/30/17 | 88,750 | ||||||
| 75,000 | Potomac Electric Power Co., 6.500%, 11/15/37 | 101,118 | ||||||
| 35,000 | Progress Energy, Inc., 4.400%, 01/15/21 | 38,580 | ||||||
| 37,000 | PSEG Power LLC, 5.125%, 04/15/20 | 41,505 | ||||||
| 18,000 | Public Service Co. of Colorado, 3.200%, 11/15/20 | 18,672 | ||||||
| 175,000 | Public Service Co. of Oklahoma, 6.625%, 11/15/37 | 223,119 | ||||||
Public Service Electric & Gas Co., | ||||||||
| 28,000 | 5.375%, 11/01/39 | 34,622 | ||||||
SEE NOTES TO FINANCIAL STATEMENTS.
| 20 | JPMORGAN INSURANCE TRUST | DECEMBER 31, 2011 | ||||
Table of Contents
| PRINCIPAL AMOUNT($) | SECURITY DESCRIPTION | VALUE($) | ||||||
| Corporate Bonds — Continued |
| ||||||
Electric Utilities — Continued | ||||||||
| 25,000 | 6.330%, 11/01/13 | 27,331 | ||||||
| 50,000 | Southwestern Public Service Co., 8.750%, 12/01/18 | 68,292 | ||||||
Spectra Energy Capital LLC, | ||||||||
| 45,000 | 7.500%, 09/15/38 | 58,553 | ||||||
| 50,000 | 8.000%, 10/01/19 | 62,921 | ||||||
Virginia Electric and Power Co., | ||||||||
| 140,000 | 5.100%, 11/30/12 | 145,419 | ||||||
| 50,000 | 5.400%, 04/30/18 | 59,644 | ||||||
| 70,000 | 5.950%, 09/15/17 | 84,239 | ||||||
| 70,000 | 6.350%, 11/30/37 | 93,433 | ||||||
|
| |||||||
| 2,417,448 | ||||||||
|
| |||||||
Gas Utilities — 0.2% | ||||||||
AGL Capital Corp., | ||||||||
| 37,000 | 3.500%, 09/15/21 | 37,020 | ||||||
| 30,000 | 4.450%, 04/15/13 | 31,012 | ||||||
| 96,000 | 5.875%, 03/15/41 | 113,570 | ||||||
| 25,000 | CenterPoint Energy Resources Corp., 6.125%, 11/01/17 | 28,659 | ||||||
| 100,000 | NGPL PipeCo LLC, 7.119%, 12/15/17 (e) | 98,718 | ||||||
TransCanada PipeLines Ltd., (Canada), | ||||||||
| 50,000 | 4.000%, 06/15/13 | 52,034 | ||||||
| 50,000 | 6.500%, 08/15/18 | 61,188 | ||||||
| 50,000 | 7.125%, 01/15/19 | 63,813 | ||||||
|
| |||||||
| 486,014 | ||||||||
|
| |||||||
Multi-Utilities — 0.1% | ||||||||
| 75,000 | KCP&L Greater Missouri Operations Co., 11.875%, 07/01/12 | 78,759 | ||||||
Sempra Energy, | ||||||||
| 100,000 | 6.500%, 06/01/16 | 116,650 | ||||||
| 40,000 | 8.900%, 11/15/13 | 45,101 | ||||||
|
| |||||||
| 240,510 | ||||||||
|
| |||||||
Water Utilities — 0.0% (g) | ||||||||
| 100,000 | American Water Capital Corp., 6.085%, 10/15/17 | 116,324 | ||||||
|
| |||||||
Total Utilities | 3,260,296 | |||||||
|
| |||||||
Total Corporate Bonds | 36,093,595 | |||||||
|
| |||||||
| Foreign Government Securities — 0.2% |
| ||||||
Province of Ontario, (Canada), | ||||||||
| 75,000 | 2.700%, 06/16/15 | 78,552 | ||||||
| 200,000 | 2.950%, 02/05/15 | 210,621 | ||||||
| 100,000 | United Mexican States, (Mexico), 6.625%, 03/03/15 | 113,500 | ||||||
|
| |||||||
Total Foreign Government Securities (Cost $375,838) | 402,673 | |||||||
|
| |||||||
| PRINCIPAL AMOUNT($) | SECURITY DESCRIPTION | VALUE($) | ||||||
| Mortgage Pass-Through Securities — 5.4% |
| ||||||
Federal Home Loan Mortgage Corp., | ||||||||
| 99,253 | ARM, 2.248%, 01/01/27 | 104,634 | ||||||
| 153,900 | ARM, 2.334%, 03/01/35 | 161,669 | ||||||
| 30,360 | ARM, 2.377%, 04/01/30 | 32,042 | ||||||
| 171,891 | ARM, 2.500%, 04/01/34 | 180,814 | ||||||
| 77,495 | ARM, 5.974%, 01/01/37 | 84,209 | ||||||
Federal Home Loan Mortgage Corp. Gold Pools, 15 Year, Single Family, | ||||||||
| 47,398 | 4.500%, 08/01/18 | 51,181 | ||||||
| 61,252 | 5.000%, 12/01/13 - 04/01/14 | 64,078 | ||||||
| 15,817 | 5.500%, 03/01/14 | 17,124 | ||||||
| 5,022 | 6.000%, 04/01/14 | 5,446 | ||||||
| 229,001 | 6.500%, 06/01/14 - 02/01/19 | 250,804 | ||||||
| 32,891 | 7.000%, 01/01/17 | 33,504 | ||||||
| 2,040 | 8.500%, 11/01/15 | 2,047 | ||||||
Federal Home Loan Mortgage Corp. Gold Pools, 20 Year, Single Family, | ||||||||
| 51,202 | 6.000%, 12/01/22 | 56,252 | ||||||
| 95,791 | 6.500%, 11/01/22 | 106,886 | ||||||
Federal Home Loan Mortgage Corp. Gold Pools, 30 Year, Single Family, | ||||||||
| 174,181 | 5.500%, 10/01/33 | 193,320 | ||||||
| 472,481 | 6.000%, 04/01/26 - 02/01/39 | 520,123 | ||||||
| 557,638 | 6.500%, 11/01/25 - 11/01/34 | 637,078 | ||||||
| 111,725 | 7.000%, 04/01/35 | 128,262 | ||||||
| 8,340 | 8.500%, 07/01/28 | 10,082 | ||||||
| 127,899 | Federal Home Loan Mortgage Corp. Gold Pool, Other, 7.000%, 07/01/29 | 141,142 | ||||||
Federal Home Loan Mortgage Corp., 30 Year, Single Family, | ||||||||
| 33,455 | 10.000%, 01/01/20 - 09/01/20 | 39,440 | ||||||
| 1,217 | 12.000%, 07/01/19 | 1,364 | ||||||
Federal National Mortgage Association, | ||||||||
| 2,720 | ARM, 1.947%, 03/01/19 | 2,760 | ||||||
| 494,750 | ARM, 2.046%, 01/01/35 | 519,987 | ||||||
| 36,670 | ARM, 2.291%, 04/01/34 | 38,696 | ||||||
| 159,466 | ARM, 2.348%, 08/01/34 | 167,779 | ||||||
| 135,182 | ARM, 2.358%, 07/01/33 | 142,267 | ||||||
| 154,342 | ARM, 2.409%, 10/01/34 | 162,539 | ||||||
| 111,831 | ARM, 2.464%, 04/01/33 | 117,819 | ||||||
| 110,972 | ARM, 2.470%, 05/01/35 | 117,104 | ||||||
| 101,855 | ARM, 2.543%, 01/01/34 | 107,386 | ||||||
| 7,405 | ARM, 3.914%, 03/01/29 | 7,881 | ||||||
Federal National Mortgage Association, 15 Year, Single Family, | ||||||||
| 199,491 | 3.500%, 09/01/18 - 05/01/19 | 209,834 | ||||||
| 37,421 | 4.000%, 07/01/18 | 39,806 | ||||||
SEE NOTES TO FINANCIAL STATEMENTS.
| DECEMBER 31, 2011 | JPMORGAN INSURANCE TRUST | 21 | ||||||
Table of Contents
JPMorgan Insurance Trust Core Bond Portfolio
SCHEDULE OF PORTFOLIO INVESTMENTS
AS OF DECEMBER 31, 2011 (continued)
| PRINCIPAL AMOUNT($) | SECURITY DESCRIPTION | VALUE($) | ||||||
| Mortgage Pass-Through Securities — Continued |
| ||||||
| 242,704 | 4.500%, 03/01/23 - 05/01/23 | 258,966 | ||||||
| 30,361 | 5.000%, 06/01/18 | 33,105 | ||||||
| 239,758 | 5.500%, 04/01/22 | 260,334 | ||||||
| 252,457 | 6.000%, 04/01/13 - 09/01/22 | 273,458 | ||||||
| 82,989 | 6.500%, 05/01/13 - 08/01/20 | 90,733 | ||||||
| 18,824 | 8.000%, 11/01/12 - 01/01/16 | 19,752 | ||||||
Federal National Mortgage Association, 20 Year, Single Family, | ||||||||
| 108,951 | 4.500%, 01/01/25 | 118,090 | ||||||
| 647,574 | 5.000%, 11/01/23 | 709,622 | ||||||
| 170,317 | 6.500%, 03/01/19 - 12/01/22 | 189,591 | ||||||
Federal National Mortgage Association, 30 Year, FHA/VA, | ||||||||
| 59,105 | 8.500%, 10/01/26 - 06/01/30 | 64,330 | ||||||
| 85,973 | 9.000%, 04/01/25 | 103,065 | ||||||
Federal National Mortgage Association, 30 Year, Single Family, | ||||||||
| 297,660 | 3.000%, 09/01/31 | 301,073 | ||||||
| 354,671 | 4.500%, 04/01/38 - 05/01/39 | 377,717 | ||||||
| 328,584 | 5.000%, 09/01/35 | 355,242 | ||||||
| 156,594 | 5.500%, 01/01/38 - 06/01/38 | 170,644 | ||||||
| 197,950 | 6.000%, 01/01/29 - 03/01/33 | 221,327 | ||||||
| 887,794 | 6.500%, 09/01/25 - 11/01/36 | 1,000,946 | ||||||
| 4,162 | 7.000%, 08/01/32 | 4,833 | ||||||
| 46,438 | 7.500%, 03/01/30 - 08/01/30 | 50,712 | ||||||
| 147,857 | 8.000%, 03/01/27 - 11/01/28 | 177,486 | ||||||
Federal National Mortgage Association, Other, | ||||||||
| 490,752 | 4.130%, 07/01/20 | 537,893 | ||||||
| 362,168 | 5.500%, 09/01/33 - 04/01/38 | 390,769 | ||||||
| 134,272 | 6.000%, 09/01/28 | 149,269 | ||||||
| 220,737 | 6.500%, 10/01/35 | 245,629 | ||||||
| 12,379 | 7.500%, 02/01/13 | 12,657 | ||||||
Government National Mortgage Association II, 30 Year, Single Family, | ||||||||
| 4,955 | 7.500%, 12/20/26 | 5,862 | ||||||
| 97,214 | 8.000%, 11/20/26 - 01/20/27 | 116,366 | ||||||
| 3,299 | 8.500%, 05/20/25 | 3,983 | ||||||
Government National Mortgage Association II, Other, | ||||||||
| 596,309 | ARM, 2.125%, 07/20/34 - 09/20/34 | 617,576 | ||||||
| 14,902 | Government National Mortgage Association, 15 Year, Single Family, 8.000%, 01/15/16 | 16,171 | ||||||
Government National Mortgage Association, 30 Year, Single Family, | ||||||||
| 204,079 | 6.000%, 05/15/37 - 10/15/38 | 231,426 | ||||||
| PRINCIPAL AMOUNT($) | SECURITY DESCRIPTION | VALUE($) | ||||||
| 212,737 | 6.500%, 03/15/28 - 12/15/38 | 242,577 | ||||||
| 44,239 | 7.000%, 12/15/25 - 06/15/33 | 51,723 | ||||||
| 22,941 | 7.500%, 05/15/23 - 09/15/28 | 26,202 | ||||||
| 27,131 | 8.000%, 09/15/22 - 10/15/27 | 32,391 | ||||||
| 8,414 | 9.000%, 11/15/24 | 9,845 | ||||||
| 261,437 | 9.500%, 10/15/24 | 313,351 | ||||||
|
| |||||||
Total Mortgage Pass-Through Securities | 12,240,075 | |||||||
|
| |||||||
| Municipal Bonds — 0.2% |
| ||||||
Illinois — 0.1% |
| |||||||
| 160,000 | State of Illinois, Taxable Pension, Series 2003, GO, 5.100%, 06/01/33 | 146,029 | ||||||
|
| |||||||
New York — 0.1% |
| |||||||
| 30,000 | New York State Dormitory Authority, Build America Bonds, Series D, Rev., 5.600%, 03/15/40 | 35,837 | ||||||
| 130,000 | Port Authority of New York & New Jersey, Taxable Construction 164th, Rev., 5.647%, 11/01/40 | 147,310 | ||||||
|
| |||||||
| 183,147 | ||||||||
|
| |||||||
Ohio — 0.0% (g) |
| |||||||
| 98,000 | Ohio State University, General Receipts, Series A, Rev., 4.800%, 06/01/11† | 102,211 | ||||||
|
| |||||||
Total Municipal Bonds | 431,387 | |||||||
|
| |||||||
| Supranational — 0.0% (g) |
| ||||||
| 50,000 | Corp. Andina de Fomento, 5.200%, 05/21/13 (Cost $49,964) | 52,306 | ||||||
|
| |||||||
| U.S. Government Agency Securities — 11.7% |
| ||||||
Federal Home Loan Mortgage Corp., | ||||||||
| 30,000 | 4.875%, 06/13/18 | 36,148 | ||||||
| 125,000 | 5.125%, 10/18/16 | 147,799 | ||||||
Federal National Mortgage Association, | ||||||||
| 3,000,000 | Zero Coupon, 10/09/19 | 2,306,595 | ||||||
| 195,000 | 2.750%, 03/13/14 | 204,334 | ||||||
| 150,000 | 4.875%, 12/15/16 | 176,680 | ||||||
| 6,000,000 | Federal National Mortgage Association Interest STRIPS, 09/23/20 | 4,852,998 | ||||||
| 630,000 | Federal National Mortgage Association Principal STRIPS, 03/23/28 | 365,607 | ||||||
Financing Corp., Principal STRIPS, | ||||||||
| 2,000,000 | 11/02/18 | 1,757,202 | ||||||
| 8,000,000 | 12/06/18 | 6,856,496 | ||||||
| 100,000 | 09/26/19 | 84,899 | ||||||
| 4,000,000 | Residual Funding Corp. Principal STRIPS, 07/15/20 | 3,334,104 | ||||||
SEE NOTES TO FINANCIAL STATEMENTS.
| 22 | JPMORGAN INSURANCE TRUST | DECEMBER 31, 2011 | ||||
Table of Contents
| PRINCIPAL AMOUNT($) | SECURITY DESCRIPTION | VALUE($) | ||||||
| U.S. Government Agency Securities — Continued |
| ||||||
| 2,000,000 | Resolution Funding Corp. Interest STRIPS, 01/15/20 | 1,693,964 | ||||||
| 33,000 | Tennessee Valley Authority, 4.625%, 09/15/60 | 39,403 | ||||||
| 5,000,000 | Tennessee Valley Authority STRIPS, 07/15/16 | 4,683,625 | ||||||
|
| |||||||
Total U.S. Government Agency Securities (Cost $20,122,145) | 26,539,854 | |||||||
|
| |||||||
| U.S. Treasury Obligations — 19.2% |
| ||||||
U.S. Treasury Bonds, | ||||||||
| 415,000 | 4.375%, 02/15/38 | 536,517 | ||||||
| 50,000 | 4.500%, 02/15/36 | 65,430 | ||||||
| 75,000 | 4.500%, 05/15/38 | 98,836 | ||||||
| 50,000 | 4.750%, 02/15/37 | 67,914 | ||||||
| 230,000 | 5.000%, 05/15/37 | 323,617 | ||||||
| 50,000 | 5.375%, 02/15/31 | 71,266 | ||||||
| 50,000 | 6.250%, 05/15/30 | 77,328 | ||||||
| 10,000 | 6.375%, 08/15/27 | 15,158 | ||||||
| 150,000 | 6.750%, 08/15/26 | 231,633 | ||||||
| 80,000 | 7.250%, 08/15/22 | 121,087 | ||||||
| 250,000 | 8.000%, 11/15/21 | 390,742 | ||||||
U.S. Treasury Bonds STRIPS, | ||||||||
| 600,000 | 11/15/14 | 593,126 | ||||||
| 1,750,000 | 02/15/15 | 1,722,654 | ||||||
| 500,000 | 05/15/15 | 490,856 | ||||||
| 180,000 | 08/15/15 | 176,247 | ||||||
| 4,715,000 | 11/15/15 | 4,599,497 | ||||||
| 3,300,000 | 02/15/16 (m) | 3,203,993 | ||||||
| 1,615,000 | 05/15/16 | 1,561,498 | ||||||
| 1,925,000 | 08/15/16 | 1,850,735 | ||||||
| 3,050,000 | 11/15/16 | 2,915,617 | ||||||
| 825,000 | 02/15/17 | 784,347 | ||||||
| 3,625,000 | 08/15/17 | 3,405,336 | ||||||
| 2,900,000 | 11/15/17 | 2,707,127 | ||||||
| 150,000 | 02/15/18 | 139,135 | ||||||
| 280,000 | 02/15/19 | 252,114 | ||||||
| 100,000 | 05/15/19 | 89,346 | ||||||
| 400,000 | 08/15/19 | 354,504 | ||||||
| 1,903,000 | 05/15/20 | 1,640,415 | ||||||
| 350,000 | 08/15/20 | 299,345 | ||||||
| 100,000 | 08/15/21 | 82,495 | ||||||
| 300,000 | 11/15/21 | 244,930 | ||||||
| 10,000 | 11/15/24 | 7,228 | ||||||
| 100,000 | 05/15/26 | 68,058 | ||||||
| 50,000 | 08/15/26 | 33,702 | ||||||
| 250,000 | 11/15/26 | 166,924 | ||||||
| PRINCIPAL AMOUNT($) | SECURITY DESCRIPTION | VALUE($) | ||||||
| 400,000 | 02/15/27 | 264,540 | ||||||
| 175,000 | 05/15/27 | 114,652 | ||||||
| 200,000 | 11/15/27 | 128,544 | ||||||
| 50,000 | 08/15/28 | 31,299 | ||||||
| 100,000 | 11/15/28 | 62,051 | ||||||
| 250,000 | 08/15/29 | 151,080 | ||||||
| 100,000 | 11/15/29 | 59,912 | ||||||
| 725,000 | 02/15/30 | 430,453 | ||||||
| 50,000 | 08/15/30 | 29,236 | ||||||
| 50,000 | 11/15/30 | 28,958 | ||||||
| 75,000 | 05/15/31 | 42,666 | ||||||
| 400,000 | 11/15/32 | 215,688 | ||||||
| 325,000 | 05/15/33 | 172,056 | ||||||
| 100,000 | 08/15/33 | 52,453 | ||||||
| 200,000 | 11/15/33 | 103,946 | ||||||
| 225,000 | 02/15/34 | 115,790 | ||||||
| 100,000 | 05/15/34 | 50,982 | ||||||
| 50,000 | 02/15/35 | 24,783 | ||||||
U.S. Treasury Inflation Indexed Bonds, | ||||||||
| 100,000 | 2.500%, 01/15/29 | 140,697 | ||||||
| 300,000 | 3.625%, 04/15/28 | 624,447 | ||||||
| 170,000 | U.S. Treasury Inflation Indexed Note, 1.375%, 07/15/18 | 202,096 | ||||||
U.S. Treasury Notes, | ||||||||
| 125,000 | 1.375%, 11/30/18 | 125,430 | ||||||
| 150,000 | 1.750%, 10/31/18 | 154,383 | ||||||
| 400,000 | 2.250%, 07/31/18 | 425,438 | ||||||
| 742,000 | 3.125%, 05/15/19 | 831,967 | ||||||
| 200,000 | 3.250%, 12/31/16 | 223,312 | ||||||
| 500,000 | 4.750%, 08/15/17 | 602,031 | ||||||
| 10,000,000 | U.S. Treasury Principal STRIPS, 05/15/20 | 8,703,880 | ||||||
|
| |||||||
Total U.S. Treasury Obligations (Cost $36,516,615) | 43,501,527 | |||||||
|
| |||||||
| SHARES | ||||||||
| Short-Term Investment — 2.4% |
| ||||||
Investment Company — 2.4% |
| |||||||
| 5,449,573 | JPMorgan Liquid Assets Money Market Fund, Institutional Class Shares, 0.110% (b) (l) (Cost $5,449,573) | 5,449,573 | ||||||
|
| |||||||
Total Investments — 101.0% | 229,176,123 | |||||||
Liabilities in Excess of Other Assets — (1.0)% | (2,236,788 | ) | ||||||
|
| |||||||
NET ASSETS — 100.0% | $ | 226,939,335 | ||||||
|
| |||||||
Percentages indicated are based on net assets.
SEE NOTES TO FINANCIAL STATEMENTS.
| DECEMBER 31, 2011 | JPMORGAN INSURANCE TRUST | 23 | ||||||
Table of Contents
JPMorgan Insurance Trust Core Bond Portfolio
NOTES TO SCHEDULE OF PORTFOLIO INVESTMENTS
AS OF DECEMBER 31, 2011
| ARM | — Adjustable Rate Mortgage | |
| CMO | — Collateralized Mortgage Obligation | |
| ESOP | — Employee Stock Ownership Program | |
| FHA | — Federal Housing Administration | |
| GMAC | — General Motors Acceptance Corp. | |
| GO | — General Obligation | |
| HB | — High Coupon Bonds (a.k.a. “IOettes”) represent the right to receive interest payments on an underlying pool of mortgages with similar features as those associated with IO securities. Unlike IO’s the owner also has a right to receive a very small portion of principal. The high interest rates result from taking interest payments from other classes in the Real Estate Mortgage Investment Conduit trust and allocating them to the small principal of the HB class. | |
| IF | — Inverse Floaters represent securities that pay interest at a rate that increases (decreases) with a decline (incline) in a specified index. The interest rate shown is the rate in effect as of December 31, 2011. The rate may be subject to a cap and floor. | |
| IO | — Interest Only represents the right to receive the monthly interest payments on an underlying pool of mortgage loans. The principal amount shown represents the par value on the underlying pool. The yields on these securities are subject to accelerated principal paydowns as a result of prepayment or refinancing of the underlying pool of mortgage instruments. As a result, interest income may be reduced considerably. | |
| PO | — Principal Only represents the right to receive the principal portion only on an underlying pool of mortgage loans. The market value of these securities is extremely volatile in response to changes in market interest rates. As prepayments on the underlying mortgages of these securities increase, the yield on these securities increases. | |
| REMICS | — Real Estate Mortgage Investment Conduits | |
| Rev. | — Revenue Bond | |
| STRIPS | — Separate Trading of Registered Interest and Principal of Securities. The STRIPS Program lets investors hold and trade individual interest and principal components of eligible notes and bonds as separate securities. | |
| SUB | — Step-Up Bond. The interest rate shown is the rate in effect as of December 31, 2011. |
| VA | — Veterans Administration | |
| VAR | — Variable Rate Security. The interest rate shown is the rate in effect as of December 31, 2011. | |
| (~) | — Securities are guaranteed by the Federal Deposit Insurance Corporation (FDIC) under its Temporary Liquidity Guarantee Program (TLGP). Under this program, the FDIC guarantees, with the full faith and credit of the U.S. government, the payment of principal and interest. The expiration of the FDIC’s guarantee is the earlier of the maturity date of the debt or June 30, 2012. | |
| (b) | — Investment in affiliate. Money market fund registered under the Investment Company Act of 1940, as amended, and advised by J.P. Morgan Investment Management Inc. | |
| (d) | — Defaulted Security. | |
| (e) | — Security is exempt from registration under Rule 144A of the Securities Act of 1933, as amended. Unless otherwise indicated, this security has been determined to be liquid under procedures established by the Board of Trustees and may be resold in transactions exempt from registration, normally to qualified institutional buyers. | |
| (f) | — Security is fair valued in accordance with procedures established by and under the supervision and responsibility of the Board of Trustees. The portfolio owns fair valued securities with a value of approximately $699,294 which amounts to 0.3% of total investments. | |
| (g) | — Amount rounds to less than 0.1%. | |
| (i) | — Security has been deemed illiquid pursuant to procedures approved by the Board of Trustees and may be difficult to sell. | |
| (l) | — The rate shown is the current yield as of December 31, 2011. | |
| (m) | — All or a portion of this security is reserved and/or pledged with the custodian for current or potential holdings of futures, swaps, options, TBAs, when-issued securities, delayed delivery securities, reverse repurchase agreements, unfunded commitments and/or forward foreign currency exchange contracts. | |
| † | — Security matures in 2111. | |
| # | — The Portfolio is not currently able to sell this security due to ongoing resolution of issues with the Lehman bankruptcy and therefore the security is deemed to be illiquid. | |
SEE NOTES TO FINANCIAL STATEMENTS.
| 24 | JPMORGAN INSURANCE TRUST | DECEMBER 31, 2011 | ||||
Table of Contents
THIS PAGE IS INTENTIONALLY LEFT BLANK
| DECEMBER 31, 2011 | JPMORGAN INSURANCE TRUST | 25 | ||||||
Table of Contents
STATEMENT OF ASSETS AND LIABILITIES
AS OF DECEMBER 31, 2011
| Core Bond Portfolio | ||||
ASSETS: | ||||
Investments in non-affiliates, at value | $ | 223,726,550 | ||
Investments in affiliates, at value | 5,449,573 | |||
|
| |||
Total investment securities, at value | 229,176,123 | |||
Cash | 17,212 | |||
Receivables: | ||||
Investment securities sold | 10,616 | |||
Portfolio shares sold | 60,544 | |||
Interest from non-affiliates | 1,076,180 | |||
Dividends from affiliates | 371 | |||
Other assets (See Note 8) | 20,163 | |||
|
| |||
Total Assets | 230,361,209 | |||
|
| |||
LIABILITIES: | ||||
Payables: | ||||
Portfolio shares redeemed | 3,175,624 | |||
Accrued liabilities: | ||||
Investment advisory fees | 77,802 | |||
Administration fees | 17,224 | |||
Distribution fees | 218 | |||
Custodian and accounting fees | 28,178 | |||
Trustees’ and Chief Compliance Officer’s fees | 427 | |||
Other (See Note 8) | 122,401 | |||
|
| |||
Total Liabilities | 3,421,874 | |||
|
| |||
Net Assets | $ | 226,939,335 | ||
|
| |||
SEE NOTES TO FINANCIAL STATEMENTS.
| 26 | JPMORGAN INSURANCE TRUST | DECEMBER 31, 2011 | ||||
Table of Contents
| Core Bond Portfolio | ||||
NET ASSETS: | ||||
Paid in capital | $ | 200,885,945 | ||
Accumulated undistributed net investment income | 11,277,317 | |||
Accumulated net realized gains (losses) | (6,228,804 | ) | ||
Net unrealized appreciation (depreciation) | 21,004,877 | |||
|
| |||
Total Net Assets | $ | 226,939,335 | ||
|
| |||
Net Assets: | ||||
Class 1 | $ | 225,138,765 | ||
Class 2 | 1,800,570 | |||
|
| |||
Total | $ | 226,939,335 | ||
|
| |||
Outstanding units of beneficial interest (shares) | ||||
(unlimited number of shares authorized, no par value): | ||||
Class 1 | 19,225,630 | |||
Class 2 | 154,148 | |||
Net Asset Value, offering and redemption price per share (a): | ||||
Class 1 | $ | 11.71 | ||
Class 2 | 11.68 | |||
|
| |||
Cost of investments in non-affiliates | $ | 202,721,673 | ||
Cost of investments in affiliates | 5,449,573 | |||
| (a) | Per share amounts may not recalculate due to rounding of net assets and/or shares outstanding. |
SEE NOTES TO FINANCIAL STATEMENTS.
| DECEMBER 31, 2011 | JPMORGAN INSURANCE TRUST | 27 | ||||||
Table of Contents
STATEMENT OF OPERATIONS
FOR THE YEAR ENDED DECEMBER 31, 2011
| Core Bond Portfolio | ||||
INVESTMENT INCOME: | ||||
Interest income from non-affiliates | $ | 12,711,946 | ||
Dividend income from affiliates | 3,246 | |||
|
| |||
Total investment income | 12,715,192 | |||
|
| |||
EXPENSES: | ||||
Investment advisory fees | 953,440 | |||
Administration fees | 211,020 | |||
Distribution fees — Class 2 | 283 | |||
Custodian and accounting fees | 127,818 | |||
Interest expense to affiliates | 73 | |||
Professional fees | 66,206 | |||
Trustees’ and Chief Compliance Officer’s fees | 2,376 | |||
Printing and mailing costs | 57,875 | |||
Transfer agent fees | 4,103 | |||
Other | 28,374 | |||
|
| |||
Total expenses | 1,451,568 | |||
|
| |||
Less amounts waived | (39,730 | ) | ||
Less earnings credits | (4 | ) | ||
|
| |||
Net expenses | 1,411,834 | |||
|
| |||
Net investment income (loss) | 11,303,358 | |||
|
| |||
REALIZED/UNREALIZED GAINS (LOSSES): | ||||
Net realized gain (loss) on transactions from investments in non-affiliates | 1,102,720 | |||
|
| |||
Change in net unrealized appreciation (depreciation) of investments in non-affiliates | 4,832,982 | |||
|
| |||
Net realized/unrealized gains (losses) | 5,935,702 | |||
|
| |||
Change in net assets resulting from operations | $ | 17,239,060 | ||
|
| |||
SEE NOTES TO FINANCIAL STATEMENTS.
| 28 | JPMORGAN INSURANCE TRUST | DECEMBER 31, 2011 | ||||
Table of Contents
STATEMENTS OF CHANGES IN NET ASSETS
FOR THE PERIODS INDICATED
| Core Bond Portfolio | ||||||||
| Year Ended 12/31/2011 | Year Ended 12/31/2010 | |||||||
CHANGE IN NET ASSETS RESULTING FROM OPERATIONS: | ||||||||
Net investment income (loss) | $ | 11,303,358 | $ | 13,325,369 | ||||
Net realized gain (loss) | 1,102,720 | 923,828 | ||||||
Change in net unrealized appreciation (depreciation) | 4,832,982 | 9,276,930 | ||||||
|
|
|
| |||||
Change in net assets resulting from operations | 17,239,060 | 23,526,127 | ||||||
|
|
|
| |||||
DISTRIBUTIONS TO SHAREHOLDERS: | ||||||||
Class 1 | ||||||||
From net investment income | (13,335,748 | ) | (10,410,679 | ) | ||||
Class 2 | ||||||||
From net investment income | (1,059 | ) | (689 | ) | ||||
|
|
|
| |||||
Total distributions to shareholders | (13,336,807 | ) | (10,411,368 | ) | ||||
|
|
|
| |||||
CAPITAL TRANSACTIONS: | ||||||||
Change in net assets from capital transactions | (22,659,824 | ) | (30,994,509 | ) | ||||
|
|
|
| |||||
NET ASSETS: | ||||||||
Change in net assets | (18,757,571 | ) | (17,879,750 | ) | ||||
Beginning of period | 245,696,906 | 263,576,656 | ||||||
|
|
|
| |||||
End of period | $ | 226,939,335 | $ | 245,696,906 | ||||
|
|
|
| |||||
Accumulated undistributed net investment income | $ | 11,277,317 | $ | 13,310,190 | ||||
|
|
|
| |||||
SEE NOTES TO FINANCIAL STATEMENTS.
| DECEMBER 31, 2011 | JPMORGAN INSURANCE TRUST | 29 | ||||||
Table of Contents
STATEMENTS OF CHANGES IN NET ASSETS
FOR THE PERIODS INDICATED (continued)
| Core Bond Portfolio | ||||||||
| Year Ended 12/31/2011 | Year Ended 12/31/2010 | |||||||
CAPITAL TRANSACTIONS: | ||||||||
Class 1 | ||||||||
Proceeds from shares issued | $ | 29,889,689 | $ | 26,030,552 | ||||
Dividends and distributions reinvested | 13,335,748 | 10,410,679 | ||||||
Cost of shares redeemed | (67,660,013 | ) | (67,436,429 | ) | ||||
|
|
|
| |||||
Change in net assets from Class 1 capital transactions | $ | (24,434,576 | ) | $ | (30,995,198 | ) | ||
|
|
|
| |||||
Class 2 | ||||||||
Proceeds from shares issued | 1,773,774 | — | ||||||
Dividends and distributions reinvested | 1,059 | 689 | ||||||
Cost of shares redeemed | (81 | ) | — | |||||
|
|
|
| |||||
Change in net assets from Class 2 capital transactions | $ | 1,774,752 | $ | 689 | ||||
|
|
|
| |||||
Total change in net assets from capital transactions | $ | (22,659,824 | ) | $ | (30,994,509 | ) | ||
|
|
|
| |||||
SHARE TRANSACTIONS: | ||||||||
Class 1 | ||||||||
Issued | 2,599,514 | 2,294,097 | ||||||
Reinvested | 1,213,444 | 957,744 | ||||||
Redeemed | (5,883,615 | ) | (5,939,474 | ) | ||||
|
|
|
| |||||
Change in Class 1 Shares | (2,070,657 | ) | (2,687,633 | ) | ||||
|
|
|
| |||||
Class 2 | ||||||||
Issued | 152,351 | — | ||||||
Reinvested | 97 | 63 | ||||||
Redeemed | (7 | ) | — | |||||
|
|
|
| |||||
Change in Class 2 Shares | 152,441 | 63 | ||||||
|
|
|
| |||||
SEE NOTES TO FINANCIAL STATEMENTS.
| 30 | JPMORGAN INSURANCE TRUST | DECEMBER 31, 2011 | ||||
Table of Contents
THIS PAGE IS INTENTIONALLY LEFT BLANK
| DECEMBER 31, 2011 | JPMORGAN INSURANCE TRUST | 31 | ||||||
Table of Contents
FOR THE PERIODS INDICATED
| Per share operating performance | ||||||||||||||||||||
| Investment operations | Distributions | |||||||||||||||||||
| Net asset value, beginning of period | Net investment income (loss) | Net realized and unrealized gains (losses) on investments | Total from investment operations | Net investment income | ||||||||||||||||
Core Bond Portfolio | ||||||||||||||||||||
Class 1 | ||||||||||||||||||||
Year Ended December 31, 2011 | $ | 11.54 | $ | 0.54 | (c) | $ | 0.28 | $ | 0.82 | $ | (0.65 | ) | ||||||||
Year Ended December 31, 2010 | 10.99 | 0.57 | (c) | 0.42 | 0.99 | (0.44 | ) | |||||||||||||
Year Ended December 31, 2009 | 10.94 | 0.61 | (c) | 0.38 | 0.99 | (0.94 | ) | |||||||||||||
Year Ended December 31, 2008 | 11.41 | 0.56 | (c) | (0.41 | ) | 0.15 | (0.62 | ) | ||||||||||||
Year Ended December 31, 2007 | 11.30 | 0.51 | (c) | 0.17 | 0.68 | (0.57 | ) | |||||||||||||
Class 2 | ||||||||||||||||||||
Year Ended December 31, 2011 | 11.51 | 0.50 | (c) | 0.29 | 0.79 | (0.62 | ) | |||||||||||||
Year Ended December 31, 2010 | 10.97 | 0.54 | (c) | 0.42 | 0.96 | (0.42 | ) | |||||||||||||
Year Ended December 31, 2009 | 10.92 | 0.59 | (c) | 0.37 | 0.96 | (0.91 | ) | |||||||||||||
Year Ended December 31, 2008 | 11.38 | 0.54 | (c) | (0.41 | ) | 0.13 | (0.59 | ) | ||||||||||||
Year Ended December 31, 2007 | 11.29 | 0.49 | (c) | 0.16 | 0.65 | (0.56 | ) | |||||||||||||
| (a) | Includes adjustments in accordance with accounting principles generally accepted in the United States of America and as such, the net asset value for financial reporting purposes and the returns based upon those net asset values may differ from the net asset value and returns for shareholder transactions. |
| (b) | Includes earnings credits and interest expense, each of which is less than 0.01%, if applicable or unless otherwise noted. |
| (c) | Calculated based upon average shares outstanding. |
SEE NOTES TO FINANCIAL STATEMENTS.
| 32 | JPMORGAN INSURANCE TRUST | DECEMBER 31, 2011 | ||||
Table of Contents
| Ratios/Supplemental data | |||||||||||||||||||||||||
| Ratios to average net assets | ||||||||||||||||||||||||||
| Net asset value, end of period | Total return (a) | Net assets, end of period | Net expenses (b) | Net investment income (loss) | Expenses without | Portfolio turnover rate | ||||||||||||||||||||
| $ | 11.71 | 7.46 | % | $ | 225,138,765 | 0.59 | % | 4.74 | % | 0.61 | % | 9 | % | |||||||||||||
| 11.54 | 9.24 | 245,677,262 | 0.60 | 5.06 | 0.62 | 10 | ||||||||||||||||||||
| 10.99 | 9.65 | 263,558,623 | 0.59 | 5.63 | 0.67 | 17 | ||||||||||||||||||||
| 10.94 | 1.31 | 145,805,357 | 0.60 | 5.04 | 0.63 | 3 | ||||||||||||||||||||
| 11.41 | 6.21 | 191,761,981 | 0.60 | 4.62 | 0.65 | 4 | ||||||||||||||||||||
| 11.68 | 7.21 | 1,800,570 | 0.84 | 4.33 | 0.84 | 9 | ||||||||||||||||||||
| 11.51 | 8.97 | 19,644 | 0.85 | 4.80 | 0.88 | 10 | ||||||||||||||||||||
| 10.97 | 9.32 | 18,033 | 0.84 | 5.47 | 0.92 | 17 | ||||||||||||||||||||
| 10.92 | 1.15 | 16,490 | 0.85 | 4.83 | 0.87 | 3 | ||||||||||||||||||||
| 11.38 | 5.93 | 16,391 | 0.85 | 4.36 | 0.91 | 4 | ||||||||||||||||||||
SEE NOTES TO FINANCIAL STATEMENTS.
| DECEMBER 31, 2011 | JPMORGAN INSURANCE TRUST | 33 | ||||||
Table of Contents
AS OF DECEMBER 31, 2011
1. Organization
JPMorgan Insurance Trust (the “Trust”) is registered under the Investment Company Act of 1940, as amended (the “1940 Act”), as an open-end management investment company and is a Massachusetts business trust.
The following is a separate Portfolio of the Trust (the “Portfolio”) covered by this report:
| Classes Offered | Diversified/Non-Diversified | |||
| Core Bond Portfolio | Class 1 and Class 2 | Diversified |
The investment objective of the Portfolio is to maximize total return by investing primarily in a diversified portfolio of intermediate- and long-term debt securities.
Portfolio shares are offered only to separate accounts of participating insurance companies and Eligible Plans. Individuals may not purchase shares directly from the Portfolio.
All classes of shares have equal rights as to earnings, assets and voting privileges except that each class may bear different distribution and service fees and each class has exclusive voting rights with respect to its distribution plan or administrative services plan.
2. Significant Accounting Policies
The following is a summary of significant accounting policies followed by the Trust in the preparation of its financial statements. The policies are in accordance with accounting principles generally accepted in the United States of America. The preparation of financial statements requires management to make estimates and assumptions that affect the reported amounts of assets and liabilities at the date of the financial statements and the reported amounts of income and expenses for the period. Actual results could differ from those estimates.
A. Valuation of Investments — Fixed income securities (other than certain short-term investments maturing in less than 61 days) are valued each day based on prices received from independent or affiliated pricing services approved by the Board of Trustees or third party broker-dealers. The broker-dealers or pricing services use multiple valuation techniques to determine fair value. In instances where sufficient market activity exists, the broker-dealers or pricing services may utilize a market-based approach through which quotes from market makers are used to determine fair value. In instances where sufficient market activity may not exist or is limited, the broker-dealers or pricing services also utilize proprietary valuation models which may consider market transactions in comparable securities and the various relationships between securities in determining value and/or market characteristics such as benchmark yield curves, option-adjusted spreads, credit spreads, estimated default rates, coupon-rates, anticipated timing of principal repayments, underlying collateral, and other unique security features in order to estimate the relevant cash flows, which are then discounted to calculate the fair values. Generally, short-term investments of sufficient credit quality maturing in less than 61 days are valued at amortized cost, which approximates market value. Certain investments of the Portfolio may, depending upon market conditions, trade in relatively thin markets and/or in markets that experience significant volatility. As a result of these conditions, the prices used by the Portfolio to value securities may differ from the value that would be realized if these securities were sold, and the differences could be material. Futures and options shall generally be valued on the basis of available market quotations. Swaps and other derivatives are valued daily, primarily using independent or affiliated pricing services approved by the Board of Trustees. If valuations are not available from such services or values received are deemed not representative of market value, values will be obtained from a third party broker-dealer or counterparty. Investments in other open-end investment companies are valued at such investment company’s net asset value per share as of the report date. Equity securities listed on a North American, Central American, South American or Caribbean securities exchange shall generally be valued at the last sale price on the exchange on which the security is principally traded that is reported before the time when the net assets of the Portfolio are valued. The value of securities listed on The NASDAQ Stock Market LLC shall generally be the NASDAQ Official Closing Price.
Securities or other assets for which market quotations are not readily available or for which market quotations do not represent the value at the time of pricing (including certain illiquid securities) are fair valued in accordance with procedures established by and under the supervision and responsibility of the Board of Trustees. Under these procedures, the Portfolio primarily employs a market-based approach which may use related or comparable assets or liabilities, recent transactions, market multiples, book values, and other relevant information for the investment to determine the fair value of the investment. The Portfolio may also use an income-based valuation approach in which the anticipated future cash flows of the investment are discounted to calculate fair value. Discounts may also be applied due to the nature or duration of any restrictions on the disposition of the investments. Valuations may be based upon current market prices of securities that are comparable in coupon, rating, maturity and industry. It is possible that the estimated values may differ significantly from the values that would have been used had a ready market for the investments existed, and such differences could be material. Trading in securities on most foreign exchanges and over-the-counter markets is normally completed before the close of the domestic market and may also take place on days when the domestic market is closed. In accordance with procedures adopted by the Board of Trustees, the Portfolio applies fair value pricing on equity securities on a daily basis, except for North American, Central American, South American and Caribbean equity securities held in its portfolio, by utilizing the quotations of an independent pricing service, unless the Portfolio’s advisor determines that use of another valuation methodology is appropriate. The pricing service uses statistical analyses and quantitative models to adjust local market prices using factors such as subsequent movement and changes in the prices of indices, securities and exchange rates in other markets, in determining fair value as of the time the Portfolio calculates its net asset values.
Valuations reflected in this report are as of the report date. As a result, changes in valuation due to market events and/or issuer related events after the report date and prior to issuance of the report are not reflected herein.
| 34 | JPMORGAN INSURANCE TRUST | DECEMBER 31, 2011 | ||||
Table of Contents
The various inputs that are used in determining the fair value of the Portfolio’s investments are summarized into the three broad levels listed below:
| Ÿ | Level 1 — quoted prices in active markets for identical securities |
| Ÿ | Level 2 — other significant observable inputs (including quoted prices for similar securities, interest rates, prepayment speeds, credit risk, etc.) |
| Ÿ | Level 3 — significant unobservable inputs (including the Portfolio’s own assumptions in determining the fair value of investments) |
A financial instrument’s level within the fair value hierarchy is based on the lowest level of any input both individually and in aggregate that is significant to the fair value measurement. The inputs or methodology used for valuing securities are not necessarily an indication of the risk associated with investing in those securities.
The following table represents each valuation input as presented on the Schedule of Portfolio Investments (“SOI”):
| Level 1 Quoted prices | Level 2 Other significant observable inputs | Level 3 Significant unobservable inputs | Total | |||||||||||||
Investments in Securities | ||||||||||||||||
Debt Securities | ||||||||||||||||
Asset-Backed Securities | $ | — | $ | 2,950,075 | $ | 216,362 | $ | 3,166,437 | ||||||||
Collateralized Mortgage Obligations | ||||||||||||||||
Agency | — | 73,061,651 | — | 73,061,651 | ||||||||||||
Non-Agency | — | 23,503,614 | 189,888 | 23,693,502 | ||||||||||||
|
|
|
|
|
|
|
| |||||||||
Total Collateralized Mortgage Obligations | — | 96,565,265 | 189,888 | 96,755,153 | ||||||||||||
|
|
|
|
|
|
|
| |||||||||
Commercial Mortgage-Backed Securities | — | 4,543,543 | — | 4,543,543 | ||||||||||||
Corporate Bonds | ||||||||||||||||
Consumer Discretionary | — | 2,973,491 | — | 2,973,491 | ||||||||||||
Consumer Staples | — | 1,437,433 | — | 1,437,433 | ||||||||||||
Energy | — | 1,120,134 | — | 1,120,134 | ||||||||||||
Financials | — | 19,237,416 | 293,044 | 19,530,460 | ||||||||||||
Health Care | — | 509,398 | — | 509,398 | ||||||||||||
Industrials | — | 1,676,364 | — | 1,676,364 | ||||||||||||
Information Technology | — | 1,866,763 | — | 1,866,763 | ||||||||||||
Materials | — | 877,018 | — | 877,018 | ||||||||||||
Telecommunication Services | — | 2,842,238 | — | 2,842,238 | ||||||||||||
Utilities | — | 3,260,296 | — | 3,260,296 | ||||||||||||
|
|
|
|
|
|
|
| |||||||||
Total Corporate Bonds | — | 35,800,551 | 293,044 | 36,093,595 | ||||||||||||
|
|
|
|
|
|
|
| |||||||||
Foreign Government Securities | — | 402,673 | — | 402,673 | ||||||||||||
Mortgage Pass-Through Securities | — | 12,240,075 | — | 12,240,075 | ||||||||||||
Municipal Bonds | — | 431,387 | — | 431,387 | ||||||||||||
Supranational | — | 52,306 | — | 52,306 | ||||||||||||
U.S. Government Agency Securities | — | 26,539,854 | — | 26,539,854 | ||||||||||||
U.S. Treasury Obligations | — | 43,501,527 | — | 43,501,527 | ||||||||||||
Short-Term Investment | ||||||||||||||||
Investment Company | 5,449,573 | — | — | 5,449,573 | ||||||||||||
|
|
|
|
|
|
|
| |||||||||
Total Investments in Securities | $ | 5,449,573 | $ | 223,027,256 | $ | 699,294 | $ | 229,176,123 | ||||||||
|
|
|
|
|
|
|
| |||||||||
There were no transfers between Levels 1 and 2 during the year ended December 31, 2011.
The following is a summary of investments for which significant unobservable inputs (Level 3) were used in determining fair value:
| Balance as of 12/31/10 | Realized gain (loss) | Change in unrealized appreciation (depreciation) | Net amortization (accretion) | Purchases (1) | Sales (2) | Transfers into Level 3 | Transfers out of Level 3 | Balance as of 12/31/11 | ||||||||||||||||||||||||||||
Investments in Securities | ||||||||||||||||||||||||||||||||||||
Asset-Backed Securities | $ | — | $ | 75 | $ | 450 | $ | 4 | $ | 249,375 | $ | (33,542 | ) | $ | — | $ | — | $ | 216,362 | |||||||||||||||||
Collateralized Mortgage Obligations — Agency | 195,154 | — | — | — | — | — | — | (195,154 | ) | — | ||||||||||||||||||||||||||
Collateralized Mortgage Obligations — Non-Agency | 47,898 | (115,898 | ) | 125,835 | 216 | 237,491 | (105,654 | ) | — | — | 189,888 | |||||||||||||||||||||||||
Corporate Bonds — Financials | 104,125 | — | 7,019 | — | — | — | 181,900 | — | 293,044 | |||||||||||||||||||||||||||
|
|
|
|
|
|
|
|
|
|
|
|
|
|
|
|
|
| |||||||||||||||||||
| $ | 347,177 | $ | (115,823 | ) | $ | 133,304 | $ | 220 | $ | 486,866 | $ | (139,196 | ) | $ | 181,900 | $ | (195,154 | ) | $ | 699,294 | ||||||||||||||||
|
|
|
|
|
|
|
|
|
|
|
|
|
|
|
|
|
| |||||||||||||||||||
| (1) | Purchases include all purchases of securities and securities received in corporate actions. |
| (2) | Sales include all sales of securities, maturities, paydowns and securities tendered in a corporate action. |
| DECEMBER 31, 2011 | JPMORGAN INSURANCE TRUST | 35 | ||||||
Table of Contents
NOTES TO FINANCIAL STATEMENTS
AS OF DECEMBER 31, 2011 (continued)
Transfers into and out of Level 3 are valued using values as of the beginning of the period.
Transfers from Level 2 to Level 3 or from Level 3 to Level 2 are due to a decline or an increase in market activity (e.g. frequency of trades), which resulted in a lack of or increase in available market inputs to determine price.
The change in unrealized appreciation (depreciation) attributable to securities owned at December 31, 2011, which were valued using significant unobservable inputs (Level 3) amounted to approximately $5,000. This amount is included in Change in net unrealized appreciation (depreciation) of investments in non-affiliates on the Statement of Operations.
B. Restricted and Illiquid Securities — Certain securities held by the Portfolio may be subject to legal or contractual restrictions on resale or are illiquid. Restricted securities generally may be resold in transactions exempt from registration under the Securities Act of 1933. An illiquid security is a security which cannot be disposed of promptly (within seven days) and in the usual course of business at approximately its fair value and includes, but is not limited to, repurchase agreements maturing in excess of seven days, time deposits with a withdrawal penalty, non-negotiable instruments and instruments for which no market exists. Disposal of these securities may involve time-consuming negotiations and expense. Prompt sale at the current valuation may be difficult and could adversely affect the net assets of the Portfolio.
The following is the value and percentage of net assets of illiquid securities as of December 31, 2011:
| Value | Percentage | |||||||
| $ | 699,294 | 0.3 | % | |||||
C. Security Transactions and Investment Income — Investment transactions are accounted for on the trade date (the date the order to buy or sell is executed). Securities gains and losses are calculated on a specifically identified cost basis. Interest income is determined on the basis of coupon interest accrued using the effective interest method adjusted for amortization of premiums and accretion of discounts. Dividend income less foreign taxes withheld, if any, is recorded on the ex-dividend date or when the Portfolio first learns of the dividend.
D. Allocation of Income and Expenses — In calculating the net asset value per share of each class, investment income, realized and unrealized gains and losses and expenses other than class specific expenses are allocated daily to each class of shares based upon the proportion of net assets of each class at the beginning of each day. Expenses directly attributable to a portfolio are charged directly to that portfolio while the expenses attributable to more than one portfolio of the Trust are allocated among the respective portfolios. Each class of shares bears its pro-rata portion of expenses attributable to the Portfolio, except that each class separately bears expenses related specifically to that class, such as distribution fees.
E. Federal Income Taxes — The Portfolio is treated as a separate taxable entity for Federal income tax purposes. The Portfolio’s policy is to comply with the provisions of the Internal Revenue Code of 1986, as amended (the “Code”), applicable to regulated investment companies and to distribute to shareholders all of its distributable net investment income and net realized gain on investments. Accordingly, no provision for Federal income tax is necessary. The Portfolio is also a segregated portfolio of assets for insurance purposes and intends to comply with the diversification requirements of Subchapter L of the Code. The Portfolio is not aware of any tax positions for which it is reasonably possible that the total amounts of unrecognized tax benefits or losses will significantly change in the next twelve months. However, the Portfolio’s conclusions may be subject to future review based on changes in, or the interpretation of, the accounting standards or tax laws and regulations. The Portfolio’s Federal tax returns for the prior three fiscal years remain subject to examination by the Internal Revenue Service.
F. Dividends and Distributions to Shareholders — Dividends from net investment income are generally declared and paid at least annually. Dividends are declared separately for each class. No class has preferential dividend rights; differences in per share rates are due to differences in separate class expenses. Net realized capital gains, if any, are distributed at least annually. The amount of dividends and distributions from net investment income and net realized capital gains is determined in accordance with Federal income tax regulations, which may differ from accounting principles generally accepted in the United States of America. To the extent these “book/tax” differences are permanent in nature (i.e., that they result from other than timing of recognition — “temporary differences”), such amounts are reclassified within the capital accounts based on their Federal tax-basis treatment.
The following amounts were reclassified within the capital accounts:
| Paid-in-Capital | Accumulated (Overdistributed) Net Investment Income | Accumulated Net Realized Gain (Loss) on Investments | ||||||||||
| $ | — | $ | 576 | $ | (576 | ) | ||||||
The reclassifications for the Portfolio relate primarily to consent fees.
3. Fees and Other Transactions with Affiliates
A. Investment Advisory Fee — Pursuant to the Investment Advisory Agreement, J.P. Morgan Investment Management Inc. (“JPMIM” or the “Advisor”) acts as the investment advisor to the Portfolio. JPMIM is a wholly-owned subsidiary of JPMorgan Asset Management Holdings Inc., which is a wholly-owned subsidiary of JPMorgan Chase & Co. (“JPMorgan”). JPMIM supervises the investments of the Portfolio and for such services is paid a fee. The fee is accrued daily and paid monthly based on the Portfolio’s average daily net assets at an annual fee rate of 0.40%.
| 36 | JPMORGAN INSURANCE TRUST | DECEMBER 31, 2011 | ||||
Table of Contents
The Advisor waived Investment Advisory fees and/or reimbursed expenses as outlined in Note 3.E.
B. Administration Fee — Pursuant to an Administration Agreement, JPMorgan Funds Management, Inc. (the “Administrator”), an indirect, wholly owned subsidiary of JPMorgan, provides certain administration services to the Portfolio. In consideration of these services, the Administrator receives a fee computed daily and paid monthly at the annual rate of 0.15% of the first $25 billion of the average daily net assets of all funds in the J.P. Morgan Funds Complex (excluding certain funds of funds and money market funds) and 0.075% of the average daily net assets in excess of $25 billion of all such funds. For the year ended December 31, 2011, the annual effective rate was 0.09% of the Portfolio’s average daily net assets.
JPMorgan Chase Bank, N.A (“JPMCB”), a wholly-owned subsidiary of JPMorgan, and successor in interest to J.P. Morgan Investor Services Co. (“JPMIS”) serves as the Portfolio’s sub-administrator (the “Sub-administrator”). For its services as Sub-administrator, JPMCB receives a portion of the fees payable to the Administrator.
C. Distribution Fees — Pursuant to a Distribution Agreement, JPMorgan Distribution Services, Inc. (the “Distributor”), a wholly-owned subsidiary of JPMorgan, serves as the Trust’s exclusive underwriter and promotes and arranges for the sale of the Portfolio’s shares.
The Board of Trustees has adopted a Distribution Plan (the “Distribution Plan”) for Class 2 Shares of the Portfolio in accordance with Rule 12b-1 under the 1940 Act. The Distribution Plan provides that the Portfolio shall pay distribution fees, including payments to the Distributor, at an annual rate of 0.25% of the average daily net assets of Class 2 Shares.
D. Custodian and Accounting Fees — JPMCB, an affiliate of the Portfolio, provides portfolio custody and accounting services for the Portfolio. The amounts paid directly to JPMCB by the Portfolio for custody and accounting services are included in Custodian and accounting fees in the Statement of Operations. The custodian fees may be reduced by credits earned by the Portfolio, based on uninvested cash balances held by the custodian. Such earnings credits are presented separately in the Statement of Operations.
Interest income, if any, earned on cash balances at the custodian, is included as Interest income from affiliates in the Statement of Operations.
Interest expense, if any, paid to the custodian related to cash overdrafts is included in Interest expense to affiliates in the Statement of Operations.
E. Waivers and Reimbursements — The Advisor and Administrator have contractually agreed to waive fees and/or reimburse the Portfolio to the extent that total annual operating expenses (excluding acquired fund fees and expenses, dividend expense related to short sales, interest, taxes, extraordinary expenses and expenses related to the Board of Trustees’ deferred compensation plan) exceed the percentages of the Portfolio’s average daily net assets as shown in the table below:
| Class 1 | Class 2 | |||||||
| 0.60 | % | 0.85 | % | |||||
The contractual expense limitation agreements were in effect for the year ended December 31, 2011. The contractual expense limitation percentages in the table above are in place until at least April 30, 2012.
For the year ended December 31, 2011, the Advisor contractually waived fees for the Portfolio in the amount of $33,836. The Advisor does not expect the Portfolio to repay any such waived fees in future years.
Additionally, the Portfolio may invest in one or more money market funds advised by the Advisor or its affiliates. The Advisor, Administrator and the Distributor waive fees in an amount sufficient to offset the respective fees each charges to the affiliated money market fund on the Portfolio’s investment in such affiliated money market fund. A portion of the waiver is voluntary.
The amount of waivers resulting from investments in the money market funds for the year ended December 31, 2011 was $5,894.
F. Other — Certain officers of the Trust are affiliated with the Advisor, the Administrator and the Distributor. Such officers, with the exception of the Chief Compliance Officer, receive no compensation from the Portfolio for serving in their respective roles.
The Board of Trustees appointed a Chief Compliance Officer to the Portfolio in accordance with federal securities regulations. The Portfolio, along with other affiliated portfolios, makes reimbursement payments, on a pro-rata basis, to the Administrator for a portion of the fees associated with the Office of the Chief Compliance Officer. Such fees are included in Trustees’ and Chief Compliance Officer’s fees in the Statement of Operations.
The Trust adopted a Trustee Deferred Compensation Plan (the “Plan”) which allows the Independent Trustees to defer the receipt of all or a portion of compensation related to performance of their duties as a Trustee. The deferred fees are invested in various J.P. Morgan Funds until distribution in accordance with the Plan.
During the year ended December 31, 2011, the Portfolio may have purchased securities from an underwriting syndicate in which the principal underwriter or members of the syndicate are affiliated with the Advisor.
The Portfolio may use related party broker/dealers. For the year ended December 31, 2011, the Portfolio did not incur any brokerage commissions with broker/dealers affiliated with the Advisor.
The Securities and Exchange Commission has granted an exemptive order permitting the Portfolio to engage in principal transactions with J.P. Morgan Securities, Inc., an affiliated broker, involving taxable money market instruments subject to certain conditions.
| DECEMBER 31, 2011 | JPMORGAN INSURANCE TRUST | 37 | ||||||
Table of Contents
NOTES TO FINANCIAL STATEMENTS
AS OF DECEMBER 31, 2011 (continued)
4. Investment Transactions
During the year ended December 31, 2011, purchases and sales of investments (excluding short-term investments) were as follows:
| Purchases (excluding U.S. Government) | Sales (excluding U.S. Government) | Purchases of U.S. Government | Sales of U.S. Government | |||||||||||||
| $ | 12,840,391 | $ | 36,904,501 | $ | 7,010,169 | $ | 9,473,115 | |||||||||
5. Federal Income Tax Matters
For Federal income tax purposes, the cost and unrealized appreciation (depreciation) in value of the investment securities at December 31, 2011, were as follows:
| Aggregate Cost | Gross Unrealized Appreciation | Gross Unrealized Depreciation | Net Unrealized Appreciation (Depreciation) | |||||||||||||
| $ | 208,173,713 | $ | 26,192,128 | $ | 5,189,718 | $ | 21,002,410 | |||||||||
The difference between book and tax basis appreciation (depreciation) on investments is primarily attributed to wash sales loss deferrals.
The tax character of distributions paid during the fiscal year ended December 31, 2011 was as follows:
| Total Distributions Paid From: | Total Distributions Paid | |||||||
| Ordinary Income | ||||||||
| $ | 13,336,807 | $ | 13,336,807 | |||||
The tax character of distributions paid during the fiscal year ended December 31, 2010 was as follows:
| Total Distributions Paid From: | Total Distributions Paid | |||||||
| Ordinary Income | ||||||||
| $ | 10,411,368 | $ | 10,411,368 | |||||
At December 31, 2011, the components of net assets (excluding paid in capital) on a tax basis were as follows:
| Current Distributable Ordinary Income | Current Distributable Long-Term Capital-Gain or (Tax Basis Capital Loss Carryover) | Unrealized Appreciation (Depreciation) | ||||||||||
| $ | 11,288,213 | $ | (6,220,591 | ) | $ | 21,002,410 | ||||||
The cumulative timing differences primarily consist of Trustee deferred compensation, straddle loss deferrals and wash sale loss deferrals.
Under the Regulated Investment Company Modernization Act of 2010 (the “Act”), net capital losses recognized by the Portfolio after December 31, 2010, may get carried forward indefinitely, and retain their character as short-term and/or long term losses. Prior to the Act, pre-enactment net capital losses incurred by the Portfolio were carried forward for eight years and treated as short-term losses. The Act requires that post-enactment net capital losses be used before pre-enactment net capital losses.
As of December 31, 2011, the Portfolio did not have post-enactment net capital loss carryforwards.
As of December 31, 2011, the Portfolio had the following pre-enactment net capital loss carryforwards expiring during the years indicated, which are available to offset future realized gains:
| 2015 | 2016 | Total | ||||||||||
| $ | 779,717 | $ | 5,440,874 | $ | 6,220,591 | * | ||||||
| * | The entire amount is comprised, of capital loss carryforwards from business combinations, which may be limited in future years under the Internal Revenues Code Section 381-384. |
During the year ended December 31, 2011, the Portfolio utilized capital loss carryforwards of $1,102,144.
| 38 | JPMORGAN INSURANCE TRUST | DECEMBER 31, 2011 | ||||
Table of Contents
6. Borrowings
The Trust and JPMCB have entered into a financing arrangement. Under this arrangement, JPMCB provides an unsecured, uncommitted credit facility in the aggregate amount of $100 million to certain of the J.P. Morgan Funds, including the Portfolio. Advances under the arrangement are taken primarily for temporary or emergency purposes, including the meeting of redemption requests that otherwise might require the untimely disposition of securities, and are subject to the Portfolio’s borrowing restrictions. Interest on borrowings is payable at a rate determined by JPMCB at the time of borrowing. This agreement has been extended until November 12, 2012.
The Portfolio had no borrowings outstanding from the unsecured, uncommitted credit facility at December 31, 2011, or at any time during the year then ended.
Interest expense paid, if any, as a result of borrowings from the unsecured, uncommitted credit facility is included in Interest expense to affiliates in the Statement of Operations.
7. Risks, Concentrations and Indemnifications
In the normal course of business, the Portfolio enters into contracts that contain a variety of representations which provide general indemnifications. The Portfolio’s maximum exposure under these arrangements is unknown, as this would involve future claims that may be made against the Portfolio that have not yet occurred. However, based on experience, the Portfolio expects the risk of loss to be remote.
From time to time, the Portfolio may have a concentration of several shareholders holding a significant percentage of shares outstanding. Investment activities of these shareholders could have a material impact on the Portfolio.
The Portfolio is subject to interest rate and credit risk. The value of debt securities may decline as interest rates increase. The Portfolio could lose money if the issuer of a fixed income security is unable to pay interest or repay principal when it is due. The ability of the issuers of debt to meet their obligations may be affected by the economic and political developments in a specific industry or region.
The Portfolio is also subject to counterparty credit risk, which is the risk that a counterparty fails to perform on agreements with the Portfolio such as swap and option contracts, credit-linked notes and TBA securities.
The Portfolio is subject to risks associated with securities with contractual cash flows including asset-backed and mortgage-related securities such as collateralized mortgage obligations, mortgage pass-through securities and commercial mortgage-backed securities, including securities backed by sub-prime mortgage loans. The value, liquidity and related income of these securities are sensitive to changes in economic conditions, including real estate value, prepayments, delinquencies and/or defaults, and may be adversely affected by shifts in the market’s perception of the issuers and changes in interest rates.
The Portfolio is subject to the risk that should the Portfolio decide to sell an illiquid investment when a ready buyer is not available at a price the Portfolio deems representative of its value, the value of the Portfolio’s net assets could be adversely affected.
8. Other
Lehman Brothers Holdings, Inc. (“Lehman”) filed for bankruptcy on September 15, 2008. As of December 31, 2011, the Portfolio has an outstanding receivable from a subsidiary of Lehman, Lehman Brothers Special Financing, Inc. (“LBSF”) of $20,163 included in Other assets in the Statement of Assets and Liabilities.
As of December 31, 2011, the Portfolio had an outstanding payable to a subsidiary of Lehman, Lehman Brothers, Inc., of $51,622, included in Other payable in the Statement of Assets and Liabilities.
| DECEMBER 31, 2011 | JPMORGAN INSURANCE TRUST | 39 | ||||||
Table of Contents
REPORT OF INDEPENDENT REGISTERED PUBLIC ACCOUNTING FIRM
To the Board of Trustees of JPMorgan Insurance Trust and Shareholders of JPMorgan Insurance Trust Core Bond Portfolio:
In our opinion, the accompanying statement of assets and liabilities, including the schedule of portfolio investments, and the related statements of operations and of changes in net assets and the financial highlights present fairly, in all material respects, the financial position of JPMorgan Insurance Trust Core Bond Portfolio (a separate Portfolio of JPMorgan Insurance Trust) (hereafter referred to as the “Portfolio”) at December 31, 2011, the results of its operations for the year then ended, the changes in its net assets for each of the two years in the period then ended and the financial highlights for each of the five years in the period then ended, in conformity with accounting principles generally accepted in the United States of America. These financial statements and financial highlights (hereafter referred to as “financial statements”) are the responsibility of the Portfolio’s management. Our responsibility is to express an opinion on these financial statements based on our audits. We conducted our audits of these financial statements in accordance with the standards of the Public Company Accounting Oversight Board (United States). Those standards require that we plan and perform the audit to obtain reasonable assurance about whether the financial statements are free of material misstatement. An audit includes examining, on a test basis, evidence supporting the amounts and disclosures in the financial statements, assessing the accounting principles used and significant estimates made by management, and evaluating the overall financial statement presentation. We believe that our audits, which included confirmation of securities at December 31, 2011 by correspondence with the custodian and brokers, provide a reasonable basis for our opinion.
PricewaterhouseCoopers LLP
New York, New York
February 23, 2012
| 40 | JPMORGAN INSURANCE TRUST | DECEMBER 31, 2011 | ||||
Table of Contents
(Unaudited)
The Portfolio’s Statement of Additional Information includes additional information about the Portfolio’s Trustees and is available, without charge, upon request by calling 1-800-480-4111 or on the J.P. Morgan Funds’ website at www.jpmorganfunds.com.
Name (Year of Birth); Positions With the Portfolio (1) | Principal Occupations During Past 5 Years | Number of Complex Overseen by Trustee (2) | Other Directorships Held Outside Fund Complex During Past 5 Years | |||
Independent Trustees | ||||||
William J. Armstrong (1941); Trustee of Trust since 2005; Trustee of heritage J.P. Morgan Funds since 1987. | Retired; CFO and Consultant, EduNeering, Inc. (internet business education supplier) | 154 | None. | |||
John F. Finn (1947); Trustee of Trust since 2005; Trustee of heritage One Group Mutual Funds since 1998. | Chairman (1985-present), President and Chief Executive Officer, Gardner, Inc. (supply chain management company serving industrial and consumer markets) (1974-present). | 154 | Director, Cardinal Health, Inc. (CAH) (1994-present); Director, Greif, Inc. (GEF) (industrial package products and services) (2007-present). | |||
Dr. Matthew Goldstein (1941); Trustee of Trust since 2005; Trustee of heritage J.P. Morgan Funds since 2003. | Chancellor, City University of New York | 154 | Director, New Plan Excel (NXL) | |||
Robert J. Higgins (1945); Trustee of Trust since 2005; Trustee of heritage J.P. Morgan Funds since 2002. | Retired; Director of Administration of the State of Rhode Island (2003-2004); President — Consumer Banking and Investment Services, Fleet Boston Financial (1971-2001). | 154 | None. | |||
Peter C. Marshall (1942); Trustee of Trust since 2005; Trustee of heritage One Group Mutual Funds since 1985. | Self-employed business consultant | 154 | Director, Center for Communication, Hearing, and Deafness (1990-present). | |||
Marilyn McCoy* (1948); Trustee of Trust since 2005; Trustee of heritage One Group Mutual Funds since 1999. | Vice President of Administration and Planning, Northwestern University (1985-present). | 154 | Trustee, Carleton College | |||
William G. Morton, Jr. (1937); Trustee of Trust since 2005; Trustee of heritage J.P. Morgan Funds since 2003. | Retired; Chairman Emeritus (2001-2002), and Chairman and Chief Executive Officer, Boston Stock Exchange (1985-2001). | 154 | Director, Radio Shack Corp. | |||
Robert A. Oden, Jr. (1946); Trustee of Trust since 2005; Trustee of heritage One Group Mutual Funds since 1997. | Retired; President, Carleton College | 154 | Trustee, American University in Cairo (1999-present); Trustee, Carleton College (2002-2010). | |||
Fergus Reid, III (1932); Trustee of Trust (Chairman) since 2005; Trustee (Chairman) of heritage J.P. Morgan Funds since 1987. | Chairman, Joe Pietryka, Inc. (formerly Lumelite Corporation) (plastics manufacturing) | 154 | Trustee, Morgan Stanley Funds | |||
| DECEMBER 31, 2011 | JPMORGAN INSURANCE TRUST | 41 | ||||||
Table of Contents
TRUSTEES
(Unaudited) (continued)
Name (Year of Birth); Positions With the Portfolio (1) | Principal Occupations During Past 5 Years | Number of Complex Overseen by Trustee (2) | Other Directorships Held Outside Fund Complex During Past 5 Years | |||
Independent Trustees (continued) | ||||||
| Frederick W. Ruebeck (1939); Trustee of Trust since 2005; Trustee of heritage One Group Mutual Funds since 1994. | Consultant (2000-present); Advisor, JP Greene & Associates, LLC (broker-dealer) (2000-2009); Chief Investment Officer, Wabash College (2004-present); Director of Investments, Eli Lilly and Company (pharmaceuticals) (1988-1999). | 154 | Trustee, Wabash College (1988-present); Chairman, Indianapolis Symphony Orchestra Foundation (1994-present). | |||
| James J. Schonbachler (1943); Trustee of Trust since 2005; Trustee of heritage J.P. Morgan Funds since 2001. | Retired; Managing Director of Bankers Trust Company (financial services) (1968-1998). | 154 | None. | |||
Interested Trustees | ||||||
| Frankie D. Hughes** (1952), Trustee of Trust since 2008. | President and Chief Investment Officer, Hughes Capital Management, Inc. (fixed income asset management) (1993-present). | 154 | Trustee, The Victory Portfolios (2000-2008). | |||
| Leonard M. Spalding, Jr.*** (1935); Trustee of Trust since 2005; Trustee of heritage J.P. Morgan Funds since 1998. | Retired; Chief Executive Officer, Chase Mutual Funds (investment company) (1989-1998); President and Chief Executive Officer, Vista Capital Management (investment management) (1990-1998); Chief Investment Executive, Chase Manhattan Private Bank (investment management) (1990-1998). | 154 | Director, Glenview Trust Company, LLC (2001-present); Trustee, St. Catharine College (1998-present); Trustee, Bellarmine University (2000-present); Director, Springfield-Washington County Economic Development Authority (1997-present); Trustee, Catholic Education Foundation (2005-present). | |||
| (1) | Each Trustee serves for an indefinite term, subject to the Trust’s current retirement policy, which is age 75 for all Trustees, except that the Board has determined Messrs. Reid and Spalding should continue to serve until December 31, 2012. |
| (2) | A Fund Complex means two or more registered investment companies that hold themselves out to investors as related companies for purposes of investment and investor services or have a common investment adviser or have an investment adviser that is an affiliated person of the investment adviser of any of the other registered investment companies. The J.P. Morgan Funds Complex for which the Board of Trustees serves currently includes eleven registered investment companies (154 funds). |
| * | Ms. McCoy has served as Vice President of Administration and Planning for Northwestern University since 1985. William M. Daley was the Head of Corporate Responsibility for JPMorgan Chase & Co. prior to January 2011 and served as a member of the Board of Trustees of Northwestern University from 2005 through 2010. JPMIM, the Funds’ investment advisor, is a wholly-owned subsidiary of JPMorgan Chase & Co. Three other members of the Board of Trustees of Northwestern University are executive officers of registered investment advisors (not affiliated with JPMorgan) that are under common control with subadvisors to certain J.P. Morgan Funds. |
| ** | Ms. Hughes is treated as an “interested person” based on the portfolio holdings of clients of Hughes Capital Management, Inc. |
| *** | Mr. Spalding is treated as an “interested person” due to his ownership of JPMorgan Chase stock. |
The contact address for each of the Trustees is 270 Park Avenue, New York, NY 10017.
| 42 | JPMORGAN INSURANCE TRUST | DECEMBER 31, 2011 | ||||
Table of Contents
(Unaudited)
Name (Year of Birth), Positions Held with the Trust (Since) | Principal Occupations During Past 5 Years | |
Patricia A. Maleski (1960), | Managing Director, J.P. Morgan Investment Management Inc. and Chief Administrative Officer, J.P. Morgan Funds and Institutional Pooled Vehicles since 2010; previously, Treasurer and Principal Financial Officer of the Trusts from 2008 to 2010; previously, Head of Funds Administration and Board Liaison, J.P. Morgan Funds prior to 2010. Ms. Maleski has been with JPMorgan Chase & Co. since 2001. | |
Joy C. Dowd (1972), | Assistant Treasurer of the Trusts from 2009 to 2010; Executive Director, JPMorgan Funds Management, Inc. from February 2011; Vice President, JPMorgan Funds Management, Inc. from December 2008 to February 2011; prior to joining JPMorgan Chase, Ms. Dowd worked in MetLife’s investments audit group from 2005 through 2008. | |
Frank J. Nasta (1964), | Managing Director and Associate General Counsel, JPMorgan Chase since 2008; Previously, Director, Managing Director, General Counsel and Corporate Secretary, J. & W. Seligman & Co. Incorporated; Secretary of each of the investment companies of the Seligman Group of Funds and Seligman Data Corp.; Director and Corporate Secretary, Seligman Advisors, Inc. and Seligman Services, Inc. | |
Stephen M. Ungerman (1953), | Managing Director, JPMorgan Chase & Co.; Mr. Ungerman has been with JPMorgan Chase & Co. since 2000. | |
Paul L. Gulinello (1950), | Vice President and Anti Money Laundering Compliance Officer for JPMorgan Asset Management Americas, additionally responsible for privacy, personal trading and Code of Ethics compliance since 2004. Mr. Gulinello has been with JPMorgan Chase & Co. since 1972. | |
Elizabeth A. Davin (1964), Assistant Secretary (2005)* | Vice President and Assistant General Counsel, JPMorgan Chase since 2005; Senior Counsel, JPMorgan Chase (formerly Bank One Corporation) from 2004 to 2005. | |
Jessica K. Ditullio (1962), | Executive Director and Assistant General Counsel, JPMorgan Chase since February 2011; Ms. Ditullio has served as an attorney with various titles for JPMorgan Chase (formerly Bank One Corporation) since 1990. | |
John T. Fitzgerald (1975), | Executive Director and Assistant General Counsel, JPMorgan Chase since February 2011; formerly, Vice President and Assistant General Counsel, JPMorgan Chase from 2005 until February 2011. | |
Carmine Lekstutis (1980) | Vice President and Assistant General Counsel, JPMorgan Chase since 2011; Associate, Skadden, Arps, Slate, Meagher & Flom LLP (law firm) from 2006 to 2011. | |
Gregory S. Samuels (1980) | Vice President and Assistant General Counsel, JPMorgan Chase since 2010; Associate, Ropes & Gray (law firm) from 2008 to 2010; Associate, Clifford Chance LLP (law firm) from 2005 to 2008. | |
Brian L. Duncan (1965), | Vice President, JPMorgan Funds Management, Inc. since June 2007; prior to joining JPMorgan Chase, Mr. Duncan worked for Penn Treaty American Corporation as Vice President and Controller from 2004 through 2007. | |
Jeffrey D. House (1972), | Vice President, JPMorgan Funds Management, Inc. since July 2006. | |
Laura S. Melman (1966), | Executive Director, JPMorgan Funds Management, Inc. since February 2011, responsible for Taxation; Vice President, JPMorgan Funds Management, Inc. from August 2006 to February 2011, responsible for Taxation. | |
Joseph Parascondola (1963), | Vice President, JPMorgan Funds Management, Inc. since August 2006. | |
Matthew J. Plastina (1970), | Vice President, JPMorgan Funds Management, Inc. since August 2010; prior to August 2010, Vice President and Controller, Legg Mason Global Asset Management. | |
Jeffery Reedy (1973), | Vice President, JPMorgan Funds Management, Inc. since February 2006. | |
The contact address for each of the officers, unless otherwise noted, is 270 Park Avenue, New York, NY 10017.
| * | The contact address for the officer is 1111 Polaris Parkway, Columbus, OH 43240. |
| DECEMBER 31, 2011 | JPMORGAN INSURANCE TRUST | 43 | ||||||
Table of Contents
SCHEDULE OF SHAREHOLDER EXPENSES
(Unaudited)
Hypothetical $1,000 Investment
As a shareholder of the Portfolio, you incur ongoing costs, including investment advisory fees, administration fees, distribution fees (for Class 2 Shares) and other Portfolio expenses. Because the Portfolio is a funding vehicle for Policies and Eligible Plans, you may also incur sales charges and other fees relating to the Policies or Eligible Plans. The examples below are intended to help you understand your ongoing costs (in dollars) of investing in the Portfolio, but not the costs of the Policies or Eligible Plans, and to compare these ongoing costs with the ongoing costs of investing in other mutual funds. The examples assume that you had a $1,000 investment in the Class at the beginning of the reporting period, July 1, 2011, and continued to hold your shares at the end of the reporting period, December 31, 2011.
Actual Expenses
For each Class of the Portfolio in the table below, the first line provides information about actual account values and actual expenses. You may use the information in this line, together with the amount you invested, to estimate the expenses that you paid over the period. Simply divide your account value by $1,000 (for example, an $8,600 account value divided by $1,000 = 8.6), then multiply the result by the number in the first line of each Class under the heading entitled “Expenses Paid During” to estimate the expenses you paid on your account during this period.
Hypothetical Example for Comparison Purposes
The second line of each Class in the table below provides information about hypothetical account values and hypothetical expenses based on the Class’ actual expense ratio and an assumed rate of return of 5% per year before expenses, which is not the Class’ actual return. The hypothetical account values and expenses may not be used to estimate the actual ending account balance or expenses you paid for the period. You may use this information to compare the ongoing costs of investing in the Class of the Portfolio and other portfolios. To do so, compare this 5% hypothetical example with the 5% hypothetical examples that appear in the shareholder reports of the other funds. Please note that the expenses shown in the table are meant to highlight your ongoing costs only and do not reflect any transaction costs, such as sales charges (loads) or redemption fees or the costs associated with the Policies and Eligible Plans through which the Portfolio is held. Therefore, the second line for each Class in the table is useful in comparing ongoing costs only, and will not help you determine the relative total costs of owning different portfolios. In addition, if these transaction costs were included, your costs would have been higher. The examples also assume all dividends and distributions have been reinvested.
Expense Example
| Beginning Account Value, July 1, 2011 | Ending Account Value December 31, 2011 | Expenses Paid During July 1, 2011 to December 31, 2011* | Annualized Expense Ratio | |||||||||||||
Core Bond Portfolio | ||||||||||||||||
Class 1 | ||||||||||||||||
Actual | $ | 1,000.00 | $ | 1,043.70 | $ | 3.04 | 0.59 | % | ||||||||
Hypothetical | 1,000.00 | 1,022.23 | 3.01 | 0.59 | ||||||||||||
Class 2 | ||||||||||||||||
Actual | 1,000.00 | 1,042.90 | 4.33 | 0.84 | ||||||||||||
Hypothetical | 1,000.00 | 1,020.97 | 4.28 | 0.84 | ||||||||||||
| * | Expenses are equal to the Portfolio’s annualized expense ratio, multiplied by the average account value over the period, multiplied by 184/365 (to reflect the one-half year period). |
| 44 | JPMORGAN INSURANCE TRUST | DECEMBER 31, 2011 | ||||
Table of Contents
BOARD APPROVAL OF INVESTMENT ADVISORY AGREEMENT
(Unaudited)
The Board of Trustees meets regularly throughout the year and considers factors that are relevant to its annual consideration of investment advisory agreements at each meeting. The Board of Trustees has established various standing committees, composed of Trustees with diverse backgrounds, to which the Board of Trustees has assigned specific subject matter responsibilities to further enhance the effectiveness of the Board’s oversight and decision making. The Board of Trustees and its investment subcommittees (money market and alternative products, equity, and fixed income) also meet for the specific purpose of considering advisory contract annual renewals. The Board of Trustees held meetings in person in June and August 2011, at which the Trustees considered the continuation of the investment advisory agreement for the Portfolio whose annual report is contained herein (the “Advisory Agreement”). At the June meeting, the Board’s investment subcommittees met to review and consider performance, expense and related information for the J.P. Morgan Funds. Each investment subcommittee reported to the full Board, which then considered the investment subcommittee’s preliminary findings. At the August meeting, the Trustees continued their review and consideration. The Trustees, including a majority of the Trustees who are not “interested persons” (as defined in the 1940 Act) of any party to the Advisory Agreement or any of their affiliates, approved the continuation of the Advisory Agreement on August 25, 2011.
The Trustees, as part of their review of the investment advisory arrangements for the J.P. Morgan Funds, considered and reviewed performance and other information received from the Advisor, on a regular basis over the course of the year, as well as information specifically prepared for their annual review. This information included the Portfolio’s performance compared to the performance of the Portfolio’s peers and benchmarks and analyses by the Advisor of the Portfolio’s performance. The Advisor also periodically provides comparative information regarding the Portfolio’s expense ratios and those of the peer groups. In addition, in preparation for the June and August meetings, the Trustees requested, received and evaluated extensive materials from the Advisor, including, with respect to certain J.P. Morgan Funds, performance and expense information compiled by Lipper Inc. (“Lipper”), an independent provider of investment company data. Prior to voting, the Trustees reviewed the proposed approval of the Advisory Agreement with representatives of the Advisor and with counsels to the Trust and independent Trustees and received a memorandum from independent counsel to the Trustees discussing the legal standards for their consideration of the proposed approval. The Trustees also discussed the proposed approvals in executive sessions with counsels to the Trust and independent Trustees at which no representatives of the Advisor were present. Set forth below is a summary of the material factors evaluated by the Trustees in determining whether to approve the Advisory Agreement.
In their deliberations, there was a comprehensive consideration of the information received by the Trustees. Each Trustee attributed different weights to the various factors and no factor alone was considered determinative. From year to year, the Trustees consider and place emphasis on relevant information in light of changing circumstances in market and economic conditions. The Trustees determined that the compensation to be received by the Advisor from the Portfolio under the Advisory Agreement was fair and reasonable and that the continuance of the investment advisory contract was in the best interests of the Portfolio and its shareholders.
The factors summarized below were considered and discussed by the Trustees in reaching their conclusions:
Nature, Extent and Quality of Services Provided by the Advisor
The Trustees received and considered information regarding the nature, extent and quality of the services provided to the Portfolio under the Advisory Agreement. The Trustees took into account information furnished throughout the year at Trustee meetings, as well as the materials furnished specifically in connection with this annual review process. The Trustees considered the background and experience of the Advisor’s senior management and the expertise of, and the amount of attention given to the Portfolio by, investment personnel of the Advisor. In addition, the Trustees reviewed the qualifications, backgrounds and responsibilities of the portfolio management team primarily responsible for the day-to-day management of the Portfolio and the infrastructure supporting the team. The Trustees also considered information provided by the Advisor and JPMorgan Distribution Services, Inc. (“JPMDS”) about the structure and distribution strategy of the Portfolio. The Trustees also reviewed information relating to the Advisor’s risk governance model and reports showing the Advisor’s compliance structure and ongoing compliance processes The quality of the administrative services provided by JPMorgan Funds Management, Inc. (“JPMFM”), an affiliate of the Advisor, was also considered.
The Board of Trustees also considered its knowledge of the nature and quality of the services provided by the Advisor to the Portfolio gained from their experience as Trustees of the J.P. Morgan Funds. In addition, they considered the overall reputation and capabilities of the Advisor and its affiliates, the commitment of the Advisor to provide high quality service to the Portfolio, their overall confidence in the Advisor’s integrity and the Advisor’s responsiveness to questions or concerns raised by them, including the Advisor’s willingness to consider and implement organizational and operational changes designed to improve investment results and the services provided to the Portfolio.
Based on these considerations and other factors, the Trustees concluded that they were satisfied with the nature, extent and quality of the investment advisory services provided to the Portfolio by the Advisor.
| DECEMBER 31, 2011 | JPMORGAN INSURANCE TRUST | 45 | ||||||
Table of Contents
BOARD APPROVAL OF INVESTMENT ADVISORY AGREEMENT
(Unaudited) (continued)
Costs of Services Provided and Profitability to the Advisor and its Affiliates
The Trustees received and considered information regarding the profitability to the Advisor and its affiliates in providing services to the Portfolio. The Trustees reviewed and discussed this data. The Trustees recognized that this data is not audited and represents the Advisor’s determination of its and its affiliates’ revenues from the contractual services provided to the Portfolio, less expenses of providing such services. Expenses include direct and indirect costs and are calculated using an allocation methodology developed by the Advisor. The Trustees also recognized that it is difficult to make comparisons of profitability from fund investment advisory contracts because comparative information is not generally publicly available and is affected by numerous factors, including the structure of the particular adviser, the types of funds it manages, its business mix, numerous assumptions regarding allocations and the fact that publicly-traded fund managers’ operating profits and net income are net of distribution and marketing expenses. Based on their review, the Trustees concluded that the profitability to the Advisor under the Advisory Agreement was not unreasonable in light of the services and benefits provided to the Portfolio.
Fall-Out Benefits
The Trustees reviewed information regarding potential “fallout” or ancillary benefits received by the Advisor and its affiliates as a result of their relationship with the Portfolio. The Board considered that the Advisor does not currently use third-party soft dollar arrangements with respect to securities transactions it executes for the Portfolio.
The Trustees also considered that JPMFM earns fees from the Portfolio for providing administrative services. These fees were shown separately in the profitability analysis presented to the Trustees. The Trustees also considered the payments of Rule 12b-1 fees to JPMDS, an affiliate of the Advisor, which also acts as the Portfolio’s distributor and that these fees are in turn generally paid to financial intermediaries that sell the J.P. Morgan Funds, including financial intermediaries that are affiliates of the Advisor. The Trustees also considered the fees paid to JPMorgan Chase Bank, N.A. (“JPMCB”) for custody and fund accounting, and other related services. The Trustees also considered that the Fund is not currently engaged in securities lending.
Economies of Scale
The Trustees noted that the proposed investment advisory fee schedule for the Portfolio does not contain breakpoints. The Trustees considered whether it would be appropriate to add advisory fee breakpoints and the Trustees concluded that the current fee structure was reasonable in light of the fee waivers and expense limitations that the Advisor has in place that serve to limit the overall net expense ratio at competitive levels. The
Trustees also recognized that the fee schedule for the administrative services provided by JPMFM does include a fee breakpoint, which is tied to the overall level of non-money market fund assets excluding certain funds-of-funds, as applicable, advised by the Advisor, and that the Portfolio benefits from that breakpoint. The Trustees concluded that shareholders benefited from the lower expense ratios which resulted from these factors.
Independent Written Evaluation of the Portfolio’s Chief Compliance Officer
The Trustees noted that, upon their direction, the Chief Compliance Officer for the Portfolio had prepared an independent written evaluation in order to assist the Trustees in determining the reasonableness of the proposed management fees. The Trustees considered the written evaluation in determining whether to continue the Advisory Agreement.
Fees Relative to Advisor’s Other Clients
The Trustees received and considered information about the nature and extent of investment advisory services and fee rates offered to other clients of the Advisor for investment management styles substantially similar to that of the Portfolio. The Trustees also considered the complexity of investment management for the Portfolio relative to the Advisor’s other clients and the differences in the nature and extent of the services provided to the different clients. The Trustees concluded that the fee rates charged to the Portfolio in comparison to those charged to the Advisor’s other clients were reasonable.
Investment Performance
The Trustees received and considered absolute and/or relative performance for the Portfolio in a report prepared by Lipper. The Trustees considered the total return performance information, which included the ranking of the Portfolio within a performance universe made up of funds with the same Lipper investment classification and objective (the “Universe Group”) by total return for applicable one-, three- and five- year periods. The Trustees reviewed a description of Lipper’s methodology for selecting mutual funds in the Portfolio’s Universe Group. The Lipper materials provided to the Trustees highlighted information with respect to a representative class to assist the Trustees in their review. As part of this review, the Trustees also reviewed the Portfolio’s performance against its benchmark and considered the performance information provided for the Portfolio at regular Board meetings by the Advisor. The Lipper performance data noted by the Trustees as part of their review and the determinations made by the Trustees with respect to the Portfolio’s performance are summarized below:
The Trustees noted the Portfolio’s performance was in the first quintiles for Class 1 shares for the one-, three-, and five-year periods ended December 31, 2010, respectively. The Trustees
| 46 | JPMORGAN INSURANCE TRUST | DECEMBER 31, 2011 | ||||
Table of Contents
discussed the performance and investment strategy of the Portfolio with the Advisor and, based upon this discussion and other factors, concluded that the performance was reasonable.
Advisory Fees and Expense Ratios
The Trustees considered the contractual advisory fee rate paid by the Portfolio to the Advisor and compared that rate to the information prepared by Lipper concerning management fee rates paid by other funds in the same Lipper category as the Portfolio. The Trustees recognized that Lipper reported the Portfolio’s management fee rate as the combined contractual advisory fee and the administration fee rates. The Trustees considered the fee waiver and/or expense reimbursement arrangements currently in place for the Portfolio and consid-
ered the net advisory fee rate after taking into account any waivers and/or reimbursements. The Trustees recognized that it is difficult to make comparisons of advisory fees because there are variations in the services that are included in the fees paid by other funds. The Trustees’ determinations as a result of the review of the Portfolio’s advisory fees and expense ratios are summarized below:
The Trustees noted that the Portfolio’s net advisory fee and actual total expenses for Class 1 shares were in the second quintile of their Universe Group. After considering the factors identified above, in light of this information, the Trustees concluded that the advisory fees were reasonable.
| DECEMBER 31, 2011 | JPMORGAN INSURANCE TRUST | 47 | ||||||
Table of Contents
(Unaudited)
Certain tax information for the Portfolio is required to be provided to shareholders based upon the Portfolio’s income and distributions for the taxable year ended December 31, 2011. The information and distributions reported in this letter may differ from the information and taxable distributions reported to the shareholders for the calendar year ending December 31, 2011. The information necessary to complete your income tax returns for the calendar year ending December 31, 2011 will be received under separate cover.
Treasury Income
The Portfolio earned 17.70% of its income from direct U.S. Treasury Obligations for the fiscal year ended December 31, 2011.
| 48 | JPMORGAN INSURANCE TRUST | DECEMBER 31, 2011 | ||||
Table of Contents
J.P. Morgan Funds are distributed by JPMorgan Distribution Services, Inc., which is an affiliate of JPMorgan Chase & Co. Affiliates of JPMorgan Chase & Co. receive fees for providing various services to the funds.
Contact JPMorgan Distribution Services, Inc. at 1-800-480-4111 for a portfolio prospectus. You can also visit us at www.jpmorganfunds.com. Investors should carefully consider the investment objectives and risk as well as charges and expenses of the mutual fund before investing. The prospectus contains this and other information about the mutual fund. Read the prospectus carefully before investing.
The Portfolio files a complete schedule of its portfolio holdings for the first and third quarters of its fiscal year with the SEC on Form N-Q. The Portfolio’s Forms N-Q are available on the SEC’s website at http://www.sec.gov and may be reviewed and copied at the SEC’s Public Reference Room in Washington, DC. Information on the operation of the SEC’s Public Reference Room may be obtained by calling 1-800-SEC-0330. Shareholders may request the Form N-Q without charge by calling 1-800-480-4111 or by visiting the variable insurance portfolio section of the J.P. Morgan Funds’ website at www.jpmorganfunds.com.
A description of the Portfolio’s policies and procedures with respect to the disclosure of the Portfolio’s holdings is available in the prospectus and Statement of Additional Information.
A copy of proxy policies and procedures is available without charge upon request by calling 1-800-480-4111 and a description of such policies and procedures is on the SEC’s website at www.sec.gov. The Trustees have delegated the authority to vote proxies for securities owned by the Portfolio to the Advisor. A copy of the Portfolio’s voting record for the most recent 12-month period ended June 30 is available on the SEC’s website at www.sec.gov or at the Portfolio’s website at www.jpmorganfunds.com no later than August 31 of each year. The Portfolio’s proxy voting record will include, among other things, a brief description of the matter voted on for each portfolio security, and will state how each vote was cast, for example, for or against the proposal.

Table of Contents
| © JPMorgan Chase & Co., 2012. All rights reserved. December 2011. | AN-JPMITCBP-1211 |
Table of Contents
Annual Report
JPMorgan Insurance Trust
December 31, 2011
JPMorgan Insurance Trust Equity Index Portfolio
NOT FDIC INSURED Ÿ NO BANK GUARANTEE Ÿ MAY LOSE VALUE
|  |
Table of Contents
Investments in the Portfolio are not bank deposits or obligations of, or guaranteed or endorsed by, any bank and are not insured or guaranteed by the FDIC, the Federal Reserve Board or any other government agency. You could lose money if you sell when the Portfolio’s share price is lower than when you invested.
Past performance is no guarantee for future performance. The general market views expressed in this report are opinions based on conditions through the end of the reporting period and are subject to change without notice based on market and other conditions. These views are not intended to predict the future performance of the Portfolio or the securities markets. References to specific securities and their issuers are for illustrative purposes only and are not intended to be, and should not be interpreted as, recommendations to purchase or sell such securities. Such views are not meant as investment advice and may not be relied on as an indication of trading intent on behalf of the Portfolio.
This Portfolio is intended to be a funding vehicle for variable annuity contracts and variable life insurance policies (collectively “Policies”) offered by separate accounts of participating insurance companies. Portfolio shares are also offered through qualified pension and retirement plans (“Eligible Plans”). Individuals may not purchase shares directly from the Portfolio.
Prospective investors should refer to the Portfolio’s prospectus for a discussion of the Portfolio’s investment objective, strategies and risks. Call J.P. Morgan Funds Service Center at 1-800-480-4111 for a prospectus containing more complete information about the Portfolio including management fees and other expenses. Please read it carefully before investing.
Table of Contents
JANUARY 25, 2012 (Unaudited)
Dear Shareholder:
Investors greeted 2011 in much the same way they welcomed 2010: with high hopes that an improving U.S. economy would finally get us back on course to recovery.
This optimism quickly faded as the European debt crisis and a host of other economic and geopolitical concerns cast a dark shadow on the prospects for future growth. The combination of weak global economic data, credit downgrades in the U.S. and in Europe, and escalating fears of contagion all resulted in a level of market volatility not seen since the financial crisis three years ago.
 |
“Investors greeted 2011 in much the same way they welcomed 2010: With high hopes that an improving U.S. economy would finally get us back on course to recovery.” |
Nonetheless, stocks have regained some of their footing, as positive fourth-quarter economic data on auto sales, payroll employment and manufacturing activity all appear to indicate that consumer confidence is improving and economic growth may be accelerating.
We remain cautious, however, since many of the same challenges that we experienced in 2011 — European debt concerns, uncertainty over monetary and fiscal stimulus, and soft economic data — will likely remain in place this year, laying the groundwork for continued market volatility.
Strong fourth quarter surge caps volatile year
The European debt crisis and other geopolitical and economic events created a generally volatile year for equities, culminating in major sell off in the third quarter. A strong fourth quarter comeback did little to reverse the losses, as the Standard & Poor’s 500 Index (“S&P500 Index”) ended the year with only slight gains. As of December 31, 2011, the Index had reached a level of 1,258, an increase of 2.1% from one year prior.
Large cap growth stocks lead style categories
Large cap stocks outpaced mid- and small-cap stocks over the 12-month period ended December 31, 2011 (the Russell 1000 Index returned 1.5% and the Russell Mid Cap Index returned -1.6%, compared to a return of -4.2% for the Russell 2000 Index). Overall, large-cap growth stocks fared better than large-cap value stocks as the Russell 1000 Growth Index returned 2.6% for the 12-month reporting period, compared to 0.4% for the Russell 1000 Value Index.
Euro zone uncertainty drives flight-to-quality sentiment
Investors’ lack of confidence in global economic growth prompted them to seek safe havens in U.S. Treasury securities, and high-quality corporate bonds. The Barclays Capital U.S. Aggregate Bond Index returned 7.8%. High yield bonds and emerging market debt securities also performed well, as the Barclays Capital High Yield Index returned 5.0%, and the Barclays Capital Emerging Markets Index returned 7.0% for the 12-month period ended December 31, 2011.
Similar economic concerns pushed yields of U.S. Treasury securities maturing in 10 years or more to historic lows throughout the year. As of the end of the 12-month period ended December 31, 2011, the yields on the benchmark 10-year U.S. Treasury bond dropped from 3.3% to 1.9%. In addition, yields on the 30-year U.S. Treasury bond declined from 4.3% to 2.9%, as did the two-year U.S. Treasury note, from 0.6% to 0.3%.
Lesson for 2012: Keep balance in mind in economic uncertainty
Last year offered its share of shocks to investors: geopolitical upheaval, natural disasters, sovereign-debt crises, and credit-rating downgrades were all among the events competing for the market’s attention. Against the backdrop of an election year, it’s likely that we will face continued global surprises — both on the upside and the downside.
As you reassess your investment strategy for the year ahead, it’s important to stick with a plan that focuses on diversification as well as long-term allocation. Trying to “time” market fluctuations can be risky business, especially given the ongoing uncertainty surrounding the direction of economic growth and the euro zone crisis in the months ahead.
On behalf of everyone at J.P. Morgan Asset Management, thank you for your continued confidence. We look forward to managing your investment needs for years to come. Should you have any questions, please visit www.jpmorganfunds.com or contact the J.P. Morgan Funds Service Center at 1-800-480-4111.
Sincerely yours,

George C.W. Gatch
CEO-Investment Management Americas
J.P. Morgan Asset Management
| DECEMBER 31, 2011 | JPMORGAN INSURANCE TRUST | 1 | ||||||
Table of Contents
JPMorgan Insurance Trust Equity Index Portfolio
PORTFOLIO COMMENTARY
TWELVE MONTHS ENDED DECEMBER 31, 2011 (Unaudited)
| Reporting Period Return: | ||||
| Portfolio (Class 1 Shares)* | 1.71% | |||
| S&P 500 Index** | 2.11% | |||
| Net Assets as of 12/31/2011 | $ | 67,188,220 | ||
INVESTMENT OBJECTIVE***
The JPMorgan Insurance Trust Equity Index Portfolio (the “Portfolio”) seeks investment results that correspond to the aggregate price and dividend performance of securities in the S&P 500 Index.
WHAT WERE THE MAIN DRIVERS OF THE PORTFOLIO’S PERFORMANCE?
The Portfolio (Class 1 Shares) underperformed the S&P 500 Index (the “Benchmark”) for the twelve months ended December 31, 2011. This was consistent with its indexing strategy and investment objective, as the Portfolio looks to generate returns that are comparable to that of the Benchmark.
Strong corporate earnings and robust merger-and-acquisition activity encouraged investors and helped support the Benchmark during the beginning of the reporting period. However, uncertainty surrounding global economic growth began to dampen investors’ appetite for risk in April 2011. This negative mood among investors worsened as they seemed to lack confidence in the ability of European governments to combat the region’s debt crisis, stoking fear about economic contagion. Concerns about the credit downgrade of U.S.-issued debt exacerbated this negative sentiment among investors. Each of these factors helped trigger a sharp downturn in the Benchmark for the third quarter of 2011. The Benchmark rebounded in the fourth quarter of 2011 as better-than-expected economic data helped investors regain their appetite for risk. The Benchmark finished the twelve months ended December 31, 2011 with a 2.11% gain.
The majority of sectors in the Benchmark produced positive returns during the twelve-month period. The financials and materials sectors posted negative returns and were the worst performing sectors. The utilities and consumer staples sectors produced the strongest returns.
HOW WAS THE PORTFOLIO POSITIONED?
Regardless of the market outlook, the Portfolio was managed in strict conformity with a full replication index strategy and aimed to hold the same stocks in nearly the same proportions as those found in the Benchmark.
| TOP TEN EQUITY HOLDINGS OF THE PORTFOLIO**** | ||||||||
| 1. | Exxon Mobil Corp. | 3.5 | % | |||||
| 2. | Apple, Inc. | 3.3 | ||||||
| 3. | International Business Machines Corp. | 1.9 | ||||||
| 4. | Chevron Corp. | 1.8 | ||||||
| 5. | Microsoft Corp. | 1.7 | ||||||
| 6. | General Electric Co. | 1.6 | ||||||
| 7. | Procter & Gamble Co. (The) | 1.6 | ||||||
| 8. | AT&T, Inc. | 1.6 | ||||||
| 9. | Johnson & Johnson | 1.6 | ||||||
| 10. | Pfizer, Inc. | 1.5 | ||||||
PORTFOLIO COMPOSITION BY SECTOR**** | ||||
| Information Technology | 18.9 | % | ||
| Financials | 13.3 | |||
| Energy | 12.2 | |||
| Health Care | 11.8 | |||
| Consumer Staples | 11.5 | |||
| Industrials | 10.6 | |||
| Consumer Discretionary | 10.6 | |||
| Utilities | 3.8 | |||
| Materials | 3.5 | |||
| Telecommunication Services | 3.1 | |||
| Short-Term Investments | 0.7 | |||
| * | The return shown is based on net asset value calculated for shareholder transactions and may differ from the return shown in the financial highlights, which reflects adjustments made to the net asset value in accordance with accounting principles generally accepted in the United States of America. |
| ** | “S&P 500 Index” is a registered service mark of Standard & Poor’s Corporation, which does not sponsor, and is in no way affiliated with, the Portfolio. |
| *** | The advisor seeks to achieve the Portfolio’s objective. There can be no guarantee it will be achieved. |
| **** | Percentages indicated are based upon total investments (excluding Investments of Cash Collateral for Securities on Loan) as of December 31, 2011. The Portfolio’s composition is subject to change. |
| 2 | JPMORGAN INSURANCE TRUST | DECEMBER 31, 2011 | ||||
Table of Contents
AVERAGE ANNUAL TOTAL RETURNS AS OF DECEMBER 31, 2011 | ||||||||||||||||
| INCEPTION DATE OF CLASS | 1 YEAR | 5 YEAR | 10 YEAR | |||||||||||||
CLASS 1 SHARES | 5/01/98 | 1.71 | % | (0.59 | )% | 2.51 | % | |||||||||
TEN YEAR PERFORMANCE (12/31/01 TO 12/31/11)
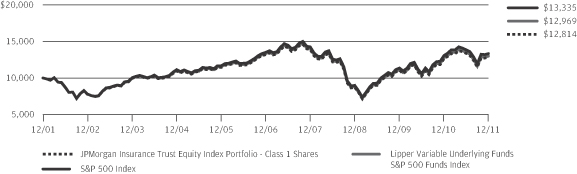
Source: Lipper, Inc. The performance quoted is past performance and is not a guarantee of future results. Mutual funds are subject to certain market risks. Investment returns and principal value of an investment will fluctuate so that an investor’s shares, when redeemed, may be worth more or less than their original cost. Current performance may be higher or lower than the performance data shown. For up-to-date month-end performance information please call 1-800-480-4111.
The graph illustrates comparative performance for $10,000 invested in Class 1 Shares of the JPMorgan Insurance Trust Equity Index Portfolio, the S&P 500 Index and the Lipper Variable Underlying Funds S&P 500 Funds Index from December 31, 2001 to December 31, 2011. The performance of the Portfolio assumes reinvestment of all dividends and capital gains, if any. The performance of the S&P 500 Index does not reflect the deduction of expenses associated with a mutual fund and has been adjusted to reflect reinvestment of all dividends and capital gains of the securities included in the benchmark. The performance of the Lipper Variable Underlying Funds S&P 500 Funds Index includes expenses associated with a mutual fund, such as investment
management fees. These expenses are not identical to the expenses charged by the Portfolio. The S&P 500 Index is an unmanaged index generally representative of the performance of large companies in the U.S. stock market. The Lipper Variable Underlying Funds S&P 500 Funds Index is an index based on the total returns of certain mutual funds within the Portfolio’s designated category as determined by Lipper, Inc. Investors cannot invest directly in an index.
The performance does not reflect any charges imposed by the Policies or Eligible Plans. If these charges were included, the returns would be lower than shown. Performance may reflect the waiver of the Portfolio’s fees and reimbursement of expenses for certain periods since the inception date. Without these waivers and reimbursements performance would have been lower.
The returns shown are based on net asset values calculated for shareholder transactions and may differ from the returns shown in the financial highlights, which reflect adjustments made to the net asset values in accordance with accounting principles generally accepted in the United States of America.
| DECEMBER 31, 2011 | JPMORGAN INSURANCE TRUST | 3 | ||||||
Table of Contents
JPMorgan Insurance Trust Equity Index Portfolio
SCHEDULE OF PORTFOLIO INVESTMENTS
AS OF DECEMBER 31, 2011
| SHARES | SECURITY DESCRIPTION | VALUE($) | ||||||
| Common Stocks — 99.2% |
| ||||||
Consumer Discretionary — 10.6% |
| |||||||
Auto Components — 0.3% |
| |||||||
| 643 | BorgWarner, Inc. (a) | 40,985 | ||||||
| 1,431 | Goodyear Tire & Rubber Co. (The) (a) | 20,277 | ||||||
| 3,985 | Johnson Controls, Inc. | 124,571 | ||||||
|
| |||||||
| 185,833 | ||||||||
|
| |||||||
Automobiles — 0.4% |
| |||||||
| 22,259 | Ford Motor Co. (a) | 239,507 | ||||||
| 1,361 | Harley-Davidson, Inc. | 52,902 | ||||||
|
| |||||||
| 292,409 | ||||||||
|
| |||||||
Distributors — 0.1% |
| |||||||
| 912 | Genuine Parts Co. | 55,814 | ||||||
|
| |||||||
Diversified Consumer Services — 0.1% |
| |||||||
| 681 | Apollo Group, Inc., Class A (a) | 36,686 | ||||||
| 355 | DeVry, Inc. | 13,653 | ||||||
| 1,716 | H&R Block, Inc. | 28,022 | ||||||
|
| |||||||
| 78,361 | ||||||||
|
| |||||||
Hotels, Restaurants & Leisure — 2.0% |
| |||||||
| 2,651 | Carnival Corp. | 86,529 | ||||||
| 183 | Chipotle Mexican Grill, Inc. (a) | 61,806 | ||||||
| 772 | Darden Restaurants, Inc. | 35,188 | ||||||
| 1,743 | International Game Technology | 29,979 | ||||||
| 1,570 | Marriott International, Inc., Class A | 45,797 | ||||||
| 5,993 | McDonald’s Corp. | 601,278 | ||||||
| 4,366 | Starbucks Corp. | 200,880 | ||||||
| 1,126 | Starwood Hotels & Resorts Worldwide, Inc. | 54,014 | ||||||
| 894 | Wyndham Worldwide Corp. | 33,820 | ||||||
| 464 | Wynn Resorts Ltd. | 51,267 | ||||||
| 2,697 | Yum! Brands, Inc. | 159,150 | ||||||
|
| |||||||
| 1,359,708 | ||||||||
|
| |||||||
Household Durables — 0.2% |
| |||||||
| 1,629 | D.R. Horton, Inc. | 20,542 | ||||||
| 411 | Harman International Industries, Inc. | 15,634 | ||||||
| 815 | Leggett & Platt, Inc. | 18,778 | ||||||
| 942 | Lennar Corp., Class A | 18,510 | ||||||
| 1,695 | Newell Rubbermaid, Inc. | 27,374 | ||||||
| 1,973 | PulteGroup, Inc. (a) | 12,450 | ||||||
| 448 | Whirlpool Corp. | 21,258 | ||||||
|
| |||||||
| 134,546 | ||||||||
|
| |||||||
Internet & Catalog Retail — 0.8% |
| |||||||
| 2,131 | Amazon.com, Inc. (a) | 368,876 | ||||||
| 556 | Expedia, Inc. | 16,121 | ||||||
| 324 | NetFlix, Inc. (a) | 22,450 | ||||||
| SHARES | SECURITY DESCRIPTION | VALUE($) | ||||||
Internet & Catalog Retail — Continued | ||||||||
| 292 | priceline.com, Inc. (a) | 136,571 | ||||||
| 556 | TripAdvisor, Inc. (a) | 14,004 | ||||||
|
| |||||||
| 558,022 | ||||||||
|
| |||||||
Leisure Equipment & Products — 0.1% |
| |||||||
| 680 | Hasbro, Inc. | 21,685 | ||||||
| 1,984 | Mattel, Inc. | 55,076 | ||||||
|
| |||||||
| 76,761 | ||||||||
|
| |||||||
Media — 3.1% |
| |||||||
| 1,293 | Cablevision Systems Corp., Class A | 18,387 | ||||||
| 3,833 | CBS Corp. (Non-Voting), Class B | 104,028 | ||||||
| 15,961 | Comcast Corp., Class A | 378,435 | ||||||
| 4,133 | DIRECTV, Class A (a) | 176,727 | ||||||
| 1,548 | Discovery Communications, Inc., Class A (a) | 63,422 | ||||||
| 1,414 | Gannett Co., Inc. | 18,905 | ||||||
| 2,701 | Interpublic Group of Cos., Inc. (The) | 26,281 | ||||||
| 1,719 | McGraw-Hill Cos., Inc. (The) | 77,303 | ||||||
| 12,845 | News Corp., Class A | 229,155 | ||||||
| 1,616 | Omnicom Group, Inc. | 72,041 | ||||||
| 570 | Scripps Networks Interactive, Inc., Class A | 24,179 | ||||||
| 1,869 | Time Warner Cable, Inc. | 118,812 | ||||||
| 5,863 | Time Warner, Inc. | 211,889 | ||||||
| 3,235 | Viacom, Inc., Class B | 146,901 | ||||||
| 10,523 | Walt Disney Co. (The) | 394,613 | ||||||
| 28 | Washington Post Co. (The), Class B | 10,551 | ||||||
|
| |||||||
| 2,071,629 | ||||||||
|
| |||||||
Multiline Retail — 0.8% |
| |||||||
| 384 | Big Lots, Inc. (a) | 14,500 | ||||||
| 697 | Dollar Tree, Inc. (a) | 57,928 | ||||||
| 688 | Family Dollar Stores, Inc. | 39,670 | ||||||
| 837 | J.C. Penney Co., Inc. | 29,421 | ||||||
| 1,484 | Kohl’s Corp. | 73,235 | ||||||
| 2,459 | Macy’s, Inc. | 79,131 | ||||||
| 948 | Nordstrom, Inc. | 47,125 | ||||||
| 225 | Sears Holdings Corp. (a) | 7,150 | ||||||
| 3,934 | Target Corp. | 201,499 | ||||||
|
| |||||||
| 549,659 | ||||||||
|
| |||||||
Specialty Retail — 2.0% |
| |||||||
| 504 | Abercrombie & Fitch Co., Class A | 24,615 | ||||||
| 279 | AutoNation, Inc. (a) | 10,287 | ||||||
| 164 | AutoZone, Inc. (a) | 53,295 | ||||||
| 1,406 | Bed Bath & Beyond, Inc. (a) | 81,506 | ||||||
| 1,719 | Best Buy Co., Inc. | 40,173 | ||||||
| 1,326 | CarMax, Inc. (a) | 40,417 | ||||||
SEE NOTES TO FINANCIAL STATEMENTS.
| 4 | JPMORGAN INSURANCE TRUST | DECEMBER 31, 2011 | ||||
Table of Contents
| SHARES | SECURITY DESCRIPTION | VALUE($) | ||||||
| Common Stocks — Continued | |||||||
Specialty Retail — Continued | ||||||||
| 811 | GameStop Corp., Class A (a) | 19,569 | ||||||
| 2,032 | Gap, Inc. (The) | 37,694 | ||||||
| 9,030 | Home Depot, Inc. (The) | 379,621 | ||||||
| 1,441 | Limited Brands, Inc. | 58,144 | ||||||
| 7,337 | Lowe’s Cos., Inc. | 186,213 | ||||||
| 10 | Orchard Supply Hardware Stores Corp., Class A (a) (f) (i) | — | ||||||
| 752 | O’Reilly Automotive, Inc. (a) | 60,122 | ||||||
| 1,354 | Ross Stores, Inc. | 64,356 | ||||||
| 4,097 | Staples, Inc. | 56,907 | ||||||
| 744 | Tiffany & Co. | 49,298 | ||||||
| 2,209 | TJX Cos., Inc. | 142,591 | ||||||
| 650 | Urban Outfitters, Inc. (a) | 17,914 | ||||||
|
| |||||||
| 1,322,722 | ||||||||
|
| |||||||
Textiles, Apparel & Luxury Goods — 0.7% |
| |||||||
| 1,709 | Coach, Inc. | 104,318 | ||||||
| 2,173 | NIKE, Inc., Class B | 209,412 | ||||||
| 378 | Ralph Lauren Corp. | 52,194 | ||||||
| 511 | V.F. Corp. | 64,892 | ||||||
|
| |||||||
| 430,816 | ||||||||
|
| |||||||
Total Consumer Discretionary | 7,116,280 | |||||||
|
| |||||||
Consumer Staples — 11.4% |
| |||||||
Beverages — 2.6% |
| |||||||
| 911 | Beam, Inc. | 46,671 | ||||||
| 591 | Brown-Forman Corp., Class B | 47,581 | ||||||
| 13,304 | Coca-Cola Co. (The) | 930,881 | ||||||
| 1,828 | Coca-Cola Enterprises, Inc. | 47,126 | ||||||
| 1,020 | Constellation Brands, Inc., Class A (a) | 21,083 | ||||||
| 1,256 | Dr. Pepper Snapple Group, Inc. | 49,587 | ||||||
| 923 | Molson Coors Brewing Co., Class B | 40,188 | ||||||
| 9,158 | PepsiCo, Inc. | 607,633 | ||||||
|
| |||||||
| 1,790,750 | ||||||||
|
| |||||||
Food & Staples Retailing — 2.4% |
| |||||||
| 2,538 | Costco Wholesale Corp. | 211,466 | ||||||
| 7,624 | CVS Caremark Corp. | 310,907 | ||||||
| 3,498 | Kroger Co. (The) | 84,722 | ||||||
| 1,991 | Safeway, Inc. | 41,891 | ||||||
| 1,243 | SUPERVALU, Inc. (c) | 10,093 | ||||||
| 3,455 | Sysco Corp. | 101,335 | ||||||
| 5,209 | Walgreen Co. | 172,209 | ||||||
| 10,231 | Wal-Mart Stores, Inc. | 611,404 | ||||||
| 936 | Whole Foods Market, Inc. | 65,127 | ||||||
|
| |||||||
| 1,609,154 | ||||||||
|
| |||||||
| SHARES | SECURITY DESCRIPTION | VALUE($) | ||||||
Food Products — 1.9% |
| |||||||
| 3,913 | Archer-Daniels-Midland Co. | 111,912 | ||||||
| 1,050 | Campbell Soup Co. | 34,902 | ||||||
| 2,428 | ConAgra Foods, Inc. | 64,099 | ||||||
| 1,076 | Dean Foods Co. (a) | 12,051 | ||||||
| 3,769 | General Mills, Inc. | 152,305 | ||||||
| 1,876 | H.J. Heinz Co. | 101,379 | ||||||
| 897 | Hershey Co. (The) | 55,417 | ||||||
| 808 | Hormel Foods Corp. | 23,666 | ||||||
| 667 | JM Smucker Co. (The) | 52,140 | ||||||
| 1,452 | Kellogg Co. | 73,428 | ||||||
| 10,349 | Kraft Foods, Inc., Class A | 386,639 | ||||||
| 777 | McCormick & Co., Inc. (Non-Voting) | 39,176 | ||||||
| 1,192 | Mead Johnson Nutrition Co. | 81,926 | ||||||
| 3,460 | Sara Lee Corp. | 65,463 | ||||||
| 1,711 | Tyson Foods, Inc., Class A | 35,315 | ||||||
|
| |||||||
| 1,289,818 | ||||||||
|
| |||||||
Household Products — 2.3% |
| |||||||
| 773 | Clorox Co. (The) | 51,451 | ||||||
| 2,835 | Colgate-Palmolive Co. | 261,926 | ||||||
| 2,308 | Kimberly-Clark Corp. | 169,777 | ||||||
| 16,116 | Procter & Gamble Co. (The) | 1,075,098 | ||||||
|
| |||||||
| 1,558,252 | ||||||||
|
| |||||||
Personal Products — 0.2% |
| |||||||
| 2,523 | Avon Products, Inc. | 44,077 | ||||||
| 654 | Estee Lauder Cos., Inc. (The), Class A | 73,457 | ||||||
|
| |||||||
| 117,534 | ||||||||
|
| |||||||
Tobacco — 2.0% |
| |||||||
| 12,045 | Altria Group, Inc. | 357,134 | ||||||
| 791 | Lorillard, Inc. | 90,174 | ||||||
| 10,174 | Philip Morris International, Inc. | 798,455 | ||||||
| 1,980 | Reynolds American, Inc. | 82,012 | ||||||
|
| |||||||
| 1,327,775 | ||||||||
|
| |||||||
Total Consumer Staples | 7,693,283 | |||||||
|
| |||||||
Energy — 12.2% |
| |||||||
Energy Equipment & Services — 2.0% |
| |||||||
| 2,557 | Baker Hughes, Inc. | 124,372 | ||||||
| 1,436 | Cameron International Corp. (a) | 70,637 | ||||||
| 407 | Diamond Offshore Drilling, Inc. | 22,491 | ||||||
| 1,396 | FMC Technologies, Inc. (a) | 72,913 | ||||||
| 5,390 | Halliburton Co. | 186,009 | ||||||
| 628 | Helmerich & Payne, Inc. | 36,650 | ||||||
| 1,684 | Nabors Industries Ltd., (Bermuda) (a) | 29,200 | ||||||
| 2,483 | National Oilwell Varco, Inc. | 168,819 | ||||||
SEE NOTES TO FINANCIAL STATEMENTS.
| DECEMBER 31, 2011 | JPMORGAN INSURANCE TRUST | 5 | ||||||
Table of Contents
JPMorgan Insurance Trust Equity Index Portfolio
SCHEDULE OF PORTFOLIO INVESTMENTS
AS OF DECEMBER 31, 2011 (continued)
| SHARES | SECURITY DESCRIPTION | VALUE($) | ||||||
| Common Stocks — Continued |
| ||||||
Energy Equipment & Services — Continued | ||||||||
| 1,478 | Noble Corp., (Switzerland) (a) | 44,665 | ||||||
| 732 | Rowan Cos., Inc. (a) | 22,202 | ||||||
| 7,861 | Schlumberger Ltd. | 536,985 | ||||||
|
| |||||||
| 1,314,943 | ||||||||
|
| |||||||
Oil, Gas & Consumable Fuels — 10.2% | ||||||||
| 1,287 | Alpha Natural Resources, Inc. (a) | 26,293 | ||||||
| 2,917 | Anadarko Petroleum Corp. | 222,655 | ||||||
| 2,250 | Apache Corp. | 203,805 | ||||||
| 612 | Cabot Oil & Gas Corp. | 46,451 | ||||||
| 3,862 | Chesapeake Energy Corp. | 86,084 | ||||||
| 11,665 | Chevron Corp. | 1,241,156 | ||||||
| 7,777 | ConocoPhillips | 566,710 | ||||||
| 1,329 | Consol Energy, Inc. | 48,774 | ||||||
| 2,327 | Denbury Resources, Inc. (a) | 35,138 | ||||||
| 2,366 | Devon Energy Corp. | 146,692 | ||||||
| 4,517 | El Paso Corp. | 120,017 | ||||||
| 1,575 | EOG Resources, Inc. | 155,153 | ||||||
| 875 | EQT Corp. | 47,941 | ||||||
| 28,076 | Exxon Mobil Corp. | 2,379,721 | ||||||
| 1,746 | Hess Corp. | 99,173 | ||||||
| 4,122 | Marathon Oil Corp. | 120,651 | ||||||
| 2,088 | Marathon Petroleum Corp. | 69,510 | ||||||
| 1,134 | Murphy Oil Corp. | 63,209 | ||||||
| 776 | Newfield Exploration Co. (a) | 29,278 | ||||||
| 1,028 | Noble Energy, Inc. | 97,033 | ||||||
| 4,755 | Occidental Petroleum Corp. | 445,543 | ||||||
| 1,587 | Peabody Energy Corp. | 52,546 | ||||||
| 717 | Pioneer Natural Resources Co. | 64,157 | ||||||
| 1,037 | QEP Resources, Inc. | 30,384 | ||||||
| 916 | Range Resources Corp. | 56,737 | ||||||
| 2,035 | Southwestern Energy Co. (a) | 64,998 | ||||||
| 3,809 | Spectra Energy Corp. | 117,127 | ||||||
| 625 | Sunoco, Inc. | 25,637 | ||||||
| 833 | Tesoro Corp. (a) | 19,459 | ||||||
| 3,279 | Valero Energy Corp. | 69,023 | ||||||
| 3,452 | Williams Cos., Inc. (The) | 113,985 | ||||||
|
| |||||||
| 6,865,040 | ||||||||
|
| |||||||
Total Energy | 8,179,983 | |||||||
|
| |||||||
Financials — 13.3% | ||||||||
Capital Markets — 1.8% | ||||||||
| 1,325 | Ameriprise Financial, Inc. | 65,773 | ||||||
| 7,103 | Bank of New York Mellon Corp. (The) | 141,421 | ||||||
| 587 | BlackRock, Inc. | 104,627 | ||||||
| 6,323 | Charles Schwab Corp. (The) | 71,197 | ||||||
| SHARES | SECURITY DESCRIPTION | VALUE($) | ||||||
Capital Markets — Continued | ||||||||
| 1,487 | E*Trade Financial Corp. (a) | 11,837 | ||||||
| 540 | Federated Investors, Inc., Class B | 8,181 | ||||||
| 853 | Franklin Resources, Inc. | 81,939 | ||||||
| 2,884 | Goldman Sachs Group, Inc. (The) | 260,800 | ||||||
| 2,642 | Invesco Ltd. | 53,078 | ||||||
| 729 | Legg Mason, Inc. | 17,532 | ||||||
| 8,693 | Morgan Stanley | 131,525 | ||||||
| 1,412 | Northern Trust Corp. | 56,000 | ||||||
| 2,882 | State Street Corp. | 116,173 | ||||||
| 1,480 | T. Rowe Price Group, Inc. | 84,286 | ||||||
|
| |||||||
| 1,204,369 | ||||||||
|
| |||||||
Commercial Banks — 2.6% | ||||||||
| 4,083 | BB&T Corp. | 102,769 | ||||||
| 1,164 | Comerica, Inc. | 30,031 | ||||||
| 5,388 | Fifth Third Bancorp | 68,535 | ||||||
| 1,544 | First Horizon National Corp. | 12,352 | ||||||
| 5,061 | Huntington Bancshares, Inc. | 27,785 | ||||||
| 5,582 | KeyCorp | 42,926 | ||||||
| 736 | M&T Bank Corp. | 56,186 | ||||||
| 3,082 | PNC Financial Services Group, Inc. | 177,739 | ||||||
| 7,374 | Regions Financial Corp. | 31,708 | ||||||
| 3,145 | SunTrust Banks, Inc. | 55,667 | ||||||
| 11,178 | U.S. Bancorp | 302,365 | ||||||
| 30,890 | Wells Fargo & Co. | 851,329 | ||||||
| 1,079 | Zions Bancorp | 17,566 | ||||||
|
| |||||||
| 1,776,958 | ||||||||
|
| |||||||
Consumer Finance — 0.8% | ||||||||
| 5,919 | American Express Co. | 279,199 | ||||||
| 2,693 | Capital One Financial Corp. | 113,887 | ||||||
| 3,220 | Discover Financial Services | 77,280 | ||||||
| 2,980 | SLM Corp. | 39,932 | ||||||
|
| |||||||
| 510,298 | ||||||||
|
| |||||||
Diversified Financial Services — 2.7% | ||||||||
| 59,371 | Bank of America Corp. | 330,103 | ||||||
| 17,126 | Citigroup, Inc. | 450,585 | ||||||
| 389 | CME Group, Inc. | 94,788 | ||||||
| 426 | IntercontinentalExchange, Inc. (a) | 51,354 | ||||||
| 22,233 | JPMorgan Chase & Co. (q) | 739,247 | ||||||
| 1,160 | Leucadia National Corp. | 26,378 | ||||||
| 1,144 | Moody’s Corp. | 38,530 | ||||||
| 747 | NASDAQ OMX Group, Inc. (The) (a) | 18,309 | ||||||
| 1,535 | NYSE Euronext | 40,064 | ||||||
|
| |||||||
| 1,789,358 | ||||||||
|
| |||||||
SEE NOTES TO FINANCIAL STATEMENTS.
| 6 | JPMORGAN INSURANCE TRUST | DECEMBER 31, 2011 | ||||
Table of Contents
| SHARES | SECURITY DESCRIPTION | VALUE($) | ||||||
| Common Stocks — Continued |
| ||||||
Insurance — 3.5% | ||||||||
| 1,973 | ACE Ltd., (Switzerland) | 138,347 | ||||||
| 2,734 | Aflac, Inc. | 118,273 | ||||||
| 2,960 | Allstate Corp. (The) | 81,134 | ||||||
| 2,559 | American International Group, Inc. (a) | 59,369 | ||||||
| 1,894 | Aon Corp. | 88,639 | ||||||
| 540 | Assurant, Inc. | 22,172 | ||||||
| 10,298 | Berkshire Hathaway, Inc., Class B (a) | 785,737 | ||||||
| 1,629 | Chubb Corp. (The) | 112,759 | ||||||
| 949 | Cincinnati Financial Corp. | 28,906 | ||||||
| 2,876 | Genworth Financial, Inc., Class A (a) | 18,838 | ||||||
| 2,611 | Hartford Financial Services Group, Inc. | 42,429 | ||||||
| 1,767 | Lincoln National Corp. | 34,315 | ||||||
| 1,789 | Loews Corp. | 67,356 | ||||||
| 3,151 | Marsh & McLennan Cos., Inc. | 99,635 | ||||||
| 6,195 | MetLife, Inc. | 193,160 | ||||||
| 1,787 | Principal Financial Group, Inc. | 43,960 | ||||||
| 3,612 | Progressive Corp. (The) | 70,470 | ||||||
| 2,765 | Prudential Financial, Inc. | 138,582 | ||||||
| 597 | Torchmark Corp. | 25,904 | ||||||
| 2,418 | Travelers Cos., Inc. (The) | 143,073 | ||||||
| 1,713 | Unum Group | 36,093 | ||||||
| 1,877 | XL Group plc, (Ireland) | 37,108 | ||||||
|
| |||||||
| 2,386,259 | ||||||||
|
| |||||||
Real Estate Investment Trusts (REITs) — 1.8% |
| |||||||
| 708 | Apartment Investment & Management Co., Class A | 16,220 | ||||||
| 557 | AvalonBay Communities, Inc. | 72,744 | ||||||
| 865 | Boston Properties, Inc. | 86,154 | ||||||
| 1,737 | Equity Residential | 99,061 | ||||||
| 2,389 | HCP, Inc. | 98,976 | ||||||
| 1,112 | Health Care REIT, Inc. | 60,637 | ||||||
| 4,137 | Host Hotels & Resorts, Inc. | 61,104 | ||||||
| 2,384 | Kimco Realty Corp. | 38,716 | ||||||
| 945 | Plum Creek Timber Co., Inc. | 34,549 | ||||||
| 2,684 | ProLogis, Inc. | 76,736 | ||||||
| 832 | Public Storage | 111,871 | ||||||
| 1,721 | Simon Property Group, Inc. | 221,906 | ||||||
| 1,686 | Ventas, Inc. | 92,949 | ||||||
| 1,081 | Vornado Realty Trust | 83,086 | ||||||
| 3,142 | Weyerhaeuser Co. | 58,661 | ||||||
|
| |||||||
| 1,213,370 | ||||||||
|
| |||||||
Real Estate Management & Development — 0.0% (g) |
| |||||||
| 1,900 | CBRE Group, Inc. (a) | 28,918 | ||||||
|
| |||||||
| SHARES | SECURITY DESCRIPTION | VALUE($) | ||||||
Thrifts & Mortgage Finance — 0.1% | ||||||||
| 3,090 | Hudson City Bancorp, Inc. | 19,313 | ||||||
| 2,112 | People’s United Financial, Inc. | 27,139 | ||||||
|
| |||||||
| 46,452 | ||||||||
|
| |||||||
Total Financials | 8,955,982 | |||||||
|
| |||||||
Health Care — 11.8% | ||||||||
Biotechnology — 1.2% | ||||||||
| 4,646 | Amgen, Inc. | 298,320 | ||||||
| 1,423 | Biogen Idec, Inc. (a) | 156,601 | ||||||
| 2,600 | Celgene Corp. (a) | 175,760 | ||||||
| 4,400 | Gilead Sciences, Inc. (a) | 180,092 | ||||||
|
| |||||||
| 810,773 | ||||||||
|
| |||||||
Health Care Equipment & Supplies — 1.8% | ||||||||
| 3,303 | Baxter International, Inc. | 163,432 | ||||||
| 1,259 | Becton, Dickinson & Co. | 94,072 | ||||||
| 8,678 | Boston Scientific Corp. (a) | 46,341 | ||||||
| 502 | C.R. Bard, Inc. | 42,921 | ||||||
| 1,316 | CareFusion Corp. (a) | 33,440 | ||||||
| 2,826 | Covidien plc, (Ireland) | 127,198 | ||||||
| 829 | DENTSPLY International, Inc. | 29,007 | ||||||
| 668 | Edwards Lifesciences Corp. (a) | 47,228 | ||||||
| 228 | Intuitive Surgical, Inc. (a) | 105,566 | ||||||
| 6,182 | Medtronic, Inc. | 236,461 | ||||||
| 1,868 | St. Jude Medical, Inc. | 64,072 | ||||||
| 1,905 | Stryker Corp. | 94,698 | ||||||
| 659 | Varian Medical Systems, Inc. (a) | 44,239 | ||||||
| 1,050 | Zimmer Holdings, Inc. (a) | 56,091 | ||||||
|
| |||||||
| 1,184,766 | ||||||||
|
| |||||||
Health Care Providers & Services — 2.1% | ||||||||
| 2,122 | Aetna, Inc. | 89,527 | ||||||
| 1,513 | AmerisourceBergen Corp. | 56,268 | ||||||
| 2,024 | Cardinal Health, Inc. | 82,195 | ||||||
| 1,672 | Cigna Corp. | 70,224 | ||||||
| 845 | Coventry Health Care, Inc. (a) | 25,663 | ||||||
| 548 | DaVita, Inc. (a) | 41,544 | ||||||
| 2,850 | Express Scripts, Inc. (a) | 127,366 | ||||||
| 958 | Humana, Inc. | 83,930 | ||||||
| 580 | Laboratory Corp. of America Holdings (a) | 49,863 | ||||||
| 1,438 | McKesson Corp. | 112,035 | ||||||
| 2,268 | Medco Health Solutions, Inc. (a) | 126,781 | ||||||
| 548 | Patterson Cos., Inc. | 16,177 | ||||||
| 924 | Quest Diagnostics, Inc. | 53,647 | ||||||
| 2,544 | Tenet Healthcare Corp. (a) | 13,051 | ||||||
SEE NOTES TO FINANCIAL STATEMENTS.
| DECEMBER 31, 2011 | JPMORGAN INSURANCE TRUST | 7 | ||||||
Table of Contents
JPMorgan Insurance Trust Equity Index Portfolio
SCHEDULE OF PORTFOLIO INVESTMENTS
AS OF DECEMBER 31, 2011 (continued)
| SHARES | SECURITY DESCRIPTION | VALUE($) | ||||||
| Common Stocks — Continued |
| ||||||
Health Care Providers & Services — Continued |
| |||||||
| 6,244 | UnitedHealth Group, Inc. | 316,446 | ||||||
| 2,038 | WellPoint, Inc. | 135,018 | ||||||
|
| |||||||
| 1,399,735 | ||||||||
|
| |||||||
Health Care Technology — 0.1% |
| |||||||
| 853 | Cerner Corp. (a) | 52,246 | ||||||
|
| |||||||
Life Sciences Tools & Services — 0.4% |
| |||||||
| 2,034 | Agilent Technologies, Inc. (a) | 71,048 | ||||||
| 1,044 | Life Technologies Corp. (a) | 40,622 | ||||||
| 662 | PerkinElmer, Inc. | 13,240 | ||||||
| 2,216 | Thermo Fisher Scientific, Inc. (a) | 99,653 | ||||||
| 525 | Waters Corp. (a) | 38,876 | ||||||
|
| |||||||
| 263,439 | ||||||||
|
| |||||||
Pharmaceuticals — 6.2% |
| |||||||
| 9,125 | Abbott Laboratories | 513,099 | ||||||
| 1,787 | Allergan, Inc. | 156,791 | ||||||
| 9,926 | Bristol-Myers Squibb Co. | 349,792 | ||||||
| 5,968 | Eli Lilly & Co. | 248,030 | ||||||
| 1,565 | Forest Laboratories, Inc. (a) | 47,357 | ||||||
| 965 | Hospira, Inc. (a) | 29,307 | ||||||
| 15,996 | Johnson & Johnson | 1,049,018 | ||||||
| 17,853 | Merck & Co., Inc. | 673,058 | ||||||
| 2,498 | Mylan, Inc. (a) | 53,607 | ||||||
| 546 | Perrigo Co. | 53,126 | ||||||
| 45,026 | Pfizer, Inc. | 974,363 | ||||||
| 745 | Watson Pharmaceuticals, Inc. (a) | 44,953 | ||||||
|
| |||||||
| 4,192,501 | ||||||||
|
| |||||||
Total Health Care | 7,903,460 | |||||||
|
| |||||||
Industrials — 10.6% |
| |||||||
Aerospace & Defense — 2.6% |
| |||||||
| 4,353 | Boeing Co. (The) | 319,293 | ||||||
| 2,086 | General Dynamics Corp. | 138,531 | ||||||
| 733 | Goodrich Corp. | 90,672 | ||||||
| 4,531 | Honeywell International, Inc. | 246,260 | ||||||
| 585 | L-3 Communications Holdings, Inc. | 39,008 | ||||||
| 1,554 | Lockheed Martin Corp. | 125,719 | ||||||
| 1,530 | Northrop Grumman Corp. | 89,474 | ||||||
| 845 | Precision Castparts Corp. | 139,247 | ||||||
| 2,027 | Raytheon Co. | 98,066 | ||||||
| 886 | Rockwell Collins, Inc. | 49,058 | ||||||
| 1,629 | Textron, Inc. | 30,120 | ||||||
| 5,307 | United Technologies Corp. | 387,889 | ||||||
|
| |||||||
| 1,753,337 | ||||||||
|
| |||||||
| SHARES | SECURITY DESCRIPTION | VALUE($) | ||||||
Air Freight & Logistics — 1.0% |
| |||||||
| 962 | C.H. Robinson Worldwide, Inc. | 67,128 | ||||||
| 1,242 | Expeditors International of Washington, Inc. | 50,872 | ||||||
| 1,858 | FedEx Corp. | 155,162 | ||||||
| 5,652 | United Parcel Service, Inc., Class B | 413,670 | ||||||
|
| |||||||
| 686,832 | ||||||||
|
| |||||||
Airlines — 0.1% |
| |||||||
| 4,560 | Southwest Airlines Co. | 39,034 | ||||||
|
| |||||||
Building Products — 0.0% (g) |
| |||||||
| 2,096 | Masco Corp. | 21,966 | ||||||
|
| |||||||
Commercial Services & Supplies — 0.4% |
| |||||||
| 616 | Avery Dennison Corp. | 17,667 | ||||||
| 646 | Cintas Corp. | 22,487 | ||||||
| 1,087 | Iron Mountain, Inc. | 33,480 | ||||||
| 1,169 | Pitney Bowes, Inc. | 21,673 | ||||||
| 1,100 | R.R. Donnelley & Sons Co. | 15,873 | ||||||
| 1,844 | Republic Services, Inc. | 50,802 | ||||||
| 499 | Stericycle, Inc. (a) | 38,882 | ||||||
| 2,696 | Waste Management, Inc. | 88,186 | ||||||
|
| |||||||
| 289,050 | ||||||||
|
| |||||||
Construction & Engineering — 0.2% |
| |||||||
| 994 | Fluor Corp. | 49,948 | ||||||
| 751 | Jacobs Engineering Group, Inc. (a) | 30,476 | ||||||
| 1,231 | Quanta Services, Inc. (a) | 26,516 | ||||||
|
| |||||||
| 106,940 | ||||||||
|
| |||||||
Electrical Equipment — 0.5% |
| |||||||
| 926 | Cooper Industries plc | 50,143 | ||||||
| 4,310 | Emerson Electric Co. | 200,803 | ||||||
| 831 | Rockwell Automation, Inc. | 60,970 | ||||||
| 565 | Roper Industries, Inc. | 49,082 | ||||||
|
| |||||||
| 360,998 | ||||||||
|
| |||||||
Industrial Conglomerates — 2.6% |
| |||||||
| 4,105 | 3M Co. | 335,502 | ||||||
| 3,337 | Danaher Corp. | 156,973 | ||||||
| 61,840 | General Electric Co. | 1,107,554 | ||||||
| 2,706 | Tyco International Ltd., (Switzerland) | 126,397 | ||||||
|
| |||||||
| 1,726,426 | ||||||||
|
| |||||||
Machinery — 2.0% |
| |||||||
| 3,788 | Caterpillar, Inc. | 343,193 | ||||||
| 1,130 | Cummins, Inc. | 99,463 | ||||||
| 2,425 | Deere & Co. | 187,574 | ||||||
| 1,086 | Dover Corp. | 63,042 | ||||||
| 1,958 | Eaton Corp. | 85,232 | ||||||
SEE NOTES TO FINANCIAL STATEMENTS.
| 8 | JPMORGAN INSURANCE TRUST | DECEMBER 31, 2011 | ||||
Table of Contents
| SHARES | SECURITY DESCRIPTION | VALUE($) | ||||||
| Common Stocks — Continued |
| ||||||
Machinery — Continued | ||||||||
| 325 | Flowserve Corp. | 32,279 | ||||||
| 2,830 | Illinois Tool Works, Inc. | 132,189 | ||||||
| 1,829 | Ingersoll-Rand plc, (Ireland) | 55,730 | ||||||
| 616 | Joy Global, Inc. | 46,182 | ||||||
| 2,098 | PACCAR, Inc. | 78,612 | ||||||
| 674 | Pall Corp. | 38,519 | ||||||
| 885 | Parker Hannifin Corp. | 67,481 | ||||||
| 341 | Snap-on, Inc. | 17,261 | ||||||
| 989 | Stanley Black & Decker, Inc. | 66,856 | ||||||
| 1,081 | Xylem, Inc. | 27,771 | ||||||
|
| |||||||
| 1,341,384 | ||||||||
|
| |||||||
Professional Services — 0.1% |
| |||||||
| 285 | Dun & Bradstreet Corp. (The) | 21,326 | ||||||
| 709 | Equifax, Inc. | 27,467 | ||||||
| 837 | Robert Half International, Inc. | 23,821 | ||||||
|
| |||||||
| 72,614 | ||||||||
|
| |||||||
Road & Rail — 0.9% |
| |||||||
| 6,150 | CSX Corp. | 129,519 | ||||||
| 1,969 | Norfolk Southern Corp. | 143,461 | ||||||
| 299 | Ryder System, Inc. | 15,889 | ||||||
| 2,830 | Union Pacific Corp. | 299,810 | ||||||
|
| |||||||
| 588,679 | ||||||||
|
| |||||||
Trading Companies & Distributors — 0.2% |
| |||||||
| 1,729 | Fastenal Co. (c) | 75,402 | ||||||
| 355 | W.W. Grainger, Inc. | 66,452 | ||||||
|
| |||||||
| 141,854 | ||||||||
|
| |||||||
Total Industrials | 7,129,114 | |||||||
|
| |||||||
Information Technology — 18.9% |
| |||||||
Communications Equipment — 2.1% |
| |||||||
| 31,489 | Cisco Systems, Inc. | 569,321 | ||||||
| 12 | Comverse Technology, Inc. (a) | 82 | ||||||
| 466 | F5 Networks, Inc. (a) | 49,452 | ||||||
| 678 | Harris Corp. | 24,435 | ||||||
| 1,342 | JDS Uniphase Corp. (a) | 14,011 | ||||||
| 3,081 | Juniper Networks, Inc. (a) | 62,883 | ||||||
| 1,544 | Motorola Mobility Holdings, Inc. (a) | 59,907 | ||||||
| 1,678 | Motorola Solutions, Inc. | 77,675 | ||||||
| 9,846 | QUALCOMM, Inc. | 538,576 | ||||||
|
| |||||||
| 1,396,342 | ||||||||
|
| |||||||
Computers & Peripherals — 4.6% |
| |||||||
| 5,444 | Apple, Inc. (a) | 2,204,820 | ||||||
| 8,945 | Dell, Inc. (a) | 130,865 | ||||||
| 11,949 | EMC Corp. (a) | 257,381 | ||||||
| SHARES | SECURITY DESCRIPTION | VALUE($) | ||||||
Computers & Peripherals — Continued | ||||||||
| 11,639 | Hewlett-Packard Co. | 299,821 | ||||||
| 421 | Lexmark International, Inc., Class A | 13,922 | ||||||
| 2,101 | NetApp, Inc. (a) | 76,203 | ||||||
| 1,408 | SanDisk Corp. (a) | 69,288 | ||||||
| 1,369 | Western Digital Corp. (a) | 42,371 | ||||||
|
| |||||||
| 3,094,671 | ||||||||
|
| |||||||
Electronic Equipment, Instruments & Components — 0.4% |
| |||||||
| 971 | Amphenol Corp., Class A | 44,074 | ||||||
| 9,206 | Corning, Inc. | 119,494 | ||||||
| 914 | FLIR Systems, Inc. | 22,914 | ||||||
| 1,073 | Jabil Circuit, Inc. | 21,095 | ||||||
| 803 | Molex, Inc. | 19,159 | ||||||
| 2,486 | TE Connectivity Ltd., (Switzerland) | 76,594 | ||||||
|
| |||||||
| 303,330 | ||||||||
|
| |||||||
Internet Software & Services — 2.0% |
| |||||||
| 1,051 | Akamai Technologies, Inc. (a) | 33,926 | ||||||
| 6,730 | eBay, Inc. (a) | 204,121 | ||||||
| 1,480 | Google, Inc., Class A (a) | 955,932 | ||||||
| 932 | VeriSign, Inc. | 33,291 | ||||||
| 7,265 | Yahoo!, Inc. (a) | 117,185 | ||||||
|
| |||||||
| 1,344,455 | ||||||||
|
| |||||||
IT Services — 3.9% |
| |||||||
| 3,754 | Accenture plc, (Ireland), Class A | 199,825 | ||||||
| 2,863 | Automatic Data Processing, Inc. | 154,631 | ||||||
| 1,770 | Cognizant Technology Solutions Corp., Class A (a) | 113,829 | ||||||
| 908 | Computer Sciences Corp. | 21,520 | ||||||
| 1,421 | Fidelity National Information Services, Inc. | 37,784 | ||||||
| 825 | Fiserv, Inc. (a) | 48,460 | ||||||
| 6,904 | International Business Machines Corp. | 1,269,508 | ||||||
| 624 | MasterCard, Inc., Class A | 232,640 | ||||||
| 1,889 | Paychex, Inc. | 56,878 | ||||||
| 1,618 | SAIC, Inc. (a) | 19,885 | ||||||
| 981 | Teradata Corp. (a) | 47,588 | ||||||
| 950 | Total System Services, Inc. | 18,582 | ||||||
| 2,979 | Visa, Inc., Class A | 302,458 | ||||||
| 3,627 | Western Union Co. (The) | 66,229 | ||||||
|
| |||||||
| 2,589,817 | ||||||||
|
| |||||||
Office Electronics — 0.1% |
| |||||||
| 8,125 | Xerox Corp. | 64,675 | ||||||
|
| |||||||
Semiconductors & Semiconductor Equipment — 2.3% |
| |||||||
| 3,429 | Advanced Micro Devices, Inc. (a) | 18,517 | ||||||
| 1,879 | Altera Corp. | 69,711 | ||||||
SEE NOTES TO FINANCIAL STATEMENTS.
| DECEMBER 31, 2011 | JPMORGAN INSURANCE TRUST | 9 | ||||||
Table of Contents
JPMorgan Insurance Trust Equity Index Portfolio
SCHEDULE OF PORTFOLIO INVESTMENTS
AS OF DECEMBER 31, 2011 (continued)
| SHARES | SECURITY DESCRIPTION | VALUE($) | ||||||
| Common Stocks — Continued |
| ||||||
Semiconductors & Semiconductor Equipment — Continued |
| |||||||
| 1,745 | Analog Devices, Inc. | 62,436 | ||||||
| 7,648 | Applied Materials, Inc. | 81,910 | ||||||
| 2,841 | Broadcom Corp., Class A (a) | 83,412 | ||||||
| 344 | First Solar, Inc. (a) | 11,613 | ||||||
| 29,826 | Intel Corp. | 723,281 | ||||||
| 976 | KLA-Tencor Corp. | 47,092 | ||||||
| 1,334 | Linear Technology Corp. | 40,060 | ||||||
| 3,301 | LSI Corp. (a) | 19,641 | ||||||
| 1,120 | Microchip Technology, Inc. (c) | 41,026 | ||||||
| 5,785 | Micron Technology, Inc. (a) | 36,388 | ||||||
| 390 | Novellus Systems, Inc. (a) | 16,103 | ||||||
| 3,577 | NVIDIA Corp. (a) | 49,577 | ||||||
| 1,078 | Teradyne, Inc. (a) | 14,693 | ||||||
| 6,693 | Texas Instruments, Inc. | 194,833 | ||||||
| 1,537 | Xilinx, Inc. | 49,276 | ||||||
|
| |||||||
| 1,559,569 | ||||||||
|
| |||||||
Software — 3.5% | ||||||||
| 2,875 | Adobe Systems, Inc. (a) | 81,276 | ||||||
| 1,328 | Autodesk, Inc. (a) | 40,278 | ||||||
| 997 | BMC Software, Inc. (a) | 32,682 | ||||||
| 2,168 | CA, Inc. | 43,826 | ||||||
| 1,092 | Citrix Systems, Inc. (a) | 66,306 | ||||||
| 1,941 | Electronic Arts, Inc. (a) | 39,984 | ||||||
| 1,741 | Intuit, Inc. | 91,559 | ||||||
| 43,854 | Microsoft Corp. | 1,138,450 | ||||||
| 23,048 | Oracle Corp. | 591,181 | ||||||
| 1,130 | Red Hat, Inc. (a) | 46,658 | ||||||
| 797 | Salesforce.com, Inc. (a) | 80,864 | ||||||
| 4,318 | Symantec Corp. (a) | 67,577 | ||||||
|
| |||||||
| 2,320,641 | ||||||||
|
| |||||||
Total Information Technology | 12,673,500 | |||||||
|
| |||||||
Materials — 3.5% | ||||||||
Chemicals — 2.2% | ||||||||
| 1,233 | Air Products & Chemicals, Inc. | 105,039 | ||||||
| 400 | Airgas, Inc. | 31,232 | ||||||
| 383 | CF Industries Holdings, Inc. | 55,527 | ||||||
| 6,922 | Dow Chemical Co. (The) | 199,077 | ||||||
| 5,412 | E.I. du Pont de Nemours & Co. | 247,761 | ||||||
| 806 | Eastman Chemical Co. | 31,482 | ||||||
| 1,758 | Ecolab, Inc. | 101,630 | ||||||
| 413 | FMC Corp. | 35,535 | ||||||
| 474 | International Flavors & Fragrances, Inc. | 24,847 | ||||||
| 3,136 | Monsanto Co. | 219,740 | ||||||
| 1,744 | Mosaic Co. (The) | 87,950 | ||||||
| SHARES | SECURITY DESCRIPTION | VALUE($) | ||||||
Chemicals — Continued | ||||||||
| 905 | PPG Industries, Inc. | 75,559 | ||||||
| 1,756 | Praxair, Inc. | 187,716 | ||||||
| 504 | Sherwin-Williams Co. (The) | 44,992 | ||||||
| 705 | Sigma-Aldrich Corp. | 44,034 | ||||||
|
| |||||||
| 1,492,121 | ||||||||
|
| |||||||
Construction Materials — 0.1% | ||||||||
| 757 | Vulcan Materials Co. | 29,788 | ||||||
|
| |||||||
Containers & Packaging — 0.1% | ||||||||
| 953 | Ball Corp. | 34,032 | ||||||
| 603 | Bemis Co., Inc. | 18,138 | ||||||
| 962 | Owens-Illinois, Inc. (a) | 18,644 | ||||||
| 1,125 | Sealed Air Corp. | 19,361 | ||||||
|
| |||||||
| 90,175 | ||||||||
|
| |||||||
Metals & Mining — 0.9% | ||||||||
| 6,234 | Alcoa, Inc. | 53,924 | ||||||
| 623 | Allegheny Technologies, Inc. | 29,780 | ||||||
| 838 | Cliffs Natural Resources, Inc. | 52,249 | ||||||
| 5,552 | Freeport-McMoRan Copper & Gold, Inc. | 204,258 | ||||||
| 2,898 | Newmont Mining Corp. | 173,909 | ||||||
| 1,855 | Nucor Corp. | 73,402 | ||||||
| 482 | Titanium Metals Corp. | 7,220 | ||||||
| 843 | United States Steel Corp. | 22,306 | ||||||
|
| |||||||
| 617,048 | ||||||||
|
| |||||||
Paper & Forest Products — 0.2% | ||||||||
| 2,560 | International Paper Co. | 75,776 | ||||||
| 1,000 | MeadWestvaco Corp. | 29,950 | ||||||
|
| |||||||
| 105,726 | ||||||||
|
| |||||||
Total Materials | 2,334,858 | |||||||
|
| |||||||
Telecommunication Services — 3.1% | ||||||||
Diversified Telecommunication Services — 2.8% |
| |||||||
| 34,711 | AT&T, Inc. | 1,049,661 | ||||||
| 3,618 | CenturyLink, Inc. | 134,590 | ||||||
| 5,829 | Frontier Communications Corp. | 30,019 | ||||||
| 16,583 | Verizon Communications, Inc. | 665,310 | ||||||
| 3,414 | Windstream Corp. | 40,080 | ||||||
|
| |||||||
| 1,919,660 | ||||||||
|
| |||||||
Wireless Telecommunication Services — 0.3% |
| |||||||
| 2,302 | American Tower Corp., Class A | 138,143 | ||||||
| 1,719 | MetroPCS Communications, Inc. (a) | 14,921 | ||||||
| 17,548 | Sprint Nextel Corp. (a) | 41,062 | ||||||
|
| |||||||
| 194,126 | ||||||||
|
| |||||||
Total Telecommunication Services | 2,113,786 | |||||||
|
| |||||||
SEE NOTES TO FINANCIAL STATEMENTS.
| 10 | JPMORGAN INSURANCE TRUST | DECEMBER 31, 2011 | ||||
Table of Contents
| SHARES | SECURITY DESCRIPTION | VALUE($) | ||||||
| Common Stocks — Continued | |||||||
Utilities — 3.8% | ||||||||
Electric Utilities — 2.1% | ||||||||
| 2,829 | American Electric Power Co., Inc. | 116,866 | ||||||
| 7,806 | Duke Energy Corp. | 171,732 | ||||||
| 1,908 | Edison International | 78,991 | ||||||
| 1,032 | Entergy Corp. | 75,388 | ||||||
| 3,884 | Exelon Corp. | 168,449 | ||||||
| 2,450 | FirstEnergy Corp. | 108,535 | ||||||
| 2,475 | NextEra Energy, Inc. | 150,678 | ||||||
| 1,037 | Northeast Utilities | 37,405 | ||||||
| 1,329 | Pepco Holdings, Inc. | 26,979 | ||||||
| 640 | Pinnacle West Capital Corp. | 30,835 | ||||||
| 3,387 | PPL Corp. | 99,645 | ||||||
| 1,728 | Progress Energy, Inc. | 96,803 | ||||||
| 5,049 | Southern Co. (The) | 233,718 | ||||||
|
| |||||||
| 1,396,024 | ||||||||
|
| |||||||
Gas Utilities — 0.1% | ||||||||
| 684 | AGL Resources, Inc. | 28,906 | ||||||
| 603 | ONEOK, Inc. | 52,274 | ||||||
|
| |||||||
| 81,180 | ||||||||
|
| |||||||
Independent Power Producers & Energy Traders — 0.2% |
| |||||||
| 3,777 | AES Corp. (The) (a) | 44,720 | ||||||
| 1,181 | Constellation Energy Group, Inc. | 46,850 | ||||||
| 1,347 | NRG Energy, Inc. (a) | 24,407 | ||||||
|
| |||||||
| 115,977 | ||||||||
|
| |||||||
Multi-Utilities — 1.4% | ||||||||
| 1,419 | Ameren Corp. | 47,011 | ||||||
| 2,495 | CenterPoint Energy, Inc. | 50,125 | ||||||
| 1,476 | CMS Energy Corp. (c) | 32,590 | ||||||
| 1,716 | Consolidated Edison, Inc. | 106,443 | ||||||
| 3,336 | Dominion Resources, Inc. | 177,075 | ||||||
| 991 | DTE Energy Co. | 53,960 | ||||||
| 456 | Integrys Energy Group, Inc. | 24,706 | ||||||
| 1,647 | NiSource, Inc. | 39,215 | ||||||
| 2,377 | PG&E Corp. | 97,980 | ||||||
| 2,963 | Public Service Enterprise Group, Inc. | 97,809 | ||||||
| 676 | SCANA Corp. | 30,461 | ||||||
| 1,404 | Sempra Energy | 77,220 | ||||||
| 1,264 | TECO Energy, Inc. | 24,193 | ||||||
| 1,355 | Wisconsin Energy Corp. | 47,371 | ||||||
| 2,841 | Xcel Energy, Inc. | 78,525 | ||||||
|
| |||||||
| 984,684 | ||||||||
|
| |||||||
Total Utilities | 2,577,865 | |||||||
|
| |||||||
Total Common Stocks | 66,678,111 | |||||||
|
| |||||||
| SHARES | SECURITY DESCRIPTION | VALUE($) | ||||||
| Preferred Stock — 0.0% | |||||||
Consumer Discretionary — 0.0% | ||||||||
Specialty Retail — 0.0% | ||||||||
| 10 | Orchard Supply Hardware Stores Corp., Series A, Zero Coupon (a) (f) (i) (x) | — | ||||||
|
| |||||||
| NUMBER OF WARRANTS | ||||||||
| Warrant — 0.0% (g) | |||||||
Financials — 0.0% (g) | ||||||||
Insurance — 0.0% (g) | ||||||||
| 492 | American International Group, Inc., expiring 01/19/21 (a) | 2,711 | ||||||
|
| |||||||
| SHARES | ||||||||
| Short-Term Investments — 0.7% | |||||||
Investment Company — 0.6% | ||||||||
| 406,181 | JPMorgan Liquid Assets Money Market Fund, Institutional Class Shares, 0.110% (b) (l) (m) | 406,181 | ||||||
|
| |||||||
| PRINCIPAL AMOUNT($) | ||||||||
U.S. Treasury Obligations — 0.1% | ||||||||
U.S. Treasury Bills | ||||||||
| 25,000 | 0.014%, 03/15/12 (k) (n) | 24,999 | ||||||
| 75,000 | 0.019%, 02/16/12 (k) (n) | 74,999 | ||||||
|
| |||||||
| 99,998 | ||||||||
|
| |||||||
Total Short-Term Investments | 506,179 | |||||||
|
| |||||||
| SHARES | ||||||||
| Investment of Cash Collateral for Securities on Loan — 0.1% |
| ||||||
Investment Company — 0.1% | ||||||||
| 99,122 | JPMorgan Prime Money Market Fund, Capital Shares, 0.120% (b) (l) | 99,122 | ||||||
|
| |||||||
Total Investments — 100.1% | 67,286,123 | |||||||
Liabilities in Excess of | (97,903 | ) | ||||||
|
| |||||||
NET ASSETS — 100.0% | $ | 67,188,220 | ||||||
|
| |||||||
Percentages indicated are based on net assets.
SEE NOTES TO FINANCIAL STATEMENTS.
| DECEMBER 31, 2011 | JPMORGAN INSURANCE TRUST | 11 | ||||||
Table of Contents
JPMorgan Insurance Trust Equity Index Portfolio
SCHEDULE OF PORTFOLIO INVESTMENTS
AS OF DECEMBER 31, 2011 (continued)
| Futures Contracts | ||||||||||||||||
| NUMBER OF CONTRACTS | DESCRIPTION | EXPIRATION DATE | NOTIONAL VALUE AT 12/31/11 | UNREALIZED APPRECIATION (DEPRECIATION) | ||||||||||||
Long Futures Outstanding | ||||||||||||||||
| 8 | E-mini S&P 500 | 03/16/12 | $ | 501,040 | $ | 10,748 | ||||||||||
|
| |||||||||||||||
NOTES TO SCHEDULE OF PORTFOLIO INVESTMENTS:
| (a) | — Non-income producing security. | |
| (b) | — Investment in affiliate. Money market fund registered under the Investment Company Act of 1940, as amended, and advised by J.P. Morgan Investment Management Inc. | |
| (c) | — Security, or a portion of the security, has been delivered to a counterparty as part of a security lending transaction. | |
| (f) | — Security is fair valued in accordance with procedures established by and under the supervision and responsibility of the Board of Trustees. The Portfolio owns fair valued securities with a value of $0 which amounts to 0.0% of total investments. | |
| (g) | — Amount rounds to less than 0.1%. | |
| (i) | — Security has been deemed illiquid pursuant to procedures approved by the Board of Trustees and may be difficult to sell. | |
| (k) | — All or a portion of this security is deposited with the broker as collateral for futures or with brokers as initial margin for futures contracts. |
| (l) | — The rate shown is the current yield as of December 31, 2011. | |
| (m) | — All or a portion of this security is reserved and/or pledged with the custodian for current or potential holdings of futures, swaps, options, TBAs, when-issued securities, delayed delivery securities, reverse repurchase agreements, unfunded commitments and/or forward foreign currency exchange contracts. | |
| (n) | — The rate shown is the effective yield at the date of purchase. | |
| (q) | — Investment in affiliate. This security is included in an index in which the Portfolio, as an index fund, invests. | |
| (x) | — Security is perpetual and, thus, does not have a predetermined maturity date. The coupon rate for this security is fixed for a period of time and may be structured to adjust thereafter. The date shown, if applicable, reflects the next call date. The coupon rate shown is the rate in effect as of December 31, 2011. |
SEE NOTES TO FINANCIAL STATEMENTS.
| 12 | JPMORGAN INSURANCE TRUST | DECEMBER 31, 2011 | ||||
Table of Contents
STATEMENT OF ASSETS AND LIABILITIES
AS OF DECEMBER 31, 2011
| Equity Index Portfolio | ||||
ASSETS: | ||||
Investments in non-affiliates, at value | $ | 66,041,573 | ||
Investments in affiliates, at value | 1,244,550 | |||
|
| |||
Total investment securities, at value | 67,286,123 | |||
Receivables: | ||||
Investment securities sold | 11,302 | |||
Dividends from non-affiliates | 100,944 | |||
Dividends from affiliates | 69 | |||
Securities lending income | 24 | |||
|
| |||
Total Assets | 67,398,462 | |||
|
| |||
LIABILITIES: | ||||
Payables: | ||||
Due to custodian | 4 | |||
Collateral for securities lending program | 99,122 | |||
Portfolio shares redeemed | 32,380 | |||
Variation margin on futures contracts | 1,920 | |||
Accrued liabilities: | ||||
Investment advisory fees | 13,131 | |||
Administration fees | 4,402 | |||
Custodian and accounting fees | 12,866 | |||
Trustees’ and Chief Compliance Officer’s fees | 543 | |||
Printing & mailing costs | 23,020 | |||
Audit fees | 21,691 | |||
Other | 1,163 | |||
|
| |||
Total Liabilities | 210,242 | |||
|
| |||
Net Assets | $ | 67,188,220 | ||
|
| |||
NET ASSETS: | ||||
Paid in capital | $ | 66,283,301 | ||
Accumulated undistributed net investment income | 1,195,161 | |||
Accumulated net realized gains (losses) | (11,173,543 | ) | ||
Net unrealized appreciation (depreciation) | 10,883,301 | |||
|
| |||
Total Net Assets | $ | 67,188,220 | ||
|
| |||
Outstanding units of beneficial interest (shares) | ||||
(unlimited number of shares authorized, no par value): | 6,146,380 | |||
Net Asset Value, offering and redemption price per share (a) | $ | 10.93 | ||
|
| |||
Cost of investments in non-affiliates | $ | 55,125,446 | ||
Cost of investments in affiliates | 1,288,124 | |||
Value of securities on loan | 95,923 | |||
| (a) | Per share amounts may not recalculate due to rounding of net assets and/or shares outstanding. |
SEE NOTES TO FINANCIAL STATEMENTS.
| DECEMBER 31, 2011 | JPMORGAN INSURANCE TRUST | 13 | ||||||
Table of Contents
STATEMENT OF OPERATIONS
FOR THE YEAR ENDED DECEMBER 31, 2011
| Equity Index Portfolio | ||||
INVESTMENT INCOME: | ||||
Interest income from non-affiliates | $ | 66 | ||
Dividend income from non-affiliates | 1,476,041 | |||
Dividend income from affiliates | 20,143 | |||
Income from securities lending (net) | 3,280 | |||
Other income | 996 | |||
|
| |||
Total investment income | 1,500,526 | |||
|
| |||
EXPENSES: | ||||
Investment advisory fees | 180,084 | |||
Administration fees | 63,780 | |||
Custodian and accounting fees | 30,890 | |||
Interest expense to affiliates | 35 | |||
Professional fees | 44,826 | |||
Trustees’ and Chief Compliance Officer’s fees | 777 | |||
Printing and mailing costs | 30,029 | |||
Transfer agent fees | 876 | |||
Other | 11,794 | |||
|
| |||
Total expenses | 363,091 | |||
|
| |||
Less amounts waived | (76,236 | ) | ||
Less earnings credits | (1 | ) | ||
|
| |||
Net expenses | 286,854 | |||
|
| |||
Net investment income (loss) | 1,213,672 | |||
|
| |||
REALIZED/UNREALIZED GAINS (LOSSES): | ||||
Net realized gain (loss) on transactions from: | ||||
Investments in non-affiliates | 1,622,272 | |||
Investments in affiliates | 30,462 | |||
Futures | 138,290 | |||
|
| |||
Net realized gain (loss) | 1,791,024 | |||
|
| |||
Change in net unrealized appreciation (depreciation) of: | ||||
Investments in non-affiliates | (1,204,056 | ) | ||
Investments in affiliates | (247,856 | ) | ||
Futures | (10,931 | ) | ||
|
| |||
Change in net unrealized appreciation (depreciation) | (1,462,843 | ) | ||
|
| |||
Net realized/unrealized gains (losses) | 328,181 | |||
|
| |||
Change in net assets resulting from operations | $ | 1,541,853 | ||
|
| |||
SEE NOTES TO FINANCIAL STATEMENTS.
| 14 | JPMORGAN INSURANCE TRUST | DECEMBER 31, 2011 | ||||
Table of Contents
STATEMENTS OF CHANGES IN NET ASSETS
FOR THE PERIODS INDICATED
| Equity Index Portfolio | ||||||||
| Year Ended 12/31/2011 | Year Ended 12/31/2010 | |||||||
CHANGE IN NET ASSETS RESULTING FROM OPERATIONS: | ||||||||
Net investment income (loss) | $ | 1,213,672 | $ | 1,293,343 | ||||
Net realized gain (loss) | 1,791,024 | (1,205,688 | ) | |||||
Change in net unrealized appreciation (depreciation) | (1,462,843 | ) | 10,815,626 | |||||
|
|
|
| |||||
Change in net assets resulting from operations | 1,541,853 | 10,903,281 | ||||||
|
|
|
| |||||
DISTRIBUTIONS TO SHAREHOLDERS: | ||||||||
From net investment income | (1,278,018 | ) | (1,708,349 | ) | ||||
|
|
|
| |||||
CAPITAL TRANSACTIONS: | ||||||||
Proceeds from shares issued | $ | 3,282,256 | $ | 8,654,954 | ||||
Dividends and distributions reinvested | 1,278,018 | 1,708,349 | ||||||
Cost of shares redeemed | (16,509,932 | ) | (22,700,057 | ) | ||||
|
|
|
| |||||
Total change in net assets from capital transactions | $ | (11,949,658 | ) | $ | (12,336,754 | ) | ||
|
|
|
| |||||
NET ASSETS: | ||||||||
Change in net assets | (11,685,823 | ) | (3,141,822 | ) | ||||
Beginning of period | 78,874,043 | 82,015,865 | ||||||
|
|
|
| |||||
End of period | $ | 67,188,220 | $ | 78,874,043 | ||||
|
|
|
| |||||
Accumulated undistributed net investment income | $ | 1,195,161 | $ | 1,282,162 | ||||
|
|
|
| |||||
SHARE TRANSACTIONS: | ||||||||
Issued | 315,176 | 912,867 | ||||||
Reinvested | 113,300 | 163,949 | ||||||
Redeemed | (1,496,562 | ) | (2,277,311 | ) | ||||
|
|
|
| |||||
Change in Shares | (1,068,086 | ) | (1,200,495 | ) | ||||
|
|
|
| |||||
SEE NOTES TO FINANCIAL STATEMENTS.
| DECEMBER 31, 2011 | JPMORGAN INSURANCE TRUST | 15 | ||||||
Table of Contents
FOR THE PERIODS INDICATED
| Per share operating performance | ||||||||||||||||||||
| Investment operations | Distributions | |||||||||||||||||||
| Net asset value, beginning of period | Net investment income (loss) | Net realized and unrealized gains (losses) on investments | Total from investment operations | Net investment income | ||||||||||||||||
Equity Index Portfolio | ||||||||||||||||||||
Year Ended December 31, 2011 | $ | 10.93 | $ | 0.19 | (c) | $ | — | (d) | $ | 0.19 | $ | (0.19 | ) | |||||||
Year Ended December 31, 2010 | 9.75 | 0.16 | (c) | 1.23 | 1.39 | (0.21 | ) | |||||||||||||
Year Ended December 31, 2009 | 7.93 | 0.20 | 1.83 | 2.03 | (0.21 | ) | ||||||||||||||
Year Ended December 31, 2008 | 12.87 | 0.21 | (c) | (4.93 | ) | (4.72 | ) | (0.22 | ) | |||||||||||
Year Ended December 31, 2007 | 12.43 | 0.22 | 0.41 | 0.63 | (0.19 | ) | ||||||||||||||
| (a) | Includes adjustments in accordance with accounting principles generally accepted in the United States of America and as such, the net asset value for financial reporting purposes and the returns based upon those net asset values may differ from the net asset value and returns for shareholder transactions. |
| (b) | Includes earnings credits and interest expense, each of which is less than 0.01%, if applicable or unless otherwise noted. |
| (c) | Calculated based upon average shares outstanding. |
| (d) | Amount rounds to less than $0.01. |
SEE NOTES TO FINANCIAL STATEMENTS.
| 16 | JPMORGAN INSURANCE TRUST | DECEMBER 31, 2011 | ||||
Table of Contents
| Ratios/Supplemental data | |||||||||||||||||||||||||
| Ratios to average net assets | ||||||||||||||||||||||||||
| Net asset value, end of period | Total return (a) | Net assets, end of period | Net expenses (b) | Net investment income (loss) | Expenses without waivers, reimbursements and earnings credits | Portfolio turnover rate | ||||||||||||||||||||
| $ | 10.93 | 1.71 | % | $ | 67,188,220 | 0.40 | % | 1.69 | % | 0.50 | % | 4 | % | |||||||||||||
| 10.93 | 14.41 | 78,874,043 | 0.40 | 1.67 | 0.60 | 11 | ||||||||||||||||||||
| 9.75 | 26.44 | 82,015,865 | 0.40 | 2.25 | 0.62 | 13 | ||||||||||||||||||||
| 7.93 | (37.21 | ) | 74,329,183 | 0.40 | 1.95 | 0.52 | 12 | |||||||||||||||||||
| 12.87 | 5.10 | 132,032,146 | 0.40 | 1.56 | 0.53 | 6 | ||||||||||||||||||||
SEE NOTES TO FINANCIAL STATEMENTS.
| DECEMBER 31, 2011 | JPMORGAN INSURANCE TRUST | 17 | ||||||
Table of Contents
AS OF DECEMBER 31, 2011
1. Organization
JPMorgan Insurance Trust (the “Trust”) is registered under the Investment Company Act of 1940, as amended (the “1940 Act”), as an open-end management investment company and is a Massachusetts business trust.
The following is a separate Portfolio of the Trust (the “Portfolio”) covered by this report:
| Classes Offered | Diversified/Non-Diversified | |||
| Equity Index Portfolio | Class 1 | Diversified |
The investment objective of the Portfolio is to seek investment results that correspond to the aggregate price and dividend performance of securities in the Standard & Poor’s 500 Composite Stock Price Index (S&P 500 Index).
Portfolio shares are offered only to separate accounts of participating insurance companies and Eligible Plans. Individuals may not purchase shares directly from the Portfolio.
2. Significant Accounting Policies
The following is a summary of significant accounting policies followed by the Trust in the preparation of its financial statements. The policies are in accordance with accounting principles generally accepted in the United States of America. The preparation of financial statements requires management to make estimates and assumptions that affect the reported amounts of assets and liabilities at the date of the financial statements and the reported amounts of income and expenses for the period. Actual results could differ from those estimates.
A. Valuation of Investments — Equity securities listed on a North American, Central American, South American or Caribbean securities exchange shall generally be valued at the last sale price on the exchange on which the security is principally traded that is reported before the time when the net assets of the Portfolio are valued. The value of securities listed on The NASDAQ Stock Market LLC shall generally be the NASDAQ Official Closing Price. Fixed income securities (other than certain short-term investments maturing in less than 61 days) are valued each day based on prices received from independent or affiliated pricing services approved by the Board of Trustees or third party broker-dealers. The broker-dealers or pricing services use multiple valuation techniques to determine fair value. In instances where sufficient market activity exists, the broker-dealers or pricing services may utilize a market-based approach through which quotes from market makers are used to determine fair value. In instances where sufficient market activity may not exist or is limited, the broker-dealers or pricing services also utilize proprietary valuation models which may consider market transactions in comparable securities and the various relationships between securities in determining value and/or market characteristics such as benchmark yield curves, option-adjusted spreads, credit spreads, estimated default rates, coupon-rates, anticipated timing of principal repayments, underlying collateral, and other unique security features in order to estimate the relevant cash flows, which are then discounted to calculate the fair values. Generally, short-term investments of sufficient credit quality maturing in less than 61 days are valued at amortized cost, which approximates market value. Certain investments of the Portfolio may, depending upon market conditions, trade in relatively thin markets and/or in markets that experience significant volatility. As a result of these conditions, the prices used by the Portfolio to value securities may differ from the value that would be realized if these securities were sold, and the differences could be material. Futures and options shall generally be valued on the basis of available market quotations. Swaps and other derivatives are valued daily, primarily using independent or affiliated pricing services approved by the Board of Trustees. If valuations are not available from such services or values received are deemed not representative of market value, values will be obtained from a third party broker-dealer or counterparty. Investments in other open-end investment companies are valued at such investment company’s net asset value per share as of the report date.
Securities or other assets for which market quotations are not readily available or for which market quotations do not represent the value at the time of pricing (including certain illiquid securities) are fair valued in accordance with procedures established by and under the supervision and responsibility of the Board of Trustees. Under these procedures, the Portfolio primarily employs a market-based approach which may use related or comparable assets or liabilities, recent transactions, market multiples, book values, and other relevant information for the investment to determine the fair value of the investment. The Portfolio may also use an income-based valuation approach in which the anticipated future cash flows of the investment are discounted to calculate fair value. Discounts may also be applied due to the nature or duration of any restrictions on the disposition of the investments. Valuations may be based upon current market prices of securities that are comparable in coupon, rating, maturity and industry. It is possible that the estimated values may differ significantly from the values that would have been used had a ready market for the investments existed, and such differences could be material. Trading in securities on most foreign exchanges and over-the-counter markets is normally completed before the close of the domestic market and may also take place on days when the domestic market is closed. In accordance with procedures adopted by the Board of Trustees, the Portfolio applies fair value pricing on equity securities on a daily basis except for North American, Central American, South American and Caribbean equity securities held in its portfolio by utilizing the quotations of an independent pricing service, unless the Portfolio’s advisor determines that use of another valuation methodology is appropriate. The pricing service uses statistical analyses and quantitative models to adjust local market prices using factors such as subsequent movement and changes in the prices of indices, securities and exchange rates in other markets, in determining fair value as of the time the Portfolio calculates its net asset value.
Valuations reflected in this report are as of the report date. As a result, changes in valuation due to market events and/or issuer related events after the report date and prior to issuance of the report are not reflected herein.
| 18 | JPMORGAN INSURANCE TRUST | DECEMBER 31, 2011 | ||||
Table of Contents
The various inputs that are used in determining the fair value of the Portfolio’s investments are summarized into the three broad levels listed below.
| Ÿ | Level 1 — quoted prices in active markets for identical securities |
| Ÿ | Level 2 — other significant observable inputs (including quoted prices for similar securities, interest rates, prepayment speeds, credit risk, etc.) |
| Ÿ | Level 3 — significant unobservable inputs (including the Portfolio’s own assumptions in determining the fair value of investments) |
A financial instrument’s level within the fair value hierarchy is based on the lowest level of any input both individually and in aggregate that is significant to the fair value measurement. The inputs or methodology used for valuing securities are not necessarily an indication of the risk associated with investing in those securities.
The following table represents each valuation input by sector as presented on the Schedule of Portfolio Investments (“SOI”):
Level 1 Quoted prices | Level 2 Other significant observable inputs | Level 3 Significant unobservable inputs | Total | |||||||||||||
Investments in Securities | ||||||||||||||||
Common Stocks | ||||||||||||||||
Consumer Discretionary | $ | 7,116,280 | $ | — | $ | — | (a) | $ | 7,116,280 | |||||||
Consumer Staples | 7,693,283 | — | — | 7,693,283 | ||||||||||||
Energy | 8,179,983 | — | — | 8,179,983 | ||||||||||||
Financials | 8,955,982 | — | — | 8,955,982 | ||||||||||||
Health Care | 7,903,460 | — | — | 7,903,460 | ||||||||||||
Industrials | 7,129,114 | — | — | 7,129,114 | ||||||||||||
Information Technology | 12,673,500 | — | — | 12,673,500 | ||||||||||||
Materials | 2,334,858 | — | — | 2,334,858 | ||||||||||||
Telecommunication Services | 2,113,786 | — | — | 2,113,786 | ||||||||||||
Utilities | 2,577,865 | — | — | 2,577,865 | ||||||||||||
|
|
|
|
|
|
|
| |||||||||
Total Common Stocks | 66,678,111 | — | — | (a) | 66,678,111 | |||||||||||
|
|
|
|
|
|
|
| |||||||||
Preferred Stock | ||||||||||||||||
Consumer Discretionary | — | — | — | (a) | — | (a) | ||||||||||
Warrants | ||||||||||||||||
Financials | — | 2,711 | — | 2,711 | ||||||||||||
Short-Term Investments | ||||||||||||||||
Investment Company | 406,181 | — | — | 406,181 | ||||||||||||
U.S. Treasury Obligations | — | 99,998 | — | 99,998 | ||||||||||||
|
|
|
|
|
|
|
| |||||||||
Total Short-Term Investments | 406,181 | 99,998 | — | 506,179 | ||||||||||||
|
|
|
|
|
|
|
| |||||||||
Investment of Cash Collateral for Securities on Loan | 99,122 | — | — | 99,122 | ||||||||||||
|
|
|
|
|
|
|
| |||||||||
Total Investments in Securities | $ | 67,183,414 | $ | 102,709 | $ | — | (a) | $ | 67,286,123 | |||||||
|
|
|
|
|
|
|
| |||||||||
Appreciation in Other Financial Instruments | ||||||||||||||||
Futures Contracts | $ | 10,748 | $ | — | $ | — | $ | 10,748 | ||||||||
|
|
|
|
|
|
|
| |||||||||
| (a) | Security has zero value. |
There were no transfers between Levels 1 and 2 during the year ended December 31, 2011.
The following is a summary of investments for which significant unobservable inputs (Level 3) were used in determining fair value:
| Balance as of 12/31/10 | Realized gain (loss) | Change in unrealized appreciation (depreciation) | Net amortization (accretion) | Purchases1 | Sales2 | Transfers Level 3 | Transfers out of Level 3 | Balance as of 12/31/11 | ||||||||||||||||||||||||||||
Investments in Securities | ||||||||||||||||||||||||||||||||||||
Common Stocks — Consumer Discretionary | $ | — | $ | — | $ | — | $ | — | $ | — | (a) | $ | — | $ | — | $ | — | $ | — | (a) | ||||||||||||||||
Preferred Stocks — Consumer Discretionary | — | — | — | — | — | (a) | — | — | — | — | (a) | |||||||||||||||||||||||||
|
|
|
|
|
|
|
|
|
|
|
|
|
|
|
|
|
| |||||||||||||||||||
Total | $ | — | $ | — | $ | — | $ | — | $ | — | (a) | $ | — | $ | — | $ | — | $ | — | (a) | ||||||||||||||||
|
|
|
|
|
|
|
|
|
|
|
|
|
|
|
|
|
| |||||||||||||||||||
| 1 | Purchases include all purchases of securities and securities received in corporate actions. |
| 2 | Sales include all sales of securities, maturities, paydowns and securities tendered in a corporate action. |
| (a) | Security has zero value. |
| DECEMBER 31, 2011 | JPMORGAN INSURANCE TRUST | 19 | ||||||
Table of Contents
NOTES TO FINANCIAL STATEMENTS
AS OF DECEMBER 31, 2011 (continued)
The change in unrealized appreciation (depreciation) attributable to securities owned at December 31, 2011, which were valued using significant unobservable inputs (Level 3), amounted to zero. This amount is included in Change in net unrealized appreciation (depreciation) of investments in non-affiliates on the Statement of Operations.
B. Restricted and Illiquid Securities — Certain securities held by the Portfolio may be subject to legal or contractual restrictions on resale or are illiquid. Restricted securities generally are resold in transactions exempt from registration under the Securities Act of 1933. An illiquid security is a security which cannot be disposed of promptly (within seven days) and in the usual course of business at approximately its fair value and includes, but is not limited to, repurchase agreements maturing in excess of seven days, time deposits with a withdrawal penalty, non-negotiable instruments and instruments for which no market exists. Disposal of these securities may involve time-consuming negotiations and expense. Prompt sale at the current valuation may be difficult and could adversely affect the net assets of the Portfolio.
The value and percentage of net assets of illiquid securities as of December 31, 2011 was zero.
C. Futures Contracts — The Portfolio uses index futures contracts to gain or reduce exposure to the stock market, maintain liquidity and minimize transaction costs. The Portfolio buys futures contracts to immediately invest incoming cash in the market or sells futures in response to cash outflows, thereby simulating an invested position in the underlying index while maintaining a cash balance for liquidity. The use of futures contracts exposes the Portfolio to equity price risk.
Futures contracts provide for the delayed delivery of the underlying instrument at a fixed price or for a cash amount based on the change in the value of the underlying instrument at a specific date in the future. Upon entering into a futures contract, the Portfolio is required to deposit with the broker, cash or securities in an amount equal to a certain percentage of the contract amount which is referred to as the initial margin deposit. Subsequent payments, referred to as variation margin, are made or received by the Portfolio periodically and are based on changes in the market value of open futures contracts. Changes in the market value of open futures contracts are recorded as unrealized appreciation or depreciation in the Statement of Operations. Realized gains or losses, representing the difference between the value of the contract at the time it was opened and the value at the time it was closed, are reported in the Statement of Operations at the closing or expiration of futures contracts. Securities deposited as initial margin are designated in the SOI and cash deposited is recorded on the Statement of Assets and Liabilities. A receivable from and/or a payable to brokers for the daily variation margin is also recorded on the Statement of Assets and Liabilities.
The Portfolio may be subject to the risk that the change in the value of the futures contract may not correlate perfectly with the underlying instrument. Use of long futures contracts subjects the Portfolio to risk of loss in excess of the amounts shown on the Statement of Assets and Liabilities, up to the notional amount of the futures contracts. Use of short futures contracts subjects the Portfolio to unlimited risk of loss. The Portfolio may enter into futures contracts only on exchanges or boards of trade. The exchange or board of trade acts as the counterparty to each futures transaction; therefore, the Portfolio’s credit risk is limited to failure of the exchange or board of trade. Under some circumstances, futures exchanges may establish daily limits on the amount that the price of a futures contract can vary from the previous day’s settlement price, which could effectively prevent liquidation of unfavorable positions.
The table below discloses the volume of the Portfolio’s futures activities during the year ended December 31, 2011:
Futures Contracts: | ||||
Average Notional Balance Long | $ | 978,295 | ||
Ending Notional Balance Long | 501,040 |
D. Transactions with Affiliates — An issuer which is under common control with the Portfolio may be considered an affiliate. For the purposes of the report, the Portfolio assumes the following to be affiliated issuers:
| For the year ended December 31, 2011 | ||||||||||||||||||||||||||||
| Affiliate | Value at December 31, | Purchase Cost | Sales Proceeds | Realized Gain/(Loss) | Dividend Income | Shares at December 31, | Value at December 31, 2011 | |||||||||||||||||||||
JPMorgan Chase & Co. (Common Stock)* | $ | 1,117,852 | $ | 27,775 | $ | 188,986 | $ | 30,462 | $ | 19,487 | 22,233 | $ | 739,247 | |||||||||||||||
JPMorgan Liquid Assets Money Market Fund, Institutional Class Shares | 324,385 | 15,894,158 | 15,812,362 | — | 656 | 406,181 | 406,181 | |||||||||||||||||||||
JPMorgan Prime Money Market Fund, Capital Shares** | 894,110 | 1,021,573 | 1,816,561 | — | 316 | 99,122 | 99,122 | |||||||||||||||||||||
|
|
|
|
|
|
|
| |||||||||||||||||||||
Total | $ | 2,336,347 | $ | 30,462 | $ | 20,459 | $ | 1,244,550 | ||||||||||||||||||||
|
|
|
|
|
|
|
| |||||||||||||||||||||
| * | Security is included in an index in which the Fund, as an index fund, invests. |
| ** | Represents investment of cash collateral related to securities on loan, as described in Note 2.E. Dividend income earned from this investment is included in Income from securities lending (net) in the Statement of Operations. |
E. Securities Lending — The Portfolio may lend securities to brokers approved by J.P. Morgan Investment Management Inc. (“JPMIM” or the “Advisor”) in order to generate additional income. The Goldman Sachs Bank USA, doing business as Goldman Sachs Agency Lending (“GSAL”), serves as lending agent for the Portfolio pursuant to a Securities Lending Agreement (the “GSAL Securities Lending Agreement”). Securities loaned are
| 20 | JPMORGAN INSURANCE TRUST | DECEMBER 31, 2011 | ||||
Table of Contents
collateralized by cash, which is invested in Capital Shares of the JPMorgan Prime Money Market Fund. Upon termination of the loan, the Portfolio is required to return to the borrower the posted cash collateral. Loans are subject to termination by the Portfolio or the borrower at any time.
Securities lending income is comprised of income earned on cash collateral investments (“Collateral Investments”), net of a rebate received from or paid to borrowers for use of cash collateral and lending agent fees. This amount is recorded as Income from securities lending (net) on the Statement of Operations. The Portfolio also receives payments from the borrower during the period of the loan, equivalent to dividends and interest earned on the securities loaned, which are recorded as Dividend or Interest income, respectively, on the Statement of Operations.
For the year ended December 31, 2011, the Portfolio earned $316 from the investment of cash collateral, prior to rebates or fees, from an investment in an affiliated fund as described below.
At the inception of a loan, securities are exchanged for cash collateral equal to at least 102% of the value of loaned U.S. dollar-denominated securities, plus accrued interest. The GSAL Securities Lending Agreement requires that the loaned securities be marked to market on a daily basis and additional cash collateral is requested from borrowers when the cash received from borrowers becomes less than 102% of the value of loaned securities.
The value of the cash collateral received is recorded as a liability on the Statement of Assets and Liabilities and details of Collateral Investments are disclosed in the SOI. At December 31, 2011, the value of outstanding securities on loan and the value of Collateral Investments were as follows:
| Value of Securities on Loan | Cash Collateral Posted by Borrower | Total Value of Collateral Investments | ||||||||||
| $ | 95,923 | $ | 99,122 | $ | 99,122 | |||||||
The Portfolio bears the risk of loss associated with the Collateral Investments and is not entitled to additional collateral from the borrower to cover any such losses. To the extent that the value of the Collateral Investments declines below the amount owed to a borrower, the Portfolio may incur losses that exceed the amount it earned on lending the security. Upon termination of a loan, the Portfolio may use leverage (borrow money) to repay the borrower for cash collateral posted if the Advisor does not believe that it is prudent to sell the Collateral Investments to fund the payment of this liability.
Securities lending also involves counterparty risks, including the risk that the loaned securities may not be returned in a timely manner or at all. Subject to certain conditions, GSAL has agreed to indemnify the Portfolio from losses resulting from a borrower’s failure to return a loaned security.
The Advisor waived fees associated with the Portfolio’s investment in JPMorgan Prime Money Market Fund in the amount of $244. This amount offsets the administration fees and shareholder servicing fees incurred by JPMorgan Prime Money Market Fund related to the Portfolio’s investment in such fund. A portion of the waiver is voluntary.
F. Security Transactions and Investment Income — Investment transactions are accounted for on the trade date (the date the order to buy or sell is executed). Securities gains and losses are calculated on a specifically identified cost basis. Interest income is determined on the basis of coupon interest accrued using the effective interest method adjusted for amortization of premiums and accretion of discounts. Dividend income less foreign taxes withheld, if any, is recorded on the ex-dividend date or when the Portfolio first learns of the dividend.
G. Allocation of Expenses — Expenses directly attributable to the Portfolio are charged directly to the Portfolio while the expenses attributable to more than one portfolio of the Trust are allocated among the respective portfolios.
H. Federal Income Taxes — The Portfolio is treated as a separate taxable entity for Federal income tax purposes. The Portfolio’s policy is to comply with the provisions of the Internal Revenue Code of 1986, as amended (the “Code”), applicable to regulated investment companies and to distribute to shareholders all of its distributable net investment income and net realized gain on investments. Accordingly, no provision for Federal income tax is necessary. The Portfolio is also a segregated portfolio of assets for insurance purposes and intends to comply with the diversification requirements of Subchapter L of the Code. The Portfolio is not aware of any tax positions for which it is reasonably possible that the total amounts of unrecognized tax benefits or losses will significantly change in the next twelve months. However, the Portfolio’s conclusions may be subject to future review based on changes in, or the interpretation of, the accounting standards or tax laws and regulations. The Portfolio’s Federal tax returns for the prior three fiscal years remain subject to examination by the Internal Revenue Service.
I. Dividends and Distributions to Shareholders — Dividends from net investment income and distributions of net realized capital gains, if any, are generally declared and paid at least annually. The amount of dividends and distributions from net investment income and net realized capital gains is determined in accordance with Federal income tax regulations, which may differ from accounting principles generally accepted in the United States of America. To the extent these “book/tax” differences are permanent in nature (i.e., that they result from other than timing of recognition — “temporary differences”), such amounts are reclassified within the capital accounts based on their Federal tax-basis treatment.
| DECEMBER 31, 2011 | JPMORGAN INSURANCE TRUST | 21 | ||||||
Table of Contents
NOTES TO FINANCIAL STATEMENTS
AS OF DECEMBER 31, 2011 (continued)
The following amounts were reclassified within the capital accounts:
| Paid-in-Capital | Accumulated (Overdistributed) Net Investment Income | Accumulated Net Realized Gain (Loss) on Investments | ||||||||||
| $ | 7,117 | $ | (22,655 | ) | $ | 15,538 | ||||||
The reclassifications for the Portfolio relate primarily to distributions from investments in real estate investment trusts and expiration of capital loss carryforwards.
3. Fees and Other Transactions with Affiliates
A. Investment Advisory Fee — Pursuant to the Investment Advisory Agreement, JPMIM acts as the investment advisor to the Portfolio. JPMIM is a wholly-owned subsidiary of JPMorgan Asset Management Holdings Inc., which is a wholly-owned subsidiary of JPMorgan Chase & Co. (“JPMorgan”). JPMIM supervises the investments of the Portfolio and for such services is paid a fee. The fee is accrued daily and paid monthly based on the Portfolio’s average daily net assets at an annual fee rate of 0.25%.
The Advisor waived Investment Advisory fees and/or reimbursed expenses as outlined in Note 3.E.
B. Administration Fee — Pursuant to an Administration Agreement, JPMorgan Funds Management, Inc. (the “Administrator”), an indirect, wholly-owned subsidiary of JPMorgan, provides certain administration services to the Portfolio. In consideration of these services, the Administrator receives a fee computed daily and paid monthly at the annual rate of 0.15% of the first $25 billion of the average daily net assets of all funds in the J.P. Morgan Funds Complex (excluding certain funds of funds and money market funds) and 0.075% of the average daily net assets in excess of $25 billion of all such funds. For the year ended December 31, 2011, the annual effective rate was 0.09% of the Portfolio’s average daily net assets.
JPMorgan Chase Bank, N.A. (“JPMCB”), a wholly-owned subsidiary of JPMorgan, and successor in interest to J.P. Morgan Investor Services Co. serves as the Portfolio’s sub-administrator (the “Sub-administrator”). For its services as Sub-administrator, JPMCB receives a portion of the fees payable to the Administrator.
C. Distribution Fees — Pursuant to a Distribution Agreement, JPMorgan Distribution Services, Inc. (the “Distributor”), a wholly-owned subsidiary of JPMorgan, serves as the Trust’s exclusive underwriter and promotes and arranges for the sale of the Portfolio’s shares. The Distributor receives no compensation in its capacity as the Portfolio’s underwriter.
D. Custodian and Accounting Fees — JPMCB provides portfolio custody and accounting services for the Portfolio. The amounts paid directly to JPMCB by the Portfolio for custody and accounting services are included in Custodian and accounting fees in the Statement of Operations. The custodian fees may be reduced by credits earned by the Portfolio, based on uninvested cash balances held by the custodian. Such earnings credits are presented separately in the Statement of Operations.
Interest expense, if any, paid to the custodian related to cash overdrafts is included in Interest expense to affiliates in the Statement of Operations.
E. Waivers and Reimbursements — The Advisor and Administrator have contractually agreed to waive fees and/or reimburse the Portfolio to the extent that total annual operating expenses (excluding acquired fund fees and expenses, dividend expense related to short sales, interest, taxes, extraordinary expenses and expenses related to the Board of Trustees’ deferred compensation plan) exceed 0.40% of the Portfolio’s average daily net assets.
The contractual expense limitation agreements were in effect for the year ended December 31, 2011. The expense limitation percentage above is in place until at least April 30, 2012.
For the year ended December 31, 2011, the Advisor contractually waived fees for the Portfolio in the amount of $74,920. The Advisor does not expect the Portfolio to repay any such waived fees in future years.
Additionally, the Portfolio may invest in one or more money market funds advised by the Advisor or its affiliates. The Advisor, Administrator and the Distributor waive fees in an amount sufficient to offset the respective fees each charges to the affiliated money market fund on the Portfolio’s investment in such affiliated money market fund. A portion of the waiver is voluntary.
The amount of waivers resulting from investments in the money market funds for the year ended December 31, 2011 (excluding the waiver disclosed in Note 2.E. regarding cash collateral for securities lending invested in JPMorgan Prime Money Market Fund) was $1,316.
F. Other — Certain officers of the Trust are affiliated with the Advisor, the Administrator and the Distributor. Such officers, with the exception of the Chief Compliance Officer, receive no compensation from the Portfolio for serving in their respective roles.
The Board of Trustees appointed a Chief Compliance Officer to the Portfolio in accordance with federal securities regulations. The Portfolio, along with other affiliated portfolios, makes reimbursement payments, on a pro-rata basis, to the Administrator for a portion of the fees associated with the Office of the Chief Compliance Officer. Such fees are included in Trustees’ and Chief Compliance Officer’s fees in the Statement of Operations.
| 22 | JPMORGAN INSURANCE TRUST | DECEMBER 31, 2011 | ||||
Table of Contents
The Trust adopted a Trustee Deferred Compensation Plan (the “Plan”) which allows the Independent Trustees to defer the receipt of all or a portion of compensation related to performance of their duties as a Trustee. The deferred fees are invested in various J.P. Morgan Funds until distribution in accordance with the Plan.
During the year ended December 31, 2011, the Portfolio may have purchased securities from an underwriting syndicate in which the principal underwriter or members of the syndicate are affiliated with the Advisor.
The Portfolio may use related party broker/dealers. For the year ended December 31, 2011, the Portfolio did not incur any brokerage commissions with broker/dealers affiliated with the Advisor.
The Securities and Exchange Commission has granted an exemptive order permitting the Portfolio to engage in principal transactions with J.P. Morgan Securities, Inc., an affiliated broker, involving taxable money market instruments subject to certain conditions.
4. Investment Transactions
During the year ended December 31, 2011, purchases and sales of investments (excluding short-term investments) were as follows:
| Purchases (excluding U.S. Government) | Sales (excluding U.S. Government) | |||||||
| $ | 2,999,940 | $ | 13,522,641 | |||||
During the year ended December 31, 2011, there were no purchases or sales of U.S. Government Securities.
5. Federal Income Tax Matters
For Federal income tax purposes, the cost and unrealized appreciation (depreciation) in value of the investment securities at December 31, 2011, were as follows:
| Aggregate Cost | Gross Unrealized Appreciation | Gross Unrealized Depreciation | Net Unrealized Appreciation (Depreciation) | |||||||||||||
| $ | 65,727,927 | $ | 10,047,020 | $ | 8,488,824 | $ | 1,558,196 | |||||||||
The difference between book and tax basis appreciation (depreciation) on investments is primarily attributed to wash sale loss deferrals.
The tax character of distributions paid during the fiscal year ended December 31, 2011 was as follows:
| Total Distributions Paid From: | ||||||||
| Ordinary Income | Total Distributions Paid | |||||||
| $ | 1,278,018 | $ | 1,278,018 | |||||
The tax character of distributions paid during the fiscal year ended December 31, 2010 was as follows:
| Total Distributions Paid From: | ||||||||
| Ordinary Income | Total Distributions Paid | |||||||
| $ | 1,708,349 | $ | 1,708,349 | |||||
At December 31, 2011, the components of net assets (excluding paid in capital) on a tax basis were as follows:
| Current Distributable Ordinary Income | Current Distributable Long-Term Capital Gain or (Tax Basis Capital Loss Carryover) | Unrealized Appreciation (Depreciation) | ||||||||||
| $ | 1,198,252 | $ | (1,848,440 | ) | $ | 1,558,196 | ||||||
The cumulative timing differences primarily consist of Trustee deferred compensation and wash sale loss deferrals.
Under the Regulated Investment Company Modernization Act of 2010 (the “Act”), net capital losses recognized by the Portfolio after December 31, 2010, may get carried forward indefinitely, and retain their character as short-term and/or long term losses. Prior to the Act, pre-enactment net capital losses incurred by the Portfolio were carried forward for eight years and treated as short-term losses. The Act requires that post-enactment net capital losses be used before pre-enactment net capital losses.
As of December 31, 2011, the Portfolio did not have post-enactment net capital loss carryforwards.
| DECEMBER 31, 2011 | JPMORGAN INSURANCE TRUST | 23 | ||||||
Table of Contents
NOTES TO FINANCIAL STATEMENTS
AS OF DECEMBER 31, 2011 (continued)
As of December 31, 2011, the Portfolio had the following pre-enactment net capital loss carryforwards, expiring during the year indicated, which are available to offset future realized gains:
| 2017 | Total | |||||||
| $ | 1,848,440 | $ | 1,848,440 | |||||
During the year ended December 31, 2011, the Portfolio utilized capital loss carryforwards in the amount of $1,896,989.
6. Borrowings
The Trust and JPMCB have entered into a financing arrangement. Under this arrangement, JPMCB provides an unsecured, uncommitted credit facility in the aggregate amount of $100 million to certain of the J.P. Morgan Funds, including the Portfolio. Advances under the arrangement are taken primarily for temporary or emergency purposes, including the meeting of redemption requests that otherwise might require the untimely disposition of securities, and are subject to the Portfolio’s borrowing restrictions. Interest on borrowings is payable at a rate determined by JPMCB at the time of borrowing. This agreement has been extended until November 12, 2012.
The Portfolio had no borrowings outstanding from the unsecured, uncommitted credit facility at December 31, 2011, or at any time during the year then ended.
Interest expense paid, if any, as a result of borrowings from the unsecured, uncommitted credit facility is included in Interest expense to affiliates in the Statement of Operations.
7. Risks, Concentrations and Indemnifications
In the normal course of business, the Portfolio enters into contracts that contain a variety of representations which provide general indemnifications. The Portfolio’s maximum exposure under these arrangements is unknown, as this would involve future claims that may be made against the Portfolio that have not yet occurred. However, based on experience, the Portfolio expects the risk of loss to be remote.
From time to time, the Portfolio may have a concentration of several shareholders holding a significant percentage of shares outstanding. Investment activities of these shareholders could have a material impact on the Portfolio.
| 24 | JPMORGAN INSURANCE TRUST | DECEMBER 31, 2011 | ||||
Table of Contents
REPORT OF INDEPENDENT REGISTERED PUBLIC ACCOUNTING FIRM
To the Board of Trustees of JPMorgan Insurance Trust and Shareholders of JPMorgan Insurance Trust Equity Index Portfolio:
In our opinion, the accompanying statement of assets and liabilities, including the schedule of portfolio investments, and the related statements of operations and of changes in net assets and the financial highlights present fairly, in all material respects, the financial position of JPMorgan Insurance Trust Equity Index Portfolio (a separate Portfolio of JPMorgan Insurance Trust) (hereafter referred to as the “Portfolio”) at December 31, 2011, the results of its operations for the year then ended, the changes in its net assets for each of the two years in the period then ended and the financial highlights for each of the five years in the period then ended, in conformity with accounting principles generally accepted in the United States of America. These financial statements and financial highlights (hereafter referred to as “financial statements”) are the responsibility of the Portfolio’s management. Our responsibility is to express an opinion on these financial statements based on our audits. We conducted our audits of these financial statements in accordance with the standards of the Public Company Accounting Oversight Board (United States). Those standards require that we plan and perform the audit to obtain reasonable assurance about whether the financial statements are free of material misstatement. An audit includes examining, on a test basis, evidence supporting the amounts and disclosures in the financial statements, assessing the accounting principles used and significant estimates made by management, and evaluating the overall financial statement presentation. We believe that our audits, which included confirmation of securities at December 31, 2011 by correspondence with the custodian and brokers, provide a reasonable basis for our opinion.
PricewaterhouseCoopers LLP
New York, New York
February 23, 2012
| DECEMBER 31, 2011 | JPMORGAN INSURANCE TRUST | 25 | ||||||
Table of Contents
(Unaudited)
The Portfolio’s Statement of Additional Information includes additional information about the Portfolio’s Trustees and is available, without charge, upon request by calling 1-800-480-4111 or on the J.P. Morgan Funds’ website at www.jpmorganfunds.com.
Name (Year of Birth); Positions With the Portfolio (1) | Principal Occupations During Past 5 Years | Number of Complex Overseen by Trustee (2) | Other Directorships Held Outside Fund Complex During Past 5 Years | |||
Independent Trustees | ||||||
| William J. Armstrong (1941); Trustee of Trust since 2005; Trustee of heritage J.P. Morgan Funds since 1987. | Retired; CFO and Consultant, EduNeering, Inc. (internet business education supplier) (2000-2001); Vice President and Treasurer, Ingersoll-Rand Company (manufacturer of industrial equipment) (1972-2000). | 154 | None. | |||
| John F. Finn (1947); Trustee of Trust since 2005; Trustee of heritage One Group Mutual Funds since 1998. | Chairman (1985-present), President and Chief Executive Officer, Gardner, Inc. (supply chain management company serving industrial and consumer markets) (1974-present). | 154 | Director, Cardinal Health, Inc. (CAH) (1994-present); Director, Greif, Inc. (GEF) (industrial package products and services) (2007-present). | |||
| Dr. Matthew Goldstein (1941); Trustee of Trust since 2005; Trustee of heritage J.P. Morgan Funds since 2003. | Chancellor, City University of New York (1999-present); President, Adelphi University (New York) (1998-1999). | 154 | Director, New Plan Excel (NXL) (1999-2005); Director, National Financial Partners (NFP) (2003-2005); Director, Bronx-Lebanon Hospital Center; Director, United Way of New York City (2002-present). | |||
| Robert J. Higgins (1945); Trustee of Trust since 2005; Trustee of heritage J.P. Morgan Funds since 2002. | Retired; Director of Administration of the State of Rhode Island (2003-2004); President — Consumer Banking and Investment Services, Fleet Boston Financial (1971-2001). | 154 | None. | |||
| Peter C. Marshall (1942); Trustee of Trust since 2005; Trustee of heritage One Group Mutual Funds since 1985. | Self-employed business consultant (2002-present). | 154 | Director, Center for Communication, Hearing, and Deafness (1990-present). | |||
| Marilyn McCoy* (1948); Trustee of Trust since 2005; Trustee of heritage One Group Mutual Funds since 1999. | Vice President of Administration and Planning, Northwestern University (1985-present). | 154 | Trustee, Carleton College (2003-present). | |||
| William G. Morton, Jr. (1937); Trustee of Trust since 2005; Trustee of heritage J.P. Morgan Funds since 2003. | Retired; Chairman Emeritus (2001-2002), and Chairman and Chief Executive Officer, Boston Stock Exchange (1985-2001). | 154 | Director, Radio Shack Corp. (1987-2008); Trustee, Stratton Mountain School (2001-present). | |||
| Robert A. Oden, Jr. (1946); Trustee of Trust since 2005; Trustee of heritage One Group Mutual Funds since 1997. | Retired; President, Carleton College (2002-2010); President, Kenyon College (1995-2002). | 154 | Trustee, American University in Cairo (1999-present); Trustee, Carleton College (2002-2010). | |||
| Fergus Reid, III (1932); Trustee of Trust (Chairman) since 2005; Trustee (Chairman) of heritage J.P. Morgan Funds since 1987. | Chairman, Joe Pietryka, Inc. (formerly Lumelite Corporation) (plastics manufacturing) (2003-present); Chairman and Chief Executive Officer, Lumelite Corporation (1985-2002). | 154 | Trustee, Morgan Stanley Funds (105 portfolios) (1992-present). | |||
| 26 | JPMORGAN INSURANCE TRUST | DECEMBER 31, 2011 | ||||
Table of Contents
Name (Year of Birth); Positions With the Portfolio (1) | Principal Occupations During Past 5 Years | Number of Complex Overseen by Trustee (2) | Other Directorships Held Outside Fund Complex During Past 5 Years | |||
Independent Trustees (continued) | ||||||
| Frederick W. Ruebeck (1939); Trustee of Trust since 2005; Trustee of heritage One Group Mutual Funds since 1994. | Consultant (2000-present); Advisor, JP Greene & Associates, LLC (broker-dealer) (2000-2009); Chief Investment Officer, Wabash College (2004-present); Director of Investments, Eli Lilly and Company (pharmaceuticals) (1988-1999). | 154 | Trustee, Wabash College (1988-present); Chairman, Indianapolis Symphony Orchestra Foundation (1994-present). | |||
| James J. Schonbachler (1943); Trustee of Trust since 2005; Trustee of heritage J.P. Morgan Funds since 2001. | Retired; Managing Director of Bankers Trust Company (financial services) (1968-1998). | 154 | None. | |||
Interested Trustees | ||||||
| Frankie D. Hughes** (1952), Trustee of Trust since 2008. | President and Chief Investment Officer, Hughes Capital Management, Inc. (fixed income asset management) (1993-present). | 154 | Trustee, The Victory Portfolios (2000-2008). | |||
| Leonard M. Spalding, Jr.*** (1935); Trustee of Trust since 2005; Trustee of heritage J.P. Morgan Funds since 1998. | Retired; Chief Executive Officer, Chase Mutual Funds (investment company) (1989-1998); President and Chief Executive Officer, Vista Capital Management (investment management) (1990-1998); Chief Investment Executive, Chase Manhattan Private Bank (investment management) (1990-1998). | 154 | Director, Glenview Trust Company, LLC (2001-present); Trustee, St. Catharine College (1998-present); Trustee, Bellarmine University (2000-present); Director, Springfield-Washington County Economic Development Authority (1997-present); Trustee, Catholic Education Foundation (2005-present). | |||
| (1) | Each Trustee serves for an indefinite term, subject to the Trust’s current retirement policy, which is age 75 for all Trustees, except that the Board has determined Messrs. Reid and Spalding should continue to serve until December 31, 2012. |
| (2) | A Fund Complex means two or more registered investment companies that hold themselves out to investors as related companies for purposes of investment and investor services or have a common investment adviser or have an investment adviser that is an affiliated person of the investment adviser of any of the other registered investment companies. The J.P. Morgan Funds Complex for which the Board of Trustees serves currently includes eleven registered investment companies (154 funds). |
| * | Ms. McCoy has served as Vice President of Administration and Planning for Northwestern University since 1985. William M. Daley was the Head of Corporate Responsibility for JPMorgan Chase & Co. prior to January 2011 and served as a member of the Board of Trustees of Northwestern University from 2005 through 2010. JPMIM, the Funds’ investment advisor, is a wholly-owned subsidiary of JPMorgan Chase & Co. Three other members of the Board of Trustees of Northwestern University are executive officers of registered investment advisors (not affiliated with JPMorgan) that are under common control with subadvisors to certain J.P. Morgan Funds. |
| ** | Ms. Hughes is treated as an “interested person” based on the portfolio holdings of clients of Hughes Capital Management, Inc. |
| *** | Mr. Spalding is treated as an “interested person” due to his ownership of JPMorgan Chase stock. |
The contact address for each of the Trustees is 270 Park Avenue, New York, NY 10017.
| DECEMBER 31, 2011 | JPMORGAN INSURANCE TRUST | 27 | ||||||
Table of Contents
(Unaudited)
Name (Year of Birth), Positions Held with the Trust (Since) | Principal Occupations During Past 5 Years | |
| Patricia A. Maleski (1960), President and Principal Executive Officer (2010) | Managing Director, J.P. Morgan Investment Management Inc. and Chief Administrative Officer, J.P. Morgan Funds and Institutional Pooled Vehicles since 2010; previously, Treasurer and Principal Financial Officer of the Trusts from 2008 to 2010; previously, Head of Funds Administration and Board Liaison, J.P. Morgan Funds prior to 2010. Ms. Maleski has been with JPMorgan Chase & Co. since 2001. | |
| Joy C. Dowd (1972), Treasurer and Principal Financial Officer (2010) | Assistant Treasurer of the Trusts from 2009 to 2010; Executive Director, JPMorgan Funds Management, Inc. from February 2011; Vice President, JPMorgan Funds Management, Inc. from December 2008 to February 2011; prior to joining JPMorgan Chase, Ms. Dowd worked in MetLife’s investments audit group from 2005 through 2008. | |
| Frank J. Nasta (1964), Secretary (2008) | Managing Director and Associate General Counsel, JPMorgan Chase since 2008; Previously, Director, Managing Director, General Counsel and Corporate Secretary, J. & W. Seligman & Co. Incorporated; Secretary of each of the investment companies of the Seligman Group of Funds and Seligman Data Corp.; Director and Corporate Secretary, Seligman Advisors, Inc. and Seligman Services, Inc. | |
| Stephen M. Ungerman (1953), Chief Compliance Officer (2005) | Managing Director, JPMorgan Chase & Co.; Mr. Ungerman has been with JPMorgan Chase & Co. since 2000. | |
| Paul L. Gulinello (1950), AML Compliance Officer (2005) | Vice President and Anti Money Laundering Compliance Officer for JPMorgan Asset Management Americas, additionally responsible for privacy, personal trading and Code of Ethics compliance since 2004. Mr. Gulinello has been with JPMorgan Chase & Co. since 1972. | |
Elizabeth A. Davin (1964), Assistant Secretary (2005)* | Vice President and Assistant General Counsel, JPMorgan Chase since 2005; Senior Counsel, JPMorgan Chase (formerly Bank One Corporation) from 2004 to 2005. | |
| Jessica K. Ditullio (1962), Assistant Secretary (2005)* | Executive Director and Assistant General Counsel, JPMorgan Chase since February 2011; Ms. Ditullio has served as an attorney with various titles for JPMorgan Chase (formerly Bank One Corporation) since 1990. | |
| John T. Fitzgerald (1975), Assistant Secretary (2008) | Executive Director and Assistant General Counsel, JPMorgan Chase since February 2011; formerly, Vice President and Assistant General Counsel, JPMorgan Chase from 2005 until February 2011. | |
| Carmine Lekstutis (1980) Assistant Secretary (2011) | Vice President and Assistant General Counsel, JPMorgan Chase since 2011; Associate, Skadden, Arps, Slate, Meagher & Flom LLP (law firm) from 2006 to 2011. | |
| Gregory S. Samuels (1980) Assistant Secretary (2010) | Vice President and Assistant General Counsel, JPMorgan Chase since 2010; Associate, Ropes & Gray (law firm) from 2008 to 2010; Associate, Clifford Chance LLP (law firm) from 2005 to 2008. | |
| Brian L. Duncan (1965), Assistant Treasurer (2008)* | Vice President, JPMorgan Funds Management, Inc. since June 2007; prior to joining JPMorgan Chase, Mr. Duncan worked for Penn Treaty American Corporation as Vice President and Controller from 2004 through 2007. | |
| Jeffrey D. House (1972), Assistant Treasurer (2006)* | Vice President, JPMorgan Funds Management, Inc. since July 2006. | |
| Laura S. Melman (1966), Assistant Treasurer (2006) | Executive Director, JPMorgan Funds Management, Inc. since February 2011, responsible for Taxation; Vice President, JPMorgan Funds Management, Inc. from August 2006 to February 2011, responsible for Taxation. | |
| Joseph Parascondola (1963), Assistant Treasurer (2011) | Vice President, JPMorgan Funds Management, Inc. since August 2006. | |
| Matthew J. Plastina (1970), Assistant Treasurer (2011) | Vice President, JPMorgan Funds Management, Inc. since August 2010; prior to August 2010, Vice President and Controller, Legg Mason Global Asset Management. | |
| Jeffery Reedy (1973), Assistant Treasurer (2011)* | Vice President, JPMorgan Funds Management, Inc. since February 2006. | |
The contact address for each of the officers, unless otherwise noted, is 270 Park Avenue, New York, NY 10017.
| * | The contact address for the officer is 1111 Polaris Parkway, Columbus, OH 43240. |
| 28 | JPMORGAN INSURANCE TRUST | DECEMBER 31, 2011 | ||||
Table of Contents
SCHEDULE OF SHAREHOLDER EXPENSES
(Unaudited)
Hypothetical $1,000 Investment
As a shareholder of the Portfolio, you incur ongoing costs: including investment advisory fees, administration fees and other Portfolio expenses. Because the Portfolio is a funding vehicle for Policies and Eligible Plans, you may also incur sales charges and other fees relating to the Policies or Eligible Plans. The examples below are intended to help you understand your ongoing costs (in dollars) of investing in the Portfolio, but not the costs of the Policies or Eligible Plans, and to compare these ongoing costs with the ongoing costs of investing in other mutual funds. The examples assume that you had a $1,000 investment in the Portfolio at the beginning of the reporting period, July 1, 2011, and continued to hold your shares at the end of the reporting period, December 31, 2011.
Actual Expenses
The first line provides information about actual account values and actual expenses. You may use the information in this line, together with the amount you invested, to estimate the expenses that you paid over the period. Simply divide your account value by $1,000 (for example, an $8,600 account value divided by $1,000 = 8.6), then multiply the result by the number in the first line under the heading entitled “Expenses Paid During” to estimate the expenses you paid on your account during this period.
Hypothetical Example for Comparison Purposes
The second line in the table below provides information about hypothetical account values and hypothetical expenses based on the actual expense ratio and an assumed rate of return of 5% per year before expenses, which is not the Portfolio’s actual return. The hypothetical account values and expenses may not be used to estimate the actual ending account balance or expenses you paid for the period. You may use this information to compare the ongoing costs of investing in the Portfolio and other portfolios. To do so, compare this 5% hypothetical example with the 5% hypothetical examples that appear in the shareholder reports of the other funds. Please note that the expenses shown in the table are meant to highlight your ongoing costs only and do not reflect any transaction costs, such as sales charges (loads) or redemption fees or the costs associated with the Policies and Eligible Plans through which the Portfolio is held. Therefore, the second line in the table is useful in comparing ongoing costs only, and will not help you determine the relative total costs of owning different portfolios. In addition, if these transaction costs were included, your costs would have been higher. The examples also assume all dividends and distributions have been reinvested.
| Beginning Account Value, July 1, 2011 | Ending Account Value December 31, 2011 | Expenses Paid During July 1, 2011 to December 31, 2011* | Annualized Expense Ratio | |||||||||||||
Class 1 | ||||||||||||||||
Actual | $ | 1,000.00 | $ | 960.50 | $ | 1.98 | 0.40 | % | ||||||||
Hypothetical | 1,000.00 | 1,023.19 | 2.04 | 0.40 | ||||||||||||
| * | Expenses are equal to the Portfolio’s annualized expense ratio, multiplied by the average account value over the period, multiplied by 184/365 (to reflect the one-half year period). |
| DECEMBER 31, 2011 | JPMORGAN INSURANCE TRUST | 29 | ||||||
Table of Contents
BOARD APPROVAL OF INVESTMENT ADVISORY AGREEMENT
(Unaudited)
The Board of Trustees meets regularly throughout the year and considers factors that are relevant to its annual consideration of investment advisory agreements at each meeting. The Board of Trustees has established various standing committees, composed of Trustees with diverse backgrounds, to which the Board of Trustees has assigned specific subject matter responsibilities to further enhance the effectiveness of the Board’s oversight and decision making. The Board of Trustees and its investment subcommittees (money market and alternative products, equity, and fixed income) also meet for the specific purpose of considering advisory contract annual renewals. The Board of Trustees held meetings in person in June and August 2011, at which the Trustees considered the continuation of the investment advisory agreement for the Portfolio whose annual report is contained herein (the “Advisory Agreement”). At the June meeting, the Board’s investment subcommittees met to review and consider performance, expense and related information for the J.P. Morgan Funds. Each investment subcommittee reported to the full Board, which then considered the investment subcommittee’s preliminary findings. At the August meeting, the Trustees continued their review and consideration. The Trustees, including a majority of the Trustees who are not “interested persons” (as defined in the 1940 Act) of any party to the Advisory Agreement or any of their affiliates, approved the continuation of the Advisory Agreement on August 25, 2011.
The Trustees, as part of their review of the investment advisory arrangements for the J.P. Morgan Funds, considered and reviewed performance and other information received from the Advisor, on a regular basis over the course of the year, as well as information specifically prepared for their annual review. This information included the Portfolio’s performance compared to the performance of the Portfolio’s peers and benchmarks and analyses by the Advisor of the Portfolio’s performance. The Advisor also periodically provides comparative information regarding the Portfolio’s expense ratios and those of the peer groups. In addition, in preparation for the June and August meetings, the Trustees requested, received and evaluated extensive materials from the Advisor, including, with respect to certain J.P. Morgan Funds, performance and expense information compiled by Lipper Inc. (“Lipper”), an independent provider of investment company data. Prior to voting, the Trustees reviewed the proposed approval of the Advisory Agreement with representatives of the Advisor and with counsels to the Trust and independent Trustees and received a memorandum from independent counsel to the Trustees discussing the legal standards for their consideration of the proposed approval. The Trustees also discussed the proposed approvals in executive sessions with counsels to the Trust and independent Trustees at which no representatives of the Advisor were present. Set forth below is a summary of the material factors evaluated by the Trustees in determining whether to approve the Advisory Agreement.
In their deliberations, there was a comprehensive consideration of the information received by the Trustees. Each Trustee attributed different weights to the various factors and no factor alone was considered determinative. From year to year, the Trustees consider and place emphasis on relevant information in light of changing circumstances in market and economic conditions. The Trustees determined that the compensation to be received by the Advisor from the Portfolio under the Advisory Agreement was fair and reasonable and that the continuance of the investment advisory contract was in the best interests of the Portfolio and its shareholders.
The factors summarized below were considered and discussed by the Trustees in reaching their conclusions:
Nature, Extent and Quality of Services Provided by the Advisor
The Trustees received and considered information regarding the nature, extent and quality of the services provided to the Portfolio under the Advisory Agreement. The Trustees took into account information furnished throughout the year at Trustee meetings, as well as the materials furnished specifically in connection with this annual review process. The Trustees considered the background and experience of the Advisor’s senior management and the expertise of, and the amount of attention given to the Portfolio by, investment personnel of the Advisor. In addition, the Trustees reviewed the qualifications, backgrounds and responsibilities of the portfolio management team primarily responsible for the day-to-day management of the Portfolio and the infrastructure supporting the team. The Trustees also considered information provided by the Advisor and JPMorgan Distribution Services, Inc. (“JPMDS”) about the structure and distribution strategy of the Portfolio. The Trustees also reviewed information relating to the Advisor’s risk governance model and reports showing the Advisor’s compliance structure and ongoing compliance processes. The quality of the administrative services provided by JPMorgan Funds Management, Inc. (“JPMFM”), an affiliate of the Advisor, was also considered.
The Board of Trustees also considered its knowledge of the nature and quality of the services provided by the Advisor to the Portfolio gained from their experience as Trustees of the J.P. Morgan Funds. In addition, they considered the overall reputation and capabilities of the Advisor and its affiliates, the commitment of the Advisor to provide high quality service to the Portfolio, their overall confidence in the Advisor’s integrity and the Advisor’s responsiveness to questions or concerns raised by them, including the Advisor’s willingness to consider and implement organizational and operational changes designed to improve investment results and the services provided to the Portfolio.
Based on these considerations and other factors, the Trustees concluded that they were satisfied with the nature, extent and
| 30 | JPMORGAN INSURANCE TRUST | DECEMBER 31, 2011 | ||||
Table of Contents
quality of the investment advisory services provided to the Portfolio by the Advisor.
Costs of Services Provided and Profitability to the Advisor and its Affiliates
The Trustees received and considered information regarding the profitability to the Advisor and its affiliates in providing services to the Portfolio. The Trustees reviewed and discussed this data. The Trustees recognized that this data is not audited and represents the Advisor’s determination of its and its affiliates’ revenues from the contractual services provided to the Portfolio, less expenses of providing such services. Expenses include direct and indirect costs and are calculated using an allocation methodology developed by the Advisor. The Trustees also recognized that it is difficult to make comparisons of profitability from fund investment advisory contracts because comparative information is not generally publicly available and is affected by numerous factors, including the structure of the particular adviser, the types of funds it manages, its business mix, numerous assumptions regarding allocations and the fact that publicly-traded fund managers’ operating profits and net income are net of distribution and marketing expenses. Based on their review, the Trustees concluded that the profitability to the Advisor under the Advisory Agreement was not unreasonable in light of the services and benefits provided to the Portfolio.
Fall-Out Benefits
The Trustees reviewed information regarding potential “fallout” or ancillary benefits received by the Advisor and its affiliates as a result of their relationship with the Portfolio. The Board considered that the Advisor does not currently use third-party soft dollar arrangements with respect to securities transactions it executes for the Portfolio.
The Trustees also considered that JPMFM earns fees from the Portfolio for providing administrative services. These fees were shown separately in the profitability analysis presented to the Trustees. The Trustees also considered the fees paid to JPMorgan Chase Bank, N.A. (“JPMCB”) for custody and fund accounting and other related services.
Economies of Scale
The Trustees noted that the proposed investment advisory fee schedule for the Portfolio does not contain breakpoints. The Trustees considered whether it would be appropriate to add advisory fee breakpoints and the Trustees concluded that the current fee structure was reasonable in light of the fee waivers and expense limitations that the Advisor has in place that serve to limit the overall net expense ratio at competitive levels. The Trustees also recognized that the fee schedule for the administrative services provided by JPMFM does include a fee breakpoint, which is tied to the overall level of non-money market fund assets excluding certain funds-of-funds, as applicable,
advised by the Advisor, and that the Portfolio benefits from that breakpoint. The Trustees concluded that shareholders benefited from the lower expense ratios which resulted from these factors.
Independent Written Evaluation of the Portfolio’s Chief Compliance Officer
The Trustees noted that, upon their direction, the Chief Compliance Officer for the Portfolio had prepared an independent written evaluation in order to assist the Trustees in determining the reasonableness of the proposed management fees. The Trustees considered the written evaluation in determining whether to continue the Advisory Agreement.
Fees Relative to Advisor’s Other Clients
The Trustees received and considered information about the nature and extent of investment advisory services and fee rates offered to other clients of the Advisor for investment management styles substantially similar to that of the Portfolio. The Trustees also considered the complexity of investment management for the Portfolio relative to the Advisor’s other clients and the differences in the nature and extent of the services provided to the different clients. The Trustees concluded that the fee rates charged to the Portfolio in comparison to those charged to the Advisor’s other clients were reasonable.
Investment Performance
The Trustees received and considered absolute and/or relative performance for the Portfolio in a report prepared by Lipper. The Trustees considered the total return performance information, which included the ranking of the Portfolio within a performance universe made up of funds with the same Lipper investment classification and objective (the “Universe Group”) by total return for applicable one-, three- and five-year periods. The Trustees reviewed a description of Lipper’s methodology for selecting mutual funds in the Portfolio’s Universe Group. As part of this review, the Trustees also reviewed the Portfolio’s performance against its benchmark and considered the performance information provided for the Portfolio at regular Board meetings by the Advisor. The Lipper performance data noted by the Trustees as part of their review and the determinations made by the Trustees with respect to the Portfolio’s performance are summarized below:
The Trustees noted the Portfolio’s performance was in the fifth, third and third quintiles for the one-, three-, and five-year periods ended December 31, 2010, respectively. The Trustees discussed the performance and investment strategy of the Portfolio with the Advisor and, based upon this discussion and other factors, concluded that the performance was reasonable.
Advisory Fees and Expense Ratios
The Trustees considered the contractual advisory fee rate paid by the Portfolio to the Advisor and compared that rate to the
| DECEMBER 31, 2011 | JPMORGAN INSURANCE TRUST | 31 | ||||||
Table of Contents
BOARD APPROVAL OF INVESTMENT ADVISORY AGREEMENT
(Unaudited) (continued)
information prepared by Lipper concerning management fee rates paid by other funds in the same Lipper category as the Portfolio. The Trustees recognized that Lipper reported the Portfolio’s management fee rate as the combined contractual advisory fee and the administration fee rates. The Trustees considered the fee waiver and/or expense reimbursement arrangements currently in place for the Portfolio and considered the net advisory fee rate after taking into account any waivers and/or reimbursements. The Trustees recognized that it is difficult to make comparisons of advisory fees because
there are variations in the services that are included in the fees paid by other funds. The Trustees’ determinations as a result of the review of the Portfolio’s advisory fees and expense ratios are summarized below:
The Trustees noted that the Portfolio’s net advisory fee and actual total expenses were in the first and third quintiles respectively, of their Universe Group. After considering the factors identified above, in light of this information, the Trustees concluded that the advisory fees were reasonable.
| 32 | JPMORGAN INSURANCE TRUST | DECEMBER 31, 2011 | ||||
Table of Contents
(Unaudited)
Certain tax information for the Portfolio is required to be provided to shareholders based upon the Portfolios’ income and distributions for the taxable year ended December 31, 2011. The information and distributions reported in this letter may differ from the information and taxable distributions reported to the shareholders for the calendar year ending December 31, 2011. The information necessary to complete your income tax
returns for the calendar year ending December 31, 2011 will be received under separate cover.
Dividends Received Deductions (DRD)
100.00% of ordinary income distributions were eligible for the 70% dividend received deduction for corporate rate shareholders for the fiscal year ended December 31, 2011.
| DECEMBER 31, 2011 | JPMORGAN INSURANCE TRUST | 33 | ||||||
Table of Contents
J.P. Morgan Funds are distributed by JPMorgan Distribution Services, Inc., which is an affiliate of JPMorgan Chase & Co. Affiliates of JPMorgan Chase & Co. receive fees for providing various services to the funds.
Contact JPMorgan Distribution Services, Inc. at 1-800-480-4111 for a portfolio prospectus. You can also visit us at www.jpmorganfunds.com. Investors should carefully consider the investment objectives and risk as well as charges and expenses of the mutual fund before investing. The prospectus contains this and other information about the mutual fund. Read the prospectus carefully before investing.
The Portfolio files a complete schedule of its portfolio holdings for the first and third quarters of its fiscal year with the SEC on Form N-Q. The Portfolio’s Forms N-Q are available on the SEC’s website at http://www.sec.gov and may be reviewed and copied at the SEC’s Public Reference Room in Washington, DC. Information on the operation of the SEC’s Public Reference Room may be obtained by calling 1-800-SEC-0330. Shareholders may request the Form N-Q without charge by calling 1-800-480-4111 or by visiting the variable insurance portfolio section of the J.P. Morgan Funds’ website at www.jpmorganfunds.com.
A description of the Portfolio’s policies and procedures with respect to the disclosure of the Portfolio’s holdings is available in the prospectus and Statement of Additional Information.
A copy of proxy policies and procedures is available without charge upon request by calling 1-800-480-4111 and a description of such policies and procedures is on the SEC’s website at www.sec.gov. The Trustees have delegated the authority to vote proxies for securities owned by the Portfolio to the Advisor. A copy of the Portfolio’s voting record for the most recent 12-month period ended June 30 is available on the SEC’s website at www.sec.gov or at the Portfolio’s website at www.jpmorganfunds.com no later than August 31 of each year. The Portfolio’s proxy voting record will include, among other things, a brief description of the matter voted on for each portfolio security, and will state how each vote was cast, for example, for or against the proposal.
Table of Contents
| © JPMorgan Chase & Co., 2012. All rights reserved. December 2011. | AN-JPMITEIP-1211 |
Table of Contents
Annual Report
JPMorgan Insurance Trust
December 31, 2011
JPMorgan Insurance Trust International Equity Portfolio
NOT FDIC INSURED Ÿ NO BANK GUARANTEE Ÿ MAY LOSE VALUE
|  |
Table of Contents
Investments in the Portfolio are not bank deposits or obligations of, or guaranteed or endorsed by, any bank and are not insured or guaranteed by the FDIC, the Federal Reserve Board or any other government agency. You could lose money if you sell when the Portfolio’s share price is lower than when you invested.
Past performance is no guarantee for future performance. The general market views expressed in this report are opinions based on conditions through the end of the reporting period and are subject to change without notice based on market and other conditions. These views are not intended to predict the future performance of the Portfolio or the securities markets. References to specific securities and their issuers are for illustrative purposes only and are not intended to be, and should not be interpreted as, recommendations to purchase or sell such securities. Such views are not meant as investment advice and may not be relied on as an indication of trading intent on behalf of the Portfolio.
This Portfolio is intended to be a funding vehicle for variable annuity contracts and variable life insurance policies (collectively “Policies”) offered by separate accounts of participating insurance companies. Portfolio shares are also offered through qualified pension and retirement plans (“Eligible Plans”). Individuals may not purchase shares directly from the Portfolio.
Prospective investors should refer to the Portfolio’s prospectus for a discussion of the Portfolio’s investment objective, strategies and risks. Call J.P. Morgan Funds Service Center at 1-800-480-4111 for a prospectus containing more complete information about the Portfolio including management fees and other expenses. Please read it carefully before investing.
Table of Contents
JANUARY 25, 2012 (Unaudited)
Dear Shareholder:
Investors greeted 2011 in much the same way they welcomed 2010: with high hopes that an improving U.S. economy would finally get us back on course to recovery.
This optimism quickly faded as the European debt crisis and a host of other economic and geopolitical concerns cast a dark shadow on the prospects for future growth. The combination of weak global economic data, credit downgrades in the U.S. and in Europe, and escalating fears of contagion all resulted in a level of market volatility not seen since the financial crisis three years ago.
 |
“Investors greeted 2011 in much the same way they welcomed 2010: With high hopes that an improving U.S. economy would finally get us back on course to recovery.” |
Nonetheless, stocks have regained some of their footing, as positive fourth-quarter economic data on auto sales, payroll employment and manufacturing activity all appear to indicate that consumer confidence is improving and economic growth may be accelerating.
We remain cautious, however, since many of the same challenges that we experienced in 2011—European debt concerns, uncertainty over monetary and fiscal stimulus, and soft economic data—will likely remain in place this year, laying the groundwork for continued market volatility.
Strong fourth quarter surge caps volatile year
The European debt crisis and other geopolitical and economic events created a generally volatile year for equities, culminating in major sell off in the third quarter. A strong fourth quarter comeback did little to reverse the losses, as the Standard & Poor’s 500 Index (“S&P500 Index”) ended the year with only slight gains. As of December 31, 2011, the Index had reached a level of 1,258, an increase of 2.1% from one year prior.
Large cap growth stocks lead style categories
Large cap stocks outpaced mid- and small-cap stocks over the 12-month period ended December 31, 2011 (the Russell 1000 Index returned 1.5% and the Russell Mid Cap Index returned -1.6%, compared to a return of -4.2% for the Russell 2000 Index). Overall, large-cap growth stocks fared better than large-cap value stocks as the Russell 1000 Growth Index returned 2.6% for the 12-month reporting period, compared to 0.4% for the Russell 1000 Value Index.
Euro zone uncertainty drives flight-to-quality sentiment
Investors’ lack of confidence in global economic growth prompted them to seek safe havens in U.S. Treasury securities, and high-quality corporate bonds. The Barclays Capital U.S. Aggregate Bond Index returned 7.8%. High yield bonds and emerging market debt securities also performed well, as the Barclays Capital High Yield Index returned 5.0%, and the Barclays Capital Emerging Markets Index returned 7.0% for the 12-month period ended December 31, 2011.
Similar economic concerns pushed yields of U.S. Treasury securities maturing in 10 years or more to historic lows throughout the year. As of the end of the 12-month period ended December 31, 2011, the yields on the benchmark 10-year U.S. Treasury bond dropped from 3.3% to 1.9%. In addition, yields on the 30-year U.S. Treasury bond declined from 4.3% to 2.9%, as did the two-year U.S. Treasury note, from 0.6% to 0.3%.
Lesson for 2012: Keep balance in mind in economic uncertainty
Last year offered its share of shocks to investors: geopolitical upheaval, natural disasters, sovereign-debt crises, and credit-rating downgrades were all among the events competing for the market’s attention. Against the backdrop of an election year, it’s likely that we will face continued global surprises—both on the upside and the downside.
As you reassess your investment strategy for the year ahead, it’s important to stick with a plan that focuses on diversification as well as long-term allocation. Trying to “time” market fluctuations can be risky business, especially given the ongoing uncertainty surrounding the direction of economic growth and the euro zone crisis in the months ahead.
On behalf of everyone at J.P. Morgan Asset Management, thank you for your continued confidence. We look forward to managing your investment needs for years to come. Should you have any questions, please visit www.jpmorganfunds.com or contact the J.P. Morgan Funds Service Center at 1-800-480-4111.
Sincerely yours,

George C.W. Gatch
CEO-Investment Management Americas
J.P. Morgan Asset Management
| DECEMBER 31, 2011 | JPMORGAN INSURANCE TRUST | 1 | ||||||
Table of Contents
JPMorgan Insurance Trust International Equity Portfolio
TWELVE MONTHS ENDED DECEMBER 31, 2011 (Unaudited)
| Reporting Period Return: | ||||
| Portfolio (Class 1 Shares)* | -11.45% | |||
| Morgan Stanley Capital International (“MSCI”) Europe, Australasia and Far East (“EAFE”) Index (net of foreign withholding taxes) | -12.14% | |||
| Net Assets as of 12/31/2011 | $ | 31,737,442 | ||
INVESTMENT OBJECTIVE**
The JPMorgan Insurance Trust International Equity Portfolio (the “Portfolio”) seeks to provide high total return from a portfolio of equity securities of foreign companies. Total return consists of capital growth and current income.
HOW DID THE MARKET PERFORM?
Strong corporate earnings and robust merger-and-acquisition activity encouraged investors and helped support international stock prices during the beginning of the reporting period. However, uncertainty surrounding global economic growth began to dampen investors’ appetite for risk in April 2011. This negative mood among investors worsened as they seemed to lack confidence in the ability of European governments to combat the region’s debt crisis, which hurt international stocks more than U.S. stocks. Concerns about the credit downgrade of U.S.-issued debt exacerbated this negative sentiment among investors. Each of these factors triggered a sharp downturn in international stock prices in the third quarter of 2011 and helped cause the MSCI EAFE Index (net of foreign withholding taxes) (the “Benchmark”) to finish the twelve months ended December 31, 2011 with a 12.14% loss.
WHAT WERE THE MAIN DRIVERS OF THE PORTFOLIO’S PERFORMANCE?
The Portfolio (Class 1 Shares) outperformed the Benchmark for the twelve months ended December 31, 2011. The Portfolio’s stock selection in the consumer staples and information technology sectors contributed to relative performance. The Portfolio’s stock selection in the financials sector and stock selection and overweight versus the Benchmark in the materials sector detracted from relative performance.
Individual contributors to the Fund’s relative performance included the Fund’s overweight positions versus the Benchmark in Autonomy Corp., Imperial Tobacco Group plc and British American Tobacco plc. Shares of Autonomy Corp. increased after the UK software company agreed to be bought by Hewlett-Packard Co. Shares of Imperial Tobacco Group plc and British American Tobacco plc increased as investors flocked into less economically-sensitive sectors, including tobacco companies that have demonstrated strong pricing power and an ability to generate cash.
Individual detractors from relative performance included the Portfolio’s overweight positions versus the Benchmark in French bank Societe Generale S.A. and Swiss bank Credit Suisse Group AG. Each of these stocks declined on concerns the companies would have to take large write-offs on their European sovereign debt holdings. The Fund’s position in Lafarge S.A., a French company that produces and sells building materials, also detracted from relative performance. The stock declined on concerns about the company’s outstanding debt and that weak European economic growth would hurt the company’s earnings.
HOW WAS THE PORTFOLIO POSITIONED?
The Fund’s portfolio managers focused on stock selection to build a portfolio of international equities. They used bottom-up fundamental research to identify what they believed were attractively priced stocks of well-managed companies with the potential to grow their earnings faster than their industry peers.
| 2 | JPMORGAN INSURANCE TRUST | DECEMBER 31, 2011 | ||||
Table of Contents
| TOP TEN EQUITY HOLDINGS OF THE PORTFOLIO*** | ||||||||
| 1. | Royal Dutch Shell plc, Class A (Netherlands) | 3.9 | % | |||||
| 2. | Vodafone Group plc (United Kingdom) | 2.9 | ||||||
| 3. | BHP Billiton Ltd. (Australia) | 2.8 | ||||||
| 4. | Nestle S.A. (Switzerland) | 2.6 | ||||||
| 5. | BG Group plc (United Kingdom) | 2.5 | ||||||
| 6. | Total S.A. (France) | 2.4 | ||||||
| 7. | Standard Chartered plc (United Kingdom) | 2.1 | ||||||
| 8. | HSBC Holdings plc (United Kingdom) | 2.0 | ||||||
| 9. | GlaxoSmithKline plc (United Kingdom) | 2.0 | ||||||
| 10. | British American Tobacco plc (United Kingdom) | 1.8 | ||||||
PORTFOLIO COMPOSITION BY COUNTRY*** | ||||||
| United Kingdom | 26.4 | % | ||||
| Japan | 17.5 | |||||
| France | 13.3 | |||||
| Switzerland | 11.9 | |||||
| Germany | 8.0 | |||||
| Netherlands | 5.1 | |||||
| Australia | 3.7 | |||||
| China | 2.9 | |||||
| Belgium | 1.8 | |||||
| Spain | 1.6 | |||||
| Hong Kong | 1.4 | |||||
| Ireland | 1.3 | |||||
| South Korea | 1.2 | |||||
| Others (each less than 1.0%) | 3.9 | |||||
| * | The return shown is based on net asset value calculated for shareholder transactions and may differ from the return shown in the financial highlights, which reflects adjustments made to the net asset value in accordance with accounting principles gener- ally accepted in the United States of America. |
| ** | The advisor seeks to achieve the Portfolio’s objective. There can be no guarantee it will be achieved. |
| *** | Percentages indicated are based upon total investments as of December 31, 2011. The Portfolio’s composition is subject to change. |
| DECEMBER 31, 2011 | JPMORGAN INSURANCE TRUST | 3 | ||||||
Table of Contents
JPMorgan Insurance Trust International Equity Portfolio
PORTFOLIO COMMENTARY
TWELVE MONTHS ENDED DECEMBER 31, 2011 (Unaudited) (continued)
AVERAGE ANNUAL TOTAL RETURNS AS OF DECEMBER 31, 2011 | ||||||||||||||||
| INCEPTION DATE OF CLASS | 1 YEAR | 5 YEAR | 10 YEAR | |||||||||||||
CLASS 1 SHARES | 1/3/95 | (11.45 | )% | (3.87 | )% | 3.57 | % | |||||||||
CLASS 2 SHARES | 4/24/09 | (11.64 | ) | (4.01 | ) | 3.50 | ||||||||||
TEN YEAR PERFORMANCE (12/31/01 TO 12/31/11)
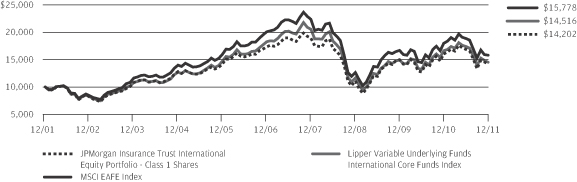
Source: Lipper Inc. The performance quoted is past performance and is not a guarantee of future results. Mutual Funds are subject to certain market risks. Investment returns and principal value of an investment will fluctuate so that an investor’s shares, when redeemed, may be worth more or less than their original cost. Current performance may be higher or lower than the performance data shown. For up-to-date, month-end performance information please call 1-800-480-4111.
Inception date for Class 1 Shares is January 3, 1995, which is the inception date of JPMorgan International Equity Portfolio (“Predecessor Portfolio”). The JPMorgan Insurance Trust International Equity Portfolio acquired all of the assets and liabilities of the Predecessor Portfolio in a reorganization on April 24, 2009. The Predecessor Portfolio’s performance and financial history have been adopted by International Equity Portfolio and have been used since the reorganization. As a result the performance for Class 1 Shares prior to April 25, 2009 is the performance of the Predecessor Portfolio.
Returns for Class 2 Shares prior to April 25, 2009 are based on the performance of Class 1 Shares. The actual returns of Class 2 Shares would have been lower than shown because Class 2 Shares have higher expenses than Class 1 Shares and the Predecessor Portfolio.
The graph illustrates comparative performance for $10,000 invested in Class 1 Shares of the JPMorgan Insurance Trust International Equity Portfolio, the MSCI EAFE Index and the Lipper Variable Underlying Funds International Core Funds Index from December 31, 2001 to December 31, 2011. The performance of the Portfolio assumes reinvestment of all dividends and capital gains, if any. The performance of the MSCI EAFE Index does not reflect the deduction of expenses associated with a mutual fund and approximates the minimum possible dividend reinvestment of the securities included in the benchmark. The dividend is reinvested after deduction of withholding tax, applying the maximum rate to
non-resident institutional investors who do not benefit from double taxation treaties. The performance of the Lipper Variable Underlying Funds International Core Funds Index includes expenses associated with a mutual fund, such as investment management fees. These expenses are not identical to the expenses charged by the Portfolio. The MSCI EAFE Index is a free float-adjusted market capitalization weighted index that is designed to measure the equity market performance of developed markets, excluding U.S. and Canada. The Lipper Variable Underlying Funds International Core Funds Index is an index based on the total returns of certain mutual funds within the Portfolio’s designated category as determined by Lipper, Inc. Investors cannot invest directly in an index.
The performance does not reflect any charges imposed by the Policies or Eligible Plans. If these charges were included, the returns would be lower than shown. Performance may reflect the waiver of the Portfolio’s fees and reimbursement of expenses for certain periods since the inception date. Without these waivers and reimbursements performance would have been lower.
International investing involves a greater degree of risk and increased volatility. Changes in currency exchange rates and differences in accounting and taxation policies outside the United States can raise or lower returns. Also, some overseas markets may not be as politically and economically stable as the United States and other nations. The Portfolio may also be subject to the additional risk of “regional” investing, which involves focusing investments in a particular geographic region or regions.
The returns shown are based on net asset values calculated for shareholder transactions and may differ from the returns shown in the financial highlights, which reflect adjustments made to the net asset values in accordance with accounting principles generally accepted in the United States of America.
| 4 | JPMORGAN INSURANCE TRUST | DECEMBER 31, 2011 | ||||
Table of Contents
JPMorgan Insurance Trust International Equity Portfolio
SCHEDULE OF PORTFOLIO INVESTMENTS
AS OF DECEMBER 31, 2011
| SHARES | SECURITY DESCRIPTION | VALUE($) | ||||||
| Common Stocks — 97.9% |
| ||||||
Australia — 3.7% |
| |||||||
| 24,760 | BHP Billiton Ltd. (m) | 873,995 | ||||||
| 4,697 | Rio Tinto Ltd. (m) | 289,566 | ||||||
|
| |||||||
| 1,163,561 | ||||||||
|
| |||||||
Belgium — 1.8% |
| |||||||
| 9,360 | Anheuser-Busch InBev N.V. (m) | 571,271 | ||||||
|
| |||||||
China — 2.9% |
| |||||||
| 276,000 | China Construction Bank Corp., Class H (m) | 191,713 | ||||||
| 169,000 | CNOOC Ltd. (m) | 294,693 | ||||||
| 522,500 | Industrial & Commercial Bank of China, | 308,618 | ||||||
| 41,200 | Sands China Ltd. (a) (m) | 115,590 | ||||||
|
| |||||||
| 910,614 | ||||||||
|
| |||||||
France — 13.2% |
| |||||||
| 5,993 | Accor S.A. (m) | 151,033 | ||||||
| 22,449 | AXA S.A. (m) | 290,180 | ||||||
| 8,289 | BNP Paribas S.A. (m) | 322,769 | ||||||
| 3,245 | Imerys S.A. (m) | 148,835 | ||||||
| 6,390 | Lafarge S.A. (m) | 223,696 | ||||||
| 3,097 | LVMH Moet Hennessy Louis Vuitton S.A. (m) | 436,258 | ||||||
| 3,388 | Pernod-Ricard S.A. (m) | 313,590 | ||||||
| 2,240 | PPR (m) | 319,736 | ||||||
| 6,597 | Sanofi (m) | 482,225 | ||||||
| 4,662 | Schneider Electric S.A. (m) | 243,736 | ||||||
| 8,310 | Societe Generale S.A. (m) | 183,448 | ||||||
| 3,400 | Technip S.A. (m) | 318,750 | ||||||
| 15,106 | Total S.A. (m) | 770,827 | ||||||
|
| |||||||
| 4,205,083 | ||||||||
|
| |||||||
Germany — 6.4% |
| |||||||
| 6,440 | Bayer AG (m) | 411,281 | ||||||
| 7 | E.ON AG (m) | 151 | ||||||
| 3,150 | Fresenius Medical Care AG & Co. KGaA (m) | 213,961 | ||||||
| 2,159 | Linde AG (m) | 320,854 | ||||||
| 9,098 | SAP AG (m) | 481,208 | ||||||
| 4,285 | Siemens AG (m) | 409,971 | ||||||
| 6,992 | Symrise AG (m) | 186,208 | ||||||
|
| |||||||
| 2,023,634 | ||||||||
|
| |||||||
Hong Kong — 1.4% |
| |||||||
| 101,000 | Belle International Holdings Ltd. (m) | 175,464 | ||||||
| 97,000 | Hang Lung Properties Ltd. (m) | 275,343 | ||||||
|
| |||||||
| 450,807 | ||||||||
|
| |||||||
Ireland — 1.3% |
| |||||||
| 40,582 | WPP plc (m) | 425,594 | ||||||
|
| |||||||
| SHARES | SECURITY DESCRIPTION | VALUE($) | ||||||
Israel — 0.9% |
| |||||||
| 6,830 | Teva Pharmaceutical Industries Ltd., ADR (m) | 275,659 | ||||||
|
| |||||||
Italy — 0.6% |
| |||||||
| 113,366 | Intesa Sanpaolo S.p.A. (m) | 188,813 | ||||||
|
| |||||||
Japan — 17.5% | ||||||||
| 11,600 | Canon, Inc. (m) | 510,485 | ||||||
| 6,900 | Daikin Industries Ltd. (m) | 188,350 | ||||||
| 5,200 | East Japan Railway Co. (m) | 331,439 | ||||||
| 1,800 | FANUC Corp. (m) | 274,558 | ||||||
| 16,000 | Honda Motor Co., Ltd. (m) | 487,374 | ||||||
| 69 | Japan Tobacco, Inc. (m) | 324,473 | ||||||
| 18,000 | Komatsu Ltd. (m) | 419,722 | ||||||
| 44,000 | Kubota Corp. (m) | 368,216 | ||||||
| 22,500 | Mitsubishi Corp. (m) | 453,482 | ||||||
| 3,700 | Murata Manufacturing Co., Ltd. (m) | 189,483 | ||||||
| 3,600 | Nidec Corp. (m) | 312,574 | ||||||
| 6,000 | Omron Corp. (m) | 120,438 | ||||||
| 6,700 | Shin-Etsu Chemical Co., Ltd. (m) | 329,103 | ||||||
| 2,000 | SMC Corp. (m) | 321,772 | ||||||
| 30,400 | Sumitomo Corp. (m) | 410,921 | ||||||
| 10,200 | Toyota Motor Corp. (m) | 337,285 | ||||||
| 508 | Yahoo! Japan Corp. (m) | 163,431 | ||||||
|
| |||||||
| 5,543,106 | ||||||||
|
| |||||||
Mexico — 0.6% |
| |||||||
| 7,860 | America Movil S.A.B. de C.V., Series L, , ADR (m) | 177,636 | ||||||
|
| |||||||
Netherlands — 5.1% |
| |||||||
| 52,943 | ING Groep N.V. CVA (a) (m) | 378,627 | ||||||
| 8 | Reed Elsevier N.V. (m) | 93 | ||||||
| 33,869 | Royal Dutch Shell plc, Class A (m) | 1,234,554 | ||||||
|
| |||||||
| 1,613,274 | ||||||||
|
| |||||||
South Korea — 1.2% |
| |||||||
| 411 | Samsung Electronics Co., Ltd. (m) | 378,053 | ||||||
|
| |||||||
Spain — 1.5% |
| |||||||
| 34,639 | Banco Bilbao Vizcaya Argentaria S.A. (m) | 298,387 | ||||||
| 2,359 | Inditex S.A. (m) | 192,577 | ||||||
|
| |||||||
| 490,964 | ||||||||
|
| |||||||
Sweden — 0.7% |
| |||||||
| 10,830 | Atlas Copco AB, Class A (m) | 232,049 | ||||||
|
| |||||||
Switzerland — 11.9% |
| |||||||
| 20,860 | ABB Ltd. (a) (m) | 391,882 | ||||||
| 12,970 | Credit Suisse Group AG (a) (m) | 303,993 | ||||||
| 4,821 | Holcim Ltd. (a) (m) | 256,984 | ||||||
| 14,266 | Nestle S.A. (m) | 819,204 | ||||||
| 10,079 | Novartis AG (m) | 575,441 | ||||||
SEE NOTES TO FINANCIAL STATEMENTS.
| DECEMBER 31, 2011 | JPMORGAN INSURANCE TRUST | 5 | ||||||
Table of Contents
JPMorgan Insurance Trust International Equity Portfolio
SCHEDULE OF PORTFOLIO INVESTMENTS
AS OF DECEMBER 31, 2011 (continued)
| SHARES | SECURITY DESCRIPTION | VALUE($) | ||||||
| Common Stocks — Continued |
| ||||||
Switzerland — Continued |
| |||||||
| 2,623 | Roche Holding AG (m) | 443,597 | ||||||
| 156 | SGS S.A. (m) | 257,297 | ||||||
| 22,299 | Xstrata plc (m) | 339,506 | ||||||
| 1,675 | Zurich Financial Services AG (a) (m) | 377,390 | ||||||
|
| |||||||
| 3,765,294 | ||||||||
|
| |||||||
Taiwan — 0.9% |
| |||||||
| 23,167 | Taiwan Semiconductor Manufacturing Co., Ltd., ADR (m) | 299,086 | ||||||
|
| |||||||
United Kingdom — 26.3% |
| |||||||
| 98,077 | Barclays plc (m) | 268,602 | ||||||
| 36,821 | BG Group plc (m) | 786,631 | ||||||
| 12,280 | British American Tobacco plc (m) | 582,568 | ||||||
| 15,380 | Burberry Group plc (m) | 282,802 | ||||||
| 71,824 | Centrica plc (m) | 322,597 | ||||||
| 27,893 | GlaxoSmithKline plc (m) | 635,568 | ||||||
| 84,166 | HSBC Holdings plc (m) | 641,142 | ||||||
| 45,669 | ICAP plc (m) | 245,995 | ||||||
| 12,041 | Imperial Tobacco Group plc (m) | 455,638 | ||||||
| 74,680 | Man Group plc (m) | 145,741 | ||||||
| 50,270 | Marks & Spencer Group plc (m) | 242,794 | ||||||
| 23,850 | Meggitt plc (m) | 130,550 | ||||||
| 36,241 | Prudential plc (m) | 358,575 | ||||||
| 7,918 | Rio Tinto plc (m) | 386,767 | ||||||
| 30,784 | Standard Chartered plc (m) | 673,324 | ||||||
| 58,858 | Tesco plc (m) | 368,265 | ||||||
| 16,940 | Tullow Oil plc (m) | 368,075 | ||||||
| 15,835 | Unilever plc (m) | 531,012 | ||||||
| 332,428 | Vodafone Group plc (m) | 926,844 | ||||||
|
| |||||||
| 8,353,490 | ||||||||
|
| |||||||
Total Common Stocks | 31,067,988 | |||||||
|
| |||||||
| Preferred Stocks — 1.5% |
| ||||||
Germany — 1.5% |
| |||||||
| 2,840 | Henkel AG & Co. KGaA (m) | 163,721 | ||||||
| 2,270 | Volkswagen AG (m) | 339,391 | ||||||
|
| |||||||
Total Preferred Stocks | 503,112 | |||||||
|
| |||||||
| SHARES | SECURITY DESCRIPTION | VALUE($) | ||||||
| Short-Term Investment — 0.2% |
| ||||||
Investment Company — 0.2% |
| |||||||
| 50,045 | JPMorgan Prime Money Market Fund, Institutional Class Shares, 0.090% (b) (l) (m) (Cost $50,045) | 50,045 | ||||||
|
| |||||||
Total Investments — 99.6% | 31,621,145 | |||||||
Other Assets in Excess of | 116,297 | |||||||
|
| |||||||
NET ASSETS — 100.0% | $ | 31,737,442 | ||||||
|
| |||||||
Percentages indicated are based on net assets.
Summary of Investments by Industry, December 31, 2011
The following table represents the portfolio investments of the Portfolio by industry classifications as a percentage of total investments:
| INDUSTRY | PERCENTAGE | |||
Oil, Gas & Consumable Fuels | 10.9 | % | ||
Commercial Banks | 9.7 | |||
Pharmaceuticals | 8.9 | |||
Metals & Mining | 6.0 | |||
Machinery | 5.1 | |||
Tobacco | 4.3 | |||
Food Products | 4.3 | |||
Automobiles | 3.7 | |||
Wireless Telecommunication Services | 3.5 | |||
Insurance | 3.3 | |||
Electrical Equipment | 3.0 | |||
Beverages | 2.8 | |||
Trading Companies & Distributors | 2.7 | |||
Chemicals | 2.6 | |||
Textiles, Apparel & Luxury Goods | 2.3 | |||
Capital Markets | 2.2 | |||
Semiconductors & Semiconductor Equipment | 2.1 | |||
Construction Materials | 2.0 | |||
Multiline Retail | 1.8 | |||
Office Electronics | 1.6 | |||
Software | 1.5 | |||
Media | 1.3 | |||
Industrial Conglomerates | 1.3 | |||
Diversified Financial Services | 1.2 | |||
Food & Staples Retailing | 1.2 | |||
Specialty Retail | 1.2 | |||
Road & Rail | 1.1 | |||
Multi-Utilities | 1.0 | |||
Energy Equipment & Services | 1.0 | |||
Electronic Equipment, Instruments & Components | 1.0 | |||
Others (each less than 1.0%) | 5.4 | |||
SEE NOTES TO FINANCIAL STATEMENTS.
| 6 | JPMORGAN INSURANCE TRUST | DECEMBER 31, 2011 | ||||
Table of Contents
NOTES TO SCHEDULE OF PORTFOLIO INVESTMENTS:
| ADR | — American Depositary Receipt | |
| CVA | — Dutch Certification | |
| (a) | — Non-income producing security | |
| (b) | — Investment in affiliate. Money market fund registered under the Investment Company Act of 1940, as amended, and advised by J.P. Morgan Investment Management Inc. | |
| (l) | — The rate shown is the current yield as of December 31, 2011. |
| (m) | — All or a portion of this security is reserved and/or pledged with the custodian for current or potential holdings of futures, swaps, options, TBAs, when-issued securities, delayed delivery securities, reverse repurchase agreements, unfunded commitments and/or forward foreign currency exchange contracts. |
In addition, the value and percentage, based on total investments, of the investments that apply the fair valuation policy for the international investments described in Note 2.A. of the notes to financial statements are $30,818,719 which amounts to 97.5% of total investments.
SEE NOTES TO FINANCIAL STATEMENTS.
| DECEMBER 31, 2011 | JPMORGAN INSURANCE TRUST | 7 | ||||||
Table of Contents
STATEMENT OF ASSETS AND LIABILITIES
AS OF DECEMBER 31, 2011
| International Equity Portfolio | ||||
ASSETS: | ||||
Investments in non-affiliates, at value | $ | 31,571,100 | ||
Investments in affiliates, at value | 50,045 | |||
|
| |||
Total investment securities, at value | 31,621,145 | |||
Cash | 37,764 | |||
Foreign currency, at value | 63,143 | |||
Receivables: | ||||
Portfolio shares sold | 2,736 | |||
Dividends from non-affiliates | 70,941 | |||
Dividends from affiliates | 4 | |||
Tax reclaims | 25,177 | |||
|
| |||
Total Assets | 31,820,910 | |||
|
| |||
LIABILITIES: | ||||
Payables: | ||||
Portfolio shares redeemed | 20,399 | |||
Accrued liabilities: | ||||
Investment advisory fees | 6,027 | |||
Administration fees | 2,391 | |||
Distribution fees | 11 | |||
Custodian and accounting fees | 18,954 | |||
Trustees’ and Chief Compliance Officer’s fees | 91 | |||
Printing and mailing costs | 9,778 | |||
Audit fees | 23,960 | |||
Other | 1,857 | |||
|
| |||
Total Liabilities | 83,468 | |||
|
| |||
Net Assets | $ | 31,737,442 | ||
|
| |||
NET ASSETS: | ||||
Paid in capital | $ | 29,315,205 | ||
Accumulated undistributed net investment income | 710,526 | |||
Accumulated net realized gains (losses) | (2,998,392 | ) | ||
Net unrealized appreciation (depreciation) | 4,710,103 | |||
|
| |||
Total Net Assets | $ | 31,737,442 | ||
|
| |||
Net Assets: | ||||
Class 1 | $ | 31,686,069 | ||
Class 2 | 51,373 | |||
|
| |||
Total | $ | 31,737,442 | ||
|
| |||
Outstanding units of beneficial interest (shares) | ||||
(unlimited number of shares authorized, no par value): | ||||
Class 1 | 3,568,883 | |||
Class 2 | 5,733 | |||
Net Asset Value, offering and redemption price per share (a): | ||||
Class 1 | $ | 8.88 | ||
Class 2 | 8.96 | |||
|
| |||
Cost of investments in non-affiliates | $ | 26,859,207 | ||
Cost of investments in affiliates | 50,045 | |||
Cost of foreign currency | 63,115 | |||
| (a) | Per share amounts may not recalculate due to rounding of net assets and/or shares outstanding. |
SEE NOTES TO FINANCIAL STATEMENTS.
| 8 | JPMORGAN INSURANCE TRUST | DECEMBER 31, 2011 | ||||
Table of Contents
STATEMENT OF OPERATIONS
FOR THE YEAR ENDED DECEMBER 31, 2011
| International Equity Portfolio | ||||
INVESTMENT INCOME: | ||||
Dividend income from non-affiliates | $ | 1,161,799 | ||
Dividend income from affiliates | 107 | |||
Interest income from non-affiliates | 180 | |||
Interest income from affiliates | 157 | |||
Foreign taxes withheld | (82,833 | ) | ||
|
| |||
Total investment income | 1,079,410 | |||
|
| |||
EXPENSES: | ||||
Investment advisory fees | 218,147 | |||
Administration fees | 32,192 | |||
Distribution fees — Class 2 | 142 | |||
Custodian and accounting fees | 68,203 | |||
Interest expense to affiliates | 157 | |||
Professional fees | 50,382 | |||
Trustees’ and Chief Compliance Officer’s fees | 377 | |||
Printing and mailing costs | 20,878 | |||
Transfer agent fees | 4,886 | |||
Other | 7,604 | |||
|
| |||
Total expenses | 402,968 | |||
|
| |||
Less amounts waived | (29,491 | ) | ||
|
| |||
Net expenses | 373,477 | |||
|
| |||
Net investment income (loss) | 705,933 | |||
|
| |||
REALIZED/UNREALIZED GAINS (LOSSES): | ||||
Net realized gain (loss) on transactions from: | ||||
Investments in non-affiliates | 629,747 | |||
Foreign currency transactions | 4,716 | |||
|
| |||
Net realized gain (loss) | 634,463 | |||
|
| |||
Change in net unrealized appreciation (depreciation) of: | ||||
Investments in non-affiliates | (5,174,463 | ) | ||
Foreign currency translations | (6,693 | ) | ||
|
| |||
Change in net unrealized appreciation (depreciation) | (5,181,156 | ) | ||
|
| |||
Net realized/unrealized gains (losses) | (4,546,693 | ) | ||
|
| |||
Change in net assets resulting from operations | $ | (3,840,760 | ) | |
|
| |||
SEE NOTES TO FINANCIAL STATEMENTS.
| DECEMBER 31, 2011 | JPMORGAN INSURANCE TRUST | 9 | ||||||
Table of Contents
STATEMENTS OF CHANGES IN NET ASSETS
FOR THE PERIODS INDICATED
| International Equity Portfolio | ||||||||
| Year Ended 12/31/2011 | Year Ended 12/31/2010 | |||||||
CHANGE IN NET ASSETS RESULTING FROM OPERATIONS: | ||||||||
Net investment income (loss) | $ | 705,933 | $ | 659,660 | ||||
Net realized gain (loss) | 634,463 | 708,925 | ||||||
Change in net unrealized appreciation (depreciation) | (5,181,156 | ) | 1,080,169 | |||||
|
|
|
| |||||
Change in net assets resulting from operations | (3,840,760 | ) | 2,448,754 | |||||
|
|
|
| |||||
DISTRIBUTIONS TO SHAREHOLDERS: | ||||||||
Class 1 | ||||||||
From net investment income | (665,932 | ) | (98,232 | ) | ||||
Class 2 | ||||||||
From net investment income | (887 | ) | (125 | ) | ||||
|
|
|
| |||||
Total distributions to shareholders | (666,819 | ) | (98,357 | ) | ||||
|
|
|
| |||||
CAPITAL TRANSACTIONS: | ||||||||
Change in net assets from capital transactions | (2,902,531 | ) | (7,195,356 | ) | ||||
|
|
|
| |||||
NET ASSETS: | ||||||||
Change in net assets | (7,410,110 | ) | (4,844,959 | ) | ||||
Beginning of period | 39,147,552 | 43,992,511 | ||||||
|
|
|
| |||||
End of period | $ | 31,737,442 | $ | 39,147,552 | ||||
|
|
|
| |||||
Accumulated undistributed net investment income | $ | 710,526 | $ | 666,697 | ||||
|
|
|
| |||||
CAPITAL TRANSACTIONS: | ||||||||
Class 1 | ||||||||
Proceeds from shares issued | $ | 4,466,275 | $ | 4,422,429 | ||||
Dividends and distributions reinvested | 665,932 | 98,232 | ||||||
Cost of shares redeemed | (8,035,625 | ) | (11,716,142 | ) | ||||
|
|
|
| |||||
Change in net assets from Class 1 capital transactions | $ | (2,903,418 | ) | $ | (7,195,481 | ) | ||
|
|
|
| |||||
Class 2 | ||||||||
Dividends and distributions reinvested | $ | 887 | $ | 125 | ||||
|
|
|
| |||||
Change in net assets from Class 2 capital transactions | $ | 887 | $ | 125 | ||||
|
|
|
| |||||
Total change in net assets from capital transactions | $ | (2,902,531 | ) | $ | (7,195,356 | ) | ||
|
|
|
| |||||
SHARE TRANSACTIONS: | ||||||||
Class 1 | ||||||||
Issued | 476,082 | 484,131 | ||||||
Reinvested | 63,302 | 9,952 | ||||||
Redeemed | (815,112 | ) | (1,255,353 | ) | ||||
|
|
|
| |||||
Change in Class 1 Shares | (275,728 | ) | (761,270 | ) | ||||
|
|
|
| |||||
Class 2 | ||||||||
Reinvested | 83 | 13 | ||||||
|
|
|
| |||||
Change in Class 2 Shares | 83 | 13 | ||||||
|
|
|
| |||||
SEE NOTES TO FINANCIAL STATEMENTS.
| 10 | JPMORGAN INSURANCE TRUST | DECEMBER 31, 2011 | ||||
Table of Contents
THIS PAGE IS INTENTIONALLY LEFT BLANK
| DECEMBER 31, 2011 | JPMORGAN INSURANCE TRUST | 11 | ||||||
Table of Contents
FOR THE PERIODS INDICATED
| Per share operating performance | ||||||||||||||||||||||||||||
| Investment operations | Distributions | |||||||||||||||||||||||||||
| Net asset value, beginning of period | Net investment income (loss) | Net realized and unrealized gains (losses) on investments | Total from investment operations | Net investment income | Net realized gain | Total distributions | ||||||||||||||||||||||
International Equity Portfolio | ||||||||||||||||||||||||||||
Class 1 (e) | ||||||||||||||||||||||||||||
Year Ended December 31, 2011 | $ | 10.17 | $ | 0.19 | (f) | $ | (1.30 | ) | $ | (1.11 | ) | $ | (0.18 | ) | $ | — | $ | (0.18 | ) | |||||||||
Year Ended December 31, 2010 | 9.54 | 0.15 | (f) | 0.50 | 0.65 | (0.02 | ) | — | (0.02 | ) | ||||||||||||||||||
Year Ended December 31, 2009 | 7.93 | 0.16 | (f) | 2.31 | 2.47 | (0.50 | ) | (0.36 | ) | (0.86 | ) | |||||||||||||||||
Year Ended December 31, 2008 | 15.95 | 0.34 | (6.00 | ) | (5.66 | ) | (0.23 | ) | (2.13 | ) | (2.36 | ) | ||||||||||||||||
Year Ended December 31, 2007 | 14.74 | 0.19 | (f) | 1.18 | 1.37 | (0.16 | ) | — | (0.16 | ) | ||||||||||||||||||
Class 2 | ||||||||||||||||||||||||||||
Year Ended December 31, 2011 | 10.26 | 0.17 | (f) | (1.31 | ) | (1.14 | ) | (0.16 | ) | — | (0.16 | ) | ||||||||||||||||
Year Ended December 31, 2010 | 9.65 | 0.13 | (f) | 0.50 | 0.63 | (0.02 | ) | — | (0.02 | ) | ||||||||||||||||||
April 24, 2009 (i) through December 31, 2009 | 6.88 | 0.45 | (f) | 2.33 | 2.78 | (0.01 | ) | — | (0.01 | ) | ||||||||||||||||||
| (a) | Annualized for periods less than one year. |
| (b) | Not annualized for periods less than one year. |
| (c) | Includes adjustments in accordance with accounting principles generally accepted in the United States of America and as such, the net asset value for financial reporting purposes and the returns based upon those net asset values may differ from the net asset value and returns for shareholder transactions. |
| (d) | Includes earnings credits and interest expense, each of which is less than 0.01%, if applicable or unless otherwise noted. |
| (e) | International Equity Portfolio acquired all of the assets and liabilities of JPMorgan International Equity Portfolio (“Predecessor Portfolio”) in a reorganization on April 24, 2009. The Predecessor Portfolio’s performance and financial history have been adopted by International Equity Portfolio and have been used since the reorganization. As a result, the financial highlight information reflects that of the Predecessor Portfolio for the periods prior to reorganization with International Equity Portfolio. |
| (f) | Calculated based upon average shares outstanding. |
| (g) | Ratios are disproportionate between classes due to the size of net assets and fixed expenses. |
| (h) | Includes interest expense of 0.02%. |
| (i) | Because of the reorganization with the Predecessor Portfolio in which the performance and financial history of the International Equity Portfolio was replaced with that of the Predecessor Portfolio, the performance and the financial history began on April 24, 2009. |
SEE NOTES TO FINANCIAL STATEMENTS.
| 12 | JPMORGAN INSURANCE TRUST | DECEMBER 31, 2011 | ||||
Table of Contents
| Ratios/Supplemental data | |||||||||||||||||||||||||
| Ratios to average net assets (a) | ||||||||||||||||||||||||||
| Net asset value, end of period | Total return (b)(c) | Net assets, end of period | Net expenses (d) | Net investment income (loss) | Expenses without waivers, reimbursements and earnings credits | Portfolio turnover rate (b) | ||||||||||||||||||||
| $ | 8.88 | (11.19 | )% | $ | 31,686,069 | 1.03 | % | 1.94 | % | 1.11 | % | 16 | % | |||||||||||||
| 10.17 | 6.84 | 39,089,569 | 1.02 | 1.66 | 1.13 | 15 | ||||||||||||||||||||
| 9.54 | 34.91 | 43,938,093 | 1.01 | 2.00 | (g) | 1.38 | 13 | |||||||||||||||||||
| 7.93 | (41.35 | ) | 41,741,133 | 1.09 | 2.68 | 1.20 | 21 | |||||||||||||||||||
| 15.95 | 9.33 | 83,638,866 | 1.22 | (h) | 1.20 | 1.22 | 15 | |||||||||||||||||||
| 8.96 | (11.38 | ) | 51,373 | 1.28 | 1.69 | 1.36 | 16 | |||||||||||||||||||
| 10.26 | 6.56 | 57,983 | 1.27 | 1.39 | 1.38 | 15 | ||||||||||||||||||||
| 9.65 | 40.42 | 54,418 | 1.26 | 8.82 | (g) | 1.44 | 13 | |||||||||||||||||||
SEE NOTES TO FINANCIAL STATEMENTS.
| DECEMBER 31, 2011 | JPMORGAN INSURANCE TRUST | 13 | ||||||
Table of Contents
AS OF DECEMBER 31, 2011
1. Organization
JPMorgan Insurance Trust (the “Trust”) is registered under the Investment Company Act of 1940, as amended (the “1940 Act”), as an open-end management investment company and is a Massachusetts business trust.
The following is a separate Portfolio of the Trust (the “Portfolio”) covered by this report:
| Classes Offered | Diversified/Non-Diversified | |||
| International Equity Portfolio | Class 1 and Class 2 | Diversified |
The Investment objective of the Portfolio is to provide high total return from a portfolio of equity securities of foreign companies. Total return consists of capital growth and current income.
Portfolio shares are offered only to separate accounts of participating insurance companies and Eligible Plans. Individuals may not purchase shares directly from the Portfolio.
All classes of shares have equal rights as to earnings, assets and voting privileges except that each class may bear different distribution and service fees, and each class has exclusive voting rights with respect to its distribution plan or administrative services plan.
2. Significant Accounting Policies
The following is a summary of significant accounting policies followed by the Trust in the preparation of its financial statements. The policies are in accordance with accounting principles generally accepted in the United States of America. The preparation of financial statements requires management to make estimates and assumptions that affect the reported amounts of assets and liabilities at the date of the financial statements and the reported amounts of income and expenses for the period. Actual results could differ from those estimates.
A. Valuation of Investments — Equity securities listed on a North American, Central American, South American or Caribbean securities exchange shall generally be valued at the last sale price on the exchange on which the security is principally traded that is reported before the time when the net assets of the Portfolio are valued. The value of securities listed on The NASDAQ Stock Market LLC shall generally be the NASDAQ Official Closing Price. Fixed income securities (other than certain short-term investments maturing in less than 61 days) are valued each day based on prices received from independent or affiliated pricing services approved by the Board of Trustees or third party broker-dealers. The broker-dealers or pricing services use multiple valuation techniques to determine fair value. In instances where sufficient market activity exists, the broker-dealers or pricing services may utilize a market-based approach through which quotes from market makers are used to determine fair value. In instances where sufficient market activity may not exist or is limited, the broker-dealers or pricing services also utilize proprietary valuation models which may consider market transactions in comparable securities and the various relationships between securities in determining value and/or market characteristics such as benchmark yield curves, option-adjusted spreads, credit spreads, estimated default rates, coupon-rates, anticipated timing of principal repayments, underlying collateral, and other unique security features in order to estimate the relevant cash flows, which are then discounted to calculate the fair values. Generally, short-term investments of sufficient credit quality maturing in less than 61 days are valued at amortized cost, which approximates market value. Certain investments of the Portfolio may, depending upon market conditions, trade in relatively thin markets and/or in markets that experience significant volatility. As a result of these conditions, the prices used by the Portfolio to value securities may differ from the value that would be realized if these securities were sold, and the differences could be material. Futures and options shall generally be valued on the basis of available market quotations. Swaps and other derivatives are valued daily, primarily using independent or affiliated pricing services approved by the Board of Trustees. If valuations are not available from such services or values received are deemed not representative of market value, values will be obtained from a third party broker-dealer or counterparty. Investments in other open-end investment companies are valued at such investment company’s net asset value per share as of the report date.
Securities or other assets for which market quotations are not readily available or for which market quotations do not represent the value at the time of pricing (including certain illiquid securities) are fair valued in accordance with procedures established by and under the supervision and responsibility of the Board of Trustees. Under these procedures, the Portfolio primarily employs a market-based approach which may use related or comparable assets or liabilities, recent transactions, market multiples, book values, and other relevant information for the investment to determine the fair value of the investment. The Portfolio may also use an income-based valuation approach in which the anticipated future cash flows of the investment are discounted to calculate fair value. Discounts may also be applied due to the nature or duration of any restrictions on the disposition of the investments. Valuations may be based upon current market prices of securities that are comparable in coupon, rating, maturity and industry. It is possible that the estimated values may differ significantly from the values that would have been used had a ready market for the investments existed, and such differences could be material. Trading in securities on most foreign exchanges and over-the-counter markets is normally completed before the close of the domestic market and may also take place on days when the domestic market is closed. In accordance with procedures adopted by the Board of Trustees, the Portfolio applies fair value pricing on equity securities on a daily basis except for North American, Central American, South American and Caribbean equity securities held in its portfolio by utilizing the quotations of an independent pricing service, unless the Portfolio’s advisor determines that use of another valuation methodology is appropriate. The pricing service uses statistical analyses and quantitative models to adjust local market prices using factors such as subsequent movement and changes in the prices of indices, securities and exchange rates in other markets, in determining fair value as of the time the Portfolio calculates its net asset values.
Valuations reflected in this report are as of the report date. As a result, changes in valuation due to market events and/or issuer related events after the report date and prior to issuance of the report are not reflected herein.
| 14 | JPMORGAN INSURANCE TRUST | DECEMBER 31, 2011 | ||||
Table of Contents
The various inputs that are used in determining the fair value of the Portfolio’s investments are summarized into the three broad levels listed below.
| Ÿ | Level 1 — quoted prices in active markets for identical securities |
| Ÿ | Level 2 — other significant observable inputs (including quoted prices for similar securities, interest rates, prepayment speeds, credit risk, etc.) |
| Ÿ | Level 3 — significant unobservable inputs (including the Portfolio’s own assumptions in determining the fair value of investments) |
A financial instrument’s level within the fair value hierarchy is based on the lowest level of any input both individually and in aggregate that is significant to the fair value measurement. The inputs or methodology used for valuing securities are not necessarily an indication of the risk associated with investing in those securities.
The following table represents each valuation input as presented on the Schedule of Portfolio Investments (“SOI”):
| Level 1 Quoted prices | Level 2 Other significant | Level 3 Significant | Total | |||||||||||||
Total Investments in Securities (a) | $ | 50,045 | $ | 31,571,100 | $ | — | $ | 31,621,145 | ||||||||
|
|
|
|
|
|
|
| |||||||||
| (a) | Portfolio holdings designated as Level 1 and Level 2 are disclosed individually in the SOI. Level 1 consists of a money market mutual fund that is held for daily investments of cash. Please refer to the SOI for industry specifics of the portfolio holdings. |
There were no transfers between Levels 1 and 2 during the year ended December 31, 2011.
B. Foreign Currency Translation — The books and records of the Portfolio are maintained in U.S. dollars. Foreign currency amounts are translated into U.S. dollars at the prevailing exchange rates of such currencies against the U.S. dollar. The market value of investment securities and other assets and liabilities are translated at the exchange rate as of the valuation date. Purchases and sales of investment securities, income and expenses are translated at the exchange rate prevailing on the respective dates of such transactions.
Although the net assets of the Portfolio are presented at the foreign exchange rates and market values at the close of the period, the Portfolio does not isolate that portion of the results of operations arising as a result of changes in the foreign exchange rates from the fluctuations arising from
changes in the market prices of securities held or sold during the year. Accordingly, such foreign currency gains (losses) are included in the reported net realized and unrealized gains (losses) on investment transactions on the Statement of Operations.
Reported realized foreign currency gains or losses arise from the disposition of foreign currency, purchase of foreign currency in certain countries (such as Brazil) that impose a tax on such purchases, currency gains or losses realized between the trade and settlement dates on securities transactions, and the difference between the amounts of dividends, interest and foreign withholding taxes recorded on the Portfolio’s books on the transaction date and the U.S. dollar equivalent of the amounts actually received or paid. Unrealized foreign exchange gains and losses arise from changes (due to the changes in the exchange rate) in the value of foreign currency and other assets and liabilities denominated in foreign currencies, which are held at year end.
C. Security Transactions and Investment Income — Investment transactions are accounted for on the trade date (the date the order to buy or sell is executed). Securities gains and losses are calculated on a specifically identified cost basis. Interest income is determined on the basis of coupon interest accrued using the effective interest method adjusted for amortization of premiums and accretion of discounts. Dividend income less foreign taxes withheld, if any, is recorded on the ex-dividend date or when the Portfolio first learns of the dividend.
D. Allocation of Income and Expenses — In calculating the net asset value per share of each class, investment income, realized and unrealized gains and losses and expenses other than class specific expenses are allocated daily to each class of shares based upon the proportion of net assets of each class at the beginning of each day. Expenses directly attributable to a portfolio are charged directly to that portfolio while the expenses attributable to more than one portfolio of the Trust are allocated among the respective portfolios. Each class of shares bears its pro-rata portion of expenses attributable to the Portfolio, except that each class separately bears expenses related specifically to that class, such as distribution fees.
E. Federal Income Taxes — The Portfolio is treated as a separate taxable entity for Federal income tax purposes. The Portfolio’s policy is to comply with the provisions of the Internal Revenue Code of 1986, as amended (the “Code”), applicable to regulated investment companies and to distribute to shareholders all of its distributable net investment income and net realized gain on investments. Accordingly, no provision for Federal income tax is necessary. The Portfolio is also a segregated portfolio of assets for insurance purposes and intends to comply with the diversification requirements of Subchapter L of the Code. The Portfolio is not aware of any tax positions for which it is reasonably possible that the total amounts of unrecognized tax benefits or losses will significantly change in the next twelve months. However, the Portfolio’s conclusions may be subject to future review based on changes in, or the interpretation of, the accounting standards or tax laws and regulations. The Portfolio’s Federal tax returns for the prior three fiscal years remain subject to examination by the Internal Revenue Service.
F. Foreign Taxes — The Portfolio may be subject to foreign taxes on income, gains on investments or currency purchases/repatriation, a portion of which may be recoverable. The Portfolio will accrue such taxes and recoveries as applicable, based upon its current interpretation of tax rules and regulations that exist in the markets in which it invests.
| DECEMBER 31, 2011 | JPMORGAN INSURANCE TRUST | 15 | ||||||
Table of Contents
NOTES TO FINANCIAL STATEMENTS
AS OF DECEMBER 31, 2011 (continued)
G. Dividends and Distributions to Shareholders — Dividends from net investment income are generally declared and paid at least annually. Dividends are declared separately for each class. No class has preferential dividend rights; differences in per share rates are due to differences in separate class expenses. Net realized capital gains, if any, are distributed at least annually. The amount of dividends and distributions from net investment income and net realized capital gains is determined in accordance with Federal income tax regulations, which may differ from accounting principles generally accepted in the United States of America. To the extent these “book/tax” differences are permanent in nature (i.e., that they result from other than timing of recognition — “temporary differences”), such amounts are reclassified within the capital accounts based on their Federal tax-basis treatment.
The following amounts were reclassified within the capital accounts:
| Paid in capital | Accumulated Undistributed/ (Overdistributed) Net Investment Income | Accumulated Net Realized Gain (Loss) on Investments | ||||||||||
| $ | (43,799 | ) | $ | 4,715 | $ | 39,084 | ||||||
The reclassifications for the Portfolio relate primarily to the write-offs of capital loss carryforwards acquired in the merger.
3. Fees and Other Transactions with Affiliates
A. Investment Advisory Fee — Pursuant to the Investment Advisory Agreement, J.P. Morgan Investment Management Inc. (“JPMIM” or the “Advisor”) acts as the investment advisor to the Portfolio. The Advisor is a wholly-owned subsidiary of JPMorgan Asset Management Holdings Inc., which is a wholly-owned subsidiary of JPMorgan Chase & Co. (“JPMorgan”). The Advisor supervises the investments of the Portfolio and for such services is paid a fee. The fee is accrued daily and paid monthly based on the Portfolio’s average daily net assets at an annual fee rate of 0.60%.
The Advisor waived Investment Advisory fees and/or reimbursed expenses as outlined in Note 3.E.
B. Administration Fee — Pursuant to an Administration Agreement, JPMorgan Funds Management, Inc. (the “Administrator”), an indirect, wholly-owned subsidiary of JPMorgan, provides certain administration services to the Portfolio. In consideration of these services, the Administrator receives a fee computed daily and paid monthly at the annual rate of 0.15% of the first $25 billion of the average daily net assets of all funds in the J.P. Morgan Funds Complex (excluding certain funds of funds and money market funds) and 0.075% of the average daily net assets in excess of $25 billion of all such funds. For the year ended December 31, 2011, the annual effective rate was 0.09% of the Portfolio’s average daily net assets.
JPMorgan Chase Bank, N.A. (“JPMCB”), a wholly-owned subsidiary of JPMorgan, and successor in interest to J.P. Morgan Investor Services Co. serves as the Portfolio’s sub-administrator (the “Sub-administrator”). For its services as Sub-administrator, JPMCB receives a portion of the fees payable to the Administrator.
C. Distribution Fees — Pursuant to a Distribution Agreement, JPMorgan Distribution Services, Inc. (the “Distributor”), a wholly-owned subsidiary of JPMorgan, serves as the Trust’s exclusive underwriter and promotes and arranges for the sale of the Portfolio’s shares.
The Board of Trustees has adopted a Distribution Plan (the “Distribution Plan”) for Class 2 Shares of the Portfolio in accordance with Rule 12b-1 under the 1940 Act. The Distribution Plan provides that the Portfolio shall pay distribution fees, including payments to the Distributor, at an annual rate of 0.25% of the average daily net assets of Class 2 Shares.
D. Custodian and Accounting Fees — JPMCB provides portfolio custody and accounting services for the Portfolio. The amounts paid directly to JPMCB by the Portfolio for custody and accounting services are included in Custodian and accounting fees in the Statement of Operations. The Portfolio earns interest on uninvested cash balances held by the custodian. Such interest amounts are presented separately in the Statement of Operations.
Interest expense, if any, paid to the custodian related to cash overdrafts is included in Interest expense to affiliates in the Statement of Operations.
Interest income, if any, earned on cash balances at the custodian is included as Interest income from affiliates in the Statement of Operations.
E. Waivers and Reimbursements — The Advisor and Administrator have contractually agreed to waive fees and/or reimburse the Portfolio to the extent that total annual operating expenses (excluding acquired fund fees and expenses, dividend expense related to short sales, interest, taxes, extraordinary expenses and expenses related to the Board of Trustees’ deferred compensation plan) exceed the percentages of the Portfolio’s average daily net assets as shown in the table below:
| Class 1 | Class 2 | |||||||
| 1.03% | 1.28 | % | ||||||
The contractual expense limitation agreements were in effect for the year ended December 31, 2011. The expense limitation percentages in the table above are in place until at least April 30, 2012. In addition, the Portfolio’s service providers have voluntarily waived fees during the year ended December 31, 2011. However, the Portfolio’s service providers are under no obligation to do so and may discontinue such voluntary waivers at any time.
| 16 | JPMORGAN INSURANCE TRUST | DECEMBER 31, 2011 | ||||
Table of Contents
For the year ended December 31, 2011, the Advisor contractually waived fees for the Portfolio in the amount of $29,197. The Advisor does not expect the Portfolio to repay any such waived fees in future years.
Additionally, the Portfolio may invest in one or more money market funds advised by the Advisor or its affiliates. The Advisor, Administrator and the Distributor waive fees in an amount sufficient to offset the respective fees each charges to the affiliated money market fund on the Portfolio’s investment in such affiliated money market fund. A portion of the waiver is voluntary.
The amount of waivers resulting from investments in the money market funds for the year ended December 31, 2011 was $294.
F. Other — Certain officers of the Trust are affiliated with the Advisor, the Administrator and the Distributor. Such officers, with the exception of the Chief Compliance Officer, receive no compensation from the Portfolio for serving in their respective roles.
The Board of Trustees appointed a Chief Compliance Officer to the Portfolio in accordance with federal securities regulations. The Portfolio, along with other affiliated portfolios, makes reimbursement payments, on a pro-rata basis, to the Administrator for a portion of the fees associated with the Office of the Chief Compliance Officer. Such fees are included in Trustees’ and Chief Compliance Officer’s fees in the Statement of Operations.
The Trust adopted a Trustee Deferred Compensation Plan (the “Plan”) which allows the Independent Trustees to defer the receipt of all or a portion of compensation related to performance of their duties as a Trustee. The deferred fees are invested in various J.P. Morgan Funds until distribution in accordance with the Plan.
During the year ended December 31, 2011, the Portfolio may have purchased securities from an underwriting syndicate in which the principal underwriter or members of the syndicate are affiliated with the Advisor.
The Portfolio may use related party broker/dealers. For the year ended December 31, 2011, the Portfolio did not incur any brokerage commissions with broker/dealers affiliated with the Advisor.
The Securities and Exchange Commission has granted an exemptive order permitting the Portfolio to engage in principal transactions with J.P. Morgan Securities, Inc., an affiliated broker, involving taxable money market instruments subject to certain conditions.
4. Investment Transactions
During the year ended December 31, 2011, purchases and sales of investments (excluding short-term investments) were as follows:
Purchases (excluding U.S. Government) | Sales (excluding U.S. Government) | |||||||
| $ | 5,813,285 | $ | 8,609,748 | |||||
During the year ended December 31, 2011, there were no purchases or sales of U.S. Government securities.
5. Federal Income Tax Matters
For Federal income tax purposes, the cost and unrealized appreciation (depreciation) in value of the investment securities at December 31, 2011, were as follows:
Aggregate Cost | Gross Unrealized Appreciation | Gross Unrealized Depreciation | Net Unrealized Appreciation (Depreciation) | |||||||||||||
| $ | 27,210,980 | $ | 7,857,947 | $ | 3,447,782 | $ | 4,410,165 | |||||||||
The difference between book and tax basis appreciation/ (depreciation) on investments is primarily attributed to wash sale loss deferrals.
The tax character of distributions paid during the fiscal year ended December 31, 2011 was as follows:
| Total Distributions Paid From: | ||||||||
Ordinary Income | Total Distributions Paid | |||||||
| $ | 666,819 | $ | 666,819 | |||||
The tax character of distributions paid during the fiscal year ended December 31, 2010 was as follows:
| Total Distributions Paid From: | ||||||||
Ordinary Income | Total Distributions Paid | |||||||
| $ | 98,357 | $ | 98,357 | |||||
| DECEMBER 31, 2011 | JPMORGAN INSURANCE TRUST | 17 | ||||||
Table of Contents
NOTES TO FINANCIAL STATEMENTS
AS OF DECEMBER 31, 2011 (continued)
At December 31, 2011, the components of net assets (excluding paid in capital) on a tax basis were as follows:
Current Distributable Ordinary Income | Current Distributable Long-Term Capital Gain or (Tax Basis Capital Loss Carryover) | Unrealized Appreciation (Depreciation) | ||||||||||
| $ | 710,726 | $ | (2,684,955 | ) | $ | 4,408,375 | ||||||
The cumulative timing differences primarily consist of Trustee deferred compensation and wash sale loss deferrals.
Under the Regulated Investment Company Modernization Act of 2010 (the “Act”), net capital losses recognized by the Portfolio after December 31, 2010, may get carried forward indefinitely, and retain their character as short-term and/or long term losses. Prior to the Act, pre-enactment net capital losses incurred by the Portfolio were carried forward for eight years and treated as short-term losses. The Act requires that post-enactment net capital losses be used before pre-enactment net capital losses.
As of December 31, 2011, the Portfolio did not have post-enactment net capital loss carryforwards.
As of December 31, 2011, the Portfolio had the following pre-enactment net capital loss carryforwards, expiring during the year indicated, which are available to offset future realized gains:
| 2016 | 2017 | Total | ||||||||||
| $ | 959,016 | $ | 1,725,939 | * | $ | 2,684,955 | ||||||
| * | This amount includes $1,725,939 of capital loss carryforwards from business combinations, which may be limited in future years under the Internal Revenue Code Sections 381-384. |
During the year ended December 31, 2011, the Portfolio utilized capital loss carryforwards in the amount of $606,283 and $43,799 was written-off due to IRS Code Section 382-383 limitations.
Net capital losses incurred after October 31 and within the taxable year are deemed to arise on the first business day of the Portfolio’s next taxable year. For the year ended December 31, 2011, the Portfolio deferred to January 1, 2012 post-October long-term capital losses of $11,708.
6. Borrowings
The Trust and JPMCB have entered into a financing arrangement. Under this arrangement, JPMCB provides an unsecured, uncommitted credit facility in the aggregate amount of $100 million to certain of the J.P. Morgan Funds, including the Portfolio. Advances under the arrangement are taken primarily for temporary or emergency purposes, including the meeting of redemption requests that otherwise might require the untimely disposition of securities, and are subject to the Portfolio’s borrowing restrictions. Interest on borrowings is payable at a rate determined by JPMCB at the time of borrowing. This agreement has been extended until November 12, 2012.
The Portfolio had no borrowings outstanding from the unsecured, uncommitted credit facility at December 31, 2011, or at any time during the year then ended.
Interest expense paid, if any, as a result of borrowings from the unsecured, uncommitted credit facility is included in Interest expense to affiliates in the Statement of Operations.
7. Risks, Concentrations and Indemnifications
In the normal course of business, the Portfolio enters into contracts that contain a variety of representations which provide general indemnifications. The Portfolio’s maximum exposure under these arrangements is unknown, as this would involve future claims that may be made against the Portfolio that have not yet occurred. However, based on experience, the Portfolio expects the risk of loss to be remote.
From time to time, the Portfolio may have a concentration of several shareholders holding a significant percentage of shares outstanding. Investment activities of these shareholders could have a material impact on the Portfolio.
The Portfolio may have elements of risk not typically associated with investments in the United States of America due to concentrated investments in a limited number of countries or regions, which may vary throughout the year. Such concentrations may subject the Portfolio to additional risks resulting from political or economic conditions in such countries or regions and the possible imposition of adverse governmental laws or currency exchange restrictions could cause the Portfolio’s securities and their markets to be less liquid and their prices to be more volatile than those of comparable U.S. securities.
As of December 31, 2011, substantially all of the Portfolio’s net assets consist of securities of issuers that are denominated in foreign currencies. Changes in currency exchange rates will affect the value of and investment income from such securities.
As of December 31, 2011, the Portfolio invested approximately 26.4% of its total investments in the United Kingdom.
| 18 | JPMORGAN INSURANCE TRUST | DECEMBER 31, 2011 | ||||
Table of Contents
REPORT OF INDEPENDENT REGISTERED PUBLIC ACCOUNTING FIRM
To the Board of Trustees of JPMorgan Insurance Trust and Shareholders of JPMorgan Insurance Trust International Equity Portfolio:
In our opinion, the accompanying statement of assets and liabilities, including the schedule of portfolio investments, and the related statements of operations and of changes in net assets and the financial highlights present fairly, in all material respects, the financial position of JPMorgan Insurance Trust International Equity Portfolio (a separate Portfolio of JPMorgan Insurance Trust) (hereafter referred to as the “Portfolio”) at December 31, 2011, the results of its operations for the year then ended, the changes in its net assets for each of the two years in the period then ended and the financial highlights for each of the five years in the period then ended, in conformity with accounting principles generally accepted in the United States of America. These financial statements and financial highlights (hereafter referred to as “financial statements”) are the responsibility of the Portfolio’s management. Our responsibility is to express an opinion on these financial statements based on our audits. We conducted our audits of these financial statements in accordance with the standards of the Public Company Accounting Oversight Board (United States). Those standards require that we plan and perform the audit to obtain reasonable assurance about whether the financial statements are free of material misstatement. An audit includes examining, on a test basis, evidence supporting the amounts and disclosures in the financial statements, assessing the accounting principles used and significant estimates made by management, and evaluating the overall financial statement presentation. We believe that our audits, which included confirmation of securities at December 31, 2011 by correspondence with the custodian, provide a reasonable basis for our opinion.
PricewaterhouseCoopers LLP
New York, New York
February 23, 2012
| DECEMBER 31, 2011 | JPMORGAN INSURANCE TRUST | 19 | ||||||
Table of Contents
(Unaudited)
The Portfolio’s Statement of Additional Information includes additional information about the Portfolio’s Trustees and is available, without charge, upon request by calling 1-800-480-4111 or on the J.P. Morgan Funds’ website at www.jpmorganfunds.com.
Name (Year of Birth); Positions With the Portfolio (1) | Principal Occupations During Past 5 Years | Number of Complex Overseen by Trustee (2) | Other Directorships Held Outside Fund Complex During Past 5 Years | |||
Independent Trustees | ||||||
| William J. Armstrong (1941); Trustee of Trust since 2005; Trustee of heritage J.P. Morgan Funds since 1987. | Retired; CFO and Consultant, EduNeering, Inc. (internet business education supplier) (2000-2001); Vice President and Treasurer, Ingersoll-Rand Company (manufacturer of industrial equipment) (1972-2000). | 154 | None. | |||
| John F. Finn (1947); Trustee of Trust since 2005; Trustee of heritage One Group Mutual Funds since 1998. | Chairman (1985-present), President and Chief Executive Officer, Gardner, Inc. (supply chain management company serving industrial and consumer markets) (1974-present). | 154 | Director, Cardinal Health, Inc. (CAH) (1994-present); Director, Greif, Inc. (GEF) (industrial package products and services) (2007-present). | |||
| Dr. Matthew Goldstein (1941); Trustee of Trust since 2005; Trustee of heritage J.P. Morgan Funds since 2003. | Chancellor, City University of New York (1999-present); President, Adelphi University (New York) (1998-1999). | 154 | Director, New Plan Excel (NXL) (1999-2005); Director, National Financial Partners (NFP) (2003-2005); Director, Bronx-Lebanon Hospital Center; Director, United Way of New York City (2002-present). | |||
| Robert J. Higgins (1945); Trustee of Trust since 2005; Trustee of heritage J.P. Morgan Funds since 2002. | Retired; Director of Administration of the State of Rhode Island (2003-2004); President — Consumer Banking and Investment Services, Fleet Boston Financial (1971-2001). | 154 | None. | |||
| Peter C. Marshall (1942); Trustee of Trust since 2005; Trustee of heritage One Group Mutual Funds since 1985. | Self-employed business consultant (2002-present). | 154 | Director, Center for Communication, Hearing, and Deafness (1990-present). | |||
| Marilyn McCoy* (1948); Trustee of Trust since 2005; Trustee of heritage One Group Mutual Funds since 1999. | Vice President of Administration and Planning, Northwestern University (1985-present). | 154 | Trustee, Carleton College (2003-present). | |||
| William G. Morton, Jr. (1937); Trustee of Trust since 2005; Trustee of heritage J.P. Morgan Funds since 2003. | Retired; Chairman Emeritus (2001-2002), and Chairman and Chief Executive Officer, Boston Stock Exchange (1985-2001). | 154 | Director, Radio Shack Corp. (1987-2008); Trustee, Stratton Mountain School (2001-present). | |||
| Robert A. Oden, Jr. (1946); Trustee of Trust since 2005; Trustee of heritage One Group Mutual Funds since 1997. | Retired; President, Carleton College (2002-2010); President, Kenyon College (1995-2002). | 154 | Trustee, American University in Cairo (1999-present); Trustee, Carleton College (2002-2010). | |||
| Fergus Reid, III (1932); Trustee of Trust (Chairman) since 2005; Trustee (Chairman) of heritage J.P. Morgan Funds since 1987. | Chairman, Joe Pietryka, Inc. (formerly Lumelite Corporation) (plastics manufacturing) (2003-present); Chairman and Chief Executive Officer, Lumelite Corporation (1985-2002). | 154 | Trustee, Morgan Stanley Funds (105 portfolios) (1992-present). | |||
| 20 | JPMORGAN INSURANCE TRUST | DECEMBER 31, 2011 | ||||
Table of Contents
TRUSTEES
(Unaudited) (continued)
Name (Year of Birth); Positions With the Portfolio (1) | Principal Occupations During Past 5 Years | Number of Complex Overseen by Trustee (2) | Other Directorships Held Outside Fund Complex During Past 5 Years | |||
Independent Trustees (continued) | ||||||
| Frederick W. Ruebeck (1939); Trustee of Trust since 2005; Trustee of heritage One Group Mutual Funds since 1994. | Consultant (2000-present); Advisor, JP Greene & Associates, LLC (broker-dealer) (2000-2009); Chief Investment Officer, Wabash College (2004-present); Director of Investments, Eli Lilly and Company (pharmaceuticals) (1988-1999). | 154 | Trustee, Wabash College (1988-present); Chairman, Indianapolis Symphony Orchestra Foundation (1994-present). | |||
| James J. Schonbachler (1943); Trustee of Trust since 2005; Trustee of heritage J.P. Morgan Funds since 2001. | Retired; Managing Director of Bankers Trust Company (financial services) (1968-1998). | 154 | None. | |||
Interested Trustees | ||||||
| Frankie D. Hughes** (1952), Trustee of Trust since 2008. | President and Chief Investment Officer, Hughes Capital Management, Inc. (fixed income asset management) (1993-present). | 154 | Trustee, The Victory Portfolios (2000-2008). | |||
| Leonard M. Spalding, Jr.*** (1935); Trustee of Trust since 2005; Trustee of heritage J.P. Morgan Funds since 1998. | Retired; Chief Executive Officer, Chase Mutual Funds (investment company) (1989-1998); President and Chief Executive Officer, Vista Capital Management (investment management) (1990-1998); Chief Investment Executive, Chase Manhattan Private Bank (investment management) (1990-1998). | 154 | Director, Glenview Trust Company, LLC (2001-present); Trustee, St. Catharine College (1998-present); Trustee, Bellarmine University (2000-present); Director, Springfield-Washington County Economic Development Authority (1997-present); Trustee, Catholic Education Foundation (2005-present). | |||
| (1) | Each Trustee serves for an indefinite term, subject to the Trust’s current retirement policy, which is age 75 for all Trustees, except that the Board has determined Messrs. Reid and Spalding should continue to serve until December 31, 2012. |
| (2) | A Fund Complex means two or more registered investment companies that hold themselves out to investors as related companies for purposes of investment and investor services or have a common investment adviser or have an investment adviser that is an affiliated person of the investment adviser of any of the other registered investment companies. The J.P. Morgan Funds Complex for which the Board of Trustees serves currently includes eleven registered investment companies (154 funds). |
| * | Ms. McCoy has served as Vice President of Administration and Planning for Northwestern University since 1985. William M. Daley was the Head of Corporate Responsibility for JPMorgan Chase & Co. prior to January 2011 and served as a member of the Board of Trustees of Northwestern University from 2005 through 2010. JPMIM, the Funds’ investment advisor, is a wholly-owned subsidiary of JPMorgan Chase & Co. Three other members of the Board of Trustees of Northwestern University are executive officers of registered investment advisors (not affiliated with JPMorgan) that are under common control with subadvisors to certain J.P. Morgan Funds. |
| ** | Ms. Hughes is treated as an “interested person” based on the portfolio holdings of clients of Hughes Capital Management, Inc. |
| *** | Mr. Spalding is treated as an “interested person” due to his ownership of JPMorgan Chase stock. |
The contact address for each of the Trustees is 270 Park Avenue, New York, NY 10017.
| DECEMBER 31, 2011 | JPMORGAN INSURANCE TRUST | 21 | ||||||
Table of Contents
(Unaudited)
Name (Year of Birth), Positions Held with the Trust (Since) | Principal Occupations During Past 5 Years | |
| Patricia A. Maleski (1960), President and Principal Executive Officer (2010) | Managing Director, J.P. Morgan Investment Management Inc. and Chief Administrative Officer, J.P. Morgan Funds and Institutional Pooled Vehicles since 2010; previously, Treasurer and Principal Financial Officer of the Trusts from 2008 to 2010; previously, Head of Funds Administration and Board Liaison, J.P. Morgan Funds prior to 2010. Ms. Maleski has been with JPMorgan Chase & Co. since 2001. | |
| Joy C. Dowd (1972), Treasurer and Principal Financial Officer (2010) | Assistant Treasurer of the Trusts from 2009 to 2010; Executive Director, JPMorgan Funds Management, Inc. from February 2011; Vice President, JPMorgan Funds Management, Inc. from December 2008 to February 2011; prior to joining JPMorgan Chase, Ms. Dowd worked in MetLife’s investments audit group from 2005 through 2008. | |
| Frank J. Nasta (1964), Secretary (2008) | Managing Director and Associate General Counsel, JPMorgan Chase since 2008; Previously, Director, Managing Director, General Counsel and Corporate Secretary, J. & W. Seligman & Co. Incorporated; Secretary of each of the investment companies of the Seligman Group of Funds and Seligman Data Corp.; Director and Corporate Secretary, Seligman Advisors, Inc. and Seligman Services, Inc. | |
| Stephen M. Ungerman (1953), Chief Compliance Officer (2005) | Managing Director, JPMorgan Chase & Co.; Mr. Ungerman has been with JPMorgan Chase & Co. since 2000. | |
| Paul L. Gulinello (1950), AML Compliance Officer (2005) | Vice President and Anti Money Laundering Compliance Officer for JPMorgan Asset Management Americas, additionally responsible for privacy, personal trading and Code of Ethics compliance since 2004. Mr. Gulinello has been with JPMorgan Chase & Co. since 1972. | |
Elizabeth A. Davin (1964), Assistant Secretary (2005)* | Vice President and Assistant General Counsel, JPMorgan Chase since 2005; Senior Counsel, JPMorgan Chase (formerly Bank One Corporation) from 2004 to 2005. | |
| Jessica K. Ditullio (1962), Assistant Secretary (2005)* | Executive Director and Assistant General Counsel, JPMorgan Chase since February 2011; Ms. Ditullio has served as an attorney with various titles for JPMorgan Chase (formerly Bank One Corporation) since 1990. | |
| John T. Fitzgerald (1975), Assistant Secretary (2008) | Executive Director and Assistant General Counsel, JPMorgan Chase since February 2011; formerly, Vice President and Assistant General Counsel, JPMorgan Chase from 2005 until February 2011. | |
| Carmine Lekstutis (1980) Assistant Secretary (2011) | Vice President and Assistant General Counsel, JPMorgan Chase since 2011; Associate, Skadden, Arps, Slate, Meagher & Flom LLP (law firm) from 2006 to 2011. | |
| Gregory S. Samuels (1980) Assistant Secretary (2010) | Vice President and Assistant General Counsel, JPMorgan Chase since 2010; Associate, Ropes & Gray (law firm) from 2008 to 2010; Associate, Clifford Chance LLP (law firm) from 2005 to 2008. | |
| Brian L. Duncan (1965), Assistant Treasurer (2008)* | Vice President, JPMorgan Funds Management, Inc. since June 2007; prior to joining JPMorgan Chase, Mr. Duncan worked for Penn Treaty American Corporation as Vice President and Controller from 2004 through 2007. | |
| Jeffrey D. House (1972), Assistant Treasurer (2006)* | Vice President, JPMorgan Funds Management, Inc. since July 2006. | |
| Laura S. Melman (1966), Assistant Treasurer (2006) | Executive Director, JPMorgan Funds Management, Inc. since February 2011, responsible for Taxation; Vice President, JPMorgan Funds Management, Inc. from August 2006 to February 2011, responsible for Taxation. | |
| Joseph Parascondola (1963), Assistant Treasurer (2011) | Vice President, JPMorgan Funds Management, Inc. since August 2006. | |
| Matthew J. Plastina (1970), Assistant Treasurer (2011) | Vice President, JPMorgan Funds Management, Inc. since August 2010; prior to August 2010, Vice President and Controller, Legg Mason Global Asset Management. | |
| Jeffery Reedy (1973), Assistant Treasurer (2011)* | Vice President, JPMorgan Funds Management, Inc. since February 2006. | |
The contact address for each of the officers, unless otherwise noted, is 270 Park Avenue, New York, NY 10017.
| * | The contact address for the officer is 1111 Polaris Parkway, Columbus, OH 43240. |
| 22 | JPMORGAN INSURANCE TRUST | DECEMBER 31, 2011 | ||||
Table of Contents
SCHEDULE OF SHAREHOLDER EXPENSES
(Unaudited)
Hypothetical $1,000 Investment
As a shareholder of the Portfolio, you incur ongoing costs, including investment advisory fees, administration fees, distribution fees (for Class 2 Shares) and other Portfolio expenses. Because the Portfolio is a funding vehicle for Policies and Eligible Plans, you may also incur sales charges and other fees relating to the Policies or Eligible Plans. The examples below are intended to help you understand your ongoing costs (in dollars) of investing in the Portfolio, but not the costs of the Policies or Eligible Plans, and to compare these ongoing costs with the ongoing costs of investing in other mutual funds. The examples assume that you had a $1,000 investment in the Class at the beginning of the reporting period, July 1, 2011, and continued to hold your shares at the end of the reporting period, December 31, 2011.
Actual Expenses
For each Class of the Portfolio in the table below, the first line provides information about actual account values and actual expenses. You may use the information in this line, together with the amount you invested, to estimate the expenses that you paid over the period. Simply divide your account value by $1,000 (for example, an $8,600 account value divided by $1,000 = 8.6), then multiply the result by the number in the first line of each Class under the heading entitled “Expenses Paid During” to estimate the expenses you paid on your account during this period.
Hypothetical Example for Comparison Purposes
The second line of each Class in the table below provides information about hypothetical account values and hypothetical expenses based on the Class’ actual expense ratio and an assumed rate of return of 5% per year before expenses, which is not the Class’ actual return. The hypothetical account values and expenses may not be used to estimate the actual ending account balance or expenses you paid for the period. You may use this information to compare the ongoing costs of investing in the Class of the Portfolio and other portfolios. To do so, compare this 5% hypothetical example with the 5% hypothetical examples that appear in the shareholder reports of the other funds. Please note that the expenses shown in the table are meant to highlight your ongoing costs only and do not reflect any transaction costs, such as sales charges (loads) or redemption fees or the costs associated with the Policies and Eligible Plans through which the Portfolio is held. Therefore, the second line for each Class in the table is useful in comparing ongoing costs only, and will not help you determine the relative total costs of owning different portfolios. In addition, if these transaction costs were included, your costs would have been higher. The examples also assume all dividends and distributions have been reinvested.
| Beginning Account Value, July 1, 2011 | Ending Account Value December 31, 2011 | Expenses Paid During July 1, 2011 to December 31, 2011* | Annualized Expense Ratio | |||||||||||||
International Equity Portfolio | ||||||||||||||||
Class 1 | ||||||||||||||||
Actual | $ | 1,000.00 | $ | 841.70 | $ | 4.73 | 1.02 | % | ||||||||
Hypothetical | 1,000.00 | 1,020.06 | 5.19 | 1.02 | ||||||||||||
Class 2 | ||||||||||||||||
Actual | 1,000.00 | 840.50 | 5.89 | 1.27 | ||||||||||||
Hypothetical | 1,000.00 | 1,018.80 | 6.46 | 1.27 | ||||||||||||
| * | Expenses are equal to the Portfolio’s annualized expense ratio, multiplied by the average account value over the period, multiplied by 184/365 (to reflect the one-half year period). |
| DECEMBER 31, 2011 | JPMORGAN INSURANCE TRUST | 23 | ||||||
Table of Contents
BOARD APPROVAL OF INVESTMENT ADVISORY AGREEMENT
(Unaudited)
The Board of Trustees meets regularly throughout the year and considers factors that are relevant to its annual consideration of investment advisory agreements at each meeting. The Board of Trustees has established various standing committees, composed of Trustees with diverse backgrounds, to which the Board of Trustees has assigned specific subject matter responsibilities to further enhance the effectiveness of the Board’s oversight and decision making. The Board of Trustees and its investment subcommittees (money market and alternative products, equity, and fixed income) also meet for the specific purpose of considering advisory contract annual renewals. The Board of Trustees held meetings in person in June and August 2011, at which the Trustees considered the continuation of the investment advisory agreement for the Portfolio whose annual report is contained herein (the “Advisory Agreement”). At the June meeting, the Board’s investment subcommittees met to review and consider performance, expense and related information for the J.P. Morgan Funds. Each investment subcommittee reported to the full Board, which then considered the investment subcommittee’s preliminary findings. At the August meeting, the Trustees continued their review and consideration. The Trustees, including a majority of the Trustees who are not “interested persons” (as defined in the 1940 Act) of any party to the Advisory Agreement or any of their affiliates, approved the continuation of the Advisory Agreement on August 25, 2011.
The Trustees, as part of their review of the investment advisory arrangements for the J.P. Morgan Funds, considered and reviewed performance and other information received from the Advisor, on a regular basis over the course of the year, as well as information specifically prepared for their annual review. This information included the Portfolio’s performance compared to the performance of the Portfolio’s peers and benchmarks and analyses by the Advisor of the Portfolio’s performance. The Advisor also periodically provides comparative information regarding the Portfolio’s expense ratios and those of the peer groups. In addition, in preparation for the June and August meetings, the Trustees requested, received and evaluated extensive materials from the Advisor, including, with respect to certain J.P. Morgan Funds, performance and expense information compiled by Lipper Inc. (“Lipper”), an independent provider of investment company data. Prior to voting, the Trustees reviewed the proposed approval of the Advisory Agreement with representatives of the Advisor and with counsels to the Trust and independent Trustees and received a memorandum from independent counsel to the Trustees discussing the legal standards for their consideration of the proposed approval. The Trustees also discussed the proposed approvals in executive sessions with counsels to the Trust and independent Trustees at which no representatives of the Advisor were present. Set forth below is a summary of the material factors evaluated by the Trustees in determining whether to approve the Advisory Agreement.
In their deliberations, there was a comprehensive consideration of the information received by the Trustees. Each Trustee attributed different weights to the various factors and no factor alone was considered determinative. From year to year, the Trustees consider and place emphasis on relevant information in light of changing circumstances in market and economic conditions. The Trustees determined that the compensation to be received by the Advisor from the Portfolio under the Advisory Agreement was fair and reasonable and that the continuance of the investment advisory contract was in the best interests of the Portfolio and its shareholders.
The factors summarized below were considered and discussed by the Trustees in reaching their conclusions:
Nature, Extent and Quality of Services Provided by the Advisor
The Trustees received and considered information regarding the nature, extent and quality of the services provided to the Portfolio under the Advisory Agreement. The Trustees took into account information furnished throughout the year at Trustee meetings, as well as the materials furnished specifically in connection with this annual review process. The Trustees considered the background and experience of the Advisor’s senior management and the expertise of, and the amount of attention given to the Portfolio by, investment personnel of the Advisor. In addition, the Trustees reviewed the qualifications, backgrounds and responsibilities of the portfolio management team primarily responsible for the day-to-day management of the Portfolio and the infrastructure supporting the team. The Trustees also considered information provided by the Advisor and JPMorgan Distribution Services, Inc. (“JPMDS”) about the structure and distribution strategy of the Portfolio. The Trustees also reviewed information relating to the Advisor’s risk governance model and reports showing the Advisor’s compliance structure and ongoing compliance processes. The quality of the administrative services provided by JPMorgan Funds Management, Inc. (“JPMFM”), an affiliate of the Advisor, was also considered.
The Board of Trustees also considered its knowledge of the nature and quality of the services provided by the Advisor to the Portfolio gained from their experience as Trustees of the J.P. Morgan Funds. In addition, they considered the overall reputation and capabilities of the Advisor and its affiliates, the commitment of the Advisor to provide high quality service to the Portfolio, their overall confidence in the Advisor’s integrity and the Advisor’s responsiveness to questions or concerns raised by them, including the Advisor’s willingness to consider and implement organizational and operational changes designed to improve investment results and the services provided to the Portfolio.
Based on these considerations and other factors, the Trustees concluded that they were satisfied with the nature, extent and
| 24 | JPMORGAN INSURANCE TRUST | DECEMBER 31, 2011 | ||||
Table of Contents
quality of the investment advisory services provided to the Portfolio by the Advisor.
Costs of Services Provided and Profitability to the Advisor and its Affiliates
The Trustees received and considered information regarding the profitability to the Advisor and its affiliates in providing services to the Portfolio. The Trustees reviewed and discussed this data. The Trustees recognized that this data is not audited and represents the Advisor’s determination of its and its affiliates’ revenues from the contractual services provided to the Portfolio, less expenses of providing such services. Expenses include direct and indirect costs and are calculated using an allocation methodology developed by the Advisor. The Trustees also recognized that it is difficult to make comparisons of profitability from fund investment advisory contracts because comparative information is not generally publicly available and is affected by numerous factors, including the structure of the particular adviser, the types of funds it manages, its business mix, numerous assumptions regarding allocations and the fact that publicly-traded fund managers’ operating profits and net income are net of distribution and marketing expenses. Based on their review, the Trustees concluded that the profitability to the Advisor under the Advisory Agreement was not unreasonable in light of the services and benefits provided to the Portfolio.
Fall-Out Benefits
The Trustees reviewed information regarding potential “fallout” or ancillary benefits received by the Advisor and its affiliates as a result of their relationship with the Portfolio. The Board considered that the Advisor does not currently use third-party soft dollar arrangements with respect to securities transactions it executes for the Portfolio.
The Trustees also considered that JPMFM earns fees from the Portfolio for providing administrative services. These fees were shown separately in the profitability analysis presented to the Trustees. The Trustees also considered the payments of Rule 12b-1 fees to JPMDS, an affiliate of the Advisor, which also acts as the Portfolio’s distributor and that these fees are in turn generally paid to financial intermediaries that sell the J.P. Morgan Funds, including financial intermediaries that are affiliates of the Advisor. The Trustees also considered the fees paid to JPMorgan Chase Bank, N.A. (“JPMCB”) for custody and fund accounting and other related services.
Economies of Scale
The Trustees noted that the proposed investment advisory fee schedule for the Portfolio does not contain breakpoints. The Trustees considered whether it would be appropriate to add advisory fee breakpoints and the Trustees concluded that the current fee structure was reasonable in light of the fee waivers
and expense limitations that the Advisor has in place that serve to limit the overall net expense ratio at competitive levels. The Trustees also recognized that the fee schedule for the administrative services provided by JPMFM does include a fee breakpoint, which is tied to the overall level of non-money market fund assets excluding certain funds-of-funds, as applicable, advised by the Advisor, and that the Portfolio benefits from that breakpoint. The Trustees concluded that shareholders benefited from the lower expense ratios which resulted from these factors.
Independent Written Evaluation of the Portfolio’s Chief Compliance Officer
The Trustees noted that, upon their direction, the Chief Compliance Officer for the Portfolio had prepared an independent written evaluation in order to assist the Trustees in determining the reasonableness of the proposed management fees. The Trustees considered the written evaluation in determining whether to continue the Advisory Agreement.
Fees Relative to Advisor’s Other Clients
The Trustees received and considered information about the nature and extent of investment advisory services and fee rates offered to other clients of the Advisor for investment management styles substantially similar to that of the Portfolio. The Trustees also considered the complexity of investment management for the Portfolio relative to the Advisor’s other clients and the differences in the nature and extent of the services provided to the different clients. The Trustees concluded that the fee rates charged to the Portfolio in comparison to those charged to the Advisor’s other clients were reasonable.
Investment Performance
The Trustees received and considered absolute and/or relative performance for the Portfolio in a report prepared by Lipper. The Trustees considered the total return performance information, which included the ranking of the Portfolio within a performance universe made up of funds with the same Lipper investment classification and objective (the “Universe Group”) by total return for applicable one-, three- and five-year periods. The Trustees reviewed a description of Lipper’s methodology for selecting mutual funds in the Portfolio’s Universe Group. The Lipper materials provided to the Trustees highlighted information with respect to a representative class to assist the Trustees in their review. As part of this review, the Trustees also reviewed the Portfolio’s performance against its benchmark and considered the performance information provided for the Portfolio at regular Board meetings by the Advisor. The Lipper performance data noted by the Trustees as part of their review and the determinations made by the Trustees with respect to the Portfolio’s performance are summarized below:
The Trustees noted the Portfolio’s performance was in the fourth, second and fourth quintiles for Class 1 shares for the
| DECEMBER 31, 2011 | JPMORGAN INSURANCE TRUST | 25 | ||||||
Table of Contents
BOARD APPROVAL OF INVESTMENT ADVISORY AGREEMENT
(Unaudited) (continued)
one-, three-, and five-year periods ended December 31, 2010, respectively. The Trustees discussed the performance and investment strategy of the Portfolio with the Advisor and, based upon this discussion and other factors, concluded that the performance was reasonable.
Advisory Fees and Expense Ratios
The Trustees considered the contractual advisory fee rate paid by the Portfolio to the Advisor and compared that rate to the information prepared by Lipper concerning management fee rates paid by other funds in the same Lipper category as the Portfolio. The Trustees recognized that Lipper reported the Portfolio’s management fee rate as the combined contractual advisory fee and the administration fee rates. The Trustees considered the fee waiver and/or expense reimbursement
arrangements currently in place for the Portfolio and considered the net advisory fee rate after taking into account any waivers and/or reimbursements. The Trustees recognized that it is difficult to make comparisons of advisory fees because there are variations in the services that are included in the fees paid by other funds. The Trustees’ determinations as a result of the review of the Portfolio’s advisory fees and expense ratios are summarized below:
The Trustees noted that the Portfolio’s net advisory fee and actual total expenses for Class 1 shares were in the first and second quintiles, respectively, of their Universe Group. After considering the factors identified above, in light of this information, the Trustees concluded that the advisory fees were reasonable.
| 26 | JPMORGAN INSURANCE TRUST | DECEMBER 31, 2011 | ||||
Table of Contents
J.P. Morgan Funds are distributed by JPMorgan Distribution Services, Inc., which is an affiliate of JPMorgan Chase & Co. Affiliates of JPMorgan Chase & Co. receive fees for providing various services to the funds.
Contact JPMorgan Distribution Services, Inc. at 1-800-480-4111 for a portfolio prospectus. You can also visit us at www.jpmorganfunds.com. Investors should carefully consider the investment objectives and risk as well as charges and expenses of the mutual fund before investing. The prospectus contains this and other information about the mutual fund. Read the prospectus carefully before investing.
The Portfolio files a complete schedule of its portfolio holdings for the first and third quarters of its fiscal year with the SEC on Form N-Q. The Portfolio’s Forms N-Q are available on the SEC’s website at http://www.sec.gov and may be reviewed and copied at the SEC’s Public Reference Room in Washington, DC. Information on the operation of the SEC’s Public Reference Room may be obtained by calling 1-800-SEC-0330. Shareholders may request the Form N-Q without charge by calling 1-800-480-4111 or by visiting the variable insurance portfolio section of the J.P. Morgan Funds’ website at www.jpmorganfunds.com.
A description of the Portfolio’s policies and procedures with respect to the disclosure of the Portfolio’s holdings is available in the prospectus and Statement of Additional Information.
A copy of proxy policies and procedures is available without charge upon request by calling 1-800-480-4111 and a description of such policies and procedures is on the SEC’s website at www.sec.gov. The Trustees have delegated the authority to vote proxies for securities owned by the Portfolio to the Advisor. A copy of the Portfolio’s voting record for the most recent 12-month period ended June 30 is available on the SEC’s website at www.sec.gov or at the Portfolio’s website at www.jpmorganfunds.com no later than August 31 of each year. The Portfolio’s proxy voting record will include, among other things, a brief description of the matter voted on for each portfolio security, and will state how each vote was cast, for example, for or against the proposal.
Table of Contents
| © JPMorgan Chase & Co., 2012. All rights reserved. December 2011. | AN-JPMITIEP-1211 |
Table of Contents
Annual Report
JPMorgan Insurance Trust
December 31, 2011
JPMorgan Insurance Trust Intrepid Growth Portfolio
NOT FDIC INSURED Ÿ NO BANK GUARANTEE Ÿ MAY LOSE VALUE
|  |
Table of Contents
Investments in the Portfolio are not bank deposits or obligations of, or guaranteed or endorsed by, any bank and are not insured or guaranteed by the FDIC, the Federal Reserve Board or any other government agency. You could lose money if you sell when the Portfolio’s share price is lower than when you invested.
Past performance is no guarantee for future performance. The general market views expressed in this report are opinions based on conditions through the end of the reporting period and are subject to change without notice based on market and other conditions. These views are not intended to predict the future performance of the Portfolio or the securities markets. References to specific securities and their issuers are for illustrative purposes only and are not intended to be, and should not be interpreted as, recommendations to purchase or sell such securities. Such views are not meant as investment advice and may not be relied on as an indication of trading intent on behalf of the Portfolio.
This Portfolio is intended to be a funding vehicle for variable annuity contracts and variable life insurance policies (collectively “Policies”) offered by separate accounts of participating insurance companies. Portfolio shares are also offered through qualified pension and retirement plans (“Eligible Plans”). Individuals may not purchase shares directly from the Portfolio.
Prospective investors should refer to the Portfolio’s prospectus for a discussion of the Portfolio’s investment objective, strategies and risks. Call J.P. Morgan Funds Service Center at 1-800-480-4111 for a prospectus containing more complete information about the Portfolio including management fees and other expenses. Please read it carefully before investing.
Table of Contents
January 25, 2012 (Unaudited)
Dear Shareholder:
Investors greeted 2011 in much the same way they welcomed 2010: with high hopes that an improving U.S. economy would finally get us back on course to recovery.
This optimism quickly faded as the European debt crisis and a host of other economic and geopolitical concerns cast a dark shadow on the prospects for future growth. The combination of weak global economic data, credit downgrades in the U.S. and in Europe, and escalating fears of contagion all resulted in a level of market volatility not seen since the financial crisis three years ago.
 |
“Investors greeted 2011 in much the same way they welcomed 2010: With high hopes that an improving U.S. economy would finally get us back on course to recovery.” |
Nonetheless, stocks have regained some of their footing, as positive fourth-quarter economic data on auto sales, payroll employment and manufacturing activity all appear to indicate that consumer confidence is improving and economic growth may be accelerating.
We remain cautious, however, since many of the same challenges that we experienced in 2011 — European debt concerns, uncertainty over monetary and fiscal stimulus, and soft economic data — will likely remain in place this year, laying the groundwork for continued market volatility.
Strong fourth quarter surge caps volatile year
The European debt crisis and other geopolitical and economic events created a generally volatile year for equities, culminating in major sell off in the third quarter. A strong fourth quarter comeback did little to reverse the losses, as the Standard & Poor’s 500 Index (“S&P 500 Index”) ended the year with only slight gains. As of December 31, 2011, the Index had reached a level of 1,258, an increase of 2.1% from one year prior.
Large cap growth stocks lead style categories
Large cap stocks outpaced mid- and small-cap stocks over the 12-month period ended December 31, 2011 (the Russell 1000 Index returned 1.5% and the Russell Mid Cap Index returned -1.6%, compared to a return of -4.2% for the Russell 2000 Index). Overall, large-cap growth stocks fared better than large-cap value stocks as the Russell 1000 Growth Index returned
2.6% for the 12-month reporting period, compared to 0.4% for the Russell 1000 Value Index.
Euro zone uncertainty drives flight-to-quality sentiment
Investors’ lack of confidence in global economic growth prompted them to seek safe havens in U.S. Treasury securities, and high-quality corporate bonds. The Barclays Capital U.S. Aggregate Bond Index returned 7.8%. High yield bonds and emerging market debt securities also performed well, as the Barclays Capital High Yield Index returned 5.0%, and the Barclays Capital Emerging Markets Index returned 7.0% for the 12-month period ended December 31, 2011.
Similar economic concerns pushed yields of U.S. Treasury securities maturing in 10 years or more to historic lows throughout the year. As of the end of the 12-month period ended December 31, 2011, the yields on the benchmark 10-year U.S. Treasury bond dropped from 3.3% to 1.9%. In addition, yields on the 30-year U.S. Treasury bond declined from 4.3% to 2.9%, as did the two-year U.S. Treasury note, from 0.6% to 0.3%.
Lesson for 2012: Keep balance in mind in economic uncertainty
Last year offered its share of shocks to investors: geopolitical upheaval, natural disasters, sovereign-debt crises, and credit-rating downgrades were all among the events competing for the market’s attention. Against the backdrop of an election year, it’s likely that we will face continued global surprises — both on the upside and the downside.
As you reassess your investment strategy for the year ahead, it’s important to stick with a plan that focuses on diversification as well as long-term allocation. Trying to “time” market fluctuations can be risky business, especially given the ongoing uncertainty surrounding the direction of economic growth and the euro zone crisis in the months ahead.
On behalf of everyone at J.P. Morgan Asset Management, thank you for your continued confidence. We look forward to managing your investment needs for years to come. Should you have any questions, please visit www.jpmorganfunds.com or contact the J.P. Morgan Funds Service Center at 1-800-480-4111.
Sincerely yours,

George C.W. Gatch
CEO-Investment Management Americas
J.P. Morgan Asset Management
| DECEMBER 31, 2011 | JPMORGAN INSURANCE TRUST | 1 | ||||||
Table of Contents
JPMorgan Insurance Trust Intrepid Growth Portfolio
PORTFOLIO COMMENTARY
TWELVE MONTHS ENDED DECEMBER 31, 2011
| REPORTING PERIOD RETURN: | ||||
| Portfolio (Class 1 Shares)* | 1.85% | |||
| Russell 1000 Growth Index | 2.64% | |||
| Net Assets as of 12/31/2011 | $ | 37,986,025 | ||
INVESTMENT OBJECTIVE**
The JPMorgan Insurance Trust Intrepid Growth Portfolio (the “Portfolio”) seeks to provide long-term capital growth.
HOW DID THE MARKET PERFORM?
Strong corporate earnings and robust merger-and-acquisition activity encouraged investors and helped support U.S. stock prices during the beginning of the reporting period. However, uncertainty surrounding global economic growth began to dampen investors’ appetite for risk in April 2011. This negative mood among investors worsened as they seemed to lack confidence in the ability of European governments to combat the region’s debt crisis, stoking fear about economic contagion. Concerns about the credit downgrade of U.S.-issued debt exacerbated this negative sentiment among investors. Each of these factors helped trigger a sharp downturn in stock prices in the third quarter of 2011. Stocks rebounded in the fourth quarter of 2011 as better-than-expected economic data helped investors regain their appetite for risk. The Russell 1000 Growth Index (the “Benchmark”) finished the twelve months ended December 31, 2011 with a 2.64% gain.
WHAT WERE THE MAIN DRIVERS OF THE PORTFOLIO’S PERFORMANCE?
The Portfolio (Class 1 Shares) underperformed the Benchmark for the twelve months ended December 31, 2011. The Portfolio’s stock selection in the financials and industrials sectors detracted from the Portfolio’s relative performance, while the Portfolio’s stock selection in the health care and information technology sectors contributed to relative performance.
Individual detractors from relative performance included the Portfolio’s positions in Walter Energy, Inc., Navistar International Corp. and Signet Jewelers Ltd. Shares of Walter Energy, Inc., a producer and exporter of metallurgical coal for the global steel industry, declined due to lower-than-expected earnings and concerns about the company’s future production growth. Navistar International Corp., a manufacturer of commercial and military truck engines, reported disappointing quarterly profit, which was lower-than-expected due to costs
related to its joint ventures. Shares of specialty retail jeweler Signet Jewelers Ltd. declined amid concerns that slowing economic growth would hurt jewelry demand.
Individual contributors to relative performance included the Portfolio’s positions in Herbalife Ltd., Alliance Data Systems Corp. and Pharmasset Inc. Shares of Herbalife Ltd., a direct seller of nutritional and weight loss supplements, advanced after consistently reporting better-than-expected results during the reporting period. Shares of consumer financial services company Alliance Data Systems Corp. benefited from the company’s strong earnings and announced stock repurchase plan. Shares of biotechnology company Pharmasset Inc. increased after the announcement that it would be acquired by Gilead Sciences, Inc.
HOW WAS THE PORTFOLIO POSITIONED?
The portfolio managers used the JPMorgan Intrepid investment philosophy, which is rooted in behavioral finance, in positioning the Portfolio. Behavioral finance, which is a field of study that emphasizes the importance of human psychology in financial markets, examines how investor behavior can be affected by biases and emotional reactions and theorizes that inefficiencies arise in the stock market because investors are consistently irrational in making many investment decisions.
The JPMorgan Intrepid investment team (the “Team”) aimed to capitalize on these market inefficiencies by targeting stocks that they believed were attractively valued with strong momentum characteristics and by seeking stocks with increasing prices that they believed would continue to increase. The investment process started with a disciplined proprietary ranking methodology that attempted to identify stocks in each sector that had more attractive value and stronger momentum characteristics relative to the Benchmark. In addition, the Team looked to sell stocks held in the Portfolio that became overvalued and/or experienced momentum that deteriorated materially, replacing them with more attractive stocks identified by the proprietary ranking methodology. The Team combined its value and momentum factors with disciplined portfolio construction, qualitative research and value-added trading.
| 2 | JPMORGAN INSURANCE TRUST | DECEMBER 31, 2011 | ||||
Table of Contents
| TOP TEN EQUITY HOLDINGS OF THE PORTFOLIO*** | ||||||||
| 1. | Apple, Inc. | 7.3 | % | |||||
| 2. | Exxon Mobil Corp. | 5.2 | ||||||
| 3. | International Business Machines Corp. | 4.2 | ||||||
| 4. | Microsoft Corp. | 3.8 | ||||||
| 5. | Philip Morris International, Inc. | 3.2 | ||||||
| 6. | Wal-Mart Stores, Inc. | 2.3 | ||||||
| 7. | Gilead Sciences, Inc. | 2.2 | ||||||
| 8. | Oracle Corp. | 2.2 | ||||||
| 9. | QUALCOMM, Inc. | 1.8 | ||||||
| 10. | Honeywell International, Inc. | 1.8 | ||||||
PORTFOLIO COMPOSITION BY SECTOR*** | ||||
| Information Technology | 28.1 | % | ||
| Consumer Discretionary | 12.4 | |||
| Industrials | 11.8 | |||
| Consumer Staples | 11.3 | |||
| Health Care | 11.1 | |||
| Energy | 10.9 | |||
| Materials | 5.0 | |||
| Financials | 4.1 | |||
| Telecommunication Services | 1.0 | |||
| Short-Term Investment | 4.3 | |||
| * | The return shown is based on net asset value calculated for shareholder transactions and may differ from the return shown in the financial highlights, which reflects adjustments made to the net asset value in accordance with accounting principles generally accepted in the United States of America. |
| ** | The advisor seeks to achieve the Portfolio’s objective. There can be no guarantee it will be achieved. |
| *** | Percentages indicated are based upon total investments (excluding Investments of Cash Collateral for Securities on Loan) as of December 31, 2011. The Portfolio’s composition is subject to change. |
| DECEMBER 31, 2011 | JPMORGAN INSURANCE TRUST | 3 | ||||||
Table of Contents
JPMorgan Insurance Trust Intrepid Growth Portfolio
PORTFOLIO COMMENTARY
TWELVE MONTHS ENDED DECEMBER 31, 2011 (Unaudited) (continued)
AVERAGE ANNUAL TOTAL RETURNS AS OF DECEMBER 31, 2011 | ||||||||||||||||
| INCEPTION DATE OF CLASS | 1 YEAR | 5 YEAR | 10 YEAR | |||||||||||||
CLASS 1 SHARES | 8/1/94 | 1.85 | % | 1.49 | % | 1.53 | % | |||||||||
CLASS 2 SHARES | 8/16/06 | 1.58 | 1.24 | 1.40 | ||||||||||||
TEN YEAR PERFORMANCE (12/31/01 TO 12/31/11)
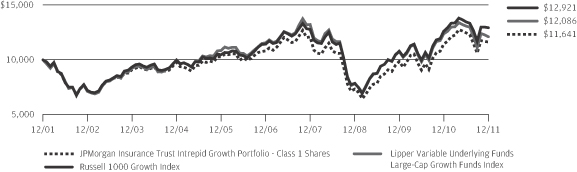
Source: Lipper, Inc. The performance quoted is past performance and is not a guarantee of future results. Mutual funds are subject to certain market risks. Investment returns and principal value of an investment will fluctuate so that an investor’s shares, when redeemed, may be worth more or less than their original cost. Current performance may be higher or lower than the performance data shown. For up-to-date month-end performance information please call 1-800-480-4111. Effective November 1, 2006, the Portfolio’s investment objective and strategies changed. Although past performance is not necessarily an indication of how the Portfolio will perform in the future, in view of these changes, the Portfolio’s performance record prior to this period might be less relevant for investors considering whether to purchase shares of the Portfolio.
Returns for Class 2 Shares prior to their inception date are based on the performance of Class 1 Shares. The actual returns of Class 2 Shares would have been lower than shown because Class 2 Shares have higher expenses than Class 1 Shares.
The graph illustrates comparative performance for $10,000 invested in Class 1 Shares of the JPMorgan Insurance Trust Intrepid Growth Portfolio, the Russell 1000 Growth Index and the Lipper Variable Underlying Funds Large-Cap Growth Funds Index from December 31, 2001 to December 31, 2011. The performance of the Portfolio assumes reinvestment of all dividends and capital gains, if any. The performance of the Russell 1000 Growth Index does not reflect the deduction of expenses associated with a mutual fund and has been adjusted to reflect reinvestment of all dividends and capital gains of the
securities included in the benchmark. The performance of the Lipper Variable Underlying Funds Large-Cap Growth Funds Index includes expenses associated with a mutual fund, such as investment management fees. These expenses are not identical to the expenses charged by the Portfolio. The Russell 1000 Growth Index is an unmanaged index which measures the performance of those Russell 1000 companies with higher price-to-book ratios and higher forecasted growth values. The Lipper Variable Underlying Funds Large-Cap Growth Funds Index is an index based on the total returns of certain mutual funds within the Portfolio’s designated category as determined by Lipper, Inc. Investors cannot invest directly in an index.
The performance does not reflect any charges imposed by the Policies or Eligible Plans. If these charges were included, the returns would be lower than shown. Performance may reflect the waiver of the Portfolio’s fees and reimbursement of expenses for certain periods since the inception date. Without these waivers and reimbursements performance would have been lower. The returns shown are based on net asset values calculated for shareholder transactions and may differ from the returns shown in the financial highlights, which reflect adjustments made to the net asset values in accordance with accounting principles generally accepted in the United States of America.
| 4 | JPMORGAN INSURANCE TRUST | DECEMBER 31, 2011 | ||||
Table of Contents
JPMorgan Insurance Trust Intrepid Growth Portfolio
SCHEDULE OF PORTFOLIO INVESTMENTS
AS OF DECEMBER 31, 2011
| SHARES | SECURITY DESCRIPTION | VALUE($) | ||||||
| Common Stocks — 95.5% |
| ||||||
Consumer Discretionary — 12.4% |
| |||||||
Automobiles — 1.1% |
| |||||||
| 37,200 | Ford Motor Co. (a) | 400,272 | ||||||
|
| |||||||
Diversified Consumer Services — 0.2% |
| |||||||
| 1,400 | ITT Educational Services, Inc. (a) | 79,646 | ||||||
|
| |||||||
Hotels, Restaurants & Leisure — 3.1% |
| |||||||
| 6,600 | Brinker International, Inc. | 176,616 | ||||||
| 4,200 | Carnival Corp. | 137,088 | ||||||
| 2,600 | McDonald’s Corp. | 260,858 | ||||||
| 4,100 | Penn National Gaming, Inc. (a) | 156,087 | ||||||
| 4,200 | Wyndham Worldwide Corp. | 158,886 | ||||||
| 4,600 | Yum! Brands, Inc. | 271,446 | ||||||
|
| |||||||
| 1,160,981 | ||||||||
|
| |||||||
Household Durables — 0.3% |
| |||||||
| 2,500 | Tempur-Pedic International, Inc. (a) | 131,325 | ||||||
|
| |||||||
Internet & Catalog Retail — 2.0% |
| |||||||
| 2,300 | Amazon.com, Inc. (a) | 398,130 | ||||||
| 800 | priceline.com, Inc. (a) | 374,168 | ||||||
|
| |||||||
| 772,298 | ||||||||
|
| |||||||
Leisure Equipment & Products — 0.5% |
| |||||||
| 2,700 | Mattel, Inc. | 74,952 | ||||||
| 1,700 | Polaris Industries, Inc. | 95,166 | ||||||
|
| |||||||
| 170,118 | ||||||||
|
| |||||||
Media — 2.4% |
| |||||||
| 7,100 | CBS Corp. (Non-Voting), Class B | 192,694 | ||||||
| 7,400 | DIRECTV, Class A (a) | 316,424 | ||||||
| 1,100 | Time Warner Cable, Inc. | 69,927 | ||||||
| 7,300 | Viacom, Inc., Class B | 331,493 | ||||||
|
| |||||||
| 910,538 | ||||||||
|
| |||||||
Multiline Retail — 1.3% |
| |||||||
| 15,050 | Macy’s, Inc. | 484,309 | ||||||
|
| |||||||
Specialty Retail — 1.2% |
| |||||||
| 1,100 | AutoZone, Inc. (a) | 357,467 | ||||||
| 2,800 | Limited Brands, Inc. | 112,980 | ||||||
|
| |||||||
| 470,447 | ||||||||
|
| |||||||
Textiles, Apparel & Luxury Goods — 0.3% |
| |||||||
| 1,500 | Deckers Outdoor Corp. (a) | 113,355 | ||||||
|
| |||||||
Total Consumer Discretionary | 4,693,289 | |||||||
|
| |||||||
Consumer Staples — 11.2% |
| |||||||
Beverages — 0.4% |
| |||||||
| 7,700 | Constellation Brands, Inc., Class A (a) | 159,159 | ||||||
|
| |||||||
Food & Staples Retailing — 3.2% |
| |||||||
| 2,900 | CVS Caremark Corp. | 118,262 | ||||||
| SHARES | SECURITY DESCRIPTION | VALUE($) | ||||||
Food & Staples Retailing — Continued |
| |||||||
| 9,800 | Kroger Co. (The) | 237,356 | ||||||
| 14,350 | Wal-Mart Stores, Inc. | 857,556 | ||||||
|
| |||||||
| 1,213,174 | ||||||||
|
| |||||||
Food Products — 1.7% |
| |||||||
| 4,800 | Campbell Soup Co. | 159,552 | ||||||
| 5,900 | ConAgra Foods, Inc. | 155,760 | ||||||
| 6,900 | Smithfield Foods, Inc. (a) | 167,532 | ||||||
| 8,200 | Tyson Foods, Inc., Class A | 169,248 | ||||||
|
| |||||||
| 652,092 | ||||||||
|
| |||||||
Household Products — 1.8% |
| |||||||
| 2,100 | Colgate-Palmolive Co. | 194,019 | ||||||
| 6,500 | Kimberly-Clark Corp. | 478,140 | ||||||
|
| |||||||
| 672,159 | ||||||||
|
| |||||||
Personal Products — 0.2% |
| |||||||
| 1,500 | Nu Skin Enterprises, Inc., Class A | 72,855 | ||||||
|
| |||||||
Tobacco — 3.9% |
| |||||||
| 5,200 | Altria Group, Inc. | 154,180 | ||||||
| 1,000 | Lorillard, Inc. | 114,000 | ||||||
| 15,700 | Philip Morris International, Inc. | 1,232,136 | ||||||
|
| |||||||
| 1,500,316 | ||||||||
|
| |||||||
Total Consumer Staples | 4,269,755 | |||||||
|
| |||||||
Energy — 10.8% |
| |||||||
Energy Equipment & Services — 2.9% |
| |||||||
| 7,900 | Baker Hughes, Inc. | 384,256 | ||||||
| 5,500 | Halliburton Co. | 189,805 | ||||||
| 3,100 | Helmerich & Payne, Inc. | 180,916 | ||||||
| 5,400 | National Oilwell Varco, Inc. | 367,146 | ||||||
|
| |||||||
| 1,122,123 | ||||||||
|
| |||||||
Oil, Gas & Consumable Fuels — 7.9% |
| |||||||
| 734 | Chevron Corp. | 78,098 | ||||||
| 23,200 | Exxon Mobil Corp. | 1,966,432 | ||||||
| 16,200 | Marathon Oil Corp. | 474,174 | ||||||
| 5,100 | Occidental Petroleum Corp. | 477,870 | ||||||
|
| |||||||
| 2,996,574 | ||||||||
|
| |||||||
Total Energy | 4,118,697 | |||||||
|
| |||||||
Financials — 4.1% |
| |||||||
Capital Markets — 0.5% |
| |||||||
| 3,800 | Ameriprise Financial, Inc. | 188,632 | ||||||
|
| |||||||
Consumer Finance — 1.3% |
| |||||||
| 12,300 | Capital One Financial Corp. | 520,167 | ||||||
|
| |||||||
Diversified Financial Services — 0.6% |
| |||||||
| 27,600 | Bank of America Corp. | 153,456 | ||||||
SEE NOTES TO FINANCIAL STATEMENTS.
| DECEMBER 31, 2011 | JPMORGAN INSURANCE TRUST | 5 | ||||||
Table of Contents
JPMorgan Insurance Trust Intrepid Growth Portfolio
SCHEDULE OF PORTFOLIO INVESTMENTS
AS OF DECEMBER 31, 2011 (continued)
| SHARES | SECURITY DESCRIPTION | VALUE($) | ||||||
| Common Stocks — Continued | |||||||
Diversified Financial Services — Continued | ||||||||
| 2,700 | Citigroup, Inc. | 71,037 | ||||||
|
| |||||||
| 224,493 | ||||||||
|
| |||||||
Insurance — 0.7% | ||||||||
| 1,600 | Everest Re Group Ltd., (Bermuda) | 134,544 | ||||||
| 4,100 | Validus Holdings Ltd., (Bermuda) | 129,150 | ||||||
|
| |||||||
| 263,694 | ||||||||
|
| |||||||
Real Estate Investment Trusts (REITs) — 1.0% |
| |||||||
| 5,200 | Hospitality Properties Trust | 119,496 | ||||||
| 4,600 | Ventas, Inc. | 253,598 | ||||||
|
| |||||||
| 373,094 | ||||||||
|
| |||||||
Total Financials | 1,570,080 | |||||||
|
| |||||||
Health Care — 11.1% | ||||||||
Biotechnology — 4.6% | ||||||||
| 4,100 | Alexion Pharmaceuticals, Inc. (a) | 293,150 | ||||||
| 2,850 | Amgen, Inc. | 182,999 | ||||||
| 4,000 | Celgene Corp. (a) | 270,400 | ||||||
| 20,200 | Gilead Sciences, Inc. (a) | 826,786 | ||||||
| 4,800 | Vertex Pharmaceuticals, Inc. (a) | 159,408 | ||||||
|
| |||||||
| 1,732,743 | ||||||||
|
| |||||||
Health Care Equipment & Supplies — 1.4% | ||||||||
| 6,200 | Baxter International, Inc. | 306,776 | ||||||
| 5,000 | Covidien plc, (Ireland) | 225,050 | ||||||
|
| |||||||
| 531,826 | ||||||||
|
| |||||||
Health Care Providers & Services — 2.0% | ||||||||
| 2,700 | Humana, Inc. | 236,547 | ||||||
| 10,000 | UnitedHealth Group, Inc. | 506,800 | ||||||
|
| |||||||
| 743,347 | ||||||||
|
| |||||||
Pharmaceuticals — 3.1% | ||||||||
| 5,100 | Endo Pharmaceuticals Holdings, Inc. (a) | 176,103 | ||||||
| 30,100 | Pfizer, Inc. | 651,364 | ||||||
| 12,850 | Warner Chilcott plc, (Ireland), Class A (a) | 194,420 | ||||||
| 2,900 | Watson Pharmaceuticals, Inc. (a) | 174,986 | ||||||
|
| |||||||
| 1,196,873 | ||||||||
|
| |||||||
Total Health Care | 4,204,789 | |||||||
|
| |||||||
Industrials — 11.7% | ||||||||
Aerospace & Defense — 3.0% | ||||||||
| 7,000 | General Dynamics Corp. | 464,870 | ||||||
| 12,300 | Honeywell International, Inc. | 668,505 | ||||||
|
| |||||||
| 1,133,375 | ||||||||
|
| |||||||
Airlines — 0.9% | ||||||||
| 1,600 | Alaska Air Group, Inc. (a) | 120,144 | ||||||
| 15,400 | Delta Air Lines, Inc. (a) | 124,586 | ||||||
| SHARES | SECURITY DESCRIPTION | VALUE($) | ||||||
Airlines — Continued | ||||||||
| 4,700 | United Continental Holdings, Inc. (a) | 88,689 | ||||||
|
| |||||||
| 333,419 | ||||||||
|
| |||||||
Industrial Conglomerates — 1.5% | ||||||||
| 7,200 | General Electric Co. | 128,952 | ||||||
| 9,300 | Tyco International Ltd., (Switzerland) | 434,403 | ||||||
|
| |||||||
| 563,355 | ||||||||
|
| |||||||
Machinery — 4.8% | ||||||||
| 6,400 | Caterpillar, Inc. | 579,840 | ||||||
| 2,100 | Joy Global, Inc. | 157,437 | ||||||
| 4,100 | Navistar International Corp. (a) | 155,308 | ||||||
| 7,200 | Parker Hannifin Corp. | 549,000 | ||||||
| 3,900 | Stanley Black & Decker, Inc. | 263,640 | ||||||
| 3,200 | WABCO Holdings, Inc. (a) | 138,880 | ||||||
|
| |||||||
| 1,844,105 | ||||||||
|
| |||||||
Professional Services — 0.7% | ||||||||
| 2,400 | Dun & Bradstreet Corp. (The) | 179,592 | ||||||
| 1,400 | Towers Watson & Co., Class A | 83,902 | ||||||
|
| |||||||
| 263,494 | ||||||||
|
| |||||||
Road & Rail — 0.8% | ||||||||
| 15,300 | CSX Corp. | 322,218 | ||||||
|
| |||||||
Total Industrials | 4,459,966 | |||||||
|
| |||||||
Information Technology — 28.1% | ||||||||
Communications Equipment — 2.0% | ||||||||
| 4,300 | Cisco Systems, Inc. | 77,744 | ||||||
| 12,300 | QUALCOMM, Inc. | 672,810 | ||||||
|
| |||||||
| 750,554 | ||||||||
|
| |||||||
Computers & Peripherals — 8.2% | ||||||||
| 6,805 | Apple, Inc. (a) | 2,756,025 | ||||||
| 11,000 | Dell, Inc. (a) | 160,930 | ||||||
| 4,200 | SanDisk Corp. (a) | 206,682 | ||||||
|
| |||||||
| 3,123,637 | ||||||||
|
| |||||||
Electronic Equipment, Instruments & Components — 0.2% |
| |||||||
| 8,900 | Vishay Intertechnology, Inc. (a) | 80,011 | ||||||
|
| |||||||
Internet Software & Services — 1.8% | ||||||||
| 800 | Google, Inc., Class A (a) | 516,720 | ||||||
| 3,900 | IAC/InterActiveCorp. | 166,140 | ||||||
|
| |||||||
| 682,860 | ||||||||
|
| |||||||
IT Services — 6.6% | ||||||||
| 1,200 | Accenture plc, (Ireland), Class A | 63,876 | ||||||
| 1,750 | Alliance Data Systems Corp. (a) (c) | 181,720 | ||||||
| 8,750 | International Business Machines Corp. | 1,608,950 | ||||||
| 300 | MasterCard, Inc., Class A | 111,846 | ||||||
SEE NOTES TO FINANCIAL STATEMENTS.
| 6 | JPMORGAN INSURANCE TRUST | DECEMBER 31, 2011 | ||||
Table of Contents
JPMorgan Insurance Trust Intrepid Growth Portfolio
SCHEDULE OF PORTFOLIO INVESTMENTS
AS OF DECEMBER 31, 2011 (continued)
| SHARES | SECURITY DESCRIPTION | VALUE($) | ||||||
| Common Stocks — Continued |
| ||||||
IT Services — Continued |
| |||||||
| 29,800 | Western Union Co. (The) | 544,148 | ||||||
|
| |||||||
| 2,510,540 | ||||||||
|
| |||||||
Office Electronics — 0.3% |
| |||||||
| 13,700 | Xerox Corp. | 109,052 | ||||||
|
| |||||||
Semiconductors & Semiconductor Equipment — 2.0% |
| |||||||
| 8,300 | Broadcom Corp., Class A (a) | 243,688 | ||||||
| 7,700 | Freescale Semiconductor Holdings I Ltd. (a) (c) | 97,405 | ||||||
| 12,600 | Xilinx, Inc. | 403,956 | ||||||
|
| |||||||
| 745,049 | ||||||||
|
| |||||||
Software — 7.0% |
| |||||||
| 56,100 | Microsoft Corp. | 1,456,356 | ||||||
| 31,840 | Oracle Corp. | 816,696 | ||||||
| 22,000 | Symantec Corp. (a) | 344,300 | ||||||
| 4,100 | Zynga, Inc., Class A (a) | 38,581 | ||||||
|
| |||||||
| 2,655,933 | ||||||||
|
| |||||||
Total Information Technology | 10,657,636 | |||||||
|
| |||||||
Materials — 5.0% |
| |||||||
Chemicals — 3.5% |
| |||||||
| 2,000 | CF Industries Holdings, Inc. | 289,960 | ||||||
| 4,600 | LyondellBasell Industries N.V., (Netherlands), Class A | 149,454 | ||||||
| 7,200 | Monsanto Co. | 504,504 | ||||||
| 4,500 | PPG Industries, Inc. | 375,705 | ||||||
|
| |||||||
| 1,319,623 | ||||||||
|
| |||||||
| SHARES | SECURITY DESCRIPTION | VALUE($) | ||||||
Metals & Mining — 1.5% |
| |||||||
| 16,100 | Freeport-McMoRan Copper & Gold, Inc. | 592,319 | ||||||
|
| |||||||
Total Materials | 1,911,942 | |||||||
|
| |||||||
Telecommunication Services — 1.1% |
| |||||||
Diversified Telecommunication Services — 1.1% |
| |||||||
| 10,702 | CenturyLink, Inc. | 398,114 | ||||||
|
| |||||||
Total Common Stocks | 36,284,268 | |||||||
|
| |||||||
| Short-Term Investment — 4.3% |
| ||||||
Investment Company — 4.3% |
| |||||||
| 1,628,827 | JPMorgan Liquid Assets Money Market Fund, Institutional Class Shares, | 1,628,827 | ||||||
|
| |||||||
| Investment of Cash Collateral for Securities on Loan — 0.2% |
| ||||||
Investment Company — 0.2% |
| |||||||
| 78,550 | JPMorgan Prime Money Market Fund, Capital Shares, 0.120% (b) (l) | 78,550 | ||||||
|
| |||||||
Total Investments — 100.0% | 37,991,645 | |||||||
Liabilities in Excess of | (5,620 | ) | ||||||
|
| |||||||
NET ASSETS — 100.0% | $ | 37,986,025 | ||||||
|
| |||||||
Percentages indicated are based on net assets.
| Futures Contracts | ||||||||||||||||
| NUMBER OF CONTRACTS | DESCRIPTION | EXPIRATION DATE | NOTIONAL VALUE AT 12/31/11 | UNREALIZED APPRECIATION (DEPRECIATION) | ||||||||||||
Long Futures Outstanding | ||||||||||||||||
| 14 | E-mini S&P 500 | 03/16/12 | $ | 876,820 | $ | 12,114 | ||||||||||
|
| |||||||||||||||
NOTES TO SCHEDULE OF PORTFOLIO INVESTMENTS:
| (a) | — Non-income producing security | |
| (b) | — Investment in affiliate. Money market fund registered under the Investment Company Act of 1940, as amended, and advised by J.P. Morgan Investment Management Inc. | |
| (c) | — Security, or a portion of the security, has been delivered to a counterparty as part of a security lending transaction. | |
| (g) | — Amount rounds to less than 0.1%. |
| (l) | — The rate shown is the current yield as of December 31, 2011. | |
| (m) | — All or a portion of this security is reserved and/or pledged with the custodian for current or potential holdings of futures, swaps, options, TBAs, when-issued securities, delayed delivery securities, reverse repurchase agreements, unfunded commitments and/or forward foreign currency exchange contracts. |
SEE NOTES TO FINANCIAL STATEMENTS.
| DECEMBER 31, 2011 | JPMORGAN INSURANCE TRUST | 7 | ||||||
Table of Contents
STATEMENT OF ASSETS AND LIABILITIES
AS OF DECEMBER 31, 2011
| Intrepid Growth Portfolio | ||||
ASSETS: | ||||
Investments in non-affiliates, at value | $ | 36,284,268 | ||
Investments in affiliates, at value | 1,707,377 | |||
|
| |||
Total investment securities, at value | 37,991,645 | |||
Deposits at broker for futures contracts | 125,000 | |||
Receivables: | ||||
Portfolio shares sold | 30 | |||
Dividends from non-affiliates | 36,705 | |||
Dividends from affiliates | 140 | |||
Securities lending income | 13 | |||
|
| |||
Total Assets | 38,153,533 | |||
|
| |||
LIABILITIES: | ||||
Payables: | ||||
Collateral for securities lending program | 78,550 | |||
Portfolio shares redeemed | 13,089 | |||
Variation margin on futures contracts | 3,645 | |||
Accrued liabilities: | ||||
Investment advisory fees | 17,903 | |||
Administration fees | 2,846 | |||
Distribution fees | 4 | |||
Custodian and accounting fees | 7,278 | |||
Trustees’ and Chief Compliance Officer’s fees | 472 | |||
Printing and mailing costs | 20,670 | |||
Audit fees | 21,622 | |||
Other | 1,429 | |||
|
| |||
Total Liabilities | 167,508 | |||
|
| |||
Net Assets | $ | 37,986,025 | ||
|
| |||
SEE NOTES TO FINANCIAL STATEMENTS.
| 8 | JPMORGAN INSURANCE TRUST | DECEMBER 31, 2011 | ||||
Table of Contents
Intrepid Growth | ||||
NET ASSETS: | ||||
Paid in capital | $ | 57,464,789 | ||
Accumulated undistributed net investment income | 272,462 | |||
Accumulated net realized gains (losses) | (22,230,945 | ) | ||
Net unrealized appreciation (depreciation) | 2,479,719 | |||
|
| |||
Total Net Assets | $ | 37,986,025 | ||
|
| |||
Net Assets: | ||||
Class 1 | $ | 37,969,142 | ||
Class 2 | 16,883 | |||
|
| |||
Total | $ | 37,986,025 | ||
|
| |||
Outstanding units of beneficial interest (shares) | ||||
(unlimited number of shares authorized, no par value): | ||||
Class 1 | 2,491,291 | |||
Class 2 | 1,110 | |||
Net Asset Value, offering and redemption price per share (a): | ||||
Class 1 | $ | 15.24 | ||
Class 2 | 15.21 | |||
|
| |||
Cost of investments in non-affiliates | $ | 33,816,663 | ||
Cost of investments in affiliates | 1,707,377 | |||
Value of securities on loan | 76,983 | |||
| (a) | Per share amounts may not recalculate due to rounding of net assets and/or shares outstanding. |
SEE NOTES TO FINANCIAL STATEMENTS.
| DECEMBER 31, 2011 | JPMORGAN INSURANCE TRUST | 9 | ||||||
Table of Contents
STATEMENT OF OPERATIONS
FOR THE YEAR ENDED DECEMBER 31, 2011
Intrepid Growth | ||||
INVESTMENT INCOME: | ||||
Dividend income from non-affiliates | $ | 653,412 | ||
Dividend income from affiliates | 844 | |||
Income from securities lending (net) | 1,025 | |||
|
| |||
Total investment income | 655,281 | |||
|
| |||
EXPENSES: | ||||
Investment advisory fees | 272,374 | |||
Administration fees | 37,104 | |||
Distribution fees — Class 2 | 43 | |||
Custodian and accounting fees | 28,522 | |||
Interest expense to affiliates | 4 | |||
Professional fees | 43,659 | |||
Trustees’ and Chief Compliance Officer’s fees | 420 | |||
Printing and mailing costs | 25,858 | |||
Transfer agent fees | 3,951 | |||
Other | 8,817 | |||
|
| |||
Total expenses | 420,752 | |||
|
| |||
Less amounts waived | (45,106 | ) | ||
Less earnings credits | — | (a) | ||
|
| |||
Net expenses | 375,646 | |||
|
| |||
Net investment income (loss) | 279,635 | |||
|
| |||
REALIZED/UNREALIZED GAINS (LOSSES): | ||||
Net realized gain (loss) on transactions from: | ||||
Investments in non-affiliates | 5,707,717 | |||
Futures | 81,103 | |||
|
| |||
Net realized gain (loss) | 5,788,820 | |||
|
| |||
Change in net unrealized appreciation (depreciation) of: | ||||
Investments in non-affiliates | (5,079,048 | ) | ||
Futures | 7,349 | |||
|
| |||
Change in net unrealized appreciation (depreciation) | (5,071,699 | ) | ||
|
| |||
Net realized/unrealized gains (losses) | 717,121 | |||
|
| |||
Change in net assets resulting from operations | $ | 996,756 | ||
|
| |||
| (a) | Amount rounds to less than $1. |
SEE NOTES TO FINANCIAL STATEMENTS.
| 10 | JPMORGAN INSURANCE TRUST | DECEMBER 31, 2011 | ||||
Table of Contents
STATEMENTS OF CHANGES IN NET ASSETS
FOR THE PERIODS INDICATED
| Intrepid Growth Portfolio | ||||||||
| Year Ended 12/31/2011 | Year Ended 12/31/2010 | |||||||
CHANGE IN NET ASSETS RESULTING FROM OPERATIONS: | ||||||||
Net investment income (loss) | $ | 279,635 | $ | 438,317 | ||||
Net realized gain (loss) | 5,788,820 | 7,438,977 | ||||||
Change in net unrealized appreciation (depreciation) | (5,071,699 | ) | (1,188,957 | ) | ||||
|
|
|
| |||||
Change in net assets resulting from operations | 996,756 | 6,688,337 | ||||||
|
|
|
| |||||
DISTRIBUTIONS TO SHAREHOLDERS: | ||||||||
Class 1 | ||||||||
From net investment income | (436,013 | ) | (461,071 | ) | ||||
Class 2 | ||||||||
From net investment income | (136 | ) | (108 | ) | ||||
|
|
|
| |||||
Total distributions to shareholders | (436,149 | ) | (461,179 | ) | ||||
|
|
|
| |||||
CAPITAL TRANSACTIONS: | ||||||||
Change in net assets from capital transactions | (8,117,304 | ) | (11,485,166 | ) | ||||
|
|
|
| |||||
NET ASSETS: | ||||||||
Change in net assets | (7,556,697 | ) | (5,258,008 | ) | ||||
Beginning of period | 45,542,722 | 50,800,730 | ||||||
|
|
|
| |||||
End of period | $ | 37,986,025 | $ | 45,542,722 | ||||
|
|
|
| |||||
Accumulated undistributed net investment income | $ | 272,462 | $ | 433,803 | ||||
|
|
|
| |||||
CAPITAL TRANSACTIONS: | ||||||||
Class 1 | ||||||||
Proceeds from shares issued | $ | 1,718,322 | $ | 2,608,830 | ||||
Dividends and distributions reinvested | 436,013 | 461,071 | ||||||
Cost of shares redeemed | (10,271,775 | ) | (14,555,175 | ) | ||||
|
|
|
| |||||
Change in net assets from Class 1 capital transactions | $ | (8,117,440 | ) | $ | (11,485,274 | ) | ||
|
|
|
| |||||
Class 2 | ||||||||
Dividends and distributions reinvested | $ | 136 | $ | 108 | ||||
|
|
|
| |||||
Change in net assets from Class 2 capital transactions | $ | 136 | $ | 108 | ||||
|
|
|
| |||||
Total change in net assets from capital transactions | $ | (8,117,304 | ) | $ | (11,485,166 | ) | ||
|
|
|
| |||||
SHARE TRANSACTIONS: | ||||||||
Class 1 | ||||||||
Issued | 113,963 | 197,265 | ||||||
Reinvested | 27,422 | 32,396 | ||||||
Redeemed | (657,967 | ) | (1,088,309 | ) | ||||
|
|
|
| |||||
Change in Class 1 Shares | (516,582 | ) | (858,648 | ) | ||||
|
|
|
| |||||
Class 2 | ||||||||
Reinvested | 8 | 8 | ||||||
|
|
|
| |||||
Change in Class 2 Shares | 8 | 8 | ||||||
|
|
|
| |||||
SEE NOTES TO FINANCIAL STATEMENTS.
| DECEMBER 31, 2011 | JPMORGAN INSURANCE TRUST | 11 | ||||||
Table of Contents
FOR THE PERIODS INDICATED
| Per share operating performance | ||||||||||||||||||||
| Investment operations | Distributions | |||||||||||||||||||
| Net asset value, beginning of period | Net investment income (loss) | Net realized (losses) on | Total from investment operations | Net investment income | ||||||||||||||||
Intrepid Growth Portfolio | ||||||||||||||||||||
Class 1 | ||||||||||||||||||||
Year Ended December 31, 2011 | $ | 15.14 | $ | 0.10 | (c) | $ | 0.16 | (d) | $ | 0.26 | $ | (0.16 | ) | |||||||
Year Ended December 31, 2010 | 13.13 | 0.13 | (c) | 2.01 | 2.14 | (0.13 | ) | |||||||||||||
Year Ended December 31, 2009 | 9.86 | 0.12 | 3.23 | 3.35 | (0.08 | ) | ||||||||||||||
Year Ended December 31, 2008 | 16.37 | 0.09 | (6.47 | ) | (6.38 | ) | (0.13 | ) | ||||||||||||
Year Ended December 31, 2007 | 14.70 | 0.08 | (c) | 1.62 | 1.70 | (0.03 | ) | |||||||||||||
Class 2 | ||||||||||||||||||||
Year Ended December 31, 2011 | 15.11 | 0.07 | (c) | 0.15 | (d) | 0.22 | (0.12 | ) | ||||||||||||
Year Ended December 31, 2010 | 13.12 | 0.10 | (c) | 1.99 | 2.09 | (0.10 | ) | |||||||||||||
Year Ended December 31, 2009 | 9.84 | 0.08 | 3.25 | 3.33 | (0.05 | ) | ||||||||||||||
Year Ended December 31, 2008 | 16.33 | 0.04 | (6.44 | ) | (6.40 | ) | (0.09 | ) | ||||||||||||
Year Ended December 31, 2007 | 14.69 | 0.04 | (c) | 1.61 | 1.65 | (0.01 | ) | |||||||||||||
| (a) | Includes adjustments in accordance with accounting principles generally accepted in the United States of America and as such, the net asset value for financial reporting purposes and the returns based upon those net asset values may differ from the net asset value and returns for shareholder transactions. |
| (b) | Includes earnings credits and interest expense, each of which is less than 0.01%, if applicable or unless otherwise noted. |
| (c) | Calculated based upon average shares outstanding. |
| (d) | Includes a gain resulting from litigation payments on securities owned in a prior year. Without these gains, the net realized and unrealized gains (losses) on investments per share would have been $0.09 and $0.08, and the return would have been 1.18% and 0.97% for Class 1 and Class 2 Shares, respectively. |
SEE NOTES TO FINANCIAL STATEMENTS.
| 12 | JPMORGAN INSURANCE TRUST | DECEMBER 31, 2011 | ||||
Table of Contents
| Ratios/Supplemental data | |||||||||||||||||||||||||
| Ratios to average net assets | ||||||||||||||||||||||||||
Net asset end of period | Total return (a) | Net assets, period | Net expenses (b) | Net income | Expenses without | Portfolio turnover rate | ||||||||||||||||||||
| $ | 15.24 | 1.65 | %(d) | $ | 37,969,142 | 0.89 | % | 0.67 | % | 1.00 | % | 121 | % | |||||||||||||
| 15.14 | 16.33 | 45,426,077 | 0.90 | 0.95 | 1.02 | 126 | ||||||||||||||||||||
| 13.13 | 34.32 | 50,786,376 | 0.90 | 0.96 | 1.07 | 134 | ||||||||||||||||||||
| 9.86 | (39.22 | ) | 46,462,195 | 0.90 | 0.54 | 0.94 | 132 | |||||||||||||||||||
| 16.37 | 11.55 | 97,736,451 | 0.88 | 0.51 | 0.90 | 137 | ||||||||||||||||||||
| 15.21 | 1.44 | (d) | 16,883 | 1.15 | 0.43 | 1.25 | 121 | |||||||||||||||||||
| 15.11 | 15.96 | 16,645 | 1.15 | 0.72 | 1.27 | 126 | ||||||||||||||||||||
| 13.12 | 34.03 | 14,354 | 1.15 | 0.70 | 1.32 | 134 | ||||||||||||||||||||
| 9.84 | (39.36 | ) | 10,713 | 1.15 | 0.30 | 1.19 | 132 | |||||||||||||||||||
| 16.33 | 11.25 | 17,750 | 1.14 | 0.22 | 1.16 | 137 | ||||||||||||||||||||
SEE NOTES TO FINANCIAL STATEMENTS.
| DECEMBER 31, 2011 | JPMORGAN INSURANCE TRUST | 13 | ||||||
Table of Contents
AS OF DECEMBER 31, 2011
1. Organization
JPMorgan Insurance Trust (the “Trust”) is registered under the Investment Company Act of 1940, as amended (the “1940 Act”), as an open-end management investment company and is a Massachusetts business trust.
The following is a separate Portfolio of the Trust (the “Portfolio”) covered by this report:
| Classes Offered | Diversified/Non-Diversified | |||
| Intrepid Growth Portfolio | Class 1 and Class 2 | Diversified |
The investment objective of the Portfolio is to provide long-term capital growth.
Portfolio shares are offered only to separate accounts of participating insurance companies and Eligible Plans. Individuals may not purchase shares directly from the Portfolio.
All classes of shares have equal rights as to earnings, assets and voting privileges except that each class may bear different distribution and service fees and each class has exclusive voting rights with respect to its distribution plan or administrative services plan.
2. Significant Accounting Policies
The following is a summary of significant accounting policies followed by the Trust in the preparation of its financial statements. The policies are in accordance with accounting principles generally accepted in the United States of America. The preparation of financial statements requires management to make estimates and assumptions that affect the reported amounts of assets and liabilities at the date of the financial statements and the reported amounts of income and expenses for the period. Actual results could differ from those estimates.
A. Valuation of Investments — Equity securities listed on a North American, Central American, South American or Caribbean securities exchange shall generally be valued at the last sale price on the exchange on which the security is principally traded that is reported before the time when the net assets of the Portfolio are valued. The value of securities listed on The NASDAQ Stock Market LLC shall generally be the NASDAQ Official Closing Price. Fixed income securities (other than certain short-term investments maturing in less than 61 days) are valued each day based on prices received from independent or affiliated pricing services approved by the Board of Trustees or third party broker-dealers. The broker-dealers or pricing services use multiple valuation techniques to determine fair value. In instances where sufficient market activity exists, the broker-dealers or pricing services may utilize a market-based approach through which quotes from market makers are used to determine fair value. In instances where sufficient market activity may not exist or is limited, the broker-dealers or pricing services also utilize proprietary valuation models which may consider market transactions in comparable securities and the various relationships between securities in determining value and/or market characteristics such as benchmark yield curves, option-adjusted spreads, credit spreads, estimated default rates, coupon rates, anticipated timing of principal repayments, underlying collateral, and other unique security features in order to estimate the relevant cash flows, which are then discounted to calculate the fair values. Generally, short-term investments of sufficient credit quality maturing in less than 61 days are valued at amortized cost, which approximates market value. Certain investments of the Portfolio may, depending upon market conditions, trade in relatively thin markets and/or in markets that experience significant volatility. As a result of these conditions, the prices used by the Portfolio to value securities may differ from the value that would be realized if these securities were sold and the differences could be material. Futures and options shall generally be valued on the basis of available market quotations. Swaps and other derivatives are valued daily, primarily using independent or affiliated pricing services approved by the Board of Trustees. If valuations are not available from such services or values received are deemed not representative of market value, values will be obtained from a third party broker-dealer or counterparty. Investments in other open-end investment companies are valued at such investment company’s net asset value per share as of the report date.
Securities or other assets for which market quotations are not readily available or for which market quotations do not represent the value at the time of pricing (including certain illiquid securities) are fair valued in accordance with procedures established by and under the supervision and responsibility of the Board of Trustees. Under these procedures, the Portfolio primarily employs a market-based approach which may use related or comparable assets or liabilities, recent transactions, market multiples, book values, and other relevant information for the investment to determine the fair value of the investment. The Portfolio may also use an income-based valuation approach in which the anticipated future cash flows of the investment are discounted to calculate fair value. Discounts may also be applied due to the nature or duration of any restrictions on the disposition of the investments. Valuations may be based upon current market prices of securities that are comparable in coupon, rating, maturity and industry. It is possible that the estimated values may differ significantly from the values that would have been used had a ready market for the investments existed, and such differences could be material. Trading in securities on most foreign exchanges and over-the-counter markets is normally completed before the close of the domestic market and may also take place on days when the domestic market is closed. In accordance with procedures adopted by the Board of Trustees, the Portfolio applies fair value pricing on equity securities on a daily basis except for North American, Central American, South American and Caribbean equity securities held in its portfolio by utilizing the quotations of an independent pricing service, unless the Portfolio’s advisor determines that use of another valuation methodology is appropriate. The pricing service uses statistical analyses and quantitative models to adjust local market prices using factors such as subsequent movement and changes in the prices of indices, securities and exchange rates in other markets, in determining fair value as of the time the Portfolio calculates its net asset values.
Valuations reflected in this report are as of the report date. As a result, changes in valuation due to market events and/or issuer related events after the report date and prior to issuance of the report are not reflected herein.
| 14 | JPMORGAN INSURANCE TRUST | DECEMBER 31, 2011 | ||||
Table of Contents
The various inputs that are used in determining the fair value of the Portfolio’s investments are summarized into the three broad levels listed below.
| Ÿ | Level 1 — quoted prices in active markets for identical securities |
| Ÿ | Level 2 — other significant observable inputs (including quoted prices for similar securities, interest rates, prepayment speeds, credit risk, etc.) |
| Ÿ | Level 3 — significant unobservable inputs (including the Portfolio’s own assumptions in determining the fair value of investments) |
A financial instrument’s level within the fair value hierarchy is based on the lowest level of any input both individually and in aggregate that is significant to the fair value measurement. The inputs or methodology used for valuing securities are not necessarily an indication of the risk associated with investing in those securities.
The following table represents each valuation input as presented on the Schedule of Portfolio Investments (“SOI”):
Level 1 Quoted prices | Level 2 Other significant observable inputs | Level 3 Significant unobservable inputs | Total | |||||||||||||
Total Investments in Securities (a) | $ | 37,991,645 | $ | — | $ | — | $ | 37,991,645 | ||||||||
|
|
|
|
|
|
|
| |||||||||
Appreciation in Other Financial Instruments | ||||||||||||||||
Futures Contracts | $ | 12,114 | $ | — | $ | — | $ | 12,114 | ||||||||
|
|
|
|
|
|
|
| |||||||||
| (a) | Portfolio holdings designated as Level 1 are disclosed individually in the SOI. Please refer to the SOI for industry specifics of portfolio holdings. |
There were no transfers between Levels 1 and 2 during the year ended December 31, 2011.
B. Futures Contracts — The Portfolio uses index futures contracts to gain or reduce exposure to the stock market, maintain liquidity and minimize transaction costs. The Portfolio buys futures contracts to immediately invest incoming cash in the market or sells futures in response to cash outflows, thereby simulating an invested position in the underlying index while maintaining a cash balance for liquidity. The use of futures contracts exposes the Portfolio to equity price risk.
Futures contracts provide for the delayed delivery of the underlying instrument at a fixed price or for a cash amount based on the change in the value of the underlying instrument at a specific date in the future. Upon entering into a futures contract, the Portfolio is required to deposit with the broker, cash or securities in an amount equal to a certain percentage of the contract amount which is referred to as the initial margin deposit. Subsequent payments, referred to as variation margin, are made or received by the Portfolio periodically and are based on changes in the market value of open futures contracts. Changes in the market value of open futures contracts are recorded as unrealized appreciation or depreciation in the Statement of Operations. Realized gains or losses, representing the difference between the value of the contract at the time it was opened and the value at the time it was closed, are reported in the Statement of Operations at the closing or expiration of futures contracts. Securities deposited as initial margin are designated in the SOI and cash deposited is recorded on the Statement of Assets and Liabilities. A receivable from and/or a payable to brokers for the daily variation margin is also recorded on the Statement of Assets and Liabilities.
The Portfolio may be subject to the risk that the change in the value of the futures contract may not correlate perfectly with the underlying instrument. Use of long futures contracts subjects the Portfolio to risk of loss in excess of the amounts shown on the Statement of Assets and Liabilities, up to the notional amount of the futures contracts. Use of short futures contracts subjects the Portfolio to unlimited risk of loss. The Portfolio may enter into futures contracts only on exchanges or boards of trade. The exchange or board of trade acts as the counterparty to each futures transaction; therefore, the Portfolio’s credit risk is limited to failure of the exchange or board of trade. Under some circumstances, futures exchanges may establish daily limits on the amount that the price of a futures contract can vary from the previous day’s settlement price, which could effectively prevent liquidation of unfavorable positions.
The table below discloses the volume of the Portfolio’s futures activities during the year ended December 31, 2011:
Futures Contracts: | ||||
Average Notional Balance Long | $ | 624,410 | ||
Ending Notional Balance Long | 876,820 |
C. Securities Lending — The Portfolio may lend securities to brokers approved by J.P. Morgan Investment Management Inc. (“JPMIM” or the “Advisor”) in order to generate additional income. The Goldman Sachs Bank USA, doing business as Goldman Sachs Agency Lending (“GSAL”), serves as lending agent for the Portfolio pursuant to a Securities Lending Agreement (the “GSAL Securities Lending Agreement”). Securities loaned are collateralized by cash, which is invested in Capital Shares of the JPMorgan Prime Money Market Fund. Upon termination of the loan, the Portfolio is required to return to the borrower the posted cash collateral. Loans are subject to termination by the Portfolio or the borrower at any time.
Securities lending income is comprised of income earned on cash collateral investments (“Collateral Investments”), net of a rebate received from or paid to borrowers for use of cash collateral and lending agent fees. This amount is recorded as Income from securities lending (net) on the Statement of Operations. The Portfolio also receives payments from the borrower during the period of the loan, equivalent to dividends and interest earned on the securities loaned, which are recorded as Dividend or Interest income, respectively, on the Statement of Operations. For the year ended December 31, 2011, the Portfolio earned $494 from the investment of cash collateral, prior to rebates or fees, from an investment in an affiliated fund as described below.
| DECEMBER 31, 2011 | JPMORGAN INSURANCE TRUST | 15 | ||||||
Table of Contents
NOTES TO FINANCIAL STATEMENTS
AS OF DECEMBER 31, 2011 (continued)
At the inception of a loan, securities are exchanged for cash collateral equal to at least 102% of the value of loaned U.S. dollar-denominated securities, plus accrued interest. The GSAL Securities Lending Agreement requires that the loaned securities be marked to market on a daily basis and additional cash collateral is requested from borrowers when the cash received from borrowers becomes less than 102% of the value of loaned securities.
The value of the cash collateral received is recorded as a liability on the Statement of Assets and Liabilities and details of Collateral Investments are disclosed in the SOI. At December 31, 2011, the value of outstanding securities on loan and the value of Collateral Investments were as follows:
Value of Securities on Loan | Cash Collateral Posted by Borrower | Total Value of Collateral Investments | ||||||||
| $76,983 | $ | 78,550 | $ | 78,550 | ||||||
The Portfolio bears the risk of loss associated with the Collateral Investments and is not entitled to additional collateral from the borrower to cover any such losses. To the extent that the value of the Collateral Investments declines below the amount owed to a borrower, the Portfolio may incur losses that exceed the amount it earned on lending the security. Upon termination of a loan, the Portfolio may use leverage (borrow money) to repay the borrower for cash collateral posted if the Advisor does not believe that it is prudent to sell the Collateral Investments to fund the payment of this liability.
Securities lending also involves counterparty risks, including the risk that the loaned securities may not be returned in a timely manner or at all. Subject to certain conditions, GSAL has agreed to indemnify the Portfolio from losses resulting from a borrower’s failure to return a loaned security.
The Advisor waived fees associated with the Portfolio’s investment in JPMorgan Prime Money Market Fund in the amount of $376. This amount offsets the administration fees and shareholder servicing fees incurred by JPMorgan Prime Money Market Fund related to the Portfolio’s investment in such fund. A portion of the waiver is voluntary.
D. Security Transactions and Investment Income — Investment transactions are accounted for on the trade date (the date the order to buy or sell is executed). Securities gains and losses are calculated on a specifically identified cost basis. Interest income is determined on the basis of coupon interest accrued using the effective interest method adjusted for amortization of premiums and accretion of discounts. Dividend income less foreign taxes withheld, if any, is recorded on the ex-dividend date or when the Portfolio first learns of the dividend.
E. Allocation of Income and Expenses — In calculating the net asset value per share of each class, investment income, realized and unrealized gains and losses and expenses other than class specific expenses are allocated daily to each class of shares based upon the proportion of net assets of each class at the beginning of each day. Expenses directly attributable to a portfolio are charged directly to that portfolio while the expenses attributable to more than one portfolio of the Trust are allocated among the respective portfolios. Each class of shares bears its pro-rata portion of expenses attributable to the Portfolio, except that each class separately bears expenses related specifically to that class, such as distribution fees.
F. Federal Income Taxes — The Portfolio is treated as a separate taxable entity for Federal income tax purposes. The Portfolio’s policy is to comply with the provisions of the Internal Revenue Code of 1986, as amended (the “Code”), applicable to regulated investment companies and to distribute to shareholders all of its distributable net investment income and net realized gain on investments. Accordingly, no provision for Federal income tax is necessary. The Portfolio is also a segregated portfolio of assets for insurance purposes and intends to comply with the diversification requirements of Subchapter L of the Code. The Portfolio is not aware of any tax positions for which it is reasonably possible that the total amounts of unrecognized tax benefits or losses will significantly change in the next twelve months. However, the Portfolio’s conclusions may be subject to future review based on changes in, or the interpretation of, the accounting standards or tax laws and regulations. The Portfolio’s Federal tax returns for the prior three fiscal years remain subject to examination by the Internal Revenue Service.
G. Dividends and Distributions to Shareholders — Dividends from net investment income are generally declared and paid at least annually. Dividends are declared separately for each class. No class has preferential dividend rights; differences in per share rates are due to differences in separate class expenses. Net realized capital gains, if any, are distributed at least annually. The amount of dividends and distributions from net investment income and net realized capital gains is determined in accordance with Federal income tax regulations, which may differ from accounting principles generally accepted in the United States of America. To the extent these “book/tax” differences are permanent in nature (i.e., that they result from other than timing of recognition — “temporary differences”), such amounts are reclassified within the capital accounts based on their Federal tax-basis treatment.
The following amounts were reclassified within the capital accounts:
| Paid-in-Capital | Accumulated Undistributed/ (Overdistributed) Net Investment Income | Accumulated Net Realized Gain (Loss) | ||||||||||
| $ | (9,739,715 | ) | $ | (4,827 | ) | $ | 9,744,542 | |||||
The reclassifications for the Portfolio relate primarily to expiration of capital loss carryforwards.
| 16 | JPMORGAN INSURANCE TRUST | DECEMBER 31, 2011 | ||||
Table of Contents
3. Fees and Other Transactions with Affiliates
A. Investment Advisory Fee — Pursuant to the Investment Advisory Agreement, JPMIM acts as the investment advisor to the Portfolio. JPMIM is a wholly-owned subsidiary of JPMorgan Asset Management Holdings Inc., which is a wholly-owned subsidiary of JPMorgan Chase & Co. (“JPMorgan”). JPMIM supervises the investments of the Portfolio and for such services is paid a fee. The fee is accrued daily and paid monthly based on the Portfolio’s average daily net assets at an annual fee rate of 0.65%.
The Advisor waived Investment Advisory fees and/or reimbursed expenses as outlined in Note 3.E.
B. Administration Fee — Pursuant to an Administration Agreement, JPMorgan Funds Management, Inc. (the “Administrator”), an indirect, wholly-owned subsidiary of JPMorgan, provides certain administration services to the Portfolio. In consideration of these services, the Administrator receives a fee computed daily and paid monthly at the annual rate of 0.15% of the first $25 billion of the average daily net assets of all funds in the J.P. Morgan Funds Complex (excluding certain funds of funds and money market funds) and 0.075% of the average daily net assets in excess of $25 billion of all such funds. For the year ended December 31, 2011, the annual effective rate was 0.09% of the Portfolio’s average daily net assets.
JPMorgan Chase Bank, N.A. (“JPMCB”), a wholly-owned subsidiary of JPMorgan, and successor in interest to J.P. Morgan Investor Services Co. serves as the Portfolio’s sub-administrator (the “Sub-administrator”). For its services as Sub-administrator, JPMCB receives a portion of the fees payable to the Administrator.
C. Distribution Fees — Pursuant to a Distribution Agreement, JPMorgan Distribution Services, Inc. (the “Distributor”), a wholly-owned subsidiary of JPMorgan, serves as the Trust’s exclusive underwriter and promotes and arranges for the sale of the Portfolio’s shares.
The Board of Trustees has adopted a Distribution Plan (the “Distribution Plan”) for Class 2 Shares of the Portfolio in accordance with Rule 12b-1 under the 1940 Act. The Distribution Plan provides that the Portfolio shall pay distribution fees, including payments to the Distributor, at an annual rate of 0.25% of the average daily net assets of Class 2 Shares.
D. Custodian and Accounting Fees — JPMCB provides portfolio custody and accounting services for the Portfolio. The amounts paid directly to JPMCB by the Portfolio for custody and accounting services are included in Custodian and accounting fees in the Statement of Operations. The custodian fees may be reduced by credits earned by the Portfolio, based on uninvested cash balances held by the custodian. Such earnings credits are presented separately in the Statement of Operations.
Interest expense, if any, paid to the custodian related to cash overdrafts is included in Interest expense to affiliates in the Statement of Operations.
E. Waivers and Reimbursements — The Advisor and Administrator have contractually agreed to waive fees and/or reimburse the Portfolio to the extent that total annual operating expenses (excluding acquired fund fees and expenses, dividend expense related to short sales, interest, taxes, extraordinary expenses and expenses related to the Board of Trustees’ deferred compensation plan) exceed the percentages of the Portfolio’s average daily net assets as shown in the table below:
| Class 1 | Class 2 | |||||||
| 0.90 | % | 1.15 | % | |||||
The contractual expense limitation agreements were in effect for the year ended December 31, 2011. The expense limitation percentages in the table above are in place until at least April 30, 2012.
For the year ended December 31, 2011, the Advisor contractually waived fees for the Portfolio in the amount of $43,572. The Advisor does not expect the Portfolio to repay any such waived fees in future years.
Additionally, the Portfolio may invest in one or more money market funds advised by the Advisor or its affiliates. The Advisor, Administrator and the Distributor waive fees in an amount sufficient to offset the respective fees each charges to the affiliated money market fund on the Portfolio’s investment in such affiliated money market fund. A portion of the waiver is voluntary.
The amount of waivers resulting from investments in the money market funds for the year ended December 31, 2011 (excluding the waiver disclosed in Note 2.C. regarding cash collateral for securities lending invested in the JPMorgan Prime Money Market Fund) was $1,534.
F. Other — Certain officers of the Trust are affiliated with the Advisor, the Administrator and the Distributor. Such officers, with the exception of the Chief Compliance Officer, receive no compensation from the Portfolio for serving in their respective roles.
The Board of Trustees appointed a Chief Compliance Officer to the Portfolio in accordance with federal securities regulations. The Portfolio, along with other affiliated portfolios, makes reimbursement payments, on a pro-rata basis, to the Administrator for a portion of the fees associated with the Office of the Chief Compliance Officer. Such fees are included in Trustees’ and Chief Compliance Officer’s fees in the Statement of Operations.
The Trust adopted a Trustee Deferred Compensation Plan (the “Plan”) which allows the Independent Trustees to defer the receipt of all or a portion of compensation related to performance of their duties as a Trustee. The deferred fees are invested in various J.P. Morgan Funds until distribution in accordance with the Plan.
During the year ended December 31, 2011, the Portfolio may have purchased securities from an underwriting syndicate in which the principal underwriter or members of the syndicate are affiliated with the Advisor.
| DECEMBER 31, 2011 | JPMORGAN INSURANCE TRUST | 17 | ||||||
Table of Contents
NOTES TO FINANCIAL STATEMENTS
AS OF DECEMBER 31, 2011 (continued)
The Portfolio may use related party broker/dealers. For the year ended December 31, 2011, the Portfolio did not incur any brokerage commissions with broker/dealers affiliated with the Advisor.
The Securities and Exchange Commission (“SEC”) has granted an exemptive order permitting the Portfolio to engage in principal transactions with J.P. Morgan Securities, Inc., an affiliated broker, involving taxable money market instruments subject to certain conditions.
4. Investment Transactions
During the year ended December 31, 2011, purchases and sales of investments (excluding short-term investments) were as follows:
Purchases (excluding U.S. Government) | Sales (excluding U.S. Government) | |||||||
| $ | 50,307,693 | $ | 58,996,084 | |||||
During the year ended December 31, 2011, there were no purchases or sales of U.S. Government securities.
5. Federal Income Tax Matters
For Federal income tax purposes, the cost and unrealized appreciation (depreciation) in value of the investment securities at December 31, 2011, were as follows:
Aggregate Cost | Gross Unrealized Appreciation | Gross Unrealized Depreciation | Net Unrealized Appreciation (Depreciation) | |||||||||||||
| $ | 35,758,332 | $ | 3,564,579 | $ | 1,331,266 | $ | 2,233,313 | |||||||||
The difference between book and tax basis appreciation (depreciation) on investments is primarily attributed to wash sale loss deferrals.
The tax character of distributions paid during the fiscal year ended December 31, 2011 was as follows:
| Total Distributions Paid From: | ||||||||
Ordinary Income | Total Distributions Paid | |||||||
| $ | 436,149 | $ | 436,149 | |||||
The tax character of distributions paid during the fiscal year ended December 31, 2010 was as follows:
| Total Distributions Paid From: | ||||||||
Ordinary Income | Total Distributions Paid | |||||||
| $ | 461,179 | $ | 461,179 | |||||
At December 31, 2011, the components of net assets (excluding paid in capital) on a tax basis were as follows:
Current Distributable Ordinary Income | Current Distributable Long-Term Capital Gain or (Tax Basis Capital Loss Carryover) | Unrealized Appreciation (Depreciation) | ||||||||||
| $ | 276,886 | $ | (21,984,539 | ) | $ | 2,233,313 | ||||||
The cumulative timing differences primarily consist of Trustee deferred compensation and wash sale loss deferrals.
Under the Regulated Investment Company Modernization Act of 2010 (the “Act”), net capital losses recognized by the Portfolio after December 31, 2010, may get carried forward indefinitely, and retain their character as short-term and/or long term losses. Prior to the Act, pre-enactment net capital losses incurred by the Portfolio were carried forward for eight years and treated as short-term losses. The Act requires that post-enactment net capital losses be used before pre-enactment net capital losses.
As of December 31, 2011, the Portfolio did not have post-enactment net capital loss carryforwards.
As of December 31, 2011, the Portfolio had the following pre-enactment net capital loss carryforwards, expiring during the year indicated, which are available to offset future realized gains:
| 2013 | 2016 | 2017 | Total | |||||||||||||
| $ | 4,697,466 | $ | 5,636,634 | $ | 11,650,439 | $ | 21,984,539 | |||||||||
During the year ended December 31, 2011, the Portfolio utilized capital loss carryforwards in the amount of $5,777,368 and had expired capital loss carryforwards in the amount of $9,741,883.
| 18 | JPMORGAN INSURANCE TRUST | DECEMBER 31, 2011 | ||||
Table of Contents
6. Borrowings
The Trust and JPMCB have entered into a financing arrangement. Under this arrangement, JPMCB provides an unsecured, uncommitted credit facility in the aggregate amount of $100 million to certain of the J.P. Morgan Funds, including the Portfolio. Advances under the arrangement are taken primarily for temporary or emergency purposes, including the meeting of redemption requests that otherwise might require the untimely disposition of securities, and are subject to the Portfolio’s borrowing restrictions. Interest on borrowings is payable at a rate determined by JPMCB at the time of borrowing. This agreement has been extended until November 12, 2012.
The Portfolio had no borrowings outstanding from the unsecured, uncommitted credit facility at December 31, 2011, or at any time during the year then ended.
Interest expense paid, if any, as a result of borrowings from the unsecured, uncommitted credit facility is included in Interest expense to affiliates in the Statement of Operations.
7. Risks, Concentrations and Indemnifications
In the normal course of business, the Portfolio enters into contracts that contain a variety of representations which provide general indemnifications. The Portfolio’s maximum exposure under these arrangements is unknown, as this would involve future claims that may be made against the Portfolio that have not yet occurred. However, based on experience, the Portfolio expects the risk of loss to be remote.
From time to time, the Portfolio may have a concentration of several shareholders holding a significant percentage of shares outstanding. Investment activities of these shareholders could have a material impact on the Portfolio.
| DECEMBER 31, 2011 | JPMORGAN INSURANCE TRUST | 19 | ||||||
Table of Contents
REPORT OF INDEPENDENT REGISTERED PUBLIC ACCOUNTING FIRM
To the Board of Trustees of JPMorgan Insurance Trust and Shareholders of JPMorgan Insurance Trust Intrepid Growth Portfolio:
In our opinion, the accompanying statement of assets and liabilities, including the schedule of portfolio investments, and the related statements of operations and of changes in net assets and the financial highlights present fairly, in all material respects, the financial position of JPMorgan Insurance Trust Intrepid Growth Portfolio (a separate Portfolio of JPMorgan Insurance Trust) (hereafter referred to as the “Portfolio”) at December 31, 2011, the results of its operations for the year then ended, the changes in its net assets for each of the two years in the period then ended and the financial highlights for each of the five years in the period then ended, in conformity with accounting principles generally accepted in the United States of America. These financial statements and financial highlights (hereafter referred to as “financial statements”) are the responsibility of the Portfolio’s management. Our responsibility is to express an opinion on these financial statements based on our audits. We conducted our audits of these financial statements in accordance with the standards of the Public Company Accounting Oversight Board (United States). Those standards require that we plan and perform the audit to obtain reasonable assurance about whether the financial statements are free of material misstatement. An audit includes examining, on a test basis, evidence supporting the amounts and disclosures in the financial statements, assessing the accounting principles used and significant estimates made by management, and evaluating the overall financial statement presentation. We believe that our audits, which included confirmation of securities at December 31, 2011 by correspondence with the custodian and brokers, provide a reasonable basis for our opinion.
PricewaterhouseCoopers LLP
New York, New York
February 23, 2012
| 20 | JPMORGAN INSURANCE TRUST | DECEMBER 31, 2011 | ||||
Table of Contents
(Unaudited)
The Portfolio’s Statement of Additional Information includes additional information about the Portfolio’s Trustees and is available, without charge, upon request by calling 1-800-480-4111 or on the J.P. Morgan Funds’ website at www.jpmorganfunds.com.
Name (Year of Birth); Positions With the Portfolio (1) | Principal Occupations During Past 5 Years | Number of Complex Overseen by Trustee (2) | Other Directorships Held Outside Fund Complex During Past 5 Years | |||
Independent Trustees | ||||||
| William J. Armstrong (1941); Trustee of Trust since 2005; Trustee of heritage J.P. Morgan Funds since 1987. | Retired; CFO and Consultant, EduNeering, Inc. (internet business education supplier) (2000-2001); Vice President and Treasurer, Ingersoll-Rand Company (manufacturer of industrial equipment) (1972-2000). | 154 | None. | |||
| John F. Finn (1947); Trustee of Trust since 2005; Trustee of heritage One Group Mutual Funds since 1998. | Chairman (1985-present), President and Chief Executive Officer, Gardner, Inc. (supply chain management company serving industrial and consumer markets) (1974-present). | 154 | Director, Cardinal Health, Inc. (CAH) (1994-present); Director, Greif, Inc. (GEF) (industrial package products and services) (2007-present). | |||
| Dr. Matthew Goldstein (1941); Trustee of Trust since 2005; Trustee of heritage J.P. Morgan Funds since 2003. | Chancellor, City University of New York (1999-present); President, Adelphi University (New York) (1998-1999). | 154 | Director, New Plan Excel (NXL) (1999-2005); Director, National Financial Partners (NFP) (2003-2005); Director, Bronx-Lebanon Hospital Center; Director, United Way of New York City (2002-present). | |||
| Robert J. Higgins (1945); Trustee of Trust since 2005; Trustee of heritage J.P. Morgan Funds since 2002. | Retired; Director of Administration of the State of Rhode Island (2003-2004); President — Consumer Banking and Investment Services, Fleet Boston Financial (1971-2001). | 154 | None. | |||
| Peter C. Marshall (1942); Trustee of Trust since 2005; Trustee of heritage One Group Mutual Funds since 1985. | Self-employed business consultant (2002-present). | 154 | Director, Center for Communication, Hearing, and Deafness (1990-present). | |||
| Marilyn McCoy* (1948); Trustee of Trust since 2005; Trustee of heritage One Group Mutual Funds since 1999. | Vice President of Administration and Planning, Northwestern University (1985-present). | 154 | Trustee, Carleton College (2003-present). | |||
| William G. Morton, Jr. (1937); Trustee of Trust since 2005; Trustee of heritage J.P. Morgan Funds since 2003. | Retired; Chairman Emeritus (2001-2002), and Chairman and Chief Executive Officer, Boston Stock Exchange (1985-2001). | 154 | Director, Radio Shack Corp. (1987-2008); Trustee, Stratton Mountain School (2001-present). | |||
| Robert A. Oden, Jr. (1946); Trustee of Trust since 2005; Trustee of heritage One Group Mutual Funds since 1997. | Retired; President, Carleton College (2002-2010); President, Kenyon College (1995-2002). | 154 | Trustee, American University in Cairo (1999-present); Trustee, Carleton College (2002-2010). | |||
| Fergus Reid, III (1932); Trustee of Trust (Chairman) since 2005; Trustee (Chairman) of heritage J.P. Morgan Funds since 1987. | Chairman, Joe Pietryka, Inc. (formerly Lumelite Corporation) (plastics manufacturing) (2003-present); Chairman and Chief Executive Officer, Lumelite Corporation (1985-2002). | 154 | Trustee, Morgan Stanley Funds (105 portfolios) (1992-present). | |||
| DECEMBER 31, 2011 | JPMORGAN INSURANCE TRUST | 21 | ||||||
Table of Contents
TRUSTEES
(Unaudited) (continued)
Name (Year of Birth); Positions With the Portfolio (1) | Principal Occupations During Past 5 Years | Number of Complex Overseen by Trustee (2) | Other Directorships Held Outside Fund Complex During Past 5 Years | |||
Independent Trustees (continued) | ||||||
| Frederick W. Ruebeck (1939); Trustee of Trust since 2005; Trustee of heritage One Group Mutual Funds since 1994. | Consultant (2000-present); Advisor, JP Greene & Associates, LLC (broker-dealer) (2000-2009); Chief Investment Officer, Wabash College (2004-present); Director of Investments, Eli Lilly and Company (pharmaceuticals) (1988-1999). | 154 | Trustee, Wabash College (1988-present); Chairman, Indianapolis Symphony Orchestra Foundation (1994-present). | |||
| James J. Schonbachler (1943); Trustee of Trust since 2005; Trustee of heritage J.P. Morgan Funds since 2001. | Retired; Managing Director of Bankers Trust Company (financial services) (1968-1998). | 154 | None. | |||
Interested Trustees | ||||||
| Frankie D. Hughes** (1952), Trustee of Trust since 2008. | President and Chief Investment Officer, Hughes Capital Management, Inc. (fixed income asset management) (1993-present). | 154 | Trustee, The Victory Portfolios (2000-2008). | |||
| Leonard M. Spalding, Jr.*** (1935); Trustee of Trust since 2005; Trustee of heritage J.P. Morgan Funds since 1998. | Retired; Chief Executive Officer, Chase Mutual Funds (investment company) (1989-1998); President and Chief Executive Officer, Vista Capital Management (investment management) (1990-1998); Chief Investment Executive, Chase Manhattan Private Bank (investment management) (1990-1998). | 154 | Director, Glenview Trust Company, LLC (2001-present); Trustee, St. Catharine College (1998-present); Trustee, Bellarmine University (2000-present); Director, Springfield-Washington County Economic Development Authority (1997-present); Trustee, Catholic Education Foundation (2005-present). | |||
| (1) | Each Trustee serves for an indefinite term, subject to the Trust’s current retirement policy, which is age 75 for all Trustees, except that the Board has determined Messrs. Reid and Spalding should continue to serve until December 31, 2012. |
| (2) | A Fund Complex means two or more registered investment companies that hold themselves out to investors as related companies for purposes of investment and investor services or have a common investment adviser or have an investment adviser that is an affiliated person of the investment adviser of any of the other registered investment companies. The J.P. Morgan Funds Complex for which the Board of Trustees serves currently includes eleven registered investment companies (154 funds). |
| * | Ms. McCoy has served as Vice President of Administration and Planning for Northwestern University since 1985. William M. Daley was the Head of Corporate Responsibility for JPMorgan Chase & Co. prior to January 2011 and served as a member of the Board of Trustees of Northwestern University from 2005 through 2010. JPMIM, the Funds’ investment advisor, is a wholly-owned subsidiary of JPMorgan Chase & Co. Three other members of the Board of Trustees of Northwestern University are executive officers of registered investment advisors (not affiliated with JPMorgan) that are under common control with subadvisors to certain J.P. Morgan Funds. |
| ** | Ms. Hughes is treated as an “interested person” based on the portfolio holdings of clients of Hughes Capital Management, Inc. |
| *** | Mr. Spalding is treated as an “interested person” due to his ownership of JPMorgan Chase stock. |
The contact address for each of the Trustees is 270 Park Avenue, New York, NY 10017.
| 22 | JPMORGAN INSURANCE TRUST | DECEMBER 31, 2011 | ||||
Table of Contents
(Unaudited)
Name (Year of Birth), Positions Held with the Trust (Since) | Principal Occupations During Past 5 Years | |
Patricia A. Maleski (1960), | Managing Director, J.P. Morgan Investment Management Inc. and Chief Administrative Officer, J.P. Morgan Funds and Institutional Pooled Vehicles since 2010; previously, Treasurer and Principal Financial Officer of the Trusts from 2008 to 2010; previously, Head of Funds Administration and Board Liaison, J.P. Morgan Funds prior to 2010. Ms. Maleski has been with JPMorgan Chase & Co. since 2001. | |
| Joy C. Dowd (1972), Treasurer and Principal Financial Officer (2010) | Assistant Treasurer of the Trusts from 2009 to 2010; Executive Director, JPMorgan Funds Management, Inc. from February 2011; Vice President, JPMorgan Funds Management, Inc. from December 2008 to February 2011; prior to joining JPMorgan Chase, Ms. Dowd worked in MetLife’s investments audit group from 2005 through 2008. | |
| Frank J. Nasta (1964), Secretary (2008) | Managing Director and Associate General Counsel, JPMorgan Chase since 2008; Previously, Director, Managing Director, General Counsel and Corporate Secretary, J. & W. Seligman & Co. Incorporated; Secretary of each of the investment companies of the Seligman Group of Funds and Seligman Data Corp.; Director and Corporate Secretary, Seligman Advisors, Inc. and Seligman Services, Inc. | |
| Stephen M. Ungerman (1953), Chief Compliance Officer (2005) | Managing Director, JPMorgan Chase & Co.; Mr. Ungerman has been with JPMorgan Chase & Co. since 2000. | |
| Paul L. Gulinello (1950), AML Compliance Officer (2005) | Vice President and Anti Money Laundering Compliance Officer for JPMorgan Asset Management Americas, additionally responsible for privacy, personal trading and Code of Ethics compliance since 2004. Mr. Gulinello has been with JPMorgan Chase & Co. since 1972. | |
Elizabeth A. Davin (1964), Assistant Secretary (2005)* | Vice President and Assistant General Counsel, JPMorgan Chase since 2005; Senior Counsel, JPMorgan Chase (formerly Bank One Corporation) from 2004 to 2005. | |
| Jessica K. Ditullio (1962), Assistant Secretary (2005)* | Executive Director and Assistant General Counsel, JPMorgan Chase since February 2011; Ms. Ditullio has served as an attorney with various titles for JPMorgan Chase (formerly Bank One Corporation) since 1990. | |
| John T. Fitzgerald (1975), Assistant Secretary (2008) | Executive Director and Assistant General Counsel, JPMorgan Chase since February 2011; formerly, Vice President and Assistant General Counsel, JPMorgan Chase from 2005 until February 2011. | |
| Carmine Lekstutis (1980), Assistant Secretary (2011) | Vice President and Assistant General Counsel, JPMorgan Chase since 2011; Associate, Skadden, Arps, Slate, Meagher & Flom LLP (law firm) from 2006 to 2011. | |
| Gregory S. Samuels (1980), Assistant Secretary (2010) | Vice President and Assistant General Counsel, JPMorgan Chase since 2010; Associate, Ropes & Gray (law firm) from 2008 to 2010; Associate, Clifford Chance LLP (law firm) from 2005 to 2008. | |
| Brian L. Duncan (1965), Assistant Treasurer (2008)* | Vice President, JPMorgan Funds Management, Inc. since June 2007; prior to joining JPMorgan Chase, Mr. Duncan worked for Penn Treaty American Corporation as Vice President and Controller from 2004 through 2007. | |
| Jeffrey D. House (1972), Assistant Treasurer (2006)* | Vice President, JPMorgan Funds Management, Inc. since July 2006. | |
| Laura S. Melman (1966), Assistant Treasurer (2006) | Executive Director, JPMorgan Funds Management, Inc. since February 2011, responsible for Taxation; Vice President, JPMorgan Funds Management, Inc. from August 2006 to February 2011, responsible for Taxation. | |
| Joseph Parascondola (1963), Assistant Treasurer (2011) | Vice President, JPMorgan Funds Management, Inc. since August 2006. | |
| Matthew J. Plastina (1970), Assistant Treasurer (2011) | Vice President, JPMorgan Funds Management, Inc. since August 2010; prior to August 2010, Vice President and Controller, Legg Mason Global Asset Management. | |
| Jeffery Reedy (1973), Assistant Treasurer (2011)* | Vice President, JPMorgan Funds Management, Inc. since February 2006. | |
The contact address for each of the officers, unless otherwise noted, is 270 Park Avenue, New York, NY 10017.
| * | The contact address for the officer is 1111 Polaris Parkway, Columbus, OH 43240. |
| DECEMBER 31, 2011 | JPMORGAN INSURANCE TRUST | 23 | ||||||
Table of Contents
SCHEDULE OF SHAREHOLDER EXPENSES
(Unaudited)
Hypothetical $1,000 Investment
As a shareholder of the Portfolio, you incur ongoing costs, including investment advisory fees, administration fees, distribution fees (for Class 2 Shares) and other Portfolio expenses. Because the Portfolio is a funding vehicle for Policies and Eligible Plans, you may also incur sales charges and other fees relating to the Policies or Eligible Plans. The examples below are intended to help you understand your ongoing costs (in dollars) of investing in the Portfolio, but not the costs of the Policies or Eligible Plans, and to compare these ongoing costs with the ongoing costs of investing in other mutual funds. The examples assume that you had a $1,000 investment in the Class at the beginning of the reporting period, July 1, 2011, and continued to hold your shares at the end of the reporting period, December 31, 2011.
Actual Expenses
For each Class of the Portfolio in the table below, the first line provides information about actual account values and actual expenses. You may use the information in this line, together with the amount you invested, to estimate the expenses that you paid over the period. Simply divide your account value by $1,000 (for example, an $8,600 account value divided by $1,000 = 8.6), then multiply the result by the number in the first line of each Class under the heading entitled “Expenses Paid During” to estimate the expenses you paid on your account during this period.
Hypothetical Example for Comparison Purposes
The second line of each Class in the table below provides information about hypothetical account values and hypothetical expenses based on the Class’ actual expense ratio and an assumed rate of return of 5% per year before expenses, which is not the Class’ actual return. The hypothetical account values and expenses may not be used to estimate the actual ending account balance or expenses you paid for the period. You may use this information to compare the ongoing costs of investing in the Class of the Portfolio and other portfolios. To do so, compare this 5% hypothetical example with the 5% hypothetical examples that appear in the shareholder reports of the other funds. Please note that the expenses shown in the table are meant to highlight your ongoing costs only and do not reflect any transaction costs, such as sales charges (loads) or redemption fees or the costs associated with the Policies and Eligible Plans through which the Portfolio is held. Therefore, the second line for each Class in the table is useful in comparing ongoing costs only, and will not help you determine the relative total costs of owning different portfolios. In addition, if these transaction costs were included, your costs would have been higher. The examples also assume all dividends and distributions have been reinvested.
| Beginning Account Value, July 1, 2011 | Ending Account Value December 31, 2011 | Expenses Paid During July 1, 2011 to December 31, 2011* | Annualized Expense Ratio | |||||||||||||
Class 1 | ||||||||||||||||
Actual | $ | 1,000.00 | $ | 935.00 | $ | 4.39 | 0.90 | % | ||||||||
Hypothetical | 1,000.00 | 1,020.67 | 4.58 | 0.90 | ||||||||||||
Class 2 | ||||||||||||||||
Actual | 1,000.00 | 934.30 | 5.61 | 1.15 | ||||||||||||
Hypothetical | 1,000.00 | 1,019.41 | 5.85 | 1.15 | ||||||||||||
| * | Expenses are equal to the Portfolio's annualized expense ratio, multiplied by the average account value over the period, multiplied by 184/365 (to reflect the one-half year period). |
| 24 | JPMORGAN INSURANCE TRUST | DECEMBER 31, 2011 | ||||
Table of Contents
BOARD APPROVAL OF INVESTMENT ADVISORY AGREEMENT
(Unaudited)
The Board of Trustees meets regularly throughout the year and considers factors that are relevant to its annual consideration of investment advisory agreements at each meeting. The Board of Trustees has established various standing committees, composed of Trustees with diverse backgrounds, to which the Board of Trustees has assigned specific subject matter responsibilities to further enhance the effectiveness of the Board’s oversight and decision making. The Board of Trustees and its investment subcommittees (money market and alternative products, equity, and fixed income) also meet for the specific purpose of considering advisory contract annual renewals. The Board of Trustees held meetings in person in June and August 2011, at which the Trustees considered the continuation of the investment advisory agreement for the Portfolio whose annual report is contained herein (the “Advisory Agreement”). At the June meeting, the Board’s investment subcommittees met to review and consider performance, expense and related information for the J.P. Morgan Funds. Each investment subcommittee reported to the full Board, which then considered the investment subcommittee’s preliminary findings. At the August meeting, the Trustees continued their review and consideration. The Trustees, including a majority of the Trustees who are not “interested persons” (as defined in the 1940 Act) of any party to the Advisory Agreement or any of their affiliates, approved the continuation of the Advisory Agreement on August 25, 2011.
The Trustees, as part of their review of the investment advisory arrangements for the J.P. Morgan Funds, considered and reviewed performance and other information received from the Advisor, on a regular basis over the course of the year, as well as information specifically prepared for their annual review. This information included the Portfolio’s performance compared to the performance of the Portfolio’s peers and benchmarks and analyses by the Advisor of the Portfolio’s performance. The Advisor also periodically provides comparative information regarding the Portfolio’s expense ratios and those of the peer groups. In addition, in preparation for the June and August meetings, the Trustees requested, received and evaluated extensive materials from the Advisor, including, with respect to certain J.P. Morgan Funds, performance and expense information compiled by Lipper Inc. (“Lipper”), an independent provider of investment company data. Prior to voting, the Trustees reviewed the proposed approval of the Advisory Agreement with representatives of the Advisor and with counsels to the Trust and independent Trustees and received a memorandum from independent counsel to the Trustees discussing the legal standards for their consideration of the proposed approval. The Trustees also discussed the proposed approvals in executive sessions with counsels to the Trust and independent Trustees at which no representatives of the Advisor were present. Set forth below is a summary of the material factors evaluated by the Trustees in determining whether to approve the Advisory Agreement.
In their deliberations, there was a comprehensive consideration of the information received by the Trustees. Each Trustee attributed different weights to the various factors and no factor alone was considered determinative. From year to year, the Trustees consider and place emphasis on relevant information in light of changing circumstances in market and economic conditions. The Trustees determined that the compensation to be received by the Advisor from the Portfolio under the Advisory Agreement was fair and reasonable and that the continuance of the investment advisory contract was in the best interests of the Portfolio and its shareholders.
The factors summarized below were considered and discussed by the Trustees in reaching their conclusions:
Nature, Extent and Quality of Services Provided by the Advisor
The Trustees received and considered information regarding the nature, extent and quality of the services provided to the Portfolio under the Advisory Agreement. The Trustees took into account information furnished throughout the year at Trustee meetings, as well as the materials furnished specifically in connection with this annual review process. The Trustees considered the background and experience of the Advisor’s senior management and the expertise of, and the amount of attention given to the Portfolio by, investment personnel of the Advisor. In addition, the Trustees reviewed the qualifications, backgrounds and responsibilities of the portfolio management team primarily responsible for the day-to-day management of the Portfolio and the infrastructure supporting the team. The Trustees also considered information provided by the Advisor and JPMorgan Distribution Services, Inc. (“JPMDS”) about the structure and distribution strategy of the Portfolio. The Trustees also reviewed information relating to the Advisor’s risk governance model and reports showing the Advisor’s compliance structure and ongoing compliance processes. The quality of the administrative services provided by JPMorgan Funds Management, Inc. (“JPMFM”), an affiliate of the Advisor, was also considered.
The Board of Trustees also considered its knowledge of the nature and quality of the services provided by the Advisor to the Portfolio gained from their experience as Trustees of the J.P. Morgan Funds. In addition, they considered the overall reputation and capabilities of the Advisor and its affiliates, the commitment of the Advisor to provide high quality service to the Portfolio, their overall confidence in the Advisor’s integrity and the Advisor’s responsiveness to questions or concerns raised by them, including the Advisor’s willingness to consider and implement organizational and operational changes designed to improve investment results and the services provided to the Portfolio.
Based on these considerations and other factors, the Trustees concluded that they were satisfied with the nature, extent and
| DECEMBER 31, 2011 | JPMORGAN INSURANCE TRUST | 25 | ||||||
Table of Contents
BOARD APPROVAL OF INVESTMENT ADVISORY AGREEMENT
(Unaudited) (continued)
quality of the investment advisory services provided to the Portfolio by the Advisor.
Costs of Services Provided and Profitability to the Advisor and its Affiliates
The Trustees received and considered information regarding the profitability to the Advisor and its affiliates in providing services to the Portfolio. The Trustees reviewed and discussed this data. The Trustees recognized that this data is not audited and represents the Advisor’s determination of its and its affiliates’ revenues from the contractual services provided to the Portfolio, less expenses of providing such services. Expenses include direct and indirect costs and are calculated using an allocation methodology developed by the Advisor. The Trustees also recognized that it is difficult to make comparisons of profitability from fund investment advisory contracts because comparative information is not generally publicly available and is affected by numerous factors, including the structure of the particular adviser, the types of funds it manages, its business mix, numerous assumptions regarding allocations and the fact that publicly-traded fund managers’ operating profits and net income are net of distribution and marketing expenses. Based on their review, the Trustees concluded that the profitability to the Advisor under the Advisory Agreement was not unreasonable in light of the services and benefits provided to the Portfolio.
Fall-Out Benefits
The Trustees reviewed information regarding potential “fallout” or ancillary benefits received by the Advisor and its affiliates as a result of their relationship with the Portfolio. The Board also considered that the Advisor currently uses third-party soft dollar arrangements with respect to securities transactions it executes for the Portfolio.
The Trustees also considered that JPMFM earns fees from the Portfolio for providing administrative services. These fees were shown separately in the profitability analysis presented to the Trustees. The Trustees also considered the payments of Rule 12b-1 fees to JPMDS, an affiliate of the Advisor, which also acts as the Portfolio’s distributor and that these fees are in turn generally paid to financial intermediaries that sell the J.P. Morgan Funds, including financial intermediaries that are affiliates of the Advisor. The Trustees also considered the fees paid to JPMorgan Chase Bank, N.A. (“JPMCB”) for custody and fund accounting and other related services.
Economies of Scale
The Trustees noted that the proposed investment advisory fee schedule for the Portfolio does not contain breakpoints. The Trustees considered whether it would be appropriate to add advisory fee breakpoints and the Trustees concluded that the current fee structure was reasonable in light of the fee waivers and expense limitations that the Advisor has in place that serve
to limit the overall net expense ratio at competitive levels. The Trustees also recognized that the fee schedule for the administrative services provided by JPMFM does include a fee breakpoint, which is tied to the overall level of non-money market fund assets excluding certain funds-of-funds, as applicable, advised by the Advisor, and that the Portfolio benefits from that breakpoint. The Trustees concluded that shareholders benefited from the lower expense ratios which resulted from these factors.
Independent Written Evaluation of the Portfolio’s Chief Compliance Officer
The Trustees noted that, upon their direction, the Chief Compliance Officer for the Portfolio had prepared an independent written evaluation in order to assist the Trustees in determining the reasonableness of the proposed management fees. The Trustees considered the written evaluation in determining whether to continue the Advisory Agreement.
Fees Relative to Advisor’s Other Clients
The Trustees received and considered information about the nature and extent of investment advisory services and fee rates offered to other clients of the Advisor for investment management styles substantially similar to that of the Portfolio. The Trustees also considered the complexity of investment management for the Portfolio relative to the Advisor’s other clients and the differences in the nature and extent of the services provided to the different clients. The Trustees concluded that the fee rates charged to the Portfolio in comparison to those charged to the Advisor’s other clients were reasonable.
Investment Performance
The Trustees received and considered absolute and/or relative performance for the Portfolio in a report prepared by Lipper. The Trustees considered the total return performance information, which included the ranking of the Portfolio within a performance universe made up of funds with the same Lipper investment classification and objective (the “Universe Group”) by total return for applicable one-, three- and five-year periods. The Trustees reviewed a description of Lipper’s methodology for selecting mutual funds in the Portfolio’s Universe Group. The Lipper materials provided to the Trustees highlighted information with respect to a representative class to assist the Trustees in their review. As part of this review, the Trustees also reviewed the Portfolio’s performance against its benchmark and considered the performance information provided for the Portfolio at regular Board meetings by the Advisor. The Lipper performance data noted by the Trustees as part of their review and the determinations made by the Trustees with respect to the Portfolio’s performance are summarized below:
The Trustees noted the Portfolio’s performance was in the third, third and fourth quintiles for Class 1 shares for the one-,
| 26 | JPMORGAN INSURANCE TRUST | DECEMBER 31, 2011 | ||||
Table of Contents
three-, and five-year periods ended December 31, 2010, respectively. The Trustees discussed the performance and investment strategy of the Portfolio with the Advisor and, based upon this discussion and other factors, concluded that the performance was reasonable.
Advisory Fees and Expense Ratios
The Trustees considered the contractual advisory fee rate paid by the Portfolio to the Advisor and compared that rate to the information prepared by Lipper concerning management fee rates paid by other funds in the same Lipper category as the Portfolio. The Trustees recognized that Lipper reported the Portfolio’s management fee rate as the combined contractual advisory fee and the administration fee rates. The Trustees considered the fee waiver and/or expense reimbursement
arrangements currently in place for the Portfolio and considered the net advisory fee rate after taking into account any waivers and/or reimbursements. The Trustees recognized that it is difficult to make comparisons of advisory fees because there are variations in the services that are included in the fees paid by other funds. The Trustees’ determinations as a result of the review of the Portfolio’s advisory fees and expense ratios are summarized below:
The Trustees noted that the Portfolio’s net advisory fee and actual total expenses for Class 1 shares were in the second and third quintiles, respectively, of their Universe Group. After considering the factors identified above, in light of this information, the Trustees concluded that the advisory fees were reasonable.
| DECEMBER 31, 2011 | JPMORGAN INSURANCE TRUST | 27 | ||||||
Table of Contents
(Unaudited)
Certain tax information for the Portfolio is required to be provided to shareholders based upon the Portfolio’s income and distributions for the taxable year ended December 31, 2011. The information and distributions reported in this letter may differ from the information and taxable distributions reported to the shareholders for the calendar year ending December 31, 2011. The information necessary to complete your income tax returns
for the calendar year ending December 31, 2011 will be received under separate cover.
Dividends Received Deductions (DRD)
100.00% of ordinary income distributions were eligible for the 70% dividend received deduction for corporate rate shareholders for the fiscal year ended December 31, 2011.
| 28 | JPMORGAN INSURANCE TRUST | DECEMBER 31, 2011 | ||||
Table of Contents
J.P. Morgan Funds are distributed by JPMorgan Distribution Services, Inc., which is an affiliate of JPMorgan Chase & Co. Affiliates of JPMorgan Chase & Co. receive fees for providing various services to the funds.
Contact JPMorgan Distribution Services, Inc. at 1-800-480-4111 for a portfolio prospectus. You can also visit us at www.jpmorganfunds.com. Investors should carefully consider the investment objectives and risk as well as charges and expenses of the mutual fund before investing. The prospectus contains this and other information about the mutual fund. Read the prospectus carefully before investing.
The Portfolio files a complete schedule of its portfolio holdings for the first and third quarters of its fiscal year with the SEC on Form N-Q. The Portfolio’s Forms N-Q are available on the SEC’s website at http://www.sec.gov and may be reviewed and copied at the SEC’s Public Reference Room in Washington, DC. Information on the operation of the SEC’s Public Reference Room may be obtained by calling 1-800-SEC-0330. Shareholders may request the Form N-Q without charge by calling 1-800-480-4111 or by visiting the variable insurance portfolio section of the J.P. Morgan Funds’ website at www.jpmorganfunds.com.
A description of the Portfolio’s policies and procedures with respect to the disclosure of the Portfolio’s holdings is available in the prospectus and Statement of Additional Information.
A copy of proxy policies and procedures is available without charge upon request by calling 1-800-480-4111 and a description of such policies and procedures is on the SEC’s website at www.sec.gov. The Trustees have delegated the authority to vote proxies for securities owned by the Portfolio to the Advisor. A copy of the Portfolio’s voting record for the most recent 12-month period ended June 30 is available on the SEC’s website at www.sec.gov or at the Portfolio’s website at www.jpmorganfunds.com no later than August 31 of each year. The Portfolio’s proxy voting record will include, among other things, a brief description of the matter voted on for each portfolio security, and will state how each vote was cast, for example, for or against the proposal.
Table of Contents
| © JPMorgan Chase & Co., 2012. All rights reserved. December 2011. | AN-JPMITIGP-1211 |
Table of Contents
Annual Report
JPMorgan Insurance Trust
December 31, 2011
JPMorgan Insurance Trust Intrepid Mid Cap Portfolio
NOT FDIC INSURED Ÿ NO BANK GUARANTEE Ÿ MAY LOSE VALUE
|  |
Table of Contents
Investments in the Portfolio are not bank deposits or obligations of, or guaranteed or endorsed by, any bank and are not insured or guaranteed by the FDIC, the Federal Reserve Board or any other government agency. You could lose money if you sell when the Portfolio’s share price is lower than when you invested.
Past performance is no guarantee for future performance. The general market views expressed in this report are opinions based on conditions through the end of the reporting period and are subject to change without notice based on market and other conditions. These views are not intended to predict the future performance of the Portfolio or the securities markets. References to specific securities and their issuers are for illustrative purposes only and are not intended to be, and should not be interpreted as, recommendations to purchase or sell such securities. Such views are not meant as investment advice and may not be relied on as an indication of trading intent on behalf of the Portfolio.
This Portfolio is intended to be a funding vehicle for variable annuity contracts and variable life insurance policies (collectively “Policies”) offered by separate accounts of participating insurance companies. Portfolio shares are also offered through qualified pension and retirement plans (“Eligible Plans”). Individuals may not purchase shares directly from the Portfolio.
Prospective investors should refer to the Portfolio’s prospectus for a discussion of the Portfolio’s investment objective, strategies and risks. Call J.P. Morgan Funds Service Center at 1-800-480-4111 for a prospectus containing more complete information about the Portfolio including management fees and other expenses. Please read it carefully before investing.
Table of Contents
JANUARY 25, 2012 (Unaudited)
Dear Shareholder:
Investors greeted 2011 in much the same way they welcomed 2010: with high hopes that an improving U.S. economy would finally get us back on course to recovery.
This optimism quickly faded as the European debt crisis and a host of other economic and geopolitical concerns cast a dark shadow on the prospects for future growth. The combination of weak global economic data, credit downgrades in the U.S. and in Europe, and escalating fears of contagion all resulted in a level of market volatility not seen since the financial crisis three years ago.
 |
“Investors greeted 2011 in much the same way they welcomed 2010: With high hopes that an improving U.S. economy would finally get us back on course to recovery.” |
Nonetheless, stocks have regained some of their footing, as positive fourth-quarter economic data on auto sales, payroll employment and manufacturing activity all appear to indicate that consumer confidence is improving and economic growth may be accelerating.
We remain cautious, however, since many of the same challenges that we experienced in 2011 — European debt concerns, uncertainty over monetary and fiscal stimulus, and soft economic data — will likely remain in place this year, laying the groundwork for continued market volatility.
Strong fourth quarter surge caps volatile year
The European debt crisis and other geopolitical and economic events created a generally volatile year for equities, culminating in major sell off in the third quarter. A strong fourth quarter comeback did little to reverse the losses, as the Standard & Poor’s 500 Index (“S&P500 Index”) ended the year with only slight gains. As of December 31, 2011, the Index had reached a level of 1,258, an increase of 2.1% from one year prior.
Large cap growth stocks lead style categories
Large cap stocks outpaced mid- and small-cap stocks over the 12-month period ended December 31, 2011 (the Russell 1000 Index returned 1.5% and the Russell Mid Cap Index returned -1.6%, compared to a return of -4.2% for the Russell 2000 Index). Overall, large-cap growth stocks fared better than large-cap value stocks as the Russell 1000 Growth Index returned 2.6% for the 12-month reporting period, compared to 0.4% for the Russell 1000 Value Index.
Euro zone uncertainty drives flight-to-quality sentiment
Investors’ lack of confidence in global economic growth prompted them to seek safe havens in U.S. Treasury securities, and high-quality corporate bonds. The Barclays Capital U.S. Aggregate Bond Index returned 7.8%. High yield bonds and emerging market debt securities also performed well, as the Barclays Capital High Yield Index returned 5.0%, and the Barclays Capital Emerging Markets Index returned 7.0% for the 12-month period ended December 31, 2011.
Similar economic concerns pushed yields of U.S. Treasury securities maturing in 10 years or more to historic lows throughout the year. As of the end of the 12-month period ended December 31, 2011, the yields on the benchmark 10-year U.S. Treasury bond dropped from 3.3% to 1.9%. In addition, yields on the 30-year U.S. Treasury bond declined from 4.3% to 2.9%, as did the two-year U.S. Treasury note, from 0.6% to 0.3%.
Lesson for 2012: Keep balance in mind in economic uncertainty
Last year offered its share of shocks to investors: geopolitical upheaval, natural disasters, sovereign-debt crises, and credit-rating downgrades were all among the events competing for the market’s attention. Against the backdrop of an election year, it’s likely that we will face continued global surprises —both on the upside and the downside.
As you reassess your investment strategy for the year ahead, it’s important to stick with a plan that focuses on diversification as well as long-term allocation. Trying to “time” market fluctuations can be risky business, especially given the ongoing uncertainty surrounding the direction of economic growth and the euro zone crisis in the months ahead.
On behalf of everyone at J.P. Morgan Asset Management, thank you for your continued confidence. We look forward to managing your investment needs for years to come. Should you have any questions, please visit www.jpmorganfunds.com or contact the J.P. Morgan Funds Service Center at 1-800-480-4111.
Sincerely yours,

George C.W. Gatch
CEO-Investment Management Americas
J.P. Morgan Asset Management
| DECEMBER 31, 2011 | JPMORGAN INSURANCE TRUST | 1 | ||||||
Table of Contents
JPMorgan Insurance Trust Intrepid Mid Cap Portfolio
PORTFOLIO COMMENTARY
TWELVE MONTHS ENDED DECEMBER 31, 2011 (Unaudited)
| REPORTING PERIOD RETURN: | ||||
| Portfolio (Class 1 Shares)* | -1.52% | |||
| Russell Midcap Index | -1.55% | |||
| Net Assets as of 12/31/2011 | $31,598,007 | |||
INVESTMENT OBJECTIVE**
The JPMorgan Insurance Trust Intrepid Mid Cap Portfolio (the “Portfolio”) seeks long-term capital growth by investing primarily in equity securities with intermediate capitalizations.
HOW DID THE MARKET PERFORM?
Strong corporate earnings and robust merger-and-acquisition activity encouraged investors and helped support U.S. stock prices during the beginning of the reporting period. However, uncertainty surrounding global economic growth began to dampen investors’ appetite for risk in April 2011. This negative mood among investors worsened as they seemed to lack confidence in the ability of European governments to combat the region’s debt crisis, stoking fear about economic contagion. Concerns about the credit downgrade of U.S.-issued debt exacerbated this negative sentiment among investors. Each of these factors helped trigger a sharp downturn in stock prices in the third quarter of 2011. Stocks rebounded in the fourth quarter of 2011 as better-than-expected economic data helped investors regain their appetite for risk. The Russell Midcap Index (the “Benchmark”) finished the twelve months ended December 31, 2011 with a 1.55% loss.
WHAT WERE THE MAIN DRIVERS OF THE PORTFOLIO’S PERFORMANCE?
The Portfolio (Class 1 Shares) outperformed the Benchmark for the twelve months ended December 31, 2011. The Portfolio’s stock selection in the health services and systems and capital markets sectors contributed to relative performance, while the Portfolio’s stock selection in the industrial cyclical and software and services sectors detracted from relative performance.
Individual contributors to relative performance included the Portfolio’s positions in Cooper Cos., Inc., Alliance Data Systems Corp. and Pharmasset Inc. Shares of eye-care and surgical products maker Cooper Cos., Inc. outperformed as the company’s revenue and earnings per share consistently beat investor expectations during the reporting period and the company raised its guidance. Shares of consumer financial services company Alliance Data Systems Corp. benefited from the
company’s strong earnings and announced stock repurchase plan. Shares of biotechnology company Pharmasset Inc. increased after the announcement that it would be acquired by Gilead Sciences, Inc.
Individual detractors from relative performance included the Portfolio’s positions in Walter Energy, Inc., Navistar International Corp. and Signet Jewelers Ltd. Shares of Walter Energy, Inc., a producer and exporter of metallurgical coal for the global steel industry, declined due to lower-than-expected earnings and concerns about the company’s future production growth. Navistar International Corp., a manufacturer of commercial and military truck engines, reported disappointing quarterly profit, which was lower-than-expected due to costs related to its joint ventures. In addition, lower expectations for military spending caused the company to lower its guidance, which also hurt the stock. Shares of specialty retail jeweler Signet Jewelers Ltd. declined amid concerns that slowing economic growth would hurt jewelry demand.
HOW WAS THE PORTFOLIO POSITIONED?
The portfolio managers employed the JPMorgan Intrepid investment philosophy, which is rooted in behavioral finance, in positioning the Portfolio. Behavioral finance, which is a field of study that emphasizes the importance of human psychology in financial markets, examines how investor behavior can be affected by biases and emotional reactions and theorizes that inefficiencies arise in the stock market because investors are consistently irrational in making many investment decisions.
The JPMorgan Behavioral Finance investment team (the “Team”) aimed to capitalize on these market inefficiencies by targeting stocks that they believed had attractive valuations and strong fundamentals. Additionally, the Team looked to sell stocks when they stopped exhibiting these characteristics. The Team used a disciplined quantitative ranking methodology to identify attractive stocks in each sector. This screening process was combined with bottom-up fundamental research, as the Team rigorously researched the companies identified as attractive to determine their underlying value and potential for future earnings growth.
| 2 | JPMORGAN INSURANCE TRUST | DECEMBER 31, 2011 | ||||
Table of Contents
| TOP TEN EQUITY HOLDINGS OF THE PORTFOLIO*** | ||||||||
| 1. | Lorillard, Inc. | 2.3 | % | |||||
| 2. | Macy’s, Inc. | 2.2 | ||||||
| 3. | PPG Industries, Inc. | 2.0 | ||||||
| 4. | Discover Financial Services | 1.9 | ||||||
| 5. | Cooper Cos., Inc. (The) | 1.7 | ||||||
| 6. | Campbell Soup Co. | 1.5 | ||||||
| 7. | Parker Hannifin Corp. | 1.5 | ||||||
| 8. | CBS Corp. (Non-Voting), Class B | 1.4 | ||||||
| 9. | Alliance Data Systems Corp. | 1.4 | ||||||
| 10. | Wyndham Worldwide Corp. | 1.3 | ||||||
PORTFOLIO COMPOSITION BY SECTOR*** | ||||
| Financials | 18.2 | % | ||
| Consumer Discretionary | 15.7 | |||
| Information Technology | 13.9 | |||
| Industrials | 11.0 | |||
| Health Care | 9.1 | |||
| Utilities | 8.2 | |||
| Materials | 7.0 | |||
| Energy | 6.6 | |||
| Consumer Staples | 6.4 | |||
| Telecommunication Services | 1.0 | |||
| U.S. Treasury Obligation | 0.2 | |||
| Short-Term Investment | 2.7 | |||
| * | The return shown is based on net asset value calculated for shareholder transactions and may differ from the return shown in the financial highlights, which reflects adjustments made to the net asset value in accordance with accounting principles generally accepted in the United States of America. |
| ** | The advisor seeks to achieve the Portfolio’s objective. There can be no guarantee it will be achieved. |
| *** | Percentages indicated are based upon total investments (excluding Investments of Cash Collateral for Securities on Loan) as of December 31, 2011. The Portfolio’s composition is subject to change. |
| DECEMBER 31, 2011 | JPMORGAN INSURANCE TRUST | 3 | ||||||
Table of Contents
JPMorgan Insurance Trust Intrepid Mid Cap Portfolio
PORTFOLIO COMMENTARY
TWELVE MONTHS ENDED DECEMBER 31, 2011 (Unaudited) (continued)
AVERAGE ANNUAL TOTAL RETURNS AS OF DECEMBER 31, 2011 | ||||||||||||||||
| INCEPTION DATE OF CLASS | 1 YEAR | 5 YEAR | 10 YEAR | |||||||||||||
CLASS 1 SHARES | 3/30/95 | (1.52 | )% | 0.10 | % | 5.12 | % | |||||||||
CLASS 2 SHARES | 8/16/06 | (1.79 | ) | (0.15 | ) | 4.98 | ||||||||||
TEN YEAR PERFORMANCE (12/31/01 TO 12/31/11)
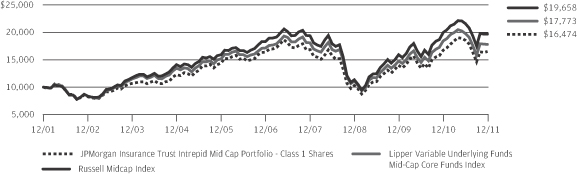
Source: Lipper, Inc. The performance quoted is past performance and is not a guarantee of future results. Mutual funds are subject to certain market risks. Investment returns and principal value of an investment will fluctuate so that an investor’s shares, when redeemed, may be worth more or less than their original cost. Current performance may be higher or lower than the performance data shown. For up-to-date month-end performance information please call 1-800-480-4111.
Returns for the Class 2 Shares prior to their inception date are based on the performance of Class 1 Shares. The actual returns of Class 2 Shares would have been lower than shown because Class 2 Shares have higher expenses than Class 1 Shares.
The graph illustrates comparative performance for $10,000 invested in Class 1 Shares of the JPMorgan Insurance Trust Intrepid Mid Cap Portfolio, the Russell Midcap Index and the Lipper Variable Underlying Funds Mid-Cap Core Funds Index from December 31, 2001 to December 31, 2011. The performance of the Portfolio assumes reinvestment of all dividends and capital gains, if any. The performance of the Russell Midcap Index does not reflect the deduction of expenses associated with a mutual fund and has been adjusted to reflect reinvestment of all dividends and capital gains of the securities included in the
benchmark. The performance of the Lipper Variable Underlying Funds Mid-Cap Core Funds Index includes expenses associated with a mutual fund, such as investment management fees. These expenses are not identical to the expenses charged by the Portfolio. The Russell Midcap Index is an unmanaged index which measures the performance of the 800 smallest companies in the Russell 1000 Index. The Lipper Variable Underlying Funds Mid-Cap Core Funds Index is an index based on the total returns of certain mutual funds within the Portfolio’s designated category as determined by Lipper, Inc. Investors cannot invest directly in an index.
The performance does not reflect any charges imposed by the Policies or Eligible Plans. If these charges were included, the returns would be lower than shown. Performance may reflect the waiver of the Portfolio’s fees and reimbursement of expenses for certain periods since the inception date. Without these waivers and reimbursements performance would have been lower.
The returns shown are based on net asset values calculated for shareholder transactions and may differ from the returns shown in the financial highlights, which reflect adjustments made to the net asset values in accordance with accounting principles generally accepted in the United States of America.
| 4 | JPMORGAN INSURANCE TRUST | DECEMBER 31, 2011 | ||||
Table of Contents
JPMorgan Insurance Trust Intrepid Mid Cap Portfolio
SCHEDULE OF PORTFOLIO INVESTMENTS
AS OF DECEMBER 31, 2011
| SHARES | SECURITY DESCRIPTION | VALUE($) | ||||||
| Common Stocks — 98.0% |
| ||||||
Consumer Discretionary — 15.8% | ||||||||
Auto Components — 1.0% |
| |||||||
| 3,500 | Autoliv, Inc., (Sweden) | 187,215 | ||||||
| 800 | Lear Corp. | 31,840 | ||||||
| 3,000 | TRW Automotive Holdings Corp. (a) | 97,800 | ||||||
|
| |||||||
| 316,855 | ||||||||
|
| |||||||
Distributors — 0.1% |
| |||||||
| 300 | Genuine Parts Co. | 18,360 | ||||||
|
| |||||||
Diversified Consumer Services — 2.4% |
| |||||||
| 2,400 | Apollo Group, Inc., Class A (a) | 129,288 | ||||||
| 1,300 | Career Education Corp. (a) | 10,361 | ||||||
| 14,050 | H&R Block, Inc. | 229,437 | ||||||
| 2,200 | ITT Educational Services, Inc. (a) (c) | 125,158 | ||||||
| 24,400 | Service Corp. International | 259,860 | ||||||
|
| |||||||
| 754,104 | ||||||||
|
| |||||||
Hotels, Restaurants & Leisure — 2.0% |
| |||||||
| 6,800 | Brinker International, Inc. | 181,968 | ||||||
| 11,200 | Wyndham Worldwide Corp. | 423,696 | ||||||
| 200 | Wynn Resorts Ltd. | 22,098 | ||||||
|
| |||||||
| 627,762 | ||||||||
|
| |||||||
Household Durables — 1.3% |
| |||||||
| 2,150 | Garmin Ltd., (Switzerland) | 85,591 | ||||||
| 6,050 | Leggett & Platt, Inc. | 139,392 | ||||||
| 1,700 | Tempur-Pedic International, Inc. (a) | 89,301 | ||||||
| 1,800 | Tupperware Brands Corp. | 100,746 | ||||||
|
| |||||||
| 415,030 | ||||||||
|
| |||||||
Internet & Catalog Retail — 0.5% |
| |||||||
| 3,500 | Groupon, Inc. (a) | 72,205 | ||||||
| 200 | priceline.com, Inc. (a) | 93,542 | ||||||
|
| |||||||
| 165,747 | ||||||||
|
| |||||||
Leisure Equipment & Products — 0.1% |
| |||||||
| 1,500 | Mattel, Inc. | 41,640 | ||||||
|
| |||||||
Media — 1.9% |
| |||||||
| 16,300 | CBS Corp. (Non-Voting), Class B | 442,382 | ||||||
| 5,850 | DISH Network Corp., Class A | 166,608 | ||||||
|
| |||||||
| 608,990 | ||||||||
|
| |||||||
Multiline Retail — 2.7% |
| |||||||
| 250 | Big Lots, Inc. (a) | 9,440 | ||||||
| 2,500 | Dillard’s, Inc., Class A | 112,200 | ||||||
| 22,300 | Macy’s, Inc. | 717,614 | ||||||
|
| |||||||
| 839,254 | ||||||||
|
| |||||||
Specialty Retail — 3.2% |
| |||||||
| 800 | AutoZone, Inc. (a) | 259,976 | ||||||
| SHARES | SECURITY DESCRIPTION | VALUE($) | ||||||
Specialty Retail — Continued |
| |||||||
| 6,800 | Best Buy Co., Inc. | 158,916 | ||||||
| 14,300 | GameStop Corp., Class A (a) (c) | 345,059 | ||||||
| 1,200 | Limited Brands, Inc. | 48,420 | ||||||
| 1,700 | TJX Cos., Inc. | 109,735 | ||||||
| 3,100 | Urban Outfitters, Inc. (a) | 85,436 | ||||||
|
| |||||||
| 1,007,542 | ||||||||
|
| |||||||
Textiles, Apparel & Luxury Goods — 0.6% |
| |||||||
| 7,600 | Michael Kors Holdings Ltd., (Hong Kong) (a) | 207,100 | ||||||
|
| |||||||
Total Consumer Discretionary | 5,002,384 | |||||||
|
| |||||||
Consumer Staples — 6.4% |
| |||||||
Beverages — 1.3% |
| |||||||
| 900 | Coca-Cola Enterprises, Inc. | 23,202 | ||||||
| 18,700 | Constellation Brands, Inc., Class A (a) | 386,529 | ||||||
|
| |||||||
| 409,731 | ||||||||
|
| |||||||
Food & Staples Retailing — 0.5% |
| |||||||
| 21,400 | SUPERVALU, Inc. (c) | 173,768 | ||||||
|
| |||||||
Food Products — 2.3% |
| |||||||
| 14,400 | Campbell Soup Co. | 478,656 | ||||||
| 600 | Corn Products International, Inc. | 31,554 | ||||||
| 4,100 | Smithfield Foods, Inc. (a) | 99,548 | ||||||
| 6,100 | Tyson Foods, Inc., Class A | 125,904 | ||||||
|
| |||||||
| 735,662 | ||||||||
|
| |||||||
Tobacco — 2.3% |
| |||||||
| 6,300 | Lorillard, Inc. | 718,200 | ||||||
|
| |||||||
Total Consumer Staples | 2,037,361 | |||||||
|
| |||||||
Energy — 6.7% |
| |||||||
Energy Equipment & Services — 2.5% |
| |||||||
| 701 | Baker Hughes, Inc. | 34,097 | ||||||
| 700 | Core Laboratories N.V., (Netherlands) | 79,765 | ||||||
| 1,200 | Dresser-Rand Group, Inc. (a) | 59,892 | ||||||
| 1,468 | National Oilwell Varco, Inc. | 99,809 | ||||||
| 5,200 | Oil States International, Inc. (a) | 397,124 | ||||||
| 300 | SEACOR Holdings, Inc. (a) | 26,688 | ||||||
| 1,700 | Unit Corp. (a) | 78,880 | ||||||
|
| |||||||
| 776,255 | ||||||||
|
| |||||||
Oil, Gas & Consumable Fuels — 4.2% |
| |||||||
| 3,100 | Cimarex Energy Co. | 191,890 | ||||||
| 7,295 | Energen Corp. | 364,750 | ||||||
| 5,600 | HollyFrontier Corp. | 131,040 | ||||||
| 2,500 | Laredo Petroleum Holdings, Inc. (a) | 55,750 | ||||||
| 1,400 | Murphy Oil Corp. | 78,036 | ||||||
| 3,400 | Newfield Exploration Co. (a) | 128,282 | ||||||
| 1,020 | Noble Energy, Inc. | 96,278 | ||||||
SEE NOTES TO FINANCIAL STATEMENTS.
| DECEMBER 31, 2011 | JPMORGAN INSURANCE TRUST | 5 | ||||||
Table of Contents
JPMorgan Insurance Trust Intrepid Mid Cap Portfolio
SCHEDULE OF PORTFOLIO INVESTMENTS
AS OF DECEMBER 31, 2011 (continued)
| SHARES | SECURITY DESCRIPTION | VALUE($) | ||||||
| Common Stocks — Continued |
| ||||||
Oil, Gas & Consumable Fuels — Continued |
| |||||||
| 2,400 | Southern Union Co. | 101,064 | ||||||
| 1,700 | Sunoco, Inc. | 69,734 | ||||||
| 5,300 | Valero Energy Corp. | 111,565 | ||||||
|
| |||||||
| 1,328,389 | ||||||||
|
| |||||||
Total Energy | 2,104,644 | |||||||
|
| |||||||
Financials — 18.4% |
| |||||||
Capital Markets — 1.1% |
| |||||||
| 2,500 | Affiliated Managers Group, Inc. (a) | 239,875 | ||||||
| 15,000 | American Capital Ltd. (a) | 100,950 | ||||||
|
| |||||||
| 340,825 | ||||||||
|
| |||||||
Commercial Banks — 1.9% |
| |||||||
| 1,550 | BOK Financial Corp. (c) | 85,142 | ||||||
| 600 | City National Corp. | 26,508 | ||||||
| 300 | Cullen/Frost Bankers, Inc. | 15,873 | ||||||
| 7,000 | Fifth Third Bancorp | 89,040 | ||||||
| 8,400 | Huntington Bancshares, Inc. | 46,116 | ||||||
| 18,300 | KeyCorp | 140,727 | ||||||
| 800 | M&T Bank Corp. | 61,072 | ||||||
| 12,800 | TCF Financial Corp. (c) | 132,096 | ||||||
|
| |||||||
| 596,574 | ||||||||
|
| |||||||
Consumer Finance — 1.9% |
| |||||||
| 25,100 | Discover Financial Services | 602,400 | ||||||
|
| |||||||
Diversified Financial Services — 0.8% |
| |||||||
| 10,650 | NASDAQ OMX Group, Inc. (The) (a) | 261,031 | ||||||
|
| |||||||
Insurance — 5.1% |
| |||||||
| 2,350 | Allied World Assurance Co. Holdings AG, (Switzerland) | 147,885 | ||||||
| 10,050 | American Financial Group, Inc. | 370,745 | ||||||
| 4,850 | Arch Capital Group Ltd., (Bermuda) (a) | 180,566 | ||||||
| 2,100 | Assurant, Inc. | 86,226 | ||||||
| 10,300 | Assured Guaranty Ltd., (Bermuda) | 135,342 | ||||||
| 1,450 | Axis Capital Holdings Ltd., (Bermuda) | 46,342 | ||||||
| 600 | Everest Re Group Ltd., (Bermuda) | 50,454 | ||||||
| 4,000 | Hartford Financial Services Group, Inc. | 65,000 | ||||||
| 2,800 | Lincoln National Corp. | 54,376 | ||||||
| 3,700 | Principal Financial Group, Inc. | 91,020 | ||||||
| 3,600 | Protective Life Corp. | 81,216 | ||||||
| 1,000 | Reinsurance Group of America, Inc. | 52,250 | ||||||
| 1,300 | Torchmark Corp. | 56,407 | ||||||
| 8,700 | Unum Group | 183,309 | ||||||
|
| |||||||
| 1,601,138 | ||||||||
|
| |||||||
Real Estate Investment Trusts (REITs) — 7.1% |
| |||||||
| 19,400 | Annaly Capital Management, Inc. | 309,624 | ||||||
| SHARES | SECURITY DESCRIPTION | VALUE($) | ||||||
Real Estate Investment Trusts (REITs) — Continued |
| |||||||
| 6,900 | Apartment Investment & Management Co., Class A | 158,079 | ||||||
| 6,600 | Brandywine Realty Trust | 62,700 | ||||||
| 1,300 | Camden Property Trust | 80,912 | ||||||
| 2,000 | Chimera Investment Corp. | 5,020 | ||||||
| 4,025 | CommonWealth REIT | 66,976 | ||||||
| 4,400 | DDR Corp. | 53,548 | ||||||
| 3,800 | Douglas Emmett, Inc. (m) | 69,312 | ||||||
| 25,700 | Duke Realty Corp. | 309,685 | ||||||
| 1,800 | Equity Residential | 102,654 | ||||||
| 3,800 | Health Care REIT, Inc. | 207,214 | ||||||
| 16,810 | Hospitality Properties Trust | 386,294 | ||||||
| 2,250 | Mack-Cali Realty Corp. | 60,052 | ||||||
| 500 | SL Green Realty Corp. | 33,320 | ||||||
| 2,700 | Taubman Centers, Inc. | 167,670 | ||||||
| 3,322 | Ventas, Inc. | 183,142 | ||||||
|
| |||||||
| 2,256,202 | ||||||||
|
| |||||||
Real Estate Management & Development — 0.1% |
| |||||||
| 1,900 | Forest City Enterprises, Inc., Class A (a) | 22,458 | ||||||
|
| |||||||
Thrifts & Mortgage Finance — 0.4% |
| |||||||
| 10,000 | New York Community Bancorp, Inc. | 123,700 | ||||||
|
| |||||||
Total Financials | 5,804,328 | |||||||
|
| |||||||
Health Care — 9.2% |
| |||||||
Biotechnology — 0.9% |
| |||||||
| 1,100 | Pharmasset, Inc. (a) | 141,020 | ||||||
| 2,700 | United Therapeutics Corp. (a) | 127,575 | ||||||
|
| |||||||
| 268,595 | ||||||||
|
| |||||||
Health Care Equipment & Supplies — 2.4% |
| |||||||
| 7,600 | Cooper Cos., Inc. (The) | 535,952 | ||||||
| 3,900 | Hologic, Inc. (a) | 68,289 | ||||||
| 3,100 | Zimmer Holdings, Inc. (a) | 165,602 | ||||||
|
| |||||||
| 769,843 | ||||||||
|
| |||||||
Health Care Providers & Services — 3.7% |
| |||||||
| 2,410 | Aetna, Inc. | 101,678 | ||||||
| 10,300 | AmerisourceBergen Corp. | 383,057 | ||||||
| 4,600 | Community Health Systems, Inc. (a) | 80,270 | ||||||
| 3,900 | Humana, Inc. | 341,679 | ||||||
| 6,800 | LifePoint Hospitals, Inc. (a) | 252,620 | ||||||
|
| |||||||
| 1,159,304 | ||||||||
|
| |||||||
Life Sciences Tools & Services — 0.7% |
| |||||||
| 1,500 | Agilent Technologies, Inc. (a) | 52,395 | ||||||
| 4,100 | Life Technologies Corp. (a) | 159,531 | ||||||
|
| |||||||
| 211,926 | ||||||||
|
| |||||||
SEE NOTES TO FINANCIAL STATEMENTS.
| 6 | JPMORGAN INSURANCE TRUST | DECEMBER 31, 2011 | ||||
Table of Contents
| SHARES | SECURITY DESCRIPTION | VALUE($) | ||||||
| Common Stocks — Continued |
| ||||||
Pharmaceuticals — 1.5% | ||||||||
| 7,850 | Endo Pharmaceuticals Holdings, Inc. (a) | 271,060 | ||||||
| 3,900 | Mylan, Inc. (a) | 83,694 | ||||||
| 8,900 | Warner Chilcott plc, (Ireland), Class A (a) | 134,657 | ||||||
|
| |||||||
| 489,411 | ||||||||
|
| |||||||
Total Health Care | 2,899,079 | |||||||
|
| |||||||
Industrials — 11.1% | ||||||||
Aerospace & Defense — 1.5% | ||||||||
| 700 | Alliant Techsystems, Inc. | 40,012 | ||||||
| 900 | Exelis, Inc. | 8,145 | ||||||
| 266 | Huntington Ingalls Industries, Inc. (a) | 8,320 | ||||||
| 5,250 | L-3 Communications Holdings, Inc. | 350,070 | ||||||
| 1,400 | Northrop Grumman Corp. | 81,872 | ||||||
|
| |||||||
| 488,419 | ||||||||
|
| |||||||
Airlines — 0.9% | ||||||||
| 1,800 | Copa Holdings S.A., (Panama), Class A | 105,606 | ||||||
| 9,200 | United Continental Holdings, Inc. (a) | 173,604 | ||||||
|
| |||||||
| 279,210 | ||||||||
|
| |||||||
Commercial Services & Supplies — 0.6% | ||||||||
| 2,400 | KAR Auction Services, Inc. (a) | 32,400 | ||||||
| 1,800 | Pitney Bowes, Inc. | 33,372 | ||||||
| 8,730 | R.R. Donnelley & Sons Co. | 125,974 | ||||||
|
| |||||||
| 191,746 | ||||||||
|
| |||||||
Construction & Engineering — 2.1% | ||||||||
| 3,800 | Chicago Bridge & Iron Co. N.V., (Netherlands) | 143,640 | ||||||
| 13,900 | KBR, Inc. | 387,393 | ||||||
| 4,100 | URS Corp. (a) | 143,992 | ||||||
|
| |||||||
| 675,025 | ||||||||
|
| |||||||
Electrical Equipment — 1.4% | ||||||||
| 4,250 | Hubbell, Inc., Class B | 284,155 | ||||||
| 2,625 | Thomas & Betts Corp. (a) | 143,325 | ||||||
|
| |||||||
| 427,480 | ||||||||
|
| |||||||
Machinery — 3.5% | ||||||||
| 4,400 | AGCO Corp. (a) | 189,068 | ||||||
| 450 | ITT Corp. | 8,699 | ||||||
| 5,800 | Navistar International Corp. (a) | 219,704 | ||||||
| 6,145 | Parker Hannifin Corp. | 468,556 | ||||||
| 5,200 | Timken Co. | 201,292 | ||||||
| 900 | Xylem, Inc. | 23,121 | ||||||
|
| |||||||
| 1,110,440 | ||||||||
|
| |||||||
Marine — 0.3% | ||||||||
| 1,500 | Kirby Corp. (a) | 98,760 | ||||||
|
| |||||||
| SHARES | SECURITY DESCRIPTION | VALUE($) | ||||||
Professional Services — 0.1% |
| |||||||
| 300 | Dun & Bradstreet Corp. (The) | 22,449 | ||||||
|
| |||||||
Road & Rail — 0.7% |
| |||||||
| 6,400 | CSX Corp. | 134,784 | ||||||
| 1,400 | Ryder System, Inc. | 74,396 | ||||||
|
| |||||||
| 209,180 | ||||||||
|
| |||||||
Total Industrials | 3,502,709 | |||||||
|
| |||||||
Information Technology — 14.1% |
| |||||||
Communications Equipment — 0.6% |
| |||||||
| 4,100 | Brocade Communications Systems, Inc. (a) | 21,279 | ||||||
| 4,300 | Harris Corp. | 154,972 | ||||||
|
| |||||||
| 176,251 | ||||||||
|
| |||||||
Computers & Peripherals — 1.9% |
| |||||||
| 4,900 | Lexmark International, Inc., Class A | 162,043 | ||||||
| 8,300 | NCR Corp. (a) | 136,618 | ||||||
| 2,150 | QLogic Corp. (a) | 32,250 | ||||||
| 2,100 | SanDisk Corp. (a) | 103,341 | ||||||
| 5,750 | Western Digital Corp. (a) | 177,963 | ||||||
|
| |||||||
| 612,215 | ||||||||
|
| |||||||
Electronic Equipment, Instruments & Components — 1.5% |
| |||||||
| 4,900 | Arrow Electronics, Inc. (a) | 183,309 | ||||||
| 6,700 | Avnet, Inc. (a) | 208,303 | ||||||
| 700 | Tech Data Corp. (a) | 34,587 | ||||||
| 5,300 | Vishay Intertechnology, Inc. (a) | 47,647 | ||||||
|
| |||||||
| 473,846 | ||||||||
|
| |||||||
Internet Software & Services — 1.4% |
| |||||||
| 6,400 | IAC/InterActiveCorp. | 272,640 | ||||||
| 2,800 | LinkedIn Corp., Class A (a) | 176,428 | ||||||
|
| |||||||
| 449,068 | ||||||||
|
| |||||||
IT Services — 3.5% |
| |||||||
| 4,150 | Alliance Data Systems Corp. (a) (c) | 430,936 | ||||||
| 1,000 | Amdocs Ltd. (a) | 28,530 | ||||||
| 4,000 | Broadridge Financial Solutions, Inc. | 90,200 | ||||||
| 4,500 | Computer Sciences Corp. | 106,650 | ||||||
| 1,700 | DST Systems, Inc. | 77,384 | ||||||
| 4,800 | Fidelity National Information Services, Inc. | 127,632 | ||||||
| 4,200 | Lender Processing Services, Inc. | 63,294 | ||||||
| 13,800 | SAIC, Inc. (a) | 169,602 | ||||||
|
| |||||||
| 1,094,228 | ||||||||
|
| |||||||
Office Electronics — 0.6% |
| |||||||
| 23,400 | Xerox Corp. | 186,264 | ||||||
|
| |||||||
SEE NOTES TO FINANCIAL STATEMENTS.
| DECEMBER 31, 2011 | JPMORGAN INSURANCE TRUST | 7 | ||||||
Table of Contents
JPMorgan Insurance Trust Intrepid Mid Cap Portfolio
SCHEDULE OF PORTFOLIO INVESTMENTS
AS OF DECEMBER 31, 2011 (continued)
| SHARES | SECURITY DESCRIPTION | VALUE($) | ||||||
| Common Stocks — Continued |
| ||||||
Semiconductors & Semiconductor Equipment — 1.9% |
| |||||||
| 1,600 | Analog Devices, Inc. | 57,248 | ||||||
| 2,100 | Fairchild Semiconductor International, Inc. (a) | 25,284 | ||||||
| 900 | Linear Technology Corp. | 27,027 | ||||||
| 22,000 | LSI Corp. (a) | 130,900 | ||||||
| 8,700 | Marvell Technology Group Ltd., (Bermuda) (a) | 120,495 | ||||||
| 16,400 | Micron Technology, Inc. (a) | 103,156 | ||||||
| 2,800 | Teradyne, Inc. (a) | 38,164 | ||||||
| 3,050 | Xilinx, Inc. | 97,783 | ||||||
|
| |||||||
| 600,057 | ||||||||
|
| |||||||
Software — 2.7% |
| |||||||
| 4,380 | BMC Software, Inc. (a) | 143,576 | ||||||
| 18,400 | CA, Inc. | 371,956 | ||||||
| 1,100 | Rovi Corp. (a) | 27,038 | ||||||
| 6,400 | Symantec Corp. (a) | 100,160 | ||||||
| 2,500 | Synopsys, Inc. (a) | 68,000 | ||||||
| 15,800 | Zynga, Inc., Class A (a) | 148,678 | ||||||
|
| |||||||
| 859,408 | ||||||||
|
| |||||||
Total Information Technology | 4,451,337 | |||||||
|
| |||||||
Materials — 7.0% |
| |||||||
Chemicals — 3.4% |
| |||||||
| 1,400 | Ashland, Inc. | 80,024 | ||||||
| 1,500 | CF Industries Holdings, Inc. | 217,470 | ||||||
| 7,500 | PPG Industries, Inc. | 626,175 | ||||||
| 3,700 | Valspar Corp. | 144,189 | ||||||
|
| |||||||
| 1,067,858 | ||||||||
|
| |||||||
Containers & Packaging — 0.6% |
| |||||||
| 3,400 | Crown Holdings, Inc. (a) | 114,172 | ||||||
| 1,200 | Rock-Tenn Co., Class A | 69,240 | ||||||
|
| |||||||
| 183,412 | ||||||||
|
| |||||||
Metals & Mining — 2.0% |
| |||||||
| 3,550 | Cliffs Natural Resources, Inc. | 221,343 | ||||||
| 1,900 | Reliance Steel & Aluminum Co. | 92,511 | ||||||
| 1,300 | Royal Gold, Inc. | 87,659 | ||||||
| 900 | Schnitzer Steel Industries, Inc., Class A | 38,052 | ||||||
| 3,350 | Walter Energy, Inc. | 202,876 | ||||||
|
| |||||||
| 642,441 | ||||||||
|
| |||||||
Paper & Forest Products — 1.0% |
| |||||||
| 1,900 | Domtar Corp., (Canada) | 151,924 | ||||||
| 6,100 | International Paper Co. | 180,560 | ||||||
|
| |||||||
| 332,484 | ||||||||
|
| |||||||
Total Materials | 2,226,195 | |||||||
|
| |||||||
| SHARES | SECURITY DESCRIPTION | VALUE($) | ||||||
Telecommunication Services — 1.0% |
| |||||||
Diversified Telecommunication Services — 0.6% |
| |||||||
| 20,600 | Frontier Communications Corp. | 106,090 | ||||||
| 7,150 | Windstream Corp. | 83,941 | ||||||
|
| |||||||
| 190,031 | ||||||||
|
| |||||||
Wireless Telecommunication Services — 0.4% |
| |||||||
| 4,600 | Telephone & Data Systems, Inc. | 119,094 | ||||||
|
| |||||||
Total Telecommunication Services | 309,125 | |||||||
|
| |||||||
Utilities — 8.3% |
| |||||||
Electric Utilities — 0.7% |
| |||||||
| 1,700 | Entergy Corp. | 124,185 | ||||||
| 2,900 | NV Energy, Inc. | 47,415 | ||||||
| 1,200 | Pinnacle West Capital Corp. | 57,816 | ||||||
|
| |||||||
| 229,416 | ||||||||
|
| |||||||
Gas Utilities — 1.1% |
| |||||||
| 1,400 | AGL Resources, Inc. | 59,164 | ||||||
| 4,400 | Questar Corp. | 87,384 | ||||||
| 6,850 | UGI Corp. | 201,390 | ||||||
|
| |||||||
| 347,938 | ||||||||
|
| |||||||
Independent Power Producers & Energy Traders — 0.6% |
| |||||||
| 11,300 | AES Corp. (The) (a) | 133,792 | ||||||
| 1,800 | Constellation Energy Group, Inc. | 71,406 | ||||||
|
| |||||||
| 205,198 | ||||||||
|
| |||||||
Multi-Utilities — 5.9% |
| |||||||
| 3,250 | Alliant Energy Corp. | 143,357 | ||||||
| 4,600 | Ameren Corp. | 152,398 | ||||||
| 14,130 | CenterPoint Energy, Inc. | 283,872 | ||||||
| 6,100 | CMS Energy Corp. (c) | 134,688 | ||||||
| 3,000 | Consolidated Edison, Inc. | 186,090 | ||||||
| 5,200 | DTE Energy Co. | 283,140 | ||||||
| 900 | Integrys Energy Group, Inc. | 48,762 | ||||||
| 4,050 | MDU Resources Group, Inc. | 86,913 | ||||||
| 6,100 | Sempra Energy | 335,500 | ||||||
| 10,300 | TECO Energy, Inc. | 197,142 | ||||||
|
| |||||||
| 1,851,862 | ||||||||
|
| |||||||
Total Utilities | 2,634,414 | |||||||
|
| |||||||
Total Common Stocks | 30,971,576 | |||||||
|
| |||||||
| PRINCIPAL AMOUNT($) | ||||||||
| U.S. Treasury Obligation — 0.2% |
| ||||||
| 60,000 | U.S. Treasury Note, 0.500%, 11/30/12 (k) (Cost $60,189) | 60,192 | ||||||
|
| |||||||
SEE NOTES TO FINANCIAL STATEMENTS.
| 8 | JPMORGAN INSURANCE TRUST | DECEMBER 31, 2011 | ||||
Table of Contents
| SHARES | SECURITY DESCRIPTION | VALUE($) | ||||||
| Short-Term Investment — 2.8% |
| ||||||
Investment Company — 2.8% | ||||||||
| 874,342 | JPMorgan Liquid Assets Money Market Fund, Institutional Class Shares, 0.110% (b) (l) (m) | 874,342 | ||||||
|
| |||||||
| Investment of Cash Collateral for Securities on Loan — 3.1% |
| ||||||
Investment Company — 3.1% | ||||||||
| 974,674 | JPMorgan Prime Money Market Fund, Capital Shares, 0.120% (b) (l) | 974,674 | ||||||
|
| |||||||
Total Investments — 104.1% | 32,880,784 | |||||||
Liabilities in Excess of | (1,282,777 | ) | ||||||
|
| |||||||
NET ASSETS — 100.0% | $ | 31,598,007 | ||||||
|
| |||||||
Percentages indicated are based on net assets.
| Futures Contracts | ||||||||||||||||
| NUMBER OF CONTRACTS | DESCRIPTION | EXPIRATION DATE | NOTIONAL VALUE AT 12/31/11 | UNREALIZED APPRECIATION (DEPRECIATION) | ||||||||||||
Long Futures Outstanding | ||||||||||||||||
| 4 | S&P Mid Cap 400 | 03/16/12 | $ | 350,920 | $ | 1,801 | ||||||||||
|
| |||||||||||||||
NOTES TO SCHEDULE OF PORTFOLIO INVESTMENTS:
| (a) | — Non-income producing security. | |
| (b) | — Investment in affiliate. Money market fund registered under the Investment Company Act of 1940, as amended, and advised by J.P. Morgan Investment Management Inc. | |
| (c) | — Security, or a portion of the security, has been delivered to a counterparty as part of a security lending transaction. | |
| (k) | — All or a portion of this security is deposited with the broker as collateral for futures or with brokers as initial margin for futures contracts. |
| (l) | — The rate shown is the current yield as of December 31, 2011. | |
(m) | — All or a portion of this security is reserved and/or pledged with the custodian for current or potential holdings of futures, swaps, options, TBAs, when-issued securities, delayed delivery securities, reverse repurchase agreements, unfunded commitments and/or forward foreign currency exchange contracts. |
SEE NOTES TO FINANCIAL STATEMENTS.
| DECEMBER 31, 2011 | JPMORGAN INSURANCE TRUST | 9 | ||||||
Table of Contents
STATEMENT OF ASSETS AND LIABILITIES
AS OF DECEMBER 31, 2011
Intrepid Mid Cap Portfolio | ||||
ASSETS: | ||||
Investments in non-affiliates, at value | $ | 31,031,768 | ||
Investments in affiliates, at value | 1,849,016 | |||
|
| |||
Total investment securities, at value | 32,880,784 | |||
Receivables: | ||||
Investment securities sold | 60,511 | |||
Interest and dividends from non-affiliates | 53,146 | |||
Dividends from affiliates | 73 | |||
Securities lending income | 530 | |||
|
| |||
Total Assets | 32,995,044 | |||
|
| |||
LIABILITIES: | ||||
Payables: | ||||
Investment securities purchased | 329,470 | |||
Collateral for securities lending program | 974,674 | |||
Portfolio shares redeemed | 10,784 | |||
Variation margin on futures contracts | 1,292 | |||
Accrued liabilities: | ||||
Investment advisory fees | 13,312 | |||
Administration fees | 2,359 | |||
Distribution fees | 3 | |||
Custodian and accounting fees | 7,981 | |||
Trustees’ and Chief Compliance Officer’s fees | 117 | |||
Other | 57,045 | |||
|
| |||
Total Liabilities | 1,397,037 | |||
|
| |||
Net Assets | $ | 31,598,007 | ||
|
| |||
NET ASSETS: | ||||
Paid in capital | $ | 32,886,245 | ||
Accumulated undistributed net investment income | 265,103 | |||
Accumulated net realized gains (losses) | (3,876,607 | ) | ||
Net unrealized appreciation (depreciation) | 2,323,266 | |||
|
| |||
Total Net Assets | $ | 31,598,007 | ||
|
| |||
Net Assets: | ||||
Class 1 | $ | 31,581,775 | ||
Class 2 | 16,232 | |||
|
| |||
Total | $ | 31,598,007 | ||
|
| |||
Outstanding units of beneficial interest (shares) | ||||
(unlimited number of shares authorized, no par value): | ||||
Class 1 | 2,069,490 | |||
Class 2 | 1,065 | |||
Net Asset Value, offering and redemption price per share (a): | ||||
Class 1 | $ | 15.26 | ||
Class 2 | 15.23 | |||
|
| |||
Cost of investments in non-affiliates | $ | 28,710,303 | ||
Cost of investments in affiliates | 1,849,016 | |||
Value of securities on loan | 946,894 | |||
| (a) | Per share amounts may not recalculate due to rounding of net assets and/or shares outstanding. |
SEE NOTES TO FINANCIAL STATEMENTS.
| 10 | JPMORGAN INSURANCE TRUST | DECEMBER 31, 2011 | ||||
Table of Contents
STATEMENT OF OPERATIONS
FOR THE YEAR ENDED DECEMBER 31, 2011
| Intrepid Mid Cap Portfolio | ||||
INVESTMENT INCOME: | ||||
Interest income from non-affiliates | $ | 307 | ||
Dividend income from non-affiliates | 570,190 | |||
Dividend income from affiliates | 573 | |||
Income from securities lending (net) | 13,214 | |||
|
| |||
Total investment income | 584,284 | |||
|
| |||
EXPENSES: | ||||
Investment advisory fees | 230,197 | |||
Administration fees | 31,357 | |||
Distribution fees — Class 2 | 42 | |||
Custodian and accounting fees | 23,139 | |||
Professional fees | 43,725 | |||
Trustees’ and Chief Compliance Officer’s fees | 330 | |||
Printing and mailing costs | 42,041 | |||
Transfer agent fees | 4,091 | |||
Other | 7,283 | |||
|
| |||
Total expenses | 382,205 | |||
|
| |||
Less amounts waived | (64,487 | ) | ||
Less earnings credits | (3 | ) | ||
|
| |||
Net expenses | 317,715 | |||
|
| |||
Net investment income (loss) | 266,569 | |||
|
| |||
REALIZED/UNREALIZED GAINS (LOSSES): | ||||
Net realized gain (loss) on transactions from: | ||||
Investments in non-affiliates | 3,738,670 | |||
Futures | (26,171 | ) | ||
|
| |||
Net realized gain (loss) | 3,712,499 | |||
|
| |||
Change in net unrealized appreciation (depreciation) of: | ||||
Investments in non-affiliates | (4,101,467 | ) | ||
Futures | 3,273 | |||
|
| |||
Change in net unrealized appreciation (depreciation) | (4,098,194 | ) | ||
|
| |||
Net realized/unrealized gains (losses) | (385,695 | ) | ||
|
| |||
Change in net assets resulting from operations | $ | (119,126 | ) | |
|
| |||
SEE NOTES TO FINANCIAL STATEMENTS.
| DECEMBER 31, 2011 | JPMORGAN INSURANCE TRUST | 11 | ||||||
Table of Contents
STATEMENTS OF CHANGES IN NET ASSETS
FOR THE PERIODS INDICATED
| Intrepid Mid Cap Portfolio | ||||||||
| Year Ended 12/31/2011 | Year Ended 12/31/2010 | |||||||
CHANGE IN NET ASSETS RESULTING FROM OPERATIONS: | ||||||||
Net investment income (loss) | $ | 266,569 | $ | 318,540 | ||||
Net realized gain (loss) | 3,712,499 | 2,524,155 | ||||||
Change in net unrealized appreciation (depreciation) | (4,098,194 | ) | 4,250,790 | |||||
|
|
|
| |||||
Change in net assets resulting from operations | (119,126 | ) | 7,093,485 | |||||
|
|
|
| |||||
DISTRIBUTIONS TO SHAREHOLDERS: | ||||||||
Class 1 | ||||||||
From net investment income | (307,518 | ) | (544,358 | ) | ||||
Class 2 | ||||||||
From net investment income | (106 | ) | (164 | ) | ||||
|
|
|
| |||||
Total distributions to shareholders | (307,624 | ) | (544,522 | ) | ||||
|
|
|
| |||||
CAPITAL TRANSACTIONS: | ||||||||
Change in net assets from capital transactions | (6,548,413 | ) | (10,799,838 | ) | ||||
|
|
|
| |||||
NET ASSETS: | ||||||||
Change in net assets | (6,975,163 | ) | (4,250,875 | ) | ||||
Beginning of period | 38,573,170 | 42,824,045 | ||||||
|
|
|
| |||||
End of period | $ | 31,598,007 | $ | 38,573,170 | ||||
|
|
|
| |||||
Accumulated undistributed net investment income | $ | 265,103 | $ | 317,141 | ||||
|
|
|
| |||||
CAPITAL TRANSACTIONS: | ||||||||
Class 1 | ||||||||
Proceeds from shares issued | $ | 2,511,734 | $ | 2,668,163 | ||||
Dividends and distributions reinvested | 307,518 | 544,358 | ||||||
Cost of shares redeemed | (9,367,771 | ) | (14,012,523 | ) | ||||
|
|
|
| |||||
Change in net assets from Class 1 capital transactions | $ | (6,548,519 | ) | $ | (10,800,002 | ) | ||
|
|
|
| |||||
Class 2 | ||||||||
Dividends and distributions reinvested | 106 | 164 | ||||||
|
|
|
| |||||
Change in net assets from Class 2 capital transactions | $ | 106 | $ | 164 | ||||
|
|
|
| |||||
Total change in net assets from capital transactions | $ | (6,548,413 | ) | $ | (10,799,838 | ) | ||
|
|
|
| |||||
SHARE TRANSACTIONS: | ||||||||
Class 1 | ||||||||
Issued | 167,012 | 196,478 | ||||||
Reinvested | 18,196 | 36,657 | ||||||
Redeemed | (583,474 | ) | (1,000,414 | ) | ||||
|
|
|
| |||||
Change in Class 1 Shares | (398,266 | ) | (767,279 | ) | ||||
|
|
|
| |||||
Class 2 | ||||||||
Reinvested | 6 | 11 | ||||||
|
|
|
| |||||
Change in Class 2 Shares | 6 | 11 | ||||||
|
|
|
| |||||
SEE NOTES TO FINANCIAL STATEMENTS.
| 12 | JPMORGAN INSURANCE TRUST | DECEMBER 31, 2011 | ||||
Table of Contents
THIS PAGE IS INTENTIONALLY LEFT BLANK
| DECEMBER 31, 2011 | JPMORGAN INSURANCE TRUST | 13 | ||||||
Table of Contents
FOR THE PERIODS INDICATED
| Per share operating performance | ||||||||||||||||||||||||||||
| Investment operations | Distributions | |||||||||||||||||||||||||||
| Net asset value, beginning of period | Net investment income (loss) | Net realized and unrealized gains (losses) on investments | Total from investment operations | Net investment income | Net realized gain | Total distributions | ||||||||||||||||||||||
Intrepid Mid Cap Portfolio | ||||||||||||||||||||||||||||
Class 1 | ||||||||||||||||||||||||||||
Year Ended December 31, 2011 | $ | 15.62 | $ | 0.12 | (c) | $ | (0.34 | ) | $ | (0.22 | ) | $ | (0.14 | ) | $ | — | $ | (0.14 | ) | |||||||||
Year Ended December 31, 2010 | 13.23 | 0.11 | (c) | 2.46 | 2.57 | (0.18 | ) | — | (0.18 | ) | ||||||||||||||||||
Year Ended December 31, 2009 | 9.92 | 0.18 | 3.30 | 3.48 | (0.17 | ) | — | (0.17 | ) | |||||||||||||||||||
Year Ended December 31, 2008 | 17.82 | 0.16 | (6.63 | ) | (6.47 | ) | (0.08 | ) | (1.35 | ) | (1.43 | ) | ||||||||||||||||
Year Ended December 31, 2007 | 18.90 | 0.08 | 0.50 | 0.58 | (0.12 | ) | (1.54 | ) | (1.66 | ) | ||||||||||||||||||
Class 2 | ||||||||||||||||||||||||||||
Year Ended December 31, 2011 | 15.60 | 0.08 | (c) | (0.35 | ) | (0.27 | ) | (0.10 | ) | — | (0.10 | ) | ||||||||||||||||
Year Ended December 31, 2010 | 13.22 | 0.08 | (c) | 2.46 | 2.54 | (0.16 | ) | — | (0.16 | ) | ||||||||||||||||||
Year Ended December 31, 2009 | 9.90 | 0.12 | 3.33 | 3.45 | (0.13 | ) | — | (0.13 | ) | |||||||||||||||||||
Year Ended December 31, 2008 | 17.78 | 0.12 | (6.61 | ) | (6.49 | ) | (0.04 | ) | (1.35 | ) | (1.39 | ) | ||||||||||||||||
Year Ended December 31, 2007 | 18.89 | 0.03 | 0.50 | 0.53 | (0.10 | ) | (1.54 | ) | (1.64 | ) | ||||||||||||||||||
| (a) | Includes adjustments in accordance with accounting principles generally accepted in the United States of America and as such, the net asset value for financial reporting purposes and the returns based upon those net asset values may differ from the net asset value and returns for shareholder transactions. |
| (b) | Includes earnings credits and interest expense, each of which is less than 0.01%, if applicable or unless otherwise noted. |
| (c) | Calculated based upon average shares outstanding. |
SEE NOTES TO FINANCIAL STATEMENTS.
| 14 | JPMORGAN INSURANCE TRUST | DECEMBER 31, 2011 | ||||
Table of Contents
| Ratios/Supplemental data | |||||||||||||||||||||||||
| Ratios to average net assets | ||||||||||||||||||||||||||
| Net asset value, end of period | Total return (a) | Net assets, end of period | Net expenses (b) | Net investment income (loss) | Expenses without | Portfolio turnover rate | ||||||||||||||||||||
| $ | 15.26 | (1.52 | )% | $ | 31,581,775 | 0.90 | % | 0.75 | % | 1.08 | % | 47 | % | |||||||||||||
| 15.62 | 19.52 | 38,556,642 | 0.90 | 0.81 | 1.22 | 46 | ||||||||||||||||||||
| 13.23 | 35.66 | 42,810,183 | 0.90 | 1.37 | 1.15 | 74 | ||||||||||||||||||||
| 9.92 | (38.82 | ) | 39,157,400 | 0.90 | 1.10 | 1.01 | 101 | |||||||||||||||||||
| 17.82 | 2.87 | 74,896,887 | 0.90 | 0.41 | 0.95 | 105 | ||||||||||||||||||||
| 15.23 | (1.79 | ) | 16,232 | 1.15 | 0.52 | 1.33 | 47 | |||||||||||||||||||
| 15.60 | 19.24 | 16,528 | 1.15 | 0.57 | 1.48 | 46 | ||||||||||||||||||||
| 13.22 | 35.37 | 13,862 | 1.15 | 1.14 | 1.40 | 74 | ||||||||||||||||||||
| 9.90 | (38.98 | ) | 10,240 | 1.15 | 0.87 | 1.27 | 101 | |||||||||||||||||||
| 17.78 | 2.60 | 16,857 | 1.15 | 0.16 | 1.20 | 105 | ||||||||||||||||||||
SEE NOTES TO FINANCIAL STATEMENTS.
| DECEMBER 31, 2011 | JPMORGAN INSURANCE TRUST | 15 | ||||||
Table of Contents
AS OF DECEMBER 31, 2011
1. Organization
JPMorgan Insurance Trust (the “Trust”) is registered under the Investment Company Act of 1940, as amended (the “1940 Act”), as an open-end management investment company and is a Massachusetts business trust.
The following is a separate Portfolio of the Trust (the “Portfolio”) covered by this report:
| Classes Offered | Diversified/Non-Diversified | |||
| Intrepid Mid Cap Portfolio | Class 1 and Class 2 | Diversified |
The investment objective of the Portfolio is to seek long-term capital growth by investing primarily in equity securities with intermediate capitalizations.
Portfolio shares are offered only to separate accounts of participating insurance companies and Eligible Plans. Individuals may not purchase shares directly from the Portfolio.
All classes of shares have equal rights as to earnings, assets and voting privileges except that each class may bear different distribution and service fees, and each class has exclusive voting rights with respect to its distribution plan or administrative services plan.
2. Significant Accounting Policies
The following is a summary of significant accounting policies followed by the Trust in the preparation of its financial statements. The policies are in accordance with accounting principles generally accepted in the United States of America. The preparation of financial statements requires management to make estimates and assumptions that affect the reported amounts of assets and liabilities at the date of the financial statements and the reported amounts of income and expenses for the period. Actual results could differ from those estimates.
A. Valuation of Investments — Equity securities listed on a North American, Central American, South American or Caribbean securities exchange shall generally be valued at the last sale price on the exchange on which the security is principally traded that is reported before the time when the net assets of the Portfolio are valued. The value of securities listed on The NASDAQ Stock Market LLC shall generally be the NASDAQ Official Closing Price. Fixed income securities (other than certain short-term investments maturing in less than 61 days) are valued each day based on prices received from independent or affiliated pricing services approved by the Board of Trustees or third party broker-dealers. The broker-dealers or pricing services use multiple valuation techniques to determine fair value. In instances where sufficient market activity exists, the broker-dealers or pricing services may utilize a market-based approach through which quotes from market makers are used to determine fair value. In instances where sufficient market activity may not exist or is limited, the broker-dealers or pricing services also utilize proprietary valuation models which may consider market transactions in comparable securities and the various relationships between securities in determining value and/or market characteristics such as benchmark yield curves, option-adjusted spreads, credit spreads, estimated default rates, coupon-rates, anticipated timing of principal repayments, underlying collateral, and other unique security features in order to estimate the relevant cash flows, which are then discounted to calculate the fair values. Generally, short-term investments of sufficient credit quality maturing in less than 61 days are valued at amortized cost, which approximates market value. Certain investments of the Portfolio may, depending upon market conditions, trade in relatively thin markets and/or in markets that experience significant volatility. As a result of these conditions, the prices used by the Portfolio to value securities may differ from the value that would be realized if these securities were sold, and the differences could be material. Futures and options shall generally be valued on the basis of available market quotations. Swaps and other derivatives are valued daily, primarily using independent or affiliated pricing services approved by the Board of Trustees. If valuations are not available from such services or values received are deemed not representative of market value, values will be obtained from a third party broker-dealer or counterparty. Investments in other open-end investment companies are valued at such investment company’s net asset value per share as of the report date.
Securities or other assets for which market quotations are not readily available or for which market quotations do not represent the value at the time of pricing (including certain illiquid securities) are fair valued in accordance with procedures established by and under the supervision and responsibility of the Board of Trustees. Under these procedures, the Portfolio primarily employs a market-based approach which may use related or comparable assets or liabilities, recent transactions, market multiples, book values, and other relevant information for the investment to determine the fair value of the investment. The Portfolio may also use an income-based valuation approach in which the anticipated future cash flows of the investment are discounted to calculate fair value. Discounts may also be applied due to the nature or duration of any restrictions on the disposition of the investments. Valuations may be based upon current market prices of securities that are comparable in coupon, rating, maturity and industry. It is possible that the estimated values may differ significantly from the values that would have been used had a ready market for the investments existed, and such differences could be material. Trading in securities on most foreign exchanges and over-the-counter markets is normally completed before the close of the domestic market and may also take place on days when the domestic market is closed. In accordance with procedures adopted by the Board of Trustees, the Portfolio applies fair value pricing on equity securities on a daily basis except for North American, Central American, South American and Caribbean equity securities held in its portfolio by utilizing the quotations of an independent pricing service, unless the Portfolio’s advisor determines that use of another valuation methodology is appropriate. The pricing service uses statistical analyses and quantitative models to adjust local market prices using factors such as subsequent movement and changes in the prices of indices, securities and exchange rates in other markets, in determining fair value as of the time the Portfolio calculates its net asset values.
Valuations reflected in this report are as of the report date. As a result, changes in valuation due to market events and/or issuer related events after the report date and prior to issuance of the report are not reflected herein.
| 16 | JPMORGAN INSURANCE TRUST | DECEMBER 31, 2011 | ||||
Table of Contents
The various inputs that are used in determining the fair value of the Portfolio’s investments are summarized into the three broad levels listed below.
| Ÿ | Level 1 — quoted prices in active markets for identical securities |
| Ÿ | Level 2 — other significant observable inputs (including quoted prices for similar securities, interest rates, prepayment speeds, credit risk, etc.) |
| Ÿ | Level 3 — significant unobservable inputs (including the Portfolio’s own assumptions in determining the fair value of investments) |
A financial instrument’s level within the fair value hierarchy is based on the lowest level of any input both individually and in aggregate that is significant to the fair value measurement. The inputs or methodology used for valuing securities are not necessarily an indication of the risk associated with investing in those securities.
The following table represents each valuation input as presented on the Schedule of Portfolio Investments (“SOI”):
Level 1 Quoted prices | Level 2 Other significant observable inputs | Level 3 Significant unobservable inputs | Total | |||||||||||||
Total Investments in Securities (a) | $ | 32,820,592 | $ | 60,192 | $ | — | $ | 32,880,784 | ||||||||
|
|
|
|
|
|
|
| |||||||||
Appreciation in Other Financial Instruments | ||||||||||||||||
Futures Contracts | $ | 1,801 | $ | — | $ | — | $ | 1,801 | ||||||||
|
|
|
|
|
|
|
| |||||||||
| (a) | Portfolio holdings designated as Level 1 and Level 2 are disclosed individually in the SOI. Level 2 consists of a U.S. Treasury Note that is held for futures collateral. Please refer to the SOI for industry specifics of the portfolio holdings. |
There were no transfers between Levels 1 and 2 during the year ended December 31, 2011.
B. Futures Contracts — The Portfolio uses index futures contracts to gain or reduce exposure to the stock market, maintain liquidity and minimize transaction costs. The Portfolio buys futures contracts to immediately invest incoming cash in the market or sells futures in response to cash outflows, thereby simulating an invested position in the underlying index while maintaining a cash balance for liquidity. The use of futures contracts exposes the Portfolio to equity price risk.
Futures contracts provide for the delayed delivery of the underlying instrument at a fixed price or for a cash amount based on the change in the value of the underlying instrument at a specific date in the future. Upon entering into a futures contract, the Portfolio is required to deposit with the broker, cash or securities in an amount equal to a certain percentage of the contract amount which is referred to as the initial margin deposit. Subsequent payments, referred to as variation margin, are made or received by the Portfolio periodically and are based on changes in the market value of open futures contracts. Changes in the market value of open futures contracts are recorded as unrealized appreciation or depreciation in the Statement of Operations. Realized gains or losses, representing the difference between the value of the contract at the time it was opened and the value at the time it was closed, are reported in the Statement of Operations at the closing or expiration of futures contracts. Securities deposited as initial margin are designated in the SOI and cash deposited is recorded on the Statement of Assets and Liabilities. A receivable from and/or a payable to brokers for the daily variation margin is also recorded on the Statement of Assets and Liabilities.
The Portfolio may be subject to the risk that the change in the value of the futures contract may not correlate perfectly with the underlying instrument. Use of long futures contracts subjects the Portfolio to risk of loss in excess of the amounts shown on the Statement of Assets and Liabilities, up to the notional amount of the futures contracts. Use of short futures contracts subjects the Portfolio to unlimited risk of loss. The Portfolio may enter into futures contracts only on exchanges or boards of trade. The exchange or board of trade acts as the counterparty to each futures transaction; therefore, the Portfolio’s credit risk is limited to failure of the exchange or board of trade. Under some circumstances, futures exchanges may establish daily limits on the amount that the price of a futures contract can vary from the previous day’s settlement price, which could effectively prevent liquidation of unfavorable positions.
The table below discloses the volume of the Portfolio’s futures activities during the year ended December 31, 2011:
Futures Contracts: | ||||
Average Notional Balance Long | $ | 668,474 | ||
Ending Notional Balance Long | 350,920 |
C. Securities Lending — The Portfolio may lend securities to brokers approved by J.P. Morgan Investment Management Inc. (“JPMIM” or the “Advisor”) in order to generate additional income. The Goldman Sachs Bank USA, doing business as Goldman Sachs Agency Lending (“GSAL”), serves as lending agent for the Portfolio pursuant to a Securities Lending Agreement (the “GSAL Securities Lending Agreement”). Securities loaned are collateralized by cash, which is invested in Capital Shares of the JPMorgan Prime Money Market Fund. Upon termination of the loan, the Portfolio is required to return to the borrower the posted cash collateral. Loans are subject to termination by the Portfolio or the borrower at any time.
Securities lending income is comprised of income earned on cash collateral investments (“Collateral Investments”), net of a rebate received from or paid to borrowers for use of cash collateral and lending agent fees. This amount is recorded as Income from securities lending (net) on the Statement of Operations. The Portfolio also receives payments from the borrower during the period of the loan, equivalent to dividends and interest earned on the securities loaned, which are recorded as Dividend or Interest income, respectively, on the Statement of Operations.
| DECEMBER 31, 2011 | JPMORGAN INSURANCE TRUST | 17 | ||||||
Table of Contents
NOTES TO FINANCIAL STATEMENTS
AS OF DECEMBER 31, 2011 (continued)
For the year ended December 31, 2011, the Portfolio earned $1,776 from the investment of cash collateral, prior to rebates or fees, from an investment in an affiliated fund as described below.
At the inception of a loan, securities are exchanged for cash collateral equal to at least 102% of the value of loaned U.S. dollar-denominated securities, plus accrued interest. The GSAL Securities Lending Agreement requires that the loaned securities be marked to market on a daily basis and additional cash collateral is requested from borrowers when the cash received from borrowers becomes less than 102% of the value of loaned securities.
The value of the cash collateral received is recorded as a liability on the Statement of Assets and Liabilities and details of Collateral Investments are disclosed in the SOI. At December 31, 2011, the value of outstanding securities on loan and the value of Collateral Investments were as follows:
Value of Securities on Loan | Cash Collateral Posted by Borrower | Total Value of Collateral Investments | ||||||||||
| $ | 946,894 | $ | 974,674 | $ | 974,674 | |||||||
The Portfolio bears the risk of loss associated with the Collateral Investments and is not entitled to additional collateral from the borrower to cover any such losses. To the extent that the value of the Collateral Investments declines below the amount owed to a borrower, the Portfolio may incur losses that exceed the amount it earned on lending the security. Upon termination of a loan, the Portfolio may use leverage (borrow money) to repay the borrower for cash collateral posted if the Advisor does not believe that it is prudent to sell the Collateral Investments to fund the payment of this liability.
Securities lending also involves counterparty risks, including the risk that the loaned securities may not be returned in a timely manner or at all. Subject to certain conditions, GSAL has agreed to indemnify the Portfolio from losses resulting from a borrower’s failure to return a loaned security.
The Advisor waived fees associated with the Portfolio’s investment in JPMorgan Prime Money Market Fund in the amount of $1,446. This amount offsets the administration fees and shareholder servicing fees incurred by JPMorgan Prime Money Market Fund related to the Portfolio’s investment in such fund. A portion of the waiver is voluntary.
D. Security Transactions and Investment Income — Investment transactions are accounted for on the trade date (the date the order to buy or sell is executed). Securities gains and losses are calculated on a specifically identified cost basis. Interest income is determined on the basis of coupon interest accrued using the effective interest method adjusted for amortization of premiums and accretion of discounts. Dividend income less foreign taxes withheld, if any, is recorded on the ex-dividend date or when the Portfolio first learns of the dividend.
The Portfolio records distributions received in excess of income from underlying investments as a reduction of cost of investments and/or realized gain. Such amounts are based on estimates if actual amounts are not available and actual amounts of income, realized gain and return of capital may differ from the estimated amounts. The Portfolio adjusts the estimated amounts of components of distributions (and consequently its net investment income) as necessary once the issuers provide information about the actual composition of the distributions.
E. Allocation of Income and Expenses — In calculating the net asset value per share of each class, investment income, realized and unrealized gains and losses and expenses other than class specific expenses are allocated daily to each class of shares based upon the proportion of net assets of each class at the beginning of each day. Expenses directly attributable to a portfolio are charged directly to that portfolio while the expenses attributable to more than one portfolio of the Trust are allocated among the respective portfolios. Each class of shares bears its pro-rata portion of expenses attributable to the Portfolio, except that each class separately bears expenses related specifically to that class, such as distribution fees.
F. Federal Income Taxes — The Portfolio is treated as a separate taxable entity for Federal income tax purposes. The Portfolio’s policy is to comply with the provisions of the Internal Revenue Code of 1986, as amended (the “Code”), applicable to regulated investment companies and to distribute to shareholders all of its distributable net investment income and net realized gain on investments. Accordingly, no provision for Federal income tax is necessary. The Portfolio is also a segregated portfolio of assets for insurance purposes and intends to comply with the diversification requirements of Subchapter L of the Code. The Portfolio is not aware of any tax positions for which it is reasonably possible that the total amounts of unrecognized tax benefits or losses will significantly change in the next twelve months. However, the Portfolio’s conclusions may be subject to future review based on changes in, or the interpretation of, the accounting standards or tax laws and regulations. The Portfolio’s Federal tax returns for the prior three fiscal years remain subject to examination by the Internal Revenue Service.
G. Dividends and Distributions to Shareholders — Dividends from net investment income are generally declared and paid at least annually. Dividends are declared separately for each class. No class has preferential dividend rights; differences in per share rates are due to differences in separate class expenses. Net realized capital gains, if any, are distributed at least annually. The amount of dividends and distributions from net investment income and net realized capital gains is determined in accordance with Federal income tax regulations, which may differ from accounting principles generally accepted in the United States of America. To the extent these “book/tax” differences are permanent in nature (i.e., that they result from other than timing of recognition — “temporary differences”), such amounts are reclassified within the capital accounts based on their Federal tax-basis treatment.
| 18 | JPMORGAN INSURANCE TRUST | DECEMBER 31, 2011 | ||||
Table of Contents
The following amounts were reclassified within the capital accounts:
| Paid-in-Capital | Accumulated (Overdistributed) Net Investment Income | Accumulated Investments | ||||||||||
| $ | 5,346 | $ | (10,983 | ) | $ | 5,637 | ||||||
The reclassifications for the Portfolio relate primarily to distributions from investments in real estate investment trusts.
3. Fees and Other Transactions with Affiliates
A. Investment Advisory Fee — Pursuant to the Investment Advisory Agreement, JPMIM acts as the investment advisor to the Portfolio. JPMIM is a wholly-owned subsidiary of JPMorgan Asset Management Holdings Inc., which is a wholly-owned subsidiary of JPMorgan Chase & Co. (“JPMorgan”). JPMIM supervises the investments of the Portfolio and for such services is paid a fee. The fee is accrued daily and paid monthly based on the Portfolio’s average daily net assets at an annual fee rate of 0.65%.
The Advisor waived Investment Advisory fees and/or reimbursed expenses as outlined in Note 3.E.
B. Administration Fee — Pursuant to an Administration Agreement, JPMorgan Funds Management, Inc. (the “Administrator”), an indirect, wholly-owned subsidiary of JPMorgan, provides certain administration services to the Portfolio. In consideration of these services, the Administrator receives a fee computed daily and paid monthly at the annual rate of 0.15% of the first $25 billion of the average daily net assets of all funds in the J.P. Morgan Funds Complex (excluding certain funds of funds and money market funds) and 0.075% of the average daily net assets in excess of $25 billion of all such funds. For the year ended December 31, 2011, the annual effective rate was 0.09% of the Portfolio’s average daily net assets.
JPMorgan Chase Bank, N.A. (“JPMCB”), a wholly-owned subsidiary of JPMorgan, and successor in interest to J.P. Morgan Investor Services Co. serves as the Portfolio’s sub-administrator (the “Sub-administrator”). For its services as Sub-administrator, JPMCB receives a portion of the fees payable to the Administrator.
C. Distribution Fees — Pursuant to a Distribution Agreement, JPMorgan Distribution Services, Inc. (the “Distributor”), a wholly-owned subsidiary of JPMorgan, serves as the Trust’s exclusive underwriter and promotes and arranges for the sale of the Portfolio’s shares.
The Board of Trustees has adopted a Distribution Plan (the “Distribution Plan”) for Class 2 Shares of the Portfolio in accordance with Rule 12b-1 under the 1940 Act. The Distribution Plan provides that the Portfolio shall pay distribution fees, including payments to the Distributor, at an annual rate of 0.25% of the average daily net assets of Class 2 Shares.
D. Custodian and Accounting Fees — JPMCB provides portfolio custody and accounting services for the Portfolio. The amounts paid directly to JPMCB by the Portfolio for custody and accounting services are included in Custodian and accounting fees in the Statement of Operations. The custodian fees may be reduced by credits earned by the Portfolio, based on uninvested cash balances held by the custodian. Such earnings credits are presented separately in the Statement of Operations.
Interest expense, if any, paid to the custodian related to cash overdrafts is included in Interest expense to affiliates in the Statement of Operations.
E. Waivers and Reimbursements — The Advisor and Administrator have contractually agreed to waive fees and/or reimburse the Portfolio to the extent that total annual operating expenses (excluding acquired fund fees and expenses, dividend expense related to short sales, interest, taxes, extraordinary expenses and expenses related to the Board of Trustees’ deferred compensation plan) exceed the percentages of the Portfolio’s average daily net assets as shown in the table below:
| Class 1 | Class 2 | |||||||
| 0.90 | % | 1.15 | % | |||||
The contractual expense limitation agreements were in effect for the year ended December 31, 2011. The expense limitation percentages in the table above are in place until at least April 30, 2012.
For the year ended December 31, 2011, the Advisor contractually waived fees for the Portfolio in the amount of $63,424. The Advisor does not expect the Portfolio to repay any such waived fees in future years.
Additionally, the Portfolio may invest in one or more money market funds advised by the Advisor or its affiliates. The Advisor, Administrator and the Distributor waive fees in an amount sufficient to offset the respective fees each charges to the affiliated money market fund on the Portfolio’s investment in such affiliated money market fund. A portion of the waiver is voluntary.
The amount of waivers resulting from investments in the money market funds for the year ended December 31, 2011 (excluding the waiver disclosed in Note 2.C. regarding cash collateral for securities lending invested in JPMorgan Prime Money Market Fund) was $1,063.
F. Other — Certain officers of the Trust are affiliated with the Advisor, the Administrator and the Distributor. Such officers, with the exception of the Chief Compliance Officer, receive no compensation from the Portfolio for serving in their respective roles.
| DECEMBER 31, 2011 | JPMORGAN INSURANCE TRUST | 19 | ||||||
Table of Contents
NOTES TO FINANCIAL STATEMENTS
AS OF DECEMBER 31, 2011 (continued)
The Board of Trustees appointed a Chief Compliance Officer to the Portfolio in accordance with federal securities regulations. The Portfolio, along with other affiliated portfolios, makes reimbursement payments, on a pro-rata basis, to the Administrator for a portion of the fees associated with the Office of the Chief Compliance Officer. Such fees are included in Trustees’ and Chief Compliance Officer’s fees in the Statement of Operations.
The Trust adopted a Trustee Deferred Compensation Plan (the “Plan”) which allows the Independent Trustees to defer the receipt of all or a portion of compensation related to performance of their duties as a Trustee. The deferred fees are invested in various J.P. Morgan Funds until distribution in accordance with the Plan.
During the year ended December 31, 2011, the Portfolio may have purchased securities from an underwriting syndicate in which the principal underwriter or members of the syndicate are affiliated with the Advisor.
The Portfolio may use related party broker/dealers. For the year ended December 31, 2011, the Portfolio did not incur any brokerage commissions with broker/dealers affiliated with the Advisor.
The Securities and Exchange Commission has granted an exemptive order permitting the Portfolio to engage in principal transactions with J.P. Morgan Securities, Inc., an affiliated broker, involving taxable money market instruments subject to certain conditions.
4. Investment Transactions
During the year ended December 31, 2011, purchases and sales of investments (excluding short-term investments) were as follows:
Purchases (excluding U.S. Government) | Sales (excluding U.S. Government) | Purchases of U.S. Government | Sales of U.S. Government | |||||||||||||
| $ | 16,558,592 | $ | 22,830,876 | $ | 45,157 | $ | 85,000 | |||||||||
5. Federal Income Tax Matters
For Federal income tax purposes, the cost and unrealized appreciation (depreciation) in value of the investment securities at December 31, 2011, were as follows:
Aggregate Cost | Gross Unrealized Appreciation | Gross Unrealized Depreciation | Net Appreciation (Depreciation) | |||||||||||||
| $ | 30,786,633 | $ | 4,391,563 | $ | 2,297,412 | $ | 2,094,151 | |||||||||
The difference between book and tax basis appreciation (depreciation) on investments is primarily attributed to wash sale loss deferrals.
The tax character of distributions paid during the fiscal year ended December 31, 2011 was as follows:
| Total Distributions Paid From: | ||||||||
Ordinary Income | Total Distributions Paid | |||||||
| $ | 307,624 | $ | 307,624 | |||||
The tax character of distributions paid during the fiscal year ended December 31, 2010 was as follows:
| Total Distributions Paid From: | ||||||||
Ordinary Income | Total Distributions Paid | |||||||
| $ | 544,522 | $ | 544,522 | |||||
At December 31, 2011, the components of net assets (excluding paid in capital) on a tax basis were as follows:
Current Distributable Ordinary Income | Current Distributable Long-Term Capital Gain Loss Carryover) | Unrealized Appreciation (Depreciation) | ||||||||||
| $ | 266,590 | $ | (3,647,491 | ) | $ | 2,094,151 | ||||||
| 20 | JPMORGAN INSURANCE TRUST | DECEMBER 31, 2011 | ||||
Table of Contents
The cumulative timing differences primarily consist of Trustee deferred compensation and wash sale loss deferrals.
Under the Regulated Investment Company Modernization Act of 2010 (the “Act”), net capital losses recognized by the Portfolio after December 31, 2010, may get carried forward indefinitely, and retain their character as short-term and/or long term losses. Prior to the Act, pre-enactment net capital losses incurred by the Portfolio were carried forward for eight years and treated as short-term losses. The Act requires that post-enactment net capital losses be used before pre-enactment net capital losses.
As of December 31, 2011, the Portfolio did not have post-enactment net capital loss carryforwards.
As of December 31, 2011, the Portfolio had the following pre-enactment net capital loss carryforwards, expiring during the year indicated, which are available to offset future realized gains:
| 2017 | Total | |||||||
| $ | 3,647,491 | $ | 3,647,491 | |||||
During the year ended December 31, 2011, the Portfolio utilized capital loss carryforwards in the amount of $3,637,858.
6. Borrowings
The Trust and JPMCB have entered into a financing arrangement. Under this arrangement, JPMCB provides an unsecured, uncommitted credit facility in the aggregate amount of $100 million to certain of the J.P. Morgan Funds, including the Portfolio. Advances under the arrangement are taken primarily for temporary or emergency purposes, including the meeting of redemption requests that otherwise might require the untimely disposition of securities, and are subject to the Portfolio’s borrowing restrictions. Interest on borrowings is payable at a rate determined by JPMCB at the time of borrowing. This agreement has been extended until November 12, 2012.
The Portfolio had no borrowings outstanding from the unsecured, uncommitted credit facility at December 31, 2011, or at any time during the year then ended.
Interest expense paid, if any, as a result of borrowings from the unsecured, uncommitted credit facility is included in Interest expense to affiliates in the Statement of Operations.
7. Risks, Concentrations and Indemnifications
In the normal course of business, the Portfolio enters into contracts that contain a variety of representations which provide general indemnifications. The Portfolio’s maximum exposure under these arrangements is unknown, as this would involve future claims that may be made against the Portfolio that have not yet occurred. However, based on experience, the Portfolio expects the risk of loss to be remote.
From time to time, the Portfolio may have a concentration of several shareholders holding a significant percentage of shares outstanding. Investment activities of these shareholders could have a material impact on the Portfolio.
| DECEMBER 31, 2011 | JPMORGAN INSURANCE TRUST | 21 | ||||||
Table of Contents
REPORT OF INDEPENDENT REGISTERED PUBLIC ACCOUNTING FIRM
To the Board of Trustees of JPMorgan Insurance Trust and Shareholders of JPMorgan Insurance Trust Intrepid Mid Cap Portfolio:
In our opinion, the accompanying statement of assets and liabilities, including the schedule of portfolio investments, and the related statements of operations and of changes in net assets and the financial highlights present fairly, in all material respects, the financial position of JPMorgan Insurance Trust Intrepid Mid Cap Portfolio (a separate Portfolio of JPMorgan Insurance Trust) (hereafter referred to as the “Portfolio”) at December 31, 2011, the results of its operations for the year then ended, the changes in its net assets for each of the two years in the period then ended and the financial highlights for each of the five years in the period then ended, in conformity with accounting principles generally accepted in the United States of America. These financial statements and financial highlights (hereafter referred to as “financial statements”) are the responsibility of the Portfolio’s management. Our responsibility is to express an opinion on these financial statements based on our audits. We conducted our audits of these financial statements in accordance with the standards of the Public Company Accounting Oversight Board (United States). Those standards require that we plan and perform the audit to obtain reasonable assurance about whether the financial statements are free of material misstatement. An audit includes examining, on a test basis, evidence supporting the amounts and disclosures in the financial statements, assessing the accounting principles used and significant estimates made by management, and evaluating the overall financial statement presentation. We believe that our audits, which included confirmation of securities at December 31, 2011 by correspondence with the custodian and brokers, provide a reasonable basis for our opinion.
PricewaterhouseCoopers LLP
New York, New York
February 23, 2012
| 22 | JPMORGAN INSURANCE TRUST | DECEMBER 31, 2011 | ||||
Table of Contents
(Unaudited)
The Portfolio’s Statement of Additional Information includes additional information about the Portfolio’s Trustees and is available, without charge, upon request by calling 1-800-480-4111 or on the J.P. Morgan Funds’ website at www.jpmorganfunds.com.
Name (Year of Birth); Positions With the Portfolio (1) | Principal Occupations During Past 5 Years | Number of Complex Overseen by Trustee (2) | Other Directorships Held Outside Fund Complex During Past 5 Years | |||
Independent Trustees | ||||||
| William J. Armstrong (1941); Trustee of Trust since 2005; Trustee of heritage J.P. Morgan Funds since 1987. | Retired; CFO and Consultant, EduNeering, Inc. (internet business education supplier) (2000-2001); Vice President and Treasurer, Ingersoll-Rand Company (manufacturer of industrial equipment) (1972-2000). | 154 | None. | |||
| John F. Finn (1947); Trustee of Trust since 2005; Trustee of heritage One Group Mutual Funds since 1998. | Chairman (1985-present), President and Chief Executive Officer, Gardner, Inc. (supply chain management company serving industrial and consumer markets) (1974-present). | 154 | Director, Cardinal Health, Inc. (CAH) (1994-present); Director, Greif, Inc. (GEF) (industrial package products and services) (2007-present). | |||
| Dr. Matthew Goldstein (1941); Trustee of Trust since 2005; Trustee of heritage J.P. Morgan Funds since 2003. | Chancellor, City University of New York (1999-present); President, Adelphi University (New York) (1998-1999). | 154 | Director, New Plan Excel (NXL) (1999-2005); Director, National Financial Partners (NFP) (2003-2005); Director, Bronx-Lebanon Hospital Center; Director, United Way of New York City (2002-present). | |||
| Robert J. Higgins (1945); Trustee of Trust since 2005; Trustee of heritage J.P. Morgan Funds since 2002. | Retired; Director of Administration of the State of Rhode Island (2003-2004); President — Consumer Banking and Investment Services, Fleet Boston Financial (1971-2001). | 154 | None. | |||
| Peter C. Marshall (1942); Trustee of Trust since 2005; Trustee of heritage One Group Mutual Funds since 1985. | Self-employed business consultant (2002-present). | 154 | Director, Center for Communication, Hearing, and Deafness (1990-present). | |||
| Marilyn McCoy* (1948); Trustee of Trust since 2005; Trustee of heritage One Group Mutual Funds since 1999. | Vice President of Administration and Planning, Northwestern University (1985-present). | 154 | Trustee, Carleton College (2003-present). | |||
| William G. Morton, Jr. (1937); Trustee of Trust since 2005; Trustee of heritage J.P. Morgan Funds since 2003. | Retired; Chairman Emeritus (2001-2002), and Chairman and Chief Executive Officer, Boston Stock Exchange (1985-2001). | 154 | Director, Radio Shack Corp. (1987-2008); Trustee, Stratton Mountain School (2001-present). | |||
| Robert A. Oden, Jr. (1946); Trustee of Trust since 2005; Trustee of heritage One Group Mutual Funds since 1997. | Retired; President, Carleton College (2002-2010); President, Kenyon College (1995-2002). | 154 | Trustee, American University in Cairo (1999-present); Trustee, Carleton College (2002-2010). | |||
| Fergus Reid, III (1932); Trustee of Trust (Chairman) since 2005; Trustee (Chairman) of heritage J.P. Morgan Funds since 1987. | Chairman, Joe Pietryka, Inc. (formerly Lumelite Corporation) (plastics manufacturing) (2003-present); Chairman and Chief Executive Officer, Lumelite Corporation (1985-2002). | 154 | Trustee, Morgan Stanley Funds (105 portfolios) (1992-present). | |||
| DECEMBER 31, 2011 | JPMORGAN INSURANCE TRUST | 23 | ||||||
Table of Contents
TRUSTEES
(Unaudited) (continued)
Name (Year of Birth); Positions With the Portfolio (1) | Principal Occupations During Past 5 Years | Number of Complex Overseen by Trustee (2) | Other Directorships Held Outside Fund Complex During Past 5 Years | |||
Independent Trustees (continued) | ||||||
| Frederick W. Ruebeck (1939); Trustee of Trust since 2005; Trustee of heritage One Group Mutual Funds since 1994. | Consultant (2000-present); Advisor, JP Greene & Associates, LLC (broker-dealer) (2000-2009); Chief Investment Officer, Wabash College (2004-present); Director of Investments, Eli Lilly and Company (pharmaceuticals) (1988-1999). | 154 | Trustee, Wabash College (1988-present); Chairman, Indianapolis Symphony Orchestra Foundation (1994-present). | |||
| James J. Schonbachler (1943); Trustee of Trust since 2005; Trustee of heritage J.P. Morgan Funds since 2001. | Retired; Managing Director of Bankers Trust Company (financial services) (1968-1998). | 154 | None. | |||
Interested Trustees | ||||||
| Frankie D. Hughes** (1952), Trustee of Trust since 2008. | President and Chief Investment Officer, Hughes Capital Management, Inc. (fixed income asset management) (1993-present). | 154 | Trustee, The Victory Portfolios (2000-2008). | |||
| Leonard M. Spalding, Jr.*** (1935); Trustee of Trust since 2005; Trustee of heritage J.P. Morgan Funds since 1998. | Retired; Chief Executive Officer, Chase Mutual Funds (investment company) (1989-1998); President and Chief Executive Officer, Vista Capital Management (investment management) (1990-1998); Chief Investment Executive, Chase Manhattan Private Bank (investment management) (1990-1998). | 154 | Director, Glenview Trust Company, LLC (2001-present); Trustee, St. Catharine College (1998-present); Trustee, Bellarmine University (2000-present); Director, Springfield-Washington County Economic Development Authority (1997-present); Trustee, Catholic Education Foundation (2005-present). | |||
| (1) | Each Trustee serves for an indefinite term, subject to the Trust’s current retirement policy, which is age 75 for all Trustees, except that the Board has determined Messrs. Reid and Spalding should continue to serve until December 31, 2012. |
| (2) | A Fund Complex means two or more registered investment companies that hold themselves out to investors as related companies for purposes of investment and investor services or have a common investment adviser or have an investment adviser that is an affiliated person of the investment adviser of any of the other registered investment companies. The J.P. Morgan Funds Complex for which the Board of Trustees serves currently includes eleven registered investment companies (154 funds). |
| * | Ms. McCoy has served as Vice President of Administration and Planning for Northwestern University since 1985. William M. Daley was the Head of Corporate Responsibility for JPMorgan Chase & Co. prior to January 2011 and served as a member of the Board of Trustees of Northwestern University from 2005 through 2010. JPMIM, the Funds’ investment advisor, is a wholly-owned subsidiary of JPMorgan Chase & Co. Three other members of the Board of Trustees of Northwestern University are executive officers of registered investment advisors (not affiliated with JPMorgan) that are under common control with subadvisors to certain J.P. Morgan Funds. |
| ** | Ms. Hughes is treated as an “interested person” based on the portfolio holdings of clients of Hughes Capital Management, Inc. |
| *** | Mr. Spalding is treated as an “interested person” due to his ownership of JPMorgan Chase stock. |
The contact address for each of the Trustees is 270 Park Avenue, New York, NY 10017.
| 24 | JPMORGAN INSURANCE TRUST | DECEMBER 31, 2011 | ||||
Table of Contents
(Unaudited)
Name (Year of Birth), Positions Held with the Trust (Since) | Principal Occupations During Past 5 Years | |
| Patricia A. Maleski (1960), President and Principal Executive Officer (2010) | Managing Director, J.P. Morgan Investment Management Inc. and Chief Administrative Officer, J.P. Morgan Funds and Institutional Pooled Vehicles since 2010; previously, Treasurer and Principal Financial Officer of the Trusts from 2008 to 2010; previously, Head of Funds Administration and Board Liaison, J.P. Morgan Funds prior to 2010. Ms. Maleski has been with JPMorgan Chase & Co. since 2001. | |
| Joy C. Dowd (1972), Treasurer and Principal Financial Officer (2010) | Assistant Treasurer of the Trusts from 2009 to 2010; Executive Director, JPMorgan Funds Management, Inc. from February 2011; Vice President, JPMorgan Funds Management, Inc. from December 2008 to February 2011; prior to joining JPMorgan Chase, Ms. Dowd worked in MetLife’s investments audit group from 2005 through 2008. | |
| Frank J. Nasta (1964), Secretary (2008) | Managing Director and Associate General Counsel, JPMorgan Chase since 2008; Previously, Director, Managing Director, General Counsel and Corporate Secretary, J. & W. Seligman & Co. Incorporated; Secretary of each of the investment companies of the Seligman Group of Funds and Seligman Data Corp.; Director and Corporate Secretary, Seligman Advisors, Inc. and Seligman Services, Inc. | |
| Stephen M. Ungerman (1953), Chief Compliance Officer (2005) | Managing Director, JPMorgan Chase & Co.; Mr. Ungerman has been with JPMorgan Chase & Co. since 2000. | |
| Paul L. Gulinello (1950), AML Compliance Officer (2005) | Vice President and Anti Money Laundering Compliance Officer for JPMorgan Asset Management Americas, additionally responsible for privacy, personal trading and Code of Ethics compliance since 2004. Mr. Gulinello has been with JPMorgan Chase & Co. since 1972. | |
Elizabeth A. Davin (1964), Assistant Secretary (2005)* | Vice President and Assistant General Counsel, JPMorgan Chase since 2005; Senior Counsel, JPMorgan Chase (formerly Bank One Corporation) from 2004 to 2005. | |
| Jessica K. Ditullio (1962), Assistant Secretary (2005)* | Executive Director and Assistant General Counsel, JPMorgan Chase since February 2011; Ms. Ditullio has served as an attorney with various titles for JPMorgan Chase (formerly Bank One Corporation) since 1990. | |
| John T. Fitzgerald (1975), Assistant Secretary (2008) | Executive Director and Assistant General Counsel, JPMorgan Chase since February 2011; formerly, Vice President and Assistant General Counsel, JPMorgan Chase from 2005 until February 2011. | |
| Carmine Lekstutis (1980) Assistant Secretary (2011) | Vice President and Assistant General Counsel, JPMorgan Chase since 2011; Associate, Skadden, Arps, Slate, Meagher & Flom LLP (law firm) from 2006 to 2011. | |
| Gregory S. Samuels (1980) Assistant Secretary (2010) | Vice President and Assistant General Counsel, JPMorgan Chase since 2010; Associate, Ropes & Gray (law firm) from 2008 to 2010; Associate, Clifford Chance LLP (law firm) from 2005 to 2008. | |
| Brian L. Duncan (1965), Assistant Treasurer (2008)* | Vice President, JPMorgan Funds Management, Inc. since June 2007; prior to joining JPMorgan Chase, Mr. Duncan worked for Penn Treaty American Corporation as Vice President and Controller from 2004 through 2007. | |
| Jeffrey D. House (1972), Assistant Treasurer (2006)* | Vice President, JPMorgan Funds Management, Inc. since July 2006. | |
| Laura S. Melman (1966), Assistant Treasurer (2006) | Executive Director, JPMorgan Funds Management, Inc. since February 2011, responsible for Taxation; Vice President, JPMorgan Funds Management, Inc. from August 2006 to February 2011, responsible for Taxation. | |
| Joseph Parascondola (1963), Assistant Treasurer (2011) | Vice President, JPMorgan Funds Management, Inc. since August 2006. | |
| Matthew J. Plastina (1970), Assistant Treasurer (2011) | Vice President, JPMorgan Funds Management, Inc. since August 2010; prior to August 2010, Vice President and Controller, Legg Mason Global Asset Management. | |
| Jeffery Reedy (1973), Assistant Treasurer (2011)* | Vice President, JPMorgan Funds Management, Inc. since February 2006. | |
The contact address for each of the officers, unless otherwise noted, is 270 Park Avenue, New York, NY 10017.
| * | The contact address for the officer is 1111 Polaris Parkway, Columbus, OH 43240. |
| DECEMBER 31, 2011 | JPMORGAN INSURANCE TRUST | 25 | ||||||
Table of Contents
SCHEDULE OF SHAREHOLDER EXPENSES
(Unaudited)
Hypothetical $1,000 Investment
As a shareholder of the Portfolio, you incur ongoing costs, including investment advisory fees, administration fees, distribution fees (for Class 2 Shares) and other Portfolio expenses. Because the Portfolio is a funding vehicle for Policies and Eligible Plans, you may also incur sales charges and other fees relating to the Policies or Eligible Plans. The examples below are intended to help you understand your ongoing costs (in dollars) of investing in the Portfolio, but not the costs of the Policies or Eligible Plans, and to compare these ongoing costs with the ongoing costs of investing in other mutual funds. The examples assume that you had a $1,000 investment in the Class at the beginning of the reporting period, July 1, 2011, and continued to hold your shares at the end of the reporting period, December 31, 2011.
Actual Expenses
For each Class of the Portfolio in the table below, the first line provides information about actual account values and actual expenses. You may use the information in this line, together with the amount you invested, to estimate the expenses that you paid over the period. Simply divide your account value by $1,000 (for example, an $8,600 account value divided by $1,000 = 8.6), then multiply the result by the number in the first line of each Class under the heading entitled “Expenses Paid During” to estimate the expenses you paid on your account during this period.
Hypothetical Example for Comparison Purposes
The second line of each Class in the table below provides information about hypothetical account values and hypothetical expenses based on the Class’ actual expense ratio and an assumed rate of return of 5% per year before expenses, which is not the Class’ actual return. The hypothetical account values and expenses may not be used to estimate the actual ending account balance or expenses you paid for the period. You may use this information to compare the ongoing costs of investing in the Class of the Portfolio and other portfolios. To do so, compare this 5% hypothetical example with the 5% hypothetical examples that appear in the shareholder reports of the other funds. Please note that the expenses shown in the table are meant to highlight your ongoing costs only and do not reflect any transaction costs, such as sales charges (loads) or redemption fees or the costs associated with the Policies and Eligible Plans through which the Portfolio is held. Therefore, the second line for each Class in the table is useful in comparing ongoing costs only, and will not help you determine the relative total costs of owning different portfolios. In addition, if these transaction costs were included, your costs would have been higher. The examples also assume all dividends and distributions have been reinvested.
| Beginning Account Value, July 1, 2011 | Ending Account Value December 31, 2011 | Expenses Paid During | Annualized Expense Ratio | |||||||||||||
Class 1 | ||||||||||||||||
Actual | $ | 1,000.00 | $ | 889.30 | $ | 4.29 | 0.90 | % | ||||||||
Hypothetical | 1,000.00 | 1,020.67 | 4.58 | 0.90 | ||||||||||||
Class 2 | ||||||||||||||||
Actual | 1,000.00 | 888.00 | 5.47 | 1.15 | ||||||||||||
Hypothetical | 1,000.00 | 1,019.41 | 5.85 | 1.15 | ||||||||||||
| * | Expenses are equal to the Portfolio’s annualized expense ratio, multiplied by the average account value over the period, multiplied by 184/365 (to reflect the one-half year period). |
| 26 | JPMORGAN INSURANCE TRUST | DECEMBER 31, 2011 | ||||
Table of Contents
BOARD APPROVAL OF INVESTMENT ADVISORY AGREEMENT
(Unaudited)
The Board of Trustees meets regularly throughout the year and considers factors that are relevant to its annual consideration of investment advisory agreements at each meeting. The Board of Trustees has established various standing committees, composed of Trustees with diverse backgrounds, to which the Board of Trustees has assigned specific subject matter responsibilities to further enhance the effectiveness of the Board’s oversight and decision making. The Board of Trustees and its investment subcommittees (money market and alternative products, equity, and fixed income) also meet for the specific purpose of considering advisory contract annual renewals. The Board of Trustees held meetings in person in June and August 2011, at which the Trustees considered the continuation of the investment advisory agreement for the Portfolio whose annual report is contained herein (the “Advisory Agreement”). At the June meeting, the Board’s investment subcommittees met to review and consider performance, expense and related information for the J.P. Morgan Funds. Each investment subcommittee reported to the full Board, which then considered the investment subcommittee’s preliminary findings. At the August meeting, the Trustees continued their review and consideration. The Trustees, including a majority of the Trustees who are not “interested persons” (as defined in the 1940 Act) of any party to the Advisory Agreement or any of their affiliates, approved the continuation of the Advisory Agreement on August 25, 2011.
The Trustees, as part of their review of the investment advisory arrangements for the J.P. Morgan Funds, considered and reviewed performance and other information received from the Advisor, on a regular basis over the course of the year, as well as information specifically prepared for their annual review. This information included the Portfolio’s performance compared to the performance of the Portfolio’s peers and benchmarks and analyses by the Advisor of the Portfolio’s performance. The Advisor also periodically provides comparative information regarding the Portfolio’s expense ratios and those of the peer groups. In addition, in preparation for the June and August meetings, the Trustees requested, received and evaluated extensive materials from the Advisor, including, with respect to certain J.P. Morgan Funds, performance and expense information compiled by Lipper Inc. (“Lipper”), an independent provider of investment company data. Prior to voting, the Trustees reviewed the proposed approval of the Advisory Agreement with representatives of the Advisor and with counsels to the Trust and independent Trustees and received a memorandum from independent counsel to the Trustees discussing the legal standards for their consideration of the proposed approval. The Trustees also discussed the proposed approvals in executive sessions with counsels to the Trust and independent Trustees at which no representatives of the Advisor were present. Set forth below is a summary of the material factors evaluated by the Trustees in determining whether to approve the Advisory Agreement.
In their deliberations, there was a comprehensive consideration of the information received by the Trustees. Each Trustee attributed different weights to the various factors and no factor alone was considered determinative. From year to year, the Trustees consider and place emphasis on relevant information in light of changing circumstances in market and economic conditions. The Trustees determined that the compensation to be received by the Advisor from the Portfolio under the Advisory Agreement was fair and reasonable and that the continuance of the investment advisory contract was in the best interests of the Portfolio and its shareholders.
The factors summarized below were considered and discussed by the Trustees in reaching their conclusions:
Nature, Extent and Quality of Services Provided by the Advisor
The Trustees received and considered information regarding the nature, extent and quality of the services provided to the Portfolio under the Advisory Agreement. The Trustees took into account information furnished throughout the year at Trustee meetings, as well as the materials furnished specifically in connection with this annual review process. The Trustees considered the background and experience of the Advisor’s senior management and the expertise of, and the amount of attention given to the Portfolio by, investment personnel of the Advisor. In addition, the Trustees reviewed the qualifications, backgrounds and responsibilities of the portfolio management team primarily responsible for the day-to-day management of the Portfolio and the infrastructure supporting the team. The Trustees also considered information provided by the Advisor and JPMorgan Distribution Services, Inc. (“JPMDS”) about the structure and distribution strategy of the Portfolio. The Trustees also reviewed information relating to the Advisor’s risk governance model and reports showing the Advisor’s compliance structure and ongoing compliance processes. The quality of the administrative services provided by JPMorgan Funds Management, Inc. (“JPMFM”), an affiliate of the Advisor, was also considered.
The Board of Trustees also considered its knowledge of the nature and quality of the services provided by the Advisor to the Portfolio gained from their experience as Trustees of the J.P. Morgan Funds. In addition, they considered the overall reputation and capabilities of the Advisor and its affiliates, the commitment of the Advisor to provide high quality service to the Portfolio, their overall confidence in the Advisor’s integrity and the Advisor’s responsiveness to questions or concerns raised by them, including the Advisor’s willingness to consider and implement organizational and operational changes designed to improve investment results and the services provided to the Portfolio.
Based on these considerations and other factors, the Trustees concluded that they were satisfied with the nature, extent and
| DECEMBER 31, 2011 | JPMORGAN INSURANCE TRUST | 27 | ||||||
Table of Contents
BOARD APPROVAL OF INVESTMENT ADVISORY AGREEMENT
(Unaudited) (continued)
quality of the investment advisory services provided to the Portfolio by the Advisor.
Costs of Services Provided and Profitability to the Advisor and its Affiliates
The Trustees received and considered information regarding the profitability to the Advisor and its affiliates in providing services to the Portfolio. The Trustees reviewed and discussed this data. The Trustees recognized that this data is not audited and represents the Advisor’s determination of its and its affiliates’ revenues from the contractual services provided to the Portfolio, less expenses of providing such services. Expenses include direct and indirect costs and are calculated using an allocation methodology developed by the Advisor. The Trustees also recognized that it is difficult to make comparisons of profitability from fund investment advisory contracts because comparative information is not generally publicly available and is affected by numerous factors, including the structure of the particular adviser, the types of funds it manages, its business mix, numerous assumptions regarding allocations and the fact that publicly-traded fund managers’ operating profits and net income are net of distribution and marketing expenses. Based on their review, the Trustees concluded that the profitability to the Advisor of the Advisory Agreement was not unreasonable in light of the services and benefits provided to the Portfolio.
Fall-Out Benefits
The Trustees reviewed information regarding potential “fallout” or ancillary benefits received by the Advisor and its affiliates as a result of their relationship with the Portfolio. The Board also considered that the Advisor uses third-party soft dollar arrangements with respect to securities transactions it executes for the Portfolio.
The Trustees also considered that JPMFM earns fees from the Portfolio for providing administrative services. These fees were shown separately in the profitability analysis presented to the Trustees. The Trustees also considered the payments of Rule 12b-1 fees to JPMDS, an affiliate of the Advisor, which also acts as the Portfolio’s distributor and that these fees are in turn generally paid to financial intermediaries that sell the J.P. Morgan Funds, including financial intermediaries that are affiliates of the Advisor. The Trustees also considered the fees paid to JPMorgan Chase Bank, N.A. (“JPMCB”) for custody and fund accounting and other related services.
Economies of Scale
The Trustees noted that the proposed investment advisory fee schedule for the Portfolio does not contain breakpoints. The Trustees considered whether it would be appropriate to add advisory fee breakpoints and the Trustees concluded that the current fee structure was reasonable in light of the fee waivers and expense limitations that the Advisor has in place that serve to limit the overall net expense ratio at competitive levels. The
Trustees also recognized that the fee schedule for the administrative services provided by JPMFM does include a fee breakpoint, which is tied to the overall level of non-money market fund assets excluding certain funds-of-funds, as applicable, advised by the Advisor, and that the Portfolio benefits from that breakpoint. The Trustees concluded that shareholders benefited from the lower expense ratios which resulted from these factors.
Independent Written Evaluation of the Portfolio’s Chief Compliance Officer
The Trustees noted that, upon their direction, the Chief Compliance Officer for the Portfolio had prepared an independent written evaluation in order to assist the Trustees in determining the reasonableness of the proposed management fees. The Trustees considered the written evaluation in determining whether to continue the Advisory Agreement.
Fees Relative to Advisor’s Other Clients
The Trustees received and considered information about the nature and extent of investment advisory services and fee rates offered to other clients of the Advisor for investment management styles substantially similar to that of the Portfolio. The Trustees also considered the complexity of investment management for the Portfolio relative to the Advisor’s other clients and the differences in the nature and extent of the services provided to the different clients. The Trustees concluded that the fee rates charged to the Portfolio in comparison to those charged to the Advisor’s other clients were reasonable.
Investment Performance
The Trustees received and considered absolute and/or relative performance for the Portfolio in a report prepared by Lipper. The Trustees considered the total return performance information, which included the ranking of the Portfolio within a performance universe made up of funds with the same Lipper investment classification and objective (the “Universe Group”) by total return for applicable one-, three- and five-year periods. The Trustees reviewed a description of Lipper’s methodology for selecting mutual funds in the Portfolio’s Universe Group. The Lipper materials provided to the Trustees highlighted information with respect to a representative class to assist the Trustees in their review. As part of this review, the Trustees also reviewed the Portfolio’s performance against its benchmark and considered the performance information provided for the Portfolio at regular Board meetings by the Advisor. The Lipper performance data noted by the Trustees as part of their review and the determinations made by the Trustees with respect to the Portfolio’s performance are summarized below:
The Trustees noted the Portfolio’s performance was in the fifth, fourth and fourth quintiles for Class 1 shares for the one-, three-, and five-year periods ended December 31, 2010, respectively. The Trustees discussed the performance and
| 28 | JPMORGAN INSURANCE TRUST | DECEMBER 31, 2011 | ||||
Table of Contents
investment strategy of the Portfolio with the Advisor and, based upon this discussion and other factors, concluded that the performance was reasonable. However, they requested the Portfolio’s Advisor provide additional Portfolio performance information to be reviewed with members of the equity subcommittee at each of their regular meetings over the course of the next year.
Advisory Fees and Expense Ratios
The Trustees considered the contractual advisory fee rate paid by the Portfolio to the Advisor and compared that rate to the information prepared by Lipper concerning management fee rates paid by other funds in the same Lipper category as the Portfolio. The Trustees recognized that Lipper reported the Portfolio’s management fee rate as the combined contractual advisory fee and the administration fee rates. The Trustees
considered the fee waiver and/or expense reimbursement arrangements currently in place for the Portfolio and considered the net advisory fee rate after taking into account any waivers and/or reimbursements. The Trustees recognized that it is difficult to make comparisons of advisory fees because there are variations in the services that are included in the fees paid by other funds. The Trustees’ determinations as a result of the review of the Portfolio’s advisory fees and expense ratios are summarized below:
The Trustees noted that the Portfolio’s net advisory fee and actual total expenses for Class 1 shares were in the first and second quintiles, respectively, of their Universe Group. After considering the factors identified above, in light of this information, the Trustees concluded that the advisory fees were reasonable.
| DECEMBER 31, 2011 | JPMORGAN INSURANCE TRUST | 29 | ||||||
Table of Contents
(Unaudited)
Certain tax information for the Portfolio is required to be provided to shareholders based upon the Portfolio’s income and distributions for the taxable year ended December 31, 2011. The information and distributions reported in this letter may differ from the information and taxable distributions reported to the shareholders for the calendar year ending December 31, 2011. The information necessary to complete your income tax returns
for the calendar year ending December 31, 2011 will be received under separate cover.
Dividends Received Deductions (DRD)
100.00% of ordinary income distributions were eligible for the 70% dividend received deduction for corporate rate shareholders for the fiscal year ended December 31, 2011.
| 30 | JPMORGAN INSURANCE TRUST | DECEMBER 31, 2011 | ||||
Table of Contents
J.P. Morgan Funds are distributed by JPMorgan Distribution Services, Inc., which is an affiliate of JPMorgan Chase & Co. Affiliates of JPMorgan Chase & Co. receive fees for providing various services to the funds.
Contact JPMorgan Distribution Services, Inc. at 1-800-480-4111 for a portfolio prospectus. You can also visit us at www.jpmorganfunds.com. Investors should carefully consider the investment objectives and risk as well as charges and expenses of the mutual fund before investing. The prospectus contains this and other information about the mutual fund. Read the prospectus carefully before investing.
The Portfolio files a complete schedule of its portfolio holdings for the first and third quarters of its fiscal year with the SEC on Form N-Q. The Portfolio’s Forms N-Q are available on the SEC’s website at http://www.sec.gov and may be reviewed and copied at the SEC’s Public Reference Room in Washington, DC. Information on the operation of the SEC’s Public Reference Room may be obtained by calling 1-800-SEC-0330. Shareholders may request the Form N-Q without charge by calling 1-800-480-4111 or by visiting the variable insurance portfolio section of the J.P. Morgan Funds’ website at www.jpmorganfunds.com.
A description of the Portfolio’s policies and procedures with respect to the disclosure of the Portfolio’s holdings is available in the prospectus and Statement of Additional Information.
A copy of proxy policies and procedures is available without charge upon request by calling 1-800-480-4111 and a description of such policies and procedures is on the SEC’s website at www.sec.gov. The Trustees have delegated the authority to vote proxies for securities owned by the Portfolio to the Advisor. A copy of the Portfolio’s voting record for the most recent 12-month period ended June 30 is available on the SEC’s website at www.sec.gov or at the Portfolio’s website at www.jpmorganfunds.com no later than August 31 of each year. The Portfolio’s proxy voting record will include, among other things, a brief description of the matter voted on for each portfolio security, and will state how each vote was cast, for example, for or against the proposal.
Table of Contents
| © JPMorgan Chase & Co., 2012. All rights reserved. December 2011. | AN-JPMITIMCP-1211 |
Table of Contents
Annual Report
JPMorgan Insurance Trust
December 31, 2011
JPMorgan Insurance Trust Mid Cap Growth Portfolio
NOT FDIC INSURED Ÿ NO BANK GUARANTEE Ÿ MAY LOSE VALUE
|  |
Table of Contents
Investments in the Portfolio are not bank deposits or obligations of, or guaranteed or endorsed by, any bank and are not insured or guaranteed by the FDIC, the Federal Reserve Board or any other government agency. You could lose money if you sell when the Portfolio’s share price is lower than when you invested.
Past performance is no guarantee for future performance. The general market views expressed in this report are opinions based on conditions through the end of the reporting period and are subject to change without notice based on market and other conditions. These views are not intended to predict the future performance of the Portfolio or the securities markets. References to specific securities and their issuers are for illustrative purposes only and are not intended to be, and should not be interpreted as, recommendations to purchase or sell such securities. Such views are not meant as investment advice and may not be relied on as an indication of trading intent on behalf of the Portfolio.
This Portfolio is intended to be a funding vehicle for variable annuity contracts and variable life insurance policies (collectively “Policies”) offered by separate accounts of participating insurance companies. Portfolio shares are also offered through qualified pension and retirement plans (“Eligible Plans”). Individuals may not purchase shares directly from the Portfolio.
Prospective investors should refer to the Portfolio’s prospectus for a discussion of the Portfolio’s investment objective, strategies and risks. Call J.P. Morgan Funds Service Center at 1-800-480-4111 for a prospectus containing more complete information about the Portfolio including management fees and other expenses. Please read it carefully before investing.
Table of Contents
JANUARY 25, 2012 (Unaudited)
Dear Shareholder:
Investors greeted 2011 in much the same way they welcomed 2010: with high hopes that an improving U.S. economy would finally get us back on course to recovery.
This optimism quickly faded as the European debt crisis and a host of other economic and geopolitical concerns cast a dark shadow on the prospects for future growth. The combination of weak global economic data, credit downgrades in the U.S. and in Europe, and escalating fears of contagion all resulted in a level of market volatility not seen since the financial crisis three years ago.
 |
“Investors greeted 2011 in much the same way they welcomed 2010: With high hopes that an improving U.S. economy would finally get us back on course to recovery.” |
Nonetheless, stocks have regained some of their footing, as positive fourth-quarter economic data on auto sales, payroll employment and manufacturing activity all appear to indicate that consumer confidence is improving and economic growth may be accelerating.
We remain cautious, however, since many of the same challenges that we experienced in 2011 — European debt concerns, uncertainty over monetary and fiscal stimulus, and soft economic data — will likely remain in place this year, laying the groundwork for continued market volatility.
Strong fourth quarter surge caps volatile year
The European debt crisis and other geopolitical and economic events created a generally volatile year for equities, culminating in major sell off in the third quarter. A strong fourth quarter comeback did little to reverse the losses, as the Standard & Poor’s 500 Index (“S&P500 Index”) ended the year with only slight gains. As of December 31, 2011, the Index had reached a level of 1,258, an increase of 2.1% from one year prior.
Large cap growth stocks lead style categories
Large cap stocks outpaced mid- and small-cap stocks over the 12-month period ended December 31, 2011 (the Russell 1000 Index returned 1.5% and the Russell Mid Cap Index returned -1.6%, compared to a return of -4.2% for the Russell 2000 Index). Overall, large-cap growth stocks fared better than large-cap value stocks as the Russell 1000 Growth Index returned 2.6% for the 12-month reporting period, compared to 0.4% for the Russell 1000 Value Index.
Euro zone uncertainty drives flight-to-quality sentiment
Investors’ lack of confidence in global economic growth prompted them to seek safe havens in U.S. Treasury securities, and high-quality corporate bonds. The Barclays Capital U.S. Aggregate Bond Index returned 7.8%. High yield bonds and emerging market debt securities also performed well, as the Barclays Capital High Yield Index returned 5.0%, and the Barclays Capital Emerging Markets Index returned 7.0% for the 12-month period ended December 31, 2011.
Similar economic concerns pushed yields of U.S. Treasury securities maturing in 10 years or more to historic lows throughout the year. As of the end of the 12-month period ended December 31, 2011, the yields on the benchmark 10-year U.S. Treasury bond dropped from 3.3% to 1.9%. In addition, yields on the 30-year U.S. Treasury bond declined from 4.3% to 2.9%, as did the two-year U.S. Treasury note, from 0.6% to 0.3%.
Lesson for 2012: Keep balance in mind in economic uncertainty
Last year offered its share of shocks to investors: geopolitical upheaval, natural disasters, sovereign-debt crises, and credit-rating downgrades were all among the events competing for the market’s attention. Against the backdrop of an election year, it’s likely that we will face continued global surprises — both on the upside and the downside.
As you reassess your investment strategy for the year ahead, it’s important to stick with a plan that focuses on diversification as well as long-term allocation. Trying to “time” market fluctuations can be risky business, especially given the ongoing uncertainty surrounding the direction of economic growth and the euro zone crisis in the months ahead.
On behalf of everyone at J.P. Morgan Asset Management, thank you for your continued confidence. We look forward to managing your investment needs for years to come. Should you have any questions, please visit www.jpmorganfunds.com or contact the J.P. Morgan Funds Service Center at 1-800-480-4111.
Sincerely yours,

George C.W. Gatch
CEO-Investment Management Americas
J.P. Morgan Asset Management
| DECEMBER 31, 2011 | JPMORGAN INSURANCE TRUST | 1 | ||||||
Table of Contents
JPMorgan Insurance Trust Mid Cap Growth Portfolio
PORTFOLIO COMMENTARY
TWELVE MONTHS ENDED DECEMBER 31, 2011 (Unaudited)
| REPORTING PERIOD RETURN: | ||||
| Portfolio (Class 1 Shares)* | -6.15% | |||
| Russell Midcap Growth Index | -1.65% | |||
| Net Assets as of 12/31/2011 | $ | 64,603,058 | ||
INVESTMENT OBJECTIVE**
The JPMorgan Insurance Trust Mid Cap Growth Portfolio (the “Portfolio”) seeks capital growth over the long term.
HOW DID THE MARKET PERFORM?
Strong corporate earnings and robust merger-and-acquisition activity encouraged investors and helped support U.S. stock prices during the beginning of the reporting period. However, uncertainty surrounding global economic growth began to dampen investors’ appetite for risk in April 2011. This negative mood among investors worsened as they seemed to lack confidence in the ability of European governments to combat the region’s debt crisis, stoking fear about economic contagion. Concerns about the credit downgrade of U.S.-issued debt exacerbated this negative sentiment among investors. Each of these factors helped trigger a sharp downturn in stock prices in the third quarter of 2011. Stocks rebounded in the fourth quarter of 2011 as better-than-expected economic data helped investors regain their appetite for risk. The Russell Midcap Growth Index (the “Benchmark”) finished the twelve months ended December 31, 2011 with a 1.65% loss.
WHAT WERE THE MAIN DRIVERS OF THE PORTFOLIO’S PERFORMANCE?
The Portfolio (Class 1 Shares) underperformed the Benchmark for the twelve months ended December 31, 2011. The Portfolio’s stock selection in the consumer discretionary and technology sectors detracted from relative performance, while the Portfolio’s stock selection in the health care and producer durables sectors contributed to relative performance.
Individual detractors from the Portfolio’s relative performance included the Portfolio’s positions in Lamar Advertising Co., Newfield Exploration Co. and OfficeMax, Inc. Lamar Advertising Co. lowered its forecast for second-quarter revenue, which hurt the stock during the reporting period. Shares of Newfield
Exploration Co. declined after the oil and gas operations company lowered its expectations for its fiscal 2011 natural gas production. Shares of office supplies retailer OfficeMax, Inc. declined after the company reported disappointing quarterly profit, as corporate customers spent less on office supplies and fewer shoppers visited its stores.
The Portfolio’s individual contributors to relative performance included the Fund’s positions in Valeant Pharmaceuticals International Inc., Humana, Inc. and W.W. Grainger, Inc. Shares of Valeant Pharmaceuticals International Inc. rose after the specialty pharmaceutical company completed its merger with Biovail Corp. and reported a positive outlook for 2011, suggesting that the integration of the two companies was proceeding faster than investors had initially anticipated. Shares of Humana, Inc., a U.S. Medicare managed-care provider, gained after the company raised its full-year profit forecast and issued a better-than-expected 2012 outlook. Shares of W.W. Grainger, Inc., an industrial supply manufacturer, benefited as the company continued to gain market share. In addition, the company raised the low end of its 2011 fiscal year guidance and issued a positive outlook for 2012.
HOW WAS THE PORTFOLIO POSITIONED?
The portfolio managers utilized a bottom-up approach to stock selection, rigorously researching individual companies in an effort to construct portfolios of stocks that have strong fundamentals. The portfolio managers preferred to invest in high quality companies with durable franchises that, in their view, possessed the ability to generate strong future earnings growth.
As a result of this bottom-up stock selection process, the Portfolio’s largest overweight versus the Benchmark was in the technology sector and the Portfolio’s largest underweight versus the Benchmark was in the consumer staples sector.
| 2 | JPMORGAN INSURANCE TRUST | DECEMBER 31, 2011 | ||||
Table of Contents
| TOP TEN EQUITY HOLDINGS OF THE PORTFOLIO*** | ||||||||
| 1. | W.W. Grainger, Inc. | 2.4 | % | |||||
| 2. | Concho Resources, Inc. | 2.2 | ||||||
| 3. | Valeant Pharmaceuticals International, Inc., (Canada) | 2.2 | ||||||
| 4. | Pall Corp. | 2.1 | ||||||
| 5. | Cameron International Corp. | 2.1 | ||||||
| 6. | Alliance Data Systems Corp. | 1.9 | ||||||
| 7. | FMC Corp. | 1.7 | ||||||
| 8. | Humana, Inc. | 1.7 | ||||||
| 9. | Harley-Davidson, Inc. | 1.6 | ||||||
| 10. | Wabtec Corp. | 1.6 | ||||||
PORTFOLIO COMPOSITION BY SECTOR*** | ||||
| Information Technology | 25.0 | % | ||
| Industrials | 21.0 | |||
| Consumer Discretionary | 18.4 | |||
| Health Care | 14.0 | |||
| Energy | 8.5 | |||
| Financials | 6.7 | |||
| Materials | 3.7 | |||
| Consumer Staples | 0.9 | |||
| Short-Term Investment | 1.8 | |||
| * | The return shown is based on net asset value calculated for shareholder transactions and may differ from the return shown in the financial highlights, which reflects adjustments made to the net asset value in accordance with accounting principles generally accepted in the United States of America. |
| ** | The advisor seeks to achieve the Portfolio’s objective. There can be no guarantee it will be achieved. |
| *** | Percentages indicated are based upon total investments (excluding Investments of Cash Collateral for Securities on Loan) as of December 31, 2011. The Portfolio’s composition is subject to change. |
| DECEMBER 31, 2011 | JPMORGAN INSURANCE TRUST | 3 | ||||||
Table of Contents
JPMorgan Insurance Trust Mid Cap Growth Portfolio
PORTFOLIO COMMENTARY
TWELVE MONTHS ENDED DECEMBER 31, 2011 (Unaudited) (continued)
AVERAGE ANNUAL TOTAL RETURNS AS OF DECEMBER 31, 2011 | ||||||||||||||||
| INCEPTION DATE OF CLASS | 1 YEAR | 5 YEAR | 10 YEAR | |||||||||||||
CLASS 1 SHARES | 8/01/94 | (6.15 | )% | 2.14 | % | 4.63 | % | |||||||||
CLASS 2 SHARES | 8/16/06 | (6.40 | ) | 1.88 | 4.49 | |||||||||||
TEN YEAR PERFORMANCE (12/31/01 TO 12/31/11)
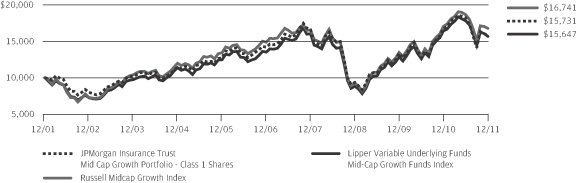
Source: Lipper, Inc. The performance quoted is past performance and is not a guarantee of future results. Mutual funds are subject to certain market risks. Investment returns and principal value of an investment will fluctuate so that an investor’s shares, when redeemed, may be worth more or less than their original cost. Current performance may be higher or lower than the performance data shown. For up-to-date month-end performance information please call 1-800-480-4111.
Returns for Class 2 Shares prior to their inception date are based on the performance of Class 1 Shares. The actual returns of Class 2 Shares would have been lower than shown because Class 2 Shares have higher expenses than Class 1 Shares.
The graph illustrates comparative performance for $10,000 invested in Class 1 Shares of the JPMorgan Insurance Trust Mid Cap Growth Portfolio, the Russell Midcap Growth Index and the Lipper Variable Underlying Funds Mid-Cap Growth Funds Index from December 31, 2001 to December 31, 2011. The performance of the Portfolio assumes reinvestment of all dividends and capital gains, if any. The performance of the Russell Midcap Growth Index does not reflect the deduction of expenses associated with a mutual fund and has been adjusted to reflect reinvestment of all dividends and capital gains of the securities included
in the benchmark. The performance of the Lipper Variable Underlying Funds Mid-Cap Growth Funds Index includes expenses associated with a mutual fund, such as investment management fees. These expenses are not identical to the expenses charged by the Portfolio. The Russell Midcap Growth Index is an unmanaged index which measures the performance of those Russell Midcap companies with higher price-to-book ratios and higher forecasted growth values. The Lipper Variable Underlying Funds Mid-Cap Growth Funds Index is an index based on the total returns of certain mutual funds within the Portfolio’s designated category as determined by Lipper, Inc. Investors cannot invest directly in an index.
The performance does not reflect any charges imposed by the Policies or Eligible Plans. If these charges were included, the returns would be lower than shown. Performance may reflect the waiver of the Portfolio’s fees and reimbursement of expenses for certain periods since the inception date. Without these waivers and reimbursements performance would have been lower.
The returns shown are based on net asset values calculated for shareholder transactions and may differ from the returns shown in the financial highlights, which reflect adjustments made to the net asset values in accordance with accounting principles generally accepted in the United States of America.
| 4 | JPMORGAN INSURANCE TRUST | DECEMBER 31, 2011 | ||||
Table of Contents
JPMorgan Insurance Trust Mid Cap Growth Portfolio
SCHEDULE OF PORTFOLIO INVESTMENTS
AS OF DECEMBER 31, 2011
| SHARES | SECURITY DESCRIPTION | VALUE($) | ||||||
| Common Stocks — 98.9% |
| ||||||
Consumer Discretionary — 18.6% | ||||||||
Auto Components — 1.4% | ||||||||
| 14,600 | BorgWarner, Inc. (a) | 930,604 | ||||||
|
| |||||||
Automobiles — 2.1% | ||||||||
| 26,700 | Harley-Davidson, Inc. | 1,037,829 | ||||||
| 11,900 | Tesla Motors, Inc. (a) | 339,864 | ||||||
|
| |||||||
| 1,377,693 | ||||||||
|
| |||||||
Diversified Consumer Services — 0.5% | ||||||||
| 11,100 | Sotheby’s | 316,683 | ||||||
|
| |||||||
Hotels, Restaurants & Leisure — 4.5% | ||||||||
| 48,667 | International Game Technology | 837,072 | ||||||
| 31,600 | Marriott International, Inc., Class A | 921,772 | ||||||
| 23,100 | Royal Caribbean Cruises Ltd. | 572,187 | ||||||
| 5,000 | Wynn Resorts Ltd. | 552,450 | ||||||
|
| |||||||
| 2,883,481 | ||||||||
|
| |||||||
Household Durables — 1.9% | ||||||||
| 8,300 | Tempur-Pedic International, Inc. (a) | 435,999 | ||||||
| 37,000 | Toll Brothers, Inc. (a) | 755,540 | ||||||
|
| |||||||
| 1,191,539 | ||||||||
|
| |||||||
Internet & Catalog Retail — 0.4% | ||||||||
| 3,600 | NetFlix, Inc. (a) | 249,444 | ||||||
|
| |||||||
Media — 1.4% | ||||||||
| 496,800 | Sirius XM Radio, Inc. (a) | 904,176 | ||||||
|
| |||||||
Specialty Retail — 2.3% | ||||||||
| 5,800 | Abercrombie & Fitch Co., Class A | 283,272 | ||||||
| 11,200 | Dick’s Sporting Goods, Inc. | 413,056 | ||||||
| 36,811 | Sally Beauty Holdings, Inc. (a) | 777,817 | ||||||
|
| |||||||
| 1,474,145 | ||||||||
|
| |||||||
Textiles, Apparel & Luxury Goods — 4.1% | ||||||||
| 11,100 | Coach, Inc. | 677,544 | ||||||
| 6,600 | Deckers Outdoor Corp. (a) | 498,762 | ||||||
| 5,700 | Fossil, Inc. (a) | 452,352 | ||||||
| 10,900 | Lululemon Athletica, Inc., (Canada) (a) | 508,594 | ||||||
| 19,000 | Michael Kors Holdings Ltd., (Hong Kong) (a) | 517,750 | ||||||
|
| |||||||
| 2,655,002 | ||||||||
|
| |||||||
Total Consumer Discretionary | 11,982,767 | |||||||
|
| |||||||
Consumer Staples — 0.9% | ||||||||
Food Products — 0.9% | ||||||||
| 8,600 | Diamond Foods, Inc. | 277,522 | ||||||
| 6,500 | Green Mountain Coffee Roasters, Inc. (a) | 291,525 | ||||||
|
| |||||||
Total Consumer Staples | 569,047 | |||||||
|
| |||||||
| SHARES | SECURITY DESCRIPTION | VALUE($) | ||||||
Energy — 8.5% | ||||||||
Energy Equipment & Services — 4.0% | ||||||||
| 27,170 | Cameron International Corp. (a) | 1,336,493 | ||||||
| 3,300 | CARBO Ceramics, Inc. | 406,989 | ||||||
| 7,200 | Core Laboratories N.V., (Netherlands) | 820,440 | ||||||
|
| |||||||
| 2,563,922 | ||||||||
|
| |||||||
Oil, Gas & Consumable Fuels — 4.5% | ||||||||
| 15,400 | Concho Resources, Inc. (a) | 1,443,750 | ||||||
| 10,700 | Laredo Petroleum Holdings, Inc. (a) | 238,610 | ||||||
| 14,100 | Newfield Exploration Co. (a) | 531,993 | ||||||
| 11,900 | Range Resources Corp. | 737,086 | ||||||
|
| |||||||
| 2,951,439 | ||||||||
|
| |||||||
Total Energy | 5,515,361 | |||||||
|
| |||||||
Financials — 6.7% | ||||||||
Capital Markets — 3.7% | ||||||||
| 40,400 | Blackstone Group LP (The) | 566,004 | ||||||
| 21,600 | Lazard Ltd., (Bermuda), Class A | 563,976 | ||||||
| 39,320 | Och-Ziff Capital Management Group LLC, Class A | 330,681 | ||||||
| 16,280 | T. Rowe Price Group, Inc. | 927,146 | ||||||
|
| |||||||
| 2,387,807 | ||||||||
|
| |||||||
Commercial Banks — 1.0% | ||||||||
| 12,600 | BOK Financial Corp. | 692,118 | ||||||
|
| |||||||
Diversified Financial Services — 1.1% | ||||||||
| 20,800 | Moody’s Corp. | 700,544 | ||||||
|
| |||||||
Real Estate Investment Trusts (REITs) — 0.9% |
| |||||||
| 19,700 | ProLogis, Inc. | 563,223 | ||||||
|
| |||||||
Total Financials | 4,343,692 | |||||||
|
| |||||||
Health Care — 14.1% | ||||||||
Biotechnology — 1.8% | ||||||||
| 11,400 | Alexion Pharmaceuticals, Inc. (a) | 815,100 | ||||||
| 10,300 | Vertex Pharmaceuticals, Inc. (a) | 342,063 | ||||||
|
| |||||||
| 1,157,163 | ||||||||
|
| |||||||
Health Care Equipment & Supplies — 1.9% |
| |||||||
| 13,400 | Sirona Dental Systems, Inc. (a) | 590,136 | ||||||
| 19,800 | Thoratec Corp. (a) | 664,488 | ||||||
|
| |||||||
| 1,254,624 | ||||||||
|
| |||||||
Health Care Providers & Services — 5.0% |
| |||||||
| 48,100 | Brookdale Senior Living, Inc. (a) | 836,459 | ||||||
| 20,100 | Coventry Health Care, Inc. (a) | 610,437 | ||||||
| 12,410 | Humana, Inc. | 1,087,240 | ||||||
| 27,100 | Lincare Holdings, Inc. | 696,741 | ||||||
|
| |||||||
| 3,230,877 | ||||||||
|
| |||||||
SEE NOTES TO FINANCIAL STATEMENTS.
| DECEMBER 31, 2011 | JPMORGAN INSURANCE TRUST | 5 | ||||||
Table of Contents
JPMorgan Insurance Trust Mid Cap Growth Portfolio
SCHEDULE OF PORTFOLIO INVESTMENTS
AS OF DECEMBER 31, 2011 (continued)
| SHARES | SECURITY DESCRIPTION | VALUE($) | ||||||
| Common Stocks — Continued |
| ||||||
Life Sciences Tools & Services — 2.1% |
| |||||||
| 21,700 | Agilent Technologies, Inc. (a) | 757,981 | ||||||
| 27,300 | Bruker Corp. (a) | 339,066 | ||||||
| 8,520 | Illumina, Inc. (a) | 259,690 | ||||||
|
| |||||||
| 1,356,737 | ||||||||
|
| |||||||
Pharmaceuticals — 3.3% | ||||||||
| 7,100 | Perrigo Co. | 690,830 | ||||||
| 30,600 | Valeant Pharmaceuticals International, Inc., (Canada) (a) | 1,428,714 | ||||||
|
| |||||||
| 2,119,544 | ||||||||
|
| |||||||
Total Health Care | 9,118,945 | |||||||
|
| |||||||
Industrials — 21.2% | ||||||||
Aerospace & Defense — 1.7% | ||||||||
| 1,814 | Goodrich Corp. | 224,392 | ||||||
| 9,347 | TransDigm Group, Inc. (a) | 894,321 | ||||||
|
| |||||||
| 1,118,713 | ||||||||
|
| |||||||
Building Products — 1.1% | ||||||||
| 16,600 | Armstrong World Industries, Inc. (a) | 728,242 | ||||||
|
| |||||||
Commercial Services & Supplies — 1.2% | ||||||||
| 10,040 | Stericycle, Inc. (a) | 782,317 | ||||||
|
| |||||||
Electrical Equipment — 2.1% | ||||||||
| 11,000 | Cooper Industries plc | 595,650 | ||||||
| 8,410 | Roper Industries, Inc. | 730,576 | ||||||
|
| |||||||
| 1,326,226 | ||||||||
|
| |||||||
Industrial Conglomerates — 1.3% | ||||||||
| 19,600 | Carlisle Cos., Inc. | 868,280 | ||||||
|
| |||||||
Machinery — 6.3% | ||||||||
| 11,200 | AGCO Corp. (a) | 481,264 | ||||||
| 7,200 | Cummins, Inc. | 633,744 | ||||||
| 24,300 | Pall Corp. | 1,388,745 | ||||||
| 7,300 | Parker Hannifin Corp. | 556,625 | ||||||
| 14,597 | Wabtec Corp. | 1,021,060 | ||||||
|
| |||||||
| 4,081,438 | ||||||||
|
| |||||||
Professional Services — 1.3% | ||||||||
| 9,400 | IHS, Inc., Class A (a) | 809,904 | ||||||
|
| |||||||
Road & Rail — 1.8% | ||||||||
| 34,400 | Avis Budget Group, Inc. (a) | 368,768 | ||||||
| 17,000 | J.B. Hunt Transport Services, Inc. | 766,190 | ||||||
|
| |||||||
| 1,134,958 | ||||||||
|
| |||||||
Trading Companies & Distributors — 4.4% | ||||||||
| 30,800 | Air Lease Corp. (a) (c) | 730,268 | ||||||
| 7,708 | MSC Industrial Direct Co., Inc., Class A | 551,507 | ||||||
| SHARES | SECURITY DESCRIPTION | VALUE($) | ||||||
Trading Companies & Distributors — Continued |
| |||||||
| 8,239 | W.W. Grainger, Inc. | 1,542,259 | ||||||
|
| |||||||
| 2,824,034 | ||||||||
|
| |||||||
Total Industrials | 13,674,112 | |||||||
|
| |||||||
Information Technology — 25.2% | ||||||||
Communications Equipment — 3.1% | ||||||||
| 22,400 | Aruba Networks, Inc. (a) | 414,848 | ||||||
| 8,700 | F5 Networks, Inc. (a) | 923,244 | ||||||
| 38,800 | Polycom, Inc. (a) | 632,440 | ||||||
|
| |||||||
| 1,970,532 | ||||||||
|
| |||||||
Computers & Peripherals — 0.8% | ||||||||
| 14,800 | NetApp, Inc. (a) | 536,796 | ||||||
|
| |||||||
Electronic Equipment, Instruments & Components — 1.1% |
| |||||||
| 21,900 | TE Connectivity Ltd., (Switzerland) | 674,739 | ||||||
|
| |||||||
Internet Software & Services — 1.3% | ||||||||
| 8,200 | OpenTable, Inc. (a) | 320,866 | ||||||
| 12,600 | Rackspace Hosting, Inc. (a) | 541,926 | ||||||
|
| |||||||
| 862,792 | ||||||||
|
| |||||||
IT Services — 4.2% | ||||||||
| 12,070 | Alliance Data Systems Corp. (a) (c) | 1,253,349 | ||||||
| 20,350 | CGI Group, Inc., (Canada), Class A (a) | 383,597 | ||||||
| 17,300 | FleetCor Technologies, Inc. (a) | 516,751 | ||||||
| 14,700 | VeriFone Systems, Inc. (a) | 522,144 | ||||||
|
| |||||||
| 2,675,841 | ||||||||
|
| |||||||
Office Electronics — 0.6% | ||||||||
| 11,500 | Zebra Technologies Corp., Class A (a) | 411,470 | ||||||
|
| |||||||
Semiconductors & Semiconductor Equipment — 5.5% |
| |||||||
| 24,200 | Avago Technologies Ltd., (Singapore) | 698,412 | ||||||
| 36,400 | Freescale Semiconductor Holdings I Ltd. (a) (c) | 460,460 | ||||||
| 15,600 | KLA-Tencor Corp. | 752,700 | ||||||
| 21,600 | Microchip Technology, Inc. | 791,208 | ||||||
| 26,800 | Xilinx, Inc. | 859,208 | ||||||
|
| |||||||
| 3,561,988 | ||||||||
|
| |||||||
Software — 8.6% | ||||||||
| 12,500 | Citrix Systems, Inc. (a) | 759,000 | ||||||
| 9,400 | Concur Technologies, Inc. (a) | 477,426 | ||||||
| 5,700 | FactSet Research Systems, Inc. | 497,496 | ||||||
| 24,300 | Fortinet, Inc. (a) | 529,983 | ||||||
| 14,100 | MICROS Systems, Inc. (a) | 656,778 | ||||||
| 33,500 | Nuance Communications, Inc. (a) | 842,860 | ||||||
| 18,500 | Red Hat, Inc. (a) | 763,865 | ||||||
| 4,000 | Salesforce.com, Inc. (a) | 405,840 | ||||||
| 13,000 | TIBCO Software, Inc. (a) | 310,830 | ||||||
SEE NOTES TO FINANCIAL STATEMENTS.
| 6 | JPMORGAN INSURANCE TRUST | DECEMBER 31, 2011 | ||||
Table of Contents
| SHARES | SECURITY DESCRIPTION | VALUE($) | ||||||
| Common Stocks — Continued |
| ||||||
Software — Continued |
| |||||||
| 35,300 | Zynga, Inc., Class A (a) | 332,173 | ||||||
|
| |||||||
| 5,576,251 | ||||||||
|
| |||||||
Total Information Technology | 16,270,409 | |||||||
|
| |||||||
Materials — 3.7% |
| |||||||
Chemicals — 3.1% |
| |||||||
| 13,100 | FMC Corp. | 1,127,124 | ||||||
| 9,700 | Sherwin-Williams Co. (The) | 865,919 | ||||||
|
| |||||||
| 1,993,043 | ||||||||
|
| |||||||
Containers & Packaging — 0.6% |
| |||||||
| 9,100 | Greif, Inc., Class A | 414,505 | ||||||
|
| |||||||
Total Materials | 2,407,548 | |||||||
|
| |||||||
Total Common Stocks | 63,881,881 | |||||||
|
| |||||||
| Short-Term Investment — 1.8% |
| ||||||
Investment Company — 1.8% |
| |||||||
| 1,171,645 | JPMorgan Liquid Assets Money Market Fund, Institutional Class Shares, 0.110% (b) (l) (m) | 1,171,645 | ||||||
|
| |||||||
| Investment of Cash Collateral for Securities on Loan — 3.2% |
| ||||||
Investment Company —3.2% |
| |||||||
| 2,076,808 | JPMorgan Prime Money Market Fund, Capital Shares, 0.120% (b) (l) | 2,076,808 | ||||||
|
| |||||||
Total Investments — 103.9% | 67,130,334 | |||||||
Liabilities in Excess of | (2,527,276 | ) | ||||||
|
| |||||||
NET ASSETS — 100.0% | $ | 64,603,058 | ||||||
|
| |||||||
Percentages indicated are based on net assets.
NOTES TO SCHEDULE OF PORTFOLIO INVESTMENTS:
| (a) | — Non-income producing security. | |
| (b) | — Investment in affiliate. Money market fund registered under the Investment Company Act of 1940, as amended, and advised by J.P. Morgan Investment Management Inc. | |
| (c) | — Security, or a portion of the security, has been delivered to a counterparty as part of a security lending transaction. | |
| (l) | — The rate shown is the current yield as of December 31, 2011. | |
| (m) | — All or a portion of this security is reserved and/or pledged with the custodian for current or potential holdings of futures, swaps, options, TBAs, when-issued securities, delayed delivery securities, reverse repurchase agreements, unfunded commitments and/or forward foreign currency exchange contracts. |
SEE NOTES TO FINANCIAL STATEMENTS.
| DECEMBER 31, 2011 | JPMORGAN INSURANCE TRUST | 7 | ||||||
Table of Contents
STATEMENT OF ASSETS AND LIABILITIES
AS OF DECEMBER 31, 2011
| Mid Cap Growth Portfolio | ||||
ASSETS: | ||||
Investments in non-affiliates, at value | $ | 63,881,881 | ||
Investments in affiliates, at value | 3,248,453 | |||
|
| |||
Total investment securities, at value | 67,130,334 | |||
Receivables: | ||||
Investment securities sold | 247,024 | |||
Portfolio shares sold | 3,264 | |||
Dividends from non-affiliates | 28,535 | |||
Dividends from affiliates | 154 | |||
Securities lending income | 437 | |||
|
| |||
Total Assets | 67,409,748 | |||
|
| |||
LIABILITIES: | ||||
Payables: | ||||
Investment securities purchased | 323,949 | |||
Collateral for securities lending program | 2,076,808 | |||
Portfolio shares redeemed | 311,916 | |||
Accrued liabilities: | ||||
Investment advisory fees | 36,055 | |||
Administration fees | 4,922 | |||
Distribution fees | 4 | |||
Custodian and accounting fees | 7,340 | |||
Trustees’ and Chief Compliance Officer’s fees | 22 | |||
Other | 45,674 | |||
|
| |||
Total Liabilities | 2,806,690 | |||
|
| |||
Net Assets | $ | 64,603,058 | ||
|
| |||
NET ASSETS: | ||||
Paid in capital | $ | 61,105,660 | ||
Accumulated net investment loss | (3,930 | ) | ||
Accumulated net realized gains (losses) | (347,387 | ) | ||
Net unrealized appreciation (depreciation) | 3,848,715 | |||
|
| |||
Total Net Assets | $ | 64,603,058 | ||
|
| |||
Net Assets: | ||||
Class 1 | $ | 64,585,309 | ||
Class 2 | 17,749 | |||
|
| |||
Total | $ | 64,603,058 | ||
|
| |||
Outstanding units of beneficial interest (shares) | ||||
(unlimited number of shares authorized, no par value): | ||||
Class 1 | 4,068,319 | |||
Class 2 | 1,135 | |||
Net Asset Value, offering and redemption price per share: (a) | ||||
Class 1 | $ | 15.88 | ||
Class 2 | 15.64 | |||
Cost of investments in non-affiliates | $ | 60,033,166 | ||
Cost of investments in affiliates | 3,248,453 | |||
Value of securities on loan | 2,022,738 | |||
| (a) | Per share amounts may not recalculate due to rounding of net assets and/or shares outstanding. |
SEE NOTES TO FINANCIAL STATEMENTS.
| 8 | JPMORGAN INSURANCE TRUST | DECEMBER 31, 2011 | ||||
Table of Contents
STATEMENT OF OPERATIONS
FOR THE YEAR ENDED DECEMBER 31, 2011
| Mid Cap Growth Portfolio | ||||
INVESTMENT INCOME: | ||||
Dividend income from non-affiliates | $ | 555,758 | ||
Dividend income from affiliates | 1,212 | |||
Income from securities lending (net) | 16,166 | |||
|
| |||
Total investment income | 573,136 | |||
|
| |||
EXPENSES: | ||||
Investment advisory fees | 485,907 | |||
Administration fees | 66,188 | |||
Distribution fees — Class 2 | 47 | |||
Custodian and accounting fees | 16,228 | |||
Interest expense to affiliates | 44 | |||
Professional fees | 22,426 | |||
Trustees’ and Chief Compliance Officer’s fees | 807 | |||
Printing and mailing costs | 25,727 | |||
Transfer agent fees | 13,872 | |||
Other | 12,013 | |||
|
| |||
Total expenses | 643,259 | |||
|
| |||
Less amounts waived | (11,143 | ) | ||
Less earnings credits | — | (a) | ||
|
| |||
Net expenses | 632,116 | |||
|
| |||
Net investment income (loss) | (58,980 | ) | ||
|
| |||
REALIZED/UNREALIZED GAINS (LOSSES): | ||||
Net realized gain (loss) on transactions from investments in non-affiliates | 10,905,639 | |||
Change in net unrealized appreciation (depreciation) of investments in non-affiliates | (14,869,670 | ) | ||
|
| |||
Net realized/unrealized gains (losses) | (3,964,031 | ) | ||
|
| |||
Change in net assets resulting from operations | $ | (4,023,011 | ) | |
|
| |||
| (a) | Amount rounds to less than $1. |
SEE NOTES TO FINANCIAL STATEMENTS.
| DECEMBER 31, 2011 | JPMORGAN INSURANCE TRUST | 9 | ||||||
Table of Contents
STATEMENTS OF CHANGES IN NET ASSETS
FOR THE PERIODS INDICATED
| Mid Cap Growth Portfolio | ||||||||
| Year Ended 12/31/2011 | Year Ended 12/31/2010 | |||||||
CHANGE IN NET ASSETS RESULTING FROM OPERATIONS: | ||||||||
Net investment income (loss) | $ | (58,980 | ) | $ | (80,543 | ) | ||
Net realized gain (loss) | 10,905,639 | 11,855,953 | ||||||
Change in net unrealized appreciation (depreciation) | (14,869,670 | ) | 6,165,514 | |||||
|
|
|
| |||||
Change in net assets resulting from operations | (4,023,011 | ) | 17,940,924 | |||||
|
|
|
| |||||
CAPITAL TRANSACTIONS: | ||||||||
Change in net assets from capital transactions | (12,013,249 | ) | (18,299,561 | ) | ||||
|
|
|
| |||||
NET ASSETS: | ||||||||
Change in net assets | (16,036,260 | ) | (358,637 | ) | ||||
Beginning of period | 80,639,318 | 80,997,955 | ||||||
|
|
|
| |||||
End of period | $ | 64,603,058 | $ | 80,639,318 | ||||
|
|
|
| |||||
Accumulated net investment loss | $ | (3,930 | ) | $ | (3,894 | ) | ||
|
|
|
| |||||
CAPITAL TRANSACTIONS: | ||||||||
Class 1 | ||||||||
Proceeds from shares issued | $ | 4,665,862 | $ | 4,191,356 | ||||
Cost of shares redeemed | (16,679,111 | ) | (22,490,917 | ) | ||||
|
|
|
| |||||
Change in net assets from Class 1 capital transactions | $ | (12,013,249 | ) | $ | (18,299,561 | ) | ||
|
|
|
| |||||
Total change in net assets from capital transactions | $ | (12,013,249 | ) | $ | (18,299,561 | ) | ||
|
|
|
| |||||
SHARE TRANSACTIONS: | ||||||||
Class 1 | ||||||||
Issued | 283,951 | 299,441 | ||||||
Redeemed | (982,212 | ) | (1,548,620 | ) | ||||
|
|
|
| |||||
Change in Class 1 Shares | (698,261 | ) | (1,249,179 | ) | ||||
|
|
|
| |||||
SEE NOTES TO FINANCIAL STATEMENTS.
| 10 | JPMORGAN INSURANCE TRUST | DECEMBER 31, 2011 | ||||
Table of Contents
THIS PAGE IS INTENTIONALLY LEFT BLANK
| DECEMBER 31, 2011 | JPMORGAN INSURANCE TRUST | 11 | ||||||
Table of Contents
FOR THE PERIODS INDICATED
| Per share operating performance | ||||||||||||||||||||
| Investment operations | Distributions | |||||||||||||||||||
| Net asset value, beginning of period | Net investment income (loss) | Net realized and unrealized gains (losses) on investments | Total from investment operations | Net realized gain | ||||||||||||||||
Mid Cap Growth Portfolio | ||||||||||||||||||||
Class 1 | ||||||||||||||||||||
Year Ended December 31, 2011 | $ | 16.91 | $ | (0.02 | ) | $ | (1.01 | ) | $ | (1.03 | ) | $ | — | |||||||
Year Ended December 31, 2010 | 13.46 | (0.02 | ) | 3.47 | 3.45 | — | ||||||||||||||
Year Ended December 31, 2009 | 9.41 | (0.02 | ) | 4.07 | 4.05 | — | ||||||||||||||
Year Ended December 31, 2008 | 20.69 | (0.05 | ) | (7.84 | ) | (7.89 | ) | (3.39 | ) | |||||||||||
Year Ended December 31, 2007 | 21.26 | (0.09 | ) | 3.25 | 3.16 | (3.73 | ) | |||||||||||||
Class 2 | ||||||||||||||||||||
Year Ended December 31, 2011 | 16.71 | (0.05 | ) | (1.02 | ) | (1.07 | ) | — | ||||||||||||
Year Ended December 31, 2010 | 13.33 | (0.04 | ) | 3.42 | 3.38 | — | ||||||||||||||
Year Ended December 31, 2009 | 9.34 | (0.03 | ) | 4.02 | 3.99 | — | ||||||||||||||
Year Ended December 31, 2008 | 20.62 | (0.06 | ) | (7.83 | ) | (7.89 | ) | (3.39 | ) | |||||||||||
Year Ended December 31, 2007 | 21.24 | (0.13 | ) | 3.24 | 3.11 | (3.73 | ) | |||||||||||||
| (a) | Includes adjustments in accordance with accounting principles generally accepted in the United States of America and as such, the net asset value for financial reporting purposes and the returns based upon those net asset values may differ from the net asset value and returns for shareholder transactions. |
| (b) | Includes earnings credits and interest expense, each of which is less than 0.01%, if applicable or unless otherwise noted. |
SEE NOTES TO FINANCIAL STATEMENTS.
| 12 | JPMORGAN INSURANCE TRUST | DECEMBER 31, 2011 | ||||
Table of Contents
| Ratios/Supplemental data | |||||||||||||||||||||||||
| Ratios to average net assets | ||||||||||||||||||||||||||
| Net asset value, end of period | Total return (a) | Net assets, end of period | Net expenses (b) | Net investment income (loss) | Expenses without waivers, reimbursements and earnings credits | Portfolio turnover rate | ||||||||||||||||||||
| $ | 15.88 | (6.09 | )% | $ | 64,585,309 | 0.85 | % | (0.08 | )% | 0.86 | % | 72 | % | |||||||||||||
| 16.91 | 25.63 | 80,620,361 | 0.90 | (0.10 | ) | 0.97 | 76 | |||||||||||||||||||
| 13.46 | 43.04 | 80,982,829 | 0.90 | (0.14 | ) | 1.03 | 85 | |||||||||||||||||||
| 9.41 | (43.78 | ) | 66,522,316 | 0.90 | (0.31 | ) | 0.91 | 95 | ||||||||||||||||||
| 20.69 | 17.24 | 150,278,599 | 0.89 | (0.42 | ) | 0.89 | 107 | |||||||||||||||||||
| 15.64 | (6.40 | ) | 17,749 | 1.09 | (0.32 | ) | 1.11 | 72 | ||||||||||||||||||
| 16.71 | 25.36 | 18,957 | 1.15 | (0.34 | ) | 1.22 | 76 | |||||||||||||||||||
| 13.33 | 42.72 | 15,126 | 1.15 | (0.40 | ) | 1.28 | 85 | |||||||||||||||||||
| 9.34 | (43.96 | ) | 10,596 | 1.15 | (0.56 | ) | 1.16 | 95 | ||||||||||||||||||
| 20.62 | 16.98 | 18,987 | 1.14 | (0.67 | ) | 1.14 | 107 | |||||||||||||||||||
SEE NOTES TO FINANCIAL STATEMENTS.
| DECEMBER 31, 2011 | JPMORGAN INSURANCE TRUST | 13 | ||||||
Table of Contents
AS OF DECEMBER 31, 2011
1. Organization
JPMorgan Insurance Trust (the “Trust”) is registered under the Investment Company Act of 1940, as amended (the “1940 Act”), as an open-end management investment company and is a Massachusetts business trust.
The following is a separate Portfolio of the Trust (the “Portfolio”) covered by this report:
| Classes Offered | Diversified/Non-Diversified | |||
| Mid Cap Growth Portfolio | Class 1 and Class 2 | Diversified |
The Portfolio seeks capital growth over the long term.
Portfolio shares are offered only to separate accounts of participating insurance companies and Eligible Plans. Individuals may not purchase shares directly from the Portfolio.
All classes of shares have equal rights as to earnings, assets and voting privileges except that each class may bear different distribution and service fees, and each class has exclusive voting rights with respect to its distribution plan or administrative services plan.
2. Significant Accounting Policies
The following is a summary of significant accounting policies followed by the Trust in the preparation of its financial statements. The policies are in accordance with accounting principles generally accepted in the United States of America. The preparation of financial statements requires management to make estimates and assumptions that affect the reported amounts of assets and liabilities at the date of the financial statements and the reported amounts of income and expenses for the period. Actual results could differ from those estimates.
A. Valuation of Investments — Equity securities listed on a North American, Central American, South American or Caribbean securities exchange shall generally be valued at the last sale price on the exchange on which the security is principally traded that is reported before the time when the net assets of the Portfolio are valued. The value of securities listed on The NASDAQ Stock Market LLC shall generally be the NASDAQ Official Closing Price. Fixed income securities (other than certain short-term investments maturing in less than 61 days) are valued each day based on prices received from independent or affiliated pricing services approved by the Board of Trustees or third party broker-dealers. The broker-dealers or pricing services use multiple valuation techniques to determine fair value. In instances where sufficient market activity exists, the broker-dealers or pricing services may utilize a market-based approach through which quotes from market makers are used to determine fair value. In instances where sufficient market activity may not exist or is limited, the broker-dealers or pricing services also utilize proprietary valuation models which may consider market transactions in comparable securities and the various relationships between securities in determining value and/or market characteristics such as benchmark yield curves, option-adjusted spreads, credit spreads, estimated default rates, coupon-rates, anticipated timing of principal repayments, underlying collateral and other unique security features in order to estimate the relevant cash flows, which are then discounted to calculate the fair values. Generally, short-term investments of sufficient credit quality maturing in less than 61 days are valued at amortized cost, which approximates market value. Certain investments of the Portfolio may, depending upon market conditions, trade in relatively thin markets and/or in markets that experience significant volatility. As a result of these conditions, the prices used by the Portfolio to value securities may differ from the value that would be realized if these securities were sold, and the differences could be material. Futures and options shall generally be valued on the basis of available market quotations. Swaps and other derivatives are valued daily, primarily using independent or affiliated pricing services approved by the Board of Trustees. If valuations are not available from such services or values received are deemed not representative of market value, values will be obtained from a third party broker-dealer or counterparty. Investments in other open-end investment companies are valued at such investment company’s net asset value per share as of the report date.
Securities or other assets for which market quotations are not readily available or for which market quotations do not represent the value at the time of pricing (including certain illiquid securities) are fair valued in accordance with procedures established by and under the supervision and responsibility of the Board of Trustees. Under these procedures, the Portfolio primarily employs a market-based approach which may use related or comparable assets or liabilities, recent transactions, market multiples, book values, and other relevant information for the investment to determine the fair value of the investment. The Portfolio may also use an income-based valuation approach in which the anticipated future cash flows of the investment are discounted to calculate fair value. Discounts may also be applied due to the nature or duration of any restrictions on the disposition of the investments. Valuations may be based upon current market prices of securities that are comparable in coupon, rating, maturity and industry. It is possible that the estimated values may differ significantly from the values that would have been used had a ready market for the investments existed, and such differences could be material. Trading in securities on most foreign exchanges and over-the-counter markets is normally completed before the close of the domestic market and may also take place on days when the domestic market is closed. In accordance with procedures adopted by the Board of Trustees, the Portfolio applies fair value pricing on equity securities on a daily basis, except for North American, Central American, South American and Caribbean equity securities held in its portfolio, by utilizing the quotations of an independent pricing service, unless the Portfolio’s advisor determines that use of another valuation methodology is appropriate. The pricing service uses statistical analyses and quantitative models to adjust local market prices using factors such as subsequent movement and changes in the prices of indices, securities and exchange rates in other markets, in determining fair value as of the time the Portfolio calculates its net asset values.
Valuations reflected in this report are as of the report date. As a result, changes in valuation due to market events and/or issuer related events after the report date and prior to issuance of the report are not reflected herein.
| 14 | JPMORGAN INSURANCE TRUST | DECEMBER 31, 2011 | ||||
Table of Contents
The various inputs that are used in determining the fair value of the Portfolio’s investments are summarized into the three broad levels listed below:
| Ÿ | Level 1 — quoted prices in active markets for identical securities |
| Ÿ | Level 2 — other significant observable inputs (including quoted prices for similar securities, interest rates, prepayment speeds, credit risk, etc.) |
| Ÿ | Level 3 — significant unobservable inputs (including the Portfolio’s own assumptions in determining the fair value of investments) |
A financial instrument’s level within the fair value hierarchy is based on the lowest level of any input both individually and in aggregate that is significant to the fair value measurement. The inputs or methodology used for valuing securities are not necessarily an indication of the risk associated with investing in those securities.
The following table represents each valuation input as presented on the Schedule of Portfolio Investments (“SOI”):
Level 1 Quoted prices | Level 2 Other significant observable inputs | Level 3 Significant unobservable inputs | Total | |||||||||||||
Total Investments in Securities (a) | $ | 67,130,334 | $ | — | $ | — | $ | 67,130,334 | ||||||||
|
|
|
|
|
|
|
| |||||||||
| (a) | Portfolio holdings designated as Level 1 are disclosed individually in the SOI. Please refer to the SOI for industry specifics of portfolio holdings. |
There were no transfers between Levels 1 and 2 during the year ended December 31, 2011.
B. Securities Lending — The Portfolio may lend securities to brokers approved by J.P. Morgan Investment Management Inc. (“JPMIM” or the “Advisor”) in order to generate additional income. The Goldman Sachs Bank USA, doing business as Goldman Sachs Agency Lending (“GSAL”), serves as lending agent for the Portfolio pursuant to a Securities Lending Agreement (the “GSAL Securities Lending Agreement”). Prior to March 1, 2011, JPMorgan Chase Bank, N.A. (“JPMCB”), an affiliate of the Portfolio, served as lending agent for the Portfolio pursuant to a Securities Lending Agreement (the “JPMCB Securities Lending Agreement”). Securities loaned are collateralized by cash, which is invested in Capital Shares of the JPMorgan Prime Money Market Fund. Upon termination of the loan, the Portfolio is required to return to the borrower the posted cash collateral. Loans are subject to termination by the Portfolio or the borrower at any time.
Securities lending income is comprised of income earned on cash collateral investments (“Collateral Investments”), net of a rebate received from or paid to borrowers for use of cash collateral and lending agent fees. This amount is recorded as Income from securities lending (net) on the Statement of Operations. The Portfolio also receives payments from the borrower during the period of the loan, equivalent to dividends and interest earned on the securities loaned, which are recorded as Dividend or Interest income, respectively, on the Statement of Operations.
For the year ended December 31, 2011, the Portfolio earned $1,774 from the investment of cash collateral, prior to rebates or fees, from an investment in an affiliated fund as described below.
Under the GSAL Securities Lending Agreement, at the inception of a loan, securities are exchanged for cash collateral equal to at least 102% of the value of loaned U.S. securities plus accrued interest. The GSAL Securities Lending Agreement requires that the loaned securities be marked to market on a daily basis and additional cash collateral is requested from borrowers when the cash received from borrowers becomes less than 102% of the value of loaned securities. Under the JPMCB Securities Lending Agreement, at the inception of a loan, securities were exchanged for cash collateral equal to at least 102% of the value of loaned U.S. dollar-denominated securities, plus accrued interest, and 105% of the value of loaned non-dollar-denominated securities, plus accrued interest. The JPMCB Securities Lending Agreement required that the loaned securities be marked to market on a daily basis and additional cash collateral is requested from borrowers when the cash received from borrowers becomes less than 102% and 105% of the value of loaned U.S. dollar-denominated and non-dollar-denominated securities, respectively, subject to certain de minimis guidelines.
The value of the cash collateral received is recorded as a liability on the Statement of Assets and Liabilities and details of Collateral Investments are disclosed in the SOI. At December 31, 2011, the value of outstanding securities on loan and the value of Collateral Investments were as follows:
| Value of Securities on Loan | Cash Collateral Posted by Borrower | Total Value of Collateral Investments | ||||||||||
| $ | 2,022,738 | $ | 2,076,808 | $ | 2,076,808 | |||||||
The Portfolio bears the risk of loss associated with the Collateral Investments and is not entitled to additional collateral from the borrower to cover any such losses. To the extent that the value of the Collateral Investments declines below the amount owed to a borrower, the Portfolio may incur losses that exceed the amount it earned on lending the security. Upon termination of a loan, the Portfolio may use leverage (borrow money) to repay the borrower for cash collateral posted if the Advisor does not believe that it is prudent to sell the Collateral Investments to fund the payment of this liability.
Securities lending also involves counterparty risks, including the risk that the loaned securities may not be returned in a timely manner or at all. Subject to certain conditions, JPMCB and GSAL have agreed to indemnify the Portfolio under their respective agreements from losses resulting from a borrower’s failure to return a loaned security.
| DECEMBER 31, 2011 | JPMORGAN INSURANCE TRUST | 15 | ||||||
Table of Contents
NOTES TO FINANCIAL STATEMENTS
AS OF DECEMBER 31, 2011 (continued)
The Advisor waived fees associated with the Portfolio’s investment in JPMorgan Prime Money Market Fund in the amount of $1,616. This amount offsets the administration fees and shareholder servicing fees incurred by JPMorgan Prime Money Market Fund related to the Portfolio’s investment in such fund. A portion of the waiver is voluntary.
Under the JPMCB Securities Lending Agreement, JPMCB was entitled to a fee paid monthly in arrears equal to: (i) 0.03% of the average dollar value of the loans of U.S. dollar-denominated securities outstanding during a given month; and (ii) 0.09% of the average dollar value of loans of non-dollar denominated securities outstanding during a given month.
The Portfolio incurred lending agent fees to JPMCB in the amount of $44 for the year ended December 31, 2011.
C. Security Transactions and Investment Income — Investment transactions are accounted for on the trade date (the date the order to buy or sell is executed). Securities gains and losses are calculated on a specifically identified cost basis. Interest income is determined on the basis of coupon interest accrued using the effective interest method adjusted for amortization of premiums and accretion of discounts. Dividend income less foreign taxes withheld, if any, is recorded on the ex-dividend date or when the Portfolio first learns of the dividend.
D. Allocation of Income and Expenses — In calculating the net asset value per share of each class, investment income, realized and unrealized gains and losses and expenses other than class specific expenses are allocated daily to each class of shares based upon the proportion of net assets of each class at the beginning of each day. Expenses directly attributable to a portfolio are charged directly to that portfolio while the expenses attributable to more than one portfolio of the Trust are allocated among the respective portfolios. Each class of shares bears its pro-rata portion of expenses attributable to the Portfolio, except that each class separately bears expenses related specifically to that class, such as distribution fees.
E. Federal Income Taxes — The Portfolio is treated as a separate taxable entity for Federal income tax purposes. The Portfolio’s policy is to comply with the provisions of the Internal Revenue Code of 1986, as amended (the “Code”), applicable to regulated investment companies and to distribute to shareholders all of its distributable net investment income and net realized gain on investments. Accordingly, no provision for Federal income tax is necessary. The Portfolio is also a segregated portfolio of assets for insurance purposes and intends to comply with the diversification requirements of Subchapter L of the Code. The Portfolio is not aware of any tax positions for which it is reasonably possible that the total amounts of unrecognized tax benefits or losses will significantly change in the next twelve months. However, the Portfolio’s conclusions may be subject to future review based on changes in, or the interpretation of, the accounting standards or tax laws and regulations. The Portfolio’s Federal tax returns for the prior three fiscal years remain subject to examination by the Internal Revenue Service.
F. Dividends and Distributions to Shareholders — Dividends from net investment income are generally declared and paid at least annually. Dividends are declared separately for each class. No class has preferential dividend rights; differences in per share rates are due to differences in separate class expenses. Net realized capital gains, if any, are generally distributed at least annually. The amount of dividends and distributions from net investment income and net realized capital gains is determined in accordance with Federal income tax regulations, which may differ from accounting principles generally accepted in the United States of America. To the extent these “book/tax” differences are permanent in nature (i.e., that they result from other than timing of recognition — “temporary differences”), such amounts are reclassified within the capital accounts based on their Federal tax-basis treatment.
The following amounts were reclassified within the capital accounts:
| Paid-in-Capital | Accumulated Undistributed/ (Overdistributed) Net Investment Income | Accumulated Net Realized Gain (Loss) on Investments | ||||||||||
| $ | (90,576 | ) | $ | 58,944 | $ | 31,632 | ||||||
The reclassifications for the Portfolio relate primarily to investments in partnerships and net operating losses.
3. Fees and Other Transactions with Affiliates
A. Investment Advisory Fee — Pursuant to the Investment Advisory Agreement, JPMIM acts as the investment advisor to the Portfolio. JPMIM is a wholly-owned subsidiary of JPMorgan Asset Management Holdings Inc., which is a wholly-owned subsidiary of JPMorgan Chase & Co. (“JPMorgan”). JPMIM supervises the investments of the Portfolio and for such services is paid a fee. The fee is accrued daily and paid monthly based on the Portfolio’s average daily net assets at an annual fee rate of 0.65%.
The Advisor waived Investment Advisory fees and/or reimbursed expenses as outlined in Note 3.E.
B. Administration Fee — Pursuant to an Administration Agreement, JPMorgan Funds Management, Inc. (the “Administrator”), an indirect, wholly-owned subsidiary of JPMorgan, provides certain administration services to the Portfolio. In consideration of these services, the Administrator receives a fee computed daily and paid monthly at the annual rate of 0.15% of the first $25 billion of the average daily net assets of all funds in the J.P. Morgan Funds Complex (excluding certain funds of funds and money market funds) and 0.075% of the average daily net assets in excess of $25 billion of all such funds. For the year ended December 31, 2011, the annual effective rate was 0.09% of the Portfolio’s average daily net assets.
JPMCB, a wholly-owned subsidiary of JPMorgan, and successor in interest to J.P. Morgan Investor Services Co., serves as the Portfolio’s sub-administrator (the “Sub-administrator”). For its services as Sub-administrator, JPMCB receives a portion of the fees payable to the Administrator.
| 16 | JPMORGAN INSURANCE TRUST | DECEMBER 31, 2011 | ||||
Table of Contents
C. Distribution Fees — Pursuant to a Distribution Agreement, JPMorgan Distribution Services, Inc. (the “Distributor”), a wholly-owned subsidiary of JPMorgan, serves as the Trust’s exclusive underwriter and promotes and arranges for the sale of the Portfolio’s shares.
The Board of Trustees has adopted a Distribution Plan (the “Distribution Plan”) for Class 2 Shares of the Portfolio in accordance with Rule 12b-1 under the 1940 Act. The Distribution Plan provides that the Portfolio shall pay distribution fees, including payments to the Distributor, at an annual rate of 0.25% of the average daily net assets of Class 2 Shares.
D. Custodian and Accounting Fees — JPMCB provides portfolio custody and accounting services for the Portfolio. The amounts paid directly to JPMCB by the Portfolio for custody and accounting services are included in Custodian and accounting fees in the Statement of Operations. The custodian fees may be reduced by credits earned by the Portfolio, based on uninvested cash balances held by the custodian. Such earnings credits are presented separately in the Statement of Operations.
Interest expense, if any, paid to the custodian related to cash overdrafts is included in Interest expense to affiliates in the Statement of Operations.
E. Waivers and Reimbursements — The Advisor and Administrator have contractually agreed to waive fees and/or reimburse the Portfolio to the extent that total annual operating expenses (excluding acquired fund fees and expenses, dividend expense related to short sales, interest, taxes, extraordinary expenses and expenses related to the Board of Trustees’ deferred compensation plan) exceed the percentages of the Portfolio’s average daily net assets as shown in the table below:
| Class 1 | Class 2 | |||||||
| 0.90 | % | 1.15 | % | |||||
The contractual expense limitation agreements were in effect for the year ended December 31, 2011. The expense limitation percentages in the table above are in place until at least April 30, 2012.
For the year ended December 31, 2011, the Advisor voluntarily waived fees for the Portfolio in the amount of $8,857. The Advisor does not expect the Portfolio to repay any such waived fees in future years.
Additionally, the Portfolio may invest in one or more money market funds advised by the Advisor or its affiliates. The Advisor, Administrator and the Distributor waive fees in an amount sufficient to offset the respective fees each charges to the affiliated money market fund on the Portfolio’s investment in such affiliated money market fund. A portion of the waiver is voluntary.
The amount of waivers resulting from investments in the money market funds for the year ended December 31, 2011 (excluding the waiver disclosed in Note 2.B. regarding cash collateral for securities lending invested in JPMorgan Prime Money Market Fund) was $2,286.
F. Other — Certain officers of the Trust are affiliated with the Advisor, the Administrator and the Distributor. Such officers, with the exception of the Chief Compliance Officer, receive no compensation from the Portfolio for serving in their respective roles.
The Board of Trustees appointed a Chief Compliance Officer to the Portfolio in accordance with federal securities regulations. The Portfolio, along with other affiliated portfolios, makes reimbursement payments, on a pro-rata basis, to the Administrator for a portion of the fees associated with the Office of the Chief Compliance Officer. Such fees are included in Trustees’ and Chief Compliance Officer’s fees in the Statement of Operations.
The Trust adopted a Trustee Deferred Compensation Plan (the “Plan”) which allows the Independent Trustees to defer the receipt of all or a portion of compensation related to performance of their duties as a Trustee. The deferred fees are invested in various J.P. Morgan Funds until distribution in accordance with the Plan.
During the year ended December 31, 2011, the Portfolio may have purchased securities from an underwriting syndicate in which the principal underwriter or members of the syndicate are affiliated with the Advisor.
The Portfolio may use related party broker/dealers. For the year ended December 31, 2011, the Portfolio did not incur any brokerage commissions with broker/dealers affiliated with the Advisor.
The Securities and Exchange Commission has granted an exemptive order permitting the Portfolio to engage in principal transactions with J.P. Morgan Securities, Inc., an affiliated broker, involving taxable money market instruments subject to certain conditions.
4. Investment Transactions
During the year ended December 31, 2011, purchases and sales of investments (excluding short-term investments) were as follows:
Purchases (excluding U.S. Government) | Sales (excluding U.S. Government) | |||||||
| $ | 53,473,698 | $ | 64,802,543 | |||||
During the year ended December 31, 2011, there were no purchases or sales of U.S. Government securities.
| DECEMBER 31, 2011 | JPMORGAN INSURANCE TRUST | 17 | ||||||
Table of Contents
NOTES TO FINANCIAL STATEMENTS
AS OF DECEMBER 31, 2011 (continued)
5. Federal Income Tax Matters
For Federal income tax purposes, the cost and unrealized appreciation (depreciation) in value of the investment securities at December 31, 2011, were as follows:
Aggregate Cost | Gross Unrealized Appreciation | Gross Unrealized Depreciation | Net Unrealized Appreciation (Depreciation) | |||||||||||||
| $ | 63,890,117 | $ | 8,440,592 | $ | 5,200,375 | $ | 3,240,217 | |||||||||
The difference between book and tax basis appreciation (depreciation) on investments is primarily attributed to wash sale loss deferrals.
There were no distributions paid during the fiscal years ended December 31, 2011 and December 31, 2010.
At December 31, 2011, the components of net assets (excluding paid in capital) on a tax basis were as follows (amounts in thousands):
Current Distributable Ordinary Income | Current Distributable Long-Term Capital Gain or (Tax Basis Capital Loss Carryover) | Unrealized Appreciation (Depreciation) | ||||||||||
| $ | — | $ | 810,815 | $ | 3,240,217 | |||||||
The cumulative timing differences primarily consist of Trustee deferred compensation, post-October short-term loss deferrals and wash sale loss deferrals.
Under the Regulated Investment Company Modernization Act of 2010 (the “Act”), net capital losses recognized by the Portfolio after December 31, 2010, may get carried forward indefinitely, and retain their character as short-term and/or long term losses. Prior to the Act, pre-enactment net capital losses incurred by the Portfolio were carried forward for eight years and treated as short-term losses. The Act requires that post-enactment net capital losses be used before pre-enactment net capital losses
As of December 31, 2011, the Portfolio did not have post-enactment or pre-enactment net capital loss carryforwards.
During the year ended December 31, 2011, the Portfolio utilized capital loss carryforwards of $9,914,217.
Net capital losses incurred after October 31 and within the taxable year are deemed to arise on the first business day of the Portfolio’s next taxable year. For the year ended December 31, 2011, the Portfolio deferred to January 1, 2012 post-October short-term capital losses of $549,701.
6. Borrowings
The Trust and JPMCB have entered into a financing arrangement. Under this arrangement, JPMCB provides an unsecured, uncommitted credit facility in the aggregate amount of $100 million to certain of the J.P. Morgan Funds, including the Portfolio. Advances under the arrangement are taken primarily for temporary or emergency purposes, including the meeting of redemption requests that otherwise might require the untimely disposition of securities, and are subject to the Portfolio’s borrowing restrictions. Interest on borrowings is payable at a rate determined by JPMCB at the time of borrowing. This agreement has been extended until November 12, 2012.
The Portfolio had no borrowings outstanding from the unsecured, uncommitted credit facility at December 31, 2011, or at any time during the year then ended.
Interest expense paid, if any, as a result of borrowings from the unsecured, uncommitted credit facility is included in Interest expense to affiliates in the Statement of Operations.
7. Risks, Concentrations and Indemnifications
In the normal course of business, the Portfolio enters into contracts that contain a variety of representations which provide general indemnifications. The Portfolio’s maximum exposure under these arrangements is unknown, as this would involve future claims that may be made against the Portfolio that have not yet occurred. However, based on experience, the Portfolio expects the risk of loss to be remote.
From time to time, the Portfolio may have a concentration of several shareholders holding a significant percentage of shares outstanding. Investment activities of these shareholders could have a material impact on the Portfolio.
| 18 | JPMORGAN INSURANCE TRUST | DECEMBER 31, 2011 | ||||
Table of Contents
REPORT OF INDEPENDENT REGISTERED PUBLIC ACCOUNTING FIRM
To the Board of Trustees of JPMorgan Insurance Trust and Shareholders of JPMorgan Insurance Trust Mid Cap Growth Portfolio:
In our opinion, the accompanying statement of assets and liabilities, including the schedule of portfolio investments, and the related statements of operations and of changes in net assets and the financial highlights present fairly, in all material respects, the financial position of JPMorgan Insurance Trust Mid Cap Growth Portfolio (a separate Portfolio of JPMorgan Insurance Trust) (hereafter referred to as the “Portfolio”) at December 31, 2011, the results of its operations for the year then ended, the changes in its net assets for each of the two years in the period then ended and the financial highlights for each of the five years in the period then ended, in conformity with accounting principles generally accepted in the United States of America. These financial statements and financial highlights (hereafter referred to as “financial statements”) are the responsibility of the Portfolio’s management. Our responsibility is to express an opinion on these financial statements based on our audits. We conducted our audits of these financial statements in accordance with the standards of the Public Company Accounting Oversight Board (United States). Those standards require that we plan and perform the audit to obtain reasonable assurance about whether the financial statements are free of material misstatement. An audit includes examining, on a test basis, evidence supporting the amounts and disclosures in the financial statements, assessing the accounting principles used and significant estimates made by management, and evaluating the overall financial statement presentation. We believe that our audits, which included confirmation of securities at December 31, 2011 by correspondence with the custodian and brokers, provide a reasonable basis for our opinion.
PricewaterhouseCoopers LLP
New York, New York
February 23, 2012
| DECEMBER 31, 2011 | JPMORGAN INSURANCE TRUST | 19 | ||||||
Table of Contents
(Unaudited)
The Portfolio’s Statement of Additional Information includes additional information about the Portfolio’s Trustees and is available, without charge, upon request by calling 1-800-480-4111 or on the J.P. Morgan Funds’ website at www.jpmorganfunds.com.
Name (Year of Birth); Positions With the Portfolio (1) | Principal Occupations During Past 5 Years | Number of Complex Overseen by Trustee (2) | Other Directorships Held Outside Fund Complex During Past 5 Years | |||
Independent Trustees | ||||||
| William J. Armstrong (1941); Trustee of Trust since 2005; Trustee of heritage J.P. Morgan Funds since 1987. | Retired; CFO and Consultant, EduNeering, Inc. (internet business education supplier) (2000-2001); Vice President and Treasurer, Ingersoll-Rand Company (manufacturer of industrial equipment) (1972-2000). | 154 | None. | |||
| John F. Finn (1947); Trustee of Trust since 2005; Trustee of heritage One Group Mutual Funds since 1998. | Chairman (1985-present), President and Chief Executive Officer, Gardner, Inc. (supply chain management company serving industrial and consumer markets) (1974-present). | 154 | Director, Cardinal Health, Inc. (CAH) (1994-present); Director, Greif, Inc. (GEF) (industrial package products and services) (2007-present). | |||
| Dr. Matthew Goldstein (1941); Trustee of Trust since 2005; Trustee of heritage J.P. Morgan Funds since 2003. | Chancellor, City University of New York (1999-present); President, Adelphi University (New York) (1998-1999). | 154 | Director, New Plan Excel (NXL) (1999-2005); Director, National Financial Partners (NFP) (2003-2005); Director, Bronx-Lebanon Hospital Center; Director, United Way of New York City (2002-present). | |||
| Robert J. Higgins (1945); Trustee of Trust since 2005; Trustee of heritage J.P. Morgan Funds since 2002. | Retired; Director of Administration of the State of Rhode Island (2003-2004); President — Consumer Banking and Investment Services, Fleet Boston Financial (1971-2001). | 154 | None. | |||
| Peter C. Marshall (1942); Trustee of Trust since 2005; Trustee of heritage One Group Mutual Funds since 1985. | Self-employed business consultant (2002-present). | 154 | Director, Center for Communication, Hearing, and Deafness (1990-present). | |||
| Marilyn McCoy* (1948); Trustee of Trust since 2005; Trustee of heritage One Group Mutual Funds since 1999. | Vice President of Administration and Planning, Northwestern University (1985-present). | 154 | Trustee, Carleton College (2003-present). | |||
| William G. Morton, Jr. (1937); Trustee of Trust since 2005; Trustee of heritage J.P. Morgan Funds since 2003. | Retired; Chairman Emeritus (2001-2002), and Chairman and Chief Executive Officer, Boston Stock Exchange (1985-2001). | 154 | Director, Radio Shack Corp. (1987-2008); Trustee, Stratton Mountain School (2001-present). | |||
| Robert A. Oden, Jr. (1946); Trustee of Trust since 2005; Trustee of heritage One Group Mutual Funds since 1997. | Retired; President, Carleton College (2002-2010); President, Kenyon College (1995-2002). | 154 | Trustee, American University in Cairo (1999-present); Trustee, Carleton College (2002-2010). | |||
| Fergus Reid, III (1932); Trustee of Trust (Chairman) since 2005; Trustee (Chairman) of heritage J.P. Morgan Funds since 1987. | Chairman, Joe Pietryka, Inc. (formerly Lumelite Corporation) (plastics manufacturing) (2003-present); Chairman and Chief Executive Officer, Lumelite Corporation (1985-2002). | 154 | Trustee, Morgan Stanley Funds (105 portfolios) (1992-present). | |||
| 20 | JPMORGAN INSURANCE TRUST | DECEMBER 31, 2011 | ||||
Table of Contents
TRUSTEES
(Unaudited) (continued)
Name (Year of Birth); Positions With the Portfolio (1) | Principal Occupations During Past 5 Years | Number of Complex Overseen by Trustee (2) | Other Directorships Held Outside Fund Complex During Past 5 Years | |||
Independent Trustees (continued) | ||||||
| Frederick W. Ruebeck (1939); Trustee of Trust since 2005; Trustee of heritage One Group Mutual Funds since 1994. | Consultant (2000-present); Advisor, JP Greene & Associates, LLC (broker-dealer) (2000-2009); Chief Investment Officer, Wabash College (2004-present); Director of Investments, Eli Lilly and Company (pharmaceuticals) (1988-1999). | 154 | Trustee, Wabash College (1988-present); Chairman, Indianapolis Symphony Orchestra Foundation (1994-present). | |||
| James J. Schonbachler (1943); Trustee of Trust since 2005; Trustee of heritage J.P. Morgan Funds since 2001. | Retired; Managing Director of Bankers Trust Company (financial services) (1968-1998). | 154 | None. | |||
Interested Trustees | ||||||
| Frankie D. Hughes** (1952), Trustee of Trust since 2008. | President and Chief Investment Officer, Hughes Capital Management, Inc. (fixed income asset management) (1993-present). | 154 | Trustee, The Victory Portfolios (2000-2008). | |||
| Leonard M. Spalding, Jr.*** (1935); Trustee of Trust since 2005; Trustee of heritage J.P. Morgan Funds since 1998. | Retired; Chief Executive Officer, Chase Mutual Funds (investment company) (1989-1998); President and Chief Executive Officer, Vista Capital Management (investment management) (1990-1998); Chief Investment Executive, Chase Manhattan Private Bank (investment management) (1990-1998). | 154 | Director, Glenview Trust Company, LLC (2001-present); Trustee, St. Catharine College (1998-present); Trustee, Bellarmine University (2000-present); Director, Springfield-Washington County Economic Development Authority (1997-present); Trustee, Catholic Education Foundation (2005-present). | |||
| (1) | Each Trustee serves for an indefinite term, subject to the Trust’s current retirement policy, which is age 75 for all Trustees, except that the Board has determined Messrs. Reid and Spalding should continue to serve until December 31, 2012. |
| (2) | A Fund Complex means two or more registered investment companies that hold themselves out to investors as related companies for purposes of investment and investor services or have a common investment adviser or have an investment adviser that is an affiliated person of the investment adviser of any of the other registered investment companies. The J.P. Morgan Funds Complex for which the Board of Trustees serves currently includes eleven registered investment companies (154 funds). |
| * | Ms. McCoy has served as Vice President of Administration and Planning for Northwestern University since 1985. William M. Daley was the Head of Corporate Responsibility for JPMorgan Chase & Co. prior to January 2011 and served as a member of the Board of Trustees of Northwestern University from 2005 through 2010. JPMIM, the Funds’ investment advisor, is a wholly-owned subsidiary of JPMorgan Chase & Co. Three other members of the Board of Trustees of Northwestern University are executive officers of registered investment advisors (not affiliated with JPMorgan) that are under common control with subadvisors to certain J.P. Morgan Funds. |
| ** | Ms. Hughes is treated as an “interested person” based on the portfolio holdings of clients of Hughes Capital Management, Inc. |
| *** | Mr. Spalding is treated as an “interested person” due to his ownership of JPMorgan Chase stock. |
The contact address for each of the Trustees is 270 Park Avenue, New York, NY 10017.
| DECEMBER 31, 2011 | JPMORGAN INSURANCE TRUST | 21 | ||||||
Table of Contents
(Unaudited)
Name (Year of Birth), Positions Held with the Trust (Since) | Principal Occupations During Past 5 Years | |
Patricia A. Maleski (1960), | Managing Director, J.P. Morgan Investment Management Inc. and Chief Administrative Officer, J.P. Morgan Funds and Institutional Pooled Vehicles since 2010; previously, Treasurer and Principal Financial Officer of the Trusts from 2008 to 2010; previously, Head of Funds Administration and Board Liaison, J.P. Morgan Funds prior to 2010. Ms. Maleski has been with JPMorgan Chase & Co. since 2001. | |
| Joy C. Dowd (1972), Treasurer and Principal Financial Officer (2010) | Assistant Treasurer of the Trusts from 2009 to 2010; Executive Director, JPMorgan Funds Management, Inc. from February 2011; Vice President, JPMorgan Funds Management, Inc. from December 2008 to February 2011; prior to joining JPMorgan Chase, Ms. Dowd worked in MetLife’s investments audit group from 2005 through 2008. | |
| Frank J. Nasta (1964), Secretary (2008) | Managing Director and Associate General Counsel, JPMorgan Chase since 2008; Previously, Director, Managing Director, General Counsel and Corporate Secretary, J. & W. Seligman & Co. Incorporated; Secretary of each of the investment companies of the Seligman Group of Funds and Seligman Data Corp.; Director and Corporate Secretary, Seligman Advisors, Inc. and Seligman Services, Inc. | |
| Stephen M. Ungerman (1953), Chief Compliance Officer (2005) | Managing Director, JPMorgan Chase & Co.; Mr. Ungerman has been with JPMorgan Chase & Co. since 2000. | |
| Paul L. Gulinello (1950), AML Compliance Officer (2005) | Vice President and Anti Money Laundering Compliance Officer for JPMorgan Asset Management Americas, additionally responsible for privacy, personal trading and Code of Ethics compliance since 2004. Mr. Gulinello has been with JPMorgan Chase & Co. since 1972. | |
Elizabeth A. Davin (1964), Assistant Secretary (2005)* | Vice President and Assistant General Counsel, JPMorgan Chase since 2005; Senior Counsel, JPMorgan Chase (formerly Bank One Corporation) from 2004 to 2005. | |
| Jessica K. Ditullio (1962), Assistant Secretary (2005)* | Executive Director and Assistant General Counsel, JPMorgan Chase since February 2011; Ms. Ditullio has served as an attorney with various titles for JPMorgan Chase (formerly Bank One Corporation) since 1990. | |
| John T. Fitzgerald (1975), Assistant Secretary (2008) | Executive Director and Assistant General Counsel, JPMorgan Chase since February 2011; formerly, Vice President and Assistant General Counsel, JPMorgan Chase from 2005 until February 2011. | |
| Carmine Lekstutis (1980) Assistant Secretary (2011) | Vice President and Assistant General Counsel, JPMorgan Chase since 2011; Associate, Skadden, Arps, Slate, Meagher & Flom LLP (law firm) from 2006 to 2011. | |
| Gregory S. Samuels (1980) Assistant Secretary (2010) | Vice President and Assistant General Counsel, JPMorgan Chase since 2010; Associate, Ropes & Gray (law firm) from 2008 to 2010; Associate, Clifford Chance LLP (law firm) from 2005 to 2008. | |
| Brian L. Duncan (1965), Assistant Treasurer (2008)* | Vice President, JPMorgan Funds Management, Inc. since June 2007; prior to joining JPMorgan Chase, Mr. Duncan worked for Penn Treaty American Corporation as Vice President and Controller from 2004 through 2007. | |
| Jeffrey D. House (1972), Assistant Treasurer (2006)* | Vice President, JPMorgan Funds Management, Inc. since July 2006. | |
| Laura S. Melman (1966), Assistant Treasurer (2006) | Executive Director, JPMorgan Funds Management, Inc. since February 2011, responsible for Taxation; Vice President, JPMorgan Funds Management, Inc. from August 2006 to February 2011, responsible for Taxation. | |
| Joseph Parascondola (1963), Assistant Treasurer (2011) | Vice President, JPMorgan Funds Management, Inc. since August 2006. | |
| Matthew J. Plastina (1970), Assistant Treasurer (2011) | Vice President, JPMorgan Funds Management, Inc. since August 2010; prior to August 2010, Vice President and Controller, Legg Mason Global Asset Management. | |
| Jeffery Reedy (1973), Assistant Treasurer (2011)* | Vice President, JPMorgan Funds Management, Inc. since February 2006. | |
The contact address for each of the officers, unless otherwise noted, is 270 Park Avenue, New York, NY 10017.
| * | The contact address for the officer is 1111 Polaris Parkway, Columbus, OH 43240. |
| 22 | JPMORGAN INSURANCE TRUST | DECEMBER 31, 2011 | ||||
Table of Contents
SCHEDULE OF SHAREHOLDER EXPENSES
(Unaudited)
Hypothetical $1,000 Investment
As a shareholder of the Portfolio, you incur ongoing costs, including investment advisory fees, administration fees, distribution fees (for Class 2 Shares) and other Portfolio expenses. Because the Portfolio is a funding vehicle for Policies and Eligible Plans, you may also incur sales charges and other fees relating to the Policies or Eligible Plans. The examples below are intended to help you understand your ongoing costs (in dollars) of investing in the Portfolio, but not the costs of the Policies or Eligible Plans, and to compare these ongoing costs with the ongoing costs of investing in other mutual funds. The examples assume that you had a $1,000 investment in the Class at the beginning of the reporting period, July 1, 2011, and continued to hold your shares at the end of the reporting period, December 31, 2011.
Actual Expenses
For each Class of the Portfolio in the table below, the first line provides information about actual account values and actual expenses. You may use the information in this line, together with the amount you invested, to estimate the expenses that you paid over the period. Simply divide your account value by $1,000 (for example, an $8,600 account value divided by $1,000 = 8.6), then multiply the result by the number in the first line of each Class under the heading entitled “Expenses Paid During” to estimate the expenses you paid on your account during this period.
Hypothetical Example for Comparison Purposes
The second line of each Class in the table below provides information about hypothetical account values and hypothetical expenses based on the Class’ actual expense ratio and an assumed rate of return of 5% per year before expenses, which is not the Class’ actual return. The hypothetical account values and expenses may not be used to estimate the actual ending account balance or expenses you paid for the period. You may use this information to compare the ongoing costs of investing in the Class of the Portfolio and other portfolios. To do so, compare this 5% hypothetical example with the 5% hypothetical examples that appear in the shareholder reports of the other funds. Please note that the expenses shown in the table are meant to highlight your ongoing costs only and do not reflect any transaction costs, such as sales charges (loads) or redemption fees or the costs associated with the Policies and Eligible Plans through which the Portfolio is held. Therefore, the second line for each Class in the table is useful in comparing ongoing costs only, and will not help you determine the relative total costs of owning different portfolios. In addition, if these transaction costs were included, your costs would have been higher. The examples also assume all dividends and distributions have been reinvested.
| Beginning Account Value, July 1, 2011 | Ending Account Value December 31, 2011 | Expenses Paid During July 1, 2011 to December 31, 2011* | Annualized Expense Ratio | |||||||||||||
Mid Cap Growth Portfolio | ||||||||||||||||
Class 1 | ||||||||||||||||
Actual | $ | 1,000.00 | $ | 864.90 | $ | 3.67 | 0.78 | % | ||||||||
Hypothetical | 1,000.00 | 1,021.27 | 3.97 | 0.78 | ||||||||||||
Class 2 | ||||||||||||||||
Actual | 1,000.00 | 863.60 | 4.84 | 1.03 | ||||||||||||
Hypothetical | 1,000.00 | 1,020.01 | 5.24 | 1.03 | ||||||||||||
| * | Expenses are equal to the Portfolio’s annualized expense ratio, multiplied by the average account value over the period, multiplied by 184/365 (to reflect the one-half year period). |
| DECEMBER 31, 2011 | JPMORGAN INSURANCE TRUST | 23 | ||||||
Table of Contents
BOARD APPROVAL OF INVESTMENT ADVISORY AGREEMENT
(Unaudited)
The Board of Trustees meets regularly throughout the year and considers factors that are relevant to its annual consideration of investment advisory agreements at each meeting. The Board of Trustees has established various standing committees, composed of Trustees with diverse backgrounds, to which the Board of Trustees has assigned specific subject matter responsibilities to further enhance the effectiveness of the Board’s oversight and decision making. The Board of Trustees and its investment subcommittees (money market and alternative products, equity, and fixed income) also meet for the specific purpose of considering advisory contract annual renewals. The Board of Trustees held meetings in person in June and August 2011, at which the Trustees considered the continuation of the investment advisory agreement for the Portfolio whose annual report is contained herein (the “Advisory Agreement”). At the June meeting, the Board’s investment subcommittees met to review and consider performance, expense and related information for the J.P. Morgan Funds. Each investment subcommittee reported to the full Board, which then considered the investment subcommittee’s preliminary findings. At the August meeting, the Trustees continued their review and consideration. The Trustees, including a majority of the Trustees who are not “interested persons” (as defined in the 1940 Act) of any party to the Advisory Agreement or any of their affiliates, approved the continuation of the Advisory Agreement on August 25, 2011.
The Trustees, as part of their review of the investment advisory arrangements for the J.P. Morgan Funds, considered and reviewed performance and other information received from the Advisor, on a regular basis over the course of the year, as well as information specifically prepared for their annual review. This information included the Portfolio’s performance compared to the performance of the Portfolio’s peers and benchmarks and analyses by the Advisor of the Portfolio’s performance. The Advisor also periodically provides comparative information regarding the Portfolio’s expense ratios and those of the peer groups. In addition, in preparation for the June and August meetings, the Trustees requested, received and evaluated extensive materials from the Advisor, including, with respect to certain J.P. Morgan Funds, performance and expense information compiled by Lipper Inc. (“Lipper”), an independent provider of investment company data. Prior to voting, the Trustees reviewed the proposed approval of the Advisory Agreement with representatives of the Advisor and with counsels to the Trust and independent Trustees and received a memorandum from independent counsel to the Trustees discussing the legal standards for their consideration of the proposed approval. The Trustees also discussed the proposed approvals in executive sessions with counsels to the Trust and independent Trustees at which no representatives of the Advisor were present. Set forth below is a summary of the material factors evaluated by the Trustees in determining whether to approve the Advisory Agreement.
In their deliberations, there was a comprehensive consideration of the information received by the Trustees. Each Trustee attributed different weights to the various factors and no factor alone was considered determinative. From year to year, the Trustees consider and place emphasis on relevant information in light of changing circumstances in market and economic conditions. The Trustees determined that the compensation to be received by the Advisor from the Portfolio under the Advisory Agreement was fair and reasonable and that the continuance of the investment advisory contract was in the best interests of the Portfolio and its shareholders.
The factors summarized below were considered and discussed by the Trustees in reaching their conclusions:
Nature, Extent and Quality of Services Provided by the Advisor
The Trustees received and considered information regarding the nature, extent and quality of the services provided to the Portfolio under the Advisory Agreement. The Trustees took into account information furnished throughout the year at Trustee meetings, as well as the materials furnished specifically in connection with this annual review process. The Trustees considered the background and experience of the Advisor’s senior management and the expertise of, and the amount of attention given to the Portfolio by, investment personnel of the Advisor. In addition, the Trustees reviewed the qualifications, backgrounds and responsibilities of the portfolio management team primarily responsible for the day-to-day management of the Portfolio and the infrastructure supporting the team. The Trustees also considered information provided by the Advisor and JPMorgan Distribution Services, Inc. (“JPMDS”) about the structure and distribution strategy of the Portfolio. The Trustees also reviewed information relating to the Advisor’s risk governance model and reports showing the Advisor’s compliance structure and ongoing compliance processes. The quality of the administrative services provided by JPMorgan Funds Management, Inc. (“JPMFM”), an affiliate of the Advisor, was also considered.
The Board of Trustees also considered its knowledge of the nature and quality of the services provided by the Advisor to the Portfolio gained from their experience as Trustees of the J.P. Morgan Funds. In addition, they considered the overall reputation and capabilities of the Advisor and its affiliates, the commitment of the Advisor to provide high quality service to the Portfolio, their overall confidence in the Advisor’s integrity and the Advisor’s responsiveness to questions or concerns raised by them, including the Advisor’s willingness to consider and implement organizational and operational changes designed to improve investment results and the services provided to the Portfolio.
Based on these considerations and other factors, the Trustees concluded that they were satisfied with the nature, extent and quality of the investment advisory services provided to the Portfolio by the Advisor.
| 24 | JPMORGAN INSURANCE TRUST | DECEMBER 31, 2011 | ||||
Table of Contents
Costs of Services Provided and Profitability to the Advisor and its Affiliates
The Trustees received and considered information regarding the profitability to the Advisor and its affiliates in providing services to the Portfolio. The Trustees reviewed and discussed this data. The Trustees recognized that this data is not audited and represents the Advisor’s determination of its and its affiliates’ revenues from the contractual services provided to the Portfolio, less expenses of providing such services. Expenses include direct and indirect costs and are calculated using an allocation methodology developed by the Advisor. The Trustees also recognized that it is difficult to make comparisons of profitability from fund investment advisory contracts because comparative information is not generally publicly available and is affected by numerous factors, including the structure of the particular adviser, the types of funds it manages, its business mix, numerous assumptions regarding allocations and the fact that publicly-traded fund managers’ operating profits and net income are net of distribution and marketing expenses. Based on their review, the Trustees concluded that the profitability to the Advisor under the Advisory Agreement was not unreasonable in light of the services and benefits provided to the Portfolio.
Fall-Out Benefits
The Trustees reviewed information regarding potential “fallout” or ancillary benefits received by the Advisor and its affiliates as a result of their relationship with the Portfolio. The Board also considered that the Advisor uses third-party soft dollar arrangements with respect to securities transactions it executes for the Portfolio.
The Trustees also considered that JPMFM earns fees from the Portfolio for providing administrative services. These fees were shown separately in the profitability analysis presented to the Trustees. The Trustees also considered the payments of Rule 12b-1 fees to JPMDS, an affiliate of the Advisor, which also acts as the Portfolio’s distributor and that these fees are in turn generally paid to financial intermediaries that sell the J.P. Morgan Funds, including financial intermediaries that are affiliates of the Advisor. The Trustees also considered the fees paid to JPMorgan Chase Bank, N.A. (“JPMCB”) for custody and fund accounting, securities lending, and other related services. The Trustees also considered the fees paid to JPMCB, the former securities lending agent for the Portfolio during the review period. Effective March 1, 2011, the Portfolio retained an unaffiliated securities lending agent.
Economies of Scale
The Trustees noted that the proposed investment advisory fee schedule for the Portfolio does not contain breakpoints. The Trustees considered whether it would be appropriate to add advisory fee breakpoints and the Trustees concluded that the
current fee structure was reasonable in light of the fee waivers and expense limitations that the Advisor has in place that serve to limit the overall net expense ratio at competitive levels. The Trustees also recognized that the fee schedule for the administrative services provided by JPMFM does include a fee breakpoint, which is tied to the overall level of non-money market fund assets excluding certain funds-of-funds, as applicable, advised by the Advisor, and that the Portfolio benefits from that breakpoint. The Trustees concluded that shareholders benefited from the lower expense ratios which resulted from these factors.
Independent Written Evaluation of the Portfolio’s Chief Compliance Officer
The Trustees noted that, upon their direction, the Chief Compliance Officer for the Portfolio had prepared an independent written evaluation in order to assist the Trustees in determining the reasonableness of the proposed management fees. The Trustees considered the written evaluation in determining whether to continue the Advisory Agreement.
Fees Relative to Advisor’s Other Clients
The Trustees received and considered information about the nature and extent of investment advisory services and fee rates offered to other clients of the Advisor for investment management styles substantially similar to that of the Portfolio. The Trustees also considered the complexity of investment management for the Portfolio relative to the Advisor’s other clients and the differences in the nature and extent of the services provided to the different clients. The Trustees concluded that the fee rates charged to the Portfolio in comparison to those charged to the Advisor’s other clients were reasonable.
Investment Performance
The Trustees received and considered absolute and/or relative performance for the Portfolio in a report prepared by Lipper. The Trustees considered the total return performance information, which included the ranking of the Portfolio within a performance universe made up of funds with the same Lipper investment classification and objective (the “Universe Group”) by total return for applicable one-, three- and five-year periods. The Trustees reviewed a description of Lipper’s methodology for selecting mutual funds in the Portfolio’s Universe Group. The Lipper materials provided to the Trustees highlighted information with respect to a representative class to assist the Trustees in their review. As part of this review, the Trustees also reviewed the Portfolio’s performance against its benchmark and considered the performance information provided for the Portfolio at regular Board meetings by the Advisor. The Lipper performance data noted by the Trustees as part of their review and the determinations made by the Trustees with respect to the Portfolio’s performance are summarized below:
| DECEMBER 31, 2011 | JPMORGAN INSURANCE TRUST | 25 | ||||||
Table of Contents
BOARD APPROVAL OF INVESTMENT ADVISORY AGREEMENT
(Unaudited) (continued)
The Trustees noted the Portfolio’s performance was in the fourth, third and third quintiles for Class 1 shares for the one-, three-, and five-year periods ended December 31, 2010, respectively. The Trustees discussed the performance and investment strategy of the Portfolio with the Advisor and, based upon this discussion and other factors, concluded that the performance was reasonable.
Advisory Fees and Expense Ratios
The Trustees considered the contractual advisory fee rate paid by the Portfolio to the Advisor and compared that rate to the information prepared by Lipper concerning management fee rates paid by other funds in the same Lipper category as the Portfolio. The Trustees recognized that Lipper reported the Portfolio’s management fee rate as the combined contractual advisory fee and the administration fee rates. The Trustees
considered the fee waiver and/or expense reimbursement arrangements currently in place for the Portfolio and considered the net advisory fee rate after taking into account any waivers and/or reimbursements. The Trustees recognized that it is difficult to make comparisons of advisory fees because there are variations in the services that are included in the fees paid by other funds. The Trustees’ determinations as a result of the review of the Portfolio’s advisory fees and expense ratios are summarized below:
The Trustees noted that the Portfolio’s net advisory fee and actual total expenses for Class 1 shares were in the first and second quintiles, respectively, of their Universe Group. After considering the factors identified above, in light of this information, the Trustees concluded that the advisory fees were reasonable.
| 26 | JPMORGAN INSURANCE TRUST | DECEMBER 31, 2011 | ||||
Table of Contents
J.P. Morgan Funds are distributed by JPMorgan Distribution Services, Inc., which is an affiliate of JPMorgan Chase & Co. Affiliates of JPMorgan Chase & Co. receive fees for providing various services to the funds.
Contact JPMorgan Distribution Services, Inc. at 1-800-480-4111 for a portfolio prospectus. You can also visit us at www.jpmorganfunds.com. Investors should carefully consider the investment objectives and risk as well as charges and expenses of the mutual fund before investing. The prospectus contains this and other information about the mutual fund. Read the prospectus carefully before investing.
The Portfolio files a complete schedule of its portfolio holdings for the first and third quarters of its fiscal year with the SEC on Form N-Q. The Portfolio’s Forms N-Q are available on the SEC’s website at http://www.sec.gov and may be reviewed and copied at the SEC’s Public Reference Room in Washington, DC. Information on the operation of the SEC’s Public Reference Room may be obtained by calling 1-800-SEC-0330. Shareholders may request the Form N-Q without charge by calling 1-800-480-4111 or by visiting the variable insurance portfolio section of the J.P. Morgan Funds’ website at www.jpmorganfunds.com.
A description of the Portfolio’s policies and procedures with respect to the disclosure of the Portfolio’s holdings is available in the prospectus and Statement of Additional Information.
A copy of proxy policies and procedures is available without charge upon request by calling 1-800-480-4111 and a description of such policies and procedures is on the SEC’s website at www.sec.gov. The Trustees have delegated the authority to vote proxies for securities owned by the Portfolio to the Advisor. A copy of the Portfolio’s voting record for the most recent 12-month period ended June 30 is available on the SEC’s website at www.sec.gov or at the Portfolio’s website at www.jpmorganfunds.com no later than August 31 of each year. The Portfolio’s proxy voting record will include, among other things, a brief description of the matter voted on for each portfolio security, and will state how each vote was cast, for example, for or against the proposal.
Table of Contents
| © JPMorgan Chase & Co., 2012. All rights reserved. December 2011. | AN-JPMITMCGP-1211 |
Table of Contents
Annual Report
JPMorgan Insurance Trust
December 31, 2011
JPMorgan Insurance Trust Mid Cap Value Portfolio
NOT FDIC INSURED Ÿ NO BANK GUARANTEE Ÿ MAY LOSE VALUE
|  |
Table of Contents
Investments in the Portfolio are not bank deposits or obligations of, or guaranteed or endorsed by, any bank and are not insured or guaranteed by the FDIC, the Federal Reserve Board or any other government agency. You could lose money if you sell when the Portfolio’s share price is lower than when you invested.
Past performance is no guarantee for future performance. The general market views expressed in this report are opinions based on conditions through the end of the reporting period and are subject to change without notice based on market and other conditions. These views are not intended to predict the future performance of the Portfolio or the securities markets. References to specific securities and their issuers are for illustrative purposes only and are not intended to be, and should not be interpreted as, recommendations to purchase or sell such securities. Such views are not meant as investment advice and may not be relied on as an indication of trading intent on behalf of the Portfolio.
This Portfolio is intended to be a funding vehicle for variable annuity contracts and variable life insurance policies (collectively “Policies”) offered by separate accounts of participating insurance companies. Portfolio shares are also offered through qualified pension and retirement plans (“Eligible Plans”). Individuals may not purchase shares directly from the Portfolio.
Prospective investors should refer to the Portfolio’s prospectus for a discussion of the Portfolio’s investment objective, strategies and risks. Call J.P. Morgan Funds Service Center at 1-800-480-4111 for a prospectus containing more complete information about the Portfolio including management fees and other expenses. Please read it carefully before investing.
Table of Contents
JANUARY 25, 2012 (Unaudited)
Dear Shareholder:
Investors greeted 2011 in much the same way they welcomed 2010: with high hopes that an improving U.S. economy would finally get us back on course to recovery.
This optimism quickly faded as the European debt crisis and a host of other economic and geopolitical concerns cast a dark shadow on the prospects for future growth. The combination of weak global economic data, credit downgrades in the U.S. and in Europe, and escalating fears of contagion all resulted in a level of market volatility not seen since the financial crisis three years ago.
|
“Investors greeted 2011 in much the same way they welcomed 2010: With high hopes that an improving U.S. economy would finally get us back on course to recovery.” |

Nonetheless, stocks have regained some of their footing, as positive fourth-quarter economic data on auto sales, payroll employment and manufacturing activity all appear to indicate that consumer confidence is improving and economic growth may be accelerating.
We remain cautious, however, since many of the same challenges that we experienced in 2011 — European debt concerns, uncertainty over monetary and fiscal stimulus, and soft economic data — will likely remain in place this year, laying the groundwork for continued market volatility.
Strong fourth quarter surge caps volatile year
The European debt crisis and other geopolitical and economic events created a generally volatile year for equities, culminating in major sell off in the third quarter. A strong fourth quarter comeback did little to reverse the losses, as the Standard & Poor’s 500 Index (“S&P 500 Index”) ended the year with only slight gains. As of December 31, 2011, the Index had reached a level of 1,258, an increase of 2.1% from one year prior.
Large cap growth stocks lead style categories
Large cap stocks outpaced mid- and small-cap stocks over the 12-month period ended December 31, 2011 (the Russell 1000 Index returned 1.5% and the Russell Mid Cap Index returned -1.6%, compared to a return of -4.2% for the Russell 2000 Index). Overall, large-cap growth stocks fared better than large-cap value stocks as the Russell 1000 Growth Index returned 2.6% for the 12-month reporting period, compared to 0.4% for the Russell 1000 Value Index.
Euro zone uncertainty drives flight-to-quality sentiment
Investors’ lack of confidence in global economic growth prompted them to seek safe havens in U.S. Treasury securities, and high-quality corporate bonds. The Barclays Capital U.S. Aggregate Bond Index returned 7.8%. High yield bonds and emerging market debt securities also performed well, as the Barclays Capital High Yield Index returned 5.0%, and the Barclays Capital Emerging Markets Index returned 7.0% for the 12-month period ended December 31, 2011.
Similar economic concerns pushed yields of U.S. Treasury securities maturing in 10 years or more to historic lows throughout the year. As of the end of the 12-month period ended December 31, 2011, the yields on the benchmark 10-year U.S. Treasury bond dropped from 3.3% to 1.9%. In addition, yields on the 30-year U.S. Treasury bond declined from 4.3% to 2.9%, as did the two-year U.S. Treasury note, from 0.6% to 0.3%.
Lesson for 2012: Keep balance in mind in economic uncertainty
Last year offered its share of shocks to investors: geopolitical upheaval, natural disasters, sovereign-debt crises, and credit-rating downgrades were all among the events competing for the market’s attention. Against the backdrop of an election year, it’s likely that we will face continued global surprises — both on the upside and the downside.
As you reassess your investment strategy for the year ahead, it’s important to stick with a plan that focuses on diversification as well as long-term allocation. Trying to “time” market fluctuations can be risky business, especially given the ongoing uncertainty surrounding the direction of economic growth and the euro zone crisis in the months ahead.
On behalf of everyone at J.P. Morgan Asset Management, thank you for your continued confidence. We look forward to managing your investment needs for years to come. Should you have any questions, please visit www.jpmorganfunds.com or contact the J.P. Morgan Funds Service Center at 1-800-480-4111.
Sincerely yours,

George C.W. Gatch
CEO-Investment Management Americas
J.P. Morgan Asset Management
| DECEMBER 31, 2011 | JPMORGAN INSURANCE TRUST | 1 | ||||||
Table of Contents
JPMorgan Insurance Trust Mid Cap Value Portfolio
TWELVE MONTHS ENDED DECEMBER 31, 2011 (Unaudited)
| REPORTING PERIOD RETURN: | ||||
| Portfolio (Class 1 Shares)* | 2.16% | |||
| Russell Midcap Value Index | (1.38)% | |||
| Net Assets as of 12/31/2011 | $254,378,785 | |||
INVESTMENT OBJECTIVE**
The JPMorgan Insurance Trust Mid Cap Value Portfolio (the “Portfolio”) seeks capital appreciation with the secondary goal of achieving current income by investing primarily in equity securities.
HOW DID THE MARKET PERFORM?
Strong corporate earnings and robust merger-and-acquisition activity encouraged investors and helped support U.S. stock prices during the beginning of the reporting period. However, uncertainty surrounding global economic growth began to dampen investors’ appetite for risk in April 2011. This negative mood among investors worsened as the market seemed to lack confidence in the ability of European governments to combat the region’s debt crisis, stoking fear about economic contagion. Concerns about the credit downgrade of U.S.-issued debt exacerbated this negative sentiment among investors. Each of these factors helped trigger a sharp downturn in stock prices in the third quarter of 2011. Stocks rebounded in the fourth quarter of 2011 as better-than-expected economic data helped investors regain their appetite for risk. The Russell Midcap Value Index (the “Benchmark”) finished the twelve months ended December 31, 2011 with a 1.38% loss.
WHAT WERE THE MAIN DRIVERS OF THE PORTFOLIO’S PERFORMANCE?
The Portfolio (Class 1 Shares) outperformed the Benchmark for the twelve months ended December 31, 2011. The Portfolio’s stock selection in the consumer discretionary and information technology sectors contributed to relative performance, while the Portfolio’s stock selection in the health care sector and the Fund’s overweight versus the Benchmark in the telecommunication services sector detracted from relative performance.
Individual contributors to relative performance included the Portfolio’s positions in Williams Cos., TJX Cos., Inc. and W.R. Berkley Corp. Shares of Williams Cos., an integrated energy company, rose as investors reacted positively to the announcement that it would separate into two distinct publicly traded companies. Shares of TJX Cos., Inc. increased after the retail company raised its expectations for its 2012 earnings. Shares of property and casualty insurer W.R. Berkley Corp. benefited from the news that the company declared a dividend and increased its stock repurchase authorization.
Individual detractors from the Portfolio’s relative performance included the Portfolio’s positions in Newfield Exploration Co., Devon Energy Corp. and Community Health Systems, Inc. Shares of oil and gas operations companies Newfield Exploration Co. and Devon Energy Corp. declined due to concerns that slowing economic growth would hurt the demand for oil and natural gas. Newfield Exploration Co. also lowered its expectations for its fiscal 2011 natural gas production, which placed additional pressure on the stock. Shares of hospital operator Community Health Systems, Inc. traded lower after the company reported a decline in third-quarter patient admissions.
HOW WAS THE PORTFOLIO POSITIONED?
The Portfolio managers utilized a bottom-up approach to stock selection and sought to identify durable franchises possessing the ability to generate sustainable levels of free cash flow. The Portfolio managers believed that these types of companies should perform relatively well in what they view as a slow but sustainable economic recovery in the United States. The Portfolio’s largest overweight continued to be in the consumer discretionary sector. The Portfolio managers sought to own retailers with strong brands and business models that produce recurring revenue, believing that these factors, coupled with lower levels of capital spending, should contribute to their sustainable generation of free cash flow.
| 2 | JPMORGAN INSURANCE TRUST | DECEMBER 31, 2011 | ||||
Table of Contents
| TOP TEN EQUITY HOLDINGS OF THE PORTFOLIO*** | ||||||||
| 1. | Republic Services, Inc. | 1.9 | % | |||||
| 2. | Energen Corp. | 1.7 | ||||||
| 3. | Loews Corp. | 1.7 | ||||||
| 4. | CMS Energy Corp. | 1.6 | ||||||
| 5. | Williams Cos., Inc. (The) | 1.5 | ||||||
| 6. | Ameriprise Financial, Inc. | 1.5 | ||||||
| 7. | Xcel Energy, Inc. | 1.5 | ||||||
| 8. | Ball Corp. | 1.4 | ||||||
| 9. | W.R. Berkley Corp. | 1.4 | ||||||
| 10. | ONEOK, Inc. | 1.4 | ||||||
PORTFOLIO COMPOSITION BY SECTOR*** | ||||
| Financials | 22.6 | % | ||
| Consumer Discretionary | 18.1 | |||
| Utilities | 11.3 | |||
| Industrials | 8.5 | |||
| Materials | 7.0 | |||
| Energy | 6.4 | |||
| Information Technology | 6.3 | |||
| Health Care | 5.9 | |||
| Consumer Staples | 5.9 | |||
| Telecommunication Services | 1.3 | |||
| Short-Term Investment | 6.7 | |||
| * | The return shown is based on net asset value calculated for shareholder transactions and may differ from the return shown in the financial highlights, which reflects adjustments made to the net asset value in accordance with accounting principles generally accepted in the United States of America. |
| ** | The advisor seeks to achieve the Portfolio’s objective. There can be no guarantee it will be achieved. |
| *** | Percentages indicated are based upon total investments as of December 31, 2011. The Portfolio’s composition is subject to change. |
| DECEMBER 31, 2011 | JPMORGAN INSURANCE TRUST | 3 | ||||||
Table of Contents
JPMorgan Insurance Trust Mid Cap Value Portfolio
PORTFOLIO COMMENTARY
TWELVE MONTHS ENDED DECEMBER 31, 2011 (Unaudited) (continued)
AVERAGE ANNUAL TOTAL RETURNS AS OF DECEMBER 31, 2011 | ||||||||||||||||
| INCEPTION DATE OF CLASS | 1 YEAR | 5 YEAR | 10 YEAR | |||||||||||||
Class 1 Shares | 9/28/01 | 2.16 | % | 1.80 | % | 8.24 | % | |||||||||
TEN YEAR PERFORMANCE (12/31/01 TO 12/31/11)
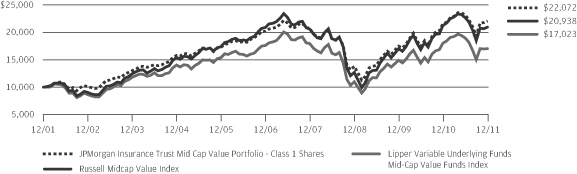
Source: Lipper, Inc. The performance quoted is past performance and is not a guarantee of future results. Mutual funds are subject to certain market risks. Investment returns and principal value of an investment will fluctuate so that an investor’s shares, when redeemed, may be worth more or less than their original cost. Current performance may be higher or lower than the performance data shown. For up-to-date month-end performance information please call 1-800-480-4111.
Inception date for JPMorgan Insurance Trust Mid Cap Value Portfolio is September 28, 2001, which is the inception date of JPMorgan Mid Cap Value Portfolio (“Predecessor Portfolio”). JPMorgan Insurance Trust Mid Cap Value Portfolio acquired all of the assets and liabilities of the Predecessor Portfolio in a reorganization on April 24, 2009. The Predecessor Portfolio’s performance and financial history have been adopted by the JPMorgan Insurance Trust Mid Cap Value Portfolio and have been used since the reorganization. As a result, the performance prior to April 25, 2009, is the performance of the Predecessor Portfolio.
The graph illustrates comparative performance for $10,000 invested in Class 1 Shares of the JPMorgan Insurance Trust Mid Cap Value Portfolio, the Russell Midcap Value Index and the Lipper Variable Underlying Funds Mid-Cap Value Funds Index from December 31, 2001 to December 31, 2011. The performance of the Portfolio assumes reinvestment of all dividends and capital gains, if any. The performance of the Russell Midcap Value Index does not reflect the
deduction of expenses associated with a mutual fund and has been adjusted to reflect reinvestment of all dividends and capital gains of the securities included in the benchmark. The performance of the Lipper Variable Underlying Funds Mid-Cap Value Funds Index includes expenses associated with a mutual fund, such as investment management fees. These expenses are not identical to expenses charged by the Portfolio. The Russell Midcap Value Index is an unmanaged index which measures the performance of those Russell Midcap companies with lower price-to-book ratios and lower forecasted growth values. The Lipper Variable Underlying Funds Mid-Cap Value Funds Index is an index based on the total returns of certain mutual funds within the Portfolio’s designated category as determined by Lipper, Inc. Investors cannot invest directly in an index.
The performance does not reflect any charges imposed by the Policies or Eligible Plans. If these charges were included, the returns would be lower than shown. Performance may reflect the waiver of the Portfolio’s fees and reimbursement of expenses for certain periods since the inception date. Without these waivers and reimbursements performance would have been lower.
The returns shown are based on net asset values calculated for shareholder transactions and may differ from the returns shown in the financial highlights, which reflect adjustments made to the net asset values in accordance with accounting principles generally accepted in the United States of America.
| 4 | JPMORGAN INSURANCE TRUST | DECEMBER 31, 2011 | ||||
Table of Contents
JPMorgan Insurance Trust Mid Cap Value Portfolio
SCHEDULE OF PORTFOLIO INVESTMENTS
AS OF DECEMBER 31, 2011
| SHARES | SECURITY DESCRIPTION | VALUE($) | ||||||
| Common Stocks — 97.2% |
| ||||||
Consumer Discretionary — 18.9% |
| |||||||
Distributors — 1.0% |
| |||||||
| 40,940 | Genuine Parts Co. | 2,505,528 | ||||||
|
| |||||||
Hotels, Restaurants & Leisure — 3.6% | ||||||||
| 59,441 | Darden Restaurants, Inc. | 2,709,321 | ||||||
| 107,086 | Marriott International, Inc., Class A | 3,123,698 | ||||||
| 33,600 | Royal Caribbean Cruises Ltd. | 832,272 | ||||||
| 41,800 | Yum! Brands, Inc. | 2,466,618 | ||||||
|
| |||||||
| 9,131,909 | ||||||||
|
| |||||||
Household Durables — 1.3% | ||||||||
| 46,587 | Jarden Corp. | 1,392,019 | ||||||
| 31,400 | Mohawk Industries, Inc. (a) | 1,879,290 | ||||||
|
| |||||||
| 3,271,309 | ||||||||
|
| |||||||
Internet & Catalog Retail — 0.8% | ||||||||
| 36,700 | Expedia, Inc. | 1,065,034 | ||||||
| 36,700 | TripAdvisor, Inc. (a) | 925,207 | ||||||
|
| |||||||
| 1,990,241 | ||||||||
|
| |||||||
Media — 3.6% | ||||||||
| 16,930 | AMC Networks, Inc., Class A (a) | 636,229 | ||||||
| 49,720 | Cablevision Systems Corp., Class A | 707,019 | ||||||
| 96,300 | CBS Corp. (Non Voting), Class B | 2,613,582 | ||||||
| 89,904 | Clear Channel Outdoor Holdings, Inc., Class A (a) | 1,128,295 | ||||||
| 74,900 | DISH Network Corp., Class A | 2,133,152 | ||||||
| 104,400 | Gannett Co., Inc. | 1,395,828 | ||||||
| 1,460 | Washington Post Co. (The), Class B | 550,143 | ||||||
|
| |||||||
| 9,164,248 | ||||||||
|
| |||||||
Multiline Retail — 1.8% | ||||||||
| 34,700 | Family Dollar Stores, Inc. | 2,000,802 | ||||||
| 54,200 | Kohl’s Corp. | 2,674,770 | ||||||
|
| |||||||
| 4,675,572 | ||||||||
|
| |||||||
Specialty Retail — 5.9% | ||||||||
| 8,350 | AutoZone, Inc. (a) | 2,713,500 | ||||||
| 40,470 | Bed Bath & Beyond, Inc. (a) | 2,346,046 | ||||||
| 112,090 | Gap, Inc. (The) | 2,079,269 | ||||||
| 31,600 | PetSmart, Inc. | 1,620,764 | ||||||
| 27,040 | Tiffany & Co. | 1,791,670 | ||||||
| 53,550 | TJX Cos., Inc. | 3,456,653 | ||||||
| 23,100 | Williams-Sonoma, Inc. | 889,350 | ||||||
|
| |||||||
| 14,897,252 | ||||||||
|
| |||||||
Textiles, Apparel & Luxury Goods — 0.9% | ||||||||
| 32,700 | PVH Corp. | 2,305,023 | ||||||
|
| |||||||
Total Consumer Discretionary | 47,941,082 | |||||||
|
| |||||||
| SHARES | SECURITY DESCRIPTION | VALUE($) | ||||||
Consumer Staples — 6.2% | ||||||||
Beverages — 2.4% | ||||||||
| 64,640 | Beam, Inc. | 3,311,507 | ||||||
| 14,882 | Brown-Forman Corp., Class B | 1,198,150 | ||||||
| 37,400 | Dr. Pepper Snapple Group, Inc. | 1,476,552 | ||||||
|
| |||||||
| 5,986,209 | ||||||||
|
| |||||||
Food Products — 2.9% | ||||||||
| 28,900 | Hershey Co. (The) | 1,785,442 | ||||||
| 32,430 | JM Smucker Co. (The) | 2,535,053 | ||||||
| 37,000 | Ralcorp Holdings, Inc. (a) | 3,163,500 | ||||||
|
| |||||||
| 7,483,995 | ||||||||
|
| |||||||
Household Products — 0.9% | ||||||||
| 28,900 | Energizer Holdings, Inc. (a) | 2,239,172 | ||||||
|
| |||||||
Total Consumer Staples | 15,709,376 | |||||||
|
| |||||||
Energy — 6.6% | ||||||||
Oil, Gas & Consumable Fuels — 6.6% | ||||||||
| 36,140 | CVR Energy, Inc. (a) | 676,902 | ||||||
| 51,114 | Devon Energy Corp. | 3,169,068 | ||||||
| 92,490 | Energen Corp. | 4,624,500 | ||||||
| 34,210 | EQT Corp. | 1,874,366 | ||||||
| 41,000 | Newfield Exploration Co. (a) | 1,546,930 | ||||||
| 34,570 | Teekay Corp., (Canada) | 924,056 | ||||||
| 123,480 | Williams Cos., Inc. (The) | 4,077,310 | ||||||
|
| |||||||
Total Energy | 16,893,132 | |||||||
|
| |||||||
Financials — 23.5% | ||||||||
Capital Markets — 4.1% | ||||||||
| 80,700 | Ameriprise Financial, Inc. | 4,005,948 | ||||||
| 122,600 | Invesco Ltd. | 2,463,034 | ||||||
| 32,630 | Northern Trust Corp. | 1,294,106 | ||||||
| 47,440 | T. Rowe Price Group, Inc. | 2,701,708 | ||||||
|
| |||||||
| 10,464,796 | ||||||||
|
| |||||||
Commercial Banks — 5.6% | ||||||||
| 50,600 | BancorpSouth, Inc. | 557,612 | ||||||
| 46,070 | City National Corp. | 2,035,373 | ||||||
| 39,240 | Cullen/Frost Bankers, Inc. | 2,076,188 | ||||||
| 206,600 | Fifth Third Bancorp | 2,627,952 | ||||||
| 154,900 | Huntington Bancshares, Inc. | 850,401 | ||||||
| 40,070 | M&T Bank Corp. | 3,058,944 | ||||||
| 112,100 | SunTrust Banks, Inc. | 1,984,170 | ||||||
| 70,400 | Zions Bancorp | 1,146,112 | ||||||
|
| |||||||
| 14,336,752 | ||||||||
|
| |||||||
Insurance — 9.5% | ||||||||
| 20,200 | Arch Capital Group Ltd., (Bermuda) (a) | 752,046 | ||||||
| 33,900 | Chubb Corp. (The) | 2,346,558 | ||||||
SEE NOTES TO FINANCIAL STATEMENTS.
| DECEMBER 31, 2011 | JPMORGAN INSURANCE TRUST | 5 | ||||||
Table of Contents
JPMorgan Insurance Trust Mid Cap Value Portfolio
SCHEDULE OF PORTFOLIO INVESTMENTS
AS OF DECEMBER 31, 2011 (continued)
| SHARES | SECURITY DESCRIPTION | VALUE($) | ||||||
| Common Stocks — Continued | |||||||
Insurance — Continued | ||||||||
| 118,480 | Loews Corp. | 4,460,772 | ||||||
| 96,400 | Marsh & McLennan Cos., Inc. | 3,048,168 | ||||||
| 191,574 | Old Republic International Corp. | 1,775,891 | ||||||
| 85,882 | OneBeacon Insurance Group Ltd., Class A | 1,321,724 | ||||||
| 27,850 | Torchmark Corp. | 1,208,411 | ||||||
| 54,100 | Transatlantic Holdings, Inc. | 2,960,893 | ||||||
| 105,610 | W.R. Berkley Corp. | 3,631,928 | ||||||
| 133,100 | XL Group plc, (Ireland) | 2,631,387 | ||||||
|
| |||||||
| 24,137,778 | ||||||||
|
| |||||||
Real Estate Investment Trusts (REITs) — 2.4% |
| |||||||
| 48,500 | HCP, Inc. | 2,009,355 | ||||||
| 52,920 | Regency Centers Corp. | 1,990,850 | ||||||
| 26,044 | Vornado Realty Trust | 2,001,742 | ||||||
|
| |||||||
| 6,001,947 | ||||||||
|
| |||||||
Real Estate Management & Development — 0.7% |
| |||||||
| 119,780 | Brookfield Office Properties, Inc. | 1,873,359 | ||||||
|
| |||||||
Thrifts & Mortgage Finance — 1.2% |
| |||||||
| 78,100 | Capitol Federal Financial, Inc. | 901,274 | ||||||
| 168,280 | People’s United Financial, Inc. | 2,162,398 | ||||||
|
| |||||||
| 3,063,672 | ||||||||
|
| |||||||
Total Financials | 59,878,304 | |||||||
|
| |||||||
Health Care — 6.2% |
| |||||||
Health Care Equipment & Supplies — 0.9% |
| |||||||
| 30,860 | Becton, Dickinson & Co. | 2,305,859 | ||||||
|
| |||||||
Health Care Providers & Services — 5.3% |
| |||||||
| 82,100 | AmerisourceBergen Corp. | 3,053,299 | ||||||
| 29,400 | Cigna Corp. | 1,234,800 | ||||||
| 59,750 | Coventry Health Care, Inc. (a) | 1,814,608 | ||||||
| 50,300 | HCA Holdings, Inc. (a) | 1,108,109 | ||||||
| 31,900 | Humana, Inc. | 2,794,759 | ||||||
| 133,475 | Lincare Holdings, Inc. | 3,431,642 | ||||||
|
| |||||||
| 13,437,217 | ||||||||
|
| |||||||
Total Health Care | 15,743,076 | |||||||
|
| |||||||
Industrials — 8.9% |
| |||||||
Aerospace & Defense — 1.3% |
| |||||||
| 31,280 | Alliant Techsystems, Inc. | 1,787,965 | ||||||
| 21,400 | L-3 Communications Holdings, Inc. | 1,426,952 | ||||||
|
| |||||||
| 3,214,917 | ||||||||
|
| |||||||
Building Products — 0.5% |
| |||||||
| 78,440 | Fortune Brands Home & Security, Inc. (a) | 1,335,833 | ||||||
|
| |||||||
Commercial Services & Supplies — 2.0% |
| |||||||
| 182,130 | Republic Services, Inc. | 5,017,682 | ||||||
|
| |||||||
| SHARES | SECURITY DESCRIPTION | VALUE($) | ||||||
Electrical Equipment — 3.1% |
| |||||||
| 62,000 | AMETEK, Inc. | 2,610,200 | ||||||
| 49,040 | Cooper Industries plc | 2,655,516 | ||||||
| 49,700 | Regal-Beloit Corp. | 2,533,209 | ||||||
|
| |||||||
| 7,798,925 | ||||||||
|
| |||||||
Industrial Conglomerates — 1.0% | ||||||||
| 59,340 | Carlisle Cos., Inc. | 2,628,762 | ||||||
|
| |||||||
Machinery — 1.0% |
| |||||||
| 49,800 | Snap-on, Inc. | 2,520,876 | ||||||
|
| |||||||
Total Industrials | 22,516,995 | |||||||
|
| |||||||
Information Technology — 6.5% |
| |||||||
Electronic Equipment, Instruments & Components — 3.3% |
| |||||||
| 66,340 | Amphenol Corp., Class A | 3,011,172 | ||||||
| 68,310 | Arrow Electronics, Inc. (a) | 2,555,477 | ||||||
| 87,980 | TE Connectivity Ltd., (Switzerland) | 2,710,664 | ||||||
|
| |||||||
| 8,277,313 | ||||||||
|
| |||||||
IT Services — 1.2% |
| |||||||
| 90,090 | Jack Henry & Associates, Inc. | 3,027,925 | ||||||
|
| |||||||
Semiconductors & Semiconductor Equipment — 1.0% |
| |||||||
| 72,500 | Analog Devices, Inc. | 2,594,050 | ||||||
|
| |||||||
Software — 1.0% |
| |||||||
| 97,400 | Synopsys, Inc. (a) | 2,649,280 | ||||||
|
| |||||||
Total Information Technology | 16,548,568 | |||||||
|
| |||||||
Materials — 7.2% | ||||||||
Chemicals — 3.9% | ||||||||
| 27,900 | Airgas, Inc. | 2,178,432 | ||||||
| 49,746 | Albemarle Corp. | 2,562,417 | ||||||
| 28,730 | Sherwin-Williams Co. (The) | 2,564,727 | ||||||
| 41,550 | Sigma-Aldrich Corp. | 2,595,213 | ||||||
|
| |||||||
| 9,900,789 | ||||||||
|
| |||||||
Containers & Packaging — 3.3% | ||||||||
| 105,660 | Ball Corp. | 3,773,119 | ||||||
| 37,200 | Rock-Tenn Co., Class A | 2,146,440 | ||||||
| 67,390 | Silgan Holdings, Inc. | 2,603,949 | ||||||
|
| |||||||
| 8,523,508 | ||||||||
|
| |||||||
Total Materials | 18,424,297 | |||||||
|
| |||||||
Telecommunication Services — 1.4% | ||||||||
Diversified Telecommunication Services — 0.7% |
| |||||||
| 48,690 | CenturyLink, Inc. | 1,811,268 | ||||||
|
| |||||||
Wireless Telecommunication Services — 0.7% |
| |||||||
| 73,390 | Telephone & Data Systems, Inc. | 1,747,416 | ||||||
|
| |||||||
Total Telecommunication Services | 3,558,684 | |||||||
|
| |||||||
SEE NOTES TO FINANCIAL STATEMENTS.
| 6 | JPMORGAN INSURANCE TRUST | DECEMBER 31, 2011 | ||||
Table of Contents
JPMorgan Insurance Trust Mid Cap Value Portfolio
SCHEDULE OF PORTFOLIO INVESTMENTS
AS OF DECEMBER 31, 2011 (continued)
| SHARES | SECURITY DESCRIPTION | VALUE($) | ||||||
| Common Stocks — Continued |
| ||||||
Utilities — 11.8% | ||||||||
Electric Utilities — 2.9% | ||||||||
| 39,600 | Northeast Utilities | 1,428,372 | ||||||
| 154,200 | NV Energy, Inc. | 2,521,170 | ||||||
| 117,220 | Westar Energy, Inc. | 3,373,592 | ||||||
|
| |||||||
| 7,323,134 | ||||||||
|
| |||||||
Gas Utilities — 1.4% | ||||||||
| 41,420 | ONEOK, Inc. | 3,590,700 | ||||||
|
| |||||||
Multi-Utilities — 7.5% | ||||||||
| 76,300 | CenterPoint Energy, Inc. | 1,532,867 | ||||||
| 196,840 | CMS Energy Corp. | 4,346,227 | ||||||
| 60,500 | NSTAR | 2,841,080 | ||||||
| 56,500 | Sempra Energy | 3,107,500 | ||||||
| 93,900 | Wisconsin Energy Corp. | 3,282,744 | ||||||
| 143,480 | Xcel Energy, Inc. | 3,965,787 | ||||||
|
| |||||||
| 19,076,205 | ||||||||
|
| |||||||
Total Utilities | 29,990,039 | |||||||
|
| |||||||
Total Common Stocks | 247,203,553 | |||||||
|
| |||||||
| SHARES | SECURITY DESCRIPTION | VALUE($) | ||||||
| Short-Term Investment — 6.9% |
| ||||||
Investment Company — 6.9% | ||||||||
| 17,667,208 | JPMorgan Prime Money Market Fund, Institutional Class Shares, | 17,667,208 | ||||||
|
| |||||||
Total Investments — 104.1% | 264,870,761 | |||||||
Liabilities in Excess of | (10,491,976 | ) | ||||||
|
| |||||||
NET ASSETS — 100.0% | $ | 254,378,785 | ||||||
|
| |||||||
Percentages indicated are based on net assets.
NOTES TO SCHEDULE OF PORTFOLIO INVESTMENTS:
| (a) | — Non-income producing security. | |
| (b) | — Investment in affiliate. Money market fund registered under the Investment Company Act of 1940, as amended, and advised by J.P. Morgan Investment Management Inc. | |
| (l) | — The rate shown is the current yield as of December 31, 2011. | |
| (m) | — All or a portion of this security is reserved and/or pledged with the custodian for current or potential holdings of futures, swaps, options, TBAs, when-issued securities, delayed delivery securities, reverse repurchase agreements, unfunded commitments and/or forward foreign currency exchange contracts. |
SEE NOTES TO FINANCIAL STATEMENTS.
| DECEMBER 31, 2011 | JPMORGAN INSURANCE TRUST | 7 | ||||||
Table of Contents
STATEMENT OF ASSETS AND LIABILITIES
AS OF DECEMBER 31, 2011
| Mid Cap Value Portfolio | ||||
ASSETS: | ||||
Investments in non-affiliates, at value | $ | 247,203,553 | ||
Investments in affiliates, at value | 17,667,208 | |||
|
| |||
Total investment securities, at value | 264,870,761 | |||
Receivables: | ||||
Investment securities sold | 115,674 | |||
Portfolio shares sold | 329,701 | |||
Dividends from non-affiliates | 337,763 | |||
Dividends from affiliates | 416 | |||
|
| |||
Total Assets | 265,654,315 | |||
|
| |||
LIABILITIES: | ||||
Payables: | ||||
Investment securities purchased | 11,020,458 | |||
Portfolio shares redeemed | 44,248 | |||
Accrued liabilities: | ||||
Investment advisory fees | 130,246 | |||
Administration fees | 17,819 | |||
Custodian and accounting fees | 7,995 | |||
Trustees’ and Chief Compliance Officer’s fees | 1,711 | |||
Other | 53,053 | |||
|
| |||
Total Liabilities | 11,275,530 | |||
|
| |||
Net Assets | $ | 254,378,785 | ||
|
| |||
NET ASSETS: | ||||
Paid in capital | $ | 226,828,858 | ||
Accumulated undistributed net investment income | 2,924,572 | |||
Accumulated net realized gains (losses) | (24,891,814 | ) | ||
Net unrealized appreciation (depreciation) | 49,517,169 | |||
|
| |||
Total Net Assets | $ | 254,378,785 | ||
|
| |||
Outstanding units of beneficial interest (shares) | 37,102,954 | |||
Net Asset Value, offering and redemption price per share (a) | $ | 6.86 | ||
Cost of investments in non-affiliates | $ | 197,686,384 | ||
Cost of investments in affiliates | 17,667,208 | |||
| (a) | Per share amounts may not recalculate due to rounding of net assets and/or shares outstanding. |
SEE NOTES TO FINANCIAL STATEMENTS.
| 8 | JPMORGAN INSURANCE TRUST | DECEMBER 31, 2011 | ||||
Table of Contents
STATEMENT OF OPERATIONS
FOR THE YEAR ENDED DECEMBER 31, 2011
| Mid Cap Value Portfolio | ||||
INVESTMENT INCOME: | ||||
Dividend income from non-affiliates | $ | 4,950,952 | ||
Dividend income from affiliates | 4,150 | |||
Income from securities lending (net) | 11,446 | |||
|
| |||
Total investment income | 4,966,548 | |||
|
| |||
EXPENSES: | ||||
Investment advisory fees | 1,603,160 | |||
Administration fees | 218,356 | |||
Custodian and accounting fees | 24,329 | |||
Professional fees | 45,873 | |||
Trustees’ and Chief Compliance Officer’s fees | 1,049 | |||
Printing and mailing costs | 50,425 | |||
Transfer agent fees | 4,689 | |||
Other | 31,019 | |||
|
| |||
Total expenses | 1,978,900 | |||
|
| |||
Less amounts waived | (9,825 | ) | ||
|
| |||
Net expenses | 1,969,075 | |||
|
| |||
Net investment income (loss) | 2,997,473 | |||
|
| |||
REALIZED/UNREALIZED GAINS (LOSSES): | ||||
Net realized gain (loss) on transactions from investments in non-affiliates | 15,643,317 | |||
Change in net unrealized appreciation (depreciation) of investments in non-affiliates | (13,257,744 | ) | ||
|
| |||
Net realized/unrealized gains (losses) | 2,385,573 | |||
|
| |||
Change in net assets resulting from operations | $ | 5,383,046 | ||
|
| |||
SEE NOTES TO FINANCIAL STATEMENTS.
| DECEMBER 31, 2011 | JPMORGAN INSURANCE TRUST | 9 | ||||||
Table of Contents
STATEMENTS OF CHANGES IN NET ASSETS
FOR THE PERIODS INDICATED
| Mid Cap Value Portfolio | ||||||||
| Year Ended 12/31/2011 | Year Ended 12/31/2010 | |||||||
CHANGE IN NET ASSETS RESULTING FROM OPERATIONS: | ||||||||
Net investment income | $ | 2,997,473 | $ | 3,247,814 | ||||
Net realized gain | 15,643,317 | 8,333,230 | ||||||
Change in net unrealized appreciation (depreciation) | (13,257,744 | ) | 39,389,501 | |||||
|
|
|
| |||||
Change in net assets resulting from operations | 5,383,046 | 50,970,545 | ||||||
|
|
|
| |||||
DISTRIBUTIONS TO SHAREHOLDERS: | ||||||||
From net investment income | (3,246,300 | ) | (2,838,071 | ) | ||||
|
|
|
| |||||
Total distributions to shareholders | (3,246,300 | ) | (2,838,071 | ) | ||||
|
|
|
| |||||
CAPITAL TRANSACTIONS: | ||||||||
Change in net assets from capital transactions | (5,070,140 | ) | (29,253,724 | ) | ||||
|
|
|
| |||||
NET ASSETS: | ||||||||
Change in net assets | (2,933,394 | ) | 18,878,750 | |||||
Beginning of period | 257,312,179 | 238,433,429 | ||||||
|
|
|
| |||||
End of period | $ | 254,378,785 | $ | 257,312,179 | ||||
|
|
|
| |||||
(Distributions in excess of) net investment income | $ | 2,924,572 | $ | 3,243,713 | ||||
|
|
|
| |||||
CAPITAL TRANSACTIONS: | ||||||||
Proceeds from shares issued | $ | 47,962,715 | $ | 29,153,831 | ||||
Dividends and distributions reinvested | 3,246,300 | 2,838,071 | ||||||
Cost of shares redeemed | (56,279,155 | ) | (61,245,626 | ) | ||||
|
|
|
| |||||
Change in net assets from capital transactions | $ | (5,070,140 | ) | $ | (29,253,724 | ) | ||
|
|
|
| |||||
Total change in net assets from capital transactions | $ | (5,070,140 | ) | $ | (29,253,724 | ) | ||
|
|
|
| |||||
SHARE TRANSACTIONS: | ||||||||
Issued | 7,038,462 | 4,888,486 | ||||||
Reinvested | 460,468 | 454,819 | ||||||
Redeemed | (8,238,466 | ) | (10,302,850 | ) | ||||
|
|
|
| |||||
Change in Shares | (739,536 | ) | (4,959,545 | ) | ||||
|
|
|
| |||||
SEE NOTES TO FINANCIAL STATEMENTS.
| 10 | JPMORGAN INSURANCE TRUST | DECEMBER 31, 2011 | ||||
Table of Contents
THIS PAGE IS INTENTIONALLY LEFT BLANK
| DECEMBER 31, 2011 | JPMORGAN INSURANCE TRUST | 11 | ||||||
Table of Contents
FOR THE PERIODS INDICATED
| Per share operating performance | ||||||||||||||||||||||||||||
| Investment operations | Distributions | |||||||||||||||||||||||||||
| Net asset value, beginning of period | Net investment income (loss) | Net realized gains (losses) on | Total from investment operations | Net investment income | Net realized gain | Total distributions | ||||||||||||||||||||||
Mid Cap Value Portfolio (c) | ||||||||||||||||||||||||||||
Year Ended December 31, 2011 | $ | 6.80 | $ | 0.09 | $ | 0.06 | $ | 0.15 | $ | (0.09 | ) | $ | — | $ | (0.09 | ) | ||||||||||||
Year Ended December 31, 2010 | 5.57 | 0.09 | 1.21 | 1.30 | (0.07 | ) | — | (0.07 | ) | |||||||||||||||||||
Year Ended December 31, 2009* | 4.52 | 0.09 | 1.08 | 1.17 | (0.11 | ) | (0.01 | ) | (0.12 | ) | ||||||||||||||||||
Year Ended December 31, 2008* | 7.33 | 0.08 | (d) | (2.35 | ) | (2.27 | ) | (0.07 | ) | (0.47 | ) | (0.54 | ) | |||||||||||||||
Year Ended December 31, 2007* | 7.54 | 0.07 | 0.13 | 0.20 | (0.07 | ) | (0.34 | ) | (0.41 | ) | ||||||||||||||||||
| (a) | Includes adjustments in accordance with accounting principles generally accepted in the United States of America and as such, the net asset value for financial reporting purposes and the returns based upon those net asset values may differ from the net asset value and returns for shareholder transactions. |
| (b) | Includes earnings credits and interest expense, each of which is less than 0.01%, if applicable or unless otherwise noted. |
| (c) | Effective April 25, 2009, Diversified Mid Cap Value Portfolio was renamed Mid Cap Value Portfolio. Mid Cap Value Portfolio acquired all of the assets and liabilities of JPMorgan Mid Cap Value Portfolio (“Predecessor Portfolio”) in a reorganization on April 24, 2009. The Predecessor Portfolio’s performance and financial history have been adopted by Mid Cap Value Portfolio and have been used since the reorganization. As a result, the financial highlight information reflects that of the Predecessor Portfolio for the periods prior to its reorganization with Mid Cap Value Portfolio. |
| (d) | Calculated based upon average shares outstanding. |
| * | Reflects a 4.187:1 stock split that occurred on April 24, 2009. All per share amounts presented for periods prior to the stock split have been adjusted to reflect the stock split. |
SEE NOTES TO FINANCIAL STATEMENTS.
| 12 | JPMORGAN INSURANCE TRUST | DECEMBER 31, 2011 | ||||
Table of Contents
| Ratios/Supplemental data | |||||||||||||||||||||||||
| Ratios to average net assets | ||||||||||||||||||||||||||
| Net asset value, end of period | Total return (a) | Net assets, end of period | Net expenses (b) | Net income | Expenses | Portfolio turnover rate | ||||||||||||||||||||
| $ | 6.86 | 2.16 | % | $ | 254,378,785 | 0.80 | % | 1.22 | % | 0.80 | % | 43 | % | |||||||||||||
| 6.80 | 23.45 | 257,312,179 | 0.81 | 1.36 | 0.82 | 32 | ||||||||||||||||||||
| 5.57 | 26.68 | 238,433,429 | 0.88 | 1.93 | 1.02 | 39 | ||||||||||||||||||||
| 4.52 | (33.21 | ) | 181,965,679 | 1.00 | 1.31 | 1.25 | 41 | |||||||||||||||||||
| 7.33 | 2.45 | 312,274,147 | 1.00 | 0.92 | 1.25 | 48 | ||||||||||||||||||||
SEE NOTES TO FINANCIAL STATEMENTS.
| DECEMBER 31, 2011 | JPMORGAN INSURANCE TRUST | 13 | ||||||
Table of Contents
AS OF DECEMBER 31, 2011
1. Organization
JPMorgan Insurance Trust (the “Trust”) is registered under the Investment Company Act of 1940, as amended (the “1940 Act”), as an open-end management investment company and is a Massachusetts business trust.
The following is a separate Portfolio of the Trust (the “Portfolio”) covered by this report:
| Class Offered | Diversified/Non-Diversified | |||
| Mid Cap Value Portfolio | Class 1 | Diversified |
The Portfolio seeks capital appreciation with the secondary goal of achieving current income by investing primarily in equity securities.
Portfolio shares are offered only to separate accounts of participating insurance companies and Eligible Plans. Individuals may not purchase shares directly from the Portfolio.
The Portfolio acquired all of the assets and liabilities of JPMorgan Mid Cap Value Portfolio, a series of J.P. Morgan Series Trust II (“Predecessor Portfolio”) in a reorganization on April 24, 2009. The Predecessor Portfolio’s performance and financial history have been adopted by the Portfolio. On April 24, 2009, prior to the reorganization, shareholders of the Predecessor Portfolio received 4.187 shares of the Predecessor Portfolio for every share held of the Predecessor Portfolio. All share and per share amounts presented for periods prior to the stock split have been adjusted to reflect the stock split.
2. Significant Accounting Policies
The following is a summary of significant accounting policies followed by the Trust in the preparation of its financial statements. The policies are in accordance with accounting principles generally accepted in the United States of America. The preparation of financial statements requires management to make estimates and assumptions that affect the reported amounts of assets and liabilities at the date of the financial statements and the reported amounts of income and expenses for the period. Actual results could differ from those estimates.
A. Valuation of Investments — Equity securities listed on a North American, Central American, South American or Caribbean securities exchange shall generally be valued at the last sale price on the exchange on which the security is principally traded that is reported before the time when the net assets of the Portfolio are valued. The value of securities listed on The NASDAQ Stock Market LLC shall generally be the NASDAQ Official Closing Price. Fixed income securities (other than certain short-term investments maturing in less than 61 days) are valued each day based on prices received from independent or affiliated pricing services approved by the Board of Trustees or third party broker-dealers. The broker-dealers or pricing services use multiple valuation techniques to determine fair value. In instances where sufficient market activity exists, the broker-dealers or pricing services may utilize a market-based approach through which quotes from market makers are used to determine fair value. In instances where sufficient market activity may not exist or is limited, the broker- dealers or pricing services also utilize proprietary valuation models which may consider market transactions in comparable securities and the various relationships between securities in determining value and/or market characteristics such as benchmark yield curves, option-adjusted spreads, credit spreads, estimated default rates, coupon-rates, anticipated timing of principal repayments, underlying collateral and other unique security features in order to estimate the relevant cash flows, which are then discounted to calculate the fair values. Generally, short-term investments of sufficient credit quality maturing in less than 61 days are valued at amortized cost, which approximates market value. Certain investments of the Portfolio may, depending upon market conditions, trade in relatively thin markets and/or in markets that experience significant volatility. As a result of these conditions, the prices used by the Portfolio to value securities may differ from the value that would be realized if these securities were sold, and the differences could be material. Futures and options shall generally be valued on the basis of available market quotations. Swaps and other derivatives are valued daily, primarily using independent or affiliated pricing services approved by the Board of Trustees. If valuations are not available from such services or values received are deemed not representative of market value, values will be obtained from a third party broker-dealer or counterparty. Investments in other open-end investment companies are valued at such investment company’s net asset value per share as of the report date.
Securities or other assets for which market quotations are not readily available or for which market quotations do not represent the value at the time of pricing (including certain illiquid securities) are fair valued in accordance with procedures established by and under the supervision and responsibility of the Board of Trustees. Under these procedures, the Portfolio primarily employs a market-based approach which may use related or comparable assets or liabilities, recent transactions, market multiples, book values, and other relevant information for the investment to determine the fair value of the investment. The Portfolio may also use an income-based valuation approach in which the anticipated future cash flows of the investment are discounted to calculate fair value. Discounts may also be applied due to the nature or duration of any restrictions on the disposition of the investments. Valuations may be based upon current market prices of securities that are comparable in coupon, rating, maturity and industry. It is possible that the estimated values may differ significantly from the values that would have been used had a ready market for the investments existed, and such differences could be material. Trading in securities on most foreign exchanges and over-the-counter markets is normally completed before the close of the domestic market and may also take place on days when the domestic market is closed. In accordance with procedures adopted by the Board of Trustees, the Portfolio applies fair value pricing on equity securities on a daily basis except for North American, Central American, South American and Caribbean equity securities held in its portfolio, by utilizing the quotations of an independent pricing service, unless the Portfolio’s advisor determines that use of another valuation methodology is appropriate. The pricing service uses statistical analyses and quantitative models to adjust local market prices using factors such as subsequent movement and changes in the prices of indices, securities and exchange rates in other markets, in determining fair value as of the time the Portfolio calculates its net asset value.
| 14 | JPMORGAN INSURANCE TRUST | DECEMBER 31, 2011 | ||||
Table of Contents
Valuations reflected in this report are as of the report date. As a result, changes in valuation due to market events and/or issuer related events after the report date and prior to issuance of the report are not reflected herein.
The various inputs that are used in determining the fair value of the Portfolio’s investments are summarized into the three broad levels listed below.
| Ÿ | Level 1 — quoted prices in active markets for identical securities |
| Ÿ | Level 2 — other significant observable inputs (including quoted prices for similar securities, interest rates, prepayment speeds, credit risk, etc.) |
| Ÿ | Level 3 — significant unobservable inputs (including the Portfolio’s own assumptions in determining the fair value of investments) |
A financial instrument’s level within the fair value hierarchy is based on the lowest level of any input both individually and in aggregate that is significant to the fair value measurement. The inputs or methodology used for valuing securities are not necessarily an indication of the risk associated with investing in those securities.
The following table represents each valuation input as presented on the Schedule of Portfolio Investments (“SOI”):
Level 1 Quoted prices | Level 2 Other significant observable inputs | Level 3 Significant unobservable inputs | Total | |||||||||||||
Total Investments in Securities (a) | $ | 264,870,761 | $ | — | $ | — | $ | 264,870,761 | ||||||||
|
|
|
|
|
|
|
| |||||||||
| (a) | Portfolio holdings designated as Level 1 are disclosed individually in the SOI. Please refer to the SOI for industry specifics of portfolio holdings. |
There were no transfers between Levels 1 and 2 during the year ended December 31, 2011.
B. Securities Lending — The Portfolio may lend securities to brokers approved by J.P. Morgan Investment Management Inc. (“JPMIM” or the “Advisor”) in order to generate additional income. The Goldman Sachs Bank USA, doing business as Goldman Sachs Agency Lending (“GSAL”), serves as lending agent for the Portfolio pursuant to a Securities Lending Agreement (the “GSAL Securities Lending Agreement”). Securities loaned are collateralized by cash, which is invested in Capital Shares of the JPMorgan Prime Money Market Fund. Upon termination of the loan, the Portfolio is required to return to the borrower the posted cash collateral. Loans are subject to termination by the Portfolio or the borrower at any time.
Securities lending income is comprised of income earned on cash collateral investments (“Collateral Investments”), net of a rebate received from or paid to borrowers for use of cash collateral and lending agent fees. This amount is recorded as Income from securities lending (net) on the Statement of Operations. The Portfolio also receives payments from the borrower during the period of the loan, equivalent to dividends and interest earned on the securities loaned, which are recorded as Dividend or Interest income, respectively, on the Statement of Operations. For the year ended December 31, 2011, the Portfolio earned $2,454 from the investment of cash collateral, prior to rebates or fees, from an investment in an affiliated fund as described below.
At the inception of a loan, securities are exchanged for cash collateral equal to at least 102% of the value of loaned U.S. dollar-denominated securities plus accrued interest. The GSAL Securities Lending Agreement requires that the loaned securities be marked to market on a daily basis and additional cash collateral is requested from borrowers when the cash received from borrowers becomes less than 102% of the value of loaned securities.
The value of the cash collateral received is recorded as a liability on the Statement of Assets and Liabilities and details of Collateral Investments are disclosed in the SOI. At December 31, 2011, there were no outstanding securities on loan.
The Portfolio bears the risk of loss associated with the Collateral Investments and is not entitled to additional collateral from the borrower to cover any such losses. To the extent that the value of the Collateral Investments declines below the amount owed to a borrower, the Portfolio may incur losses that exceed the amount it earned on lending the security. Upon termination of a loan, the Portfolio may use leverage (borrow money) to repay the borrower for cash collateral posted if the Advisor does not believe that it is prudent to sell the Collateral Investments to fund the payment of this liability.
Securities lending also involves counterparty risks, including the risk that the loaned securities may not be returned in a timely manner or at all. Subject to certain conditions, GSAL has agreed to indemnify the Portfolio from losses resulting from a borrower’s failure to return a loaned security.
The Advisor waived fees associated with the Portfolio’s investment in JPMorgan Prime Money Market Fund in the amount of $1,760. This amount offsets the administration fees and shareholder servicing fees incurred by JPMorgan Prime Money Market Fund related to the Portfolio’s investment in such fund. A portion of the waiver is voluntary.
C. Security Transactions and Investment Income — Investment transactions are accounted for on the trade date (the date the order to buy or sell is executed). Securities gains and losses are calculated on a specifically identified cost basis. Interest income is determined on the basis of coupon interest accrued using the effective interest method adjusted for amortization of premiums and accretion of discounts. Dividend income less foreign taxes withheld, if any, is recorded on the ex-dividend date or when the Portfolio first learns of the dividend.
| DECEMBER 31, 2011 | JPMORGAN INSURANCE TRUST | 15 | ||||||
Table of Contents
NOTES TO FINANCIAL STATEMENTS
AS OF DECEMBER 31, 2011 (continued)
The Portfolio records distributions received in excess of income from underlying investments as a reduction of cost of investments and/or realized gain. Such amounts are based on estimates if actual amounts are not available and actual amounts of income, realized gain and return of capital may differ from the estimated amounts. The Portfolio adjusts the estimated amounts of components of distributions (and consequently its net investment income) as necessary once the issuers provide information about the actual composition of the distributions.
D. Allocation of Expenses — Expenses directly attributable to a portfolio are charged directly to that portfolio while the expenses attributable to more than one portfolio of the Trust are allocated among the respective portfolios.
E. Federal Income Taxes — The Portfolio is treated as a separate taxable entity for Federal income tax purposes. The Portfolio’s policy is to comply with the provisions of the Internal Revenue Code of 1986, as amended (the “Code”), applicable to regulated investment companies and to distribute to shareholders all of its distributable net investment income and net realized gain on investments. Accordingly, no provision for Federal income tax is necessary. The Portfolio is also a segregated portfolio of assets for insurance purposes and intends to comply with the diversification requirements of Subchapter L of the Code. The Portfolio is not aware of any tax positions for which it is reasonably possible that the total amounts of unrecognized tax benefits or losses will significantly change in the next twelve months. However, the Portfolio’s conclusions may be subject to future review based on changes in, or the interpretation of, the accounting standards or tax laws and regulations. The Portfolio’s Federal tax returns for the prior three fiscal years remain subject to examination by the Internal Revenue Service.
F. Dividends and Distributions to Shareholders — Dividends from net investment income and distributions of net realized capital gains, if any, are generally declared and paid at least annually. The amount of dividends and distributions from net investment income and net realized capital gains is determined in accordance with Federal income tax regulations, which may differ from accounting principles generally accepted in the United States of America. To the extent these “book/tax” differences are permanent in nature (i.e., that they result from other than timing of recognition — “temporary differences”), such amounts are reclassified within the capital accounts based on their Federal tax-basis treatment.
The following amounts were reclassified within the capital accounts:
| Paid in Capital | Accumulated Undistributed (Overdistributed) Net Investment Income | Accumulated Net Realized Gain (Loss) on Investments | ||||||||||
| $ | (262,233 | ) | $ | (70,314 | ) | $ | 332,547 | |||||
The reclassifications for the Portfolio relate primarily to the write-off of capital loss carryforwards acquired in the merger with the Predecessor Portfolio and non-taxable special dividends.
3. Fees and Other Transactions with Affiliates
A. Investment Advisory Fee — Pursuant to the Investment Advisory Agreement, JPMIM acts as the investment advisor to the Portfolio. JPMIM is a wholly-owned subsidiary of JPMorgan Asset Management Holdings Inc., which is a wholly owned subsidiary of JPMorgan Chase & Co. (“JPMorgan”). JPMIM supervises the investments of the Portfolio and for such services is paid a fee. The fee is accrued daily and paid monthly based on the Portfolio’s average daily net assets at an annual fee rate of 0.65%.
The Advisor waived Investment Advisory fees and/or reimbursed expenses as outlined in Note 3.E.
B. Administration Fee — Pursuant to an Administration Agreement, JPMorgan Funds Management, Inc. (the “Administrator”), an indirect, wholly-owned subsidiary of JPMorgan, provides certain administration services to the Portfolio. In consideration of these services, the Administrator receives a fee computed daily and paid monthly at the annual rate of 0.15% of the first $25 billion of the average daily net assets of all funds in the J.P. Morgan Funds Complex (excluding certain funds of funds and money market funds) and 0.075% of the average daily net assets in excess of $25 billion of all such funds. For the year ended December 31, 2011, the annual effective rate was 0.09% of the Portfolio’s average daily net assets.
JPMorgan Chase Bank, N.A. (“JPMCB”), a wholly-owned subsidiary of JPMorgan, and successor in interest to J.P. Morgan Investor Services Co. serves as the Portfolio’s sub-administrator (the “Sub-administrator”). For its services as Sub-administrator, JPMCB receives a portion of the fees payable to the Administrator.
C. Distribution Fees — Pursuant to a Distribution Agreement, JPMorgan Distribution Services, Inc. (the “Distributor”), a wholly-owned subsidiary of JPMorgan, serves as the Trust’s exclusive underwriter and promotes and arranges for the sale of the Portfolio’s shares. The Distributor receives no compensation in its capacity as the Portfolio’s underwriter.
D. Custodian and Accounting Fees — JPMCB provides portfolio custody and accounting services for the Portfolio. The amounts paid directly to JPMCB by the Portfolio for custody and accounting services are included in Custodian and accounting fees in the Statement of Operations. The custodian fees may be reduced by credits earned by the Portfolio, based on uninvested cash balances held by the custodian. Such earnings credits are presented separately in the Statement of Operations.
Interest expense, if any, paid to the custodian related to cash overdrafts is included in Interest expense to affiliates in the Statement of Operations.
E. Waivers and Reimbursements — The Advisor and Administrator have contractually agreed to waive fees and/or reimburse the Portfolio to the extent that total annual operating expenses (excluding acquired fund fees and expenses, dividend expense related to short sales, interest, taxes, extraordinary expenses and expenses related to the Board of Trustees’ deferred compensation plan) exceed 0.90% of the Portfolio’s average daily net assets.
| 16 | JPMORGAN INSURANCE TRUST | DECEMBER 31, 2011 | ||||
Table of Contents
The contractual expense limitation agreement was in effect for the year ended December 31, 2011. The expense limitation percentage above is in place until at least April 30, 2012.
Additionally, the Portfolio may invest in one or more money market funds advised by the Advisor or its affiliates. The Advisor, Administrator and the Distributor waive fees in an amount sufficient to offset the respective fees each charges to the affiliated money market fund on the Portfolio’s investment in such affiliated money market fund. A portion of the waiver is voluntary.
The amount of waivers resulting from investments in the money market funds for the year ended December 31, 2011 (excluding the waiver disclosed in Note 2.B. regarding cash collateral for securities lending invested in JPMorgan Prime Money Market Fund) was $9,825.
F. Other — Certain officers of the Trust are affiliated with the Advisor, the Administrator and the Distributor. Such officers, with the exception of the Chief Compliance Officer, receive no compensation from the Portfolio for serving in their respective roles.
The Board of Trustees appointed a Chief Compliance Officer to the Portfolio in accordance with federal securities regulations. The Portfolio, along with other affiliated portfolios, makes reimbursement payments, on a pro-rata basis, to the Administrator for a portion of the fees associated with the Office of the Chief Compliance Officer. Such fees are included in Trustees’ and Chief Compliance Officer’s fees in the Statement of Operations.
The Trust adopted a Trustee Deferred Compensation Plan (the “Plan”) which allows the Independent Trustees to defer the receipt of all or a portion of compensation related to performance of their duties as a Trustee. The deferred fees are invested in various J.P. Morgan Funds until distribution in accordance with the Plan.
During the year ended December 31, 2011, the Portfolio may have purchased securities from an underwriting syndicate in which the principal underwriter or members of the syndicate are affiliated with the Advisor.
The Portfolio may use related party broker/dealers. For the year ended December 31, 2011, the Portfolio did not incur any brokerage commissions with broker/dealers affiliated with the Advisor.
The Securities and Exchange Commission (“SEC”) has granted an exemptive order permitting the Portfolio to engage in principal transactions with J.P. Morgan Securities, Inc., an affiliated broker, involving taxable money market instruments subject to certain conditions.
4. Investment Transactions
During the year ended December 31, 2011, purchases and sales of investments (excluding short-term investments) were as follows:
| Purchases (excluding U.S. Government) | Sales (excluding U.S. Government) | |||||||
| $ | 104,880,821 | $ | 113,301,963 | |||||
During the year ended December 31, 2011, there were no purchases or sales of U.S. Government securities.
5. Federal Income Tax Matters
For Federal income tax purposes, the cost and unrealized appreciation (depreciation) in value of the investment securities at December 31, 2011, were as follows:
Aggregate Cost | Gross Unrealized Appreciation | Gross Unrealized Depreciation | Net Unrealized Appreciation (Depreciation) | |||||||||||||
| $ | 218,660,042 | $ | 52,751,817 | $ | 6,541,098 | $ | 46,210,719 | |||||||||
The difference between book and tax basis appreciation (depreciation) on investments is primarily attributed to wash sale loss deferrals.
The tax character of distributions paid during the fiscal year ended December 31, 2011 was as follows:
| Total Distributions Paid From: | ||||||||
| Ordinary Income | Total Paid | |||||||
| $ | 3,246,300 | $ | 3,246,300 | |||||
The tax character of distributions paid during the fiscal year ended December 31, 2010 was as follows:
| Total Distributions Paid From: | ||||||
| Ordinary Income | Total Paid | |||||
| $2,838,071 | $ | 2,838,071 | ||||
| DECEMBER 31, 2011 | JPMORGAN INSURANCE TRUST | 17 | ||||||
Table of Contents
NOTES TO FINANCIAL STATEMENTS
AS OF DECEMBER 31, 2011 (continued)
At December 31, 2011, the components of net assets (excluding paid in capital) on a tax basis were as follows:
| Current Distributable Ordinary Income | Current Capital Gain or (Tax Basis Capital | Unrealized Appreciation (Depreciation) | ||||||||||
| $ | 2,929,344 | $ | (21,162,635 | ) | $ | 46,210,719 | ||||||
The cumulative timing differences primarily consist of Trustee deferred compensation and wash sale loss deferrals.
Under the Regulated Investment Company Modernization Act of 2010 (“the Act”), net capital losses recognized by the Portfolio after December 31, 2010, may get carried forward indefinitely, and retain their character as short-term and/or long term losses. Prior to the Act, pre-enactment net capital losses incurred by the Portfolio were carried forward for eight years and treated as short-term losses. The Act requires that post-enactment net capital losses be used before pre-enactment net capital losses.
As of December 31, 2011, the Portfolio did not have post-enactment net capital loss carryforwards.
As of December 31, 2011, the Portfolio had the following pre-enactment net capital loss carryforwards, expiring during the year indicated, which are available to offset future realized gains:
| 2016 | 2017 | Total | ||||||||||
| $ | 4,260,018 | $ | 16,902,617 | * | $ | 21,162,635 | ||||||
| * | This amount includes $8,119,698 of capital loss carryforwards from business combinations, which may be limited in future years under the Internal Revenue Code Sections 381-384. |
During the year ended December 31, 2011, the Portfolio utilized capital loss carryforwards in the amount of $14,462,876 and $273,304 was written-off due to IRS Code Section 382-383 limitations.
Net capital losses incurred after October 31 and within the taxable year are deemed to arise on the first business day of the Portfolio’s next taxable year. For the year ended December 31, 2011, the Portfolio deferred to January 1, 2012 post-October short-term capital losses of $422,729.
6. Borrowings
The Trust and JPMCB have entered into a financing arrangement. Under this arrangement, JPMCB provides an unsecured, uncommitted credit facility in the aggregate amount of $100 million to certain of the J.P. Morgan Funds, including the Portfolio. Advances under the arrangement are taken primarily for temporary or emergency purposes, including the meeting of redemption requests that otherwise might require the untimely disposition of securities, and are subject to the Portfolio’s borrowing restrictions. Interest on borrowings is payable at a rate determined by JPMCB at the time of borrowing. This agreement has been extended until November 12, 2012.
The Portfolio had no borrowings outstanding from the unsecured, uncommitted credit facility at December 31, 2011, or at any time during the year then ended.
Interest expense paid, if any, as a result of borrowings from the unsecured, uncommitted credit facility is included in Interest expense to affiliates in the Statement of Operations.
7. Risks, Concentrations and Indemnifications
In the normal course of business, the Portfolio enters into contracts that contain a variety of representations which provide general indemnifications. The Portfolio’s maximum exposure under these arrangements is unknown, as this would involve future claims that may be made against the Portfolio that have not yet occurred. However, based on experience, the Portfolio expects the risk of loss to be remote.
From time to time, the Portfolio may have a concentration of several shareholders holding a significant percentage of shares outstanding. Investment activities of these shareholders could have a material impact on the Portfolio.
| 18 | JPMORGAN INSURANCE TRUST | DECEMBER 31, 2011 | ||||
Table of Contents
REPORT OF INDEPENDENT REGISTERED PUBLIC ACCOUNTING FIRM
To the Board of Trustees of JPMorgan Insurance Trust and Shareholders of JPMorgan Insurance Trust Mid Cap Value Portfolio:
In our opinion, the accompanying statement of assets and liabilities, including the schedule of portfolio investments, and the related statements of operations and of changes in net assets and the financial highlights present fairly, in all material respects, the financial position of JPMorgan Insurance Trust Mid Cap Value Portfolio (a separate Portfolio of JPMorgan Insurance Trust) (hereafter referred to as the “Portfolio”) at December 31, 2011, the results of its operations for the year then ended, the changes in its net assets for each of the two years in the period then ended and the financial highlights for each of the five years in the period then ended, in conformity with accounting principles generally accepted in the United States of America. These financial statements and financial highlights (hereafter referred to as “financial statements”) are the responsibility of the Portfolio’s management. Our responsibility is to express an opinion on these financial statements based on our audits. We conducted our audits of these financial statements in accordance with the standards of the Public Company Accounting Oversight Board (United States). Those standards require that we plan and perform the audit to obtain reasonable assurance about whether the financial statements are free of material misstatement. An audit includes examining, on a test basis, evidence supporting the amounts and disclosures in the financial statements, assessing the accounting principles used and significant estimates made by management, and evaluating the overall financial statement presentation. We believe that our audits, which included confirmation of securities at December 31, 2011 by correspondence with the custodian and brokers, provide a reasonable basis for our opinion.
PricewaterhouseCoopers LLP
New York, New York
February 23, 2012
| DECEMBER 31, 2011 | JPMORGAN INSURANCE TRUST | 19 | ||||||
Table of Contents
(Unaudited)
The Portfolio’s Statement of Additional Information includes additional information about the Portfolio’s Trustees and is available, without charge, upon request by calling 1-800-480-4111 or on the J.P. Morgan Funds’ website at www.jpmorganfunds.com.
Name (Year of Birth); Positions With the Portfolio (1) | Principal Occupations During Past 5 Years | Number of Complex Overseen by Trustee (2) | Other Directorships Held Outside Fund Complex During Past 5 Years | |||
Independent Trustees | ||||||
| William J. Armstrong (1941); Trustee of Trust since 2005; Trustee of heritage J.P. Morgan Funds since 1987. | Retired; CFO and Consultant, EduNeering, Inc. (internet business education supplier) (2000-2001); Vice President and Treasurer, Ingersoll-Rand Company (manufacturer of industrial equipment) (1972-2000). | 154 | None. | |||
| John F. Finn (1947); Trustee of Trust since 2005; Trustee of heritage One Group Mutual Funds since 1998. | Chairman (1985-present), President and Chief Executive Officer, Gardner, Inc. (supply chain management company serving industrial and consumer markets) (1974-present). | 154 | Director, Cardinal Health, Inc. (CAH) (1994-present); Director, Greif, Inc. (GEF) (industrial package products and services) (2007-present). | |||
| Dr. Matthew Goldstein (1941); Trustee of Trust since 2005; Trustee of heritage J.P. Morgan Funds since 2003. | Chancellor, City University of New York (1999-present); President, Adelphi University (New York) (1998-1999). | 154 | Director, New Plan Excel (NXL) (1999-2005); Director, National Financial Partners (NFP) (2003-2005); Director, Bronx-Lebanon Hospital Center; Director, United Way of New York City (2002-present). | |||
| Robert J. Higgins (1945); Trustee of Trust since 2005; Trustee of heritage J.P. Morgan Funds since 2002. | Retired; Director of Administration of the State of Rhode Island (2003-2004); President — Consumer Banking and Investment Services, Fleet Boston Financial (1971-2001). | 154 | None. | |||
| Peter C. Marshall (1942); Trustee of Trust since 2005; Trustee of heritage One Group Mutual Funds since 1985. | Self-employed business consultant (2002-present). | 154 | Director, Center for Communication, Hearing, and Deafness (1990-present). | |||
| Marilyn McCoy* (1948); Trustee of Trust since 2005; Trustee of heritage One Group Mutual Funds since 1999. | Vice President of Administration and Planning, Northwestern University (1985-present). | 154 | Trustee, Carleton College (2003-present). | |||
| William G. Morton, Jr. (1937); Trustee of Trust since 2005; Trustee of heritage J.P. Morgan Funds since 2003. | Retired; Chairman Emeritus (2001-2002), and Chairman and Chief Executive Officer, Boston Stock Exchange (1985-2001). | 154 | Director, Radio Shack Corp. (1987-2008); Trustee, Stratton Mountain School (2001-present). | |||
| Robert A. Oden, Jr. (1946); Trustee of Trust since 2005; Trustee of heritage One Group Mutual Funds since 1997. | Retired; President, Carleton College (2002-2010); President, Kenyon College (1995-2002). | 154 | Trustee, American University in Cairo (1999-present); Trustee, Carleton College (2002-2010). | |||
| Fergus Reid, III (1932); Trustee of Trust (Chairman) since 2005; Trustee (Chairman) of heritage J.P. Morgan Funds since 1987. | Chairman, Joe Pietryka, Inc. (formerly Lumelite Corporation) (plastics manufacturing) (2003-present); Chairman and Chief Executive Officer, Lumelite Corporation (1985-2002). | 154 | Trustee, Morgan Stanley Funds (105 portfolios) (1992-present). | |||
| 20 | JPMORGAN INSURANCE TRUST | DECEMBER 31, 2011 | ||||
Table of Contents
Name (Year of Birth); Positions With the Portfolio (1) | Principal Occupations During Past 5 Years | Number of Complex Overseen by Trustee (2) | Other Directorships Held Outside Fund Complex During Past 5 Years | |||
Independent Trustees (continued) | ||||||
| Frederick W. Ruebeck (1939); Trustee of Trust since 2005; Trustee of heritage One Group Mutual Funds since 1994. | Consultant (2000-present); Advisor, JP Greene & Associates, LLC (broker-dealer) (2000-2009); Chief Investment Officer, Wabash College (2004-present); Director of Investments, Eli Lilly and Company (pharmaceuticals) (1988-1999). | 154 | Trustee, Wabash College (1988-present); Chairman, Indianapolis Symphony Orchestra Foundation (1994-present). | |||
| James J. Schonbachler (1943); Trustee of Trust since 2005; Trustee of heritage J.P. Morgan Funds since 2001. | Retired; Managing Director of Bankers Trust Company (financial services) (1968-1998). | 154 | None. | |||
Interested Trustees | ||||||
| Frankie D. Hughes** (1952), Trustee of Trust since 2008. | President and Chief Investment Officer, Hughes Capital Management, Inc. (fixed income asset management) (1993-present). | 154 | Trustee, The Victory Portfolios (2000-2008). | |||
| Leonard M. Spalding, Jr.*** (1935); Trustee of Trust since 2005; Trustee of heritage J.P. Morgan Funds since 1998. | Retired; Chief Executive Officer, Chase Mutual Funds (investment company) (1989-1998); President and Chief Executive Officer, Vista Capital Management (investment management) (1990-1998); Chief Investment Executive, Chase Manhattan Private Bank (investment management) (1990-1998). | 154 | Director, Glenview Trust Company, LLC (2001-present); Trustee, St. Catharine College (1998-present); Trustee, Bellarmine University (2000-present); Director, Springfield-Washington County Economic Development Authority (1997-present); Trustee, Catholic Education Foundation (2005-present). | |||
| (1) | Each Trustee serves for an indefinite term, subject to the Trust’s current retirement policy, which is age 75 for all Trustees, except that the Board has determined Messrs. Reid and Spalding should continue to serve until December 31, 2012. |
| (2) | A Fund Complex means two or more registered investment companies that hold themselves out to investors as related companies for purposes of investment and investor services or have a common investment adviser or have an investment adviser that is an affiliated person of the investment adviser of any of the other registered investment companies. The J.P. Morgan Funds Complex for which the Board of Trustees serves currently includes eleven registered investment companies (154 funds). |
| * | Ms. McCoy has served as Vice President of Administration and Planning for Northwestern University since 1985. William M. Daley was the Head of Corporate Responsibility for JPMorgan Chase & Co. prior to January 2011 and served as a member of the Board of Trustees of Northwestern University from 2005 through 2010. JPMIM, the Funds’ investment advisor, is a wholly-owned subsidiary of JPMorgan Chase & Co. Three other members of the Board of Trustees of Northwestern University are executive officers of registered investment advisors (not affiliated with JPMorgan) that are under common control with subadvisors to certain J.P. Morgan Funds. |
| ** | Ms. Hughes is treated as an “interested person” based on the portfolio holdings of clients of Hughes Capital Management, Inc. |
| *** | Mr. Spalding is treated as an “interested person” due to his ownership of JPMorgan Chase stock. |
The contact address for each of the Trustees is 270 Park Avenue, New York, NY 10017.
| DECEMBER 31, 2011 | JPMORGAN INSURANCE TRUST | 21 | ||||||
Table of Contents
(Unaudited)
Name (Year of Birth), Positions Held with the Trust (Since) | Principal Occupations During Past 5 Years | |
Patricia A. Maleski (1960), | Managing Director, J.P. Morgan Investment Management Inc. and Chief Administrative Officer, J.P. Morgan Funds and Institutional Pooled Vehicles since 2010; previously, Treasurer and Principal Financial Officer of the Trusts from 2008 to 2010; previously, Head of Funds Administration and Board Liaison, J.P. Morgan Funds prior to 2010. Ms. Maleski has been with JPMorgan Chase & Co. since 2001. | |
| Joy C. Dowd (1972), Treasurer and Principal Financial Officer (2010) | Assistant Treasurer of the Trusts from 2009 to 2010; Executive Director, JPMorgan Funds Management, Inc. from February 2011; Vice President, JPMorgan Funds Management, Inc. from December 2008 to February 2011; prior to joining JPMorgan Chase, Ms. Dowd worked in MetLife’s investments audit group from 2005 through 2008. | |
| Frank J. Nasta (1964), Secretary (2008) | Managing Director and Associate General Counsel, JPMorgan Chase since 2008; Previously, Director, Managing Director, General Counsel and Corporate Secretary, J. & W. Seligman & Co. Incorporated; Secretary of each of the investment companies of the Seligman Group of Funds and Seligman Data Corp.; Director and Corporate Secretary, Seligman Advisors, Inc. and Seligman Services, Inc. | |
| Stephen M. Ungerman (1953), Chief Compliance Officer (2005) | Managing Director, JPMorgan Chase & Co.; Mr. Ungerman has been with JPMorgan Chase & Co. since 2000. | |
| Paul L. Gulinello (1950), AML Compliance Officer (2005) | Vice President and Anti Money Laundering Compliance Officer for JPMorgan Asset Management Americas, additionally responsible for privacy, personal trading and Code of Ethics compliance since 2004. Mr. Gulinello has been with JPMorgan Chase & Co. since 1972. | |
Elizabeth A. Davin (1964), Assistant Secretary (2005)* | Vice President and Assistant General Counsel, JPMorgan Chase since 2005; Senior Counsel, JPMorgan Chase (formerly Bank One Corporation) from 2004 to 2005. | |
| Jessica K. Ditullio (1962), Assistant Secretary (2005)* | Executive Director and Assistant General Counsel, JPMorgan Chase since February 2011; Ms. Ditullio has served as an attorney with various titles for JPMorgan Chase (formerly Bank One Corporation) since 1990. | |
| John T. Fitzgerald (1975), Assistant Secretary (2008) | Executive Director and Assistant General Counsel, JPMorgan Chase since February 2011; formerly, Vice President and Assistant General Counsel, JPMorgan Chase from 2005 until February 2011. | |
| Carmine Lekstutis (1980) Assistant Secretary (2011) | Vice President and Assistant General Counsel, JPMorgan Chase since 2011; Associate, Skadden, Arps, Slate, Meagher & Flom LLP (law firm) from 2006 to 2011. | |
| Gregory S. Samuels (1980) Assistant Secretary (2010) | Vice President and Assistant General Counsel, JPMorgan Chase since 2010; Associate, Ropes & Gray (law firm) from 2008 to 2010; Associate, Clifford Chance LLP (law firm) from 2005 to 2008. | |
| Brian L. Duncan (1965), Assistant Treasurer (2008)* | Vice President, JPMorgan Funds Management, Inc. since June 2007; prior to joining JPMorgan Chase, Mr. Duncan worked for Penn Treaty American Corporation as Vice President and Controller from 2004 through 2007. | |
| Jeffrey D. House (1972), Assistant Treasurer (2006)* | Vice President, JPMorgan Funds Management, Inc. since July 2006. | |
| Laura S. Melman (1966), Assistant Treasurer (2006) | Executive Director, JPMorgan Funds Management, Inc. since February 2011, responsible for Taxation; Vice President, JPMorgan Funds Management, Inc. from August 2006 to February 2011, responsible for Taxation. | |
| Joseph Parascondola (1963), Assistant Treasurer (2011) | Vice President, JPMorgan Funds Management, Inc. since August 2006. | |
| Matthew J. Plastina (1970), Assistant Treasurer (2011) | Vice President, JPMorgan Funds Management, Inc. since August 2010; prior to August 2010, Vice President and Controller, Legg Mason Global Asset Management. | |
| Jeffery Reedy (1973), Assistant Treasurer (2011)* | Vice President, JPMorgan Funds Management, Inc. since February 2006. | |
The contact address for each of the officers, unless otherwise noted, is 270 Park Avenue, New York, NY 10017.
| * | The contact address for the officer is 1111 Polaris Parkway, Columbus, OH 43240. |
| 22 | JPMORGAN INSURANCE TRUST | DECEMBER 31, 2011 | ||||
Table of Contents
SCHEDULE OF SHAREHOLDER EXPENSES
(Unaudited)
Hypothetical $1,000 Investment
As a shareholder of the Portfolio, you incur ongoing costs, including investment advisory fees, administration fees and other Portfolio expenses. Because the Portfolio is a funding vehicle for Policies and Eligible Plans, you may also incur sales charges and other fees relating to the Policies or Eligible Plans. The examples below are intended to help you understand your ongoing costs (in dollars) of investing in the Portfolio, but not the costs of the Policies or Eligible Plans, and to compare these ongoing costs with the ongoing costs of investing in other mutual funds. The examples assume that you had a $1,000 investment in the Portfolio at the beginning of the reporting period, July 1, 2011, and continued to hold your shares at the end of the reporting period, December 31, 2011.
Actual Expenses
The first line provides information about actual account values and actual expenses. You may use the information in this line, together with the amount you invested, to estimate the expenses that you paid over the period. Simply divide your account value by $1,000 (for example, an $8,600 account value divided by $1,000 = 8.6), then multiply the result by the number in the first line under the heading entitled “Expenses Paid During” to estimate the expenses you paid on your account during this period.
Hypothetical Example for Comparison Purposes
The second line in the table below provides information about hypothetical account values and hypothetical expenses based on the actual expense ratio and an assumed rate of return of 5% per year before expenses, which is not the Portfolio’s actual return. The hypothetical account values and expenses may not be used to estimate the actual ending account balance or expenses you paid for the period. You may use this information to compare the ongoing costs of investing in the Portfolio and other portfolios. To do so, compare this 5% hypothetical example with the 5% hypothetical examples that appear in the shareholder reports of the other funds. Please note that the expenses shown in the table are meant to highlight your ongoing costs only and do not reflect any transaction costs, such as sales charges (loads) or redemption fees or the costs associated with the Policies and Eligible Plans through which the Portfolio is held. Therefore, the second line in the table is useful in comparing ongoing costs only, and will not help you determine the relative total costs of owning different portfolios. In addition, if these transaction costs were included, your costs would have been higher. The examples also assume all dividends and distributions have been reinvested.
| Beginning Account Value, July 1, 2011 | Ending Account Value, December 31, 2011 | Expenses Paid During July 1, 2011 to December 31, 2011* | Annualized Expense Ratio | |||||||||||||
Class 1 | ||||||||||||||||
Actual | $ | 1,000.00 | $ | 954.10 | $ | 3.89 | 0.79 | % | ||||||||
Hypothetical | 1,000.00 | 1,021.22 | 4.02 | 0.79 | ||||||||||||
| * | Expenses are equal to the Portfolio’s annualized expense ratio, multiplied by the average account value over the period, multiplied by 184/365 (to reflect the one-half year period). |
| DECEMBER 31, 2011 | JPMORGAN INSURANCE TRUST | 23 | ||||||
Table of Contents
BOARD APPROVAL OF INVESTMENT ADVISORY AGREEMENT
(Unaudited)
The Board of Trustees meets regularly throughout the year and considers factors that are relevant to its annual consideration of investment advisory agreements at each meeting. The Board of Trustees has established various standing committees, composed of Trustees with diverse backgrounds, to which the Board of Trustees has assigned specific subject matter responsibilities to further enhance the effectiveness of the Board’s oversight and decision making. The Board of Trustees and its investment subcommittees (money market and alternative products, equity, and fixed income) also meet for the specific purpose of considering advisory contract annual renewals. The Board of Trustees held meetings in person in June and August 2011, at which the Trustees considered the continuation of the investment advisory agreement for the Portfolio whose annual report is contained herein (the “Advisory Agreement”). At the June meeting, the Board’s investment subcommittees met to review and consider performance, expense and related information for the J.P. Morgan Funds. Each investment subcommittee reported to the full Board, which then considered the investment subcommittee’s preliminary findings. At the August meeting, the Trustees continued their review and consideration. The Trustees, including a majority of the Trustees who are not “interested persons” (as defined in the 1940 Act) of any party to the Advisory Agreement or any of their affiliates, approved the continuation of the Advisory Agreement on August 25, 2011.
The Trustees, as part of their review of the investment advisory arrangements for the J.P. Morgan Funds, considered and reviewed performance and other information received from the Advisor, on a regular basis over the course of the year, as well as information specifically prepared for their annual review. This information included the Portfolio’s performance compared to the performance of the Portfolio’s peers and benchmarks and analyses by the Advisor of the Portfolio’s performance. The Advisor also periodically provides comparative information regarding the Portfolio’s expense ratios and those of the peer groups. In addition, in preparation for the June and August meetings, the Trustees requested, received and evaluated extensive materials from the Advisor, including, with respect to certain J.P. Morgan Funds, performance and expense information compiled by Lipper Inc. (“Lipper”), an independent provider of investment company data. Prior to voting, the Trustees reviewed the proposed approval of the Advisory Agreement with representatives of the Advisor and with counsels to the Trust and independent Trustees and received a memorandum from independent counsel to the Trustees discussing the legal standards for their consideration of the proposed approval. The Trustees also discussed the proposed approvals in executive sessions with counsels to the Trust and independent Trustees at which no representatives of the Advisor were present. Set forth below is a summary of the
material factors evaluated by the Trustees in determining whether to approve the Advisory Agreement.
In their deliberations, there was a comprehensive consideration of the information received by the Trustees. Each Trustee attributed different weights to the various factors and no factor alone was considered determinative. From year to year, the Trustees consider and place emphasis on relevant information in light of changing circumstances in market and economic conditions. The Trustees determined that the compensation to be received by the Advisor from the Portfolio under the Advisory Agreement was fair and reasonable and that the continuance of the investment advisory contract was in the best interests of the Portfolio and its shareholders.
The factors summarized below were considered and discussed by the Trustees in reaching their conclusions:
Nature, Extent and Quality of Services Provided by the Advisor
The Trustees received and considered information regarding the nature, extent and quality of the services provided to the Portfolio under the Advisory Agreement. The Trustees took into account information furnished throughout the year at Trustee meetings, as well as the materials furnished specifically in connection with this annual review process. The Trustees considered the background and experience of the Advisor’s senior management and the expertise of, and the amount of attention given to the Portfolio by, investment personnel of the Advisor. In addition, the Trustees reviewed the qualifications, backgrounds and responsibilities of the portfolio management team primarily responsible for the day-to-day management of the Portfolio and the infrastructure supporting the team. The Trustees also considered information provided by the Advisor and JPMorgan Distribution Services, Inc. (“JPMDS”) about the structure and distribution strategy of the Portfolio. The Trustees also reviewed information relating to the Advisor’s risk governance model in light of recent market turbulence and reports showing the Advisor’s compliance structure and ongoing compliance processes. The quality of the administrative services provided by JPMorgan Funds Management, Inc. (“JPMFM”), an affiliate of the Advisor, was also considered.
The Board of Trustees also considered its knowledge of the nature and quality of the services provided by the Advisor to the Portfolio gained from their experience as Trustees of the J.P. Morgan Funds. In addition, they considered the overall reputation and capabilities of the Advisor and its affiliates, the commitment of the Advisor to provide high quality service to the Portfolio, their overall confidence in the Advisor’s integrity and the Advisor’s responsiveness to questions or concerns raised by them, including the Advisor’s willingness to consider and implement organizational and operational changes designed to improve investment results and the services provided to the Portfolio.
Based on these considerations and other factors, the Trustees concluded that they were satisfied with the nature, extent and quality of the investment advisory services provided to the Portfolio by the Advisor.
| 24 | JPMORGAN INSURANCE TRUST | DECEMBER 31, 2011 | ||||
Table of Contents
Costs of Services Provided and Profitability to the Advisor and its Affiliates
The Trustees received and considered information regarding the profitability to the Advisor and its affiliates in providing services to the Portfolio. The Trustees reviewed and discussed this data. The Trustees recognized that this data is not audited and represents the Advisor’s determination of its and its affiliates’ revenues from the contractual services provided to the Portfolio, less expenses of providing such services. Expenses include direct and indirect costs and are calculated using an allocation methodology developed by the Advisor. The Trustees also recognized that it is difficult to make comparisons of profitability from fund investment advisory contracts because comparative information is not generally publicly available and is affected by numerous factors, including the structure of the particular adviser, the types of funds it manages, its business mix, numerous assumptions regarding allocations and the fact that publicly-traded fund managers’ operating profits and net income are net of distribution and marketing expenses. Based on their review, the Trustees concluded that the profitability to the Advisor under the Advisory Agreement was not unreasonable in light of the services and benefits provided to the Portfolio.
Fall-Out Benefits
The Trustees reviewed information regarding potential “fallout” or ancillary benefits received by the Advisor and its affiliates as a result of their relationship with the Portfolio. The Board also considered that the Advisor uses third-party soft dollar arrangements with respect to securities transactions it executes for the Portfolio.
The Trustees also considered that JPMFM earns fees from the Portfolio for providing administrative services. These fees were shown separately in the profitability analysis presented to the Trustees. The Trustees also considered the fees paid to JPMorgan Chase Bank, N.A. (“JPMCB”) for custody and fund accounting and other related services.
Economies of Scale
The Trustees noted that the proposed investment advisory fee schedule for the Portfolio does not contain breakpoints. The Trustees considered whether it would be appropriate to add advisory fee breakpoints and the Trustees concluded that the current fee structure was reasonable in light of the fee waivers and expense limitations that the Advisor has in place that serve to limit the overall net expense ratio at competitive levels. The Trustees also recognized that the fee schedule for the administrative services provided by JPMFM does include a fee breakpoint, which is tied to the overall level of non-money market fund assets excluding certain funds-of-funds, as applicable, advised by the Advisor, and that the Portfolio benefits from that breakpoint. The Trustees concluded that shareholders
benefited from the lower expense ratios which resulted from these factors.
Independent Written Evaluation of the Portfolio’s Chief Compliance Officer
The Trustees noted that, upon their direction, the Chief Compliance Officer for the Portfolio had prepared an independent written evaluation in order to assist the Trustees in determining the reasonableness of the proposed management fees. The Trustees considered the written evaluation in determining whether to continue the Advisory Agreement.
Fees Relative to Advisor’s Other Clients
The Trustees received and considered information about the nature and extent of investment advisory services and fee rates offered to other clients of the Advisor for investment management styles substantially similar to that of the Portfolio. The Trustees also considered the complexity of investment management for the Portfolio relative to the Advisor’s other clients and the differences in the nature and extent of the services provided to the different clients. The Trustees concluded that the fee rates charged to the Portfolio in comparison to those charged to the Advisor’s other clients were reasonable.
Investment Performance
The Trustees received and considered absolute and/or relative performance for the Portfolio in a report prepared by Lipper. The Trustees considered the total return performance information, which included the ranking of the Portfolio within a performance universe made up of funds with the same Lipper investment classification and objective (the “Universe Group”) by total return for applicable one-, three- and five-year periods. The Trustees reviewed a description of Lipper’s methodology for selecting mutual funds in the Portfolio’s Universe Group. As part of this review, the Trustees also reviewed the Portfolio’s performance against its benchmark and considered the performance information provided for the Portfolio at regular Board meetings by the Advisor. The Lipper performance data noted by the Trustees as part of their review and the determinations made by the Trustees with respect to the Portfolio’s performance are summarized below:
The Trustees noted the Portfolio’s performance was in the third quintile for the one-, three-, and five-year periods ended December 31, 2010. The Trustees discussed the performance and investment strategy of the Portfolio with the Advisor and, based upon this discussion and other factors, concluded that the performance was reasonable.
Advisory Fees and Expense Ratios
The Trustees considered the contractual advisory fee rate paid by the Portfolio to the Advisor and compared that rate to the information prepared by Lipper concerning management fee
| DECEMBER 31, 2011 | JPMORGAN INSURANCE TRUST | 25 | ||||||
Table of Contents
BOARD APPROVAL OF INVESTMENT ADVISORY AGREEMENT
(Unaudited) (continued)
rates paid by other funds in the same Lipper category as the Portfolio. The Trustees recognized that Lipper reported the Portfolio’s management fee rate as the combined contractual advisory fee and the administration fee rates. The Trustees considered the fee waiver and/or expense reimbursement arrangements currently in place for the Portfolio and considered the net advisory fee rate after taking into account any waivers and/or reimbursements. The Trustees recognized that it is difficult to make comparisons of advisory fees because there are variations in the services that are included in the fees
paid by other funds. The Trustees’ determinations as a result of the review of the Portfolio’s advisory fees and expense ratios are summarized below:
The Trustees noted that the Portfolio’s net advisory fee and actual total expenses were in the second and first quintiles respectively, of their Universe Group. After considering the factors identified above, in light of this information, the Trustees concluded that the advisory fees were reasonable.
| 26 | JPMORGAN INSURANCE TRUST | DECEMBER 31, 2011 | ||||
Table of Contents
(Unaudited)
Certain tax information for the Portfolio is required to be provided to shareholders based upon the Portfolio’s income and distributions for the taxable year ended December 31, 2011. The information and distributions reported in this letter may differ from the information and taxable distributions reported to the shareholders for the calendar year ending December 31, 2011. The information necessary to complete your income tax returns for the calendar year ending December 31, 2011 will be received under separate cover.
Dividends Received Deductions (DRD)
100.00% of ordinary income distributions were eligible for the 70% dividend received deduction for corporate rate shareholders for the fiscal year ended December 31, 2011.
| DECEMBER 31, 2011 | JPMORGAN INSURANCE TRUST | 27 | ||||||
Table of Contents
J.P. Morgan Funds are distributed by JPMorgan Distribution Services, Inc., which is an affiliate of JPMorgan Chase & Co. Affiliates of JPMorgan Chase & Co. receive fees for providing various services to the funds.
Contact JPMorgan Distribution Services, Inc. at 1-800-480-4111 for a portfolio prospectus. You can also visit us at www.jpmorganfunds.com. Investors should carefully consider the investment objectives and risk as well as charges and expenses of the mutual fund before investing. The prospectus contains this and other information about the mutual fund. Read the prospectus carefully before investing.
The Portfolio files a complete schedule of its portfolio holdings for the first and third quarters of its fiscal year with the SEC on Form N-Q. The Portfolio’s Forms N-Q are available on the SEC’s website at http://www.sec.gov and may be reviewed and copied at the SEC’s Public Reference Room in Washington, DC. Information on the operation of the SEC’s Public Reference Room may be obtained by calling 1-800-SEC-0330. Shareholders may request the Form N-Q without charge by calling 1-800-480-4111 or by visiting the variable insurance portfolio section of the J.P. Morgan Funds’ website at www.jpmorganfunds.com.
A description of the Portfolio’s policies and procedures with respect to the disclosure of the Portfolio’s holdings is available in the prospectus and Statement of Additional Information.
A copy of proxy policies and procedures is available without charge upon request by calling 1-800-480-4111 and a description of such policies and procedures is on the SEC’s website at www.sec.gov. The Trustees have delegated the authority to vote proxies for securities owned by the Portfolio to the Advisor. A copy of the Portfolio’s voting record for the most recent 12-month period ended June 30 is available on the SEC’s website at www.sec.gov or at the Portfolio’s website at www.jpmorganfunds.com no later than August 31 of each year. The Portfolio’s proxy voting record will include, among other things, a brief description of the matter voted on for each portfolio security, and will state how each vote was cast, for example, for or against the proposal.
Table of Contents
| © JPMorgan Chase & Co., 2012. All rights reserved. December 2011. | AN-JPMITMCVP-1211 |
Table of Contents
Annual Report
JPMorgan Insurance Trust
December 31, 2011
JPMorgan Insurance Trust Small Cap Core Portfolio
NOT FDIC INSURED Ÿ NO BANK GUARANTEE Ÿ MAY LOSE VALUE
|  |
Table of Contents
Investments in the Portfolio are not bank deposits or obligations of, or guaranteed or endorsed by, any bank and are not insured or guaranteed by the FDIC, the Federal Reserve Board or any other government agency. You could lose money if you sell when the Portfolio’s share price is lower than when you invested.
Past performance is no guarantee for future performance. The general market views expressed in this report are opinions based on conditions through the end of the reporting period and are subject to change without notice based on market and other conditions. These views are not intended to predict the future performance of the Portfolio or the securities markets. References to specific securities and their issuers are for illustrative purposes only and are not intended to be, and should not be interpreted as, recommendations to purchase or sell such securities. Such views are not meant as investment advice and may not be relied on as an indication of trading intent on behalf of the Portfolio.
This Portfolio is intended to be a funding vehicle for variable annuity contracts and variable life insurance policies (collectively “Policies”) offered by separate accounts of participating insurance companies. Portfolio shares are also offered through qualified pension and retirement plans (“Eligible Plans”). Individuals may not purchase shares directly from the Portfolio.
Prospective investors should refer to the Portfolio’s prospectus for a discussion of the Portfolio’s investment objective, strategies and risks. Call J.P. Morgan Funds Service Center at 1-800-480-4111 for a prospectus containing more complete information about the Portfolio including management fees and other expenses. Please read it carefully before investing.
Table of Contents
JANUARY 25, 2012 (Unaudited)
Dear Shareholder:
Investors greeted 2011 in much the same way they welcomed 2010: with high hopes that an improving U.S. economy would finally get us back on course to recovery.
This optimism quickly faded as the European debt crisis and a host of other economic and geopolitical concerns cast a dark shadow on the prospects for future growth. The combination of weak global economic data, credit downgrades in the U.S. and in Europe, and escalating fears of contagion all resulted in a level of market volatility not seen since the financial crisis three years ago.
 |
“Investors greeted 2011 in much the same way they welcomed 2010: With high hopes that an improving U.S. economy would finally get us back on course to recovery.” |
Nonetheless, stocks have regained some of their footing, as positive fourth-quarter economic data on auto sales, payroll employment and manufacturing activity all appear to indicate that consumer confidence is improving and economic growth may be accelerating.
We remain cautious, however, since many of the same challenges that we experienced in 2011 — European debt concerns, uncertainty over monetary and fiscal stimulus, and soft economic data — will likely remain in place this year, laying the groundwork for continued market volatility.
Strong fourth quarter surge caps volatile year
The European debt crisis and other geopolitical and economic events created a generally volatile year for equities, culminating in major sell off in the third quarter. A strong fourth quarter comeback did little to reverse the losses, as the Standard & Poor’s 500 Index (“S&P 500 Index”) ended the year with only slight gains. As of December 31, 2011, the Index had reached a level of 1,258, an increase of 2.1% from one year prior.
Large cap growth stocks lead style categories
Large cap stocks outpaced mid- and small-cap stocks over the 12-month period ended December 31, 2011 (the Russell 1000 Index returned 1.5% and the Russell Mid Cap Index returned -1.6%, compared to a return of -4.2% for the Russell 2000 Index). Overall, large-cap growth stocks fared better than large-cap value stocks as the Russell 1000 Growth Index returned 2.6% for the 12-month reporting period, compared to 0.4% for the Russell 1000 Value Index.
Euro zone uncertainty drives flight-to-quality sentiment
Investors’ lack of confidence in global economic growth prompted them to seek safe havens in U.S. Treasury securities, and high-quality corporate bonds. The Barclays Capital U.S. Aggregate Bond Index returned 7.8%. High yield bonds and emerging market debt securities also performed well, as the Barclays Capital High Yield Index returned 5.0%, and the Barclays Capital Emerging Markets Index returned 7.0% for the 12-month period ended December 31, 2011.
Similar economic concerns pushed yields of U.S. Treasury securities maturing in 10 years or more to historic lows throughout the year. As of the end of the 12-month period ended December 31, 2011, the yields on the benchmark 10-year U.S. Treasury bond dropped from 3.3% to 1.9%. In addition, yields on the 30-year U.S. Treasury bond declined from 4.3% to 2.9%, as did the two-year U.S. Treasury note, from 0.6% to 0.3%.
Lesson for 2012: Keep balance in mind in economic uncertainty
Last year offered its share of shocks to investors: geopolitical upheaval, natural disasters, sovereign-debt crises, and credit-rating downgrades were all among the events competing for the market’s attention. Against the backdrop of an election year, it’s likely that we will face continued global surprises — both on the upside and the downside.
As you reassess your investment strategy for the year ahead, it’s important to stick with a plan that focuses on diversification as well as long-term allocation. Trying to “time” market fluctuations can be risky business, especially given the ongoing uncertainty surrounding the direction of economic growth and the euro zone crisis in the months ahead.
On behalf of everyone at J.P. Morgan Asset Management, thank you for your continued confidence. We look forward to managing your investment needs for years to come. Should you have any questions, please visit www.jpmorganfunds.com or contact the J.P. Morgan Funds Service Center at 1-800-480-4111.
Sincerely yours,

George C.W. Gatch
CEO-Investment Management Americas
J.P. Morgan Asset Management
| DECEMBER 31, 2011 | JPMORGAN INSURANCE TRUST | 1 | ||||||
Table of Contents
JPMorgan Insurance Trust Small Cap Core Portfolio
TWELVE MONTHS ENDED DECEMBER 31, 2011 (Unaudited)
| REPORTING PERIOD RETURN: | ||||
| Portfolio (Class 1 Shares)* | -4.77% | |||
| Russell 2000 Index | -4.18% | |||
| Net Assets as of 12/31/2011 | $ | 60,170,785 | ||
INVESTMENT OBJECTIVE**
The JPMorgan Insurance Trust Small Cap Core Portfolio (the “Portfolio”) seeks capital growth over the long term.
HOW DID THE MARKET PERFORM?
Strong corporate earnings and robust merger-and-acquisition activity encouraged investors and helped support U.S. stock prices during the beginning of the reporting period. However, uncertainty surrounding global economic growth began to dampen investors’ appetite for risk in April 2011. This negative mood among investors worsened as they seemed to lack confidence in the ability of European governments to combat the region’s debt crisis, stoking fear about economic contagion. Concerns about the credit downgrade of U.S.-issued debt exacerbated this negative sentiment among investors. Each of these factors helped trigger a sharp downturn in stock prices in the third quarter of 2011. Stocks rebounded in the fourth quarter of 2011 as better-than-expected economic data helped investors regain their appetite for risk. The Russell 2000 Index (the “Benchmark”) finished the twelve months ended December 31, 2011 with a 4.18% loss.
WHAT WERE THE MAIN DRIVERS OF THE PORTFOLIO’S PERFORMANCE?
The Portfolio (Class 1 Shares) underperformed the Benchmark for the twelve months ended December 31, 2011. The Portfolio’s stock selection in the health services and systems and semiconductors sectors detracted from relative performance, while the Portfolio’s stock selection in the consumer cyclical and basic materials sectors contributed to relative performance.
Individual detractors from relative performance included the Portfolio’s positions in THQ, Inc., Five Star Quality Care, Inc. and
Gentiva Health Services, Inc. Shares of THQ, Inc., a developer and publisher of video games, declined on investors’ concerns about the quality of its recent games as well as disappointing sell through (the percentage of video games shipped that are actually sold to consumers). Shares of Five Star Quality Care, Inc., an operator of senior living communities, declined due to potential skilled nursing rate cuts and concerns that the company’s secondary offering would dilute the value of the stock. Shares of Gentiva Health Services, Inc., a provider of home health services, declined on investors’ concerns about covenant compliance due to a heavy debt load and potential cuts to home health services as part of federal deficit reduction discussions.
Individual contributors to relative performance included the Portfolio’s positions in Tempur-Pedic International, Inc., Healthspring, Inc. and Oxford Industries, Inc. Shares of Tempur-Pedic International, Inc. increased after the company reported strong quarterly results, boosted by better-than-expected mattress sales after launching a new product line, as well as increasingly positive guidance. Shares of insurance company Healthspring, Inc. increased after the announcement that Cigna Corporation, Inc. would acquire the company. Shares of apparel retailer Oxford Industries, Inc. benefited from consistently strong earnings during the reporting period.
HOW WAS THE PORTFOLIO POSITIONED?
The portfolio managers took limited sector bets and constructed the Portfolio so that stock selection would be the primary driver of its relative performance versus the Benchmark. The portfolio managers employed a bottom-up approach to stock selection, using quantitative screening and proprietary fundamental analysis to construct a portfolio of what they believed were attractively priced stocks with strong fundamentals.
| 2 | JPMORGAN INSURANCE TRUST | DECEMBER 31, 2011 | ||||
Table of Contents
| TOP TEN EQUITY HOLDINGS OF THE PORTFOLIO*** | ||||||||
| 1. | Triumph Group, Inc. | 1.2 | % | |||||
| 2. | Alaska Air Group, Inc. | 1.1 | ||||||
| 3. | World Acceptance Corp. | 1.1 | ||||||
| 4. | Portland General Electric Co. | 1.1 | ||||||
| 5. | Omega Healthcare Investors, Inc. | 1.0 | ||||||
| 6. | AmSurg Corp. | 1.0 | ||||||
| 7. | JDA Software Group, Inc. | 1.0 | ||||||
| 8. | Deluxe Corp. | 1.0 | ||||||
| 9. | Wabtec Corp. | 1.0 | ||||||
| 10. | Kulicke & Soffa Industries, Inc. | 0.9 | ||||||
PORTFOLIO COMPOSITION BY SECTOR*** | ||||
| Financials | 21.7 | % | ||
| Industrials | 14.9 | |||
| Information Technology | 14.8 | |||
| Consumer Discretionary | 13.1 | |||
| Health Care | 12.4 | |||
| Energy | 6.6 | |||
| Materials | 5.1 | |||
| Utilities | 3.8 | |||
| Consumer Staples | 3.2 | |||
| Telecommunication Services | 1.4 | |||
| U.S. Treasury Obligations | 0.4 | |||
| Short-Term Investment | 2.6 | |||
| * | The return shown is based on net asset value calculated for shareholder transactions and may differ from the return shown in the financial highlights, which reflects adjustments made to the net asset value in accordance with accounting principles generally accepted in the United States of America. |
| ** | The advisor seeks to achieve the Portfolio’s objective. There can be no guarantee it will be achieved. |
| *** | Percentages indicated are based upon total investments as of December 31, 2011. The Portfolio’s composition is subject to change. |
| DECEMBER 31, 2011 | JPMORGAN INSURANCE TRUST | 3 | ||||||
Table of Contents
JPMorgan Insurance Trust Small Cap Core Portfolio
PORTFOLIO COMMENTARY
TWELVE MONTHS ENDED DECEMBER 31, 2011 (Unaudited) (continued)
AVERAGE ANNUAL TOTAL RETURNS AS OF DECEMBER 31, 2011 | ||||||||||||||||
| INCEPTION DATE OF CLASS | 1 YEAR | 5 YEAR | 10 YEAR | |||||||||||||
CLASS 1 SHARES | 1/3/95 | (4.77 | )% | (0.98 | )% | 4.37 | % | |||||||||
CLASS 2 SHARES | 4/24/09 | (5.03 | ) | (1.11 | ) | 4.30 | ||||||||||
TEN YEAR PERFORMANCE (12/31/01 TO 12/31/11)
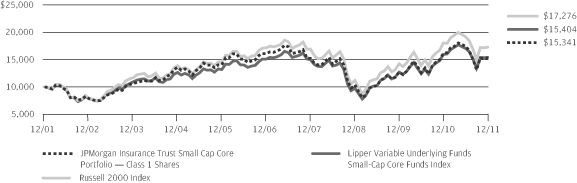
Source: Lipper Inc. The performance quoted is past performance and is not a guarantee of future results. Mutual funds are subject to certain market risks. Investment returns and principal value of an investment will fluctuate so that an investor’s shares, when redeemed, may be worth more or less than their original cost. Current performance may be higher or lower than the performance data shown. For up-to-date month-end performance information please call 1-800-480-4111.
Inception date for Class 1 Shares is January 3, 1995, which is the inception date of JPMorgan Small Company Portfolio (“Predecessor Portfolio”). The JPMorgan Insurance Trust Small Cap Core Portfolio acquired all of the assets and liabilities of the Predecessor Portfolio in a reorganization on April 24, 2009. The Predecessor Portfolio’s performance and financial history have been adopted by the Small Cap Core Portfolio and have been used since the reorganization. As a result the performance for Class 1 Shares prior to April 25, 2009, is the performance of the Predecessor Portfolio.
Returns for Class 2 Shares prior to April 25, 2009 are based on the performance of Class 1 Shares. The actual returns of Class 2 Shares would have been lower than shown because Class 2 Shares have higher expenses than Class 1 Shares and the Predecessor Portfolio.
The graph illustrates comparative performance for $10,000 invested in Class 1 Shares of the JPMorgan Insurance Trust Small Cap Core Portfolio, the Russell 2000 Index and the Lipper Variable Underlying Funds Small-Cap Core Funds
Index from December 31, 2001 to December 31, 2011. The performance of the Portfolio assumes reinvestment of all dividends and capital gains, if any. The performance of the Russell 2000 Index does not reflect the deduction of expenses associated with a mutual fund and has been adjusted to reflect reinvestment of all dividends and capital gains of the securities included in the benchmark. The performance of the Lipper Variable Underlying Funds Small-Cap Core Funds Index includes expenses associated with a mutual fund, such as investment management fees. These expenses are not identical to the expenses charged by the Portfolio. The Russell 2000 Index is an unmanaged index which measures the performance of the 2000 smallest stocks (on the basis of capitalization) in the Russell 3000 Index. The Lipper Variable Underlying Funds Small-Cap Core Funds Index is an index based on the total returns of certain mutual funds within the Portfolio’s designated category as determined by Lipper, Inc. Investors cannot invest directly in an index.
The performance does not reflect any charges imposed by the Policies or Eligible Plans. If these charges were included, the returns would be lower than shown. Performance may reflect the waiver of the Portfolio’s fees and reimbursement of expenses for certain periods since the inception date. Without these waivers and reimbursements performance would have been lower.
The returns shown are based on net asset values calculated for shareholder transactions and may differ from the returns shown in the financial highlights, which reflect adjustments made to the net asset values in accordance with accounting principles generally accepted in the United States of America.
| 4 | JPMORGAN INSURANCE TRUST | DECEMBER 31, 2011 | ||||
Table of Contents
JPMorgan Insurance Trust Small Cap Core Portfolio
SCHEDULE OF PORTFOLIO INVESTMENTS
AS OF DECEMBER 31, 2011
| SHARES | SECURITY DESCRIPTION | VALUE($) | ||||||
| Common Stocks — 97.4% |
| ||||||
Consumer Discretionary — 13.2% |
| |||||||
Auto Components — 0.5% |
| |||||||
| 1,600 | American Axle & Manufacturing Holdings, Inc. (a) | 15,824 | ||||||
| 2,800 | Cooper Tire & Rubber Co. | 39,228 | ||||||
| 11,236 | Standard Motor Products, Inc. | 225,282 | ||||||
|
| |||||||
| 280,334 | ||||||||
|
| |||||||
Distributors — 0.0% (g) | ||||||||
| 1,446 | VOXX International Corp. (a) | 12,219 | ||||||
|
| |||||||
Diversified Consumer Services — 0.6% | ||||||||
| 13,800 | Bridgepoint Education, Inc. (a) | 317,400 | ||||||
| 700 | Capella Education Co. (a) | 25,235 | ||||||
| 1,000 | Lincoln Educational Services Corp. | 7,900 | ||||||
| 1,700 | Mac-Gray Corp. | 23,443 | ||||||
|
| |||||||
| 373,978 | ||||||||
|
| |||||||
Hotels, Restaurants & Leisure — 2.4% | ||||||||
| 14,800 | Ameristar Casinos, Inc. | 255,892 | ||||||
| 600 | Biglari Holdings, Inc. (a) | 220,944 | ||||||
| 1,900 | Cracker Barrel Old Country Store, Inc. | 95,779 | ||||||
| 4,400 | DineEquity, Inc. (a) | 185,724 | ||||||
| 15,300 | Domino’s Pizza, Inc. (a) | 519,435 | ||||||
| 472 | Dunkin’ Brands Group, Inc. (a) | 11,791 | ||||||
| 10,100 | Ruby Tuesday, Inc. (a) | 69,690 | ||||||
| 19,168 | Ruth’s Hospitality Group, Inc. (a) | 95,265 | ||||||
|
| |||||||
| 1,454,520 | ||||||||
|
| |||||||
Household Durables — 2.2% | ||||||||
| 11,700 | American Greetings Corp., Class A | 146,367 | ||||||
| 42 | CSS Industries, Inc. | 837 | ||||||
| 17,400 | Helen of Troy Ltd., (Bermuda) (a) | 534,180 | ||||||
| 2,393 | Jarden Corp. | 71,503 | ||||||
| 2,600 | Libbey, Inc. (a) | 33,124 | ||||||
| 5,800 | Lifetime Brands, Inc. | 70,412 | ||||||
| 900 | Skullcandy, Inc. (a) | 11,268 | ||||||
| 7,950 | Tempur-Pedic International, Inc. (a) | 417,613 | ||||||
|
| |||||||
| 1,285,304 | ||||||||
|
| |||||||
Leisure Equipment & Products — 0.3% | ||||||||
| 9,750 | JAKKS Pacific, Inc. | 137,572 | ||||||
| 1,800 | Sturm Ruger & Co., Inc. | 60,228 | ||||||
|
| |||||||
| 197,800 | ||||||||
|
| |||||||
Media — 1.0% | ||||||||
| 14,000 | Entercom Communications Corp., Class A (a) | 86,100 | ||||||
| 15,700 | Journal Communications, Inc., Class A (a) | 69,080 | ||||||
| 2,100 | Knology, Inc. (a) | 29,820 | ||||||
| 3,700 | LIN TV Corp., Class A (a) | 15,651 | ||||||
| 3,100 | Pandora Media, Inc. (a) | 31,031 | ||||||
| SHARES | SECURITY DESCRIPTION | VALUE($) | ||||||
Media — Continued | ||||||||
| 32,100 | Sinclair Broadcast Group, Inc., Class A | 363,693 | ||||||
|
| |||||||
| 595,375 | ||||||||
|
| |||||||
Multiline Retail — 0.6% | ||||||||
| 7,800 | Dillard’s, Inc., Class A | 350,064 | ||||||
|
| |||||||
Specialty Retail — 3.5% | ||||||||
| 18,300 | Cabela’s, Inc. (a) | 465,186 | ||||||
| 16,700 | Casual Male Retail Group, Inc. (a) | 57,114 | ||||||
| 1,567 | Collective Brands, Inc. (a) | 22,518 | ||||||
| 28,000 | Conn’s, Inc. (a) | 310,800 | ||||||
| 17,100 | Express, Inc. (a) | 340,974 | ||||||
| 9,025 | Finish Line, Inc. (The), Class A | 174,047 | ||||||
| 1,200 | Kirkland’s, Inc. (a) | 15,960 | ||||||
| 12,600 | Rent-A-Center, Inc. | 466,200 | ||||||
| 5,800 | Select Comfort Corp. (a) | 125,802 | ||||||
| 6,600 | Teavana Holdings, Inc. (a) | 123,948 | ||||||
|
| |||||||
| 2,102,549 | ||||||||
|
| |||||||
Textiles, Apparel & Luxury Goods — 2.1% | ||||||||
| 2,000 | Deckers Outdoor Corp. (a) | 151,140 | ||||||
| 2,900 | G-III Apparel Group Ltd. (a) | 72,239 | ||||||
| 10,200 | Iconix Brand Group, Inc. (a) | 166,158 | ||||||
| 18,200 | Maidenform Brands, Inc. (a) | 333,060 | ||||||
| 6,000 | Oxford Industries, Inc. | 270,720 | ||||||
| 10,100 | Perry Ellis International, Inc. (a) | 143,622 | ||||||
| 3,975 | Steven Madden Ltd. (a) | 137,137 | ||||||
|
| |||||||
| 1,274,076 | ||||||||
|
| |||||||
Total Consumer Discretionary | 7,926,219 | |||||||
|
| |||||||
Consumer Staples — 3.2% | ||||||||
Beverages — 0.1% | ||||||||
| 1,300 | Coca-Cola Bottling Co. Consolidated | 76,115 | ||||||
|
| |||||||
Food & Staples Retailing — 1.4% | ||||||||
| 6,300 | Andersons, Inc. (The) | 275,058 | ||||||
| 26,500 | Spartan Stores, Inc. | 490,250 | ||||||
| 1,900 | Village Super Market, Inc., Class A | 54,055 | ||||||
|
| |||||||
| 819,363 | ||||||||
|
| |||||||
Food Products — 1.2% | ||||||||
| 7,400 | B&G Foods, Inc. | 178,118 | ||||||
| 5,820 | Chiquita Brands International, Inc. (a) | 48,539 | ||||||
| 6,300 | Darling International, Inc. (a) | 83,727 | ||||||
| 6,700 | Diamond Foods, Inc. | 216,209 | ||||||
| 3,760 | Dole Food Co., Inc. (a) | 32,524 | ||||||
| 3,400 | Fresh Del Monte Produce, Inc. | 85,034 | ||||||
| 1,100 | TreeHouse Foods, Inc. (a) | 71,918 | ||||||
|
| |||||||
| 716,069 | ||||||||
|
| |||||||
SEE NOTES TO FINANCIAL STATEMENTS.
| DECEMBER 31, 2011 | JPMORGAN INSURANCE TRUST | 5 | ||||||
Table of Contents
JPMorgan Insurance Trust Small Cap Core Portfolio
SCHEDULE OF PORTFOLIO INVESTMENTS
AS OF DECEMBER 31, 2011 (continued)
| SHARES | SECURITY DESCRIPTION | VALUE($) | ||||||
| Common Stocks — Continued |
| ||||||
Personal Products — 0.5% | ||||||||
| 2,700 | Elizabeth Arden, Inc. (a) | 100,008 | ||||||
| 1,500 | Nature’s Sunshine Products, Inc. (a) | 23,280 | ||||||
| 10,625 | Prestige Brands Holdings, Inc. (a) | 119,744 | ||||||
| 5,100 | Revlon, Inc., Class A (a) | 75,837 | ||||||
|
| |||||||
| 318,869 | ||||||||
|
| |||||||
Total Consumer Staples | 1,930,416 | |||||||
|
| |||||||
Energy — 6.6% | ||||||||
Energy Equipment & Services — 2.2% | ||||||||
| 3,500 | C&J Energy Services, Inc. (a) | 73,255 | ||||||
| 1,100 | Cal Dive International, Inc. (a) | 2,475 | ||||||
| 12,700 | Complete Production Services, Inc. (a) | 426,212 | ||||||
| 9,000 | Gulfmark Offshore, Inc., Class A (a) | 378,090 | ||||||
| 3,200 | Lufkin Industries, Inc. | 215,392 | ||||||
| 1,900 | Matrix Service Co. (a) | 17,936 | ||||||
| 8,400 | Newpark Resources, Inc. (a) | 79,800 | ||||||
| 700 | OYO Geospace Corp. (a) | 54,131 | ||||||
| 5,100 | RPC, Inc. | 93,075 | ||||||
|
| |||||||
| 1,340,366 | ||||||||
|
| |||||||
Oil, Gas & Consumable Fuels — 4.4% | ||||||||
| 2,200 | Alon USA Energy, Inc. | 19,162 | ||||||
| 575 | Apco Oil and Gas International, Inc. | 46,989 | ||||||
| 2,500 | Bank of Nova Scotia (a) | 31,250 | ||||||
| 16,100 | Callon Petroleum Co. (a) | 80,017 | ||||||
| 4,415 | Clayton Williams Energy, Inc. (a) | 335,010 | ||||||
| 3,400 | Cloud Peak Energy, Inc. (a) | 65,688 | ||||||
| 3,200 | Delek U.S. Holdings, Inc. | 36,512 | ||||||
| 11,600 | EXCO Resources, Inc. | 121,220 | ||||||
| 2,500 | Georesources, Inc. (a) | 73,275 | ||||||
| 16,800 | Gulfport Energy Corp. (a) | 494,760 | ||||||
| 196 | KiOR, Inc., Class A (a) | 1,996 | ||||||
| 11,375 | McMoRan Exploration Co. (a) | 165,506 | ||||||
| 18,825 | VAALCO Energy, Inc. (a) | 113,703 | ||||||
| 18,200 | W&T Offshore, Inc. | 386,022 | ||||||
| 11,900 | Warren Resources, Inc. (a) | 38,794 | ||||||
| 16,400 | Western Refining, Inc. (a) | 217,956 | ||||||
| 9,900 | World Fuel Services Corp. | 415,602 | ||||||
|
| |||||||
| 2,643,462 | ||||||||
|
| |||||||
Total Energy | 3,983,828 | |||||||
|
| |||||||
Financials — 21.8% | ||||||||
Capital Markets — 0.6% | ||||||||
| 16,100 | BGC Partners, Inc., Class A | 95,634 | ||||||
| 3,200 | Gladstone Capital Corp. | 24,416 | ||||||
| 10,900 | Knight Capital Group, Inc., Class A (a) | 128,838 | ||||||
| 3,500 | Manning & Napier, Inc. (a) | 43,715 | ||||||
| SHARES | SECURITY DESCRIPTION | VALUE($) | ||||||
Capital Markets — Continued | ||||||||
| 1,312 | Prospect Capital Corp. | 12,189 | ||||||
| 6,807 | SWS Group, Inc. | 46,764 | ||||||
|
| |||||||
| 351,556 | ||||||||
|
| |||||||
Commercial Banks — 5.6% | ||||||||
| 300 | Alliance Financial Corp. | 9,264 | ||||||
| 3,300 | Banco Latinoamericano de Comercio Exterior S.A., (Panama), Class E | 52,965 | ||||||
| 12,500 | Bank of Nova Scotia (a) | 118,125 | ||||||
| 1,300 | Bridge Bancorp, Inc. | 25,870 | ||||||
| 7,300 | Cathay General Bancorp | 108,989 | ||||||
| 4,200 | Citizens & Northern Corp. | 77,574 | ||||||
| 3,525 | City Holding Co. | 119,462 | ||||||
| 4,900 | Community Bank System, Inc. | 136,220 | ||||||
| 1,440 | Community Trust Bancorp, Inc. | 42,365 | ||||||
| 3,500 | East West Bancorp, Inc. | 69,125 | ||||||
| 2,000 | Enterprise Financial Services Corp. | 29,600 | ||||||
| 4,500 | Financial Institutions, Inc. | 72,630 | ||||||
| 1,700 | First Bancorp | 18,955 | ||||||
| 12,000 | First Busey Corp. | 60,000 | ||||||
| 54,300 | First Commonwealth Financial Corp. | 285,618 | ||||||
| 5,400 | First Community Bancshares, Inc. | 67,392 | ||||||
| 12,000 | First Financial Bancorp | 199,680 | ||||||
| 4,200 | First Merchants Corp. | 35,574 | ||||||
| 4,557 | First Niagara Financial Group, Inc. | 39,327 | ||||||
| 13,700 | FNB Corp. | 154,947 | ||||||
| 2,725 | Hanmi Financial Corp. (a) | 20,165 | ||||||
| 700 | Heartland Financial USA, Inc. | 10,738 | ||||||
| 4,300 | Huntington Bancshares, Inc. | 23,607 | ||||||
| 2,475 | Iberiabank Corp. | 122,017 | ||||||
| 3,510 | International Bancshares Corp. | 64,356 | ||||||
| 2,325 | Lakeland Bancorp, Inc. | 20,041 | ||||||
| 1,900 | Lakeland Financial Corp. | 49,153 | ||||||
| 3,900 | MainSource Financial Group, Inc. | 34,437 | ||||||
| 1,300 | National Bankshares, Inc. | 36,296 | ||||||
| 1,900 | NBT Bancorp, Inc. | 42,047 | ||||||
| 14,800 | Oriental Financial Group, Inc. | 179,228 | ||||||
| 5,200 | PacWest Bancorp | 98,540 | ||||||
| 800 | Peoples Bancorp, Inc. | 11,848 | ||||||
| 9,100 | Pinnacle Financial Partners, Inc. (a) | 146,965 | ||||||
| 2,200 | Prosperity Bancshares, Inc. | 88,770 | ||||||
| 600 | Renasant Corp. | 9,000 | ||||||
| 1,563 | Republic Bancorp, Inc., Class A | 35,793 | ||||||
| 5,250 | Sierra Bancorp | 46,200 | ||||||
| 2,206 | Southside Bancshares, Inc. | 47,782 | ||||||
| 14,835 | Southwest Bancorp, Inc. (a) | 88,417 | ||||||
SEE NOTES TO FINANCIAL STATEMENTS.
| 6 | JPMORGAN INSURANCE TRUST | DECEMBER 31, 2011 | ||||
Table of Contents
| SHARES | SECURITY DESCRIPTION | VALUE($) | ||||||
| Common Stocks — Continued |
| ||||||
Commercial Banks — Continued | ||||||||
| 12,800 | Susquehanna Bancshares, Inc. | 107,264 | ||||||
| 2,100 | SVB Financial Group (a) | 100,149 | ||||||
| 2,500 | WesBanco, Inc. | 48,675 | ||||||
| 4,100 | West Bancorp, Inc. | 39,278 | ||||||
| 1,600 | Westamerica Bancorp | 70,240 | ||||||
| 25,600 | Wilshire Bancorp, Inc. (a) | 92,928 | ||||||
|
| |||||||
| 3,357,616 | ||||||||
|
| |||||||
Consumer Finance — 2.8% |
| |||||||
| 3,575 | Advance America Cash Advance Centers, Inc. | 31,996 | ||||||
| 10,800 | Cash America International, Inc. | 503,604 | ||||||
| 17,646 | DFC Global Corp. (a) | 318,687 | ||||||
| 7,000 | Nelnet, Inc., Class A | 171,290 | ||||||
| 8,825 | World Acceptance Corp. (a) | 648,637 | ||||||
|
| |||||||
| 1,674,214 | ||||||||
|
| |||||||
Diversified Financial Services — 0.3% |
| |||||||
| 16,100 | PHH Corp. (a) | 172,270 | ||||||
|
| |||||||
Insurance — 2.9% |
| |||||||
| 39,500 | American Equity Investment Life Holding Co. | 410,800 | ||||||
| 4,200 | American Safety Insurance Holdings Ltd. (a) | 91,350 | ||||||
| 6,925 | Aspen Insurance Holdings Ltd., (Bermuda) | 183,512 | ||||||
| 50,600 | CNO Financial Group, Inc. (a) | 319,286 | ||||||
| 7,250 | Delphi Financial Group, Inc., Class A | 321,175 | ||||||
| 5,900 | Flagstone Reinsurance Holdings S.A., (Luxembourg) | 48,911 | ||||||
| 1,600 | Horace Mann Educators Corp. | 21,936 | ||||||
| 10,475 | Meadowbrook Insurance Group, Inc. | 111,873 | ||||||
| 13,000 | National Financial Partners Corp. (a) | 175,760 | ||||||
| 5,000 | Selective Insurance Group, Inc. | 88,650 | ||||||
|
| |||||||
| 1,773,253 | ||||||||
|
| |||||||
Real Estate Investment Trusts (REITs) — 8.5% |
| |||||||
| 4,500 | Agree Realty Corp. | 109,710 | ||||||
| 4,183 | American Campus Communities, Inc. | 175,519 | ||||||
| 66,200 | Anworth Mortgage Asset Corp. | 415,736 | ||||||
| 33,000 | Ashford Hospitality Trust, Inc. | 264,000 | ||||||
| 9,400 | Associated Estates Realty Corp. | 149,930 | ||||||
| 5,700 | BioMed Realty Trust, Inc. | 103,056 | ||||||
| 4,500 | CapLease, Inc. | 18,180 | ||||||
| 32,500 | Capstead Mortgage Corp. | 404,300 | ||||||
| 13,700 | CBL & Associates Properties, Inc. | 215,090 | ||||||
| 3,164 | Colonial Properties Trust | 66,001 | ||||||
| 7,000 | Coresite Realty Corp. | 124,740 | ||||||
| 27,375 | DCT Industrial Trust, Inc. | 140,160 | ||||||
| 8,900 | DDR Corp. | 108,313 | ||||||
| 3,000 | EastGroup Properties, Inc. | 130,440 | ||||||
| SHARES | SECURITY DESCRIPTION | VALUE($) | ||||||
Real Estate Investment Trusts (REITs) — Continued |
| |||||||
| 5,300 | Education Realty Trust, Inc. | 54,219 | ||||||
| 900 | Equity Lifestyle Properties, Inc. | 60,021 | ||||||
| 23,700 | First Industrial Realty Trust, Inc. (a) | 242,451 | ||||||
| 8,100 | Glimcher Realty Trust | 74,520 | ||||||
| 1,450 | Home Properties, Inc. | 83,477 | ||||||
| 5,800 | LaSalle Hotel Properties | 140,418 | ||||||
| 48,709 | Lexington Realty Trust | 364,830 | ||||||
| 3,700 | LTC Properties, Inc. | 114,182 | ||||||
| 36,425 | MFA Financial, Inc. | 244,776 | ||||||
| 1,400 | Mission West Properties, Inc. | 12,628 | ||||||
| 32,600 | Omega Healthcare Investors, Inc. | 630,810 | ||||||
| 3,000 | Parkway Properties, Inc. | 29,580 | ||||||
| 14,625 | Pennsylvania Real Estate Investment Trust | 152,685 | ||||||
| 2,275 | PS Business Parks, Inc. | 126,103 | ||||||
| 2,700 | Ramco-Gershenson Properties Trust | 26,541 | ||||||
| 12,900 | Senior Housing Properties Trust | 289,476 | ||||||
| 1,400 | Sun Communities, Inc. | 51,142 | ||||||
|
| |||||||
| 5,123,034 | ||||||||
|
| |||||||
Thrifts & Mortgage Finance — 1.1% |
| |||||||
| 3,000 | Dime Community Bancshares, Inc. | 37,800 | ||||||
| 2,700 | OceanFirst Financial Corp. | 35,289 | ||||||
| 38,275 | Ocwen Financial Corp. (a) | 554,222 | ||||||
| 6,200 | Trustco Bank Corp. | 34,782 | ||||||
|
| |||||||
| 662,093 | ||||||||
|
| |||||||
Total Financials | 13,114,036 | |||||||
|
| |||||||
Health Care — 12.4% |
| |||||||
Biotechnology — 4.5% |
| |||||||
| 17,000 | Achillion Pharmaceuticals, Inc. (a) (m) | 129,540 | ||||||
| 8,900 | Acorda Therapeutics, Inc. (a) (m) | 212,176 | ||||||
| 12,500 | Aegerion Pharmaceuticals, Inc. (a) | 209,250 | ||||||
| 27,100 | Ariad Pharmaceuticals, Inc. (a) | 331,975 | ||||||
| 9,200 | BioCryst Pharmaceuticals, Inc. (a) | 22,724 | ||||||
| 8,200 | Chelsea Therapeutics International Ltd. (a) | 42,066 | ||||||
| 60,500 | Dynavax Technologies Corp. (a) | 200,860 | ||||||
| 12,700 | Genomic Health, Inc. (a) | 322,453 | ||||||
| 17,800 | Halozyme Therapeutics, Inc. (a) | 169,278 | ||||||
| 9,000 | Immunomedics, Inc. (a) | 29,970 | ||||||
| 21,800 | Inhibitex, Inc. (a) | 238,492 | ||||||
| 12,700 | InterMune, Inc. (a) | 160,020 | ||||||
| 4,800 | Ironwood Pharmaceuticals, Inc. (a) | 57,456 | ||||||
| 11,400 | Momenta Pharmaceuticals, Inc. (a) | 198,246 | ||||||
| 3,300 | Onyx Pharmaceuticals, Inc. (a) | 145,035 | ||||||
| 36,100 | Raptor Pharmaceutical Corp. (a) | 225,986 | ||||||
|
| |||||||
| 2,695,527 | ||||||||
|
| |||||||
SEE NOTES TO FINANCIAL STATEMENTS.
| DECEMBER 31, 2011 | JPMORGAN INSURANCE TRUST | 7 | ||||||
Table of Contents
JPMorgan Insurance Trust Small Cap Core Portfolio
SCHEDULE OF PORTFOLIO INVESTMENTS
AS OF DECEMBER 31, 2011 (continued)
| SHARES | SECURITY DESCRIPTION | VALUE($) | ||||||
| Common Stocks — Continued |
| ||||||
Health Care Equipment & Supplies — 2.8% |
| |||||||
| 13,100 | Cantel Medical Corp. | 365,883 | ||||||
| 4,500 | DynaVox, Inc., Class A (a) | 16,380 | ||||||
| 18,700 | Greatbatch, Inc. (a) | 413,270 | ||||||
| 5,100 | Integra LifeSciences Holdings Corp. (a) | 157,233 | ||||||
| 10,600 | Invacare Corp. | 162,074 | ||||||
| 6,700 | Orthofix International N.V., (Netherlands) (a) | 236,041 | ||||||
| 40,200 | RTI Biologics, Inc. (a) | 178,488 | ||||||
| 3,600 | Sirona Dental Systems, Inc. (a) | 158,544 | ||||||
|
| |||||||
| 1,687,913 | ||||||||
|
| |||||||
Health Care Providers & Services — 3.4% |
| |||||||
| 3,100 | Almost Family, Inc. (a) | 51,398 | ||||||
| 23,213 | AmSurg Corp. (a) | 604,466 | ||||||
| 7,300 | Hanger Orthopedic Group, Inc. (a) | 136,437 | ||||||
| 25,600 | Metropolitan Health Networks, Inc. (a) | 191,232 | ||||||
| 6,000 | Molina Healthcare, Inc. (a) | 133,980 | ||||||
| 5,800 | Owens & Minor, Inc. | 161,182 | ||||||
| 20,900 | PharMerica Corp. (a) | 317,262 | ||||||
| 3,300 | Triple-S Management Corp., Class B (a) | 66,066 | ||||||
| 1,500 | US Physical Therapy, Inc. | 29,520 | ||||||
| 3,000 | Vanguard Health Systems, Inc. (a) | 30,660 | ||||||
| 6,300 | WellCare Health Plans, Inc. (a) | 330,750 | ||||||
|
| |||||||
| 2,052,953 | ||||||||
|
| |||||||
Health Care Technology — 0.3% |
| |||||||
| 18,159 | MedAssets, Inc. (a) | 167,971 | ||||||
|
| |||||||
Life Sciences Tools & Services — 0.1% |
| |||||||
| 7,900 | Cambrex Corp. (a) | 56,722 | ||||||
| 5,525 | Enzo Biochem, Inc. (a) | 12,376 | ||||||
|
| |||||||
| 69,098 | ||||||||
|
| |||||||
Pharmaceuticals — 1.3% |
| |||||||
| 10,900 | Impax Laboratories, Inc. (a) | 219,853 | ||||||
| 3,200 | Medicis Pharmaceutical Corp., Class A | 106,400 | ||||||
| 4,300 | Par Pharmaceutical Cos., Inc. (a) | 140,739 | ||||||
| 2,300 | Salix Pharmaceuticals Ltd. (a) | 110,055 | ||||||
| 2,800 | ViroPharma, Inc. (a) | 76,692 | ||||||
| 15,400 | Vivus, Inc. (a) | 150,150 | ||||||
|
| |||||||
| 803,889 | ||||||||
|
| |||||||
Total Health Care | 7,477,351 | |||||||
|
| |||||||
Industrials — 15.0% |
| |||||||
Aerospace & Defense — 2.6% |
| |||||||
| 2,050 | Ceradyne, Inc. (a) | 54,899 | ||||||
| 1,200 | Curtiss-Wright Corp. | 42,396 | ||||||
| 5,200 | Esterline Technologies Corp. (a) | 291,044 | ||||||
| 40,200 | GenCorp, Inc. (a) | 213,864 | ||||||
| SHARES | SECURITY DESCRIPTION | VALUE($) | ||||||
Aerospace & Defense — Continued |
| |||||||
| 1,868 | HEICO Corp. | 109,240 | ||||||
| 7,200 | LMI Aerospace, Inc. (a) | 126,360 | ||||||
| 12,100 | Triumph Group, Inc. | 707,245 | ||||||
|
| |||||||
| 1,545,048 | ||||||||
|
| |||||||
Air Freight & Logistics — 0.5% |
| |||||||
| 7,700 | Atlas Air Worldwide Holdings, Inc. (a) | 295,911 | ||||||
|
| |||||||
Airlines — 1.2% |
| |||||||
| 8,800 | Alaska Air Group, Inc. (a) | 660,792 | ||||||
| 15,250 | Hawaiian Holdings, Inc. (a) | 88,450 | ||||||
|
| |||||||
| 749,242 | ||||||||
|
| |||||||
Building Products — 0.0% (g) |
| |||||||
| 1,075 | Gibraltar Industries, Inc. (a) | 15,007 | ||||||
|
| |||||||
Commercial Services & Supplies — 3.0% |
| |||||||
| 45,700 | Cenveo, Inc. (a) | 155,380 | ||||||
| 26,050 | Deluxe Corp. | 592,898 | ||||||
| 18,600 | Encore Capital Group, Inc. (a) | 395,436 | ||||||
| 2,400 | Herman Miller, Inc. | 44,280 | ||||||
| 11,000 | Knoll, Inc. | 163,350 | ||||||
| 2,400 | Portfolio Recovery Associates, Inc. (a) | 162,048 | ||||||
| 2,200 | Team, Inc. (a) | 65,450 | ||||||
| 1,200 | UniFirst Corp. | 68,088 | ||||||
| 3,800 | United Stationers, Inc. | 123,728 | ||||||
| 150 | Waste Connections, Inc. | 4,971 | ||||||
|
| |||||||
| 1,775,629 | ||||||||
|
| |||||||
Construction & Engineering — 1.0% |
| |||||||
| 10,275 | EMCOR Group, Inc. | 275,473 | ||||||
| 13,100 | MasTec, Inc. (a) | 227,547 | ||||||
| 2,400 | Michael Baker Corp. (a) | 47,064 | ||||||
| 3,200 | Tutor Perini Corp. (a) | 39,488 | ||||||
|
| |||||||
| 589,572 | ||||||||
|
| |||||||
Electrical Equipment — 1.5% |
| |||||||
| 5,800 | Acuity Brands, Inc. | 307,400 | ||||||
| 6,700 | EnerSys (a) | 173,999 | ||||||
| 8,200 | Regal-Beloit Corp. | 417,954 | ||||||
|
| |||||||
| 899,353 | ||||||||
|
| |||||||
Industrial Conglomerates — 0.1% |
| |||||||
| 900 | Standex International Corp. | 30,753 | ||||||
|
| |||||||
Machinery — 3.1% |
| |||||||
| 3,900 | Actuant Corp., Class A | 88,491 | ||||||
| 5,400 | Barnes Group, Inc. | 130,194 | ||||||
| 4,600 | CIRCOR International, Inc. | 162,426 | ||||||
| 2,500 | Columbus McKinnon Corp. (a) | 31,725 | ||||||
SEE NOTES TO FINANCIAL STATEMENTS.
| 8 | JPMORGAN INSURANCE TRUST | DECEMBER 31, 2011 | ||||
Table of Contents
| SHARES | SECURITY DESCRIPTION | VALUE($) | ||||||
| Common Stocks — Continued |
| ||||||
Machinery — Continued |
| |||||||
| 12,900 | EnPro Industries, Inc. (a) | 425,442 | ||||||
| 6,100 | Kadant, Inc. (a) | 137,921 | ||||||
| 2,466 | Robbins & Myers, Inc. | 119,724 | ||||||
| 8,900 | Trimas Corp. (a) | 159,755 | ||||||
| 8,250 | Wabtec Corp. | 577,088 | ||||||
| 1,100 | Watts Water Technologies, Inc., Class A | 37,631 | ||||||
|
| |||||||
| 1,870,397 | ||||||||
|
| |||||||
Professional Services — 0.2% |
| |||||||
| 1,800 | GP Strategies Corp. (a) | 24,264 | ||||||
| 5,300 | Kelly Services, Inc., Class A | 72,504 | ||||||
| 1,200 | VSE Corp. | 29,136 | ||||||
|
| |||||||
| 125,904 | ||||||||
|
| |||||||
Road & Rail — 0.5% |
| |||||||
| 1,400 | Dollar Thrifty Automotive Group, Inc. (a) | 98,364 | ||||||
| 20,400 | Quality Distribution, Inc. (a) | 229,500 | ||||||
|
| |||||||
| 327,864 | ||||||||
|
| |||||||
Trading Companies & Distributors — 1.0% |
| |||||||
| 7,575 | Applied Industrial Technologies, Inc. | 266,413 | ||||||
| 3,100 | Beacon Roofing Supply, Inc. (a) | 62,713 | ||||||
| 1,600 | Interline Brands, Inc. (a) | 24,912 | ||||||
| 9,700 | SeaCube Container Leasing Ltd. | 143,657 | ||||||
| 3,100 | United Rentals, Inc. (a) | 91,605 | ||||||
|
| |||||||
| 589,300 | ||||||||
|
| |||||||
Transportation Infrastructure — 0.3% |
| |||||||
| 12,200 | Wesco Aircraft Holdings, Inc. (a) | 170,678 | ||||||
|
| |||||||
Total Industrials | 8,984,658 | |||||||
|
| |||||||
Information Technology — 14.9% |
| |||||||
Communications Equipment — 1.7% |
| |||||||
| 22,282 | Arris Group, Inc. (a) | 241,091 | ||||||
| 6,650 | Black Box Corp. | 186,466 | ||||||
| 2,900 | Blue Coat Systems, Inc. (a) | 73,805 | ||||||
| 3,800 | Comtech Telecommunications Corp. | 108,756 | ||||||
| 2,000 | NETGEAR, Inc. (a) | 67,140 | ||||||
| 2,000 | Oplink Communications, Inc. (a) | 32,940 | ||||||
| 4,700 | Plantronics, Inc. | 167,508 | ||||||
| 8,300 | Polycom, Inc. (a) | 135,290 | ||||||
|
| |||||||
| 1,012,996 | ||||||||
|
| |||||||
Computers & Peripherals — 0.5% |
| |||||||
| 4,300 | Fusion-io, Inc. (a) | 104,060 | ||||||
| 3,125 | Imation Corp. (a) | 17,906 | ||||||
| 2,800 | Synaptics, Inc. (a) | 84,420 | ||||||
| SHARES | SECURITY DESCRIPTION | VALUE($) | ||||||
Computers & Peripherals — Continued |
| |||||||
| 5,400 | Xyratex Ltd., (United Kingdom) | 71,928 | ||||||
|
| |||||||
| 278,314 | ||||||||
|
| |||||||
Electronic Equipment, Instruments & Components — 1.4% |
| |||||||
| 9,300 | Brightpoint, Inc. (a) | 100,068 | ||||||
| 3,900 | Daktronics, Inc. | 37,323 | ||||||
| 4,300 | DDi Corp. | 40,119 | ||||||
| 1,700 | FEI Co. (a) | 69,326 | ||||||
| 4,400 | Insight Enterprises, Inc. (a) | 67,276 | ||||||
| 2,400 | Littelfuse, Inc. | 103,152 | ||||||
| 1,100 | Measurement Specialties, Inc. (a) | 30,756 | ||||||
| 6,500 | Newport Corp. (a) | 88,465 | ||||||
| 1,800 | Plexus Corp. (a) | 49,284 | ||||||
| 7,900 | RadiSys Corp. (a) | 39,974 | ||||||
| 5,500 | SYNNEX Corp. (a) | 167,530 | ||||||
| 6,000 | TTM Technologies, Inc. (a) | 65,760 | ||||||
|
| |||||||
| 859,033 | ||||||||
|
| |||||||
Internet Software & Services — 1.0% |
| |||||||
| 2,500 | Keynote Systems, Inc. | 51,350 | ||||||
| 97,759 | United Online, Inc. | 531,809 | ||||||
| 600 | Zillow, Inc. (a) | 13,488 | ||||||
|
| |||||||
| 596,647 | ||||||||
|
| |||||||
IT Services — 1.7% |
| |||||||
| 2,500 | CACI International, Inc., Class A (a) | 139,800 | ||||||
| 3,225 | CSG Systems International, Inc. (a) | 47,440 | ||||||
| 3,375 | Gartner, Inc. (a) | 117,349 | ||||||
| 1,900 | ManTech International Corp., Class A | 59,356 | ||||||
| 1,800 | MAXIMUS, Inc. | 74,430 | ||||||
| 4,200 | TeleTech Holdings, Inc. (a) | 68,040 | ||||||
| 3,200 | Unisys Corp. (a) | 63,072 | ||||||
| 6,502 | VeriFone Systems, Inc. (a) | 230,951 | ||||||
| 3,700 | Wright Express Corp. (a) | 200,836 | ||||||
|
| |||||||
| 1,001,274 | ||||||||
|
| |||||||
Semiconductors & Semiconductor Equipment — 3.8% |
| |||||||
| 22,875 | Amkor Technology, Inc. (a) | 99,735 | ||||||
| 6,300 | Brooks Automation, Inc. | 64,701 | ||||||
| 19,625 | Cirrus Logic, Inc. (a) | 311,056 | ||||||
| 19,706 | Entegris, Inc. (a) | 171,935 | ||||||
| 6,500 | GSI Technology, Inc. (a) | 30,420 | ||||||
| 49,000 | GT Advanced Technologies, Inc. (a) | 354,760 | ||||||
| 4,800 | Integrated Silicon Solution, Inc. (a) | 43,872 | ||||||
| 8,200 | Intermolecular, Inc. (a) | 70,356 | ||||||
| 60,800 | Kulicke & Soffa Industries, Inc. (a) | 562,400 | ||||||
| 11,300 | Lattice Semiconductor Corp. (a) | 67,122 | ||||||
SEE NOTES TO FINANCIAL STATEMENTS.
| DECEMBER 31, 2011 | JPMORGAN INSURANCE TRUST | 9 | ||||||
Table of Contents
JPMorgan Insurance Trust Small Cap Core Portfolio
SCHEDULE OF PORTFOLIO INVESTMENTS
AS OF DECEMBER 31, 2011 (continued)
| SHARES | SECURITY DESCRIPTION | VALUE($) | ||||||
| Common Stocks — Continued |
| ||||||
Semiconductors & Semiconductor Equipment — Continued |
| |||||||
| 7,175 | Micrel, Inc. | 72,539 | ||||||
| 6,400 | Photronics, Inc. (a) | 38,912 | ||||||
| 25,800 | PMC-Sierra, Inc. (a) | 142,158 | ||||||
| 18,000 | Skyworks Solutions, Inc. (a) | 291,960 | ||||||
|
| |||||||
| 2,321,926 | ||||||||
|
| |||||||
Software — 4.8% |
| |||||||
| 6,784 | Actuate Corp. (a) | 39,754 | ||||||
| 2,000 | Ariba, Inc. (a) | 56,160 | ||||||
| 23,250 | Aspen Technology, Inc. (a) | 403,388 | ||||||
| 6,400 | Ebix, Inc. | 141,440 | ||||||
| 600 | Imperva, Inc. (a) | 20,886 | ||||||
| 18,614 | JDA Software Group, Inc. (a) | 602,908 | ||||||
| 1,100 | Jive Software, Inc. (a) | 17,600 | ||||||
| 13,600 | Magma Design Automation, Inc. (a) | 97,648 | ||||||
| 200 | Manhattan Associates, Inc. (a) | 8,096 | ||||||
| 3,200 | Monotype Imaging Holdings, Inc. (a) | 49,888 | ||||||
| 3,600 | Netscout Systems, Inc. (a) | 63,360 | ||||||
| 8,240 | Parametric Technology Corp. (a) | 150,462 | ||||||
| 5,200 | Progress Software Corp. (a) | 100,620 | ||||||
| 4,900 | Quest Software, Inc. (a) | 91,140 | ||||||
| 1,500 | Rovi Corp. (a) | 36,870 | ||||||
| 4,400 | SS&C Technologies Holdings, Inc. (a) | 79,464 | ||||||
| 31,900 | Take-Two Interactive Software, Inc. (a) | 432,245 | ||||||
| 900 | Tangoe, Inc. (a) | 13,860 | ||||||
| 2,700 | TeleCommunication Systems, Inc., Class A (a) | 6,345 | ||||||
| 16,000 | TeleNav, Inc. (a) | 124,960 | ||||||
| 4,100 | TIBCO Software, Inc. (a) | 98,031 | ||||||
| 5,200 | VASCO Data Security International, Inc. (a) | 33,904 | ||||||
| 5,500 | VirnetX Holding Corp. (a) | 137,335 | ||||||
| 4,200 | Websense, Inc. (a) | 78,666 | ||||||
|
| |||||||
| 2,885,030 | ||||||||
|
| |||||||
Total Information Technology | 8,955,220 | |||||||
|
| |||||||
Materials — 5.1% |
| |||||||
Chemicals — 2.2% |
| |||||||
| 900 | FutureFuel Corp. | 11,178 | ||||||
| 13,500 | Georgia Gulf Corp. (a) | 263,115 | ||||||
| 5,100 | H.B. Fuller Co. | 117,861 | ||||||
| 5,500 | Innophos Holdings, Inc. | 267,080 | ||||||
| 1,000 | Innospec, Inc. (a) | 28,070 | ||||||
| 7,200 | Koppers Holdings, Inc. | 247,392 | ||||||
| 3,200 | Kraton Performance Polymers, Inc. (a) | 64,960 | ||||||
| 15,300 | PolyOne Corp. | 176,715 | ||||||
| 8,100 | Solutia, Inc. (a) | 139,968 | ||||||
|
| |||||||
| 1,316,339 | ||||||||
|
| |||||||
| SHARES | SECURITY DESCRIPTION | VALUE($) | ||||||
Containers & Packaging — 0.8% |
| |||||||
| 26,200 | Graphic Packaging Holding Co. (a) | 111,612 | ||||||
| 6,575 | Rock-Tenn Co., Class A | 379,377 | ||||||
|
| |||||||
| 490,989 | ||||||||
|
| |||||||
Metals & Mining — 1.4% |
| |||||||
| 11,200 | Coeur d’Alene Mines Corp. (a) | 270,368 | ||||||
| 6,000 | Hecla Mining Co. | 31,380 | ||||||
| 30,800 | Noranda Aluminum Holding Corp. | 254,100 | ||||||
| 8,600 | Revett Minerals, Inc. (a) | 40,592 | ||||||
| 14,100 | Worthington Industries, Inc. | 230,958 | ||||||
|
| |||||||
| 827,398 | ||||||||
|
| |||||||
Paper & Forest Products — 0.7% |
| |||||||
| 12,375 | Buckeye Technologies, Inc. | 413,820 | ||||||
| 400 | Schweitzer-Mauduit International, Inc. | 26,584 | ||||||
|
| |||||||
| 440,404 | ||||||||
|
| |||||||
Total Materials | 3,075,130 | |||||||
|
| |||||||
Telecommunication Services — 1.4% |
| |||||||
Diversified Telecommunication Services — 1.4% |
| |||||||
| 2,800 | Boingo Wireless, Inc. (a) | 24,080 | ||||||
| 152,100 | Cincinnati Bell, Inc. (a) | 460,863 | ||||||
| 5,800 | Consolidated Communications Holdings, Inc. | 110,490 | ||||||
| 500 | IDT Corp., Class B | 4,690 | ||||||
| 22,400 | Premiere Global Services, Inc. (a) | 189,728 | ||||||
| 27,800 | Vonage Holdings Corp. (a) | 68,110 | ||||||
|
| |||||||
Total Telecommunication Services | 857,961 | |||||||
|
| |||||||
Utilities — 3.8% |
| |||||||
Electric Utilities — 2.6% |
| |||||||
| 1,500 | Central Vermont Public Service Corp. | 52,650 | ||||||
| 10,525 | El Paso Electric Co. | 364,586 | ||||||
| 3,700 | Empire District Electric Co. (The) | �� | 78,033 | |||||
| 6,100 | IDACORP, Inc. | 258,701 | ||||||
| 25,275 | Portland General Electric Co. | 639,205 | ||||||
| 2,625 | UniSource Energy Corp. | 96,915 | ||||||
| 2,100 | Westar Energy, Inc. | 60,438 | ||||||
|
| |||||||
| 1,550,528 | ||||||||
|
| |||||||
Gas Utilities — 1.2% | ||||||||
| 419 | AGL Resources, Inc. (m) | 17,707 | ||||||
| 2,200 | Chesapeake Utilities Corp. | 95,370 | ||||||
| 2,100 | Laclede Group, Inc. (The) | 84,987 | ||||||
| 5,200 | New Jersey Resources Corp. | 255,840 | ||||||
| 1,600 | Northwest Natural Gas Co. | 76,688 | ||||||
| 2,900 | Southwest Gas Corp. | 123,221 | ||||||
SEE NOTES TO FINANCIAL STATEMENTS.
| 10 | JPMORGAN INSURANCE TRUST | DECEMBER 31, 2011 | ||||
Table of Contents
| SHARES | SECURITY DESCRIPTION | VALUE($) | ||||||
| Common Stocks — Continued |
| ||||||
Gas Utilities — Continued | ||||||||
| 1,900 | WGL Holdings, Inc. | 84,018 | ||||||
|
| |||||||
| 737,831 | ||||||||
|
| |||||||
Independent Power Producers & Energy Traders — 0.0% (g) |
| |||||||
| 500 | Genie Energy Ltd., Class B | 3,965 | ||||||
|
| |||||||
Total Utilities | 2,292,324 | |||||||
|
| |||||||
Total Common Stocks | 58,597,143 | |||||||
|
| |||||||
| PRINCIPAL AMOUNT($) | ||||||||
| U.S. Treasury Obligation — 0.4% |
| ||||||
| 230,000 | U.S. Treasury Note, 0.500%, 11/30/12 (k) | 230,737 | ||||||
|
| |||||||
| SHARES | SECURITY DESCRIPTION | VALUE($) | ||||||
| Short-Term Investment — 2.6% |
| ||||||
Investment Company — 2.6% | ||||||||
| 1,570,403 | JPMorgan Prime Money Market Fund, Institutional Class Shares, 0.090% (b) (l) (m) | 1,570,403 | ||||||
|
| |||||||
Total Investments — 100.4% | 60,398,283 | |||||||
Liabilities in Excess of | (227,498 | ) | ||||||
|
| |||||||
NET ASSETS — 100.0% | $ | 60,170,785 | ||||||
|
| |||||||
Percentages indicated are based on net assets.
| Futures Contracts | ||||||||||||||||
| NUMBER OF CONTRACTS | DESCRIPTION | EXPIRATION DATE | NOTIONAL VALUE AT 12/31/11 | UNREALIZED APPRECIATION (DEPRECIATION) | ||||||||||||
Long Futures Outstanding | ||||||||||||||||
| 22 | E-mini Russell 2000 | 03/16/12 | $ | 1,625,360 | $ | 12,052 | ||||||||||
|
| |||||||||||||||
NOTES TO SCHEDULE OF PORTFOLIO INVESTMENTS:
| (a) | — Non-income producing security | |
| (b) | — Investment in affiliate. Money market fund registered under the Investment Company Act of 1940, as amended, and advised by J.P. Morgan Investment Management Inc. | |
| (g) | — Amount rounds to less than 0.1%. | |
| (k) | — All or a portion of this security is deposited with the broker as collateral for futures or with brokers as initial margin for futures contracts. |
| (l) | — The rate shown is the current yield as of December 31, 2011. | |
| (m) | — All or a portion of this security is reserved and/or pledged with the custodian for current or potential holdings of futures, swaps, options, TBAs, when-issued securities, delayed delivery securities, reverse repurchase agreements, unfunded commitments and/or forward foreign currency exchange contracts. |
SEE NOTES TO FINANCIAL STATEMENTS.
| DECEMBER 31, 2011 | JPMORGAN INSURANCE TRUST | 11 | ||||||
Table of Contents
STATEMENT OF ASSETS AND LIABILITIES
AS OF DECEMBER 31, 2011
| Small Cap Core Portfolio | ||||
ASSETS: | ||||
Investments in non-affiliates, at value | $ | 58,827,880 | ||
Investments in affiliates, at value | 1,570,403 | |||
|
| |||
Total investment securities, at value | 60,398,283 | |||
Receivables: | ||||
Investment securities sold | 115,786 | |||
Portfolio shares sold | 8,913 | |||
Interest and dividends from non-affiliates | 94,515 | |||
Dividends from affiliates | 158 | |||
|
| |||
Total Assets | 60,617,655 | |||
|
| |||
LIABILITIES: | ||||
Payables: | ||||
Investment securities purchased | 342,207 | |||
Portfolio shares redeemed | 10,596 | |||
Variation margin on futures contracts | 6,160 | |||
Accrued liabilities: | ||||
Investment advisory fees | 32,777 | |||
Administration fees | 4,503 | |||
Distribution fees | 373 | |||
Custodian and accounting fees | 12,174 | |||
Trustees’ and Chief Compliance Officer’s fees | 27 | |||
Other | 38,053 | |||
|
| |||
Total Liabilities | 446,870 | |||
|
| |||
Net Assets | $ | 60,170,785 | ||
|
| |||
NET ASSETS: | ||||
Paid in capital | $ | 58,851,214 | ||
Accumulated undistributed net investment income | 133,064 | |||
Accumulated net realized gains (losses) | (9,504,790 | ) | ||
Net unrealized appreciation (depreciation) | 10,691,297 | |||
|
| |||
Total Net Assets | $ | 60,170,785 | ||
|
| |||
Net Assets: | ||||
Class 1 | $ | 58,405,012 | ||
Class 2 | 1,765,773 | |||
|
| |||
Total | $ | 60,170,785 | ||
|
| |||
Outstanding units of beneficial interest (shares) (unlimited number of shares authorized, no par value): | ||||
Class 1 | 4,106,829 | |||
Class 2 | 124,714 | |||
Net Asset Value, offering and redemption price per share: (a) | ||||
Class 1 | $ | 14.22 | ||
Class 2 | 14.16 | |||
|
| |||
Cost of investments in non-affiliates | $ | 48,148,635 | ||
Cost of investments in affiliates | 1,570,403 | |||
| (a) | Per share amounts may not recalculate due to rounding of net assets and/or shares outstanding. |
SEE NOTES TO FINANCIAL STATEMENTS.
| 12 | JPMORGAN INSURANCE TRUST | DECEMBER 31, 2011 | ||||
Table of Contents
STATEMENT OF OPERATIONS
FOR THE YEAR ENDED DECEMBER 31, 2011
| Small Cap Core Portfolio | ||||
INVESTMENT INCOME: | ||||
Interest income from non-affiliates | $ | 480 | ||
Dividend income from non-affiliates | 779,561 | |||
Dividend income from affiliates | 1,273 | |||
|
| |||
Total investment income | 781,314 | |||
|
| |||
EXPENSES: | ||||
Investment advisory fees | 433,281 | |||
Administration fees | 59,020 | |||
Distribution fees — Class 2 | 4,778 | |||
Custodian and accounting fees | 33,791 | |||
Professional fees | 44,595 | |||
Trustees’ and Chief Compliance Officer’s fees | 719 | |||
Printing and mailing costs | 43,709 | |||
Transfer agent fees | 7,380 | |||
Other | 12,347 | |||
|
| |||
Total expenses | 639,620 | |||
|
| |||
Less amounts waived | (4,267 | ) | ||
Less earnings credits | (1 | ) | ||
|
| |||
Net expenses | 635,352 | |||
|
| |||
Net investment income (loss) | 145,962 | |||
|
| |||
REALIZED/UNREALIZED GAINS (LOSSES): | ||||
Net realized gain (loss) on transactions from: | ||||
Investments in non-affiliates | 2,926,991 | |||
Futures | (2,283 | ) | ||
|
| |||
Net realized gains (losses) | 2,924,708 | |||
|
| |||
Change in net unrealized appreciation (depreciation) of: | ||||
Investments in non-affiliates | (5,923,432 | ) | ||
Futures | (21,453 | ) | ||
|
| |||
Change in net unrealized appreciation (depreciation) | (5,944,885 | ) | ||
|
| |||
Net realized/unrealized gains (losses) | (3,020,177 | ) | ||
|
| |||
Change in net assets resulting from operations | $ | (2,874,215 | ) | |
|
| |||
SEE NOTES TO FINANCIAL STATEMENTS.
| DECEMBER 31, 2011 | JPMORGAN INSURANCE TRUST | 13 | ||||||
Table of Contents
STATEMENT OF CHANGES IN NET ASSETS
FOR THE PERIODS INDICATED
| Small Cap Core Portfolio | ||||||||
| Year Ended 12/31/2011 | Year Ended 12/31/2010 | |||||||
CHANGE IN NET ASSETS RESULTING FROM OPERATIONS: | ||||||||
Net investment income (loss) | $ | 145,962 | $ | 79,776 | ||||
Net realized gain (loss) | 2,924,708 | 1,274,581 | ||||||
Change in net unrealized appreciation (depreciation) | (5,944,885 | ) | 14,066,091 | |||||
|
|
|
| |||||
Change in net assets resulting from operations | (2,874,215 | ) | 15,420,448 | |||||
|
|
|
| |||||
DISTRIBUTIONS TO SHAREHOLDERS: | ||||||||
Class 1 | ||||||||
From net investment income | (83,140 | ) | — | |||||
|
|
|
| |||||
Total distributions to shareholders | (83,140 | ) | — | |||||
|
|
|
| |||||
CAPITAL TRANSACTIONS: | ||||||||
Change in net assets from capital transactions | (9,222,762 | ) | (732,592 | ) | ||||
|
|
|
| |||||
NET ASSETS: | ||||||||
Change in net assets | (12,180,117 | ) | 14,687,856 | |||||
Beginning of period | 72,350,902 | 57,663,046 | ||||||
|
|
|
| |||||
End of period | $ | 60,170,785 | $ | 72,350,902 | ||||
|
|
|
| |||||
Accumulated undistributed net investment income | $ | 133,064 | $ | 80,827 | ||||
|
|
|
| |||||
CAPITAL TRANSACTIONS: | ||||||||
Class 1 | ||||||||
Proceeds from shares issued | $ | 11,467,229 | $ | 19,840,628 | ||||
Dividends and distributions reinvested | 83,140 | — | ||||||
Cost of shares redeemed | (20,630,854 | ) | (21,272,478 | ) | ||||
|
|
|
| |||||
Change in net assets from Class 1 capital transactions | $ | (9,080,485 | ) | $ | (1,431,850 | ) | ||
|
|
|
| |||||
Class 2 | ||||||||
Proceeds from shares issued | 114,974 | 1,086,656 | ||||||
Cost of shares redeemed | (257,251 | ) | (387,398 | ) | ||||
|
|
|
| |||||
Change in net assets from Class 2 capital transactions | $ | (142,277 | ) | $ | 699,258 | |||
|
|
|
| |||||
Total change in net assets from capital transactions | $ | (9,222,762 | ) | $ | (732,592 | ) | ||
|
|
|
| |||||
SHARE TRANSACTIONS: | ||||||||
Class 1 | ||||||||
Issued | 779,981 | 1,539,522 | ||||||
Reinvested | 5,222 | — | ||||||
Redeemed | (1,383,093 | ) | (1,660,186 | ) | ||||
|
|
|
| |||||
Change in Class 1 Shares | (597,890 | ) | (120,664 | ) | ||||
|
|
|
| |||||
Class 2 | ||||||||
Issued | 7,935 | 87,635 | ||||||
Redeemed | (17,056 | ) | (30,523 | ) | ||||
|
|
|
| |||||
Change in Class 2 Shares | (9,121 | ) | 57,112 | |||||
|
|
|
| |||||
SEE NOTES TO FINANCIAL STATEMENTS.
| 14 | JPMORGAN INSURANCE TRUST | DECEMBER 31, 2011 | ||||
Table of Contents
THIS PAGE IS INTENTIONALLY LEFT BLANK
| DECEMBER 31, 2011 | JPMORGAN INSURANCE TRUST | 15 | ||||||
Table of Contents
FOR THE PERIODS INDICATED
| Per share operating performance | |||||||||||||||||||||||
| Investment operations | Distributions | |||||||||||||||||||||||
| Net asset value, beginning of period | Net investment income (loss) | Net realized and unrealized gains (losses) on investments | Total from investment operations | Net investment income | Net realized gain | |||||||||||||||||||
Small Cap Core Portfolio (e) | ||||||||||||||||||||||||
Class 1 | ||||||||||||||||||||||||
Year Ended December 31, 2011 | $ | 14.95 | $ | 0.04 | $ | (0.75 | ) | $ | (0.71 | ) | $ | (0.02 | ) | $ | — | |||||||||
Year Ended December 31, 2010 | 11.76 | 0.02 | 3.17 | 3.19 | — | — | ||||||||||||||||||
Year Ended December 31, 2009 | 9.84 | 0.05 | 2.11 | 2.16 | (0.08 | ) | (0.16 | ) | ||||||||||||||||
Year Ended December 31, 2008 | 16.06 | 0.04 | (4.73 | ) | (4.69 | ) | (0.03 | ) | (1.50 | ) | ||||||||||||||
Year Ended December 31, 2007 | 17.82 | 0.02 | (0.95 | ) | (0.93 | ) | — | (f) | (0.83 | ) | ||||||||||||||
Class 2 | ||||||||||||||||||||||||
Year Ended December 31, 2011 | 14.91 | — | (f) | (0.75 | ) | (0.75 | ) | — | — | |||||||||||||||
Year Ended December 31, 2010 | 11.76 | (0.01 | ) | 3.16 | 3.15 | — | — | |||||||||||||||||
April 24, 2009 (g) through December 31, 2009 | 9.03 | 0.01 | 2.73 | 2.74 | (0.01 | ) | — | |||||||||||||||||
| (a) | Annualized for periods less than one year. |
| (b) | Not annualized for periods less than one year. |
| (c) | Includes adjustments in accordance with accounting principles generally accepted in the United States of America and as such, the net asset value for financial reporting purposes and the returns based upon those net asset values may differ from the net asset value and returns for shareholder transactions. |
| (d) | Includes earnings credits and interest expense, each of which is less than 0.01%, if applicable or unless otherwise noted. |
| (e) | Small Cap Core Portfolio acquired all of the assets and liabilities of JPMorgan Small Company Portfolio (“Predecessor Portfolio”) in a reorganization on April 24, 2009. The Predecessor Portfolio’s performance and financial history have been adopted by Small Cap Core Portfolio and have been used since the reorganization. As a result, the financial highlight information reflects that of the Predecessor Portfolio for the periods prior to its reorganization with Small Cap Core Portfolio. |
| (f) | Amount rounds to less than $0.01. |
| (g) | Because of the reorganization with the Predecessor Portfolio in which the performance and financial history of the Small Cap Core Portfolio was replaced with that of the Predecessor Portfolio, the performance and the financial history began on April 24, 2009. |
SEE NOTES TO FINANCIAL STATEMENTS.
| 16 | JPMORGAN INSURANCE TRUST | DECEMBER 31, 2011 | ||||
Table of Contents
| Ratios/Supplemental data | |||||||||||||||||||||||||||||
| Ratios to average net assets (a) | |||||||||||||||||||||||||||||
| Total distributions | Net asset value, end of period | Total return (b)(c) | Net assets, end of period | Net expenses (d) | Net investment income (loss) | Expenses without waivers, reimbursements and earnings credits | Portfolio turnover rate (b) | |||||||||||||||||||||||
| $ | (0.02 | ) | $ | 14.22 | (4.77 | )% | $ | 58,405,012 | 0.95 | % | 0.23 | % | 0.95 | % | 46 | % | ||||||||||||||
| — | 14.95 | 27.13 | 70,355,671 | 0.99 | 0.13 | 1.04 | 45 | |||||||||||||||||||||||
| (0.24 | ) | 11.76 | 22.58 | 56,761,095 | 0.98 | 0.42 | 1.34 | 55 | ||||||||||||||||||||||
| (1.53 | ) | 9.84 | (31.98 | ) | 49,825,124 | 1.08 | 0.29 | 1.15 | 45 | |||||||||||||||||||||
| (0.83 | ) | 16.06 | (5.67 | ) | 82,402,308 | 1.15 | 0.14 | 1.15 | 44 | |||||||||||||||||||||
| — | 14.16 | (5.03 | ) | 1,765,773 | 1.20 | (0.02 | ) | 1.20 | 46 | |||||||||||||||||||||
| — | 14.91 | 26.79 | 1,995,231 | 1.24 | (0.09 | ) | 1.28 | 45 | ||||||||||||||||||||||
| (0.01 | ) | 11.76 | 30.37 | 901,951 | 1.17 | 0.26 | 1.45 | 55 | ||||||||||||||||||||||
SEE NOTES TO FINANCIAL STATEMENTS.
| DECEMBER 31, 2011 | JPMORGAN INSURANCE TRUST | 17 | ||||||
Table of Contents
AS OF DECEMBER 31, 2011
1. Organization
JPMorgan Insurance Trust (the “Trust”) is registered under the Investment Company Act of 1940, as amended (the “1940 Act”), as an open-end management investment company and is a Massachusetts business trust.
The following is a separate Portfolio of the Trust (the “Portfolio”) covered by this report:
| Classes Offered | Diversified/Non-Diversified | |||
| Small Cap Core Portfolio | Class 1 and Class 2 | Diversified |
The Portfolio seeks capital growth over the long term.
Portfolio shares are offered only to separate accounts of participating insurance companies and Eligible Plans. Individuals may not purchase shares directly from the Portfolio.
All classes of shares have equal rights as to earnings, assets and voting privileges except that each class may bear different distribution and service fees and each class has exclusive voting rights with respect to its distribution plan or administrative services plan.
2. Significant Accounting Policies
The following is a summary of significant accounting policies followed by the Trust in the preparation of its financial statements. The policies are in accordance with accounting principles generally accepted in the United States of America. The preparation of financial statements requires management to make estimates and assumptions that affect the reported amounts of assets and liabilities at the date of the financial statements and the reported amounts of income and expenses for the period. Actual results could differ from those estimates.
A. Valuation of Investments — Equity securities listed on a North American, Central American, South American or Caribbean securities exchange shall generally be valued at the last sale price on the exchange on which the security is principally traded that is reported before the time when the net assets of the Portfolio are valued. The value of securities listed on The NASDAQ Stock Market LLC shall generally be the NASDAQ Official Closing Price. Fixed income securities (other than certain short-term investments maturing in less than 61 days) are valued each day based on prices received from independent or affiliated pricing services approved by the Board of Trustees or third party broker-dealers. The broker-dealers or pricing services use multiple valuation techniques to determine fair value. In instances where sufficient market activity exists, the broker-dealers or pricing services may utilize a market-based approach through which quotes from market makers are used to determine fair value. In instances where sufficient market activity may not exist or is limited, the broker-dealers or pricing services also utilize proprietary valuation models which may consider market transactions in comparable securities and the various relationships between securities in determining value and/or market characteristics such as benchmark yield curves, option-adjusted spreads, credit spreads, estimated default rates, coupon-rates, anticipated timing of principal repayments, underlying collateral, and other unique security features in order to estimate the relevant cash flows, which are then discounted to calculate the fair values. Generally, short-term investments of sufficient credit quality maturing in less than 61 days are valued at amortized cost, which approximates market value. Certain investments of the Portfolio may, depending upon market conditions, trade in relatively thin markets and/or in markets that experience significant volatility. As a result of these conditions, the prices used by the Portfolio to value securities may differ from the value that would be realized if these securities were sold, and the differences could be material. Futures and options shall generally be valued on the basis of available market quotations. Swaps and other derivatives are valued daily, primarily using independent or affiliated pricing services approved by the Board of Trustees. If valuations are not available from such services or values received are deemed not representative of market value, values will be obtained from a third party broker-dealer or counterparty. Investments in other open-end investment companies are valued at such investment company’s net asset value per share as of the report date.
Securities or other assets for which market quotations are not readily available or for which market quotations do not represent the value at the time of pricing (including certain illiquid securities) are fair valued in accordance with procedures established by and under the supervision and responsibility of the Board of Trustees. Under these procedures, the Portfolio primarily employs a market-based approach which may use related or comparable assets or liabilities, recent transactions, market multiples, book values, and other relevant information for the investment to determine the fair value of the investment. The Portfolio may also use an income-based valuation approach in which the anticipated future cash flows of the investment are discounted to calculate fair value. Discounts may also be applied due to the nature or duration of any restrictions on the disposition of the investments. Valuations may be based upon current market prices of securities that are comparable in coupon, rating, maturity and industry. It is possible that the estimated values may differ significantly from the values that would have been used had a ready market for the investments existed, and such differences could be material. Trading in securities on most foreign exchanges and over-the-counter markets is normally completed before the close of the domestic market and may also take place on days when the domestic market is closed. In accordance with procedures adopted by the Board of Trustees, the Portfolio applies fair value pricing on equity securities on a daily basis except for North American, Central American, South American and Caribbean equity securities held in its portfolio, by utilizing the quotations of an independent pricing service, unless the Portfolio’s advisor determines that use of another valuation methodology is appropriate. The pricing service uses statistical analyses and quantitative models to adjust local market prices using factors such as subsequent movement and changes in the prices of indices, securities and exchange rates in other markets, in determining fair value as of the time the Portfolio calculates its net asset value.
Valuations reflected in this report are as of the report date. As a result, changes in valuation due to market events and/or issuer related events after the report date and prior to issuance of the report are not reflected herein.
| 18 | JPMORGAN INSURANCE TRUST | DECEMBER 31, 2011 | ||||
Table of Contents
The various inputs that are used in determining the fair value of the Portfolio’s investments are summarized into the three broad levels listed below.
| Ÿ | Level 1 — quoted prices in active markets for identical securities |
| Ÿ | Level 2 — other significant observable inputs (including quoted prices for similar securities, interest rates, prepayment speeds, credit risk, etc.) |
| Ÿ | Level 3 — significant unobservable inputs (including the Portfolio’s own assumptions in determining the fair value of investments) |
A financial instrument’s level within the fair value hierarchy is based on the lowest level of any input both individually and in aggregate that is significant to the fair value measurement. The inputs or methodology used for valuing securities are not necessarily an indication of the risk associated with investing in those securities.
The following table represents each valuation input as presented on the Schedule of Portfolio Investments (“SOI”):
| Level 1 Quoted prices | Level 2 Other significant observable inputs | Level 3 Significant unobservable inputs | Total | |||||||||||||
Total Investments in Securities (a) | $ | 60,167,546 | $ | 230,737 | $ | — | $ | 60,398,283 | ||||||||
|
|
|
|
|
|
|
| |||||||||
Appreciation in Other Financials Instruments | ||||||||||||||||
Futures Contracts | $ | 12,052 | $ | — | $ | — | $ | 12,052 | ||||||||
|
|
|
|
|
|
|
| |||||||||
| (a) | Portfolio holdings designated as Level 1 and Level 2 are disclosed individually in the SOI. Level 2 consists of a U.S. Treasury Note that is held for futures collateral. Please refer to the SOI for industry specifics of portfolio holdings. |
There were no transfers between Levels 1 and 2 during the year ended December 31, 2011.
B. Futures Contracts — The Portfolio uses index futures contracts to gain or reduce exposure to the stock market, maintain liquidity and minimize transaction costs. The Portfolio buys futures contracts to immediately invest incoming cash in the market or sells futures in response to cash outflows, thereby simulating an invested position in the underlying index while maintaining a cash balance for liquidity. The use of futures contracts exposes the Portfolio to equity price risk.
Futures contracts provide for the delayed delivery of the underlying instrument at a fixed price or for a cash amount based on the change in the value of the underlying instrument at a specific date in the future. Upon entering into a futures contract, the Portfolio is required to deposit with the broker, cash or securities in an amount equal to a certain percentage of the contract amount which is referred to as the initial margin deposit. Subsequent payments, referred to as variation margin, are made or received by the Portfolio periodically and are based on changes in the market value of open futures contracts. Changes in the market value of open futures contracts are recorded as unrealized appreciation or depreciation in the Statement of Operations. Realized gains or losses, representing the difference between the value of the contract at the time it was opened and the value at the time it was closed, are reported in the Statement of Operations at the closing or expiration of futures contracts. Securities deposited as initial margin are designated in the SOI and cash deposited is recorded on the Statement of Assets and Liabilities. A receivable from and/or a payable to brokers for the daily variation margin is also recorded on the Statement of Assets and Liabilities.
The Portfolio may be subject to the risk that the change in the value of the futures contract may not correlate perfectly with the underlying instrument. Use of long futures contracts subjects the Portfolio to risk of loss in excess of the amounts shown on the Statement of Assets and Liabilities, up to the notional amount of the futures contracts. Use of short futures contracts subjects the Portfolio to unlimited risk of loss. The Portfolio may enter into futures contracts only on exchanges or boards of trade. The exchange or board of trade acts as the counterparty to each futures transaction; therefore, the Portfolio’s credit risk is limited to failure of the exchange or board of trade. Under some circumstances, futures exchanges may establish daily limits on the amount that the price of a futures contract can vary from the previous day’s settlement price, which could effectively prevent liquidation of unfavorable positions.
The table below discloses the volume of the Portfolio’s futures activities during the year ended December 31, 2011:
Futures Contracts: | ||||
Average Notional Balance Long | $ | 1,691,428 | ||
Ending Notional Balance Long | 1,625,360 |
C. Security Transactions and Investment Income — Investment transactions are accounted for on the trade date (the date the order to buy or sell is executed). Securities gains and losses are calculated on a specifically identified cost basis. Interest income is determined on the basis of coupon interest accrued using the effective interest method adjusted for amortization of premiums and accretion of discounts. Dividend income less foreign taxes withheld, if any, is recorded on the ex-dividend date or when the Portfolio first learns of the dividend.
The Portfolio records distributions received in excess of income from underlying investments as a reduction of cost of investments and/or realized gain. Such amounts are based on estimates if actual amounts are not available and actual amounts of income, realized gain and return of capital may differ from the estimated amounts. The Portfolio adjusts the estimated amounts of components of distributions (and consequently its net investment income) as necessary once the issuers provide information about the actual composition of the distributions.
| DECEMBER 31, 2011 | JPMORGAN INSURANCE TRUST | 19 | ||||||
Table of Contents
NOTES TO FINANCIAL STATEMENTS
AS OF DECEMBER 31, 2011 (continued)
D. Allocation of Income and Expenses — In calculating the net asset value per share of each class, investment income, realized and unrealized gains and losses and expenses other than class specific expenses are allocated daily to each class of shares based upon the proportion of net assets of each class at the beginning of each day. Expenses directly attributable to a portfolio are charged directly to that portfolio while the expenses attributable to more than one portfolio of the Trust are allocated among the respective portfolios. Each class of shares bears its pro-rata portion of expenses attributable to the Portfolio, except that each class separately bears expenses related specifically to that class, such as distribution fees.
E. Federal Income Taxes — The Portfolio is treated as a separate taxable entity for Federal income tax purposes. The Portfolio’s policy is to comply with the provisions of the Internal Revenue Code of 1986, as amended (the “Code”), applicable to regulated investment companies and to distribute to shareholders all of its distributable net investment income and net realized gain on investments. Accordingly, no provision for Federal income tax is necessary. The Portfolio is also a segregated portfolio of assets for insurance purposes and intends to comply with the diversification requirements of Subchapter L of the Code. The Portfolio is not aware of any tax positions for which it is reasonably possible that the total amounts of unrecognized tax benefits or losses will significantly change in the next twelve months. However, the Portfolio’s conclusions may be subject to future review based on changes in, or the interpretation of, the accounting standards or tax laws and regulations. The Portfolio’s Federal tax returns for the prior three fiscal years remain subject to examination by the Internal Revenue Service.
F. Dividends and Distributions to Shareholders — Dividends from net investment income are generally declared and paid at least annually. Dividends are declared separately for each class. No class has preferential dividend rights; differences in per share rates are due to differences in separate class expenses. Net realized capital gains, if any, are distributed at least annually. The amount of dividends and distributions from net investment income and net realized capital gains is determined in accordance with Federal income tax regulations, which may differ from accounting principles generally accepted in the United States of America. To the extent these “book/tax” differences are permanent in nature (i.e., that they result from other than timing of recognition — “temporary differences”), such amounts are reclassified within the capital accounts based on their Federal tax-basis treatment.
The following amounts were reclassified within the capital accounts:
| Paid-in-Capital | Accumulated Undistributed/ (Overdistributed) Net Investment Income | Accumulated Net Realized Gain (Loss) on Investments | ||||||||||
| $ | 20,684 | $ | (10,585 | ) | $ | (10,099 | ) | |||||
The reclassifications for the Portfolio relate primarily to distributions from investments in real estate investment trusts, non-taxable special dividends and passive foreign investment company (PFIC) gains and losses.
3. Fees and Other Transactions with Affiliates
A. Investment Advisory Fee — Pursuant to the Investment Advisory Agreement, J.P. Morgan Investment Management Inc. (“JPMIM” or the “Advisor”) acts as the investment advisor to the Portfolio. The Advisor is a wholly-owned subsidiary of JPMorgan Asset Management Holdings Inc., which is a wholly-owned subsidiary of JPMorgan Chase & Co. (“JPMorgan”). The Advisor supervises the investments of the Portfolio and for such services is paid a fee. The fee is accrued daily and paid monthly based on the Portfolio’s average daily net assets at an annual fee rate of 0.65%.
The Advisor waived Investment Advisory fees and/or reimbursed expenses as outlined in Note 3.E.
B. Administration Fee — Pursuant to an Administration Agreement, JPMorgan Funds Management, Inc. (the “Administrator”), an indirect, wholly-owned subsidiary of JPMorgan, provides certain administration services to the Portfolio. In consideration of these services, the Administrator receives a fee computed daily and paid monthly at the annual rate of 0.15% of the first $25 billion of the average daily net assets of all funds in the J.P. Morgan Funds Complex (excluding certain funds of funds and money market funds) and 0.075% of the average daily net assets in excess of $25 billion of all such funds. For the year ended December 31, 2011, the annual effective rate was 0.09% of the Portfolio’s average daily net assets.
JPMorgan Chase Bank, N.A (“JPMCB”), a wholly-owned subsidiary of JPMorgan, and successor in interest to J.P. Morgan Investor Services Co. serves as the Portfolio’s sub-administrator (the “Sub-administrator”). For its services as Sub-administrator, JPMCB receives a portion of the fees payable to the Administrator.
C. Distribution Fees — Pursuant to a Distribution Agreement, JPMorgan Distribution Services, Inc. (the “Distributor”), a wholly-owned subsidiary of JPMorgan, serves as the Trust’s exclusive underwriter and promotes and arranges for the sale of the Portfolio’s shares.
The Board of Trustees has adopted a Distribution Plan (the “Distribution Plan”) for Class 2 Shares of the Portfolio in accordance with Rule 12b-1 under the 1940 Act. The Distribution Plan provides that the Portfolio shall pay distribution fees, including payments to the Distributor, at an annual rate of 0.25% of the average daily net assets of Class 2 Shares.
D. Custodian and Accounting Fees — JPMCB provides portfolio custody and accounting services for the Portfolio. The amounts paid directly to JPMCB by the Portfolio for custody and accounting services are included in Custodian and accounting fees in the Statement of Operations. The custodian fees may be reduced by credits earned by the Portfolio, based on uninvested cash balances held by the custodian. Such earnings credits are presented separately in the Statement of Operations.
Interest expense, if any, paid to the custodian related to cash overdrafts is included in Interest expense to affiliates in the Statement of Operations.
| 20 | JPMORGAN INSURANCE TRUST | DECEMBER 31, 2011 | ||||
Table of Contents
E. Waivers and Reimbursements — The Advisor and Administrator have contractually agreed to waive fees and/or reimburse the Portfolio to the extent that total annual operating expenses (excluding acquired fund fees and expenses, dividend expense related to short sales, interest, taxes, extraordinary expenses and expenses related to the Board of Trustees’ deferred compensation plan) exceed the percentages of the Portfolio’s respective average daily net assets as shown in the table below:
| Class 1 | Class 2 | |||||||
| 1.03 | % | 1.28 | % | |||||
The contractual expense limitation agreements were in effect for the year ended December 31, 2011. The expense limitation percentages in the table above are in place until at least April 30, 2012.
For the year ended December 31, 2011, the Advisor voluntarily waived fees for the Portfolio in the amount of $1,211. The Advisor does not expect the Portfolio to repay any such waived fees in future years.
Additionally, the Portfolio may invest in one or more money market funds advised by the Advisor or its affiliates. The Advisor, Administrator and the Distributor waive fees in an amount sufficient to offset the respective fees each charges to the affiliated money market fund on the Portfolio’s investment in such affiliated money market fund. A portion of the waiver is voluntary.
The amount of waivers resulting from investments in the money market funds for the year ended December 31, 2011 was $3,056.
F. Other — Certain officers of the Trust are affiliated with the Advisor, the Administrator and the Distributor. Such officers, with the exception of the Chief Compliance Officer, receive no compensation from the Portfolio for serving in their respective roles.
The Board of Trustees appointed a Chief Compliance Officer to the Portfolio in accordance with federal securities regulations. The Portfolio, along with other affiliated portfolios, makes reimbursement payments, on a pro-rata basis, to the Administrator for a portion of the fees associated with the Office of the Chief Compliance Officer. Such fees are included in Trustees’ and Chief Compliance Officer’s fees in the Statement of Operations.
The Trust adopted a Trustee Deferred Compensation Plan (the “Plan”) which allows the Independent Trustees to defer the receipt of all or a portion of compensation related to performance of their duties as a Trustee. The deferred fees are invested in various J.P. Morgan Funds until distribution in accordance with the Plan.
During the year ended December 31, 2011, the Portfolio may have purchased securities from an underwriting syndicate in which the principal underwriter or members of the syndicate are affiliated with the Advisor.
The Portfolio may use related party broker/dealers. For the year ended December 31, 2011, the Portfolio did not incur any brokerage commissions with broker/dealers affiliated with the Advisor.
The Securities and Exchange Commission (“SEC”) has granted an exemptive order permitting the Portfolio to engage in principal transactions with J.P. Morgan Securities, Inc., an affiliated broker, involving taxable money market instruments subject to certain conditions.
4. Investment Transactions
During the year ended December 31, 2011, purchases and sales of investments (excluding short-term investments) were as follows:
Purchases (excluding | Sales (excluding | Purchases of U.S. Government | Sales of U.S. Government | |||||||||||||
| $ | 30,100,771 | $ | 39,121,738 | $ | 210,745 | $ | 100,000 | |||||||||
5. Federal Income Tax Matters
For Federal income tax purposes, the cost and unrealized appreciation (depreciation) in value of the investment securities at December 31, 2011 were as follows:
Aggregate Cost | Gross Unrealized Appreciation | Gross Unrealized Depreciation | Net Appreciation (Depreciation) | |||||||||||||
| $ | 51,167,743 | $ | 13,271,794 | $ | 4,041,254 | $ | 9,230,540 | |||||||||
The difference between book and tax basis appreciation (depreciation) on investments is primarily attributed to wash sale loss deferrals.
The tax character of distributions paid during the fiscal year ended December 31, 2011 was as follows:
| Total Distributions Paid From: | ||||||||
Ordinary Income | Total Distributions Paid | |||||||
| $ | 83,140 | $ | 83,140 | |||||
There were no distributions paid during the fiscal year ended December 31, 2010.
| DECEMBER 31, 2011 | JPMORGAN INSURANCE TRUST | 21 | ||||||
Table of Contents
NOTES TO FINANCIAL STATEMENTS
AS OF DECEMBER 31, 2011 (continued)
At December 31, 2011, the components of net assets (excluding paid in capital) on a tax basis were as follows:
Current Distributable Ordinary Income | Current Distributable Long-Term Capital-Gain or (Tax Basis Capital Loss Carryover) | Unrealized Appreciation (Depreciation) | ||||||||||
| $ | 133,839 | $ | (7,621,480 | ) | $ | 9,230,540 | ||||||
The cumulative timing differences primarily consist of Trustee deferred compensation, wash sale loss deferrals, post October loss deferrals and mark to market of passive foreign investment companies (PFICs).
Under the Regulated Investment Company Modernization Act of 2010 (the “Act”), net capital losses recognized by the Portfolio after December 31, 2010, may get carried forward indefinitely, and retain their character as short-term and/or long term losses. Prior to the Act, pre-enactment net capital losses incurred by the Portfolio were carried forward for eight years and treated as short-term losses. The Act requires that post-enactment net capital losses be used before pre-enactment net capital losses.
As of December 31, 2011, the Portfolio did not have post-enactment net capital loss carryforwards.
As of December 31, 2011, the Portfolio had the following pre-enactment net capital loss carryforwards, expiring during the years indicated, which are available to offset future realized gains:
| 2016 | 2017 | Total | ||||||||||
| $ | 3,531,122 | $ | 4,090,358 | * | $ | 7,621,480 | ||||||
| * | This amount includes $690,210 of capital loss carryforwards from business combinations, which may be limited in future years under the Internal Revenue Code Sections 381-384. |
During the year ended December 31, 2011, the Portfolio utilized capital loss carryforwards of $3,233,180.
Net capital losses incurred after October 31 and within the taxable year are deemed to arise on the first business day of the Portfolio’s next taxable year. For the year ended December 31, 2011, the Portfolio deferred to January 1, 2012 post-October short-term capital losses of $422,998.
6. Borrowings
The Trust and JPMCB have entered into a financing arrangement. Under this arrangement, JPMCB provides an unsecured, uncommitted credit facility in the aggregate amount of $100 million to certain of the J.P. Morgan Funds, including the Portfolio. Advances under the arrangement are taken primarily for temporary or emergency purposes, including the meeting of redemption requests that otherwise might require the untimely disposition of securities, and are subject to the Portfolio’s borrowing restrictions. Interest on borrowings is payable at a rate determined by JPMCB at the time of borrowing. This agreement has been extended until November 12, 2012.
The Portfolio had no borrowings outstanding from the unsecured, uncommitted credit facility at December 31, 2011, or at any time during the year then ended.
Interest expense paid, if any, as a result of borrowings from the unsecured, uncommitted credit facility is included in Interest expense to affiliates in the Statement of Operations.
7. Risks, Concentrations and Indemnifications
In the normal course of business, the Portfolio enters into contracts that contain a variety of representations which provide general indemnifications. The Portfolio’s maximum exposure under these arrangements is unknown, as this would involve future claims that may be made against the Portfolio that have not yet occurred. However, based on experience, the Portfolio expects the risk of loss to be remote.
From time to time, the Portfolio may have a concentration of several shareholders holding a significant percentage of shares outstanding. Investment activities of these shareholders could have a material impact on the Portfolio.
| 22 | JPMORGAN INSURANCE TRUST | DECEMBER 31, 2011 | ||||
Table of Contents
REPORT OF INDEPENDENT REGISTERED PUBLIC ACCOUNTING FIRM
To the Board of Trustees of JPMorgan Insurance Trust and Shareholders of JPMorgan Insurance Trust Small Cap Core Portfolio:
In our opinion, the accompanying statement of assets and liabilities, including the schedule of portfolio investments, and the related statements of operations and of changes in net assets and the financial highlights present fairly, in all material respects, the financial position of JPMorgan Insurance Trust Small Cap Core Portfolio (a separate Portfolio of JPMorgan Insurance Trust) (hereafter referred to as the “Portfolio”) at December 31, 2011, the results of its operations for the year then ended, the changes in its net assets for each of the two years in the period then ended and the financial highlights for each of the five years in the period then ended, in conformity with accounting principles generally accepted in the United States of America. These financial statements and financial highlights (hereafter referred to as “financial statements”) are the responsibility of the Portfolio’s management. Our responsibility is to express an opinion on these financial statements based on our audits. We conducted our audits of these financial statements in accordance with the standards of the Public Company Accounting Oversight Board (United States). Those standards require that we plan and perform the audit to obtain reasonable assurance about whether the financial statements are free of material misstatement. An audit includes examining, on a test basis, evidence supporting the amounts and disclosures in the financial statements, assessing the accounting principles used and significant estimates made by management, and evaluating the overall financial statement presentation. We believe that our audits, which included confirmation of securities at December 31, 2011 by correspondence with the custodian and brokers, provide a reasonable basis for our opinion.
PricewaterhouseCoopers LLP
New York, New York
February 23, 2012
| DECEMBER 31, 2011 | JPMORGAN INSURANCE TRUST | 23 | ||||||
Table of Contents
(Unaudited)
The Portfolio’s Statement of Additional Information includes additional information about the Portfolio’s Trustees and is available, without charge, upon request by calling 1-800-480-4111 or on the J.P. Morgan Funds’ website at www.jpmorganfunds.com.
Name (Year of Birth); Positions With the Portfolio (1) | Principal Occupations During Past 5 Years | Number of Complex Overseen by Trustee (2) | Other Directorships Held Outside Fund Complex During Past 5 Years | |||
Independent Trustees | ||||||
| William J. Armstrong (1941); Trustee of Trust since 2005; Trustee of heritage J.P. Morgan Funds since 1987. | Retired; CFO and Consultant, EduNeering, Inc. (internet business education supplier) (2000-2001); Vice President and Treasurer, Ingersoll-Rand Company (manufacturer of industrial equipment) (1972-2000). | 154 | None. | |||
| John F. Finn (1947); Trustee of Trust since 2005; Trustee of heritage One Group Mutual Funds since 1998. | Chairman (1985-present), President and Chief Executive Officer, Gardner, Inc. (supply chain management company serving industrial and consumer markets) (1974-present). | 154 | Director, Cardinal Health, Inc. (CAH) (1994-present); Director, Greif, Inc. (GEF) (industrial package products and services) (2007-present). | |||
| Dr. Matthew Goldstein (1941); Trustee of Trust since 2005; Trustee of heritage J.P. Morgan Funds since 2003. | Chancellor, City University of New York (1999-present); President, Adelphi University (New York) (1998-1999). | 154 | Director, New Plan Excel (NXL) (1999-2005); Director, National Financial Partners (NFP) (2003-2005); Director, Bronx-Lebanon Hospital Center; Director, United Way of New York City (2002-present). | |||
| Robert J. Higgins (1945); Trustee of Trust since 2005; Trustee of heritage J.P. Morgan Funds since 2002. | Retired; Director of Administration of the State of Rhode Island (2003-2004); President — Consumer Banking and Investment Services, Fleet Boston Financial (1971-2001). | 154 | None. | |||
| Peter C. Marshall (1942); Trustee of Trust since 2005; Trustee of heritage One Group Mutual Funds since 1985. | Self-employed business consultant (2002-present). | 154 | Director, Center for Communication, Hearing, and Deafness (1990-present). | |||
| Marilyn McCoy* (1948); Trustee of Trust since 2005; Trustee of heritage One Group Mutual Funds since 1999. | Vice President of Administration and Planning, Northwestern University (1985-present). | 154 | Trustee, Carleton College (2003-present). | |||
| William G. Morton, Jr. (1937); Trustee of Trust since 2005; Trustee of heritage J.P. Morgan Funds since 2003. | Retired; Chairman Emeritus (2001-2002), and Chairman and Chief Executive Officer, Boston Stock Exchange (1985-2001). | 154 | Director, Radio Shack Corp. (1987-2008); Trustee, Stratton Mountain School (2001-present). | |||
| Robert A. Oden, Jr. (1946); Trustee of Trust since 2005; Trustee of heritage One Group Mutual Funds since 1997. | Retired; President, Carleton College (2002-2010); President, Kenyon College (1995-2002). | 154 | Trustee, American University in Cairo (1999-present); Trustee, Carleton College (2002-2010). | |||
| Fergus Reid, III (1932); Trustee of Trust (Chairman) since 2005; Trustee (Chairman) of heritage J.P. Morgan Funds since 1987. | Chairman, Joe Pietryka, Inc. (formerly Lumelite Corporation) (plastics manufacturing) (2003-present); Chairman and Chief Executive Officer, Lumelite Corporation (1985-2002). | 154 | Trustee, Morgan Stanley Funds (105 portfolios) (1992-present). | |||
| 24 | JPMORGAN INSURANCE TRUST | DECEMBER 31, 2011 | ||||
Table of Contents
Name (Year of Birth); Positions With the Portfolio (1) | Principal Occupations During Past 5 Years | Number of Complex Overseen by Trustee (2) | Other Directorships Held Outside Fund Complex During Past 5 Years | |||
Independent Trustees (continued) | ||||||
| Frederick W. Ruebeck (1939); Trustee of Trust since 2005; Trustee of heritage One Group Mutual Funds since 1994. | Consultant (2000-present); Advisor, JP Greene & Associates, LLC (broker-dealer) (2000-2009); Chief Investment Officer, Wabash College (2004-present); Director of Investments, Eli Lilly and Company (pharmaceuticals) (1988-1999). | 154 | Trustee, Wabash College (1988-present); Chairman, Indianapolis Symphony Orchestra Foundation (1994-present). | |||
| James J. Schonbachler (1943); Trustee of Trust since 2005; Trustee of heritage J.P. Morgan Funds since 2001. | Retired; Managing Director of Bankers Trust Company (financial services) (1968-1998). | 154 | None. | |||
Interested Trustees | ||||||
| Frankie D. Hughes** (1952), Trustee of Trust since 2008. | President and Chief Investment Officer, Hughes Capital Management, Inc. (fixed income asset management) (1993-present). | 154 | Trustee, The Victory Portfolios (2000-2008). | |||
| Leonard M. Spalding, Jr.*** (1935); Trustee of Trust since 2005; Trustee of heritage J.P. Morgan Funds since 1998. | Retired; Chief Executive Officer, Chase Mutual Funds (investment company) (1989-1998); President and Chief Executive Officer, Vista Capital Management (investment management) (1990-1998); Chief Investment Executive, Chase Manhattan Private Bank (investment management) (1990-1998). | 154 | Director, Glenview Trust Company, LLC (2001-present); Trustee, St. Catharine College (1998-present); Trustee, Bellarmine University (2000-present); Director, Springfield-Washington County Economic Development Authority (1997-present); Trustee, Catholic Education Foundation (2005-present). | |||
| (1) | Each Trustee serves for an indefinite term, subject to the Trust’s current retirement policy, which is age 75 for all Trustees, except that the Board has determined Messrs. Reid and Spalding should continue to serve until December 31, 2012. |
| (2) | A Fund Complex means two or more registered investment companies that hold themselves out to investors as related companies for purposes of investment and investor services or have a common investment adviser or have an investment adviser that is an affiliated person of the investment adviser of any of the other registered investment companies. The J.P. Morgan Funds Complex for which the Board of Trustees serves currently includes eleven registered investment companies (154 funds). |
| * | Ms. McCoy has served as Vice President of Administration and Planning for Northwestern University since 1985. William M. Daley was the Head of Corporate Responsibility for JPMorgan Chase & Co. prior to January 2011 and served as a member of the Board of Trustees of Northwestern University from 2005 through 2010. JPMIM, the Funds’ investment advisor, is a wholly-owned subsidiary of JPMorgan Chase & Co. Three other members of the Board of Trustees of Northwestern University are executive officers of registered investment advisors (not affiliated with JPMorgan) that are under common control with subadvisors to certain J.P. Morgan Funds. |
| ** | Ms. Hughes is treated as an “interested person” based on the portfolio holdings of clients of Hughes Capital Management, Inc. |
| *** | Mr. Spalding is treated as an “interested person” due to his ownership of JPMorgan Chase stock. |
The contact address for each of the Trustees is 270 Park Avenue, New York, NY 10017.
| DECEMBER 31, 2011 | JPMORGAN INSURANCE TRUST | 25 | ||||||
Table of Contents
(Unaudited)
Name (Year of Birth), Positions Held with the Trust (Since) | Principal Occupations During Past 5 Years | |
Patricia A. Maleski (1960), | Managing Director, J.P. Morgan Investment Management Inc. and Chief Administrative Officer, J.P. Morgan Funds and Institutional Pooled Vehicles since 2010; previously, Treasurer and Principal Financial Officer of the Trusts from 2008 to 2010; previously, Head of Funds Administration and Board Liaison, J.P. Morgan Funds prior to 2010. Ms. Maleski has been with JPMorgan Chase & Co. since 2001. | |
| Joy C. Dowd (1972), Treasurer and Principal Financial Officer (2010) | Assistant Treasurer of the Trusts from 2009 to 2010; Executive Director, JPMorgan Funds Management, Inc. from February 2011; Vice President, JPMorgan Funds Management, Inc. from December 2008 to February 2011; prior to joining JPMorgan Chase, Ms. Dowd worked in MetLife’s investments audit group from 2005 through 2008. | |
| Frank J. Nasta (1964), Secretary (2008) | Managing Director and Associate General Counsel, JPMorgan Chase since 2008; Previously, Director, Managing Director, General Counsel and Corporate Secretary, J. & W. Seligman & Co. Incorporated; Secretary of each of the investment companies of the Seligman Group of Funds and Seligman Data Corp.; Director and Corporate Secretary, Seligman Advisors, Inc. and Seligman Services, Inc. | |
| Stephen M. Ungerman (1953), Chief Compliance Officer (2005) | Managing Director, JPMorgan Chase & Co.; Mr. Ungerman has been with JPMorgan Chase & Co. since 2000. | |
| Paul L. Gulinello (1950), AML Compliance Officer (2005) | Vice President and Anti Money Laundering Compliance Officer for JPMorgan Asset Management Americas, additionally responsible for privacy, personal trading and Code of Ethics compliance since 2004. Mr. Gulinello has been with JPMorgan Chase & Co. since 1972. | |
Elizabeth A. Davin (1964), Assistant Secretary (2005)* | Vice President and Assistant General Counsel, JPMorgan Chase since 2005; Senior Counsel, JPMorgan Chase (formerly Bank One Corporation) from 2004 to 2005. | |
| Jessica K. Ditullio (1962), Assistant Secretary (2005)* | Executive Director and Assistant General Counsel, JPMorgan Chase since February 2011; Ms. Ditullio has served as an attorney with various titles for JPMorgan Chase (formerly Bank One Corporation) since 1990. | |
| John T. Fitzgerald (1975), Assistant Secretary (2008) | Executive Director and Assistant General Counsel, JPMorgan Chase since February 2011; formerly, Vice President and Assistant General Counsel, JPMorgan Chase from 2005 until February 2011. | |
| Carmine Lekstutis (1980) Assistant Secretary (2011) | Vice President and Assistant General Counsel, JPMorgan Chase since 2011; Associate, Skadden, Arps, Slate, Meagher & Flom LLP (law firm) from 2006 to 2011. | |
| Gregory S. Samuels (1980) Assistant Secretary (2010) | Vice President and Assistant General Counsel, JPMorgan Chase since 2010; Associate, Ropes & Gray (law firm) from 2008 to 2010; Associate, Clifford Chance LLP (law firm) from 2005 to 2008. | |
| Brian L. Duncan (1965), Assistant Treasurer (2008)* | Vice President, JPMorgan Funds Management, Inc. since June 2007; prior to joining JPMorgan Chase, Mr. Duncan worked for Penn Treaty American Corporation as Vice President and Controller from 2004 through 2007. | |
| Jeffrey D. House (1972), Assistant Treasurer (2006)* | Vice President, JPMorgan Funds Management, Inc. since July 2006. | |
| Laura S. Melman (1966), Assistant Treasurer (2006) | Executive Director, JPMorgan Funds Management, Inc. since February 2011, responsible for Taxation; Vice President, JPMorgan Funds Management, Inc. from August 2006 to February 2011, responsible for Taxation. | |
| Joseph Parascondola (1963), Assistant Treasurer (2011) | Vice President, JPMorgan Funds Management, Inc. since August 2006. | |
| Matthew J. Plastina (1970), Assistant Treasurer (2011) | Vice President, JPMorgan Funds Management, Inc. since August 2010; prior to August 2010, Vice President and Controller, Legg Mason Global Asset Management. | |
| Jeffery Reedy (1973), Assistant Treasurer (2011)* | Vice President, JPMorgan Funds Management, Inc. since February 2006. | |
The contact address for each of the officers, unless otherwise noted, is 270 Park Avenue, New York, NY 10017.
| * | The contact address for the officer is 1111 Polaris Parkway, Columbus, OH 43240. |
| 26 | JPMORGAN INSURANCE TRUST | DECEMBER 31, 2011 | ||||
Table of Contents
SCHEDULE OF SHAREHOLDER EXPENSES
(Unaudited)
Hypothetical $1,000 Investment
As a shareholder of the Portfolio, you incur ongoing costs, including investment advisory fees, administration fees, distribution fees (for Class 2 shares) and other Portfolio expenses. Because the Portfolio is a funding vehicle for Policies and Eligible Plans, you may also incur sales charges and other fees relating to the Policies or Eligible Plans. The examples below are intended to help you understand your ongoing costs (in dollars) of investing in the Portfolio, but not the costs of the Policies or Eligible Plans, and to compare these ongoing costs with the ongoing costs of investing in other mutual funds. The examples assume that you had a $1,000 investment in the Class at the beginning of the reporting period, July 1, 2011, and continued to hold your shares at the end of the reporting period, December 31, 2011.
Actual Expenses
For each Class of the Portfolio in the table below, the first line provides information about actual account values and actual expenses. You may use the information in this line, together with the amount you invested, to estimate the expenses that you paid over the period. Simply divide your account value by $1,000 (for example, an $8,600 account value divided by $1,000 = 8.6), then multiply the result by the number in the first line of each Class under the heading entitled “Expenses Paid During” to estimate the expenses you paid on your account during this period.
Hypothetical Example for Comparison Purposes
The second line of each Class in the table below provides information about hypothetical account values and hypothetical expenses based on the Class’ actual expense ratio and an assumed rate of return of 5% per year before expenses, which is not the Class’ actual return. The hypothetical account values and expenses may not be used to estimate the actual ending account balance or expenses you paid for the period. You may use this information to compare the ongoing costs of investing in the Class of the Portfolio and other portfolios. To do so, compare this 5% hypothetical example with the 5% hypothetical examples that appear in the shareholder reports of the other funds. Please note that the expenses shown in the table are meant to highlight your ongoing costs only and do not reflect any transaction costs, such as sales charges (loads) or redemption fees or the costs associated with the Policies and Eligible Plans through which the Portfolio is held. Therefore, the second line for each Class in the table is useful in comparing ongoing costs only, and will not help you determine the relative total costs of owning different portfolios. In addition, if these transaction costs were included, your costs would have been higher. The examples also assume all dividends and distributions have been reinvested.
| Beginning Account Value, July 1, 2011 | Ending Account Value December 31, 2011 | Expenses Paid During July 1, 2011 to December 31, 2011* | Annualized Expense Ratio | |||||||||||||
Small Cap Core Portfolio | ||||||||||||||||
Class 1 | ||||||||||||||||
Actual | $ | 1,000.00 | $ | 881.00 | $ | 4.60 | 0.97 | % | ||||||||
Hypothetical | 1,000.00 | 1,020.32 | 4.94 | 0.97 | ||||||||||||
Class 2 | ||||||||||||||||
Actual | 1,000.00 | 880.00 | 5.78 | 1.22 | ||||||||||||
Hypothetical | 1,000.00 | 1,019.06 | 6.21 | 1.22 | ||||||||||||
| * | Expenses are equal to the Portfolio’s annualized expense ratio, multiplied by the average account value over the period, multiplied by 184/365 (to reflect the one-half year period). |
| DECEMBER 31, 2011 | JPMORGAN INSURANCE TRUST | 27 | ||||||
Table of Contents
BOARD APPROVAL OF INVESTMENT ADVISORY AGREEMENT
(Unaudited)
The Board of Trustees meets regularly throughout the year and considers factors that are relevant to its annual consideration of investment advisory agreements at each meeting. The Board of Trustees has established various standing committees, composed of Trustees with diverse backgrounds, to which the Board of Trustees has assigned specific subject matter responsibilities to further enhance the effectiveness of the Board’s oversight and decision making. The Board of Trustees and its investment subcommittees (money market and alternative products, equity, and fixed income) also meet for the specific purpose of considering advisory contract annual renewals. The Board of Trustees held meetings in person in June and August 2011, at which the Trustees considered the continuation of the investment advisory agreement for the Portfolio whose annual report is contained herein (the “Advisory Agreement”). At the June meeting, the Board’s investment subcommittees met to review and consider performance, expense and related information for the J.P. Morgan Funds. Each investment subcommittee reported to the full Board, which then considered the investment subcommittee’s preliminary findings. At the August meeting, the Trustees continued their review and consideration. The Trustees, including a majority of the Trustees who are not “interested persons” (as defined in the 1940 Act) of any party to the Advisory Agreement or any of their affiliates, approved the continuation of the Advisory Agreement on August 25, 2011.
The Trustees, as part of their review of the investment advisory arrangements for the J.P. Morgan Funds, considered and reviewed performance and other information received from the Advisor, on a regular basis over the course of the year, as well as information specifically prepared for their annual review. This information included the Portfolio’s performance compared to the performance of the Portfolio’s peers and benchmarks and analyses by the Advisor of the Portfolio’s performance. The Advisor also periodically provides comparative information regarding the Portfolio’s expense ratios and those of the peer groups. In addition, in preparation for the June and August meetings, the Trustees requested, received and evaluated extensive materials from the Advisor, including, with respect to certain J.P. Morgan Funds, performance and expense information compiled by Lipper Inc. (“Lipper”), an independent provider of investment company data. Prior to voting, the Trustees reviewed the proposed approval of the Advisory Agreement with representatives of the Advisor and with counsels to the Trust and independent Trustees and received a memorandum from independent counsel to the Trustees discussing the legal standards for their consideration of the proposed approval. The Trustees also discussed the proposed approvals in executive sessions with counsels to the Trust and independent Trustees at which no representatives of the Advisor were present. Set forth below is a summary of the material factors evaluated by the Trustees in determining whether to approve the Advisory Agreement.
In their deliberations, there was a comprehensive consideration of the information received by the Trustees. Each Trustee attributed different weights to the various factors and no factor alone was considered determinative. From year to year, the Trustees consider and place emphasis on relevant information in light of changing circumstances in market and economic conditions. The Trustees determined that the compensation to be received by the Advisor from the Portfolio under the Advisory Agreement was fair and reasonable and that the continuance of the investment advisory contract was in the best interests of the Portfolio and its shareholders.
The factors summarized below were considered and discussed by the Trustees in reaching their conclusions:
Nature, Extent and Quality of Services Provided by the Advisor
The Trustees received and considered information regarding the nature, extent and quality of the services provided to the Portfolio under the Advisory Agreement. The Trustees took into account information furnished throughout the year at Trustee meetings, as well as the materials furnished specifically in connection with this annual review process. The Trustees considered the background and experience of the Advisor’s senior management and the expertise of, and the amount of attention given to the Portfolio by, investment personnel of the Advisor. In addition, the Trustees reviewed the qualifications, backgrounds and responsibilities of the portfolio management team primarily responsible for the day-to-day management of the Portfolio and the infrastructure supporting the team. The Trustees also considered information provided by the Advisor and JPMorgan Distribution Services, Inc. (“JPMDS”) about the structure and distribution strategy of the Portfolio. The Trustees also reviewed information relating to the Advisor’s risk governance model and reports showing the Advisor’s compliance structure and ongoing compliance processes. The quality of the administrative services provided by JPMorgan Funds Management, Inc. (“JPMFM”), an affiliate of the Advisor, was also considered.
The Board of Trustees also considered its knowledge of the nature and quality of the services provided by the Advisor to the Portfolio gained from their experience as Trustees of the J.P. Morgan Funds. In addition, they considered the overall reputation and capabilities of the Advisor and its affiliates, the commitment of the Advisor to provide high quality service to the Portfolio, their overall confidence in the Advisor’s integrity and the Advisor’s responsiveness to questions or concerns raised by them, including the Advisor’s willingness to consider and implement organizational and operational changes designed to improve investment results and the services provided to the Portfolio.
Based on these considerations and other factors, the Trustees concluded that they were satisfied with the nature, extent and quality of the investment advisory services provided to the Portfolio by the Advisor.
| 28 | JPMORGAN INSURANCE TRUST | DECEMBER 31, 2011 | ||||
Table of Contents
Costs of Services Provided and Profitability to the Advisor and its Affiliates
The Trustees received and considered information regarding the profitability to the Advisor and its affiliates in providing services to the Portfolio. The Trustees reviewed and discussed this data. The Trustees recognized that this data is not audited and represents the Advisor’s determination of its and its affiliates’ revenues from the contractual services provided to the Portfolio, less expenses of providing such services. Expenses include direct and indirect costs and are calculated using an allocation methodology developed by the Advisor. The Trustees also recognized that it is difficult to make comparisons of profitability from fund investment advisory contracts because comparative information is not generally publicly available and is affected by numerous factors, including the structure of the particular adviser, the types of funds it manages, its business mix, numerous assumptions regarding allocations and the fact that publicly-traded fund managers’ operating profits and net income are net of distribution and marketing expenses. Based on their review, the Trustees concluded that the profitability to the Advisor under the Advisory Agreement was not unreasonable in light of the services and benefits provided to the Portfolio.
Fall-Out Benefits
The Trustees reviewed information regarding potential “fallout” or ancillary benefits received by the Advisor and its affiliates as a result of their relationship with the Portfolio. The Board also considered that the Advisor uses third-party soft dollar arrangements with respect to securities transactions it executes for the Portfolio.
The Trustees also considered that JPMFM earns fees from the Portfolio for providing administrative services. These fees were shown separately in the profitability analysis presented to the Trustees. The Trustees also considered the payments of Rule 12b-1 fees to JPMDS, an affiliate of the Advisor, which also acts as the Portfolio’s distributor and that these fees are in turn generally paid to financial intermediaries that sell the J.P. Morgan Funds, including financial intermediaries that are affiliates of the Advisor. The Trustees also considered the fees paid to JPMorgan Chase Bank, N.A. (“JPMCB”) for custody and fund accounting and other related services.
Economies of Scale
The Trustees noted that the proposed investment advisory fee schedule for the Portfolio does not contain breakpoints. The Trustees considered whether it would be appropriate to add advisory fee breakpoints and the Trustees concluded that the current fee structure was reasonable in light of the fee waivers and expense limitations that the Advisor has in place that serve to limit the overall net expense ratio at competitive levels. The Trustees also recognized that the fee schedule for the administrative services provided by JPMFM does include a fee breakpoint, which is tied to the overall level of non-money market
fund assets excluding certain funds-of-funds, as applicable, advised by the Advisor, and that the Portfolio benefits from that breakpoint. The Trustees concluded that shareholders benefited from the lower expense ratios which resulted from these factors.
Independent Written Evaluation of the Portfolio’s Chief Compliance Officer
The Trustees noted that, upon their direction, the Chief Compliance Officer for the Portfolio had prepared an independent written evaluation in order to assist the Trustees in determining the reasonableness of the proposed management fees. The Trustees considered the written evaluation in determining whether to continue the Advisory Agreement.
Fees Relative to Advisor’s Other Clients
The Trustees received and considered information about the nature and extent of investment advisory services and fee rates offered to other clients of the Advisor for investment management styles substantially similar to that of the Portfolio. The Trustees also considered the complexity of investment management for the Portfolio relative to the Advisor’s other clients and the differences in the nature and extent of the services provided to the different clients. The Trustees concluded that the fee rates charged to the Portfolio in comparison to those charged to the Advisor’s other clients were reasonable.
Investment Performance
The Trustees received and considered absolute and/or relative performance for the Portfolio in a report prepared by Lipper. The Trustees considered the total return performance information, which included the ranking of the Portfolio within a performance universe made up of funds with the same Lipper investment classification and objective (the “Universe Group”) by total return for applicable one-, three- and five-year periods. The Trustees reviewed a description of Lipper’s methodology for selecting mutual funds in the Portfolio’s Universe Group. The Lipper materials provided to the Trustees highlighted information with respect to a representative class to assist the Trustees in their review. As part of this review, the Trustees also reviewed the Portfolio’s performance against its benchmark and considered the performance information provided for the Portfolio at regular Board meetings by the Advisor. The Lipper performance data noted by the Trustees as part of their review and the determinations made by the Trustees with respect to the Portfolio’s performance are summarized below:
The Trustees noted the Portfolio’s performance was in the second, third and fourth quintiles for Class 1 shares for the one-, three-, and five-year periods ended December 31, 2010, respectively. The Trustees discussed the performance and investment strategy of the Portfolio with the Advisor and, based upon this discussion and other factors, concluded that the performance was reasonable.
| DECEMBER 31, 2011 | JPMORGAN INSURANCE TRUST | 29 | ||||||
Table of Contents
BOARD APPROVAL OF INVESTMENT ADVISORY AGREEMENT
(Unaudited) (continued)
Advisory Fees and Expense Ratios
The Trustees considered the contractual advisory fee rate paid by the Portfolio to the Advisor and compared that rate to the information prepared by Lipper concerning management fee rates paid by other funds in the same Lipper category as the Portfolio. The Trustees recognized that Lipper reported the Portfolio’s management fee rate as the combined contractual advisory fee and the administration fee rates. The Trustees considered the fee waiver and/or expense reimbursement arrangements currently in place for the Portfolio and considered the net advisory fee rate after taking into account any
waivers and/or reimbursements. The Trustees recognized that it is difficult to make comparisons of advisory fees because there are variations in the services that are included in the fees paid by other funds. The Trustees’ determinations as a result of the review of the Portfolio’s advisory fees and expense ratios are summarized below:
The Trustees noted that the Portfolio’s net advisory fee and actual total expenses for Class 1 shares were both in the second quintile of their Universe Group. After considering the factors identified above, in light of this information, the Trustees concluded that the advisory fees were reasonable.
| 30 | JPMORGAN INSURANCE TRUST | DECEMBER 31, 2011 | ||||
Table of Contents
(Unaudited)
Certain tax information for the Portfolio is required to be provided to shareholders based upon the Portfolio’s income and distributions for the taxable year ended December 31, 2011. The information and distributions reported in this letter may differ from the information and taxable distributions reported to the shareholders for the calendar year ending December 31, 2011. The information necessary to complete your income tax returns for the calendar year ending December 31, 2011 will be received under separate cover.
Dividends Received Deductions (DRD)
100.00% of ordinary income distributions were eligible for the 70% dividend received deduction for corporate rate shareholders for the fiscal year ended December 31, 2011.
| DECEMBER 31, 2011 | JPMORGAN INSURANCE TRUST | 31 | ||||||
Table of Contents
J.P. Morgan Funds are distributed by JPMorgan Distribution Services, Inc., which is an affiliate of JPMorgan Chase & Co. Affiliates of JPMorgan Chase & Co. receive fees for providing various services to the funds.
Contact JPMorgan Distribution Services, Inc. at 1-800-480-4111 for a portfolio prospectus. You can also visit us at www.jpmorganfunds.com. Investors should carefully consider the investment objectives and risk as well as charges and expenses of the mutual fund before investing. The prospectus contains this and other information about the mutual fund. Read the prospectus carefully before investing.
The Portfolio files a complete schedule of its portfolio holdings for the first and third quarters of its fiscal year with the SEC on Form N-Q. The Portfolio’s Forms N-Q are available on the SEC’s website at http://www.sec.gov and may be reviewed and copied at the SEC’s Public Reference Room in Washington, DC. Information on the operation of the SEC’s Public Reference Room may be obtained by calling 1-800-SEC-0330. Shareholders may request the Form N-Q without charge by calling 1-800-480-4111 or by visiting the variable insurance portfolio section of the J.P. Morgan Funds’ website at www.jpmorganfunds.com.
A description of the Portfolio’s policies and procedures with respect to the disclosure of the Portfolio’s holdings is available in the prospectus and Statement of Additional Information.
A copy of proxy policies and procedures is available without charge upon request by calling 1-800-480-4111 and a description of such policies and procedures is on the SEC’s website at www.sec.gov. The Trustees have delegated the authority to vote proxies for securities owned by the Portfolio to the Advisor. A copy of the Portfolio’s voting record for the most recent 12-month period ended June 30 is available on the SEC’s website at www.sec.gov or at the Portfolio’s website at www.jpmorganfunds.com no later than August 31 of each year. The Portfolio’s proxy voting record will include, among other things, a brief description of the matter voted on for each portfolio security, and will state how each vote was cast, for example, for or against the proposal.
Table of Contents
| © JPMorgan Chase & Co., 2012. All rights reserved. December 2011. | AN-JPMITSCCP-1211 |
Table of Contents
Annual Report
JPMorgan Insurance Trust
December 31, 2011
JPMorgan Insurance Trust U.S. Equity Portfolio
NOT FDIC INSURED Ÿ NO BANK GUARANTEE Ÿ MAY LOSE VALUE |  |
Table of Contents
Investments in the Portfolio are not bank deposits or obligations of, or guaranteed or endorsed by, any bank and are not insured or guaranteed by the FDIC, the Federal Reserve Board or any other government agency. You could lose money if you sell when the Portfolio’s share price is lower than when you invested.
Past performance is no guarantee for future performance. The general market views expressed in this report are opinions based on conditions through the end of the reporting period and are subject to change without notice based on market and other conditions. These views are not intended to predict the future performance of the Portfolio or the securities markets. References to specific securities and their issuers are for illustrative purposes only and are not intended to be, and should not be interpreted as, recommendations to purchase or sell such securities. Such views are not meant as investment advice and may not be relied on as an indication of trading intent on behalf of the Portfolio.
This Portfolio is intended to be a funding vehicle for variable annuity contracts and variable life insurance policies (collectively “Policies”) offered by separate accounts of participating insurance companies. Portfolio shares are also offered through qualified pension and retirement plans (“Eligible Plans”). Individuals may not purchase shares directly from the Portfolio.
Prospective investors should refer to the Portfolio’s prospectus for a discussion of the Portfolio’s investment objective, strategies and risks. Call J.P. Morgan Funds Service Center at 1-800-480-4111 for a prospectus containing more complete information about the Portfolio including management fees and other expenses. Please read it carefully before investing.
Table of Contents
January 25, 2012 (Unaudited)
Dear Shareholder:
Investors greeted 2011 in much the same way they welcomed 2010: with high hopes that an improving U.S. economy would finally get us back on course to recovery.
This optimism quickly faded as the European debt crisis and a host of other economic and geopolitical concerns cast a dark shadow on the prospects for future growth. The combination of weak global economic data, credit downgrades in the U.S. and in Europe, and escalating fears of contagion all resulted in a level of market volatility not seen since the financial crisis three years ago.
 |
“Investors greeted 2011 in much the same way they welcomed 2010: With high hopes that an improving U.S. economy would finally get us back on course to recovery.” |
Nonetheless, stocks have regained some of their footing, as positive fourth-quarter economic data on auto sales, payroll employment and manufacturing activity all appear to indicate that consumer confidence is improving and economic growth may be accelerating.
We remain cautious, however, since many of the same challenges that we experienced in 2011 — European debt concerns, uncertainty over monetary and fiscal stimulus, and soft economic data — will likely remain in place this year, laying the groundwork for continued market volatility.
Strong fourth quarter surge caps volatile year
The European debt crisis and other geopolitical and economic events created a generally volatile year for equities, culminating in major sell off in the third quarter. A strong fourth quarter comeback did little to reverse the losses, as the Standard & Poor’s 500 Index (“S&P500 Index”) ended the year with only slight gains. As of December 31, 2011, the Index had reached a level of 1,258, an increase of 2.1% from one year prior.
Large cap growth stocks lead style categories
Large cap stocks outpaced mid- and small-cap stocks over the 12-month period ended December 31, 2011 (the Russell 1000 Index returned 1.5% and the Russell Mid Cap Index returned -1.6%, compared to a return of -4.2% for the Russell 2000 Index). Overall, large-cap growth stocks fared better than large-cap value stocks as the Russell 1000 Growth Index returned 2.6% for the 12-month reporting period, compared to 0.4% for the Russell 1000 Value Index.
Euro zone uncertainty drives flight-to-quality sentiment
Investors’ lack of confidence in global economic growth prompted them to seek safe havens in U.S. Treasury securities, and high-quality corporate bonds. The Barclays Capital U.S. Aggregate Bond Index returned 7.8%. High yield bonds and emerging market debt securities also performed well, as the Barclays Capital High Yield Index returned 5.0%, and the Barclays Capital Emerging Markets Index returned 7.0% for the 12-month period ended December 31, 2011.
Similar economic concerns pushed yields of U.S. Treasury securities maturing in 10 years or more to historic lows throughout the year. As of the end of the 12-month period ended December 31, 2011, the yields on the benchmark 10-year U.S. Treasury bond dropped from 3.3% to 1.9%. In addition, yields on the 30-year U.S. Treasury bond declined from 4.3% to 2.9%, as did the two-year U.S. Treasury note, from 0.6% to 0.3%.
Lesson for 2012: Keep balance in mind in economic uncertainty
Last year offered its share of shocks to investors: geopolitical upheaval, natural disasters, sovereign-debt crises, and credit-rating downgrades were all among the events competing for the market’s attention. Against the backdrop of an election year, it’s likely that we will face continued global surprises — both on the upside and the downside.
As you reassess your investment strategy for the year ahead, it’s important to stick with a plan that focuses on diversification as well as long-term allocation. Trying to “time” market fluctuations can be risky business, especially given the ongoing uncertainty surrounding the direction of economic growth and the euro zone crisis in the months ahead.
On behalf of everyone at J.P. Morgan Asset Management, thank you for your continued confidence. We look forward to managing your investment needs for years to come. Should you have any questions, please visit www.jpmorganfunds.com or contact the J.P. Morgan Funds Service Center at 1-800-480-4111.
Sincerely yours,

George C.W. Gatch
CEO, Investment Management Americas
J.P. Morgan Asset Management
| DECEMBER 31, 2011 | JPMORGAN INSURANCE TRUST | 1 | ||||||
Table of Contents
JPMorgan Insurance Trust U.S. Equity Portfolio
TWELVE MONTHS ENDED DECEMBER 31, 2011 (Unaudited)
| REPORTING PERIOD RETURN: | ||||
| Portfolio (Class 1 Shares)* | -1.87% | |||
| S&P 500 Index | 2.11% | |||
| Net Assets as of 12/31/2011 | $77,924,404 | |||
INVESTMENT OBJECTIVE**
The JPMorgan Insurance Trust U.S. Equity Portfolio (the “Portfolio”) seeks to provide high total return from a portfolio of selected equity securities.
HOW DID THE MARKET PERFORM?
Strong corporate earnings and robust merger-and-acquisition activity encouraged investors and helped support U.S. stock prices during the beginning of the reporting period. However, uncertainty surrounding global economic growth began to dampen investors’ appetite for risk in April 2011. This negative mood among investors worsened as they seemed to lack confidence in the ability of European governments to combat the region’s debt crisis, stoking fear about economic contagion. Concerns about the credit downgrade of U.S.-issued debt exacerbated this negative sentiment among investors. Each of these factors helped trigger a sharp downturn in stock prices in the third quarter of 2011. Stocks rebounded in the fourth quarter of 2011 as better-than-expected economic data helped investors regain their appetite for risk. The S&P 500 Index (the “Benchmark”) finished the twelve months ended December 31, 2011 with a 2.11% gain.
WHAT WERE THE MAIN DRIVERS OF THE PORTFOLIO’S PERFORMANCE?
The Portfolio (Class 1 Shares) underperformed the Benchmark for the twelve months ended December 31, 2011. The Portfolio’s stock selection in the banks and brokers and basic materials sectors detracted from relative performance, while the Portfolio’s stock selection in the systems hardware and health services and system sectors contributed to relative performance.
Individual detractors from relative performance included the Portfolio’s positions in General Motors Co., Dendreon Corp. and
Goldman Sachs Group, Inc. Shares of car manufacturer General Motors Co. declined due to supply chain disruptions, weakness in Europe and concerns over slowing global growth. Shares of Goldman Sachs Group, Inc. declined on concerns about the financial services company’s declining revenue in its trading segment and uncertainty about potential federal regulation. Shares of Dendreon Corp., a biotechnology company, declined on news that sales of its prostate cancer drug Provenge® would fall short of expectations. The announcement of a class action lawsuit against the company also hurt the stock.
Individual contributors to relative performance included the Portfolio’s positions in Biogen Idec, Inc., Apple, Inc. and Norfolk Southern Corp. Shares of biotechnology and drugs company Biogen Idec, Inc. increased as strong revenue from its TYSABRI® and AVONEX® products boosted the company’s earnings. Shares of technology company Apple, Inc. rose as the company continued to show the ability to gain share in the growing mobility market through the strong sales of its iPhone and iPad. Shares of railroad operator Norfolk Southern Corp. increased after the company raised its dividend payout and reported strong earnings during the reporting period, boosted by the company’s coal operations and robust demand for freight rail transportation.
HOW WAS THE PORTFOLIO POSITIONED?
The portfolio managers employed a bottom-up fundamental approach to stock selection, rigorously researching companies to determine their underlying value and potential for future earnings growth. As a result of the Portfolio’s bottom-up fundamental approach to stock selection, the Portfolio had modest overweights versus the Benchmark in the auto and transportation and energy sectors. The Portfolio had modest underweights versus the Benchmark in the industrial cyclical and retail sectors.
| 2 | JPMORGAN INSURANCE TRUST | DECEMBER 31, 2011 | ||||
Table of Contents
| TOP TEN EQUITY HOLDINGS OF THE PORTFOLIO*** | ||||||||
| 1. | Apple, Inc. | 4.8 | % | |||||
| 2. | Merck & Co., Inc. | 3.1 | ||||||
| 3. | Wells Fargo & Co. | 2.6 | ||||||
| 4. | Microsoft Corp. | 2.5 | ||||||
| 5. | Schlumberger Ltd. | 2.5 | ||||||
| 6. | Time Warner, Inc. | 2.4 | ||||||
| 7. | Chevron Corp. | 2.2 | ||||||
| 8. | Occidental Petroleum Corp. | 2.1 | ||||||
| 9. | Procter & Gamble Co. (The) | 2.1 | ||||||
| 10. | Cisco Systems, Inc. | 1.9 | ||||||
PORTFOLIO COMPOSITION BY SECTOR*** | ||||
| Information Technology | 18.2 | % | ||
| Consumer Discretionary | 14.8 | |||
| Health Care | 13.6 | |||
| Energy | 12.7 | |||
| Financials | 12.2 | |||
| Industrials | 9.7 | |||
| Consumer Staples | 8.5 | |||
| Materials | 3.3 | |||
| Utilities | 3.1 | |||
| Telecommunication Services | 2.9 | |||
| Short-Term Investment | 1.0 | |||
| * | The return shown is based on net asset value calculated for shareholder transactions and may differ from the return shown in the financial highlights, which reflects adjustments made to the net asset value in accordance with accounting principles generally accepted in the United States of America. |
| ** | The advisor seeks to achieve the Portfolio’s objective. There can be no guarantee it will be achieved. |
| *** | Percentages indicated are based upon total investments as of December 31, 2011. The Portfolio’s composition is subject to change. |
| DECEMBER 31, 2011 | JPMORGAN INSURANCE TRUST | 3 | ||||||
Table of Contents
JPMorgan Insurance Trust U.S. Equity Portfolio
PORTFOLIO COMMENTARY
TWELVE MONTHS ENDED DECEMBER 31, 2011 (Unaudited) (continued)
AVERAGE ANNUAL TOTAL RETURNS AS OF DECEMBER 31, 2011 | ||||||||||||||||
| INCEPTION DATE OF CLASS | 1 YEAR | 5 YEAR | 10 YEAR | |||||||||||||
CLASS 1 SHARES | 3/30/95 | (1.87 | )% | 1.42 | % | 2.74 | % | |||||||||
CLASS 2 SHARES | 8/16/06 | (2.09 | ) | 1.17 | 2.60 | |||||||||||
TEN YEAR PERFORMANCE (12/31/01 TO 12/31/11)
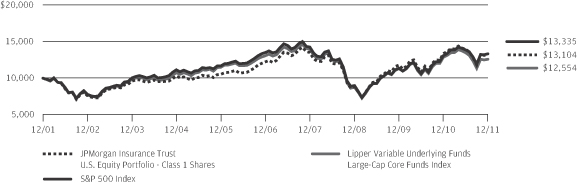
Source: Lipper, Inc. The performance quoted is past performance and is not a guarantee of future results. Mutual funds are subject to certain market risks. Investment returns and principal value of an investment will fluctuate so that an investor’s shares, when redeemed, may be worth more or less than their original cost. Current performance may be higher or lower than the performance data shown. For up-to-date month-end performance information please call 1-800-480-4111. Effective November 1, 2006, the Portfolio’s investment objective and strategies changed. Although past performance is not necessarily an indication of how the Portfolio will perform in the future, in view of these changes, the Portfolio’s performance record prior to this period might be less relevant for investors considering whether to purchase shares of the Portfolio.
Returns for the Class 2 Shares prior to their inception date are based on the performance of Class 1 Shares. The actual returns of Class 2 Shares would have been lower than shown because Class 2 Shares have higher expenses than Class 1 Shares.
The graph illustrates comparative performance for $10,000 invested in Class 1 Shares of the JPMorgan Insurance Trust U.S. Equity Portfolio, the S&P 500 Index and the Lipper Variable Underlying Funds Large-Cap Core Funds Index from December 31, 2001 to December 31, 2011. The performance of the Portfolio assumes reinvestment of all dividends and capital gains, if any. The
performance of the S&P 500 Index does not reflect the deduction of expenses associated with a mutual fund and has been adjusted to reflect reinvestment of all dividends and capital gains of the securities included in the benchmark. The performance of the Lipper Variable Underlying Funds Large-Cap Core Funds Index includes expenses associated with a mutual fund, such as investment management fees. These expenses are not identical to the expenses charged by the Portfolio. The S&P 500 Index is an unmanaged index generally representative of the performance of large companies in the U.S. stock market. The Lipper Variable Underlying Funds Large-Cap Core Funds Index is an index based on the total returns of certain mutual funds within the Portfolio’s designated category as determined by Lipper, Inc. Investors cannot invest directly in an index.
The performance does not reflect any charges imposed by the Policies or Eligible Plans. If these charges were included, the returns would be lower than shown. Performance may reflect the waiver of the Portfolio’s fees and reimbursement of expenses for certain periods since the inception date. Without these waivers and reimbursements performance would have been lower.
The returns shown are based on net asset values calculated for shareholder transactions and may differ from the returns shown in the financial highlights, which reflect adjustments made to the net asset values in accordance with accounting principles generally accepted in the United States of America.
| 4 | JPMORGAN INSURANCE TRUST | DECEMBER 31, 2011 | ||||
Table of Contents
JPMorgan Insurance Trust U.S. Equity Portfolio
SCHEDULE OF PORTFOLIO INVESTMENTS
AS OF DECEMBER 31, 2011
| SHARES | SECURITY DESCRIPTION | VALUE($) | ||||||
| Common Stocks — 98.0% |
| ||||||
Consumer Discretionary — 14.7% |
| |||||||
Auto Components — 1.5% |
| |||||||
| 36,211 | Johnson Controls, Inc. | 1,131,956 | ||||||
|
| |||||||
Automobiles — 1.0% |
| |||||||
| 39,100 | General Motors Co. (a) | 792,557 | ||||||
|
| |||||||
Hotels, Restaurants & Leisure — 1.8% |
| |||||||
| 17,890 | Carnival Corp. | 583,930 | ||||||
| 3,080 | Darden Restaurants, Inc. | 140,386 | ||||||
| 3,880 | Marriott International, Inc., Class A | 113,180 | ||||||
| 9,942 | Yum! Brands, Inc. | 586,677 | ||||||
|
| |||||||
| 1,424,173 | ||||||||
|
| |||||||
Household Durables — 0.6% |
| |||||||
| 8,310 | D.R. Horton, Inc. | 104,789 | ||||||
| 6,200 | Lennar Corp., Class A | 121,830 | ||||||
| 310 | NVR, Inc. (a) | 212,660 | ||||||
| 3,060 | Ryland Group, Inc. (The) | 48,226 | ||||||
|
| |||||||
| 487,505 | ||||||||
|
| |||||||
Internet & Catalog Retail — 1.4% |
| |||||||
| 6,180 | Amazon.com, Inc. (a) | 1,069,758 | ||||||
|
| |||||||
Media — 4.4% |
| |||||||
| 23,640 | CBS Corp. (Non-Voting), Class B | 641,589 | ||||||
| 37,870 | Comcast Corp., Class A | 897,898 | ||||||
| 52,085 | Time Warner, Inc. | 1,882,352 | ||||||
|
| |||||||
| 3,421,839 | ||||||||
|
| |||||||
Multiline Retail — 0.7% |
| |||||||
| 2,653 | Kohl’s Corp. | 130,926 | ||||||
| 7,700 | Target Corp. | 394,394 | ||||||
|
| |||||||
| 525,320 | ||||||||
|
| |||||||
Specialty Retail — 2.0% |
| |||||||
| 1,500 | AutoZone, Inc. (a) | 487,455 | ||||||
| 13,380 | Home Depot, Inc. (The) | 562,495 | ||||||
| 15,660 | Lowe’s Cos., Inc. | 397,451 | ||||||
| 1,770 | TJX Cos., Inc. | 114,253 | ||||||
|
| |||||||
| 1,561,654 | ||||||||
|
| |||||||
Textiles, Apparel & Luxury Goods — 1.3% |
| |||||||
| 1,720 | Coach, Inc. | 104,989 | ||||||
| 6,250 | NIKE, Inc., Class B | 602,312 | ||||||
| 2,600 | V.F. Corp. | 330,174 | ||||||
|
| |||||||
| 1,037,475 | ||||||||
|
| |||||||
Total Consumer Discretionary | 11,452,237 | |||||||
|
| |||||||
Consumer Staples — 8.4% |
| |||||||
Beverages — 2.0% |
| |||||||
| 19,920 | Coca-Cola Co. (The) | 1,393,802 | ||||||
| SHARES | SECURITY DESCRIPTION | VALUE($) | ||||||
Beverages — Continued |
| |||||||
| 2,820 | PepsiCo, Inc. | 187,107 | ||||||
|
| |||||||
| 1,580,909 | ||||||||
|
| |||||||
Food & Staples Retailing — 0.6% |
| |||||||
| 9,099 | CVS Caremark Corp. | 371,057 | ||||||
| 1,330 | Wal-Mart Stores, Inc. | 79,481 | ||||||
|
| |||||||
| 450,538 | ||||||||
|
| |||||||
Food Products — 2.4% |
| |||||||
| 10,020 | Campbell Soup Co. | 333,065 | ||||||
| 11,568 | General Mills, Inc. | 467,463 | ||||||
| 28,430 | Kraft Foods, Inc., Class A | 1,062,145 | ||||||
|
| |||||||
| 1,862,673 | ||||||||
|
| |||||||
Household Products — 2.7% |
| |||||||
| 5,150 | Colgate-Palmolive Co. | 475,808 | ||||||
| 24,387 | Procter & Gamble Co. (The) | 1,626,857 | ||||||
|
| |||||||
| 2,102,665 | ||||||||
|
| |||||||
Tobacco — 0.7% |
| |||||||
| 7,260 | Philip Morris International, Inc. | 569,765 | ||||||
|
| |||||||
Total Consumer Staples | 6,566,550 | |||||||
|
| |||||||
Energy — 12.6% |
| |||||||
Energy Equipment & Services — 3.5% |
| |||||||
| 7,370 | Baker Hughes, Inc. | 358,477 | ||||||
| 2,390 | Cameron International Corp. (a) | 117,564 | ||||||
| 7,750 | Halliburton Co. | 267,453 | ||||||
| 980 | National Oilwell Varco, Inc. | 66,630 | ||||||
| 28,198 | Schlumberger Ltd. | 1,926,205 | ||||||
|
| |||||||
| 2,736,329 | ||||||||
|
| |||||||
Oil, Gas & Consumable Fuels — 9.1% |
| |||||||
| 4,540 | Anadarko Petroleum Corp. | 346,538 | ||||||
| 1,468 | Apache Corp. | 132,972 | ||||||
| 16,250 | Chevron Corp. | 1,729,000 | ||||||
| 9,670 | ConocoPhillips | 704,653 | ||||||
| 3,017 | Devon Energy Corp. | 187,054 | ||||||
| 4,910 | EOG Resources, Inc. | 483,684 | ||||||
| 15,445 | Exxon Mobil Corp. | 1,309,118 | ||||||
| 1,620 | Hess Corp. | 92,016 | ||||||
| 2,600 | Marathon Petroleum Corp. | 86,554 | ||||||
| 17,642 | Occidental Petroleum Corp. | 1,653,056 | ||||||
| 740 | Pioneer Natural Resources Co. | 66,215 | ||||||
| 3,830 | Southwestern Energy Co. (a) | 122,330 | ||||||
| 5,610 | Williams Cos., Inc. (The) | 185,242 | ||||||
|
| |||||||
| 7,098,432 | ||||||||
|
| |||||||
Total Energy | 9,834,761 | |||||||
|
| |||||||
SEE NOTES TO FINANCIAL STATEMENTS.
| DECEMBER 31, 2011 | JPMORGAN INSURANCE TRUST | 5 | ||||||
Table of Contents
JPMorgan Insurance Trust U.S. Equity Portfolio
SCHEDULE OF PORTFOLIO INVESTMENTS
AS OF DECEMBER 31, 2011 (continued)
| SHARES | SECURITY DESCRIPTION | VALUE($) | ||||||
| Common Stocks — Continued |
| ||||||
Financials — 12.0% |
| |||||||
Capital Markets — 2.3% |
| |||||||
| 3,050 | Ameriprise Financial, Inc. | 151,402 | ||||||
| 7,106 | Goldman Sachs Group, Inc. (The) | 642,596 | ||||||
| 17,250 | Invesco Ltd. | 346,552 | ||||||
| 19,591 | Morgan Stanley | 296,412 | ||||||
| 4,020 | State Street Corp. | 162,046 | ||||||
| 12,445 | TD Ameritrade Holding Corp. | 194,764 | ||||||
|
| |||||||
| 1,793,772 | ||||||||
|
| |||||||
Commercial Banks — 3.3% |
| |||||||
| 3,990 | Huntington Bancshares, Inc. | 21,905 | ||||||
| 6,530 | Regions Financial Corp. | 28,079 | ||||||
| 6,640 | SunTrust Banks, Inc. | 117,528 | ||||||
| 14,182 | U.S. Bancorp | 383,623 | ||||||
| 72,203 | Wells Fargo & Co. | 1,989,915 | ||||||
| 1,620 | Zions Bancorp | 26,373 | ||||||
|
| |||||||
| 2,567,423 | ||||||||
|
| |||||||
Consumer Finance — 0.6% |
| |||||||
| 3,400 | American Express Co. | 160,378 | ||||||
| 8,260 | Capital One Financial Corp. | 349,315 | ||||||
|
| |||||||
| 509,693 | ||||||||
|
| |||||||
Diversified Financial Services — 2.3% |
| |||||||
| 96,469 | Bank of America Corp. | 536,368 | ||||||
| 29,984 | Citigroup, Inc. | 788,879 | ||||||
| 1,217 | CME Group, Inc. | 296,546 | ||||||
| 1,490 | IntercontinentalExchange, Inc. (a) | 179,620 | ||||||
|
| |||||||
| 1,801,413 | ||||||||
|
| |||||||
Insurance — 3.3% |
| |||||||
| 6,728 | ACE Ltd., (Switzerland) | 471,767 | ||||||
| 8,180 | Allstate Corp. (The) | 224,214 | ||||||
| 3,240 | Axis Capital Holdings Ltd., (Bermuda) | 103,551 | ||||||
| 1,150 | Everest Re Group Ltd., (Bermuda) | 96,704 | ||||||
| 2,790 | First American Financial Corp. | 35,349 | ||||||
| 860 | Hartford Financial Services Group, Inc. | 13,975 | ||||||
| 21,990 | MetLife, Inc. | 685,648 | ||||||
| 12,044 | Prudential Financial, Inc. | 603,645 | ||||||
| 2,048 | RenaissanceRe Holdings Ltd., (Bermuda) | 152,310 | ||||||
| 9,970 | XL Group plc, (Ireland) | 197,107 | ||||||
|
| |||||||
| 2,584,270 | ||||||||
|
| |||||||
Real Estate Investment Trusts (REITs) — 0.2% |
| |||||||
| 1,660 | Vornado Realty Trust | 127,588 | ||||||
|
| |||||||
Total Financials | 9,384,159 | |||||||
|
| |||||||
| SHARES | SECURITY DESCRIPTION | VALUE($) | ||||||
Health Care — 13.4% |
| |||||||
Biotechnology — 2.1% |
| |||||||
| 6,950 | Biogen Idec, Inc. (a) | 764,848 | ||||||
| 10,289 | Celgene Corp. (a) | 695,536 | ||||||
| 4,450 | Vertex Pharmaceuticals, Inc. (a) | 147,784 | ||||||
|
| |||||||
| 1,608,168 | ||||||||
|
| |||||||
Health Care Equipment & Supplies — 1.2% |
| |||||||
| 3,650 | Becton, Dickinson & Co. | 272,728 | ||||||
| 14,969 | Covidien plc, (Ireland) | 673,755 | ||||||
|
| |||||||
| 946,483 | ||||||||
|
| |||||||
Health Care Providers & Services — 3.8% |
| |||||||
| 750 | Aetna, Inc. | 31,643 | ||||||
| 11,230 | Cardinal Health, Inc. | 456,050 | ||||||
| 6,470 | Express Scripts, Inc. (a) | 289,144 | ||||||
| 8,040 | Humana, Inc. | 704,385 | ||||||
| 5,520 | McKesson Corp. | 430,063 | ||||||
| 21,500 | UnitedHealth Group, Inc. | 1,089,620 | ||||||
|
| |||||||
| 3,000,905 | ||||||||
|
| |||||||
Pharmaceuticals — 6.3% |
| |||||||
| 7,932 | Abbott Laboratories | 446,016 | ||||||
| 2,920 | Allergan, Inc. | 256,201 | ||||||
| 7,640 | Johnson & Johnson | 501,031 | ||||||
| 63,792 | Merck & Co., Inc. | 2,404,958 | ||||||
| 2,700 | Mylan, Inc. (a) | 57,942 | ||||||
| 54,732 | Pfizer, Inc. | 1,184,401 | ||||||
| 1,270 | Teva Pharmaceutical Industries Ltd., | 51,257 | ||||||
|
| |||||||
| 4,901,806 | ||||||||
|
| |||||||
Total Health Care | 10,457,362 | |||||||
|
| |||||||
Industrials — 9.6% |
| |||||||
Aerospace & Defense — 2.8% |
| |||||||
| 13,190 | Honeywell International, Inc. | 716,877 | ||||||
| 20,125 | United Technologies Corp. | 1,470,936 | ||||||
|
| |||||||
| 2,187,813 | ||||||||
|
| |||||||
Building Products — 0.1% |
| |||||||
| 6,140 | Masco Corp. | 64,347 | ||||||
|
| |||||||
Construction & Engineering — 0.5% |
| |||||||
| 7,750 | Fluor Corp. | 389,438 | ||||||
|
| |||||||
Electrical Equipment — 1.1% |
| |||||||
| 18,638 | Emerson Electric Co. | 868,344 | ||||||
|
| |||||||
Industrial Conglomerates — 2.5% |
| |||||||
| 6,910 | 3M Co. | 564,754 | ||||||
| 42,810 | General Electric Co. | 766,727 | ||||||
SEE NOTES TO FINANCIAL STATEMENTS.
| 6 | JPMORGAN INSURANCE TRUST | DECEMBER 31, 2011 | ||||
Table of Contents
| SHARES | SECURITY DESCRIPTION | VALUE($) | ||||||
| Common Stocks — Continued |
| ||||||
Industrial Conglomerates — Continued |
| |||||||
| 12,870 | Tyco International Ltd., (Switzerland) | 601,158 | ||||||
|
| |||||||
| 1,932,639 | ||||||||
|
| |||||||
Machinery — 0.8% | ||||||||
| 16,483 | PACCAR, Inc. | 617,618 | ||||||
|
| |||||||
Road & Rail — 1.8% | ||||||||
| 13,460 | CSX Corp. | 283,468 | ||||||
| 12,268 | Norfolk Southern Corp. | 893,846 | ||||||
| 1,950 | Union Pacific Corp. | 206,583 | ||||||
|
| |||||||
| 1,383,897 | ||||||||
|
| |||||||
Total Industrials | 7,444,096 | |||||||
|
| |||||||
Information Technology — 18.0% | ||||||||
Communications Equipment — 3.2% | ||||||||
| 82,633 | Cisco Systems, Inc. | 1,494,005 | ||||||
| 6,603 | Juniper Networks, Inc. (a) | 134,767 | ||||||
| 15,464 | QUALCOMM, Inc. | 845,881 | ||||||
|
| |||||||
| 2,474,653 | ||||||||
|
| |||||||
Computers & Peripherals — 5.4% | ||||||||
| 9,108 | Apple, Inc. (a) | 3,688,740 | ||||||
| 14,190 | EMC Corp. (a) | 305,652 | ||||||
| 200 | Hewlett-Packard Co. | 5,152 | ||||||
| 4,940 | NetApp, Inc. (a) | 179,174 | ||||||
| 1,210 | SanDisk Corp. (a) | 59,544 | ||||||
|
| |||||||
| 4,238,262 | ||||||||
|
| |||||||
Electronic Equipment, Instruments & Components — 0.1% |
| |||||||
| 1,820 | TE Connectivity Ltd., (Switzerland) | 56,074 | ||||||
|
| |||||||
Internet Software & Services — 0.7% | ||||||||
| 872 | Google, Inc., Class A (a) | 563,225 | ||||||
|
| |||||||
IT Services — 1.8% | ||||||||
| 8,010 | Cognizant Technology Solutions Corp., Class A (a) | 515,123 | ||||||
| 3,580 | Genpact Ltd., (Bermuda) (a) | 53,521 | ||||||
| 2,211 | International Business Machines Corp. | 406,559 | ||||||
| 1,260 | MasterCard, Inc., Class A | 469,753 | ||||||
|
| |||||||
| 1,444,956 | ||||||||
|
| |||||||
Semiconductors & Semiconductor Equipment — 2.2% |
| |||||||
| 9,890 | Altera Corp. | 366,919 | ||||||
| 7,320 | Broadcom Corp., Class A (a) | 214,915 | ||||||
| 8,860 | Freescale Semiconductor Holdings I Ltd. (a) | 112,079 | ||||||
| 8,420 | Lam Research Corp. (a) | 311,709 | ||||||
| 1,100 | Novellus Systems, Inc. (a) | 45,419 | ||||||
| 20,719 | Xilinx, Inc. | 664,251 | ||||||
|
| |||||||
| 1,715,292 | ||||||||
|
| |||||||
| SHARES | SECURITY DESCRIPTION | VALUE($) | ||||||
Software — 4.6% | ||||||||
| 3,370 | Adobe Systems, Inc. (a) | 95,270 | ||||||
| 1,710 | Citrix Systems, Inc. (a) | 103,831 | ||||||
| 1,440 | MICROS Systems, Inc. (a) | 67,075 | ||||||
| 74,753 | Microsoft Corp. | 1,940,588 | ||||||
| 50,450 | Oracle Corp. | 1,294,043 | ||||||
| 5,500 | Zynga, Inc., Class A (a) | 51,755 | ||||||
|
| |||||||
| 3,552,562 | ||||||||
|
| |||||||
Total Information Technology | 14,045,024 | |||||||
|
| |||||||
Materials — 3.3% | ||||||||
Chemicals — 2.2% | ||||||||
| 7,900 | Air Products & Chemicals, Inc. | 673,001 | ||||||
| 13,820 | E.I. du Pont de Nemours & Co. | 632,680 | ||||||
| 5,674 | Georgia Gulf Corp. (a) | 110,586 | ||||||
| 3,910 | Monsanto Co. | 273,974 | ||||||
|
| |||||||
| 1,690,241 | ||||||||
|
| |||||||
Containers & Packaging — 0.1% | ||||||||
| 3,130 | Crown Holdings, Inc. (a) | 105,105 | ||||||
|
| |||||||
Metals & Mining — 0.9% | ||||||||
| 4,100 | Alcoa, Inc. | 35,465 | ||||||
| 16,910 | Freeport-McMoRan Copper & Gold, Inc. | 622,119 | ||||||
|
| |||||||
| 657,584 | ||||||||
|
| |||||||
Paper & Forest Products — 0.1% | ||||||||
| 3,030 | International Paper Co. | 89,688 | ||||||
|
| |||||||
Total Materials | 2,542,618 | |||||||
|
| |||||||
Telecommunication Services — 2.9% | ||||||||
Diversified Telecommunication Services — 2.8% |
| |||||||
| 27,870 | AT&T, Inc. | 842,789 | ||||||
| 33,353 | Verizon Communications, Inc. | 1,338,122 | ||||||
|
| |||||||
| 2,180,911 | ||||||||
|
| |||||||
Wireless Telecommunication Services — 0.1% |
| |||||||
| 15,600 | Sprint Nextel Corp. (a) | 36,504 | ||||||
|
| |||||||
Total Telecommunication Services | 2,217,415 | |||||||
|
| |||||||
Utilities — 3.1% | ||||||||
Electric Utilities — 1.9% | ||||||||
| 5,690 | American Electric Power Co., Inc. | 235,054 | ||||||
| 4,530 | Exelon Corp. | 196,466 | ||||||
| 8,870 | NextEra Energy, Inc. | 540,006 | ||||||
| 7,180 | Northeast Utilities | 258,982 | ||||||
| 7,580 | PPL Corp. | 223,003 | ||||||
|
| |||||||
| 1,453,511 | ||||||||
|
| |||||||
SEE NOTES TO FINANCIAL STATEMENTS.
| DECEMBER 31, 2011 | JPMORGAN INSURANCE TRUST | 7 | ||||||
Table of Contents
JPMorgan Insurance Trust U.S. Equity Portfolio
SCHEDULE OF PORTFOLIO INVESTMENTS
AS OF DECEMBER 31, 2011 (continued)
| SHARES | SECURITY DESCRIPTION | VALUE($) | ||||||
| Common Stocks — Continued | |||||||
Gas Utilities — 0.2% |
| |||||||
| 4,630 | AGL Resources, Inc. | 195,664 | ||||||
|
| |||||||
Multi-Utilities — 1.0% |
| |||||||
| 2,390 | CenterPoint Energy, Inc. | 48,015 | ||||||
| 5,520 | Dominion Resources, Inc. | 293,002 | ||||||
| 3,990 | DTE Energy Co. | 217,255 | ||||||
| 2,140 | PG&E Corp. | 88,211 | ||||||
| 2,290 | Public Service Enterprise Group, Inc. | 75,593 | ||||||
| 901 | Sempra Energy | 49,555 | ||||||
|
| |||||||
| 771,631 | ||||||||
|
| |||||||
Total Utilities | 2,420,806 | |||||||
|
| |||||||
Total Common Stocks | 76,365,028 | |||||||
|
| |||||||
| SHARES | SECURITY DESCRIPTION | VALUE($) | ||||||
| Short-Term Investment — 1.0% |
| ||||||
Investment Company — 1.0% |
| |||||||
| 804,854 | JPMorgan Liquid Assets Money Market Fund, Institutional Class Shares, | 804,854 | ||||||
|
| |||||||
Total Investments — 99.0% | 77,169,882 | |||||||
Other Assets in Excess of | 754,522 | |||||||
|
| |||||||
NET ASSETS — 100.0% | $ | 77,924,404 | ||||||
|
| |||||||
Percentages indicated are based on net assets.
| Futures Contracts | ||||||||||||||||
| NUMBER OF CONTRACTS | DESCRIPTION | EXPIRATION DATE | NOTIONAL VALUE AT 12/31/11 | UNREALIZED APPRECIATION (DEPRECIATION) | ||||||||||||
Long Futures Outstanding | ||||||||||||||||
| 7 | E-mini S&P 500 | 03/16/12 | $ | 438,410 | $ | 1,507 | ||||||||||
|
| |||||||||||||||
NOTES TO SCHEDULE OF PORTFOLIO INVESTMENTS:
| ADR | — American Depositary Receipt | |
| (a) | — Non-income producing security | |
| (b) | — Investment in affiliate. Money market fund registered under the Investment Company Act of 1940, as amended, and advised by J.P. Morgan Investment Management Inc. | |
| (l) | — The rate shown is the current yield as of December 31, 2011. |
| (m) | — All or a portion of this security is reserved and/or pledged with the custodian for current or potential holdings of futures, swaps, options, TBAs, when-issued securities, delayed delivery securities, reverse repurchase agreements, unfunded commitments, and/or forward foreign currency exchange contracts. |
SEE NOTES TO FINANCIAL STATEMENTS.
| 8 | JPMORGAN INSURANCE TRUST | DECEMBER 31, 2011 | ||||
Table of Contents
STATEMENT OF ASSETS AND LIABILITIES
AS OF DECEMBER 31, 2011
| U.S. Equity Portfolio | ||||
ASSETS: | ||||
Investments in non-affiliates, at value | $ | 76,365,028 | ||
Investments in affiliates, at value | 804,854 | |||
|
| |||
Total investment securities, at value | 77,169,882 | |||
Deposits at broker for futures contracts | 45,000 | |||
Receivables: | ||||
Investment securities sold | 829,721 | |||
Portfolio shares sold | 1,795 | |||
Dividends from non-affiliates | 122,365 | |||
Dividends from affiliates | 123 | |||
|
| |||
Total Assets | 78,168,886 | |||
|
| |||
LIABILITIES: | ||||
Payables: | ||||
Due to custodian | 44 | |||
Investment securities purchased | 76,998 | |||
Portfolio shares redeemed | 56,096 | |||
Variation margin on futures contracts | 1,680 | |||
Accrued liabilities: | ||||
Investment advisory fees | 35,126 | |||
Administration fees | 5,861 | |||
Distribution fees | 12 | |||
Custodian and accounting fees | 12,083 | |||
Trustees’ and Chief Compliance Officer’s fees | 151 | |||
Printing and Postage fees | 31,710 | |||
Audit fees | 21,909 | |||
Other | 2,812 | |||
|
| |||
Total Liabilities | 244,482 | |||
|
| |||
Net Assets | $ | 77,924,404 | ||
|
| |||
NET ASSETS: | ||||
Paid in capital | $ | 105,733,490 | ||
Accumulated undistributed net investment income (loss) | 1,183,857 | |||
Accumulated net realized gains (losses) | (32,441,730 | ) | ||
Net unrealized appreciation (depreciation) | 3,448,787 | |||
|
| |||
Total Net Assets | $ | 77,924,404 | ||
|
| |||
Net Assets: | ||||
Class 1 | $ | 77,847,972 | ||
Class 2 | 76,432 | |||
|
| |||
Total | $ | 77,924,404 | ||
|
| |||
Outstanding units of beneficial interest (shares) | ||||
(unlimited number of shares authorized, no par value): | ||||
Class 1 | 5,114,142 | |||
Class 2 | 5,036 | |||
Net Asset Value, offering and redemption price per share (a) | ||||
Class 1 | $ | 15.22 | ||
Class 2 | 15.18 | |||
|
| |||
Cost of investments in non-affiliates | $ | 72,917,748 | ||
Cost of investments in affiliates | 804,854 | |||
| (a) | Per share amounts may not recalculate due to rounding of net assets and/or shares outstanding. |
SEE NOTES TO FINANCIAL STATEMENTS.
| DECEMBER 31, 2011 | JPMORGAN INSURANCE TRUST | 9 | ||||||
Table of Contents
STATEMENT OF OPERATIONS
FOR THE YEAR ENDED DECEMBER 31, 2011
| U.S. Equity Portfolio | ||||
INVESTMENT INCOME: | ||||
Interest income from non-affiliates | $ | 235 | ||
Dividend income from non-affiliates | 2,006,696 | |||
Dividend income from affiliates | 1,148 | |||
Income from securities lending (net) | 1,060 | |||
|
| |||
Total investment income | 2,009,139 | |||
|
| |||
EXPENSES: | ||||
Investment advisory fees | 572,781 | |||
Administration fees | 92,239 | |||
Distribution fee — Class 2 | 55 | |||
Custodian and accounting fees | 38,141 | |||
Interest expense to affiliates | 15 | |||
Professional fees | 43,935 | |||
Trustees’ and Chief Compliance Officer’s fees | 1,130 | |||
Printing and mailing costs | 54,006 | |||
Transfer agent fees | 2,631 | |||
Other | 18,783 | |||
|
| |||
Total expenses | 823,716 | |||
|
| |||
Less amounts waived | (6,439 | ) | ||
Less earnings credits | — | (a) | ||
|
| |||
Net expenses | 817,277 | |||
|
| |||
Net investment income (loss) | 1,191,862 | |||
|
| |||
REALIZED/UNREALIZED GAINS (LOSSES): | ||||
Net realized gain (loss) on transactions from: | ||||
Investments in non-affiliates | 13,717,911 | |||
Futures | 121,006 | |||
|
| |||
Net realized gain (loss) | 13,838,917 | |||
|
| |||
Change in net unrealized appreciation (depreciation) of: | ||||
Investments in non-affiliates | (16,143,175 | ) | ||
Futures | 1,171 | |||
|
| |||
Change in net unrealized appreciation (depreciation) | (16,142,004 | ) | ||
|
| |||
Net realized/unrealized gains (losses) | (2,303,087 | ) | ||
|
| |||
Change in net assets resulting from operations | $ | (1,111,225 | ) | |
|
| |||
| (a) | Amount rounds to less than $1. |
SEE NOTES TO FINANCIAL STATEMENTS.
| 10 | JPMORGAN INSURANCE TRUST | DECEMBER 31, 2011 | ||||
Table of Contents
STATEMENTS OF CHANGES IN NET ASSETS
FOR THE PERIODS INDICATED
| U.S. Equity Portfolio | ||||||||
| Year Ended 12/31/2011 | Year Ended 12/31/2010 | |||||||
CHANGE IN NET ASSETS RESULTING FROM OPERATIONS: | ||||||||
Net investment income | $ | 1,191,862 | $ | 1,495,369 | ||||
Net realized gain | 13,838,917 | 18,561,531 | ||||||
Change in net unrealized depreciation | (16,142,004 | ) | (2,542,641 | ) | ||||
|
|
|
| |||||
Change in net assets resulting from operations | (1,111,225 | ) | 17,514,259 | |||||
|
|
|
| |||||
DISTRIBUTIONS TO SHAREHOLDERS: | ||||||||
Class 1 | ||||||||
From net investment income | (1,487,487 | ) | (1,314,251 | ) | ||||
Class 2 | ||||||||
From net investment income | (174 | ) | (119 | ) | ||||
|
|
|
| |||||
Total distributions to shareholders | (1,487,661 | ) | (1,314,370 | ) | ||||
|
|
|
| |||||
CAPITAL TRANSACTIONS: | ||||||||
Change in net assets from capital transactions | (52,043,530 | ) | (34,320,573 | ) | ||||
|
|
|
| |||||
NET ASSETS: | ||||||||
Change in net assets | (54,642,416 | ) | (18,120,684 | ) | ||||
Beginning of period | 132,566,820 | 150,687,504 | ||||||
|
|
|
| |||||
End of period | $ | 77,924,404 | $ | 132,566,820 | ||||
|
|
|
| |||||
Accumulated undistributed net investment income | $ | 1,183,857 | $ | 1,489,538 | ||||
|
|
|
| |||||
CAPITAL TRANSACTIONS: | ||||||||
Class 1 | ||||||||
Proceeds from shares issued | $ | 3,800,102 | $ | 7,718,630 | ||||
Dividends and distributions reinvested | 1,487,487 | 1,314,251 | ||||||
Cost of shares redeemed | (57,389,515 | ) | (43,353,573 | ) | ||||
|
|
|
| |||||
Change in net assets from Class 1 capital transactions | $ | (52,101,926 | ) | $ | (34,320,692 | ) | ||
|
|
|
| |||||
Class 2 | ||||||||
Proceeds from shares issued | $ | 58,270 | $ | — | ||||
Dividends and distributions reinvested | 174 | 119 | ||||||
Cost of shares redeemed | (48 | ) | — | |||||
|
|
|
| |||||
Change in net assets from Class 2 capital transactions | $ | 58,396 | $ | 119 | ||||
|
|
|
| |||||
Total change in net assets from capital transactions | $ | (52,043,530 | ) | $ | (34,320,573 | ) | ||
|
|
|
| |||||
SHARE TRANSACTIONS: | ||||||||
Class 1 | ||||||||
Issued | 252,092 | 559,660 | ||||||
Reinvested | 92,679 | 87,500 | ||||||
Redeemed | (3,680,656 | ) | (3,016,493 | ) | ||||
|
|
|
| |||||
Change in Class 1 Shares | (3,335,885 | ) | (2,369,333 | ) | ||||
|
|
|
| |||||
Class 2 | ||||||||
Issued | 3,877 | — | ||||||
Reinvested | 11 | 8 | ||||||
Redeemed | (3 | ) | — | |||||
|
|
|
| |||||
Change in Class 2 Shares | 3,885 | 8 | ||||||
|
|
|
| |||||
SEE NOTES TO FINANCIAL STATEMENTS.
| DECEMBER 31, 2011 | JPMORGAN INSURANCE TRUST | 11 | ||||||
Table of Contents
FOR THE PERIODS INDICATED
| Per share operating performance | ||||||||||||||||||||||||||||
| Investment operations | Distributions | |||||||||||||||||||||||||||
| Net asset value, beginning of period | Net investment income (loss) | Net realized and unrealized gains (losses) on investments | Total from investment operations | Net investment income | Net realized gain | Total distributions | ||||||||||||||||||||||
U.S. Equity Portfolio | ||||||||||||||||||||||||||||
Class 1 | ||||||||||||||||||||||||||||
Year Ended December 31, 2011 | $ | 15.69 | $ | 0.18 | (c) | $ | (0.46 | ) | $ | (0.28 | ) | $ | (0.19 | ) | $ | — | $ | (0.19 | ) | |||||||||
Year Ended December 31, 2010 | 13.93 | 0.16 | (c) | 1.73 | 1.89 | (0.13 | ) | — | (0.13 | ) | ||||||||||||||||||
Year Ended December 31, 2009 | 10.74 | 0.19 | 3.32 | 3.51 | (0.32 | ) | — | (0.32 | ) | |||||||||||||||||||
Year Ended December 31, 2008 | 18.34 | 0.22 | (c) | (6.12 | ) | (5.90 | ) | (0.18 | ) | (1.52 | ) | (1.70 | ) | |||||||||||||||
Year Ended December 31, 2007 | 17.60 | 0.18 | 1.57 | 1.75 | (0.19 | ) | (0.82 | ) | (1.01 | ) | ||||||||||||||||||
Class 2 | ||||||||||||||||||||||||||||
Year Ended December 31, 2011 | 15.65 | 0.14 | (c) | (0.46 | ) | (0.32 | ) | (0.15 | ) | — | (0.15 | ) | ||||||||||||||||
Year Ended December 31, 2010 | 13.91 | 0.12 | (c) | 1.72 | 1.84 | (0.10 | ) | — | (0.10 | ) | ||||||||||||||||||
Year Ended December 31, 2009 | 10.71 | 0.13 | 3.35 | 3.48 | (0.28 | ) | — | (0.28 | ) | |||||||||||||||||||
Year Ended December 31, 2008 | 18.28 | 0.19 | (c) | (6.11 | ) | (5.92 | ) | (0.13 | ) | (1.52 | ) | (1.65 | ) | |||||||||||||||
Year Ended December 31, 2007 | 17.58 | 0.16 | 1.54 | 1.70 | (0.18 | ) | (0.82 | ) | (1.00 | ) | ||||||||||||||||||
| (a) | Includes adjustments in accordance with accounting principles generally accepted in the United States of America and as such, the net asset value for financial reporting purposes and the returns based upon those net asset values may differ from the net asset value and returns for shareholder transactions. |
| (b) | Includes earnings credits and interest expense, each of which is less than 0.01%, if applicable or unless otherwise noted. |
| (c) | Calculated based upon average shares outstanding. |
SEE NOTES TO FINANCIAL STATEMENTS.
| 12 | JPMORGAN INSURANCE TRUST | DECEMBER 31, 2011 | ||||
Table of Contents
| Ratios/Supplemental data | |||||||||||||||||||||||||
| Ratios to average net assets | ||||||||||||||||||||||||||
| Net asset value, end of period | Total return (a) | Net assets, end of period | Net expenses (b) | Net investment income (loss) | Expenses | Portfolio turnover rate | ||||||||||||||||||||
| $ | 15.22 | (1.87 | )% | $ | 77,847,972 | 0.79 | % | 1.15 | % | 0.79 | % | 70 | % | |||||||||||||
| 15.69 | 13.58 | 132,548,805 | 0.79 | 1.10 | 0.82 | 75 | ||||||||||||||||||||
| 13.93 | 33.68 | 150,671,602 | 0.80 | 1.45 | 0.91 | 88 | ||||||||||||||||||||
| 10.74 | (34.80 | ) | 123,301,034 | 0.76 | 1.50 | 0.78 | 93 | |||||||||||||||||||
| 18.34 | 10.45 | 290,232,687 | 0.73 | 1.12 | 0.73 | 116 | ||||||||||||||||||||
| 15.18 | (2.09 | ) | 76,432 | 1.04 | 0.94 | 1.05 | 70 | |||||||||||||||||||
| 15.65 | 13.28 | 18,015 | 1.04 | 0.86 | 1.07 | 75 | ||||||||||||||||||||
| 13.91 | 33.34 | 15,902 | 1.05 | 1.21 | 1.17 | 88 | ||||||||||||||||||||
| 10.71 | (34.94 | ) | 11,930 | 1.01 | 1.30 | 1.04 | 93 | |||||||||||||||||||
| 18.28 | 10.12 | 18,421 | 0.99 | 0.85 | 0.99 | 116 | ||||||||||||||||||||
| DECEMBER 31, 2011 | JPMORGAN INSURANCE TRUST | 13 | ||||||
Table of Contents
AS OF DECEMBER 31, 2011
1. Organization
JPMorgan Insurance Trust (the “Trust”) is registered under the Investment Company Act of 1940, as amended (the “1940 Act”), as an open-end management investment company and is a Massachusetts business trust.
The following is a separate Portfolio of the Trust (the “Portfolio”) covered by this report:
| Classes Offered | Diversified/Non-Diversified | |||
| U.S. Equity Portfolio | Class 1 and Class 2 | Diversified |
The Portfolio seeks to provide high total return from a portfolio of selected equity securities.
Portfolio shares are offered only to separate accounts of participating insurance companies and Eligible Plans. Individuals may not purchase shares directly from the Portfolio.
All classes of shares have equal rights as to earnings, assets and voting privileges except that each class may bear different distribution and service fees, and each class has exclusive voting rights with respect to its distribution plan or administrative services plan.
2. Significant Accounting Policies
The following is a summary of significant accounting policies followed by the Trust in the preparation of its financial statements. The policies are in accordance with accounting principles generally accepted in the United States of America. The preparation of financial statements requires management to make estimates and assumptions that affect the reported amounts of assets and liabilities at the date of the financial statements and the reported amounts of income and expenses for the period. Actual results could differ from those estimates.
A. Valuation of Investments — Equity securities listed on a North American, Central American, South American or Caribbean securities exchange shall generally be valued at the last sale price on the exchange on which the security is principally traded that is reported before the time when the net assets of the Portfolio are valued. The value of securities listed on The NASDAQ Stock Market LLC shall generally be the NASDAQ Official Closing Price. Fixed income securities (other than certain short-term investments maturing in less than 61 days) are valued each day based on prices received from independent or affiliated pricing services approved by the Board of Trustees or third party broker-dealers. The broker-dealers or pricing services use multiple valuation techniques to determine fair value. In instances where sufficient market activity exists, the broker-dealers or pricing services may utilize a market-based approach through which quotes from market makers are used to determine fair value. In instances where sufficient market activity may not exist or is limited, the broker-dealers or pricing services also utilize proprietary valuation models which may consider market transactions in comparable securities and the various relationships between securities in determining value and/or market characteristics such as benchmark yield curves, option-adjusted spreads, credit spreads, estimated default rates, coupon-rates, anticipated timing of principal repayments, underlying collateral, and other unique security features in order to estimate the relevant cash flows, which are then discounted to calculate the fair values. Generally, short-term investments of sufficient credit quality maturing in less than 61 days are valued at amortized cost, which approximates market value. Certain investments of the Portfolio may, depending upon market conditions, trade in relatively thin markets and/or in markets that experience significant volatility. As a result of these conditions, the prices used by the Portfolio to value securities may differ from the value that would be realized if these securities were sold, and the differences could be material. Futures and options shall generally be valued on the basis of available market quotations. Swaps and other derivatives are valued daily, primarily using independent or affiliated pricing services approved by the Board of Trustees. If valuations are not available from such services or values received are deemed not representative of market value, values will be obtained from a third party broker-dealer or counterparty. Investments in other open-end investment companies are valued at such investment company's net asset value per share as of the report date.
Securities or other assets for which market quotations are not readily available or for which market quotations do not represent the value at the time of pricing (including certain illiquid securities) are fair valued in accordance with procedures established by and under the supervision and responsibility of the Board of Trustees. Under these procedures, the Portfolio primarily employs a market-based approach which may use related or comparable assets or liabilities, recent transactions, market multiples, book values, and other relevant information for the investment to determine the fair value of the investment. The Portfolio may also use an income-based valuation approach in which the anticipated future cash flows of the investment are discounted to calculate fair value. Discounts may also be applied due to the nature or duration of any restrictions on the disposition of the investments. Valuations may be based upon current market prices of securities that are comparable in coupon, rating, maturity and industry. It is possible that the estimated values may differ significantly from the values that would have been used had a ready market for the investments existed, and such differences could be material. Trading in securities on most foreign exchanges and over-the-counter markets is normally completed before the close of the domestic market and may also take place on days when the domestic market is closed. In accordance with procedures adopted by the Board of Trustees, the Portfolio applies fair value pricing on equity securities on a daily basis except for North American, Central American, South American and Caribbean equity securities held in its portfolio by utilizing the quotations of an independent pricing service, unless the Portfolio’s advisor determines that use of another valuation methodology is appropriate. The pricing service uses statistical analyses and quantitative models to adjust local market prices using factors such as subsequent movement and changes in the prices of indices, securities and exchange rates in other markets, in determining fair value as of the time the Portfolio calculates its net asset values.
Valuations reflected in this report are as of the report date. As a result, changes in valuation due to market events and/or issuer related events after the report date and prior to issuance of the report are not reflected herein.
| 14 | JPMORGAN INSURANCE TRUST | DECEMBER 31, 2011 | ||||
Table of Contents
The various inputs that are used in determining the fair value of the Portfolio’s investments are summarized into the three broad levels listed below.
| Ÿ | Level 1 — quoted prices in active markets for identical securities |
| Ÿ | Level 2 — other significant observable inputs (including quoted prices for similar securities, interest rates, prepayment speeds, credit risk, etc.) |
| Ÿ | Level 3 — significant unobservable inputs (including the Portfolio’s own assumptions in determining the fair value of investments) |
A financial instrument’s level within the fair value hierarchy is based on the lowest level of any input both individually and in aggregate that is significant to the fair value measurement. The inputs or methodology used for valuing securities are not necessarily an indication of the risk associated with investing in those securities.
The following table represents each valuation input as presented on the Schedule of Portfolio Investments (“SOI”):
Level 1 Quoted prices | Level 2 Other significant observable inputs | Level 3 Significant unobservable inputs | Total | |||||||||||||
Total Investments in Securities (a) | $ | 77,118,625 | $ | 51,257 | $ | — | $ | 77,169,882 | ||||||||
|
|
|
|
|
|
|
| |||||||||
Appreciation in Other Financial Instruments | ||||||||||||||||
Futures Contracts | $ | 1,507 | $ | — | $ | — | $ | 1,507 | ||||||||
|
|
|
|
|
|
|
| |||||||||
| (a) | Portfolio holdings designated as Level 1 and Level 2 are disclosed individually in the SOI. Level 2 consists of an ADR, the reported value of which is an evaluated price. Please refer to the SOI for industry specifics of the portfolio holdings. |
There were no transfers between Levels 1 and 2 during the year ended December 31, 2011.
B. Futures Contracts — The Portfolio uses index futures contracts to gain or reduce exposure to the stock market, maintain liquidity and minimize transaction costs. The Portfolio buys futures contracts to immediately invest incoming cash in the market or sells futures in response to cash outflows, thereby simulating an invested position in the underlying index while maintaining a cash balance for liquidity. The use of futures contracts exposes the Portfolio to equity price risk.
Futures contracts provide for the delayed delivery of the underlying instrument at a fixed price or for a cash amount based on the change in the value of the underlying instrument at a specific date in the future. Upon entering into a futures contract, the Portfolio is required to deposit with the broker, cash or securities in an amount equal to a certain percentage of the contract amount which is referred to as the initial margin deposit. Subsequent payments, referred to as variation margin, are made or received by the Portfolio periodically and are based on changes in the market value of open futures contracts. Changes in the market value of open futures contracts are recorded as unrealized appreciation or depreciation in the Statement of Operations. Realized gains or losses, representing the difference between the value of the contract at the time it was opened and the value at the time it was closed, are reported in the Statement of Operations at the closing or expiration of futures contracts. Securities deposited as initial margin are designated in the SOI and cash deposited is recorded on the Statement of Assets and Liabilities. A receivable from and/or a payable to brokers for the daily variation margin is also recorded on the Statement of Assets and Liabilities.
The Portfolio may be subject to the risk that the change in the value of the futures contract may not correlate perfectly with the underlying instrument. Use of long futures contracts subjects the Portfolio to risk of loss in excess of the amounts shown on the Statement of Assets and Liabilities, up to the notional amount of the futures contracts. Use of short futures contracts subjects the Portfolio to unlimited risk of loss. The Portfolio may enter into futures contracts only on exchanges or boards of trade. The exchange or board of trade acts as the counterparty to each futures transaction; therefore, the Portfolio’s credit risk is limited to failure of the exchange or board of trade. Under some circumstances, futures exchanges may establish daily limits on the amount that the price of a futures contract can vary from the previous day’s settlement price, which could effectively prevent liquidation of unfavorable positions.
The table below discloses the volume of the Portfolio’s futures activities during the year ended December 31, 2011:
Futures Contracts: | ||||
Average Notional Balance Long | $ | 706,856 | ||
Ending Notional Balance Long | 438,410 |
C. Securities Lending — The Portfolio may lend securities to brokers approved by J.P. Morgan Investment Management Inc. (“JPMIM” or the “Advisor”) in order to generate additional income. The Goldman Sachs Bank USA, doing business as Goldman Sachs Agency Lending (“GSAL”), serves as lending agent for the Portfolio pursuant to a Securities Lending Agreement (the “GSAL Securities Lending Agreement”). Securities loaned are collateralized by cash, which is invested in Capital Shares of the JPMorgan Prime Money Market Fund. Upon termination of the loan, the Portfolio is required to return to the borrower the posted cash collateral. Loans are subject to termination by the Portfolio or the borrower at any time.
Securities lending income is comprised of income earned on cash collateral investments (“Collateral Investments”), net of a rebate received from or paid to borrowers for use of cash collateral and lending agent fees. This amount is recorded as Income from securities lending (net) on the Statement of Operations. The Portfolio also receives payments from the borrower during the period of the loan, equivalent to dividends and interest
| DECEMBER 31, 2011 | JPMORGAN INSURANCE TRUST | 15 | ||||||
Table of Contents
NOTES TO FINANCIAL STATEMENTS
AS OF DECEMBER 31, 2011 (continued)
earned on the securities loaned, which are recorded as Dividend or Interest income, respectively, on the Statement of Operations. For the year ended December 31, 2011, the Portfolio earned $657 from the investment of cash collateral, prior to rebates or fees, from an investment in an affiliated fund as described below.
At the inception of a loan, securities are exchanged for cash collateral equal to at least 102% of the value of loaned U.S. dollar-denominated securities plus accrued interest. The GSAL Securities Lending Agreement requires that the loaned securities be marked to market on a daily basis and additional cash collateral is requested from borrowers when the cash received from borrowers becomes less than 102% of the value of loaned securities.
The value of the cash collateral received is recorded as a liability on the Statement of Assets and Liabilities and details of Collateral Investments are disclosed in the SOI. At December 31, 2011, there were no outstanding securities on loan.
The Portfolio bears the risk of loss associated with the Collateral Investments and is not entitled to additional collateral from the borrower to cover any such losses. To the extent that the value of the Collateral Investments declines below the amount owed to a borrower, the Portfolio may incur losses that exceed the amount it earned on lending the security. Upon termination of a loan, the Portfolio may use leverage (borrow money) to repay the borrower for cash collateral posted, if the Advisor does not believe that it is prudent to sell the Collateral Investments to fund the payment of this liability.
Securities lending also involves counterparty risks, including the risk that the loaned securities may not be returned in a timely manner or at all. Subject to certain conditions, GSAL has agreed to indemnify the Portfolio from losses resulting from a borrower’s failure to return a loaned security.
The Advisor waived fees associated with the Portfolio’s investment in JPMorgan Prime Money Market Fund in the amount of $463. This amount offsets the administration fees and shareholder servicing fees incurred by JPMorgan Prime Money Market Fund related to the Portfolio’s investment in such fund. A portion of the waiver is voluntary.
D. Security Transactions and Investment Income — Investment transactions are accounted for on the trade date (the date the order to buy or sell is executed). Securities gains and losses are calculated on a specifically identified cost basis. Interest income is determined on the basis of coupon interest accrued using the effective interest method adjusted for amortization of premiums and accretion of discounts. Dividend income less foreign taxes withheld, if any, is recorded on the ex-dividend date or when the Portfolio first learns of the dividend.
E. Allocation of Income and Expenses — In calculating the net asset value per share of each class, investment income, realized and unrealized gains and losses and expenses other than class specific expenses are allocated daily to each class of shares based upon the proportion of net assets of each class at the beginning of each day. Expenses directly attributable to a portfolio are charged directly to that portfolio while the expenses attributable to more than one portfolio of the Trust are allocated among the respective portfolios. Each class of shares bears its pro-rata portion of expenses attributable to the Portfolio, except that each class separately bears expenses related specifically to that class, such as distribution fees.
F. Federal Income Taxes — The Portfolio is treated as a separate taxable entity for Federal income tax purposes. The Portfolio’s policy is to comply with the provisions of the Internal Revenue Code of 1986, as amended (the “Code”), applicable to regulated investment companies and to distribute to shareholders all of its distributable net investment income and net realized gain on investments. Accordingly, no provision for Federal income tax is necessary. The Portfolio is also a segregated portfolio of assets for insurance purposes and intends to comply with the diversification requirements of Subchapter L of the Code. The Portfolio is not aware of any tax positions for which it is reasonably possible that the total amounts of unrecognized tax benefits or losses will significantly change in the next twelve months. However, the Portfolio’s conclusions may be subject to future review based on changes in, or the interpretation of, the accounting standards or tax laws and regulations. The Portfolio’s Federal tax returns for the prior three fiscal years remain subject to examination by the Internal Revenue Service.
G. Dividends and Distributions to Shareholders — Dividends from net investment income are generally declared and paid at least annually. Dividends are declared separately for each class. No class has preferential dividend rights; differences in per share rates are due to differences in separate class expenses. Net realized capital gains, if any, are distributed at least annually. The amount of dividends and distributions from net investment income and net realized capital gains is determined in accordance with Federal income tax regulations, which may differ from accounting principles generally accepted in the United States of America. To the extent these “book/tax” differences are permanent in nature (i.e., that they result from other than timing of recognition — “temporary differences”), such amounts are reclassified within the capital accounts based on their Federal tax-basis treatment.
The following amounts were reclassified within the capital accounts:
| Paid-in-Capital | Accumulated (Overdistributed) Net Investment Income | Accumulated Net Realized Gain (Loss) on Investments | ||||||||||
| $ | — | $ | (9,882 | ) | $ | 9,882 | ||||||
The reclassifications for the Portfolio relate primarily to distributions from investments in real estate investment trusts.
| 16 | JPMORGAN INSURANCE TRUST | DECEMBER 31, 2011 | ||||
Table of Contents
3. Fees and Other Transactions with Affiliates
A. Investment Advisory Fee — Pursuant to the Investment Advisory Agreement, JPMIM acts as the investment advisor to the Portfolio. JPMIM is a wholly-owned subsidiary of JPMorgan Asset Management Holdings Inc., which is a wholly-owned subsidiary of JPMorgan Chase & Co. (“JPMorgan”). JPMIM supervises the investments of the Portfolio and for such services is paid a fee. The fee is accrued daily and paid monthly based on the Portfolio’s average daily net assets at an annual fee rate of 0.55%.
The Advisor waived Investment Advisory fees and/or reimbursed expenses as outlined in Note 3.E.
B. Administration Fee — Pursuant to an Administration Agreement, JPMorgan Funds Management, Inc. (the “Administrator”), an indirect, wholly-owned subsidiary of JPMorgan, provides certain administration services to the Portfolio. In consideration of these services, the Administrator receives a fee computed daily and paid monthly at the annual rate of 0.15% of the first $25 billion of the average daily net assets of all funds in the J.P. Morgan Funds Complex (excluding certain funds of funds and money market funds) and 0.075% of the average daily net assets in excess of $25 billion of all such funds. For the year ended December 31, 2011, the annual effective rate was 0.09% of the Portfolio’s average daily net assets.
JPMorgan Chase Bank, N.A (“JPMCB”), a wholly-owned subsidiary of JPMorgan, and successor in interest to J.P. Morgan Investor Services Co. serves as the Portfolio’s sub-administrator (the “Sub-administrator”). For its services as Sub-administrator, JPMCB receives a portion of the fees payable to the Administrator.
C. Distribution Fees — Pursuant to a Distribution Agreement, JPMorgan Distribution Services, Inc. (the “Distributor”), a wholly-owned subsidiary of JPMorgan, serves as the Trust’s exclusive underwriter and promotes and arranges for the sale of the Portfolio’s shares.
The Board of Trustees has adopted a Distribution Plan (the “Distribution Plan”) for Class 2 Shares of the Portfolio in accordance with Rule 12b-1 under the 1940 Act. The Distribution Plan provides that the Portfolio shall pay distribution fees, including payments to the Distributor, at an annual rate of 0.25% of the average daily net assets of Class 2 Shares.
D. Custodian and Accounting Fees — JPMCB provides portfolio custody and accounting services for the Portfolio. The amounts paid directly to JPMCB by the Portfolio for custody and accounting services are included in Custodian and accounting fees in the Statement of Operations. The custodian fees may be reduced by credits earned by the Portfolio, based on uninvested cash balances held by the custodian. Such earnings credits are presented separately in the Statement of Operations.
Interest expense, if any, paid to the custodian related to cash overdrafts is included in Interest expense to affiliates in the Statement of Operations.
E. Waivers and Reimbursements — The Advisor and Administrator have contractually agreed to waive fees and/or reimburse the Portfolio to the extent that total annual operating expenses (excluding acquired fund fees and expenses, dividend expense related to short sales, interest, taxes, extraordinary expenses and expenses related to the Board of Trustees’ deferred compensation plan) exceed the percentages of the Portfolio’s average daily net assets as shown in the table below:
| Class 1 | Class 2 | |||||||
| 0.80 | % | 1.05 | % | |||||
The contractual expense limitation agreements were in effect for the year ended December 31, 2011. The expense limitation percentages in the table above are in place until at least April 30, 2012.
For the year ended December 31, 2011, the Advisor contractually waived fees for the Portfolio in the amount of $4,274. The Advisor does not expect the Portfolio to repay any such waived fees in future years.
Additionally, the Portfolio may invest in one or more money market funds advised by the Advisor or its affiliates. The Advisor, Administrator and the Distributor waive fees in an amount sufficient to offset the respective fees each charges to the affiliated money market fund on the Portfolio’s investment in such affiliated money market fund. A portion of the waiver is voluntary.
The amount of waivers resulting from investments in the money market funds for the year ended December 31, 2011 (excluding the waiver disclosed in Note 2.C. regarding cash collateral for securities lending invested in the JPMorgan Prime Money Market Fund) was $2,165.
F. Other — Certain officers of the Trust are affiliated with the Advisor, the Administrator and the Distributor. Such officers, with the exception of the Chief Compliance Officer, receive no compensation from the Portfolio for serving in their respective roles.
The Board of Trustees appointed a Chief Compliance Officer to the Portfolio in accordance with federal securities regulations. The Portfolio, along with other affiliated portfolios, makes reimbursement payments, on a pro-rata basis, to the Administrator for a portion of the fees associated with the Office of the Chief Compliance Officer. Such fees are included in Trustees’ and Chief Compliance Officer’s fees in the Statement of Operations.
The Trust adopted a Trustee Deferred Compensation Plan (the “Plan”) which allows the Independent Trustees to defer the receipt of all or a portion of compensation related to performance of their duties as a Trustee. The deferred fees are invested in various J.P. Morgan Funds until distribution in accordance with the Plan.
During the year ended December 31, 2011, the Portfolio may have purchased securities from an underwriting syndicate in which the principal underwriter or members of the syndicate are affiliated with the Advisor.
| DECEMBER 31, 2011 | JPMORGAN INSURANCE TRUST | 17 | ||||||
Table of Contents
NOTES TO FINANCIAL STATEMENTS
AS OF DECEMBER 31, 2011 (continued)
The Portfolio may use related party broker/dealers. For the year ended December 31, 2011, the Portfolio did not incur any brokerage commissions with broker/dealers affiliated with the Advisor.
The Securities and Exchange Commission has granted an exemptive order permitting the Portfolio to engage in principal transactions with J.P. Morgan Securities, Inc., an affiliated broker, involving taxable money market instruments subject to certain conditions.
4. Investment Transactions
During the year ended December 31, 2011, purchases and sales of investments (excluding short-term investments) were as follows:
Purchases (excluding | Sales (excluding | Purchases of U.S. Government | Sales of U.S. Government | |||||||||||||
| $ | 72,351,983 | $ | 123,546,793 | $ | — | $ | 200,356 | |||||||||
5. Federal Income Tax Matters
For Federal income tax purposes, the cost and unrealized appreciation (depreciation) in value of the investment securities at December 31, 2011, were as follows:
Aggregate Cost | Gross Unrealized Appreciation | Gross Unrealized Depreciation | Net Unrealized Appreciation (Depreciation) | |||||||||||||
| $ | 77,630,449 | $ | 4,565,496 | $ | 5,026,063 | $ | (460,567 | ) | ||||||||
The difference between book and tax basis appreciation (depreciation) on investments is primarily attributed to wash sale loss deferrals.
The tax character of distributions paid during the fiscal year ended December 31, 2011 was as follows:
| Total Distributions Paid From: | ||||||||
Ordinary Income | Total Distributions Paid | |||||||
| $ | 1,487,661 | $ | 1,487,661 | |||||
The tax character of distributions paid during the fiscal year ended December 31, 2010 was as follows:
| Total Distributions Paid From: | ||||||||
Ordinary Income | Total Distributions Paid | |||||||
| $ | 1,314,370 | $ | 1,314,370 | |||||
At December 31, 2011, the components of net assets (excluding paid in capital) on a tax basis were as follows:
Current Distributable Ordinary Income | Current Distributable Long-Term Capital Gain or (Tax Basis Capital Loss Carryover) | Unrealized Appreciation (Depreciation) | ||||||||||
| $ | 1,187,744 | $ | (28,010,515 | ) | $ | (460,567 | ) | |||||
The cumulative timing differences primarily consist of wash sale loss deferrals, Trustee deferred compensation and post-October loss deferrals.
Under the Regulated Investment Company Modernization Act of 2010 (the “Act”), net capital losses recognized by the Portfolio after December 31, 2010, may get carried forward indefinitely, and retain their character as short-term and/or long term losses. Prior to the Act, pre-enactment net capital losses incurred by the Portfolio were carried forward for eight years and treated as short-term losses. The Act requires that post-enactment net capital losses be used before pre-enactment net capital losses.
As of December 31, 2011, the Portfolio did not have post-enactment net capital loss carryforwards.
As of December 31, 2011, the Portfolio had the following pre-enactment net capital loss carryforwards expiring during the years indicated, which are available to offset future realized gains:
| 2016 | 2017 | Total | ||||||||||
| $ | 2,550,957 | * | $ | 25,459,558 | $ | 28,010,515 | ||||||
| * | This amount includes $2,550,957 of capital loss carryforwards from business combinations, which may be limited in future years under the Internal Revenue Code Sections 381-384. |
| 18 | JPMORGAN INSURANCE TRUST | DECEMBER 31, 2011 | ||||
Table of Contents
During the year ended December 31, 2011, the Portfolio utilized capital loss carryforwards in the amount of $9,248,867.
Net capital losses incurred after October 31 and within the taxable year are deemed to arise on the first business day of the Portfolio’s next taxable year. For the year ended December 31, 2011, the Portfolio deferred to January 1, 2012 post-October short-term capital losses of $521,863.
6. Borrowings
The Trust and JPMCB have entered into a financing arrangement. Under this arrangement, JPMCB provides an unsecured, uncommitted credit facility in the aggregate amount of $100 million to certain of the J.P. Morgan Funds, including the Portfolio. Advances under the arrangement are taken primarily for temporary or emergency purposes, including the meeting of redemption requests that otherwise might require the untimely disposition of securities, and are subject to the Portfolio’s borrowing restrictions. Interest on borrowings is payable at a rate determined by JPMCB at the time of borrowing. This agreement has been extended until November 12, 2012.
The Portfolio had no borrowings outstanding from the unsecured, uncommitted credit facility at December 31, 2011, or at any time during the year then ended.
Interest expense paid, if any, as a result of borrowings from the unsecured, uncommitted credit facility is included in Interest expense to affiliates in the Statement of Operations.
7. Risks, Concentrations and Indemnifications
In the normal course of business, the Portfolio enters into contracts that contain a variety of representations which provide general indemnifications. The Portfolio’s maximum exposure under these arrangements is unknown, as this would involve future claims that may be made against the Portfolio that have not yet occurred. However, based on experience, the Portfolio expects the risk of loss to be remote.
From time to time, the Portfolio may have a concentration of several shareholders holding a significant percentage of shares outstanding. Investment activities of these shareholders could have a material impact on the Portfolio.
| DECEMBER 31, 2011 | JPMORGAN INSURANCE TRUST | 19 | ||||||
Table of Contents
REPORT OF INDEPENDENT REGISTERED PUBLIC ACCOUNTING FIRM
To the Board of Trustees of JPMorgan Insurance Trust and Shareholders of JPMorgan Insurance Trust U.S. Equity Portfolio:
In our opinion, the accompanying statement of assets and liabilities, including the schedule of portfolio investments, and the related statements of operations and of changes in net assets and the financial highlights present fairly, in all material respects, the financial position of JPMorgan Insurance Trust U.S. Equity Portfolio (a separate Portfolio of JPMorgan Insurance Trust) (hereafter referred to as the “Portfolio”) at December 31, 2011, the results of its operations for the year then ended, the changes in its net assets for each of the two years in the period then ended and the financial highlights for each of the five years in the period then ended, in conformity with accounting principles generally accepted in the United States of America. These financial statements and financial highlights (hereafter referred to as “financial statements”) are the responsibility of the Portfolio’s management. Our responsibility is to express an opinion on these financial statements based on our audits. We conducted our audits of these financial statements in accordance with the standards of the Public Company Accounting Oversight Board (United States). Those standards require that we plan and perform the audit to obtain reasonable assurance about whether the financial statements are free of material misstatement. An audit includes examining, on a test basis, evidence supporting the amounts and disclosures in the financial statements, assessing the accounting principles used and significant estimates made by management, and evaluating the overall financial statement presentation. We believe that our audits, which included confirmation of securities at December 31, 2011 by correspondence with the custodian and brokers, provide a reasonable basis for our opinion.
PricewaterhouseCoopers LLP
New York, New York
February 23, 2012
| 20 | JPMORGAN INSURANCE TRUST | DECEMBER 31, 2011 | ||||
Table of Contents
(Unaudited)
The Portfolio’s Statement of Additional Information includes additional information about the Portfolio’s Trustees and is available, without charge, upon request by calling 1-800-480-4111 or on the J.P. Morgan Funds’ website at www.jpmorganfunds.com.
Name (Year of Birth); Positions With the Portfolio (1) | Principal Occupations During Past 5 Years | Number of Complex Overseen by Trustee (2) | Other Directorships Held Outside Fund Complex During Past 5 Years | |||
Independent Trustees | ||||||
| William J. Armstrong (1941); Trustee of Trust since 2005; Trustee of heritage J.P. Morgan Funds since 1987. | Retired; CFO and Consultant, EduNeering, Inc. (internet business education supplier) (2000-2001); Vice President and Treasurer, Ingersoll-Rand Company (manufacturer of industrial equipment) (1972-2000). | 154 | None. | |||
| John F. Finn (1947); Trustee of Trust since 2005; Trustee of heritage One Group Mutual Funds since 1998. | Chairman (1985-present), President and Chief Executive Officer, Gardner, Inc. (supply chain management company serving industrial and consumer markets) (1974-present). | 154 | Director, Cardinal Health, Inc. (CAH) (1994-present); Director, Greif, Inc. (GEF) (industrial package products and services) (2007-present). | |||
| Dr. Matthew Goldstein (1941); Trustee of Trust since 2005; Trustee of heritage J.P. Morgan Funds since 2003. | Chancellor, City University of New York (1999-present); President, Adelphi University (New York) (1998-1999). | 154 | Director, New Plan Excel (NXL) (1999-2005); Director, National Financial Partners (NFP) (2003-2005); Director, Bronx-Lebanon Hospital Center; Director, United Way of New York City (2002-present). | |||
| Robert J. Higgins (1945); Trustee of Trust since 2005; Trustee of heritage J.P. Morgan Funds since 2002. | Retired; Director of Administration of the State of Rhode Island (2003-2004); President — Consumer Banking and Investment Services, Fleet Boston Financial (1971-2001). | 154 | None. | |||
| Peter C. Marshall (1942); Trustee of Trust since 2005; Trustee of heritage One Group Mutual Funds since 1985. | Self-employed business consultant (2002-present). | 154 | Director, Center for Communication, Hearing, and Deafness (1990-present). | |||
| Marilyn McCoy* (1948); Trustee of Trust since 2005; Trustee of heritage One Group Mutual Funds since 1999. | Vice President of Administration and Planning, Northwestern University (1985-present). | 154 | Trustee, Carleton College (2003-present). | |||
| William G. Morton, Jr. (1937); Trustee of Trust since 2005; Trustee of heritage J.P. Morgan Funds since 2003. | Retired; Chairman Emeritus (2001-2002), and Chairman and Chief Executive Officer, Boston Stock Exchange (1985-2001). | 154 | Director, Radio Shack Corp. (1987-2008); Trustee, Stratton Mountain School (2001-present). | |||
| Robert A. Oden, Jr. (1946); Trustee of Trust since 2005; Trustee of heritage One Group Mutual Funds since 1997. | Retired; President, Carleton College (2002-2010); President, Kenyon College (1995-2002). | 154 | Trustee, American University in Cairo (1999-present); Trustee, Carleton College (2002-2010). | |||
| Fergus Reid, III (1932); Trustee of Trust (Chairman) since 2005; Trustee (Chairman) of heritage J.P. Morgan Funds since 1987. | Chairman, Joe Pietryka, Inc. (formerly Lumelite Corporation) (plastics manufacturing) (2003-present); Chairman and Chief Executive Officer, Lumelite Corporation (1985-2002). | 154 | Trustee, Morgan Stanley Funds (105 portfolios) (1992-present). | |||
| DECEMBER 31, 2011 | JPMORGAN INSURANCE TRUST | 21 | ||||||
Table of Contents
TRUSTEES
(Unaudited) (continued)
Name (Year of Birth); Positions With the Portfolio (1) | Principal Occupations During Past 5 Years | Number of Complex Overseen by Trustee (2) | Other Directorships Held Outside Fund Complex During Past 5 Years | |||
Independent Trustees (continued) | ||||||
| Frederick W. Ruebeck (1939); Trustee of Trust since 2005; Trustee of heritage One Group Mutual Funds since 1994. | Consultant (2000-present); Advisor, JP Greene & Associates, LLC (broker-dealer) (2000-2009); Chief Investment Officer, Wabash College (2004-present); Director of Investments, Eli Lilly and Company (pharmaceuticals) (1988-1999). | 154 | Trustee, Wabash College (1988-present); Chairman, Indianapolis Symphony Orchestra Foundation (1994-present). | |||
| James J. Schonbachler (1943); Trustee of Trust since 2005; Trustee of heritage J.P. Morgan Funds since 2001. | Retired; Managing Director of Bankers Trust Company (financial services) (1968-1998). | 154 | None. | |||
Interested Trustees | ||||||
| Frankie D. Hughes** (1952), Trustee of Trust since 2008. | President and Chief Investment Officer, Hughes Capital Management, Inc. (fixed income asset management) (1993-present). | 154 | Trustee, The Victory Portfolios (2000-2008). | |||
| Leonard M. Spalding, Jr.*** (1935); Trustee of Trust since 2005; Trustee of heritage J.P. Morgan Funds since 1998. | Retired; Chief Executive Officer, Chase Mutual Funds (investment company) (1989-1998); President and Chief Executive Officer, Vista Capital Management (investment management) (1990-1998); Chief Investment Executive, Chase Manhattan Private Bank (investment management) (1990-1998). | 154 | Director, Glenview Trust Company, LLC (2001-present); Trustee, St. Catharine College (1998-present); Trustee, Bellarmine University (2000-present); Director, Springfield-Washington County Economic Development Authority (1997-present); Trustee, Catholic Education Foundation (2005-present). | |||
| (1) | Each Trustee serves for an indefinite term, subject to the Trust’s current retirement policy, which is age 75 for all Trustees, except that the Board has determined Messrs. Reid and Spalding should continue to serve until December 31, 2012. |
| (2) | A Fund Complex means two or more registered investment companies that hold themselves out to investors as related companies for purposes of investment and investor services or have a common investment adviser or have an investment adviser that is an affiliated person of the investment adviser of any of the other registered investment companies. The J.P. Morgan Funds Complex for which the Board of Trustees serves currently includes eleven registered investment companies (154 funds). |
| * | Ms. McCoy has served as Vice President of Administration and Planning for Northwestern University since 1985. William M. Daley was the Head of Corporate Responsibility for JPMorgan Chase & Co. prior to January 2011 and served as a member of the Board of Trustees of Northwestern University from 2005 through 2010. JPMIM, the Funds’ investment advisor, is a wholly-owned subsidiary of JPMorgan Chase & Co. Three other members of the Board of Trustees of Northwestern University are executive officers of registered investment advisors (not affiliated with JPMorgan) that are under common control with subadvisors to certain J.P. Morgan Funds. |
| ** | Ms. Hughes is treated as an “interested person” based on the portfolio holdings of clients of Hughes Capital Management, Inc. |
| *** | Mr. Spalding is treated as an “interested person” due to his ownership of JPMorgan Chase stock. |
The contact address for each of the Trustees is 270 Park Avenue, New York, NY 10017.
| 22 | JPMORGAN INSURANCE TRUST | DECEMBER 31, 2011 | ||||
Table of Contents
(Unaudited)
Name (Year of Birth), Positions Held with the Trust (Since) | Principal Occupations During Past 5 Years | |
Patricia A. Maleski (1960), | Managing Director, J.P. Morgan Investment Management Inc. and Chief Administrative Officer, J.P. Morgan Funds and Institutional Pooled Vehicles since 2010; previously, Treasurer and Principal Financial Officer of the Trusts from 2008 to 2010; previously, Head of Funds Administration and Board Liaison, J.P. Morgan Funds prior to 2010. Ms. Maleski has been with JPMorgan Chase & Co. since 2001. | |
| Joy C. Dowd (1972), Treasurer and Principal Financial Officer (2010) | Assistant Treasurer of the Trusts from 2009 to 2010; Executive Director, JPMorgan Funds Management, Inc. from February 2011; Vice President, JPMorgan Funds Management, Inc. from December 2008 to February 2011; prior to joining JPMorgan Chase, Ms. Dowd worked in MetLife’s investments audit group from 2005 through 2008. | |
| Frank J. Nasta (1964), Secretary (2008) | Managing Director and Associate General Counsel, JPMorgan Chase since 2008; Previously, Director, Managing Director, General Counsel and Corporate Secretary, J. & W. Seligman & Co. Incorporated; Secretary of each of the investment companies of the Seligman Group of Funds and Seligman Data Corp.; Director and Corporate Secretary, Seligman Advisors, Inc. and Seligman Services, Inc. | |
| Stephen M. Ungerman (1953), Chief Compliance Officer (2005) | Managing Director, JPMorgan Chase & Co.; Mr. Ungerman has been with JPMorgan Chase & Co. since 2000. | |
| Paul L. Gulinello (1950), AML Compliance Officer (2005) | Vice President and Anti Money Laundering Compliance Officer for JPMorgan Asset Management Americas, additionally responsible for privacy, personal trading and Code of Ethics compliance since 2004. Mr. Gulinello has been with JPMorgan Chase & Co. since 1972. | |
Elizabeth A. Davin (1964), Assistant Secretary (2005)* | Vice President and Assistant General Counsel, JPMorgan Chase since 2005; Senior Counsel, JPMorgan Chase (formerly Bank One Corporation) from 2004 to 2005. | |
| Jessica K. Ditullio (1962), Assistant Secretary (2005)* | Executive Director and Assistant General Counsel, JPMorgan Chase since February 2011; Ms. Ditullio has served as an attorney with various titles for JPMorgan Chase (formerly Bank One Corporation) since 1990. | |
| John T. Fitzgerald (1975), Assistant Secretary (2008) | Executive Director and Assistant General Counsel, JPMorgan Chase since February 2011; formerly, Vice President and Assistant General Counsel, JPMorgan Chase from 2005 until February 2011. | |
| Carmine Lekstutis (1980) Assistant Secretary (2011) | Vice President and Assistant General Counsel, JPMorgan Chase since 2011; Associate, Skadden, Arps, Slate, Meagher & Flom LLP (law firm) from 2006 to 2011. | |
| Gregory S. Samuels (1980) Assistant Secretary (2010) | Vice President and Assistant General Counsel, JPMorgan Chase since 2010; Associate, Ropes & Gray (law firm) from 2008 to 2010; Associate, Clifford Chance LLP (law firm) from 2005 to 2008. | |
| Brian L. Duncan (1965), Assistant Treasurer (2008)* | Vice President, JPMorgan Funds Management, Inc. since June 2007; prior to joining JPMorgan Chase, Mr. Duncan worked for Penn Treaty American Corporation as Vice President and Controller from 2004 through 2007. | |
| Jeffrey D. House (1972), Assistant Treasurer (2006)* | Vice President, JPMorgan Funds Management, Inc. since July 2006. | |
| Laura S. Melman (1966), Assistant Treasurer (2006) | Executive Director, JPMorgan Funds Management, Inc. since February 2011, responsible for Taxation; Vice President, JPMorgan Funds Management, Inc. from August 2006 to February 2011, responsible for Taxation. | |
| Joseph Parascondola (1963), Assistant Treasurer (2011) | Vice President, JPMorgan Funds Management, Inc. since August 2006. | |
| Matthew J. Plastina (1970), Assistant Treasurer (2011) | Vice President, JPMorgan Funds Management, Inc. since August 2010; prior to August 2010, Vice President and Controller, Legg Mason Global Asset Management. | |
| Jeffery Reedy (1973), Assistant Treasurer (2011)* | Vice President, JPMorgan Funds Management, Inc. since February 2006. | |
The contact address for each of the officers, unless otherwise noted, is 270 Park Avenue, New York, NY 10017.
| * | The contact address for the officer is 1111 Polaris Parkway, Columbus, OH 43240. |
| DECEMBER 31, 2011 | JPMORGAN INSURANCE TRUST | 23 | ||||||
Table of Contents
SCHEDULE OF SHAREHOLDER EXPENSES
(Unaudited)
Hypothetical $1,000 Investment
As a shareholder of the Portfolio, you incur ongoing costs, including investment advisory fees, administration fees, distribution fees (for Class 2 Shares) and other Portfolio expenses. Because the Portfolio is a funding vehicle for Policies and Eligible Plans, you may also incur sales charges and other fees relating to the Policies or Eligible Plans. The examples below are intended to help you understand your ongoing costs (in dollars) of investing in the Portfolio, but not the costs of the Policies or Eligible Plans, and to compare these ongoing costs with the ongoing costs of investing in other mutual funds. The examples assume that you had a $1,000 investment in the Class at the beginning of the reporting period, July 1, 2011, and continued to hold your shares at the end of the reporting period, December 31, 2011.
Actual Expenses
For each Class of the Portfolio in the table below, the first line provides information about actual account values and actual expenses. You may use the information in this line, together with the amount you invested, to estimate the expenses that you paid over the period. Simply divide your account value by $1,000 (for example, an $8,600 account value divided by $1,000 = 8.6), then multiply the result by the number in the first line of each Class under the heading entitled “Expenses Paid During” to estimate the expenses you paid on your account during this period.
Hypothetical Example for Comparison Purposes
The second line of each Class in the table below provides information about hypothetical account values and hypothetical expenses based on the Class’ actual expense ratio and an assumed rate of return of 5% per year before expenses, which is not the Class’ actual return. The hypothetical account values and expenses may not be used to estimate the actual ending account balance or expenses you paid for the period. You may use this information to compare the ongoing costs of investing in the Class of the Portfolio and other portfolios. To do so, compare this 5% hypothetical example with the 5% hypothetical examples that appear in the shareholder reports of the other funds. Please note that the expenses shown in the table are meant to highlight your ongoing costs only and do not reflect any transaction costs, such as sales charges (loads) or redemption fees or the costs associated with the Policies and Eligible Plans through which the Portfolio is held. Therefore, the second line for each Class in the table is useful in comparing ongoing costs only, and will not help you determine the relative total costs of owning different portfolios. In addition, if these transaction costs were included, your costs would have been higher. The examples also assume all dividends and distributions have been reinvested.
Beginning Account Value, July 1, 2011 | Ending Account Value December 31, 2011 | Expenses Paid During July 1, 2011 | Annualized Expense Ratio | |||||||||||||
U.S. Equity Portfolio | ||||||||||||||||
Class 1 | ||||||||||||||||
Actual | $ | 1,000.00 | $ | 941.80 | $ | 3.87 | 0.79 | % | ||||||||
Hypothetical | 1,000.00 | 1,021.22 | 4.02 | 0.79 | ||||||||||||
Class 2 | ||||||||||||||||
Actual | 1,000.00 | 941.10 | 5.09 | 1.04 | ||||||||||||
Hypothetical | 1,000.00 | 1,019.96 | 5.30 | 1.04 | ||||||||||||
| * | Expenses are equal to the Portfolio’s annualized expense ratio, multiplied by the average account value over the period, multiplied by 184/365 (to reflect the one-half year period). |
| 24 | JPMORGAN INSURANCE TRUST | DECEMBER 31, 2011 | ||||
Table of Contents
BOARD APPROVAL OF INVESTMENT ADVISORY AGREEMENT
(Unaudited)
The Board of Trustees meets regularly throughout the year and considers factors that are relevant to its annual consideration of investment advisory agreements at each meeting. The Board of Trustees has established various standing committees, composed of Trustees with diverse backgrounds, to which the Board of Trustees has assigned specific subject matter responsibilities to further enhance the effectiveness of the Board’s oversight and decision making. The Board of Trustees and its investment subcommittees (money market and alternative products, equity, and fixed income) also meet for the specific purpose of considering advisory contract annual renewals. The Board of Trustees held meetings in person in June and August 2011, at which the Trustees considered the continuation of the investment advisory agreement for the Portfolio whose annual report is contained herein (the “Advisory Agreement”). At the June meeting, the Board’s investment subcommittees met to review and consider performance, expense and related information for the J.P. Morgan Funds. Each investment subcommittee reported to the full Board, which then considered the investment subcommittee’s preliminary findings. At the August meeting, the Trustees continued their review and consideration. The Trustees, including a majority of the Trustees who are not “interested persons” (as defined in the 1940 Act) of any party to the Advisory Agreement or any of their affiliates, approved the continuation of the Advisory Agreement on August 25, 2011.
The Trustees, as part of their review of the investment advisory arrangements for the J.P. Morgan Funds, considered and reviewed performance and other information received from the Advisor, on a regular basis over the course of the year, as well as information specifically prepared for their annual review. This information included the Portfolio’s performance compared to the performance of the Portfolio’s peers and benchmarks and analyses by the Advisor of the Portfolio’s performance. The Advisor also periodically provides comparative information regarding the Portfolio’s expense ratios and those of the peer groups. In addition, in preparation for the June and August meetings, the Trustees requested, received and evaluated extensive materials from the Advisor, including, with respect to certain J.P. Morgan Funds, performance and expense information compiled by Lipper Inc. (“Lipper”), an independent provider of investment company data. Prior to voting, the Trustees reviewed the proposed approval of the Advisory Agreement with representatives of the Advisor and with counsels to the Trust and independent Trustees and received a memorandum from independent counsel to the Trustees discussing the legal standards for their consideration of the proposed approval. The Trustees also discussed the proposed approvals in executive sessions with counsels to the Trust and independent Trustees at which no representatives of the Advisor were present. Set forth below is a summary of the material factors evaluated by the Trustees in determining whether to approve the Advisory Agreement.
In their deliberations, there was a comprehensive consideration of the information received by the Trustees. Each Trustee attributed different weights to the various factors and no factor alone was considered determinative. From year to year, the Trustees consider and place emphasis on relevant information in light of changing circumstances in market and economic conditions. The Trustees determined that the compensation to be received by the Advisor from the Portfolio under the Advisory Agreement was fair and reasonable and that the continuance of the investment advisory contract was in the best interests of the Portfolio and its shareholders.
The factors summarized below were considered and discussed by the Trustees in reaching their conclusions:
Nature, Extent and Quality of Services Provided by the Advisor
The Trustees received and considered information regarding the nature, extent and quality of the services provided to the Portfolio under the Advisory Agreement. The Trustees took into account information furnished throughout the year at Trustee meetings, as well as the materials furnished specifically in connection with this annual review process. The Trustees considered the background and experience of the Advisor’s senior management and the expertise of, and the amount of attention given to the Portfolio by, investment personnel of the Advisor. In addition, the Trustees reviewed the qualifications, backgrounds and responsibilities of the portfolio management team primarily responsible for the day-to-day management of the Portfolio and the infrastructure supporting the team. The Trustees also considered information provided by the Advisor and JPMorgan Distribution Services, Inc. (“JPMDS”) about the structure and distribution strategy of the Portfolio. The Trustees also reviewed information relating to the Advisor’s risk governance model and reports showing the Advisor’s compliance structure and ongoing compliance processes. The quality of the administrative services provided by JPMorgan Funds Management, Inc. (“JPMFM”), an affiliate of the Advisor, was also considered.
The Board of Trustees also considered its knowledge of the nature and quality of the services provided by the Advisor to the Portfolio gained from their experience as Trustees of the J.P. Morgan Funds. In addition, they considered the overall reputation and capabilities of the Advisor and its affiliates, the commitment of the Advisor to provide high quality service to the Portfolio, their overall confidence in the Advisor’s integrity and the Advisor’s responsiveness to questions or concerns raised by them, including the Advisor’s willingness to consider and implement organizational and operational changes designed to improve investment results and the services provided to the Portfolio.
Based on these considerations and other factors, the Trustees concluded that they were satisfied with the nature, extent and quality of the investment advisory services provided to the Portfolio by the Advisor.
| DECEMBER 31, 2011 | JPMORGAN INSURANCE TRUST | 25 | ||||||
Table of Contents
BOARD APPROVAL OF INVESTMENT ADVISORY AGREEMENT
(Unaudited) (continued)
Costs of Services Provided and Profitability to the Advisor and its Affiliates
The Trustees received and considered information regarding the profitability to the Advisor and its affiliates in providing services to the Portfolio. The Trustees reviewed and discussed this data. The Trustees recognized that this data is not audited and represents the Advisor’s determination of its and its affiliates’ revenues from the contractual services provided to the Portfolio, less expenses of providing such services. Expenses include direct and indirect costs and are calculated using an allocation methodology developed by the Advisor. The Trustees also recognized that it is difficult to make comparisons of profitability from fund investment advisory contracts because comparative information is not generally publicly available and is affected by numerous factors, including the structure of the particular adviser, the types of funds it manages, its business mix, numerous assumptions regarding allocations and the fact that publicly-traded fund managers’ operating profits and net income are net of distribution and marketing expenses. Based on their review, the Trustees concluded that the profitability to the Advisor under the Advisory Agreement was not unreasonable in light of the services and benefits provided to the Portfolio.
Fall-Out Benefits
The Trustees reviewed information regarding potential “fallout” or ancillary benefits received by the Advisor and its affiliates as a result of their relationship with the Portfolio. The Board also considered that the Advisor uses third-party soft dollar arrangements with respect to securities transactions it executes for the Portfolio.
The Trustees also considered that JPMFM earns fees from the Portfolio for providing administrative services. These fees were shown separately in the profitability analysis presented to the Trustees. The Trustees also considered the payments of Rule 12b-1 fees to JPMDS, an affiliate of the Advisor, which also acts as the Portfolio’s distributor and that these fees are in turn generally paid to financial intermediaries that sell the J.P. Morgan Funds, including financial intermediaries that are affiliates of the Advisor. The Trustees also considered the fees paid to JPMorgan Chase Bank, N.A. (“JPMCB”) for custody and fund accounting and other related services.
Economies of Scale
The Trustees noted that the proposed investment advisory fee schedule for the Portfolio does not contain breakpoints. The Trustees considered whether it would be appropriate to add advisory fee breakpoints and the Trustees concluded that the current fee structure was reasonable in light of the fee waivers and expense limitations that the Advisor has in place that serve to limit the overall net expense ratio at competitive levels. The Trustees also recognized that the fee schedule for the
administrative services provided by JPMFM does include a fee breakpoint, which is tied to the overall level of non-money market fund assets excluding certain funds-of-funds, as applicable, advised by the Advisor, and that the Portfolio benefits from that breakpoint. The Trustees concluded that shareholders benefited from the lower expense ratios which resulted from these factors.
Independent Written Evaluation of the Portfolio’s Chief Compliance Officer
The Trustees noted that, upon their direction, the Chief Compliance Officer for the Portfolio had prepared an independent written evaluation in order to assist the Trustees in determining the reasonableness of the proposed management fees. The Trustees considered the written evaluation in determining whether to continue the Advisory Agreement.
Fees Relative to Advisor’s Other Clients
The Trustees received and considered information about the nature and extent of investment advisory services and fee rates offered to other clients of the Advisor for investment management styles substantially similar to that of the Portfolio. The Trustees also considered the complexity of investment management for the Portfolio relative to the Advisor’s other clients and the differences in the nature and extent of the services provided to the different clients. The Trustees concluded that the fee rates charged to the Portfolio in comparison to those charged to the Advisor’s other clients were reasonable.
Investment Performance
The Trustees received and considered absolute and/or relative performance for the Portfolio in a report prepared by Lipper. The Trustees considered the total return performance information, which included the ranking of the Portfolio within a performance universe made up of funds with the same Lipper investment classification and objective (the “Universe Group”) by total return for applicable one-, three- and five-year periods. The Trustees reviewed a description of Lipper’s methodology for selecting mutual funds in the Portfolio’s Universe Group. The Lipper materials provided to the Trustees highlighted information with respect to a representative class to assist the Trustees in their review. As part of this review, the Trustees also reviewed the Portfolio’s performance against its benchmark and considered the performance information provided for the Portfolio at regular Board meetings by the Advisor. The Lipper performance data noted by the Trustees as part of their review and the determinations made by the Trustees with respect to the Portfolio’s performance are summarized below:
The Trustees noted the Portfolio’s performance was in the third, first and first quintiles for Class 1 shares for the one-, three-, and five-year periods ended December 31, 2010, respectively. The Trustees discussed the performance and investment strategy of the Portfolio with the Advisor and,
| 26 | JPMORGAN INSURANCE TRUST | DECEMBER 31, 2011 | ||||
Table of Contents
based upon this discussion and other factors, concluded that the performance was reasonable.
Advisory Fees and Expense Ratios
The Trustees considered the contractual advisory fee rate paid by the Portfolio to the Advisor and compared that rate to the information prepared by Lipper concerning management fee rates paid by other funds in the same Lipper category as the Portfolio. The Trustees recognized that Lipper reported the Portfolio’s management fee rate as the combined contractual advisory fee and the administration fee rates. The Trustees considered the fee waiver and/or expense reimbursement arrangements currently in place for the
Portfolio and considered the net advisory fee rate after taking into account any waivers and/or reimbursements. The Trustees recognized that it is difficult to make comparisons of advisory fees because there are variations in the services that are included in the fees paid by other funds. The Trustees’ determinations as a result of the review of the Portfolio’s advisory fees and expense ratios are summarized below:
The Trustees noted that the Portfolio’s net advisory fee and actual total expenses for Class 1 shares were both in the second quintile of their Universe Group. After considering the factors identified above, in light of this information, the Trustees concluded that the advisory fees were reasonable.
| DECEMBER 31, 2011 | JPMORGAN INSURANCE TRUST | 27 | ||||||
Table of Contents
(Unaudited)
Certain tax information for the J.P. Morgan Funds is required to be provided to shareholders based upon the Funds’ income and distributions for the taxable year ended December 31, 2011. The information and distributions reported in this letter may differ from the information and taxable distributions reported to the shareholders for the calendar year ending December 31, 2011. The information necessary to complete your income tax returns for the calendar year ending December 31, 2011 will be received under separate cover.
Dividends Received Deductions (DRD)
100.0% of ordinary income distributions were eligible for the 70% dividend received deduction for corporate rate shareholders for the fiscal year ended December 31, 2011.
| 28 | JPMORGAN INSURANCE TRUST | DECEMBER 31, 2011 | ||||
Table of Contents
J.P. Morgan Funds are distributed by JPMorgan Distribution Services, Inc., which is an affiliate of JPMorgan Chase & Co. Affiliates of JPMorgan Chase & Co. receive fees for providing various services to the funds.
Contact JPMorgan Distribution Services, Inc. at 1-800-480-4111 for a portfolio prospectus. You can also visit us at www.jpmorganfunds.com. Investors should carefully consider the investment objectives and risk as well as charges and expenses of the mutual fund before investing. The prospectus contains this and other information about the mutual fund. Read the prospectus carefully before investing.
The Portfolio files a complete schedule of its portfolio holdings for the first and third quarters of its fiscal year with the SEC on Form N-Q. The Portfolio’s Forms N-Q are available on the SEC’s website at http://www.sec.gov and may be reviewed and copied at the SEC’s Public Reference Room in Washington, DC. Information on the operation of the SEC’s Public Reference Room may be obtained by calling 1-800-SEC-0330. Shareholders may request the Form N-Q without charge by calling 1-800-480-4111 or by visiting the variable insurance portfolio section of the J.P. Morgan Funds’ website at www.jpmorganfunds.com.
A description of the Portfolio’s policies and procedures with respect to the disclosure of the Portfolio’s holdings is available in the prospectus and Statement of Additional Information.
A copy of proxy policies and procedures is available without charge upon request by calling 1-800-480-4111 and a description of such policies and procedures is on the SEC’s website at www.sec.gov. The Trustees have delegated the authority to vote proxies for securities owned by the Portfolio to the Advisor. A copy of the Portfolio’s voting record for the most recent 12-month period ended June 30 is available on the SEC’s website at www.sec.gov or at the Portfolio’s website at www.jpmorganfunds.com no later than August 31 of each year. The Portfolio’s proxy voting record will include, among other things, a brief description of the matter voted on for each portfolio security, and will state how each vote was cast, for example, for or against the proposal.
Table of Contents
| © JPMorgan Chase & Co., 2012. All rights reserved. December 2011. | AN-JPMITUSEP-1211 |
Table of Contents
ITEM 2. CODE OF ETHICS.
Disclose whether, as of the end of the period covered by the report, the registrant has adopted a code of ethics that applies to the registrant’s principal executive officer, principal financial officer, principal accounting officer or controller, or persons performing similar functions, regardless of whether these individuals are employed by the registrant or a third party. If the registrant has not adopted such a code of ethics, explain why it has not done so.
The registrant must briefly describe the nature of any amendment, during the period covered by the report, to a provision of its code of ethics that applies to the registrant’s principal executive officer, principal financial officer, principal accounting officer or controller, or persons performing similar functions, regardless of whether these individuals are employed by the registrant or a third party, and that relates to any element of the code of ethics definition enumerated in paragraph (b) of this Item. The registrant must file a copy of any such amendment as an exhibit pursuant to Item 12(a)(1), unless the registrant has elected to satisfy paragraph (f) of this Item by positing its code of ethics on its website pursuant to paragraph (f)(2) of this Item, or by undertaking to provide its code of ethics to any person without charge, upon request, pursuant to paragraph (f)(3) of this Item.
If the registrant has, during the period covered by the report, granted a waiver, including an implicit waiver, from a provision of the code of ethics that applies to the registrant’s principal executive officer, principal financial officer, principal accounting officer or controller, or persons performing similar functions, regardless of whether these individuals are employed by the registrant or third party, that relates to one or more items set forth in paragraph (b) of this Item, the registrant must briefly describe the nature of the waiver, the name of the person to whom the waiver was granted, and the date of the waiver.
The Registrant has adopted a code of ethics that applies to the Registrant’s principal executive officer and principal financial officer. There were no amendments to the code of ethics or waivers granted with respect to the code of ethics in the period covered by the report.
ITEM 3. AUDIT COMMITTEE FINANCIAL EXPERT.
(a) (1) Disclose that the registrant’s board of directors has determined that the registrant either:
(i) Has at least one audit committee financial expert serving on its audit committee; or
(ii) Does not have an audit committee financial expert serving on its audit committee.
The Registrant’s Board of Trustees has determined that the Registrant has at least one audit committee financial expert serving on its audit committee. The Securities and Exchange Commission has stated that the designation or identification of a person as an audit committee financial expert pursuant to this Item 3 of Form N-CSR does not impose on such person any duties, obligations or liabilities that are greater than the duties, obligations and liabilities imposed on such person as a member of the Audit Committee and the Board of Trustees in the absence of such designation or identification.
(2) If the registrant provides the disclosure required by paragraph (a)(1)(i) of this Item, it must disclose the name of the audit committee financial expert and whether that person is “independent.” In order to be considered “independent” for purposes of this Item, a member of an audit committee may not, other than in his or her capacity as a member of the audit committee, the board of directors, or any other board committee:
(i) Accept directly or indirectly any consulting, advisory, or other compensatory fee from the issuer; or
(ii) Be an “interested person” of the investment company as defined in Section 2(a)(19) of the Act (15 U.S.C. 80a-2(a)(19)).
The audit committee financial expert is John F. Finn. He is not an “interested person” of the Registrant and is also “independent” as defined by the U.S. Securities and Exchange Commission for purposes of audit committee financial expert determinations.
(3) If the registrant provides the disclosure required by paragraph (a)(1)(ii) of this Item, it must explain why it does not have an audit committee financial expert.
Not applicable.
Table of Contents
ITEM 4. PRINCIPAL ACCOUNTANT FEES AND SERVICES.
(a) Disclose, under the caption Audit Fees, the aggregate fees billed for each of the last two fiscal years for professional services rendered by the principal accountant for the audit of the registrant’s annual financial statements or services that are normally provided by the accountant in connection with statutory and regulatory filings or engagements for those fiscal years.
| 000000000000 | 000000000000 | |||
AUDIT FEES | ||||
| 2011 — $261,700 | ||||
| 2010 — $258,900 |
(b) Disclose, under the caption Audit-Related Fees, the aggregate fees billed in each of the last two fiscal years for assurance and related services by the principal accountant that are reasonably related to the performance of the audit of the registrant’s financial statements and are not reported under paragraph (a) of this Item. Registrants shall describe the nature of the services comprising the fees disclosed under this category.
AUDIT-RELATED FEES
| 000000000000 | 000000000000 | |||
| 2011 — $108,070 | ||||
| 2010 — $106,200 |
Audit-related fees consists of semi-annual financial statement reviews and security count procedures performed as required under Rule 17f-2 of the Investment Company Act of 1940 during the Registrant’s fiscal year.
(c) Disclose, under the caption Tax Fees, the aggregate fees billed in each of the last two fiscal years for professional services rendered by the principal accountant for tax compliance, tax advice, and tax planning. Registrants shall describe the nature of the services comprising the fees disclosed under this category.
| 000000000000 | 000000000000 | |||
TAX FEES | ||||
| 2011 — $52,550 | ||||
| 2010 — $53,000 |
The tax fees consist of fees billed in connection with preparing the federal regulated investment company income tax returns for the Registrant for the tax years ended December 31, 2011 and 2010, respectively.
For the last fiscal year, no tax fees were required to be approved pursuant to paragraph (c)(7)(ii) of Rule 2-01 of Regulation S-X.
(d) Disclose, under the caption All Other Fees, the aggregate fees billed in each of the last two fiscal years for products and services provided by the principal accountant, other than the services reported in paragraphs (a) through (c) of this Item. Registrants shall describe the nature of the services comprising the fees disclosed under this category.
ALL OTHER FEES
| 000000000000 | 000000000000 | |||
| 2011 — Not applicable | ||||
| 2010 — Not applicable |
(e) (1) Disclose the audit committee’s pre-approval policies and procedures described in paragraph (c)(7) of Rule 2-01 of Regulation S-X.
Pursuant to the Registrant’s Audit Committee Charter and written policies and procedures for the pre-approval of audit and non-audit services (the “Pre-approval Policy”), the Audit Committee pre-approves all audit and non-audit services performed by the Registrant’s independent public registered accounting firm for the Registrant. In addition, the Audit Committee pre-approves the auditor’s engagement for non-audit services with the Registrant’s investment adviser (not including a sub-adviser whose role is primarily portfolio management and is sub-contracted or overseen by another investment adviser) and any Service Affiliate in accordance with paragraph (c)(7)(ii) of Rule 2-01 of Regulation S-X, if the
Table of Contents
engagement relates directly to the operations and financial reporting of the Registrant. Proposed services may be pre-approved either 1) without consideration of specific case-by-case services or 2) require the specific pre-approval of the Audit Committee. Therefore, initially the Pre-approval Policy listed a number of audit and non-audit services that have been approved by the Audit Committee, or which were not subject to pre-approval under the transition provisions of Sarbanes-Oxley Act of 2002 (the “Pre-approval List”). The Audit Committee annually reviews and pre-approves the services included on the Pre-approval List that may be provided by the independent public registered accounting firm without obtaining additional specific pre-approval of individual services from the Audit Committee. The Audit Committee adds to, or subtracts from, the list of general pre-approved services from time to time, based on subsequent determinations. All other audit and non-audit services not on the Pre-approval List must be specifically pre-approved by the Audit Committee.
One or more members of the Audit Committee may be appointed as the Committee’s delegate for the purposes of considering whether to approve such services. Any pre-approvals granted by the delegate will be reported, for informational purposes only, to the Audit Committee at its next scheduled meeting. The Audit Committee’s responsibilities to pre-approve services performed by the independent public registered accounting firm are not delegated to management.
(2) Disclose the percentage of services described in each of paragraphs (b) through (d) of this Item that were approved by the audit committee pursuant to paragraph (c)(7)(i)(C) of Rule 2-01 of Regulation S-X.
| 00000000000000 | 00000000000000 | |||
| 2011 — 0.0% | ||||
| 2010 — 0.0% |
(f) If greater than 50 percent, disclose the percentage of hours expended on the principal accountant’s engagement to audit the registrant’s financial statements for the most recent fiscal year that were attributed to work performed by persons other than the principal accountant’s full-time, permanent employees.
None.
(g) Disclose the aggregate non-audit fees billed by the registrant’s accountant for services rendered to the registrant, and rendered to the registrant’s investment adviser (not including any sub-adviser whose role is primarily portfolio management and is subcontracted with or overseen by another investment adviser), and any entity controlling, controlled by, or under common control with the adviser that provides ongoing services to the registrant for each of the last two fiscal years of the registrant.
The aggregate non-audit fees billed by the independent registered public accounting firm for services rendered to the Registrant, and rendered to Service Affiliates, for the last two calendar year ends were:
| 00000000000000 | 00000000000000 | |||
| 2011 — $28.7 million | ||||
| 2010 — $32.2 million |
(h) Disclose whether the registrant’s audit committee of the board of directors has considered whether the provision of non-audit services that were rendered to the registrant’s investment adviser (not including any subadviser whose role is primarily portfolio management and is subcontracted with or overseen by another investment adviser), and any entity controlling, controlled by, or under common control with the investment adviser that provides ongoing services to the registrant that were not pre-approved pursuant to paragraph (c)(7)(ii) of Rule 2-01 of Regulation S-X is compatible with maintaining the principal accountant’s independence.
The Registrant’s Audit Committee has considered whether the provision of the non-audit services that were rendered to Service Affiliates that were not pre-approved (not requiring pre-approval) is compatible with maintaining the independent public registered accounting firm’s independence. All services provided by the independent public registered accounting firm to the Registrant or to Service Affiliates that were required to be pre-approved were pre-approved as required.
ITEM 5. AUDIT COMMITTEE OF LISTED REGISTRANTS.
(a) If the registrant is a listed issuer as defined in Rule 10A-3 under the Exchange Act (17CFR 240.10A-3), state whether or not the registrant has a separately-designated standing audit committee established in accordance with Section 3(a)(58)(A) of the Exchange Act (15 U.S.C. 78c(a)(58)(A)). If the registrant has such a committee, however designated, identify each committee member. If the entire board of directors is acting as the registrant’s audit committee as specified in Section 3(a)(58)(B) of the Exchange Act (15 U.S.C. 78c(a)(58)(B)), so state.
Table of Contents
(b) If applicable, provide the disclosure required by Rule 10A-3(d) under the Exchange Act (17CFR 240.10A-3(d)) regarding an exemption from the listing standards for all audit committees.
Not applicable.
ITEM 6. SCHEDULE OF INVESTMENTS.
File Schedule I – Investments in securities of unaffiliated issuers as of the close of the reporting period as set forth in Section 210.12-12 of Regulation S-X, unless the schedule is included as part of the report to shareholders filed under Item 1 of this Form.
Included in Item 1.
ITEM 7. DISCLOSURE OF PROXY VOTING POLICIES AND PROCEDURES FOR CLOSED-END MANAGEMENT INVESTMENT COMPANIES.
A closed-end management investment company that is filing an annual report on this Form N-CSR must, unless it invests exclusively in non-voting securities, describe the policies and procedures that it uses to determine how to vote proxies relating to portfolio securities, including the procedures that the company uses when a vote presents a conflict between the interests of its shareholders, on the one hand, and those of the company’s investment adviser; principal underwriter; or any affiliated person (as defined in Section 2(a)(3) of the Investment Company Act of 1940 (15 U.S.C. 80a-2(a)(3)) and the rules thereunder) of the company, its investment adviser, or its principal underwriter, on the other. Include any policies and procedures of the company’s investment adviser, or any other third party, that the company uses, or that are used on the company’s behalf, to determine how to vote proxies relating to portfolio securities.
Not applicable.
ITEM 8. PORTFOLIO MANAGERS OF CLOSED-END MANAGEMENT INVESTMENT COMPANIES.
Not applicable.
ITEM 9. PURCHASE OF EQUITY SECURITIES BY CLOSED-END MANAGEMENT INVESTMENT COMPANY AND AFFILIATED PURCHASERS.
(a) If the registrant is a closed-end management investment company, provide the information specified in paragraph (b) of this Item with respect to any purchase made by or on behalf of the registrant or any “affiliated purchaser,” as defined in Rule 10b-18(a)(3) under the Exchange Act (17 CFR 240.10b-18(a)(3)), of shares or other units of any class of the registrant’s equity securities that is registered by the registrant pursuant to Section 12 of the Exchange Act (15 U.S.C. 781).
Not applicable.
ITEM 10. SUBMISSION OF MATTERS TO A VOTE OF SECURITY HOLDERS.
Describe any material changes to the procedures by which shareholders may recommend nominees to the registrant’s board of directors, where those changes were implemented after the registrant last provided disclosure in response to the requirements of Item 7(d)(2)(ii)(G) of Schedule 14A (17 CFR 240.14a-101), or this Item.
No material changes to report.
ITEM 11. CONTROLS AND PROCEDURES.
(a) Disclose the conclusions of the registrant’s principal executive and principal financial officers, or persons performing similar functions, regarding the effectiveness of the registrant’s disclosure controls and procedures (as defined in Rule 30a-3(c) under the Act (17 CFR 270.30a-3(c))) as of a date within 90 days of the filing date of the report that includes the disclosure required by this paragraph, based on the evaluation of these controls and procedures required by Rule 30a-3(b) under the Act (17 CFR 270.30a-3(b)) and Rules 13a-15(b) or 15d-15(b) under the Exchange Act (17 CFR 240.13a-15(b) or 240.15d-15(b)).
Table of Contents
The Registrant’s principal executive and principal financial officers have concluded, based on their evaluation of the Registrant’s disclosure controls and procedures as of a date within 90 days of the filing date of this report, that the Registrant’s disclosure controls and procedures are reasonably designed to ensure that information required to be disclosed by the Registrant on Form N-CSR is recorded, processed, summarized and reported within the required time periods and that information required to be disclosed by the Registrant in the reports that it files or submits on Form N-CSR is accumulated and communicated to the Registrant’s management, including its principal executive and principal financial officers, as appropriate to allow timely decisions regarding required disclosure.
(b) Disclose any change in the registrant’s internal control over financial reporting (as defined in Rule 30a-3(d) under the Act (17 CFR 270.30a-3(d)) that occurred during the registrant’s second fiscal quarter of the period covered by this report that has materially affected, or is reasonably likely to materially affect, the registrant’s internal control over financial reporting.
There were no changes in the Registrant’s internal control over financial reporting that occurred during the last fiscal quarter covered by this report that have materially affected, or are reasonably likely to materially affect, the Registrant’s internal control over financial reporting.
ITEM 12. EXHIBITS.
(a) File the exhibits listed below as part of this Form. Letter or number the exhibits in the sequence indicated.
(a)(1) Any code of ethics, or amendment thereto, that is the subject of the disclosure required by Item 2, to the extent that the registrant intends to satisfy the Item 2 requirements through filing of an exhibit.
Code of Ethics applicable to its Principal Executive and Principal Financial Officers pursuant to Section 406 of the Sarbanes-Oxley Act of 2002 attached hereto.
(a)(2) A separate certification for each principal executive officer and principal financial officer of the registrant as required by Rule 30a-2(a) under the Act (17 CFR 270.30a-2).
Certifications pursuant to Rule 30a-2(a) under the Investment Company Act of 1940 are attached hereto.
(a)(3) Any written solicitation to purchase securities under Rule 23c-1 under the Act (17 CFR 270.23c-1) sent or given during the period covered by the report by or on behalf of the registrant to 10 or more persons.
Not applicable.
(b) A separate or combined certification for each principal executive officer and principal officer of the registrant as required by Rule 30a-2(b) under the Act of 1940.
Certifications pursuant to Rule 30a-2(b) under the Investment Company Act of 1940 are attached hereto.
Table of Contents
SIGNATURES
Pursuant to the requirements of the Securities Exchange Act of 1934 and the Investment Company Act of 1940, the registrant has duly caused this report to be signed on its behalf by the undersigned, thereunto duly authorized.
| JPMorgan Insurance Trust | ||
| By: | /s/ Patricia A. Maleski | |
| Patricia A. Maleski | ||
President and Principal Executive Officer March 5, 2012 | ||
Pursuant to the requirements of the Securities Exchange Act of 1934 and the Investment Company Act of 1940, this report has been signed below by the following persons on behalf of the registrant and in the capacities and on the dates indicated.
| By: | /s/ Patricia A. Maleski | |
| Patricia A. Maleski | ||
President and Principal Executive Officer March 5, 2012 | ||
| By: | /s/ Joy C. Dowd | |
| Joy C. Dowd | ||
Treasurer and Principal Financial Officer March 5, 2012 | ||