Table of Contents
UNITED STATES
SECURITIES AND EXCHANGE COMMISSION
Washington, D.C. 20549
FORM N-CSR
CERTIFIED SHAREHOLDER REPORT OF REGISTERED
MANAGEMENT INVESTMENT COMPANIES
Investment Company Act file number: 811-07874
JPMorgan Insurance Trust
(Exact name of registrant as specified in charter)
270 Park Avenue
New York, NY 10017
(Address of principal executive offices) (Zip code)
Frank J. Nasta
270 Park Avenue
New York, NY 10017
(Name and Address of Agent for Service)
Registrant’s telephone number, including area code: (800) 480-4111
Date of fiscal year end: December 31
Date of reporting period: January 1, 2013 through December 31, 2013
Form N-CSR is to be used by management investment companies to file reports with the Commission not later than 10 days after the transmission to stockholders of any report that is required to be transmitted to stockholders under Rule 30e-1 under the Investment Company Act of 1940 (17 CFR 270.30e-1). The Commission may use the information provided on Form N-CSR in its regulatory, disclosure review, inspection, and policymaking roles.
A registrant is required to disclose the information specified by Form N-CSR, and the Commission will make this information public. A registrant is not required to respond to the collection of information contained in Form N-CSR unless the Form displays a currently valid Office of Management and Budget (“OMB”) control number. Please direct comments concerning the accuracy of the information collection burden estimate and any suggestions for reducing the burden to Secretary, Securities and Exchange Commission, 450 Fifth Street, NW, Washington, DC 20549-0609. The OMB has reviewed this collection of information under the clearance requirements of 44 U.S.C. Section 3507.
Table of Contents
ITEM 1. REPORTS TO STOCKHOLDERS.
The following is a copy of the report transmitted to shareholders pursuant to Rule 30e-1 under the Investment Company Act of 1940 (17 CFR 270.30e-1).
Table of Contents
Annual Report
JPMorgan Insurance Trust
December 31, 2013
JPMorgan Insurance Trust Core Bond Portfolio
NOT FDIC INSURED Ÿ NO BANK GUARANTEE Ÿ MAY LOSE VALUE
|  |
Table of Contents
CONTENTS
Investments in the Portfolio are not bank deposits or obligations of, or guaranteed or endorsed by, any bank and are not insured or guaranteed by the FDIC, the Federal Reserve Board or any other government agency. You could lose money if you sell when the Portfolio’s share price is lower than when you invested.
Past performance is no guarantee of future performance. The general market views expressed in this report are opinions based on market and other conditions through the end of the reporting period and are subject to change without notice. These views are not intended to predict the future performance of the Portfolio or the securities markets. References to specific securities and their issuers are for illustrative purposes only and are not intended to be, and should not be interpreted as, recommendations to purchase or sell such securities. Such views are not meant as investment advice and may not be relied on as an indication of trading intent on behalf of the Portfolio.
This Portfolio is intended to be a funding vehicle for variable annuity contracts and variable life insurance policies (collectively “Policies”) offered by separate accounts of participating insurance companies. Portfolio shares are also offered through qualified pension and retirement plans (“Eligible Plans”). Individuals may not purchase shares directly from the Portfolio.
Prospective investors should refer to the Portfolio’s prospectus for a discussion of the Portfolio’s investment objective, strategies and risks. Call J.P. Morgan Funds Service Center at 1-800-480-4111 for a prospectus containing more complete information about the Portfolio, including management fees and other expenses. Please read it carefully before investing.
Table of Contents
January 23, 2014 (Unaudited)
Dear Shareholder,
Equities markets in developed economies performed strongly in the face of periodic spikes in volatility throughout the twelve months ended December 31, 2013. Healthy corporate earnings and incremental but steady improvements in a range of economic indicators provided a positive backdrop for investors seeking returns in the low interest rate environment. While political discord in Washington injected volatility into the market, a bipartisan budget agreement at the end of the year relieved much of the political uncertainty created by partisan brinkmanship over the so-called fiscal cliff and the partial shutdown of the federal government in October. In the first half of the year, the U.S. Federal Reserve (“Fed”) announced its intention to taper off its $85 billion in monthly asset purchases and the statement weakened investor sentiment and set off widespread speculation about the timing and magnitude of such a move. The Fed followed through in December, deciding to reduce its monthly purchases by $10 billion. The news, along with robust gains in jobs, housing and consumer sentiment, drove U.S. equities to new highs. The S&P 500 stock index hit seven closing highs in the final month of the reporting period, finishing 2013 with its best performance since 1997.
 |
“While a repeat of the equity performance we experienced in 2013 may be a tall order, we believe stocks in the U.S. and Europe may continue to show gains.” |
Overseas, the European Central Bank reaffirmed its commitment to accommodative monetary policy and to the euro itself. In the second quarter of the year, the European Union (EU) returned to positive growth and at the end of the year, Ireland became the first nation to exit from its European Union bailout program. The Fed’s decision to curb its asset purchases also sent equities higher in Europe, as investors viewed the move as a sign of further economic stability. In Japan, equity markets rebounded to their best year since 1988, benefiting from Prime Minister Shinzo Abe’s efforts to revive the economy. Low returns on bonds and short-term debt instruments also drove investors into stocks.
Emerging market equities were weaker overall. As of December 31, 2013, the MSCI Emerging Markets Index returned -2.3% for the year. China’s economy showed signs of slower growth during the year and the Fed’s decision to taper its asset purchase program set off speculation that the maturation of the emerging markets credit cycle would push yield-seeking investors to rotate into developed markets.
Taper Talk Pressures Bonds
Fixed income markets generally remained weak during the year, as central bankers across the globe held interest rates at historic lows. However, benchmark bond yields rose on an
annual basis for the first time since 2009. During the year, the Fed’s talk of tapering off its Quantitative Easing (QE) program hurt fixed income markets. U.S. Treasury security yields continued to be low from a historical perspective, but ended the period higher. The yield for 10-year U.S. Treasury securities ended December 31, 2013 at 3.04%, while the yields for 2- and 30-year U.S. Treasury securities finished the reporting period at 0.38% and 3.96%, respectively. High-yield debt returned 7.4% for the year, as measured by the Barclays US High Yield Corporate Index, while other U.S. debt securities and emerging market debt both had negative returns.
While global economic growth accelerated during the year, the U.S. recovery in particular showed stronger fundamentals and the Fed’s decision to taper its QE program was a response to the improved picture. Europe emerged from its lengthy recession and the worst of the fiscal crises seem to be behind it, though unemployment remains strikingly high in many EU nations. Japan made progress toward ending persistent deflation, but Tokyo’s monetary and fiscal stimulus has sharply weakened the yen, putting other Asian exporting nations — notably China and South Korea — at a competitive disadvantage. Emerging market economies may face further headwinds as foreign investment shrinks and economic growth moderates from recent strength. Moreover, political instability — already apparent in Thailand and Turkey — may surface in other emerging market nations as governments struggle to deliver improved living standards and respond to demands for political reforms.
The Long-Term Lens
We welcome the Fed’s move to curb its QE program as a sign that the U.S. economy’s need for artificial stimulus is waning. While a repeat of the equity performance we experienced in 2013 may be a tall order, we believe stocks in the U.S. and Europe may continue to show gains. In the fixed-income market, persistent weakness has led to attractive valuations in some sectors. The past year’s market swings and intermittent volatility underlined the importance of maintaining a long-term view of your investment portfolio and the benefits derived from diversified holdings.
On behalf of everyone at J.P. Morgan Asset Management, thank you for your continued support. We look forward to managing your investment needs for years to come. Should you have any questions, please visit www.jpmorganfunds.com or contact the J.P. Morgan Funds Service Center at 1-800-480-4111.
Sincerely yours,

George C.W. Gatch
CEO, Global Funds Management
J.P. Morgan Asset Management
| DECEMBER 31, 2013 | JPMORGAN INSURANCE TRUST | 1 | ||||||
Table of Contents
JPMorgan Insurance Trust Core Bond Portfolio
TWELVE MONTHS ENDED DECEMBER 31, 2013 (Unaudited)
| REPORTING PERIOD RETURN: | ||||
| Fund (Class 1 Shares)* | -1.47% | |||
| Barclays U.S. Aggregate Index | -2.02% | |||
| Net Assets as of 12/31/2013 | $ | 201,916,409 | ||
| Duration as of 12/31/2013 | 4.63 years | |||
INVESTMENT OBJECTIVE**
The JPMorgan Insurance Trust Core Bond Portfolio (the “Portfolio”) seeks to maximize total return by investing primarily in a diversified portfolio of intermediate- and long-term debt securities.
HOW DID THE MARKET PERFORM?
Improving economic data led risk assets to strengthen over the reporting period despite the prospect of the U.S. Federal Reserve Bank (“Fed”) beginning to taper its asset purchases. Equity markets hit record highs, with the Standard & Poor’s 500 Index gaining 30% and the Dow Industrials Average climbing 27% in 2013. Even with political wrangling over the debt ceiling in October, interest rates stayed within a narrow range until the announcement of a strong October employment report, leading some market participants to predict that the Fed might begin to reduce its asset purchases as early as December. Meanwhile, the euro zone moved out of recession in the third quarter of 2013, and economic data suggested that the economic expansion continued through the end of the calendar year. The euro zone composite Purchasing Managers Index ended the year at 52.1 points, a three-month high. Despite the improving economic backdrop, an unhealthy low level of inflation led the European Central Bank (ECB) to reduce its benchmark interest rate to a record low of 0.25% in November. While this move was welcomed by markets, investors wondered what else the ECB would do in the future to deal with low and falling inflation.
WHAT WERE THE MAIN DRIVERS OF THE PORTFOLIO’S PERFORMANCE?
The Portfolio outperformed the Barclays U.S. Aggregate Index (the “Benchmark”) for the year ended December 31, 2013. The Portfolio’s underweight to U.S. Treasury debt was a benefit to performance, as spread sectors outperformed their risk-free counterpart. Within Treasuries, the bellwether 30-year bond was the worst performer, declining -3.56% during the fourth quarter. The Portfolio’s mortgage allocation also outperformed index pass-throughs during the quarter. Lower coupon mortgages, which are a large part of the index and of the Fed pur-
chase program, sold off as economic data improved and “taper” entered the everyday investment lexicon. The Portfolio generally avoided newly issued, generic mortgage collateral in return for more specific collateral attributes, which the Portfolio’s managers believed may provide better total return prospects. The year also saw spreads on investment grade corporate bonds tighten by 27 basis points with option-adjusted spread moving from 141 to 114 points. This puts U.S. corporate spreads at their tightest levels since the summer of 2007. The Portfolio’s underweight to corporate debt was a slight detractor from performance on the quarter as credit outperformed mortgages on a duration- neutral basis. Duration measures the price sensitivity of fixed income investments to changes in interest rates.
The Portfolio’s yield curve positioning was a slight detractor from relative performance, as the Portfolio remained overweight to the 5-10 year part of the curve, which rose the most in absolute terms. The yield curve measures the differences in interest rates on bonds of different maturity dates. The Portfolio’s slightly shorter duration posture compared with the Benchmark was a benefit to performance.
HOW WAS THE PORTFOLIO POSITIONED?
The Portfolio’s primary strategy continued to be security selection and relative value, which seeks to identify undervalued bonds between individual securities and across market sectors. The Portfolio managers used bottom-up fundamental research to construct, in their view, a portfolio of undervalued fixed income securities. Portfolio construction is strategic in nature, so sector allocation changes should be gradual and a function of relative value. The Portfolio remained underweight in U.S. Treasury securities, underweight in corporate debt, and overweight mortgage-backed securities, which include both agency and non-agency securities. The Portfolio was overweight in the intermediate part of the yield curve (U.S. Treasury securities with 5 to 10 year maturities) as the Portfolio’s managers believed that these U.S. Treasuries had the most attractive risk/reward profile. The Portfolio maintained its shorter duration posture during the calendar year.
| 2 | JPMORGAN INSURANCE TRUST | DECEMBER 31, 2013 | ||||
Table of Contents
PORTFOLIO COMPOSITION*** | ||||
| Collateralized Mortgage Obligations | 28.0 | % | ||
| U.S. Treasury Obligations | 25.9 | |||
| Corporate Bonds | 16.3 | |||
| U.S. Government Agency Securities | 13.7 | |||
| Mortgage Pass-Through Securities | 7.7 | |||
| Commercial Mortgage-Backed Securities | 2.6 | |||
| Asset-Backed Securities | 1.8 | |||
| Others (each less than 1.0%) | 0.4 | |||
| Short-Term Investment | 3.6 | |||
| * | The return shown is based on net asset values calculated for shareholder transactions and may differ from the return shown in the financial highlights, which reflects adjustments made to the net asset values in accordance with accounting principles generally accepted in the United States of America. |
| ** | The adviser seeks to achieve the Portfolio’s objective. There can be no guarantee it will be achieved. |
| *** | Percentages indicated are based on total investments as of December 31, 2013. The Portfolio’s composition is subject to change. |
| DECEMBER 31, 2013 | JPMORGAN INSURANCE TRUST | 3 | ||||||
Table of Contents
JPMorgan Insurance Trust Core Bond Portfolio
PORTFOLIO COMMENTARY
TWELVE MONTHS ENDED DECEMBER 31, 2013 (Unaudited) (continued)
AVERAGE ANNUAL TOTAL RETURNS AS OF DECEMBER 31, 2013 | ||||||||||||||||
| INCEPTION DATE OF CLASS | 1 YEAR | 5 YEAR | 10 YEAR | |||||||||||||
CLASS 1 SHARES | 5/1/97 | (1.47 | )% | 5.96 | % | 4.79 | % | |||||||||
CLASS 2 SHARES | 8/16/06 | (1.74 | ) | 5.68 | 4.60 | |||||||||||
TEN YEAR PERFORMANCE (12/31/03 TO 12/31/13)
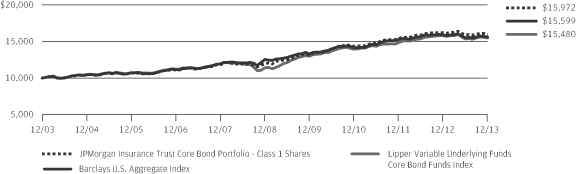
The performance quoted is past performance and is not a guarantee of future results. Mutual funds are subject to certain market risks. Investment returns and principal value of an investment will fluctuate so that an investor’s shares, when redeemed, may be worth more or less than their original cost. Current performance may be higher or lower than the performance data shown. For up-to-date month-end performance information please call 1-800-480-4111.
Returns for Class 2 Shares prior to its inception date are based on the performance of Class 1 Shares. The actual returns of Class 2 Shares would have been lower than those shown because Class 2 Shares have higher expenses than Class 1 Shares.
The graph illustrates comparative performance for $10,000 invested in Class 1 Shares of the JPMorgan Insurance Trust Core Bond Portfolio, the Barclays U.S. Aggregate Index and the Lipper Variable Underlying Funds Core Bond Funds Index from December 31, 2003 to December 31, 2013. The performance of the Portfolio assumes reinvestment of all dividends and capital gain distributions, if any. The performance of the Barclays U.S. Aggregate Index does not reflect the deduction of expenses associated with a mutual fund and has been adjusted to reflect reinvestment of all dividends and capital gain distributions of the securities included in the benchmark, if applicable. The performance of the Lipper
Variable Underlying Funds Core Bond Funds Index includes expenses associated with a mutual fund, such as investment management fees. These expenses are not identical to the expenses incurred by the Portfolio. The Barclays U.S. Aggregate Index is an unmanaged index that represents securities that are SEC-registered, taxable, and dollar denominated. The index covers the U.S. investment grade fixed rate bond market, with index components for government and corporate securities, mortgage pass-through securities, and asset-backed securities. The Lipper Variable Underlying Funds Core Bond Funds Index is an index based on the total returns of certain mutual funds within the Portfolio’s designated category as determined by Lipper, Inc. Investors cannot invest directly in an index.
Portfolio performance does not reflect any charges imposed by the Policies or Eligible Plans. If these charges were included, the returns would be lower than shown. Portfolio performance may reflect the waiver of the Portfolio’s fees and reimbursement of expenses for certain periods since the inception date. Without these waivers and reimbursements, performance would have been lower. The returns shown are based on net asset values calculated for shareholder transactions and may differ from the returns shown in the financial highlights, which reflect adjustments made to the net asset values in accordance with accounting principles generally accepted in the United States of America.
| 4 | JPMORGAN INSURANCE TRUST | DECEMBER 31, 2013 | ||||
Table of Contents
JPMorgan Insurance Trust Core Bond Portfolio
SCHEDULE OF PORTFOLIO INVESTMENTS
AS OF DECEMBER 31, 2013
| PRINCIPAL AMOUNT($) | SECURITY DESCRIPTION | VALUE($) | ||||||
| Asset-Backed Securities — 1.8% |
| ||||||
| 172,000 | Ally Auto Receivables Trust, Series 2013-2, Class A3, 0.790%, 01/15/18 | 171,844 | ||||||
| 9,813 | American Credit Acceptance Receivables Trust, Series 2012-1, Class A2, 3.040%, 10/15/15 (e) | 9,833 | ||||||
| 61,000 | AmeriCredit Automobile Receivables Trust, Series 2013-4, Class A2, 0.740%, 11/08/16 | 61,060 | ||||||
| 23,535 | Bear Stearns Asset-Backed Securities Trust, Series 2006-SD1, Class A, VAR, 0.535%, 04/25/36 | 22,458 | ||||||
CarMax Auto Owner Trust, | ||||||||
| 62,000 | Series 2013-4, Class A3, 0.800%, 07/16/18 | 61,907 | ||||||
| 55,000 | Series 2013-4, Class A4, 1.280%, 05/15/19 | 54,625 | ||||||
| 144,026 | Centex Home Equity Loan Trust, | 149,321 | ||||||
CNH Equipment Trust, | ||||||||
| 15,507 | Series 2011-A, Class A3, 1.200%, 05/16/16 | 15,518 | ||||||
| 80,000 | Series 2011-A, Class A4, 2.040%, 10/17/16 | 81,020 | ||||||
Countrywide Asset-Backed Certificates, | ||||||||
| 1,056 | Series 2004-1, Class 3A, VAR, 0.725%, 04/25/34 | 987 | ||||||
| 120,000 | Series 2004-1, Class M1, VAR, 0.915%, 03/25/34 | 113,265 | ||||||
| 16,783 | Series 2004-1, Class M2, VAR, 0.990%, 03/25/34 | 16,050 | ||||||
| 14,400 | CWABS Revolving Home Equity Loan Trust, Series 2004-K, Class 2A, VAR, 0.467%, 02/15/34 | 12,438 | ||||||
HLSS Servicer Advance Receivables Backed Notes, | ||||||||
| 257,000 | Series 2013-T1, Class A1, 0.898%, 01/15/44 (e) | 257,000 | ||||||
| 180,000 | Series 2013-T1, Class A2, 1.495%, 01/16/46 (e) | 179,334 | ||||||
Hyundai Auto Receivables Trust, | ||||||||
| 169,000 | Series 2013-A, Class A3, 0.560%, 07/17/17 | 169,011 | ||||||
| 200,000 | Series 2013-A, Class A4, 0.750%, 09/17/18 | 198,770 | ||||||
| 44,669 | Lake Country Mortgage Loan Trust, Series 2006-HE1, Class A3, VAR, 0.515%, 07/25/34 (e) | 44,369 | ||||||
Long Beach Mortgage Loan Trust, | ||||||||
| 142,914 | Series 2003-4, Class M1, VAR, 1.185%, 08/25/33 | 133,530 | ||||||
| PRINCIPAL AMOUNT($) | SECURITY DESCRIPTION | VALUE($) | ||||||
| 190,000 | Series 2004-1, Class M1, VAR, 0.915%, 02/25/34 | 176,935 | ||||||
| 41,358 | Series 2004-1, Class M2, VAR, 0.990%, 02/25/34 | 40,160 | ||||||
| 20,853 | Series 2006-WL2, Class 2A3, VAR, 0.365%, 01/25/36 | 19,016 | ||||||
| 102,000 | Nationstar Agency Advance Funding Trust, Series 2013-T1A, Class AT1, 0.997%, 02/15/45 (e) | 101,458 | ||||||
| 125,000 | New Century Home Equity Loan Trust, Series 2005-1, Class M1, VAR, 0.615%, 03/25/35 | 119,668 | ||||||
| 498,053 | Normandy Mortgage Loan Trust, Series 2013-NPL3, Class A, SUB, 4.949%, 09/16/43 (e) | 498,053 | ||||||
| 140,466 | Park Place Securities, Inc., Asset-Backed Pass-Through Certificates, | 139,522 | ||||||
| 8,499 | RASC Trust, Series 2003-KS9, Class A2B, VAR, 0.805%, 11/25/33 | 6,700 | ||||||
| 124,939 | Residential Credit Solutions Trust, Series 2011-1, Class A1, 6.000%, 03/25/41 (e) (i) | 127,437 | ||||||
Santander Drive Auto Receivables Trust, | ||||||||
| 59,383 | Series 2011-1, Class B, 2.350%, 11/16/15 | 59,653 | ||||||
| 10,510 | Series 2011-S2A, Class B, 2.060%, 06/15/17 (e) | 10,510 | ||||||
| 39,710 | SNAAC Auto Receivables Trust, Series 2013-1A, Class A, 1.140%, 07/16/18 (e) | 39,678 | ||||||
| 450,000 | Springleaf Funding Trust, Series 2013-AA, Class A, 2.580%, 09/15/21 (e) | 449,345 | ||||||
| 180,628 | Volt NPL IX LLC, Series 2013-NPL3, Class A1, SUB, 4.250%, 04/25/53 (e) | 180,515 | ||||||
|
| |||||||
Total Asset-Backed Securities | 3,720,990 | |||||||
|
| |||||||
| Collateralized Mortgage Obligations — 27.9% |
| ||||||
Agency CMO — 19.5% | ||||||||
| 150,167 | Federal Home Loan Mortgage Corp. - Government National Mortgage Association, Series 8, Class ZA, 7.000%, 03/25/23 | 168,572 | ||||||
Federal Home Loan Mortgage Corp. REMIC, | ||||||||
| 816 | Series 1065, Class J, 9.000%, 04/15/21 | 966 | ||||||
| 2,383 | Series 11, Class D, 9.500%, 07/15/19 | 2,517 | ||||||
| 66,903 | Series 1113, Class J, 8.500%, 06/15/21 | 72,430 | ||||||
| 4,585 | Series 1250, Class J, 7.000%, 05/15/22 | 5,205 | ||||||
| 9,320 | Series 1316, Class Z, 8.000%, 06/15/22 | 10,598 | ||||||
SEE NOTES TO FINANCIAL STATEMENTS.
| DECEMBER 31, 2013 | JPMORGAN INSURANCE TRUST | 5 | ||||||
Table of Contents
JPMorgan Insurance Trust Core Bond Portfolio
SCHEDULE OF PORTFOLIO INVESTMENTS
AS OF DECEMBER 31, 2013 (continued)
| PRINCIPAL AMOUNT($) | SECURITY DESCRIPTION | VALUE($) | ||||||
| Collateralized Mortgage Obligations — Continued |
| ||||||
Agency CMO — Continued |
| |||||||
| 14,975 | Series 1324, Class Z, 7.000%, 07/15/22 | 16,910 | ||||||
| 67,850 | Series 1343, Class LA, 8.000%, 08/15/22 | 79,826 | ||||||
| 13,967 | Series 1343, Class LB, 7.500%, 08/15/22 | 16,480 | ||||||
| 9,987 | Series 1394, Class ID, IF, 9.566%, 10/15/22 | 11,740 | ||||||
| 9,376 | Series 1395, Class G, 6.000%, 10/15/22 | 10,109 | ||||||
| 6,497 | Series 1505, Class Q, 7.000%, 05/15/23 | 7,189 | ||||||
| 12,161 | Series 1518, Class G, IF, 8.829%, 05/15/23 | 14,017 | ||||||
| 12,134 | Series 1541, Class O, VAR, 2.140%, 07/15/23 | 12,624 | ||||||
| 277,039 | Series 1577, Class PV, 6.500%, 09/15/23 | 286,742 | ||||||
| 225,120 | Series 1584, Class L, 6.500%, 09/15/23 | 251,899 | ||||||
| 3,817 | Series 1609, Class LG, IF, 16.972%, 11/15/23 | 4,258 | ||||||
| 236,883 | Series 1633, Class Z, 6.500%, 12/15/23 | 263,595 | ||||||
| 267,162 | Series 1638, Class H, 6.500%, 12/15/23 | 297,703 | ||||||
| 2,387 | Series 1671, Class QC, IF, 10.000%, 02/15/24 | 3,127 | ||||||
| 44,138 | Series 1694, Class PK, 6.500%, 03/15/24 | 46,236 | ||||||
| 9,396 | Series 1700, Class GA, PO, 02/15/24 | 9,258 | ||||||
| 31,619 | Series 1798, Class F, 5.000%, 05/15/23 | 34,085 | ||||||
| 62,704 | Series 1863, Class Z, 6.500%, 07/15/26 | 69,543 | ||||||
| 4,026 | Series 1865, Class D, PO, 02/15/24 | 3,396 | ||||||
| 22,389 | Series 1981, Class Z, 6.000%, 05/15/27 | 25,066 | ||||||
| 28,915 | Series 1987, Class PE, 7.500%, 09/15/27 | 32,066 | ||||||
| 117,137 | Series 1999, Class PU, 7.000%, 10/15/27 | 133,884 | ||||||
| 166,792 | Series 2031, Class PG, 7.000%, 02/15/28 (m) | 188,493 | ||||||
| 7,254 | Series 2033, Class SN, HB, IF, 27.106%, 03/15/24 | 4,347 | ||||||
| 167,563 | Series 2035, Class PC, 6.950%, 03/15/28 | 191,999 | ||||||
| 12,138 | Series 2038, Class PN, IO, 7.000%, 03/15/28 | 2,932 | ||||||
| 38,788 | Series 2054, Class PV, 7.500%, 05/15/28 | 44,713 | ||||||
| 193,993 | Series 2057, Class PE, 6.750%, 05/15/28 | 219,504 | ||||||
| 55,132 | Series 2064, Class TE, 7.000%, 06/15/28 | 63,297 | ||||||
| PRINCIPAL AMOUNT($) | SECURITY DESCRIPTION | VALUE($) | ||||||
Agency CMO — Continued |
| |||||||
| 40,513 | Series 2075, Class PH, 6.500%, 08/15/28 | 45,606 | ||||||
| 133,732 | Series 2095, Class PE, 6.000%, 11/15/28 | 148,564 | ||||||
| 253 | Series 2115, Class PE, 6.000%, 01/15/14 | 253 | ||||||
| 7,848 | Series 2132, Class SB, HB, IF, 29.835%, 03/15/29 | 14,449 | ||||||
| 13,328 | Series 2134, Class PI, IO, 6.500%, 03/15/19 | 1,592 | ||||||
| 51 | Series 2135, Class UK, IO, 6.500%, 03/15/14 | — | (h) | |||||
| 66,347 | Series 2178, Class PB, 7.000%, 08/15/29 | 75,864 | ||||||
| 106,999 | Series 2182, Class ZB, 8.000%, 09/15/29 | 124,996 | ||||||
| 3,614 | Series 22, Class C, 9.500%, 04/15/20 | 4,007 | ||||||
| 16,710 | Series 2247, Class Z, 7.500%, 08/15/30 | 19,367 | ||||||
| 206,554 | Series 2259, Class ZC, 7.350%, 10/15/30 | 237,778 | ||||||
| 3,767 | Series 2261, Class ZY, 7.500%, 10/15/30 | 4,354 | ||||||
| 60,051 | Series 2283, Class K, 6.500%, 12/15/23 | 66,454 | ||||||
| 8,397 | Series 2306, Class K, PO, 05/15/24 | 8,065 | ||||||
| 20,152 | Series 2306, Class SE, IF, IO, 7.860%, 05/15/24 | 3,246 | ||||||
| 21,893 | Series 2325, Class PM, 7.000%, 06/15/31 | 23,422 | ||||||
| 130,910 | Series 2344, Class ZD, 6.500%, 08/15/31 | 140,643 | ||||||
| 20,834 | Series 2344, Class ZJ, 6.500%, 08/15/31 | 23,232 | ||||||
| 13,251 | Series 2345, Class NE, 6.500%, 08/15/31 | 14,909 | ||||||
| 59,475 | Series 2345, Class PQ, 6.500%, 08/15/16 | 62,711 | ||||||
| 22,469 | Series 2355, Class BP, 6.000%, 09/15/16 | 23,536 | ||||||
| 82,504 | Series 2359, Class ZB, 8.500%, 06/15/31 | 98,897 | ||||||
| 194,064 | Series 2367, Class ME, 6.500%, 10/15/31 | 205,532 | ||||||
| 19,267 | Series 2390, Class DO, PO, 12/15/31 | 17,694 | ||||||
| 31,094 | Series 2391, Class QR, 5.500%, 12/15/16 | 32,585 | ||||||
| 30,724 | Series 2394, Class MC, 6.000%, 12/15/16 | 32,339 | ||||||
| 34,704 | Series 2410, Class OE, 6.375%, 02/15/32 | 37,505 | ||||||
SEE NOTES TO FINANCIAL STATEMENTS.
| 6 | JPMORGAN INSURANCE TRUST | DECEMBER 31, 2013 | ||||
Table of Contents
| PRINCIPAL AMOUNT($) | SECURITY DESCRIPTION | VALUE($) | ||||||
| Collateralized Mortgage Obligations — Continued |
| ||||||
Agency CMO — Continued |
| |||||||
| 35,060 | Series 2410, Class QS, IF, 19.067%, 02/15/32 | 52,329 | ||||||
| 35,745 | Series 2410, Class QX, IF, IO, 8.483%, 02/15/32 | 7,861 | ||||||
| 30,272 | Series 2412, Class SP, IF, 15.767%, 02/15/32 | 41,309 | ||||||
| 71,461 | Series 2423, Class MC, 7.000%, 03/15/32 | 82,234 | ||||||
| 122,961 | Series 2423, Class MT, 7.000%, 03/15/32 | 140,700 | ||||||
| 227,841 | Series 2435, Class CJ, 6.500%, 04/15/32 | 247,263 | ||||||
| 48,713 | Series 2444, Class ES, IF, IO, 7.783%, 03/15/32 | 9,036 | ||||||
| 32,475 | Series 2450, Class SW, IF, IO, 7.833%, 03/15/32 | 6,067 | ||||||
| 102,836 | Series 2455, Class GK, 6.500%, 05/15/32 | 115,809 | ||||||
| 64,362 | Series 2484, Class LZ, 6.500%, 07/15/32 | 71,792 | ||||||
| 283,151 | Series 2500, Class MC, 6.000%, 09/15/32 | 311,448 | ||||||
| 16,458 | Series 2503, Class BH, 5.500%, 09/15/17 | 17,520 | ||||||
| 141,686 | Series 2527, Class BP, 5.000%, 11/15/17 | 150,199 | ||||||
| 97,111 | Series 2535, Class BK, 5.500%, 12/15/22 | 107,429 | ||||||
| 2,930,193 | Series 2543, Class YX, 6.000%, 12/15/32 (m) | 3,256,195 | ||||||
| 238,435 | Series 2544, Class HC, 6.000%, 12/15/32 | 265,028 | ||||||
| 390,084 | Series 2575, Class ME, 6.000%, 02/15/33 | 433,358 | ||||||
| 1,158,254 | Series 2578, Class PG, 5.000%, 02/15/18 | 1,231,274 | ||||||
| 29,191 | Series 2586, Class WI, IO, 6.500%, 03/15/33 | 6,080 | ||||||
| 55,262 | Series 2626, Class NS, IF, IO, 6.383%, 06/15/23 | 4,269 | ||||||
| 28,562 | Series 2638, Class DS, IF, 8.433%, 07/15/23 | 32,135 | ||||||
| 142,586 | Series 2647, Class A, 3.250%, 04/15/32 | 145,983 | ||||||
| 612,328 | Series 2651, Class VZ, 4.500%, 07/15/18 | 647,915 | ||||||
| 1,140,761 | Series 2656, Class BG, 5.000%, 10/15/32 | 1,194,713 | ||||||
| 150,184 | Series 2682, Class LC, 4.500%, 07/15/32 | 156,007 | ||||||
| PRINCIPAL AMOUNT($) | SECURITY DESCRIPTION | VALUE($) | ||||||
Agency CMO — Continued |
| |||||||
| 5,053 | Series 2755, Class SA, IF, 13.867%, 05/15/30 | 5,149 | ||||||
| 14,520 | Series 2780, Class JG, 4.500%, 04/15/19 | 14,987 | ||||||
| 551,550 | Series 2827, Class DG, 4.500%, 07/15/19 | 585,667 | ||||||
| 8,856 | Series 2989, Class PO, PO, 06/15/23 | 8,838 | ||||||
| 300,000 | Series 3047, Class OD, 5.500%, 10/15/35 | 328,360 | ||||||
| 209,659 | Series 3085, Class VS, HB, IF, 28.054%, 12/15/35 | 344,043 | ||||||
| 69,110 | Series 3117, Class EO, PO, 02/15/36 | 63,213 | ||||||
| 64,398 | Series 3260, Class CS, IF, IO, 5.973%, 01/15/37 | 10,051 | ||||||
| 174,294 | Series 3385, Class SN, IF, IO, 5.833%, 11/15/37 | 24,529 | ||||||
| 181,524 | Series 3387, Class SA, IF, IO, 6.253%, 11/15/37 | 23,910 | ||||||
| 160,222 | Series 3451, Class SA, IF, IO, 5.883%, 05/15/38 | 21,407 | ||||||
| 482,169 | Series 3455, Class SE, IF, IO, 6.033%, 06/15/38 | 74,801 | ||||||
| 527,485 | Series 3688, Class NI, IO, 5.000%, 04/15/32 | 64,270 | ||||||
| 165,354 | Series 3759, Class HI, IO, 4.000%, 08/15/37 | 20,544 | ||||||
| 230,334 | Series 3772, Class IO, IO, 3.500%, 09/15/24 | 16,117 | ||||||
| 529 | Series 47, Class F, 10.000%, 06/15/20 | 608 | ||||||
| 454 | Series 99, Class Z, 9.500%, 01/15/21 | 517 | ||||||
Federal Home Loan Mortgage Corp. STRIPS, | ||||||||
| 168,055 | Series 233, Class 11, IO, 5.000%, 09/15/35 | 32,580 | ||||||
| 223,367 | Series 239, Class S30, IF, IO, 7.533%, 08/15/36 | 42,614 | ||||||
| 465,184 | Series 262, Class 35, 3.500%, 07/15/42 | 465,480 | ||||||
| 475,282 | Series 299, Class 300, 3.000%, 01/15/43 | 462,783 | ||||||
Federal Home Loan Mortgage Corp. Structured Pass-Through Securities, | ||||||||
| 17,940 | Series T-41, Class 3A, VAR, 6.611%, 07/25/32 | 20,252 | ||||||
| 114,157 | Series T-54, Class 2A, 6.500%, 02/25/43 | 132,993 | ||||||
| 52,646 | Series T-54, Class 3A, 7.000%, 02/25/43 | 60,232 | ||||||
| 217,371 | Series T-56, Class APO, PO, 05/25/43 | 184,880 | ||||||
| 29,933 | Series T-58, Class APO, PO, 09/25/43 | 23,937 | ||||||
SEE NOTES TO FINANCIAL STATEMENTS.
| DECEMBER 31, 2013 | JPMORGAN INSURANCE TRUST | 7 | ||||||
Table of Contents
JPMorgan Insurance Trust Core Bond Portfolio
SCHEDULE OF PORTFOLIO INVESTMENTS
AS OF DECEMBER 31, 2013 (continued)
| PRINCIPAL AMOUNT($) | SECURITY DESCRIPTION | VALUE($) | ||||||
| Collateralized Mortgage Obligations — Continued |
| ||||||
Agency CMO — Continued |
| |||||||
Federal National Mortgage Association REMIC, | ||||||||
| 5,625 | Series 1988-16, Class B, 9.500%, 06/25/18 | 6,177 | ||||||
| 4,209 | Series 1989-83, Class H, 8.500%, 11/25/19 | 4,747 | ||||||
| 819 | Series 1990-1, Class D, 8.800%, 01/25/20 | 928 | ||||||
| 5,324 | Series 1990-10, Class L, 8.500%, 02/25/20 | 6,024 | ||||||
| 575 | Series 1990-93, Class G, 5.500%, 08/25/20 | 590 | ||||||
| 19 | Series 1990-140, Class K, HB, 652.145%, 12/25/20 | 248 | ||||||
| 1,186 | Series 1990-143, Class J, 8.750%, 12/25/20 | 1,377 | ||||||
| 20,161 | Series 1992-101, Class J, 7.500%, 06/25/22 | 22,832 | ||||||
| 9,421 | Series 1992-143, Class MA, 5.500%, 09/25/22 | 10,229 | ||||||
| 32,608 | Series 1993-146, Class E, PO, 05/25/23 | 31,631 | ||||||
| 75,279 | Series 1993-155, Class PJ, 7.000%, 09/25/23 | 86,870 | ||||||
| 2,358 | Series 1993-165, Class SD, IF, 12.814%, 09/25/23 | 2,999 | ||||||
| 11,760 | Series 1993-165, Class SK, IF, 12.500%, 09/25/23 | 13,330 | ||||||
| 100,898 | Series 1993-203, Class PL, 6.500%, 10/25/23 | 111,797 | ||||||
| 10,416 | Series 1993-205, Class H, PO, 09/25/23 | 9,619 | ||||||
| 546,913 | Series 1993-223, Class PZ, 6.500%, 12/25/23 | 603,462 | ||||||
| 100,232 | Series 1993-225, Class UB, 6.500%, 12/25/23 | 113,406 | ||||||
| 2,930 | Series 1993-230, Class FA, VAR, 0.765%, 12/25/23 | 2,946 | ||||||
| 132,602 | Series 1993-250, Class Z, 7.000%, 12/25/23 | 136,777 | ||||||
| 244,767 | Series 1994-37, Class L, 6.500%, 03/25/24 | 271,380 | ||||||
| 2,082,323 | Series 1994-72, Class K, 6.000%, 04/25/24 | 2,288,858 | ||||||
| 22,615 | Series 1995-2, Class Z, 8.500%, 01/25/25 | 26,527 | ||||||
| 83,206 | Series 1995-19, Class Z, 6.500%, 11/25/23 | 95,406 | ||||||
| 4,378 | Series 1996-59, Class J, 6.500%, 08/25/22 | 4,804 | ||||||
| 165,653 | Series 1997-20, Class IB, IO, VAR, 1.840%, 03/25/27 | 7,506 | ||||||
| PRINCIPAL AMOUNT($) | SECURITY DESCRIPTION | VALUE($) | ||||||
Agency CMO — Continued |
| |||||||
| 19,611 | Series 1997-39, Class PD, 7.500%, 05/20/27 | 22,941 | ||||||
| 39,222 | Series 1997-46, Class PL, 6.000%, 07/18/27 | 42,889 | ||||||
| 98,199 | Series 1997-61, Class ZC, 7.000%, 02/25/23 | 111,002 | ||||||
| 19,011 | Series 1998-36, Class ZB, 6.000%, 07/18/28 | 20,762 | ||||||
| 36,637 | Series 1998-43, Class SA, IF, IO, 17.423%, 04/25/23 | 11,967 | ||||||
| 51,774 | Series 1998-46, Class GZ, 6.500%, 08/18/28 | 58,250 | ||||||
| 95,182 | Series 1998-58, Class PC, 6.500%, 10/25/28 | 107,043 | ||||||
| 227,627 | Series 1999-39, Class JH, IO, 6.500%, 08/25/29 | 50,746 | ||||||
| 6,554 | Series 2000-52, Class IO, IO, 8.500%, 01/25/31 | 1,577 | ||||||
| 90,938 | Series 2001-4, Class PC, 7.000%, 03/25/21 | 101,006 | ||||||
| 75,030 | Series 2001-30, Class PM, 7.000%, 07/25/31 | 85,692 | ||||||
| 254,492 | Series 2001-33, Class ID, IO, 6.000%, 07/25/31 | 55,120 | ||||||
| 116,335 | Series 2001-36, Class DE, 7.000%, 08/25/31 | 133,579 | ||||||
| 12,697 | Series 2001-44, Class PD, 7.000%, 09/25/31 | 14,372 | ||||||
| 17,940 | Series 2001-52, Class XN, 6.500%, 11/25/15 | 18,632 | ||||||
| 183,910 | Series 2001-61, Class Z, 7.000%, 11/25/31 | 208,225 | ||||||
| 37,508 | Series 2001-69, Class PG, 6.000%, 12/25/16 | 39,308 | ||||||
| 27,023 | Series 2001-71, Class QE, 6.000%, 12/25/16 | 28,358 | ||||||
| 26,819 | Series 2002-1, Class HC, 6.500%, 02/25/22 | 29,665 | ||||||
| 8,622 | Series 2002-1, Class SA, HB, IF, 24.653%, 02/25/32 | 14,635 | ||||||
| 44,914 | Series 2002-2, Class UC, 6.000%, 02/25/17 | 47,387 | ||||||
| 44,851 | Series 2002-3, Class OG, 6.000%, 02/25/17 | 47,040 | ||||||
| 226,537 | Series 2002-13, Class SJ, IF, IO, 1.600%, 03/25/32 | 10,541 | ||||||
| 175,143 | Series 2002-15, Class PO, PO, 04/25/32 | 158,366 | ||||||
| 84,117 | Series 2002-28, Class PK, 6.500%, 05/25/32 | 94,753 | ||||||
SEE NOTES TO FINANCIAL STATEMENTS.
| 8 | JPMORGAN INSURANCE TRUST | DECEMBER 31, 2013 | ||||
Table of Contents
| PRINCIPAL AMOUNT($) | SECURITY DESCRIPTION | VALUE($) | ||||||
| Collateralized Mortgage Obligations — Continued |
| ||||||
Agency CMO — Continued |
| |||||||
| 264,097 | Series 2002-62, Class ZE, 5.500%, 11/25/17 | 281,110 | ||||||
| 168,830 | Series 2002-68, Class SH, IF, IO, 7.835%, 10/18/32 | 31,975 | ||||||
| 18,208 | Series 2002-77, Class S, IF, 14.182%, 12/25/32 | 23,094 | ||||||
| 178,046 | Series 2002-94, Class BK, 5.500%, 01/25/18 | 188,149 | ||||||
| 261,978 | Series 2003-7, Class A1, 6.500%, 12/25/42 | 301,762 | ||||||
| 293,000 | Series 2003-22, Class UD, 4.000%, 04/25/33 | 305,020 | ||||||
| 85,195 | Series 2003-44, Class IU, IO, 7.000%, 06/25/33 | 20,444 | ||||||
| 68,085 | Series 2003-47, Class PE, 5.750%, 06/25/33 | 74,346 | ||||||
| 14,963 | Series 2003-64, Class SX, IF, 13.337%, 07/25/33 | 17,455 | ||||||
| 25,492 | Series 2003-66, Class PA, 3.500%, 02/25/33 | 26,315 | ||||||
| 46,662 | Series 2003-71, Class DS, IF, 7.242%, 08/25/33 | 45,815 | ||||||
| 98,712 | Series 2003-71, Class IM, IO, 5.500%, 12/25/31 | 4,135 | ||||||
| 103,388 | Series 2003-80, Class SY, IF, IO, 7.485%, 06/25/23 | 9,661 | ||||||
| 1,347,203 | Series 2003-81, Class MC, 5.000%, 12/25/32 | 1,406,525 | ||||||
| 485,892 | Series 2003-82, Class VB, 5.500%, 08/25/33 | 525,571 | ||||||
| 27,522 | Series 2003-91, Class SD, IF, 12.226%, 09/25/33 | 32,864 | ||||||
| 234,246 | Series 2003-116, Class SB, IF, IO, 7.435%, 11/25/33 | 41,606 | ||||||
| 1,316,102 | Series 2003-128, Class DY, 4.500%, 01/25/24 | 1,428,285 | ||||||
| 16,519 | Series 2003-130, Class SX, IF, 11.273%, 01/25/34 | 19,232 | ||||||
| 36,456 | Series 2003-132, Class OA, PO, 08/25/33 | 34,865 | ||||||
| 830,124 | Series 2004-2, Class OE, 5.000%, 05/25/23 | 869,259 | ||||||
| 110,580 | Series 2004-4, Class QM, IF, 13.871%, 06/25/33 | 135,755 | ||||||
| 63,536 | Series 2004-10, Class SC, HB, IF, 27.942%, 02/25/34 | 92,242 | ||||||
| 159,234 | Series 2004-36, Class SA, IF, 19.072%, 05/25/34 | 219,827 | ||||||
| 102,304 | Series 2004-46, Class SK, IF, 16.047%, 05/25/34 | 128,907 | ||||||
| PRINCIPAL AMOUNT($) | SECURITY DESCRIPTION | VALUE($) | ||||||
Agency CMO — Continued |
| |||||||
| 16,332 | Series 2004-51, Class SY, IF, 13.911%, 07/25/34 | 20,475 | ||||||
| 82,992 | Series 2004-61, Class SK, IF, 8.500%, 11/25/32 | 90,801 | ||||||
| 104,248 | Series 2004-75, Class VK, 4.500%, 09/25/22 | 104,383 | ||||||
| 83,763 | Series 2004-76, Class CL, 4.000%, 10/25/19 | 88,113 | ||||||
| 1,468 | Series 2004-92, Class JO, PO, 12/25/34 | 1,467 | ||||||
| 235,957 | Series 2005-45, Class DC, HB, IF, 23.706%, 06/25/35 | 364,537 | ||||||
| 44,126 | Series 2005-52, Class PA, 6.500%, 06/25/35 | 47,393 | ||||||
| 475,673 | Series 2005-68, Class BC, 5.250%, 06/25/35 | 517,213 | ||||||
| 272,059 | Series 2005-84, Class XM, 5.750%, 10/25/35 | 296,711 | ||||||
| 653,878 | Series 2005-110, Class MN, 5.500%, 06/25/35 | 702,761 | ||||||
| 91,510 | Series 2006-22, Class AO, PO, 04/25/36 | 83,445 | ||||||
| 39,247 | Series 2006-46, Class SW, HB, IF, 23.596%, 06/25/36 | 60,236 | ||||||
| 83,344 | Series 2006-59, Class QO, PO, 01/25/33 | 82,081 | ||||||
| 115,766 | Series 2006-110, Class PO, PO, 11/25/36 | 104,971 | ||||||
| 187,144 | Series 2006-117, Class GS, IF, IO, 6.485%, 12/25/36 | 30,167 | ||||||
| 43,031 | Series 2007-7, Class SG, IF, IO, 6.335%, 08/25/36 | 7,887 | ||||||
| 353,289 | Series 2007-53, Class SH, IF, IO, 5.935%, 06/25/37 | 52,051 | ||||||
| 283,809 | Series 2007-88, Class VI, IF, IO, 6.375%, 09/25/37 | 39,466 | ||||||
| 261,606 | Series 2007-100, Class SM, IF, IO, 6.285%, 10/25/37 | 35,665 | ||||||
| 253,782 | Series 2008-1, Class BI, IF, IO, 5.745%, 02/25/38 | 30,045 | ||||||
| 72,177 | Series 2008-16, Class IS, IF, IO, 6.035%, 03/25/38 | 10,506 | ||||||
| 143,471 | Series 2008-46, Class HI, IO, VAR, 1.766%, 06/25/38 | 13,210 | ||||||
| 95,141 | Series 2008-53, Class CI, IF, IO, 7.035%, 07/25/38 | 15,578 | ||||||
| 221,129 | Series 2009-112, Class ST, IF, IO, 6.085%, 01/25/40 | 29,077 | ||||||
| 119,363 | Series 2010-35, Class SB, IF, IO, 6.255%, 04/25/40 | 17,237 | ||||||
| 2,489 | Series G92-42, Class Z, 7.000%, 07/25/22 | 2,786 | ||||||
SEE NOTES TO FINANCIAL STATEMENTS.
| DECEMBER 31, 2013 | JPMORGAN INSURANCE TRUST | 9 | ||||||
Table of Contents
JPMorgan Insurance Trust Core Bond Portfolio
SCHEDULE OF PORTFOLIO INVESTMENTS
AS OF DECEMBER 31, 2013 (continued)
| PRINCIPAL AMOUNT($) | SECURITY DESCRIPTION | VALUE($) | ||||||
| Collateralized Mortgage Obligations — Continued |
| ||||||
Agency CMO — Continued |
| |||||||
| 40,579 | Series G92-44, Class ZQ, 8.000%, 07/25/22 | 44,441 | ||||||
| 26,154 | Series G92-54, Class ZQ, 7.500%, 09/25/22 | 29,230 | ||||||
| 1,760 | Series G92-59, Class F, VAR, 1.663%, 10/25/22 | 1,772 | ||||||
| 4,739 | Series G92-61, Class Z, 7.000%, 10/25/22 | 5,512 | ||||||
| 10,770 | Series G92-66, Class KA, 6.000%, 12/25/22 | 11,708 | ||||||
| 50,938 | Series G92-66, Class KB, 7.000%, 12/25/22 | 57,521 | ||||||
| 14,332 | Series G93-1, Class KA, 7.900%, 01/25/23 | 16,344 | ||||||
| 14,896 | Series G93-17, Class SI, IF, 6.000%, 04/25/23 | 16,708 | ||||||
Federal National Mortgage Association REMIC Trust, | ||||||||
| 53,678 | Series 1999-W1, Class PO, PO, 02/25/29 | 48,996 | ||||||
| 222,963 | Series 1999-W4, Class A9, 6.250%, 02/25/29 | 250,276 | ||||||
| 442,862 | Series 2002-W7, Class A4, 6.000%, 06/25/29 | 485,437 | ||||||
| 390,478 | Series 2003-W1, Class 1A1, VAR, 5.963%, 12/25/42 | 436,969 | ||||||
| 51,644 | Series 2003-W1, Class 2A, VAR, 6.716%, 12/25/42 | 59,569 | ||||||
Federal National Mortgage Association STRIPS, | ||||||||
| 15,798 | Series 329, Class 1, PO, 01/01/33 | 14,269 | ||||||
| 73,613 | Series 365, Class 8, IO, 5.500%, 05/01/36 | 13,702 | ||||||
| 52,280 | Federal National Mortgage Association Trust, Series 2004-W2, Class 2A2, 7.000%, 02/25/44 | 60,593 | ||||||
Government National Mortgage Association, | ||||||||
| 175,273 | Series 1994-7, Class PQ, 6.500%, 10/16/24 | 203,013 | ||||||
| 101,189 | Series 1998-22, Class PD, 6.500%, 09/20/28 | 107,203 | ||||||
| 32,084 | Series 1999-17, Class L, 6.000%, 05/20/29 | 33,603 | ||||||
| 42,227 | Series 1999-41, Class Z, 8.000%, 11/16/29 | 50,171 | ||||||
| 29,507 | Series 1999-44, Class PC, 7.500%, 12/20/29 | 34,491 | ||||||
| 37,858 | Series 1999-44, Class ZG, 8.000%, 12/20/29 | 44,995 | ||||||
| PRINCIPAL AMOUNT($) | SECURITY DESCRIPTION | VALUE($) | ||||||
Agency CMO — Continued |
| |||||||
| 165,114 | Series 2000-21, Class Z, 9.000%, 03/16/30 | 198,781 | ||||||
| 3,185 | Series 2000-36, Class IK, IO, 9.000%, 11/16/30 | 722 | ||||||
| 555,623 | Series 2000-36, Class PB, 7.500%, 11/16/30 | 665,502 | ||||||
| 1,183,522 | Series 2001-10, Class PE, 6.500%, 03/16/31 (m) | 1,334,274 | ||||||
| 179,459 | Series 2001-22, Class PS, HB, IF, 20.582%, 03/17/31 | 263,334 | ||||||
| 70,955 | Series 2001-36, Class S, IF, IO, 7.883%, 08/16/31 | 16,792 | ||||||
| 69,395 | Series 2001-53, Class SR, IF, IO, 7.983%, 10/20/31 | 5,096 | ||||||
| 92,355 | Series 2001-64, Class MQ, 6.500%, 12/20/31 | 106,411 | ||||||
| 1,000,000 | Series 2001-64, Class PB, 6.500%, 12/20/31 | 1,139,004 | ||||||
| 12,288 | Series 2002-24, Class SB, IF, 11.675%, 04/16/32 | 15,193 | ||||||
| 6,494 | Series 2003-24, Class PO, PO, 03/16/33 | 5,428 | ||||||
| 211,838 | Series 2003-59, Class XA, IO, VAR, 1.040%, 06/16/34 | 1,145 | ||||||
| 12,308 | Series 2003-76, Class LS, IF, IO, 7.033%, 09/20/31 | 136 | ||||||
| 338,966 | Series 2004-11, Class SW, IF, IO, 5.333%, 02/20/34 | 44,862 | ||||||
| 36,730 | Series 2004-28, Class S, IF, 19.204%, 04/16/34 | 50,981 | ||||||
| 248,206 | Series 2007-45, Class QA, IF, IO, 6.473%, 07/20/37 | 41,811 | ||||||
| 202,771 | Series 2007-76, Class SA, IF, IO, 6.363%, 11/20/37 | 34,085 | ||||||
| 184,015 | Series 2008-2, Class MS, IF, IO, 6.993%, 01/16/38 | 29,181 | ||||||
| 141,580 | Series 2008-55, Class SA, IF, IO, 6.033%, 06/20/38 | 21,422 | ||||||
| 114,422 | Series 2009-6, Class SA, IF, IO, 5.933%, 02/16/39 | 15,776 | ||||||
| 299,287 | Series 2009-6, Class SH, IF, IO, 5.873%, 02/20/39 | 43,717 | ||||||
| 204,881 | Series 2009-14, Class KI, IO, 6.500%, 03/20/39 | 43,710 | ||||||
| 143,062 | Series 2009-14, Class NI, IO, 6.500%, 03/20/39 | 31,177 | ||||||
| 436,228 | Series 2009-22, Class SA, IF, IO, 6.103%, 04/20/39 | 62,236 | ||||||
| 400,506 | Series 2009-31, Class ST, IF, IO, 6.183%, 03/20/39 | 46,363 | ||||||
SEE NOTES TO FINANCIAL STATEMENTS.
| 10 | JPMORGAN INSURANCE TRUST | DECEMBER 31, 2013 | ||||
Table of Contents
| PRINCIPAL AMOUNT($) | SECURITY DESCRIPTION | VALUE($) | ||||||
| Collateralized Mortgage Obligations — Continued |
| ||||||
Agency CMO — Continued |
| |||||||
| 400,506 | Series 2009-31, Class TS, IF, IO, 6.133%, 03/20/39 | 56,615 | ||||||
| 408,936 | Series 2009-64, Class SN, IF, IO, 5.933%, 07/16/39 | 57,924 | ||||||
| 141,176 | Series 2009-79, Class OK, PO, 11/16/37 | 121,606 | ||||||
| 216,351 | Series 2009-102, Class SM, IF, IO, 6.233%, 06/16/39 | 28,726 | ||||||
| 610,464 | Series 2009-106, Class ST, IF, IO, 5.833%, 02/20/38 | 91,753 | ||||||
| 198,558 | Series 2010-130, Class CP, 7.000%, 10/16/40 | 231,462 | ||||||
| 393,840 | Series 2011-75, Class SM, IF, IO, 6.433%, 05/20/41 | 73,144 | ||||||
| 953,049 | Series 2013-H08, Class FC, VAR, 0.618%, 02/20/63 | 945,807 | ||||||
| 502,146 | Series 2013-H09, Class HA, 1.650%, 04/20/63 | 487,423 | ||||||
Vendee Mortgage Trust, | ||||||||
| 67,271 | Series 1994-1, Class 1, VAR, 5.618%, 02/15/24 | 73,934 | ||||||
| 154,684 | Series 1996-1, Class 1Z, 6.750%, 02/15/26 | 177,081 | ||||||
| 85,974 | Series 1996-2, Class 1Z, 6.750%, 06/15/26 | 99,145 | ||||||
| 312,410 | Series 1997-1, Class 2Z, 7.500%, 02/15/27 | 367,913 | ||||||
| 85,351 | Series 1998-1, Class 2E, 7.000%, 03/15/28 | 98,807 | ||||||
|
| |||||||
| 39,481,450 | ||||||||
|
| |||||||
Non-Agency CMO — 8.4% | ||||||||
Alternative Loan Trust, | ||||||||
| 49,899 | Series 2002-8, Class A4, 6.500%, 07/25/32 | 51,245 | ||||||
| 20,173 | Series 2003-J1, Class PO, PO, 10/25/33 | 18,099 | ||||||
| 1,943,305 | Series 2004-2CB, Class 1A9, 5.750%, 03/25/34 | 1,917,947 | ||||||
| 36,703 | Series 2004-18CB, Class 2A4, 5.700%, 09/25/34 | 37,121 | ||||||
| 634,854 | Series 2005-20CB, Class 3A8, IF, IO, 4.585%, 07/25/35 | 65,270 | ||||||
| 913,197 | Series 2005-28CB, Class 1A4, 5.500%, 08/25/35 | 863,436 | ||||||
| 457,742 | Series 2005-54CB, Class 1A11, 5.500%, 11/25/35 | 417,362 | ||||||
| 845,451 | Series 2005-22T1, Class A2, IF, IO, 4.905%, 06/25/35 | 135,773 | ||||||
| 750,338 | Series 2005-J1, Class 1A4, IF, IO, 4.935%, 02/25/35 | 77,405 | ||||||
| PRINCIPAL AMOUNT($) | SECURITY DESCRIPTION | VALUE($) | ||||||
Non-Agency CMO — Continued |
| |||||||
| 19,882 | Alternative Loan Trust Resecuritization, Series 2005-5R, Class A1, 5.250%, 12/25/18 | 19,989 | ||||||
| 200,000 | American General Mortgage Loan Trust, Series 2009-1, Class A7, VAR, 5.750%, 09/25/48 (e) | 202,180 | ||||||
Banc of America Alternative Loan Trust, | ||||||||
| 54,573 | Series 2003-9, Class 1CB2, 5.500%, 11/25/33 | 55,581 | ||||||
| 314,167 | Series 2004-5, Class 3A3, PO, 06/25/34 | 259,198 | ||||||
| 42,586 | Series 2004-6, Class 15PO, PO, 07/25/19 | 38,638 | ||||||
Banc of America Funding Trust, | ||||||||
| 45,312 | Series 2004-1, Class PO, PO, 03/25/34 | 40,916 | ||||||
| 366,768 | Series 2005-6, Class 2A7, 5.500%, 10/25/35 | 360,710 | ||||||
| 54,269 | Series 2005-7, Class 30PO, PO, 11/25/35 | 43,153 | ||||||
| 215,046 | Series 2005-E, Class 4A1, VAR, 2.669%, 03/20/35 | 216,050 | ||||||
Banc of America Mortgage Trust, | ||||||||
| 15,456 | Series 2003-8, Class APO, PO, 11/25/33 | 13,105 | ||||||
| 90,019 | Series 2004-3, Class 1A26, 5.500%, 04/25/34 | 91,353 | ||||||
| 11,569 | Series 2004-4, Class APO, PO, 05/25/34 | 9,775 | ||||||
| 290,852 | Series 2004-5, Class 2A2, 5.500%, 06/25/34 | 301,597 | ||||||
| 180,866 | Series 2004-6, Class 2A5, PO, 07/25/34 | 149,737 | ||||||
| 40,654 | Series 2004-6, Class APO, PO, 07/25/34 | 33,518 | ||||||
| 34,775 | Series 2004-7, Class 1A19, PO, 08/25/34 | 33,380 | ||||||
| 162,065 | Series 2004-J, Class 3A1, VAR, 2.654%, 11/25/34 | 160,625 | ||||||
BCAP LLC Trust, | ||||||||
| 149,579 | Series 2011-RR5, Class 11A3, VAR, 0.314%, 05/28/36 (e) | 138,907 | ||||||
| 53,623 | Series 2011-RR5, Class 14A3, VAR, 2.663%, 07/26/36 (e) | 53,388 | ||||||
Bear Stearns ARM Trust, | ||||||||
| 58,888 | Series 2003-7, Class 3A, VAR, 2.467%, 10/25/33 | 57,911 | ||||||
| 121,823 | Series 2005-5, Class A1, VAR, 2.210%, 08/25/35 | 121,888 | ||||||
| 389,173 | Series 2006-1, Class A1, VAR, 2.369%, 02/25/36 | 384,920 | ||||||
| 87,918 | CAM Mortgage Trust, Series 2013-1, Class A, VAR, 3.967%, 11/25/57 (e) (i) | 87,533 | ||||||
CHL Mortgage Pass-Through Trust, | ||||||||
| 139,659 | Series 2003-26, Class 1A6, 3.500%, 08/25/33 | 139,404 | ||||||
SEE NOTES TO FINANCIAL STATEMENTS.
| DECEMBER 31, 2013 | JPMORGAN INSURANCE TRUST | 11 | ||||||
Table of Contents
JPMorgan Insurance Trust Core Bond Portfolio
SCHEDULE OF PORTFOLIO INVESTMENTS
AS OF DECEMBER 31, 2013 (continued)
| PRINCIPAL AMOUNT($) | SECURITY DESCRIPTION | VALUE($) | ||||||
| Collateralized Mortgage Obligations — Continued |
| ||||||
Non-Agency CMO — Continued |
| |||||||
| 19,448 | Series 2003-J7, Class 4A3, IF, 9.560%, 08/25/18 | 20,320 | ||||||
| 81,686 | Series 2004-7, Class 2A1, VAR, 2.692%, 06/25/34 | 78,531 | ||||||
| 50,883 | Series 2004-HYB1, Class 2A, VAR, 2.660%, 05/20/34 | 47,790 | ||||||
| 68,595 | Series 2004-HYB3, Class 2A, VAR, 2.500%, 06/20/34 | 64,170 | ||||||
| 83,608 | Series 2004-J8, Class 1A2, 4.750%, 11/25/19 | 85,720 | ||||||
| 8,420 | Series 2004-J8, Class POA, PO, 11/25/19 | 7,843 | ||||||
| 214,113 | Series 2005-16, Class A23, 5.500%, 09/25/35 | 202,860 | ||||||
| 338,326 | Series 2005-22, Class 2A1, VAR, 2.586%, 11/25/35 | 275,938 | ||||||
Citigroup Mortgage Loan Trust, | ||||||||
| 97,747 | 2.110%, 01/12/18 | 97,990 | ||||||
| 310,692 | Series 2010-8, Class 6A6, 4.500%, 12/25/36 (e) | 319,563 | ||||||
Citigroup Mortgage Loan Trust, Inc., | ||||||||
| 12,656 | Series 2003-UP3, Class A3, 7.000%, 09/25/33 | 13,105 | ||||||
| 16,482 | Series 2003-UST1, Class A1, 5.500%, 12/25/18 | 17,108 | ||||||
| 5,519 | Series 2003-UST1, Class PO1, PO, 12/25/18 | 5,107 | ||||||
| 5,157 | Series 2003-UST1, Class PO3, PO, 12/25/18 | 4,814 | ||||||
| 112,636 | Series 2005-1, Class 2A1A, VAR, 2.649%, 04/25/35 | 88,431 | ||||||
| 8,499 | Credit Suisse First Boston Mortgage Securities Corp., Series 2004-5, Class 5P, PO, 08/25/19 | 7,900 | ||||||
CSMC, | ||||||||
| 198,148 | Series 2010-11R, Class A6, VAR, 1.168%, 06/28/47 (e) | 189,265 | ||||||
| 54,443 | Series 2011-7R, Class A1, VAR, 1.417%, 08/28/47 (e) | 54,334 | ||||||
| 155,126 | Series 2011-9R, Class A1, VAR, 2.167%, 03/27/46 (e) | 155,435 | ||||||
| 90,284 | FDIC Trust, Series 2013-N1, Class A, 4.500%, 10/25/18 (e) | 91,272 | ||||||
| 273,873 | First Horizon Alternative Mortgage Securities Trust, Series 2005-FA8, Class 1A19, 5.500%, 11/25/35 | 239,599 | ||||||
First Horizon Mortgage Pass-Through Trust, | ||||||||
| 240,611 | Series 2004-AR7, Class 2A2, VAR, 2.559%, 02/25/35 | 241,619 | ||||||
| PRINCIPAL AMOUNT($) | SECURITY DESCRIPTION | VALUE($) | ||||||
Non-Agency CMO — Continued |
| |||||||
| 180,164 | Series 2005-AR1, Class 2A2, VAR, 2.654%, 04/25/35 | 180,219 | ||||||
GMACM Mortgage Loan Trust, | ||||||||
| 142,243 | Series 2003-AR1, Class A4, VAR, 2.965%, 10/19/33 | 144,213 | ||||||
| 133,890 | Series 2004-J5, Class A7, 6.500%, 01/25/35 | 142,475 | ||||||
| 603,405 | Series 2005-AR3, Class 3A4, VAR, 2.989%, 06/19/35 | 578,234 | ||||||
GSR Mortgage Loan Trust, | ||||||||
| 137,282 | Series 2004-6F, Class 1A2, 5.000%, 05/25/34 | 140,925 | ||||||
| 384,294 | Series 2004-6F, Class 3A4, 6.500%, 05/25/34 | 406,923 | ||||||
| 83,597 | Series 2004-13F, Class 3A3, 6.000%, 11/25/34 | 82,595 | ||||||
| 73,610 | Impac Secured Assets Trust, Series 2006-1, Class 2A1, VAR, 0.515%, 05/25/36 | 72,541 | ||||||
| 1,375,575 | IndyMac INDX Mortgage Loan Trust, Series 2005-AR11, Class A7, IO, VAR, 0.000%, 08/25/35 | 1,720 | ||||||
| 138,718 | JP Morgan Mortgage Trust, Series 2006-A2, Class 5A3, VAR, 2.550%, 11/25/33 | 139,609 | ||||||
| 85,164 | MASTR Adjustable Rate Mortgages Trust, Series 2004-13, Class 2A1, VAR, 2.644%, 04/21/34 | 87,223 | ||||||
MASTR Alternative Loan Trust, | ||||||||
| 103,204 | Series 2003-9, Class 8A1, 6.000%, 01/25/34 | 105,981 | ||||||
| 220,389 | Series 2004-4, Class 10A1, 5.000%, 05/25/24 | 228,366 | ||||||
| 208,349 | Series 2004-6, Class 7A1, 6.000%, 07/25/34 | 213,810 | ||||||
| 27,928 | Series 2004-7, Class 30PO, PO, 08/25/34 | 21,562 | ||||||
| 154,806 | Series 2004-8, Class 6A1, 5.500%, 09/25/19 | 161,156 | ||||||
| 108,893 | Series 2004-10, Class 1A1, 4.500%, 09/25/19 | 111,102 | ||||||
MASTR Asset Securitization Trust, | ||||||||
| 298,386 | Series 2003-11, Class 9A6, 5.250%, 12/25/33 | 310,916 | ||||||
| 20,106 | Series 2003-12, Class 15PO, PO, 12/25/18 | 18,487 | ||||||
| 42,773 | Series 2004-6, Class 15PO, PO, 07/25/19 | 39,669 | ||||||
| 23,301 | Series 2004-8, Class PO, PO, 08/25/19 | 21,651 | ||||||
| 82,453 | Series 2004-10, Class 15PO, PO, 10/25/19 | 76,122 | ||||||
| 148,791 | MASTR Resecuritization Trust, | 119,033 | ||||||
SEE NOTES TO FINANCIAL STATEMENTS.
| 12 | JPMORGAN INSURANCE TRUST | DECEMBER 31, 2013 | ||||
Table of Contents
| PRINCIPAL AMOUNT($) | SECURITY DESCRIPTION | VALUE($) | ||||||
| Collateralized Mortgage Obligations — Continued |
| ||||||
Non-Agency CMO — Continued |
| |||||||
| 69,075 | MortgageIT Trust, Series 2005-1, Class 1A1, VAR, 0.485%, 02/25/35 | 65,827 | ||||||
| 56,364 | NACC Reperforming Loan REMIC Trust, Series 2004-R2, Class A1, VAR, 6.500%, 10/25/34 (e) | 57,606 | ||||||
| 430,464 | PHH Alternative Mortgage Trust, Series 2007-2, Class 2X, IO, 6.000%, 05/25/37 | 87,119 | ||||||
RALI Trust, | ||||||||
| 50,398 | Series 2002-QS8, Class A5, 6.250%, 06/25/17 | 51,333 | ||||||
| 864,336 | Series 2003-QR19, Class CB4, 5.750%, 10/25/33 | 894,033 | ||||||
| 15,142 | Series 2003-QS3, Class A2, IF, 16.138%, 02/25/18 | 16,477 | ||||||
| 28,363 | Series 2003-QS3, Class A8, IF, IO, 7.435%, 02/25/18 | 1,391 | ||||||
| 106,012 | Series 2003-QS9, Class A3, IF, IO, 7.385%, 05/25/18 | 11,929 | ||||||
| 143,085 | Series 2003-QS14, Class A1, 5.000%, 07/25/18 | 145,749 | ||||||
| 45,473 | Series 2003-QS18, Class A1, 5.000%, 09/25/18 | 46,665 | ||||||
| 11,210 | Residential Asset Securitization Trust, Series 2003-A14, Class A1, 4.750%, 02/25/19 | 11,481 | ||||||
| 161,813 | RFMSI Trust, Series 2005-SA4, Class 1A1, VAR, 2.847%, 09/25/35 | 133,872 | ||||||
| 5,150 | SACO I, Inc., Series 1997-2, Class 1A5, 7.000%, 08/25/36 (e) | 5,285 | ||||||
Salomon Brothers Mortgage Securities VII, Inc., | ||||||||
| 83,539 | Series 2003-HYB1, Class A, VAR, 2.618%, 09/25/33 | 84,039 | ||||||
| 3,447 | Series 2003-UP2, Class PO1, PO, 12/25/18 | 3,096 | ||||||
Springleaf Mortgage Loan Trust, | ||||||||
| 52,234 | Series 2011-1A, Class A1, VAR, 4.050%, 01/25/58 (e) | 54,284 | ||||||
| 81,556 | Series 2012-2A, Class A, VAR, 2.220%, 10/25/57 (e) | 83,083 | ||||||
| 263,174 | Series 2013-1A, Class A, VAR, 1.270%, 06/25/58 (e) | 262,514 | ||||||
| 124,000 | Series 2013-1A, Class M1, VAR, 2.310%, 06/25/58 (e) | 119,960 | ||||||
| 108,000 | Series 2013-1A, Class M2, VAR, 3.140%, 06/25/58 (e) | 105,025 | ||||||
| 196,967 | Series 2013-2A, Class A, VAR, 1.780%, 12/25/65 (e) | 196,414 | ||||||
| 125,000 | Series 2013-2A, Class M1, VAR, 3.520%, 12/25/65 (e) | 122,925 | ||||||
| PRINCIPAL AMOUNT($) | SECURITY DESCRIPTION | VALUE($) | ||||||
Non-Agency CMO — Continued |
| |||||||
| 256,686 | Structured Adjustable Rate Mortgage Loan Trust, Series 2004-6, Class 5A4, VAR, 4.813%, 06/25/34 | 255,520 | ||||||
| 122,932 | Structured Asset Securities Corp. Mortgage Pass-Through Certificates, | 125,776 | ||||||
WaMu Mortgage Pass-Through Certificates Trust, | ||||||||
| 24,013 | Series 2003-AR8, Class A, VAR, 2.422%, 08/25/33 | 24,047 | ||||||
| 108,025 | Series 2003-AR9, Class 1A6, VAR, 2.423%, 09/25/33 | 108,999 | ||||||
| 6,856 | Series 2003-S4, Class 3A, 5.500%, 06/25/33 | 6,890 | ||||||
| 40,151 | Series 2004-AR3, Class A2, VAR, 2.449%, 06/25/34 | 40,351 | ||||||
Washington Mutual Mortgage Pass-Through Certificates WMALT Trust, | ||||||||
| 1,506,588 | Series 2005-2, Class 1A4, IF, IO, 4.885%, 04/25/35 | 212,887 | ||||||
| 437,682 | Series 2005-2, Class 2A3, IF, IO, 4.835%, 04/25/35 | 54,184 | ||||||
| 405,883 | Series 2005-3, Class CX, IO, 5.500%, 05/25/35 | 109,151 | ||||||
| 383,218 | Series 2005-4, Class CB7, 5.500%, 06/25/35 | 353,473 | ||||||
| 22,301 | Series 2005-4, Class DP, PO, 06/25/20 | 19,921 | ||||||
| 131,851 | Series 2005-6, Class 2A4, 5.500%, 08/25/35 | 120,799 | ||||||
Wells Fargo Mortgage-Backed Securities Trust, | ||||||||
| 33,061 | Series 2003-K, Class 1A1, VAR, 2.490%, 11/25/33 | 33,461 | ||||||
| 66,122 | Series 2003-K, Class 1A2, VAR, 2.490%, 11/25/33 | 67,467 | ||||||
| 76,089 | Series 2004-EE, Class 3A1, VAR, 2.703%, 12/25/34 | 76,371 | ||||||
| 206,140 | Series 2004-P, Class 2A1, VAR, 2.613%, 09/25/34 | 208,094 | ||||||
| 117,795 | Series 2005-AR8, Class 2A1, VAR, 2.659%, 06/25/35 | 119,387 | ||||||
| 87,862 | Series 2005-AR16, Class 2A1, VAR, 2.645%, 02/25/34 | 88,564 | ||||||
|
| |||||||
| 16,895,809 | ||||||||
|
| |||||||
Total Collateralized Mortgage Obligations | 56,377,259 | |||||||
|
| |||||||
SEE NOTES TO FINANCIAL STATEMENTS.
| DECEMBER 31, 2013 | JPMORGAN INSURANCE TRUST | 13 | ||||||
Table of Contents
JPMorgan Insurance Trust Core Bond Portfolio
SCHEDULE OF PORTFOLIO INVESTMENTS
AS OF DECEMBER 31, 2013 (continued)
| PRINCIPAL AMOUNT($) | SECURITY DESCRIPTION | VALUE($) | ||||||
| Commercial Mortgage-Backed Securities — 2.6% |
| ||||||
A10 Securitization LLC, | ||||||||
| 250,000 | Series 2013-1, Class A, 2.400%, 11/15/25 (e) | 249,164 | ||||||
| 287,000 | Series 2013-2, Class A, 2.620%, 11/15/27 (e) | 287,000 | ||||||
| 250,000 | Banc of America Commercial Mortgage Trust, Series 2006-4, Class A4, 5.634%, 07/10/46 | 271,004 | ||||||
Banc of America Merrill Lynch Commercial Mortgage, Inc., | ||||||||
| 125,000 | Series 2005-3, Class A4, 4.668%, 07/10/43 | 130,765 | ||||||
| 125,000 | Series 2005-3, Class AM, 4.727%, 07/10/43 | 129,870 | ||||||
| 133,555 | Series 2005-6, Class ASB, VAR, 5.184%, 09/10/47 | 133,690 | ||||||
BB-UBS Trust, | ||||||||
| 100,000 | Series 2012-SHOW, Class A, 3.430%, 11/05/36 (e) | 91,655 | ||||||
| 100,000 | Series 2012-TFT, Class A, 2.892%, 06/05/30 (e) | 94,200 | ||||||
Bear Stearns Commercial Mortgage Securities Trust, | ||||||||
| 245,996 | Series 2005-PWR8, Class A4, 4.674%, 06/11/41 | 255,838 | ||||||
| 60,500 | Series 2005-PWR9, Class AAB, 4.804%, 09/11/42 | 61,248 | ||||||
| 360,000 | Series 2006-PW11, Class A4, VAR, 5.439%, 03/11/39 | 387,787 | ||||||
| 11,395,545 | CD Commercial Mortgage Trust, Series 2007-CD4, Class XC, IO, VAR, 0.168%, 12/11/49 (e) | 108,770 | ||||||
| 100,000 | Citigroup Commercial Mortgage Trust, Series 2005-C3, Class AM, VAR, 4.830%, 05/15/43 | 104,113 | ||||||
| 125,000 | COMM Mortgage Trust, Series 2013-SFS, Class A2, VAR, 2.987%, 04/12/35 (e) | 115,128 | ||||||
| 565,000 | Commercial Mortgage Pass-Through Certificates, Series 2006-C1, Class A4, VAR, 5.465%, 02/15/39 | 608,732 | ||||||
| 100,000 | GMAC Commercial Mortgage Securities, Inc. Trust, Series 2006-C1, Class A4, VAR, 5.238%, 11/10/45 | 105,068 | ||||||
| 154,957 | GS Mortgage Securities Corp. II, Series 2004-GG2, Class A6, VAR, 5.396%, 08/10/38 | 156,509 | ||||||
| 122,000 | GS Mortgage Securities Corp. Trust, Series 2013-NYC5, Class A, 2.318%, 01/10/30 (e) | 122,050 | ||||||
| PRINCIPAL AMOUNT($) | SECURITY DESCRIPTION | VALUE($) | ||||||
| 26,581 | JP Morgan Chase Commercial Mortgage Securities Corp., Series 2004-CB8, Class A4, 4.404%, 01/12/39 | 26,585 | ||||||
LB-UBS Commercial Mortgage Trust, | ||||||||
| 24,029 | Series 2004-C2, Class A4, 4.367%, 03/15/36 | 24,070 | ||||||
| 75,000 | Series 2005-C1, Class A4, 4.742%, 02/15/30 | 76,993 | ||||||
| 60,715 | Merrill Lynch Mortgage Trust, Series 2005-MCP1, Class ASB, VAR, 4.674%, 06/12/43 | 61,023 | ||||||
| 3,403,451 | Morgan Stanley Capital I Trust, Series 2006-IQ12, Class X1, IO, VAR, 0.128%, 12/15/43 (e) | 43,993 | ||||||
| 48,790 | Morgan Stanley Re-REMIC Trust, | 49,415 | ||||||
| 698,787 | NCUA Guaranteed Notes Trust, | 717,888 | ||||||
| 201,973 | TIAA Seasoned Commercial Mortgage Trust, Series 2007-C4, Class A3, VAR, 5.565%, 08/15/39 | 207,539 | ||||||
| 116,000 | UBS-BAMLL Trust, Series 2012-WRM, Class A, 3.663%, 06/10/30 (e) | 110,207 | ||||||
| 104,000 | UBS-Barclays Commercial Mortgage Trust, Series 2012-C2, Class A4, 3.525%, 05/10/63 | 102,800 | ||||||
| 200,000 | VNO Mortgage Trust, Series 2013-PENN, Class A, 3.808%, 12/13/29 (e) | 204,438 | ||||||
| 68,454 | Wachovia Bank Commercial Mortgage Trust, Series 2004-C11, Class A5, VAR, 5.215%, 01/15/41 | 68,491 | ||||||
| 110,000 | WFRBS Commercial Mortgage Trust, | 115,741 | ||||||
|
| |||||||
Total Commercial Mortgage-Backed Securities | 5,221,774 | |||||||
|
| |||||||
| Corporate Bonds — 16.2% |
| ||||||
Consumer Discretionary — 1.2% |
| |||||||
Automobiles — 0.1% |
| |||||||
| 150,000 | Daimler Finance North America LLC, 1.875%, 01/11/18 (e) | 147,756 | ||||||
|
| |||||||
Household Durables — 0.0% (g) |
| |||||||
| 50,000 | Newell Rubbermaid, Inc., 4.700%, 08/15/20 | 52,443 | ||||||
|
| |||||||
Media — 1.0% |
| |||||||
CBS Corp., | ||||||||
| 21,000 | 5.750%, 04/15/20 | 23,573 | ||||||
| 100,000 | 7.875%, 07/30/30 | 124,418 | ||||||
SEE NOTES TO FINANCIAL STATEMENTS.
| 14 | JPMORGAN INSURANCE TRUST | DECEMBER 31, 2013 | ||||
Table of Contents
| PRINCIPAL AMOUNT($) | SECURITY DESCRIPTION | VALUE($) | ||||||
| Corporate Bonds — Continued |
| ||||||
Media — Continued | ||||||||
| 75,000 | Comcast Cable Holdings LLC, 10.125%, 04/15/22 | 101,679 | ||||||
Comcast Corp., | ||||||||
| 87,000 | 4.250%, 01/15/33 | 80,816 | ||||||
| 50,000 | 5.900%, 03/15/16 | 55,220 | ||||||
| 50,000 | 6.450%, 03/15/37 | 58,027 | ||||||
| 30,000 | 6.500%, 01/15/17 | 34,368 | ||||||
| 35,000 | 6.500%, 11/15/35 | 40,824 | ||||||
COX Communications, Inc., | ||||||||
| 9,000 | 5.450%, 12/15/14 | 9,405 | ||||||
| 20,000 | 8.375%, 03/01/39 (e) | 24,256 | ||||||
DIRECTV Holdings LLC/DIRECTV Financing Co., Inc., | ||||||||
| 125,000 | 4.600%, 02/15/21 | 129,086 | ||||||
| 67,000 | 5.000%, 03/01/21 | 70,384 | ||||||
| 125,000 | 6.000%, 08/15/40 | 123,437 | ||||||
| 78,000 | Discovery Communications LLC, 4.375%, 06/15/21 | 80,600 | ||||||
| 100,000 | Historic TW, Inc., 9.150%, 02/01/23 | 132,608 | ||||||
| 75,000 | NBCUniversal Media LLC, 5.950%, 04/01/41 | 82,038 | ||||||
News America, Inc., | ||||||||
| 50,000 | 6.650%, 11/15/37 | 58,363 | ||||||
| 50,000 | 7.250%, 05/18/18 | 60,391 | ||||||
| 150,000 | 7.300%, 04/30/28 | 175,596 | ||||||
| 84,000 | Thomson Reuters Corp., (Canada), 3.950%, 09/30/21 | 83,687 | ||||||
Time Warner Cable, Inc., | ||||||||
| 50,000 | 6.550%, 05/01/37 | 46,268 | ||||||
| 50,000 | 6.750%, 07/01/18 | 56,072 | ||||||
| 50,000 | 7.300%, 07/01/38 | 49,859 | ||||||
| 70,000 | 8.250%, 02/14/14 | 70,606 | ||||||
Time Warner Entertainment Co. LP, | ||||||||
| 50,000 | 8.375%, 03/15/23 | 57,509 | ||||||
| 25,000 | 8.375%, 07/15/33 | 27,237 | ||||||
Time Warner, Inc., | ||||||||
| 35,000 | 4.750%, 03/29/21 | 37,323 | ||||||
| 75,000 | 6.200%, 03/15/40 | 82,625 | ||||||
| 7,000 | 6.250%, 03/29/41 | 7,773 | ||||||
| 15,000 | 6.500%, 11/15/36 | 16,948 | ||||||
Viacom, Inc., | ||||||||
| 13,000 | 1.250%, 02/27/15 | 13,065 | ||||||
| 22,000 | 3.250%, 03/15/23 | 20,377 | ||||||
| 43,000 | 3.875%, 12/15/21 | 42,735 | ||||||
| 20,000 | 4.500%, 02/27/42 | 17,063 | ||||||
|
| |||||||
| 2,094,236 | ||||||||
|
| |||||||
| PRINCIPAL AMOUNT($) | SECURITY DESCRIPTION | VALUE($) | ||||||
Multiline Retail — 0.0% (g) |
| |||||||
Macy’s Retail Holdings, Inc., | ||||||||
| 18,000 | 4.375%, 09/01/23 | 18,068 | ||||||
| 9,000 | 5.125%, 01/15/42 | 8,588 | ||||||
|
| |||||||
| 26,656 | ||||||||
|
| |||||||
Specialty Retail — 0.1% |
| |||||||
| 30,000 | Gap, Inc. (The), 5.950%, 04/12/21 | 33,149 | ||||||
| 70,000 | Home Depot, Inc. (The), 5.400%, 03/01/16 | 76,782 | ||||||
| 75,000 | Lowe’s Cos., Inc., Series B, 7.110%, 05/15/37 | 92,542 | ||||||
|
| |||||||
| 202,473 | ||||||||
|
| |||||||
Total Consumer Discretionary | 2,523,564 | |||||||
|
| |||||||
Consumer Staples — 0.6% |
| |||||||
Beverages — 0.2% |
| |||||||
| 125,000 | Anheuser-Busch InBev Worldwide, Inc., 7.750%, 01/15/19 | 156,082 | ||||||
| 95,000 | Diageo Capital plc, (United Kingdom), 5.750%, 10/23/17 | 108,416 | ||||||
| 20,000 | Diageo Finance B.V., (Netherlands), 5.300%, 10/28/15 | 21,651 | ||||||
| 15,000 | FBG Finance Pty Ltd., (Australia), 5.125%, 06/15/15 (e) | 15,915 | ||||||
| 40,000 | SABMiller plc, (United Kingdom), 5.700%, 01/15/14 (e) | 40,077 | ||||||
|
| |||||||
| 342,141 | ||||||||
|
| |||||||
Food & Staples Retailing — 0.1% |
| |||||||
CVS Caremark Corp., | ||||||||
| 36,000 | 4.000%, 12/05/23 | 35,924 | ||||||
| 16,000 | 5.300%, 12/05/43 | 16,547 | ||||||
| 60,000 | 5.750%, 05/15/41 | 65,482 | ||||||
| 30,000 | 6.125%, 09/15/39 | 34,023 | ||||||
Kroger Co. (The), | ||||||||
| 18,000 | 5.400%, 07/15/40 | 17,812 | ||||||
| 25,000 | 7.500%, 04/01/31 | 30,348 | ||||||
| 70,000 | Wal-Mart Stores, Inc., 6.500%, 08/15/37 | 87,565 | ||||||
|
| |||||||
| 287,701 | ||||||||
|
| |||||||
Food Products — 0.3% |
| |||||||
| 25,000 | Archer-Daniels-Midland Co., 5.935%, 10/01/32 | 27,675 | ||||||
| 55,000 | Bunge Ltd. Finance Corp., 8.500%, 06/15/19 | 67,567 | ||||||
| 27,000 | Bunge N.A. Finance LP, 5.900%, 04/01/17 | 29,480 | ||||||
| 10,000 | ConAgra Foods, Inc., 2.100%, 03/15/18 | 9,890 | ||||||
Kellogg Co., | ||||||||
| 13,000 | 1.750%, 05/17/17 | 12,985 | ||||||
| 22,000 | 3.125%, 05/17/22 | 20,858 | ||||||
SEE NOTES TO FINANCIAL STATEMENTS.
| DECEMBER 31, 2013 | JPMORGAN INSURANCE TRUST | 15 | ||||||
Table of Contents
JPMorgan Insurance Trust Core Bond Portfolio
SCHEDULE OF PORTFOLIO INVESTMENTS
AS OF DECEMBER 31, 2013 (continued)
| PRINCIPAL AMOUNT($) | SECURITY DESCRIPTION | VALUE($) | ||||||
| Corporate Bonds — Continued |
| ||||||
Food Products — Continued |
| |||||||
Kraft Foods Group, Inc., | ||||||||
| 66,000 | 5.375%, 02/10/20 | 74,461 | ||||||
| 122,000 | 6.125%, 08/23/18 | 142,206 | ||||||
| 100,000 | 6.875%, 01/26/39 | 121,784 | ||||||
|
| |||||||
| 506,906 | ||||||||
|
| |||||||
Household Products — 0.0% (g) |
| |||||||
| 67,129 | Procter & Gamble — ESOP, Series A, 9.360%, 01/01/21 | 85,599 | ||||||
|
| |||||||
Total Consumer Staples | 1,222,347 | |||||||
|
| |||||||
Energy — 1.2% |
| |||||||
Energy Equipment & Services — 0.1% |
| |||||||
| 54,000 | Halliburton Co., 3.500%, 08/01/23 | 52,346 | ||||||
| 5,000 | Noble Holding International Ltd., (Cayman Islands), 3.950%, 03/15/22 | 4,888 | ||||||
Transocean, Inc., (Cayman Islands), | ||||||||
| 18,000 | 6.375%, 12/15/21 | 20,227 | ||||||
| 75,000 | 6.500%, 11/15/20 | 85,646 | ||||||
| 14,000 | 7.350%, 12/15/41 | 16,884 | ||||||
|
| |||||||
| 179,991 | ||||||||
|
| |||||||
Oil, Gas & Consumable Fuels — 1.1% |
| |||||||
| 50,000 | Apache Corp., 6.900%, 09/15/18 | 60,099 | ||||||
BP Capital Markets plc, (United Kingdom), | ||||||||
| 71,000 | 2.750%, 05/10/23 | 64,830 | ||||||
| 150,000 | 4.742%, 03/11/21 | 164,079 | ||||||
| 100,000 | Canadian Natural Resources Ltd., (Canada), 5.900%, 02/01/18 | 113,825 | ||||||
Cenovus Energy, Inc., (Canada), | ||||||||
| 13,000 | 3.000%, 08/15/22 | 12,191 | ||||||
| 31,000 | 4.450%, 09/15/42 | 27,914 | ||||||
| 20,000 | Chevron Corp., 2.427%, 06/24/20 | 19,461 | ||||||
ConocoPhillips, | ||||||||
| 25,000 | 5.750%, 02/01/19 | 28,869 | ||||||
| 120,000 | 6.000%, 01/15/20 | 140,774 | ||||||
| 75,000 | ConocoPhillips Canada Funding Co. I, (Canada), 5.625%, 10/15/16 | 83,915 | ||||||
Devon Energy Corp., | ||||||||
| 47,000 | 3.250%, 05/15/22 | 44,817 | ||||||
| 21,000 | 4.750%, 05/15/42 | 19,473 | ||||||
| 15,000 | EOG Resources, Inc., 2.625%, 03/15/23 | 13,647 | ||||||
| 50,000 | Kerr-McGee Corp., 7.875%, 09/15/31 | 62,567 | ||||||
| 51,000 | Magellan Midstream Partners LP, 5.150%, 10/15/43 | 50,270 | ||||||
| 150,000 | Marathon Oil Corp., 6.000%, 10/01/17 | 169,992 | ||||||
| 100,000 | NGPL PipeCo LLC, 7.119%, 12/15/17 (e) | 90,500 | ||||||
| PRINCIPAL AMOUNT($) | SECURITY DESCRIPTION | VALUE($) | ||||||
Oil, Gas & Consumable Fuels — Continued |
| |||||||
| 56,000 | Petrobras Global Finance B.V., (Netherlands), 4.375%, 05/20/23 | 49,890 | ||||||
Petrobras International Finance Co., (Cayman Islands), | ||||||||
| 45,000 | 5.375%, 01/27/21 | 44,657 | ||||||
| 25,000 | 7.875%, 03/15/19 | 28,319 | ||||||
| 60,000 | Petro-Canada, (Canada), 6.800%, 05/15/38 | 71,812 | ||||||
Spectra Energy Capital LLC, | ||||||||
| 47,000 | 3.300%, 03/15/23 | 41,624 | ||||||
| 50,000 | 5.650%, 03/01/20 | 54,446 | ||||||
| 45,000 | 7.500%, 09/15/38 | 51,745 | ||||||
| 50,000 | 8.000%, 10/01/19 | 59,558 | ||||||
Spectra Energy Partners LP, | ||||||||
| 34,000 | 2.950%, 09/25/18 | 34,463 | ||||||
| 25,000 | 5.950%, 09/25/43 | 26,726 | ||||||
Statoil ASA, (Norway), | ||||||||
| 143,000 | 2.650%, 01/15/24 | 128,986 | ||||||
| 50,000 | 3.125%, 08/17/17 | 52,487 | ||||||
| 45,000 | Suncor Energy, Inc., (Canada), 6.850%, 06/01/39 | 54,138 | ||||||
Talisman Energy, Inc., (Canada), | ||||||||
| 45,000 | 5.500%, 05/15/42 | 42,385 | ||||||
| 5,000 | 5.850%, 02/01/37 | 4,831 | ||||||
| 10,000 | 6.250%, 02/01/38 | 10,169 | ||||||
| 40,000 | 7.750%, 06/01/19 | 47,907 | ||||||
| 28,000 | Total Capital International S.A., (France), 1.550%, 06/28/17 | 28,006 | ||||||
| 150,000 | Total Capital S.A., (France), 2.300%, 03/15/16 | 154,547 | ||||||
TransCanada PipeLines Ltd., (Canada), | ||||||||
| 50,000 | 6.500%, 08/15/18 | 58,844 | ||||||
| 50,000 | 7.125%, 01/15/19 | 60,436 | ||||||
|
| |||||||
| 2,273,199 | ||||||||
|
| |||||||
Total Energy | 2,453,190 | |||||||
|
| |||||||
Financials — 7.8% |
| |||||||
Capital Markets — 2.1% |
| |||||||
| 60,000 | Ameriprise Financial, Inc., 4.000%, 10/15/23 | 59,822 | ||||||
Bank of New York Mellon Corp. (The), | ||||||||
| 75,000 | 2.950%, 06/18/15 | 77,640 | ||||||
| 55,000 | 4.600%, 01/15/20 | 59,270 | ||||||
BlackRock, Inc., | ||||||||
| 80,000 | 3.500%, 12/10/14 | 82,338 | ||||||
| 130,000 | Series 2, 5.000%, 12/10/19 | 146,782 | ||||||
| 65,000 | 6.250%, 09/15/17 | 75,418 | ||||||
SEE NOTES TO FINANCIAL STATEMENTS.
| 16 | JPMORGAN INSURANCE TRUST | DECEMBER 31, 2013 | ||||
Table of Contents
| PRINCIPAL AMOUNT($) | SECURITY DESCRIPTION | VALUE($) | ||||||
| Corporate Bonds — Continued |
| ||||||
Capital Markets — Continued |
| |||||||
| 100,000 | Blackstone Holdings Finance Co. LLC, 5.875%, 03/15/21 (e) | 111,254 | ||||||
| 150,000 | Credit Suisse, (Switzerland), 5.500%, 05/01/14 | 152,445 | ||||||
| 50,000 | Credit Suisse USA, Inc., 4.875%, 01/15/15 | 52,239 | ||||||
Goldman Sachs Group, Inc. (The), | ||||||||
| 75,000 | 3.625%, 02/07/16 | 78,711 | ||||||
| 20,000 | 3.700%, 08/01/15 | 20,826 | ||||||
| 150,000 | 5.150%, 01/15/14 | 150,266 | ||||||
| 23,000 | 5.250%, 07/27/21 | 25,181 | ||||||
| 156,000 | 5.375%, 03/15/20 | 173,492 | ||||||
| 100,000 | 5.500%, 11/15/14 | 104,225 | ||||||
| 150,000 | 5.950%, 01/18/18 | 170,541 | ||||||
| 75,000 | 5.950%, 01/15/27 | 79,648 | ||||||
| 100,000 | 6.250%, 09/01/17 | 114,486 | ||||||
| 80,000 | 6.750%, 10/01/37 | 89,004 | ||||||
| 125,000 | 7.500%, 02/15/19 | 152,246 | ||||||
| 29,000 | Invesco Finance plc, (United Kingdom), 4.000%, 01/30/24 | 28,744 | ||||||
Jefferies Group LLC, | ||||||||
| 55,000 | 3.875%, 11/09/15 | 57,382 | ||||||
| 110,000 | 6.450%, 06/08/27 | 114,298 | ||||||
| 100,000 | 8.500%, 07/15/19 | 122,000 | ||||||
Macquarie Bank Ltd., (Australia), | ||||||||
| 62,000 | 2.000%, 08/15/16 (e) | 62,705 | ||||||
| 223,000 | 5.000%, 02/22/17 (e) | 241,830 | ||||||
| 50,000 | Macquarie Group Ltd., (Australia), 7.300%, 08/01/14 (e) | 51,831 | ||||||
Merrill Lynch & Co., Inc., | ||||||||
| 120,000 | 5.450%, 07/15/14 | 123,115 | ||||||
| 135,000 | 6.400%, 08/28/17 | 155,642 | ||||||
| 90,000 | 6.875%, 04/25/18 | 106,413 | ||||||
Morgan Stanley, | ||||||||
| 100,000 | 4.200%, 11/20/14 | 103,180 | ||||||
| 100,000 | 4.750%, 04/01/14 | 100,795 | ||||||
| 35,000 | 5.500%, 07/28/21 | 39,111 | ||||||
| 200,000 | 5.625%, 09/23/19 | 227,337 | ||||||
| 130,000 | 5.950%, 12/28/17 | 148,528 | ||||||
| 65,000 | Nomura Holdings, Inc., (Japan), 6.700%, 03/04/20 | 74,534 | ||||||
State Street Corp., | ||||||||
| 24,000 | 3.100%, 05/15/23 | 22,315 | ||||||
| 77,000 | 3.700%, 11/20/23 | 76,395 | ||||||
UBS AG, (Switzerland), | ||||||||
| 250,000 | 3.875%, 01/15/15 | 258,464 | ||||||
| PRINCIPAL AMOUNT($) | SECURITY DESCRIPTION | VALUE($) | ||||||
Capital Markets — Continued |
| |||||||
| 100,000 | 5.750%, 04/25/18 | 114,805 | ||||||
|
| |||||||
| 4,205,258 | ||||||||
|
| |||||||
Commercial Banks — 1.7% |
| |||||||
Bank of Nova Scotia, (Canada), | ||||||||
| 100,000 | 2.550%, 01/12/17 | 103,711 | ||||||
| 82,000 | 3.400%, 01/22/15 | 84,596 | ||||||
Barclays Bank plc, (United Kingdom), | ||||||||
| 106,000 | 2.750%, 02/23/15 | 108,394 | ||||||
| 100,000 | 5.200%, 07/10/14 | 102,497 | ||||||
| 150,000 | 6.050%, 12/04/17 (e) | 167,698 | ||||||
BB&T Corp., | ||||||||
| 100,000 | 3.950%, 04/29/16 | 106,457 | ||||||
| 50,000 | 4.900%, 06/30/17 | 54,714 | ||||||
| 50,000 | 5.700%, 04/30/14 | 50,862 | ||||||
| 200,000 | Cooperatieve Centrale Raiffeisen-Boerenleenbank B.A., (Netherlands), 3.200%, 03/11/15 (e) | 206,225 | ||||||
| 350,000 | Glitnir Banki HF, (Iceland), 0.000%, 10/15/08 (d) (e) (i) | 102,375 | ||||||
HSBC Bank plc, (United Kingdom), | ||||||||
| 100,000 | 3.500%, 06/28/15 (e) | 104,232 | ||||||
| 111,000 | 4.125%, 08/12/20 (e) | 117,448 | ||||||
National Australia Bank Ltd., (Australia), | ||||||||
| 200,000 | 2.750%, 09/28/15 (e) | 207,096 | ||||||
| 100,000 | 3.750%, 03/02/15 (e) | 103,726 | ||||||
PNC Funding Corp., | ||||||||
| 150,000 | 5.125%, 02/08/20 | 168,474 | ||||||
| 25,000 | 5.250%, 11/15/15 | 26,847 | ||||||
| 25,000 | 5.625%, 02/01/17 | 27,750 | ||||||
| 25,000 | 6.700%, 06/10/19 | 30,029 | ||||||
| 80,000 | Royal Bank of Canada, (Canada), 2.000%, 10/01/18 | 79,585 | ||||||
| 72,000 | Toronto-Dominion Bank (The), (Canada), 2.500%, 07/14/16 | 74,684 | ||||||
U.S. Bancorp, | ||||||||
| 90,000 | 2.450%, 07/27/15 | 92,530 | ||||||
| 100,000 | 7.500%, 06/01/26 | 122,949 | ||||||
Wachovia Bank N.A., | ||||||||
| 250,000 | 6.000%, 11/15/17 | 288,475 | ||||||
| 250,000 | VAR, 0.573%, 03/15/16 | 248,797 | ||||||
| 50,000 | Wachovia Corp., 5.750%, 02/01/18 | 57,654 | ||||||
Wells Fargo & Co., | ||||||||
| 284,000 | 5.606%, 01/15/44 (e) | 294,987 | ||||||
| 200,000 | SUB, 3.676%, 06/15/16 | 212,949 | ||||||
SEE NOTES TO FINANCIAL STATEMENTS.
| DECEMBER 31, 2013 | JPMORGAN INSURANCE TRUST | 17 | ||||||
Table of Contents
JPMorgan Insurance Trust Core Bond Portfolio
SCHEDULE OF PORTFOLIO INVESTMENTS
AS OF DECEMBER 31, 2013 (continued)
| PRINCIPAL AMOUNT($) | SECURITY DESCRIPTION | VALUE($) | ||||||
| Corporate Bonds — Continued |
| ||||||
Commercial Banks — Continued |
| |||||||
Westpac Banking Corp., (Australia), | ||||||||
| 65,000 | 4.200%, 02/27/15 | 67,767 | ||||||
| 121,000 | 4.875%, 11/19/19 | 134,266 | ||||||
|
| |||||||
| 3,547,774 | ||||||||
|
| |||||||
Consumer Finance — 0.9% |
| |||||||
| 50,000 | American Express Co., 7.000%, 03/19/18 | 59,742 | ||||||
American Honda Finance Corp., | ||||||||
| 200,000 | 1.600%, 02/16/18 (e) | 196,959 | ||||||
| 33,000 | 2.125%, 10/10/18 | 32,864 | ||||||
Capital One Financial Corp., | ||||||||
| 110,000 | 3.500%, 06/15/23 | 103,258 | ||||||
| 185,000 | 7.375%, 05/23/14 | 189,764 | ||||||
Caterpillar Financial Services Corp., | ||||||||
| 80,000 | 5.450%, 04/15/18 | 90,934 | ||||||
| 100,000 | 7.050%, 10/01/18 | 120,649 | ||||||
| 50,000 | 7.150%, 02/15/19 | 61,462 | ||||||
| 200,000 | Ford Motor Credit Co. LLC, 3.984%, 06/15/16 | 212,680 | ||||||
HSBC Finance Corp., | ||||||||
| 150,000 | 5.000%, 06/30/15 | 158,508 | ||||||
| 150,000 | 5.250%, 01/15/14 | 150,296 | ||||||
| 50,000 | 7.350%, 11/27/32 | 57,908 | ||||||
| 100,000 | VAR, 0.494%, 01/15/14 | 100,001 | ||||||
| 100,000 | HSBC USA, Inc., 1.625%, 01/16/18 | 98,606 | ||||||
John Deere Capital Corp., | ||||||||
| 39,000 | 1.200%, 10/10/17 | 38,030 | ||||||
| 42,000 | 3.150%, 10/15/21 | 41,411 | ||||||
Toyota Motor Credit Corp., | ||||||||
| 100,000 | 2.000%, 09/15/16 | 102,861 | ||||||
| 87,000 | 3.200%, 06/17/15 | 90,475 | ||||||
|
| |||||||
| 1,906,408 | ||||||||
|
| |||||||
Diversified Financial Services — 1.9% | ||||||||
Bank of America Corp., | ||||||||
| 50,000 | 2.000%, 01/11/18 | 49,911 | ||||||
| 295,000 | Series L, 5.650%, 05/01/18 | 335,789 | ||||||
| 245,000 | 5.750%, 12/01/17 | 278,838 | ||||||
| 50,000 | 6.500%, 08/01/16 | 56,455 | ||||||
| 200,000 | 7.375%, 05/15/14 | 204,978 | ||||||
| 25,000 | 7.625%, 06/01/19 | 31,008 | ||||||
Citigroup, Inc., | ||||||||
| 100,000 | 1.250%, 01/15/16 | 100,332 | ||||||
| 60,000 | 2.250%, 08/07/15 | 61,247 | ||||||
| 22,000 | 4.500%, 01/14/22 | 23,314 | ||||||
| 150,000 | 4.700%, 05/29/15 | 157,912 | ||||||
| PRINCIPAL AMOUNT($) | SECURITY DESCRIPTION | VALUE($) | ||||||
Diversified Financial Services — Continued |
| |||||||
| 30,000 | 4.750%, 05/19/15 | 31,568 | ||||||
| 300,000 | 5.000%, 09/15/14 | 308,545 | ||||||
| 36,000 | 5.375%, 08/09/20 | 40,955 | ||||||
| 58,000 | 5.500%, 09/13/25 | 61,088 | ||||||
| 5,000 | 6.000%, 08/15/17 | 5,699 | ||||||
| 101,000 | 6.010%, 01/15/15 | 106,357 | ||||||
| 100,000 | 8.125%, 07/15/39 | 140,269 | ||||||
| 45,000 | 8.500%, 05/22/19 | 57,671 | ||||||
CME Group, Inc., | ||||||||
| 16,000 | 5.300%, 09/15/43 | 16,744 | ||||||
| 70,000 | 5.750%, 02/15/14 | 70,422 | ||||||
| 75,000 | Countrywide Financial Corp., 6.250%, 05/15/16 | 82,762 | ||||||
General Electric Capital Corp., | ||||||||
| 200,000 | Series A, 4.750%, 09/15/14 | 206,268 | ||||||
| 305,000 | 5.500%, 01/08/20 | 349,275 | ||||||
| 285,000 | 5.625%, 05/01/18 | 327,285 | ||||||
| 100,000 | 5.875%, 01/14/38 | 113,911 | ||||||
| 115,000 | 5.900%, 05/13/14 | 117,326 | ||||||
| 200,000 | 6.750%, 03/15/32 | 247,661 | ||||||
IntercontinentalExchange Group, Inc., | ||||||||
| 23,000 | 2.500%, 10/15/18 | 23,169 | ||||||
| 59,000 | 4.000%, 10/15/23 | 59,350 | ||||||
| 50,000 | National Rural Utilities Cooperative Finance Corp., 10.375%, 11/01/18 | 67,619 | ||||||
Shell International Finance B.V., (Netherlands), | ||||||||
| 42,000 | 1.125%, 08/21/17 | 41,421 | ||||||
| 60,000 | 6.375%, 12/15/38 | 74,520 | ||||||
|
| |||||||
| 3,849,669 | ||||||||
|
| |||||||
Insurance — 0.8% | ||||||||
| 35,000 | ACE INA Holdings, Inc., 5.600%, 05/15/15 | 37,331 | ||||||
Aflac, Inc., | ||||||||
| 63,000 | 3.625%, 06/15/23 | 60,983 | ||||||
| 25,000 | 6.450%, 08/15/40 | 29,415 | ||||||
| 20,000 | 8.500%, 05/15/19 | 25,544 | ||||||
| 31,000 | Allstate Corp. (The), 3.150%, 06/15/23 | 29,399 | ||||||
| 59,000 | American International Group, Inc., 4.125%, 02/15/24 | 58,658 | ||||||
Aon Corp., | ||||||||
| 40,000 | 3.125%, 05/27/16 | 41,715 | ||||||
| 23,000 | 3.500%, 09/30/15 | 24,005 | ||||||
| 18,000 | 6.250%, 09/30/40 | 20,583 | ||||||
Berkshire Hathaway Finance Corp., | ||||||||
| 33,000 | 2.450%, 12/15/15 | 34,199 | ||||||
SEE NOTES TO FINANCIAL STATEMENTS.
| 18 | JPMORGAN INSURANCE TRUST | DECEMBER 31, 2013 | ||||
Table of Contents
| PRINCIPAL AMOUNT($) | SECURITY DESCRIPTION | VALUE($) | ||||||
| Corporate Bonds — Continued |
| ||||||
Insurance — Continued |
| |||||||
| 62,000 | 4.300%, 05/15/43 | 55,838 | ||||||
| 50,000 | 5.400%, 05/15/18 | 57,511 | ||||||
| 100,000 | 5.750%, 01/15/40 | 110,619 | ||||||
| 75,000 | CNA Financial Corp., 5.875%, 08/15/20 | 85,502 | ||||||
| 27,000 | Liberty Mutual Group, Inc., 5.000%, 06/01/21 (e) | 28,317 | ||||||
| 20,000 | Lincoln National Corp., 4.850%, 06/24/21 | 21,482 | ||||||
| 100,000 | MassMutual Global Funding II, 3.125%, 04/14/16 (e) | 104,676 | ||||||
Metropolitan Life Global Funding I, | ||||||||
| 100,000 | 1.700%, 06/29/15 (e) | 101,503 | ||||||
| 175,000 | 3.650%, 06/14/18 (e) | 184,505 | ||||||
| 75,000 | Nationwide Mutual Insurance Co., 9.375%, 08/15/39 (e) | 105,175 | ||||||
| 100,000 | Pacific Life Global Funding, 5.000%, 05/15/17 (e) | 104,568 | ||||||
| 35,000 | Principal Life Income Funding Trusts, 5.100%, 04/15/14 | 35,467 | ||||||
| 150,000 | Prudential Insurance Co. of America (The), 8.300%, 07/01/25 (e) | 188,281 | ||||||
| 25,000 | Travelers Cos., Inc. (The), 5.800%, 05/15/18 | 28,799 | ||||||
|
| |||||||
| 1,574,075 | ||||||||
|
| |||||||
Real Estate Investment Trusts (REITs) — 0.4% |
| |||||||
| 40,000 | American Tower Corp., 3.500%, 01/31/23 | 36,470 | ||||||
CommonWealth REIT, | ||||||||
| 75,000 | 5.875%, 09/15/20 | 77,161 | ||||||
| 100,000 | 6.650%, 01/15/18 | 109,041 | ||||||
| 92,000 | HCP, Inc., 5.375%, 02/01/21 | 100,149 | ||||||
| 37,000 | Health Care REIT, Inc., 4.500%, 01/15/24 | 36,532 | ||||||
| 27,000 | ProLogis LP, 4.250%, 08/15/23 | 26,672 | ||||||
Simon Property Group LP, | ||||||||
| 8,000 | 4.200%, 02/01/15 | 8,235 | ||||||
| 20,000 | 4.375%, 03/01/21 | 21,147 | ||||||
| 50,000 | 5.625%, 08/15/14 | 51,184 | ||||||
| 50,000 | 5.650%, 02/01/20 | 56,849 | ||||||
| 45,000 | 6.100%, 05/01/16 | 49,694 | ||||||
| 30,000 | 6.750%, 05/15/14 | 30,210 | ||||||
| 102,000 | WEA Finance LLC/WT Finance Aust Pty Ltd., 6.750%, 09/02/19 (e) | 121,278 | ||||||
|
| |||||||
| 724,622 | ||||||||
|
| |||||||
Total Financials | 15,807,806 | |||||||
|
| |||||||
| PRINCIPAL AMOUNT($) | SECURITY DESCRIPTION | VALUE($) | ||||||
Health Care — 0.4% | ||||||||
Biotechnology — 0.1% | ||||||||
Amgen, Inc., | ||||||||
| 25,000 | 4.500%, 03/15/20 | 26,805 | ||||||
| 100,000 | 5.150%, 11/15/41 | 99,629 | ||||||
| 40,000 | 5.700%, 02/01/19 | 46,096 | ||||||
| 82,000 | 5.750%, 03/15/40 | 87,856 | ||||||
| 49,000 | Celgene Corp., 3.250%, 08/15/22 | 46,391 | ||||||
|
| |||||||
| 306,777 | ||||||||
|
| |||||||
Health Care Equipment & Supplies — 0.0% (g) |
| |||||||
| 10,000 | Baxter International, Inc., 4.000%, 03/01/14 | 10,055 | ||||||
|
| |||||||
Health Care Providers & Services — 0.1% | ||||||||
| 30,000 | Medco Health Solutions, Inc., 2.750%, 09/15/15 | 30,968 | ||||||
| 50,000 | UnitedHealth Group, Inc., 6.625%, 11/15/37 | 60,493 | ||||||
WellPoint, Inc., | ||||||||
| 47,000 | 2.300%, 07/15/18 | 46,627 | ||||||
| 18,000 | 3.300%, 01/15/23 | 16,798 | ||||||
| 18,000 | 4.650%, 01/15/43 | 16,664 | ||||||
|
| |||||||
| 171,550 | ||||||||
|
| |||||||
Pharmaceuticals — 0.2% | ||||||||
AbbVie, Inc., | ||||||||
| 45,000 | 1.750%, 11/06/17 | 44,923 | ||||||
| 22,000 | 2.900%, 11/06/22 | 20,562 | ||||||
| 35,000 | AstraZeneca plc, (United Kingdom), 5.400%, 06/01/14 | 35,733 | ||||||
| 50,000 | GlaxoSmithKline Capital, Inc., 4.375%, 04/15/14 | 50,558 | ||||||
| 63,000 | Merck & Co., Inc., 2.800%, 05/18/23 | 58,324 | ||||||
| 80,000 | Novartis Capital Corp., 4.125%, 02/10/14 | 80,296 | ||||||
Zoetis, Inc., | ||||||||
| 14,000 | 1.875%, 02/01/18 | 13,885 | ||||||
| 9,000 | 4.700%, 02/01/43 | 8,412 | ||||||
|
| |||||||
| 312,693 | ||||||||
|
| |||||||
Total Health Care | 801,075 | |||||||
|
| |||||||
Industrials — 0.8% | ||||||||
Aerospace & Defense — 0.1% | ||||||||
| 51,000 | BAE Systems plc, (United Kingdom), 5.800%, 10/11/41 (e) | 52,828 | ||||||
| 32,000 | EADS Finance B.V., (Netherlands), 2.700%, 04/17/23 (e) | 29,347 | ||||||
SEE NOTES TO FINANCIAL STATEMENTS.
| DECEMBER 31, 2013 | JPMORGAN INSURANCE TRUST | 19 | ||||||
Table of Contents
JPMorgan Insurance Trust Core Bond Portfolio
SCHEDULE OF PORTFOLIO INVESTMENTS
AS OF DECEMBER 31, 2013 (continued)
| PRINCIPAL AMOUNT($) | SECURITY DESCRIPTION | VALUE($) | ||||||
| Corporate Bonds — Continued |
| ||||||
Aerospace & Defense — Continued | ||||||||
Lockheed Martin Corp., | ||||||||
| 33,000 | 2.125%, 09/15/16 | 33,858 | ||||||
| 30,000 | 4.850%, 09/15/41 | 29,482 | ||||||
| 100,000 | United Technologies Corp., 6.125%, 02/01/19 | 118,040 | ||||||
|
| |||||||
| 263,555 | ||||||||
|
| |||||||
Air Freight & Logistics — 0.0% (g) | ||||||||
| 35,000 | United Parcel Service of America, Inc., 8.375%, 04/01/20 | 45,277 | ||||||
|
| |||||||
Airlines — 0.1% | ||||||||
| 26,000 | Air Canada 2013-1 Class A Pass-Through Trust, (Canada), 4.125%, 05/15/25 (e) | 25,350 | ||||||
| 27,403 | American Airlines 2011-1 Class A Pass-Through Trust, 5.250%, 01/31/21 | 28,979 | ||||||
| 42,585 | Delta Air Lines 2010-2 Class A Pass-Through Trust, 4.950%, 05/23/19 | 45,885 | ||||||
|
| |||||||
| 100,214 | ||||||||
|
| |||||||
Commercial Services & Supplies — 0.1% | ||||||||
ADT Corp. (The), | ||||||||
| 35,000 | 3.500%, 07/15/22 | 30,466 | ||||||
| 17,000 | 4.125%, 06/15/23 | 15,087 | ||||||
| 28,000 | 4.875%, 07/15/42 | 21,070 | ||||||
| 21,000 | Republic Services, Inc., 3.550%, 06/01/22 | 20,249 | ||||||
| 43,000 | Waste Management, Inc., 4.750%, 06/30/20 | 46,759 | ||||||
|
| |||||||
| 133,631 | ||||||||
|
| |||||||
Construction & Engineering — 0.0% (g) | ||||||||
| 23,000 | ABB Finance USA, Inc., 2.875%, 05/08/22 | 21,733 | ||||||
| 44,000 | Fluor Corp., 3.375%, 09/15/21 | 42,887 | ||||||
|
| |||||||
| 64,620 | ||||||||
|
| |||||||
Industrial Conglomerates — 0.1% | ||||||||
| 44,000 | Danaher Corp., 3.900%, 06/23/21 | 45,526 | ||||||
| 65,000 | General Electric Co., 5.250%, 12/06/17 | 73,576 | ||||||
| 22,000 | Koninklijke Philips N.V., (Netherlands), 5.750%, 03/11/18 | 25,169 | ||||||
|
| |||||||
| 144,271 | ||||||||
|
| |||||||
Machinery — 0.0% (g) | ||||||||
| 80,000 | Illinois Tool Works, Inc., 3.900%, 09/01/42 | 68,461 | ||||||
| 25,000 | Parker Hannifin Corp., 5.500%, 05/15/18 | 28,320 | ||||||
|
| |||||||
| 96,781 | ||||||||
|
| |||||||
Road & Rail — 0.4% | ||||||||
Burlington Northern Santa Fe LLC, | ||||||||
| 50,000 | 3.000%, 03/15/23 | 46,563 | ||||||
| PRINCIPAL AMOUNT($) | SECURITY DESCRIPTION | VALUE($) | ||||||
Road & Rail — Continued | ||||||||
| 25,000 | 3.600%, 09/01/20 | 25,361 | ||||||
| 25,000 | 4.375%, 09/01/42 | 22,336 | ||||||
| 77,000 | 5.150%, 09/01/43 | 78,223 | ||||||
| 75,000 | 5.400%, 06/01/41 | 77,791 | ||||||
| 100,000 | 5.650%, 05/01/17 | 112,151 | ||||||
| 85,000 | 5.750%, 05/01/40 | 93,279 | ||||||
CSX Corp., | ||||||||
| 33,000 | 4.250%, 06/01/21 | 34,458 | ||||||
| 50,000 | 5.500%, 04/15/41 | 52,584 | ||||||
| 25,000 | 7.375%, 02/01/19 | 30,330 | ||||||
ERAC USA Finance LLC, | ||||||||
| 45,000 | 4.500%, 08/16/21 (e) | 46,897 | ||||||
| 12,000 | 5.625%, 03/15/42 (e) | 12,256 | ||||||
Norfolk Southern Corp., | ||||||||
| 70,000 | 3.950%, 10/01/42 | 58,899 | ||||||
| 78,000 | 6.000%, 05/23/11 † | 82,588 | ||||||
| 27,000 | Penske Truck Leasing Co. LP/PTL Finance Corp., 2.875%, 07/17/18 (e) | 27,159 | ||||||
| 35,000 | Ryder System, Inc., 3.600%, 03/01/16 | 36,515 | ||||||
|
| |||||||
| 837,390 | ||||||||
|
| |||||||
Total Industrials | 1,685,739 | |||||||
|
| |||||||
Information Technology — 1.0% | ||||||||
Communications Equipment — 0.1% | ||||||||
Cisco Systems, Inc., | ||||||||
| 80,000 | 5.500%, 02/22/16 | 88,011 | ||||||
| 75,000 | 5.900%, 02/15/39 | 83,383 | ||||||
|
| |||||||
| 171,394 | ||||||||
|
| |||||||
Computers & Peripherals — 0.3% | ||||||||
Apple, Inc., | ||||||||
| 142,000 | 2.400%, 05/03/23 | 127,688 | ||||||
| 69,000 | VAR, 0.492%, 05/03/18 | 68,883 | ||||||
| 25,000 | Dell, Inc., 7.100%, 04/15/28 | 22,000 | ||||||
EMC Corp., | ||||||||
| 40,000 | 1.875%, 06/01/18 | 39,546 | ||||||
| 50,000 | 3.375%, 06/01/23 | 48,040 | ||||||
Hewlett-Packard Co., | ||||||||
| 24,000 | 4.300%, 06/01/21 | 24,325 | ||||||
| 20,000 | 4.650%, 12/09/21 | 20,593 | ||||||
| 75,000 | 4.750%, 06/02/14 | 76,201 | ||||||
| 98,000 | 6.000%, 09/15/41 | 98,189 | ||||||
|
| |||||||
| 525,465 | ||||||||
|
| |||||||
SEE NOTES TO FINANCIAL STATEMENTS.
| 20 | JPMORGAN INSURANCE TRUST | DECEMBER 31, 2013 | ||||
Table of Contents
| PRINCIPAL AMOUNT($) | SECURITY DESCRIPTION | VALUE($) | ||||||
| Corporate Bonds — Continued |
| ||||||
Electronic Equipment, Instruments & Components — 0.1% |
| |||||||
Arrow Electronics, Inc., | ||||||||
| 13,000 | 3.000%, 03/01/18 | 13,007 | ||||||
| 25,000 | 3.375%, 11/01/15 | 25,872 | ||||||
| 8,000 | 4.500%, 03/01/23 | 7,694 | ||||||
| 25,000 | 6.000%, 04/01/20 | 26,661 | ||||||
| 80,000 | 6.875%, 06/01/18 | 90,643 | ||||||
| 7,000 | 7.500%, 01/15/27 | 8,039 | ||||||
|
| |||||||
| 171,916 | ||||||||
|
| |||||||
IT Services — 0.2% | ||||||||
| 50,000 | HP Enterprise Services LLC, 7.450%, 10/15/29 | 56,256 | ||||||
International Business Machines Corp., | ||||||||
| 174,000 | 1.625%, 05/15/20 | 163,165 | ||||||
| 169,000 | 4.000%, 06/20/42 | 150,904 | ||||||
| 50,000 | 6.220%, 08/01/27 | 59,137 | ||||||
|
| |||||||
| 429,462 | ||||||||
|
| |||||||
Office Electronics — 0.0% (g) | ||||||||
Xerox Corp., | ||||||||
| 17,000 | 4.500%, 05/15/21 | 17,498 | ||||||
| 35,000 | 5.625%, 12/15/19 | 38,595 | ||||||
| 50,000 | 6.750%, 02/01/17 | 56,788 | ||||||
|
| |||||||
| 112,881 | ||||||||
|
| |||||||
Semiconductors & Semiconductor Equipment — 0.1% |
| |||||||
| 110,000 | National Semiconductor Corp., 6.600%, 06/15/17 | 128,552 | ||||||
|
| |||||||
Software — 0.2% | ||||||||
Microsoft Corp., | ||||||||
| 75,000 | 1.625%, 09/25/15 | 76,562 | ||||||
| 108,000 | 2.375%, 05/01/23 | 97,708 | ||||||
Oracle Corp., | ||||||||
| 50,000 | 5.250%, 01/15/16 | 54,580 | ||||||
| 50,000 | 5.750%, 04/15/18 | 57,779 | ||||||
| 100,000 | 6.500%, 04/15/38 | 121,835 | ||||||
|
| |||||||
| 408,464 | ||||||||
|
| |||||||
Total Information Technology | 1,948,134 | |||||||
|
| |||||||
Materials — 0.5% | ||||||||
Chemicals — 0.3% | ||||||||
| 30,000 | Dow Chemical Co. (The), 7.375%, 11/01/29 | 38,554 | ||||||
E.I. du Pont de Nemours & Co., | ||||||||
| 58,000 | 1.950%, 01/15/16 | 59,183 | ||||||
| 25,000 | 4.900%, 01/15/41 | 24,650 | ||||||
| PRINCIPAL AMOUNT($) | SECURITY DESCRIPTION | VALUE($) | ||||||
Chemicals — Continued | ||||||||
Mosaic Co. (The), | ||||||||
| 24,000 | 3.750%, 11/15/21 | 23,493 | ||||||
| 71,000 | 4.250%, 11/15/23 | 70,119 | ||||||
| 8,000 | 4.875%, 11/15/41 | 7,243 | ||||||
| 36,000 | 5.450%, 11/15/33 | 36,679 | ||||||
| 22,000 | 5.625%, 11/15/43 | 22,319 | ||||||
| 10,000 | Potash Corp. of Saskatchewan, Inc., (Canada), 3.250%, 12/01/17 | 10,435 | ||||||
PPG Industries, Inc., | ||||||||
| 14,000 | 5.500%, 11/15/40 | 14,593 | ||||||
| 50,000 | 9.000%, 05/01/21 | 64,067 | ||||||
Union Carbide Corp., | ||||||||
| 100,000 | 7.500%, 06/01/25 | 115,803 | ||||||
| 80,000 | 7.750%, 10/01/96 | 87,350 | ||||||
|
| |||||||
| 574,488 | ||||||||
|
| |||||||
Construction Materials — 0.0% (g) | ||||||||
| 18,000 | CRH America, Inc., 6.000%, 09/30/16 | 20,108 | ||||||
|
| |||||||
Metals & Mining — 0.2% | ||||||||
BHP Billiton Finance USA Ltd., (Australia), | ||||||||
| 44,000 | 3.850%, 09/30/23 | 44,191 | ||||||
| 40,000 | 5.400%, 03/29/17 | 44,798 | ||||||
| 80,000 | 6.500%, 04/01/19 | 95,912 | ||||||
| 55,000 | Freeport-McMoRan Copper & Gold, Inc., 3.875%, 03/15/23 | 52,010 | ||||||
| 13,000 | Nucor Corp., 4.000%, 08/01/23 | 12,690 | ||||||
Rio Tinto Finance USA Ltd., (Australia), | ||||||||
| 12,000 | 3.500%, 11/02/20 | 12,251 | ||||||
| 60,000 | 8.950%, 05/01/14 | 61,630 | ||||||
| 29,000 | Rio Tinto Finance USA plc, (United Kingdom), 1.625%, 08/21/17 | 28,989 | ||||||
|
| |||||||
| 352,471 | ||||||||
|
| |||||||
Total Materials | 947,067 | |||||||
|
| |||||||
Telecommunication Services — 1.4% | ||||||||
Diversified Telecommunication Services — 1.2% |
| |||||||
AT&T, Inc., | ||||||||
| 140,000 | 3.875%, 08/15/21 | 141,834 | ||||||
| 10,000 | 4.300%, 12/15/42 | 8,482 | ||||||
| 205,000 | 5.350%, 09/01/40 | 202,834 | ||||||
| 100,000 | 5.500%, 02/01/18 | 112,568 | ||||||
| 45,000 | 6.300%, 01/15/38 | 49,736 | ||||||
| 145,000 | BellSouth Corp., 5.200%, 09/15/14 | 149,729 | ||||||
| 98,484 | BellSouth Telecommunications LLC, 6.300%, 12/15/15 | 103,258 | ||||||
SEE NOTES TO FINANCIAL STATEMENTS.
| DECEMBER 31, 2013 | JPMORGAN INSURANCE TRUST | 21 | ||||||
Table of Contents
JPMorgan Insurance Trust Core Bond Portfolio
SCHEDULE OF PORTFOLIO INVESTMENTS
AS OF DECEMBER 31, 2013 (continued)
| PRINCIPAL AMOUNT($) | SECURITY DESCRIPTION | VALUE($) | ||||||
| Corporate Bonds — Continued |
| ||||||
Diversified Telecommunication Services — Continued |
| |||||||
| 100,000 | Cellco Partnership/Verizon Wireless Capital LLC, 8.500%, 11/15/18 | 126,613 | ||||||
| 50,000 | Centel Capital Corp., 9.000%, 10/15/19 | 59,280 | ||||||
CenturyLink, Inc., | ||||||||
| 90,000 | Series S, 6.450%, 06/15/21 | 93,600 | ||||||
| 50,000 | Series P, 7.600%, 09/15/39 | 44,500 | ||||||
| 70,000 | Deutsche Telekom International Finance B.V., (Netherlands), 8.654%, 06/15/30 | 98,755 | ||||||
| 200,000 | GTE Corp., 6.840%, 04/15/18 | 232,951 | ||||||
| 125,000 | GTP Acquisition Partners I LLC, 4.347%, 06/15/16 (e) | 131,558 | ||||||
| 35,000 | Orange S.A., (France), 2.750%, 09/14/16 | 36,346 | ||||||
Telefonica Emisiones S.A.U., (Spain), | ||||||||
| 19,000 | 5.462%, 02/16/21 | 20,048 | ||||||
| 25,000 | 5.877%, 07/15/19 | 27,877 | ||||||
Verizon Communications, Inc., | ||||||||
| 16,000 | 2.500%, 09/15/16 | 16,545 | ||||||
| 106,000 | 4.500%, 09/15/20 | 113,480 | ||||||
| 84,000 | 6.400%, 09/15/33 | 96,610 | ||||||
| 90,000 | 6.400%, 02/15/38 | 101,067 | ||||||
| 200,000 | 7.750%, 12/01/30 | 255,449 | ||||||
Verizon Pennsylvania LLC, | ||||||||
| 100,000 | 8.350%, 12/15/30 | 118,890 | ||||||
| 50,000 | 8.750%, 08/15/31 | 61,784 | ||||||
|
| |||||||
| 2,403,794 | ||||||||
|
| |||||||
Wireless Telecommunication Services — 0.2% |
| |||||||
| 40,000 | Crown Castle Towers LLC, 3.214%, 08/15/15 (e) | 40,782 | ||||||
Rogers Communications, Inc., (Canada), | ||||||||
| 80,000 | 4.100%, 10/01/23 | 80,151 | ||||||
| 70,000 | 6.375%, 03/01/14 | 70,668 | ||||||
| 50,000 | 6.800%, 08/15/18 | 59,592 | ||||||
| 25,000 | 8.750%, 05/01/32 | 32,411 | ||||||
Vodafone Group plc, (United Kingdom), | ||||||||
| 50,000 | 1.500%, 02/19/18 | 48,749 | ||||||
| 50,000 | 1.625%, 03/20/17 | 49,982 | ||||||
| 50,000 | 5.000%, 09/15/15 | 53,465 | ||||||
|
| |||||||
| 435,800 | ||||||||
|
| |||||||
Total Telecommunication Services | 2,839,594 | |||||||
|
| |||||||
Utilities — 1.3% | ||||||||
Electric Utilities — 1.0% | ||||||||
| 62,000 | Alabama Power Co., 6.125%, 05/15/38 | 73,275 | ||||||
| 9,000 | Arizona Public Service Co., 4.500%, 04/01/42 | 8,618 | ||||||
| PRINCIPAL AMOUNT($) | SECURITY DESCRIPTION | VALUE($) | ||||||
Electric Utilities — Continued | ||||||||
Duke Energy Carolinas LLC, | ||||||||
| 39,000 | 4.300%, 06/15/20 | 41,821 | ||||||
| 75,000 | 5.100%, 04/15/18 | 84,509 | ||||||
| 60,000 | Duke Energy Indiana, Inc., 6.350%, 08/15/38 | 73,097 | ||||||
| 25,000 | Duke Energy Progress, Inc., 5.300%, 01/15/19 | 28,435 | ||||||
Florida Power & Light Co., | ||||||||
| 55,000 | 5.950%, 10/01/33 | 64,759 | ||||||
| 30,000 | 5.950%, 02/01/38 | 35,155 | ||||||
| 25,000 | Georgia Power Co., 5.950%, 02/01/39 | 27,628 | ||||||
| 18,000 | Great Plains Energy, Inc., 4.850%, 06/01/21 | 18,966 | ||||||
| 100,000 | Hydro-Quebec, (Canada), Series IO, 8.050%, 07/07/24 | 133,195 | ||||||
Kansas City Power & Light Co., | ||||||||
| 24,000 | 3.150%, 03/15/23 | 22,256 | ||||||
| 50,000 | 5.300%, 10/01/41 | 50,033 | ||||||
| 40,000 | Niagara Mohawk Power Corp., 4.881%, 08/15/19 (e) | 44,218 | ||||||
| 25,000 | Northern States Power Co., 6.250%, 06/01/36 | 30,156 | ||||||
| 40,000 | Ohio Power Co., 6.050%, 05/01/18 | 45,725 | ||||||
Oncor Electric Delivery Co. LLC, | ||||||||
| 30,000 | 6.800%, 09/01/18 | 35,256 | ||||||
| 25,000 | 7.000%, 09/01/22 | 29,825 | ||||||
Pacific Gas & Electric Co., | ||||||||
| 24,000 | 4.500%, 12/15/41 | 22,564 | ||||||
| 75,000 | 5.625%, 11/30/17 | 84,973 | ||||||
| 100,000 | 6.050%, 03/01/34 | 114,550 | ||||||
| 75,000 | Potomac Electric Power Co., 6.500%, 11/15/37 | 93,057 | ||||||
| 35,000 | Progress Energy, Inc., 4.400%, 01/15/21 | 36,936 | ||||||
| 18,000 | Public Service Co. of Colorado, 3.200%, 11/15/20 | 18,093 | ||||||
| 175,000 | Public Service Co. of Oklahoma, Series G, 6.625%, 11/15/37 | 202,391 | ||||||
| 28,000 | Public Service Electric & Gas Co., 5.375%, 11/01/39 | 30,565 | ||||||
| 53,000 | Southern California Edison Co., Series C, 3.500%, 10/01/23 | 51,943 | ||||||
| 50,000 | Southwestern Public Service Co., Series G, 8.750%, 12/01/18 | 63,729 | ||||||
| 200,000 | State Grid Overseas Investment Ltd., (United Kingdom), 1.750%, 05/22/18 (e) | 193,997 | ||||||
Virginia Electric and Power Co., | ||||||||
| 50,000 | 5.400%, 04/30/18 | 56,750 | ||||||
SEE NOTES TO FINANCIAL STATEMENTS.
| 22 | JPMORGAN INSURANCE TRUST | DECEMBER 31, 2013 | ||||
Table of Contents
| PRINCIPAL AMOUNT($) | SECURITY DESCRIPTION | VALUE($) | ||||||
| Corporate Bonds — Continued |
| ||||||
Electric Utilities — Continued | ||||||||
| 70,000 | 5.950%, 09/15/17 | 80,715 | ||||||
| 70,000 | 6.350%, 11/30/37 | 84,369 | ||||||
| 20,000 | Xcel Energy, Inc., 6.500%, 07/01/36 | 23,827 | ||||||
|
| |||||||
| 2,005,386 | ||||||||
|
| |||||||
Gas Utilities — 0.0% (g) | ||||||||
| 22,000 | Boston Gas Co., 4.487%, 02/15/42 (e) | 20,797 | ||||||
| 25,000 | CenterPoint Energy Resources Corp., 6.125%, 11/01/17 | 28,695 | ||||||
|
| |||||||
| 49,492 | ||||||||
|
| |||||||
Independent Power Producers & Energy Traders — 0.1% |
| |||||||
Exelon Generation Co. LLC, | ||||||||
| 78,000 | 4.000%, 10/01/20 | 77,970 | ||||||
| 29,000 | 5.750%, 10/01/41 | 27,778 | ||||||
| 37,000 | PSEG Power LLC, 5.125%, 04/15/20 | 40,350 | ||||||
|
| |||||||
| 146,098 | ||||||||
|
| |||||||
Multi-Utilities — 0.2% | ||||||||
AGL Capital Corp., | ||||||||
| 37,000 | 3.500%, 09/15/21 | 36,811 | ||||||
| 42,000 | 4.400%, 06/01/43 | 37,870 | ||||||
| 96,000 | 5.875%, 03/15/41 | 105,296 | ||||||
| 38,000 | Consolidated Edison Co. of New York, Inc., 5.700%, 06/15/40 | 43,124 | ||||||
Sempra Energy, | ||||||||
| 62,000 | 4.050%, 12/01/23 | 61,221 | ||||||
| 100,000 | 6.500%, 06/01/16 | 112,520 | ||||||
|
| |||||||
| 396,842 | ||||||||
|
| |||||||
Total Utilities | 2,597,818 | |||||||
|
| |||||||
Total Corporate Bonds | 32,826,334 | |||||||
|
| |||||||
| Foreign Government Securities — 0.2% |
| ||||||
Province of Ontario, (Canada), | ||||||||
| 75,000 | 2.700%, 06/16/15 | 77,467 | ||||||
| 200,000 | 2.950%, 02/05/15 | 205,572 | ||||||
| 58,000 | United Mexican States, (Mexico), 4.000%, 10/02/23 | 57,420 | ||||||
|
| |||||||
Total Foreign Government Securities | 340,459 | |||||||
|
| |||||||
| Mortgage Pass-Through Securities — 7.7% |
| ||||||
Federal Home Loan Mortgage Corp., | ||||||||
| 65,000 | ARM, 2.256%, 01/01/27 | 69,326 | ||||||
| 19,787 | ARM, 2.321%, 04/01/30 | 21,149 | ||||||
| 120,864 | ARM, 2.459%, 03/01/35 | 128,508 | ||||||
| 117,174 | ARM, 2.546%, 04/01/34 | 124,323 | ||||||
| 28,778 | ARM, 4.799%, 01/01/37 | 30,864 | ||||||
| PRINCIPAL AMOUNT($) | SECURITY DESCRIPTION | VALUE($) | ||||||
Federal Home Loan Mortgage Corp. Gold Pools, 15 Year, Single Family, | ||||||||
| 21,313 | 4.500%, 08/01/18 | 22,595 | ||||||
| 3,307 | 5.000%, 04/01/14 | 3,497 | ||||||
| 164 | 5.500%, 03/01/14 | 173 | ||||||
| 300 | 6.000%, 04/01/14 | 301 | ||||||
| 100,843 | 6.500%, 06/01/14 - 02/01/19 | 107,081 | ||||||
| 695 | 8.500%, 11/01/15 | 698 | ||||||
Federal Home Loan Mortgage Corp. Gold Pools, 20 Year, Single Family, | ||||||||
| 25,223 | 6.000%, 12/01/22 | 27,856 | ||||||
| 52,073 | 6.500%, 11/01/22 | 57,981 | ||||||
Federal Home Loan Mortgage Corp. Gold Pools, 30 Year, Single Family, | ||||||||
| 99,533 | 5.500%, 10/01/33 | 109,622 | ||||||
| 181,103 | 6.000%, 04/01/26 - 02/01/39 | 200,157 | ||||||
| 262,225 | 6.500%, 11/01/25 - 11/01/34 | 292,121 | ||||||
| 90,588 | 7.000%, 04/01/35 | 105,832 | ||||||
| 5,382 | 8.500%, 07/01/28 | 6,342 | ||||||
Federal Home Loan Mortgage Corp. Gold Pools, Other, | ||||||||
| 1,898,734 | 3.500%, 04/01/33 - 06/01/42 | 1,887,451 | ||||||
| 471,532 | 4.000%, 06/01/42 | 480,623 | ||||||
| 67,984 | 7.000%, 07/01/29 | 76,210 | ||||||
Federal Home Loan Mortgage Corp., 30 Year, Single Family, | ||||||||
| 20,330 | 10.000%, 01/01/20 - 09/01/20 | 21,464 | ||||||
| 342 | 12.000%, 07/01/19 | 347 | ||||||
Federal National Mortgage Association, | ||||||||
| 423,859 | ARM, 1.898%, 01/01/35 | 448,491 | ||||||
| 1,380 | ARM, 1.903%, 03/01/19 | 1,403 | ||||||
| 8,015 | ARM, 2.262%, 04/01/34 | 8,516 | ||||||
| 95,987 | ARM, 2.277%, 07/01/33 | 101,959 | ||||||
| 119,398 | ARM, 2.279%, 08/01/34 | 126,828 | ||||||
| 88,293 | ARM, 2.323%, 01/01/34 | 93,100 | ||||||
| 111,478 | ARM, 2.370%, 10/01/34 | 117,887 | ||||||
| 78,635 | ARM, 2.405%, 05/01/35 | 82,760 | ||||||
| 88,960 | ARM, 2.423%, 04/01/33 | 94,646 | ||||||
| 4,138 | ARM, 3.775%, 03/01/29 | 4,394 | ||||||
Federal National Mortgage Association, 15 Year, Single Family, | ||||||||
| 83,518 | 3.500%, 09/01/18 - 05/01/19 | 87,429 | ||||||
| 14,929 | 4.000%, 07/01/18 | 15,814 | ||||||
| 104,770 | 4.500%, 03/01/23 - 05/01/23 | 111,662 | ||||||
| 14,652 | 5.000%, 06/01/18 | 15,614 | ||||||
| 47,062 | 5.500%, 04/01/22 | 50,010 | ||||||
| 117,048 | 6.000%, 03/01/18 - 09/01/22 | 124,744 | ||||||
SEE NOTES TO FINANCIAL STATEMENTS.
| DECEMBER 31, 2013 | JPMORGAN INSURANCE TRUST | 23 | ||||||
Table of Contents
JPMorgan Insurance Trust Core Bond Portfolio
SCHEDULE OF PORTFOLIO INVESTMENTS
AS OF DECEMBER 31, 2013 (continued)
| PRINCIPAL AMOUNT($) | SECURITY DESCRIPTION | VALUE($) | ||||||
| Mortgage Pass-Through Securities — Continued |
| ||||||
| 38,357 | 6.500%, 08/01/20 | 41,203 | ||||||
| 2,069 | 8.000%, 01/01/16 | 2,085 | ||||||
Federal National Mortgage Association, 20 Year, Single Family, | ||||||||
| 47,975 | 4.500%, 01/01/25 | 50,793 | ||||||
| 327,777 | 5.000%, 11/01/23 | 355,599 | ||||||
| 89,200 | 6.500%, 03/01/19 - 12/01/22 | 99,188 | ||||||
Federal National Mortgage Association, 30 Year, FHA/VA, | ||||||||
| 34,184 | 8.500%, 10/01/26 - 06/01/30 | 36,711 | ||||||
| 70,076 | 9.000%, 04/01/25 | 79,808 | ||||||
Federal National Mortgage Association, 30 Year, Single Family, | ||||||||
| 227,668 | 3.000%, 09/01/31 | 216,435 | ||||||
| 56,753 | 4.500%, 04/01/38 - 05/01/39 | 60,069 | ||||||
| 121,572 | 5.000%, 09/01/35 | 131,974 | ||||||
| 41,335 | 5.500%, 01/01/38 - 06/01/38 | 45,377 | ||||||
| 128,142 | 6.000%, 01/01/29 - 03/01/33 | 143,978 | ||||||
| 385,132 | 6.500%, 09/01/25 - 11/01/36 | 430,652 | ||||||
| 1,583 | 7.000%, 08/01/32 | 1,712 | ||||||
| 23,009 | 7.500%, 03/01/30 | 25,213 | ||||||
| 104,950 | 8.000%, 03/01/27 - 11/01/28 | 124,955 | ||||||
Federal National Mortgage Association, Other, | ||||||||
| 1,000,000 | 2.077%, 06/01/20 | 976,772 | ||||||
| 295,395 | 2.418%, 12/01/22 | 275,740 | ||||||
| 1,000,000 | 2.480%, 12/01/22 - 02/01/23 | 938,033 | ||||||
| 500,000 | 2.531%, 11/01/22 | 467,425 | ||||||
| 500,000 | 2.583%, 04/01/23 | 458,904 | ||||||
| 1,000,000 | 2.604%, 05/01/23 | 917,241 | ||||||
| 983,448 | 3.500%, 05/01/43 | 965,128 | ||||||
| 1,390,939 | 4.000%, 07/01/42 | 1,418,950 | ||||||
| 475,566 | 4.130%, 07/01/20 | 510,123 | ||||||
| 180,863 | 5.500%, 09/01/33 - 04/01/38 | 196,391 | ||||||
| 77,721 | 6.000%, 09/01/28 | 86,959 | ||||||
| 185,107 | 6.500%, 10/01/35 | 206,248 | ||||||
Government National Mortgage Association II, 30 Year, Single Family, | ||||||||
| 3,490 | 7.500%, 12/20/26 | 4,131 | ||||||
| 70,400 | 8.000%, 11/20/26 - 01/20/27 | 84,330 | ||||||
| 2,482 | 8.500%, 05/20/25 | 2,853 | ||||||
Government National Mortgage Association II, Other, | ||||||||
| 460,958 | 2.125%, 07/20/34 - 09/20/34 | 480,039 | ||||||
| 3,928 | Government National Mortgage Association, 15 Year, Single Family, 8.000%, 01/15/16 | 4,037 | ||||||
| PRINCIPAL AMOUNT($) | SECURITY DESCRIPTION | VALUE($) | ||||||
Government National Mortgage Association, 30 Year, Single Family, | ||||||||
| 134,403 | 6.000%, 05/15/37 - 10/15/38 | 149,530 | ||||||
| 110,550 | 6.500%, 03/15/28 - 12/15/38 | 125,108 | ||||||
| 29,563 | 7.000%, 12/15/25 - 06/15/33 | 33,803 | ||||||
| 18,412 | 7.500%, 05/15/23 - 09/15/28 | 20,214 | ||||||
| 17,167 | 8.000%, 09/15/22 - 10/15/27 | 19,436 | ||||||
| 4,758 | 9.000%, 11/15/24 | 5,181 | ||||||
| 145,722 | 9.500%, 10/15/24 | 165,302 | ||||||
|
| |||||||
Total Mortgage Pass-Through Securities | 15,617,408 | |||||||
|
| |||||||
| Municipal Bonds — 0.2% (t) |
| ||||||
Illinois — 0.1% |
| |||||||
| 160,000 | State of Illinois, Taxable Pension, GO, 5.100%, 06/01/33 | 149,088 | ||||||
|
| |||||||
New York — 0.1% |
| |||||||
| 30,000 | New York State Dormitory Authority, State Personal Income Tax, Series D, Rev., 5.600%, 03/15/40 | 33,582 | ||||||
| 130,000 | Port Authority of New York & New Jersey, Consolidated, Series 164, Rev., 5.647%, 11/01/40 | 141,731 | ||||||
|
| |||||||
| 175,313 | ||||||||
|
| |||||||
Ohio — 0.0% (g) |
| |||||||
| 98,000 | Ohio State University, General Receipts, Series A, Rev., 4.800%, 06/01/11 | 85,277 | ||||||
|
| |||||||
Total Municipal Bonds | 409,678 | |||||||
|
| |||||||
| U.S. Government Agency Securities — 13.7% |
| ||||||
Federal Home Loan Mortgage Corp., | ||||||||
| 30,000 | 4.875%, 06/13/18 | 34,089 | ||||||
| 125,000 | 5.125%, 10/18/16 | 140,119 | ||||||
Federal National Mortgage Association, | ||||||||
| 3,000,000 | Zero Coupon, 10/09/19 | 2,550,873 | ||||||
| 195,000 | 2.750%, 03/13/14 | 196,007 | ||||||
| 150,000 | 5.000%, 02/13/17 | 168,804 | ||||||
Federal National Mortgage Association STRIPS, | ||||||||
| 6,000,000 | Zero Coupon, 09/23/20 | 4,934,700 | ||||||
| 630,000 | Zero Coupon, 03/23/28 | 336,729 | ||||||
| 100,000 | Financing Corp. Fico, Series D-P, Zero Coupon, 09/26/19 | 86,343 | ||||||
| 2,000,000 | Financing Corp. Fico STRIPS, Series 14P, Zero Coupon, 11/02/18 | 1,812,046 | ||||||
| 8,000,000 | Financing Corp. STRIPS, Series 12P, Zero Coupon, 12/06/18 | 7,222,880 | ||||||
SEE NOTES TO FINANCIAL STATEMENTS.
| 24 | JPMORGAN INSURANCE TRUST | DECEMBER 31, 2013 | ||||
Table of Contents
| PRINCIPAL AMOUNT($) | SECURITY DESCRIPTION | VALUE($) | ||||||
| U.S. Government Agency Securities — Continued |
| ||||||
| 4,100,000 | Residual Funding Corp. STRIPS, Zero Coupon, 07/15/20 | 3,421,770 | ||||||
| 2,000,000 | Resolution Funding Corp. STRIPS, Zero Coupon, 01/15/20 | 1,706,588 | ||||||
Tennessee Valley Authority, | ||||||||
| 33,000 | 4.625%, 09/15/60 | 29,516 | ||||||
| 100,000 | 5.250%, 09/15/39 | 106,731 | ||||||
| 5,000,000 | Tennessee Valley Authority STRIPS, Zero Coupon, 07/15/16 | 4,835,875 | ||||||
|
| |||||||
Total U.S. Government Agency Securities | 27,583,070 | |||||||
|
| |||||||
| U.S. Treasury Obligations — 25.9% |
| ||||||
U.S. Treasury Bonds, | ||||||||
| 565,000 | 4.375%, 02/15/38 | 614,967 | ||||||
| 150,000 | 4.500%, 02/15/36 | 166,898 | ||||||
| 125,000 | 4.500%, 05/15/38 | 138,594 | ||||||
| 100,000 | 4.750%, 02/15/37 | 115,047 | ||||||
| 815,000 | 5.000%, 05/15/37 | 969,850 | ||||||
| 50,000 | 5.250%, 02/15/29 | 60,188 | ||||||
| 50,000 | 5.375%, 02/15/31 | 61,273 | ||||||
| 200,000 | 6.125%, 11/15/27 | 260,250 | ||||||
| 50,000 | 6.250%, 05/15/30 | 66,789 | ||||||
| 10,000 | 6.375%, 08/15/27 | 13,278 | ||||||
| 150,000 | 6.750%, 08/15/26 | 204,047 | ||||||
| 80,000 | 7.250%, 08/15/22 | 108,100 | ||||||
| 250,000 | 8.000%, 11/15/21 | 347,266 | ||||||
U.S. Treasury Bonds STRIPS, | ||||||||
| 600,000 | 11/15/14 | 599,220 | ||||||
| 1,750,000 | 02/15/15 | 1,746,166 | ||||||
| 3,715,000 | 11/15/15 | 3,690,132 | ||||||
| 3,300,000 | 02/15/16 (m) | 3,268,501 | ||||||
| 3,540,000 | 08/15/16 | 3,480,556 | ||||||
| 3,050,000 | 11/15/16 | 2,983,736 | ||||||
| 825,000 | 02/15/17 | 801,624 | ||||||
| 3,625,000 | 08/15/17 | 3,474,932 | ||||||
| 2,900,000 | 11/15/17 (m) | 2,757,987 | ||||||
| 150,000 | 02/15/18 | 141,460 | ||||||
| 280,000 | 02/15/19 | 254,899 | ||||||
| 100,000 | 05/15/19 | 90,101 | ||||||
| 400,000 | 08/15/19 | 356,456 | ||||||
| 250,000 | 02/15/20 | 218,102 | ||||||
| 1,903,000 | 05/15/20 | 1,642,848 | ||||||
| 10,000,000 | 05/15/20 | 8,651,170 | ||||||
| 350,000 | 08/15/20 | 298,548 | ||||||
| 850,000 | 02/15/21 | 706,608 | ||||||
| 750,000 | 05/15/21 | 616,605 | ||||||
| PRINCIPAL AMOUNT($) | SECURITY DESCRIPTION | VALUE($) | ||||||
| 100,000 | 08/15/21 | 81,218 | ||||||
| 925,000 | 11/15/21 | 743,021 | ||||||
| 100,000 | 02/15/22 | 79,357 | ||||||
| 300,000 | 02/15/23 | 226,745 | ||||||
| 10,000 | 11/15/24 | 6,930 | ||||||
| 100,000 | 02/15/25 | 68,388 | ||||||
| 100,000 | 05/15/26 | 64,115 | ||||||
| 23,000 | 08/15/26 | 14,559 | ||||||
| 250,000 | 11/15/26 | 156,304 | ||||||
| 600,000 | 02/15/27 | 370,498 | ||||||
| 175,000 | 05/15/27 | 106,710 | ||||||
| 250,000 | 08/15/27 | 150,604 | ||||||
| 750,000 | 11/15/27 | 445,780 | ||||||
| 27,000 | 02/15/28 | 15,872 | ||||||
| 100,000 | 05/15/28 | 58,095 | ||||||
| 50,000 | 08/15/28 | 28,702 | ||||||
| 100,000 | 11/15/28 | 56,700 | ||||||
| 250,000 | 02/15/29 | 140,070 | ||||||
| 250,000 | 08/15/29 | 136,709 | ||||||
| 100,000 | 11/15/29 | 54,040 | ||||||
| 775,000 | 02/15/30 | 413,852 | ||||||
| 300,000 | 05/15/30 | 158,205 | ||||||
| 50,000 | 08/15/30 | 26,064 | ||||||
| 50,000 | 11/15/30 | 25,746 | ||||||
| 300,000 | 02/15/31 | 152,593 | ||||||
| 175,000 | 05/15/31 | 87,973 | ||||||
| 250,000 | 08/15/31 | 124,255 | ||||||
| 100,000 | 02/15/32 | 48,605 | ||||||
| 400,000 | 05/15/32 | 192,233 | ||||||
| 400,000 | 11/15/32 | 187,914 | ||||||
| 150,000 | 02/15/33 | 69,714 | ||||||
| 325,000 | 05/15/33 | 149,413 | ||||||
| 100,000 | 08/15/33 | 45,458 | ||||||
| 650,000 | 11/15/33 | 292,263 | ||||||
| 225,000 | 02/15/34 | 100,078 | ||||||
| 100,000 | 05/15/34 | 44,007 | ||||||
| 50,000 | 11/15/34 | 21,527 | ||||||
| 150,000 | 02/15/35 | 63,821 | ||||||
| 250,000 | 05/15/35 | 105,306 | ||||||
U.S. Treasury Inflation Indexed Bonds, | ||||||||
| 100,000 | 2.500%, 01/15/29 | 127,831 | ||||||
| 300,000 | 3.625%, 04/15/28 | 573,026 | ||||||
U.S. Treasury Inflation Indexed Notes, | ||||||||
| 500,000 | 0.500%, 04/15/15 | 550,669 | ||||||
| 170,000 | 1.375%, 07/15/18 | 199,551 | ||||||
SEE NOTES TO FINANCIAL STATEMENTS.
| DECEMBER 31, 2013 | JPMORGAN INSURANCE TRUST | 25 | ||||||
Table of Contents
JPMorgan Insurance Trust Core Bond Portfolio
SCHEDULE OF PORTFOLIO INVESTMENTS
AS OF DECEMBER 31, 2013 (continued)
| PRINCIPAL AMOUNT($) | SECURITY DESCRIPTION | VALUE($) | ||||||
| U.S. Treasury Obligations — Continued |
| ||||||
U.S. Treasury Notes, | ||||||||
| 125,000 | 1.375%, 11/30/18 | 123,125 | ||||||
| 400,000 | 1.375%, 12/31/18 | 393,344 | ||||||
| 400,000 | 1.500%, 08/31/18 | 397,969 | ||||||
| 150,000 | 1.750%, 10/31/18 | 150,656 | ||||||
| 100,000 | 2.125%, 08/31/20 | 98,719 | ||||||
| 1,200,000 | 2.125%, 08/15/21 | 1,162,500 | ||||||
| 400,000 | 2.250%, 07/31/18 | 412,344 | ||||||
| 200,000 | 2.625%, 11/15/20 | 203,250 | ||||||
| 742,000 | 3.125%, 05/15/19 | 790,694 | ||||||
| 600,000 | 3.125%, 05/15/21 | 625,453 | ||||||
| 200,000 | 3.250%, 12/31/16 | 214,515 | ||||||
| 200,000 | 3.500%, 02/15/18 | 217,125 | ||||||
| 450,000 | 3.500%, 05/15/20 | 485,472 | ||||||
| 650,000 | 3.625%, 02/15/21 | 701,442 | ||||||
| 500,000 | 4.750%, 08/15/17 | 564,883 | ||||||
|
| |||||||
Total U.S. Treasury Obligations | 52,212,210 | |||||||
|
| |||||||
SHARES | SECURITY DESCRIPTION | VALUE($) | ||||||
| Short-Term Investment — 3.6% |
| ||||||
Investment Company — 3.6% | ||||||||
| 7,270,294 | JPMorgan Liquid Assets Money Market Fund, Institutional Class Shares, | 7,270,294 | ||||||
|
| |||||||
Total Investments — 99.8% | 201,579,476 | |||||||
Other Assets in Excess of | 336,933 | |||||||
|
| |||||||
NET ASSETS — 100.0% | $ | 201,916,409 | ||||||
|
| |||||||
Percentages indicated are based on net assets.
SEE NOTES TO FINANCIAL STATEMENTS.
| 26 | JPMORGAN INSURANCE TRUST | DECEMBER 31, 2013 | ||||
Table of Contents
NOTES TO SCHEDULE OF PORTFOLIO INVESTMENTS
AS OF DECEMBER 31, 2013
| ARM | — Adjustable Rate Mortgage. The interest rate shown is the rate in effect as of December 31, 2013. | |
| CMO | — Collateralized Mortgage Obligation | |
| ESOP | — Employee Stock Ownership Program | |
| FHA | — Federal Housing Administration | |
| GMAC | — General Motors Acceptance Corp. | |
| GO | — General Obligation | |
| HB | — High Coupon Bonds (a.k.a. “IOettes”) represent the right to receive interest payments on an underlying pool of mortgages with similar features as those associated with IO securities. Unlike IO’s, the owner also has a right to receive a very small portion of principal. The high interest rates result from taking interest payments from other classes in the Real Estate Mortgage Investment Conduit trust and allocating them to the small principal of the HB class. | |
| IF | — Inverse Floaters represent securities that pay interest at a rate that increases (decreases) with a decline (incline) in a specified index. The interest rate shown is the rate in effect as of December 31, 2013. The rate may be subject to a cap and floor. | |
| IO | — Interest Only represents the right to receive the monthly interest payments on an underlying pool of mortgage loans. The principal amount shown represents the par value on the underlying pool. The yields on these securities are subject to accelerated principal paydowns as a result of prepayment or refinancing of the underlying pool of mortgage instruments. As a result, interest income may be reduced considerably. | |
| PO | — Principal Only represents the right to receive the principal portion only on an underlying pool of mortgage loans. The market value of these securities is extremely volatile in response to changes in market interest rates. As prepayments on the underlying mortgages of these securities increase, the yield on these securities increases. | |
| REMIC | — Real Estate Mortgage Investment Conduit |
| Rev. | — Revenue | |
| STRIPS | — Separate Trading of Registered Interest and Principal of Securities. The STRIPS Program lets investors hold and trade individual interest and principal components of eligible notes and bonds as separate securities. | |
| SUB | — Step-Up Bond. The interest rate shown is the rate in effect as of December 31, 2013. | |
| VA | — Veterans Administration | |
| VAR | — Variable Rate Security. The interest rate shown is the rate in effect as of December 31, 2013. | |
| (b) | — Investment in affiliate. Money market fund registered under the Investment Company Act of 1940, as amended, and advised by J.P. Morgan Investment Management Inc. | |
| (d) | — Defaulted Security. | |
| (e) | — Security is exempt from registration under Rule 144A of the Securities Act of 1933, as amended. Unless otherwise indicated, this security has been determined to be liquid under procedures established by the Board of Trustees and may be resold in transactions exempt from registration, normally to qualified institutional buyers. | |
| (g) | — Amount rounds to less than 0.1%. | |
| (h) | — Amount rounds to less than one (share or dollar). | |
| (i) | — Security has been deemed illiquid pursuant to procedures approved by the Board of Trustees and may be difficult to sell. | |
| (l) | — The rate shown is the current yield as of December 31, 2013. | |
| (m) | — All or a portion of this security is reserved and/or pledged with the custodian for current or potential holdings of futures, swaps, options, TBAs, when-issued securities, delayed delivery securities, reverse repurchase agreements, unfunded commitments and/or forward foreign currency exchange contracts. | |
| (t) | — The date shown represents the earliest of the prerefunded date, next put date or final maturity date. | |
| † | — Security matures in 2111. | |
SEE NOTES TO FINANCIAL STATEMENTS.
| DECEMBER 31, 2013 | JPMORGAN INSURANCE TRUST | 27 | ||||||
Table of Contents
STATEMENT OF ASSETS AND LIABILITIES
AS OF DECEMBER 31, 2013
| Core Bond Portfolio | ||||
ASSETS: | ||||
Investments in non-affiliates, at value | $ | 194,309,182 | ||
Investments in affiliates, at value | 7,270,294 | |||
|
| |||
Total investment securities, at value | 201,579,476 | |||
Cash | 11,286 | |||
Receivables: | ||||
Investment securities sold | 4,666 | |||
Portfolio shares sold | 19,640 | |||
Interest from non-affiliates | 812,341 | |||
Dividends from affiliates | 149 | |||
|
| |||
Total Assets | 202,427,558 | |||
|
| |||
LIABILITIES: | ||||
Payables: | ||||
Investment securities purchased | 96,280 | |||
Portfolio shares redeemed | 227,805 | |||
Accrued liabilities: | ||||
Investment advisory fees | 68,033 | |||
Administration fees | 11,027 | |||
Distribution fees | 5,272 | |||
Custodian and accounting fees | 40,435 | |||
Trustees’ and Chief Compliance Officer’s fees | 80 | |||
Audit fees | 53,967 | |||
Other | 8,250 | |||
|
| |||
Total Liabilities | 511,149 | |||
|
| |||
Net Assets | $ | 201,916,409 | ||
|
| |||
NET ASSETS: | ||||
Paid-in-Capital | $ | 187,228,939 | ||
Accumulated undistributed net investment income | 8,049,234 | |||
Accumulated net realized gains (losses) | (6,199,941 | ) | ||
Net unrealized appreciation (depreciation) | 12,838,177 | |||
|
| |||
Total Net Assets | $ | 201,916,409 | ||
|
| |||
Net Assets: | ||||
Class 1 | $ | 176,728,891 | ||
Class 2 | 25,187,518 | |||
|
| |||
Total | $ | 201,916,409 | ||
|
| |||
Outstanding units of beneficial interest (shares) | ||||
(unlimited number of shares authorized, no par value): | ||||
Class 1 | 15,939,881 | |||
Class 2 | 2,287,608 | |||
Net Asset Value, offering and redemption price per share (a): | ||||
Class 1 | $ | 11.09 | ||
Class 2 | 11.01 | |||
Cost of investments in non-affiliates | $ | 181,471,005 | ||
Cost of investments in affiliates | 7,270,294 | |||
| (a) | Per share amounts may not recalculate due to rounding of net assets and/or shares outstanding. |
SEE NOTES TO FINANCIAL STATEMENTS.
| 28 | JPMORGAN INSURANCE TRUST | DECEMBER 31, 2013 | ||||
Table of Contents
STATEMENT OF OPERATIONS
FOR THE YEAR ENDED DECEMBER 31, 2013
| Core Bond Portfolio | ||||
INVESTMENT INCOME: | ||||
Interest income from non-affiliates | $ | 9,359,386 | ||
Dividend income from affiliates | 2,384 | |||
|
| |||
Total investment income | 9,361,770 | |||
|
| |||
EXPENSES: | ||||
Investment advisory fees | 841,568 | |||
Administration fees | 177,262 | |||
Distribution fees — Class 2 | 44,008 | |||
Custodian and accounting fees | 104,664 | |||
Professional fees | 82,014 | |||
Trustees’ and Chief Compliance Officer’s fees | 2,380 | |||
Printing and mailing costs | 31,575 | |||
Transfer agent fees | 6,316 | |||
Other | 24,981 | |||
|
| |||
Total expenses | 1,314,768 | |||
|
| |||
Less amounts waived | (22,106 | ) | ||
|
| |||
Net expenses | 1,292,662 | |||
|
| |||
Net investment income (loss) | 8,069,108 | |||
|
| |||
REALIZED/UNREALIZED GAINS (LOSSES): | ||||
Net realized gain (loss) on transactions from investments in non-affiliates | 336,171 | |||
Change in net unrealized appreciation/depreciation of investments in non-affiliates | (11,610,927 | ) | ||
|
| |||
Net realized/unrealized gains (losses) | (11,274,756 | ) | ||
|
| |||
Change in net assets resulting from operations | $ | (3,205,648 | ) | |
|
| |||
SEE NOTES TO FINANCIAL STATEMENTS.
| DECEMBER 31, 2013 | JPMORGAN INSURANCE TRUST | 29 | ||||||
Table of Contents
STATEMENTS OF CHANGES IN NET ASSETS
FOR THE PERIODS INDICATED
| Core Bond Portfolio | ||||||||
| Year Ended 12/31/2013 | Year Ended 12/31/2012 | |||||||
CHANGE IN NET ASSETS RESULTING FROM OPERATIONS: | ||||||||
Net investment income (loss) | $ | 8,069,108 | $ | 9,740,791 | ||||
Net realized gains (losses) | 336,171 | (307,285 | ) | |||||
Change in net unrealized appreciation/depreciation | (11,610,927 | ) | 2,266,991 | |||||
|
|
|
| |||||
Change in net assets resulting from operations | (3,205,648 | ) | 11,700,497 | |||||
|
|
|
| |||||
DISTRIBUTIONS TO SHAREHOLDERS: | ||||||||
Class 1 | ||||||||
From net investment income | (9,052,968 | ) | (9,992,343 | ) | ||||
Class 2 | ||||||||
From net investment income | (680,242 | ) | (135,209 | ) | ||||
|
|
|
| |||||
Total distributions to shareholders | (9,733,210 | ) | (10,127,552 | ) | ||||
|
|
|
| |||||
CAPITAL TRANSACTIONS: | ||||||||
Change in net assets resulting from capital transactions | (2,537,046 | ) | (11,119,967 | ) | ||||
|
|
|
| |||||
NET ASSETS: | ||||||||
Change in net assets | (15,475,904 | ) | (9,547,022 | ) | ||||
Beginning of period | 217,392,313 | 226,939,335 | ||||||
|
|
|
| |||||
End of period | $ | 201,916,409 | $ | 217,392,313 | ||||
|
|
|
| |||||
Accumulated undistributed net investment income | $ | 8,049,234 | $ | 9,713,320 | ||||
|
|
|
| |||||
CAPITAL TRANSACTIONS: | ||||||||
Class 1 | ||||||||
Proceeds from shares issued | $ | 14,399,434 | $ | 30,432,330 | ||||
Distributions reinvested | 9,052,968 | 9,992,343 | ||||||
Cost of shares redeemed | (42,830,378 | ) | (58,978,592 | ) | ||||
|
|
|
| |||||
Change in net assets resulting from Class 1 capital transactions | $ | (19,377,976 | ) | $ | (18,553,919 | ) | ||
|
|
|
| |||||
Class 2 | ||||||||
Proceeds from shares issued | $ | 20,293,669 | $ | 8,625,937 | ||||
Distributions reinvested | 680,242 | 135,209 | ||||||
Cost of shares redeemed | (4,132,981 | ) | (1,327,194 | ) | ||||
|
|
|
| |||||
Change in net assets resulting from Class 2 capital transactions | $ | 16,840,930 | $ | 7,433,952 | ||||
|
|
|
| |||||
Total change in net assets resulting from capital transactions | $ | (2,537,046 | ) | $ | (11,119,967 | ) | ||
|
|
|
| |||||
SHARE TRANSACTIONS: | ||||||||
Class 1 | ||||||||
Issued | 1,270,421 | 2,605,209 | ||||||
Reinvested | 797,618 | 877,291 | ||||||
Redeemed | (3,788,604 | ) | (5,047,684 | ) | ||||
|
|
|
| |||||
Change in Class 1 Shares | (1,720,565 | ) | (1,565,184 | ) | ||||
|
|
|
| |||||
Class 2 | ||||||||
Issued | 1,798,755 | 743,482 | ||||||
Reinvested | 60,252 | 11,902 | ||||||
Redeemed | (367,473 | ) | (113,458 | ) | ||||
|
|
|
| |||||
Change in Class 2 Shares | 1,491,534 | 641,926 | ||||||
|
|
|
| |||||
SEE NOTES TO FINANCIAL STATEMENTS.
| 30 | JPMORGAN INSURANCE TRUST | DECEMBER 31, 2013 | ||||
Table of Contents
THIS PAGE IS INTENTIONALLY LEFT BLANK
| DECEMBER 31, 2013 | JPMORGAN INSURANCE TRUST | 31 | ||||||
Table of Contents
FOR THE PERIODS INDICATED
| Per share operating performance | ||||||||||||||||||||||||
| Investment operations | Distributions | |||||||||||||||||||||||
| Net asset value, beginning of period | Net investment income (loss) | Net realized and unrealized gains (losses) on investments | Total from investment operations | Net investment income | Net asset value, end of period | |||||||||||||||||||
Core Bond Portfolio | ||||||||||||||||||||||||
Class 1 | ||||||||||||||||||||||||
Year Ended December 31, 2013 | $ | 11.78 | $ | 0.44 | (d) | $ | (0.60 | ) | $ | (0.16 | ) | $ | (0.53 | ) | $ | 11.09 | ||||||||
Year Ended December 31, 2012 | 11.71 | 0.51 | (d) | 0.10 | 0.61 | (0.54 | ) | 11.78 | ||||||||||||||||
Year Ended December 31, 2011 | 11.54 | 0.54 | (d) | 0.28 | 0.82 | (0.65 | ) | 11.71 | ||||||||||||||||
Year Ended December 31, 2010 | 10.99 | 0.57 | (d) | 0.42 | 0.99 | (0.44 | ) | 11.54 | ||||||||||||||||
Year Ended December 31, 2009 | 10.94 | 0.61 | (d) | 0.38 | 0.99 | (0.94 | ) | 10.99 | ||||||||||||||||
Class 2 | ||||||||||||||||||||||||
Year Ended December 31, 2013 | 11.72 | 0.40 | (d) | (0.59 | ) | (0.19 | ) | (0.52 | ) | 11.01 | ||||||||||||||
Year Ended December 31, 2012 | 11.68 | 0.47 | (d) | 0.11 | 0.58 | (0.54 | ) | 11.72 | ||||||||||||||||
Year Ended December 31, 2011 | 11.51 | 0.50 | (d) | 0.29 | 0.79 | (0.62 | ) | 11.68 | ||||||||||||||||
Year Ended December 31, 2010 | 10.97 | 0.54 | (d) | 0.42 | 0.96 | (0.42 | ) | 11.51 | ||||||||||||||||
Year Ended December 31, 2009 | 10.92 | 0.59 | (d) | 0.37 | 0.96 | (0.91 | ) | 10.97 | ||||||||||||||||
| (a) | Includes adjustments in accordance with accounting principles generally accepted in the United States of America and as such, the net asset values for financial reporting purposes and the returns based upon those net asset values may differ from the net asset values and returns for shareholder transactions. |
| (b) | Includes earnings credits and interest expense, if applicable, each of which is less than 0.01% unless otherwise noted. |
| (c) | Portfolio turnover is calculated by dividing the lesser of total purchases or sales of portfolio securities for the reporting period by the monthly average value of portfolio securities owned during the reporting period. Excluded from both the numerator and denominator are amounts relating to derivatives and securities whose maturities or expiration dates at the time of acquisition were one year or less. |
| (d) | Calculated based upon average shares outstanding. |
SEE NOTES TO FINANCIAL STATEMENTS.
| 32 | JPMORGAN INSURANCE TRUST | DECEMBER 31, 2013 | ||||
Table of Contents
| Ratios/Supplemental data | |||||||||||||||||||||
| Ratios to average net assets | ||||||||||||||||||||||
| Total return (a) | Net assets, end of period | Net expenses (b) | Net investment income (loss) | Expenses without waivers, reimbursements and earnings credits | Portfolio turnover rate (c) | |||||||||||||||||
| (1.47 | )% | $ | 176,728,891 | 0.59 | % | 3.86 | % | 0.60 | % | 13 | % | |||||||||||
| 5.33 | 208,061,368 | 0.60 | 4.36 | 0.62 | 8 | |||||||||||||||||
| 7.46 | 225,138,765 | 0.59 | 4.74 | 0.61 | 9 | |||||||||||||||||
| 9.24 | 245,677,262 | 0.60 | 5.06 | 0.62 | 10 | |||||||||||||||||
| 9.65 | 263,558,623 | 0.59 | 5.63 | 0.67 | 17 | |||||||||||||||||
| (1.74 | ) | 25,187,518 | 0.84 | 3.58 | 0.85 | 13 | ||||||||||||||||
| 5.07 | 9,330,945 | 0.85 | 4.00 | 0.87 | 8 | |||||||||||||||||
| 7.21 | 1,800,570 | 0.84 | 4.33 | 0.84 | 9 | |||||||||||||||||
| 8.97 | 19,644 | 0.85 | 4.80 | 0.88 | 10 | |||||||||||||||||
| 9.32 | 18,033 | 0.84 | 5.47 | 0.92 | 17 | |||||||||||||||||
SEE NOTES TO FINANCIAL STATEMENTS.
| DECEMBER 31, 2013 | JPMORGAN INSURANCE TRUST | 33 | ||||||
Table of Contents
AS OF DECEMBER 31, 2013
1. Organization
JPMorgan Insurance Trust (the “Trust”) is registered under the Investment Company Act of 1940, as amended (the “1940 Act”), as an open-end management investment company and is a Massachusetts business trust.
The following is a separate Portfolio of the Trust (the “Portfolio”) covered by this report:
| Classes Offered | Diversified/Non-Diversified | |||
| Core Bond Portfolio | Class 1 and Class 2 | Diversified |
The investment objective of the Portfolio is to seek to maximize total return by investing primarily in a diversified portfolio of intermediate- and long-term debt securities.
Portfolio shares are offered only to separate accounts of participating insurance companies and Eligible Plans. Individuals may not purchase shares directly from the Portfolio.
All classes of shares have equal rights as to earnings, assets and voting privileges, except that each class may bear different distribution and service fees and each class has exclusive voting rights with respect to its distribution plan and administrative services plan.
2. Significant Accounting Policies
The following is a summary of significant accounting policies followed by the Portfolio in the preparation of its financial statements. The policies are in accordance with accounting principles generally accepted in the United States of America (“GAAP”). The preparation of financial statements requires management to make estimates and assumptions that affect the reported amounts and disclosures in the financial statements. Actual results could differ from those estimates.
A. Valuation of Investments — Fixed income securities (other than certain short-term investments maturing in less than 61 days) are valued each day based on prices received from independent or affiliated pricing services approved by the Board of Trustees or third party broker-dealers. The pricing services or broker-dealers use multiple valuation techniques to determine fair value. In instances where sufficient market activity exists, the pricing services or broker-dealers may utilize a market-based approach through which quotes from market makers are used to determine fair value. In instances where sufficient market activity may not exist or is limited, the pricing services or broker-dealers also utilize proprietary valuation models which may consider market transactions in comparable securities and the various relationships between securities in determining fair value and/or market characteristics such as benchmark yield curves, option-adjusted spreads, credit spreads, estimated default rates, coupon rates, anticipated timing of principal repayments, underlying collateral, and other unique security features in order to estimate the relevant cash flows, which are then discounted to calculate the fair values. Generally, short-term investments of sufficient credit quality maturing in less than 61 days are valued at amortized cost, which approximates fair value. Investments in open-end investment companies are valued at each investment company’s net asset value per share (“NAV”) as of the report date.
Certain investments of the Portfolio may, depending upon market conditions, trade in relatively thin markets and/or in markets that experience significant volatility. As a result of these conditions, the prices used by the Portfolio to value these securities may differ from the value that would be realized if these securities were sold, and the differences could be material. Futures and options are generally valued on the basis of available market quotations. Swaps and other derivatives are valued daily, primarily using independent or affiliated pricing services approved by the Board of Trustees. If valuations are not available from such pricing services or values received are deemed not representative of fair value, values will be obtained from a third party broker-dealer or counterparty.
Securities or other assets for which market quotations are not readily available or for which market quotations are deemed to not represent the fair value of the security or asset at the time of pricing (including certain illiquid securities) are fair valued in accordance with procedures established by and under the supervision and responsibility of the Board of Trustees. The Board of Trustees has established an Audit and Valuation Committee to assist with the oversight of the valuation of the Portfolio’s securities. JPMorgan Funds Management, Inc. (the “Administrator” or “JPMFM”), has established a Valuation Committee (“VC”) that is comprised of senior representatives from JPMFM, J.P. Morgan Investment Management Inc. (the “Adviser” or “JPMIM”) and J.P. Morgan Asset Management’s Legal, Compliance and Risk Management groups and the Portfolio’s Chief Compliance Officer. The VC’s responsibilities include making determinations regarding Level 3 fair value measurements (“Fair Values”) and/or providing recommendations for approval to the Board of Trustees’ Audit and Valuation Committee, in accordance with the Portfolio’s valuation policies.
The VC or Board of Trustees, as applicable, primarily employs a market-based approach which may use related or comparable assets or liabilities, recent transactions, market multiples, book values, and other relevant information for the investment to determine the fair value of the investment. The VC or Board of Trustees may also use an income-based valuation approach in which the anticipated future cash flows of the investment are discounted to calculate fair value. Discounts may also be applied due to the nature or duration of any restrictions on the disposition of the investments. Valuations may be based upon current market prices of securities that are comparable in coupon, rating, maturity and industry.
It is possible that the estimated values may differ significantly from the values that would have been used had a ready market for the investments existed, and such differences could be material. JPMFM and JPMIM are responsible for monitoring developments that may impact Fair Values and for discussing and assessing Fair Values on an ongoing, and at least a quarterly, basis with the VC and Board of Trustees, as applicable. The appropriateness of Fair Values is assessed based on results of unchanged price review and consideration of macro or security specific events, back testing, and broker and vendor due diligence.
| 34 | JPMORGAN INSURANCE TRUST | DECEMBER 31, 2013 | ||||
Table of Contents
See the table on “Quantitative Information about Level 3 Fair Value Measurements” for information on the valuation techniques and inputs used to value Level 3 securities held by the Portfolio at December 31, 2013.
Valuations reflected in this report are as of the report date. As a result, changes in valuation due to market events and/or issuer related events after the report date and prior to issuance of the report, are not reflected herein.
The various inputs that are used in determining the fair value of the Portfolio’s investments are summarized into the three broad levels listed below.
| Ÿ | Level 1 — quoted prices in active markets for identical securities |
| Ÿ | Level 2 — other significant observable inputs (including quoted prices for similar securities, interest rates, prepayment speeds, credit risk, etc.) |
| Ÿ | Level 3 — significant unobservable inputs (including the Portfolio’s own assumptions in determining the fair value of investments) |
A financial instrument’s level within the fair value hierarchy is based on the lowest level of any input, both individually and in the aggregate, that is significant to the fair value measurement. The inputs or methodology used for valuing securities are not necessarily an indication of the risk associated with investing in those securities.
The following table represents each valuation input by sector as presented on the Schedule of Portfolio Investments (“SOI”):
| Level 1 Quoted prices | Level 2 Other significant observable inputs | Level 3 Significant unobservable inputs | Total | |||||||||||||
Investments in Securities | ||||||||||||||||
Debt Securities | ||||||||||||||||
Asset-Backed Securities | $ | — | $ | 2,031,936 | $ | 1,689,054 | $ | 3,720,990 | ||||||||
Collateralized Mortgage Obligations | ||||||||||||||||
Agency CMO | — | 39,481,450 | — | 39,481,450 | ||||||||||||
Non-Agency CMO | — | 14,718,813 | 2,176,996 | 16,895,809 | ||||||||||||
|
|
|
|
|
|
|
| |||||||||
Total Collateralized Mortgage Obligations | — | 54,200,263 | 2,176,996 | 56,377,259 | ||||||||||||
|
|
|
|
|
|
|
| |||||||||
Commercial Mortgage-Backed Securities | — | 4,815,158 | 406,616 | 5,221,774 | ||||||||||||
Corporate Bonds | ||||||||||||||||
Consumer Discretionary | — | 2,523,564 | — | 2,523,564 | ||||||||||||
Consumer Staples | — | 1,222,347 | — | 1,222,347 | ||||||||||||
Energy | — | 2,453,190 | — | 2,453,190 | ||||||||||||
Financials | — | 15,705,431 | 102,375 | 15,807,806 | ||||||||||||
Health Care | — | 801,075 | — | 801,075 | ||||||||||||
Industrials | — | 1,585,525 | 100,214 | 1,685,739 | ||||||||||||
Information Technology | — | 1,948,134 | — | 1,948,134 | ||||||||||||
Materials | — | 947,067 | — | 947,067 | ||||||||||||
Telecommunication Services | — | 2,708,036 | 131,558 | 2,839,594 | ||||||||||||
Utilities | — | 2,597,818 | — | 2,597,818 | ||||||||||||
|
|
|
|
|
|
|
| |||||||||
Total Corporate Bonds | — | 32,492,187 | 334,147 | 32,826,334 | ||||||||||||
|
|
|
|
|
|
|
| |||||||||
Foreign Government Securities | — | 340,459 | — | 340,459 | ||||||||||||
Mortgage Pass-Through Securities | — | 15,617,408 | — | 15,617,408 | ||||||||||||
Municipal Bonds | — | 409,678 | — | 409,678 | ||||||||||||
U.S. Government Agency Securities | — | 27,583,070 | — | 27,583,070 | ||||||||||||
U.S. Treasury Obligations | — | 52,212,210 | — | 52,212,210 | ||||||||||||
Short-Term Investment | ||||||||||||||||
Investment Company | 7,270,294 | — | — | 7,270,294 | ||||||||||||
|
|
|
|
|
|
|
| |||||||||
Total Investments in Securities | $ | 7,270,294 | $ | 189,702,369 | $ | 4,606,813 | $ | 201,579,476 | ||||||||
|
|
|
|
|
|
|
| |||||||||
There were no transfers between Levels 1 and 2 during the year ended December 31, 2013.
| DECEMBER 31, 2013 | JPMORGAN INSURANCE TRUST | 35 | ||||||
Table of Contents
NOTES TO FINANCIAL STATEMENTS
AS OF DECEMBER 31, 2013 (continued)
The following is a summary of investments for which significant unobservable inputs (Level 3) were used in determining fair value:
| Balance as of 12/31/12 | Realized gain (loss) | Change in unrealized appreciation (depreciation) | Net accretion (amortization) | Purchases1 | Sales2 | Transfers into Level 3 | Transfers out of Level 3 | Balance as of 12/31/13 | ||||||||||||||||||||||||||||
Investments in Securities | ||||||||||||||||||||||||||||||||||||
Asset-Backed Securities | $ | 167,769 | $ | — | $ | 11,297 | $ | 381 | $ | 796,573 | $ | (182,630 | ) | $ | 895,664 | $ | — | $ | 1,689,054 | |||||||||||||||||
Collateralized Mortgage Obligations | ||||||||||||||||||||||||||||||||||||
Agency CMO | 57,154 | — | — | — | — | — | — | (57,154 | ) | — | ||||||||||||||||||||||||||
Non-Agency CMO | 398,751 | — | (280,890 | ) | 85,512 | 677,376 | (767,217 | ) | 2,276,093 | (212,629 | ) | 2,176,996 | ||||||||||||||||||||||||
Commercial Mortgage-Backed Securities | 135,464 | — | 23,298 | (17,234 | ) | 205,999 | (85,153 | ) | 144,242 | — | 406,616 | |||||||||||||||||||||||||
Corporate Bonds — Financials | 95,375 | — | 7,000 | — | — | — | — | — | 102,375 | |||||||||||||||||||||||||||
Corporate Bonds — Industrials | 117,753 | 2,070 | (2,496 | ) | — | 26,000 | (43,113 | ) | — | — | 100,214 | |||||||||||||||||||||||||
Corporate Bonds —Telecommunication Services | — | — | (912 | ) | — | — | — | 132,470 | — | 131,558 | ||||||||||||||||||||||||||
|
|
|
|
|
|
|
|
|
|
|
|
|
|
|
|
|
| |||||||||||||||||||
Total | $ | 972,266 | $ | 2,070 | $ | (242,703 | ) | $ | 68,659 | $ | 1,705,948 | $ | (1,078,113 | ) | $ | 3,448,469 | $ | (269,783 | ) | $ | 4,606,813 | |||||||||||||||
|
|
|
|
|
|
|
|
|
|
|
|
|
|
|
|
|
| |||||||||||||||||||
| (1) | Purchases include all purchases of securities and securities received in corporate actions. |
| (2) | Sales include all sales of securities, maturities, paydowns and securities tendered in corporate actions. |
Transfers into and out of Level 3 are valued utilizing values as of the beginning of the year.
Transfers from Level 2 to Level 3 or from Level 3 to Level 2 are due to a decline or an increase in market activity (e.g. frequency of trades), respectively, which resulted in a lack of or increase in available market inputs to determine price.
The change in unrealized appreciation (depreciation) attributable to securities owned at December 31, 2013, which were valued using significant unobservable inputs (Level 3) amounted to $(241,469). This amount is included in Change in net unrealized appreciation (depreciation) of investments in non-affiliates on the Statement of Operations.
Core Bond Portfolio
Quantitative Information about Level 3 Fair Value Measurements #
| Fair Value at 12/31/13 | Valuation Technique(s) | Unobservable Input | Range (Weighted Average) | |||||||||
| $ | 883,049 | Discounted Cash Flow | Constant Prepayment Rate | 0.00% - 5.00% (2.26%) | ||||||||
| Constant Default Rate | 0.00% - 12.00% (6.74%) | |||||||||||
| Yield (Discount Rate of Cash Flows) | 0.00% - 4.73% (3.33%) | |||||||||||
|
| |||||||||||
Asset-Backed Securities | 883,049 | |||||||||||
| ||||||||||||
| 2,089,463 | Discounted Cash Flow | Constant Prepayment Rate | 0.00% - 25.65% (7.73%) | |||||||||
| Constant Default Rate | 0.00% - 9.13% (2.34%) | |||||||||||
| PSA Prepayment Model | 338.00% - 1,085.00% (682.69%) | |||||||||||
| Yield (Discount Rate of Cash Flows) | 0.00% - 17.34% (6.39%) | |||||||||||
|
| |||||||||||
Collateralized Mortgage Obligations — Non-Agency CMO | 2,089,463 | |||||||||||
| ||||||||||||
| 202,178 | Discounted Cash Flow | Constant Prepayment Rate | 0.00% - 100.00% (75.56%) | |||||||||
| Constant Default Rate | 0.00% (N/A) | |||||||||||
| Yield (Discount Rate of Cash Flows) | 0.00% - 2.29% (1.72%) | |||||||||||
|
| |||||||||||
Commercial Mortgage-Backed Securities | 202,178 | |||||||||||
| ||||||||||||
| 131,558 | Discounted Cash Flow | Yield (Discount Rate of Cash Flows) | 2.09% (N/A) | |||||||||
|
| |||||||||||
Corporate Bonds — Telecommunication Services | 131,558 | |||||||||||
| ||||||||||||
Total | $ | 3,306,248 | ||||||||||
| ||||||||||||
| 36 | JPMORGAN INSURANCE TRUST | DECEMBER 31, 2013 | ||||
Table of Contents
| # | The table above does not include level 3 securities that are valued by brokers and pricing services. At December 31, 2013, the value of these securities was $1,300,565. The inputs for these securities are not readily available or cannot be reasonably estimated and are generally those inputs described in Note 2A. The appropriateness of fair values for these securities is monitored on an ongoing basis which may include results of back testing, unchanged price review, results of broker and vendor due diligence and consideration of macro or security specific events. |
| The significant unobservable inputs used in the fair value measurement of the Portfolio's investments are listed above. Generally, a change in the assumptions used in any input in isolation may be accompanied by a change in another input. Significant changes in any of the unobservable inputs may significantly impact the fair value measurement. The impact is based on the relationship between each unobservable input and the fair value measurement. Significant increases (decreases) in the yield and default rate may decrease (increase) the fair value measurement. A significant change in the prepayment rate (Constant Prepayment Rate or PSA Prepayment Model) may decrease or increase the fair value measurement. |
B. Restricted and Illiquid Securities — Certain securities held by the Portfolio may be subject to legal or contractual restrictions on resale and/or are illiquid. Restricted securities generally are resold in transactions exempt from registration under the Securities Act of 1933 (the “Securities Act”). Illiquid securities are securities which cannot be disposed of promptly (within seven days) and in the usual course of business at approximately their fair value and include, but are not limited to, repurchase agreements maturing in excess of seven days, time deposits with a withdrawal penalty, non-negotiable instruments and instruments for which no market exists. Disposal of these securities may involve time-consuming negotiations and expense. Prompt sale at the current valuation may be difficult and could adversely affect the net assets of the Portfolio. As of December 31, 2013, the Portfolio had no investments in restricted securities other than securities sold to the Portfolio under Rule 144A under the Securities Act.
The value and percentage of net assets of illiquid securities as of December 31, 2013 were $317,345 and 0.2%, respectively.
C. Security Transactions and Investment Income — Investment transactions are accounted for on the trade date (the date the order to buy or sell is executed). Securities gains and losses are calculated on a specifically identified cost basis. Interest income is determined on the basis of coupon interest accrued using the effective interest method which adjusts for amortization of premiums and accretion of discounts. Dividend income, net of foreign taxes withheld, if any, is recorded on the ex-dividend date or when the Portfolio first learns of the dividend.
D. Allocation of Income and Expenses — Expenses directly attributable to a portfolio are charged directly to that portfolio, while the expenses attributable to more than one portfolio of the Trust are allocated among the respective portfolios. In calculating the NAV of each class, investment income, realized and unrealized gains and losses and expenses, other than class specific expenses, are allocated daily to each class of shares based upon the proportion of net assets of each class at the beginning of each day.
E. Federal Income Taxes — The Portfolio is treated as a separate taxable entity for Federal income tax purposes. The Portfolio’s policy is to comply with the provisions of the Internal Revenue Code of 1986, as amended (the “Code”), applicable to regulated investment companies and to distribute to shareholders all of its distributable net investment income and net realized capital gains on investments. Accordingly, no provision for Federal income tax is necessary. The Portfolio is also a segregated portfolio of assets for insurance purposes and intends to comply with the diversification requirements of Subchapter L of the Code. Management has reviewed the Portfolio’s tax positions for all open tax years and has determined that as of December 31, 2013, no liability for income tax is required in the Portfolio’s financial statements for net unrecognized tax benefits. However, management’s conclusions may be subject to future review based on changes in, or the interpretation of, the accounting standards or tax laws and regulations. The Portfolio’s Federal tax returns for the prior three fiscal years remain subject to examination by the Internal Revenue Service.
F. Distributions to Shareholders — Distributions from net investment income are generally declared and paid at least annually and are declared separately for each class. No class has preferential dividend rights; differences in per share rates are due to differences in separate class expenses. Net realized capital gains, if any, are distributed at least annually. The amount of distributions from net investment income and net realized capital gains is determined in accordance with Federal income tax regulations, which may differ from GAAP. To the extent these “book/tax” differences are permanent in nature (i.e., that they result from other than timing of recognition — “temporary differences”), such amounts are reclassified within the capital accounts based on their Federal tax-basis treatment.
The following amounts were reclassified within the capital accounts:
| Paid-in-Capital | Accumulated undistributed net investment income | Accumulated net realized gains (losses) | ||||||||
| $ | 7 | $ | 16 | $(23) | ||||||
The reclassifications for the Portfolio relate primarily to investments in regulated investment companies.
3. Fees and Other Transactions with Affiliates
A. Investment Advisory Fee — Pursuant to the Investment Advisory Agreement, the Adviser, an indirect, wholly-owned subsidiary of JPMorgan Chase & Co. (“JPMorgan”), supervises the investments of the Portfolio and for such services is paid a fee. The fee is accrued daily and paid monthly based on the Portfolio’s average daily net assets at an annual rate of 0.40%.
| DECEMBER 31, 2013 | JPMORGAN INSURANCE TRUST | 37 | ||||||
Table of Contents
NOTES TO FINANCIAL STATEMENTS
AS OF DECEMBER 31, 2013 (continued)
The Advisor waived Investment Advisory fees and/or reimbursed expenses as outlined in Note 3.E.
B. Administration Fee — Pursuant to an Administration Agreement, the Administrator, an indirect, wholly-owned subsidiary of JPMorgan, provides certain administration services to the Portfolio. In consideration of these services, the Administrator receives a fee accrued daily and paid monthly at an annual rate of 0.15% of the first $25 billion of the average daily net assets of all funds in the J.P. Morgan Funds Complex covered by the Administration Agreement (excluding certain funds of funds and money market funds) and 0.075% of the average daily net assets in excess of $25 billion of all such funds. For the year ended December 31, 2013, the effective rate was 0.08% of the Portfolio’s average daily net assets, notwithstanding any fee waivers and/or expense reimbursements.
JPMorgan Chase Bank, N.A (“JPMCB”), a wholly-owned subsidiary of JPMorgan serves as the Portfolio’s sub-administrator (the “Sub-administrator”). For its services as Sub-administrator, JPMCB receives a portion of the fees payable to the Administrator.
The Administrator waived Administration fees as outlined in Note 3.E.
C. Distribution Fees — Pursuant to a Distribution Agreement, JPMorgan Distribution Services, Inc. (the “Distributor”), a wholly-owned subsidiary of JPMorgan, serves as the Trust’s exclusive underwriter and promotes and arranges for the sale of the Portfolio’s shares.
The Board of Trustees has adopted a Distribution Plan (the “Distribution Plan”) for Class 2 Shares of the Portfolio in accordance with Rule 12b-1 under the 1940 Act. The Distribution Plan provides that the Portfolio shall pay distribution fees, including payments to the Distributor, at an annual rate of 0.25% of the average daily net assets of Class 2 Shares.
D. Custodian and Accounting Fees — JPMCB provides portfolio custody and accounting services to the Portfolio. The amounts paid directly to JPMCB by the Portfolio for custody and accounting services are included in Custodian and accounting fees in the Statement of Operations. Payments to the custodian may be reduced by credits earned by the Portfolio, based on uninvested cash balances held by the custodian. Such earnings credits, if any, are presented separately in the Statement of Operations.
Interest expense, if any, paid to the custodian related to cash overdrafts is included in Interest expense to affiliates in the Statement of Operations.
E. Waivers and Reimbursements — The Adviser, Administrator (for all share classes) and Distributor (for Class 2 Shares) have contractually agreed to waive fees and/or reimburse the Portfolio to the extent that total annual operating expenses (excluding acquired fund fees and expenses, dividend expenses related to short sales, interest, taxes, expenses related to litigation and potential litigation, extraordinary expenses and expenses related to the Board of Trustees’ deferred compensation plan) exceed the percentages of the Portfolio’s respective average daily net assets as shown in the table below:
| Class 1 | Class 2 | |||||||
| 0.60 | % | 0.85 | % | |||||
The expense limitation agreement was in effect for the year ended December 31, 2013. The contractual expense limitation percentages in the table above are in place until at least April 30, 2014.
For the year ended December 31, 2013, the Portfolio’s service providers waived fees for the Portfolio as follows. None of these parties expect the Portfolio to repay any such waived fees in future years.
| Contractual Waivers | ||||||||
| Administration | Total | |||||||
| $ | 12,208 | $ | 12,208 | |||||
| Voluntary Waivers | ||||||||
| Investment Advisory | Total | |||||||
| $ | 51 | $ | 51 | |||||
Additionally, the Portfolio may invest in one or more money market funds advised by the Adviser or its affiliates. The Adviser, Administrator and the Distributor waive fees in an amount sufficient to offset the respective fees each charges to the affiliated money market fund on the Portfolio’s investment in such affiliated money market fund. A portion of the waiver is voluntary.
The amount of waivers resulting from investments in these money market funds for the year ended December 31, 2013 was $9,847.
F. Other — Certain officers of the Trust are affiliated with the Adviser, the Administrator and the Distributor. Such officers, with the exception of the Chief Compliance Officer, receive no compensation from the Portfolio for serving in their respective roles.
The Board of Trustees appointed a Chief Compliance Officer to the Portfolio in accordance with Federal securities regulations. The Portfolio, along with other affiliated portfolios, makes reimbursement payments, on a pro-rata basis, to the Administrator for a portion of the fees associated with the Office of the Chief Compliance Officer. Such fees are included in Trustees’ and Chief Compliance Officer’s fees in the Statement of Operations.
The Trust adopted a Trustee Deferred Compensation Plan (the “Plan”) which allows the Independent Trustees to defer the receipt of all or a portion of compensation related to performance of their duties as Trustees. The deferred fees are invested in various J.P. Morgan Funds until distribution in accordance with the Plan.
| 38 | JPMORGAN INSURANCE TRUST | DECEMBER 31, 2013 | ||||
Table of Contents
During the year ended December 31, 2013, the Portfolio may have purchased securities from an underwriting syndicate in which the principal underwriter or members of the syndicate are affiliated with the Adviser.
The Portfolio may use related party broker-dealers. For the year ended December 31, 2013, the Portfolio did not incur any brokerage commissions with broker-dealers affiliated with the Adviser.
The Securities and Exchange Commission has granted an exemptive order permitting the Portfolio to engage in principal transactions with J.P. Morgan Securities, Inc., an affiliated broker, involving taxable money market instruments, subject to certain conditions.
4. Investment Transactions
During the year ended December 31, 2013, purchases and sales of investments (excluding short-term investments) were as follows:
| Purchases (excluding U.S. Government) | Sales (excluding U.S. Government) | Purchases of U.S. Government | Sales of U.S. Government | |||||||||||||
| $ | 19,123,468 | $ | 32,161,970 | $ | 8,140,878 | $ | 4,984,030 | |||||||||
5. Federal Income Tax Matters
For Federal income tax purposes, the cost and unrealized appreciation (depreciation) in value of investment securities held at December 31, 2013 were as follows:
| Aggregate Cost | Gross Unrealized Appreciation | Gross Unrealized Depreciation | Net Unrealized Appreciation (Depreciation) | |||||||||||||
| $ | 188,749,510 | $ | 16,010,870 | $ | 3,180,904 | $ | 12,829,966 | |||||||||
The difference between book and tax basis appreciation (depreciation) on investments is primarily attributed to straddle loss deferral.
The tax character of distributions paid during the year ended December 31, 2013 was as follows:
| Total Distributions Paid From: | ||||||||
| Ordinary Income | Total Distributions Paid | |||||||
| $ | 9,733,210 | $ | 9,733,210 | |||||
The tax character of distributions paid during the year ended December 31, 2012 was as follows:
| Total Distributions Paid From: | ||||||
| Ordinary Income | Total Distributions Paid | |||||
| $10,127,552 | $ | 10,127,552 | ||||
As of December 31, 2013, the components of net assets (excluding paid-in-capital) on a tax basis were as follows:
| Current Distributable Ordinary Income | Current Distributable Long-Term Capital Gain or (Tax Basis Capital Loss Carryover) | Unrealized Appreciation (Depreciation) | ||||||||
| $ | 8,060,604 | $ | (6,191,730 | ) | $12,829,966 | |||||
The cumulative timing differences primarily consist of trustee deferred compensation.
Under the Regulated Investment Company Modernization Act of 2010 (the “Act”), net capital losses recognized by the Portfolio after December 31, 2010, are carried forward indefinitely, and retain their character as short-term and/or long-term losses. Prior to the Act, net capital losses incurred by the Portfolio were carried forward for eight years and treated as short-term losses. The Act requires that post-enactment net capital losses be used before pre-enactment net capital losses.
As of December 31, 2013, the Portfolio did not have any post-enactment net capital loss carryforwards.
As of December 31, 2013, the Portfolio had pre-enactment net capital loss carryforwards, expiring during the years indicated, which are available to offset future realized gains:
| 2016 | 2017 | Total | ||||||||||
| $ | 750,856 | $ | 5,440,874 | $ | 6,191,730 | * | ||||||
| * | The entire amount is comprised of capital loss carryforwards from business combinations, which may be limited in future years under the Internal Revenue Code Sections 381-384. |
During the year ended December 31, 2013, the Portfolio utilized pre-enactment capital loss carryforwards of $28,861 and post-enactment long-term capital loss carryforwards of $307,289.
| DECEMBER 31, 2013 | JPMORGAN INSURANCE TRUST | 39 | ||||||
Table of Contents
NOTES TO FINANCIAL STATEMENTS
AS OF DECEMBER 31, 2013 (continued)
6. Borrowings
The Trust and JPMCB have entered into a financing arrangement. Under this arrangement, JPMCB provides an unsecured, uncommitted credit facility in the aggregate amount of $100 million to certain of the J.P. Morgan Funds, including the Portfolio. Advances under the arrangement are taken primarily for temporary or emergency purposes, including the meeting of redemption requests that otherwise might require the untimely disposition of securities, and are subject to the Portfolio’s borrowing restrictions. Interest on borrowings is payable at a rate determined by JPMCB at the time of borrowing. This agreement has been extended until November 10, 2014.
The Portfolio had no borrowings outstanding from the unsecured, uncommitted credit facility at December 31, 2013, or at any time during the year then ended.
Interest expense paid, if any, as a result of borrowings from the unsecured, uncommitted credit facility is included in Interest expense to affiliates in the Statement of Operations.
7. Risks, Concentrations and Indemnifications
In the normal course of business, the Portfolio enters into contracts that contain a variety of representations which provide general indemnifications. The Portfolio’s maximum exposure under these arrangements is unknown. The amount of exposure would depend on future claims that may be made against the Portfolio that have not yet occurred. However, based on experience, the Portfolio expects the risk of loss to be remote.
The Portfolio has several shareholders holding a significant percentage of shares outstanding. Investment activities of these shareholders could have a material impact on the Portfolio.
The Portfolio is subject to interest rate and credit risk. The value of debt securities may decline as interest rates increase. The Portfolio could lose money if the issuer of a fixed income security is unable to pay interest or repay principal when it is due. The ability of the issuers of debt to meet their obligations may be affected by the economic and political developments in a specific industry or region.
The Portfolio is also subject to counterparty credit risk, which is the risk that a counterparty fails to perform on agreements with the Portfolio such as swap and option contracts, credit-linked notes and TBA securities.
The Portfolio is subject to risks associated with securities with contractual cash flows including asset-backed and mortgage-related securities such as collateralized mortgage obligations, mortgage pass-through securities and commercial mortgage-backed securities, including securities backed by sub-prime mortgage loans. The value, liquidity and related income of these securities are sensitive to changes in economic conditions, including real estate value, prepayments, delinquencies and/or defaults, and may be adversely affected by shifts in the market’s perception of the issuers and changes in interest rates.
The Portfolio is subject to the risk that should the Portfolio decide to sell an illiquid investment when a ready buyer is not available at a price the Portfolio deems representative of its value, the value of the Portfolio’s net assets could be adversely affected.
| 40 | JPMORGAN INSURANCE TRUST | DECEMBER 31, 2013 | ||||
Table of Contents
REPORT OF INDEPENDENT REGISTERED PUBLIC ACCOUNTING FIRM
To the Board of Trustees of JPMorgan Insurance Trust and the Shareholders of JPMorgan Insurance Trust Core Bond Portfolio:
In our opinion, the accompanying statement of assets and liabilities, including the schedule of portfolio investments, and the related statements of operations and of changes in net assets and the financial highlights present fairly, in all material respects, the financial position of JPMorgan Insurance Trust Core Bond Portfolio (a separate Portfolio of JPMorgan Insurance Trust) (hereafter referred to as the “Portfolio”) at December 31, 2013, the results of its operations for the year then ended, the changes in its net assets for each of the two years in the period then ended and the financial highlights for each of the five years in the period then ended, in conformity with accounting principles generally accepted in the United States of America. These financial statements and financial highlights (hereafter referred to as “financial statements”) are the responsibility of the Portfolio’s management. Our responsibility is to express an opinion on these financial statements based on our audits. We conducted our audits of these financial statements in accordance with the standards of the Public Company Accounting Oversight Board (United States). Those standards require that we plan and perform the audit to obtain reasonable assurance about whether the financial statements are free of material misstatement. An audit includes examining, on a test basis, evidence supporting the amounts and disclosures in the financial statements, assessing the accounting principles used and significant estimates made by management, and evaluating the overall financial statement presentation. We believe that our audits, which included confirmation of securities at December 31, 2013 by correspondence with the custodian and brokers, provide a reasonable basis for our opinion.
PricewaterhouseCoopers LLP
New York, New York
February 21, 2014
| DECEMBER 31, 2013 | JPMORGAN INSURANCE TRUST | 41 | ||||||
Table of Contents
(Unaudited)
The Portfolio’s Statement of Additional Information includes additional information about the Portfolio’s Trustees and is available, without charge, upon request by calling 1-800-480-4111 or on the J.P. Morgan Funds’ website at www.jpmorganfunds.com.
Name (Year of Birth); Positions With the Portfolio (1) | Principal Occupations During Past 5 Years | Number of Portfolios in Fund Complex Overseen by Trustee (2) | Other Directorships Held Outside Fund Complex During Past 5 Years | |||
Independent Trustees | ||||||
| John F. Finn (1947); Trustee of Trust since 2005; Trustee of heritage One Group Mutual Funds since 1998. | Chairman (1985-present), President and Chief Executive Officer, Gardner, Inc. (supply chain management company serving industrial and consumer markets) (1974-present). | 170 | Director, Cardinal Health, Inc. (CAH) (1994-present); Director, Greif, Inc. (GEF) (industrial package products and services) (2007-present); Trustee, Columbus Association for the Performing Arts. | |||
| Dr. Matthew Goldstein (1941); Chairman since 2013; Trustee of Trust since 2005; Trustee of heritage J.P. Morgan Funds since 2003. | Professor, City University of New York (effective 7/1/13); Chancellor, City University of New York (1999-2013); President, Adelphi University (New York) (1998-1999). | 170 | Trustee, Museum of Jewish Heritage (2011-present). | |||
| Robert J. Higgins (1945); Trustee of Trust since 2005; Trustee of heritage J.P. Morgan Funds since 2002. | Retired; Director of Administration of the State of Rhode Island (2003-2004); President — Consumer Banking and Investment Services, Fleet Boston Financial (1971-2001). | 170 | None | |||
| Peter C. Marshall (1942); Trustee of Trust since 2005; Trustee of heritage One Group Mutual Funds since 1985. | Self-employed business consultant (2002-present). | 170 | None | |||
| Mary E. Martinez (1960); Trustee of Trust since 2013. | Associate, Special Properties, a Christie’s International Real Estate Affiliate (2010-Present); Managing Director, Bank of America (Asset Management) (2007-2008); Chief Operating Officer, U.S. Trust Asset Management; U.S. Trust Company (asset management) (2003-2007); President, Excelsior Funds (registered investment companies) (2004-2005). | 170 | None | |||
| Marilyn McCoy* (1948); Trustee of Trust since 2005; Trustee of heritage One Group Mutual Funds since 1999. | Vice President of Administration and Planning, Northwestern University (1985-present). | 170 | Trustee, Carleton College (2003-present). | |||
| Mitchell M. Merin (1953); Trustee of Trust since 2013. | Retired (2005-Present); President and Chief Operating Officer, Morgan Stanley Investment Management, Member Morgan Stanley & Co. Management Committee (registered investment adviser) (1998-2005). | 170 | Director, Sun Life Financial (SLF) (2007 to Present) (financial services and insurance); Trustee, Trinity College, Hartford, CT (2002-2010). | |||
| William G. Morton, Jr. (1937); Trustee of Trust since 2005; Trustee of heritage J.P. Morgan Funds since 2003. | Retired; Chairman Emeritus (2001-2002), and Chairman and Chief Executive Officer, Boston Stock Exchange (1985-2001). | 170 | Director, Radio Shack Corp. (1987-2008); Director, National Organization of Investment Professionals; Trustee of the Stratton Mountain School (2001-present). | |||
| 42 | JPMORGAN INSURANCE TRUST | DECEMBER 31, 2013 | ||||
Table of Contents
Name (Year of Birth); Positions With | Principal Occupations During Past 5 Years | Number of | Other Directorships Held Outside Fund Complex During Past 5 Years | |||
Independent Trustees (continued) | ||||||
| Dr. Robert A. Oden, Jr. (1946); Trustee of Trust since 2005; Trustee of heritage One Group Mutual Funds since 1997. | Retired; President, Carleton College (2002-2010); President, Kenyon College (1995-2002). | 170 | Trustee, American University in Cairo (1999-present); Chairman, Dartmouth-Hitchcock Medical Center (2011-present); Trustee, American Schools of Oriental Research (2011-present); Trustee, American Museum of Fly Fishing. | |||
| Marian U. Pardo** (1946); Trustee of Trust since 2013. | Managing Director and Founder, Virtual Capital Management LLC (Investment Consulting) (2007-present); Managing Director, Credit Suisse Asset Management (portfolio manager) (2003-2006). | 170 | Member, Board of Governors, Columbus Citizens Foundation (not-for-profit supporting philanthropic and cultural programs) (2006-present). | |||
| Frederick W. Ruebeck (1939); Trustee of Trust since 2005; Trustee of heritage One Group Mutual Funds since 1994. | Consultant (2000-present); Adviser, JP Greene & Associates, LLC (broker-dealer) (2000-2009); Chief Investment Officer, Wabash College (2004-present); Director of Investments, Eli Lilly and Company (pharmaceuticals) (1988-1999). | 170 | Trustee, Wabash College (1988-present); Chairman, Indianapolis Symphony Orchestra Foundation (1994-present). | |||
| James J. Schonbachler (1943); Trustee of Trust since 2005; Trustee of heritage J.P. Morgan Funds since 2001. | Retired; Managing Director of Bankers Trust Company (financial services) (1968-1998). | 170 | None | |||
Interested Trustee Not Affiliated With the Adviser | ||||||
| Frankie D. Hughes*** (1952), Trustee of Trust since 2008. | President and Chief Investment Officer, Hughes Capital Management, Inc. (fixed income asset management) (1993-present). | 170 | Trustee, The Victory Portfolios (2000-2008) (investment companies). | |||
| (1) | The Trustees serve for an indefinite term, subject to the Trust’s current retirement policy, which is age 75 for all Trustees, except that the Board has determined Mr. Morton should continue to serve until December 31, 2014. In order to fill the vacancies created by the retirement of Fergus Reid, III, William J. Armstrong, and Leonard J. Spalding Jr., effective December 31, 2012, the Board appointed Ms. Martinez and Mr. Merin to serve as Trustees effective January 1, 2013 and Ms. Pardo to serve as Trustee effective February 1, 2013. |
| (2) | A Fund Complex means two or more registered investment companies that hold themselves out to investors as related companies for purposes of investment and investor services or have a common investment adviser or have an investment adviser that is an affiliated person of the investment adviser of any of the other registered investment companies. The J.P. Morgan Funds Complex for which the Board of Trustees serves currently includes eleven registered investment companies (170 funds), including JPMorgan Mutual Fund Group which liquidated effective November 29, 2012 and is in the process of winding up its affairs. |
| * | Ms. McCoy has served as Vice President of Administration and Planning for Northwestern University since 1985. William M. Daley was the Head of Corporate Responsibility for JPMorgan Chase & Co. prior to January 2011 and served as a member of the Board of Trustees of Northwestern University from 2005 through 2010. JPMIM, the Portfolio’s investment adviser, is a wholly-owned subsidiary of JPMorgan Chase & Co. Two members of the Board of Trustees of Northwestern University are executive officers of registered investment advisers (not affiliated with JPMorgan) that are under common control with sub-advisers to certain J.P. Morgan Funds. |
| ** | In connection with prior employment with JPMorgan Chase, Ms. Pardo is the recipient of non-qualified pension plan payments from JPMorgan Chase in the amount of approximately $2,055 per month, which she irrevocably waived effective January 1, 2013, and deferred compensation payments from JPMorgan Chase in the amount of approximately $7,294 per year, which ended in January 2013. In addition, Ms. Pardo receives payments from a fully funded qualified plan, which is not an obligation of JPMorgan Chase. |
| *** | Ms. Hughes is treated as an “interested person” based on the portfolio holdings of clients of Hughes Capital Management, Inc. |
The contact address for each of the Trustees is 270 Park Avenue, New York, NY 10017.
| DECEMBER 31, 2013 | JPMORGAN INSURANCE TRUST | 43 | ||||||
Table of Contents
(Unaudited)
| Name (Year of Birth), Positions Held with the Trust (Since) | Principal Occupations During Past 5 Years | |
Robert L. Young (1963), | Chief Operating Officer and Director, J.P. Morgan Investment Management Inc. since 2010; Senior Vice President, J.P. Morgan Funds (2005-2010), Chief Operating Officer, J.P. Morgan Funds (2005-2010); Director and various officer positions for JPMorgan Funds Management, Inc. (formerly One Group Administrative Services) and JPMorgan Distribution Services, Inc. (formerly One Group Dealer Services, Inc.) from 1999 to present. Mr. Young has been with JPMorgan Chase & Co. (formerly Bank One Corporation) since 1997. | |
| Joy C. Dowd (1972), Treasurer and Principal Financial Officer (2010) | Assistant Treasurer of the Trusts from 2009 to 2010; Executive Director, JPMorgan Funds Management, Inc. from February 2011; Vice President, JPMorgan Funds Management, Inc. from December 2008 to February 2011; prior to joining JPMorgan Chase, Ms. Dowd worked in MetLife’s investments audit group from 2005 through 2008. | |
| Frank J. Nasta (1964), Secretary (2008) | Managing Director and Associate General Counsel, JPMorgan Chase since 2008; Previously, Director, Managing Director, General Counsel and Corporate Secretary, J. & W. Seligman & Co. Incorporated; Secretary of each of the investment companies of the Seligman Group of Funds and Seligman Data Corp.; Director and Corporate Secretary, Seligman Advisors, Inc. and Seligman Services, Inc. | |
| Stephen M. Ungerman (1953), Chief Compliance Officer (2005) | Managing Director, JPMorgan Chase & Co.; Mr. Ungerman has been with JPMorgan Chase & Co. since 2000. | |
Kathryn A. Jackson (1962), | Vice President and AML Compliance Manager for JPMorgan Asset Management Compliance since 2011; Senior On-Boarding Specialist for JPMorgan Distribution Services, Inc. in Global Liquidity from 2008 to 2011; prior to joining JPMorgan, Ms. Jackson was a Financial Services Analyst responsible for on-boarding, compliance and training with Nationwide Securities LLC and 1717 Capital Management Company, both registered broker-dealers, from 2005 until 2008. | |
Elizabeth A. Davin (1964), Assistant Secretary (2005)** | Executive Director and Assistant General Counsel, JPMorgan Chase since February 2012; formerly Vice President and Assistant General Counsel, JPMorgan Chase from 2005 until February 2012; Senior Counsel, JPMorgan Chase (formerly Bank One Corporation) from 2004 to 2005. | |
| Jessica K. Ditullio (1962), Assistant Secretary (2005)** | Executive Director and Assistant General Counsel, JPMorgan Chase since February 2011; Ms. Ditullio has served as an attorney with various titles for JPMorgan Chase (formerly Bank One Corporation) since 1990. | |
| John T. Fitzgerald (1975), Assistant Secretary (2008) | Executive Director and Assistant General Counsel, JPMorgan Chase since February 2011; formerly, Vice President and Assistant General Counsel, JPMorgan Chase from 2005 until February 2011. | |
| Carmine Lekstutis (1980), Assistant Secretary (2011) | Vice President and Assistant General Counsel, JPMorgan Chase since 2011; Associate, Skadden, Arps, Slate, Meagher & Flom LLP (law firm) from 2006 to 2011. | |
| Gregory S. Samuels (1980), Assistant Secretary (2010) | Vice President and Assistant General Counsel, JPMorgan Chase since 2010; Associate, Ropes & Gray (law firm) from 2008 to 2010; Associate, Clifford Chance LLP (law firm) from 2005 to 2008. | |
| Pamela L. Woodley (1971), Assistant Secretary (2012) | Vice President and Assistant General Counsel, JPMorgan Chase since November 2004. | |
Michael M. D’Ambrosio (1969), Assistant Treasurer (2012) | Executive Director, JPMorgan Funds Management, Inc. from July 2012; prior to joining JPMorgan Chase, Mr. D’Ambrosio was a Tax Director at PricewaterhouseCoopers LLP since 2006. | |
| Joseph Parascondola (1963), Assistant Treasurer (2011) | Vice President, JPMorgan Funds Management, Inc. since August 2006. | |
| Matthew J. Plastina (1970), Assistant Treasurer (2011) | Vice President, JPMorgan Funds Management, Inc. since August 2010; prior to August 2010, Vice President and Controller, Legg Mason Global Asset Management. | |
Julie A. Roach (1971), Assistant Treasurer (2012)** | Vice President, JPMorgan Funds Management, Inc. from August 2012; prior to joining JPMorgan Chase, Ms. Roach was a Senior Manager with Deloitte since 2001. | |
Gillian I. Sands (1969), Assistant Treasurer (2012) | Vice President, JPMorgan Funds Management, Inc. from September 2012; Assistant Treasurer, Wells Fargo Funds Management (2007-2009). | |
The contact address for each of the officers, unless otherwise noted, is 270 Park Avenue, New York, NY 10017.
| * | The contact address for the officer is 500 Stanton Christiana Road, Ops 1, Floor 02, Newark, DE 19173-2107. |
| ** | The contact address for the officer is 460 Polaris Parkway, Westerville, OH 43082. |
| 44 | JPMORGAN INSURANCE TRUST | DECEMBER 31, 2013 | ||||
Table of Contents
SCHEDULE OF SHAREHOLDER EXPENSES
(Unaudited)
Hypothetical $1,000 Investment
As a shareholder of the Portfolio, you incur ongoing costs, including investment advisory fees, administration fees, distribution fees (for Class 2 Shares) and other Portfolio expenses. Because the Portfolio is a funding vehicle for Policies and Eligible Plans, you may also incur sales charges and other fees relating to the Policies or Eligible Plans. The examples below are intended to help you understand your ongoing costs (in dollars) of investing in the Portfolio, but not the costs of the Policies or Eligible Plans, and to compare these ongoing costs with the ongoing costs of investing in other mutual funds. The examples assume that you had a $1,000 investment in each Class at the beginning of the reporting period, July 1, 2013, and continued to hold your shares at the end of the reporting period, December 31, 2013.
Actual Expenses
For each Class of the Portfolio in the table below, the first line provides information about actual account values and actual expenses. You may use the information in this line, together with the amount you invested, to estimate the expenses that you paid over the period. Simply divide your account value by $1,000 (for example, an $8,600 account value divided by $1,000 = 8.6), then multiply the result by the number in the first line of each Class under the heading entitled “Expenses Paid During the Period” to estimate the expenses you paid on your account during this period.
Hypothetical Example for Comparison Purposes
The second line of each Class in the table below provides information about hypothetical account values and hypothetical expenses based on the Class’ actual expense ratio and an assumed rate of return of 5% per year before expenses, which is not the Class’ actual return. The hypothetical account values and expenses may not be used to estimate the actual ending account balance or expenses you paid for the period. You may use this information to compare the ongoing costs of investing in the Class of the Portfolio and other funds. To do so, compare this 5% hypothetical example with the 5% hypothetical examples that appear in the shareholder reports of the other funds. Please note that the expenses shown in the table are meant to highlight your ongoing costs only and do not reflect any transaction costs, such as sales charges (loads) or redemption fees or the costs associated with the Policies and Eligible Plans through which the Portfolio is held. Therefore, the second line for each Class in the table is useful in comparing ongoing costs only, and will not help you determine the relative total costs of owning different funds. In addition, if these transaction costs were included, your costs would have been higher. The examples also assume all dividends and distributions have been reinvested.
Expense Example
| Beginning Account Value July 1, 2013 | Ending Account Value December 31, 2013 | Expenses Paid During the Period* | Annualized Expense Ratio | |||||||||||||
Core Bond Portfolio | ||||||||||||||||
Class 1 | ||||||||||||||||
Actual | $ | 1,000.00 | $ | 1,002.70 | $ | 2.98 | 0.59 | % | ||||||||
Hypothetical | 1,000.00 | 1,022.23 | 3.01 | 0.59 | ||||||||||||
Class 2 | ||||||||||||||||
Actual | 1,000.00 | 1,000.90 | 4.24 | 0.84 | ||||||||||||
Hypothetical | 1,000.00 | 1,020.97 | 4.28 | 0.84 | ||||||||||||
| * | Expenses are equal to each Class' respective annualized expense ratio, multiplied by the average account value over the period, multiplied by 184/365 (to reflect the one-half year period). |
| DECEMBER 31, 2013 | JPMORGAN INSURANCE TRUST | 45 | ||||||
Table of Contents
BOARD APPROVAL OF INVESTMENT ADVISORY AGREEMENT
(Unaudited)
The Board of Trustees meets regularly throughout the year and considers factors that are relevant to its annual consideration of investment advisory agreements at each meeting. The Board of Trustees has established various standing committees, composed of Trustees with diverse backgrounds, to which the Board of Trustees has assigned specific subject matter responsibilities to further enhance the effectiveness of the Board’s oversight and decision making. The Board of Trustees and its investment committees (money market and alternative products, equity, and fixed income) also meet for the specific purpose of considering advisory contract annual renewals. The Board of Trustees held meetings in person in June and August 2013, at which the Trustees considered the continuation of the investment advisory agreement for the Portfolio whose annual report is contained herein (the “Advisory Agreement”). At the June meeting, the Board’s investment committees met to review and consider performance, expense and related information for the J.P. Morgan Funds. Each investment subcommittee reported to the full Board, which then considered the investment committee’s preliminary findings. At the August meeting, the Trustees continued their review and consideration. The Trustees, including a majority of the Trustees who are not “interested persons” (as defined in the 1940 Act) of any party to the Advisory Agreement or any of their affiliates, approved the continuation of the Advisory Agreement on August 20, 2013.
The Trustees, as part of their review of the investment advisory arrangements for the J.P. Morgan Funds, considered and reviewed performance and other information received from the Adviser on a regular basis over the course of the year, as well as information specifically prepared for their annual review. This information included the Portfolio’s performance compared to the performance of the Portfolio’s peers and benchmarks and analyses by the Adviser of the Portfolio’s performance. The Adviser also periodically provides comparative information regarding the Portfolio’s expense ratios and those of the peer groups. In addition, in preparation for the June and August meetings, the Trustees requested, received and evaluated extensive materials from the Adviser, including, with respect to the Portfolio, performance and expense information compiled by Lipper Inc. (“Lipper”), an independent provider of investment company data. Prior to voting, the Trustees reviewed the proposed approval of the Advisory Agreement with representatives of the Adviser and with counsels to the Portfolio and independent Trustees and received a memorandum from independent counsel to the Trustees discussing the legal standards for their consideration of the proposed approval. The Trustees also discussed the proposed approvals in executive sessions with counsels to the Portfolio and independent Trustees at which no representatives of the Adviser were present. Set forth below is a summary of the material factors evaluated by the Trustees in determining whether to approve the Advisory Agreement.
In their deliberations, there was a comprehensive consideration of the information received by the Trustees. Each Trustee attributed different weights to the various factors and no factor alone was considered determinative. From year to year, the Trustees consider and place emphasis on relevant information in light of changing circumstances in market and economic conditions. The Trustees determined that the compensation to be received by the Adviser from the Portfolio under the Advisory Agreement was fair and reasonable and that the continuance of the investment advisory contract was in the best interests of the Portfolio and its shareholders.
The factors summarized below were considered and discussed by the Trustees in reaching their conclusions:
Nature, Extent and Quality of Services Provided by the Adviser
The Trustees received and considered information regarding the nature, extent and quality of the services provided to the Portfolio under the Advisory Agreement. The Trustees took into account information furnished throughout the year at Trustee meetings, as well as the materials furnished specifically in connection with this annual review process. The Trustees considered the background and experience of the Adviser’s senior management and the expertise of, and the amount of attention given to the Portfolio by, investment personnel of the Adviser. In addition, the Trustees reviewed the qualifications, backgrounds and responsibilities of the portfolio management team primarily responsible for the day-to-day management of the Portfolio and the infrastructure supporting the team. The Trustees also considered information provided by the Adviser and JPMorgan Distribution Services, Inc. (“JPMDS”) about the structure and distribution strategy of the Portfolio. The Trustees also reviewed information relating to the Adviser’s risk governance model and reports showing the Adviser’s compliance structure and ongoing compliance processes. The quality of the administrative services provided by JPMorgan Funds Management, Inc. (“JPMFM”), an affiliate of the Adviser, was also considered.
The Board of Trustees also considered its knowledge of the nature and quality of the services provided by the Adviser to the Portfolio gained from their experience as Trustees of the J.P. Morgan Funds. In addition, they considered the overall reputation and capabilities of the Adviser and its affiliates, the commitment of the Adviser to provide high quality service to the Portfolio, their overall confidence in the Adviser’s integrity and the Adviser’s responsiveness to questions or concerns raised by them, including the Adviser’s willingness to consider and implement organizational and operational changes designed to improve investment results and the services provided to the Portfolio.
Based on these considerations and other factors, the Trustees concluded that they were satisfied with the nature, extent and quality of the investment advisory services provided to the Portfolio by the Adviser.
| 46 | JPMORGAN INSURANCE TRUST | DECEMBER 31, 2013 | ||||
Table of Contents
Costs of Services Provided and Profitability to the Adviser and its Affiliates
The Trustees received and considered information regarding the profitability to the Adviser and its affiliates in providing services to the Portfolio. The Trustees reviewed and discussed this data. The Trustees recognized that this data is not audited and represents the Adviser’s determination of its and its affiliates’ revenues from the contractual services provided to the Portfolio, less expenses of providing such services. Expenses include direct and indirect costs and are calculated using an allocation methodology developed by the Adviser. The Trustees also recognized that it is difficult to make comparisons of profitability from fund investment advisory contracts because comparative information is not generally publicly available and is affected by numerous factors, including the structure of the particular adviser, the types of funds it manages, its business mix, numerous assumptions regarding allocations and the fact that publicly-traded fund managers’ operating profits and net income are net of distribution and marketing expenses. Based on their review, the Trustees concluded that the profitability to the Adviser under the Advisory Agreement was not unreasonable in light of the services and benefits provided to the Portfolio.
Fall-Out Benefits
The Trustees reviewed information regarding potential “fallout” or ancillary benefits received by the Adviser and its affiliates as a result of their relationship with the Portfolio. The Board also reviewed the adviser’s allocation of fund brokerage for the J.P. Morgan Funds complex, including allocations to brokers who provide research to the adviser.
The Trustees also considered that JPMFM earns fees from the Portfolio for providing administrative services. These fees were shown separately in the profitability analysis presented to the Trustees. The Trustees also considered the payments of Rule 12b-1 fees to JPMDS, an affiliate of the Adviser, which also acts as the Portfolio’s distributor and that these fees are in turn generally paid to financial intermediaries that sell the Portfolio, including financial intermediaries that are affiliates of the Adviser. The Trustees also considered the fees paid to JPMorgan Chase Bank, N.A. (“JPMCB”) for custody and fund accounting and other related services.
Economies of Scale
The Trustees noted that the proposed investment advisory fee schedule for the Portfolio does not contain breakpoints. The Trustees considered whether it would be appropriate to add advisory fee breakpoints and the Trustees concluded that the current fee structure was reasonable in light of the fee waivers and expense limitations that the Adviser has in place that serve to limit the overall net expense ratio at competitive levels. The Trustees also recognized that the fee schedule for the
administrative services provided by JPMFM does include a fee breakpoint, which is tied to the overall level of non-money market fund assets excluding certain funds-of-funds, as applicable, advised by the Adviser, and that the Portfolio benefits from that breakpoint. The Trustees concluded that shareholders benefited from the lower expense ratios which resulted from these factors.
Independent Written Evaluation of the Portfolio’s Chief Compliance Officer
The Trustees noted that, upon their direction, the Chief Compliance Officer for the Portfolio had prepared an independent written evaluation in order to assist the Trustees in determining the reasonableness of the proposed management fees. The Trustees considered the written evaluation in determining whether to continue the Advisory Agreement.
Fees Relative to Adviser’s Other Clients
The Trustees received and considered information about the nature and extent of investment advisory services and fee rates offered to other clients of the Adviser for investment management styles substantially similar to that of the Portfolio. The Trustees also considered the complexity of investment management for the Portfolio relative to the Adviser’s other clients and the differences in the nature and extent of the services provided to the different clients. The Trustees concluded that the fee rates charged to the Portfolio in comparison to those charged to the Adviser’s other clients were reasonable.
Investment Performance
The Trustees received and considered absolute and/or relative performance for the Portfolio in a report prepared by Lipper. The Trustees considered the total return performance information, which included the ranking of the Portfolio within a performance universe made up of funds with the same Lipper investment classification and objective (the “Universe Group”) by total return for applicable one-, three- and five-year periods. The Trustees reviewed a description of Lipper’s methodology for selecting mutual funds in the Portfolio’s Universe Group. The Lipper materials provided to the Trustees highlighted information with respect to a representative class to assist the Trustees in their review. As part of this review, the Trustees also reviewed the Portfolio’s performance against its benchmark and considered the performance information provided for the Portfolio at regular Board meetings by the Adviser. The Lipper performance data noted by the Trustees as part of their review and the determinations made by the Trustees with respect to the Portfolio’s performance are summarized below:
The Trustees noted the Portfolio’s performance was in the first quintile for Class 1 shares for the one-, three-, and five-year periods ended December 31, 2012, respectively. The Trustees discussed the performance and investment strategy of the
| DECEMBER 31, 2013 | JPMORGAN INSURANCE TRUST | 47 | ||||||
Table of Contents
BOARD APPROVAL OF INVESTMENT ADVISORY AGREEMENT
(Unaudited) (continued)
Portfolio with the Adviser and, based upon this discussion and various other factors, concluded that the performance was reasonable.
Advisory Fees and Expense Ratios
The Trustees considered the contractual advisory fee rate paid by the Portfolio to the Adviser and compared that rate to the information prepared by Lipper concerning management fee rates paid by other funds in the same Lipper category as the Portfolio. The Trustees recognized that Lipper reported the Portfolio’s management fee rate as the combined contractual advisory fee and administration fee rates. The Trustees also reviewed information about other expenses and the expense ratios for the Portfolio. The Trustees considered the fee waiver
and/or expense reimbursement arrangements currently in place for the Portfolio and considered the net advisory fee rate after taking into account any waivers and/or reimbursements. The Trustees recognized that it is difficult to make comparisons of advisory fees because there are variations in the services that are included in the fees paid by other funds. The Trustees’ determinations as a result of the review of the Portfolio’s advisory fees and expense ratios are summarized below:
The Trustees noted that the Portfolio’s net advisory fee and actual total expenses for Class 1 shares were in the second and third quintiles, respectively, of their Universe Group. After considering the factors identified above, in light of this information, the Trustees concluded that the advisory fee was reasonable.
| 48 | JPMORGAN INSURANCE TRUST | DECEMBER 31, 2013 | ||||
Table of Contents
J.P. Morgan Funds are distributed by JPMorgan Distribution Services, Inc., which is an affiliate of JPMorgan Chase & Co. Affiliates of JPMorgan Chase & Co. receive fees for providing various services to the funds.
Contact JPMorgan Distribution Services, Inc. at 1-800-480-4111 for a portfolio prospectus. You can also visit us at www.jpmorganfunds.com. Investors should carefully consider the investment objectives and risk as well as charges and expenses of the mutual fund before investing. The prospectus contains this and other information about the mutual fund. Read the prospectus carefully before investing.
The Portfolio files a complete schedule of its portfolio holdings for the first and third quarters of its fiscal year with the SEC on Form N-Q. The Portfolio’s Forms N-Q are available on the SEC’s website at http://www.sec.gov and may be reviewed and copied at the SEC’s Public Reference Room in Washington, DC. Information on the operation of the SEC’s Public Reference Room may be obtained by calling 1-800-SEC-0330. Shareholders may request the Form N-Q without charge by calling 1-800-480-4111 or by visiting the variable insurance portfolio section of the J.P. Morgan Funds’ website at www.jpmorganfunds.com.
A description of the Portfolio’s policies and procedures with respect to the disclosure of the Portfolio’s holdings is available in the prospectus and Statement of Additional Information.
A copy of proxy policies and procedures is available without charge upon request by calling 1-800-480-4111 and on the Portfolio’s website at www.jpmorganfunds.com. A description of such policies and procedures is on the SEC’s website at www.sec.gov. The Trustees have delegated the authority to vote proxies for securities owned by the Portfolio to the Adviser. A copy of the Portfolio’s voting record for the most recent 12-month period ended June 30 is available on the SEC’s website at www.sec.gov or at the Portfolio’s website at www.jpmorganfunds.com no later than August 31 of each year. The Portfolio’s proxy voting record will include, among other things, a brief description of the matter voted on for each portfolio security, and will state how each vote was cast, for example, for or against the proposal.

Table of Contents
| © JPMorgan Chase & Co., 2014. All rights reserved. December 2013. | AN-JPMITCBP-1213 |
Table of Contents
Annual Report
JPMorgan Insurance Trust
December 31, 2013
JPMorgan Insurance Trust Equity Index Portfolio
NOT FDIC INSURED Ÿ NO BANK GUARANTEE Ÿ MAY LOSE VALUE
|  |
Table of Contents
CONTENTS
Investments in the Portfolio are not bank deposits or obligations of, or guaranteed or endorsed by, any bank and are not insured or guaranteed by the FDIC, the Federal Reserve Board or any other government agency. You could lose money if you sell when the Portfolio’s share price is lower than when you invested.
Past performance is no guarantee of future performance. The general market views expressed in this report are opinions based on market and other conditions through the end of the reporting period and are subject to change without notice. These views are not intended to predict the future performance of the Portfolio or the securities markets. References to specific securities and their issuers are for illustrative purposes only and are not intended to be, and should not be interpreted as, recommendations to purchase or sell such securities. Such views are not meant as investment advice and may not be relied on as an indication of trading intent on behalf of the Portfolio.
This Portfolio is intended to be a funding vehicle for variable annuity contracts and variable life insurance policies (collectively “Policies”) offered by separate accounts of participating insurance companies. Portfolio shares are also offered through qualified pension and retirement plans (“Eligible Plans”). Individuals may not purchase shares directly from the Portfolio.
Prospective investors should refer to the Portfolio’s prospectus for a discussion of the Portfolio’s investment objective, strategies and risks. Call J.P. Morgan Funds Service Center at 1-800-480-4111 for a prospectus containing more complete information about the Portfolio, including management fees and other expenses. Please read it carefully before investing.
Table of Contents
January 23, 2014 (Unaudited)
Dear Shareholder,
Equities markets in developed economies performed strongly in the face of periodic spikes in volatility throughout the twelve months ended December 31, 2013. Healthy corporate earnings and incremental but steady improvements in a range of economic indicators provided a positive backdrop for investors seeking returns in the low interest rate environment. While political discord in Washington injected volatility into the market, a bipartisan budget agreement at the end of the year relieved much of the political uncertainty created by partisan brinkmanship over the so-called fiscal cliff and the partial shutdown of the federal government in October. In the first half of the year, the U.S. Federal Reserve (“Fed”) announced its intention to taper off its $85 billion in monthly asset purchases and the statement weakened investor sentiment and set off widespread speculation about the timing and magnitude of such a move. The Fed followed through in December, deciding to reduce its monthly purchases by $10 billion. The news, along with robust gains in jobs, housing and consumer sentiment, drove U.S. equities to new highs. The S&P 500 stock index hit seven closing highs in the final month of the reporting period, finishing 2013 with its best performance since 1997.
 |
“While a repeat of the equity performance we experienced in 2013 may be a tall order, we believe stocks in the U.S. and Europe may continue to show gains.” |
Overseas, the European Central Bank reaffirmed its commitment to accommodative monetary policy and to the euro itself. In the second quarter of the year, the European Union (EU) returned to positive growth and at the end of the year, Ireland became the first nation to exit from its European Union bailout program. The Fed’s decision to curb its asset purchases also sent equities higher in Europe, as investors viewed the move as a sign of further economic stability. In Japan, equity markets rebounded to their best year since 1988, benefitting from Prime Minister Shinzo Abe’s efforts to revive the economy. Low returns on bonds and short-term debt instruments also drove investors into stocks.
Emerging market equities were weaker overall. As of December 31, 2013, the MSCI Emerging Markets Index returned -2.3% for the year. China’s economy showed signs of slower growth during the year and the Fed’s decision to taper its asset purchase program set off speculation that the maturation of the emerging markets credit cycle would push yield-seeking investors to rotate into developed markets.
Taper Talk Pressures Bonds
Fixed income markets generally remained weak during the year, as central bankers across the globe held interest rates at
historic lows. However, benchmark bond yields rose on an annual basis for the first time since 2009. During the year, the Fed’s talk of tapering off its Quantitative Easing (QE) program hurt fixed income markets. U.S. Treasury security yields continued to be low from a historical perspective, but ended the period higher. The yield for 10-year U.S. Treasury securities ended December 31, 2013 at 3.04%, while the yields for 2- and 30-year U.S. Treasury securities finished the reporting period at 0.38% and 3.96%, respectively. High-yield debt returned 7.4% for the year, as measured by the Barclays US High Yield Corporate Index, while other U.S. debt securities and emerging market debt both had negative returns.
While global economic growth accelerated during the year, the U.S. recovery in particular showed stronger fundamentals and the Fed’s decision to taper its QE program was a response to the improved picture. Europe emerged from its lengthy recession and the worst of the fiscal crises seem to be behind it, though unemployment remains strikingly high in many EU nations. Japan made progress toward ending persistent deflation, but Tokyo’s monetary and fiscal stimulus has sharply weakened the yen, putting other Asian exporting nations — notably China and South Korea — at a competitive disadvantage. Emerging market economies may face further headwinds as foreign investment shrinks and economic growth moderates from recent strength. Moreover, political instability — already apparent in Thailand and Turkey — may surface in other emerging market nations as governments struggle to deliver improved living standards and respond to demands for political reforms.
The Long-Term Lens
We welcome the Fed’s move to curb its QE program as a sign that the U.S. economy’s need for artificial stimulus is waning. While a repeat of the equity performance we experienced in 2013 may be a tall order, we believe stocks in the U.S. and Europe may continue to show gains. In the fixed-income market, persistent weakness has led to attractive valuations in some sectors. The past year’s market swings and intermittent volatility underlined the importance of maintaining a long-term view of your investment portfolio and the benefits derived from diversified holdings.
On behalf of everyone at J.P. Morgan Asset Management, thank you for your continued support. We look forward to managing your investment needs for years to come. Should you have any questions, please visit www.jpmorganfunds.com or contact the J.P. Morgan Funds Service Center at 1-800-480-4111.
Sincerely yours,

George C.W. Gatch
CEO, Global Funds Management
J.P. Morgan Asset Management
| DECEMBER 31, 2013 | JPMORGAN INSURANCE TRUST | 1 | ||||||
Table of Contents
JPMorgan Insurance Trust Equity Index Portfolio
TWELVE MONTHS ENDED DECEMBER 31, 2013 (Unaudited)
| Reporting Period Return: | ||||
| Portfolio (Class 1 Shares)* | 31.81% | |||
| S&P 500 Index** | 32.39% | |||
| Net Assets as of 12/31/2013 | $ | 60,665,063 | ||
INVESTMENT OBJECTIVE***
The JPMorgan Insurance Trust Equity Index Portfolio (the “Portfolio”) seeks investment results that correspond to the aggregate price and dividend performance of securities in the Standard & Poor’s 500 Composite Stock Price Index (the “Benchmark”).
WHAT WERE THE MAIN DRIVERS OF THE PORTFOLIO’S PERFORMANCE?
The Portfolio (Class 1 Shares) performed largely in line with the Benchmark for the 12 months ended December 31, 2013. This was consistent with its indexing strategy and investment objective, as the Portfolio looks to generate returns that are comparable to that of the Benchmark.
Overall, the U.S. equity market performed strongly during the 12 months ended December 31, 2013, as a tepid economic recovery continued to gain strength from healthy corporate earnings, along with improvements in employment, housing and consumer sentiment. The Benchmark retreated at mid-year amid investor uncertainty about the U.S. Federal Reserve Board’s (“Fed”) intent to taper off its monthly purchases of $85 billion in Treasuries and mortgage-backed securities. Interest rates rose sharply higher, pressuring prices for both stocks and bonds. Partisan brinkmanship in Washington added to the uncertainty, starting with the standoff over the so-called fiscal cliff in January and followed by the partial shutdown of the federal government in October. A bipartisan budget agreement toward the end of the year relieved some of the political uncertainty. During the year, U.S. unemployment claims fell from 7.9% in January to 6.7% at year end, with slight upticks in joblessness at midyear and in October. Adding to the positive trend were advances in housing prices and auto sales in the second half of the year, and a rebound in consumer sentiment to a five-month high in December. The Benchmark hit 42 record closings during the year — the most since 1998 — including seven record high closings in the final month of the year. The Benchmark racked up a 32.39% gain for the year.
All of the sectors in the Benchmark produced positive returns during the 12-month period. The leading contributors to the Portfolio’s relative performance included the financials and health care sectors. The bottom contributors to the Portfolio’s relative performance included the telecommunication services sector and the utilities sector.
HOW WAS THE PORTFOLIO POSITIONED?
Regardless of the market outlook, the Portfolio was managed in strict conformity with a full index replication strategy and aimed to hold the same stocks in nearly the same proportions as those found in the Benchmark.
| TOP TEN EQUITY HOLDINGS OF THE PORTFOLIO**** | ||||||||
| 1. | Apple, Inc. | 3.0 | % | |||||
| 2. | Exxon Mobil Corp. | 2.6 | ||||||
| 3. | Google, Inc., Class A | 1.9 | ||||||
| 4. | Microsoft Corp. | 1.7 | ||||||
| 5. | General Electric Co. | 1.7 | ||||||
| 6. | Johnson & Johnson | 1.5 | ||||||
| 7. | Chevron Corp. | 1.4 | ||||||
| 8. | Procter & Gamble Co. (The) | 1.3 | ||||||
| 9. | JPMorgan Chase & Co. | 1.3 | ||||||
| 10. | Wells Fargo & Co. | 1.3 | ||||||
PORTFOLIO COMPOSITION BY SECTOR**** | ||||
| Information Technology | 18.4 | % | ||
| Financials | 15.9 | |||
| Health Care | 12.8 | |||
| Consumer Discretionary | 12.3 | |||
| Industrials | 10.8 | |||
| Energy | 10.1 | |||
| Consumer Staples | 9.6 | |||
| Materials | 3.4 | |||
| Utilities | 2.9 | |||
| Telecommunication Services | 2.3 | |||
| Short-Term Investments | 1.5 | |||
| * | The return shown is based on net asset values calculated for shareholder transactions and may differ from the return shown in the financial highlights, which reflects adjustments made to the net asset values in accordance with accounting principles generally accepted in the United States of America. |
| ** | “S&P 500 Index” is a registered service mark of Standard & Poor’s Corporation, which does not sponsor, and is in no way affiliated with, the Portfolio. |
| *** | The adviser seeks to achieve the Portfolio’s objective. There can be no guarantee it will be achieved. |
| **** | Percentages indicated are based on total investments as of December 31, 2013. The Portfolio’s composition is subject to change. |
| 2 | JPMORGAN INSURANCE TRUST | DECEMBER 31, 2013 | ||||
Table of Contents
AVERAGE ANNUAL TOTAL RETURNS AS OF DECEMBER 31, 2013 | ||||||||||||||||
| INCEPTION DATE OF CLASS | 1 YEAR | 5 YEAR | 10 YEAR | |||||||||||||
CLASS 1 SHARES | 5/01/98 | 31.81 | % | 17.52 | % | 7.00 | % | |||||||||
TEN YEAR PERFORMANCE (12/31/03 TO 12/31/13)
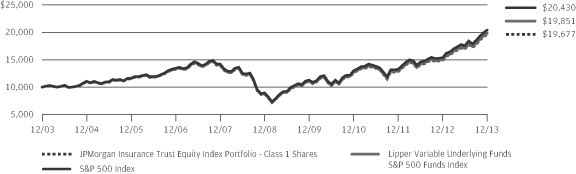
The performance quoted is past performance and is not a guarantee of future results. Mutual funds are subject to certain market risks. Investment returns and principal value of an investment will fluctuate so that an investor’s shares, when redeemed, may be worth more or less than their original cost. Current performance may be higher or lower than the performance data shown. For up-to-date month-end performance information please call 1-800-480-4111.
The graph illustrates comparative performance for $10,000 invested in Class 1 Shares of the JPMorgan Insurance Trust Equity Index Portfolio, the S&P 500 Index and the Lipper Variable Underlying Funds S&P 500 Funds Index from December 31, 2003 to December 31, 2013. The performance of the Portfolio assumes reinvestment of all dividends and capital gain distributions, if any. The performance of the S&P 500 Index does not reflect the deduction of expenses associated with a mutual fund and has been adjusted to reflect reinvestment of all dividends and capital gain distributions of the securities included in the benchmark, if applicable. The performance of the Lipper Variable Underlying Funds S&P 500 Funds Index includes expenses associated with a
mutual fund, such as investment management fees. These expenses are not identical to the expenses incurred by the Portfolio. The S&P 500 Index is an unmanaged index generally representative of the performance of large companies in the U.S. stock market. The Lipper Variable Underlying Funds S&P 500 Funds Index is an index based on the total returns of certain mutual funds within the Portfolio’s designated category as determined by Lipper, Inc. Investors cannot invest directly in an index.
Portfolio performance does not reflect any charges imposed by the Policies or Eligible Plans. If these charges were included, the returns would be lower than shown. Portfolio performance may reflect the waiver of the Portfolio’s fees and reimbursement of expenses for certain periods since the inception date. Without these waivers and reimbursements, performance would have been lower.
The returns shown are based on net asset values calculated for shareholder transactions and may differ from the returns shown in the financial highlights, which reflect adjustments made to the net asset values in accordance with accounting principles generally accepted in the United States of America.
| DECEMBER 31, 2013 | JPMORGAN INSURANCE TRUST | 3 | ||||||
Table of Contents
JPMorgan Insurance Trust Equity Index Portfolio
SCHEDULE OF PORTFOLIO INVESTMENTS
AS OF DECEMBER 31, 2013
| SHARES | SECURITY DESCRIPTION | VALUE($) | ||||||
| Common Stocks — 98.7% |
| ||||||
Consumer Discretionary — 12.4% |
| |||||||
Auto Components — 0.4% |
| |||||||
| 826 | BorgWarner, Inc. | 46,182 | ||||||
| 1,016 | Delphi Automotive plc, (United Kingdom) | 61,092 | ||||||
| 896 | Goodyear Tire & Rubber Co. (The) | 21,369 | ||||||
| 2,486 | Johnson Controls, Inc. | 127,532 | ||||||
|
| |||||||
| 256,175 | ||||||||
|
| |||||||
Automobiles — 0.7% |
| |||||||
| 14,314 | Ford Motor Co. | 220,865 | ||||||
| 4,133 | General Motors Co. (a) | 168,916 | ||||||
| 802 | Harley-Davidson, Inc. | 55,530 | ||||||
|
| |||||||
| 445,311 | ||||||||
|
| |||||||
Distributors — 0.1% |
| |||||||
| 560 | Genuine Parts Co. | 46,586 | ||||||
|
| |||||||
Diversified Consumer Services — 0.1% |
| |||||||
| 992 | H&R Block, Inc. | 28,808 | ||||||
|
| |||||||
Hotels, Restaurants & Leisure — 1.7% |
| |||||||
| 1,590 | Carnival Corp. | 63,870 | ||||||
| 112 | Chipotle Mexican Grill, Inc. (a) | 59,671 | ||||||
| 474 | Darden Restaurants, Inc. | 25,771 | ||||||
| 903 | International Game Technology | 16,399 | ||||||
| 815 | Marriott International, Inc., Class A | 40,228 | ||||||
| 3,611 | McDonald’s Corp. | 350,375 | ||||||
| 2,735 | Starbucks Corp. | 214,397 | ||||||
| 695 | Starwood Hotels & Resorts Worldwide, Inc. | 55,218 | ||||||
| 473 | Wyndham Worldwide Corp. | 34,855 | ||||||
| 293 | Wynn Resorts Ltd. | 56,904 | ||||||
| 1,616 | Yum! Brands, Inc. | 122,186 | ||||||
|
| |||||||
| 1,039,874 | ||||||||
|
| |||||||
Household Durables — 0.4% |
| |||||||
| 1,031 | D.R. Horton, Inc. (a) | 23,012 | ||||||
| 446 | Garmin Ltd., (Switzerland) | 20,614 | ||||||
| 245 | Harman International Industries, Inc. | 20,053 | ||||||
| 512 | Leggett & Platt, Inc. | 15,842 | ||||||
| 607 | Lennar Corp., Class A | 24,013 | ||||||
| 221 | Mohawk Industries, Inc. (a) | 32,907 | ||||||
| 1,042 | Newell Rubbermaid, Inc. | 33,771 | ||||||
| 1,251 | PulteGroup, Inc. | 25,483 | ||||||
| 285 | Whirlpool Corp. | 44,705 | ||||||
|
| |||||||
| 240,400 | ||||||||
|
| |||||||
Internet & Catalog Retail — 1.5% |
| |||||||
| 1,345 | Amazon.com, Inc. (a) | 536,372 | ||||||
| 374 | Expedia, Inc. | 26,053 | ||||||
| 215 | Netflix, Inc. (a) | 79,156 | ||||||
| SHARES | SECURITY DESCRIPTION | VALUE($) | ||||||
Internet & Catalog Retail — Continued |
| |||||||
| 187 | priceline.com, Inc. (a) | 217,369 | ||||||
| 402 | TripAdvisor, Inc. (a) | 33,298 | ||||||
|
| |||||||
| 892,248 | ||||||||
|
| |||||||
Leisure Equipment & Products — 0.1% |
| |||||||
| 419 | Hasbro, Inc. | 23,049 | ||||||
| 1,228 | Mattel, Inc. | 58,429 | ||||||
|
| |||||||
| 81,478 | ||||||||
|
| |||||||
Media — 3.7% |
| |||||||
| 777 | Cablevision Systems Corp., Class A | 13,932 | ||||||
| 2,025 | CBS Corp. (Non-Voting), Class B | 129,073 | ||||||
| 9,457 | Comcast Corp., Class A | 491,433 | ||||||
| 1,773 | DIRECTV (a) | 122,497 | ||||||
| 819 | Discovery Communications, Inc., Class A (a) | 74,054 | ||||||
| 823 | Gannett Co., Inc. | 24,344 | ||||||
| 16 | Graham Holdings Co., Class B (a) | 10,613 | ||||||
| 1,511 | Interpublic Group of Cos., Inc. (The) | 26,745 | ||||||
| 1,807 | News Corp., Class A (a) | 32,562 | ||||||
| 934 | Omnicom Group, Inc. | 69,462 | ||||||
| 398 | Scripps Networks Interactive, Inc., Class A | 34,391 | ||||||
| 1,023 | Time Warner Cable, Inc. | 138,616 | ||||||
| 3,283 | Time Warner, Inc. | 228,891 | ||||||
| 7,121 | Twenty-First Century Fox, Inc., Class A | 250,517 | ||||||
| 1,473 | Viacom, Inc., Class B | 128,652 | ||||||
| 5,931 | Walt Disney Co. (The) | 453,128 | ||||||
|
| |||||||
| 2,228,910 | ||||||||
|
| |||||||
Multiline Retail — 0.7% |
| |||||||
| 1,069 | Dollar General Corp. (a) | 64,482 | ||||||
| 755 | Dollar Tree, Inc. (a) | 42,597 | ||||||
| 351 | Family Dollar Stores, Inc. | 22,805 | ||||||
| 730 | Kohl’s Corp. | 41,428 | ||||||
| 1,337 | Macy’s, Inc. | 71,396 | ||||||
| 519 | Nordstrom, Inc. | 32,074 | ||||||
| 2,294 | Target Corp. | 145,141 | ||||||
|
| |||||||
| 419,923 | ||||||||
|
| |||||||
Specialty Retail — 2.2% |
| |||||||
| 234 | AutoNation, Inc. (a) | 11,628 | ||||||
| 124 | AutoZone, Inc. (a) | 59,265 | ||||||
| 779 | Bed Bath & Beyond, Inc. (a) | 62,554 | ||||||
| 992 | Best Buy Co., Inc. | 39,561 | ||||||
| 811 | CarMax, Inc. (a) | 38,133 | ||||||
| 424 | GameStop Corp., Class A | 20,886 | ||||||
| 961 | Gap, Inc. (The) | 37,556 | ||||||
| 5,110 | Home Depot, Inc. (The) | 420,757 | ||||||
| 885 | L Brands, Inc. | 54,737 | ||||||
SEE NOTES TO FINANCIAL STATEMENTS.
| 4 | JPMORGAN INSURANCE TRUST | DECEMBER 31, 2013 | ||||
Table of Contents
| SHARES | SECURITY DESCRIPTION | VALUE($) | ||||||
| Common Stocks — Continued |
| ||||||
Specialty Retail — Continued |
| |||||||
| 3,795 | Lowe’s Cos., Inc. | 188,042 | ||||||
| 389 | O’Reilly Automotive, Inc. (a) | 50,068 | ||||||
| 376 | PetSmart, Inc. | 27,354 | ||||||
| 786 | Ross Stores, Inc. | 58,895 | ||||||
| 2,397 | Staples, Inc. | 38,088 | ||||||
| 400 | Tiffany & Co. | 37,112 | ||||||
| 2,581 | TJX Cos., Inc. | 164,487 | ||||||
| 396 | Urban Outfitters, Inc. (a) | 14,692 | ||||||
|
| |||||||
| 1,323,815 | ||||||||
|
| |||||||
Textiles, Apparel & Luxury Goods — 0.8% |
| |||||||
| 1,018 | Coach, Inc. | 57,140 | ||||||
| 178 | Fossil Group, Inc. (a) | 21,349 | ||||||
| 651 | Michael Kors Holdings Ltd., (Hong Kong) (a) | 52,855 | ||||||
| 2,712 | NIKE, Inc., Class B | 213,272 | ||||||
| 296 | PVH Corp. | 40,262 | ||||||
| 216 | Ralph Lauren Corp. | 38,139 | ||||||
| 1,280 | V.F. Corp. | 79,795 | ||||||
|
| |||||||
| 502,812 | ||||||||
|
| |||||||
Total Consumer Discretionary | 7,506,340 | |||||||
|
| |||||||
Consumer Staples — 9.6% |
| |||||||
Beverages — 2.1% |
| |||||||
| 592 | Beam, Inc. | 40,292 | ||||||
| 588 | Brown-Forman Corp., Class B | 44,435 | ||||||
| 13,782 | Coca-Cola Co. (The) | 569,334 | ||||||
| 876 | Coca-Cola Enterprises, Inc. | 38,658 | ||||||
| 605 | Constellation Brands, Inc., Class A (a) | 42,580 | ||||||
| 728 | Dr. Pepper Snapple Group, Inc. | 35,468 | ||||||
| 574 | Molson Coors Brewing Co., Class B | 32,230 | ||||||
| 493 | Monster Beverage Corp. (a) | 33,411 | ||||||
| 5,565 | PepsiCo, Inc. | 461,561 | ||||||
|
| |||||||
| 1,297,969 | ||||||||
|
| |||||||
Food & Staples Retailing — 2.3% |
| |||||||
| 1,586 | Costco Wholesale Corp. | 188,750 | ||||||
| 4,319 | CVS Caremark Corp. | 309,111 | ||||||
| 1,889 | Kroger Co. (The) | 74,672 | ||||||
| 896 | Safeway, Inc. | 29,183 | ||||||
| 2,111 | Sysco Corp. | 76,207 | ||||||
| 3,160 | Walgreen Co. | 181,510 | ||||||
| 5,871 | Wal-Mart Stores, Inc. | 461,989 | ||||||
| 1,350 | Whole Foods Market, Inc. | 78,071 | ||||||
|
| |||||||
| 1,399,493 | ||||||||
|
| |||||||
Food Products — 1.5% |
| |||||||
| 2,388 | Archer-Daniels-Midland Co. | 103,639 | ||||||
| 652 | Campbell Soup Co. | 28,218 | ||||||
| SHARES | SECURITY DESCRIPTION | VALUE($) | ||||||
Food Products — Continued | �� | |||||||
| 1,531 | ConAgra Foods, Inc. | 51,595 | ||||||
| 2,302 | General Mills, Inc. | 114,893 | ||||||
| 544 | Hershey Co. (The) | 52,893 | ||||||
| 488 | Hormel Foods Corp. | 22,043 | ||||||
| 382 | JM Smucker Co. (The) | 39,583 | ||||||
| 933 | Kellogg Co. | 56,978 | ||||||
| 2,162 | Kraft Foods Group, Inc. | 116,575 | ||||||
| 479 | McCormick & Co., Inc. (Non-Voting) | 33,013 | ||||||
| 733 | Mead Johnson Nutrition Co. | 61,396 | ||||||
| 6,364 | Mondelez International, Inc., Class A | 224,649 | ||||||
| 986 | Tyson Foods, Inc., Class A | 32,992 | ||||||
|
| |||||||
| 938,467 | ||||||||
|
| |||||||
Household Products — 2.0% |
| |||||||
| 468 | Clorox Co. (The) | 43,412 | ||||||
| 3,190 | Colgate-Palmolive Co. | 208,020 | ||||||
| 1,385 | Kimberly-Clark Corp. | 144,677 | ||||||
| 9,864 | Procter & Gamble Co. (The) | 803,028 | ||||||
|
| |||||||
| 1,199,137 | ||||||||
|
| |||||||
Personal Products — 0.2% |
| |||||||
| 1,574 | Avon Products, Inc. | 27,104 | ||||||
| 929 | Estee Lauder Cos., Inc. (The), Class A | 69,972 | ||||||
|
| |||||||
| 97,076 | ||||||||
|
| |||||||
Tobacco — 1.5% |
| |||||||
| 7,258 | Altria Group, Inc. | 278,634 | ||||||
| 1,337 | Lorillard, Inc. | 67,759 | ||||||
| 5,814 | Philip Morris International, Inc. | 506,574 | ||||||
| 1,138 | Reynolds American, Inc. | 56,889 | ||||||
|
| |||||||
| 909,856 | ||||||||
|
| |||||||
Total Consumer Staples | 5,841,998 | |||||||
|
| |||||||
Energy — 10.1% |
| |||||||
Energy Equipment & Services — 1.8% |
| |||||||
| 1,608 | Baker Hughes, Inc. | 88,858 | ||||||
| 863 | Cameron International Corp. (a) | 51,374 | ||||||
| 252 | Diamond Offshore Drilling, Inc. | 14,344 | ||||||
| 848 | Ensco plc, (United Kingdom), Class A | 48,489 | ||||||
| 859 | FMC Technologies, Inc. (a) | 44,848 | ||||||
| 3,078 | Halliburton Co. | 156,208 | ||||||
| 389 | Helmerich & Payne, Inc. | 32,707 | ||||||
| 943 | Nabors Industries Ltd., (Bermuda) | 16,022 | ||||||
| 1,554 | National Oilwell Varco, Inc. | 123,590 | ||||||
| 920 | Noble Corp. plc, (United Kingdom) | 34,472 | ||||||
| 451 | Rowan Cos. plc, Class A (a) | 15,947 | ||||||
| 4,779 | Schlumberger Ltd. | 430,636 | ||||||
SEE NOTES TO FINANCIAL STATEMENTS.
| DECEMBER 31, 2013 | JPMORGAN INSURANCE TRUST | 5 | ||||||
Table of Contents
JPMorgan Insurance Trust Equity Index Portfolio
SCHEDULE OF PORTFOLIO INVESTMENTS
AS OF DECEMBER 31, 2013 (continued)
| SHARES | SECURITY DESCRIPTION | VALUE($) | ||||||
| Common Stocks — Continued |
| ||||||
Energy Equipment & Services — Continued |
| |||||||
| 1,230 | Transocean Ltd., (Switzerland) | 60,787 | ||||||
|
| |||||||
| 1,118,282 | ||||||||
|
| |||||||
Oil, Gas & Consumable Fuels — 8.3% |
| |||||||
| 1,826 | Anadarko Petroleum Corp. | 144,838 | ||||||
| 1,449 | Apache Corp. | 124,527 | ||||||
| 1,528 | Cabot Oil & Gas Corp. | 59,225 | ||||||
| 1,834 | Chesapeake Energy Corp. | 49,775 | ||||||
| 6,979 | Chevron Corp. | 871,747 | ||||||
| 4,446 | ConocoPhillips | 314,110 | ||||||
| 831 | CONSOL Energy, Inc. | 31,611 | ||||||
| 1,331 | Denbury Resources, Inc. (a) | 21,868 | ||||||
| 1,385 | Devon Energy Corp. | 85,690 | ||||||
| 991 | EOG Resources, Inc. | 166,330 | ||||||
| 547 | EQT Corp. | 49,110 | ||||||
| 15,853 | Exxon Mobil Corp. | 1,604,324 | ||||||
| 1,032 | Hess Corp. | 85,656 | ||||||
| 2,443 | Kinder Morgan, Inc. | 87,948 | ||||||
| 2,528 | Marathon Oil Corp. | 89,238 | ||||||
| 1,092 | Marathon Petroleum Corp. | 100,169 | ||||||
| 638 | Murphy Oil Corp. | 41,394 | ||||||
| 494 | Newfield Exploration Co. (a) | 12,167 | ||||||
| 1,304 | Noble Energy, Inc. | 88,815 | ||||||
| 2,925 | Occidental Petroleum Corp. | 278,168 | ||||||
| 979 | Peabody Energy Corp. | 19,120 | ||||||
| 2,176 | Phillips 66 | 167,835 | ||||||
| 518 | Pioneer Natural Resources Co. | 95,348 | ||||||
| 651 | QEP Resources, Inc. | 19,953 | ||||||
| 593 | Range Resources Corp. | 49,996 | ||||||
| 1,273 | Southwestern Energy Co. (a) | 50,067 | ||||||
| 2,432 | Spectra Energy Corp. | 86,628 | ||||||
| 482 | Tesoro Corp. | 28,197 | ||||||
| 1,958 | Valero Energy Corp. | 98,683 | ||||||
| 2,480 | Williams Cos., Inc. (The) | 95,654 | ||||||
| 729 | WPX Energy, Inc. (a) | 14,857 | ||||||
|
| |||||||
| 5,033,048 | ||||||||
|
| |||||||
Total Energy | 6,151,330 | |||||||
|
| |||||||
Financials — 16.0% |
| |||||||
Capital Markets — 2.2% |
| |||||||
| 706 | Ameriprise Financial, Inc. | 81,225 | ||||||
| 4,168 | Bank of New York Mellon Corp. (The) | 145,630 | ||||||
| 461 | BlackRock, Inc. | 145,893 | ||||||
| 4,211 | Charles Schwab Corp. (The) | 109,486 | ||||||
| 1,042 | E*TRADE Financial Corp. (a) | 20,465 | ||||||
| 1,465 | Franklin Resources, Inc. | 84,574 | ||||||
| SHARES | SECURITY DESCRIPTION | VALUE($) | ||||||
Capital Markets — Continued |
| |||||||
| 1,530 | Goldman Sachs Group, Inc. (The) | 271,208 | ||||||
| 1,609 | Invesco Ltd. | 58,568 | ||||||
| 385 | Legg Mason, Inc. | 16,740 | ||||||
| 5,028 | Morgan Stanley | 157,678 | ||||||
| 815 | Northern Trust Corp. | 50,440 | ||||||
| 1,593 | State Street Corp. | 116,910 | ||||||
| 947 | T. Rowe Price Group, Inc. | 79,330 | ||||||
|
| |||||||
| 1,338,147 | ||||||||
|
| |||||||
Commercial Banks — 2.8% |
| |||||||
| 2,558 | BB&T Corp. | 95,464 | ||||||
| 664 | Comerica, Inc. | 31,567 | ||||||
| 3,204 | Fifth Third Bancorp | 67,380 | ||||||
| 3,014 | Huntington Bancshares, Inc. | 29,085 | ||||||
| 3,254 | KeyCorp | 43,669 | ||||||
| 473 | M&T Bank Corp. | 55,067 | ||||||
| 1,931 | PNC Financial Services Group, Inc. (The) | 149,807 | ||||||
| 4,999 | Regions Financial Corp. | 49,440 | ||||||
| 1,942 | SunTrust Banks, Inc. | 71,485 | ||||||
| 6,628 | U.S. Bancorp | 267,771 | ||||||
| 17,395 | Wells Fargo & Co. | 789,733 | ||||||
| 672 | Zions Bancorporation | 20,133 | ||||||
|
| |||||||
| 1,670,601 | ||||||||
|
| |||||||
Consumer Finance — 1.0% |
| |||||||
| 3,343 | American Express Co. | 303,311 | ||||||
| 2,092 | Capital One Financial Corp. | 160,268 | ||||||
| 1,738 | Discover Financial Services | 97,241 | ||||||
| 1,583 | SLM Corp. | 41,601 | ||||||
|
| |||||||
| 602,421 | ||||||||
|
| |||||||
Diversified Financial Services — 3.9% |
| |||||||
| 38,707 | Bank of America Corp. | 602,668 | ||||||
| 11,007 | Citigroup, Inc. | 573,575 | ||||||
| 1,144 | CME Group, Inc. | 89,758 | ||||||
| 417 | IntercontinentalExchange Group, Inc. | 93,792 | ||||||
| 13,644 | JPMorgan Chase & Co. (q) | 797,901 | ||||||
| 1,138 | Leucadia National Corp. | 32,251 | ||||||
| 983 | McGraw Hill Financial, Inc. | 76,870 | ||||||
| 687 | Moody’s Corp. | 53,909 | ||||||
| 420 | NASDAQ OMX Group, Inc. (The) | 16,716 | ||||||
|
| |||||||
| 2,337,440 | ||||||||
|
| |||||||
Insurance — 4.2% |
| |||||||
| 1,234 | ACE Ltd., (Switzerland) | 127,756 | ||||||
| 1,691 | Aflac, Inc. | 112,959 | ||||||
| 1,651 | Allstate Corp. (The) | 90,045 | ||||||
SEE NOTES TO FINANCIAL STATEMENTS.
| 6 | JPMORGAN INSURANCE TRUST | DECEMBER 31, 2013 | ||||
Table of Contents
| SHARES | SECURITY DESCRIPTION | VALUE($) | ||||||
| Common Stocks — Continued |
| ||||||
Insurance — Continued |
| |||||||
| 5,343 | American International Group, Inc. | 272,760 | ||||||
| 1,093 | Aon plc, (United Kingdom) | 91,692 | ||||||
| 264 | Assurant, Inc. | 17,522 | ||||||
| 6,532 | Berkshire Hathaway, Inc., Class B (a) | 774,434 | ||||||
| 914 | Chubb Corp. (The) | 88,320 | ||||||
| 535 | Cincinnati Financial Corp. | 28,018 | ||||||
| 1,794 | Genworth Financial, Inc., Class A (a) | 27,861 | ||||||
| 1,622 | Hartford Financial Services Group, Inc. | 58,765 | ||||||
| 952 | Lincoln National Corp. | 49,142 | ||||||
| 1,110 | Loews Corp. | 53,546 | ||||||
| 1,991 | Marsh & McLennan Cos., Inc. | 96,285 | ||||||
| 4,068 | MetLife, Inc. | 219,346 | ||||||
| 993 | Principal Financial Group, Inc. | 48,965 | ||||||
| 2,003 | Progressive Corp. (The) | 54,622 | ||||||
| 1,680 | Prudential Financial, Inc. | 154,930 | ||||||
| 328 | Torchmark Corp. | 25,633 | ||||||
| 1,321 | Travelers Cos., Inc. (The) | 119,603 | ||||||
| 948 | Unum Group | 33,256 | ||||||
| 1,026 | XL Group plc, (Ireland) | 32,668 | ||||||
|
| |||||||
| 2,578,128 | ||||||||
|
| |||||||
Real Estate Investment Trusts (REITs) — 1.8% |
| |||||||
| 1,432 | American Tower Corp. | 114,302 | ||||||
| 530 | Apartment Investment & Management Co., Class A | 13,732 | ||||||
| 441 | AvalonBay Communities, Inc. | 52,139 | ||||||
| 555 | Boston Properties, Inc. | 55,705 | ||||||
| 1,216 | Equity Residential | 63,074 | ||||||
| 1,951 | General Growth Properties, Inc. | 39,157 | ||||||
| 1,656 | HCP, Inc. | 60,146 | ||||||
| 1,048 | Health Care REIT, Inc. | 56,141 | ||||||
| 2,745 | Host Hotels & Resorts, Inc. | 53,363 | ||||||
| 1,487 | Kimco Realty Corp. | 29,368 | ||||||
| 510 | Macerich Co. (The) | 30,034 | ||||||
| 642 | Plum Creek Timber Co., Inc. | 29,859 | ||||||
| 1,810 | Prologis, Inc. | 66,880 | ||||||
| 525 | Public Storage | 79,023 | ||||||
| 1,126 | Simon Property Group, Inc. | 171,332 | ||||||
| 1,067 | Ventas, Inc. | 61,118 | ||||||
| 631 | Vornado Realty Trust | 56,027 | ||||||
| 2,115 | Weyerhaeuser Co. | 66,771 | ||||||
|
| |||||||
| 1,098,171 | ||||||||
|
| |||||||
Real Estate Management & Development — 0.0% (g) |
| |||||||
| 1,010 | CBRE Group, Inc., Class A (a) | 26,563 | ||||||
|
| |||||||
| SHARES | SECURITY DESCRIPTION | VALUE($) | ||||||
Thrifts & Mortgage Finance — 0.1% |
| |||||||
| 1,726 | Hudson City Bancorp, Inc. | 16,276 | ||||||
| 1,153 | People’s United Financial, Inc. | 17,434 | ||||||
|
| |||||||
| 33,710 | ||||||||
|
| |||||||
Total Financials | 9,685,181 | |||||||
|
| |||||||
Health Care — 12.8% |
| |||||||
Biotechnology — 2.4% |
| |||||||
| 712 | Alexion Pharmaceuticals, Inc. (a) | 94,739 | ||||||
| 2,737 | Amgen, Inc. | 312,456 | ||||||
| 857 | Biogen Idec, Inc. (a) | 239,746 | ||||||
| 1,495 | Celgene Corp. (a) | 252,595 | ||||||
| 5,564 | Gilead Sciences, Inc. (a) | 418,135 | ||||||
| 285 | Regeneron Pharmaceuticals, Inc. (a) | 78,443 | ||||||
| 848 | Vertex Pharmaceuticals, Inc. (a) | 63,006 | ||||||
|
| |||||||
| 1,459,120 | ||||||||
|
| |||||||
Health Care Equipment & Supplies — 2.0% |
| |||||||
| 5,611 | Abbott Laboratories | 215,069 | ||||||
| 1,969 | Baxter International, Inc. | 136,944 | ||||||
| 704 | Becton, Dickinson & Co. | 77,785 | ||||||
| 4,845 | Boston Scientific Corp. (a) | 58,237 | ||||||
| 283 | C.R. Bard, Inc. | 37,905 | ||||||
| 767 | CareFusion Corp. (a) | 30,542 | ||||||
| 1,669 | Covidien plc, (Ireland) | 113,659 | ||||||
| 518 | DENTSPLY International, Inc. | 25,112 | ||||||
| 397 | Edwards Lifesciences Corp. (a) | 26,107 | ||||||
| 138 | Intuitive Surgical, Inc. (a) | 53,003 | ||||||
| 3,623 | Medtronic, Inc. | 207,924 | ||||||
| 1,059 | St. Jude Medical, Inc. | 65,605 | ||||||
| 1,071 | Stryker Corp. | 80,475 | ||||||
| 384 | Varian Medical Systems, Inc. (a) | 29,833 | ||||||
| 620 | Zimmer Holdings, Inc. | 57,778 | ||||||
|
| |||||||
| 1,215,978 | ||||||||
|
| |||||||
Health Care Providers & Services — 2.0% |
| |||||||
| 1,334 | Aetna, Inc. | 91,499 | ||||||
| 835 | AmerisourceBergen Corp. | 58,709 | ||||||
| 1,239 | Cardinal Health, Inc. | 82,778 | ||||||
| 1,003 | Cigna Corp. | 87,742 | ||||||
| 641 | DaVita HealthCare Partners, Inc. (a) | 40,620 | ||||||
| 2,924 | Express Scripts Holding Co. (a) | 205,382 | ||||||
| 566 | Humana, Inc. | 58,422 | ||||||
| 317 | Laboratory Corp. of America Holdings (a) | 28,964 | ||||||
| 834 | McKesson Corp. | 134,608 | ||||||
| 303 | Patterson Cos., Inc. | 12,484 | ||||||
| 528 | Quest Diagnostics, Inc. | 28,269 | ||||||
| 360 | Tenet Healthcare Corp. (a) | 15,163 | ||||||
SEE NOTES TO FINANCIAL STATEMENTS.
| DECEMBER 31, 2013 | JPMORGAN INSURANCE TRUST | 7 | ||||||
Table of Contents
JPMorgan Insurance Trust Equity Index Portfolio
SCHEDULE OF PORTFOLIO INVESTMENTS
AS OF DECEMBER 31, 2013 (continued)
| SHARES | SECURITY DESCRIPTION | VALUE($) | ||||||
| Common Stocks — Continued |
| ||||||
Health Care Providers & Services — Continued |
| |||||||
| 3,653 | UnitedHealth Group, Inc. | 275,071 | ||||||
| 1,072 | WellPoint, Inc. | 99,042 | ||||||
|
| |||||||
| 1,218,753 | ||||||||
|
| |||||||
Health Care Technology — 0.1% |
| |||||||
| 1,071 | Cerner Corp. (a) | 59,698 | ||||||
|
| |||||||
Life Sciences Tools & Services — 0.5% |
| |||||||
| 1,200 | Agilent Technologies, Inc. | 68,628 | ||||||
| 627 | Life Technologies Corp. (a) | 47,526 | ||||||
| 408 | PerkinElmer, Inc. | 16,822 | ||||||
| 1,311 | Thermo Fisher Scientific, Inc. | 145,980 | ||||||
| 309 | Waters Corp. (a) | 30,900 | ||||||
|
| |||||||
| 309,856 | ||||||||
|
| |||||||
Pharmaceuticals — 5.8% |
| |||||||
| 5,773 | AbbVie, Inc. | 304,872 | ||||||
| 632 | Actavis plc (a) | 106,176 | ||||||
| 1,078 | Allergan, Inc. | 119,744 | ||||||
| 5,975 | Bristol-Myers Squibb Co. | 317,571 | ||||||
| 3,598 | Eli Lilly & Co. | 183,498 | ||||||
| 860 | Forest Laboratories, Inc. (a) | 51,626 | ||||||
| 602 | Hospira, Inc. (a) | 24,851 | ||||||
| 10,239 | Johnson & Johnson | 937,790 | ||||||
| 10,604 | Merck & Co., Inc. | 530,730 | ||||||
| 1,389 | Mylan, Inc. (a) | 60,283 | ||||||
| 483 | Perrigo Co. plc | 74,121 | ||||||
| 23,520 | Pfizer, Inc. | 720,418 | ||||||
| 1,815 | Zoetis, Inc. | 59,332 | ||||||
|
| |||||||
| 3,491,012 | ||||||||
|
| |||||||
Total Health Care | 7,754,417 | |||||||
|
| |||||||
Industrials — 10.8% |
| |||||||
Aerospace & Defense — 2.7% |
| |||||||
| 2,509 | Boeing Co. (The) | 342,453 | ||||||
| 1,214 | General Dynamics Corp. | 115,998 | ||||||
| 2,848 | Honeywell International, Inc. | 260,222 | ||||||
| 322 | L-3 Communications Holdings, Inc. | 34,409 | ||||||
| 976 | Lockheed Martin Corp. | 145,092 | ||||||
| 806 | Northrop Grumman Corp. | 92,376 | ||||||
| 527 | Precision Castparts Corp. | 141,921 | ||||||
| 1,159 | Raytheon Co. | 105,121 | ||||||
| 490 | Rockwell Collins, Inc. | 36,221 | ||||||
| 1,020 | Textron, Inc. | 37,495 | ||||||
| 3,063 | United Technologies Corp. | 348,569 | ||||||
|
| |||||||
| 1,659,877 | ||||||||
|
| |||||||
| SHARES | SECURITY DESCRIPTION | VALUE($) | ||||||
Air Freight & Logistics — 0.8% |
| |||||||
| 550 | C.H. Robinson Worldwide, Inc. | 32,087 | ||||||
| 746 | Expeditors International of Washington, Inc. | 33,010 | ||||||
| 1,080 | FedEx Corp. | 155,272 | ||||||
| 2,594 | United Parcel Service, Inc., Class B | 272,578 | ||||||
|
| |||||||
| 492,947 | ||||||||
|
| |||||||
Airlines — 0.2% |
| |||||||
| 3,105 | Delta Air Lines, Inc. | 85,294 | ||||||
| 2,528 | Southwest Airlines Co. | 47,628 | ||||||
|
| |||||||
| 132,922 | ||||||||
|
| |||||||
Building Products — 0.1% |
| |||||||
| 325 | Allegion plc, (Ireland) (a) | 14,362 | ||||||
| 1,295 | Masco Corp. | 29,487 | ||||||
|
| |||||||
| 43,849 | ||||||||
|
| |||||||
Commercial Services & Supplies — 0.5% |
| |||||||
| 726 | ADT Corp. (The) | 29,381 | ||||||
| 365 | Cintas Corp. | 21,750 | ||||||
| 618 | Iron Mountain, Inc. | 18,756 | ||||||
| 733 | Pitney Bowes, Inc. | 17,079 | ||||||
| 980 | Republic Services, Inc. | 32,536 | ||||||
| 311 | Stericycle, Inc. (a) | 36,129 | ||||||
| 1,689 | Tyco International Ltd., (Switzerland) | 69,317 | ||||||
| 1,583 | Waste Management, Inc. | 71,029 | ||||||
|
| |||||||
| 295,977 | ||||||||
|
| |||||||
Construction & Engineering — 0.2% |
| |||||||
| 593 | Fluor Corp. | 47,612 | ||||||
| 478 | Jacobs Engineering Group, Inc. (a) | 30,109 | ||||||
| 783 | Quanta Services, Inc. (a) | 24,712 | ||||||
|
| |||||||
| 102,433 | ||||||||
|
| |||||||
Electrical Equipment — 0.8% |
| |||||||
| 888 | AMETEK, Inc. | 46,771 | ||||||
| 1,722 | Eaton Corp. plc, (Ireland) | 131,079 | ||||||
| 2,555 | Emerson Electric Co. | 179,310 | ||||||
| 503 | Rockwell Automation, Inc. | 59,434 | ||||||
| 360 | Roper Industries, Inc. | 49,925 | ||||||
|
| |||||||
| 466,519 | ||||||||
|
| |||||||
Industrial Conglomerates — 2.5% |
| |||||||
| 2,321 | 3M Co. | 325,520 | ||||||
| 2,176 | Danaher Corp. | 167,987 | ||||||
| 36,715 | General Electric Co. | 1,029,122 | ||||||
|
| |||||||
| 1,522,629 | ||||||||
|
| |||||||
Machinery — 1.7% |
| |||||||
| 2,309 | Caterpillar, Inc. | 209,680 | ||||||
SEE NOTES TO FINANCIAL STATEMENTS.
| 8 | JPMORGAN INSURANCE TRUST | DECEMBER 31, 2013 | ||||
Table of Contents
| SHARES | SECURITY DESCRIPTION | VALUE($) | ||||||
| Common Stocks — Continued |
| ||||||
Machinery — Continued |
| |||||||
| 632 | Cummins, Inc. | 89,093 | ||||||
| 1,389 | Deere & Co. | 126,857 | ||||||
| 618 | Dover Corp. | 59,662 | ||||||
| 506 | Flowserve Corp. | 39,888 | ||||||
| 1,482 | Illinois Tool Works, Inc. | 124,607 | ||||||
| 972 | Ingersoll-Rand plc, (Ireland) | 59,875 | ||||||
| 386 | Joy Global, Inc. | 22,577 | ||||||
| 1,285 | PACCAR, Inc. | 76,033 | ||||||
| 402 | Pall Corp. | 34,311 | ||||||
| 542 | Parker Hannifin Corp. | 69,723 | ||||||
| 723 | Pentair Ltd., (Switzerland) | 56,155 | ||||||
| 211 | Snap-on, Inc. | 23,109 | ||||||
| 563 | Stanley Black & Decker, Inc. | 45,429 | ||||||
| 670 | Xylem, Inc. | 23,182 | ||||||
|
| |||||||
| 1,060,181 | ||||||||
|
| |||||||
Professional Services — 0.2% |
| |||||||
| 138 | Dun & Bradstreet Corp. (The) | 16,939 | ||||||
| 442 | Equifax, Inc. | 30,538 | ||||||
| 918 | Nielsen Holdings N.V. | 42,127 | ||||||
| 503 | Robert Half International, Inc. | 21,121 | ||||||
|
| |||||||
| 110,725 | ||||||||
|
| |||||||
Road & Rail — 0.9% |
| |||||||
| 3,679 | CSX Corp. | 105,845 | ||||||
| 400 | Kansas City Southern | 49,532 | ||||||
| 1,121 | Norfolk Southern Corp. | 104,062 | ||||||
| 191 | Ryder System, Inc. | 14,092 | ||||||
| 1,671 | Union Pacific Corp. | 280,728 | ||||||
|
| |||||||
| 554,259 | ||||||||
|
| |||||||
Trading Companies & Distributors — 0.2% |
| |||||||
| 991 | Fastenal Co. | 47,082 | ||||||
| 224 | W.W. Grainger, Inc. | 57,214 | ||||||
|
| |||||||
| 104,296 | ||||||||
|
| |||||||
Total Industrials | 6,546,614 | |||||||
|
| |||||||
Information Technology — 18.4% |
| |||||||
Communications Equipment — 1.7% |
| |||||||
| 19,403 | Cisco Systems, Inc. | 435,597 | ||||||
| 282 | F5 Networks, Inc. (a) | 25,623 | ||||||
| 388 | Harris Corp. | 27,086 | ||||||
| 1,833 | Juniper Networks, Inc. (a) | 41,371 | ||||||
| 836 | Motorola Solutions, Inc. | 56,430 | ||||||
| 6,131 | QUALCOMM, Inc. | 455,227 | ||||||
|
| |||||||
| 1,041,334 | ||||||||
|
| |||||||
| SHARES | SECURITY DESCRIPTION | VALUE($) | ||||||
Computers & Peripherals — 4.1% |
| |||||||
| 3,265 | Apple, Inc. | 1,832,024 | ||||||
| 7,468 | EMC Corp. | 187,820 | ||||||
| 6,974 | Hewlett-Packard Co. | 195,133 | ||||||
| 1,237 | NetApp, Inc. | 50,890 | ||||||
| 820 | SanDisk Corp. | 57,843 | ||||||
| 1,184 | Seagate Technology plc, (Ireland) | 66,493 | ||||||
| 764 | Western Digital Corp. | 64,100 | ||||||
|
| |||||||
| 2,454,303 | ||||||||
|
| |||||||
Electronic Equipment, Instruments & Components — 0.4% |
| |||||||
| 574 | Amphenol Corp., Class A | 51,189 | ||||||
| 5,252 | Corning, Inc. | 93,591 | ||||||
| 514 | FLIR Systems, Inc. | 15,471 | ||||||
| 671 | Jabil Circuit, Inc. | 11,702 | ||||||
| 1,489 | TE Connectivity Ltd., (Switzerland) | 82,059 | ||||||
|
| |||||||
| 254,012 | ||||||||
|
| |||||||
Internet Software & Services — 3.1% |
| |||||||
| 649 | Akamai Technologies, Inc. (a) | 30,620 | ||||||
| 4,228 | eBay, Inc. (a) | 232,075 | ||||||
| 5,969 | Facebook, Inc., Class A (a) | 326,265 | ||||||
| 1,018 | Google, Inc., Class A (a) | 1,140,883 | ||||||
| 468 | VeriSign, Inc. (a) | 27,977 | ||||||
| 3,424 | Yahoo!, Inc. (a) | 138,467 | ||||||
|
| |||||||
| 1,896,287 | ||||||||
|
| |||||||
IT Services — 3.6% |
| |||||||
| 2,307 | Accenture plc, (Ireland), Class A | 189,681 | ||||||
| 177 | Alliance Data Systems Corp. (a) | 46,539 | ||||||
| 1,747 | Automatic Data Processing, Inc. | 141,175 | ||||||
| 1,098 | Cognizant Technology Solutions Corp., Class A (a) | 110,876 | ||||||
| 534 | Computer Sciences Corp. | 29,840 | ||||||
| 1,057 | Fidelity National Information Services, Inc. | 56,740 | ||||||
| 936 | Fiserv, Inc. (a) | 55,271 | ||||||
| 3,704 | International Business Machines Corp. | 694,759 | ||||||
| 376 | MasterCard, Inc., Class A | 314,133 | ||||||
| 1,179 | Paychex, Inc. | 53,680 | ||||||
| 593 | Teradata Corp. (a) | 26,975 | ||||||
| 606 | Total System Services, Inc. | 20,168 | ||||||
| 1,848 | Visa, Inc., Class A | 411,513 | ||||||
| 2,004 | Western Union Co. (The) | 34,569 | ||||||
|
| |||||||
| 2,185,919 | ||||||||
|
| |||||||
Office Electronics — 0.1% |
| |||||||
| 4,200 | Xerox Corp. | 51,114 | ||||||
|
| |||||||
SEE NOTES TO FINANCIAL STATEMENTS.
| DECEMBER 31, 2013 | JPMORGAN INSURANCE TRUST | 9 | ||||||
Table of Contents
JPMorgan Insurance Trust Equity Index Portfolio
SCHEDULE OF PORTFOLIO INVESTMENTS
AS OF DECEMBER 31, 2013 (continued)
| SHARES | SECURITY DESCRIPTION | VALUE($) | ||||||
| Common Stocks — Continued |
| ||||||
Semiconductors & Semiconductor Equipment — 2.0% |
| |||||||
| 1,165 | Altera Corp. | 37,897 | ||||||
| 1,129 | Analog Devices, Inc. | 57,500 | ||||||
| 4,370 | Applied Materials, Inc. | 77,305 | ||||||
| 1,958 | Broadcom Corp., Class A | 58,055 | ||||||
| 256 | First Solar, Inc. (a) | 13,988 | ||||||
| 18,040 | Intel Corp. | 468,318 | ||||||
| 605 | KLA-Tencor Corp. | 38,998 | ||||||
| 589 | Lam Research Corp. (a) | 32,071 | ||||||
| 850 | Linear Technology Corp. | 38,717 | ||||||
| 1,978 | LSI Corp. | 21,798 | ||||||
| 720 | Microchip Technology, Inc. | 32,220 | ||||||
| 3,817 | Micron Technology, Inc. (a) | 83,058 | ||||||
| 2,100 | NVIDIA Corp. | 33,642 | ||||||
| 3,972 | Texas Instruments, Inc. | 174,411 | ||||||
| 974 | Xilinx, Inc. | 44,726 | ||||||
|
| |||||||
| 1,212,704 | ||||||||
|
| |||||||
Software — 3.4% |
| |||||||
| 1,687 | Adobe Systems, Inc. (a) | 101,018 | ||||||
| 819 | Autodesk, Inc. (a) | 41,220 | ||||||
| 1,179 | CA, Inc. | 39,673 | ||||||
| 676 | Citrix Systems, Inc. (a) | 42,757 | ||||||
| 1,122 | Electronic Arts, Inc. (a) | 25,739 | ||||||
| 1,034 | Intuit, Inc. | 78,915 | ||||||
| 27,568 | Microsoft Corp. | 1,031,870 | ||||||
| 12,735 | Oracle Corp. | 487,241 | ||||||
| 688 | Red Hat, Inc. (a) | 38,556 | ||||||
| 2,013 | Salesforce.com, Inc. (a) | 111,097 | ||||||
| 2,526 | Symantec Corp. | 59,563 | ||||||
|
| |||||||
| 2,057,649 | ||||||||
|
| |||||||
Total Information Technology | 11,153,322 | |||||||
|
| |||||||
Materials — 3.4% |
| |||||||
Chemicals — 2.5% |
| |||||||
| 767 | Air Products & Chemicals, Inc. | 85,735 | ||||||
| 241 | Airgas, Inc. | 26,956 | ||||||
| 208 | CF Industries Holdings, Inc. | 48,472 | ||||||
| 4,401 | Dow Chemical Co. (The) | 195,405 | ||||||
| 3,361 | E.I. du Pont de Nemours & Co. | 218,364 | ||||||
| 559 | Eastman Chemical Co. | 45,111 | ||||||
| 984 | Ecolab, Inc. | 102,602 | ||||||
| 484 | FMC Corp. | 36,523 | ||||||
| 296 | International Flavors & Fragrances, Inc. | 25,450 | ||||||
| 1,585 | LyondellBasell Industries N.V., (Netherlands), Class A | 127,244 | ||||||
| 1,908 | Monsanto Co. | 222,377 | ||||||
| 1,237 | Mosaic Co. (The) | 58,473 | ||||||
| SHARES | SECURITY DESCRIPTION | VALUE($) | ||||||
Chemicals — Continued |
| |||||||
| 515 | PPG Industries, Inc. | 97,675 | ||||||
| 1,068 | Praxair, Inc. | 138,872 | ||||||
| 313 | Sherwin-Williams Co. (The) | 57,436 | ||||||
| 434 | Sigma-Aldrich Corp. | 40,800 | ||||||
|
| |||||||
| 1,527,495 | ||||||||
|
| |||||||
Construction Materials — 0.1% |
| |||||||
| 472 | Vulcan Materials Co. | 28,046 | ||||||
|
| |||||||
Containers & Packaging — 0.2% |
| |||||||
| 351 | Avery Dennison Corp. | 17,617 | ||||||
| 525 | Ball Corp. | 27,121 | ||||||
| 374 | Bemis Co., Inc. | 15,319 | ||||||
| 646 | MeadWestvaco Corp. | 23,857 | ||||||
| 599 | Owens-Illinois, Inc. (a) | 21,432 | ||||||
| 712 | Sealed Air Corp. | 24,244 | ||||||
|
| |||||||
| 129,590 | ||||||||
|
| |||||||
Metals & Mining — 0.5% |
| |||||||
| 3,882 | Alcoa, Inc. | 41,266 | ||||||
| 392 | Allegheny Technologies, Inc. | 13,967 | ||||||
| 556 | Cliffs Natural Resources, Inc. | 14,573 | ||||||
| 3,767 | Freeport-McMoRan Copper & Gold, Inc. | 142,167 | ||||||
| 1,807 | Newmont Mining Corp. | 41,615 | ||||||
| 1,155 | Nucor Corp. | 61,654 | ||||||
| 525 | United States Steel Corp. | 15,487 | ||||||
|
| |||||||
| 330,729 | ||||||||
|
| |||||||
Paper & Forest Products — 0.1% |
| |||||||
| 1,610 | International Paper Co. | 78,938 | ||||||
|
| |||||||
Total Materials | 2,094,798 | |||||||
|
| |||||||
Telecommunication Services — 2.3% |
| |||||||
Diversified Telecommunication Services — 2.1% |
| |||||||
| 19,117 | AT&T, Inc. | 672,154 | ||||||
| 2,145 | CenturyLink, Inc. | 68,318 | ||||||
| 3,627 | Frontier Communications Corp. | 16,865 | ||||||
| 10,385 | Verizon Communications, Inc. | 510,319 | ||||||
| 2,163 | Windstream Holdings, Inc. | 17,261 | ||||||
|
| |||||||
| 1,284,917 | ||||||||
|
| |||||||
Wireless Telecommunication Services — 0.2% |
| |||||||
| 1,212 | Crown Castle International Corp. (a) | 88,997 | ||||||
|
| |||||||
Total Telecommunication Services | 1,373,914 | |||||||
|
| |||||||
Utilities — 2.9% |
| |||||||
Electric Utilities — 1.6% |
| |||||||
| 1,768 | American Electric Power Co., Inc. | 82,636 | ||||||
| 2,562 | Duke Energy Corp. | 176,803 | ||||||
| 1,182 | Edison International | 54,726 | ||||||
SEE NOTES TO FINANCIAL STATEMENTS.
| 10 | JPMORGAN INSURANCE TRUST | DECEMBER 31, 2013 | ||||
Table of Contents
| SHARES | SECURITY DESCRIPTION | VALUE($) | ||||||
| Common Stocks — Continued |
| ||||||
Electric Utilities — Continued |
| |||||||
| 647 | Entergy Corp. | 40,936 | ||||||
| 3,110 | Exelon Corp. | 85,183 | ||||||
| 1,518 | FirstEnergy Corp. | 50,064 | ||||||
| 1,563 | NextEra Energy, Inc. | 133,824 | ||||||
| 1,143 | Northeast Utilities | 48,452 | ||||||
| 906 | Pepco Holdings, Inc. | 17,332 | ||||||
| 399 | Pinnacle West Capital Corp. | 21,115 | ||||||
| 2,287 | PPL Corp. | 68,816 | ||||||
| 3,200 | Southern Co. (The) | 131,552 | ||||||
| 1,806 | Xcel Energy, Inc. | 50,460 | ||||||
|
| |||||||
| 961,899 | ||||||||
|
| |||||||
Gas Utilities — 0.1% |
| |||||||
| 431 | AGL Resources, Inc. | 20,356 | ||||||
| 749 | ONEOK, Inc. | 46,573 | ||||||
|
| |||||||
| 66,929 | ||||||||
|
| |||||||
Independent Power Producers & Energy Traders — 0.1% |
| |||||||
| 2,383 | AES Corp. | 34,578 | ||||||
| 1,174 | NRG Energy, Inc. | 33,717 | ||||||
|
| |||||||
| 68,295 | ||||||||
|
| |||||||
Multi-Utilities — 1.1% |
| |||||||
| 881 | Ameren Corp. | 31,857 | ||||||
| 1,556 | CenterPoint Energy, Inc. | 36,068 | ||||||
| 965 | CMS Energy Corp. | 25,833 | ||||||
| 1,063 | Consolidated Edison, Inc. | 58,763 | ||||||
| 2,106 | Dominion Resources, Inc. | 136,237 | ||||||
| 642 | DTE Energy Co. | 42,622 | ||||||
| 290 | Integrys Energy Group, Inc. | 15,779 | ||||||
| 1,137 | NiSource, Inc. | 37,385 | ||||||
| SHARES | SECURITY DESCRIPTION | VALUE($) | ||||||
Multi-Utilities — Continued |
| |||||||
| 1,630 | PG&E Corp. | 65,656 | ||||||
| 1,836 | Public Service Enterprise Group, Inc. | 58,825 | ||||||
| 510 | SCANA Corp. | 23,934 | ||||||
| 825 | Sempra Energy | 74,052 | ||||||
| 741 | TECO Energy, Inc. | 12,775 | ||||||
| 822 | Wisconsin Energy Corp. | 33,982 | ||||||
|
| |||||||
| 653,768 | ||||||||
|
| |||||||
Total Utilities | 1,750,891 | |||||||
|
| |||||||
Total Common Stocks | 59,858,805 | |||||||
|
| |||||||
| Short-Term Investments— 1.5% |
| ||||||
Investment Company — 1.4% |
| |||||||
| 825,767 | JPMorgan Liquid Assets Money Market Fund, Institutional Class Shares, | 825,767 | ||||||
|
| |||||||
| PRINCIPAL AMOUNT($) | ||||||||
U.S. Treasury Bill — 0.1% |
| |||||||
| 80,000 | U.S. Treasury Bill, 0.045%, 02/06/14 (k) (n) | 79,998 | ||||||
|
| |||||||
Total Short-Term Investments | 905,765 | |||||||
|
| |||||||
Total Investments — 100.2% | 60,764,570 | |||||||
Liabilities in Excess of | (99,507 | ) | ||||||
|
| |||||||
NET ASSETS — 100.0% | $ | 60,665,063 | ||||||
|
| |||||||
Percentages indicated are based on net assets.
| Futures Contracts | ||||||||||||||||
| NUMBER OF CONTRACTS | DESCRIPTION | EXPIRATION DATE | NOTIONAL VALUE AT 12/31/13 | NET UNREALIZED APPRECIATION (DEPRECIATION) | ||||||||||||
Long Futures Outstanding | ||||||||||||||||
| 10 | E-mini S&P 500 | 03/21/14 | $ | 920,550 | $ | 36,030 | ||||||||||
|
| |||||||||||||||
SEE NOTES TO FINANCIAL STATEMENTS.
| DECEMBER 31, 2013 | JPMORGAN INSURANCE TRUST | 11 | ||||||
Table of Contents
JPMorgan Insurance Trust Equity Index Portfolio
NOTES TO SCHEDULE OF PORTFOLIO INVESTMENTS
AS OF DECEMBER 31, 2013
| REIT | — Real Estate Investment Trust. | |
| (a) | — Non-income producing security. | |
| (b) | — Investment in affiliate. Money market fund registered under the Investment Company Act of 1940, as amended, and advised by J.P. Morgan Investment Management Inc. | |
| (g) | — Amount rounds to less than 0.1%. | |
| (k) | — All or a portion of this security is deposited with the broker as collateral for futures or with brokers as initial margin for futures contracts. |
| (l) | — The rate shown is the current yield as of December 31, 2013. | |
| (m) | — All or a portion of this security is reserved and/or pledged with the custodian for current or potential holdings of futures, swaps, options, TBAs, when-issued securities, delayed delivery securities, reverse repurchase agreements, unfunded commitments and/or forward foreign currency exchange contracts. | |
| (n) | — The rate shown is the effective yield at the date of purchase. | |
| (q) | — Investment in affiliate which is a security in the Portfolio’s index. |
SEE NOTES TO FINANCIAL STATEMENTS.
| 12 | JPMORGAN INSURANCE TRUST | DECEMBER 31, 2013 | ||||
Table of Contents
STATEMENT OF ASSETS AND LIABILITIES
AS OF DECEMBER 31, 2013
| Equity Index Portfolio | ||||
ASSETS: | ||||
Investments in non-affiliates, at value | $ | 59,140,902 | ||
Investments in affiliates, at value | 1,623,668 | |||
|
| |||
Total investment securities, at value | 60,764,570 | |||
Cash | 2 | |||
Receivables: | ||||
Dividends from non-affiliates | 81,679 | |||
Dividends from affiliates | 18 | |||
Variation margin on futures contracts | 3,200 | |||
|
| |||
Total Assets | 60,849,469 | |||
|
| |||
LIABILITIES: | ||||
Payables: | ||||
Portfolio shares redeemed | 114,577 | |||
Accrued liabilities: | ||||
Investment advisory fees | 12,630 | |||
Administration fees | 1,238 | |||
Custodian and accounting fees | 15,002 | |||
Trustees’ and Chief Compliance Officer’s fees | 193 | |||
Audit Fees | 32,695 | |||
Other | 8,071 | |||
|
| |||
Total Liabilities | 184,406 | |||
|
| |||
Net Assets | $ | 60,665,063 | ||
|
| |||
NET ASSETS: | ||||
Paid-in-Capital | $ | 38,286,475 | ||
Accumulated undistributed net investment income | 1,014,431 | |||
Accumulated net realized gains (losses) | (3,202,909 | ) | ||
Net unrealized appreciation (depreciation) | 24,567,066 | |||
|
| |||
Total Net Assets | $ | 60,665,063 | ||
|
| |||
Outstanding units of beneficial interest (shares) (unlimited number of shares authorized, no par value): | 3,935,610 | |||
Net asset value, offering and redemption price per share (a): | $ | 15.41 | ||
|
| |||
Cost of investments in non-affiliates | $ | 34,892,383 | ||
Cost of investments in affiliates | 1,341,151 | |||
| (a) | Per share amounts may not recalculate due to rounding of net assets and/or shares outstanding. |
SEE NOTES TO FINANCIAL STATEMENTS.
| DECEMBER 31, 2013 | JPMORGAN INSURANCE TRUST | 13 | ||||||
Table of Contents
STATEMENT OF OPERATIONS
FOR THE YEAR ENDED DECEMBER 31, 2013
Equity Index | ||||
INVESTMENT INCOME: |
| |||
Dividend income from non-affiliates | $ | 1,243,483 | ||
Dividend income from affiliates | 21,633 | |||
Interest income from non-affiliates | 37 | |||
Income from securities lending (net) | 3 | |||
|
| |||
Total investment income | 1,265,156 | |||
|
| |||
EXPENSES: | ||||
Investment advisory fees | 149,624 | |||
Administration fees | 50,423 | |||
Custodian and accounting fees | 50,987 | |||
Interest expense to affiliates | 6 | |||
Professional fees | 44,235 | |||
Trustees’ and Chief Compliance Officer’s fees | 675 | |||
Printing and mailing costs | 18,265 | |||
Transfer agent fees | 2,898 | |||
Other | 10,466 | |||
|
| |||
Total expenses | 327,579 | |||
|
| |||
Less amounts waived | (89,442 | ) | ||
|
| |||
Net expenses | 238,137 | |||
|
| |||
Net investment income (loss) | 1,027,019 | |||
|
| |||
REALIZED/UNREALIZED GAINS (LOSSES): | ||||
Net realized gain (loss) on transactions from: | ||||
Investments in non-affiliates | 5,246,986 | |||
Investment in affiliates | 57,923 | |||
Futures | 222,942 | |||
|
| |||
Net realized gains (losses) | 5,527,851 | |||
|
| |||
Change in net unrealized appreciation/depreciation of: | ||||
Investments in non-affiliates | 9,812,817 | |||
Investments in affiliates | 168,262 | |||
Futures | 39,282 | |||
|
| |||
Change in net unrealized appreciation/depreciation | 10,020,361 | |||
|
| |||
Net realized/unrealized gains (losses) | 15,548,212 | |||
|
| |||
Change in net assets resulting from operations | $ | 16,575,231 | ||
|
| |||
SEE NOTES TO FINANCIAL STATEMENTS.
| 14 | JPMORGAN INSURANCE TRUST | DECEMBER 31, 2013 | ||||
Table of Contents
STATEMENTS OF CHANGES IN NET ASSETS
FOR THE PERIODS INDICATED
| Equity Index Portfolio | ||||||||
| Year Ended 12/31/2013 | Year Ended 12/31/2012 | |||||||
CHANGE IN NET ASSETS RESULTING FROM OPERATIONS: | ||||||||
Net investment income (loss) | $ | 1,027,019 | $ | 1,209,397 | ||||
Net realized gain (loss) | 5,527,851 | 4,651,011 | ||||||
Change in net unrealized appreciation/depreciation | 10,020,361 | 3,663,404 | ||||||
|
|
|
| |||||
Change in net assets resulting from operations | 16,575,231 | 9,523,812 | ||||||
|
|
|
| |||||
DISTRIBUTIONS TO SHAREHOLDERS: | ||||||||
From net investment income | (1,177,217 | ) | (1,198,609 | ) | ||||
From net realized gains | (2,249,549 | ) | — | |||||
|
|
|
| |||||
Total distributions to shareholders | (3,426,766 | ) | (1,198,609 | ) | ||||
|
|
|
| |||||
CAPITAL TRANSACTIONS: | ||||||||
Change in net assets resulting from capital transactions | (10,788,095 | ) | (17,208,730 | ) | ||||
|
|
|
| |||||
NET ASSETS: | ||||||||
Change in net assets | 2,360,370 | (8,883,527 | ) | |||||
Beginning of period | 58,304,693 | 67,188,220 | ||||||
|
|
|
| |||||
End of period | $ | 60,665,063 | $ | 58,304,693 | ||||
|
|
|
| |||||
Accumulated undistributed net investment income | $ | 1,014,431 | $ | 1,180,947 | ||||
|
|
|
| |||||
CAPITAL TRANSACTIONS: | ||||||||
Proceeds from shares issued | $ | 852,993 | $ | 1,802,034 | ||||
Distributions reinvested | 3,426,766 | 1,198,609 | ||||||
Cost of shares redeemed | (15,067,854 | ) | (20,209,373 | ) | ||||
|
|
|
| |||||
Change in net assets resulting from capital transactions | $ | (10,788,095 | ) | $ | (17,208,730 | ) | ||
|
|
|
| |||||
SHARE TRANSACTIONS: | ||||||||
Issued | 63,584 | 154,619 | ||||||
Reinvested | 264,207 | 102,096 | ||||||
Redeemed | (1,095,905 | ) | (1,699,371 | ) | ||||
|
|
|
| |||||
Change in Shares | (768,114 | ) | (1,442,656 | ) | ||||
|
|
|
| |||||
SEE NOTES TO FINANCIAL STATEMENTS.
| DECEMBER 31, 2013 | JPMORGAN INSURANCE TRUST | 15 | ||||||
Table of Contents
FOR THE PERIODS INDICATED
| Per share operating performance | ||||||||||||||||||||||||||||
| Investment operations | Distributions | |||||||||||||||||||||||||||
| Net asset value, beginning of period | Net investment income (loss) | Net realized and unrealized gains (losses) on investments | Total from investment operations | Net investment income | Net realized gain | Total distributions | ||||||||||||||||||||||
Equity Index Portfolio | ||||||||||||||||||||||||||||
Year Ended December 31, 2013 | $ | 12.40 | $ | 0.24 | (d) | $ | 3.56 | $ | 3.80 | $ | (0.27 | ) | $ | (0.52 | ) | $ | (0.79 | ) | ||||||||||
Year Ended December 31, 2012 | 10.93 | 0.23 | (d) | 1.46 | 1.69 | (0.22 | ) | — | (0.22 | ) | ||||||||||||||||||
Year Ended December 31, 2011 | 10.93 | 0.19 | (d) | — | (e) | 0.19 | (0.19 | ) | — | (0.19 | ) | |||||||||||||||||
Year Ended December 31, 2010 | 9.75 | 0.16 | (d) | 1.23 | 1.39 | (0.21 | ) | — | (0.21 | ) | ||||||||||||||||||
Year Ended December 31, 2009 | 7.93 | 0.20 | 1.83 | 2.03 | (0.21 | ) | — | (0.21 | ) | |||||||||||||||||||
| (a) | Includes adjustments in accordance with accounting principles generally accepted in the United States of America and as such, the net asset values for financial reporting purposes and the returns based upon those net asset values may differ from the net asset values and returns for shareholder transactions. |
| (b) | Includes earnings credits and interest expense, if applicable, each of which is less than 0.01% unless otherwise noted. |
| (c) | Portfolio turnover is calculated by dividing the lesser of total purchases or sales of portfolio securities for the reporting period by the monthly average value of portfolio securities owned during the reporting period. Excluded from both the numerator and denominator are amounts relating to derivatives and securities whose maturities or expiration dates at the time of acquisition were one year or less. |
| (d) | Calculated based upon average shares outstanding. |
| (e) | Amount rounds to less than $0.01. |
SEE NOTES TO FINANCIAL STATEMENTS.
| 16 | JPMORGAN INSURANCE TRUST | DECEMBER 31, 2013 | ||||
Table of Contents
| Ratios/Supplemental data | |||||||||||||||||||||||||
| Ratios to average net assets | ||||||||||||||||||||||||||
| Net asset value, end of period | Total return (a) | Net assets, end of period | Net expenses (b) | Net investment income (loss) | Expenses without waivers, reimbursements and earnings credits | Portfolio turnover rate (c) | ||||||||||||||||||||
| $ | 15.41 | 31.81 | % | $ | 60,665,063 | 0.40 | % | 1.72 | % | 0.55 | % | 4 | % | |||||||||||||
| 12.40 | 15.58 | 58,304,693 | 0.40 | 1.90 | 0.53 | 3 | ||||||||||||||||||||
| 10.93 | 1.71 | 67,188,220 | 0.40 | 1.69 | 0.50 | 4 | ||||||||||||||||||||
| 10.93 | 14.41 | 78,874,043 | 0.40 | 1.67 | 0.60 | 11 | ||||||||||||||||||||
| 9.75 | 26.44 | 82,015,865 | 0.40 | 2.25 | 0.62 | 13 | ||||||||||||||||||||
SEE NOTES TO FINANCIAL STATEMENTS.
| DECEMBER 31, 2013 | JPMORGAN INSURANCE TRUST | 17 | ||||||
Table of Contents
AS OF DECEMBER 31, 2013
1. Organization
JPMorgan Insurance Trust (the “Trust”) is registered under the Investment Company Act of 1940, as amended (the “1940 Act”), as an open-end management investment company and is a Massachusetts business trust.
The following is a separate Portfolio of the Trust (the “Portfolio”) covered by this report:
| Class Offered | Diversified/Non-Diversified | |||
| Equity Index Portfolio | Class 1 | Diversified |
The investment objective of the Portfolio is to seek investment results that correspond to the aggregate price and dividend performance of securities in the Standard & Poor’s 500 Composite Stock Price Index (S&P 500 Index).
Portfolio shares are offered only to separate accounts of participating insurance companies and Eligible Plans. Individuals may not purchase shares directly from the Portfolio.
2. Significant Accounting Policies
The following is a summary of significant accounting policies followed by the Portfolio in the preparation of its financial statements. The policies are in accordance with accounting principles generally accepted in the United States of America (“GAAP”). The preparation of financial statements requires management to make estimates and assumptions that affect the reported amounts and disclosures in the financial statements. Actual results could differ from those estimates.
A. Valuation of Investments — Equity securities listed on a North American, Central American, South American or Caribbean securities exchange shall generally be valued at the last sale price on the exchange on which the security is principally traded that is reported before the time when the net assets of the Portfolio are valued. Securities listed on the NASDAQ Stock Market LLC are generally valued at the NASDAQ Official Closing Price. Fixed income securities (other than certain short-term investments maturing in less than 61 days) are valued each day based on prices received from independent or affiliated pricing services approved by the Board of Trustees or third party broker-dealers. The pricing services or broker-dealers use multiple valuation techniques to determine fair value. In instances where sufficient market activity exists, the pricing services or broker-dealers may utilize a market-based approach through which quotes from market makers are used to determine fair value. In instances where sufficient market activity may not exist or is limited, the pricing services or broker-dealers also utilize proprietary valuation models which may consider market transactions in comparable securities and the various relationships between securities in determining fair value and/or market characteristics such as benchmark yield curves, option-adjusted spreads, credit spreads, estimated default rates, coupon rates, anticipated timing of principal repayments, underlying collateral, and other unique security features in order to estimate the relevant cash flows, which are then discounted to calculate the fair values. Generally, short-term investments of sufficient credit quality maturing in less than 61 days are valued at amortized cost, which approximates fair value. Investments in open-end investment companies are valued at each investment company’s net asset value per share (“NAV”) as of the report date.
Certain investments of the Portfolio may, depending upon market conditions, trade in relatively thin markets and/or in markets that experience significant volatility. As a result of these conditions, the prices used by the Portfolio to value these securities may differ from the value that would be realized if these securities were sold, and the differences could be material. Futures and options are generally valued on the basis of available market quotations. Swaps and other derivatives are valued daily, primarily using independent or affiliated pricing services approved by the Board of Trustees. If valuations are not available from such pricing services or values received are deemed not representative of fair value, values will be obtained from a third party broker-dealer or counterparty.
Securities or other assets for which market quotations are not readily available or for which market quotations are deemed to not represent the fair value of the security or asset at the time of pricing (including certain illiquid securities) are fair valued in accordance with procedures established by and under the supervision and responsibility of the Board of Trustees. The Board of Trustees has established an Audit and Valuation Committee to assist with the oversight of the valuation of the Portfolio’s securities. JPMorgan Funds Management, Inc. (the “Administrator” or “JPMFM”) has established a Valuation Committee (“VC”) that is comprised of senior representatives from JPMFM, J.P. Morgan Investment Management Inc. (the “Adviser” or “JPMIM”), and J.P. Morgan Asset Management’s Legal, Compliance and Risk Management groups and the Portfolio’s Chief Compliance Officer. The VC’s responsibilities include making determinations regarding Level 3 fair value measurements (“Fair Values”) and/or providing recommendations for approval to the Board of Trustees’ Audit and Valuation Committee, in accordance with the Portfolio’s valuation policies.
The VC or Board of Trustees, as applicable, primarily employs a market-based approach which may use related or comparable assets or liabilities, recent transactions, market multiples, book values, and other relevant information for the investment to determine the fair value of the investment. The VC or Board of Trustees may also use an income-based valuation approach in which the anticipated future cash flows of the investment are discounted to calculate fair value. Discounts may also be applied due to the nature or duration of any restrictions on the disposition of the investments. Valuations may be based upon current market prices of securities that are comparable in coupon, rating, maturity and industry.
It is possible that the estimated values may differ significantly from the values that would have been used had a ready market for the investments existed, and such differences could be material. JPMFM and JPMIM are responsible for monitoring developments that may impact Fair Values and
| 18 | JPMORGAN INSURANCE TRUST | DECEMBER 31, 2013 | ||||
Table of Contents
for discussing and assessing Fair Values on an ongoing, and at least a quarterly, basis with the VC and Board of Trustees, as applicable. The appropriateness of Fair Values is assessed based on results of unchanged price review and consideration of macro or security specific events, back testing, and broker and vendor due diligence.
Valuations reflected in this report are as of the report date. As a result, changes in valuation due to market events and/or issuer related events after the report date and prior to issuance of the report, are not reflected herein.
The various inputs that are used in determining the fair value of the Portfolio’s investments are summarized into the three broad levels listed below.
| Ÿ | Level 1 — quoted prices in active markets for identical securities |
| Ÿ | Level 2 — other significant observable inputs (including quoted prices for similar securities, interest rates, prepayment speeds, credit risk, etc.) |
| Ÿ | Level 3 — significant unobservable inputs (including the Portfolio’s own assumptions in determining the fair value of investments) |
A financial instrument’s level within the fair value hierarchy is based on the lowest level of any input, both individually and in the aggregate, that is significant to the fair value measurement. The inputs or methodology used for valuing securities are not necessarily an indication of the risk associated with investing in those securities.
The following table represents each valuation input as presented on the Schedule of Portfolio Investments (“SOI”):
| Level 1 Quoted prices | Level 2 Other significant observable inputs | Level 3 Significant unobservable inputs | Total | |||||||||||||
Total Investments in Securities (a) | $ | 60,684,572 | $ | 79,998 | $ | — | $ | 60,764,570 | ||||||||
|
|
|
|
|
|
|
| |||||||||
Appreciation in Other Financial Instruments | ||||||||||||||||
Futures Contracts | $ | 36,030 | $ | — | $ | — | $ | 36,030 | ||||||||
|
|
|
|
|
|
|
| |||||||||
| (a) | All portfolio holdings designated as Level 1 and Level 2 are disclosed individually on the SOI. Level 2 consists of a U.S. Treasury Bill that is held for futures collateral. Please refer to the SOI for industry specifics of portfolio holdings. |
There were no transfers among any levels during the year ended December 31, 2013.
B. Futures Contracts — The Portfolio uses index futures contracts to gain or reduce exposure to its index, maintain liquidity and minimize transaction costs. The Portfolio also buys futures contracts to immediately invest incoming cash in the market or sells futures in response to cash outflows, thereby simulating an invested position in the underlying index while maintaining a cash balance for liquidity. The use of futures contracts exposes the Portfolio to equity price risk.
Futures contracts provide for the delayed delivery of the underlying instrument at a fixed price or are settled for a cash amount based on the change in the value of the underlying instrument at a specific date in the future. Upon entering into a futures contract, the Portfolio is required to deposit with the broker, cash or securities in an amount equal to a certain percentage of the contract amount, which is referred to as the initial margin deposit. Subsequent payments, referred to as variation margin, are made or received by the Portfolio periodically and are based on changes in the market value of open futures contracts. Changes in the market value of open futures contracts are recorded as change in net unrealized appreciation (depreciation) in the Statement of Operations. Realized gains or losses, representing the difference between the value of the contract at the time it was opened and the value at the time it was closed, are reported in the Statement of Operations at the closing or expiration of the futures contract. Securities deposited as initial margin are designated in the SOI and cash deposited is recorded on the Statement of Assets and Liabilities. A receivable from and/or a payable to brokers for the daily variation margin is also recorded on the Statement of Assets and Liabilities.
The Portfolio may be subject to the risk that the change in the value of the futures contract may not correlate perfectly with the underlying instrument. Use of long futures contracts subjects the Portfolio to risk of loss in excess of the amounts shown on the Statement of Assets and Liabilities, up to the notional amount of the futures contracts. Use of short futures contracts subjects the Portfolio to unlimited risk of loss. The Portfolio may enter into futures contracts only on exchanges or boards of trade. The exchange or board of trade acts as the counterparty to each futures transaction; therefore, the Portfolio’s credit risk is limited to failure of the exchange or board of trade. Under some circumstances, futures exchanges may establish daily limits on the amount that the price of a futures contract can vary from the previous day’s settlement price, which could effectively prevent liquidation of positions.
The table below discloses the volume of the Portfolio’s futures contracts activity during the year ended December 31, 2013:
Futures Contracts: | ||||
Average Notional Balance Long | $ | 714,460 | ||
Ending Notional Balance Long | 920,550 |
The Portfolio’s futures contracts are not subject to master netting arrangements.
| DECEMBER 31, 2013 | JPMORGAN INSURANCE TRUST | 19 | ||||||
Table of Contents
NOTES TO FINANCIAL STATEMENTS
AS OF DECEMBER 31, 2013 (continued)
C. Investment Transactions with Affiliates — An issuer which is under common control with the Portfolio may be considered an affiliate. For the purposes of the financial statements, the Portfolio assumes the following to be affiliated issuers:
| For the year ended December 31, 2013 | ||||||||||||||||||||||||||||
| Affiliate | Value at December 31, 2012 | Purchase Cost | Sales Proceeds | Realized Gain/(Loss) | Dividend Income | Shares at December 31, 2013 | Value at December 31, 2013 | |||||||||||||||||||||
JPMorgan Chase & Co. (Common stock)* | $ | 753,645 | $ | 8,089 | $ | 190,017 | $ | 57,923 | $ | 21,308 | 13,644 | $ | 797,901 | |||||||||||||||
JPMorgan Liquid Assets Money Market Fund, Institutional Class Shares | 806,028 | 12,916,054 | 12,896,315 | — | 325 | 825,767 | 825,767 | |||||||||||||||||||||
JPMorgan Prime Money Market Fund, Capital Shares** | 35,500 | 2,923 | 38,423 | — | 3 | — | — | |||||||||||||||||||||
|
|
|
|
|
|
|
| |||||||||||||||||||||
| $ | 1,595,173 | $ | 57,923 | $ | 21,636 | $ | 1,623,668 | |||||||||||||||||||||
|
|
|
|
|
|
|
| |||||||||||||||||||||
| * | Investment in affiliate which is a security in the Portfolio’s index. |
| ** | Represents investment of cash collateral related to securities on loan, as described in Note 2.D. Divided income earned from this investment is included in Income from securities lending (net) in the Statement of Operations. |
D. Securities Lending — The Portfolio may lend securities to brokers approved by the Adviser in order to generate additional income. Goldman Sachs Bank USA, doing business as Goldman Sachs Agency Lending (“GSAL”), serves as lending agent for the Portfolio pursuant to a Securities Lending Agreement (the “GSAL Securities Lending Agreement”). The Portfolio receives cash collateral, which is invested in Capital Shares of the JPMorgan Prime Money Market Fund (“Collateral Investments”). Upon termination of the loan, the Portfolio is required to return to the borrower the posted cash collateral. Loans are subject to termination by the Portfolio or the borrower at any time.
Securities lending income is comprised of income earned on Collateral Investments, net amount of a rebate received from or paid to borrowers for use of cash collateral and lending agent fees. This amount is recorded as Income from securities lending (net) in the Statement of Operations. The Portfolio also receives payments from the borrower during the period of the loan, equivalent to dividends and interest earned on the securities loaned, which are recorded as Dividend or Interest income, respectively, in the Statement of Operations.
For the year ended December 31, 2013, the Portfolio earned $5 from the investment of cash collateral, prior to rebates or fees, in collateral investments as described below.
At the inception of a loan, securities are exchanged for cash collateral equal to at least 102% of the value of the loaned U.S. dollar-denominated securities, plus accrued interest. The GSAL Securities Lending Agreement requires that the loaned securities be marked to market on a daily basis and additional cash collateral is requested from borrowers when the cash received from borrowers becomes less than 102% of the value of loaned securities.
The value of the cash collateral received is recorded as a liability on the Statement of Assets and Liabilities and details of Collateral Investments are disclosed in the SOI. At December 31, 2013, there were no outstanding securities on loan.
The Portfolio bears the risk of loss associated with the Collateral Investments and is not entitled to additional collateral from the borrower to cover any such losses. To the extent that the value of the Collateral Investments declines below the amount owed to a borrower, the Portfolio may incur losses that exceed the amount it earned on lending the security. Upon termination of a loan, the Portfolio may use leverage (borrow money) to repay the borrower for cash collateral posted if the Adviser does not believe that it is prudent to sell the Collateral Investments to fund the payment of this liability.
Securities lending also involves counterparty risks, including the risk that the loaned securities may not be returned in a timely manner or at all. Subject to certain conditions, GSAL has agreed to indemnify the Portfolio from losses resulting from a borrower’s failure to return a loaned security.
The Adviser may waive fees associated with the Portfolio’s investment in JPMorgan Prime Money Market Fund. This amount offsets the administration fees and shareholder servicing fees incurred by JPMorgan Prime Money Market Fund related to the Portfolio’s investment in such fund. A portion of the waiver is voluntary. For the year ended December 31, 2013, there were no fees waived by the Adviser in association with the Portfolio’s investment in JPMorgan Prime Money Market Fund.
E. Security Transactions and Investment Income — Investment transactions are accounted for on the trade date (the date the order to buy or sell is executed). Securities gains and losses are calculated on a specifically identified cost basis. Interest income is determined on the basis of coupon interest accrued using the effective interest method which adjusts for amortization of premiums and accretion of discounts. Dividend income, net of foreign taxes withheld, if any, is recorded on the ex-dividend date or when the Portfolio first learns of the dividend.
To the extent such information is publicly available, the Portfolio records distributions received in excess of income earned from underlying investments as a reduction of cost of investments and/or realized gain. Such amounts are based on estimates if actual amounts are not available and actual amounts of income, realized gain and return of capital may differ from the estimated amounts. The Portfolio adjusts the estimated amounts of the components of distributions (and consequently its net investment income) as necessary once the issuers provide information about the actual composition of the distributions.
| 20 | JPMORGAN INSURANCE TRUST | DECEMBER 31, 2013 | ||||
Table of Contents
F. Allocation of Expenses — Expenses directly attributable to a portfolio are charged directly to that portfolio, while the expenses attributable to more than one portfolio of the Trust are allocated among the respective portfolios.
G. Federal Income Taxes — The Portfolio is treated as a separate taxable entity for Federal income tax purposes. The Portfolio’s policy is to comply with the provisions of the Internal Revenue Code of 1986, as amended (the “Code”), applicable to regulated investment companies and to distribute to shareholders all of its distributable net investment income and net realized capital gains on investments. Accordingly, no provision for Federal income tax is necessary. The Portfolio is also a segregated portfolio of assets for insurance purposes and intends to comply with the diversification requirements of Subchapter L of the Code. Management has reviewed the Portfolio’s tax positions for all open tax years and has determined that as of December 31, 2013, no liability for income tax is required in the Portfolio’s financial statements for net unrecognized tax benefits. However, management’s conclusions may be subject to future review based on changes in, or the interpretation of, the accounting standards or tax laws and regulations. The Portfolio’s Federal tax returns for the prior three fiscal years remain subject to examination by the Internal Revenue Service.
H. Distributions to Shareholders — Distributions from net investment income and net realized capital gains, if any, are generally declared and paid at least annually. The amount of distributions from net investment income and net realized capital gains is determined in accordance with Federal income tax regulations, which may differ from GAAP. To the extent these “book/tax” differences are permanent in nature (i.e., that they result from other than timing of recognition — “temporary differences”), such amounts are reclassified within the capital accounts based on their Federal tax-basis treatment.
The following amounts were reclassified within the capital accounts:
| Paid-in-Capital | Accumulated undistributed net investment income | Accumulated net realized gains (losses) | ||||||||
| $(1) | $ | (16,318 | ) | $ | 16,319 | |||||
The reclassifications for the Portfolio relate primarily to investments in real estate investment trusts.
3. Fees and Other Transactions with Affiliates
A. Investment Advisory Fee — Pursuant to the Investment Advisory Agreement, the Adviser, an indirect, wholly-owned subsidiary of JPMorgan Chase & Co. (“JPMorgan”) supervises the investments of the Portfolio and for such services is paid a fee. The fee is accrued daily and paid monthly based on the Portfolio’s average daily net assets at an annual rate of 0.25%.
The Adviser waived Investment Advisory fees and/or reimbursed expenses as outlined in Note 3.E.
B. Administration Fee — Pursuant to an Administration Agreement, the Administrator, an indirect, wholly-owned subsidiary of JPMorgan, provides certain administration services to the Portfolio. In consideration of these services, the Administrator receives a fee accrued daily and paid monthly at an annual rate of 0.15% of the first $25 billion of the average daily net assets of all funds in the J.P. Morgan Funds Complex covered by the Administration Agreement (excluding certain funds of funds and money market funds) and 0.075% of the average daily net assets in excess of $25 billion of all such funds. For the year ended December 31, 2013, the effective rate was 0.08% of the Portfolio’s average daily net assets, notwithstanding any fee waivers and/or expense reimbursements.
JPMorgan Chase Bank, N.A. (“JPMCB”), a wholly-owned subsidiary of JPMorgan, serves as the Portfolio’s sub-administrator (the “Sub-administrator”). For its services as Sub-administrator, JPMCB receives a portion of the fees payable to the Administrator.
The Administrator waived Administration fees as outlined in Note 3.E.
C. Distribution Fees — Pursuant to a Distribution Agreement, JPMorgan Distribution Services, Inc. (the “Distributor”), a wholly-owned subsidiary of JPMorgan, serves as the Trust’s exclusive underwriter and promotes and arranges for the sale of the Portfolio’s shares. The Distributor receives no compensation in its capacity as the Portfolio’s underwriter.
D. Custodian and Accounting Fees — JPMCB provides portfolio custody and accounting services to the Portfolio. The amounts paid directly to JPMCB by the Portfolio for custody and accounting services are included in Custodian and accounting fees in the Statement of Operations. Payments to the custodian may be reduced by credits earned by the Portfolio, based on uninvested cash balances held by the custodian. Such earnings credits, if any, are presented separately in the Statement of Operations.
Interest expense, if any, paid to the custodian related to cash overdrafts is included in Interest expense to affiliates in the Statement of Operations.
E. Waivers and Reimbursements — The Adviser and Administrator have contractually agreed to waive fees and/or reimburse the Portfolio to the extent that total annual operating expenses (excluding acquired fund fees and expenses, dividend expenses related to short sales, interest, taxes, expenses related to litigation and potential litigation, extraordinary expenses and expenses related to the Board of Trustees’ deferred compensation plan) exceed 0.40% of the Portfolio’s average daily net assets.
The expense limitation agreement was in effect for the year ended December 31, 2013. The contractual expense limitation percentage above is in place until at least April 30, 2014.
| DECEMBER 31, 2013 | JPMORGAN INSURANCE TRUST | 21 | ||||||
Table of Contents
NOTES TO FINANCIAL STATEMENTS
AS OF DECEMBER 31, 2013 (continued)
For the year ended December 31, 2013, the Portfolio’s service providers waived fees for the Portfolio as follows. None of these parties expect the Portfolio to repay any such waived fees in future years.
| Contractual Waivers | ||||||||||||
| Investment Advisory | Administration | Total | ||||||||||
| $ | 38,987 | $ | 49,185 | $ | 88,172 | |||||||
Additionally, the Portfolio may invest in one or more money market funds advised by the Adviser or its affiliates. The Adviser and the Administrator waive fees in an amount sufficient to offset the respective fees each charges to the affiliated money market fund on the Portfolio’s investment in such affiliated money market fund. A portion of the waiver is voluntary.
The amount of waivers resulting from investments in these money market funds for the year ended December 31, 2013 (excluding the waiver disclosed in Note 2.D. regarding cash collateral for securities lending invested in JPMorgan Prime Money Market Fund) was $1,270.
F. Other — Certain officers of the Trust are affiliated with the Adviser, the Administrator and the Distributor. Such officers, with the exception of the Chief Compliance Officer, receive no compensation from the Portfolio for serving in their respective roles.
The Board of Trustees appointed a Chief Compliance Officer to the Portfolio in accordance with Federal securities regulations. The Portfolio, along with other affiliated portfolios, makes reimbursement payments, on a pro-rata basis, to the Administrator for a portion of the fees associated with the Office of the Chief Compliance Officer. Such fees are included in Trustees’ and Chief Compliance Officer’s fees in the Statement of Operations.
The Trust adopted a Trustee Deferred Compensation Plan (the “Plan”) which allows the Independent Trustees to defer the receipt of all or a portion of compensation related to performance of their duties as Trustees. The deferred fees are invested in various J.P. Morgan Funds until distribution in accordance with the Plan.
During the year ended December 31, 2013, the Portfolio may have purchased securities from an underwriting syndicate in which the principal underwriter or members of the syndicate are affiliated with the Adviser.
The Portfolio may use related party broker-dealers. For the year ended December 31, 2013, the Portfolio did not incur any brokerage commissions with broker-dealers affiliated with the Adviser.
The Securities and Exchange Commission has granted an exemptive order permitting the Portfolio to engage in principal transactions with J.P. Morgan Securities, Inc., an affiliated broker, involving taxable money market instruments, subject to certain conditions.
4. Investment Transactions
During the year ended December 31, 2013, purchases and sales of investments (excluding short-term investments) were as follows:
| Purchases (excluding U.S. Government) | Sales (excluding U.S. Government) | |||||||
| $ | 2,260,746 | $ | 15,134,224 | |||||
During the year ended December 31, 2013, there were no purchases or sales of U.S. Government securities.
5. Federal Income Tax Matters
For Federal income tax purposes, the cost and unrealized appreciation (depreciation) in value of investment securities held at December 31, 2013 were as follows:
| Aggregate Cost | Gross Unrealized Appreciation | Gross Unrealized Depreciation | Net Unrealized Appreciation (Depreciation) | |||||||||||||
| $ | 43,885,442 | $ | 17,333,682 | $ | 454,554 | $ | 16,879,128 | |||||||||
The difference between book and tax basis appreciation (depreciation) on investments is primarily attributed to wash sale loss deferrals.
The tax character of distributions paid during the year ended December 31, 2013 was as follows:
| Total Distributions Paid From: | ||||||||||||
| Ordinary Income | Net Long-Term Capital Gains | Total Distributions Paid | ||||||||||
| $ | 1,177,113 | $ | 2,249,653 | $ | 3,426,766 | |||||||
| 22 | JPMORGAN INSURANCE TRUST | DECEMBER 31, 2013 | ||||
Table of Contents
The tax character of distributions paid during the year ended December 31, 2012 was as follows:
| Total Distributions Paid From: | ||||||||
| Ordinary Income | Total Distributions Paid | |||||||
| $ | 1,198,609 | $ | 1,198,609 | |||||
As of December 31, 2013, the components of net assets (excluding paid-in-capital) on a tax basis were as follows:
| Current Distributable Ordinary Income | Current Distributable Long-Term Capital Gain or (Tax Basis Capital Loss Carryover) | Unrealized Appreciation (Depreciation) | ||||||||||
| $ | 1,146,833 | $ | 4,355,851 | $ | 16,879,128 | |||||||
The cumulative timing differences primarily consist of mark to market of future contracts and wash sale loss deferrals.
Under the Regulated Investment Company Modernization Act of 2010 (the “Act”), net capital losses recognized by the Portfolio after December 31, 2010 are carried forward indefinitely, and retain their character as short-term and/or long-term losses. Prior to the Act, net capital losses incurred by the Portfolio were carried forward for eight years and treated as short-term losses. The Act requires that post-enactment net capital losses be used before pre-enactment net capital losses.
As of December 31, 2013, the Portfolio did not have any post-enactment or pre-enactment net capital loss carryforwards.
6. Borrowings
The Trust and JPMCB have entered into a financing arrangement. Under this arrangement, JPMCB provides an unsecured, uncommitted credit facility in the aggregate amount of $100 million to certain of the J.P. Morgan Funds, including the Portfolio. Advances under the arrangement are taken primarily for temporary or emergency purposes, including the meeting of redemption requests that otherwise might require the untimely disposition of securities, and are subject to the Portfolio’s borrowing restrictions. Interest on borrowings is payable at a rate determined by JPMCB at the time of borrowing. This agreement has been extended until November 10, 2014.
The Portfolio had no borrowings outstanding from the unsecured, uncommitted credit facility at December 31, 2013, or at any time during the year then ended.
Interest expense paid, if any, as a result of borrowings from the unsecured, uncommitted credit facility is included in Interest expense to affiliates in the Statement of Operations.
7. Risks, Concentrations and Indemnifications
In the normal course of business, the Portfolio enters into contracts that contain a variety of representations which provide general indemnifications. The Portfolio’s maximum exposure under these arrangements is unknown. The amount of exposure would depend on future claims that may be made against the Portfolio that have not yet occurred. However, based on experience, the Portfolio expects the risk of loss to be remote.
The Portfolio has several shareholders holding a significant percentage of shares outstanding. Investment activities of these shareholders could have a material impact on the Portfolio.
| DECEMBER 31, 2013 | JPMORGAN INSURANCE TRUST | 23 | ||||||
Table of Contents
REPORT OF INDEPENDENT REGISTERED PUBLIC ACCOUNTING FIRM
To the Board of Trustees of JPMorgan Insurance Trust and the Shareholders of JPMorgan Insurance Trust Equity Index Portfolio:
In our opinion, the accompanying statement of assets and liabilities, including the schedule of portfolio investments, and the related statements of operations and of changes in net assets and the financial highlights present fairly, in all material respects, the financial position of JPMorgan Insurance Trust Equity Index Portfolio (a separate Portfolio of JPMorgan Insurance Trust) (hereafter referred to as the “Portfolio”) at December 31, 2013, the results of its operations for the year then ended, the changes in its net assets for each of the two years in the period then ended and the financial highlights for each of the five years in the period then ended, in conformity with accounting principles generally accepted in the United States of America. These financial statements and financial highlights (hereafter referred to as “financial statements”) are the responsibility of the Portfolio’s management. Our responsibility is to express an opinion on these financial statements based on our audits. We conducted our audits of these financial statements in accordance with the standards of the Public Company Accounting Oversight Board (United States). Those standards require that we plan and perform the audit to obtain reasonable assurance about whether the financial statements are free of material misstatement. An audit includes examining, on a test basis, evidence supporting the amounts and disclosures in the financial statements, assessing the accounting principles used and significant estimates made by management, and evaluating the overall financial statement presentation. We believe that our audits, which included confirmation of securities at December 31, 2013 by correspondence with the custodian and broker, provide a reasonable basis for our opinion.
PricewaterhouseCoopers LLP
New York, New York
February 21, 2014
| 24 | JPMORGAN INSURANCE TRUST | DECEMBER 31, 2013 | ||||
Table of Contents
(Unaudited)
The Portfolio’s Statement of Additional Information includes additional information about the Portfolio’s Trustees and is available, without charge, upon request by calling 1-800-480-4111 or on the J.P. Morgan Funds’ website at www.jpmorganfunds.com.
Name (Year of Birth); Positions With the Portfolio (1) | Principal Occupations During Past 5 Years | Number of Portfolios in Fund Complex Overseen by Trustee (2) | Other Directorships Held Outside Fund Complex During Past 5 Years | |||
Independent Trustees | ||||||
| John F. Finn (1947); Trustee of Trust since 2005; Trustee of heritage One Group Mutual Funds since 1998. | Chairman (1985-present), President and Chief Executive Officer, Gardner, Inc. (supply chain management company serving industrial and consumer markets) (1974-present). | 170 | Director, Cardinal Health, Inc. (CAH) (1994-present); Director, Greif, Inc. (GEF) (industrial package products and services) (2007-present); Trustee, Columbus Association for the Performing Arts. | |||
| Dr. Matthew Goldstein (1941); Chairman since 2013; Trustee of Trust since 2005; Trustee of heritage J.P. Morgan Funds since 2003. | Professor, City University of New York (effective 7/1/13); Chancellor, City University of New York (1999-2013); President, Adelphi University (New York) (1998-1999). | 170 | Trustee, Museum of Jewish Heritage (2011-present). | |||
| Robert J. Higgins (1945); Trustee of Trust since 2005; Trustee of heritage J.P. Morgan Funds since 2002. | Retired; Director of Administration of the State of Rhode Island (2003-2004); President — Consumer Banking and Investment Services, Fleet Boston Financial (1971-2001). | 170 | None | |||
| Peter C. Marshall (1942); Trustee of Trust since 2005; Trustee of heritage One Group Mutual Funds since 1985. | Self-employed business consultant (2002-present). | 170 | None | |||
| Mary E. Martinez (1960); Trustee of Trust since 2013. | Associate, Special Properties, a Christie’s International Real Estate Affiliate (2010-Present); Managing Director, Bank of America (Asset Management) (2007-2008); Chief Operating Officer, U.S. Trust Asset Management; U.S. Trust Company (asset management) (2003-2007); President, Excelsior Funds (registered investment companies) (2004-2005). | 170 | None | |||
| Marilyn McCoy* (1948); Trustee of Trust since 2005; Trustee of heritage One Group Mutual Funds since 1999. | Vice President of Administration and Planning, Northwestern University (1985-present). | 170 | Trustee, Carleton College (2003-present). | |||
| Mitchell M. Merin (1953); Trustee of Trust since 2013. | Retired (2005-Present); President and Chief Operating Officer, Morgan Stanley Investment Management, Member Morgan Stanley & Co. Management Committee (registered investment adviser) (1998-2005). | 170 | Director, Sun Life Financial (SLF) (2007 to Present) (financial services and insurance); Trustee, Trinity College, Hartford, CT (2002-2010). | |||
| William G. Morton, Jr. (1937); Trustee of Trust since 2005; Trustee of heritage J.P. Morgan Funds since 2003. | Retired; Chairman Emeritus (2001-2002), and Chairman and Chief Executive Officer, Boston Stock Exchange (1985-2001). | 170 | Director, Radio Shack Corp. (1987-2008); Director, National Organization of Investment Professionals; Trustee of the Stratton Mountain School (2001-present). | |||
| Dr. Robert A. Oden, Jr. (1946); Trustee of Trust since 2005; Trustee of heritage One Group Mutual Funds since 1997. | Retired; President, Carleton College (2002-2010); President, Kenyon College (1995-2002). | 170 | Trustee, American University in Cairo (1999-present); Chairman, Dartmouth-Hitchcock Medical Center (2011-present); Trustee, American Schools of Oriental Research (2011-present); Trustee, American Museum of Fly Fishing. | |||
| DECEMBER 31, 2013 | JPMORGAN INSURANCE TRUST | 25 | ||||||
Table of Contents
TRUSTEES
(Unaudited) (continued)
Name (Year of Birth); Positions With the Portfolio (1) | Principal Occupations During Past 5 Years | Number of Complex Overseen by Trustee (2) | Other Directorships Held Outside Fund Complex During Past 5 Years | |||
Independent Trustees (continued) | ||||||
| Marian U. Pardo** (1946); Trustee of Trust since 2013. | Managing Director and Founder, Virtual Capital Management LLC (Investment Consulting) (2007-present); Managing Director, Credit Suisse Asset Management (portfolio manager) (2003-2006). | 170 | Member, Board of Governors, Columbus Citizens Foundation (not-for-profit supporting philanthropic and cultural programs) (2006-present). | |||
| Frederick W. Ruebeck (1939); Trustee of Trust since 2005; Trustee of heritage One Group Mutual Funds since 1994. | Consultant (2000-present); Adviser, JP Greene & Associates, LLC (broker-dealer) (2000-2009); Chief Investment Officer, Wabash College (2004-present); Director of Investments, Eli Lilly and Company (pharmaceuticals) (1988-1999). | 170 | Trustee, Wabash College (1988-present); Chairman, Indianapolis Symphony Orchestra Foundation (1994-present). | |||
| James J. Schonbachler (1943); Trustee of Trust since 2005; Trustee of heritage J.P. Morgan Funds since 2001. | Retired; Managing Director of Bankers Trust Company (financial services) (1968-1998). | 170 | None | |||
Interested Trustee Not Affiliated With the Adviser | ||||||
| Frankie D. Hughes*** (1952), Trustee of Trust since 2008. | President and Chief Investment Officer, Hughes Capital Management, Inc. (fixed income asset management) (1993-present). | 170 | Trustee, The Victory Portfolios (2000-2008) (investment companies). | |||
| (1) | The Trustees serve for an indefinite term, subject to the Trust’s current retirement policy, which is age 75 for all Trustees, except that the Board has determined Mr. Morton should continue to serve until December 31, 2014. In order to fill the vacancies created by the retirement of Fergus Reid, III, William J. Armstrong, and Leonard J. Spalding Jr., effective December 31, 2012, the Board appointed Ms. Martinez and Mr. Merin to serve as Trustees effective January 1, 2013 and Ms. Pardo to serve as Trustee effective February 1, 2013. |
| (2) | A Fund Complex means two or more registered investment companies that hold themselves out to investors as related companies for purposes of investment and investor services or have a common investment adviser or have an investment adviser that is an affiliated person of the investment adviser of any of the other registered investment companies. The J.P. Morgan Funds Complex for which the Board of Trustees serves currently includes eleven registered investment companies (170 funds), including JPMorgan Mutual Fund Group which liquidated effective November 29, 2012 and is in the process of winding up its affairs. |
| * | Ms. McCoy has served as Vice President of Administration and Planning for Northwestern University since 1985. William M. Daley was the Head of Corporate Responsibility for JPMorgan Chase & Co. prior to January 2011 and served as a member of the Board of Trustees of Northwestern University from 2005 through 2010. JPMIM, the Portfolio’s investment adviser, is a wholly-owned subsidiary of JPMorgan Chase & Co. Two members of the Board of Trustees of Northwestern University are executive officers of registered investment advisers (not affiliated with JPMorgan) that are under common control with sub-advisers to certain J.P. Morgan Funds. |
| ** | In connection with prior employment with JPMorgan Chase, Ms. Pardo is the recipient of non-qualified pension plan payments from JPMorgan Chase in the amount of approximately $2,055 per month, which she irrevocably waived effective January 1, 2013, and deferred compensation payments from JPMorgan Chase in the amount of approximately $7,294 per year, which ended in January 2013. In addition, Ms. Pardo receives payments from a fully funded qualified plan, which is not an obligation of JPMorgan Chase. |
| *** | Ms. Hughes is treated as an “interested person” based on the portfolio holdings of clients of Hughes Capital Management, Inc. |
The contact address for each of the Trustees is 270 Park Avenue, New York, NY 10017.
| 26 | JPMORGAN INSURANCE TRUST | DECEMBER 31, 2013 | ||||
Table of Contents
(Unaudited)
Name (Year of Birth), Positions Held with the Trust (Since) | Principal Occupations During Past 5 Years | |
| Robert L. Young (1963), President and Principal Executive Officer (2013)** | Chief Operating Officer and Director, J.P. Morgan Investment Management Inc. since 2010; Senior Vice President, J.P. Morgan Funds (2005-2010), Chief Operating Officer, J.P. Morgan Funds (2005-2010); Director and various officer positions for JPMorgan Funds Management, Inc. (formerly One Group Administrative Services) and JPMorgan Distribution Services, Inc. (formerly One Group Dealer Services, Inc.) from 1999 to present. Mr. Young has been with JPMorgan Chase & Co. (formerly Bank One Corporation) since 1997. | |
| Joy C. Dowd (1972), Treasurer and Principal Financial Officer (2010) | Assistant Treasurer of the Trusts from 2009 to 2010; Executive Director, JPMorgan Funds Management, Inc. from February 2011; Vice President, JPMorgan Funds Management, Inc. from December 2008 to February 2011; prior to joining JPMorgan Chase, Ms. Dowd worked in MetLife’s investments audit group from 2005 through 2008. | |
| Frank J. Nasta (1964), Secretary (2008) | Managing Director and Associate General Counsel, JPMorgan Chase since 2008; Previously, Director, Managing Director, General Counsel and Corporate Secretary, J. & W. Seligman & Co. Incorporated; Secretary of each of the investment companies of the Seligman Group of Funds and Seligman Data Corp.; Director and Corporate Secretary, Seligman Advisors, Inc. and Seligman Services, Inc. | |
| Stephen M. Ungerman (1953), Chief Compliance Officer (2005) | Managing Director, JPMorgan Chase & Co.; Mr. Ungerman has been with JPMorgan Chase & Co. since 2000. | |
| Kathryn A. Jackson (1962), AML Compliance Officer (2012)* | Vice President and AML Compliance Manager for JPMorgan Asset Management Compliance since 2011; Senior On-Boarding Specialist for JPMorgan Distribution Services, Inc. in Global Liquidity from 2008 to 2011; prior to joining JPMorgan, Ms. Jackson was a Financial Services Analyst responsible for on-boarding, compliance and training with Nationwide Securities LLC and 1717 Capital Management Company, both registered broker-dealers, from 2005 until 2008. | |
Elizabeth A. Davin (1964), Assistant Secretary (2005)** | Executive Director and Assistant General Counsel, JPMorgan Chase since February 2012; formerly Vice President and Assistant General Counsel, JPMorgan Chase from 2005 until February 2012; Senior Counsel, JPMorgan Chase (formerly Bank One Corporation) from 2004 to 2005. | |
| Jessica K. Ditullio (1962), Assistant Secretary (2005)** | Executive Director and Assistant General Counsel, JPMorgan Chase since February 2011; Ms. Ditullio has served as an attorney with various titles for JPMorgan Chase (formerly Bank One Corporation) since 1990. | |
| John T. Fitzgerald (1975), Assistant Secretary (2008) | Executive Director and Assistant General Counsel, JPMorgan Chase since February 2011; formerly, Vice President and Assistant General Counsel, JPMorgan Chase from 2005 until February 2011. | |
| Carmine Lekstutis (1980), Assistant Secretary (2011) | Vice President and Assistant General Counsel, JPMorgan Chase since 2011; Associate, Skadden, Arps, Slate, Meagher & Flom LLP (law firm) from 2006 to 2011. | |
| Gregory S. Samuels (1980), Assistant Secretary (2010) | Vice President and Assistant General Counsel, JPMorgan Chase since 2010; Associate, Ropes & Gray (law firm) from 2008 to 2010; Associate, Clifford Chance LLP (law firm) from 2005 to 2008. | |
| Pamela L. Woodley (1971), Assistant Secretary (2012) | Vice President and Assistant General Counsel, JPMorgan Chase since November 2004. | |
Michael M. D’Ambrosio (1969), Assistant Treasurer (2012) | Executive Director, JPMorgan Funds Management, Inc. from July 2012; prior to joining JPMorgan Chase, Mr. D’Ambrosio was a Tax Director at PricewaterhouseCoopers LLP since 2006. | |
| Joseph Parascondola (1963), Assistant Treasurer (2011) | Vice President, JPMorgan Funds Management, Inc. since August 2006. | |
| Matthew J. Plastina (1970), Assistant Treasurer (2011) | Vice President, JPMorgan Funds Management, Inc. since August 2010; prior to August 2010, Vice President and Controller, Legg Mason Global Asset Management. | |
Julie A. Roach (1971), Assistant Treasurer (2012)** | Vice President, JPMorgan Funds Management, Inc. from August 2012; prior to joining JPMorgan Chase, Ms. Roach was a Senior Manager with Deloitte since 2001. | |
Gillian I. Sands (1969), Assistant Treasurer (2012) | Vice President, JPMorgan Funds Management, Inc. from September 2012; Assistant Treasurer, Wells Fargo Funds Management (2007-2009). | |
The contact address for each of the officers, unless otherwise noted, is 270 Park Avenue, New York, NY 10017.
| * | The contact address for the officer is 500 Stanton Christiana Road, Ops 1, Floor 02, Newark, DE 19173-2107. |
| ** | The contact address for the officer is 460 Polaris Parkway, Westerville, OH 43082. |
| DECEMBER 31, 2013 | JPMORGAN INSURANCE TRUST | 27 | ||||||
Table of Contents
SCHEDULE OF SHAREHOLDER EXPENSES
(Unaudited)
Hypothetical $1,000 Investment
As a shareholder of the Portfolio, you incur ongoing costs: including investment advisory fees, administration fees and other Portfolio expenses. Because the Portfolio is a funding vehicle for Policies and Eligible Plans, you may also incur sales charges and other fees relating to the Policies or Eligible Plans. The examples below are intended to help you understand your ongoing costs (in dollars) of investing in the Portfolio, but not the costs of the Policies or Eligible Plans, and to compare these ongoing costs with the ongoing costs of investing in other mutual funds. The examples assume that you had a $1,000 investment in the Portfolio at the beginning of the reporting period, July 1, 2013, and continued to hold your shares at the end of the reporting period, December 31, 2013.
Actual Expenses
The first line provides information about actual account values and actual expenses. You may use the information in this line, together with the amount you invested, to estimate the expenses that you paid over the period. Simply divide your account value by $1,000 (for example, an $8,600 account value divided by $1,000 = 8.6), then multiply the result by the number in the first line under the heading entitled “Expenses Paid During the Period” to estimate the expenses you paid on your account during this period.
Hypothetical Example for Comparison Purposes
The second line in the table below provides information about hypothetical account values and hypothetical expenses based on the actual expense ratio and an assumed rate of return of 5% per year before expenses, which is not the Portfolio’s actual return. The hypothetical account values and expenses may not be used to estimate the actual ending account balance or expenses you paid for the period. You may use this information to compare the ongoing costs of investing in the Portfolio and other funds. To do so, compare this 5% hypothetical example with the 5% hypothetical examples that appear in the shareholder reports of the other funds. Please note that the expenses shown in the table are meant to highlight your ongoing costs only and do not reflect any transaction costs, such as sales charges (loads) or redemption fees or the costs associated with the Policies and Eligible Plans through which the Portfolio is held. Therefore, the second line in the table is useful in comparing ongoing costs only, and will not help you determine the relative total costs of owning different funds. In addition, if these transaction costs were included, your costs would have been higher. The examples also assume all dividends and distributions have been reinvested.
| Beginning Account Value July 1, 2013 | Ending Account Value December 31, 2013 | Expenses Paid During the Period* | Annualized Expense Ratio | |||||||||||||
Equity Index Portfolio | ||||||||||||||||
Actual | $ | 1,000.00 | $ | 1,160.40 | $ | 2.18 | 0.40 | % | ||||||||
Hypothetical | 1,000.00 | 1,023.19 | 2.04 | 0.40 | ||||||||||||
| * | Expenses are equal to the Portfolio’s annualized expense ratio, multiplied by the average account value over the period, multiplied by 184/365 (to reflect the one-half year period). |
| 28 | JPMORGAN INSURANCE TRUST | DECEMBER 31, 2013 | ||||
Table of Contents
BOARD APPROVAL OF INVESTMENT ADVISORY AGREEMENT
(Unaudited)
The Board of Trustees meets regularly throughout the year and considers factors that are relevant to its annual consideration of investment advisory agreements at each meeting. The Board of Trustees has established various standing committees, composed of Trustees with diverse backgrounds, to which the Board of Trustees has assigned specific subject matter responsibilities to further enhance the effectiveness of the Board’s oversight and decision making. The Board of Trustees and its investment committees (money market and alternative products, equity, and fixed income) also meet for the specific purpose of considering advisory contract annual renewals. The Board of Trustees held meetings in person in June and August 2013, at which the Trustees considered the continuation of the investment advisory agreement for the Portfolio whose annual report is contained herein (the “Advisory Agreement”). At the June meeting, the Board’s investment committees met to review and consider performance, expense and related information for the J.P. Morgan Funds. Each investment committee reported to the full Board, which then considered the investment committee’s preliminary findings. At the August meeting, the Trustees continued their review and consideration. The Trustees, including a majority of the Trustees who are not “interested persons” (as defined in the 1940 Act) of any party to the Advisory Agreement or any of their affiliates, approved the continuation of the Advisory Agreement on August 20, 2013.
The Trustees, as part of their review of the investment advisory arrangements for the J.P. Morgan Funds, considered and reviewed performance and other information received from the Adviser on a regular basis over the course of the year, as well as information specifically prepared for their annual review. This information included the Portfolio’s performance compared to the performance of the Portfolio’s peers and benchmarks and analyses by the Adviser of the Portfolio’s performance. The Adviser also periodically provides comparative information regarding the Portfolio’s expense ratios and those of the peer groups. In addition, in preparation for the June and August meetings, the Trustees requested, received and evaluated extensive materials from the Adviser, including, with respect to the Portfolio, performance and expense information compiled by Lipper Inc. (“Lipper”), an independent provider of investment company data. Prior to voting, the Trustees reviewed the proposed approval of the Advisory Agreement with representatives of the Adviser and with counsels to the Portfolio and independent Trustees and received a memorandum from independent counsel to the Trustees discussing the legal standards for their consideration of the proposed approval. The Trustees also discussed the proposed approvals in executive sessions with counsels to the Portfolio and independent Trustees at which no representatives of the Adviser were present. Set forth below is a summary of the material factors evaluated by the Trustees in determining whether to approve the Advisory Agreement.
In their deliberations, there was a comprehensive consideration of the information received by the Trustees. Each Trustee attributed different weights to the various factors and no factor alone was considered determinative. From year to year, the Trustees consider and place emphasis on relevant information in light of changing circumstances in market and economic conditions. The Trustees determined that the compensation to be received by the Adviser from the Portfolio under the Advisory Agreement was fair and reasonable and that the continuance of the investment advisory contract was in the best interests of the Portfolio and its shareholders.
The factors summarized below were considered and discussed by the Trustees in reaching their conclusions:
Nature, Extent and Quality of Services Provided by the Adviser
The Trustees received and considered information regarding the nature, extent and quality of the services provided to the Portfolio under the Advisory Agreement. The Trustees took into account information furnished throughout the year at Trustee meetings, as well as the materials furnished specifically in connection with this annual review process. The Trustees considered the background and experience of the Adviser’s senior management and the expertise of, and the amount of attention given to the Portfolio by, investment personnel of the Adviser. In addition, the Trustees reviewed the qualifications, backgrounds and responsibilities of the portfolio management team primarily responsible for the day-to-day management of the Portfolio and the infrastructure supporting the team. The Trustees also considered information provided by the Adviser and JPMorgan Distribution Services, Inc. (“JPMDS”) about the structure and distribution strategy of the Portfolio. The Trustees also reviewed information relating to the Adviser’s risk governance model and reports showing the Adviser’s compliance structure and ongoing compliance processes. The quality of the administrative services provided by JPMorgan Funds Management, Inc. (“JPMFM”), an affiliate of the Adviser, was also considered.
The Board of Trustees also considered its knowledge of the nature and quality of the services provided by the Adviser to the Portfolio gained from their experience as Trustees of the J.P. Morgan Funds. In addition, they considered the overall reputation and capabilities of the Adviser and its affiliates, the commitment of the Adviser to provide high quality service to the Portfolio, their overall confidence in the Adviser’s integrity and the Adviser’s responsiveness to questions or concerns raised by them, including the Adviser’s willingness to consider and implement organizational and operational changes designed to improve investment results and the services provided to the Portfolio.
Based on these considerations and other factors, the Trustees concluded that they were satisfied with the nature, extent and quality of the investment advisory services provided to the Portfolio by the Adviser.
| DECEMBER 31, 2013 | JPMORGAN INSURANCE TRUST | 29 | ||||||
Table of Contents
BOARD APPROVAL OF INVESTMENT ADVISORY AGREEMENT
(Unaudited) (continued)
Costs of Services Provided and Profitability to the Adviser and its Affiliates
The Trustees received and considered information regarding the profitability to the Adviser and its affiliates in providing services to the Portfolio. The Trustees reviewed and discussed this data. The Trustees recognized that this data is not audited and represents the Adviser’s determination of its and its affiliates’ revenues from the contractual services provided to the Portfolio, less expenses of providing such services. Expenses include direct and indirect costs and are calculated using an allocation methodology developed by the Adviser. The Trustees also recognized that it is difficult to make comparisons of profitability from fund investment advisory contracts because comparative information is not generally publicly available and is affected by numerous factors, including the structure of the particular adviser, the types of funds it manages, its business mix, numerous assumptions regarding allocations and the fact that publicly-traded fund managers’ operating profits and net income are net of distribution and marketing expenses. Based on their review, the Trustees concluded that the profitability to the Adviser under the Advisory Agreement was not unreasonable in light of the services and benefits provided to the Portfolio.
Fall-Out Benefits
The Trustees reviewed information regarding potential “fallout” or ancillary benefits received by the Adviser and its affiliates as a result of their relationship with the Portfolio. The Board also reviewed the adviser’s allocation of fund brokerage for the J.P. Morgan Funds complex, including allocations to brokers who provide research to the adviser.
The Trustees also considered that JPMFM earns fees from the Portfolio for providing administrative services. These fees were shown separately in the profitability analysis presented to the Trustees. The Trustees also considered the fees paid to JPMorgan Chase Bank, N.A. (“JPMCB”) for custody and fund accounting and other related services.
Economies of Scale
The Trustees noted that the proposed investment advisory fee schedule for the Portfolio does not contain breakpoints. The Trustees considered whether it would be appropriate to add advisory fee breakpoints and the Trustees concluded that the current fee structure was reasonable in light of the fee waivers and expense limitations that the Adviser has in place that serve to limit the overall net expense ratio at competitive levels. The Trustees also recognized that the fee schedule for the admin
istrative services provided by JPMFM does include a fee breakpoint, which is tied to the overall level of non-money market fund assets excluding certain funds-of-funds, as applicable, advised by the Adviser, and that the Portfolio benefits from that breakpoint. The Trustees concluded that shareholders
benefited from the lower expense ratios which resulted from these factors.
Independent Written Evaluation of the Portfolio’s Chief Compliance Officer
The Trustees noted that, upon their direction, the Chief Compliance Officer for the Portfolio had prepared an independent written evaluation in order to assist the Trustees in determining the reasonableness of the proposed management fees. The Trustees considered the written evaluation in determining whether to continue the Advisory Agreement.
Fees Relative to Adviser’s Other Clients
The Trustees received and considered information about the nature and extent of investment advisory services and fee rates offered to other clients of the Adviser for investment management styles substantially similar to that of the Portfolio. The Trustees also considered the complexity of investment management for the Portfolio relative to the Adviser’s other clients and the differences in the nature and extent of the services provided to the different clients. The Trustees concluded that the fee rates charged to the Portfolio in comparison to those charged to the Adviser’s other clients were reasonable.
Investment Performance
The Trustees received and considered absolute and/or relative performance for the Portfolio in a report prepared by Lipper. The Trustees considered the total return performance information, which included the ranking of the Portfolio within a performance universe made up of funds with the same Lipper investment classification and objective (the “Universe Group”) by total return for applicable one-, three- and five-year periods. The Trustees reviewed a description of Lipper’s methodology for selecting mutual funds in the Portfolio’s Universe Group. As part of this review, the Trustees also reviewed the Portfolio’s performance against its benchmark and considered the performance information provided for the Portfolio at regular Board meetings by the Adviser. The Lipper performance data noted by the Trustees as part of their review and the determinations made by the Trustees with respect to the Portfolio’s performance are summarized below:
The Trustees noted the Portfolio’s performance was in the third, fourth, and third, quintiles for Class 1 shares for each of the one-, three-, and five-year periods ended December 31, 2012, respectively. The Trustees discussed the performance and investment strategy of the Portfolio with the Adviser and, based upon this discussion and various other factors, concluded that the performance was reasonable.
Advisory Fees and Expense Ratios
The Trustees considered the contractual advisory fee rate paid by the Portfolio to the Adviser and compared that rate to the
| 30 | JPMORGAN INSURANCE TRUST | DECEMBER 31, 2013 | ||||
Table of Contents
BOARD APPROVAL OF INVESTMENT ADVISORY AGREEMENT
(Unaudited) (continued)
information prepared by Lipper concerning management fee rates paid by other funds in the same Lipper category as the Portfolio. The Trustees recognized that Lipper reported the Portfolio’s management fee rate as the combined contractual advisory fee and administration fee rates. The Trustees also reviewed information about other expenses and the expense ratios for the Portfolio. The Trustees considered the fee waiver and/or expense reimbursement arrangements currently in place for the Portfolio and considered the net advisory fee rate after taking into account any waivers and/or reimbursements. The Trustees recognized that it is difficult to make comparisons
of advisory fees because there are variations in the services that are included in the fees paid by other funds. The Trustees’ determinations as a result of the review of the Portfolio’s advisory fees and expense ratios are summarized below:
The Trustees noted that the Portfolio’s net advisory fee and actual total expenses for Class 1 shares were in the second and fourth quintiles, respectively, of their Universe Group. After considering the factors identified above, in light of this information, the Trustees concluded that the advisory fee was reasonable.
| DECEMBER 31, 2013 | JPMORGAN INSURANCE TRUST | 31 | ||||||
Table of Contents
(Unaudited)
Certain tax information for the Portfolio is required to be provided to shareholders based upon the Portfolio’s income and distributions for the taxable year ended December 31, 2013. The information and distributions reported in this letter may differ from the information and taxable distributions reported to the shareholders for the calendar year ending December 31, 2013. The information necessary to complete your income tax returns for the calendar year ending December 31, 2013 will be received under separate cover.
Dividends Received Deductions (DRD)
The Portfolio hereby designates 100.00% or the maximum allowable percentage as ordinary income distributions eligible for the 70% dividend received deduction for corporate rate shareholders for the fiscal year ended December 31, 2013.
Long Term Capital Gain Notice
The Portfolio distributed $2,249,653 as long-term capital gain dividends for the purpose of the dividend paid deduction on its respective tax return for the fiscal year ended December 31, 2013.
| 32 | JPMORGAN INSURANCE TRUST | DECEMBER 31, 2013 | ||||
Table of Contents
J.P. Morgan Funds are distributed by JPMorgan Distribution Services, Inc., which is an affiliate of JPMorgan Chase & Co. Affiliates of JPMorgan Chase & Co. receive fees for providing various services to the funds.
Contact JPMorgan Distribution Services, Inc. at 1-800-480-4111 for a portfolio prospectus. You can also visit us at www.jpmorganfunds.com. Investors should carefully consider the investment objectives and risk as well as charges and expenses of the mutual fund before investing. The prospectus contains this and other information about the mutual fund. Read the prospectus carefully before investing.
The Portfolio files a complete schedule of its portfolio holdings for the first and third quarters of its fiscal year with the SEC on Form N-Q. The Portfolio’s Forms N-Q are available on the SEC’s website at http://www.sec.gov and may be reviewed and copied at the SEC’s Public Reference Room in Washington, DC. Information on the operation of the SEC’s Public Reference Room may be obtained by calling 1-800-SEC-0330. Shareholders may request the Form N-Q without charge by calling 1-800-480-4111 or by visiting the variable insurance portfolio section of the J.P. Morgan Funds’ website at www.jpmorganfunds.com.
A description of the Portfolio’s policies and procedures with respect to the disclosure of the Portfolio’s holdings is available in the prospectus and Statement of Additional Information.
A copy of proxy policies and procedures is available without charge upon request by calling 1-800-480-4111 and on the Portfolio’s website at www.jpmorganfunds.com. A description of such policies and procedures is on the SEC’s website at www.sec.gov. The Trustees have delegated the authority to vote proxies for securities owned by the Portfolio to the Adviser. A copy of the Portfolio’s voting record for the most recent 12-month period ended June 30 is available on the SEC’s website at www.sec.gov or at the Portfolio’s website at www.jpmorganfunds.com no later than August 31 of each year. The Portfolio’s proxy voting record will include, among other things, a brief description of the matter voted on for each portfolio security, and will state how each vote was cast, for example, for or against the proposal.
Table of Contents
| © JPMorgan Chase & Co., 2014. All rights reserved. December 2013. | AN-JPMITEIP-1213 |
Table of Contents
Annual Report
JPMorgan Insurance Trust
December 31, 2013
JPMorgan Insurance Trust International Equity Portfolio
NOT FDIC INSURED Ÿ NO BANK GUARANTEE Ÿ MAY LOSE VALUE
|  |
Table of Contents
Investments in the Portfolio are not bank deposits or obligations of, or guaranteed or endorsed by, any bank and are not insured or guaranteed by the FDIC, the Federal Reserve Board or any other government agency. You could lose money if you sell when the Portfolio’s share price is lower than when you invested.
Past performance is no guarantee of future performance. The general market views expressed in this report are opinions based on market and other conditions through the end of the reporting period and are subject to change without notice. These views are not intended to predict the future performance of the Portfolio or the securities markets. References to specific securities and their issuers are for illustrative purposes only and are not intended to be, and should not be interpreted as, recommendations to purchase or sell such securities. Such views are not meant as investment advice and may not be relied on as an indication of trading intent on behalf of the Portfolio.
This Portfolio is intended to be a funding vehicle for variable annuity contracts and variable life insurance policies (collectively “Policies”) offered by separate accounts of participating insurance companies. Portfolio shares are also offered through qualified pension and retirement plans (“Eligible Plans”). Individuals may not purchase shares directly from the Portfolio.
Prospective investors should refer to the Portfolio’s prospectus for a discussion of the Portfolio’s investment objective, strategies and risks. Call J.P. Morgan Funds Service Center at 1-800-480-4111 for a prospectus containing more complete information about the Portfolio, including management fees and other expenses. Please read it carefully before investing.
Table of Contents
JANUARY 23, 2014 (Unaudited)
Dear Shareholder,
Equities markets in developed economies performed strongly in the face of periodic spikes in volatility throughout the twelve months ended December 31, 2013. Healthy corporate earnings and incremental but steady improvements in a range of economic indicators provided a positive backdrop for investors seeking returns in the low interest rate environment. While political discord in Washington injected volatility into the market, a bipartisan budget agreement at the end of the year relieved much of the political uncertainty created by partisan brinkmanship over the so-called fiscal cliff and the partial shutdown of the federal government in October. In the first half of the year, the U.S. Federal Reserve (“Fed”) announced its intention to taper off its $85 billion in monthly asset purchases and the statement weakened investor sentiment and set off widespread speculation about the timing and magnitude of such a move. The Fed followed through in December, deciding to reduce its monthly purchases by $10 billion. The news, along with robust gains in jobs, housing and consumer sentiment, drove U.S. equities to new highs. The S&P 500 stock index hit seven closing highs in the final month of the reporting period, finishing 2013 with its best performance since 1997.
 |
“While a repeat of the equity performance we experienced in 2013 may be a tall order, we believe stocks in the U.S. and Europe may continue to show gains.” |
Overseas, the European Central Bank reaffirmed its commitment to accommodative monetary policy and to the euro itself. In the second quarter of the year, the European Union (EU) returned to positive growth and at the end of the year, Ireland became the first nation to exit from its European Union bailout program. The Fed’s decision to curb its asset purchases also sent equities higher in Europe, as investors viewed the move as a sign of further economic stability. In Japan, equity markets rebounded to their best year since 1988, benefitting from Prime Minister Shinzo Abe’s efforts to revive the economy. Low returns on bonds and short-term debt instruments also drove investors into stocks.
Emerging market equities were weaker overall. As of December 31, 2013, the MSCI Emerging Markets Index returned -2.3% for the year. China’s economy showed signs of slower growth during the year and the Fed’s decision to taper its asset purchase program set off speculation that the maturation of the emerging markets credit cycle would push yield-seeking investors to rotate into developed markets.
Taper Talk Pressures Bonds
Fixed income markets generally remained weak during the year, as central bankers across the globe held interest rates at historic lows. However, benchmark bond yields rose on an
annual basis for the first time since 2009. During the year, the Fed’s talk of tapering off its Quantitative Easing (QE) program hurt fixed income markets. U.S. Treasury security yields continued to be low from a historical perspective, but ended the period higher. The yield for 10-year U.S. Treasury securities ended December 31, 2013 at 3.04%, while the yields for 2- and 30-year U.S. Treasury securities finished the reporting period at 0.38% and 3.96%, respectively. High-yield debt returned 7.4% for the year, as measured by the Barclays US High Yield Corporate Index, while other U.S. debt securities and emerging market debt both had negative returns.
While global economic growth accelerated during the year, the U.S. recovery in particular showed stronger fundamentals and the Fed’s decision to taper its QE program was a response to the improved picture. Europe emerged from its lengthy recession and the worst of the fiscal crises seem to be behind it, though unemployment remains strikingly high in many EU nations. Japan made progress toward ending persistent deflation, but Tokyo’s monetary and fiscal stimulus has sharply weakened the yen, putting other Asian exporting nations – notably China and South Korea – at a competitive disadvantage. Emerging market economies may face further headwinds as foreign investment shrinks and economic growth moderates from recent strength. Moreover, political instability – already apparent in Thailand and Turkey – may surface in other emerging market nations as governments struggle to deliver improved living standards and respond to demands for political reforms.
The Long-Term Lens
We welcome the Fed’s move to curb its QE program as a sign that the U.S. economy’s need for artificial stimulus is waning. While a repeat of the equity performance we experienced in 2013 may be a tall order, we believe stocks in the U.S. and Europe may continue to show gains. In the fixed-income market, persistent weakness has led to attractive valuations in some sectors. The past year’s market swings and intermittent volatility underlined the importance of maintaining a long-term view of your investment portfolio and the benefits derived from diversified holdings.
On behalf of everyone at J.P. Morgan Asset Management, thank you for your continued support. We look forward to managing your investment needs for years to come. Should you have any questions, please visit www.jpmorganfunds.com or contact the J.P. Morgan Funds Service Center at 1-800-480-4111.
Sincerely yours,

George C.W. Gatch
CEO, Global Funds Management
J.P. Morgan Asset Management
| DECEMBER 31, 2013 | JPMORGAN INSURANCE TRUST | 1 | ||||||
Table of Contents
JPMorgan Insurance Trust International Equity Portfolio
TWELVE MONTHS ENDED DECEMBER 31, 2013 (Unaudited)
| Reporting Period Return: | ||||
| Portfolio (Class 1 Shares)* | 15.45% | |||
| Morgan Stanley Capital International (“MSCI”) Europe, Australasia and Far East (“EAFE”) Index (net of foreign withholding taxes) | 22.78% | |||
| Net Assets as of 12/31/2013 | $ | 33,711,674 | ||
INVESTMENT OBJECTIVE**
The JPMorgan Insurance Trust International Equity Portfolio (the “Portfolio”) seeks to provide high total return from a portfolio of equity securities of foreign companies. Total return consists of capital growth and current income.
HOW DID THE MARKET PERFORM?
Equity markets in the U.S. and Europe performed strongly during the 12 months ended December 31, 2013, as the global economic recovery continued to gain strength from healthy corporate earnings and the continuation of stimulative policies from central banks around the globe. Early in the year, the European Central Bank reiterated its commitment to accommodative monetary policy and explicitly stated its commitment to the euro. The sovereign debt crises that had gripped several members of the European Union (EU) appeared to recede and by year end, Ireland became the first nation to exit its EU bailout program. At midyear, the U.S. Federal Reserve Board’s (“Fed”) announcement that it would taper its $85 billion in monthly asset purchases if economic conditions improved caused a spike in interest rates and pressured prices for both stocks and bonds. The Fed followed through in December, paring the so-called Quantitative Easing program to $75 billion a month. The move drove equities higher in the U.S. and Europe, where benchmark indexes closed at their highest levels in years. In Japan, Prime Minister Shinzo Abe’s three-pronged approach to economic stimulus appeared to show results and equities there closed out the period at their highest levels since 1988. Emerging market equities ended the period weaker as growth slowed and higher interest rates in the developed world put pressure on the currencies of countries running current account deficits. The MSCI EAFE Index (net of foreign withholding taxes) (the “Benchmark”) finished the twelve months ended December 31, 2013 with a 22.78% gain.
WHAT WERE THE MAIN DRIVERS OF THE PORTFOLIO’S PERFORMANCE?
The Portfolio (Class 1 Shares) underperformed the Benchmark for the twelve months ended December 31, 2013. The Portfolio’s stock selection in the consumer discretionary and financial sectors was the main detractors from relative
performance. The Portfolio’s underweight position in the utilities sector made a positive contribution to relative performance as did an overweight to the consumer discretionary sector, though in the latter case the allocation benefit was not sufficient to overcome the negative impact of stock selection in the sector.
Individual detractors from relative performance included the Portfolio’s overweight positions in Standard Chartered PLC, Komatsu Ltd. and Nitto Denko Corp. Shares of Standard Chartered, a U.K. bank, fell after the company warned that operating profit would decline for the first time in a decade as growth in emerging markets, which account for the bulk of company earnings, slowed. Shares of Komatsu, a Japanese construction equipment company, weakened after it scaled back its profit forecast as slumping demand for mining equipment overshadowed the benefits of a weaker yen and improvements in Japan and China. Shares of Nitto Denko, a Japanese manufacturer of industrial adhesives and specialty optics, fell after the company cut its profit forecast, citing fiercer competition from new entrants and weaker-than-expected demand for computer tablets
Individual contributors to relative performance included the Portfolio’s overweight positions in Prudential PLC, WPP PLC and AXA SA. Shares of Prudential, a British insurer, and AXA, a French insurer, rose during the period. Insurance stocks, in general, were boosted by the prospect of higher interest rates. Prudential reported results that surpassed analysts’ expectations and the company raised its dividend. AXA reported better-than-expected interim earnings and improving profitability. Shares of U.K. advertising company WPP advanced on strong revenue growth and acquisitions.
HOW WAS THE PORTFOLIO POSITIONED?
The portfolio managers focused on stock selection to build a portfolio of international equities. They used bottom-up fundamental research to identify what they believed were attractively priced stocks of well-managed companies with the potential to grow their earnings faster than their industry peers.
| 2 | JPMORGAN INSURANCE TRUST | DECEMBER 31, 2013 | ||||
Table of Contents
| TOP TEN EQUITY HOLDINGS OF THE PORTFOLIO*** | ||||||||
| 1. | Royal Dutch Shell plc, Class A (Netherlands) | 3.0 | % | |||||
| 2. | HSBC Holdings plc (United Kingdom) | 2.7 | ||||||
| 3. | BG Group plc (United Kingdom) | 2.4 | ||||||
| 4. | Vodafone Group plc (United Kingdom) | 2.3 | ||||||
| 5. | Nestle S.A. (Switzerland) | 2.3 | ||||||
| 6. | BHP Billiton Ltd. (Australia) | 2.2 | ||||||
| 7. | Toyota Motor Corp. (Japan) | 2.1 | ||||||
| 8. | Standard Chartered plc (United Kingdom) | 2.1 | ||||||
| 9. | Novartis AG (Switzerland) | 2.1 | ||||||
| 10. | Roche Holding AG (Switzerland) | 2.0 | ||||||
PORTFOLIO COMPOSITION BY COUNTRY*** | ||||
| United Kingdom | 23.7 | % | ||
| Japan | 18.3 | |||
| Switzerland | 14.6 | |||
| France | 11.8 | |||
| Germany | 9.9 | |||
| Netherlands | 5.6 | |||
| Hong Kong | 3.6 | |||
| China | 3.0 | |||
| Australia | 3.0 | |||
| South Korea | 1.6 | |||
| Belgium | 1.5 | |||
| Others (each less than 1.0%) | 3.4 | |||
| * | The return shown is based on net asset values calculated for shareholder transactions and may differ from the return shown in the financial highlights, which reflects adjustments made to the net asset values in accordance with accounting principles gener- ally accepted in the United States of America. |
| ** | The adviser seeks to achieve the Portfolio’s objective. There can be no guarantee it will be achieved. |
| *** | Percentages indicated are based on total investments as of December 31, 2013. The Portfolio’s composition is subject to change. |
| DECEMBER 31, 2013 | JPMORGAN INSURANCE TRUST | 3 | ||||||
Table of Contents
JPMorgan Insurance Trust International Equity Portfolio
PORTFOLIO COMMENTARY
TWELVE MONTHS ENDED DECEMBER 31, 2013 (Unaudited) (continued)
AVERAGE ANNUAL TOTAL RETURNS AS OF DECEMBER 31, 2013 | ||||||||||||||||
| INCEPTION DATE OF CLASS | 1 YEAR | 5 YEAR | 10 YEAR | |||||||||||||
CLASS 1 SHARES | 1/3/95 | 15.45 | % | 12.34 | % | 6.26 | % | |||||||||
CLASS 2 SHARES | 4/24/09 | 15.14 | 12.07 | 6.13 | ||||||||||||
TEN YEAR PERFORMANCE (12/31/03 TO 12/31/13)
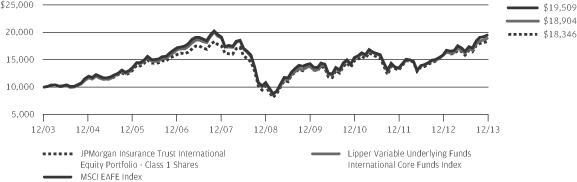
The performance quoted is past performance and is not a guarantee of future results. Mutual Funds are subject to certain market risks. Investment returns and principal value of an investment will fluctuate so that an investor’s shares, when redeemed, may be worth more or less than their original cost. Current performance may be higher or lower than the performance data shown. For up-to-date, month-end performance information please call 1-800-480-4111.
Inception date for Class 1 Shares is January 3, 1995, which is the inception date of JPMorgan International Equity Portfolio (“Predecessor Portfolio”). The JPMorgan Insurance Trust International Equity Portfolio acquired all of the assets and liabilities of the Predecessor Portfolio in a reorganization on April 24, 2009. The Predecessor Portfolio’s performance and financial history have been adopted by JPMorgan Insurance Trust International Equity Portfolio and have been used since the reorganization. As a result the performance for Class 1 Shares prior to April 25, 2009 is the performance of the Predecessor Portfolio.
Returns for Class 2 Shares prior to its inception date are based on the performance of Class 1 Shares. The actual returns of Class 2 Shares would have been lower than shown because Class 2 Shares have higher expenses than Class 1 Shares and the Predecessor Portfolio.
The graph illustrates comparative performance for $10,000 invested in Class 1 Shares of the JPMorgan Insurance Trust International Equity Portfolio, the MSCI EAFE Index and the Lipper Variable Underlying Funds International Core Funds Index from December 31, 2003 to December 31, 2013. The performance of the Portfolio assumes reinvestment of all dividends and capital gain distributions, if any. The performance of the MSCI EAFE Index does not reflect the deduction of expenses associated with a mutual fund and approximates the minimum possible dividend reinvestment of the securities included in the benchmark. The
dividend is reinvested after deduction of withholding tax, applying the maximum rate to non-resident institutional investors who do not benefit from double taxation treaties. The performance of the Lipper Variable Underlying Funds International Core Funds Index includes expenses associated with a mutual fund, such as investment management fees. These expenses are not identical to the expenses incurred by the Portfolio. The MSCI EAFE Index is a free float-adjusted market capitalization weighted index that is designed to measure the equity market performance of developed markets, excluding U.S. and Canada. The Lipper Variable Underlying Funds International Core Funds Index is an index based on the total returns of certain mutual funds within the Portfolio’s designated category as determined by Lipper, Inc. Investors cannot invest directly in an index.
Portfolio performance does not reflect any charges imposed by the Policies or Eligible Plans. If these charges were included, the returns would be lower than shown. Performance may reflect the waiver of the Portfolio’s fees and reimbursement of expenses for certain periods since the inception date. Without these waivers and reimbursements, performance would have been lower.
International investing involves a greater degree of risk and increased volatility. Changes in currency exchange rates and differences in accounting and taxation policies outside the United States can raise or lower returns. Also, some overseas markets may not be as politically and economically stable as the United States and other nations. The Portfolio may also be subject to the additional risk of “regional” investing, which involves focusing investments in a particular geographic region or regions.
The returns shown are based on net asset values calculated for shareholder transactions and may differ from the returns shown in the financial highlights, which reflect adjustments made to the net asset values in accordance with accounting principles generally accepted in the United States of America.
| 4 | JPMORGAN INSURANCE TRUST | DECEMBER 31, 2013 | ||||
Table of Contents
JPMorgan Insurance Trust International Equity Portfolio
SCHEDULE OF PORTFOLIO INVESTMENTS
AS OF DECEMBER 31, 2013
| SHARES | SECURITY DESCRIPTION | VALUE($) | ||||||
| Common Stocks — 97.0% |
| ||||||
Australia — 3.0% | ||||||||
| 21,160 | BHP Billiton Ltd. (m) | 721,407 | ||||||
| 4,697 | Rio Tinto Ltd. (m) | 287,490 | ||||||
|
| |||||||
| 1,008,897 | ||||||||
|
| |||||||
Belgium — 1.4% | ||||||||
| 4,580 | Anheuser-Busch InBev N.V. (m) | 487,020 | ||||||
|
| |||||||
China — 3.0% | ||||||||
| 362,000 | China Construction Bank Corp., Class H (m) | 274,074 | ||||||
| 145,000 | CNOOC Ltd. (m) | 269,668 | ||||||
| 398,500 | Industrial & Commercial Bank of China Ltd., Class H (m) | 270,227 | ||||||
| 23,000 | Ping An Insurance Group Co. of China Ltd., Class H (m) | 206,635 | ||||||
|
| |||||||
| 1,020,604 | ||||||||
|
| |||||||
Denmark — 0.7% | ||||||||
| 1,260 | Novo Nordisk A/S, Class B (m) | 230,960 | ||||||
|
| |||||||
France — 11.7% | ||||||||
| 7,343 | Accor S.A. (m) | 346,809 | ||||||
| 15,689 | AXA S.A. (m) | 436,901 | ||||||
| 4,079 | BNP Paribas S.A. (m) | 318,192 | ||||||
| 1,856 | Essilor International S.A. (m) | 197,492 | ||||||
| 2,745 | Imerys S.A. (m) | 238,947 | ||||||
| 1,469 | Kering (m) | 310,518 | ||||||
| 3,930 | Lafarge S.A. (m) | 294,986 | ||||||
| 1,777 | LVMH Moet Hennessy Louis Vuitton S.A. (m) | 324,647 | ||||||
| 2,187 | Pernod Ricard S.A. (m) | 249,168 | ||||||
| 4,997 | Sanofi (m) | 533,654 | ||||||
| 3,696 | Schneider Electric S.A. (m) | 322,445 | ||||||
| 3,960 | Technip S.A. (m) | 381,192 | ||||||
|
| |||||||
| 3,954,951 | ||||||||
|
| |||||||
Germany — 7.3% | ||||||||
| 2,730 | Allianz SE (m) | 491,197 | ||||||
| 3,910 | Bayer AG (m) | 549,006 | ||||||
| 2,670 | Fresenius Medical Care AG & Co. KGaA (m) | 190,440 | ||||||
| 1,252 | Linde AG (m) | 262,151 | ||||||
| 7,378 | SAP AG (m) | 639,833 | ||||||
| 2,470 | Siemens AG (m) | 338,683 | ||||||
|
| |||||||
| 2,471,310 | ||||||||
|
| |||||||
Hong Kong — 3.6% | ||||||||
| 67,000 | Belle International Holdings Ltd. (m) | 77,838 | ||||||
| 35,000 | Cheung Kong Holdings Ltd. (m) | 553,727 | ||||||
| 89,000 | Hang Lung Properties Ltd. (m) | 282,120 | ||||||
| 36,400 | Sands China Ltd. (m) | 298,311 | ||||||
|
| |||||||
| 1,211,996 | ||||||||
|
| |||||||
| SHARES | SECURITY DESCRIPTION | VALUE($) | ||||||
India — 0.5% | ||||||||
| 5,200 | HDFC Bank Ltd., ADR (m) | 179,088 | ||||||
|
| |||||||
Indonesia — 0.3% | ||||||||
| 188,000 | Astra International Tbk PT (m) | 105,290 | ||||||
|
| |||||||
Israel — 0.7% | ||||||||
| 5,430 | Teva Pharmaceutical Industries Ltd., ADR (m) | 217,634 | ||||||
|
| |||||||
Japan — 18.2% | ||||||||
| 5,900 | Astellas Pharma, Inc. (m) | 349,792 | ||||||
| 5,500 | Canon, Inc. (m) | 175,496 | ||||||
| 4,400 | Daikin Industries Ltd. (m) | 274,572 | ||||||
| 4,400 | East Japan Railway Co. (m) | 350,495 | ||||||
| 1,800 | FANUC Corp. (m) | 329,833 | ||||||
| 15,000 | Honda Motor Co., Ltd. (m) | 619,157 | ||||||
| 13,000 | Japan Tobacco, Inc. (m) | 423,004 | ||||||
| 16,500 | Komatsu Ltd. (m) | 338,766 | ||||||
| 25,000 | Kubota Corp. (m) | 414,681 | ||||||
| 4,500 | Makita Corp. (m) | 236,667 | ||||||
| 16,000 | Mitsubishi Corp. (m) | 307,167 | ||||||
| 2,600 | Nidec Corp. (m) | 256,138 | ||||||
| 4,800 | Nitto Denko Corp. (m) | 202,966 | ||||||
| 6,200 | Shin-Etsu Chemical Co., Ltd. (m) | 362,634 | ||||||
| 1,400 | SMC Corp. (m) | 353,344 | ||||||
| 22,900 | Sumitomo Corp. (m) | 287,810 | ||||||
| 11,600 | Toyota Motor Corp. (m) | 707,311 | ||||||
| 26,200 | Yahoo! Japan Corp. (m) | 146,102 | ||||||
|
| |||||||
| 6,135,935 | ||||||||
|
| |||||||
Netherlands — 5.6% | ||||||||
| 5,240 | Akzo Nobel N.V. (m) | 406,341 | ||||||
| 1,217 | ASML Holding N.V. (m) | 113,986 | ||||||
| 26,133 | ING Groep N.V., CVA (a) (m) | 365,040 | ||||||
| 28,289 | Royal Dutch Shell plc, Class A (m) | 1,009,996 | ||||||
|
| |||||||
| 1,895,363 | ||||||||
|
| |||||||
South Korea — 1.6% | ||||||||
| 620 | Hyundai Mobis (a) (m) | 172,610 | ||||||
| 286 | Samsung Electronics Co., Ltd. (m) | 372,672 | ||||||
|
| |||||||
| 545,282 | ||||||||
|
| |||||||
Sweden — 0.6% | ||||||||
| 6,730 | Atlas Copco AB, Class A (m) | 186,866 | ||||||
|
| |||||||
Switzerland — 14.5% | ||||||||
| 14,960 | ABB Ltd. (a) (m) | 395,543 | ||||||
| 2,860 | Cie Financiere Richemont S.A. (m) | 285,707 | ||||||
| 13,210 | Credit Suisse Group AG (a) (m) | 407,705 | ||||||
| 61,976 | Glencore Xstrata plc (a) (m) | 322,434 | ||||||
| 3,176 | Holcim Ltd. (a) (m) | 237,452 | ||||||
SEE NOTES TO FINANCIAL STATEMENTS.
| DECEMBER 31, 2013 | JPMORGAN INSURANCE TRUST | 5 | ||||||
Table of Contents
JPMorgan Insurance Trust International Equity Portfolio
SCHEDULE OF PORTFOLIO INVESTMENTS
AS OF DECEMBER 31, 2013 (continued)
| SHARES | SECURITY DESCRIPTION | VALUE($) | ||||||
| Common Stocks — Continued | |||||||
Switzerland — Continued |
| |||||||
| 10,482 | Nestle S.A. (m) | 768,226 | ||||||
| 8,609 | Novartis AG (m) | 690,006 | ||||||
| 2,445 | Roche Holding AG (m) | 684,909 | ||||||
| 58 | SGS S.A. (m) | 133,531 | ||||||
| 26,029 | UBS AG (a) (m) | 498,386 | ||||||
| 1,615 | Zurich Insurance Group AG (a) (m) | 468,454 | ||||||
|
| |||||||
| 4,892,353 | ||||||||
|
| |||||||
Taiwan — 0.7% | ||||||||
| 12,757 | Taiwan Semiconductor Manufacturing Co., Ltd., ADR (m) | 222,482 | ||||||
|
| |||||||
United Kingdom — 23.6% | ||||||||
| 6,600 | Aggreko plc (m) | 187,180 | ||||||
| 128,008 | Barclays plc (m) | 578,837 | ||||||
| 37,231 | BG Group plc (m) | 801,150 | ||||||
| 7,160 | British American Tobacco plc (m) | 384,307 | ||||||
| 14,000 | Burberry Group plc (m) | 352,734 | ||||||
| 39,679 | Centrica plc (m) | 228,814 | ||||||
| 84,566 | HSBC Holdings plc (m) | 921,881 | ||||||
| 9,141 | Imperial Tobacco Group plc (m) | 354,379 | ||||||
| 36,070 | Marks & Spencer Group plc (m) | 259,015 | ||||||
| 25,050 | Meggitt plc (m) | 219,324 | ||||||
| 25,587 | Prudential plc (m) | 571,716 | ||||||
| 5,828 | Rio Tinto plc (m) | 329,338 | ||||||
| 30,784 | Standard Chartered plc (m) | 695,317 | ||||||
| 36,608 | Tesco plc (m) | 203,297 | ||||||
| 13,290 | Tullow Oil plc (m) | 188,619 | ||||||
| 9,552 | Unilever plc (m) | 393,025 | ||||||
| 195,478 | Vodafone Group plc (m) | 769,635 | ||||||
| 22,093 | WPP plc (m) | 506,017 | ||||||
|
| |||||||
| 7,944,585 | ||||||||
|
| |||||||
Total Common Stocks | 32,710,616 | |||||||
|
| |||||||
| Preferred Stocks — 2.5% | |||||||
Germany — 2.5% | ||||||||
| 2,330 | Henkel AG & Co. KGaA (m) | 270,827 | ||||||
| 2,002 | Volkswagen AG (m) | 563,400 | ||||||
|
| |||||||
Total Preferred Stocks | 834,227 | |||||||
|
| |||||||
Total Investments — 99.5% | 33,544,843 | |||||||
Other Assets in Excess of | 166,831 | |||||||
|
| |||||||
NET ASSETS — 100.0% | $ | 33,711,674 | ||||||
|
| |||||||
Percentages indicated are based on net assets.
Summary of Investments by Industry, December 31, 2013
The following table represents the portfolio investments of the Portfolio by industry classifications as a percentage of total investments:
| INDUSTRY | PERCENTAGE | |||
Pharmaceuticals | 9.7 | % | ||
Commercial Banks | 9.7 | |||
Oil, Gas & Consumable Fuels | 6.8 | |||
Insurance | 6.5 | |||
Automobiles | 5.9 | |||
Machinery | 5.5 | |||
Metals & Mining | 5.0 | |||
Textiles, Apparel & Luxury Goods | 3.8 | |||
Chemicals | 3.7 | |||
Tobacco | 3.5 | |||
Food Products | 3.5 | |||
Electrical Equipment | 2.9 | |||
Capital Markets | 2.7 | |||
Real Estate Management & Development | 2.5 | |||
Construction Materials | 2.3 | |||
Wireless Telecommunication Services | 2.3 | |||
Beverages | 2.2 | |||
Semiconductors & Semiconductor Equipment | 2.1 | |||
Hotels, Restaurants & Leisure | 1.9 | |||
Software | 1.9 | |||
Trading Companies & Distributors | 1.8 | |||
Media | 1.5 | |||
Energy Equipment & Services | 1.1 | |||
Diversified Financial Services | 1.1 | |||
Road & Rail | 1.0 | |||
Industrial Conglomerates | 1.0 | |||
Others (each less than 1.0%) | 8.1 | |||
NOTES TO SCHEDULE OF PORTFOLIO INVESTMENTS:
| ADR | — American Depositary Receipt | |
| CVA | — Dutch Certification | |
| (a) | — Non-income producing security. | |
| (m) | — All or a portion of this security is reserved and/or pledged with the custodian for current or potential holdings of futures, swaps, options, TBAs, when-issued securities, delayed delivery securities, reverse repurchase agreements, unfunded commitments and/or forward foreign currency exchange contracts. | |
The value and percentage, based on total investments, of the investments that apply the fair valuation policy for the international investments described in Note 2.A. of the notes to financial statements are $32,925,638 which amounts to 98.2% of total investments.
SEE NOTES TO FINANCIAL STATEMENTS.
| 6 | JPMORGAN INSURANCE TRUST | DECEMBER 31, 2013 | ||||
Table of Contents
STATEMENT OF ASSETS AND LIABILITIES
AS OF DECEMBER 31, 2013
International | ||||
ASSETS: | ||||
Investments in non-affiliates, at value | $ | 33,544,843 | ||
Cash | 208,446 | |||
Foreign currency, at value | 38 | |||
Receivables: | ||||
Portfolio shares sold | 677 | |||
Dividends from non-affiliates | 22,964 | |||
Tax reclaims | 46,418 | |||
|
| |||
Total Assets | 33,823,386 | |||
|
| |||
LIABILITIES: | ||||
Payables: | ||||
Portfolio shares redeemed | 20,686 | |||
Accrued liabilities: | ||||
Investment advisory fees | 15,165 | |||
Distribution fees | 15 | |||
Custodian and accounting fees | 20,760 | |||
Trustees’ and Chief Compliance Officer’s fees | 22 | |||
Audit fees | 39,215 | |||
Printing and mailing costs | 11,271 | |||
Other | 4,578 | |||
|
| |||
Total Liabilities | 111,712 | |||
|
| |||
Net Assets | $ | 33,711,674 | ||
|
| |||
NET ASSETS: | ||||
Paid-in-Capital | $ | 21,618,064 | ||
Accumulated undistributed net investment income | 563,497 | |||
Accumulated net realized gains (losses) | (1,795,981 | ) | ||
Net unrealized appreciation (depreciation) | 13,326,094 | |||
|
| |||
Total Net Assets | $ | 33,711,674 | ||
|
| |||
Net Assets: | ||||
Class 1 | $ | 33,629,156 | ||
Class 2 | 82,518 | |||
|
| |||
Total | $ | 33,711,674 | ||
|
| |||
Outstanding units of beneficial interest (shares) | ||||
(unlimited number of shares authorized, no par value): | ||||
Class 1 | 2,824,062 | |||
Class 2 | 6,864 | |||
Net Asset Value, offering and redemption price per share (a): | ||||
Class 1 | $ | 11.91 | ||
Class 2 | 12.02 | |||
Cost of investments in non-affiliates | $ | 20,220,935 | ||
Cost of foreign currency | 50 | |||
| (a) | Per share amounts may not recalculate due to rounding of net assets and/or shares outstanding. |
SEE NOTES TO FINANCIAL STATEMENTS.
| DECEMBER 31, 2013 | JPMORGAN INSURANCE TRUST | 7 | ||||||
Table of Contents
STATEMENT OF OPERATIONS
FOR THE YEAR ENDED DECEMBER 31, 2013
International | ||||
INVESTMENT INCOME: | ||||
Dividend income from non-affiliates | $ | 940,351 | ||
Dividend income from affiliates | 30 | |||
Foreign taxes withheld | (27,661 | ) | ||
|
| |||
Total investment income | 912,720 | |||
|
| |||
EXPENSES: | ||||
Investment advisory fees | 198,048 | |||
Administration fees | 27,808 | |||
Distribution fees — Class 2 | 165 | |||
Custodian and accounting fees | 57,811 | |||
Professional fees | 58,430 | |||
Trustees’ and Chief Compliance Officer’s fees | 372 | |||
Printing and mailing costs | 16,038 | |||
Transfer agent fees | 6,856 | |||
Other | 7,105 | |||
|
| |||
Total expenses | 372,633 | |||
|
| |||
Less amounts waived | (32,605 | ) | ||
|
| |||
Net expenses | 340,028 | |||
|
| |||
Net investment income (loss) | 572,692 | |||
|
| |||
REALIZED/UNREALIZED GAINS (LOSSES): | ||||
Net realized gain (loss) on transactions from: | ||||
Investments in non-affiliates | 1,368,975 | |||
Foreign currency transactions | (9,378 | ) | ||
|
| |||
Net realized gains (losses) | 1,359,597 | |||
|
| |||
Change in net unrealized appreciation/depreciation of: | ||||
Investments in non-affiliates | 2,841,298 | |||
Foreign currency translations | 1,985 | |||
|
| |||
Change in net unrealized appreciation/depreciation | 2,843,283 | |||
|
| |||
Net realized/unrealized gain (loss) | 4,202,880 | |||
|
| |||
Change in net assets resulting from operations | $ | 4,775,572 | ||
|
| |||
SEE NOTES TO FINANCIAL STATEMENTS.
| 8 | JPMORGAN INSURANCE TRUST | DECEMBER 31, 2013 | ||||
Table of Contents
STATEMENTS OF CHANGES IN NET ASSETS
FOR THE PERIODS INDICATED
| International Equity Portfolio | ||||||||
| Year Ended 12/31/2013 | Year Ended 12/31/2012 | |||||||
CHANGE IN NET ASSETS RESULTING FROM OPERATIONS: | ||||||||
Net investment income (loss) | $ | 572,692 | $ | 639,466 | ||||
Net realized gain (loss) | 1,359,597 | (254,318 | ) | |||||
Change in net unrealized appreciation/depreciation | 2,843,283 | 5,772,708 | ||||||
|
|
|
| |||||
Change in net assets resulting from operations | 4,775,572 | 6,157,856 | ||||||
|
|
|
| |||||
DISTRIBUTIONS TO SHAREHOLDERS: | ||||||||
Class 1 | ||||||||
From net investment income | (640,625 | ) | (709,688 | ) | ||||
Class 2 | ||||||||
From net investment income | (1,082 | ) | (1,044 | ) | ||||
|
|
|
| |||||
Total distributions to shareholders | (641,707 | ) | (710,732 | ) | ||||
|
|
|
| |||||
CAPITAL TRANSACTIONS: | ||||||||
Change in net assets resulting from capital transactions | (3,487,175 | ) | (4,119,582 | ) | ||||
|
|
|
| |||||
NET ASSETS: | ||||||||
Change in net assets | 646,690 | 1,327,542 | ||||||
Beginning of period | 33,064,984 | 31,737,442 | ||||||
|
|
|
| |||||
End of period | $ | 33,711,674 | $ | 33,064,984 | ||||
|
|
|
| |||||
Accumulated undistributed net investment income | $ | 563,497 | $ | 641,890 | ||||
|
|
|
| |||||
CAPITAL TRANSACTIONS: | ||||||||
Class 1 | ||||||||
Proceeds from shares issued | $ | 2,618,789 | $ | 2,801,328 | ||||
Distributions reinvested | 640,625 | 709,688 | ||||||
Cost of shares redeemed | (6,758,510 | ) | (7,631,642 | ) | ||||
|
|
|
| |||||
Change in net assets resulting from Class 1 capital transactions | $ | (3,499,096 | ) | $ | (4,120,626 | ) | ||
|
|
|
| |||||
Class 2 | ||||||||
Proceeds from shares issued | $ | 10,843 | $ | 2 | ||||
Distributions reinvested | 1,082 | 1,044 | ||||||
Cost of shares redeemed | (4 | ) | (2 | ) | ||||
|
|
|
| |||||
Change in net assets resulting from Class 2 capital transactions | $ | 11,921 | $ | 1,044 | ||||
|
|
|
| |||||
Total change in net assets resulting from capital transactions | $ | (3,487,175 | ) | $ | (4,119,582 | ) | ||
|
|
|
| |||||
SHARE TRANSACTIONS: | ||||||||
Class 1 | ||||||||
Issued | 239,953 | 295,263 | ||||||
Reinvested | 60,608 | 75,100 | ||||||
Redeemed | (617,473 | ) | (798,272 | ) | ||||
|
|
|
| |||||
Change in Class 1 Shares | (316,912 | ) | (427,909 | ) | ||||
|
|
|
| |||||
Class 2 | ||||||||
Issued | 920 | — | (a) | |||||
Reinvested | 102 | 109 | ||||||
Redeemed | — | (a) | — | (a) | ||||
|
|
|
| |||||
Change in Class 2 Shares | 1,022 | 109 | ||||||
|
|
|
| |||||
| (a) | Amount rounds to less than 1 (shares or dollars). |
SEE NOTES TO FINANCIAL STATEMENTS.
| DECEMBER 31, 2013 | JPMORGAN INSURANCE TRUST | 9 | ||||||
Table of Contents
FOR THE PERIODS INDICATED
| Per share operating performance | ||||||||||||||||||||||||||||
| Investment operations | Distributions | |||||||||||||||||||||||||||
| Net asset value, beginning of period | Net investment income (loss) | Net realized and unrealized gains (losses) on investments | Total from investment operations | Net investment income | Net realized gain | Total distributions | ||||||||||||||||||||||
International Equity Portfolio | ||||||||||||||||||||||||||||
Class 1 (f) | ||||||||||||||||||||||||||||
Year Ended December 31, 2013 | $ | 10.51 | $ | 0.19 | (g) | $ | 1.42 | $ | 1.61 | $ | (0.21 | ) | $ | — | $ | (0.21 | ) | |||||||||||
Year Ended December 31, 2012 | 8.88 | 0.19 | (g) | 1.65 | 1.84 | (0.21 | ) | — | (0.21 | ) | ||||||||||||||||||
Year Ended December 31, 2011 | 10.17 | 0.19 | (g) | (1.30 | ) | (1.11 | ) | (0.18 | ) | — | (0.18 | ) | ||||||||||||||||
Year Ended December 31, 2010 | 9.54 | 0.15 | (g) | 0.50 | 0.65 | (0.02 | ) | — | (0.02 | ) | ||||||||||||||||||
Year Ended December 31, 2009 | 7.93 | 0.16 | (g) | 2.31 | 2.47 | (0.50 | ) | (0.36 | ) | (0.86 | ) | |||||||||||||||||
Class 2 | ||||||||||||||||||||||||||||
Year Ended December 31, 2013 | 10.61 | 0.16 | (g) | 1.44 | 1.60 | (0.19 | ) | — | (0.19 | ) | ||||||||||||||||||
Year Ended December 31, 2012 | 8.96 | 0.16 | (g) | 1.67 | 1.83 | (0.18 | ) | — | (0.18 | ) | ||||||||||||||||||
Year Ended December 31, 2011 | 10.26 | 0.17 | (g) | (1.31 | ) | (1.14 | ) | (0.16 | ) | — | (0.16 | ) | ||||||||||||||||
Year Ended December 31, 2010 | 9.65 | 0.13 | (g) | 0.50 | 0.63 | (0.02 | ) | — | (0.02 | ) | ||||||||||||||||||
April 24, 2009 (i) through December 31, 2009 | 6.88 | 0.45 | (g) | 2.33 | 2.78 | (0.01 | ) | — | (0.01 | ) | ||||||||||||||||||
| (a) | Annualized for periods less than one year. |
| (b) | Not annualized for periods less than one year. |
| (c) | Includes adjustments in accordance with accounting principles generally accepted in the United States of America and as such, the net asset values for financial reporting purposes and the returns based upon those net asset values may differ from the net asset values and returns for shareholder transactions. |
| (d) | Interest expense, if applicable, each of which is less than 0.01% unless otherwise noted. |
| (e) | Portfolio turnover is calculated by dividing the lesser of total purchases or sales of portfolio securities for the reporting period by the monthly average value of portfolio securities owned during the reporting period. Excluded from both the numerator and denominator are amounts relating to derivatives and securities whose maturities or expiration dates at the time of acquisition were one year or less. |
| (f) | International Equity Portfolio acquired all of the assets and liabilities of JPMorgan International Equity Portfolio (“Predecessor Portfolio”) in a reorganization on April 24, 2009. The Predecessor Portfolio’s performance and financial history have been adopted by International Equity Portfolio and have been used since the reorganization. As a result, the financial highlight information reflects that of the Predecessor Portfolio for the periods prior to reorganization with International Equity Portfolio. |
| (g) | Calculated based upon average shares outstanding. |
| (h) | Ratios are disproportionate between classes due to the size of net assets and fixed expense. |
| (i) | Because of the reorganization with the Predecessor Portfolio in which the performance and financial history of the International Equity Portfolio was replaced with that of the Predecessor Portfolio, the performance and the financial history began on April 24, 2009. |
SEE NOTES TO FINANCIAL STATEMENTS.
| 10 | JPMORGAN INSURANCE TRUST | DECEMBER 31, 2013 | ||||
Table of Contents
| Ratios/Supplemental data | |||||||||||||||||||||||||
| Ratios to average net assets (a) | ||||||||||||||||||||||||||
| Net asset value, end of period | Total return (b)(c) | Net assets, end of period | Net expenses (d) | Net investment income (loss) | Expenses without waivers and reimbursements | Portfolio turnover rate (b)(e) | ||||||||||||||||||||
| $ | 11.91 | 15.56 | % | $ | 33,629,156 | 1.03 | % | 1.74 | % | 1.13 | % | 12 | % | |||||||||||||
| 10.51 | 20.95 | 33,003,010 | 1.03 | 1.97 | 1.20 | 8 | ||||||||||||||||||||
| 8.88 | (11.19 | ) | 31,686,069 | 1.03 | 1.94 | 1.11 | 16 | |||||||||||||||||||
| 10.17 | 6.84 | 39,089,569 | 1.02 | 1.66 | 1.13 | 15 | ||||||||||||||||||||
| 9.54 | 34.91 | 43,938,093 | 1.01 | 2.00 | (h) | 1.38 | 13 | |||||||||||||||||||
| 12.02 | 15.25 | 82,518 | 1.28 | 1.44 | 1.38 | 12 | ||||||||||||||||||||
| 10.61 | 20.67 | 61,974 | 1.27 | 1.70 | 1.45 | 8 | ||||||||||||||||||||
| 8.96 | (11.38 | ) | 51,373 | 1.28 | 1.69 | 1.36 | 16 | |||||||||||||||||||
| 10.26 | 6.56 | 57,983 | 1.27 | 1.39 | 1.38 | 15 | ||||||||||||||||||||
| 9.65 | 40.42 | 54,418 | 1.26 | 8.82 | (h) | 1.44 | 13 | |||||||||||||||||||
SEE NOTES TO FINANCIAL STATEMENTS.
| DECEMBER 31, 2013 | JPMORGAN INSURANCE TRUST | 11 | ||||||
Table of Contents
AS OF DECEMBER 31, 2013
1. Organization
JPMorgan Insurance Trust (the “Trust”) is registered under the Investment Company Act of 1940, as amended (the “1940 Act”), as an open-end management investment company and is a Massachusetts business trust.
The following is a separate Portfolio of the Trust (the “Portfolio”) covered by this report:
| Classes Offered | Diversified/Non-Diversified | |||||
| International Equity Portfolio | Class 1 and Class 2 | Diversified |
The investment objective of the Portfolio is to seek to provide high total return from a portfolio of equity securities of foreign companies. Total return consists of capital growth and current income.
Portfolio shares are offered only to separate accounts of participating insurance companies and Eligible Plans. Individuals may not purchase shares directly from the Portfolio.
All classes of shares have equal rights as to earnings, assets and voting privileges, except that each class may bear different distribution and service fees and each class has exclusive voting rights with respect to its distribution plan and administrative services plan.
2. Significant Accounting Policies
The following is a summary of significant accounting policies followed by the Portfolio in the preparation of its financial statements. The policies are in accordance with accounting principles generally accepted in the United States of America (“GAAP”). The preparation of financial statements requires management to make estimates and assumptions that affect the reported amounts and disclosures in the financial statements. Actual results could differ from those estimates.
A. Valuation of Investments — Equity securities listed on a North American, Central American, South American or Caribbean securities exchange shall generally be valued at the last sale price on the exchange on which the security is principally traded that is reported before the time when the net assets of the Portfolio are valued. Securities listed on the NASDAQ Stock Market LLC are generally valued at the NASDAQ Official Closing Price. Generally, short-term investments of sufficient credit quality maturing in less than 61 days are valued at amortized cost, which approximates fair value. Investments in open-end investment companies are valued at each investment company’s net asset value per share (“NAV”) as of the report date.
Certain investments of the Portfolio may, depending upon market conditions, trade in relatively thin markets and/or in markets that experience significant volatility. As a result of these conditions, the prices used by the Portfolio to value these securities may differ from the value that would be realized if these securities were sold, and the differences could be material. Futures and options are generally valued on the basis of available market quotations. Swaps and other derivatives are valued daily, primarily using independent or affiliated pricing services approved by the Board of Trustees. If valuations are not available from such pricing services or values received are deemed not representative of fair value, values will be obtained from a third party broker-dealer or counterparty.
Securities or other assets for which market quotations are not readily available or for which market quotations are deemed to not represent the fair value of the security or asset at the time of pricing (including certain illiquid securities) are fair valued in accordance with procedures established by and under the supervision and responsibility of the Board of Trustees. The Board of Trustees has established an Audit and Valuation Committee to assist with the oversight of the valuation of the Portfolio’s securities. JPMorgan Funds Management, Inc. (the “Administrator” or “JPMFM”), has established a Valuation Committee (“VC”) that is comprised of senior representatives from JPMFM, J.P. Morgan Investment Management Inc. (the “Adviser” or “JPMIM”), and J.P. Morgan Asset Management’s Legal, Compliance and Risk Management groups and the Portfolio’s Chief Compliance Officer. The VC’s responsibilities include making determinations regarding Level 3 fair value measurements (“Fair Values”) and/or providing recommendations for approval to the Board of Trustees’ Audit and Valuation Committee, in accordance with the Portfolio’s valuation policies.
The VC or Board of Trustees, as applicable, primarily employs a market-based approach which may use related or comparable assets or liabilities, recent transactions, market multiples, book values, and other relevant information for the investment to determine the fair value of the investment. The VC or Board of Trustees may also use an income-based valuation approach in which the anticipated future cash flows of the investment are discounted to calculate fair value. Discounts may also be applied due to the nature or duration of any restrictions on the disposition of the investments. Valuations may be based upon current market prices of securities that are comparable in coupon, rating, maturity and industry. Trading in securities on most foreign exchanges and over-the-counter markets is normally completed before the close of the domestic market and may also take place on days when the domestic market is closed. In accordance with procedures adopted by the Board of Trustees, the Portfolio applies fair value pricing on equity securities on a daily basis, except for North American, Central American, South American and Caribbean equity securities held in its portfolio, by utilizing the quotations of an independent pricing service, unless the Adviser determines that use of another valuation methodology is appropriate. The pricing service uses statistical analyses and quantitative models to adjust local market prices using factors such as subsequent movement and changes in the prices of indices, securities and exchange rates in other markets, in determining fair value as of the time the Portfolio calculates its net asset values.
It is possible that the estimated values may differ significantly from the values that would have been used had a ready market for the investments existed, and such differences could be material. JPMFM and JPMIM are responsible for monitoring developments that may impact Fair Values and
| 12 | JPMORGAN INSURANCE TRUST | DECEMBER 31, 2013 | ||||
Table of Contents
for discussing and assessing Fair Values on an ongoing, and at least a quarterly, basis with the VC and Board of Trustees, as applicable. The appropriateness of Fair Values is assessed based on results of unchanged price review and consideration of macro or security specific events, back testing, and broker and vendor due diligence.
Valuations reflected in this report are as of the report date. As a result, changes in valuation due to market events and/or issuer related events after the report date and prior to issuance of the report are not reflected herein.
The various inputs that are used in determining the fair value of the Portfolio’s investments are summarized into the three broad levels listed below.
| Ÿ | Level 1 — quoted prices in active markets for identical securities |
| Ÿ | Level 2 — other significant observable inputs (including quoted prices for similar securities, interest rates, prepayment speeds, credit risk, etc.) |
| Ÿ | Level 3 — significant unobservable inputs (including the Portfolio’s own assumptions in determining the fair value of investments) |
A financial instrument’s level within the fair value hierarchy is based on the lowest level of any input, both individually and in the aggregate, that is significant to the fair value measurement. The inputs or methodology used for valuing securities are not necessarily an indication of the risk associated with investing in those securities.
The following table represents each valuation input as presented on the Schedule of Portfolio Investments (“SOI”):
Level 1 Quoted prices | Level 2 Other significant | Level 3 Significant | Total | |||||||||||||
Total Investments in Securities (a) | $ | 850,164 | $ | 32,694,679 | $ | — | $ | 33,544,843 | ||||||||
|
|
|
|
|
|
|
| |||||||||
| (a) | All portfolio holdings designated as Level 1 and Level 2 are disclosed individually on the SOI. Level 1 consists of certain ADRs and a security held in Denmark. Please refer to the SOI for country specifics of portfolio holdings. |
There were no transfers among any levels during the year ended December 31, 2013.
B. Foreign Currency Translation — The books and records of the Portfolio are maintained in U.S. dollars. Foreign currency amounts are translated into U.S. dollars at the prevailing exchange rates of such currencies against the U.S. dollar. The market value of investment securities and other assets and liabilities are translated at the exchange rate as of the valuation date. Purchases and sales of investment securities, income and expenses are translated at the exchange rate prevailing on the respective dates of such transactions.
Although the net assets of the Portfolio are presented at the foreign exchange rates and market values at the close of the year, the Portfolio does not isolate that portion of the results of operations arising as a result of changes in the foreign exchange rates from the fluctuations arising from changes in the market prices of securities held or sold during the year. Accordingly, such foreign currency gains (losses) are included in the reported net realized and unrealized gains (losses) on investment transactions in the Statement of Operations.
Reported realized foreign currency gains and losses arise from the disposition of foreign currency, purchase of foreign currency in certain countries that impose a tax on such purchases, currency gains or losses realized between the trade and settlement dates on securities transactions, and the difference between the amounts of dividends, interest and foreign withholding taxes recorded on the Portfolio’s books on the transaction date and the U.S. dollar equivalent of the amounts actually received or paid. Unrealized foreign currency gains and losses arise from changes (due to changes in the exchange rate) in the value of foreign currency and other assets and liabilities denominated in foreign currencies, which are held at year end.
C. Security Transactions and Investment Income — Investment transactions are accounted for on the trade date (the date the order to buy or sell is executed). Securities gains and losses are calculated on a specifically identified cost basis. Interest income is determined on the basis of coupon interest accrued using the effective interest method which adjusts for amortization of premiums and accretion of discounts. Dividend income, net of foreign taxes withheld, if any, is recorded on the ex-dividend date or when the Portfolio first learns of the dividend.
D. Allocation of Income and Expenses — Expenses directly attributable to a portfolio are charged directly to that portfolio, while the expenses attributable to more than one portfolio of the Trust are allocated among the respective portfolios. In calculating the NAV of each class, investment income, realized and unrealized gains and losses and expenses, other than class specific expenses, are allocated daily to each class of shares based upon the proportion of net assets of each class at the beginning of each day.
E. Federal Income Taxes — The Portfolio is treated as a separate taxable entity for Federal income tax purposes. The Portfolio’s policy is to comply with the provisions of the Internal Revenue Code of 1986, as amended (the “Code”), applicable to regulated investment companies and to distribute to shareholders all of its distributable net investment income and net realized capital gains on investments. Accordingly, no provision for Federal income tax is necessary. The Portfolio is also a segregated portfolio of assets for insurance purposes and intends to comply with the diversification requirements of Subchapter L of the Code. Management has reviewed the Portfolio’s tax positions for all open tax years and has determined that as of December 31, 2013, no liability for income tax is required in the Portfolio’s financial statements for net unrecognized tax benefits. However, management’s conclusions may be subject to future review based on changes in, or the interpretation of, the accounting standards or tax laws and regulations. The Portfolio’s Federal tax returns for the prior three fiscal years remain subject to examination by the Internal Revenue Service.
| DECEMBER 31, 2013 | JPMORGAN INSURANCE TRUST | 13 | ||||||
Table of Contents
NOTES TO FINANCIAL STATEMENTS
AS OF DECEMBER 31, 2013 (continued)
F. Foreign Taxes — The Portfolio may be subject to foreign taxes on income, gains on investments or currency purchases/repatriation, a portion of which may be recoverable. The Portfolio will accrue such taxes and recoveries as applicable, based upon its current interpretation of tax rules and regulations that exist in the markets in which it invests.
G. Distributions to Shareholders — Distributions from net investment income are generally declared and paid at least annually and are declared separately for each class. No class has preferential dividend rights; differences in per share rates are due to differences in separate class expenses. Net realized capital gains, if any, are distributed at least annually. The amount of distributions from net investment income and net realized capital gains is determined in accordance with Federal income tax regulations, which may differ from GAAP. To the extent these “book/tax” differences are permanent in nature (i.e., that they result from other than timing of recognition — “temporary differences”), such amounts are reclassified within the capital accounts based on their Federal tax-basis treatment.
The following amounts were reclassified within the capital accounts:
| Paid-in-Capital | Accumulated Undistributed Net Investment Income | Accumulated Net Realized Gains (Losses) | ||||||||||
| $ | (12,833 | ) | $ | (9,378 | ) | $ | 22,211 | |||||
The reclassifications for the Portfolio relate primarily to write-offs of capital loss carryforwards acquired in the merger.
3. Fees and Other Transactions with Affiliates
A. Investment Advisory Fee — Pursuant to the Investment Advisory Agreement, the Adviser, an indirect, wholly-owned subsidiary of JPMorgan Chase & Co. (“JPMorgan”), supervises the investments of the Portfolio and for such services is paid a fee. The fee is accrued daily and paid monthly based on the Portfolio’s average daily net assets at an annual rate of 0.60%.
The Adviser waived Investment Advisory fees and/or reimbursed expenses as outlined in Note 3.E.
B. Administration Fee — Pursuant to an Administration Agreement, the Administrator, an indirect, wholly-owned subsidiary of JPMorgan, provides certain administration services to the Portfolio. In consideration of these services, the Administrator receives a fee accrued daily and paid monthly at an annual rate of 0.15% of the first $25 billion of the average daily net assets of all funds in the J.P. Morgan Funds Complex covered by the Administration Agreement (excluding certain funds of funds and money market funds) and 0.075% of the average daily net assets in excess of $25 billion of all such funds. For the year ended December 31, 2013, the effective rate was 0.08% of the Portfolio’s average daily net assets, notwithstanding any fee waivers and/or expense reimbursements.
JPMorgan Chase Bank, N.A. (“JPMCB”), a wholly-owned subsidiary of JPMorgan, serves as the Portfolio’s sub-administrator (the “Sub-administrator”). For its services as Sub-administrator, JPMCB receives a portion of the fees payable to the Administrator.
The Administrator waived Administration fees as outlined in Note 3.E.
C. Distribution Fees — Pursuant to a Distribution Agreement, JPMorgan Distribution Services, Inc. (the “Distributor”), a wholly-owned subsidiary of JPMorgan, serves as the Trust’s exclusive underwriter and promotes and arranges for the sale of the Portfolio’s shares.
The Board of Trustees has adopted a Distribution Plan (the “Distribution Plan”) for Class 2 Shares of the Portfolio in accordance with Rule 12b-1 under the 1940 Act. The Distribution Plan provides that the Portfolio shall pay distribution fees, including payments to the Distributor, at an annual rate of 0.25% of the average daily net assets of Class 2 Shares.
D. Custodian and Accounting Fees — JPMCB provides portfolio custody and accounting services to the Portfolio. The amounts paid directly to JPMCB by the Portfolio for custody and accounting services are included in Custodian and accounting fees in the Statement of Operations. The Portfolio earns interest on uninvested cash balances held by the custodian. Such interest amounts are presented separately in the Statement of Operations.
Interest income, if any, earned on cash balances at the custodian is included in Interest income from affiliates in the Statement of Operations.
Interest expense, if any, paid to the custodian related to cash overdrafts is included in Interest expense to affiliates in the Statement of Operations.
E. Waivers and Reimbursements — The Adviser, Administrator (for all share classes) and Distributor (for Class 2 Shares) have contractually agreed to waive fees and/or reimburse the Portfolio to the extent that total annual operating expenses (excluding acquired fund fees and expenses, dividend expenses related to short sales, interest, taxes, expenses related to litigation and potential litigation, extraordinary expenses and expenses related to the Board of Trustees’ deferred compensation plan) exceed the percentages of the Portfolio’s respective average daily net assets as shown in the table below:
| Class 1 | Class 2 | |||||||
| 1.03 | % | 1.28 | % | |||||
The expense limitation agreements were in effect for the year ended December 31, 2013. The contractual expense limitation percentages in the table above are in place until at least April 30, 2014.
| 14 | JPMORGAN INSURANCE TRUST | DECEMBER 31, 2013 | ||||
Table of Contents
For the year ended December 31, 2013, the Portfolio’s service providers waived fees for the Portfolio as follows. None of these parties expect the Portfolio to repay any such waived fees in future years.
| Contractual Waivers | ||||||||||||
Investment Advisory | Administration | Total | ||||||||||
| $ | 6,065 | $ | 26,421 | $ | 32,486 | |||||||
Additionally, the Portfolio may invest in one or more money market funds advised by the Adviser or its affiliates. The Adviser, Administrator and the Distributor waive fees in an amount sufficient to offset the respective fees each charges to the affiliated money market fund on the Portfolio’s investment in such affiliated money market fund. A portion of the waiver is voluntary.
The amount of waivers resulting from investments in these money market funds for the year ended December 31, 2013 was $119.
F. Other — Certain officers of the Trust are affiliated with the Adviser, the Administrator and the Distributor. Such officers, with the exception of the Chief Compliance Officer, receive no compensation from the Portfolio for serving in their respective roles.
The Board of Trustees appointed a Chief Compliance Officer to the Portfolio in accordance with Federal securities regulations. The Portfolio, along with other affiliated portfolios, makes reimbursement payments, on a pro-rata basis, to the Administrator for a portion of the fees associated with the Office of the Chief Compliance Officer. Such fees are included in Trustees’ and Chief Compliance Officer’s fees in the Statement of Operations.
The Trust adopted a Trustee Deferred Compensation Plan (the “Plan”) which allows the Independent Trustees to defer the receipt of all or a portion of compensation related to performance of their duties as Trustees. The deferred fees are invested in various J.P. Morgan Funds until distribution in accordance with the Plan.
During the year ended December 31, 2013, the Portfolio may have purchased securities from an underwriting syndicate in which the principal underwriter or members of the syndicate are affiliated with the Adviser.
The Portfolio may use related party broker-dealers. For the year ended December 31, 2013, the Portfolio did not incur any brokerage commissions with broker-dealers affiliated with the Adviser.
The Securities and Exchange Commission has granted an exemptive order permitting the Portfolio to engage in principal transactions with J.P. Morgan Securities, Inc., an affiliated broker, involving taxable money market instruments, subject to certain conditions.
4. Investment Transactions
During the year ended December 31, 2013, purchases and sales of investments (excluding short-term investments) were as follows:
| Purchases (excluding U.S. Government) | Sales (excluding U.S. Government) | |||||||
| $ | 3,995,315 | $ | 7,542,033 | |||||
During the year ended December 31, 2013, there were no purchases or sales of U.S. Government securities.
5. Federal Income Tax Matters
For Federal income tax purposes, the cost and unrealized appreciation (depreciation) in value of investment securities held at December 31, 2013 were as follows:
Aggregate Cost | Gross Unrealized Appreciation | Gross Unrealized Depreciation | Net Unrealized Appreciation (Depreciation) | |||||||||||||
| $ | 20,456,967 | $ | 13,474,664 | $ | 386,788 | $ | 13,087,876 | |||||||||
The difference between book and tax basis appreciation (depreciation) on investments is primarily attributed to wash sale loss deferrals.
The tax character of distributions paid during the year ended December 31, 2013 was as follows:
| Total Distributions Paid From: | ||||||||
Ordinary Income | Total Distributions Paid | |||||||
| $ | 641,707 | $ | 641,707 | |||||
The tax character of distributions paid during the year ended December 31, 2012 was as follows:
| Total Distributions Paid From: | ||||||||
Ordinary Income | Total Distributions Paid | |||||||
| $ | 710,732 | $ | 710,732 | |||||
| DECEMBER 31, 2013 | JPMORGAN INSURANCE TRUST | 15 | ||||||
Table of Contents
NOTES TO FINANCIAL STATEMENTS
AS OF DECEMBER 31, 2013 (continued)
As of December 31, 2013, the components of net assets (excluding paid-in-capital) on a tax basis were as follows:
Current Distributable Ordinary Income | Current Distributable Long-Term Capital Gain or (Tax Basis Capital Loss Carryover) | Unrealized Appreciation (Depreciation) | ||||||||||
| $ | 563,853 | $ | (1,559,949 | ) | $ | 13,090,061 | ||||||
The cumulative timing differences primarily consist of wash sale loss deferrals.
Under the Regulated Investment Company Modernization Act of 2010 (the “Act”), net capital losses recognized by the Portfolio after December 31, 2010, are carried forward indefinitely, and retain their character as short-term and/or long term losses. Prior to the Act, net capital losses incurred by the Portfolio were carried forward for eight years and treated as short-term losses. The Act requires that post-enactment net capital losses be used before pre-enactment net capital losses.
As of December 31, 2013, the Portfolio had pre-enactment net capital loss carryforwards, expiring during the year indicated, which are available to offset future realized gains:
| 2017 | Total | |||||||
| $ | 1,559,949 | * | $ | 1,559,949 | * | |||
| * | This amount includes $1,559,949 of capital loss carryforwards from business combinations, which may be limited in future years under the Internal Revenue Code Sections 381-384. |
During the year ended December 31, 2013, the Portfolio was not able to utilize capital loss carryforwards of $12,832 due to Internal Revenue Code Sections 382-383 limitations.
During the year ended December 31, 2013, the Portfolio utilized capital loss carryforwards as follows:
Post-Enactment Capital Loss Carryforwards
Pre-Enactment Capital Loss Carryforwards | Short-Term | Long-Term | Total Capital Loss Carryforwards Utilized | |||
$1,034,623 | $— | $242,134 | $1,276,757 |
6. Borrowings
The Trust and JPMCB have entered into a financing arrangement. Under this arrangement, JPMCB provides an unsecured, uncommitted credit facility in the aggregate amount of $100 million to certain of the J.P. Morgan Funds, including the Portfolio. Advances under the arrangement are taken primarily for temporary or emergency purposes, including the meeting of redemption requests that otherwise might require the untimely disposition of securities, and are subject to the Portfolio’s borrowing restrictions. Interest on borrowings is payable at a rate determined by JPMCB at the time of borrowing. This agreement has been extended until November 10, 2014.
The Portfolio had no borrowings outstanding from the unsecured, uncommitted credit facility at December 31, 2013, or at any time during the year then ended.
Interest expense paid, if any, as a result of borrowings from the unsecured, uncommitted credit facility is included in Interest expense to affiliates in the Statement of Operations.
7. Risks, Concentrations and Indemnifications
In the normal course of business, the Portfolio enters into contracts that contain a variety of representations which provide general indemnifications. The Portfolio’s maximum exposure under these arrangements is unknown. The amount of exposure would depend on future claims that may be made against the Portfolio that have not yet occurred. However, based on experience, the Portfolio expects the risk of loss to be remote.
The Portfolio has several shareholders holding a significant percentage of shares outstanding. Investment activities of these shareholders could have a material impact on the Portfolio.
The Portfolio may have elements of risk not typically associated with investments in the United States of America due to concentrated investments in a limited number of countries or regions, which may vary throughout the year. Such concentrations may subject the Portfolio to additional risks resulting from political or economic conditions in such countries or regions and the possible imposition of adverse governmental laws or currency exchange restrictions could cause the Portfolio’s securities and their markets to be less liquid and their prices to be more volatile than those of comparable U.S. securities.
As of December 31, 2013, substantially all of the Portfolio’s net assets consisted of securities that are denominated in foreign currencies. Changes in currency exchange rates will affect the value of, and investment income from, such securities.
As of December 31, 2013, the Fund had the following country allocations representing greater than 10% of total investments.
| United Kingdom | Japan | Switzerland | France | |||||||||||||
| 23.7 | % | 18.3 | % | 14.6 | % | 11.8 | % | |||||||||
| 16 | JPMORGAN INSURANCE TRUST | DECEMBER 31, 2013 | ||||
Table of Contents
REPORT OF INDEPENDENT REGISTERED PUBLIC ACCOUNTING FIRM
To the Board of Trustees of JPMorgan Insurance Trust and the Shareholders of JPMorgan Insurance Trust International Equity Portfolio:
In our opinion, the accompanying statement of assets and liabilities, including the schedule of portfolio investments, and the related statements of operations and of changes in net assets and the financial highlights present fairly, in all material respects, the financial position of JPMorgan Insurance Trust International Equity Portfolio (a separate Portfolio of JPMorgan Insurance Trust) (hereafter referred to as the “Portfolio”) at December 31, 2013, the results of its operations for the year then ended, the changes in its net assets for each of the two years in the period then ended and the financial highlights for each of the periods presented, in conformity with accounting principles generally accepted in the United States of America. These financial statements and financial highlights (hereafter referred to as “financial statements”) are the responsibility of the Portfolio’s management. Our responsibility is to express an opinion on these financial statements based on our audits. We conducted our audits of these financial statements in accordance with the standards of the Public Company Accounting Oversight Board (United States). Those standards require that we plan and perform the audit to obtain reasonable assurance about whether the financial statements are free of material misstatement. An audit includes examining, on a test basis, evidence supporting the amounts and disclosures in the financial statements, assessing the accounting principles used and significant estimates made by management, and evaluating the overall financial statement presentation. We believe that our audits, which included confirmation of securities at December 31, 2013 by correspondence with the custodian, provide a reasonable basis for our opinion.
PricewaterhouseCoopers LLP
New York, New York
February 21, 2014
| DECEMBER 31, 2013 | JPMORGAN INSURANCE TRUST | 17 | ||||||
Table of Contents
(Unaudited)
The Portfolio’s Statement of Additional Information includes additional information about the Portfolio’s Trustees and is available, without charge, upon request by calling 1-800-480-4111 or on the J.P. Morgan Funds’ website at www.jpmorganfunds.com.
Name (Year of Birth); Positions With the Portfolio (1) | Principal Occupations During Past 5 Years | Number of Portfolios in Fund Complex Overseen by Trustee (2) | Other Directorships Held Outside Fund Complex During Past 5 Years | |||
Independent Trustees | ||||||
| John F. Finn (1947); Trustee of Trust since 2005; Trustee of heritage One Group Mutual Funds since 1998. | Chairman (1985-present), President and Chief Executive Officer, Gardner, Inc. (supply chain management company serving industrial and consumer markets) (1974-present). | 170 | Director, Cardinal Health, Inc. (CAH) (1994-present); Director, Greif, Inc. (GEF) (industrial package products and services) (2007-present); Trustee, Columbus Association for the Performing Arts. | |||
| Dr. Matthew Goldstein (1941); Chairman since 2013; Trustee of Trust since 2005; Trustee of heritage J.P. Morgan Funds since 2003. | Professor, City University of New York (effective 7/1/13); Chancellor, City University of New York (1999-2013); President, Adelphi University (New York) (1998-1999). | 170 | Trustee, Museum of Jewish Heritage (2011-present). | |||
| Robert J. Higgins (1945); Trustee of Trust since 2005; Trustee of heritage J.P. Morgan Funds since 2002. | Retired; Director of Administration of the State of Rhode Island (2003-2004); President — Consumer Banking and Investment Services, Fleet Boston Financial (1971-2001). | 170 | None | |||
| Peter C. Marshall (1942); Trustee of Trust since 2005; Trustee of heritage One Group Mutual Funds since 1985. | Self-employed business consultant (2002-present). | 170 | None | |||
| Mary E. Martinez (1960); Trustee of Trust since 2013. | Associate, Special Properties, a Christie’s International Real Estate Affiliate (2010-Present); Managing Director, Bank of America (Asset Management) (2007-2008); Chief Operating Officer, U.S. Trust Asset Management; U.S. Trust Company (asset management) (2003-2007); President, Excelsior Funds (registered investment companies) (2004-2005). | 170 | None | |||
| Marilyn McCoy* (1948); Trustee of Trust since 2005; Trustee of heritage One Group Mutual Funds since 1999. | Vice President of Administration and Planning, Northwestern University (1985-present). | 170 | Trustee, Carleton College (2003-present). | |||
| Mitchell M. Merin (1953); Trustee of Trust since 2013. | Retired (2005-Present); President and Chief Operating Officer, Morgan Stanley Investment Management, Member Morgan Stanley & Co. Management Committee (registered investment adviser) (1998-2005). | 170 | Director, Sun Life Financial (SLF) (2007 to Present) (financial services and insurance); Trustee, Trinity College, Hartford, CT (2002-2010). | |||
| William G. Morton, Jr. (1937); Trustee of Trust since 2005; Trustee of heritage J.P. Morgan Funds since 2003. | Retired; Chairman Emeritus (2001-2002), and Chairman and Chief Executive Officer, Boston Stock Exchange (1985-2001). | 170 | Director, Radio Shack Corp. (1987-2008); Director, National Organization of Investment Professionals; Trustee of the Stratton Mountain School (2001-present). | |||
| Dr. Robert A. Oden, Jr. (1946); Trustee of Trust since 2005; Trustee of heritage One Group Mutual Funds since 1997. | Retired; President, Carleton College (2002-2010); President, Kenyon College (1995-2002). | 170 | Trustee, American University in Cairo (1999-present); Chairman, Dartmouth-Hitchcock Medical Center (2011-present); Trustee, American Schools of Oriental Research (2011-present); Trustee, American Museum of Fly Fishing. | |||
| 18 | JPMORGAN INSURANCE TRUST | DECEMBER 31, 2013 | ||||
Table of Contents
Name (Year of Birth); Positions With the Portfolio (1) | Principal Occupations During Past 5 Years | Number of Complex Overseen by Trustee (2) | Other Directorships Held Outside Fund Complex During Past 5 Years | |||
Independent Trustees (continued) | ||||||
| Marian U. Pardo** (1946); Trustee of Trust since 2013. | Managing Director and Founder, Virtual Capital Management LLC (Investment Consulting) (2007-present); Managing Director, Credit Suisse Asset Management (portfolio manager) (2003-2006). | 170 | Member, Board of Governors, Columbus Citizens Foundation (not-for-profit supporting philanthropic and cultural programs) (2006-present). | |||
| Frederick W. Ruebeck (1939); Trustee of Trust since 2005; Trustee of heritage One Group Mutual Funds since 1994. | Consultant (2000-present); Adviser, JP Greene & Associates, LLC (broker-dealer) (2000-2009); Chief Investment Officer, Wabash College (2004-present); Director of Investments, Eli Lilly and Company (pharmaceuticals) (1988-1999). | 170 | Trustee, Wabash College (1988-present); Chairman, Indianapolis Symphony Orchestra Foundation (1994-present). | |||
| James J. Schonbachler (1943); Trustee of Trust since 2005; Trustee of heritage J.P. Morgan Funds since 2001. | Retired; Managing Director of Bankers Trust Company (financial services) (1968-1998). | 170 | None | |||
Interested Trustee Not Affiliated With the Adviser | ||||||
| Frankie D. Hughes*** (1952), Trustee of Trust since 2008. | President and Chief Investment Officer, Hughes Capital Management, Inc. (fixed income asset management) (1993-present). | 170 | Trustee, The Victory Portfolios (2000-2008) (investment companies). | |||
| (1) | The Trustees serve for an indefinite term, subject to the Trust’s current retirement policy, which is age 75 for all Trustees, except that the Board has determined Mr. Morton should continue to serve until December 31, 2014. In order to fill the vacancies created by the retirement of Fergus Reid, III, William J. Armstrong, and Leonard J. Spalding Jr., effective December 31, 2012, the Board appointed Ms. Martinez and Mr. Merin to serve as Trustees effective January 1, 2013 and Ms. Pardo to serve as Trustee effective February 1, 2013. |
| (2) | A Fund Complex means two or more registered investment companies that hold themselves out to investors as related companies for purposes of investment and investor services or have a common investment adviser or have an investment adviser that is an affiliated person of the investment adviser of any of the other registered investment companies. The J.P. Morgan Funds Complex for which the Board of Trustees serves currently includes eleven registered investment companies (170 funds), including JPMorgan Mutual Fund Group which liquidated effective November 29, 2012 and is in the process of winding up its affairs. |
| * | Ms. McCoy has served as Vice President of Administration and Planning for Northwestern University since 1985. William M. Daley was the Head of Corporate Responsibility for JPMorgan Chase & Co. prior to January 2011 and served as a member of the Board of Trustees of Northwestern University from 2005 through 2010. JPMIM, the Portfolio’s investment adviser, is a wholly-owned subsidiary of JPMorgan Chase & Co. Two members of the Board of Trustees of Northwestern University are executive officers of registered investment advisers (not affiliated with JPMorgan) that are under common control with sub-advisers to certain J.P. Morgan Funds. |
| ** | In connection with prior employment with JPMorgan Chase, Ms. Pardo is the recipient of non-qualified pension plan payments from JPMorgan Chase in the amount of approximately $2,055 per month, which she irrevocably waived effective January 1, 2013, and deferred compensation payments from JPMorgan Chase in the amount of approximately $7,294 per year, which ended in January 2013. In addition, Ms. Pardo receives payments from a fully funded qualified plan, which is not an obligation of JPMorgan Chase. |
| *** | Ms. Hughes is treated as an “interested person” based on the portfolio holdings of clients of Hughes Capital Management, Inc. |
The contact address for each of the Trustees is 270 Park Avenue, New York, NY 10017.
| DECEMBER 31, 2013 | JPMORGAN INSURANCE TRUST | 19 | ||||||
Table of Contents
(Unaudited)
Name (Year of Birth), Positions Held with the Trust (Since) | Principal Occupations During Past 5 Years | |
Robert L. Young (1963), | Chief Operating Officer and Director, J.P. Morgan Investment Management Inc. since 2010; Senior Vice President, J.P. Morgan Funds (2005-2010), Chief Operating Officer, J.P. Morgan Funds (2005-2010); Director and various officer positions for JPMorgan Funds Management, Inc. (formerly One Group Administrative Services) and JPMorgan Distribution Services, Inc. (formerly One Group Dealer Services, Inc.) from 1999 to present. Mr. Young has been with JPMorgan Chase & Co. (formerly Bank One Corporation) since 1997. | |
| Joy C. Dowd (1972), Treasurer and Principal Financial Officer (2010) | Assistant Treasurer of the Trusts from 2009 to 2010; Executive Director, JPMorgan Funds Management, Inc. from February 2011; Vice President, JPMorgan Funds Management, Inc. from December 2008 to February 2011; prior to joining JPMorgan Chase, Ms. Dowd worked in MetLife’s investments audit group from 2005 through 2008. | |
| Frank J. Nasta (1964), Secretary (2008) | Managing Director and Associate General Counsel, JPMorgan Chase since 2008; Previously, Director, Managing Director, General Counsel and Corporate Secretary, J. & W. Seligman & Co. Incorporated; Secretary of each of the investment companies of the Seligman Group of Funds and Seligman Data Corp.; Director and Corporate Secretary, Seligman Advisors, Inc. and Seligman Services, Inc. | |
| Stephen M. Ungerman (1953), Chief Compliance Officer (2005) | Managing Director, JPMorgan Chase & Co.; Mr. Ungerman has been with JPMorgan Chase & Co. since 2000. | |
Kathryn A. Jackson (1962), | Vice President and AML Compliance Manager for JPMorgan Asset Management Compliance since 2011; Senior On-Boarding Specialist for JPMorgan Distribution Services, Inc. in Global Liquidity from 2008 to 2011; prior to joining JPMorgan, Ms. Jackson was a Financial Services Analyst responsible for on-boarding, compliance and training with Nationwide Securities LLC and 1717 Capital Management Company, both registered broker-dealers, from 2005 until 2008. | |
Elizabeth A. Davin (1964), Assistant Secretary (2005)** | Executive Director and Assistant General Counsel, JPMorgan Chase since February 2012; formerly Vice President and Assistant General Counsel, JPMorgan Chase from 2005 until February 2012; Senior Counsel, JPMorgan Chase (formerly Bank One Corporation) from 2004 to 2005. | |
| Jessica K. Ditullio (1962), Assistant Secretary (2005)** | Executive Director and Assistant General Counsel, JPMorgan Chase since February 2011; Ms. Ditullio has served as an attorney with various titles for JPMorgan Chase (formerly Bank One Corporation) since 1990. | |
| John T. Fitzgerald (1975), Assistant Secretary (2008) | Executive Director and Assistant General Counsel, JPMorgan Chase since February 2011; formerly, Vice President and Assistant General Counsel, JPMorgan Chase from 2005 until February 2011. | |
| Carmine Lekstutis (1980), Assistant Secretary (2011) | Vice President and Assistant General Counsel, JPMorgan Chase since 2011; Associate, Skadden, Arps, Slate, Meagher & Flom LLP (law firm) from 2006 to 2011. | |
| Gregory S. Samuels (1980), Assistant Secretary (2010) | Vice President and Assistant General Counsel, JPMorgan Chase since 2010; Associate, Ropes & Gray (law firm) from 2008 to 2010; Associate, Clifford Chance LLP (law firm) from 2005 to 2008. | |
| Pamela L. Woodley (1971), Assistant Secretary (2012) | Vice President and Assistant General Counsel, JPMorgan Chase since November 2004. | |
Michael M. D’Ambrosio (1969), Assistant Treasurer (2012) | Executive Director, JPMorgan Funds Management, Inc. from July 2012; prior to joining JPMorgan Chase, Mr. D’Ambrosio was a Tax Director at PricewaterhouseCoopers LLP since 2006. | |
| Joseph Parascondola (1963), Assistant Treasurer (2011) | Vice President, JPMorgan Funds Management, Inc. since August 2006. | |
| Matthew J. Plastina (1970), Assistant Treasurer (2011) | Vice President, JPMorgan Funds Management, Inc. since August 2010; prior to August 2010, Vice President and Controller, Legg Mason Global Asset Management. | |
Julie A. Roach (1971), Assistant Treasurer (2012)** | Vice President, JPMorgan Funds Management, Inc. from August 2012; prior to joining JPMorgan Chase, Ms. Roach was a Senior Manager with Deloitte since 2001. | |
Gillian I. Sands (1969), Assistant Treasurer (2012) | Vice President, JPMorgan Funds Management, Inc. from September 2012; Assistant Treasurer, Wells Fargo Funds Management (2007-2009). | |
The contact address for each of the officers, unless otherwise noted, is 270 Park Avenue, New York, NY 10017.
| * | The contact address for the officer is 500 Stanton Christiana Road, Ops 1, Floor 02, Newark, DE 19173-2107. |
| ** | The contact address for the officer is 460 Polaris Parkway, Westerville, OH 43082. |
| 20 | JPMORGAN INSURANCE TRUST | DECEMBER 31, 2013 | ||||
Table of Contents
SCHEDULE OF SHAREHOLDER EXPENSES
(Unaudited)
Hypothetical $1,000 Investment
As a shareholder of the Portfolio, you incur ongoing costs, including investment advisory fees, administration fees, distribution fees (for Class 2 Shares) and other Portfolio expenses. Because the Portfolio is a funding vehicle for Policies and Eligible Plans, you may also incur sales charges and other fees relating to the Policies or Eligible Plans. The examples below are intended to help you understand your ongoing costs (in dollars) of investing in the Portfolio, but not the costs of the Policies or Eligible Plans, and to compare these ongoing costs with the ongoing costs of investing in other mutual funds. The examples assume that you had a $1,000 investment in each Class at the beginning of the reporting period, July 1, 2013, and continued to hold your shares at the end of the reporting period, December 31, 2013.
Actual Expenses
For each Class of the Portfolio in the table below, the first line provides information about actual account values and actual expenses. You may use the information in this line, together with the amount you invested, to estimate the expenses that you paid over the period. Simply divide your account value by $1,000 (for example, an $8,600 account value divided by $1,000 = 8.6), then multiply the result by the number in the first line of each Class under the heading entitled “Expenses Paid During the Period” to estimate the expenses you paid on your account during this period.
Hypothetical Example for Comparison Purposes
The second line of each Class in the table below provides information about hypothetical account values and hypothetical expenses based on the Class’ actual expense ratio and an assumed rate of return of 5% per year before expenses, which is not the Class’ actual return. The hypothetical account values and expenses may not be used to estimate the actual ending account balance or expenses you paid for the period. You may use this information to compare the ongoing costs of investing in the Class of the Portfolio and other funds. To do so, compare this 5% hypothetical example with the 5% hypothetical examples that appear in the shareholder reports of the other funds. Please note that the expenses shown in the table are meant to highlight your ongoing costs only and do not reflect any transaction costs, such as sales charges (loads) or redemption fees or the costs associated with the Policies and Eligible Plans through which the Portfolio is held. Therefore, the second line for each Class in the table is useful in comparing ongoing costs only, and will not help you determine the relative total costs of owning different funds. In addition, if these transaction costs were included, your costs would have been higher. The examples also assume all dividends and distributions have been reinvested.
Beginning Account Value | Ending Account Value | Expenses Paid During the Period* | Annualized Expense Ratio | |||||||||||||
International Equity Portfolio | ||||||||||||||||
Class 1 | ||||||||||||||||
Actual | $ | 1,000.00 | $ | 1,154.10 | $ | 5.59 | 1.03 | % | ||||||||
Hypothetical | 1,000.00 | 1,020.01 | 5.24 | 1.03 | ||||||||||||
Class 2 | ||||||||||||||||
Actual | 1,000.00 | 1,152.40 | 6.94 | 1.28 | ||||||||||||
Hypothetical | 1,000.00 | 1,018.75 | 6.51 | 1.28 | ||||||||||||
| * | Expenses are equal to each Class’ respective annualized expense ratio, multiplied by the average account value over the period, multiplied by 184/365 (to reflect the one-half year period). |
| DECEMBER 31, 2013 | JPMORGAN INSURANCE TRUST | 21 | ||||||
Table of Contents
BOARD APPROVAL OF INVESTMENT ADVISORY AGREEMENT
(Unaudited)
The Board of Trustees meets regularly throughout the year and considers factors that are relevant to its annual consideration of investment advisory agreements at each meeting. The Board of Trustees has established various standing committees, composed of Trustees with diverse backgrounds, to which the Board of Trustees has assigned specific subject matter responsibilities to further enhance the effectiveness of the Board’s oversight and decision making. The Board of Trustees and its investment committees (money market and alternative products, equity, and fixed income) also meet for the specific purpose of considering advisory contract annual renewals. The Board of Trustees held meetings in person in June and August 2013, at which the Trustees considered the continuation of the investment advisory agreement for the Portfolio whose annual report is contained herein (the “Advisory Agreement”). At the June meeting, the Board’s investment committees met to review and consider performance, expense and related information for the J.P. Morgan Funds. Each investment committee reported to the full Board, which then considered the investment committee’s preliminary findings. At the August meeting, the Trustees continued their review and consideration. The Trustees, including a majority of the Trustees who are not “interested persons” (as defined in the 1940 Act) of any party to the Advisory Agreement or any of their affiliates, approved the continuation of the Advisory Agreement on August 20, 2013.
The Trustees, as part of their review of the investment advisory arrangements for the J.P. Morgan Funds, considered and reviewed performance and other information received from the Adviser on a regular basis over the course of the year, as well as information specifically prepared for their annual review. This information included the Portfolio’s performance compared to the performance of the Portfolio’s peers and benchmarks and analyses by the Adviser of the Portfolio’s performance. The Adviser also periodically provides comparative information regarding the Portfolio’s expense ratios and those of the peer groups. In addition, in preparation for the June and August meetings, the Trustees requested, received and evaluated extensive materials from the Adviser, including, with respect to the Portfolio, performance and expense information compiled by Lipper Inc. (“Lipper”), an independent provider of investment company data. Prior to voting, the Trustees reviewed the proposed approval of the Advisory Agreement with representatives of the Adviser and with counsels to the Portfolio and independent Trustees and received a memorandum from independent counsel to the Trustees discussing the legal standards for their consideration of the proposed approval. The Trustees also discussed the proposed approvals in executive sessions with counsels to the Portfolio and independent Trustees at which no representatives of the Adviser were present. Set forth below is a summary of the material factors evaluated by the Trustees in determining whether to approve the Advisory Agreement.
In their deliberations, there was a comprehensive consideration of the information received by the Trustees. Each Trustee attributed different weights to the various factors and no factor alone was considered determinative. From year to year, the Trustees consider and place emphasis on relevant information in light of changing circumstances in market and economic conditions. The Trustees determined that the compensation to be received by the Adviser from the Portfolio under the Advisory Agreement was fair and reasonable and that the continuance of the investment advisory contract was in the best interests of the Portfolio and its shareholders.
The factors summarized below were considered and discussed by the Trustees in reaching their conclusions:
Nature, Extent and Quality of Services Provided by the Adviser
The Trustees received and considered information regarding the nature, extent and quality of the services provided to the Portfolio under the Advisory Agreement. The Trustees took into account information furnished throughout the year at Trustee meetings, as well as the materials furnished specifically in connection with this annual review process. The Trustees considered the background and experience of the Adviser’s senior management and the expertise of, and the amount of attention given to the Portfolio by, investment personnel of the Adviser. In addition, the Trustees reviewed the qualifications, backgrounds and responsibilities of the portfolio management team primarily responsible for the day-to-day management of the Portfolio and the infrastructure supporting the team. The Trustees also considered information provided by the Adviser and JPMorgan Distribution Services, Inc. (“JPMDS”) about the structure and distribution strategy of the Portfolio. The Trustees also reviewed information relating to the Adviser’s risk governance model and reports showing the Adviser’s compliance structure and ongoing compliance processes. The quality of the administrative services provided by JPMorgan Funds Management, Inc. (“JPMFM”), an affiliate of the Adviser, was also considered.
The Board of Trustees also considered its knowledge of the nature and quality of the services provided by the Adviser to the Portfolio gained from their experience as Trustees of the J.P. Morgan Funds. In addition, they considered the overall reputation and capabilities of the Adviser and its affiliates, the commitment of the Adviser to provide high quality service to the Portfolio, their overall confidence in the Adviser’s integrity and the Adviser’s responsiveness to questions or concerns raised by them, including the Adviser’s willingness to consider and implement organizational and operational changes designed to improve investment results and the services provided to the Portfolio.
Based on these considerations and other factors, the Trustees concluded that they were satisfied with the nature, extent and quality of the investment advisory services provided to the Portfolio by the Adviser.
| 22 | JPMORGAN INSURANCE TRUST | DECEMBER 31, 2013 | ||||
Table of Contents
Costs of Services Provided and Profitability to the Adviser and its Affiliates
The Trustees received and considered information regarding the profitability to the Adviser and its affiliates in providing services to the Portfolio. The Trustees reviewed and discussed this data. The Trustees recognized that this data is not audited and represents the Adviser’s determination of its and its affiliates’ revenues from the contractual services provided to the Portfolio, less expenses of providing such services. Expenses include direct and indirect costs and are calculated using an allocation methodology developed by the Adviser. The Trustees also recognized that it is difficult to make comparisons of profitability from fund investment advisory contracts because comparative information is not generally publicly available and is affected by numerous factors, including the structure of the particular adviser, the types of funds it manages, its business mix, numerous assumptions regarding allocations and the fact that publicly-traded fund managers’ operating profits and net income are net of distribution and marketing expenses. Based on their review, the Trustees concluded that the profitability to the Adviser under the Advisory Agreement was not unreasonable in light of the services and benefits provided to the Portfolio.
Fall-Out Benefits
The Trustees reviewed information regarding potential “fallout” or ancillary benefits received by the Adviser and its affiliates as a result of their relationship with the Portfolio. The Board also reviewed the adviser’s allocation of fund brokerage for the J.P. Morgan Funds complex, including allocations to brokers who provide research to the adviser.
The Trustees also considered that JPMFM earns fees from the Portfolio for providing administrative services. These fees were shown separately in the profitability analysis presented to the Trustees. The Trustees also considered the payments of Rule 12b-1 fees to JPMDS, an affiliate of the Adviser, which also acts as the Portfolio’s distributor and that these fees are in turn generally paid to financial intermediaries that sell the Portfolio, including financial intermediaries that are affiliates of the Adviser. The Trustees also considered the fees paid to JPMorgan Chase Bank, N.A. (“JPMCB”) for custody and fund accounting and other related services.
Economies of Scale
The Trustees noted that the proposed investment advisory fee schedule for the Portfolio does not contain breakpoints. The Trustees considered whether it would be appropriate to add advisory fee breakpoints and the Trustees concluded that the current fee structure was reasonable in light of the fee waivers and expense limitations that the Adviser has in place that serve to limit the overall net expense ratio at competitive levels. The Trustees also recognized that the fee schedule for the administrative services provided by JPMFM does include a fee break-
point, which is tied to the overall level of non-money market fund assets excluding certain funds-of-funds, as applicable, advised by the Adviser, and that the Portfolio benefits from that breakpoint. The Trustees concluded that shareholders benefited from the lower expense ratios which resulted from these factors.
Independent Written Evaluation of the Portfolio’s Chief Compliance Officer
The Trustees noted that, upon their direction, the Chief Compliance Officer for the Portfolio had prepared an independent written evaluation in order to assist the Trustees in determining the reasonableness of the proposed management fees. The Trustees considered the written evaluation in determining whether to continue the Advisory Agreement.
Fees Relative to Adviser’s Other Clients
The Trustees received and considered information about the nature and extent of investment advisory services and fee rates offered to other clients of the Adviser for investment management styles substantially similar to that of the Portfolio. The Trustees also considered the complexity of investment management for the Portfolio relative to the Adviser’s other clients and the differences in the nature and extent of the services provided to the different clients. The Trustees concluded that the fee rates charged to the Portfolio in comparison to those charged to the Adviser’s other clients were reasonable.
Investment Performance
The Trustees received and considered absolute and/or relative performance for the Portfolio in a report prepared by Lipper. The Trustees considered the total return performance information, which included the ranking of the Portfolio within a performance universe made up of funds with the same Lipper investment classification and objective (the “Universe Group”) by total return for applicable one-, three- and five-year periods. The Trustees reviewed a description of Lipper’s methodology for selecting mutual funds in the Portfolio’s Universe Group. The Lipper materials provided to the Trustees highlighted information with respect to a representative class to assist the Trustees in their review. As part of this review, the Trustees also reviewed the Portfolio’s performance against its benchmark and considered the performance information provided for the Portfolio at regular Board meetings by the Adviser. The Lipper performance data noted by the Trustees as part of their review and the determinations made by the Trustees with respect to the Portfolio’s performance are summarized below:
The Trustees noted the Portfolio’s performance was in the first, second, and first quintiles for Class 1 shares for the one-, three-, and five-year periods ended December 31, 2012, respectively. The Trustees discussed the performance and investment strategy of the Portfolio with the Adviser and, based upon this discussion and various other factors, concluded that the performance was reasonable.
| DECEMBER 31, 2013 | JPMORGAN INSURANCE TRUST | 23 | ||||||
Table of Contents
BOARD APPROVAL OF INVESTMENT ADVISORY AGREEMENT
(Unaudited) (continued)
Advisory Fees and Expense Ratios
The Trustees considered the contractual advisory fee rate paid by the Portfolio to the Adviser and compared that rate to the information prepared by Lipper concerning management fee rates paid by other funds in the same Lipper category as the Portfolio. The Trustees recognized that Lipper reported the Portfolio’s management fee rate as the combined contractual advisory fee and administration fee rates. The Trustees also reviewed information about other expenses and the expense ratios for the Portfolio. The Trustees considered the fee waiver and/or expense reimbursement arrangements currently in place for the Portfolio and considered the net advisory fee rate
after taking into account any waivers and/or reimbursements. The Trustees recognized that it is difficult to make comparisons of advisory fees because there are variations in the services that are included in the fees paid by other funds. The Trustees’ determinations as a result of the review of the Portfolio’s advisory fees and expense ratios are summarized below:
The Trustees noted that the Portfolio’s net advisory fee and actual total expenses for Class 1 shares were in the first quintile of their Universe Group. After considering the factors identified above, in light of this information, the Trustees concluded that the advisory fee was reasonable.
| 24 | JPMORGAN INSURANCE TRUST | DECEMBER 31, 2013 | ||||
Table of Contents
J.P. Morgan Funds are distributed by JPMorgan Distribution Services, Inc., which is an affiliate of JPMorgan Chase & Co. Affiliates of JPMorgan Chase & Co. receive fees for providing various services to the funds.
Contact JPMorgan Distribution Services, Inc. at 1-800-480-4111 for a portfolio prospectus. You can also visit us at www.jpmorganfunds.com. Investors should carefully consider the investment objectives and risk as well as charges and expenses of the mutual fund before investing. The prospectus contains this and other information about the mutual fund. Read the prospectus carefully before investing.
The Portfolio files a complete schedule of its portfolio holdings for the first and third quarters of its fiscal year with the SEC on Form N-Q. The Portfolio’s Forms N-Q are available on the SEC’s website at http://www.sec.gov and may be reviewed and copied at the SEC’s Public Reference Room in Washington, DC. Information on the operation of the SEC’s Public Reference Room may be obtained by calling 1-800-SEC-0330. Shareholders may request the Form N-Q without charge by calling 1-800-480-4111 or by visiting the variable insurance portfolio section of the J.P. Morgan Funds’ website at www.jpmorganfunds.com.
A description of the Portfolio’s policies and procedures with respect to the disclosure of the Portfolio’s holdings is available in the prospectus and Statement of Additional Information.
A copy of proxy policies and procedures is available without charge upon request by calling 1-800-480-4111 and on the Portfolio’s website at www.jpmorganfunds.com. A description of such policies and procedures is on the SEC’s website at www.sec.gov. The Trustees have delegated the authority to vote proxies for securities owned by the Portfolio to the Adviser. A copy of the Portfolio’s voting record for the most recent 12-month period ended June 30 is available on the SEC’s website at www.sec.gov or at the Portfolio’s website at www.jpmorganfunds.com no later than August 31 of each year. The Portfolio’s proxy voting record will include, among other things, a brief description of the matter voted on for each portfolio security, and will state how each vote was cast, for example, for or against the proposal.
Table of Contents
| © JPMorgan Chase & Co., 2014. All rights reserved. December 2013. | AN-JPMITIEP-1213 |
Table of Contents
Annual Report
JPMorgan Insurance Trust
December 31, 2013
JPMorgan Insurance Trust Intrepid Growth Portfolio
NOT FDIC INSURED Ÿ NO BANK GUARANTEE Ÿ MAY LOSE VALUE
|  |
Table of Contents
Investments in the Portfolio are not bank deposits or obligations of, or guaranteed or endorsed by, any bank and are not insured or guaranteed by the FDIC, the Federal Reserve Board or any other government agency. You could lose money if you sell when the Portfolio’s share price is lower than when you invested.
Past performance is no guarantee of future performance. The general market views expressed in this report are opinions based on market and other conditions through the end of the reporting period and are subject to change without notice. These views are not intended to predict the future performance of the Portfolio or the securities markets. References to specific securities and their issuers are for illustrative purposes only and are not intended to be, and should not be interpreted as, recommendations to purchase or sell such securities. Such views are not meant as investment advice and may not be relied on as an indication of trading intent on behalf of the Portfolio.
This Portfolio is intended to be a funding vehicle for variable annuity contracts and variable life insurance policies (collectively “Policies”) offered by separate accounts of participating insurance companies. Portfolio shares are also offered through qualified pension and retirement plans (“Eligible Plans”). Individuals may not purchase shares directly from the Portfolio.
Prospective investors should refer to the Portfolio’s prospectus for a discussion of the Portfolio’s investment objective, strategies and risks. Call J.P. Morgan Funds Service Center at 1-800-480-4111 for a prospectus containing more complete information about the Portfolio, including management fees and other expenses. Please read it carefully before investing.
Table of Contents
January 23, 2014 (Unaudited)
Dear Shareholder,
Equities markets in developed economies performed strongly in the face of periodic spikes in volatility throughout the twelve months ended December 31, 2013. Healthy corporate earnings and incremental but steady improvements in a range of economic indicators provided a positive backdrop for investors seeking returns in the low interest rate environment. While political discord in Washington injected volatility into the market, a bipartisan budget agreement at the end of the year relieved much of the political uncertainty created by partisan brinkmanship over the so-called fiscal cliff and the partial shutdown of the federal government in October. In the first half of the year, the U.S. Federal Reserve (“Fed”) announced its intention to taper off its $85 billion in monthly asset purchases and the statement weakened investor sentiment and set off widespread speculation about the timing and magnitude of such a move. The Fed followed through in December, deciding to reduce its monthly purchases by $10 billion. The news, along with robust gains in jobs, housing and consumer sentiment, drove U.S. equities to new highs. The S&P 500 stock index hit seven closing highs in the final month of the reporting period, finishing 2013 with its best performance since 1997.
 |
“While a repeat of the equity performance we experienced in 2013 may be a tall order, we believe stocks in the U.S. and Europe may continue to show gains.” |
Overseas, the European Central Bank reaffirmed its commitment to accommodative monetary policy and to the euro itself. In the second quarter of the year, the European Union (EU) returned to positive growth and at the end of the year, Ireland became the first nation to exit from its European Union bailout program. The Fed’s decision to curb its asset purchases also sent equities higher in Europe, as investors viewed the move as a sign of further economic stability. In Japan, equity markets rebounded to their best year since 1988, benefitting from Prime Minister Shinzo Abe’s efforts to revive the economy. Low returns on bonds and short-term debt instruments also drove investors into stocks.
Emerging market equities were weaker overall. As of December 31, 2013, the MSCI Emerging Markets Index returned -2.3% for the year. China’s economy showed signs of slower growth during the year and the Fed’s decision to taper its asset purchase program set off speculation that the maturation of the emerging markets credit cycle would push yield-seeking investors to rotate into developed markets.
Taper Talk Pressures Bonds
Fixed income markets generally remained weak during the year, as central bankers across the globe held interest rates at
historic lows. However, benchmark bond yields rose on an annual basis for the first time since 2009. During the year, the Fed’s talk of tapering off its Quantitative Easing (QE) program hurt fixed income markets. U.S. Treasury security yields continued to be low from a historical perspective, but ended the period higher. The yield for 10-year U.S. Treasury securities ended December 31, 2013 at 3.04%, while the yields for 2- and 30-year U.S. Treasury securities finished the reporting period at 0.38% and 3.96%, respectively. High-yield debt returned 7.4% for the year, as measured by the Barclays US High Yield Corporate Index, while other U.S. debt securities and emerging market debt both had negative returns.
While global economic growth accelerated during the year, the U.S. recovery in particular showed stronger fundamentals and the Fed’s decision to taper its QE program was a response to the improved picture. Europe emerged from its lengthy recession and the worst of the fiscal crises seem to be behind it, though unemployment remains strikingly high in many EU nations. Japan made progress toward ending persistent deflation, but Tokyo’s monetary and fiscal stimulus has sharply weakened the yen, putting other Asian exporting nations — notably China and South Korea — at a competitive disadvantage. Emerging market economies may face further headwinds as foreign investment shrinks and economic growth moderates from recent strength. Moreover, political instability — already apparent in Thailand and Turkey — may surface in other emerging market nations as governments struggle to deliver improved living standards and respond to demands for political reforms.
The Long-Term Lens
We welcome the Fed’s move to curb its QE program as a sign that the U.S. economy’s need for artificial stimulus is waning. While a repeat of the equity performance we experienced in 2013 may be a tall order, we believe stocks in the U.S. and Europe may continue to show gains. In the fixed-income market, persistent weakness has led to attractive valuations in some sectors. The past year’s market swings and intermittent volatility underlined the importance of maintaining a long-term view of your investment portfolio and the benefits derived from diversified holdings.
On behalf of everyone at J.P. Morgan Asset Management, thank you for your continued support. We look forward to managing your investment needs for years to come. Should you have any questions, please visit www.jpmorganfunds.com or contact the J.P. Morgan Funds Service Center at 1-800-480-4111.
Sincerely yours,

George C.W. Gatch
CEO, Global Funds Management
J.P. Morgan Asset Management
| DECEMBER 31, 2013 | JPMORGAN INSURANCE TRUST | 1 | ||||||
Table of Contents
JPMorgan Insurance Trust Intrepid Growth Portfolio
TWELVE MONTHS ENDED DECEMBER 31, 2013 (Unaudited)
| REPORTING PERIOD RETURN: | ||||
| Portfolio (Class 1 Shares)* | 34.47% | |||
| Russell 1000 Growth Index | 33.48% | |||
| Net Assets as of 12/31/2013 | 40,901,160 | |||
INVESTMENT OBJECTIVE**
The JPMorgan Insurance Trust Intrepid Growth Portfolio (the “Portfolio”) seeks to provide long-term capital growth.
HOW DID THE MARKET PERFORM?
Overall, the U.S. equity market performed strongly during the 12 months ended December 31, 2013, as a tepid economic recovery continued to gain strength from healthy corporate earnings, along with improvements in employment, housing and consumer sentiment. The stock market retreated at midyear amid investor uncertainty about the U.S. Federal Reserve Board’s (the “Fed”) plan to taper off its monthly purchases of $85 billion in U.S. Treasuries and mortgage-backed securities. Interest rates rose sharply higher, pressuring prices for both stocks and bonds. Partisan brinkmanship in Washington added to the uncertainty, starting with the standoff over the so-called fiscal cliff in January and followed by the partial shutdown of the federal government in October. A bipartisan budget agreement toward the end of the year relieved some of the political uncertainty. During the year, the U.S. unemployment rate fell from 7.9% in January to 6.7% at year end, with slight upticks in joblessness at midyear and in October. Adding to the positive trend were advances in housing prices and auto sales in the second half of the year, and a rebound in consumer sentiment to a five-month high in December. The Russell 1000 Growth Index (the “Benchmark”) returned 33.48% for the year.
WHAT WERE THE MAIN DRIVERS OF THE PORTFOLIO’S PERFORMANCE?
The Portfolio (Class 1 Shares) outperformed the Benchmark for the 12 months ended December 31, 2013. Stock selection in the industrials and consumer staples sectors was the main contributor to the Portfolio’s relative performance. Stock selection in the energy and telecommunication services sectors detracted from relative performance.
Leading individual contributors to relative performance included Gilead Sciences Inc., IBM Corp. and Nu Skin Enterprises Inc. Shares of Gilead Sciences, a biotechnology company, rose on positive clinical trial results for several of its drugs.
Shares of IBM were among the worst performers during the period and the Portfolio’s underweight position relative to the Benchmark helped performance. Shares of Nu Skin, a maker of nutritional supplements, rose on an improved sales outlook for its anti-aging products in China.
Leading individual detractors to relative performance included Apple Inc., Facebook Inc. and Eli Lilly & Co. Shares of Apple, a maker of personal computers, mobile devices and software, sank on investors’ focus on growth comparisons with its large-cap peers Amazon.com Inc. and Google Inc. Shares of Facebook, a social media technology company, rose during the year and the Portfolio’s lack of a position in the stock hurt performance relative to the Benchmark. Shares of Eli Lilly, a pharmaceutical company, slumped ahead of pending expiration of patent protection on several key drugs.
HOW WAS THE PORTFOLIO POSITIONED?
The JPMorgan Intrepid Investment Team employs a philosophy that is rooted in behavioral finance, a field of study that emphasizes the importance of human psychology in financial markets. Behavioral finance examines how investor behavior can be affected by emotional biases and reactions. The field theorizes that inefficiencies arise in the stock market because investors are consistently irrational in making many investment decisions.
The Team aims to capitalize on these market inefficiencies by targeting what it believes are attractively valued stocks with strong fundamentals and momentum characteristics, and looks to sell these stocks when they no longer exhibit these criteria. A disciplined quantitative ranking methodology is utilized to attempt to identify attractive stocks in each sector, a process that is combined with qualitative research and value-added trading. Portfolios are constructed with limited sector bets so that stock selection is typically the primary driver of relative performance.
During the reporting period, the Portfolio was managed and positioned in accordance with this investment philosophy and process.
| 2 | JPMORGAN INSURANCE TRUST | DECEMBER 31, 2013 | ||||
Table of Contents
| TOP TEN EQUITY HOLDINGS OF THE PORTFOLIO*** | ||||||||
| 1. | Microsoft Corp. | 4.7 | % | |||||
| 2. | Oracle Corp. | 2.9 | ||||||
| 3. | Home Depot, Inc. (The) | 2.7 | ||||||
| 4. | Boeing Co. (The) | 2.7 | ||||||
| 5. | Gilead Sciences, Inc. | 2.5 | ||||||
| 6. | Visa, Inc., Class A | 2.3 | ||||||
| 7. | Amgen, Inc. | 2.3 | ||||||
| 8. | priceline.com, Inc. | 2.1 | ||||||
| 9. | Google, Inc., Class A | 2.0 | ||||||
| 10. | Viacom, Inc., Class B | 2.0 | ||||||
PORTFOLIO COMPOSITION BY SECTOR*** | ||||
| Information Technology | 27.7 | % | ||
| Consumer Discretionary | 18.1 | |||
| Health Care | 12.6 | |||
| Industrials | 12.6 | |||
| Consumer Staples | 11.8 | |||
| Financials | 4.8 | |||
| Energy | 4.8 | |||
| Materials | 4.3 | |||
| Telecommunication Services | 1.6 | |||
| Utilities | 0.4 | |||
| Short-Term Investment | 1.3 | |||
| * | The return shown is based on net asset values calculated for shareholder transactions and may differ from the return shown in the financial highlights, which reflects adjustments made to the net asset values in accordance with accounting principles generally accepted in the United States of America. |
| ** | The adviser seeks to achieve the Portfolio’s objective. There can be no guarantee it will be achieved. |
| *** | Percentages indicated are based on total investments as of December 31, 2013. The Portfolio’s composition is subject to change. |
| DECEMBER 31, 2013 | JPMORGAN INSURANCE TRUST | 3 | ||||||
Table of Contents
JPMorgan Insurance Trust Intrepid Growth Portfolio
PORTFOLIO COMMENTARY
TWELVE MONTHS ENDED DECEMBER 31, 2013 (Unaudited) (continued)
AVERAGE ANNUAL TOTAL RETURNS AS OF DECEMBER 31, 2013 | ||||||||||||||||
| INCEPTION DATE OF CLASS | 1 YEAR | 5 YEAR | 10 YEAR | |||||||||||||
CLASS 1 SHARES | 8/1/94 | 34.47 | % | 19.96 | % | 7.16 | % | |||||||||
CLASS 2 SHARES | 8/16/06 | 34.16 | 19.65 | 6.96 | ||||||||||||
TEN YEAR PERFORMANCE (12/31/03 TO 12/31/13)
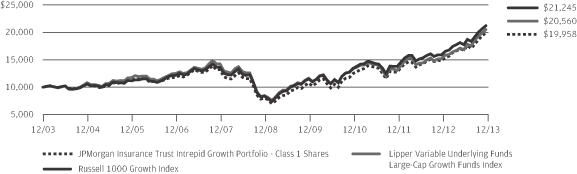
The performance quoted is past performance and is not a guarantee of future results. Mutual funds are subject to certain market risks. Investment returns and principal value of an investment will fluctuate so that an investor’s shares, when redeemed, may be worth more or less than their original cost. Current performance may be higher or lower than the performance data shown. For up-to-date month-end performance information please call 1-800-480-4111. Effective November 1, 2006, the Portfolio’s investment objective and strategies changed. Although past performance is not necessarily an indication of how the Portfolio will perform in the future, in view of these changes, the Portfolio’s performance record prior to this period might be less relevant for investors considering whether to purchase shares of the Portfolio.
Returns for Class 2 Shares prior to its inception date are based on the performance of Class 1 Shares. The actual returns of Class 2 Shares would have been lower than those shown because Class 2 Shares have higher expenses than Class 1 Shares.
The graph illustrates comparative performance for $10,000 invested in Class 1 Shares of the JPMorgan Insurance Trust Intrepid Growth Portfolio, the Russell 1000 Growth Index and the Lipper Variable Underlying Funds Large-Cap Growth Funds Index from December 31, 2003 to December 31, 2013. The performance of the Portfolio assumes reinvestment of all dividends and capital gain distributions, if any. The performance of the Russell 1000 Growth Index
does not reflect the deduction of expenses associated with a mutual fund and has been adjusted to reflect reinvestment of all dividends and capital gain distributions of the securities included in the benchmark, if applicable. The performance of the Lipper Variable Underlying Funds Large-Cap Growth Funds Index includes expenses associated with a mutual fund, such as investment management fees. These expenses are not identical to the expenses incurred by the Portfolio. The Russell 1000 Growth Index is an unmanaged index which measures the performance of those Russell 1000 companies with higher price-to-book ratios and higher forecasted growth values. The Lipper Variable Underlying Funds Large-Cap Growth Funds Index is an index based on the total returns of certain mutual funds within the Portfolio’s designated category as determined by Lipper, Inc. Investors cannot invest directly in an index.
Portfolio performance does not reflect any charges imposed by the Policies or Eligible Plans. If these charges were included, the returns would be lower than shown. Portfolio performance may reflect the waiver of the Portfolio’s fees and reimbursement of expenses for certain periods since the inception date. Without these waivers and reimbursements, performance would have been lower.
The returns shown are based on net asset values calculated for shareholder transactions and may differ from the returns shown in the financial highlights, which reflect adjustments made to the net asset values in accordance with accounting principles generally accepted in the United States of America.
| 4 | �� | JPMORGAN INSURANCE TRUST | DECEMBER 31, 2013 | |||
Table of Contents
JPMorgan Insurance Trust Intrepid Growth Portfolio
SCHEDULE OF PORTFOLIO INVESTMENTS
AS OF DECEMBER 31, 2013
| SHARES | SECURITY DESCRIPTION | VALUE($) | ||||||
| Common Stocks — 98.8% |
| ||||||
Consumer Discretionary — 18.2% |
| |||||||
Auto Components — 0.5% |
| |||||||
| 3,550 | Delphi Automotive plc, (United Kingdom) | 213,461 | ||||||
|
| |||||||
Diversified Consumer Services — 0.7% | ||||||||
| 5,250 | H&R Block, Inc. | 152,460 | ||||||
| 7,400 | Service Corp. International | 134,162 | ||||||
|
| |||||||
| 286,622 | ||||||||
|
| |||||||
Hotels, Restaurants & Leisure — 2.3% |
| |||||||
| 2,375 | Bally Technologies, Inc. (a) | 186,319 | ||||||
| 3,925 | Dunkin’ Brands Group, Inc. | 189,185 | ||||||
| 2,075 | Hyatt Hotels Corp., Class A (a) | 102,630 | ||||||
| 2,225 | Wyndham Worldwide Corp. | 163,960 | ||||||
| 1,505 | Wynn Resorts Ltd. | 292,286 | ||||||
|
| |||||||
| 934,380 | ||||||||
|
| |||||||
Household Durables — 1.3% |
| |||||||
| 475 | Harman International Industries, Inc. | 38,879 | ||||||
| 3,200 | Jarden Corp. (a) | 196,320 | ||||||
| 6,950 | PulteGroup, Inc. | 141,571 | ||||||
| 900 | Whirlpool Corp. | 141,174 | ||||||
|
| |||||||
| 517,944 | ||||||||
|
| |||||||
Internet & Catalog Retail — 2.0% |
| |||||||
| 725 | priceline.com, Inc. (a) | 842,740 | ||||||
|
| |||||||
Leisure Equipment & Products — 0.1% |
| |||||||
| 725 | Mattel, Inc. | 34,496 | ||||||
|
| |||||||
Media — 4.9% |
| |||||||
| 9,600 | Comcast Corp., Class A | 498,864 | ||||||
| 6,050 | DIRECTV (a) | 417,994 | ||||||
| 250 | Graham Holdings Co., Class B (a) | 165,830 | ||||||
| 725 | Time Warner Cable, Inc. | 98,238 | ||||||
| 9,350 | Viacom, Inc., Class B | 816,629 | ||||||
|
| |||||||
| 1,997,555 | ||||||||
|
| |||||||
Multiline Retail — 1.3% |
| |||||||
| 9,675 | Macy’s, Inc. | 516,645 | ||||||
|
| |||||||
Specialty Retail — 4.7% |
| |||||||
| 9,025 | Best Buy Co., Inc. | 359,917 | ||||||
| 2,625 | GameStop Corp., Class A | 129,308 | ||||||
| 13,600 | Home Depot, Inc. (The) | 1,119,824 | ||||||
| 3,175 | Lowe’s Cos., Inc. | 157,321 | ||||||
| 9,025 | Staples, Inc. | 143,407 | ||||||
|
| |||||||
| 1,909,777 | ||||||||
|
| |||||||
Textiles, Apparel & Luxury Goods — 0.4% |
| |||||||
| 2,450 | Hanesbrands, Inc. | 172,161 | ||||||
|
| |||||||
Total Consumer Discretionary | 7,425,781 | |||||||
|
| |||||||
| SHARES | SECURITY DESCRIPTION | VALUE($) | ||||||
Consumer Staples — 11.8% |
| |||||||
Beverages — 3.1% |
| |||||||
| 14,100 | Coca-Cola Co. (The) | 582,471 | ||||||
| 2,900 | Molson Coors Brewing Co., Class B | 162,835 | ||||||
| 6,450 | PepsiCo, Inc. | 534,963 | ||||||
|
| |||||||
| 1,280,269 | ||||||||
|
| |||||||
Food & Staples Retailing — 2.9% |
| |||||||
| 14,150 | Kroger Co. (The) | 559,350 | ||||||
| 10,450 | Walgreen Co. | 600,248 | ||||||
|
| |||||||
| 1,159,598 | ||||||||
|
| |||||||
Food Products — 2.8% |
| |||||||
| 8,900 | Archer-Daniels-Midland Co. | 386,260 | ||||||
| 5,175 | General Mills, Inc. | 258,284 | ||||||
| 2,525 | Mead Johnson Nutrition Co. | 211,494 | ||||||
| 7,950 | Pilgrim’s Pride Corp. (a) | 129,187 | ||||||
| 4,975 | Tyson Foods, Inc., Class A | 166,464 | ||||||
|
| |||||||
| 1,151,689 | ||||||||
|
| |||||||
Household Products — 0.4% |
| |||||||
| 1,475 | Energizer Holdings, Inc. | 159,654 | ||||||
|
| |||||||
Personal Products — 0.9% |
| |||||||
| 2,325 | Herbalife Ltd., (Cayman Islands) | 182,977 | ||||||
| 1,275 | Nu Skin Enterprises, Inc., Class A | 176,231 | ||||||
|
| |||||||
| 359,208 | ||||||||
|
| |||||||
Tobacco — 1.7% |
| |||||||
| 18,475 | Altria Group, Inc. | 709,255 | ||||||
|
| |||||||
Total Consumer Staples | 4,819,673 | |||||||
|
| |||||||
Energy — 4.8% |
| |||||||
Energy Equipment & Services — 0.2% |
| |||||||
| 850 | Schlumberger Ltd. | 76,594 | ||||||
|
| |||||||
Oil, Gas & Consumable Fuels — 4.6% |
| |||||||
| 6,225 | Anadarko Petroleum Corp. | 493,767 | ||||||
| 684 | Chevron Corp. | 85,438 | ||||||
| 2,775 | ConocoPhillips | 196,054 | ||||||
| 4,625 | Devon Energy Corp. | 286,149 | ||||||
| 1,375 | Marathon Petroleum Corp. | 126,129 | ||||||
| 7,050 | Phillips 66 | 543,766 | ||||||
| 2,650 | Tesoro Corp. | 155,025 | ||||||
|
| |||||||
| 1,886,328 | ||||||||
|
| |||||||
Total Energy | 1,962,922 | |||||||
|
| |||||||
Financials — 4.8% |
| |||||||
Capital Markets — 0.2% |
| |||||||
| 2,050 | Morgan Stanley | 64,288 | ||||||
|
| |||||||
SEE NOTES TO FINANCIAL STATEMENTS.
| DECEMBER 31, 2013 | JPMORGAN INSURANCE TRUST | 5 | ||||||
Table of Contents
JPMorgan Insurance Trust Intrepid Growth Portfolio
SCHEDULE OF PORTFOLIO INVESTMENTS
AS OF DECEMBER 31, 2013 (continued)
| SHARES | SECURITY DESCRIPTION | VALUE($) | ||||||
| Common Stocks — Continued |
| ||||||
Consumer Finance — 1.6% |
| |||||||
| 11,650 | Discover Financial Services | 651,818 | ||||||
| 750 | SLM Corp. | 19,710 | ||||||
|
| |||||||
| 671,528 | ||||||||
|
| |||||||
Insurance — 0.6% |
| |||||||
| 650 | Assurant, Inc. | 43,140 | ||||||
| 1,200 | Prudential Financial, Inc. | 110,664 | ||||||
| 400 | RenaissanceRe Holdings Ltd., (Bermuda) | 38,936 | ||||||
| 1,500 | Validus Holdings Ltd., (Bermuda) | 60,435 | ||||||
|
| |||||||
| 253,175 | ||||||||
|
| |||||||
Real Estate Investment Trusts (REITs) — 2.0% |
| |||||||
| 7,275 | American Tower Corp. | 580,691 | ||||||
| 3,700 | Extra Space Storage, Inc. | 155,881 | ||||||
| 1,775 | Ventas, Inc. | 101,672 | ||||||
|
| |||||||
| 838,244 | ||||||||
|
| |||||||
Thrifts & Mortgage Finance — 0.4% |
| |||||||
| 2,700 | Ocwen Financial Corp. (a) | 149,715 | ||||||
|
| |||||||
Total Financials | 1,976,950 | |||||||
|
| |||||||
Health Care — 12.6% |
| |||||||
Biotechnology — 6.5% |
| |||||||
| 8,100 | Amgen, Inc. | 924,696 | ||||||
| 13,400 | Gilead Sciences, Inc. (a) | 1,007,010 | ||||||
| 1,700 | Pharmacyclics, Inc. (a) | 179,826 | ||||||
| 450 | United Therapeutics Corp. (a) | 50,886 | ||||||
| 6,650 | Vertex Pharmaceuticals, Inc. (a) | 494,095 | ||||||
|
| |||||||
| 2,656,513 | ||||||||
|
| |||||||
Health Care Equipment & Supplies — 0.6% |
| |||||||
| 4,350 | CareFusion Corp. (a) | 173,217 | ||||||
| 1,550 | Medtronic, Inc. | 88,955 | ||||||
|
| |||||||
| 262,172 | ||||||||
|
| |||||||
Health Care Providers & Services — 3.5% |
| |||||||
| 2,700 | AmerisourceBergen Corp. | 189,837 | ||||||
| 1,500 | Cigna Corp. | 131,220 | ||||||
| 1,975 | McKesson Corp. | 318,765 | ||||||
| 3,025 | Omnicare, Inc. | 182,589 | ||||||
| 6,550 | WellPoint, Inc. | 605,154 | ||||||
|
| |||||||
| 1,427,565 | ||||||||
|
| |||||||
Pharmaceuticals — 2.0% |
| |||||||
| 3,725 | AbbVie, Inc. | 196,717 | ||||||
| 20,150 | Pfizer, Inc. | 617,195 | ||||||
|
| |||||||
| 813,912 | ||||||||
|
| |||||||
Total Health Care | 5,160,162 | |||||||
|
| |||||||
| SHARES | SECURITY DESCRIPTION | VALUE($) | ||||||
Industrials — 12.6% |
| |||||||
Aerospace & Defense — 4.4% |
| |||||||
| 7,975 | Boeing Co. (The) | 1,088,508 | ||||||
| 5,200 | Northrop Grumman Corp. | 595,972 | ||||||
| 3,000 | Spirit Aerosystems Holdings, Inc., Class A (a) | 102,240 | ||||||
|
| |||||||
| 1,786,720 | ||||||||
|
| |||||||
Air Freight & Logistics — 0.9% |
| |||||||
| 3,700 | United Parcel Service, Inc., Class B | 388,796 | ||||||
|
| |||||||
Airlines — 2.0% |
| |||||||
| 2,100 | Alaska Air Group, Inc. | 154,077 | ||||||
| 17,500 | Delta Air Lines, Inc. | 480,725 | ||||||
| 9,500 | Southwest Airlines Co. | 178,980 | ||||||
|
| |||||||
| 813,782 | ||||||||
|
| |||||||
Building Products — 0.1% |
| |||||||
| 858 | Allegion plc, (Ireland) (a) | 37,915 | ||||||
|
| |||||||
Commercial Services & Supplies — 0.9% |
| |||||||
| 8,675 | Pitney Bowes, Inc. | 202,127 | ||||||
| 7,875 | R.R. Donnelley & Sons Co. | 159,705 | ||||||
|
| |||||||
| 361,832 | ||||||||
|
| |||||||
Construction & Engineering — 0.4% |
| |||||||
| 5,625 | AECOM Technology Corp. (a) | 165,544 | ||||||
|
| |||||||
Industrial Conglomerates — 0.9% |
| |||||||
| 4,525 | Danaher Corp. | 349,330 | ||||||
|
| |||||||
Machinery — 2.7% |
| |||||||
| 2,375 | IDEX Corp. | 175,394 | ||||||
| 10,375 | Ingersoll-Rand plc, (Ireland) | 639,100 | ||||||
| 2,325 | Parker Hannifin Corp. | 299,088 | ||||||
|
| |||||||
| 1,113,582 | ||||||||
|
| |||||||
Professional Services — 0.3% |
| |||||||
| 1,150 | Dun & Bradstreet Corp. (The) | 141,162 | ||||||
|
| |||||||
Total Industrials | 5,158,663 | |||||||
|
| |||||||
Information Technology — 27.7% |
| |||||||
Communications Equipment — 0.9% |
| |||||||
| 9,225 | Brocade Communications Systems, Inc. (a) | 81,826 | ||||||
| 5,300 | Cisco Systems, Inc. | 118,985 | ||||||
| 3,825 | Ubiquiti Networks, Inc. (a) | 175,797 | ||||||
|
| |||||||
| 376,608 | ||||||||
|
| |||||||
Computers & Peripherals — 5.1% |
| |||||||
| 755 | Apple, Inc. | 423,638 | ||||||
| 21,875 | Hewlett-Packard Co. | 612,062 | ||||||
| 4,500 | NetApp, Inc. | 185,130 | ||||||
| 2,325 | SanDisk Corp. | 164,006 | ||||||
| 925 | Seagate Technology plc, (Ireland) | 51,948 | ||||||
SEE NOTES TO FINANCIAL STATEMENTS.
| 6 | JPMORGAN INSURANCE TRUST | DECEMBER 31, 2013 | ||||
Table of Contents
| SHARES | SECURITY DESCRIPTION | VALUE($) | ||||||
| Common Stocks — Continued |
| ||||||
Computers & Peripherals — Continued |
| |||||||
| 7,675 | Western Digital Corp. | 643,933 | ||||||
|
| |||||||
| 2,080,717 | ||||||||
|
| |||||||
Internet Software & Services — 4.1% |
| |||||||
| 735 | Google, Inc., Class A (a) | 823,722 | ||||||
| 900 | Twitter, Inc. (a) | 57,285 | ||||||
| 2,925 | VeriSign, Inc. (a) | 174,856 | ||||||
| 15,325 | Yahoo!, Inc. (a) | 619,743 | ||||||
|
| |||||||
| 1,675,606 | ||||||||
|
| |||||||
IT Services — 3.6% |
| |||||||
| 750 | Alliance Data Systems Corp. (a) | 197,197 | ||||||
| 3,900 | Amdocs Ltd. | 160,836 | ||||||
| 3,225 | Computer Sciences Corp. | 180,213 | ||||||
| 4,250 | Visa, Inc., Class A | 946,390 | ||||||
|
| |||||||
| 1,484,636 | ||||||||
|
| |||||||
Semiconductors & Semiconductor Equipment — 2.5% |
| |||||||
| 3,225 | Broadcom Corp., Class A | 95,621 | ||||||
| 2,625 | KLA-Tencor Corp. | 169,207 | ||||||
| 5,750 | Lam Research Corp. (a) | 313,088 | ||||||
| 13,025 | LSI Corp. | 143,536 | ||||||
| 12,100 | Marvell Technology Group Ltd., (Bermuda) | 173,998 | ||||||
| 2,275 | Xilinx, Inc. | 104,468 | ||||||
|
| |||||||
| 999,918 | ||||||||
|
| |||||||
Software — 11.5% |
| |||||||
| 31,500 | Activision Blizzard, Inc. | 561,645 | ||||||
| 4,025 | Adobe Systems, Inc. (a) | 241,017 | ||||||
| 51,175 | Microsoft Corp. | 1,915,480 | ||||||
| 31,390 | Oracle Corp. | 1,200,982 | ||||||
| 7,625 | Rovi Corp. (a) | 150,136 | ||||||
| 27,350 | Symantec Corp. | 644,913 | ||||||
|
| |||||||
| 4,714,173 | ||||||||
|
| |||||||
Total Information Technology | 11,331,658 | |||||||
|
| |||||||
| SHARES | SECURITY DESCRIPTION | VALUE($) | ||||||
Materials — 4.3% |
| |||||||
Chemicals — 3.1% |
| |||||||
| 9,750 | LyondellBasell Industries N.V., Class A | 782,730 | ||||||
| 2,514 | PPG Industries, Inc. | 476,805 | ||||||
|
| |||||||
| 1,259,535 | ||||||||
|
| |||||||
Containers & Packaging — 0.8% |
| |||||||
| 2,500 | Packaging Corp. of America | 158,200 | ||||||
| 5,100 | Sealed Air Corp. | 173,655 | ||||||
| 300 | Silgan Holdings, Inc. | 14,406 | ||||||
|
| |||||||
| 346,261 | ||||||||
|
| |||||||
Metals & Mining — 0.4% |
| |||||||
| 3,675 | Worthington Industries, Inc. | 154,644 | ||||||
|
| |||||||
Total Materials | 1,760,440 | |||||||
|
| |||||||
Telecommunication Services — 1.6% |
| |||||||
Diversified Telecommunication Services — 1.6% |
| |||||||
| 14,175 | AT&T, Inc. | 498,393 | ||||||
| 5,277 | CenturyLink, Inc. | 168,072 | ||||||
|
| |||||||
Total Telecommunication Services | 666,465 | |||||||
|
| |||||||
Utilities — 0.4% |
| |||||||
Independent Power Producers & Energy Traders — 0.4% |
| |||||||
| 11,025 | AES Corp. | 159,973 | ||||||
|
| |||||||
Total Common Stocks | 40,422,687 | |||||||
|
| |||||||
| Short-Term Investment — 1.3% |
| ||||||
Investment Company — 1.3% |
| |||||||
| 516,001 | JPMorgan Liquid Assets Money Market Fund, Institutional Class Shares, 0.020% (b) (l) (m) | 516,001 | ||||||
|
| |||||||
Total Investments — 100.1% | 40,938,688 | |||||||
Liabilities in Excess of | (37,528 | ) | ||||||
|
| |||||||
NET ASSETS — 100.0% | $ | 40,901,160 | ||||||
|
| |||||||
Percentages indicated are based on net assets.
| Futures Contracts | ||||||||||||||||
| NUMBER OF CONTRACTS | DESCRIPTION | EXPIRATION DATE | NOTIONAL VALUE AT 12/31/13 | NET UNREALIZED APPRECIATION (DEPRECIATION) | ||||||||||||
Long Futures Outstanding | ||||||||||||||||
| 5 | E-mini S&P 500 | 03/21/14 | $ | 460,275 | $ | 8,913 | ||||||||||
|
| |||||||||||||||
SEE NOTES TO FINANCIAL STATEMENTS.
| DECEMBER 31, 2013 | JPMORGAN INSURANCE TRUST | 7 | ||||||
Table of Contents
JPMorgan Insurance Trust Intrepid Growth Portfolio
NOTES TO SCHEDULE OF PORTFOLIO INVESTMENTS
AS OF DECEMBER 31, 2013
| (a) | — Non-income producing security. | |
| (b) | — Investment in affiliate. Money market fund registered under the Investment Company Act of 1940, as amended, and advised by J.P. Morgan Investment Management Inc. | |
| (l) | — The rate shown is the current yield as of December 31, 2013. |
| (m) | — All or a portion of this security is reserved and/or pledged with the custodian for current or potential holdings of futures, swaps, options, TBAs, when-issued securities, delayed delivery securities, reverse repurchase agreements, unfunded commitments and/or forward foreign currency exchange contracts. |
SEE NOTES TO FINANCIAL STATEMENTS.
| 8 | JPMORGAN INSURANCE TRUST | DECEMBER 31, 2013 | ||||
Table of Contents
STATEMENT OF ASSETS AND LIABILITIES
AS OF DECEMBER 31, 2013
Intrepid Growth | ||||
ASSETS: | ||||
Investments in non-affiliates, at value | $ | 40,422,687 | ||
Investments in affiliates, at value | 516,001 | |||
|
| |||
Total investment securities, at value | 40,938,688 | |||
Deposits at broker for futures contracts | 90,000 | |||
Receivables: | ||||
Investment securities sold | 45,024 | |||
Portfolio shares sold | 445 | |||
Interest and dividends from non-affiliates | 41,920 | |||
Dividends from affiliates | 16 | |||
Variation margin on futures contracts | 1,600 | |||
|
| |||
Total Assets | 41,117,693 | |||
|
| |||
LIABILITIES: | ||||
Payables: | ||||
Investment securities purchased | 116,256 | |||
Portfolio shares redeemed | 25,319 | |||
Accrued liabilities: | ||||
Investment advisory fees | 22,108 | |||
Administration fees | 1,947 | |||
Distribution fees | 7 | |||
Custodian and accounting fees | 9,379 | |||
Trustees’ and Chief Compliance Officer’s fees | 104 | |||
Audit fees | 32,704 | |||
Other | 8,709 | |||
|
| |||
Total Liabilities | 216,533 | |||
|
| |||
Net Assets | $ | 40,901,160 | ||
|
| |||
NET ASSETS: | ||||
Paid-in-Capital | $ | 43,784,995 | ||
Accumulated undistributed net investment income | 320,152 | |||
Accumulated net realized gains (losses) | (12,921,245 | ) | ||
Net unrealized appreciation (depreciation) | 9,717,258 | |||
|
| |||
Total Net Assets | $ | 40,901,160 | ||
|
| |||
Net Assets: | ||||
Class 1 | $ | 40,866,604 | ||
Class 2 | 34,556 | |||
|
| |||
Total | $ | 40,901,160 | ||
|
| |||
Outstanding units of beneficial interest (shares) (unlimited number of shares authorized, no par value): | ||||
Class 1 | 1,745,780 | |||
Class 2 | 1,481 | |||
Net Asset Value, offering and redemption price per share: (a) | ||||
Class 1 | $ | 23.41 | ||
Class 2 | 23.34 | |||
|
| |||
Cost of investments in non-affiliates | $ | 30,714,342 | ||
Cost of investments in affiliates | 516,001 | |||
| (a) | Per share amounts may not recalculate due to rounding of net assets and/or shares outstanding. |
SEE NOTES TO FINANCIAL STATEMENTS.
| DECEMBER 31, 2013 | JPMORGAN INSURANCE TRUST | 9 | ||||||
Table of Contents
STATEMENT OF OPERATIONS
FOR THE YEAR ENDED DECEMBER 31, 2013
Intrepid Growth | ||||
INVESTMENT INCOME: | ||||
Dividend income from non-affiliates | $ | 665,749 | ||
Dividend income from affiliates | 317 | |||
|
| |||
Total investment income | 666,066 | |||
|
| |||
EXPENSES: | ||||
Investment advisory fees | 248,808 | |||
Administration fees | 32,246 | |||
Distribution fees — Class 2 | 58 | |||
Custodian and accounting fees | 28,491 | |||
Professional fees | 43,827 | |||
Trustees’ and Chief Compliance Officer’s fees | 431 | |||
Printing and mailing costs | 15,136 | |||
Transfer agent fees | 4,472 | |||
Other | 7,398 | |||
|
| |||
Total expenses | 380,867 | |||
|
| |||
Less amounts waived | (37,593 | ) | ||
|
| |||
Net expenses | 343,274 | |||
|
| |||
Net investment income (loss) | 322,792 | |||
|
| |||
REALIZED/UNREALIZED GAINS (LOSSES): | ||||
Net realized gain (loss) on transactions from: | ||||
Investments in non-affiliates | 6,115,592 | |||
Futures | 150,200 | |||
|
| |||
Net realized gains (losses) | 6,265,792 | |||
|
| |||
Change in net unrealized appreciation/depreciation of: | ||||
Investments in non-affiliates | 4,706,907 | |||
Futures | 10,361 | |||
|
| |||
Change in net unrealized appreciation/depreciation | 4,717,268 | |||
|
| |||
Net realized/unrealized gains (losses) | 10,983,060 | |||
|
| |||
Change in net assets resulting from operations | $ | 11,305,852 | ||
|
| |||
SEE NOTES TO FINANCIAL STATEMENTS.
| 10 | JPMORGAN INSURANCE TRUST | DECEMBER 31, 2013 | ||||
Table of Contents
STATEMENTS OF CHANGES IN NET ASSETS
FOR THE PERIODS INDICATED
| Intrepid Growth Portfolio | ||||||||
| Year Ended 12/31/2013 | Year Ended 12/31/2012 | |||||||
CHANGE IN NET ASSETS RESULTING FROM OPERATIONS: | ||||||||
Net investment income (loss) | $ | 322,792 | $ | 411,101 | ||||
Net realized gain (loss) | 6,265,792 | 3,036,996 | ||||||
Change in net unrealized appreciation/depreciation | 4,717,268 | 2,520,271 | ||||||
|
|
|
| |||||
Change in net assets resulting from operations | 11,305,852 | 5,968,368 | ||||||
|
|
|
| |||||
DISTRIBUTIONS TO SHAREHOLDERS: | ||||||||
Class 1 | ||||||||
From net investment income | (401,033 | ) | (279,331 | ) | ||||
Class 2 | ||||||||
From net investment income | (188 | ) | (90 | ) | ||||
|
|
|
| |||||
Total distributions to shareholders | (401,221 | ) | (279,421 | ) | ||||
|
|
|
| |||||
CAPITAL TRANSACTIONS: | ||||||||
Change in net assets resulting from capital transactions | (5,323,258 | ) | (8,355,185 | ) | ||||
|
|
|
| |||||
NET ASSETS: | ||||||||
Change in net assets | 5,581,373 | (2,666,238 | ) | |||||
Beginning of period | 35,319,787 | 37,986,025 | ||||||
|
|
|
| |||||
End of period | $ | 40,901,160 | $ | 35,319,787 | ||||
|
|
|
| |||||
Accumulated undistributed net investment income | $ | 320,152 | $ | 404,921 | ||||
|
|
|
| |||||
CAPITAL TRANSACTIONS: | ||||||||
Class 1 | ||||||||
Proceeds from shares issued | $ | 2,266,718 | $ | 3,631,249 | ||||
Distributions reinvested | 401,033 | 279,331 | ||||||
Cost of shares redeemed | (7,999,219 | ) | (12,265,855 | ) | ||||
|
|
|
| |||||
Change in net assets resulting from Class 1 capital transactions | $ | (5,331,468 | ) | $ | (8,355,275 | ) | ||
|
|
|
| |||||
Class 2 | ||||||||
Proceeds from shares issued | $ | 8,030 | $ | — | ||||
Distributions reinvested | 188 | 90 | ||||||
Cost of shares redeemed | (8 | ) | — | |||||
|
|
|
| |||||
Change in net assets resulting from Class 2 capital transactions | $ | 8,210 | $ | 90 | ||||
|
|
|
| |||||
Total change in net assets resulting from capital transactions | $ | (5,323,258 | ) | $ | (8,355,185 | ) | ||
|
|
|
| |||||
SHARE TRANSACTIONS: | ||||||||
Class 1 | ||||||||
Issued | 113,779 | 214,321 | ||||||
Reinvested | 20,909 | 16,568 | ||||||
Redeemed | (395,014 | ) | (716,074 | ) | ||||
|
|
|
| |||||
Change in Class 1 Shares | (260,326 | ) | (485,185 | ) | ||||
|
|
|
| |||||
Class 2 | ||||||||
Issued | 356 | — | ||||||
Reinvested | 10 | 5 | ||||||
Redeemed | — | (a) | — | |||||
|
|
|
| |||||
Change in Class 2 Shares | 366 | 5 | ||||||
|
|
|
| |||||
| (a) | Amount rounds to less than 1 share. |
SEE NOTES TO FINANCIAL STATEMENTS.
| DECEMBER 31, 2013 | JPMORGAN INSURANCE TRUST | 11 | ||||||
Table of Contents
FOR THE PERIODS INDICATED
| Per share operating performance | ||||||||||||||||||||
| Investment operations | Distributions | |||||||||||||||||||
| Net asset value, beginning of period | Net investment income (loss) | Net realized and unrealized gains (losses) on investments | Total from investment operations | Net investment income | ||||||||||||||||
Intrepid Growth Portfolio | ||||||||||||||||||||
Class 1 | ||||||||||||||||||||
Year Ended December 31, 2013 | $ | 17.60 | $ | 0.17 | (d) | $ | 5.85 | $ | 6.02 | $ | (0.21 | ) | ||||||||
Year Ended December 31, 2012 | 15.24 | 0.18 | (d)(e) | 2.30 | 2.48 | (0.12 | ) | |||||||||||||
Year Ended December 31, 2011 | 15.14 | 0.10 | (d) | 0.16 | (f) | 0.26 | (0.16 | ) | ||||||||||||
Year Ended December 31, 2010 | 13.13 | 0.13 | (d) | 2.01 | 2.14 | (0.13 | ) | |||||||||||||
Year Ended December 31, 2009 | 9.86 | 0.12 | 3.23 | 3.35 | (0.08 | ) | ||||||||||||||
Class 2 | ||||||||||||||||||||
Year Ended December 31, 2013 | 17.55 | 0.12 | (d) | 5.84 | 5.96 | (0.17 | ) | |||||||||||||
Year Ended December 31, 2012 | 15.21 | 0.15 | (d)(e) | 2.27 | 2.42 | (0.08 | ) | |||||||||||||
Year Ended December 31, 2011 | 15.11 | 0.07 | (d) | 0.15 | (f) | 0.22 | (0.12 | ) | ||||||||||||
Year Ended December 31, 2010 | 13.12 | 0.10 | (d) | 1.99 | 2.09 | (0.10 | ) | |||||||||||||
Year Ended December 31, 2009 | 9.84 | 0.08 | 3.25 | 3.33 | (0.05 | ) | ||||||||||||||
| (a) | Includes adjustments in accordance with accounting principles generally accepted in the United States of America and as such, the net asset values for financial reporting purposes and the returns based upon those net asset values may differ from the net asset values and returns for shareholder transactions. |
| (b) | Includes earnings credits and interest expense, if applicable, each of which is less than 0.01% unless otherwise noted. |
| (c) | Portfolio turnover is calculated by dividing the lesser of total purchases or sales of portfolio securities for the reporting period by the monthly average value of portfolio securities owned during the reporting period. Excluded from both the numerator and denominator are amounts relating to derivatives and securities whose maturities or expiration dates at the time of acquisition were one year or less. |
| (d) | Calculated based upon average shares outstanding. |
| (e) | Reflects special dividends paid out during the period by several of the Portfolio’s holdings. Had the Portfolio not received the special dividends, the net investment income (loss) per share would have been $0.13 and $0.11 for Class 1 and Class 2 Shares, respectively, and the net investment income (loss) ratio would have been 0.85% and 0.63% for Class 1 and Class 2 Shares, respectively. |
| (f) | Includes a gain resulting from litigation payments on securities owned in a prior year. Without these gains, the net realized and unrealized gains (losses) on investments per share would have been $0.09 and $0.08, and the total return would have been 1.18% and 0.97% for Class 1 and Class 2 Shares, respectively. |
SEE NOTES TO FINANCIAL STATEMENTS.
| 12 | JPMORGAN INSURANCE TRUST | DECEMBER 31, 2013 | ||||
Table of Contents
| Ratios/Supplemental data | |||||||||||||||||||||||||
| Ratios to average net assets | ||||||||||||||||||||||||||
| Net asset value, end of period | Total return (a) | Net assets, end of period | Net expenses (b) | Net investment income (loss) | Expenses without waivers, reimbursements and earnings credits | Portfolio turnover rate (c) | ||||||||||||||||||||
| $ | 23.41 | 34.47 | % | $ | 40,866,604 | 0.90 | % | 0.84 | % | 0.99 | % | 70 | % | |||||||||||||
| 17.60 | 16.30 | 35,300,206 | 0.89 | 1.07 | (e) | 1.02 | 70 | |||||||||||||||||||
| 15.24 | 1.65 | (f) | 37,969,142 | 0.89 | 0.67 | 1.00 | 121 | |||||||||||||||||||
| 15.14 | 16.33 | 45,426,077 | 0.90 | 0.95 | 1.02 | 126 | ||||||||||||||||||||
| 13.13 | 34.32 | 50,786,376 | 0.90 | 0.96 | 1.07 | 134 | ||||||||||||||||||||
| 23.34 | 34.16 | 34,556 | 1.15 | 0.58 | 1.24 | 70 | ||||||||||||||||||||
| 17.55 | 15.94 | 19,581 | 1.14 | 0.85 | (e) | 1.27 | 70 | |||||||||||||||||||
| 15.21 | 1.44 | (f) | 16,883 | 1.15 | 0.43 | 1.25 | 121 | |||||||||||||||||||
| 15.11 | 15.96 | 16,645 | 1.15 | 0.72 | 1.27 | 126 | ||||||||||||||||||||
| 13.12 | 34.03 | 14,354 | 1.15 | 0.70 | 1.32 | 134 | ||||||||||||||||||||
SEE NOTES TO FINANCIAL STATEMENTS.
| DECEMBER 31, 2013 | JPMORGAN INSURANCE TRUST | 13 | ||||||
Table of Contents
AS OF DECEMBER 31, 2013
1. Organization
JPMorgan Insurance Trust (the “Trust”) is registered under the Investment Company Act of 1940, as amended (the “1940 Act”), as an open-end management investment company and is a Massachusetts business trust.
The following is a separate Portfolio of the Trust (the “Portfolio”) covered by this report:
| Classes Offered | Diversified/Non-Diversified | |||
| Intrepid Growth Portfolio | Class 1 and Class 2 | Diversified |
The investment objective of the Portfolio is to provide long-term capital growth.
Portfolio shares are offered only to separate accounts of participating insurance companies and Eligible Plans. Individuals may not purchase shares directly from the Portfolio.
All classes of shares have equal rights as to earnings, assets and voting privileges, except that each class may bear different distribution and service fees and each class has exclusive voting rights with respect to its distribution plan and administrative services plan.
2. Significant Accounting Policies
The following is a summary of significant accounting policies followed by the Portfolio in the preparation of its financial statements. The policies are in accordance with accounting principles generally accepted in the United States of America (“GAAP”). The preparation of financial statements requires management to make estimates and assumptions that affect the reported amounts and disclosures in the financial statements. Actual results could differ from those estimates.
A. Valuation of Investments — Equity securities listed on a North American, Central American, South American or Caribbean securities exchange shall generally be valued at the last sale price on the exchange on which the security is principally traded that is reported before the time when the net assets of the Portfolio are valued. Securities listed on the NASDAQ Stock Market LLC are generally valued at the NASDAQ Official Closing Price. Generally, short-term investments of sufficient credit quality maturing in less than 61 days are valued at amortized cost, which approximates fair value. Investments in open-end investment companies are valued at each investment company’s net asset value per share (“NAV”) as of the report date.
Certain investments of the Portfolio may, depending upon market conditions, trade in relatively thin markets and/or in markets that experience significant volatility. As a result of these conditions, the prices used by the Portfolio to value these securities may differ from the value that would be realized if these securities were sold, and the differences could be material. Futures and options are generally valued on the basis of available market quotations. Swaps and other derivatives are valued daily, primarily using independent or affiliated pricing services approved by the Board of Trustees. If valuations are not available from such pricing services or values received are deemed not representative of fair value, values will be obtained from a third party broker-dealer or counterparty.
Securities or other assets for which market quotations are not readily available or for which market quotations are deemed to not represent the fair value of the security or asset at the time of pricing (including certain illiquid securities) are fair valued in accordance with procedures established by and under the supervision and responsibility of the Board of Trustees. The Board of Trustees has established an Audit and Valuation Committee to assist with the oversight of the valuation of the Portfolio’s securities. JPMorgan Funds Management, Inc. (the “Administrator” or “JPMFM”) has established a Valuation Committee (“VC”) that is comprised of senior representatives from JPMFM, J.P. Morgan Investment Management Inc. (the “Adviser” or “JPMIM”), and J.P. Morgan Asset Management’s Legal, Compliance and Risk Management groups and the Portfolio’s Chief Compliance Officer. The VC’s responsibilities include making determinations regarding Level 3 fair value measurements (“Fair Values”) and/or providing recommendations for approval to the Board of Trustees’ Audit and Valuation Committee, in accordance with the Portfolio’s valuation policies.
The VC or Board of Trustees, as applicable, primarily employs a market-based approach which may use related or comparable assets or liabilities, recent transactions, market multiples, book values, and other relevant information for the investment to determine the fair value of the investment. The VC or Board of Trustees may also use an income-based valuation approach in which the anticipated future cash flows of the investment are discounted to calculate fair value. Discounts may also be applied due to the nature or duration of any restrictions on the disposition of the investments. Valuations may be based upon current market prices of securities that are comparable in coupon, rating, maturity and industry.
It is possible that the estimated values may differ significantly from the values that would have been used had a ready market for the investments existed, and such differences could be material. JPMFM and JPMIM are responsible for monitoring developments that may impact Fair Values and for discussing and assessing Fair Values on an ongoing, and at least a quarterly, basis with the VC and Board of Trustees, as applicable. The appropriateness of Fair Values is assessed based on results of unchanged price review and consideration of macro or security specific events, back testing, and broker and vendor due diligence.
Valuations reflected in this report are as of the report date. As a result, changes in valuation due to market events and/or issuer related events after the report date and prior to issuance of the report, are not reflected herein.
| 14 | JPMORGAN INSURANCE TRUST | DECEMBER 31, 2013 | ||||
Table of Contents
The various inputs that are used in determining the fair value of the Portfolio’s investments are summarized into the three broad levels listed below.
| Ÿ | Level 1 — quoted prices in active markets for identical securities |
| Ÿ | Level 2 — other significant observable inputs (including quoted prices for similar securities, interest rates, prepayment speeds, credit risk, etc.) |
| Ÿ | Level 3 — significant unobservable inputs (including the Portfolio’s own assumptions in determining the fair value of investments) |
A financial instrument’s level within the fair value hierarchy is based on the lowest level of any input, both individually and in the aggregate, that is significant to the fair value measurement. The inputs or methodology used for valuing securities are not necessarily an indication of the risk associated with investing in those securities.
The following table represents each valuation input as presented on the Schedule of Portfolio Investments (“SOI”):
Level 1 Quoted prices | Level 2 Other significant observable inputs | Level 3 Significant unobservable inputs | Total | |||||||||||||
Total Investments in Securities (a) | $ | 40,938,688 | $ | — | $ | — | $ | 40,938,688 | ||||||||
|
|
|
|
|
|
|
| |||||||||
Appreciation in Other Financial Instruments | ||||||||||||||||
Futures Contracts | $ | 8,913 | $ | — | $ | — | $ | 8,913 | ||||||||
|
|
|
|
|
|
|
| |||||||||
| (a) | All portfolio holdings designated as Level 1 are disclosed individually on the SOI. Please refer to the SOI for industry specifics of portfolio holdings. |
There were no transfers among any levels during the year ended December 31, 2013.
B. Futures Contracts — The Portfolio uses index futures contracts to gain or reduce exposure to the stock market, maintain liquidity and minimize transaction costs. The Portfolio also buys futures contracts to immediately invest incoming cash in the market or sells futures in response to cash outflows, thereby simulating an invested position in the underlying index while maintaining a cash balance for liquidity. The use of futures contracts exposes the Portfolio to equity price risk.
Futures contracts provide for the delayed delivery of the underlying instrument at a fixed price or are settled for a cash amount based on the change in the value of the underlying instrument at a specific date in the future. Upon entering into a futures contract, the Portfolio is required to deposit with the broker, cash or securities in an amount equal to a certain percentage of the contract amount, which is referred to as the initial margin deposit. Subsequent payments, referred to as variation margin, are made or received by the Portfolio periodically and are based on changes in the market value of open futures contracts. Changes in the market value of open futures contracts are recorded as change in net unrealized appreciation/depreciation in the Statement of Operations. Realized gains or losses, representing the difference between the value of the contract at the time it was opened and the value at the time it was closed, are reported in the Statement of Operations at the closing or expiration of the futures contract. Securities deposited as initial margin are designated in the SOI and cash deposited is recorded on the Statement of Assets and Liabilities. A receivable from and/or a payable to brokers for the daily variation margin is also recorded on the Statement of Assets and Liabilities.
The Portfolio may be subject to the risk that the change in the value of the futures contract may not correlate perfectly with the underlying instrument. Use of long futures contracts subjects the Portfolio to risk of loss in excess of the amounts shown on the Statement of Assets and Liabilities, up to the notional amount of the futures contracts. Use of short futures contracts subjects the Portfolio to unlimited risk of loss. The Portfolio may enter into futures contracts only on exchanges or boards of trade. The exchange or board of trade acts as the counterparty to each futures transaction; therefore, the Portfolio’s credit risk is limited to failure of the exchange or board of trade. Under some circumstances, futures exchanges may establish daily limits on the amount that the price of a futures contract can vary from the previous day’s settlement price, which could effectively prevent liquidation of positions.
The table below discloses the volume of the Portfolio’s futures contracts activity during the year ended December 31, 2013:
Futures Contracts: | ||||
Average Notional Balance Long | $ | 674,664 | ||
Ending Notional Balance Long | 460,275 |
The Portfolio’s futures contracts are not subject to master netting arrangements.
C. Security Transactions and Investment Income — Investment transactions are accounted for on the trade date (the date the order to buy or sell is executed). Securities gains and losses are calculated on a specifically identified cost basis. Interest income is determined on the basis of coupon interest accrued using the effective interest method which adjusts for amortization of premiums and accretion of discounts. Dividend income, net of foreign taxes withheld, if any, is recorded on the ex-dividend date or when the Portfolio first learns of the dividend.
To the extent such information is publicly available, the Portfolio records distributions received in excess of income earned from underlying investments as a reduction of cost of investments and/or realized gain. Such amounts are based on estimates if actual amounts are not available and actual amounts of income, realized gain and return of capital may differ from the estimated amounts. The Portfolio adjusts the estimated amounts of the components of distributions (and consequently its net investment income) as necessary once the issuers provide information about the actual composition of the distributions.
| DECEMBER 31, 2013 | JPMORGAN INSURANCE TRUST | 15 | ||||||
Table of Contents
NOTES TO FINANCIAL STATEMENTS
AS OF DECEMBER 31, 2013 (continued)
D. Allocation of Income and Expenses — Expenses directly attributable to a portfolio are charged directly to that portfolio, while the expenses attributable to more than one portfolio of the Trust are allocated among the respective portfolios. In calculating the NAV of each class, investment income, realized and unrealized gains and losses and expenses, other than class specific expenses, are allocated daily to each class of shares based upon the proportion of net assets of each class at the beginning of each day.
E. Federal Income Taxes — The Portfolio is treated as a separate taxable entity for Federal income tax purposes. The Portfolio’s policy is to comply with the provisions of the Internal Revenue Code of 1986, as amended (the “Code”), applicable to regulated investment companies and to distribute to shareholders all of its distributable net investment income and net realized capital gains on investments. Accordingly, no provision for Federal income tax is necessary. The Portfolio is also a segregated portfolio of assets for insurance purposes and intends to comply with the diversification requirements of Subchapter L of the Code. Management has reviewed the Portfolio’s tax positions for all open tax years and has determined that as of December 31, 2013, no liability for income tax is required in the Portfolio’s financial statements for net unrecognized tax benefits. However, management’s conclusions may be subject to future review based on changes in, or the interpretation of, the accounting standards or tax laws and regulations. The Portfolio’s Federal tax returns for the prior three fiscal years remain subject to examination by the Internal Revenue Service.
F. Distributions to Shareholders — Distributions from net investment income are generally declared and paid at least annually and are declared separately for each class. No class has preferential dividend rights; differences in per share rates are due to differences in separate class expenses. Net realized capital gains, if any, are distributed at least annually. The amount of distributions from net investment income and net realized capital gains is determined in accordance with Federal income tax regulations, which may differ from GAAP. To the extent these “book/tax” differences are permanent in nature (i.e., that they result from other than timing of recognition — “temporary differences”), such amounts are reclassified within the capital accounts based on their Federal tax-basis treatment.
The following amounts were reclassified within the capital accounts:
| Paid-in-Capital | Accumulated Undistributed Net Investment Income | Accumulated Net Realized Gains (Losses) | ||||||||||
| $ | 1 | $ | (6,340 | ) | $ | 6,339 | ||||||
The reclassifications for the Portfolio relate primarily to non-taxable dividends.
3. Fees and Other Transactions with Affiliates
A. Investment Advisory Fee — Pursuant to the Investment Advisory Agreement, the Adviser, an indirect, wholly—owned subsidiary of JPMorgan Chase & Co. (“JPMorgan”), supervises the investments of the Portfolio and for such services is paid a fee. The fee is accrued daily and paid monthly based on the Portfolio’s average daily net assets at an annual rate of 0.65%.
The Adviser waived Investment Advisory fees and/or reimbursed expenses as outlined in Note 3.E.
B. Administration Fee — Pursuant to an Administration Agreement, the Administrator, an indirect, wholly—owned subsidiary of JPMorgan, provides certain administration services to the Portfolio. In consideration of these services, the Administrator receives a fee accrued daily and paid monthly at an annual rate of 0.15% of the first $25 billion of the average daily net assets of all funds in the J.P. Morgan Funds Complex covered by the Administration Agreement (excluding certain funds of funds and money market funds) and 0.075% of the average daily net assets in excess of $25 billion of all such funds. For the year ended December 31, 2013, the effective rate was 0.08% of the Portfolio’s average daily net assets, notwithstanding any fee waivers and/or expense reimbursements.
JPMorgan Chase Bank, N.A. (“JPMCB”), a wholly-owned subsidiary of JPMorgan, serves as the Portfolio’s sub-administrator (the “Sub-administrator”). For its services as Sub-administrator, JPMCB receives a portion of the fees payable to the Administrator.
The Administrator waived Administration fees as outlined in Note 3.E.
C. Distribution Fees — Pursuant to a Distribution Agreement, JPMorgan Distribution Services, Inc. (the “Distributor”), a wholly-owned subsidiary of JPMorgan, serves as the Trust’s exclusive underwriter and promotes and arranges for the sale of the Portfolio’s shares.
The Board of Trustees has adopted a Distribution Plan (the “Distribution Plan”) for Class 2 Shares of the Portfolio in accordance with Rule 12b-1 under the 1940 Act. The Distribution Plan provides that the Portfolio shall pay distribution fees, including payments to the Distributor, at an annual rate of 0.25% of the average daily net assets of Class 2 Shares.
D. Custodian and Accounting Fees — JPMCB provides portfolio custody and accounting services to the Portfolio. The amounts paid directly to JPMCB by the Portfolio for custody and accounting services are included in Custodian and accounting fees in the Statement of Operations. Payments to the custodian may be reduced by credits earned by the Portfolio, based on uninvested cash balances held by the custodian. Such earnings credits, if any, are presented separately in the Statement of Operations.
Interest expense, if any, paid to the custodian related to cash overdrafts is included in Interest expense to affiliates in the Statement of Operations.
E. Waivers and Reimbursements — The Adviser, Administrator (for all share classes) and Distributor (for Class 2 Shares) have contractually agreed to waive fees and/or reimburse the Portfolio to the extent that total annual operating expenses (excluding acquired fund fees and expenses,
| 16 | JPMORGAN INSURANCE TRUST | DECEMBER 31, 2013 | ||||
Table of Contents
dividend expenses related to short sales, interest, taxes, expenses related to litigation and potential litigation, extraordinary expenses and expenses related to the Board of Trustees’ deferred compensation plan) exceed the percentages of the Portfolio’s respective average daily net assets as shown in the table below:
| Class 1 | Class 2 | |||||||
| 0.90 | % | 1.15 | % | |||||
The expense limitation agreements were in effect for the year ended December 31, 2013. The contractual expense limitation percentages in the table above are in place until at least April 30, 2014.
For the year ended December 31, 2013, the Portfolio’s service providers waived fees for the Portfolio as follows. None of these parties expect the Portfolio to repay any such waived fees in future years.
| Contractual Waivers | ||||||||||||
| Investment Advisory | Administration | Total | ||||||||||
| $ | 7,804 | $ | 28,501 | $ | 36,305 | |||||||
Additionally, the Portfolio may invest in one or more money market funds advised by the Adviser or its affiliates. The Adviser, Administrator and the Distributor waive fees in an amount sufficient to offset the respective fees each charges to the affiliated money market fund on the Portfolio’s investment in such affiliated money market fund. A portion of the waiver is voluntary.
The amount of waivers resulting from investments in these money market funds for the year ended December 31, 2013 was $1,288.
F. Other — Certain officers of the Trust are affiliated with the Adviser, the Administrator and the Distributor. Such officers, with the exception of the Chief Compliance Officer, receive no compensation from the Portfolio for serving in their respective roles.
The Board of Trustees appointed a Chief Compliance Officer to the Portfolio in accordance with Federal securities regulations. The Portfolio, along with other affiliated portfolios, makes reimbursement payments, on a pro-rata basis, to the Administrator for a portion of the fees associated with the Office of the Chief Compliance Officer. Such fees are included in Trustees’ and Chief Compliance Officer’s fees in the Statement of Operations.
The Trust adopted a Trustee Deferred Compensation Plan (the “Plan”) which allows the Independent Trustees to defer the receipt of all or a portion of compensation related to performance of their duties as Trustees. The deferred fees are invested in various J.P. Morgan Funds until distribution in accordance with the Plan.
During the year ended December 31, 2013, the Portfolio may have purchased securities from an underwriting syndicate in which the principal underwriter or members of the syndicate are affiliated with the Adviser.
The Portfolio may use related party broker-dealers. For the year ended December 31, 2013, the Portfolio did not incur any brokerage commissions with broker-dealers affiliated with the Adviser.
The Securities and Exchange Commission has granted an exemptive order permitting the Portfolio to engage in principal transactions with J.P. Morgan Securities, Inc., an affiliated broker, involving taxable money market instruments, subject to certain conditions.
4. Investment Transactions
During the year ended December 31, 2013, purchases and sales of investments (excluding short-term investments) were as follows:
| Purchases (excluding U.S. Government) | Sales (excluding U.S. Government) | |||||||
| $ | 26,073,237 | $ | 30,692,183 | |||||
During the year ended December 31, 2013, there were no purchases or sales of U.S. Government securities.
5. Federal Income Tax Matters
For Federal income tax purposes, the cost and unrealized appreciation (depreciation) in value of investment securities held at December 31, 2013 were as follows:
| Aggregate Cost | Gross Unrealized Appreciation | Gross Unrealized Depreciation | Net Unrealized Appreciation (Depreciation) | |||||||||||||
| $ | 31,287,719 | $ | 9,831,372 | $ | 180,403 | $ | 9,650,969 | |||||||||
The difference between book and tax basis appreciation (depreciation) on investments is primarily attributed to wash sale loss deferrals.
| DECEMBER 31, 2013 | JPMORGAN INSURANCE TRUST | 17 | ||||||
Table of Contents
NOTES TO FINANCIAL STATEMENTS
AS OF DECEMBER 31, 2013 (continued)
The tax character of distributions paid during the year ended December 31, 2013 was as follows:
| Total Distributions Paid From: | ||||||||
Ordinary Income | Total Distributions Paid | |||||||
| $ | 401,221 | $ | 401,221 | |||||
The tax character of distributions paid during the year ended December 31, 2012 was as follows:
| Total Distributions Paid From: | ||||||||
Ordinary Income | Total Distributions Paid | |||||||
| $ | 279,421 | $ | 279,421 | |||||
As of December 31, 2013, the components of net assets (excluding paid-in-capital) on a tax basis were as follows:
Current Distributable Ordinary Income | Current Distributable Long-Term Capital Gain or (Tax Basis Capital Loss Carryover) | Unrealized Appreciation (Depreciation) | ||||||||||
| $ | 324,506 | $ | (12,854,957 | ) | $ | 9,650,969 | ||||||
The cumulative timing differences primarily consist of wash sale loss deferrals.
Under the Regulated Investment Company Modernization Act of 2010 (the “Act”), net capital losses recognized by the Portfolio after December 31, 2010 are carried forward indefinitely, and retain their character as short-term and/or long-term losses. Prior to the Act, net capital losses incurred by the Portfolio were carried forward for eight years and treated as short-term losses. The Act requires that post-enactment net capital losses be used before pre-enactment net capital losses.
As of December 31, 2013, the Portfolio did not have any post-enactment net capital loss carryforwards.
As of December 31, 2013, the Portfolio had pre-enactment net capital loss carryforwards, expiring during the year indicated, which are available to offset future realized gains:
| 2016 | 2017 | Total | ||||||||||
| $ | 1,204,518 | $ | 11,650,439 | $ | 12,854,957 | |||||||
During the year ended December 31, 2013, the Portfolio utilized capital loss carryforwards in the amount of $6,229,577.
6. Borrowings
The Trust and JPMCB have entered into a financing arrangement. Under this arrangement, JPMCB provides an unsecured, uncommitted credit facility in the aggregate amount of $100 million to certain of the J.P. Morgan Funds, including the Portfolio. Advances under the arrangement are taken primarily for temporary or emergency purposes, including the meeting of redemption requests that otherwise might require the untimely disposition of securities, and are subject to the Portfolio’s borrowing restrictions. Interest on borrowings is payable at a rate determined by JPMCB at the time of borrowing. This agreement has been extended until November 10, 2014.
The Portfolio had no borrowings outstanding from the unsecured, uncommitted credit facility at December 31, 2013, or at any time during the year then ended.
Interest expense paid, if any, as a result of borrowings from the unsecured, uncommitted credit facility is included in Interest expense to affiliates in the Statement of Operations.
7. Risks, Concentrations and Indemnifications
In the normal course of business, the Portfolio enters into contracts that contain a variety of representations which provide general indemnifications. The Portfolio’s maximum exposure under these arrangements is unknown. The amount of exposure would depend on future claims that may be made against the Portfolio that have not yet occurred. However, based on experience, the Portfolio expects the risk of loss to be remote.
The Portfolio has several shareholders holding a significant percentage of shares outstanding. Investment activities of these shareholders could have a material impact on the Portfolio.
| 18 | JPMORGAN INSURANCE TRUST | DECEMBER 31, 2013 | ||||
Table of Contents
REPORT OF INDEPENDENT REGISTERED PUBLIC ACCOUNTING FIRM
To the Board of Trustees of JPMorgan Insurance Trust and the Shareholders of JPMorgan Insurance Trust Intrepid Growth Portfolio:
In our opinion, the accompanying statement of assets and liabilities, including the schedule of portfolio investments, and the related statements of operations and of changes in net assets and the financial highlights present fairly, in all material respects, the financial position of JPMorgan Insurance Trust Intrepid Growth Portfolio (a separate Portfolio of JPMorgan Insurance Trust) (hereafter referred to as the “Portfolio”) at December 31, 2013, the results of its operations for the year then ended, the changes in its net assets for each of the two years in the period then ended and the financial highlights for each of the five years in the period then ended, in conformity with accounting principles generally accepted in the United States of America. These financial statements and financial highlights (hereafter referred to as “financial statements”) are the responsibility of the Portfolio’s management. Our responsibility is to express an opinion on these financial statements based on our audits. We conducted our audits of these financial statements in accordance with the standards of the Public Company Accounting Oversight Board (United States). Those standards require that we plan and perform the audit to obtain reasonable assurance about whether the financial statements are free of material misstatement. An audit includes examining, on a test basis, evidence supporting the amounts and disclosures in the financial statements, assessing the accounting principles used and significant estimates made by management, and evaluating the overall financial statement presentation. We believe that our audits, which included confirmation of securities at December 31, 2013 by correspondence with the custodian and brokers, provide a reasonable basis for our opinion.
PricewaterhouseCoopers LLP
New York, New York
February 21, 2014
| DECEMBER 31, 2013 | JPMORGAN INSURANCE TRUST | 19 | ||||||
Table of Contents
(Unaudited)
The Portfolio’s Statement of Additional Information includes additional information about the Portfolio’s Trustees and is available, without charge, upon request by calling 1-800-480-4111 or on the J.P. Morgan Funds’ website at www.jpmorganfunds.com.
Name (Year of Birth); Positions With the Portfolio (1) | Principal Occupations During Past 5 Years | Number of Portfolios in Fund Complex Overseen by Trustee (2) | Other Directorships Held Outside Fund Complex During Past 5 Years | |||
Independent Trustees | ||||||
| John F. Finn (1947); Trustee of Trust since 2005; Trustee of heritage One Group Mutual Funds since 1998. | Chairman (1985-present), President and Chief Executive Officer, Gardner, Inc. (supply chain management company serving industrial and consumer markets) (1974-present). | 170 | Director, Cardinal Health, Inc. (CAH) (1994-present); Director, Greif, Inc. (GEF) (industrial package products and services) (2007-present); Trustee, Columbus Association for the Performing Arts. | |||
| Dr. Matthew Goldstein (1941); Chairman since 2013; Trustee of Trust since 2005; Trustee of heritage J.P. Morgan Funds since 2003. | Professor, City University of New York (effective 7/1/13); Chancellor, City University of New York (1999-2013); President, Adelphi University (New York) (1998-1999). | 170 | Trustee, Museum of Jewish Heritage (2011-present). | |||
| Robert J. Higgins (1945); Trustee of Trust since 2005; Trustee of heritage J.P. Morgan Funds since 2002. | Retired; Director of Administration of the State of Rhode Island (2003-2004); President — Consumer Banking and Investment Services, Fleet Boston Financial (1971-2001). | 170 | None | |||
| Peter C. Marshall (1942); Trustee of Trust since 2005; Trustee of heritage One Group Mutual Funds since 1985. | Self-employed business consultant (2002-present). | 170 | None | |||
| Mary E. Martinez (1960); Trustee of Trust since 2013. | Associate, Special Properties, a Christie’s International Real Estate Affiliate (2010-Present); Managing Director, Bank of America (Asset Management) (2007-2008); Chief Operating Officer, U.S. Trust Asset Management; U.S. Trust Company (asset management) (2003-2007); President, Excelsior Funds (registered investment companies) (2004-2005). | 170 | None | |||
| Marilyn McCoy* (1948); Trustee of Trust since 2005; Trustee of heritage One Group Mutual Funds since 1999. | Vice President of Administration and Planning, Northwestern University (1985-present). | 170 | Trustee, Carleton College (2003-present). | |||
| Mitchell M. Merin (1953); Trustee of Trust since 2013. | Retired (2005-Present); President and Chief Operating Officer, Morgan Stanley Investment Management, Member Morgan Stanley & Co. Management Committee (registered investment adviser) (1998-2005). | 170 | Director, Sun Life Financial (SLF) (2007 to Present) (financial services and insurance); Trustee, Trinity College, Hartford, CT (2002-2010). | |||
| William G. Morton, Jr. (1937); Trustee of Trust since 2005; Trustee of heritage J.P. Morgan Funds since 2003. | Retired; Chairman Emeritus (2001-2002), and Chairman and Chief Executive Officer, Boston Stock Exchange (1985-2001). | 170 | Director, Radio Shack Corp. (1987-2008); Director, National Organization of Investment Professionals; Trustee of the Stratton Mountain School (2001-present). | |||
| Dr. Robert A. Oden, Jr. (1946); Trustee of Trust since 2005; Trustee of heritage One Group Mutual Funds since 1997. | Retired; President, Carleton College (2002-2010); President, Kenyon College (1995-2002). | 170 | Trustee, American University in Cairo (1999-present); Chairman, Dartmouth-Hitchcock Medical Center (2011-present); Trustee, American Schools of Oriental Research (2011-present); Trustee, American Museum of Fly Fishing. | |||
| 20 | JPMORGAN INSURANCE TRUST | DECEMBER 31, 2013 | ||||
Table of Contents
Name (Year of Birth); Positions With the Portfolio (1) | Principal Occupations During Past 5 Years | Number of Complex Overseen by Trustee (2) | Other Directorships Held Outside Fund Complex During Past 5 Years | |||
Independent Trustees (continued) | ||||||
| Marian U. Pardo** (1946); Trustee of Trust since 2013. | Managing Director and Founder, Virtual Capital Management LLC (Investment Consulting) (2007-present); Managing Director, Credit Suisse Asset Management (portfolio manager) (2003-2006). | 170 | Member, Board of Governors, Columbus Citizens Foundation (not-for-profit supporting philanthropic and cultural programs) (2006-present). | |||
| Frederick W. Ruebeck (1939); Trustee of Trust since 2005; Trustee of heritage One Group Mutual Funds since 1994. | Consultant (2000-present); Adviser, JP Greene & Associates, LLC (broker-dealer) (2000-2009); Chief Investment Officer, Wabash College (2004-present); Director of Investments, Eli Lilly and Company (pharmaceuticals) (1988-1999). | 170 | Trustee, Wabash College (1988-present); Chairman, Indianapolis Symphony Orchestra Foundation (1994-present). | |||
| James J. Schonbachler (1943); Trustee of Trust since 2005; Trustee of heritage J.P. Morgan Funds since 2001. | Retired; Managing Director of Bankers Trust Company (financial services) (1968-1998). | 170 | None | |||
Interested Trustee Not Affiliated With the Adviser | ||||||
| Frankie D. Hughes*** (1952), Trustee of Trust since 2008. | President and Chief Investment Officer, Hughes Capital Management, Inc. (fixed income asset management) (1993-present). | 170 | Trustee, The Victory Portfolios (2000-2008) (investment companies). | |||
| (1) | The Trustees serve for an indefinite term, subject to the Trust’s current retirement policy, which is age 75 for all Trustees, except that the Board has determined Mr. Morton should continue to serve until December 31, 2014. In order to fill the vacancies created by the retirement of Fergus Reid, III, William J. Armstrong, and Leonard J. Spalding Jr., effective December 31, 2012, the Board appointed Ms. Martinez and Mr. Merin to serve as Trustees effective January 1, 2013 and Ms. Pardo to serve as Trustee effective February 1, 2013. |
| (2) | A Fund Complex means two or more registered investment companies that hold themselves out to investors as related companies for purposes of investment and investor services or have a common investment adviser or have an investment adviser that is an affiliated person of the investment adviser of any of the other registered investment companies. The J.P. Morgan Funds Complex for which the Board of Trustees serves currently includes eleven registered investment companies (170 funds), including JPMorgan Mutual Fund Group which liquidated effective November 29, 2012 and is in the process of winding up its affairs. |
| * | Ms. McCoy has served as Vice President of Administration and Planning for Northwestern University since 1985. William M. Daley was the Head of Corporate Responsibility for JPMorgan Chase & Co. prior to January 2011 and served as a member of the Board of Trustees of Northwestern University from 2005 through 2010. JPMIM, the Portfolio’s investment adviser, is a wholly-owned subsidiary of JPMorgan Chase & Co. Two members of the Board of Trustees of Northwestern University are executive officers of registered investment advisers (not affiliated with JPMorgan) that are under common control with sub-advisers to certain J.P. Morgan Funds. |
| ** | In connection with prior employment with JPMorgan Chase, Ms. Pardo is the recipient of non-qualified pension plan payments from JPMorgan Chase in the amount of approximately $2,055 per month, which she irrevocably waived effective January 1, 2013, and deferred compensation payments from JPMorgan Chase in the amount of approximately $7,294 per year, which ended in January 2013. In addition, Ms. Pardo receives payments from a fully funded qualified plan, which is not an obligation of JPMorgan Chase. |
| *** | Ms. Hughes is treated as an “interested person” based on the portfolio holdings of clients of Hughes Capital Management, Inc. |
The contact address for each of the Trustees is 270 Park Avenue, New York, NY 10017.
| DECEMBER 31, 2013 | JPMORGAN INSURANCE TRUST | 21 | ||||||
Table of Contents
(Unaudited)
Name (Year of Birth), Positions Held with the Trust (Since) | Principal Occupations During Past 5 Years | |
| Robert L. Young (1963), President and Principal Executive Officer (2013)** | Chief Operating Officer and Director, J.P. Morgan Investment Management Inc. since 2010; Senior Vice President, J.P. Morgan Funds (2005-2010), Chief Operating Officer, J.P. Morgan Funds (2005-2010); Director and various officer positions for JPMorgan Funds Management, Inc. (formerly One Group Administrative Services) and JPMorgan Distribution Services, Inc. (formerly One Group Dealer Services, Inc.) from 1999 to present. Mr. Young has been with JPMorgan Chase & Co. (formerly Bank One Corporation) since 1997. | |
| Joy C. Dowd (1972), Treasurer and Principal Financial Officer (2010) | Assistant Treasurer of the Trusts from 2009 to 2010; Executive Director, JPMorgan Funds Management, Inc. from February 2011; Vice President, JPMorgan Funds Management, Inc. from December 2008 to February 2011; prior to joining JPMorgan Chase, Ms. Dowd worked in MetLife’s investments audit group from 2005 through 2008. | |
| Frank J. Nasta (1964), Secretary (2008) | Managing Director and Associate General Counsel, JPMorgan Chase since 2008; Previously, Director, Managing Director, General Counsel and Corporate Secretary, J. & W. Seligman & Co. Incorporated; Secretary of each of the investment companies of the Seligman Group of Funds and Seligman Data Corp.; Director and Corporate Secretary, Seligman Advisors, Inc. and Seligman Services, Inc. | |
| Stephen M. Ungerman (1953), Chief Compliance Officer (2005) | Managing Director, JPMorgan Chase & Co.; Mr. Ungerman has been with JPMorgan Chase & Co. since 2000. | |
| Kathryn A. Jackson (1962), AML Compliance Officer (2012)* | Vice President and AML Compliance Manager for JPMorgan Asset Management Compliance since 2011; Senior On-Boarding Specialist for JPMorgan Distribution Services, Inc. in Global Liquidity from 2008 to 2011; prior to joining JPMorgan, Ms. Jackson was a Financial Services Analyst responsible for on-boarding, compliance and training with Nationwide Securities LLC and 1717 Capital Management Company, both registered broker-dealers, from 2005 until 2008. | |
Elizabeth A. Davin (1964), Assistant Secretary (2005)** | Executive Director and Assistant General Counsel, JPMorgan Chase since February 2012; formerly Vice President and Assistant General Counsel, JPMorgan Chase from 2005 until February 2012; Senior Counsel, JPMorgan Chase (formerly Bank One Corporation) from 2004 to 2005. | |
| Jessica K. Ditullio (1962), Assistant Secretary (2005)** | Executive Director and Assistant General Counsel, JPMorgan Chase since February 2011; Ms. Ditullio has served as an attorney with various titles for JPMorgan Chase (formerly Bank One Corporation) since 1990. | |
| John T. Fitzgerald (1975), Assistant Secretary (2008) | Executive Director and Assistant General Counsel, JPMorgan Chase since February 2011; formerly, Vice President and Assistant General Counsel, JPMorgan Chase from 2005 until February 2011. | |
| Carmine Lekstutis (1980), Assistant Secretary (2011) | Vice President and Assistant General Counsel, JPMorgan Chase since 2011; Associate, Skadden, Arps, Slate, Meagher & Flom LLP (law firm) from 2006 to 2011. | |
| Gregory S. Samuels (1980), Assistant Secretary (2010) | Vice President and Assistant General Counsel, JPMorgan Chase since 2010; Associate, Ropes & Gray (law firm) from 2008 to 2010; Associate, Clifford Chance LLP (law firm) from 2005 to 2008. | |
| Pamela L. Woodley (1971), Assistant Secretary (2012) | Vice President and Assistant General Counsel, JPMorgan Chase since November 2004. | |
Michael M. D’Ambrosio (1969), Assistant Treasurer (2012) | Executive Director, JPMorgan Funds Management, Inc. from July 2012; prior to joining JPMorgan Chase, Mr. D’Ambrosio was a Tax Director at PricewaterhouseCoopers LLP since 2006. | |
| Joseph Parascondola (1963), Assistant Treasurer (2011) | Vice President, JPMorgan Funds Management, Inc. since August 2006. | |
| Matthew J. Plastina (1970), Assistant Treasurer (2011) | Vice President, JPMorgan Funds Management, Inc. since August 2010; prior to August 2010, Vice President and Controller, Legg Mason Global Asset Management. | |
Julie A. Roach (1971), Assistant Treasurer (2012)** | Vice President, JPMorgan Funds Management, Inc. from August 2012; prior to joining JPMorgan Chase, Ms. Roach was a Senior Manager with Deloitte since 2001. | |
Gillian I. Sands (1969), Assistant Treasurer (2012) | Vice President, JPMorgan Funds Management, Inc. from September 2012; Assistant Treasurer, Wells Fargo Funds Management (2007-2009). | |
The contact address for each of the officers, unless otherwise noted, is 270 Park Avenue, New York, NY 10017.
| * | The contact address for the officer is 500 Stanton Christiana Road, Ops 1, Floor 02, Newark, DE 19173-2107. |
| ** | The contact address for the officer is 460 Polaris Parkway, Westerville, OH 43082. |
| 22 | JPMORGAN INSURANCE TRUST | DECEMBER 31, 2013 | ||||
Table of Contents
SCHEDULE OF SHAREHOLDER EXPENSES
(Unaudited)
Hypothetical $1,000 Investment
As a shareholder of the Portfolio, you incur ongoing costs, including investment advisory fees, administration fees, distribution fees (for Class 2 Shares) and other Portfolio expenses. Because the Portfolio is a funding vehicle for Policies and Eligible Plans, you may also incur sales charges and other fees relating to the Policies or Eligible Plans. The examples below are intended to help you understand your ongoing costs (in dollars) of investing in the Portfolio, but not the costs of the Policies or Eligible Plans, and to compare these ongoing costs with the ongoing costs of investing in other mutual funds. The examples assume that you had a $1,000 investment in each Class at the beginning of the reporting period, July 1, 2013, and continued to hold your shares at the end of the reporting period, December 31, 2013.
Actual Expenses
For each Class of the Portfolio in the table below, the first line provides information about actual account values and actual expenses. You may use the information in this line, together with the amount you invested, to estimate the expenses that you paid over the period. Simply divide your account value by $1,000 (for example, an $8,600 account value divided by $1,000 = 8.6), then multiply the result by the number in the first line of each Class under the heading entitled “Expenses Paid During the Period” to estimate the expenses you paid on your account during this period.
Hypothetical Example for Comparison Purposes
The second line of each Class in the table below provides information about hypothetical account values and hypothetical expenses based on the Class’ actual expense ratio and an assumed rate of return of 5% per year before expenses, which is not the Class’ actual return. The hypothetical account values and expenses may not be used to estimate the actual ending account balance or expenses you paid for the period. You may use this information to compare the ongoing costs of investing in the Class of the Portfolio and other funds. To do so, compare this 5% hypothetical example with the 5% hypothetical examples that appear in the shareholder reports of the other funds. Please note that the expenses shown in the table are meant to highlight your ongoing costs only and do not reflect any transaction costs, such as sales charges (loads) or redemption fees or the costs associated with the Policies and Eligible Plans through which the Portfolio is held. Therefore, the second line for each Class in the table is useful in comparing ongoing costs only, and will not help you determine the relative total costs of owning different funds. In addition, if these transaction costs were included, your costs would have been higher. The examples also assume all dividends and distributions have been reinvested.
| Beginning Account Value July 1, 2013 | Ending Account Value December 31, 2013 | Expenses Paid During the Period* | Annualized Expense Ratio | |||||||||||||
Intrepid Growth Portfolio | ||||||||||||||||
Class 1 | ||||||||||||||||
Actual | $ | 1,000.00 | $ | 1,191.30 | $ | 4.97 | 0.90 | % | ||||||||
Hypothetical | 1,000.00 | 1,020.67 | 4.58 | 0.90 | ||||||||||||
Class 2 | ||||||||||||||||
Actual | 1,000.00 | 1,189.60 | 6.35 | 1.15 | ||||||||||||
Hypothetical | 1,000.00 | 1,019.41 | 5.85 | 1.15 | ||||||||||||
| * | Expenses are equal to each Class’ respective annualized expense ratio, multiplied by the average account value over the period, multiplied by 184/365 (to reflect the one-half year period). |
| DECEMBER 31, 2013 | JPMORGAN INSURANCE TRUST | 23 | ||||||
Table of Contents
BOARD APPROVAL OF INVESTMENT ADVISORY AGREEMENT
(Unaudited)
The Board of Trustees meets regularly throughout the year and considers factors that are relevant to its annual consideration of investment advisory agreements at each meeting. The Board of Trustees has established various standing committees, composed of Trustees with diverse backgrounds, to which the Board of Trustees has assigned specific subject matter responsibilities to further enhance the effectiveness of the Board’s oversight and decision making. The Board of Trustees and its investment committees (money market and alternative products, equity, and fixed income) also meet for the specific purpose of considering advisory contract annual renewals. The Board of Trustees held meetings in person in June and August 2013, at which the Trustees considered the continuation of the investment advisory agreement for the Portfolio whose annual report is contained herein (the “Advisory Agreement”). At the June meeting, the Board’s investment committees met to review and consider performance, expense and related information for the J.P. Morgan Funds. Each investment committee reported to the full Board, which then considered the investment committee’s preliminary findings. At the August meeting, the Trustees continued their review and consideration. The Trustees, including a majority of the Trustees who are not “interested persons” (as defined in the 1940 Act) of any party to the Advisory Agreement or any of their affiliates, approved the continuation of the Advisory Agreement on August 20, 2013.
The Trustees, as part of their review of the investment advisory arrangements for the J.P. Morgan Funds, considered and reviewed performance and other information received from the Adviser on a regular basis over the course of the year, as well as information specifically prepared for their annual review. This information included the Portfolio’s performance compared to the performance of the Portfolio’s peers and benchmarks and analyses by the Adviser of the Portfolio’s performance. The Adviser also periodically provides comparative information regarding the Portfolio’s expense ratios and those of the peer groups. In addition, in preparation for the June and August meetings, the Trustees requested, received and evaluated extensive materials from the Adviser, including, with respect to the Portfolio, performance and expense information compiled by Lipper Inc. (“Lipper”), an independent provider of investment company data. Prior to voting, the Trustees reviewed the proposed approval of the Advisory Agreement with representatives of the Adviser and with counsels to the Portfolio and independent Trustees and received a memorandum from independent counsel to the Trustees discussing the legal standards for their consideration of the proposed approval. The Trustees also discussed the proposed approvals in executive sessions with counsels to the Portfolio and independent Trustees at which no representatives of the Adviser were present. Set forth below is a summary of the material factors evaluated by the Trustees in determining whether to approve the Advisory Agreement.
In their deliberations, there was a comprehensive consideration of the information received by the Trustees. Each Trustee attributed different weights to the various factors and no factor alone was considered determinative. From year to year, the Trustees consider and place emphasis on relevant information in light of changing circumstances in market and economic conditions. The Trustees determined that the compensation to be received by the Adviser from the Portfolio under the Advisory Agreement was fair and reasonable and that the continuance of the investment advisory contract was in the best interests of the Portfolio and its shareholders.
The factors summarized below were considered and discussed by the Trustees in reaching their conclusions:
Nature, Extent and Quality of Services Provided by the Adviser
The Trustees received and considered information regarding the nature, extent and quality of the services provided to the Portfolio under the Advisory Agreement. The Trustees took into account information furnished throughout the year at Trustee meetings, as well as the materials furnished specifically in connection with this annual review process. The Trustees considered the background and experience of the Adviser’s senior management and the expertise of, and the amount of attention given to the Portfolio by, investment personnel of the Adviser. In addition, the Trustees reviewed the qualifications, backgrounds and responsibilities of the portfolio management team primarily responsible for the day-to-day management of the Portfolio and the infrastructure supporting the team. The Trustees also considered information provided by the Adviser and JPMorgan Distribution Services, Inc. (“JPMDS”) about the structure and distribution strategy of the Portfolio. The Trustees also reviewed information relating to the Adviser’s risk governance model and reports showing the Adviser’s compliance structure and ongoing compliance processes. The quality of the administrative services provided by JPMorgan Funds Management, Inc. (“JPMFM”), an affiliate of the Adviser, was also considered.
The Board of Trustees also considered its knowledge of the nature and quality of the services provided by the Adviser to the Portfolio gained from their experience as Trustees of the J.P. Morgan Funds. In addition, they considered the overall reputation and capabilities of the Adviser and its affiliates, the commitment of the Adviser to provide high quality service to the Portfolio, their overall confidence in the Adviser’s integrity and the Adviser’s responsiveness to questions or concerns raised by them, including the Adviser’s willingness to consider and implement organizational and operational changes designed to improve investment results and the services provided to the Portfolio.
Based on these considerations and other factors, the Trustees concluded that they were satisfied with the nature, extent and quality of the investment advisory services provided to the Portfolio by the Adviser.
| 24 | JPMORGAN INSURANCE TRUST | DECEMBER 31, 2013 | ||||
Table of Contents
Costs of Services Provided and Profitability to the Adviser and its Affiliates
The Trustees received and considered information regarding the profitability to the Adviser and its affiliates in providing services to the Portfolio. The Trustees reviewed and discussed this data. The Trustees recognized that this data is not audited and represents the Adviser’s determination of its and its affiliates’ revenues from the contractual services provided to the Portfolio, less expenses of providing such services. Expenses include direct and indirect costs and are calculated using an allocation methodology developed by the Adviser. The Trustees also recognized that it is difficult to make comparisons of profitability from fund investment advisory contracts because comparative information is not generally publicly available and is affected by numerous factors, including the structure of the particular adviser, the types of funds it manages, its business mix, numerous assumptions regarding allocations and the fact that publicly-traded fund managers’ operating profits and net income are net of distribution and marketing expenses. Based on their review, the Trustees concluded that the profitability to the Adviser under the Advisory Agreement was not unreasonable in light of the services and benefits provided to the Portfolio.
Fall-Out Benefits
The Trustees reviewed information regarding potential “fallout” or ancillary benefits received by the Adviser and its affiliates as a result of their relationship with the Portfolio. The Board also reviewed the adviser’s allocation of fund brokerage for the J.P. Morgan Funds complex, including allocations to brokers who provide research to the adviser.
The Trustees also considered that JPMFM earns fees from the Portfolio for providing administrative services. These fees were shown separately in the profitability analysis presented to the Trustees. The Trustees also considered the payments of Rule 12b-1 fees to JPMDS, an affiliate of the Adviser, which also acts as the Portfolio’s distributor and that these fees are in turn generally paid to financial intermediaries that sell the Portfolio, including financial intermediaries that are affiliates of the Adviser. The Trustees also considered the fees paid to JPMorgan Chase Bank, N.A. (“JPMCB”) for custody and fund accounting and other related services.
Economies of Scale
The Trustees noted that the proposed investment advisory fee schedule for the Portfolio does not contain breakpoints. The Trustees considered whether it would be appropriate to add advisory fee breakpoints and the Trustees concluded that the current fee structure was reasonable in light of the fee waivers and expense limitations that the Adviser has in place that serve to limit the overall net expense ratio at competitive levels. The Trustees also recognized that the fee schedule for the administrative services provided by JPMFM does include a fee
breakpoint, which is tied to the overall level of non-money market fund assets excluding certain funds-of-funds, as applicable, advised by the Adviser, and that the Portfolio benefits from that breakpoint. The Trustees concluded that shareholders benefited from the lower expense ratios which resulted from these factors.
Independent Written Evaluation of the Portfolio’s Chief Compliance Officer
The Trustees noted that, upon their direction, the Chief Compliance Officer for the Portfolio had prepared an independent written evaluation in order to assist the Trustees in determining the reasonableness of the proposed management fees. The Trustees considered the written evaluation in determining whether to continue the Advisory Agreement.
Fees Relative to Adviser’s Other Clients
The Trustees received and considered information about the nature and extent of investment advisory services and fee rates offered to other clients of the Adviser for investment management styles substantially similar to that of the Portfolio. The Trustees also considered the complexity of investment management for the Portfolio relative to the Adviser’s other clients and the differences in the nature and extent of the services provided to the different clients. The Trustees concluded that the fee rates charged to the Portfolio in comparison to those charged to the Adviser’s other clients were reasonable.
Investment Performance
The Trustees received and considered absolute and/or relative performance for the Portfolio in a report prepared by Lipper. The Trustees considered the total return performance information, which included the ranking of the Portfolio within a performance universe made up of funds with the same Lipper investment classification and objective (the “Universe Group”) by total return for applicable one-, three- and five-year periods. The Trustees reviewed a description of Lipper’s methodology for selecting mutual funds in the Portfolio’s Universe Group. The Lipper materials provided to the Trustees highlighted information with respect to a representative class to assist the Trustees in their review. As part of this review, the Trustees also reviewed the Portfolio’s performance against its benchmark and considered the performance information provided for the Portfolio at regular Board meetings by the Adviser. The Lipper performance data noted by the Trustees as part of their review and the determinations made by the Trustees with respect to the Portfolio’s performance are summarized below:
The Trustees noted the Portfolio’s performance was in the third, first, and second quintiles for Class 1 shares for the one-, three-, and five-year periods ended December 31, 2012, respectively. The Trustees discussed the performance and investment strategy of the Portfolio with the Adviser and,
| DECEMBER 31, 2013 | JPMORGAN INSURANCE TRUST | 25 | ||||||
Table of Contents
BOARD APPROVAL OF INVESTMENT ADVISORY AGREEMENT
(Unaudited) (continued)
based upon this discussion and various other factors, concluded that the performance was reasonable.
Advisory Fees and Expense Ratios
The Trustees considered the contractual advisory fee rate paid by the Portfolio to the Adviser and compared that rate to the information prepared by Lipper concerning management fee rates paid by other funds in the same Lipper category as the Portfolio. The Trustees recognized that Lipper reported the Portfolio’s management fee rate as the combined contractual advisory fee and administration fee rates. The Trustees also reviewed information about other expenses and the expense ratios for the Portfolio. The Trustees considered the fee waiver and/or expense reimbursement arrangements currently in
place for the Portfolio and considered the net advisory fee rate after taking into account any waivers and/or reimbursements. The Trustees recognized that it is difficult to make comparisons of advisory fees because there are variations in the services that are included in the fees paid by other funds. The Trustees’ determinations as a result of the review of the Portfolio’s advisory fees and expense ratios are summarized below:
The Trustees noted that the Portfolio’s net advisory fee and actual total expenses for Class 1 shares were in the second and fifth quintiles, respectively, of their Universe Group. After considering the factors identified above, in light of this information, the Trustees concluded that the advisory fee was reasonable.
| 26 | JPMORGAN INSURANCE TRUST | DECEMBER 31, 2013 | ||||
Table of Contents
(Unaudited)
Certain tax information for the Portfolio is required to be provided to shareholders based upon the Portfolio’s income and distributions for the taxable year ended December 31, 2013. The information and distributions reported in this letter may differ from the information and taxable distributions reported to the shareholders for the calendar year ending December 31, 2013. The information necessary to complete your income tax
returns for the calendar year ending December 31, 2013 will be received under separate cover.
Dividends Received Deductions (DRD)
The Fund hereby designates 100.00% or the maximum allowable percentage as ordinary income distributions eligible for the 70% dividend received deduction for corporate rate shareholders for the fiscal year ended December 31, 2013.
| DECEMBER 31, 2013 | JPMORGAN INSURANCE TRUST | 27 | ||||||
Table of Contents
J.P. Morgan Funds are distributed by JPMorgan Distribution Services, Inc., which is an affiliate of JPMorgan Chase & Co. Affiliates of JPMorgan Chase & Co. receive fees for providing various services to the funds.
Contact JPMorgan Distribution Services, Inc. at 1-800-480-4111 for a portfolio prospectus. You can also visit us at www.jpmorganfunds.com. Investors should carefully consider the investment objectives and risk as well as charges and expenses of the mutual fund before investing. The prospectus contains this and other information about the mutual fund. Read the prospectus carefully before investing.
The Portfolio files a complete schedule of its portfolio holdings for the first and third quarters of its fiscal year with the SEC on Form N-Q. The Portfolio’s Forms N-Q are available on the SEC’s website at http://www.sec.gov and may be reviewed and copied at the SEC’s Public Reference Room in Washington, DC. Information on the operation of the SEC’s Public Reference Room may be obtained by calling 1-800-SEC-0330. Shareholders may request the Form N-Q without charge by calling 1-800-480-4111 or by visiting the variable insurance portfolio section of the J.P. Morgan Funds’ website at www.jpmorganfunds.com.
A description of the Portfolio’s policies and procedures with respect to the disclosure of the Portfolio’s holdings is available in the prospectus and Statement of Additional Information.
A copy of proxy policies and procedures is available without charge upon request by calling 1-800-480-4111 and on the Portfolio’s website at www.jpmorganfunds.com. A description of such policies and procedures is on the SEC’s website at www.sec.gov. The Trustees have delegated the authority to vote proxies for securities owned by the Portfolio to the Adviser. A copy of the Portfolio’s voting record for the most recent 12-month period ended June 30 is available on the SEC’s website at www.sec.gov or at the Portfolio’s website at www.jpmorganfunds.com no later than August 31 of each year. The Portfolio’s proxy voting record will include, among other things, a brief description of the matter voted on for each portfolio security, and will state how each vote was cast, for example, for or against the proposal.
Table of Contents
| © JPMorgan Chase & Co., 2014. All rights reserved. December 2013. | AN-JPMITIGP-1213 |
Table of Contents
Annual Report
JPMorgan Insurance Trust
December 31, 2013
JPMorgan Insurance Trust Intrepid Mid Cap Portfolio
NOT FDIC INSURED Ÿ NO BANK GUARANTEE Ÿ MAY LOSE VALUE
|  |
Table of Contents
Investments in the Portfolio are not bank deposits or obligations of, or guaranteed or endorsed by, any bank and are not insured or guaranteed by the FDIC, the Federal Reserve Board or any other government agency. You could lose money if you sell when the Portfolio’s share price is lower than when you invested.
Past performance is no guarantee of future performance. The general market views expressed in this report are opinions based on market and other conditions through the end of the reporting period and are subject to change without notice. These views are not intended to predict the future performance of the Portfolio or the securities markets. References to specific securities and their issuers are for illustrative purposes only and are not intended to be, and should not be interpreted as, recommendations to purchase or sell such securities. Such views are not meant as investment advice and may not be relied on as an indication of trading intent on behalf of the Portfolio.
This Portfolio is intended to be a funding vehicle for variable annuity contracts and variable life insurance policies (collectively “Policies”) offered by separate accounts of participating insurance companies. Portfolio shares are also offered through qualified pension and retirement plans (“Eligible Plans”). Individuals may not purchase shares directly from the Portfolio.
Prospective investors should refer to the Portfolio’s prospectus for a discussion of the Portfolio’s investment objective, strategies and risks. Call J.P. Morgan Funds Service Center at 1-800-480-4111 for a prospectus containing more complete information about the Portfolio, including management fees and other expenses. Please read it carefully before investing.
Table of Contents
JANUARY 23, 2014 (Unaudited)
Dear Shareholder,
Equities markets in developed economies performed strongly in the face of periodic spikes in volatility throughout the twelve months ended December 31, 2013. Healthy corporate earnings and incremental but steady improvements in a range of economic indicators provided a positive backdrop for investors seeking returns in the low interest rate environment. While political discord in Washington injected volatility into the market, a bipartisan budget agreement at the end of the year relieved much of the political uncertainty created by partisan brinkmanship over the so-called fiscal cliff and the partial shutdown of the federal government in October. In the first half of the year, the U.S. Federal Reserve (“Fed”) announced its intention to taper off its $85 billion in monthly asset purchases and the statement weakened investor sentiment and set off widespread speculation about the timing and magnitude of such a move. The Fed followed through in December, deciding to reduce its monthly purchases by $10 billion. The news, along with robust gains in jobs, housing and consumer sentiment, drove U.S. equities to new highs. The S&P 500 stock index hit seven closing highs in the final month of the reporting period, finishing 2013 with its best performance since 1997.
 |
“While a repeat of the equity performance we experienced in 2013 may be a tall order, we believe stocks in the U.S. and Europe may continue to show gains.” |
Overseas, the European Central Bank reaffirmed its commitment to accommodative monetary policy and to the euro itself. In the second quarter of the year, the European Union (EU) returned to positive growth and at the end of the year, Ireland became the first nation to exit from its European Union bailout program. The Fed’s decision to curb its asset purchases also sent equities higher in Europe, as investors viewed the move as a sign of further economic stability. In Japan, equity markets rebounded to their best year since 1988, benefitting from Prime Minister Shinzo Abe’s efforts to revive the economy. Low returns on bonds and short-term debt instruments also drove investors into stocks.
Emerging market equities were weaker overall. As of December 31, 2013, the MSCI Emerging Markets Index returned -2.3% for the year. China’s economy showed signs of slower growth during the year and the Fed’s decision to taper its asset purchase program set off speculation that the maturation of the emerging markets credit cycle would push yield-seeking investors to rotate into developed markets.
Taper Talk Pressures Bonds
Fixed income markets generally remained weak during the year, as central bankers across the globe held interest rates at historic lows. However, benchmark bond yields rose on an
annual basis for the first time since 2009. During the year, the Fed’s talk of tapering off its Quantitative Easing (QE) program hurt fixed income markets. U.S. Treasury security yields continued to be low from a historical perspective, but ended the period higher. The yield for 10-year U.S. Treasury securities ended December 31, 2013 at 3.04%, while the yields for 2- and 30-year U.S. Treasury securities finished the reporting period at 0.38% and 3.96%, respectively. High-yield debt returned 7.4% for the year, as measured by the Barclays US High Yield Corporate Index, while other U.S. debt securities and emerging market debt both had negative returns.
While global economic growth accelerated during the year, the U.S. recovery in particular showed stronger fundamentals and the Fed’s decision to taper its QE program was a response to the improved picture. Europe emerged from its lengthy recession and the worst of the fiscal crises seem to be behind it, though unemployment remains strikingly high in many EU nations. Japan made progress toward ending persistent deflation, but Tokyo’s monetary and fiscal stimulus has sharply weakened the yen, putting other Asian exporting nations — notably China and South Korea — at a competitive disadvantage. Emerging market economies may face further headwinds as foreign investment shrinks and economic growth moderates from recent strength. Moreover, political instability — already apparent in Thailand and Turkey — may surface in other emerging market nations as governments struggle to deliver improved living standards and respond to demands for political reforms.
The Long-Term Lens
We welcome the Fed’s move to curb its QE program as a sign that the U.S. economy’s need for artificial stimulus is waning. While a repeat of the equity performance we experienced in 2013 may be a tall order, we believe stocks in the U.S. and Europe may continue to show gains. In the fixed-income market, persistent weakness has led to attractive valuations in some sectors. The past year’s market swings and intermittent volatility underlined the importance of maintaining a long-term view of your investment portfolio and the benefits derived from diversified holdings.
On behalf of everyone at J.P. Morgan Asset Management, thank you for your continued support. We look forward to managing your investment needs for years to come. Should you have any questions, please visit www.jpmorganfunds.com or contact the J.P. Morgan Funds Service Center at 1-800-480-4111.
Sincerely yours,

George C.W. Gatch
CEO, Global Funds Management
J.P. Morgan Asset Management
| DECEMBER 31, 2013 | JPMORGAN INSURANCE TRUST | 1 | ||||||
Table of Contents
JPMorgan Insurance Trust Intrepid Mid Cap Portfolio
TWELVE MONTHS ENDED DECEMBER 31, 2013 (Unaudited)
| REPORTING PERIOD RETURN: | ||||
| Portfolio (Class 1 Shares)* | 40.59% | |||
| Russell Midcap Index | 34.76% | |||
| Net Assets as of 12/31/2013 | $ | 40,178,337 | ||
INVESTMENT OBJECTIVE**
The JPMorgan Insurance Trust Intrepid Mid Cap Portfolio (the “Portfolio”) seeks long-term capital growth by investing primarily in equity securities of companies with intermediate capitalizations.
HOW DID THE MARKET PERFORM?
Overall, the U.S. equity market performed strongly during the 12 months ended December 31, 2013, as a tepid economic recovery continued to gain strength from healthy corporate earnings, along with improvements in employment, housing and consumer sentiment. Stock markets retreated at mid-year amid investor uncertainty about the U.S. Federal Reserve Board’s (“Fed”) plan to taper off its monthly purchases of $85 billion in U.S.Treasuries and mortgage-backed securities. Interest rates rose sharply higher, pressuring prices for both stocks and bonds. Partisan brinkmanship in Washington added to the uncertainty, starting with the standoff over the so-called fiscal cliff in January and followed by the partial shutdown of the federal government in October. A bipartisan budget agreement toward the end of the year relieved some of the political uncertainty. During the year, the U.S. unemployment rate fell from 7.9% in January to 6.7% at year end, with slight upticks in joblessness at mid-year and in October. Adding to the positive trend were advances in housing prices and auto sales in the second half of the year, and a rebound in consumer sentiment to a five-month high in December. The Russell Midcap Index (“Benchmark”) returned 34.76% for the year.
WHAT WERE THE MAIN DRIVERS OF THE PORTFOLIO’S PERFORMANCE?
The Portfolio (Class 1 Shares) outperformed the Benchmark for the 12 months ended December 31, 2013. The Portfolio’s stock selection in the software & services sector and the health services & systems sector was the leading contributor to relative performance. The Portfolio’s stock selection in the pharmaceuticals sector and the telecommunications sector was the leading detractor.
Leading individual contributors to relative performance included Western Digital Corp., Towers Watson & Co. and Huntington Ingalls Industries Inc. Shares of Western Digital Corp., a
hard disk drive manufacturer, rose on demand growth for high-capacity disk drives and for its cloud computing technology. Shares of Towers Watson, a provider of executive recruiting and benefits management, rose on improved earnings and revenue growth through acquisitions. Shares of Huntington Ingalls, a manufacturer of warships and submarines, surpassed earnings expectations on the back of strength at its Ingalls Shipbuilding and Newport New Shipbuilding operations.
Leading individual detractors from relative performance included PulteGroup Inc., Best Buy Inc. and Frontier Communications Corp. Shares of Pulte, a homebuilder, retreated on expectations that rising mortgage rates would hurt home sales. Shares of Best Buy, a consumer electronics retail chain, rose during the year, but the Portfolio’s underweight position hurt performance relative to the Benchmark. Shares of Frontier, a communications company primarily serving the rural U.S. and smaller municipalities, came under pressure from flat earnings growth during the year.
HOW WAS THE PORTFOLIO POSITIONED?
The JPMorgan Intrepid Investment Team employs a philosophy that is rooted in behavioral finance, a field of study that emphasizes the importance of human psychology in financial markets. Behavioral finance examines how investor behavior can be affected by emotional biases and reactions. The field theorizes that inefficiencies arise in the stock market because investors are consistently irrational in making many investment decisions.
The Team aims to capitalize on these market inefficiencies by targeting what it believes are attractively valued stocks with strong fundamentals and momentum characteristics, and looks to sell these stocks when they no longer exhibit these criteria. A disciplined quantitative ranking methodology is utilized to attempt to identify attractive stocks in each sector, a process that is combined with qualitative research and value-added trading. Portfolios are constructed with limited sector bets so that stock selection is typically the primary driver of relative performance.
During the year, the Portfolio was managed and positioned in accordance with this investment philosophy and process.
| 2 | JPMORGAN INSURANCE TRUST | DECEMBER 31, 2013 | ||||
Table of Contents
| TOP TEN EQUITY HOLDINGS OF THE PORTFOLIO*** | ||||||||
| 1. | Macy’s, Inc. | 2.3 | % | |||||
| 2. | Bunge Ltd. | 2.1 | ||||||
| 3. | Towers Watson & Co., Class A | 2.1 | ||||||
| 4. | Best Buy Co., Inc. | 2.0 | ||||||
| 5. | Western Digital Corp. | 2.0 | ||||||
| 6. | Discover Financial Services | 1.6 | ||||||
| 7. | AECOM Technology Corp. | 1.6 | ||||||
| 8. | AmerisourceBergen Corp. | 1.6 | ||||||
| 9. | Lorillard, Inc. | 1.5 | ||||||
| 10. | CA, Inc. | 1.4 | ||||||
PORTFOLIO COMPOSITION BY SECTOR*** | ||||
| Financials | 17.7 | % | ||
| Industrials | 17.0 | |||
| Information Technology | 16.7 | |||
| Consumer Discretionary | 11.6 | |||
| Health Care | 11.0 | |||
| Consumer Staples | 6.7 | |||
| Energy | 6.1 | |||
| Utilities | 5.2 | |||
| Materials | 4.7 | |||
| Telecommunication Services | 1.7 | |||
| U.S. Treasury Obligation | 0.2 | |||
| Short-Term Investment | 1.4 | |||
| * | The return shown is based on net asset values calculated for shareholder transactions and may differ from the return shown in the financial highlights, which reflects adjustments made to the net asset values in accordance with accounting principles generally accepted in the United States of America. |
| ** | The adviser seeks to achieve the Portfolio’s objective. There can be no guarantee it will be achieved. |
| *** | Percentages indicated are based on total investments as of December 31, 2013. The Portfolio’s composition is subject to change. |
| DECEMBER 31, 2013 | JPMORGAN INSURANCE TRUST | 3 | ||||||
Table of Contents
JPMorgan Insurance Trust Intrepid Mid Cap Portfolio
PORTFOLIO COMMENTARY
TWELVE MONTHS ENDED DECEMBER 31, 2013 (Unaudited) (continued)
AVERAGE ANNUAL TOTAL RETURNS AS OF DECEMBER 31, 2013 | ||||||||||||||||
| INCEPTION DATE OF CLASS | 1 YEAR | 5 YEAR | 10 YEAR | |||||||||||||
CLASS 1 SHARES | 3/30/95 | 40.59 | % | 21.12 | % | 9.63 | % | |||||||||
CLASS 2 SHARES | 8/16/06 | 40.27 | 20.83 | 9.44 | ||||||||||||
TEN YEAR PERFORMANCE (12/31/03 TO 12/31/13)
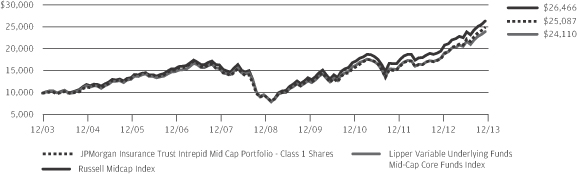
The performance quoted is past performance and is not a guarantee of future results. Mutual funds are subject to certain market risks. Investment returns and principal value of an investment will fluctuate so that an investor’s shares, when redeemed, may be worth more or less than their original cost. Current performance may be higher or lower than the performance data shown. For up-to-date month-end performance information please call 1-800-480-4111.
Returns for Class 2 Shares prior to its inception date are based on the performance of Class 1 Shares. The actual returns of Class 2 Shares would have been lower than shown because Class 2 Shares have higher expenses than Class 1 Shares.
The graph illustrates comparative performance for $10,000 invested in Class 1 Shares of the JPMorgan Insurance Trust Intrepid Mid Cap Portfolio, the Russell Midcap Index and the Lipper Variable Underlying Funds Mid-Cap Core Funds Index from December 31, 2003 to December 31, 2013. The performance of the Portfolio assumes reinvestment of all dividends and capital gain distributions, if any. The performance of the Russell Midcap Index does not reflect the deduction of expenses associated with a mutual fund and has been adjusted to reflect reinvestment of all dividends and capital gain distributions of the
securities included in the benchmark, if applicable. The performance of the Lipper Variable Underlying Funds Mid-Cap Core Funds Index includes expenses associated with a mutual fund, such as investment management fees. These expenses are not identical to the expenses incurred by the Portfolio. The Russell Midcap Index is an unmanaged index which measures the performance of the 800 smallest companies in the Russell 1000 Index. The Lipper Variable Underlying Funds Mid-Cap Core Funds Index is an index based on the total returns of certain mutual funds within the Portfolio’s designated category as determined by Lipper, Inc. Investors cannot invest directly in an index.
Portfolio performance does not reflect any charges imposed by the Policies or Eligible Plans. If these charges were included, the returns would be lower than shown. Portfolio performance may reflect the waiver of the Portfolio’s fees and reimbursement of expenses for certain periods since the inception date. Without these waivers and reimbursements, performance would have been lower.
The returns shown are based on net asset values calculated for shareholder transactions and may differ from the returns shown in the financial highlights, which reflect adjustments made to the net asset values in accordance with accounting principles generally accepted in the United States of America.
| 4 | JPMORGAN INSURANCE TRUST | DECEMBER 31, 2013 | ||||
Table of Contents
JPMorgan Insurance Trust Intrepid Mid Cap Portfolio
SCHEDULE OF PORTFOLIO INVESTMENTS
AS OF DECEMBER 31, 2013
| SHARES | SECURITY DESCRIPTION | VALUE($) | ||||||
| Common Stocks — 98.5% |
| ||||||
Consumer Discretionary — 11.6% | ||||||||
Auto Components — 0.8% |
| |||||||
| 2,300 | Delphi Automotive plc, (United Kingdom) | 138,299 | ||||||
| 7,475 | Goodyear Tire & Rubber Co. (The) | 178,279 | ||||||
|
| |||||||
| 316,578 | ||||||||
|
| |||||||
Distributors — 0.5% |
| |||||||
| 175 | Genuine Parts Co. | 14,558 | ||||||
| 6,175 | LKQ Corp. (a) | 203,158 | ||||||
|
| |||||||
| 217,716 | ||||||||
|
| |||||||
Diversified Consumer Services — 0.8% |
| |||||||
| 16,825 | Service Corp. International | 305,037 | ||||||
|
| |||||||
Hotels, Restaurants & Leisure — 0.6% |
| |||||||
| 2,050 | Brinker International, Inc. | 94,997 | ||||||
| 5,525 | Extended Stay America, Inc. (a) | 145,086 | ||||||
|
| |||||||
| 240,083 | ||||||||
|
| |||||||
Household Durables — 0.5% |
| |||||||
| 3,225 | Jarden Corp. (a) | 197,854 | ||||||
|
| |||||||
Internet & Catalog Retail — 1.5% |
| |||||||
| 2,725 | Groupon, Inc. (a) | 32,073 | ||||||
| 4,600 | Liberty Ventures, Series A (a) | 563,914 | ||||||
|
| |||||||
| 595,987 | ||||||||
|
| |||||||
Media — 0.5% |
| |||||||
| 4,375 | Gannett Co., Inc. | 129,412 | ||||||
| 1,175 | Omnicom Group, Inc. | 87,385 | ||||||
|
| |||||||
| 216,797 | ||||||||
|
| |||||||
Multiline Retail — 2.3% |
| |||||||
| 17,650 | Macy’s, Inc. | 942,510 | ||||||
|
| |||||||
Specialty Retail — 3.8% |
| |||||||
| 20,400 | Best Buy Co., Inc. | 813,552 | ||||||
| 2,650 | Foot Locker, Inc. | 109,816 | ||||||
| 4,775 | GameStop Corp., Class A | 235,217 | ||||||
| 2,000 | Gap, Inc. (The) | 78,160 | ||||||
| 925 | Murphy USA, Inc. (a) | 38,443 | ||||||
| 2,425 | TJX Cos., Inc. | 154,545 | ||||||
| 2,200 | Urban Outfitters, Inc. (a) | 81,620 | ||||||
|
| |||||||
| 1,511,353 | ||||||||
|
| |||||||
Textiles, Apparel & Luxury Goods — 0.3% |
| |||||||
| 1,425 | Hanesbrands, Inc. | 100,135 | ||||||
|
| |||||||
Total Consumer Discretionary | 4,644,050 | |||||||
|
| |||||||
Consumer Staples — 6.8% | ||||||||
Food & Staples Retailing — 1.3% |
| |||||||
| 5,850 | Kroger Co. (The) | 231,251 | ||||||
| SHARES | SECURITY DESCRIPTION | VALUE($) | ||||||
Food & Staples Retailing — Continued | ||||||||
| 9,100 | Safeway, Inc. | 296,387 | ||||||
|
| |||||||
| 527,638 | ||||||||
|
| |||||||
Food Products — 3.9% |
| |||||||
| 10,500 | Bunge Ltd. | 862,155 | ||||||
| 5,700 | Ingredion, Inc. | 390,222 | ||||||
| 9,625 | Tyson Foods, Inc., Class A | 322,052 | ||||||
|
| |||||||
| 1,574,429 | ||||||||
|
| |||||||
Tobacco — 1.6% |
| |||||||
| 12,050 | Lorillard, Inc. | 610,694 | ||||||
|
| |||||||
Total Consumer Staples | 2,712,761 | |||||||
|
| |||||||
Energy — 6.1% | ||||||||
Energy Equipment & Services — 1.2% |
| |||||||
| 501 | Baker Hughes, Inc. | 27,685 | ||||||
| 1,043 | National Oilwell Varco, Inc. | 82,950 | ||||||
| 3,575 | Oil States International, Inc. (a) | 363,649 | ||||||
|
| |||||||
| 474,284 | ||||||||
|
| |||||||
Oil, Gas & Consumable Fuels — 4.9% |
| |||||||
| 4,025 | Antero Resources Corp. (a) | 255,346 | ||||||
| 2,700 | Cabot Oil & Gas Corp. | 104,652 | ||||||
| 2,175 | Cimarex Energy Co. | 228,179 | ||||||
| 650 | Continental Resources, Inc. (a) | 73,138 | ||||||
| 4,720 | Energen Corp. | 333,940 | ||||||
| 2,800 | EQT Corp. | 251,384 | ||||||
| 1,125 | Marathon Petroleum Corp. | 103,196 | ||||||
| 3,700 | Murphy Oil Corp. | 240,056 | ||||||
| 2,350 | Newfield Exploration Co. (a) | 57,881 | ||||||
| 490 | Noble Energy, Inc. | 33,374 | ||||||
| 4,025 | Peabody Energy Corp. | 78,608 | ||||||
| 2,150 | Tesoro Corp. | 125,775 | ||||||
| 2,125 | Valero Energy Corp. | 107,100 | ||||||
|
| |||||||
| 1,992,629 | ||||||||
|
| |||||||
Total Energy | 2,466,913 | |||||||
|
| |||||||
Financials — 17.7% | ||||||||
Capital Markets — 1.2% |
| |||||||
| 1,150 | Affiliated Managers Group, Inc. (a) | 249,412 | ||||||
| 8,675 | American Capital Ltd. (a) | 135,677 | ||||||
| 925 | Lazard Ltd., (Bermuda), Class A | 41,921 | ||||||
| 2,525 | TD Ameritrade Holding Corp. | 77,366 | ||||||
|
| |||||||
| 504,376 | ||||||||
|
| |||||||
Commercial Banks — 3.1% |
| |||||||
| 750 | BankUnited, Inc. | 24,690 | ||||||
| 1,125 | BOK Financial Corp. | 74,610 | ||||||
SEE NOTES TO FINANCIAL STATEMENTS.
| DECEMBER 31, 2013 | JPMORGAN INSURANCE TRUST | 5 | ||||||
Table of Contents
JPMorgan Insurance Trust Intrepid Mid Cap Portfolio
SCHEDULE OF PORTFOLIO INVESTMENTS
AS OF DECEMBER 31, 2013 (continued)
| SHARES | SECURITY DESCRIPTION | VALUE($) | ||||||
| Common Stocks — Continued |
| ||||||
Commercial Banks — Continued |
| |||||||
| 5,500 | East West Bancorp, Inc. | 192,335 | ||||||
| 10,275 | Fifth Third Bancorp | 216,083 | ||||||
| 5,925 | Huntington Bancshares, Inc. | 57,176 | ||||||
| 6,250 | KeyCorp | 83,875 | ||||||
| 7,650 | Regions Financial Corp. | 75,658 | ||||||
| 1,850 | Signature Bank (a) | 198,727 | ||||||
| 2,975 | SVB Financial Group (a) | 311,959 | ||||||
|
| |||||||
| 1,235,113 | ||||||||
|
| |||||||
Consumer Finance — 1.6% |
| |||||||
| 11,700 | Discover Financial Services | 654,615 | ||||||
|
| |||||||
Diversified Financial Services — 0.3% |
| |||||||
| 2,650 | NASDAQ OMX Group, Inc. (The) | 105,470 | ||||||
|
| |||||||
Insurance — 4.9% |
| |||||||
| 1,575 | Allied World Assurance Co. Holdings AG, (Switzerland) | 177,676 | ||||||
| 4,375 | American Financial Group, Inc. | 252,525 | ||||||
| 1,350 | Aon plc, (United Kingdom) | 113,252 | ||||||
| 1,625 | Arch Capital Group Ltd., (Bermuda) (a) | 96,996 | ||||||
| 475 | Aspen Insurance Holdings Ltd., (Bermuda) | 19,622 | ||||||
| 2,125 | Assurant, Inc. | 141,036 | ||||||
| 7,200 | Assured Guaranty Ltd., (Bermuda) | 169,848 | ||||||
| 1,025 | Axis Capital Holdings Ltd., (Bermuda) | 48,759 | ||||||
| 475 | Everest Re Group Ltd., (Bermuda) | 74,038 | ||||||
| 2,850 | Hartford Financial Services Group, Inc. | 103,256 | ||||||
| 1,950 | Lincoln National Corp. | 100,659 | ||||||
| 2,425 | Old Republic International Corp. | 41,880 | ||||||
| 2,600 | Principal Financial Group, Inc. | 128,206 | ||||||
| 2,500 | Protective Life Corp. | 126,650 | ||||||
| 875 | Torchmark Corp. | 68,381 | ||||||
| 6,025 | Unum Group | 211,357 | ||||||
| 2,000 | Validus Holdings Ltd., (Bermuda) | 80,580 | ||||||
|
| |||||||
| 1,954,721 | ||||||||
|
| |||||||
Real Estate Investment Trusts (REITs) — 6.6% |
| |||||||
| 975 | American Capital Agency Corp. | 18,808 | ||||||
| 5,225 | Annaly Capital Management, Inc. | 52,093 | ||||||
| 4,800 | Apartment Investment & Management Co., Class A | 124,368 | ||||||
| 175 | AvalonBay Communities, Inc. | 20,690 | ||||||
| 4,625 | Brandywine Realty Trust | 65,166 | ||||||
| 875 | Camden Property Trust | 49,770 | ||||||
| 1,550 | Chimera Investment Corp. | 4,805 | ||||||
| 2,450 | CommonWealth REIT | 57,109 | ||||||
| 1,050 | Corrections Corp. of America | 33,673 | ||||||
| 3,100 | DDR Corp. | 47,647 | ||||||
| SHARES | SECURITY DESCRIPTION | VALUE($) | ||||||
Real Estate Investment Trusts (REITs) — Continued |
| |||||||
| 2,675 | Douglas Emmett, Inc. (m) | 62,301 | ||||||
| 17,725 | Duke Realty Corp. | 266,584 | ||||||
| 2,925 | Equity Lifestyle Properties, Inc. | 105,973 | ||||||
| 1,250 | Equity Residential | 64,838 | ||||||
| 1,175 | Extra Space Storage, Inc. | 49,503 | ||||||
| 2,600 | Health Care REIT, Inc. | 139,282 | ||||||
| 9,110 | Hospitality Properties Trust | 246,243 | ||||||
| 6,050 | Host Hotels & Resorts, Inc. | 117,612 | ||||||
| 1,575 | Mack-Cali Realty Corp. | 33,831 | ||||||
| 925 | Mid-America Apartment Communities, Inc. | 56,185 | ||||||
| 2,400 | Post Properties, Inc. | 108,552 | ||||||
| 4,125 | Retail Properties of America, Inc., Class A | 52,470 | ||||||
| 475 | SL Green Realty Corp. | 43,881 | ||||||
| 2,125 | Taubman Centers, Inc. | 135,830 | ||||||
| 2,297 | Ventas, Inc. | 131,572 | ||||||
| 13,200 | Weyerhaeuser Co. | 416,724 | ||||||
| 2,175 | WP Carey, Inc. | 133,436 | ||||||
|
| |||||||
| 2,638,946 | ||||||||
|
| |||||||
Real Estate Management & Development — 0.0% (g) |
| |||||||
| 150 | Jones Lang LaSalle, Inc. | 15,359 | ||||||
|
| |||||||
Total Financials | 7,108,600 | |||||||
|
| |||||||
Health Care — 11.0% | ||||||||
Biotechnology — 3.3% |
| |||||||
| 1,900 | Alexion Pharmaceuticals, Inc. (a) | 252,814 | ||||||
| 10,375 | Ariad Pharmaceuticals, Inc. (a) | 70,757 | ||||||
| 2,300 | BioMarin Pharmaceutical, Inc. (a) | 161,621 | ||||||
| 5,700 | Medivation, Inc. (a) | 363,774 | ||||||
| 1,750 | Pharmacyclics, Inc. (a) | 185,115 | ||||||
| 4,025 | Vertex Pharmaceuticals, Inc. (a) | 299,058 | ||||||
|
| |||||||
| 1,333,139 | ||||||||
|
| |||||||
Health Care Equipment & Supplies — 2.9% |
| |||||||
| 12,825 | Alere, Inc. (a) | 464,265 | ||||||
| 700 | Cooper Cos., Inc. (The) | 86,688 | ||||||
| 12,925 | Hologic, Inc. (a) | 288,874 | ||||||
| 3,275 | Zimmer Holdings, Inc. | 305,197 | ||||||
|
| |||||||
| 1,145,024 | ||||||||
|
| |||||||
Health Care Providers & Services — 4.0% |
| |||||||
| 9,000 | AmerisourceBergen Corp. | 632,790 | ||||||
| 6,625 | Catamaran Corp. (a) | 314,555 | ||||||
| 2,500 | Community Health Systems, Inc. (a) | 98,175 | ||||||
| 3,625 | Humana, Inc. | 374,173 | ||||||
| 5,450 | Premier, Inc., Class A (a) | 200,342 | ||||||
|
| |||||||
| 1,620,035 | ||||||||
|
| |||||||
SEE NOTES TO FINANCIAL STATEMENTS.
| 6 | JPMORGAN INSURANCE TRUST | DECEMBER 31, 2013 | ||||
Table of Contents
| SHARES | SECURITY DESCRIPTION | VALUE($) | ||||||
| Common Stocks — Continued |
| ||||||
Life Sciences Tools & Services — 0.0% (g) | ||||||||
| 150 | Agilent Technologies, Inc. | 8,578 | ||||||
|
| |||||||
Pharmaceuticals — 0.8% | ||||||||
| 3,125 | Hospira, Inc. (a) | 129,000 | ||||||
| 1,300 | Perrigo Co. plc, (Ireland) | 199,497 | ||||||
|
| |||||||
| 328,497 | ||||||||
|
| |||||||
Total Health Care | 4,435,273 | |||||||
|
| |||||||
Industrials — 17.0% | ||||||||
Aerospace & Defense — 2.1% | ||||||||
| 1,075 | Alliant Techsystems, Inc. | 130,806 | ||||||
| 5,416 | Huntington Ingalls Industries, Inc. | 487,494 | ||||||
| 1,800 | L-3 Communications Holdings, Inc. | 192,348 | ||||||
| 200 | Northrop Grumman Corp. | 22,922 | ||||||
|
| |||||||
| 833,570 | ||||||||
|
| |||||||
Airlines — 2.6% | ||||||||
| 3,575 | Alaska Air Group, Inc. | 262,298 | ||||||
| 1,525 | Copa Holdings S.A., (Panama), Class A | 244,167 | ||||||
| 5,400 | Delta Air Lines, Inc. | 148,338 | ||||||
| 20,800 | Southwest Airlines Co. | 391,872 | ||||||
|
| |||||||
| 1,046,675 | ||||||||
|
| |||||||
Building Products — 0.2% | ||||||||
| 1,683 | Allegion plc, (Ireland) (a) | 74,372 | ||||||
|
| |||||||
Commercial Services & Supplies — 0.5% | ||||||||
| 5,175 | KAR Auction Services, Inc. | 152,921 | ||||||
| 2,680 | R.R. Donnelley & Sons Co. | 54,351 | ||||||
|
| |||||||
| 207,272 | ||||||||
|
| |||||||
Construction & Engineering — 3.2% | ||||||||
| 21,525 | AECOM Technology Corp. (a) | 633,481 | ||||||
| 1,975 | Fluor Corp. | 158,573 | ||||||
| 5,200 | Jacobs Engineering Group, Inc. (a) | 327,548 | ||||||
| 2,850 | URS Corp. | 151,021 | ||||||
|
| |||||||
| 1,270,623 | ||||||||
|
| |||||||
Electrical Equipment — 0.2% | ||||||||
| 1,875 | Babcock & Wilcox Co. (The) | 64,106 | ||||||
| 450 | Regal-Beloit Corp. | 33,174 | ||||||
|
| |||||||
| 97,280 | ||||||||
|
| |||||||
Machinery — 3.8% | ||||||||
| 3,025 | AGCO Corp. | 179,050 | ||||||
| 5,000 | Ingersoll-Rand plc, (Ireland) | 308,000 | ||||||
| 1,925 | Lincoln Electric Holdings, Inc. | 137,329 | ||||||
| 4,050 | Oshkosh Corp. | 204,039 | ||||||
| 4,220 | Parker Hannifin Corp. | 542,861 | ||||||
| 2,025 | Timken Co. | 111,517 | ||||||
| SHARES | SECURITY DESCRIPTION | VALUE($) | ||||||
Machinery — Continued | ||||||||
| 425 | WABCO Holdings, Inc. (a) | 39,699 | ||||||
|
| |||||||
| 1,522,495 | ||||||||
|
| |||||||
Marine — 0.2% | ||||||||
| 1,050 | Kirby Corp. (a) | 104,213 | ||||||
|
| |||||||
Professional Services — 3.3% | ||||||||
| 5,725 | Manpowergroup, Inc. | 491,548 | ||||||
| 6,575 | Towers Watson & Co., Class A | 839,036 | ||||||
|
| |||||||
| 1,330,584 | ||||||||
|
| |||||||
Road & Rail — 0.5% | ||||||||
| 4,450 | CSX Corp. | 128,027 | ||||||
| 1,125 | Landstar System, Inc. | 64,631 | ||||||
|
| |||||||
| 192,658 | ||||||||
|
| |||||||
Trading Companies & Distributors — 0.4% | ||||||||
| 1,175 | Air Lease Corp. | 36,519 | ||||||
| 4,025 | MRC Global, Inc. (a) | 129,846 | ||||||
|
| |||||||
| 166,365 | ||||||||
|
| |||||||
Total Industrials | 6,846,107 | |||||||
|
| |||||||
Information Technology — 16.7% | ||||||||
Communications Equipment — 0.5% | ||||||||
| 3,075 | Harris Corp. | 214,666 | ||||||
|
| |||||||
Computers & Peripherals — 2.0% | ||||||||
| 9,575 | Western Digital Corp. | 803,342 | ||||||
|
| |||||||
Electronic Equipment, Instruments & Components — 1.4% |
| |||||||
| 3,375 | Arrow Electronics, Inc. (a) | 183,094 | ||||||
| 6,375 | Avnet, Inc. | 281,201 | ||||||
| 1,550 | Tech Data Corp. (a) | 79,980 | ||||||
|
| |||||||
| 544,275 | ||||||||
|
| |||||||
Internet Software & Services — 1.3% | ||||||||
| 2,300 | LinkedIn Corp., Class A (a) | 498,709 | ||||||
| 675 | Twitter, Inc. (a) | 42,964 | ||||||
|
| |||||||
| 541,673 | ||||||||
|
| |||||||
IT Services — 4.5% | ||||||||
| 1,900 | Alliance Data Systems Corp. (a) | 499,567 | ||||||
| 30,150 | Booz Allen Hamilton Holding Corp. | 577,372 | ||||||
| 1,175 | DST Systems, Inc. | 106,619 | ||||||
| 1,900 | Fidelity National Information Services, Inc. | 101,992 | ||||||
| 2,950 | Lender Processing Services, Inc. | 110,271 | ||||||
| 6,475 | Vantiv, Inc., Class A (a) | 211,150 | ||||||
| 6,875 | VeriFone Systems, Inc. (a) | 184,388 | ||||||
|
| |||||||
| 1,791,359 | ||||||||
|
| |||||||
Office Electronics — 0.8% | ||||||||
| 25,300 | Xerox Corp. | 307,901 | ||||||
|
| |||||||
SEE NOTES TO FINANCIAL STATEMENTS.
| DECEMBER 31, 2013 | JPMORGAN INSURANCE TRUST | 7 | ||||||
Table of Contents
JPMorgan Insurance Trust Intrepid Mid Cap Portfolio
SCHEDULE OF PORTFOLIO INVESTMENTS
AS OF DECEMBER 31, 2013 (continued)
| SHARES | SECURITY DESCRIPTION | VALUE($) | ||||||
| Common Stocks — Continued |
| ||||||
Semiconductors & Semiconductor Equipment — 2.8% |
| |||||||
| 18,650 | Advanced Micro Devices, Inc. (a) | 72,176 | ||||||
| 3,975 | First Solar, Inc. (a) | 217,194 | ||||||
| 1,450 | KLA-Tencor Corp. | 93,467 | ||||||
| 1,275 | Lam Research Corp. (a) | 69,424 | ||||||
| 5,150 | LSI Corp. | 56,753 | ||||||
| 22,275 | Marvell Technology Group Ltd., (Bermuda) | 320,314 | ||||||
| 11,600 | Micron Technology, Inc. (a) | 252,416 | ||||||
| 3,200 | Teradyne, Inc. (a) | 56,384 | ||||||
|
| |||||||
| 1,138,128 | ||||||||
|
| |||||||
Software — 3.4% | ||||||||
| 15,850 | Activision Blizzard, Inc. | 282,605 | ||||||
| 17,250 | CA, Inc. | 580,462 | ||||||
| 2,750 | Rovi Corp. (a) | 54,148 | ||||||
| 10,100 | Symantec Corp. | 238,158 | ||||||
| 4,225 | TIBCO Software, Inc. (a) | 94,978 | ||||||
| 28,350 | Zynga, Inc., Class A (a) | 107,730 | ||||||
|
| |||||||
| 1,358,081 | ||||||||
|
| |||||||
Total Information Technology | 6,699,425 | |||||||
|
| |||||||
Materials — 4.7% | ||||||||
Chemicals — 2.3% | ||||||||
| 1,075 | CF Industries Holdings, Inc. | 250,518 | ||||||
| 775 | Huntsman Corp. | 19,065 | ||||||
| 2,566 | PPG Industries, Inc. | 486,668 | ||||||
| 2,125 | Valspar Corp. (The) | 151,491 | ||||||
|
| |||||||
| 907,742 | ||||||||
|
| |||||||
Containers & Packaging — 0.6% | ||||||||
| 1,875 | Crown Holdings, Inc. (a) | 83,569 | ||||||
| 450 | Greif, Inc., Class A | 23,580 | ||||||
| 300 | Rock Tenn Co., Class A | 31,503 | ||||||
| 3,025 | Sealed Air Corp. | 103,001 | ||||||
|
| |||||||
| 241,653 | ||||||||
|
| |||||||
Metals & Mining — 0.9% | ||||||||
| 700 | Nucor Corp. | 37,366 | ||||||
| 3,675 | Reliance Steel & Aluminum Co. | 278,712 | ||||||
| 3,000 | Steel Dynamics, Inc. | 58,620 | ||||||
|
| |||||||
| 374,698 | ||||||||
|
| |||||||
Paper & Forest Products — 0.9% | ||||||||
| 1,475 | Domtar Corp., (Canada) | 139,151 | ||||||
| 4,250 | International Paper Co. | 208,378 | ||||||
|
| |||||||
| 347,529 | ||||||||
|
| |||||||
Total Materials | 1,871,622 | |||||||
|
| |||||||
Telecommunication Services — 1.7% | ||||||||
Diversified Telecommunication Services — 0.6% |
| |||||||
| 53,100 | Frontier Communications Corp. | 246,915 | ||||||
|
| |||||||
| SHARES | SECURITY DESCRIPTION | VALUE($) | ||||||
Wireless Telecommunication Services — 1.1% |
| |||||||
| 1,225 | Crown Castle International Corp. (a) | 89,952 | ||||||
| 1,400 | SBA Communications Corp., Class A (a) | 125,776 | ||||||
| 6,825 | T-Mobile US, Inc. (a) | 229,593 | ||||||
|
| |||||||
| 445,321 | ||||||||
|
| |||||||
Total Telecommunication Services | 692,236 | |||||||
|
| |||||||
Utilities — 5.2% | ||||||||
Electric Utilities — 0.1% | ||||||||
| 450 | Pinnacle West Capital Corp. | 23,814 | ||||||
|
| |||||||
Gas Utilities — 0.5% | ||||||||
| 4,725 | UGI Corp. | 195,899 | ||||||
|
| |||||||
Independent Power Producers & Energy Traders — 0.8% |
| |||||||
| 22,775 | AES Corp. | 330,466 | ||||||
|
| |||||||
Multi-Utilities — 3.8% | ||||||||
| 2,250 | Alliant Energy Corp. | 116,100 | ||||||
| 3,200 | Ameren Corp. | 115,712 | ||||||
| 9,755 | CenterPoint Energy, Inc. | 226,121 | ||||||
| 4,275 | CMS Energy Corp. | 114,442 | ||||||
| 2,100 | Consolidated Edison, Inc. | 116,088 | ||||||
| 3,625 | DTE Energy Co. | 240,664 | ||||||
| 2,800 | MDU Resources Group, Inc. | 85,540 | ||||||
| 2,750 | SCANA Corp. | 129,057 | ||||||
| 3,350 | Sempra Energy | 300,696 | ||||||
| 6,000 | TECO Energy, Inc. | 103,440 | ||||||
|
| |||||||
| 1,547,860 | ||||||||
|
| |||||||
Total Utilities | 2,098,039 | |||||||
|
| |||||||
Total Common Stocks | 39,575,026 | |||||||
|
| |||||||
| PRINCIPAL AMOUNT($) | ||||||||
| U.S. Treasury Obligation — 0.2% | |||||||
| 60,000 | U.S. Treasury Note, 0.250%, 11/30/14 (k) (Cost $60,062) | 60,054 | ||||||
|
| |||||||
| SHARES | ||||||||
| Short-Term Investment — 1.4% |
| ||||||
Investment Company — 1.4% |
| |||||||
| 570,126 | JPMorgan Liquid Assets Money Market Fund, Institutional Class Shares, 0.020% (b) (l) (m) | 570,126 | ||||||
|
| |||||||
Total Investments — 100.1% | 40,205,206 | |||||||
Liabilities in Excess of | (26,869 | ) | ||||||
|
| |||||||
NET ASSETS — 100.0% | $ | 40,178,337 | ||||||
|
| |||||||
Percentages indicated are based on net assets.
SEE NOTES TO FINANCIAL STATEMENTS.
| 8 | JPMORGAN INSURANCE TRUST | DECEMBER 31, 2013 | ||||
Table of Contents
| Futures Contracts | ||||||||||||||||
| NUMBER OF CONTRACTS | DESCRIPTION | EXPIRATION DATE | NOTIONAL VALUE AT 12/31/13 | NET UNREALIZED APPRECIATION (DEPRECIATION) | ||||||||||||
Long Futures Outstanding | ||||||||||||||||
| 5 | S&P Mid Cap 400 | 03/21/14 | $ | 669,700 | $ | 19,270 | ||||||||||
|
| |||||||||||||||
NOTES TO SCHEDULE OF PORTFOLIO INVESTMENTS
| REIT | — Real Estate Investment Trust. | |
| (a) | — Non-income producing security. | |
| (b) | — Investment in affiliate. Money market fund registered under the Investment Company Act of 1940, as amended, and advised by J.P. Morgan Investment Management Inc. | |
| (g) | — Amount rounds to less than 0.1%. | |
| (k) | — All or a portion of this security is deposited with the broker as collateral for futures or with brokers as initial margin for futures contracts. |
| (l) | — The rate shown is the current yield as of December 31, 2013. | |
| (m) | — All or a portion of this security is reserved and/or pledged with the custodian for current or potential holdings of futures, swaps, options, TBAs, when-issued securities, delayed delivery securities, reverse repurchase agreements, unfunded commitments and/or forward foreign currency exchange contracts. |
SEE NOTES TO FINANCIAL STATEMENTS.
| DECEMBER 31, 2013 | JPMORGAN INSURANCE TRUST | 9 | ||||||
Table of Contents
STATEMENT OF ASSETS AND LIABILITIES
AS OF DECEMBER 31, 2013
| Intrepid Mid Cap Portfolio | ||||
ASSETS: | ||||
Investments in non-affiliates, at value | $ | 39,635,080 | ||
Investments in affiliates, at value | 570,126 | |||
|
| |||
Total investment securities, at value | 40,205,206 | |||
Receivables: | ||||
Investment securities sold | 56,119 | |||
Portfolio shares sold | 737 | |||
Interest and dividends from non-affiliates | 45,304 | |||
Dividends from affiliates | 15 | |||
Variation margin on futures contracts | 1,750 | |||
|
| |||
Total Assets | 40,309,131 | |||
|
| |||
LIABILITIES: | ||||
Payables: | ||||
Portfolio shares redeemed | 54,417 | |||
Accrued liabilities: | ||||
Investment advisory fees | 21,748 | |||
Administration fees | 2,824 | |||
Distribution fees | 10 | |||
Custodian and accounting fees | 9,979 | |||
Trustees’ and Chief Compliance Officer’s fees | 32 | |||
Audit fees | 32,697 | |||
Other | 9,087 | |||
|
| |||
Total Liabilities | 130,794 | |||
|
| |||
Net Assets | $ | 40,178,337 | ||
|
| |||
NET ASSETS: | ||||
Paid-in-Capital | $ | 23,945,849 | ||
Accumulated undistributed net investment income | 235,130 | |||
Accumulated net realized gains (losses) | �� | 5,152,837 | ||
Net unrealized appreciation (depreciation) | 10,844,521 | |||
|
| |||
Total Net Assets | $ | 40,178,337 | ||
|
| |||
Net Assets: | ||||
Class 1 | $ | 40,129,143 | ||
Class 2 | 49,194 | |||
|
| |||
Total | $ | 40,178,337 | ||
|
| |||
Outstanding units of beneficial interest (shares) | ||||
(unlimited number of shares authorized, no par value): | ||||
Class 1 | 1,641,814 | |||
Class 2 | 2,018 | |||
Net Asset Value, offering and redemption price per share (a): | ||||
Class 1 | $ | 24.44 | ||
Class 2 | 24.38 | |||
|
| |||
Cost of investments in non-affiliates | $ | 28,809,829 | ||
Cost of investments in affiliates | 570,126 | |||
| (a) | Per share amounts may not recalculate due to rounding of net assets and/or shares outstanding. |
SEE NOTES TO FINANCIAL STATEMENTS.
| 10 | JPMORGAN INSURANCE TRUST | DECEMBER 31, 2013 | ||||
Table of Contents
STATEMENT OF OPERATIONS
FOR THE YEAR ENDED DECEMBER 31, 2013
| Intrepid Mid Cap Portfolio | ||||
INVESTMENT INCOME: | ||||
Dividend income from non-affiliates | $ | 583,508 | ||
Dividend income from affiliates | 326 | |||
Interest income from non-affiliates | 124 | |||
|
| |||
Total investment income | 583,958 | |||
|
| |||
EXPENSES: | ||||
Investment advisory fees | 250,003 | |||
Administration fees | 32,402 | |||
Distribution fees — Class 2 | 62 | |||
Custodian and accounting fees | 33,709 | |||
Professional fees | 43,729 | |||
Trustees’ and Chief Compliance Officer’s fees | 433 | |||
Printing and mailing costs | 13,573 | |||
Transfer agent fees | 4,814 | |||
Other | 7,249 | |||
|
| |||
Total expenses | 385,974 | |||
|
| |||
Less amounts waived | (41,460 | ) | ||
|
| |||
Net expenses | 344,514 | |||
|
| |||
Net investment income (loss) | 239,444 | |||
|
| |||
REALIZED/UNREALIZED GAINS (LOSSES): | ||||
Net realized gain (loss) on transactions from: | ||||
Investments in non-affiliates | 7,192,090 | |||
Futures | 227,883 | |||
|
| |||
Net realized gains (losses) | 7,419,973 | |||
|
| |||
Change in net unrealized appreciation/depreciation of: | ||||
Investments in non-affiliates | 5,434,280 | |||
Futures | 7,530 | |||
|
| |||
Change in net unrealized appreciation/depreciation | 5,441,810 | |||
|
| |||
Net realized/unrealized gains (losses) | 12,861,783 | |||
|
| |||
Change in net assets resulting from operations | $ | 13,101,227 | ||
|
| |||
SEE NOTES TO FINANCIAL STATEMENTS.
| DECEMBER 31, 2013 | JPMORGAN INSURANCE TRUST | 11 | ||||||
Table of Contents
STATEMENTS OF CHANGES IN NET ASSETS
FOR THE PERIODS INDICATED
| Intrepid Mid Cap Portfolio | ||||||||
| Year Ended 12/31/2013 | Year Ended 12/31/2012 | |||||||
CHANGE IN NET ASSETS RESULTING FROM OPERATIONS: | ||||||||
Net investment income (loss) | $ | 239,444 | $ | 433,636 | ||||
Net realized gain (loss) | 7,419,973 | 1,618,289 | ||||||
Change in net unrealized appreciation/depreciation | 5,441,810 | 3,079,445 | ||||||
|
|
|
| |||||
Change in net assets resulting from operations | 13,101,227 | 5,131,370 | ||||||
|
|
|
| |||||
DISTRIBUTIONS TO SHAREHOLDERS: | ||||||||
Class 1 | ||||||||
From net investment income | (431,619 | ) | (257,920 | ) | ||||
Class 2 | ||||||||
From net investment income | (194 | ) | (100 | ) | ||||
|
|
|
| |||||
Total distributions to shareholders | (431,813 | ) | (258,020 | ) | ||||
|
|
|
| |||||
CAPITAL TRANSACTIONS: | ||||||||
Change in net assets resulting from capital transactions | (8,548,005 | ) | (414,429 | ) | ||||
|
|
|
| |||||
NET ASSETS: | ||||||||
Change in net assets | 4,121,409 | 4,458,921 | ||||||
Beginning of period | 36,056,928 | 31,598,007 | ||||||
|
|
|
| |||||
End of period | $ | 40,178,337 | $ | 36,056,928 | ||||
|
|
|
| |||||
Accumulated undistributed net investment income | $ | 235,130 | $ | 432,144 | ||||
|
|
|
| |||||
CAPITAL TRANSACTIONS: | ||||||||
Class 1 | ||||||||
Proceeds from shares issued | $ | 2,102,652 | $ | 7,029,673 | ||||
Distributions reinvested | 431,619 | 257,920 | ||||||
Cost of shares redeemed | (11,104,437 | ) | (7,702,122 | ) | ||||
|
|
|
| |||||
Change in net assets resulting from Class 1 capital transactions | $ | (8,570,166 | ) | $ | (414,529 | ) | ||
|
|
|
| |||||
Class 2 | ||||||||
Proceeds from shares issued | $ | 21,996 | $ | 2 | ||||
Distributions reinvested | 194 | 100 | ||||||
Cost of shares redeemed | (29 | ) | (2 | ) | ||||
|
|
|
| |||||
Change in net assets resulting from Class 2 capital transactions | $ | 22,161 | $ | 100 | ||||
|
|
|
| |||||
Total change in net assets resulting from capital transactions | $ | (8,548,005 | ) | $ | (414,429 | ) | ||
|
|
|
| |||||
SHARE TRANSACTIONS: | ||||||||
Class 1 | ||||||||
Issued | 99,231 | 424,954 | ||||||
Reinvested | 21,831 | 15,528 | ||||||
Redeemed | (529,469 | ) | (459,751 | ) | ||||
|
|
|
| |||||
Change in Class 1 Shares | (408,407 | ) | (19,269 | ) | ||||
|
|
|
| |||||
Class 2 | ||||||||
Issued | 937 | 1 | ||||||
Reinvested | 10 | 6 | ||||||
Redeemed | (1 | ) | — | (a) | ||||
|
|
|
| |||||
Change in Class 2 Shares | 946 | 7 | ||||||
|
|
|
| |||||
| (a) | Amount rounds to less than 1 share. |
SEE NOTES TO FINANCIAL STATEMENTS.
| 12 | JPMORGAN INSURANCE TRUST | DECEMBER 31, 2013 | ||||
Table of Contents
THIS PAGE IS INTENTIONALLY LEFT BLANK
| DECEMBER 31, 2013 | JPMORGAN INSURANCE TRUST | 13 | ||||||
Table of Contents
FOR THE PERIODS INDICATED
| Per share operating performance | ||||||||||||||||||||
| Investment operations | Distributions | |||||||||||||||||||
| Net asset value, beginning of period | Net investment income (loss) | Net realized and unrealized gains (losses) on investments | Total from investment operations | Net investment income | ||||||||||||||||
Intrepid Mid Cap Portfolio | ||||||||||||||||||||
Class 1 | ||||||||||||||||||||
Year Ended December 31, 2013 | $ | 17.58 | $ | 0.13 | (d) | $ | 6.95 | $ | 7.08 | $ | (0.22 | ) | ||||||||
Year Ended December 31, 2012 | 15.26 | 0.21 | (d)(e) | 2.24 | 2.45 | (0.13 | ) | |||||||||||||
Year Ended December 31, 2011 | 15.62 | 0.12 | (d) | (0.34 | ) | (0.22 | ) | (0.14 | ) | |||||||||||
Year Ended December 31, 2010 | 13.23 | 0.11 | (d) | 2.46 | 2.57 | (0.18 | ) | |||||||||||||
Year Ended December 31, 2009 | 9.92 | 0.18 | 3.30 | 3.48 | (0.17 | ) | ||||||||||||||
Class 2 | ||||||||||||||||||||
Year Ended December 31, 2013 | 17.54 | 0.09 | (d) | 6.93 | 7.02 | (0.18 | ) | |||||||||||||
Year Ended December 31, 2012 | 15.23 | 0.17 | (d)(e) | 2.23 | 2.40 | (0.09 | ) | |||||||||||||
Year Ended December 31, 2011 | 15.60 | 0.08 | (d) | (0.35 | ) | (0.27 | ) | (0.10 | ) | |||||||||||
Year Ended December 31, 2010 | 13.22 | 0.08 | (d) | 2.46 | 2.54 | (0.16 | ) | |||||||||||||
Year Ended December 31, 2009 | 9.90 | 0.12 | 3.33 | 3.45 | (0.13 | ) | ||||||||||||||
| (a) | Includes adjustments in accordance with accounting principles generally accepted in the United States of America and as such, the net asset values for financial reporting purposes and the returns based upon those net asset values may differ from the net asset values and returns for shareholder transactions. |
| (b) | Includes earnings credits and interest expense, if applicable, each of which is less than 0.01% unless otherwise noted. |
| (c) | Portfolio turnover is calculated by dividing the lesser of total purchases or sales of portfolio securities for the reporting period by the monthly average value of portfolio securities owned during the reporting period. Excluded from both the numerator and denominator are amounts relating to derivatives and securities whose maturities or expiration dates at the time of acquisition were one year or less. |
| (d) | Calculated based upon average shares outstanding. |
| (e) | Reflects special dividends paid out during the period by several of the Portfolio’s holdings. Had the Portfolio not received the special dividends, the net investment income (loss) per share would have been $0.16 and $0.11 for Class 1 and Class 2 Shares, respectively, and the net investment income (loss) ratio would have been 0.93% and 0.66% for Class 1 and Class 2 Shares, respectively. |
SEE NOTES TO FINANCIAL STATEMENTS.
| 14 | JPMORGAN INSURANCE TRUST | DECEMBER 31, 2013 | ||||
Table of Contents
| Ratios/Supplemental data | |||||||||||||||||||||||||
| Ratios to average net assets | ||||||||||||||||||||||||||
| Net asset value, end of period | Total return (a) | Net assets, end of period | Net expenses (b) | Net investment income (loss) | Expenses without waivers, reimbursements and earnings credits | Portfolio turnover rate (c) | ||||||||||||||||||||
| $ | 24.44 | 40.59 | % | $ | 40,129,143 | 0.89 | % | 0.62 | % | 1.00 | % | 57 | % | |||||||||||||
| 17.58 | 16.13 | 36,038,129 | 0.90 | 1.28 | (e) | 1.02 | 54 | |||||||||||||||||||
| 15.26 | (1.52 | ) | 31,581,775 | 0.90 | 0.75 | 1.08 | 47 | |||||||||||||||||||
| 15.62 | 19.52 | 38,556,642 | 0.90 | 0.81 | 1.22 | 46 | ||||||||||||||||||||
| 13.23 | 35.66 | 42,810,183 | 0.90 | 1.37 | 1.15 | 74 | ||||||||||||||||||||
| 24.38 | 40.27 | 49,194 | 1.14 | 0.41 | 1.24 | 57 | ||||||||||||||||||||
| 17.54 | 15.82 | 18,799 | 1.15 | 1.00 | (e) | 1.27 | 54 | |||||||||||||||||||
| 15.23 | (1.79 | ) | 16,232 | 1.15 | 0.52 | 1.33 | 47 | |||||||||||||||||||
| 15.60 | 19.24 | 16,528 | 1.15 | 0.57 | 1.48 | 46 | ||||||||||||||||||||
| 13.22 | 35.37 | 13,862 | 1.15 | 1.14 | 1.40 | 74 | ||||||||||||||||||||
SEE NOTES TO FINANCIAL STATEMENTS.
| DECEMBER 31, 2013 | JPMORGAN INSURANCE TRUST | 15 | ||||||
Table of Contents
AS OF DECEMBER 31, 2013
1. Organization
JPMorgan Insurance Trust (the “Trust”) is registered under the Investment Company Act of 1940, as amended (the “1940 Act”), as an open-end management investment company and is a Massachusetts business trust.
The following is a separate Portfolio of the Trust (the “Portfolio”) covered by this report:
| Classes Offered | Diversified/Non-Diversified | |||
| Intrepid Mid Cap Portfolio | Class 1 and Class 2 | Diversified |
The investment objective of the Portfolio is to seek long-term capital growth by investing primarily in equity securities of companies with intermediate capitalizations.
Portfolio shares are offered only to separate accounts of participating insurance companies and Eligible Plans. Individuals may not purchase shares directly from the Portfolio.
All classes of shares have equal rights as to earnings, assets and voting privileges, except that each class may bear different distribution and service fees and each class has exclusive voting rights with respect to its distribution plan and administrative services plan.
2. Significant Accounting Policies
The following is a summary of significant accounting policies followed by the Portfolio in the preparation of its financial statements. The policies are in accordance with accounting principles generally accepted in the United States of America (“GAAP”). The preparation of financial statements requires management to make estimates and assumptions that affect the reported amounts and disclosures in the financial statements. Actual results could differ from those estimates.
A. Valuation of Investments — Equity securities listed on a North American, Central American, South American or Caribbean securities exchange shall generally be valued at the last sale price on the exchange on which the security is principally traded that is reported before the time when the net assets of the Portfolio are valued. Securities listed on the NASDAQ Stock Market LLC are generally valued at the NASDAQ Official Closing Price. Fixed income securities (other than certain short-term investments maturing in less than 61 days) are valued each day based on prices received from independent or affiliated pricing services approved by the Board of Trustees or third party broker-dealers. The pricing services or broker-dealers use multiple valuation techniques to determine fair value. In instances where sufficient market activity exists, the pricing services or broker-dealers may utilize a market-based approach through which quotes from market makers are used to determine fair value. In instances where sufficient market activity may not exist or is limited, the pricing services or broker-dealers also utilize proprietary valuation models which may consider market transactions in comparable securities and the various relationships between securities in determining fair value and/or market characteristics such as benchmark yield curves, option-adjusted spreads, credit spreads, estimated default rates, coupon rates, anticipated timing of principal repayments, underlying collateral, and other unique security features in order to estimate the relevant cash flows, which are then discounted to calculate the fair values. Generally, short-term investments of sufficient credit quality maturing in less than 61 days are valued at amortized cost, which approximates fair value. Investments in open-end investment companies are valued at each investment company’s net asset value per share (“NAV”) as of the report date.
Certain investments of the Portfolio may, depending upon market conditions, trade in relatively thin markets and/or in markets that experience significant volatility. As a result of these conditions, the prices used by the Portfolio to value these securities may differ from the value that would be realized if these securities were sold, and the differences could be material. Futures and options are generally valued on the basis of available market quotations. Swaps and other derivatives are valued daily, primarily using independent or affiliated pricing services approved by the Board of Trustees. If valuations are not available from such pricing services or values received are deemed not representative of fair value, values will be obtained from a third party broker-dealer or counterparty.
Securities or other assets for which market quotations are not readily available or for which market quotations are deemed to not represent the fair value of the security or asset at the time of pricing (including certain illiquid securities) are fair valued in accordance with procedures established by and under the supervision and responsibility of the Board of Trustees. The Board of Trustees has established an Audit and Valuation Committee to assist with the oversight of the valuation of the Portfolio’s securities. JPMorgan Funds Management, Inc. (the “Administrator” or ��JPMFM”) has established a Valuation Committee (“VC”) that is comprised of senior representatives from JPMFM, J.P. Morgan Investment Management Inc. (the “Adviser” or “JPMIM”), and J.P. Morgan Asset Management’s Legal, Compliance and Risk Management groups and the Portfolio’s Chief Compliance Officer. The VC’s responsibilities include making determinations regarding Level 3 fair value measurements (“Fair Values”) and/or providing recommendations for approval to the Board of Trustees’ Audit and Valuation Committee, in accordance with the Portfolio’s valuation policies.
The VC or Board of Trustees, as applicable, primarily employs a market-based approach which may use related or comparable assets or liabilities, recent transactions, market multiples, book values, and other relevant information for the investment to determine the fair value of the investment. The VC or Board of Trustees may also use an income-based valuation approach in which the anticipated future cash flows of the investment are discounted to calculate fair value. Discounts may also be applied due to the nature or duration of any restrictions on the disposition of the investments. Valuations may be based upon current market prices of securities that are comparable in coupon, rating, maturity and industry.
| 16 | JPMORGAN INSURANCE TRUST | DECEMBER 31, 2013 | ||||
Table of Contents
It is possible that the estimated values may differ significantly from the values that would have been used had a ready market for the investments existed, and such differences could be material. JPMFM and JPMIM are responsible for monitoring developments that may impact Fair Values and for discussing and assessing Fair Values on an ongoing, and at least a quarterly, basis with the VC and Board of Trustees, as applicable. The appropriateness of Fair Values is assessed based on results of unchanged price review and consideration of macro or security specific events, back testing, and broker and vendor due diligence.
Valuations reflected in this report are as of the report date. As a result, changes in valuation due to market events and/or issuer related events after the report date and prior to issuance of the report, are not reflected herein.
The various inputs that are used in determining the fair value of the Portfolio’s investments are summarized into the three broad levels listed below.
| Ÿ | Level 1 — quoted prices in active markets for identical securities |
| Ÿ | Level 2 — other significant observable inputs (including quoted prices for similar securities, interest rates, prepayment speeds, credit risk, etc.) |
| Ÿ | Level 3 — significant unobservable inputs (including the Portfolio’s own assumptions in determining the fair value of investments) |
A financial instrument’s level within the fair value hierarchy is based on the lowest level of any input, both individually and in the aggregate, that is significant to the fair value measurement. The inputs or methodology used for valuing securities are not necessarily an indication of the risk associated with investing in those securities.
The following table represents each valuation input as presented on the Schedule of Portfolio Investments (“SOI”):
| Level 1 Quoted prices | Level 2 Other significant observable inputs | Level 3 Significant unobservable inputs | Total | |||||||||||||
Total Investments in Securities (a) | $ | 40,145,152 | $ | 60,054 | $ | — | $ | 40,205,206 | ||||||||
|
|
|
|
|
|
|
| |||||||||
Appreciation in Other Financial Instruments | ||||||||||||||||
Futures Contracts | $ | 19,270 | $ | — | $ | — | $ | 19,270 | ||||||||
|
|
|
|
|
|
|
| |||||||||
| (a) | All portfolio holdings designated as Level 1 and Level 2 are disclosed individually on the SOI. Level 2 consists of a U.S. Treasury Note that is held for futures collateral. Please refer to the SOI for industry specifics of portfolio holdings. |
There were no transfers among any levels during the year ended December 31, 2013.
B. Futures Contracts — The Portfolio uses index futures contracts to gain or reduce exposure to the stock market, maintain liquidity and minimize transaction costs. The Portfolio also buys futures contracts to immediately invest incoming cash in the market or sells futures in response to cash outflows, thereby simulating an invested position in the underlying index while maintaining a cash balance for liquidity. The use of futures contracts exposes the Portfolio to equity price risk.
Futures contracts provide for the delayed delivery of the underlying instrument at a fixed price or are settled for a cash amount based on the change in the value of the underlying instrument at a specific date in the future. Upon entering into a futures contract, the Portfolio is required to deposit with the broker, cash or securities in an amount equal to a certain percentage of the contract amount, which is referred to as the initial margin deposit. Subsequent payments, referred to as variation margin, are made or received by the Portfolio periodically and are based on changes in the market value of open futures contracts. Changes in the market value of open futures contracts are recorded as change in net unrealized appreciation/depreciation in the Statement of Operations. Realized gains or losses, representing the difference between the value of the contract at the time it was opened and the value at the time it was closed, are reported in the Statement of Operations at the closing or expiration of the futures contract. Securities deposited as initial margin are designated in the SOI and cash deposited is recorded on the Statement of Assets and Liabilities. A receivable from and/or a payable to brokers for the daily variation margin is also recorded on the Statement of Assets and Liabilities.
The Portfolio may be subject to the risk that the change in the value of the futures contract may not correlate perfectly with the underlying instrument. Use of long futures contracts subjects the Portfolio to risk of loss in excess of the amounts shown on the Statement of Assets and Liabilities, up to the notional amount of the futures contracts. Use of short futures contracts subjects the Portfolio to unlimited risk of loss. The Portfolio may enter into futures contracts only on exchanges or boards of trade. The exchange or board of trade acts as the counterparty to each futures transaction; therefore, the Portfolio’s credit risk is limited to failure of the exchange or board of trade. Under some circumstances, futures exchanges may establish daily limits on the amount that the price of a futures contract can vary from the previous day’s settlement price, which could effectively prevent liquidation of positions.
The table below discloses the volume of the Portfolio’s futures contracts activity during the year ended December 31, 2013:
Futures Contracts: | ||||
Average Notional Balance Long | $ | 735,218 | ||
Ending Notional Balance Long | 669,700 |
The Portfolio’s futures contracts are not subject to master netting arrangements.
| DECEMBER 31, 2013 | JPMORGAN INSURANCE TRUST | 17 | ||||||
Table of Contents
NOTES TO FINANCIAL STATEMENTS
AS OF DECEMBER 31, 2013 (continued)
C. Security Transactions and Investment Income — Investment transactions are accounted for on the trade date (the date the order to buy or sell is executed). Securities gains and losses are calculated on a specifically identified cost basis. Interest income is determined on the basis of coupon interest accrued using the effective interest method which adjusts for amortization of premiums and accretion of discounts. Dividend income, net of foreign taxes withheld, if any, is recorded on the ex-dividend date or when the Portfolio first learns of the dividend.
To the extent such information is publicly available, the Portfolio records distributions received in excess of income earned from underlying investments as a reduction of cost of investments and/or realized gain. Such amounts are based on estimates if actual amounts are not available and actual amounts of income, realized gain and return of capital may differ from the estimated amounts. The Portfolio adjusts the estimated amounts of the components of distributions (and consequently its net investment income) as necessary once the issuers provide information about the actual composition of the distributions.
D. Allocation of Income and Expenses — Expenses directly attributable to a portfolio are charged directly to that portfolio, while the expenses attributable to more than one portfolio of the Trust are allocated among the respective portfolios. In calculating the NAV of each class, investment income, realized and unrealized gains and losses and expenses, other than class specific expenses, are allocated daily to each class of shares based upon the proportion of net assets of each class at the beginning of each day.
E. Federal Income Taxes — The Portfolio is treated as a separate taxable entity for Federal income tax purposes. The Portfolio’s policy is to comply with the provisions of the Internal Revenue Code of 1986, as amended (the “Code”), applicable to regulated investment companies and to distribute to shareholders all of its distributable net investment income and net realized capital gains on investments. Accordingly, no provision for Federal income tax is necessary. The Portfolio is also a segregated portfolio of assets for insurance purposes and intends to comply with the diversification requirements of Subchapter L of the Code. Management has reviewed the Portfolio’s tax positions for all open tax years and has determined that as of December 31, 2013, no liability for income tax is required in the Portfolio’s financial statements for net unrecognized tax benefits. However, management’s conclusions may be subject to future review based on changes in, or the interpretation of, the accounting standards or tax laws and regulations. The Portfolio’s Federal tax returns for the prior three fiscal years remain subject to examination by the Internal Revenue Service.
F. Distributions to Shareholders — Distributions from net investment income are generally declared and paid at least annually and are declared separately for each class. No class has preferential dividend rights; differences in per share rates are due to differences in separate class expenses. Net realized capital gains, if any, are distributed at least annually. The amount of distributions from net investment income and net realized capital gains is determined in accordance with Federal income tax regulations, which may differ from GAAP. To the extent these “book/tax” differences are permanent in nature (i.e., that they result from other than timing of recognition — “temporary differences”), such amounts are reclassified within the capital accounts based on their Federal tax-basis treatment.
The following amounts were reclassified within the capital accounts:
| Paid-in-Capital | Accumulated Undistributed Net Investment Income | Accumulated Net Realized Gains (Losses) | ||||||||||
| $ | 14,867 | $ | (4,645 | ) | $ | (10,222 | ) | |||||
The reclassifications for the Portfolio relate primarily to investments in partnerships.
3. Fees and Other Transactions with Affiliates
A. Investment Advisory Fee — Pursuant to the Investment Advisory Agreement, the Adviser, an indirect, wholly-owned subsidiary of JPMorgan Chase & Co. (“JPMorgan”), supervises the investments of the Portfolio and for such services is paid a fee. The fee is accrued daily and paid monthly based on the Portfolio’s average daily net assets at an annual rate of 0.65%.
The Adviser waived Investment Advisory fees and/or reimbursed expenses as outlined in Note 3.E.
B. Administration Fee — Pursuant to an Administration Agreement, the Administrator, an indirect, wholly-owned subsidiary of JPMorgan, provides certain administration services to the Portfolio. In consideration of these services, the Administrator receives a fee accrued daily and paid monthly at an annual rate of 0.15% of the first $25 billion of the average daily net assets of all funds in the J.P. Morgan Funds Complex covered by the Administration Agreement (excluding certain funds of funds and money market funds) and 0.075% of the average daily net assets in excess of $25 billion of all such funds. For the year ended December 31, 2013, the effective rate was 0.08% of the Portfolio’s average daily net assets, notwithstanding any fee waivers and/or expense reimbursements.
JPMorgan Chase Bank, N.A. (“JPMCB”), a wholly-owned subsidiary of JPMorgan, serves as the Portfolio’s sub-administrator (the “Sub-administrator”). For its services as Sub-administrator, JPMCB receives a portion of the fees payable to the Administrator.
The Administrator waived Administration fees as outlined in Note 3.E.
C. Distribution Fees — Pursuant to a Distribution Agreement, JPMorgan Distribution Services, Inc. (the “Distributor”), a wholly-owned subsidiary of JPMorgan, serves as the Trust’s exclusive underwriter and promotes and arranges for the sale of the Portfolio’s shares.
The Board of Trustees has adopted a Distribution Plan (the “Distribution Plan”) for Class 2 Shares of the Portfolio in accordance with Rule 12b-1 under the 1940 Act. The Distribution Plan provides that the Portfolio shall pay distribution fees, including payments to the Distributor, at an annual rate of 0.25% of the average daily net assets of Class 2 Shares.
| 18 | JPMORGAN INSURANCE TRUST | DECEMBER 31, 2013 | ||||
Table of Contents
D. Custodian and Accounting Fees — JPMCB provides portfolio custody and accounting services to the Portfolio. The amounts paid directly to JPMCB by the Portfolio for custody and accounting services are included in Custodian and accounting fees in the Statement of Operations. Payments to the custodian may be reduced by credits earned by the Portfolio, based on uninvested cash balances held by the custodian. Such earnings credits, if any, are presented separately in the Statement of Operations.
Interest expense, if any, paid to the custodian related to cash overdrafts is included in Interest expense to affiliates in the Statement of Operations.
E. Waivers and Reimbursements — The Adviser, Administrator (for all class shares) and Distributor (for Class 2 Shares) have contractually agreed to waive fees and/or reimburse the Portfolio to the extent that total annual operating expenses (excluding acquired fund fees and expenses, dividend expenses related to short sales, interest, taxes, expenses related to litigation and potential litigation, extraordinary expenses and expenses related to the Board of Trustees’ deferred compensation plan) exceed the percentages of the Portfolio’s respective average daily net assets as shown in the table below:
| Class 1 | Class 2 | |||||||
| 0.90 | % | 1.15 | % | |||||
The expense limitation agreements were in effect for the year ended December 31, 2013. The contractual expense limitation percentages in the table above are in place until at least April 30, 2014.
For the year ended December 31, 2013, the Portfolio’s service providers waived fees for the Portfolio as follows. None of these parties expect the Portfolio to repay any such waived fees in future years.
| Contractual Waivers | ||||||||||||
| Investment Advisory | Administration | Total | ||||||||||
| $ | 10,639 | $ | 29,578 | $ | 40,217 | |||||||
Additionally, the Portfolio may invest in one or more money market funds advised by the Adviser or its affiliates. The Adviser, Administrator and the Distributor waive fees in an amount sufficient to offset the respective fees each charges to the affiliated money market fund on the Portfolio’s investment in such affiliated money market fund. A portion of the waiver is voluntary.
The amount of waivers resulting from investments in these money market funds for the year ended December 31, 2013 was $1,243.
F. Other — Certain officers of the Trust are affiliated with the Adviser, the Administrator and the Distributor. Such officers, with the exception of the Chief Compliance Officer, receive no compensation from the Portfolio for serving in their respective roles.
The Board of Trustees appointed a Chief Compliance Officer to the Portfolio in accordance with Federal securities regulations. The Portfolio, along with other affiliated portfolios, makes reimbursement payments, on a pro-rata basis, to the Administrator for a portion of the fees associated with the Office of the Chief Compliance Officer. Such fees are included in Trustees’ and Chief Compliance Officer’s fees in the Statement of Operations.
The Trust adopted a Trustee Deferred Compensation Plan (the “Plan”) which allows the Independent Trustees to defer the receipt of all or a portion of compensation related to performance of their duties as Trustees. The deferred fees are invested in various J.P. Morgan Funds until distribution in accordance with the Plan.
During the year ended December 31, 2013, the Portfolio may have purchased securities from an underwriting syndicate in which the principal underwriter or members of the syndicate are affiliated with the Adviser.
The Portfolio may use related party broker-dealers. For the year ended December 31, 2013, the Portfolio did not incur any brokerage commissions with broker-dealers affiliated with the Adviser.
The Securities and Exchange Commission has granted an exemptive order permitting the Portfolio to engage in principal transactions with J.P. Morgan Securities, Inc., an affiliated broker, involving taxable money market instruments, subject to certain conditions.
4. Investment Transactions
During the year ended December 31, 2013, purchases and sales of investments (excluding short-term investments) were as follows:
| Purchases (excluding U.S. Government) | Sales (excluding U.S. Government) | Purchases of U.S. Government | Sales of U.S. Government | |||||||||||||
| $ | 21,589,921 | $ | 29,593,834 | $ | 60,070 | $ | 60,000 | |||||||||
5. Federal Income Tax Matters
For Federal income tax purposes, the cost and unrealized appreciation (depreciation) in value of investment securities held at December 31, 2013 were as follows:
| Aggregate Cost | Gross Unrealized Appreciation | Gross Unrealized Depreciation | Net Unrealized Appreciation (Depreciation) | |||||||||||||
| $ | 29,449,276 | $ | 11,029,132 | $ | 273,202 | $ | 10,755,930 | |||||||||
The difference between book and tax basis appreciation (depreciation) on investments is primarily attributed to wash sale loss deferrals.
| DECEMBER 31, 2013 | JPMORGAN INSURANCE TRUST | 19 | ||||||
Table of Contents
NOTES TO FINANCIAL STATEMENTS
AS OF DECEMBER 31, 2013 (continued)
The tax character of distributions paid during the year ended December 31, 2013 was as follows:
| Total Distributions Paid From: | ||||||||
Ordinary Income | Total Distributions Paid | |||||||
| $ | 431,813 | $ | 431,813 | |||||
The tax character of distributions paid during the year ended December 31, 2012 was as follows:
| Total Distributions Paid From: | ||||||||
Ordinary Income | Total Distributions Paid | |||||||
| $ | 258,020 | $ | 258,020 | |||||
As of December 31, 2013, the components of net assets (excluding paid-in-capital) on a tax basis were as follows:
Current Distributable Ordinary Income | Current Distributable Long-Term Capital Gain or (Tax Basis Capital Loss Carryover) | Unrealized Appreciation (Depreciation) | ||||||||||
| $ | 236,708 | $ | 5,241,428 | $ | 10,755,930 | |||||||
The cumulative timing differences primarily consist of wash sale loss deferrals.
Under the Regulated Investment Company Modernization Act of 2010 (the “Act”), net capital losses recognized by the Portfolio after December 31, 2010 are carried forward indefinitely, and retain their character as short-term and/or long-term losses. Prior to the Act, net capital losses incurred by the Portfolio were carried forward for eight years and treated as short-term losses. The Act requires that post-enactment net capital losses be used before pre-enactment net capital losses.
As of December 31, 2013, the Portfolio did not have any post-enactment net capital loss carryforwards.
As of December 31, 2013, the Portfolio did not have any pre-enactment net capital loss carryforwards.
During the year ended December 31, 2013, the Portfolio utilized capital loss carryforwards in the amount of $2,142,797.
6. Borrowings
The Trust and JPMCB have entered into a financing arrangement. Under this arrangement, JPMCB provides an unsecured, uncommitted credit facility in the aggregate amount of $100 million to certain of the J.P. Morgan Funds, including the Portfolio. Advances under the arrangement are taken primarily for temporary or emergency purposes, including the meeting of redemption requests that otherwise might require the untimely disposition of securities, and are subject to the Portfolio’s borrowing restrictions. Interest on borrowings is payable at a rate determined by JPMCB at the time of borrowing. This agreement has been extended until November 10, 2014.
The Portfolio had no borrowings outstanding from the unsecured, uncommitted credit facility at December 31, 2013, or at any time during the year then ended.
Interest expense paid, if any, as a result of borrowings from the unsecured, uncommitted credit facility is included in Interest expense to affiliates in the Statement of Operations.
7. Risks, Concentrations and Indemnifications
In the normal course of business, the Portfolio enters into contracts that contain a variety of representations which provide general indemnifications. The Portfolio’s maximum exposure under these arrangements is unknown. The amount of exposure would depend on future claims that may be made against the Portfolio that have not yet occurred. However, based on experience, the Portfolio expects the risk of loss to be remote.
The Portfolio has several shareholders holding a significant percentage of shares outstanding. Investment activities of these shareholders could have a material impact on the Portfolio.
| 20 | JPMORGAN INSURANCE TRUST | DECEMBER 31, 2013 | ||||
Table of Contents
REPORT OF INDEPENDENT REGISTERED PUBLIC ACCOUNTING FIRM
To the Board of Trustees of JPMorgan Insurance Trust and the Shareholders of JPMorgan Insurance Trust Intrepid Mid Cap Portfolio:
In our opinion, the accompanying statement of assets and liabilities, including the schedule of portfolio investments, and the related statements of operations and of changes in net assets and the financial highlights present fairly, in all material respects, the financial position of JPMorgan Insurance Trust Intrepid Mid Cap Portfolio (a separate Portfolio of JPMorgan Insurance Trust) (hereafter referred to as the “Portfolio”) at December 31, 2013, the results of its operations for the year then ended, the changes in its net assets for each of the two years in the period then ended and the financial highlights for each of the five years in the period then ended, in conformity with accounting principles generally accepted in the United States of America. These financial statements and financial highlights (hereafter referred to as “financial statements”) are the responsibility of the Portfolio’s management. Our responsibility is to express an opinion on these financial statements based on our audits. We conducted our audits of these financial statements in accordance with the standards of the Public Company Accounting Oversight Board (United States). Those standards require that we plan and perform the audit to obtain reasonable assurance about whether the financial statements are free of material misstatement. An audit includes examining, on a test basis, evidence supporting the amounts and disclosures in the financial statements, assessing the accounting principles used and significant estimates made by management, and evaluating the overall financial statement presentation. We believe that our audits, which included confirmation of securities at December 31, 2013 by correspondence with the custodian and brokers, provide a reasonable basis for our opinion.
PricewaterhouseCoopers LLP
New York, New York
February 21, 2014
| DECEMBER 31, 2013 | JPMORGAN INSURANCE TRUST | 21 | ||||||
Table of Contents
(Unaudited)
The Portfolio’s Statement of Additional Information includes additional information about the Portfolio’s Trustees and is available, without charge, upon request by calling 1-800-480-4111 or on the J.P. Morgan Funds’ website at www.jpmorganfunds.com.
Name (Year of Birth); Positions With the Portfolio (1) | Principal Occupations During Past 5 Years | Number of Portfolios in Fund Complex Overseen by Trustee (2) | Other Directorships Held Outside Fund Complex During Past 5 Years | |||
Independent Trustees | ||||||
| John F. Finn (1947); Trustee of Trust since 2005; Trustee of heritage One Group Mutual Funds since 1998. | Chairman (1985-present), President and Chief Executive Officer, Gardner, Inc. (supply chain management company serving industrial and consumer markets) (1974-present). | 170 | Director, Cardinal Health, Inc. (CAH) (1994-present); Director, Greif, Inc. (GEF) (industrial package products and services) (2007-present); Trustee, Columbus Association for the Performing Arts. | |||
| Dr. Matthew Goldstein (1941); Chairman since 2013; Trustee of Trust since 2005; Trustee of heritage J.P. Morgan Funds since 2003. | Professor, City University of New York (effective 7/1/13); Chancellor, City University of New York (1999-2013); President, Adelphi University (New York) (1998-1999). | 170 | Trustee, Museum of Jewish Heritage (2011-present). | |||
| Robert J. Higgins (1945); Trustee of Trust since 2005; Trustee of heritage J.P. Morgan Funds since 2002. | Retired; Director of Administration of the State of Rhode Island (2003-2004); President — Consumer Banking and Investment Services, Fleet Boston Financial (1971-2001). | 170 | None | |||
| Peter C. Marshall (1942); Trustee of Trust since 2005; Trustee of heritage One Group Mutual Funds since 1985. | Self-employed business consultant (2002-present). | 170 | None | |||
| Mary E. Martinez (1960); Trustee of Trust since 2013. | Associate, Special Properties, a Christie’s International Real Estate Affiliate (2010-Present); Managing Director, Bank of America (Asset Management) (2007-2008); Chief Operating Officer, U.S. Trust Asset Management; U.S. Trust Company (asset management) (2003-2007); President, Excelsior Funds (registered investment companies) (2004-2005). | 170 | None | |||
| Marilyn McCoy* (1948); Trustee of Trust since 2005; Trustee of heritage One Group Mutual Funds since 1999. | Vice President of Administration and Planning, Northwestern University (1985-present). | 170 | Trustee, Carleton College (2003-present). | |||
| Mitchell M. Merin (1953); Trustee of Trust since 2013. | Retired (2005-Present); President and Chief Operating Officer, Morgan Stanley Investment Management, Member Morgan Stanley & Co. Management Committee (registered investment adviser) (1998-2005). | 170 | Director, Sun Life Financial (SLF) (2007 to Present) (financial services and insurance); Trustee, Trinity College, Hartford, CT (2002-2010). | |||
| William G. Morton, Jr. (1937); Trustee of Trust since 2005; Trustee of heritage J.P. Morgan Funds since 2003. | Retired; Chairman Emeritus (2001-2002), and Chairman and Chief Executive Officer, Boston Stock Exchange (1985-2001). | 170 | Director, Radio Shack Corp. (1987-2008); Director, National Organization of Investment Professionals; Trustee of the Stratton Mountain School (2001-present). | |||
| Dr. Robert A. Oden, Jr. (1946); Trustee of Trust since 2005; Trustee of heritage One Group Mutual Funds since 1997. | Retired; President, Carleton College (2002-2010); President, Kenyon College (1995-2002). | 170 | Trustee, American University in Cairo (1999-present); Chairman, Dartmouth-Hitchcock Medical Center (2011-present); Trustee, American Schools of Oriental Research (2011-present); Trustee, American Museum of Fly Fishing. | |||
| 22 | JPMORGAN INSURANCE TRUST | DECEMBER 31, 2013 | ||||
Table of Contents
Name (Year of Birth); Positions With the Portfolio (1) | Principal Occupations During Past 5 Years | Number of Complex Overseen by Trustee (2) | Other Directorships Held Outside Fund Complex During Past 5 Years | |||
Independent Trustees (continued) | ||||||
| Marian U. Pardo** (1946); Trustee of Trust since 2013. | Managing Director and Founder, Virtual Capital Management LLC (Investment Consulting) (2007-present); Managing Director, Credit Suisse Asset Management (portfolio manager) (2003-2006). | 170 | Member, Board of Governors, Columbus Citizens Foundation (not-for-profit supporting philanthropic and cultural programs) (2006-present). | |||
| Frederick W. Ruebeck (1939); Trustee of Trust since 2005; Trustee of heritage One Group Mutual Funds since 1994. | Consultant (2000-present); Adviser, JP Greene & Associates, LLC (broker-dealer) (2000-2009); Chief Investment Officer, Wabash College (2004-present); Director of Investments, Eli Lilly and Company (pharmaceuticals) (1988-1999). | 170 | Trustee, Wabash College (1988-present); Chairman, Indianapolis Symphony Orchestra Foundation (1994-present). | |||
| James J. Schonbachler (1943); Trustee of Trust since 2005; Trustee of heritage J.P. Morgan Funds since 2001. | Retired; Managing Director of Bankers Trust Company (financial services) (1968-1998). | 170 | None | |||
Interested Trustee Not Affiliated With the Adviser | ||||||
| Frankie D. Hughes*** (1952), Trustee of Trust since 2008. | President and Chief Investment Officer, Hughes Capital Management, Inc. (fixed income asset management) (1993-present). | 170 | Trustee, The Victory Portfolios (2000-2008) (investment companies). | |||
| (1) | The Trustees serve for an indefinite term, subject to the Trust’s current retirement policy, which is age 75 for all Trustees, except that the Board has determined Mr. Morton should continue to serve until December 31, 2014. In order to fill the vacancies created by the retirement of Fergus Reid, III, William J. Armstrong, and Leonard J. Spalding Jr., effective December 31, 2012, the Board appointed Ms. Martinez and Mr. Merin to serve as Trustees effective January 1, 2013 and Ms. Pardo to serve as Trustee effective February 1, 2013. |
| (2) | A Fund Complex means two or more registered investment companies that hold themselves out to investors as related companies for purposes of investment and investor services or have a common investment adviser or have an investment adviser that is an affiliated person of the investment adviser of any of the other registered investment companies. The J.P. Morgan Funds Complex for which the Board of Trustees serves currently includes eleven registered investment companies (170 funds), including JPMorgan Mutual Fund Group which liquidated effective November 29, 2012 and is in the process of winding up its affairs. |
| * | Ms. McCoy has served as Vice President of Administration and Planning for Northwestern University since 1985. William M. Daley was the Head of Corporate Responsibility for JPMorgan Chase & Co. prior to January 2011 and served as a member of the Board of Trustees of Northwestern University from 2005 through 2010. JPMIM, the Portfolio’s investment adviser, is a wholly-owned subsidiary of JPMorgan Chase & Co. Two members of the Board of Trustees of Northwestern University are executive officers of registered investment advisers (not affiliated with JPMorgan) that are under common control with sub-advisers to certain J.P. Morgan Funds. |
| ** | In connection with prior employment with JPMorgan Chase, Ms. Pardo is the recipient of non-qualified pension plan payments from JPMorgan Chase in the amount of approximately $2,055 per month, which she irrevocably waived effective January 1, 2013, and deferred compensation payments from JPMorgan Chase in the amount of approximately $7,294 per year, which ended in January 2013. In addition, Ms. Pardo receives payments from a fully funded qualified plan, which is not an obligation of JPMorgan Chase. |
| *** | Ms. Hughes is treated as an “interested person” based on the portfolio holdings of clients of Hughes Capital Management, Inc. |
The contact address for each of the Trustees is 270 Park Avenue, New York, NY 10017.
| DECEMBER 31, 2013 | JPMORGAN INSURANCE TRUST | 23 | ||||||
Table of Contents
(Unaudited)
Name (Year of Birth), Positions Held with the Trust (Since) | Principal Occupations During Past 5 Years | |
Robert L. Young (1963), | Chief Operating Officer and Director, J.P. Morgan Investment Management Inc. since 2010; Senior Vice President, J.P. Morgan Funds (2005-2010), Chief Operating Officer, J.P. Morgan Funds (2005-2010); Director and various officer positions for JPMorgan Funds Management, Inc. (formerly One Group Administrative Services) and JPMorgan Distribution Services, Inc. (formerly One Group Dealer Services, Inc.) from 1999 to present. Mr. Young has been with JPMorgan Chase & Co. (formerly Bank One Corporation) since 1997. | |
| Joy C. Dowd (1972), Treasurer and Principal Financial Officer (2010) | Assistant Treasurer of the Trusts from 2009 to 2010; Executive Director, JPMorgan Funds Management, Inc. from February 2011; Vice President, JPMorgan Funds Management, Inc. from December 2008 to February 2011; prior to joining JPMorgan Chase, Ms. Dowd worked in MetLife’s investments audit group from 2005 through 2008. | |
| Frank J. Nasta (1964), Secretary (2008) | Managing Director and Associate General Counsel, JPMorgan Chase since 2008; Previously, Director, Managing Director, General Counsel and Corporate Secretary, J. & W. Seligman & Co. Incorporated; Secretary of each of the investment companies of the Seligman Group of Funds and Seligman Data Corp.; Director and Corporate Secretary, Seligman Advisors, Inc. and Seligman Services, Inc. | |
| Stephen M. Ungerman (1953), Chief Compliance Officer (2005) | Managing Director, JPMorgan Chase & Co.; Mr. Ungerman has been with JPMorgan Chase & Co. since 2000. | |
Kathryn A. Jackson (1962), | Vice President and AML Compliance Manager for JPMorgan Asset Management Compliance since 2011; Senior On-Boarding Specialist for JPMorgan Distribution Services, Inc. in Global Liquidity from 2008 to 2011; prior to joining JPMorgan, Ms. Jackson was a Financial Services Analyst responsible for on-boarding, compliance and training with Nationwide Securities LLC and 1717 Capital Management Company, both registered broker-dealers, from 2005 until 2008. | |
Elizabeth A. Davin (1964), Assistant Secretary (2005)** | Executive Director and Assistant General Counsel, JPMorgan Chase since February 2012; formerly Vice President and Assistant General Counsel, JPMorgan Chase from 2005 until February 2012; Senior Counsel, JPMorgan Chase (formerly Bank One Corporation) from 2004 to 2005. | |
| Jessica K. Ditullio (1962), Assistant Secretary (2005)** | Executive Director and Assistant General Counsel, JPMorgan Chase since February 2011; Ms. Ditullio has served as an attorney with various titles for JPMorgan Chase (formerly Bank One Corporation) since 1990. | |
| John T. Fitzgerald (1975), Assistant Secretary (2008) | Executive Director and Assistant General Counsel, JPMorgan Chase since February 2011; formerly, Vice President and Assistant General Counsel, JPMorgan Chase from 2005 until February 2011. | |
| Carmine Lekstutis (1980) , Assistant Secretary (2011) | Vice President and Assistant General Counsel, JPMorgan Chase since 2011; Associate, Skadden, Arps, Slate, Meagher & Flom LLP (law firm) from 2006 to 2011. | |
| Gregory S. Samuels (1980) , Assistant Secretary (2010) | Vice President and Assistant General Counsel, JPMorgan Chase since 2010; Associate, Ropes & Gray (law firm) from 2008 to 2010; Associate, Clifford Chance LLP (law firm) from 2005 to 2008. | |
| Pamela L. Woodley (1971), Assistant Secretary (2012) | Vice President and Assistant General Counsel, JPMorgan Chase since November 2004. | |
Michael M. D’Ambrosio (1969), Assistant Treasurer (2012) | Executive Director, JPMorgan Funds Management, Inc. from July 2012; prior to joining JPMorgan Chase, Mr. D’Ambrosio was a Tax Director at PricewaterhouseCoopers LLP since 2006. | |
| Joseph Parascondola (1963), Assistant Treasurer (2011) | Vice President, JPMorgan Funds Management, Inc. since August 2006. | |
| Matthew J. Plastina (1970), Assistant Treasurer (2011) | Vice President, JPMorgan Funds Management, Inc. since August 2010; prior to August 2010, Vice President and Controller, Legg Mason Global Asset Management. | |
Julie A. Roach (1971), Assistant Treasurer (2012)** | Vice President, JPMorgan Funds Management, Inc. from August 2012; prior to joining JPMorgan Chase, Ms. Roach was a Senior Manager with Deloitte since 2001. | |
Gillian I. Sands (1969), Assistant Treasurer (2012) | Vice President, JPMorgan Funds Management, Inc. from September 2012; Assistant Treasurer, Wells Fargo Funds Management (2007-2009). | |
The contact address for each of the officers, unless otherwise noted, is 270 Park Avenue, New York, NY 10017.
| * | The contact address for the officer is 500 Stanton Christiana Road, Ops 1, Floor 02, Newark, DE 19173-2107. |
| ** | The contact address for the officer is 460 Polaris Parkway, Westerville, OH 43082. |
| 24 | JPMORGAN INSURANCE TRUST | DECEMBER 31, 2013 | ||||
Table of Contents
SCHEDULE OF SHAREHOLDER EXPENSES
(Unaudited)
Hypothetical $1,000 Investment
As a shareholder of the Portfolio, you incur ongoing costs, including investment advisory fees, administration fees, distribution fees (for Class 2 Shares) and other Portfolio expenses. Because the Portfolio is a funding vehicle for Policies and Eligible Plans, you may also incur sales charges and other fees relating to the Policies or Eligible Plans. The examples below are intended to help you understand your ongoing costs (in dollars) of investing in the Portfolio, but not the costs of the Policies or Eligible Plans, and to compare these ongoing costs with the ongoing costs of investing in other mutual funds. The examples assume that you had a $1,000 investment in each Class at the beginning of the reporting period, July 1, 2013, and continued to hold your shares at the end of the reporting period, December 31, 2013.
Actual Expenses
For each Class of the Portfolio in the table below, the first line provides information about actual account values and actual expenses. You may use the information in this line, together with the amount you invested, to estimate the expenses that you paid over the period. Simply divide your account value by $1,000 (for example, an $8,600 account value divided by $1,000 = 8.6), then multiply the result by the number in the first line of each Class under the heading entitled “Expenses Paid During the Period” to estimate the expenses you paid on your account during this period.
Hypothetical Example for Comparison Purposes
The second line of each Class in the table below provides information about hypothetical account values and hypothetical expenses based on the Class’ actual expense ratio and an assumed rate of return of 5% per year before expenses, which is not the Class’ actual return. The hypothetical account values and expenses may not be used to estimate the actual ending account balance or expenses you paid for the period. You may use this information to compare the ongoing costs of investing in the Class of the Portfolio and other funds. To do so, compare this 5% hypothetical example with the 5% hypothetical examples that appear in the shareholder reports of the other funds. Please note that the expenses shown in the table are meant to highlight your ongoing costs only and do not reflect any transaction costs, such as sales charges (loads) or redemption fees or the costs associated with the Policies and Eligible Plans through which the Portfolio is held. Therefore, the second line for each Class in the table is useful in comparing ongoing costs only, and will not help you determine the relative total costs of owning different funds. In addition, if these transaction costs were included, your costs would have been higher. The examples also assume all dividends and distributions have been reinvested.
Expense Example
| Beginning Account Value July 1, 2013 | Ending Account Value December 31, 2013 | Expenses Paid During the Period* | Annualized Expense Ratio | |||||||||||||
Intrepid Mid Cap Portfolio | ||||||||||||||||
Class 1 | ||||||||||||||||
Actual | $ | 1,000.00 | $ | 1,194.70 | $ | 4.92 | 0.89 | % | ||||||||
Hypothetical | 1,000.00 | 1,020.72 | 4.53 | 0.89 | ||||||||||||
Class 2 | ||||||||||||||||
Actual | 1,000.00 | 1,192.90 | 6.30 | 1.14 | ||||||||||||
Hypothetical | 1,000.00 | 1,019.46 | 5.80 | 1.14 | ||||||||||||
| * | Expenses are equal to each Class’ respective annualized expense ratio, multiplied by the average account value over the period, multiplied by 184/365 (to reflect the one-half year period). |
| DECEMBER 31, 2013 | JPMORGAN INSURANCE TRUST | 25 | ||||||
Table of Contents
BOARD APPROVAL OF INVESTMENT ADVISORY AGREEMENT
(Unaudited)
The Board of Trustees meets regularly throughout the year and considers factors that are relevant to its annual consideration of investment advisory agreements at each meeting. The Board of Trustees has established various standing committees, composed of Trustees with diverse backgrounds, to which the Board of Trustees has assigned specific subject matter responsibilities to further enhance the effectiveness of the Board’s oversight and decision making. The Board of Trustees and its investment committees (money market and alternative products, equity, and fixed income) also meet for the specific purpose of considering advisory contract annual renewals. The Board of Trustees held meetings in person in June and August 2013, at which the Trustees considered the continuation of the investment advisory agreement for the Portfolio whose annual report is contained herein (the “Advisory Agreement”). At the June meeting, the Board’s investment committees met to review and consider performance, expense and related information for the J.P. Morgan Funds. Each investment committee reported to the full Board, which then considered the investment subcommittee’s preliminary findings. At the August meeting, the Trustees continued their review and consideration. The Trustees, including a majority of the Trustees who are not “interested persons” (as defined in the 1940 Act) of any party to the Advisory Agreement or any of their affiliates, approved the continuation of the Advisory Agreement on August 20, 2013.
The Trustees, as part of their review of the investment advisory arrangements for the J.P. Morgan Funds, considered and reviewed performance and other information received from the Adviser on a regular basis over the course of the year, as well as information specifically prepared for their annual review. This information included the Portfolio’s performance compared to the performance of the Portfolio’s peers and benchmarks and analyses by the Adviser of the Portfolio’s performance. The Adviser also periodically provides comparative information regarding the Portfolio’s expense ratios and those of the peer groups. In addition, in preparation for the June and August meetings, the Trustees requested, received and evaluated extensive materials from the Adviser, including, with respect to the Portfolio, performance and expense information compiled by Lipper Inc. (“Lipper”), an independent provider of investment company data. Prior to voting, the Trustees reviewed the proposed approval of the Advisory Agreement with representatives of the Adviser and with counsels to the Portfolio and independent Trustees and received a memorandum from independent counsel to the Trustees discussing the legal standards for their consideration of the proposed approval. The Trustees also discussed the proposed approvals in executive sessions with counsels to the Portfolio and independent Trustees at which no representatives of the Adviser were present. Set forth below is a summary of the material factors evaluated by the Trustees in determining whether to approve the Advisory Agreement.
In their deliberations, there was a comprehensive consideration of the information received by the Trustees. Each Trustee attributed different weights to the various factors and no factor alone was considered determinative. From year to year, the Trustees consider and place emphasis on relevant information in light of changing circumstances in market and economic conditions. The Trustees determined that the compensation to be received by the Adviser from the Portfolio under the Advisory Agreement was fair and reasonable and that the continuance of the investment advisory contract was in the best interests of the Portfolio and its shareholders.
The factors summarized below were considered and discussed by the Trustees in reaching their conclusions:
Nature, Extent and Quality of Services Provided by the Adviser
The Trustees received and considered information regarding the nature, extent and quality of the services provided to the Portfolio under the Advisory Agreement. The Trustees took into account information furnished throughout the year at Trustee meetings, as well as the materials furnished specifically in connection with this annual review process. The Trustees considered the background and experience of the Adviser’s senior management and the expertise of, and the amount of attention given to the Portfolio by, investment personnel of the Adviser. In addition, the Trustees reviewed the qualifications, backgrounds and responsibilities of the portfolio management team primarily responsible for the day-to-day management of the Portfolio and the infrastructure supporting the team. The Trustees also considered information provided by the Adviser and JPMorgan Distribution Services, Inc. (“JPMDS”) about the structure and distribution strategy of the Portfolio. The Trustees also reviewed information relating to the Adviser’s risk governance model and reports showing the Adviser’s compliance structure and ongoing compliance processes. The quality of the administrative services provided by JPMorgan Funds Management, Inc. (“JPMFM”), an affiliate of the Adviser, was also considered.
The Board of Trustees also considered its knowledge of the nature and quality of the services provided by the Adviser to the Portfolio gained from their experience as Trustees of the J.P. Morgan Funds. In addition, they considered the overall reputation and capabilities of the Adviser and its affiliates, the commitment of the Adviser to provide high quality service to the Portfolio, their overall confidence in the Adviser’s integrity and the Adviser’s responsiveness to questions or concerns raised by them, including the Adviser’s willingness to consider and implement organizational and operational changes designed to improve investment results and the services provided to the Portfolio.
Based on these considerations and other factors, the Trustees concluded that they were satisfied with the nature, extent and
| 26 | JPMORGAN INSURANCE TRUST | DECEMBER 31, 2013 | ||||
Table of Contents
quality of the investment advisory services provided to the Portfolio by the Adviser.
Costs of Services Provided and Profitability to the Adviser and its Affiliates
The Trustees received and considered information regarding the profitability to the Adviser and its affiliates in providing services to the Portfolio. The Trustees reviewed and discussed this data. The Trustees recognized that this data is not audited and represents the Adviser’s determination of its and its affiliates’ revenues from the contractual services provided to the Portfolio, less expenses of providing such services. Expenses include direct and indirect costs and are calculated using an allocation methodology developed by the Adviser. The Trustees also recognized that it is difficult to make comparisons of profitability from fund investment advisory contracts because comparative information is not generally publicly available and is affected by numerous factors, including the structure of the particular adviser, the types of funds it manages, its business mix, numerous assumptions regarding allocations and the fact that publicly-traded fund managers’ operating profits and net income are net of distribution and marketing expenses. Based on their review, the Trustees concluded that the profitability to the Adviser under the Advisory Agreement was not unreasonable in light of the services and benefits provided to the Portfolio.
Fall-Out Benefits
The Trustees reviewed information regarding potential “fallout” or ancillary benefits received by the Adviser and its affiliates as a result of their relationship with the Portfolio. The Board also reviewed the adviser’s allocation of fund brokerage for the J.P. Morgan Funds complex, including allocations to brokers who provide research to the adviser.
The Trustees also considered that JPMFM earns fees from the Portfolio for providing administrative services. These fees were shown separately in the profitability analysis presented to the Trustees. The Trustees also considered the payments of Rule 12b-1 fees to JPMDS, an affiliate of the Adviser, which also acts as the Portfolio’s distributor and that these fees are in turn generally paid to financial intermediaries that sell the Portfolio, including financial intermediaries that are affiliates of the Adviser. The Trustees also considered the fees paid to JPMorgan Chase Bank, N.A. (“JPMCB”) for custody and fund accounting and other related services.
Economies of Scale
The Trustees noted that the proposed investment advisory fee schedule for the Portfolio does not contain breakpoints. The Trustees considered whether it would be appropriate to add advisory fee breakpoints and the Trustees concluded that the current fee structure was reasonable in light of the fee waivers
and expense limitations that the Adviser has in place that serve to limit the overall net expense ratio at competitive levels. The Trustees also recognized that the fee schedule for the administrative services provided by JPMFM does include a fee breakpoint, which is tied to the overall level of non-money market fund assets excluding certain funds-of-funds, as applicable, advised by the Adviser, and that the Portfolio benefits from that breakpoint. The Trustees concluded that shareholders benefited from the lower expense ratios which resulted from these factors.
Independent Written Evaluation of the Portfolio’s Chief Compliance Officer
The Trustees noted that, upon their direction, the Chief Compliance Officer for the Portfolio had prepared an independent written evaluation in order to assist the Trustees in determining the reasonableness of the proposed management fees. The Trustees considered the written evaluation in determining whether to continue the Advisory Agreement.
Fees Relative to Adviser’s Other Clients
The Trustees received and considered information about the nature and extent of investment advisory services and fee rates offered to other clients of the Adviser for investment management styles substantially similar to that of the Portfolio. The Trustees also considered the complexity of investment management for the Portfolio relative to the Adviser’s other clients and the differences in the nature and extent of the services provided to the different clients. The Trustees concluded that the fee rates charged to the Portfolio in comparison to those charged to the Adviser’s other clients were reasonable.
Investment Performance
The Trustees received and considered absolute and/or relative performance for the Portfolio in a report prepared by Lipper. The Trustees considered the total return performance information, which included the ranking of the Portfolio within a performance universe made up of funds with the same Lipper investment classification and objective (the “Universe Group”) by total return for applicable one-, three- and five-year periods. The Trustees reviewed a description of Lipper’s methodology for selecting mutual funds in the Portfolio’s Universe Group. The Lipper materials provided to the Trustees highlighted information with respect to a representative class to assist the Trustees in their review. As part of this review, the Trustees also reviewed the Portfolio’s performance against its benchmark and considered the performance information provided for the Portfolio at regular Board meetings by the Adviser. The Lipper performance data noted by the Trustees as part of their review and the determinations made by the Trustees with respect to the Portfolio’s performance are summarized below:
The Trustees noted the Portfolio’s performance was in the fourth, fifth, and fourth quintiles for Class 1 shares for the one-,
| DECEMBER 31, 2013 | JPMORGAN INSURANCE TRUST | 27 | ||||||
Table of Contents
BOARD APPROVAL OF INVESTMENT ADVISORY AGREEMENT
(Unaudited) (continued)
three-, and five-year periods ended December 31, 2012, respectively. The Trustees discussed the performance and investment strategy of the Portfolio with the Adviser and, based upon this discussion and various other factors, concluded that the performance was reasonable.
Advisory Fees and Expense Ratios
The Trustees considered the contractual advisory fee rate paid by the Portfolio to the Adviser and compared that rate to the information prepared by Lipper concerning management fee rates paid by other funds in the same Lipper category as the Portfolio. The Trustees recognized that Lipper reported the Portfolio’s management fee rate as the combined contractual advisory fee and administration fee rates. The Trustees also reviewed information about other expenses and the expense
ratios for the Portfolio. The Trustees considered the fee waiver and/or expense reimbursement arrangements currently in place for the Portfolio and considered the net advisory fee rate after taking into account any waivers and/or reimbursements. The Trustees recognized that it is difficult to make comparisons of advisory fees because there are variations in the services that are included in the fees paid by other funds. The Trustees’ determinations as a result of the review of the Portfolio’s advisory fees and expense ratios are summarized below:
The Trustees noted that the Portfolio’s net advisory fee and actual total expenses for Class 1 shares were in the first and second quintiles, respectively, of their Universe Group. After considering the factors identified above, in light of this information, the Trustees concluded that the advisory fee was reasonable.
| 28 | JPMORGAN INSURANCE TRUST | DECEMBER 31, 2013 | ||||
Table of Contents
(Unaudited)
Certain tax information for the Portfolio is required to be provided to shareholders based upon the Portfolio’s income and distributions for the taxable year ended December 31, 2013. The information and distributions reported in this letter may differ from the information and taxable distributions reported to the shareholders for the calendar year ending December 31, 2013. The information necessary to complete your income tax returns for the calendar year ending December 31, 2013 will be provided under separate cover.
Dividends Received Deductions (DRD)
The Portfolio hereby designates 100% or the maximum allowable percentage as ordinary income distributions eligible for the 70% dividend received deduction for corporate rate shareholders for the fiscal year ended December 31, 2013.
| DECEMBER 31, 2013 | JPMORGAN INSURANCE TRUST | 29 | ||||||
Table of Contents
J.P. Morgan Funds are distributed by JPMorgan Distribution Services, Inc., which is an affiliate of JPMorgan Chase & Co. Affiliates of JPMorgan Chase & Co. receive fees for providing various services to the funds.
Contact JPMorgan Distribution Services, Inc. at 1-800-480-4111 for a portfolio prospectus. You can also visit us at www.jpmorganfunds.com. Investors should carefully consider the investment objectives and risk as well as charges and expenses of the mutual fund before investing. The prospectus contains this and other information about the mutual fund. Read the prospectus carefully before investing.
The Portfolio files a complete schedule of its portfolio holdings for the first and third quarters of its fiscal year with the SEC on Form N-Q. The Portfolio’s Forms N-Q are available on the SEC’s website at http://www.sec.gov and may be reviewed and copied at the SEC’s Public Reference Room in Washington, DC. Information on the operation of the SEC’s Public Reference Room may be obtained by calling 1-800-SEC-0330. Shareholders may request the Form N-Q without charge by calling 1-800-480-4111 or by visiting the variable insurance portfolio section of the J.P. Morgan Funds’ website at www.jpmorganfunds.com.
A description of the Portfolio’s policies and procedures with respect to the disclosure of the Portfolio’s holdings is available in the prospectus and Statement of Additional Information.
A copy of proxy policies and procedures is available without charge upon request by calling 1-800-480-4111 and on the Portfolio’s website at www.jpmorganfunds.com. A description of such policies and procedures is on the SEC’s website at www.sec.gov. The Trustees have delegated the authority to vote proxies for securities owned by the Portfolio to the Adviser. A copy of the Portfolio’s voting record for the most recent 12-month period ended June 30 is available on the SEC’s website at www.sec.gov or at the Portfolio’s website at www.jpmorganfunds.com no later than August 31 of each year. The Portfolio’s proxy voting record will include, among other things, a brief description of the matter voted on for each portfolio security, and will state how each vote was cast, for example, for or against the proposal.
Table of Contents
| © JPMorgan Chase & Co., 2014. All rights reserved. December 2013. | AN-JPMITIMCP-1213 |
Table of Contents
Annual Report
JPMorgan Insurance Trust
December 31, 2013
JPMorgan Insurance Trust Mid Cap Growth Portfolio
NOT FDIC INSURED Ÿ NO BANK GUARANTEE Ÿ MAY LOSE VALUE
|  |
Table of Contents
Investments in the Portfolio are not bank deposits or obligations of, or guaranteed or endorsed by, any bank and are not insured or guaranteed by the FDIC, the Federal Reserve Board or any other government agency. You could lose money if you sell when the Portfolio’s share price is lower than when you invested.
Past performance is no guarantee of future performance. The general market views expressed in this report are opinions based on market and other conditions through the end of the reporting period and are subject to change without notice. These views are not intended to predict the future performance of the Portfolio or the securities markets. References to specific securities and their issuers are for illustrative purposes only and are not intended to be, and should not be interpreted as, recommendations to purchase or sell such securities. Such views are not meant as investment advice and may not be relied on as an indication of trading intent on behalf of the Portfolio.
This Portfolio is intended to be a funding vehicle for variable annuity contracts and variable life insurance policies (collectively “Policies”) offered by separate accounts of participating insurance companies. Portfolio shares are also offered through qualified pension and retirement plans (“Eligible Plans”). Individuals may not purchase shares directly from the Portfolio.
Prospective investors should refer to the Portfolio’s prospectus for a discussion of the Portfolio’s investment objective, strategies and risks. Call J.P. Morgan Funds Service Center at 1-800-480-4111 for a prospectus containing more complete information about the Portfolio, including management fees and other expenses. Please read it carefully before investing.
Table of Contents
JANUARY 23, 2014 (Unaudited)
Dear Shareholder,
Equities markets in developed economies performed strongly in the face of periodic spikes in volatility throughout the twelve months ended December 31, 2013. Healthy corporate earnings and incremental but steady improvements in a range of economic indicators provided a positive backdrop for investors seeking returns in the low interest rate environment. While political discord in Washington injected volatility into the market, a bipartisan budget agreement at the end of the year relieved much of the political uncertainty created by partisan brinkmanship over the so-called fiscal cliff and the partial shutdown of the federal government in October. In the first half of the year, the U.S. Federal Reserve (“Fed”) announced its intention to taper off its $85 billion in monthly asset purchases and the statement weakened investor sentiment and set off widespread speculation about the timing and magnitude of such a move. The Fed followed through in December, deciding to reduce its monthly purchases by $10 billion. The news, along with robust gains in jobs, housing and consumer sentiment, drove U.S. equities to new highs. The S&P 500 stock index hit seven closing highs in the final month of the reporting period, finishing 2013 with its best performance since 1997.
 |
“While a repeat of the equity performance we experienced in 2013 may be a tall order, we believe stocks in the U.S. and Europe may continue to show gains.” |
Overseas, the European Central Bank reaffirmed its commitment to accommodative monetary policy and to the euro itself. In the second quarter of the year, the European Union (EU) returned to positive growth and at the end of the year, Ireland became the first nation to exit from its European Union bailout program. The Fed’s decision to curb its asset purchases also sent equities higher in Europe, as investors viewed the move as a sign of further economic stability. In Japan, equity markets rebounded to their best year since 1988, benefitting from Prime Minister Shinzo Abe’s efforts to revive the economy. Low returns on bonds and short-term debt instruments also drove investors into stocks.
Emerging market equities were weaker overall. As of December 31, 2013, the MSCI Emerging Markets Index returned -2.3% for the year. China’s economy showed signs of slower growth during the year and the Fed’s decision to taper its asset purchase program set off speculation that the maturation of the emerging markets credit cycle would push yield-seeking investors to rotate into developed markets.
Taper Talk Pressures Bonds
Fixed income markets generally remained weak during the year, as central bankers across the globe held interest rates at historic lows. However, benchmark bond yields rose on an
annual basis for the first time since 2009. During the year, the Fed’s talk of tapering off its Quantitative Easing (QE) program hurt fixed income markets. U.S. Treasury security yields continued to be low from a historical perspective, but ended the period higher. The yield for 10-year U.S. Treasury securities ended December 31, 2013 at 3.04%, while the yields for 2- and 30-year U.S. Treasury securities finished the reporting period at 0.38% and 3.96%, respectively. High-yield debt returned 7.4% for the year, as measured by the Barclays US High Yield Corporate Index, while other U.S. debt securities and emerging market debt both had negative returns.
While global economic growth accelerated during the year, the U.S. recovery in particular showed stronger fundamentals and the Fed’s decision to taper its QE program was a response to the improved picture. Europe emerged from its lengthy recession and the worst of the fiscal crises seem to be behind it, though unemployment remains strikingly high in many EU nations. Japan made progress toward ending persistent deflation, but Tokyo’s monetary and fiscal stimulus has sharply weakened the yen, putting other Asian exporting nations —notably China and South Korea — at a competitive disadvantage. Emerging market economies may face further headwinds as foreign investment shrinks and economic growth moderates from recent strength. Moreover, political instability — already apparent in Thailand and Turkey — may surface in other emerging market nations as governments struggle to deliver improved living standards and respond to demands for political reforms.
The Long-Term Lens
We welcome the Fed’s move to curb its QE program as a sign that the U.S. economy’s need for artificial stimulus is waning. While a repeat of the equity performance we experienced in 2013 may be a tall order, we believe stocks in the U.S. and Europe may continue to show gains. In the fixed-income market, persistent weakness has led to attractive valuations in some sectors. The past year’s market swings and intermittent volatility underlined the importance of maintaining a long-term view of your investment portfolio and the benefits derived from diversified holdings.
On behalf of everyone at J.P. Morgan Asset Management, thank you for your continued support. We look forward to managing your investment needs for years to come. Should you have any questions, please visit www.jpmorganfunds.com or contact the J.P. Morgan Funds Service Center at 1-800-480-4111.
Sincerely yours,

George C.W. Gatch
CEO, Global Funds Management
J.P. Morgan Asset Management
| DECEMBER 31, 2013 | JPMORGAN INSURANCE TRUST | 1 | ||||||
Table of Contents
JPMorgan Insurance Trust Mid Cap Growth Portfolio
TWELVE MONTHS ENDED DECEMBER 31, 2013 (Unaudited)
| REPORTING PERIOD RETURN: | ||||
| Portfolio (Class 1 Shares)* | 43.30% | |||
| Russell Midcap Growth Index | 35.74% | |||
| Net Assets as of 12/31/2013 | $ | 55,724,628 | ||
INVESTMENT OBJECTIVE**
The JPMorgan Insurance Trust Mid Cap Growth Portfolio (the “Portfolio”) seeks capital growth over the long term.
HOW DID THE MARKET PERFORM?
Overall, the U.S. equity market performed strongly during the 12 months ended December 31, 2013, as a tepid economic recovery continued to gain strength from healthy corporate earnings, along with improvements in employment, housing and consumer sentiment. The Russell Midcap Growth Index (the “Benchmark”) retreated at mid-year amid investor uncertainty about the U.S. Federal Reserve Board’s (“Fed”) intent to taper off its monthly purchases of $85 billion in Treasuries and mortgage-backed securities. Interest rates rose sharply higher, pressuring prices for both stocks and bonds. Partisan brinkmanship in Washington added to the uncertainty, starting with the standoff over the so-called fiscal cliff in January and followed by the partial shutdown of the federal government in October. A bipartisan budget agreement toward the end of the year relieved some of the political uncertainty. During the year, U.S. unemployment claims fell from 7.9% in January to 6.7%, with slight upticks in joblessness at midyear and in October. Adding to the positive trend were advances in housing prices and auto sales in the second half of the year, and a rebound in consumer sentiment to a five-month high in December. The Benchmark finished the 12 months ended December 31, 2013 with a 35.74% gain.
WHAT WERE THE MAIN DRIVERS OF THE PORTFOLIO’S PERFORMANCE?
The Portfolio (Class 1 Shares) outperformed the Benchmark for the twelve months ended December 31, 2013. The Portfolio’s stock selection in the financial services and health care sectors was the main contributor to relative performance, while stock selection in the energy and consumer discretionary sectors was the main detractor from relative performance.
Individual contributors to relative performance included the Portfolio’s positions in Fleetcor Technologies Inc., Tesla Motors Inc. and Valeant Pharmaceuticals International Inc. Shares of Fleetcor, a provider of specialized commercial payment products, rose on the back of strong organic growth. Shares of Tesla, a maker of electric vehicles and electric powertrain components, gained on earnings growth and a reaffirmation of a five-star safety rating from U.S. regulators for its Model S car. Valeant, a specialty drug maker, was rewarded for solid execution on its strategy of achieving highly diversified organic growth and realizing operational synergies from acquisitions.
Individual detractors from the Portfolio’s relative performance included the Portfolio’s positions in Urban Outfitters Inc., Aruba Networks Inc. and Netflix Inc. Shares of Urban Outfitters, a chain of clothing stores, were pressured by fashion stumbles and competition from so-called fast fashion discount chains. Shares of Aruba Networks, a provider of mobile network access technology, fell after the company posted widening losses amid higher operating costs and increase competition. Shares of Netflix, an Internet subscription provider of movies and TV programs, rose sharply during the year, but the Portfolio’s underweight position detracted from relative performance.
HOW WAS THE PORTFOLIO POSITIONED?
The portfolio managers utilized a bottom-up approach to stock selection, rigorously researching individual companies in an effort to construct portfolios of stocks that have strong fundamentals. The portfolio managers preferred to invest in high quality companies with durable franchises that, in their view, possessed the ability to generate strong future earnings growth.
As a result of this bottom-up stock selection process, the Portfolio’s largest overweight position versus the Benchmark was in the producer durables sector and the Portfolio’s largest underweight position versus the Benchmark was in the consumer staples sector.
| 2 | JPMORGAN INSURANCE TRUST | DECEMBER 31, 2013 | ||||
Table of Contents
| TOP TEN EQUITY HOLDINGS OF THE PORTFOLIO*** | ||||||||
| 1. | Harley-Davidson, Inc. | 2.6 | % | |||||
| 2. | Alliance Data Systems Corp. | 2.0 | ||||||
| 3. | Flowserve Corp. | 1.8 | ||||||
| 4. | Pall Corp. | 1.8 | ||||||
| 5. | Illumina, Inc. | 1.7 | ||||||
| 6. | Affiliated Managers Group, Inc. | 1.7 | ||||||
| 7. | Michael Kors Holdings Ltd. (Hong Kong) | 1.7 | ||||||
| 8. | Moody’s Corp. | 1.7 | ||||||
| 9. | Agilent Technologies, Inc. | 1.7 | ||||||
| 10. | Acuity Brands, Inc. | 1.6 | ||||||
PORTFOLIO COMPOSITION BY SECTOR*** | ||||
| Consumer Discretionary | 23.5 | % | ||
| Industrials | 22.1 | |||
| Information Technology | 18.9 | |||
| Health Care | 13.8 | |||
| Financials | 11.8 | |||
| Energy | 4.7 | |||
| Materials | 2.1 | |||
| Short-Term Investment | 3.1 | |||
| * | The return shown is based on net asset values calculated for shareholder transactions and may differ from the return shown in the financial highlights, which reflects adjustments made to the net asset values in accordance with accounting principles generally accepted in the United States of America. |
| ** | The adviser seeks to achieve the Portfolio’s objective. There can be no guarantee it will be achieved. |
| *** | Percentages indicated are based on total investments as of December 31, 2013. The Portfolio’s composition is subject to change. |
| DECEMBER 31, 2013 | JPMORGAN INSURANCE TRUST | 3 | ||||||
Table of Contents
JPMorgan Insurance Trust Mid Cap Growth Portfolio
PORTFOLIO COMMENTARY
TWELVE MONTHS ENDED DECEMBER 31, 2013 (Unaudited) (continued)
AVERAGE ANNUAL TOTAL RETURNS AS OF DECEMBER 31, 2013 | ||||||||||||||||
| INCEPTION DATE OF CLASS | 1 YEAR | 5 YEAR | 10 YEAR | |||||||||||||
CLASS 1 SHARES | 8/1/94 | 43.30 | % | 22.92 | % | 9.93 | % | |||||||||
CLASS 2 SHARES | 8/16/06 | 43.02 | 22.62 | 9.73 | ||||||||||||
TEN YEAR PERFORMANCE (12/31/03 TO 12/31/13)
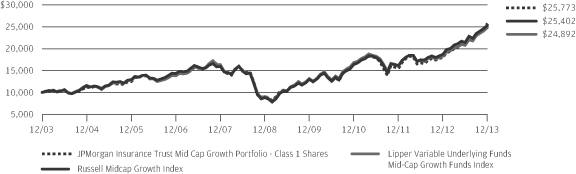
The performance quoted is past performance and is not a guarantee of future results. Mutual funds are subject to certain market risks. Investment returns and principal value of an investment will fluctuate so that an investor’s shares, when redeemed, may be worth more or less than their original cost. Current performance may be higher or lower than the performance data shown. For up-to-date month-end performance information please call 1-800-480-4111.
Returns for Class 2 Shares prior to its inception date are based on the performance of Class 1 Shares. The actual returns of Class 2 Shares would have been lower than those shown because Class 2 Shares have higher expenses than Class 1 Shares.
The graph illustrates comparative performance for $10,000 invested in Class 1 Shares of the JPMorgan Insurance Trust Mid Cap Growth Portfolio, the Russell Midcap Growth Index and the Lipper Variable Underlying Funds Mid-Cap Growth Funds Index from December 31, 2003 to December 31, 2013. The performance of the Portfolio assumes reinvestment of all dividends and capital gains distributions, if any. The performance of the Russell Midcap Growth Index does not reflect the deduction of expenses associated with a mutual fund and has been adjusted to reflect reinvestment of all dividends and capital gains distributions of the securities included in the benchmark, if applicable. The performance of
the Lipper Variable Underlying Funds Mid-Cap Growth Funds Index includes expenses associated with a mutual fund, such as investment management fees. These expenses are not identical to the expenses incurred by the Portfolio. The Russell Midcap Growth Index is an unmanaged index which measures the performance of those Russell Midcap companies with higher price-to-book ratios and higher forecasted growth values. The Lipper Variable Underlying Funds Mid-Cap Growth Funds Index is an index based on the total returns of certain mutual funds within the Portfolio’s designated category as determined by Lipper, Inc. Investors cannot invest directly in an index.
Portfolio performance does not reflect any charges imposed by the Policies or Eligible Plans. If these charges were included, the returns would be lower than shown. Portfolio performance may reflect the waiver of the Portfolio’s fees and reimbursement of expenses for certain periods since the inception date. Without these waivers and reimbursements, performance would have been lower.
The returns shown are based on net asset values calculated for shareholder transactions and may differ from the returns shown in the financial highlights, which reflect adjustments made to the net asset values in accordance with accounting principles generally accepted in the United States of America.
| 4 | JPMORGAN INSURANCE TRUST | DECEMBER 31, 2013 | ||||
Table of Contents
JPMorgan Insurance Trust Mid Cap Growth Portfolio
SCHEDULE OF PORTFOLIO INVESTMENTS
AS OF DECEMBER 31, 2013
| SHARES | SECURITY DESCRIPTION | VALUE($) | ||||||
| Common Stocks — 97.1% |
| ||||||
Consumer Discretionary — 23.5% |
| |||||||
Auto Components — 1.0% |
| |||||||
| 10,000 | BorgWarner, Inc. | 559,100 | ||||||
|
| |||||||
Automobiles — 3.4% |
| |||||||
| 21,200 | Harley-Davidson, Inc. | 1,467,888 | ||||||
| 3,050 | Tesla Motors, Inc. (a) | 458,659 | ||||||
|
| |||||||
| 1,926,547 | ||||||||
|
| |||||||
Hotels, Restaurants & Leisure — 4.1% |
| |||||||
| 610 | Chipotle Mexican Grill, Inc. (a) | 324,996 | ||||||
| 19,800 | Hilton Worldwide Holdings, Inc. (a) | 440,550 | ||||||
| 14,900 | Norwegian Cruise Line Holdings Ltd. (a) | 528,503 | ||||||
| 2,300 | Panera Bread Co., Class A (a) | 406,387 | ||||||
| 3,090 | Wynn Resorts Ltd. | 600,109 | ||||||
|
| |||||||
| 2,300,545 | ||||||||
|
| |||||||
Household Durables — 1.4% |
| |||||||
| 5,125 | Mohawk Industries, Inc. (a) | 763,113 | ||||||
|
| |||||||
Internet & Catalog Retail — 1.3% |
| |||||||
| 1,960 | Netflix, Inc. (a) | 721,613 | ||||||
|
| |||||||
Media — 1.2% |
| |||||||
| 7,200 | Discovery Communications, Inc., Class A (a) | 651,024 | ||||||
|
| |||||||
Specialty Retail — 7.7% |
| |||||||
| 5,100 | Advance Auto Parts, Inc. | 564,468 | ||||||
| 15,200 | GameStop Corp., Class A | 748,752 | ||||||
| 5,200 | O’Reilly Automotive, Inc. (a) | 669,292 | ||||||
| 9,100 | Ross Stores, Inc. | 681,863 | ||||||
| 8,750 | Signet Jewelers Ltd., (Bermuda) | 688,625 | ||||||
| 11,000 | Urban Outfitters, Inc. (a) | 408,100 | ||||||
| 9,200 | Williams-Sonoma, Inc. | 536,176 | ||||||
|
| |||||||
| 4,297,276 | ||||||||
|
| |||||||
Textiles, Apparel & Luxury Goods — 3.4% |
| |||||||
| 9,550 | Lululemon Athletica, Inc., (Canada) (a) | 563,736 | ||||||
| 11,800 | Michael Kors Holdings Ltd., (Hong Kong) (a) | 958,042 | ||||||
| 4,350 | Under Armour, Inc., Class A (a) | 379,755 | ||||||
|
| |||||||
| 1,901,533 | ||||||||
|
| |||||||
Total Consumer Discretionary | 13,120,751 | |||||||
|
| |||||||
Energy — 4.7% |
| |||||||
Energy Equipment & Services — 0.8% |
| |||||||
| 15,850 | Frank’s International N.V., (Netherlands) | 427,950 | ||||||
|
| |||||||
Oil, Gas & Consumable Fuels — 3.9% |
| |||||||
| 5,600 | Antero Resources Corp. (a) | 355,264 | ||||||
| 17,700 | Cabot Oil & Gas Corp. | 686,052 | ||||||
| 5,800 | Concho Resources, Inc. (a) | 626,400 | ||||||
| SHARES | SECURITY DESCRIPTION | VALUE($) | ||||||
Oil, Gas & Consumable Fuels — Continued |
| |||||||
| 10,100 | Plains All American Pipeline LP | 522,877 | ||||||
|
| |||||||
| 2,190,593 | ||||||||
|
| |||||||
Total Energy | 2,618,543 | |||||||
|
| |||||||
Financials — 11.9% |
| |||||||
Capital Markets — 4.7% |
| |||||||
| 4,450 | Affiliated Managers Group, Inc. (a) | 965,116 | ||||||
| 19,300 | Blackstone Group LP (The) | 607,950 | ||||||
| 10,700 | Lazard Ltd., Class A (Bermuda) | 484,924 | ||||||
| 17,900 | TD Ameritrade Holding Corp. | 548,456 | ||||||
|
| |||||||
| 2,606,446 | ||||||||
|
| |||||||
Commercial Banks — 2.1% |
| |||||||
| 17,400 | East West Bancorp, Inc. | 608,478 | ||||||
| 5,325 | Signature Bank (a) | 572,012 | ||||||
|
| |||||||
| 1,180,490 | ||||||||
|
| |||||||
Diversified Financial Services — 1.7% |
| |||||||
| 12,200 | Moody’s Corp. | 957,334 | ||||||
|
| |||||||
Insurance — 2.0% |
| |||||||
| 8,300 | Aon plc, (United Kingdom) | 696,287 | ||||||
| 8,700 | Axis Capital Holdings Ltd., (Bermuda) | 413,859 | ||||||
|
| |||||||
| 1,110,146 | ||||||||
|
| |||||||
Real Estate Management & Development — 1.4% |
| |||||||
| 28,900 | CBRE Group, Inc., Class A (a) | 760,070 | ||||||
|
| |||||||
Total Financials | 6,614,486 | |||||||
|
| |||||||
Health Care — 13.8% |
| |||||||
Biotechnology — 2.2% |
| |||||||
| 5,040 | Alexion Pharmaceuticals, Inc. (a) | 670,622 | ||||||
| 7,300 | Vertex Pharmaceuticals, Inc. (a) | 542,390 | ||||||
|
| |||||||
| 1,213,012 | ||||||||
|
| |||||||
Health Care Equipment & Supplies — 1.0% |
| |||||||
| 8,200 | Sirona Dental Systems, Inc. (a) | 575,640 | ||||||
|
| |||||||
Health Care Providers & Services — 3.6% |
| |||||||
| 18,000 | Brookdale Senior Living, Inc. (a) | 489,240 | ||||||
| 13,800 | Envision Healthcare Holdings, Inc. (a) | 490,176 | ||||||
| 6,110 | Humana, Inc. | 630,674 | ||||||
| 11,000 | Premier, Inc., Class A (a) | 404,360 | ||||||
|
| |||||||
| 2,014,450 | ||||||||
|
| |||||||
Life Sciences Tools & Services — 4.1% |
| |||||||
| 16,100 | Agilent Technologies, Inc. | 920,759 | ||||||
| 18,300 | Bruker Corp. (a) | 361,791 | ||||||
| 8,820 | Illumina, Inc. (a) | 975,669 | ||||||
|
| |||||||
| 2,258,219 | ||||||||
|
| |||||||
SEE NOTES TO FINANCIAL STATEMENTS.
| DECEMBER 31, 2013 | JPMORGAN INSURANCE TRUST | 5 | ||||||
Table of Contents
JPMorgan Insurance Trust Mid Cap Growth Portfolio
SCHEDULE OF PORTFOLIO INVESTMENTS
AS OF DECEMBER 31, 2013 (continued)
| SHARES | SECURITY DESCRIPTION | VALUE($) | ||||||
| Common Stocks — Continued |
| ||||||
Pharmaceuticals — 2.9% |
| |||||||
| 4,675 | Actavis plc (a) | 785,400 | ||||||
| 2,200 | Jazz Pharmaceuticals plc, (Ireland) (a) | 278,432 | ||||||
| 4,900 | Valeant Pharmaceuticals International, Inc. (a) | 575,260 | ||||||
|
| |||||||
| 1,639,092 | ||||||||
|
| |||||||
Total Health Care | 7,700,413 | |||||||
|
| |||||||
Industrials — 22.2% |
| |||||||
Aerospace & Defense — 0.5% |
| |||||||
| 6,341 | DigitalGlobe, Inc. (a) | 260,932 | ||||||
|
| |||||||
Airlines — 1.4% |
| |||||||
| 27,700 | Delta Air Lines, Inc. | 760,919 | ||||||
|
| |||||||
Building Products — 1.5% |
| |||||||
| 17,700 | Fortune Brands Home & Security, Inc. | 808,890 | ||||||
|
| |||||||
Commercial Services & Supplies — 1.2% |
| |||||||
| 5,740 | Stericycle, Inc. (a) | 666,816 | ||||||
|
| |||||||
Construction & Engineering — 1.0% |
| |||||||
| 6,900 | Fluor Corp. | 554,001 | ||||||
|
| |||||||
Electrical Equipment — 2.7% |
| |||||||
| 8,000 | Acuity Brands, Inc. | 874,560 | ||||||
| 11,400 | Generac Holdings, Inc. | 645,696 | ||||||
|
| |||||||
| 1,520,256 | ||||||||
|
| |||||||
Industrial Conglomerates — 1.4% |
| |||||||
| 9,800 | Carlisle Cos., Inc. | 778,120 | ||||||
|
| |||||||
Machinery — 4.4% |
| |||||||
| 12,925 | Flowserve Corp. | 1,018,878 | ||||||
| 11,575 | Pall Corp. | 987,926 | ||||||
| 4,900 | WABCO Holdings, Inc. (a) | 457,709 | ||||||
|
| |||||||
| 2,464,513 | ||||||||
|
| |||||||
Marine — 1.2% |
| |||||||
| 7,000 | Kirby Corp. (a) | 694,750 | ||||||
|
| |||||||
Professional Services — 0.8% |
| |||||||
| 3,500 | Towers Watson & Co., Class A | 446,635 | ||||||
|
| |||||||
Road & Rail — 3.3% |
| |||||||
| 3,825 | Canadian Pacific Railway Ltd., (Canada) | 578,799 | ||||||
| 28,500 | Hertz Global Holdings, Inc. (a) | 815,670 | ||||||
| 5,900 | J.B. Hunt Transport Services, Inc. | 456,070 | ||||||
|
| |||||||
| 1,850,539 | ||||||||
|
| |||||||
Trading Companies & Distributors — 2.8% |
| |||||||
| 17,100 | Air Lease Corp. | 531,468 | ||||||
| 21,000 | HD Supply Holdings, Inc. (a) | 504,210 | ||||||
| SHARES | SECURITY DESCRIPTION | VALUE($) | ||||||
Trading Companies & Distributors — Continued |
| |||||||
| 6,350 | MSC Industrial Direct Co., Inc., Class A | 513,524 | ||||||
|
| |||||||
| 1,549,202 | ||||||||
|
| |||||||
Total Industrials | 12,355,573 | |||||||
|
| |||||||
Information Technology — 18.9% |
| |||||||
Communications Equipment — 2.0% |
| |||||||
| 14,300 | Aruba Networks, Inc. (a) | 255,970 | ||||||
| 18,200 | Ciena Corp. (a) | 435,526 | ||||||
| 7,700 | Palo Alto Networks, Inc. (a) | 442,519 | ||||||
|
| |||||||
| 1,134,015 | ||||||||
|
| |||||||
Computers & Peripherals — 0.6% |
| |||||||
| 3,400 | 3D Systems Corp. (a) | 315,962 | ||||||
|
| |||||||
Electronic Equipment, Instruments & Components — 1.6% |
| |||||||
| 9,800 | Amphenol Corp., Class A | 873,964 | ||||||
|
| |||||||
Internet Software & Services — 0.9% |
| |||||||
| 2,325 | LinkedIn Corp., Class A (a) | 504,130 | ||||||
|
| |||||||
IT Services — 4.0% |
| |||||||
| 4,220 | Alliance Data Systems Corp. (a) | 1,109,564 | ||||||
| 13,600 | CoreLogic, Inc. (a) | 483,208 | ||||||
| 5,675 | FleetCor Technologies, Inc. (a) | 664,940 | ||||||
|
| |||||||
| 2,257,712 | ||||||||
|
| |||||||
Semiconductors & Semiconductor Equipment — 5.2% |
| |||||||
| 47,400 | Applied Materials, Inc. | 838,506 | ||||||
| 15,100 | Avago Technologies Ltd., (Singapore) | 798,639 | ||||||
| 9,500 | KLA-Tencor Corp. | 612,370 | ||||||
| 14,800 | Xilinx, Inc. | 679,616 | ||||||
|
| |||||||
| 2,929,131 | ||||||||
|
| |||||||
Software — 4.6% |
| |||||||
| 1,311 | CommVault Systems, Inc. (a) | 98,168 | ||||||
| 5,800 | Guidewire Software, Inc. (a) | 284,606 | ||||||
| 9,400 | Red Hat, Inc. (a) | 526,776 | ||||||
| 7,300 | ServiceNow, Inc. (a) | 408,873 | ||||||
| 5,400 | Splunk, Inc. (a) | 370,818 | ||||||
| 4,100 | Tableau Software, Inc., Class A (a) | 282,613 | ||||||
| 7,000 | Workday, Inc., Class A (a) | 582,120 | ||||||
|
| |||||||
| 2,553,974 | ||||||||
|
| |||||||
Total Information Technology | 10,568,888 | |||||||
|
| |||||||
Materials — 2.1% |
| |||||||
Chemicals — 2.1% |
| |||||||
| 2,925 | PPG Industries, Inc. | 554,755 | ||||||
| 3,385 | Sherwin-Williams Co. (The) | 621,148 | ||||||
|
| |||||||
Total Materials | 1,175,903 | |||||||
|
| |||||||
Total Common Stocks | 54,154,557 | |||||||
|
| |||||||
SEE NOTES TO FINANCIAL STATEMENTS.
| 6 | JPMORGAN INSURANCE TRUST | DECEMBER 31, 2013 | ||||
Table of Contents
| SHARES | SECURITY DESCRIPTION | VALUE($) | ||||||
| Short-Term Investment — 3.2% |
| ||||||
Investment Company — 3.2% |
| |||||||
| 1,755,577 | JPMorgan Liquid Assets Money Market Fund, | 1,755,577 | ||||||
|
| |||||||
Total Investments — 100.3% | 55,910,134 | |||||||
Liabilities in Excess of | (185,506 | ) | ||||||
|
| |||||||
NET ASSETS — 100.0% | $ | 55,724,628 | ||||||
|
| |||||||
Percentages indicated are based on net assets.
NOTES TO SCHEDULE OF PORTFOLIO INVESTMENTS:
| (a) | — Non-income producing security. | |
| (b) | — Investment in affiliate. Money market fund registered under the Investment Company Act of 1940, as amended, and advised by J.P. Morgan Investment Management Inc. | |
| (l) | — The rate shown is the current yield as of December 31, 2013. | |
| (m) | — All or a portion of this security is reserved and/or pledged with the custodian for current or potential holdings of futures, swaps, options, TBAs, when-issued securities, delayed delivery securities, reverse repurchase agreements, unfunded commitments and/or forward foreign currency exchange contracts. |
SEE NOTES TO FINANCIAL STATEMENTS.
| DECEMBER 31, 2013 | JPMORGAN INSURANCE TRUST | 7 | ||||||
Table of Contents
STATEMENT OF ASSETS AND LIABILITIES
AS OF DECEMBER 31, 2013
| Mid Cap Growth Portfolio | ||||
ASSETS: | ||||
Investments in non-affiliates, at value | $ | 54,154,557 | ||
Investments in affiliates, at value | 1,755,577 | |||
|
| |||
Total investment securities, at value | 55,910,134 | |||
Receivables: | ||||
Portfolio shares sold | 1,927 | |||
Dividends from non-affiliates | 13,716 | |||
Dividends from affiliates | 20 | |||
|
| |||
Total Assets | 55,925,797 | |||
|
| |||
LIABILITIES: | ||||
Payables: | ||||
Investment securities purchased | 45,487 | |||
Portfolio shares redeemed | 70,524 | |||
Accrued liabilities: | ||||
Investment advisory fees | 29,681 | |||
Administration fees | 3,138 | |||
Distribution fees | 9 | |||
Custodian and accounting fees | 8,786 | |||
Trustees’ and Chief Compliance Officer’s fees | 124 | |||
Audit fees | 32,677 | |||
Other | 10,743 | |||
|
| |||
Total Liabilities | 201,169 | |||
|
| |||
Net Assets | $ | 55,724,628 | ||
|
| |||
NET ASSETS: | ||||
Paid-in-Capital | $ | 26,167,610 | ||
Accumulated undistributed (distributions in excess of) net investment income | (4,023 | ) | ||
Accumulated net realized gains (losses) | 16,820,141 | |||
Net unrealized appreciation (depreciation) | 12,740,900 | |||
|
| |||
Total Net Assets | $ | 55,724,628 | ||
|
| |||
Net Assets: | ||||
Class 1 | $ | 55,665,101 | ||
Class 2 | 59,527 | |||
|
| |||
Total | $ | 55,724,628 | ||
|
| |||
Outstanding units of beneficial interest (shares) | ||||
(unlimited number of shares authorized, no par value): | ||||
Class 1 | 2,273,445 | |||
Class 2 | 2,481 | |||
Net Asset Value, offering and redemption price per share (a): | ||||
Class 1 | $ | 24.48 | ||
Class 2 | 23.99 | |||
|
| |||
Cost of investments in non-affiliates | $ | 41,413,657 | ||
Cost of investments in affiliates | 1,755,577 | |||
| (a) | Per share amounts may not recalculate due to rounding of net assets and/or shares outstanding. |
SEE NOTES TO FINANCIAL STATEMENTS.
| 8 | JPMORGAN INSURANCE TRUST | DECEMBER 31, 2013 | ||||
Table of Contents
STATEMENT OF OPERATIONS
FOR THE YEAR ENDED DECEMBER 31, 2013
| Mid Cap Growth Portfolio | ||||
INVESTMENT INCOME: | ||||
Dividend income from non-affiliates | $ | 478,336 | ||
Dividend income from affiliates | 445 | |||
|
| |||
Total investment income | 478,781 | |||
|
| |||
EXPENSES: | ||||
Investment advisory fees | 382,509 | |||
Administration fees | 49,591 | |||
Distribution fees — Class 2 | 65 | |||
Custodian and accounting fees | 29,877 | |||
Interest expense to affiliates | 236 | |||
Professional fees | 43,869 | |||
Trustees’ and Chief Compliance Officer’s fees | 773 | |||
Printing and mailing costs | 22,469 | |||
Transfer agent fees | 4,609 | |||
Other | 10,637 | |||
|
| |||
Total expenses | 544,635 | |||
|
| |||
Less amounts waived | (16,856 | ) | ||
|
| |||
Net expenses | 527,779 | |||
|
| |||
Net investment income (loss) | (48,998 | ) | ||
|
| |||
REALIZED/UNREALIZED GAINS (LOSSES): | ||||
Net realized gain (loss) on transactions from investments in non-affiliates | 17,090,384 | |||
Change in net unrealized appreciation/depreciation of investments in non-affiliates | 3,918,462 | |||
|
| |||
Net realized/unrealized gains (losses) | 21,008,846 | |||
|
| |||
Change in net assets resulting from operations | $ | 20,959,848 | ||
|
| |||
SEE NOTES TO FINANCIAL STATEMENTS.
| DECEMBER 31, 2013 | JPMORGAN INSURANCE TRUST | 9 | ||||||
Table of Contents
STATEMENTS OF CHANGES IN NET ASSETS
FOR THE PERIODS INDICATED
| Mid Cap Growth Portfolio | ||||||||
| Year Ended 12/31/2013 | Year Ended 12/31/2012 | |||||||
CHANGE IN NET ASSETS RESULTING FROM OPERATIONS: | ||||||||
Net investment income (loss) | $ | (48,998 | ) | $ | 85,706 | |||
Net realized gain (loss) | 17,090,384 | 5,174,762 | ||||||
Change in net unrealized appreciation/depreciation | 3,918,462 | 4,973,723 | ||||||
|
|
|
| |||||
Change in net assets resulting from operations | 20,959,848 | 10,234,191 | ||||||
|
|
|
| |||||
DISTRIBUTIONS TO SHAREHOLDERS: | ||||||||
Class 1 | ||||||||
From net investment income | (46,208 | ) | — | |||||
From net realized gains | (4,354,443 | ) | (817,797 | ) | ||||
Class 2 | ||||||||
From net realized gains | (1,413 | ) | (243 | ) | ||||
|
|
|
| |||||
Total distributions to shareholders | (4,402,064 | ) | (818,040 | ) | ||||
|
|
|
| |||||
CAPITAL TRANSACTIONS: | ||||||||
Change in net assets resulting from capital transactions | (28,091,381 | ) | (6,760,984 | ) | ||||
|
|
|
| |||||
NET ASSETS: | ||||||||
Change in net assets | (11,533,597 | ) | 2,655,167 | |||||
Beginning of period | 67,258,225 | 64,603,058 | ||||||
|
|
|
| |||||
End of period | $ | 55,724,628 | $ | 67,258,225 | ||||
|
|
|
| |||||
Accumulated undistributed (distributions in excess of) net investment income | $ | (4,023 | ) | $ | 72,941 | |||
|
|
|
| |||||
CAPITAL TRANSACTIONS: | ||||||||
Class 1 | ||||||||
Proceeds from shares issued | $ | 2,870,585 | $ | 6,031,656 | ||||
Distributions reinvested | 4,400,651 | 817,797 | ||||||
Cost of shares redeemed | (35,393,584 | ) | (13,610,680 | ) | ||||
|
|
|
| |||||
Change in net assets resulting from Class 1 capital transactions | $ | (28,122,348 | ) | $ | (6,761,227 | ) | ||
|
|
|
| |||||
Class 2 | ||||||||
Proceeds from shares issued | $ | 29,563 | $ | — | ||||
Distributions reinvested | 1,413 | 243 | ||||||
Cost of shares redeemed | (9 | ) | — | |||||
|
|
|
| |||||
Change in net assets resulting from Class 2 capital transactions | $ | 30,967 | $ | 243 | ||||
|
|
|
| |||||
Total change in net assets resulting from capital transactions | $ | (28,091,381 | ) | $ | (6,760,984 | ) | ||
|
|
|
| |||||
SHARE TRANSACTIONS: | ||||||||
Class 1 | ||||||||
Issued | 137,139 | 347,136 | ||||||
Reinvested | 233,456 | 45,458 | ||||||
Redeemed | (1,790,188 | ) | (767,875 | ) | ||||
|
|
|
| |||||
Change in Class 1 Shares | (1,419,593 | ) | (375,281 | ) | ||||
|
|
|
| |||||
Class 2 | ||||||||
Issued | 1,257 | — | ||||||
Reinvested | 76 | 14 | ||||||
Redeemed | (1 | ) | — | |||||
|
|
|
| |||||
Change in Class 2 Shares | 1,332 | 14 | ||||||
|
|
|
| |||||
SEE NOTES TO FINANCIAL STATEMENTS.
| 10 | JPMORGAN INSURANCE TRUST | DECEMBER 31, 2013 | ||||
Table of Contents
THIS PAGE IS INTENTIONALLY LEFT BLANK
| DECEMBER 31, 2013 | JPMORGAN INSURANCE TRUST | 11 | ||||||
Table of Contents
FOR THE PERIODS INDICATED
| Per share operating performance | ||||||||||||||||||||||||||||
| Investment operations | Distributions | |||||||||||||||||||||||||||
| Net asset value, beginning of period | Net investment income (loss) | Net realized and unrealized gains (losses) on investments | Total from investment operations | Net investment income | Net realized gain | Total distributions | ||||||||||||||||||||||
Mid Cap Growth Portfolio | ||||||||||||||||||||||||||||
Class 1 | ||||||||||||||||||||||||||||
Year Ended December 31, 2013 | $ | 18.21 | $ | (0.02 | )(d)(e) | $ | 7.53 | $ | 7.51 | $ | (0.01 | ) | $ | (1.23 | ) | $ | (1.24 | ) | ||||||||||
Year Ended December 31, 2012 | 15.88 | 0.02 | (f) | 2.52 | 2.54 | — | (0.21 | ) | (0.21 | ) | ||||||||||||||||||
Year Ended December 31, 2011 | 16.91 | (0.02 | ) | (1.01 | ) | (1.03 | ) | — | — | — | ||||||||||||||||||
Year Ended December 31, 2010 | 13.46 | (0.02 | ) | 3.47 | 3.45 | — | — | — | ||||||||||||||||||||
Year Ended December 31, 2009 | 9.41 | (0.02 | ) | 4.07 | 4.05 | — | — | — | ||||||||||||||||||||
Class 2 | ||||||||||||||||||||||||||||
Year Ended December 31, 2013 | 17.89 | (0.06 | )(d)(e) | 7.39 | 7.33 | — | (1.23 | ) | (1.23 | ) | ||||||||||||||||||
Year Ended December 31, 2012 | 15.64 | (0.02 | )(f) | 2.48 | 2.46 | — | (0.21 | ) | (0.21 | ) | ||||||||||||||||||
Year Ended December 31, 2011 | 16.71 | (0.05 | ) | (1.02 | ) | (1.07 | ) | — | — | — | ||||||||||||||||||
Year Ended December 31, 2010 | 13.33 | (0.04 | ) | 3.42 | 3.38 | — | — | — | ||||||||||||||||||||
Year Ended December 31, 2009 | 9.34 | (0.03 | ) | 4.02 | 3.99 | — | — | — | ||||||||||||||||||||
| (a) | Includes adjustments in accordance with accounting principles generally accepted in the United States of America and as such, the net asset values for financial reporting purposes and the returns based upon those net asset values may differ from the net assets values and returns for shareholder transactions. |
| (b) | Includes earnings credits and interest expense, if applicable, each of which is less than 0.01% unless otherwise noted. |
| (c) | Portfolio turnover is calculated by dividing the lesser of total purchases or sales of portfolio securities for the reporting period by the monthly average value of portfolio securities owned during the reporting period. Excluded from both the numerator and denominator are amounts relating to derivatives and securities whose maturities or expiration dates at the time of acquisition were one year or less. |
| (d) | Calculated based upon average shares outstanding. |
| (e) | Reflects special dividends paid out during the period by several of the Portfolio’s holdings. Had the Portfolio not received the special dividends, the net investment income (loss) per share would have been $(0.04) and $(0.09) for Class 1 and Class 2 Shares, respectively, and the net investment income (loss) ratio would have been (0.20)% and (0.42)% for Class 1 and Class 2 Shares, respectively. |
| (f) | Reflects special dividends paid out during the period by several of the Portfolio’s holdings. Had the Portfolio not received the special dividends, the net investment income (loss) per share would have been $(0.03) and $(0.08) for Class 1 and Class 2 Shares, respectively, and the net investment income (loss) ratio would have been (0.20)% and (0.45)% for Class 1 and Class 2 Shares, respectively. |
SEE NOTES TO FINANCIAL STATEMENTS.
| 12 | JPMORGAN INSURANCE TRUST | DECEMBER 31, 2013 | ||||
Table of Contents
| Ratios/Supplemental data | |||||||||||||||||||||||||
| Ratios to average net assets | ||||||||||||||||||||||||||
| Net asset value, end of period | Total return (a) | Net assets, end of period | Net expenses (b) | Net investment income (loss) | Expenses without waivers, reimbursements and earnings credits | Portfolio turnover rate (c) | ||||||||||||||||||||
| $ | 24.48 | 43.30 | % | $ | 55,665,101 | 0.90 | % | (0.08 | )%(e) | 0.92 | % | 76 | % | |||||||||||||
| 18.21 | 16.04 | 67,237,679 | 0.89 | 0.13 | (f) | 0.90 | 69 | |||||||||||||||||||
| 15.88 | (6.09 | ) | 64,585,309 | 0.85 | (0.08 | ) | 0.86 | 72 | ||||||||||||||||||
| 16.91 | 25.63 | 80,620,361 | 0.90 | (0.10 | ) | 0.97 | 76 | |||||||||||||||||||
| 13.46 | 43.04 | 80,982,829 | 0.90 | (0.14 | ) | 1.03 | 85 | |||||||||||||||||||
| 23.99 | 43.02 | 59,527 | 1.15 | (0.31 | )(e) | 1.18 | 76 | |||||||||||||||||||
| 17.89 | 15.77 | 20,546 | 1.14 | (0.12 | )(f) | 1.15 | 69 | |||||||||||||||||||
| 15.64 | (6.40 | ) | 17,749 | 1.09 | (0.32 | ) | 1.11 | 72 | ||||||||||||||||||
| 16.71 | 25.36 | 18,957 | 1.15 | (0.34 | ) | 1.22 | 76 | |||||||||||||||||||
| 13.33 | 42.72 | 15,126 | 1.15 | (0.40 | ) | 1.28 | 85 | |||||||||||||||||||
SEE NOTES TO FINANCIAL STATEMENTS.
| DECEMBER 31, 2013 | JPMORGAN INSURANCE TRUST | 13 | ||||||
Table of Contents
AS OF DECEMBER 31, 2013
1. Organization
JPMorgan Insurance Trust (the “Trust”) is registered under the Investment Company Act of 1940, as amended (the “1940 Act”), as an open-end management investment company and is a Massachusetts business trust.
The following is a separate Portfolio of the Trust (the “Portfolio”) covered by this report:
| Classes Offered | Diversified/Non-Diversified | |||
| Mid Cap Growth Portfolio | Class 1 and Class 2 | Diversified |
The investment objective of the Portfolio is to seek capital growth over the long term.
Portfolio shares are offered only to separate accounts of participating insurance companies and Eligible Plans. Individuals may not purchase shares directly from the Portfolio.
All classes of shares have equal rights as to earnings, assets and voting privileges, except that each class may bear different distribution and service fees and each class has exclusive voting rights with respect to its distribution plan and administrative services plan.
2. Significant Accounting Policies
The following is a summary of significant accounting policies followed by the Portfolio in the preparation of its financial statements. The policies are in accordance with accounting principles generally accepted in the United States of America (“GAAP”). The preparation of financial statements requires management to make estimates and assumptions that affect the reported amounts and disclosures in the financial statements. Actual results could differ from those estimates.
A. Valuation of Investments — Equity securities listed on a North American, Central American, South American or Caribbean securities exchange shall generally be valued at the last sale price on the exchange on which the security is principally traded that is reported before the time when the net assets of the Portfolio are valued. Securities listed on the NASDAQ Stock Market LLC are generally valued at the NASDAQ Official Closing Price. Generally, short-term investments of sufficient credit quality maturing in less than 61 days are valued at amortized cost, which approximates fair value. Investments in open-end investment companies are valued at each investment company’s net asset value per share (“NAV”) as of the report date.
Certain investments of the Portfolio may, depending upon market conditions, trade in relatively thin markets and/or in markets that experience significant volatility. As a result of these conditions, the prices used by the Portfolio to value these securities may differ from the value that would be realized if these securities were sold, and the differences could be material. Futures and options are generally valued on the basis of available market quotations. Swaps and other derivatives are valued daily, primarily using independent or affiliated pricing services approved by the Board of Trustees. If valuations are not available from such pricing services or values received are deemed not representative of fair value, values will be obtained from a third party broker-dealer or counterparty.
Securities or other assets for which market quotations are not readily available or for which market quotations are deemed to not represent the fair value of the security or asset at the time of pricing (including certain illiquid securities) are fair valued in accordance with procedures established by and under the supervision and responsibility of the Board of Trustees. The Board of Trustees has established an Audit and Valuation Committee to assist with the oversight of the valuation of the Portfolio’s securities. JPMorgan Funds Management, Inc. (the “Administrator” or “JPMFM”) has established a Valuation Committee (“VC”) that is comprised of senior representatives from JPMFM, J.P. Morgan Investment Management Inc. (the “Adviser” or “JPMIM”), and J.P. Morgan Asset Management’s Legal, Compliance and Risk Management groups and the Portfolio’s Chief Compliance Officer. The VC’s responsibilities include making determinations regarding Level 3 fair value measurements (“Fair Values”) and/or providing recommendations for approval to the Board of Trustees’ Audit and Valuation Committee, in accordance with the Portfolio’s valuation policies.
The VC or Board of Trustees, as applicable, primarily employs a market-based approach which may use related or comparable assets or liabilities, recent transactions, market multiples, book values, and other relevant information for the investment to determine the fair value of the investment. The VC or Board of Trustees may also use an income-based valuation approach in which the anticipated future cash flows of the investment are discounted to calculate fair value. Discounts may also be applied due to the nature or duration of any restrictions on the disposition of the investments. Valuations may be based upon current market prices of securities that are comparable in coupon, rating, maturity and industry.
It is possible that the estimated values may differ significantly from the values that would have been used had a ready market for the investments existed, and such differences could be material. JPMFM and JPMIM are responsible for monitoring developments that may impact Fair Values and for discussing and assessing Fair Values on an ongoing, and at least a quarterly, basis with the VC and Board of Trustees, as applicable. The appropriateness of Fair Values is assessed based on results of unchanged price review and consideration of macro or security specific events, back testing, and broker and vendor due diligence.
Valuations reflected in this report are as of the report date. As a result, changes in valuation due to market events and/or issuer related events after the report date and prior to issuance of the report, are not reflected herein.
| 14 | JPMORGAN INSURANCE TRUST | DECEMBER 31, 2013 | ||||
Table of Contents
The various inputs that are used in determining the fair value of the Portfolio’s investments are summarized into the three broad levels listed below.
| Ÿ | Level 1 — quoted prices in active markets for identical securities |
| Ÿ | Level 2 — other significant observable inputs (including quoted prices for similar securities, interest rates, prepayment speeds, credit risk, etc.) |
| Ÿ | Level 3 — significant unobservable inputs (including the Portfolio’s own assumptions in determining the fair value of investments) |
A financial instrument’s level within the fair value hierarchy is based on the lowest level of any input, both individually and in the aggregate, that is significant to the fair value measurement. The inputs or methodology used for valuing securities are not necessarily an indication of the risk associated with investing in those securities.
The following table represents each valuation input as presented on the Schedule of Portfolio Investments (“SOI”):
Level 1 Quoted prices | Level 2 Other significant observable inputs | Level 3 Significant unobservable inputs | Total | |||||||||||||
Total Investments in Securities (a) | $ | 55,910,134 | $ | — | $ | — | $ | 55,910,134 | ||||||||
|
|
|
|
|
|
|
| |||||||||
| (a) | All portfolio holdings designated as Level 1 are disclosed individually on the SOI. Please refer to the SOI for industry specifics of portfolio holdings. |
There were no transfers among any levels during the year ended December 31, 2013.
B. Security Transactions and Investment Income — Investment transactions are accounted for on the trade date (the date the order to buy or sell is executed). Securities gains and losses are calculated on a specifically identified cost basis. Interest income is determined on the basis of coupon interest accrued using the effective interest method which adjusts for amortization of premiums and accretion of discounts. Dividend income, net of foreign taxes withheld, if any, is recorded on the ex-dividend date or when the Portfolio first learns of the dividend.
To the extent such information is publicly available, the Portfolio records distributions received in excess of income earned from underlying investments as a reduction of cost of investments and/or realized gain. Such amounts are based on estimates if actual amounts are not available and actual amounts of income, realized gain and return of capital may differ from the estimated amounts. The Portfolio adjusts the estimated amounts of the components of distributions (and consequently its net investment income) as necessary once the issuers provide information about the actual composition of the distributions.
C. Allocation of Income and Expenses — Expenses directly attributable to a portfolio are charged directly to that portfolio, while the expenses attributable to more than one portfolio of the Trust are allocated among the respective portfolios. In calculating the NAV of each class, investment income, realized and unrealized gains and losses and expenses, other than class specific expenses, are allocated daily to each class of shares based upon the proportion of net assets of each class at the beginning of each day.
D. Federal Income Taxes — The Portfolio is treated as a separate taxable entity for Federal income tax purposes. The Portfolio’s policy is to comply with the provisions of the Internal Revenue Code of 1986, as amended (the “Code”), applicable to regulated investment companies and to distribute to shareholders all of its distributable net investment income and net realized capital gains on investments. Accordingly, no provision for Federal income tax is necessary. The Portfolio is also a segregated portfolio of assets for insurance purposes and intends to comply with the diversification requirements of Subchapter L of the Code. Management has reviewed the Portfolio’s tax positions for all open tax years and has determined that as of December 31, 2013, no liability for income tax is required in the Portfolio’s financial statements for net unrecognized tax benefits. However, management’s conclusions may be subject to future review based on changes in, or the interpretation of, the accounting standards or tax laws and regulations. The Portfolio’s Federal tax returns for the prior three fiscal years remain subject to examination by the Internal Revenue Service.
E. Distributions to Shareholders — Distributions from net investment income are generally declared and paid at least annually and are declared separately for each class. No class has preferential dividend rights; differences in per share rates are due to differences in separate class expenses. Net realized capital gains, if any, are distributed at least annually. The amount of distributions from net investment income and net realized capital gains is determined in accordance with Federal income tax regulations, which may differ from GAAP. To the extent these “book/tax” differences are permanent in nature (i.e., that they result from other than timing of recognition — “temporary differences”), such amounts are reclassified within the capital accounts based on their Federal tax-basis treatment.
The following amounts were reclassified within the capital accounts:
| Paid-in-Capital | Accumulated undistributed net investment income | Accumulated net realized gains (losses) | ||||||||||
| $ | (6 | ) | $ | 18,242 | $ | (18,236 | ) | |||||
The reclassifications for the Portfolio relate primarily to non-taxable dividends and net operating loss netting to short-term gains.
| DECEMBER 31, 2013 | JPMORGAN INSURANCE TRUST | 15 | ||||||
Table of Contents
NOTES TO FINANCIAL STATEMENTS
AS OF DECEMBER 31, 2013 (continued)
3. Fees and Other Transactions with Affiliates
A. Investment Advisory Fee — Pursuant to the Investment Advisory Agreement, the Adviser, an indirect, wholly-owned subsidiary of JPMorgan Chase & Co. (“JPMorgan”), supervises the investments of the Portfolio and for such services is paid a fee. The fee is accrued daily and paid monthly based on the Portfolio’s average daily net assets at an annual rate of 0.65%.
The Adviser waived Investment Advisory fees and/or reimbursed expenses as outlined in Note 3.E.
B. Administration Fee — Pursuant to an Administration Agreement, the Administrator, an indirect, wholly-owned subsidiary of JPMorgan, provides certain administration services to the Portfolio. In consideration of these services, the Administrator receives a fee accrued daily and paid monthly at an annual rate of 0.15% of the first $25 billion of the average daily net assets of all funds in the J.P. Morgan Funds Complex covered by the Administration Agreement (excluding certain funds of funds and money market funds) and 0.075% of the average daily net assets in excess of $25 billion of all such funds. For the year ended December 31, 2013, the effective rate was 0.08% of the Portfolio’s average daily net assets, notwithstanding any fee waivers and/or expense reimbursements.
JPMorgan Chase Bank, N.A. (“JPMCB”), a wholly-owned subsidiary of JPMorgan, serves as the Portfolio’s sub-administrator (the “Sub-administrator”). For its services as Sub-administrator, JPMCB receives a portion of the fees payable to the Administrator.
The Administrator waived Administration fees as outlined in Note 3.E.
C. Distribution Fees — Pursuant to a Distribution Agreement, JPMorgan Distribution Services, Inc. (the “Distributor”), a wholly-owned subsidiary of JPMorgan, serves as the Trust’s exclusive underwriter and promotes and arranges for the sale of the Portfolio’s shares.
The Board of Trustees has adopted a Distribution Plan (the “Distribution Plan”) for Class 2 Shares of the Portfolio in accordance with Rule 12b-1 under the 1940 Act. The Distribution Plan provides that the Portfolio shall pay distribution fees, including payments to the Distributor, at an annual rate of 0.25% of the average daily net assets of Class 2 Shares.
D. Custodian and Accounting Fees — JPMCB provides portfolio custody and accounting services to the Portfolio. The amounts paid directly to JPMCB by the Portfolio for custody and accounting services are included in Custodian and accounting fees in the Statement of Operations. Payments to the custodian may be reduced by credits earned by the Portfolio, based on uninvested cash balances held by the custodian. Such earnings credits, if any, are presented separately in the Statement of Operations.
Interest expense, if any, paid to the custodian related to cash overdrafts is included in Interest expense to affiliates in the Statement of Operations.
E. Waivers and Reimbursements — The Adviser, Administrator (for all share classes) and Distributor (for Class 2 Shares) have contractually agreed to waive fees and/or reimburse the Portfolio to the extent that total annual operating expenses (excluding acquired fund fees and expenses, dividend expenses related to short sales, interest, taxes, expenses related to litigation and potential litigation, extraordinary expenses and expenses related to the Board of Trustees’ deferred compensation plan) exceed the percentages of the Portfolio’s respective average daily net assets as shown in the table below:
| Class 1 | Class 2 | |||||||
| 0.90 | % | 1.15 | % | |||||
The expense limitation agreements were in effect for the year ended December 31, 2013. The contractual expense limitation percentages in the table above are in place until at least April 30, 2014.
For the year ended December 31, 2013, the Portfolio’s service providers waived fees for the Portfolio as follows. None of these parties expect the Portfolio to repay any such waived fees in future years.
| Contractual Waivers | ||||||||||||
Investment Advisory | Administration | Total | ||||||||||
| $ | 2,619 | $ | 12,289 | $ | 14,908 | |||||||
| Voluntary Waivers | ||||||||||||
Investment Advisory | Administration | Total | ||||||||||
| $ | 133 | $ | — | $ | 133 | |||||||
Additionally, the Portfolio may invest in one or more money market funds advised by the Adviser or its affiliates. The Adviser, Administrator and the Distributor waive fees in an amount sufficient to offset the respective fees each charges to the affiliated money market fund on the Portfolio’s investment in such affiliated money market fund. A portion of the waiver is voluntary.
The amount of waivers resulting from investments in these money market funds for the year ended December 31, 2013 was $1,815.
F. Other — Certain officers of the Trust are affiliated with the Adviser, the Administrator and the Distributor. Such officers, with the exception of the Chief Compliance Officer, receive no compensation from the Portfolio for serving in their respective roles.
| 16 | JPMORGAN INSURANCE TRUST | DECEMBER 31, 2013 | ||||
Table of Contents
The Board of Trustees appointed a Chief Compliance Officer to the Portfolio in accordance with Federal securities regulations. The Portfolio, along with other affiliated portfolios, makes reimbursement payments, on a pro-rata basis, to the Administrator for a portion of the fees associated with the Office of the Chief Compliance Officer. Such fees are included in Trustees’ and Chief Compliance Officer’s fees in the Statement of Operations.
The Trust adopted a Trustee Deferred Compensation Plan (the “Plan”) which allows the Independent Trustees to defer the receipt of all or a portion of compensation related to performance of their duties as Trustees. The deferred fees are invested in various J.P. Morgan Funds until distribution in accordance with the Plan.
During the year ended December 31, 2013, the Portfolio may have purchased securities from an underwriting syndicate in which the principal underwriter or members of the syndicate are affiliated with the Adviser.
The Portfolio may use related party broker-dealers. For the year ended December 31, 2013, the Portfolio did not incur any brokerage commissions with broker-dealers affiliated with the Adviser.
The Securities and Exchange Commission has granted an exemptive order permitting the Portfolio to engage in principal transactions with J.P. Morgan Securities, Inc., an affiliated broker, involving taxable money market instruments, subject to certain conditions.
4. Investment Transactions
During the year ended December 31, 2013, purchases and sales of investments (excluding short-term investments) were as follows:
Purchases (excluding U.S. Government) | Sales (excluding U.S. Government) | |||||||
| $ | 44,564,355 | $ | 77,889,493 | |||||
During the year ended December 31, 2013, there were no purchases or sales of U.S. Government securities.
5. Federal Income Tax Matters
For Federal income tax purposes, the cost and unrealized appreciation (depreciation) in value of investment securities held at December 31, 2013 were as follows:
Aggregate Cost | Gross Unrealized Appreciation | Gross Unrealized Depreciation | Net Unrealized Appreciation (Depreciation) | |||||||||||||
| $ | 43,230,032 | $ | 12,947,190 | $ | 267,088 | $ | 12,680,102 | |||||||||
The difference between book and tax basis appreciation (depreciation) on investments is primarily attributed to wash sale loss deferrals.
The tax character of distributions paid during the year ended December 31, 2013 was as follows:
| Total Distributions Paid From: | ||||||||||||
Ordinary Income | Net Long-Term Capital Gains | Total Distributions | ||||||||||
| $ | 37,815 | $ | 4,364,249 | $ | 4,402,064 | |||||||
The tax character of distributions paid during the year ended December 31, 2012 was as follows:
| Total Distributions Paid From: | ||||||||||||
Ordinary Income | Net Long-Term Capital Gains | Total Distributions | ||||||||||
| $ | — | $ | 818,040 | $ | 818,040 | |||||||
As of December 31, 2013, the components of net assets (excluding paid-in-capital) on a tax basis were as follows:
Current Distributable Ordinary Income | Current Distributable Long-Term Capital Gain or (Tax Basis Capital Loss Carryover) | Unrealized Appreciation (Depreciation) | ||||||||||
| $ | 5,269,159 | $ | 11,611,779 | $ | 12,680,102 | |||||||
The cumulative timing differences primarily consist of wash sale loss deferrals.
| DECEMBER 31, 2013 | JPMORGAN INSURANCE TRUST | 17 | ||||||
Table of Contents
NOTES TO FINANCIAL STATEMENTS
AS OF DECEMBER 31, 2013 (continued)
6. Borrowings
The Trust and JPMCB have entered into a financing arrangement. Under this arrangement, JPMCB provides an unsecured, uncommitted credit facility in the aggregate amount of $100 million to certain of the J.P. Morgan Funds, including the Portfolio. Advances under the arrangement are taken primarily for temporary or emergency purposes, including the meeting of redemption requests that otherwise might require the untimely disposition of securities, and are subject to the Portfolio’s borrowing restrictions. Interest on borrowings is payable at a rate determined by JPMCB at the time of borrowing. This agreement has been extended until November 10, 2014.
The Portfolio had no borrowings outstanding from the unsecured, uncommitted credit facility at December 31, 2013, or at any time during the year then ended.
Interest expense paid, if any, as a result of borrowings from the unsecured, uncommitted credit facility is included in Interest expense to affiliates in the Statement of Operations.
7. Risks, Concentrations and Indemnifications
In the normal course of business, the Portfolio enters into contracts that contain a variety of representations which provide general indemnifications. The Portfolio’s maximum exposure under these arrangements is unknown. The amount of exposure would depend on future claims that may be made against the Portfolio that have not yet occurred. However, based on experience, the Portfolio expects the risk of loss to be remote.
The Portfolio has several shareholders holding a significant percentage of shares outstanding. Investment activities of these shareholders could have a material impact on the Portfolio.
| 18 | JPMORGAN INSURANCE TRUST | DECEMBER 31, 2013 | ||||
Table of Contents
REPORT OF INDEPENDENT REGISTERED PUBLIC ACCOUNTING FIRM
To the Board of Trustees of JPMorgan Insurance Trust and the Shareholders of JPMorgan Insurance Trust Mid Cap Growth Portfolio:
In our opinion, the accompanying statement of assets and liabilities, including the schedule of portfolio investments, and the related statements of operations and of changes in net assets and the financial highlights present fairly, in all material respects, the financial position of JPMorgan Insurance Trust Mid Cap Growth Portfolio (a separate Portfolio of JPMorgan Insurance Trust) (hereafter referred to as the “Portfolio”) at December 31, 2013, the results of its operations for the year then ended, the changes in its net assets for each of the two years in the period then ended and the financial highlights for each of the five years in the period then ended, in conformity with accounting principles generally accepted in the United States of America. These financial statements and financial highlights (hereafter referred to as “financial statements”) are the responsibility of the Portfolio’s management. Our responsibility is to express an opinion on these financial statements based on our audits. We conducted our audits of these financial statements in accordance with the standards of the Public Company Accounting Oversight Board (United States). Those standards require that we plan and perform the audit to obtain reasonable assurance about whether the financial statements are free of material misstatement. An audit includes examining, on a test basis, evidence supporting the amounts and disclosures in the financial statements, assessing the accounting principles used and significant estimates made by management, and evaluating the overall financial statement presentation. We believe that our audits, which included confirmation of securities at December 31, 2013 by correspondence with the custodian and brokers, provide a reasonable basis for our opinion.
PricewaterhouseCoopers LLP
New York, New York
February 21, 2014
| DECEMBER 31, 2013 | JPMORGAN INSURANCE TRUST | 19 | ||||||
Table of Contents
(Unaudited)
The Portfolio’s Statement of Additional Information includes additional information about the Portfolio’s Trustees and is available, without charge, upon request by calling 1-800-480-4111 or on the J.P. Morgan Funds’ website at www.jpmorganfunds.com.
Name (Year of Birth); Positions With the Portfolio (1) | Principal Occupations During Past 5 Years | Number of Portfolios in Fund Complex Overseen by Trustee (2) | Other Directorships Held Outside Fund Complex During Past 5 Years | |||
Independent Trustees | ||||||
| John F. Finn (1947); Trustee of Trust since 2005; Trustee of heritage One Group Mutual Funds since 1998. | Chairman (1985-present), President and Chief Executive Officer, Gardner, Inc. (supply chain management company serving industrial and consumer markets) (1974-present). | 170 | Director, Cardinal Health, Inc. (CAH) (1994-present); Director, Greif, Inc. (GEF) (industrial package products and services) (2007-present); Trustee, Columbus Association for the Performing Arts. | |||
| Dr. Matthew Goldstein (1941); Chairman since 2013; Trustee of Trust since 2005; Trustee of heritage J.P. Morgan Funds since 2003. | Professor, City University of New York (effective 7/1/13); Chancellor, City University of New York (1999-2013); President, Adelphi University (New York) (1998-1999). | 170 | Trustee, Museum of Jewish Heritage (2011-present). | |||
| Robert J. Higgins (1945); Trustee of Trust since 2005; Trustee of heritage J.P. Morgan Funds since 2002. | Retired; Director of Administration of the State of Rhode Island (2003-2004); President — Consumer Banking and Investment Services, Fleet Boston Financial (1971-2001). | 170 | None | |||
| Peter C. Marshall (1942); Trustee of Trust since 2005; Trustee of heritage One Group Mutual Funds since 1985. | Self-employed business consultant (2002-present). | 170 | None | |||
| Mary E. Martinez (1960); Trustee of Trust since 2013. | Associate, Special Properties, a Christie’s International Real Estate Affiliate (2010-Present); Managing Director, Bank of America (Asset Management) (2007-2008); Chief Operating Officer, U.S. Trust Asset Management; U.S. Trust Company (asset management) (2003-2007); President, Excelsior Funds (registered investment companies) (2004-2005). | 170 | None | |||
| Marilyn McCoy* (1948); Trustee of Trust since 2005; Trustee of heritage One Group Mutual Funds since 1999. | Vice President of Administration and Planning, Northwestern University (1985-present). | 170 | Trustee, Carleton College (2003-present). | |||
| Mitchell M. Merin (1953); Trustee of Trust since 2013. | Retired (2005-Present); President and Chief Operating Officer, Morgan Stanley Investment Management, Member Morgan Stanley & Co. Management Committee (registered investment adviser) (1998-2005). | 170 | Director, Sun Life Financial (SLF) (2007 to Present) (financial services and insurance); Trustee, Trinity College, Hartford, CT (2002-2010). | |||
| William G. Morton, Jr. (1937); Trustee of Trust since 2005; Trustee of heritage J.P. Morgan Funds since 2003. | Retired; Chairman Emeritus (2001-2002), and Chairman and Chief Executive Officer, Boston Stock Exchange (1985-2001). | 170 | Director, Radio Shack Corp. (1987-2008); Director, National Organization of Investment Professionals; Trustee of the Stratton Mountain School (2001-present). | |||
| Dr. Robert A. Oden, Jr. (1946); Trustee of Trust since 2005; Trustee of heritage One Group Mutual Funds since 1997. | Retired; President, Carleton College (2002-2010); President, Kenyon College (1995-2002). | 170 | Trustee, American University in Cairo (1999-present); Chairman, Dartmouth-Hitchcock Medical Center (2011-present); Trustee, American Schools of Oriental Research (2011-present); Trustee, American Museum of Fly Fishing. | |||
| 20 | JPMORGAN INSURANCE TRUST | DECEMBER 31, 2013 | ||||
Table of Contents
Name (Year of Birth); Positions With the Portfolio (1) | Principal Occupations During Past 5 Years | Number of Complex Overseen by Trustee (2) | Other Directorships Held Outside Fund Complex During Past 5 Years | |||
Independent Trustees (continued) | ||||||
| Marian U. Pardo** (1946); Trustee of Trust since 2013. | Managing Director and Founder, Virtual Capital Management LLC (Investment Consulting) (2007-present); Managing Director, Credit Suisse Asset Management (portfolio manager) (2003-2006). | 170 | Member, Board of Governors, Columbus Citizens Foundation (not-for-profit supporting philanthropic and cultural programs) (2006-present). | |||
| Frederick W. Ruebeck (1939); Trustee of Trust since 2005; Trustee of heritage One Group Mutual Funds since 1994. | Consultant (2000-present); Adviser, JP Greene & Associates, LLC (broker-dealer) (2000-2009); Chief Investment Officer, Wabash College (2004-present); Director of Investments, Eli Lilly and Company (pharmaceuticals) (1988-1999). | 170 | Trustee, Wabash College (1988-present); Chairman, Indianapolis Symphony Orchestra Foundation (1994-present). | |||
| James J. Schonbachler (1943); Trustee of Trust since 2005; Trustee of heritage J.P. Morgan Funds since 2001. | Retired; Managing Director of Bankers Trust Company (financial services) (1968-1998). | 170 | None | |||
Interested Trustee Not Affiliated With the Adviser | ||||||
| Frankie D. Hughes*** (1952), Trustee of Trust since 2008. | President and Chief Investment Officer, Hughes Capital Management, Inc. (fixed income asset management) (1993-present). | 170 | Trustee, The Victory Portfolios (2000-2008) (investment companies). | |||
| (1) | The Trustees serve for an indefinite term, subject to the Trust’s current retirement policy, which is age 75 for all Trustees, except that the Board has determined Mr. Morton should continue to serve until December 31, 2014. In order to fill the vacancies created by the retirement of the Fergus Reid, III, William J. Armstrong, and Leonard J. Spalding Jr., effective December 31, 2012, the Board appointed Ms. Martinez and Mr. Merin to serve as Trustees effective January 1, 2013 and Ms. Pardo to serve as Trustee effective February 1, 2013. |
| (2) | A Fund Complex means two or more registered investment companies that hold themselves out to investors as related companies for purposes of investment and investor services or have a common investment adviser or have an investment adviser that is an affiliated person of the investment adviser of any of the other registered investment companies. The J.P. Morgan Funds Complex for which the Board of Trustees serves currently includes eleven registered investment companies (170 funds), including JPMorgan Mutual Fund Group which liquidated effective November 29, 2012 and is in the process of winding up its affairs. |
| * | Ms. McCoy has served as Vice President of Administration and Planning for Northwestern University since 1985. William M. Daley was the Head of Corporate Responsibility for JPMorgan Chase & Co. prior to January 2011 and served as a member of the Board of Trustees of Northwestern University from 2005 through 2010. JPMIM, the Portfolio’s investment adviser, is a wholly-owned subsidiary of JPMorgan Chase & Co.��Two members of the Board of Trustees of Northwestern University are executive officers of registered investment advisers (not affiliated with JPMorgan) that are under common control with sub-advisers to certain J.P. Morgan Funds. |
| ** | In connection with prior employment with JPMorgan Chase, Ms. Pardo is the recipient of non-qualified pension plan payments from JPMorgan Chase in the amount of approximately $2,055 per month, which she irrevocably waived effective January 1, 2013, and deferred compensation payments from JPMorgan Chase in the amount of approximately $7,294 per year, which ended in January 2013. In addition, Ms. Pardo receives payments from a fully funded qualified plan, which is not an obligation of JPMorgan Chase. |
| *** | Ms. Hughes is treated as an “interested person” based on the portfolio holdings of clients of Hughes Capital Management, Inc. |
The contact address for each of the Trustees is 270 Park Avenue, New York, NY 10017.
| DECEMBER 31, 2013 | JPMORGAN INSURANCE TRUST | 21 | ||||||
Table of Contents
(Unaudited)
Name (Year of Birth), Positions Held with the Trust (Since) | Principal Occupations During Past 5 Years | |
Robert L. Young (1963), | Chief Operating Officer and Director, J.P. Morgan Investment Management Inc. since 2010; Senior Vice President, J.P. Morgan Funds (2005-2010), Chief Operating Officer, J.P. Morgan Funds (2005-2010); Director and various officer positions for JPMorgan Funds Management, Inc. (formerly One Group Administrative Services) and JPMorgan Distribution Services, Inc. (formerly One Group Dealer Services, Inc.) from 1999 to present. Mr. Young has been with JPMorgan Chase & Co. (formerly Bank One Corporation) since 1997. | |
| Joy C. Dowd (1972), Treasurer and Principal Financial Officer (2010) | Assistant Treasurer of the Trusts from 2009 to 2010; Executive Director, JPMorgan Funds Management, Inc. from February 2011; Vice President, JPMorgan Funds Management, Inc. from December 2008 to February 2011; prior to joining JPMorgan Chase, Ms. Dowd worked in MetLife’s investments audit group from 2005 through 2008. | |
| Frank J. Nasta (1964), Secretary (2008) | Managing Director and Associate General Counsel, JPMorgan Chase since 2008; Previously, Director, Managing Director, General Counsel and Corporate Secretary, J. & W. Seligman & Co. Incorporated; Secretary of each of the investment companies of the Seligman Group of Funds and Seligman Data Corp.; Director and Corporate Secretary, Seligman Advisors, Inc. and Seligman Services, Inc. | |
| Stephen M. Ungerman (1953), Chief Compliance Officer (2005) | Managing Director, JPMorgan Chase & Co.; Mr. Ungerman has been with JPMorgan Chase & Co. since 2000. | |
Kathryn A. Jackson (1962), | Vice President and AML Compliance Manager for JPMorgan Asset Management Compliance since 2011; Senior On-Boarding Specialist for JPMorgan Distribution Services, Inc. in Global Liquidity from 2008 to 2011; prior to joining JPMorgan, Ms. Jackson was a Financial Services Analyst responsible for on-boarding, compliance and training with Nationwide Securities LLC and 1717 Capital Management Company, both registered broker-dealers, from 2005 until 2008. | |
Elizabeth A. Davin (1964), Assistant Secretary (2005)** | Executive Director and Assistant General Counsel, JPMorgan Chase since February 2012; formerly Vice President and Assistant General Counsel, JPMorgan Chase from 2005 until February 2012; Senior Counsel, JPMorgan Chase (formerly Bank One Corporation) from 2004 to 2005. | |
| Jessica K. Ditullio (1962), Assistant Secretary (2005)** | Executive Director and Assistant General Counsel, JPMorgan Chase since February 2011; Ms. Ditullio has served as an attorney with various titles for JPMorgan Chase (formerly Bank One Corporation) since 1990. | |
| John T. Fitzgerald (1975), Assistant Secretary (2008) | Executive Director and Assistant General Counsel, JPMorgan Chase since February 2011; formerly, Vice President and Assistant General Counsel, JPMorgan Chase from 2005 until February 2011. | |
| Carmine Lekstutis (1980), Assistant Secretary (2011) | Vice President and Assistant General Counsel, JPMorgan Chase since 2011; Associate, Skadden, Arps, Slate, Meagher & Flom LLP (law firm) from 2006 to 2011. | |
| Gregory S. Samuels (1980), Assistant Secretary (2010) | Vice President and Assistant General Counsel, JPMorgan Chase since 2010; Associate, Ropes & Gray (law firm) from 2008 to 2010; Associate, Clifford Chance LLP (law firm) from 2005 to 2008. | |
| Pamela L. Woodley (1971), Assistant Secretary (2012) | Vice President and Assistant General Counsel, JPMorgan Chase since November 2004. | |
Michael M. D’Ambrosio (1969), Assistant Treasurer (2012) | Executive Director, JPMorgan Funds Management, Inc. from July 2012; prior to joining JPMorgan Chase, Mr. D’Ambrosio was a Tax Director at PricewaterhouseCoopers LLP since 2006. | |
| Joseph Parascondola (1963), Assistant Treasurer (2011) | Vice President, JPMorgan Funds Management, Inc. since August 2006. | |
| Matthew J. Plastina (1970), Assistant Treasurer (2011) | Vice President, JPMorgan Funds Management, Inc. since August 2010; prior to August 2010, Vice President and Controller, Legg Mason Global Asset Management. | |
Julie A. Roach (1971), Assistant Treasurer (2012)** | Vice President, JPMorgan Funds Management, Inc. from August 2012; prior to joining JPMorgan Chase, Ms. Roach was a Senior Manager with Deloitte since 2001. | |
Gillian I. Sands (1969), Assistant Treasurer (2012) | Vice President, JPMorgan Funds Management, Inc. from September 2012; Assistant Treasurer, Wells Fargo Funds Management (2007-2009). | |
The contact address for each of the officers, unless otherwise noted, is 270 Park Avenue, New York, NY 10017.
| * | The contact address for the officer is 500 Stanton Christiana Road, Ops 1, Floor 02, Newark, DE 19173-2107. |
| ** | The contact address for the officer is 460 Polaris Parkway, Westerville, OH 43082. |
| 22 | JPMORGAN INSURANCE TRUST | DECEMBER 31, 2013 | ||||
Table of Contents
SCHEDULE OF SHAREHOLDER EXPENSES
(Unaudited)
Hypothetical $1,000 Investment
As a shareholder of the Portfolio, you incur ongoing costs, including investment advisory fees, administration fees, distribution fees (for Class 2 Shares) and other Portfolio expenses. Because the Portfolio is a funding vehicle for Policies and Eligible Plans, you may also incur sales charges and other fees relating to the Policies or Eligible Plans. The examples below are intended to help you understand your ongoing costs (in dollars) of investing in the Portfolio, but not the costs of the Policies or Eligible Plans, and to compare these ongoing costs with the ongoing costs of investing in other mutual funds. The examples assume that you had a $1,000 investment in each Class at the beginning of the reporting period, July 1, 2013, and continued to hold your shares at the end of the reporting period, December 31, 2013.
Actual Expenses
For each Class of the Portfolio in the table below, the first line provides information about actual account values and actual expenses. You may use the information in this line, together with the amount you invested, to estimate the expenses that you paid over the period. Simply divide your account value by $1,000 (for example, an $8,600 account value divided by $1,000 = 8.6), then multiply the result by the number in the first line of each Class under the heading entitled “Expenses Paid During the Period” to estimate the expenses you paid on your account during this period.
Hypothetical Example for Comparison Purposes
The second line of each Class in the table below provides information about hypothetical account values and hypothetical expenses based on the Class’ actual expense ratio and an assumed rate of return of 5% per year before expenses, which is not the Class’ actual return. The hypothetical account values and expenses may not be used to estimate the actual ending account balance or expenses you paid for the period. You may use this information to compare the ongoing costs of investing in the Class of the Portfolio and other funds. To do so, compare this 5% hypothetical example with the 5% hypothetical examples that appear in the shareholder reports of the other funds. Please note that the expenses shown in the table are meant to highlight your ongoing costs only and do not reflect any transaction costs, such as sales charges (loads) or redemption fees or the costs associated with the Policies and Eligible Plans through which the Portfolio is held. Therefore, the second line for each Class in the table is useful in comparing ongoing costs only, and will not help you determine the relative total costs of owning different funds. In addition, if these transaction costs were included, your costs would have been higher. The examples also assume all dividends and distributions have been reinvested.
| Beginning Account Value July 1, 2013 | Ending Account Value December 31, 2013 | Expenses Paid During the Period* | Annualized Expense Ratio | |||||||||||||
Mid Cap Growth Portfolio | ||||||||||||||||
Class 1 | ||||||||||||||||
Actual | $ | 1,000.00 | $ | 1,233.20 | $ | 5.01 | 0.89 | % | ||||||||
Hypothetical | 1,000.00 | 1,020.72 | 4.53 | 0.89 | ||||||||||||
Class 2 | ||||||||||||||||
Actual | 1,000.00 | 1,232.20 | 6.41 | 1.14 | ||||||||||||
Hypothetical | 1,000.00 | 1,019.46 | 5.80 | 1.14 | ||||||||||||
| * | Expenses are equal to each Class’ respective annualized expense ratio, multiplied by the average account value over the period, multiplied by 184/365 (to reflect the one-half year period). |
| DECEMBER 31, 2013 | JPMORGAN INSURANCE TRUST | 23 | ||||||
Table of Contents
BOARD APPROVAL OF INVESTMENT ADVISORY AGREEMENT
(Unaudited)
The Board of Trustees meets regularly throughout the year and considers factors that are relevant to its annual consideration of investment advisory agreements at each meeting. The Board of Trustees has established various standing committees, composed of Trustees with diverse backgrounds, to which the Board of Trustees has assigned specific subject matter responsibilities to further enhance the effectiveness of the Board’s oversight and decision making. The Board of Trustees and its investment committees (money market and alternative products, equity, and fixed income) also meet for the specific purpose of considering advisory contract annual renewals. The Board of Trustees held meetings in person in June and August 2013, at which the Trustees considered the continuation of the investment advisory agreement for the Portfolio whose annual report is contained herein (the “Advisory Agreement”). At the June meeting, the Board’s investment committees met to review and consider performance, expense and related information for the J.P. Morgan Funds. Each investment committee reported to the full Board, which then considered the investment committee’s preliminary findings. At the August meeting, the Trustees continued their review and consideration. The Trustees, including a majority of the Trustees who are not “interested persons” (as defined in the 1940 Act) of any party to the Advisory Agreement or any of their affiliates, approved the continuation of the Advisory Agreement on August 20, 2013.
The Trustees, as part of their review of the investment advisory arrangements for the J.P. Morgan Funds, considered and reviewed performance and other information received from the Adviser on a regular basis over the course of the year, as well as information specifically prepared for their annual review. This information included the Portfolio’s performance compared to the performance of the Portfolio’s peers and benchmarks and analyses by the Adviser of the Portfolio’s performance. The Adviser also periodically provides comparative information regarding the Portfolio’s expense ratios and those of the peer groups. In addition, in preparation for the June and August meetings, the Trustees requested, received and evaluated extensive materials from the Adviser, including, with respect to the Portfolio, performance and expense information compiled by Lipper Inc. (“Lipper”), an independent provider of investment company data. Prior to voting, the Trustees reviewed the proposed approval of the Advisory Agreement with representatives of the Adviser and with counsels to the Portfolio and independent Trustees and received a memorandum from independent counsel to the Trustees discussing the legal standards for their consideration of the proposed approval. The Trustees also discussed the proposed approvals in executive sessions with counsels to the Portfolio and independent Trustees at which no representatives of the Adviser were present. Set forth below is a summary of the material factors evaluated by the Trustees in determining whether to approve the Advisory Agreement.
In their deliberations, there was a comprehensive consideration of the information received by the Trustees. Each Trustee attributed different weights to the various factors and no factor alone was considered determinative. From year to year, the Trustees consider and place emphasis on relevant information in light of changing circumstances in market and economic conditions. The Trustees determined that the compensation to be received by the Adviser from the Portfolio under the Advisory Agreement was fair and reasonable and that the continuance of the investment advisory contract was in the best interests of the Portfolio and its shareholders.
The factors summarized below were considered and discussed by the Trustees in reaching their conclusions:
Nature, Extent and Quality of Services Provided by the Adviser
The Trustees received and considered information regarding the nature, extent and quality of the services provided to the Portfolio under the Advisory Agreement. The Trustees took into account information furnished throughout the year at Trustee meetings, as well as the materials furnished specifically in connection with this annual review process. The Trustees considered the background and experience of the Adviser’s senior management and the expertise of, and the amount of attention given to the Portfolio by, investment personnel of the Adviser. In addition, the Trustees reviewed the qualifications, backgrounds and responsibilities of the portfolio management team primarily responsible for the day-to-day management of the Portfolio and the infrastructure supporting the team. The Trustees also considered information provided by the Adviser and JPMorgan Distribution Services, Inc. (“JPMDS”) about the structure and distribution strategy of the Portfolio. The Trustees also reviewed information relating to the Adviser’s risk governance model and reports showing the Adviser’s compliance structure and ongoing compliance processes. The quality of the administrative services provided by JPMorgan Funds Management, Inc. (“JPMFM”), an affiliate of the Adviser, was also considered.
The Board of Trustees also considered its knowledge of the nature and quality of the services provided by the Adviser to the Portfolio gained from their experience as Trustees of the J.P. Morgan Funds. In addition, they considered the overall reputation and capabilities of the Adviser and its affiliates, the commitment of the Adviser to provide high quality service to the Portfolio, their overall confidence in the Adviser’s integrity and the Adviser’s responsiveness to questions or concerns raised by them, including the Adviser’s willingness to consider and implement organizational and operational changes designed to improve investment results and the services provided to the Portfolio.
Based on these considerations and other factors, the Trustees concluded that they were satisfied with the nature, extent and
| 24 | JPMORGAN INSURANCE TRUST | DECEMBER 31, 2013 | ||||
Table of Contents
quality of the investment advisory services provided to the Portfolio by the Adviser.
Costs of Services Provided and Profitability to the Adviser and its Affiliates
The Trustees received and considered information regarding the profitability to the Adviser and its affiliates in providing services to the Portfolio. The Trustees reviewed and discussed this data. The Trustees recognized that this data is not audited and represents the Adviser’s determination of its and its affiliates’ revenues from the contractual services provided to the Portfolio, less expenses of providing such services. Expenses include direct and indirect costs and are calculated using an allocation methodology developed by the Adviser. The Trustees also recognized that it is difficult to make comparisons of profitability from fund investment advisory contracts because comparative information is not generally publicly available and is affected by numerous factors, including the structure of the particular adviser, the types of funds it manages, its business mix, numerous assumptions regarding allocations and the fact that publicly-traded fund managers’ operating profits and net income are net of distribution and marketing expenses. Based on their review, the Trustees concluded that the profitability to the Adviser under the Advisory Agreement was not unreasonable in light of the services and benefits provided to the Portfolio.
Fall-Out Benefits
The Trustees reviewed information regarding potential “fallout” or ancillary benefits received by the Adviser and its affiliates as a result of their relationship with the Portfolio. The Board also reviewed the adviser’s allocation of fund brokerage for the J.P. Morgan Funds complex, including allocations to brokers who provide research to the adviser.
The Trustees also considered that JPMFM earns fees from the Portfolio for providing administrative services. These fees were shown separately in the profitability analysis presented to the Trustees. The Trustees also considered the payments of Rule 12b-1 fees to JPMDS, an affiliate of the Adviser, which also acts as the Portfolio’s distributor and that these fees are in turn generally paid to financial intermediaries that sell the Portfolio, including financial intermediaries that are affiliates of the Adviser. The Trustees also considered the fees paid to JPMorgan Chase Bank, N.A. (“JPMCB”) for custody and fund accounting, and other related services
Economies of Scale
The Trustees noted that the proposed investment advisory fee schedule for the Portfolio does not contain breakpoints. The Trustees considered whether it would be appropriate to add
advisory fee breakpoints and the Trustees concluded that the current fee structure was reasonable in light of the fee waivers and expense limitations that the Adviser has in place that serve to limit the overall net expense ratio at competitive levels. The Trustees also recognized that the fee schedule for the administrative services provided by JPMFM does include a fee breakpoint, which is tied to the overall level of non-money market fund assets excluding certain funds-of-funds, as applicable, advised by the Adviser, and that the Portfolio benefits from that breakpoint. The Trustees concluded that shareholders benefited from the lower expense ratios which resulted from these factors.
Independent Written Evaluation of the Portfolio’s Chief Compliance Officer
The Trustees noted that, upon their direction, the Chief Compliance Officer for the Portfolio had prepared an independent written evaluation in order to assist the Trustees in determining the reasonableness of the proposed management fees. The Trustees considered the written evaluation in determining whether to continue the Advisory Agreement.
Fees Relative to Adviser’s Other Clients
The Trustees received and considered information about the nature and extent of investment advisory services and fee rates offered to other clients of the Adviser for investment management styles substantially similar to that of the Portfolio. The Trustees also considered the complexity of investment management for the Portfolio relative to the Adviser’s other clients and the differences in the nature and extent of the services provided to the different clients. The Trustees concluded that the fee rates charged to the Portfolio in comparison to those charged to the Adviser’s other clients were reasonable.
Investment Performance
The Trustees received and considered absolute and/or relative performance for the Portfolio in a report prepared by Lipper. The Trustees considered the total return performance information, which included the ranking of the Portfolio within a performance universe made up of funds with the same Lipper investment classification and objective (the “Universe Group”) by total return for applicable one-, three- and five-year periods. The Trustees reviewed a description of Lipper’s methodology for selecting mutual funds in the Portfolio’s Universe Group. The Lipper materials provided to the Trustees highlighted information with respect to a representative class to assist the Trustees in their review. As part of this review, the Trustees also reviewed the Portfolio’s performance against its benchmark and considered the performance information provided for the Portfolio at regular Board meetings by the Adviser. The Lipper performance data noted by the Trustees as part of their
| DECEMBER 31, 2013 | JPMORGAN INSURANCE TRUST | 25 | ||||||
Table of Contents
BOARD APPROVAL OF INVESTMENT ADVISORY AGREEMENT
(Unaudited) (continued)
review and the determinations made by the Trustees with respect to the Portfolio’s performance are summarized below:
The Trustees noted the Portfolio’s performance was in the second, third, and third quintiles for Class 1 shares for each of the one-, three-, and five-year periods ended December 31, 2012, respectively. The Trustees discussed the performance and investment strategy of the Portfolio with the Adviser and, based upon this discussion and various other factors, concluded that the performance was reasonable.
Advisory Fees and Expense Ratios
The Trustees considered the contractual advisory fee rate paid by the Portfolio to the Adviser and compared that rate to the information prepared by Lipper concerning management fee rates paid by other funds in the same Lipper category as the Portfolio. The Trustees recognized that Lipper reported the Portfolio’s management fee rate as the combined contractual
advisory fee and administration fee rates. The Trustees also reviewed information about other expenses and the expense ratios for the Portfolio. The Trustees considered the fee waiver and/or expense reimbursement arrangements currently in place for the Portfolio and considered the net advisory fee rate after taking into account any waivers and/or reimbursements. The Trustees recognized that it is difficult to make comparisons of advisory fees because there are variations in the services that are included in the fees paid by other funds. The Trustees’ determinations as a result of the review of the Portfolio’s advisory fees and expense ratios are summarized below:
The Trustees noted that the Portfolio’s net advisory fee and actual total expenses for Class 1 shares were in the second and fourth quintiles, respectively, of their Universe Group. After considering the factors identified above, in light of this information, the Trustees concluded that the advisory fee was reasonable.
| 26 | JPMORGAN INSURANCE TRUST | DECEMBER 31, 2013 | ||||
Table of Contents
(Unaudited)
Certain tax information for the Portfolio is required to be provided to shareholders based upon the Portfolio’s income and distributions for the taxable year ended December 31, 2013. The information and distributions reported in this letter may differ from the information and taxable distributions reported to the shareholders for the calendar year ending December 31, 2013. The information necessary to complete your income tax returns for the calendar year ending December 31, 2013 will be provided under separate cover.
Dividends Received Deductions (DRD)
The Portfolio hereby designates 100.00% or the maximum allowable percentage as ordinary income distributions eligible for the 70% dividend received deduction for corporate rate shareholders for the fiscal year ended December 31, 2013.
Long Term Capital Gain Notice
The Portfolio distributed approximately $4,364,249 as long-term capital gain dividends for the purpose of the dividend paid deduction on its respective tax return for the fiscal year ended December 31, 2013.
| DECEMBER 31, 2013 | JPMORGAN INSURANCE TRUST | 27 | ||||||
Table of Contents
J.P. Morgan Funds are distributed by JPMorgan Distribution Services, Inc., which is an affiliate of JPMorgan Chase & Co. Affiliates of JPMorgan Chase & Co. receive fees for providing various services to the funds.
Contact JPMorgan Distribution Services, Inc. at 1-800-480-4111 for a portfolio prospectus. You can also visit us at www.jpmorganfunds.com. Investors should carefully consider the investment objectives and risk as well as charges and expenses of the mutual fund before investing. The prospectus contains this and other information about the mutual fund. Read the prospectus carefully before investing.
The Portfolio files a complete schedule of its portfolio holdings for the first and third quarters of its fiscal year with the SEC on Form N-Q. The Portfolio’s Forms N-Q are available on the SEC’s website at http://www.sec.gov and may be reviewed and copied at the SEC’s Public Reference Room in Washington, DC. Information on the operation of the SEC’s Public Reference Room may be obtained by calling 1-800-SEC-0330. Shareholders may request the Form N-Q without charge by calling 1-800-480-4111 or by visiting the variable insurance portfolio section of the J.P. Morgan Funds’ website at www.jpmorganfunds.com.
A description of the Portfolio’s policies and procedures with respect to the disclosure of the Portfolio’s holdings is available in the prospectus and Statement of Additional Information.
A copy of proxy policies and procedures is available without charge upon request by calling 1-800-480-4111 and on the Portfolio’s website at www.jpmorganfunds.com. A description of such policies and procedures is on the SEC’s website at www.sec.gov. The Trustees have delegated the authority to vote proxies for securities owned by the Portfolio to the Adviser. A copy of the Portfolio’s voting record for the most recent 12-month period ended June 30 is available on the SEC’s website at www.sec.gov or at the Portfolio’s website at www.jpmorganfunds.com no later than August 31 of each year. The Portfolio’s proxy voting record will include, among other things, a brief description of the matter voted on for each portfolio security, and will state how each vote was cast, for example, for or against the proposal.
Table of Contents
| © JPMorgan Chase & Co., 2014. All rights reserved. December 2013. | AN-JPMITMCGP-1213 |
Table of Contents
Annual Report
JPMorgan Insurance Trust
December 31, 2013
JPMorgan Insurance Trust Mid Cap Value Portfolio
NOT FDIC INSURED Ÿ NO BANK GUARANTEE Ÿ MAY LOSE VALUE
|  |
Table of Contents
Investments in the Portfolio are not bank deposits or obligations of, or guaranteed or endorsed by, any bank and are not insured or guaranteed by the FDIC, the Federal Reserve Board or any other government agency. You could lose money if you sell when the Portfolio’s share price is lower than when you invested.
Past performance is no guarantee of future performance. The general market views expressed in this report are opinions based on market and other conditions through the end of the reporting period and are subject to change without notice. These views are not intended to predict the future performance of the Portfolio or the securities markets. References to specific securities and their issuers are for illustrative purposes only and are not intended to be, and should not be interpreted as, recommendations to purchase or sell such securities. Such views are not meant as investment advice and may not be relied on as an indication of trading intent on behalf of the Portfolio.
This Portfolio is intended to be a funding vehicle for variable annuity contracts and variable life insurance policies (collectively “Policies”) offered by separate accounts of participating insurance companies. Portfolio shares are also offered through qualified pension and retirement plans (“Eligible Plans”). Individuals may not purchase shares directly from the Portfolio.
Prospective investors should refer to the Portfolio’s prospectus for a discussion of the Portfolio’s investment objective, strategies and risks. Call J.P. Morgan Funds Service Center at 1-800-480-4111 for a prospectus containing more complete information about the Portfolio, including management fees and other expenses. Please read it carefully before investing.
Table of Contents
JANUARY 23, 2014 (Unaudited)
Dear Shareholder,
Equities markets in developed economies performed strongly in the face of periodic spikes in volatility throughout the twelve months ended December 31, 2013. Healthy corporate earnings and incremental but steady improvements in a range of economic indicators provided a positive backdrop for investors seeking returns in the low interest rate environment. While political discord in Washington injected volatility into the market, a bipartisan budget agreement at the end of the year relieved much of the political uncertainty created by partisan brinkmanship over the so-called fiscal cliff and the partial shutdown of the federal government in October. In the first half of the year, the U.S. Federal Reserve (“Fed”) announced its intention to taper off its $85 billion in monthly asset purchases and the statement weakened investor sentiment and set off widespread speculation about the timing and magnitude of such a move. The Fed followed through in December, deciding to reduce its monthly purchases by $10 billion. The news, along with robust gains in jobs, housing and consumer sentiment, drove U.S. equities to new highs. The S&P 500 stock index hit seven closing highs in the final month of the reporting period, finishing 2013 with its best performance since 1997.
 |
“While a repeat of the equity performance we experienced in 2013 may be a tall order, we believe stocks in the U.S. and Europe may continue to show gains.” |
Overseas, the European Central Bank reaffirmed its commitment to accommodative monetary policy and to the euro itself. In the second quarter of the year, the European Union (EU) returned to positive growth and at the end of the year, Ireland became the first nation to exit from its European Union bailout program. The Fed’s decision to curb its asset purchases also sent equities higher in Europe, as investors viewed the move as a sign of further economic stability. In Japan, equity markets rebounded to their best year since 1988, benefitting from Prime Minister Shinzo Abe’s efforts to revive the economy. Low returns on bonds and short-term debt instruments also drove investors into stocks.
Emerging market equities were weaker overall. As of December 31, 2013, the MSCI Emerging Markets Index returned -2.3% for the year. China’s economy showed signs of slower growth during the year and the Fed’s decision to taper its asset purchase program set off speculation that the maturation of the emerging markets credit cycle would push yield-seeking investors to rotate into developed markets.
Taper Talk Pressures Bonds
Fixed income markets generally remained weak during the year, as central bankers across the globe held interest rates at
historic lows. However, benchmark bond yields rose on an annual basis for the first time since 2009. During the year, the Fed’s talk of tapering off its Quantitative Easing (QE) program hurt fixed income markets. U.S. Treasury security yields continued to be low from a historical perspective, but ended the period higher. The yield for 10-year U.S. Treasury securities ended December 31, 2013 at 3.04%, while the yields for 2- and 30-year U.S. Treasury securities finished the reporting period at 0.38% and 3.96%, respectively. High-yield debt returned 7.4% for the year, as measured by the Barclays US High Yield Corporate Index, while other U.S. debt securities and emerging market debt both had negative returns.
While global economic growth accelerated during the year, the U.S. recovery in particular showed stronger fundamentals and the Fed’s decision to taper its QE program was a response to the improved picture. Europe emerged from its lengthy recession and the worst of the fiscal crises seem to be behind it, though unemployment remains strikingly high in many EU nations. Japan made progress toward ending persistent deflation, but Tokyo’s monetary and fiscal stimulus has sharply weakened the yen, putting other Asian exporting nations — notably China and South Korea — at a competitive disadvantage. Emerging market economies may face further headwinds as foreign investment shrinks and economic growth moderates from recent strength. Moreover, political instability — already apparent in Thailand and Turkey — may surface in other emerging market nations as governments struggle to deliver improved living standards and respond to demands for political reforms.
The Long-Term Lens
We welcome the Fed’s move to curb its QE program as a sign that the U.S. economy’s need for artificial stimulus is waning. While a repeat of the equity performance we experienced in 2013 may be a tall order, we believe stocks in the U.S. and Europe may continue to show gains. In the fixed-income market, persistent weakness has led to attractive valuations in some sectors. The past year’s market swings and intermittent volatility underlined the importance of maintaining a long-term view of your investment portfolio and the benefits derived from diversified holdings.
On behalf of everyone at J.P. Morgan Asset Management, thank you for your continued support. We look forward to managing your investment needs for years to come. Should you have any questions, please visit www.jpmorganfunds.com or contact the J.P. Morgan Funds Service Center at 1-800-480-4111.
Sincerely yours,

George C.W. Gatch
CEO, Global Funds Management
J.P. Morgan Asset Management
| DECEMBER 31, 2013 | JPMORGAN INSURANCE TRUST | 1 | ||||||
Table of Contents
JPMorgan Insurance Trust Mid Cap Value Portfolio
PORTFOLIO COMMENTARY
TWELVE MONTHS ENDED DECEMBER 31, 2013 (Unaudited)
| REPORTING PERIOD RETURN: | ||||
| Portfolio (Class 1 Shares)* | 32.30% | |||
| Russell Midcap Value Index | 33.46% | |||
| Net Assets as of 12/31/2013 | $ | 408,782,236 | ||
INVESTMENT OBJECTIVE**
The JPMorgan Insurance Trust Mid Cap Value Portfolio (the “Portfolio”) seeks capital appreciation with the secondary goal of achieving current income by investing primarily in equity securities.
HOW DID THE MARKET PERFORM?
Overall, the U.S. equity market performed strongly during the 12 months ended December 31, 2013, as a tepid economic recovery continued to gain strength from healthy corporate earnings, along with improvements in employment, housing and consumer sentiment. The Russell Midcap Value Index (“Benchmark”) retreated at mid-year amid investor uncertainty about the U.S. Federal Reserve Board’s (“Fed”) intent to taper off its monthly purchases of $85 billion in Treasuries and mortgage-backed securities. Interest rates rose sharply higher, pressuring prices for both stocks and bonds. Partisan brinkmanship in Washington added to the uncertainty, starting with the standoff over the so-called fiscal cliff in January and followed by the partial shutdown of the federal government in October. A bipartisan budget agreement toward the end of the year relieved some of the political uncertainty. During the year, the U.S. unemployment rate fell from 7.9% in January to 6.7% by the end of the year, with slight upticks in joblessness at mid-year and in October. Adding to the positive trend were advances in housing prices and auto sales in the second half of the year, and a rebound in consumer sentiment to a five-month high in December. The Benchmark returned 33.46% for the year.
WHAT WERE THE MAIN DRIVERS OF THE PORTFOLIO’S PERFORMANCE?
The Portfolio (Class 1 Shares) underperformed the Benchmark for the 12 months ended December 31, 2013. Stock selection in the industrials and information technology sectors detracted from relative performance. The Portfolio’s stock selection in the
financials sector and its overweight allocation to the consumer discretionary sector positively contributed to relative performance.
The leading individual detractors from relative performance included three stocks that were in the Benchmark but not in the Portfolio during the reporting period: Micron Technology, Inc., a manufacturer and marketer of semiconductor devices, Boston Scientific Co., a developer, manufacturer and marketer of medical devices, and Western Digital Corp., a maker of a range of data storage products. The shares of all three companies performed well during the reporting period and not owning them was detrimental to the Portfolio’s relative performance.
Individual contributors to relative performance included Ameriprise Financial Inc., Energen Corp. and Cigna Corp. Shares of Ameriprise, a financial services company, gained from the overall rise in equities prices. The company’s per-share earnings were strong and net outflows from its asset management business were less than expected. Shares of Energen, a producer of natural gas and oil, rose on long-term prospects for its shale gas operations and expectations for dividend growth. Shares of Cigna, a health insurer, rose on strong earnings during the year and the acquisition of HealthSpring, which primarily serves the senior population.
HOW WAS THE PORTFOLIO POSITIONED?
The portfolio managers utilized a bottom-up approach to stock selection and sought to identify durable franchises possessing the ability to generate, in their view, sustainable levels of free cash flow. The Portfolio continued to have a large overweight position in the consumer discretionary sector, while the financials sector remained the Portfolio’s largest underweight, largely due to an underweighting of real estate investment trusts (REITs) based on their valuations, although the portfolio managers have slowly and selectively added some positions in certain REITs with niche business models.
| 2 | JPMORGAN INSURANCE TRUST | DECEMBER 31, 2013 | ||||
Table of Contents
| TOP TEN EQUITY HOLDINGS OF THE PORTFOLIO*** | ||||||||
| 1. | Ball Corp. | 2.0 | % | |||||
| 2. | Marsh & McLennan Cos., Inc. | 1.8 | ||||||
| 3. | Loews Corp. | 1.7 | ||||||
| 4. | Amphenol Corp., Class A | 1.6 | ||||||
| 5. | Ameriprise Financial, Inc. | 1.6 | ||||||
| 6. | AutoZone, Inc. | 1.5 | ||||||
| 7. | Kohl’s Corp. | 1.5 | ||||||
| 8. | Fifth Third Bancorp | 1.5 | ||||||
| 9. | Gap, Inc. (The) | 1.5 | ||||||
| 10. | Arrow Electronics, Inc. | 1.4 | ||||||
PORTFOLIO COMPOSITION BY SECTOR*** | ||||
| Financials | 26.8 | % | ||
| Consumer Discretionary | 19.9 | |||
| Industrials | 10.1 | |||
| Information Technology | 9.5 | |||
| Utilities | 9.0 | |||
| Materials | 7.7 | |||
| Health Care | 4.7 | |||
| Consumer Staples | 4.6 | |||
| Energy | 4.6 | |||
| Short-Term Investment | 3.1 | |||
| * | The return shown is based on net asset values calculated for shareholder transactions and may differ from the return shown in the financial highlights, which reflects adjustments made to the net asset values in accordance with accounting principles generally accepted in the United States of America. |
| ** | The adviser seeks to achieve the Portfolio’s objective. There can be no guarantee it will be achieved. |
| *** | Percentages indicated are based on total investments as of December 31, 2013. The Portfolio’s composition is subject to change. |
| DECEMBER 31, 2013 | JPMORGAN INSURANCE TRUST | 3 | ||||||
Table of Contents
JPMorgan Insurance Trust Mid Cap Value Portfolio
PORTFOLIO COMMENTARY
TWELVE MONTHS ENDED DECEMBER 31, 2013 (Unaudited) (continued)
AVERAGE ANNUAL TOTAL RETURNS AS OF DECEMBER 31, 2013 | ||||||||||||||||
| INCEPTION DATE OF CLASS | 1 YEAR | 5 YEAR | 10 YEAR | |||||||||||||
CLASS 1 SHARES | 9/28/01 | 32.30 | % | 20.54 | % | 10.40 | % | |||||||||
TEN YEAR PERFORMANCE (12/31/03 TO 12/31/13)
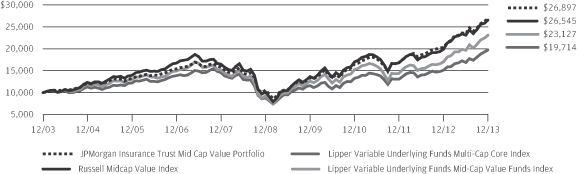
The performance quoted is past performance and is not a guarantee of future results. Mutual funds are subject to certain market risks. Investment returns and principal value of an investment will fluctuate so that an investor’s shares, when redeemed, may be worth more or less than their original cost. Current performance may be higher or lower than the performance data shown. For up-to-date month-end performance information please call 1-800-480-4111.
Inception date for JPMorgan Insurance Trust Mid Cap Value Portfolio is September 28, 2001, which is the inception date of JPMorgan Mid Cap Value Portfolio (“Predecessor Portfolio”). JPMorgan Insurance Trust Mid Cap Value Portfolio acquired all of the assets and liabilities of the Predecessor Portfolio in a reorganization on April 24, 2009. The Predecessor Portfolio’s performance and financial history have been adopted by JPMorgan Insurance Trust Mid Cap Value Portfolio and have been used since the reorganization. As a result, the performance prior to April 25, 2009 is the performance of the Predecessor Portfolio.
The graph illustrates comparative performance for $10,000 invested in Class 1 Shares of the JPMorgan Insurance Trust Mid Cap Value Portfolio, the Russell Midcap Value Index, the Lipper Variable Underlying Funds Multi-Cap Core Index and the Lipper Variable Underlying Funds Mid-Cap Value Funds Index from December 31, 2003 to December 31, 2013. The performance of the Portfolio assumes reinvestment of all dividends and capital gain distributions, if any. The performance of the Russell Midcap Value Index does not reflect the
deduction of expenses associated with a mutual fund and has been adjusted to reflect reinvestment of all dividends and capital gain distributions of the securities included in the benchmark, if applicable. The performance of the Lipper Variable Underlying Funds Multi-Cap Core Index and the Lipper Variable Underlying Funds Mid-Cap Value Funds Index includes expenses associated with a mutual fund, such as investment management fees. These expenses are not identical to expenses incurred by the Portfolio. The Russell Midcap Value Index is an unmanaged index which measures the performance of those Russell Midcap companies with lower price-to-book ratios and lower forecasted growth values. The Lipper Variable Underlying Funds Multi-Cap Core Index and the Lipper Variable Underlying Funds Mid-Cap Value Funds Index are indices based on the total returns of certain mutual funds within the Portfolio’s designated category as determined by Lipper, Inc. Investors cannot invest directly in an index.
Portfolio performance does not reflect any charges imposed by the Policies or Eligible Plans. If these charges were included, the returns would be lower than shown. Portfolio performance may reflect the waiver of the Portfolio’s fees and reimbursement of expenses for certain periods since the inception date. Without these waivers and reimbursements, performance would have been lower.
The returns shown are based on net asset values calculated for shareholder transactions and may differ from the returns shown in the financial highlights, which reflect adjustments made to the net asset values in accordance with accounting principles generally accepted in the United States of America.
| 4 | JPMORGAN INSURANCE TRUST | DECEMBER 31, 2013 | ||||
Table of Contents
JPMorgan Insurance Trust Mid Cap Value Portfolio
SCHEDULE OF PORTFOLIO INVESTMENTS
AS OF DECEMBER 31, 2013
| SHARES | SECURITY DESCRIPTION | VALUE($) | ||||||
| Common Stocks — 97.1% |
| ||||||
Consumer Discretionary — 20.0% | ||||||||
Distributors — 0.5% | ||||||||
| 23,910 | Genuine Parts Co. | 1,989,073 | ||||||
|
| |||||||
Hotels, Restaurants & Leisure — 1.9% | ||||||||
| 13,132 | Darden Restaurants, Inc. | 713,987 | ||||||
| 13,200 | Extended Stay America, Inc. (a) | 346,632 | ||||||
| 79,996 | Marriott International, Inc., Class A | 3,948,602 | ||||||
| 40,400 | Yum! Brands, Inc. | 3,054,644 | ||||||
|
| |||||||
| 8,063,865 | ||||||||
|
| |||||||
Household Durables — 2.0% | ||||||||
| 59,560 | Jarden Corp. (a) | 3,654,006 | ||||||
| 29,640 | Mohawk Industries, Inc. (a) | 4,413,396 | ||||||
|
| |||||||
| 8,067,402 | ||||||||
|
| |||||||
Internet & Catalog Retail — 1.6% | ||||||||
| 81,690 | Expedia, Inc. | 5,690,525 | ||||||
| 11,090 | TripAdvisor, Inc. (a) | 918,585 | ||||||
|
| |||||||
| 6,609,110 | ||||||||
|
| |||||||
Media — 3.1% | ||||||||
| 49,590 | CBS Corp. (Non-Voting), Class B | 3,160,867 | ||||||
| 93,704 | Clear Channel Outdoor Holdings, Inc., Class A | 950,158 | ||||||
| 99,470 | DISH Network Corp., Class A (a) | 5,761,302 | ||||||
| 92,520 | Gannett Co., Inc. | 2,736,742 | ||||||
|
| |||||||
| 12,609,069 | ||||||||
|
| |||||||
Multiline Retail — 2.5% | ||||||||
| 59,580 | Family Dollar Stores, Inc. | 3,870,913 | ||||||
| 111,440 | Kohl’s Corp. | 6,324,220 | ||||||
|
| |||||||
| 10,195,133 | ||||||||
|
| |||||||
Specialty Retail — 6.9% | ||||||||
| 13,250 | AutoZone, Inc. (a) | 6,332,705 | ||||||
| 41,330 | Bed Bath & Beyond, Inc. (a) | 3,318,799 | ||||||
| 152,790 | Gap, Inc. (The) | 5,971,033 | ||||||
| 60,260 | PetSmart, Inc. | 4,383,915 | ||||||
| 27,550 | Tiffany & Co. | 2,556,089 | ||||||
| 57,690 | TJX Cos., Inc. | 3,676,584 | ||||||
| 32,570 | Williams-Sonoma, Inc. | 1,898,180 | ||||||
|
| |||||||
| 28,137,305 | ||||||||
|
| |||||||
Textiles, Apparel & Luxury Goods — 1.5% | ||||||||
| 30,850 | PVH Corp. | 4,196,217 | ||||||
| 29,280 | V.F. Corp. | 1,825,315 | ||||||
|
| |||||||
| 6,021,532 | ||||||||
|
| |||||||
Total Consumer Discretionary | 81,692,489 | |||||||
|
| |||||||
| SHARES | SECURITY DESCRIPTION | VALUE($) | ||||||
Consumer Staples — 4.6% | ||||||||
Beverages — 2.2% | ||||||||
| 54,650 | Beam, Inc. | 3,719,479 | ||||||
| 15,903 | Brown-Forman Corp., Class B | 1,201,790 | ||||||
| 84,401 | Dr. Pepper Snapple Group, Inc. | 4,112,017 | ||||||
|
| |||||||
| 9,033,286 | ||||||||
|
| |||||||
Food & Staples Retailing — 0.9% | ||||||||
| 96,427 | Kroger Co. (The) | 3,811,759 | ||||||
|
| |||||||
Food Products — 0.7% | ||||||||
| 30,730 | Hershey Co. (The) | 2,987,878 | ||||||
|
| |||||||
Household Products — 0.8% | ||||||||
| 28,430 | Energizer Holdings, Inc. | 3,077,263 | ||||||
|
| |||||||
Total Consumer Staples | 18,910,186 | |||||||
|
| |||||||
Energy — 4.6% | ||||||||
Oil, Gas & Consumable Fuels — 4.6% | ||||||||
| 61,080 | Energen Corp. | 4,321,410 | ||||||
| 38,970 | EQT Corp. | 3,498,726 | ||||||
| 87,830 | PBF Energy, Inc., Class A | 2,763,132 | ||||||
| 103,500 | QEP Resources, Inc. | 3,172,275 | ||||||
| 46,220 | Southwestern Energy Co. (a) | 1,817,833 | ||||||
| 80,920 | Williams Cos., Inc. (The) | 3,121,084 | ||||||
|
| |||||||
Total Energy | 18,694,460 | |||||||
|
| |||||||
Financials — 26.9% | ||||||||
Capital Markets — 5.0% | ||||||||
| 55,360 | Ameriprise Financial, Inc. | 6,369,168 | ||||||
| 111,720 | Invesco Ltd. | 4,066,608 | ||||||
| 36,050 | Legg Mason, Inc. | 1,567,454 | ||||||
| 64,050 | Northern Trust Corp. | 3,964,054 | ||||||
| 55,200 | T. Rowe Price Group, Inc. | 4,624,104 | ||||||
|
| |||||||
| 20,591,388 | ||||||||
|
| |||||||
Commercial Banks — 6.3% | ||||||||
| 38,370 | City National Corp. | 3,039,671 | ||||||
| 13,230 | Cullen/Frost Bankers, Inc. | 984,709 | ||||||
| 287,780 | Fifth Third Bancorp | 6,052,013 | ||||||
| 46,450 | First Republic Bank | 2,431,658 | ||||||
| 193,920 | Huntington Bancshares, Inc. | 1,871,328 | ||||||
| 42,440 | M&T Bank Corp. | 4,940,865 | ||||||
| 125,300 | SunTrust Banks, Inc. | 4,612,293 | ||||||
| 65,830 | Zions Bancorporation | 1,972,267 | ||||||
|
| |||||||
| 25,904,804 | ||||||||
|
| |||||||
Insurance — 9.2% | ||||||||
| 6,978 | Alleghany Corp. (a) | 2,790,921 | ||||||
SEE NOTES TO FINANCIAL STATEMENTS.
| DECEMBER 31, 2013 | JPMORGAN INSURANCE TRUST | 5 | ||||||
Table of Contents
JPMorgan Insurance Trust Mid Cap Value Portfolio
SCHEDULE OF PORTFOLIO INVESTMENTS
AS OF DECEMBER 31, 2013 (continued)
| SHARES | SECURITY DESCRIPTION | VALUE($) | ||||||
| Common Stocks — Continued |
| ||||||
Insurance — Continued | ||||||||
| 29,650 | Chubb Corp. (The) | 2,865,079 | ||||||
| 99,850 | Hartford Financial Services Group, Inc. | 3,617,566 | ||||||
| 147,380 | Loews Corp. | 7,109,611 | ||||||
| 155,480 | Marsh & McLennan Cos., Inc. | 7,519,013 | ||||||
| 175,774 | Old Republic International Corp. | 3,035,617 | ||||||
| 106,410 | Unum Group | 3,732,863 | ||||||
| 74,200 | W.R. Berkley Corp. | 3,219,538 | ||||||
| 109,680 | XL Group plc, (Ireland) | 3,492,211 | ||||||
|
| |||||||
| 37,382,419 | ||||||||
|
| |||||||
Real Estate Investment Trusts (REITs) — 5.4% |
| |||||||
| 59,250 | American Campus Communities, Inc. | 1,908,442 | ||||||
| 121,091 | American Homes 4 Rent, Class A | 1,961,674 | ||||||
| 19,870 | AvalonBay Communities, Inc. | 2,349,230 | ||||||
| 49,790 | Brixmor Property Group, Inc. (a) | 1,012,231 | ||||||
| 75,690 | HCP, Inc. | 2,749,061 | ||||||
| 187,420 | Kimco Realty Corp. | 3,701,545 | ||||||
| 48,255 | Rayonier, Inc. | 2,031,536 | ||||||
| 50,220 | Regency Centers Corp. | 2,325,186 | ||||||
| 46,324 | Vornado Realty Trust | 4,113,108 | ||||||
|
| |||||||
| 22,152,013 | ||||||||
|
| |||||||
Real Estate Management & Development — 0.7% |
| |||||||
| 143,990 | Brookfield Office Properties, Inc. | 2,771,808 | ||||||
|
| |||||||
Thrifts & Mortgage Finance — 0.3% | ||||||||
| 106,000 | Hudson City Bancorp, Inc. | 999,580 | ||||||
|
| |||||||
Total Financials | 109,802,012 | |||||||
|
| |||||||
Health Care — 4.7% | ||||||||
Health Care Equipment & Supplies — 0.8% |
| |||||||
| 80,450 | CareFusion Corp. (a) | 3,203,519 | ||||||
|
| |||||||
Health Care Providers & Services — 3.9% | ||||||||
| 59,040 | AmerisourceBergen Corp. | 4,151,103 | ||||||
| 63,130 | Cigna Corp. | 5,522,612 | ||||||
| 22,570 | Henry Schein, Inc. (a) | 2,578,848 | ||||||
| 36,100 | Humana, Inc. | 3,726,242 | ||||||
|
| |||||||
| 15,978,805 | ||||||||
|
| |||||||
Total Health Care | 19,182,324 | |||||||
|
| |||||||
Industrials — 10.1% | ||||||||
Building Products — 0.7% | ||||||||
| 65,520 | Fortune Brands Home & Security, Inc. | 2,994,264 | ||||||
|
| |||||||
Electrical Equipment — 3.0% | ||||||||
| 81,590 | AMETEK, Inc. | 4,297,345 | ||||||
| 29,880 | Hubbell, Inc., Class B | 3,253,932 | ||||||
| 62,920 | Regal-Beloit Corp. | 4,638,463 | ||||||
|
| |||||||
| 12,189,740 | ||||||||
|
| |||||||
| SHARES | SECURITY DESCRIPTION | VALUE($) | ||||||
Industrial Conglomerates — 1.2% | ||||||||
| 64,850 | Carlisle Cos., Inc. | 5,149,090 | ||||||
|
| |||||||
Machinery — 2.9% | ||||||||
| 69,860 | IDEX Corp. | 5,159,161 | ||||||
| 81,630 | Rexnord Corp. (a) | 2,204,826 | ||||||
| 41,060 | Snap-on, Inc. | 4,496,891 | ||||||
|
| |||||||
| 11,860,878 | ||||||||
|
| |||||||
Professional Services — 1.2% | ||||||||
| 69,730 | Equifax, Inc. | 4,817,646 | ||||||
|
| |||||||
Trading Companies & Distributors — 1.1% | ||||||||
| 55,120 | MSC Industrial Direct Co., Inc., Class A | 4,457,554 | ||||||
|
| |||||||
Total Industrials | 41,469,172 | |||||||
|
| |||||||
Information Technology — 9.5% | ||||||||
Communications Equipment — 0.5% | ||||||||
| 97,410 | CommScope Holding Co., Inc. (a) | 1,842,997 | ||||||
|
| |||||||
Electronic Equipment, Instruments & Components — 3.0% |
| |||||||
| 72,870 | Amphenol Corp., Class A | 6,498,547 | ||||||
| 109,510 | Arrow Electronics, Inc. (a) | 5,940,917 | ||||||
|
| |||||||
| 12,439,464 | ||||||||
|
| |||||||
IT Services — 1.4% | ||||||||
| 95,430 | Jack Henry & Associates, Inc. | 5,650,410 | ||||||
|
| |||||||
Semiconductors & Semiconductor Equipment — 3.5% |
| |||||||
| 112,930 | Analog Devices, Inc. | 5,751,525 | ||||||
| 57,670 | KLA-Tencor Corp. | 3,717,408 | ||||||
| 107,060 | Xilinx, Inc. | 4,916,195 | ||||||
|
| |||||||
| 14,385,128 | ||||||||
|
| |||||||
Software — 1.1% | ||||||||
| 109,620 | Synopsys, Inc. (a) | 4,447,284 | ||||||
|
| |||||||
Total Information Technology | 38,765,283 | |||||||
|
| |||||||
Materials — 7.7% | ||||||||
Chemicals — 3.9% | ||||||||
| 45,870 | Airgas, Inc. | 5,130,560 | ||||||
| 75,616 | Albemarle Corp. | 4,793,298 | ||||||
| 10,820 | Sherwin-Williams Co. (The) | 1,985,470 | ||||||
| 44,890 | Sigma-Aldrich Corp. | 4,220,109 | ||||||
|
| |||||||
| 16,129,437 | ||||||||
|
| |||||||
Containers & Packaging — 3.8% | ||||||||
| 155,800 | Ball Corp. | 8,048,628 | ||||||
| 34,630 | Rock Tenn Co., Class A | 3,636,496 | ||||||
| 77,250 | Silgan Holdings, Inc. | 3,709,545 | ||||||
|
| |||||||
| 15,394,669 | ||||||||
|
| |||||||
Total Materials | 31,524,106 | |||||||
|
| |||||||
SEE NOTES TO FINANCIAL STATEMENTS.
| 6 | JPMORGAN INSURANCE TRUST | DECEMBER 31, 2013 | ||||
Table of Contents
JPMorgan Insurance Trust Mid Cap Value Portfolio
SCHEDULE OF PORTFOLIO INVESTMENTS
AS OF DECEMBER 31, 2013 (continued)
| SHARES | SECURITY DESCRIPTION | VALUE($) | ||||||
| Common Stocks — Continued | |||||||
Utilities — 9.0% | ||||||||
Electric Utilities — 2.7% | ||||||||
| 74,340 | Edison International | 3,441,942 | ||||||
| 125,020 | Westar Energy, Inc. | 4,021,894 | ||||||
| 134,260 | Xcel Energy, Inc. | 3,751,224 | ||||||
|
| |||||||
| 11,215,060 | ||||||||
|
| |||||||
Gas Utilities — 1.5% | ||||||||
| 34,440 | National Fuel Gas Co. | 2,459,016 | ||||||
| 154,690 | Questar Corp. | 3,556,323 | ||||||
|
| |||||||
| 6,015,339 | ||||||||
|
| |||||||
Multi-Utilities — 4.8% | ||||||||
| 158,520 | CenterPoint Energy, Inc. | 3,674,494 | ||||||
| 147,090 | CMS Energy Corp. | 3,937,599 | ||||||
| 118,770 | NiSource, Inc. | 3,905,158 | ||||||
| 56,620 | Sempra Energy | 5,082,211 | ||||||
| 76,730 | Wisconsin Energy Corp. | 3,172,018 | ||||||
|
| |||||||
| 19,771,480 | ||||||||
|
| |||||||
Total Utilities | 37,001,879 | |||||||
|
| |||||||
Total Common Stocks | 397,041,911 | |||||||
|
| |||||||
| SHARES | SECURITY DESCRIPTION | VALUE($) | ||||||
| Short-Term Investment — 3.1% | |||||||
Investment Company — 3.1% | ||||||||
| 12,654,347 | JPMorgan Prime Money Market Fund, Institutional Class Shares, | 12,654,347 | ||||||
|
| |||||||
Total Investments — 100.2% | 409,696,258 | |||||||
Liabilities in Excess of | (914,022 | ) | ||||||
|
| |||||||
NET ASSETS — 100.0% | $ | 408,782,236 | ||||||
|
| |||||||
Percentages indicated are based on net assets.
NOTES TO SCHEDULE OF PORTFOLIO INVESTMENTS:
| (a) | — Non-income producing security. | |
| (b) | — Investment in affiliate. Money market fund registered under the Investment Company Act of 1940, as amended, and advised by J.P. Morgan Investment Management Inc. | |
| (l) | — The rate shown is the current yield as of December 31, 2013. | |
| (m) | — All or a portion of this security is reserved and/or pledged with the custodian for current or potential holdings of futures, swaps, options, TBAs, when-issued securities, delayed delivery securities, reverse repurchase agreements, unfunded commitments and/or forward foreign currency exchange contracts. |
SEE NOTES TO FINANCIAL STATEMENTS.
| DECEMBER 31, 2013 | JPMORGAN INSURANCE TRUST | 7 | ||||||
Table of Contents
STATEMENT OF ASSETS AND LIABILITIES
AS OF DECEMBER 31, 2013
| Mid Cap Value Portfolio | ||||
ASSETS: | ||||
Investments in non-affiliates, at value | $ | 397,041,911 | ||
Investments in affiliates, at value | 12,654,347 | |||
|
| |||
Total investment securities, at value | 409,696,258 | |||
Receivables: | ||||
Investment securities sold | 438,849 | |||
Portfolio shares sold | 336,595 | |||
Dividends from non-affiliates | 467,414 | |||
Dividends from affiliates | 194 | |||
|
| |||
Total Assets | 410,939,310 | |||
|
| |||
LIABILITIES: | ||||
Payables: | ||||
Investment securities purchased | 486,367 | |||
Portfolio shares redeemed | 1,376,496 | |||
Accrued liabilities: | ||||
Investment advisory fees | 218,606 | |||
Administration fees | 28,659 | |||
Custodian and accounting fees | 10,690 | |||
Trustees’ and Chief Compliance Officer’s fees | 267 | |||
Other | 35,989 | |||
|
| |||
Total Liabilities | 2,157,074 | |||
|
| |||
Net Assets | $ | 408,782,236 | ||
|
| |||
NET ASSETS: | ||||
Paid-in-Capital | $ | 242,636,859 | ||
Accumulated undistributed net investment income | 3,349,142 | |||
Accumulated net realized gains (losses) | 15,475,012 | |||
Net unrealized appreciation (depreciation) | 147,321,223 | |||
|
| |||
Total Net Assets | $ | 408,782,236 | ||
|
| |||
Outstanding units of beneficial interest (shares) | 38,658,279 | |||
Net Asset Value, offering and redemption price per share (a) | $ | 10.57 | ||
Cost of investments in non-affiliates | $ | 249,720,688 | ||
Cost of investments in affiliates | 12,654,347 | |||
| (a) | Per share amounts may not recalculate due to rounding of net assets and/or shares outstanding. |
SEE NOTES TO FINANCIAL STATEMENTS.
| 8 | JPMORGAN INSURANCE TRUST | DECEMBER 31, 2013 | ||||
Table of Contents
STATEMENT OF OPERATIONS
FOR THE YEAR ENDED DECEMBER 31, 2013
| Mid Cap Value Portfolio | ||||
INVESTMENT INCOME: | ||||
Dividend income from non-affiliates | $ | 6,113,837 | ||
Dividend income from affiliates | 4,968 | |||
|
| |||
Total investment income | 6,118,805 | |||
|
| |||
EXPENSES: | ||||
Investment advisory fees | 2,310,422 | |||
Administration fees | 299,381 | |||
Custodian and accounting fees | 30,953 | |||
Professional fees | 47,063 | |||
Trustees’ and Chief Compliance Officer’s fees | 3,987 | |||
Printing and mailing costs | 28,513 | |||
Transfer agent fees | 7,451 | |||
Other | 34,822 | |||
|
| |||
Total expenses | 2,762,592 | |||
|
| |||
Less amounts waived | (24,913 | ) | ||
|
| |||
Net expenses | 2,737,679 | |||
|
| |||
Net investment income (loss) | 3,381,126 | |||
|
| |||
REALIZED/UNREALIZED GAINS (LOSSES): | ||||
Net realized gain (loss) on transactions from investments in non-affiliates | 24,547,256 | |||
Change in net unrealized appreciation/depreciation of investments in non-affiliates | 69,447,842 | |||
|
| |||
Net realized/unrealized gains (losses) | 93,995,098 | |||
|
| |||
Change in net assets resulting from operations | 97,376,224 | |||
|
| |||
SEE NOTES TO FINANCIAL STATEMENTS.
| DECEMBER 31, 2013 | JPMORGAN INSURANCE TRUST | 9 | ||||||
Table of Contents
STATEMENTS OF CHANGES IN NET ASSETS
FOR THE PERIODS INDICATED
| Mid Cap Value Portfolio | ||||||||
| Year Ended 12/31/2013 | Year Ended 12/31/2012 | |||||||
CHANGE IN NET ASSETS RESULTING FROM OPERATIONS: | ||||||||
Net investment income (loss) | $ | 3,381,126 | $ | 3,638,284 | ||||
Net realized gain (loss) | 24,547,256 | 19,429,054 | ||||||
Change in net unrealized appreciation/depreciation | 69,447,842 | 28,356,212 | ||||||
|
|
|
| |||||
Change in net assets resulting from operations | 97,376,224 | 51,423,550 | ||||||
|
|
|
| |||||
DISTRIBUTIONS TO SHAREHOLDERS: | ||||||||
From net investment income | (3,553,610 | ) | (2,911,958 | ) | ||||
From net realized gains | (3,818,800 | ) | — | |||||
|
|
|
| |||||
Total distributions to shareholders | (7,372,410 | ) | (2,911,958 | ) | ||||
|
|
|
| |||||
CAPITAL TRANSACTIONS: | ||||||||
Change in net assets resulting from capital transactions | 21,383,536 | (5,495,491 | ) | |||||
|
|
|
| |||||
NET ASSETS: | ||||||||
Change in net assets | 111,387,350 | 43,016,101 | ||||||
Beginning of period | 297,394,886 | 254,378,785 | ||||||
|
|
|
| |||||
End of period | $ | 408,782,236 | $ | 297,394,886 | ||||
|
|
|
| |||||
Accumulated undistributed net investment income | $ | 3,349,142 | $ | 3,583,722 | ||||
|
|
|
| |||||
CAPITAL TRANSACTIONS: | ||||||||
Proceeds from shares issued | $ | 92,390,380 | $ | 58,715,688 | ||||
Dividends and distributions reinvested | 7,372,410 | 2,911,958 | ||||||
Cost of shares redeemed | (78,379,254 | ) | (67,123,137 | ) | ||||
|
|
|
| |||||
Change in net assets resulting from capital transactions | $ | 21,383,536 | $ | (5,495,491 | ) | |||
|
|
|
| |||||
SHARE TRANSACTIONS: | ||||||||
Issued | 9,778,101 | 7,685,775 | ||||||
Reinvested | 824,654 | 392,977 | ||||||
Redeemed | (8,326,183 | ) | (8,799,999 | ) | ||||
|
|
|
| |||||
Change in Shares | 2,276,572 | (721,247 | ) | |||||
|
|
|
| |||||
SEE NOTES TO FINANCIAL STATEMENTS.
| 10 | JPMORGAN INSURANCE TRUST | DECEMBER 31, 2013 | ||||
Table of Contents
THIS PAGE IS INTENTIONALLY LEFT BLANK
| DECEMBER 31, 2013 | JPMORGAN INSURANCE TRUST | 11 | ||||||
Table of Contents
FOR THE PERIODS INDICATED
| Per share operating performance | |||||||||||||||||||||||||||
| Investment operations | Distributions | |||||||||||||||||||||||||||
| Net asset value, beginning of period | Net investment income (loss) | Net realized and unrealized gains (losses) on investments | Total from investment operations | Net investment income | Net realized gain | Total distributions | ||||||||||||||||||||||
Mid Cap Value Portfolio (d) |
| |||||||||||||||||||||||||||
Year Ended December 31, 2013 | $ | 8.17 | $ | 0.09 | $ | 2.51 | $ | 2.60 | $ | (0.10 | ) | $ | (0.10 | ) | $ | (0.20 | ) | |||||||||||
Year Ended December 31, 2012 | 6.86 | 0.10 | 1.29 | 1.39 | (0.08 | ) | — | (0.08 | ) | |||||||||||||||||||
Year Ended December 31, 2011 | 6.80 | 0.09 | 0.06 | 0.15 | (0.09 | ) | — | (0.09 | ) | |||||||||||||||||||
Year Ended December 31, 2010 | 5.57 | 0.09 | 1.21 | 1.30 | (0.07 | ) | — | (0.07 | ) | |||||||||||||||||||
Year Ended December 31, 2009* | 4.52 | 0.09 | 1.08 | 1.17 | (0.11 | ) | (0.01 | ) | (0.12 | ) | ||||||||||||||||||
| (a) | Includes adjustments in accordance with accounting principles generally accepted in the United States of America and as such, the net asset values for financial reporting purposes and the returns based upon those net asset values may differ from the net asset values and returns for shareholder transactions. |
| (b) | Includes earnings credits and interest expense, if applicable, each of which is less than 0.01% unless otherwise noted. |
| (c) | Portfolio turnover is calculated by dividing the lesser of total purchases or sales of portfolio securities for the reporting period by the monthly average value of portfolio securities owned during the reporting period. Excluded from both the numerator and denominator are amounts relating to derivatives and securities whose maturities or expiration dates at the time of acquisition were one year or less. |
| (d) | Mid Cap Value Portfolio acquired all of the assets and liabilities of JPMorgan Mid Cap Value Portfolio (“Predecessor Portfolio”) in a reorganization on April 24, 2009. The Predecessor Portfolio’s performance and financial history have been adopted by Mid Cap Value Portfolio and have been used since the reorganization. As a result, the financial highlights information reflects that of the Predecessor Portfolio for the periods prior to its reorganization with Mid Cap Value Portfolio. |
| * | Reflects a 4.187:1 stock split that occurred on April 24, 2009. All per share amounts presented for periods prior to the stock split have been adjusted to reflect the stock split. |
SEE NOTES TO FINANCIAL STATEMENTS.
| 12 | JPMORGAN INSURANCE TRUST | DECEMBER 31, 2013 | ||||
Table of Contents
| Ratios/Supplemental data | |||||||||||||||||||||||||
| Ratios to average net assets | ||||||||||||||||||||||||||
| Net asset value, end of period | Total return (a) | Net assets, end of period | Net expenses (b) | Net investment income (loss) | Expenses without waivers, reimbursements and earnings credits | Portfolio turnover rate (c) | ||||||||||||||||||||
| $ | 10.57 | 32.30 | % | $ | 408,782,236 | 0.77 | % | 0.95 | % | 0.78 | % | 26 | % | |||||||||||||
| 8.17 | 20.38 | 297,394,886 | 0.78 | 1.30 | 0.79 | 30 | ||||||||||||||||||||
| 6.86 | 2.16 | 254,378,785 | 0.80 | 1.22 | 0.80 | 43 | ||||||||||||||||||||
| 6.80 | 23.45 | 257,312,179 | 0.81 | 1.36 | 0.82 | 32 | ||||||||||||||||||||
| 5.57 | 26.68 | 238,433,429 | 0.88 | 1.93 | 1.02 | 39 | ||||||||||||||||||||
SEE NOTES TO FINANCIAL STATEMENTS.
| DECEMBER 31, 2013 | JPMORGAN INSURANCE TRUST | 13 | ||||||
Table of Contents
AS OF DECEMBER 31, 2013
1. Organization
JPMorgan Insurance Trust (the “Trust”) is registered under the Investment Company Act of 1940, as amended (the “1940 Act”), as an open-end management investment company and is a Massachusetts business trust.
The following is a separate Portfolio of the Trust (the “Portfolio”) covered by this report:
| Class Offered | Diversified/Non-Diversified | |||
| Mid Cap Value Portfolio | Class 1 | Diversified |
The investment objective of the Portfolio is to seek capital appreciation with the secondary goal of achieving current income by investing primarily in equity securities.
Portfolio shares are offered only to separate accounts of participating insurance companies and Eligible Plans. Individuals may not purchase shares directly from the Portfolio.
Effective as of the close of business on May 1, 2013, the Portfolio is offered only on a limited basis. Investors are not eligible to purchase shares of the Portfolio unless they meet certain requirements as described in its prospectus.
2. Significant Accounting Policies
The following is a summary of significant accounting policies followed by the Portfolio in the preparation of its financial statements. The policies are in accordance with accounting principles generally accepted in the United States of America (“GAAP”). The preparation of financial statements requires management to make estimates and assumptions that affect the reported amounts and disclosures in the financial statements. Actual results could differ from those estimates.
A. Valuation of Investments — Equity securities listed on a North American, Central American, South American or Caribbean securities exchange shall generally be valued at the last sale price on the exchange on which the security is principally traded that is reported before the time when the net assets of the Portfolio are valued. Securities listed on the NASDAQ Stock Market LLC are generally valued at the NASDAQ Official Closing Price. Generally, short-term investments of sufficient credit quality maturing in less than 61 days are valued at amortized cost, which approximates fair value. Investments in open-end investment companies are valued at each investment company’s net asset value per share (“NAV”) as of the report date.
Certain investments of the Portfolio may, depending upon market conditions, trade in relatively thin markets and/or in markets that experience significant volatility. As a result of these conditions, the prices used by the Portfolio to value these securities may differ from the value that would be realized if these securities were sold, and the differences could be material. Futures and options are generally valued on the basis of available market quotations. Swaps and other derivatives are valued daily, primarily using independent or affiliated pricing services approved by the Board of Trustees. If valuations are not available from such pricing services or values received are deemed not representative of fair value, values will be obtained from a third party broker-dealer or counterparty.
Securities or other assets for which market quotations are not readily available or for which market quotations are deemed to not represent the fair value of the security or asset at the time of pricing (including certain illiquid securities) are fair valued in accordance with procedures established by and under the supervision and responsibility of the Board of Trustees. The Board of Trustees has established an Audit and Valuation Committee to assist with the oversight of the valuation of the Portfolio’s securities. JPMorgan Funds Management, Inc. (the “Administrator” or “JPMFM”) has established a Valuation Committee (“VC”) that is comprised of senior representatives from JPMFM, J.P. Morgan Investment Management Inc. (the “Adviser” or “JPMIM”), and J.P. Morgan Asset Management’s Legal, Compliance and Risk Management groups and the Portfolio’s Chief Compliance Officer. The VC’s responsibilities include making determinations regarding Level 3 fair value measurements (“Fair Values”) and/or providing recommendations for approval to the Board of Trustees’ Audit and Valuation Committee, in accordance with the Portfolio’s valuation policies.
The VC or Board of Trustees, as applicable, primarily employs a market-based approach which may use related or comparable assets or liabilities, recent transactions, market multiples, book values, and other relevant information for the investment to determine the fair value of the investment. The VC or Board of Trustees may also use an income-based valuation approach in which the anticipated future cash flows of the investment are discounted to calculate fair value. Discounts may also be applied due to the nature or duration of any restrictions on the disposition of the investments. Valuations may be based upon current market prices of securities that are comparable in coupon, rating, maturity and industry.
It is possible that the estimated values may differ significantly from the values that would have been used had a ready market for the investments existed, and such differences could be material. JPMFM and JPMIM are responsible for monitoring developments that may impact Fair Values and for discussing and assessing Fair Values on an ongoing, and at least a quarterly, basis with the VC and Board of Trustees, as applicable. The appropriateness of Fair Values is assessed based on results of unchanged price review and consideration of macro or security specific events, back testing, and broker and vendor due diligence.
Valuations reflected in this report are as of the report date. As a result, changes in valuation due to market events and/or issuer related events after the report date and prior to issuance of the report, are not reflected herein.
| 14 | JPMORGAN INSURANCE TRUST | DECEMBER 31, 2013 | ||||
Table of Contents
The various inputs that are used in determining the fair value of the Portfolio’s investments are summarized into the three broad levels listed below.
| Ÿ | Level 1 — quoted prices in active markets for identical securities |
| Ÿ | Level 2 — other significant observable inputs (including quoted prices for similar securities, interest rates, prepayment speeds, credit risk, etc.) |
| Ÿ | Level 3 — significant unobservable inputs (including the Portfolio’s own assumptions in determining the fair value of investments) |
A financial instrument’s level within the fair value hierarchy is based on the lowest level of any input, both individually and in the aggregate, that is significant to the fair value measurement. The inputs or methodology used for valuing securities are not necessarily an indication of the risk associated with investing in those securities.
The following table represents each valuation input as presented on the Schedule of Portfolio Investments (“SOI”):
| Level 1 Quoted prices | Level 2 Other significant observable inputs | Level 3 Significant unobservable inputs | Total | |||||||||||||
Total Investments in Securities (a) | $ | 409,696,258 | $ | — | $ | — | $ | 409,696,258 | ||||||||
|
|
|
|
|
|
|
| |||||||||
| (a) | All portfolio holdings designated as Level 1 are disclosed individually on the SOI. Please refer to the SOI for industry specifics of portfolio holdings. |
There were no transfers among any levels during the year ended December 31, 2013.
B. Security Transactions and Investment Income — Investment transactions are accounted for on the trade date (the date the order to buy or sell is executed). Securities gains and losses are calculated on a specifically identified cost basis. Interest income is determined on the basis of coupon interest accrued using the effective interest method which adjusts for amortization of premiums and accretion of discounts. Dividend income, net of foreign taxes withheld, if any, is recorded on the ex-dividend date or when the Portfolio first learns of the dividend.
To the extent such information is publicly available, the Portfolio records distributions received in excess of income earned from underlying investments as a reduction of cost of investments and/or realized gain. Such amounts are based on estimates if actual amounts are not available and actual amounts of income, realized gain and return of capital may differ from the estimated amounts. The Portfolio adjusts the estimated amounts of the components of distributions (and consequently its net investment income) as necessary once the issuers provide information about the actual composition of the distributions.
C. Allocation of Expenses — Expenses directly attributable to a portfolio are charged directly to that portfolio, while the expenses attributable to more than one portfolio of the Trust are allocated among the respective portfolios.
D. Federal Income Taxes — The Portfolio is treated as a separate taxable entity for Federal income tax purposes. The Portfolio’s policy is to comply with the provisions of the Internal Revenue Code of 1986, as amended (the “Code”), applicable to regulated investment companies and to distribute to shareholders all of its distributable net investment income and net realized capital gains on investments. Accordingly, no provision for Federal income tax is necessary. The Portfolio is also a segregated portfolio of assets for insurance purposes and intends to comply with the diversification requirements of Subchapter L of the Code. Management has reviewed the Portfolio’s tax positions for all open tax years and has determined that as of December 31, 2013, no liability for income tax is required in the Portfolio’s financial statements for net unrecognized tax benefits. However, management’s conclusions may be subject to future review based on changes in, or the interpretation of, the accounting standards or tax laws and regulations. The Portfolio’s Federal tax returns for the prior three fiscal years remain subject to examination by the Internal Revenue Service.
E. Distributions to Shareholders — Distributions from net investment income and net realized capital gains, if any, are generally declared and paid at least annually. The amount of distributions from net investment income and net realized capital gains is determined in accordance with Federal income tax regulations, which may differ from GAAP. To the extent these “book/tax” differences are permanent in nature (i.e., that they result from other than timing of recognition — “temporary differences”), such amounts are reclassified within the capital accounts based on their Federal tax-basis treatment.
The following amounts were reclassified within the capital accounts:
| Paid-in-Capital | Accumulated Undistributed Net Investment Income | Accumulated Net Realized Gains (Losses) | ||||||||||
| $ | (89,297 | ) | $ | (62,096 | ) | $ | 151,393 | |||||
The reclassifications for the Portfolio relate primarily to expiration of capital loss carryforwards.
3. Fees and Other Transactions with Affiliates
A. Investment Advisory Fee — Pursuant to the Investment Advisory Agreement, the Adviser, an indirect, wholly-owned subsidiary of JPMorgan Chase & Co. (“JPMorgan”), supervises the investments of the Portfolio and for such services is paid a fee. The fee is accrued daily and paid monthly based on the Portfolio’s average daily net assets at an annual rate of 0.65%.
| DECEMBER 31, 2013 | JPMORGAN INSURANCE TRUST | 15 | ||||||
Table of Contents
NOTES TO FINANCIAL STATEMENTS
AS OF DECEMBER 31, 2013 (continued)
The Adviser waived Investment Advisory fees and/or reimbursed expenses as outlined in Note 3.E.
B. Administration Fee — Pursuant to an Administration Agreement, the Administrator, an indirect, wholly-owned subsidiary of JPMorgan, provides certain administration services to the Portfolio. In consideration of these services, the Administrator receives a fee accrued daily and paid monthly at an annual rate of 0.15% of the first $25 billion of the average daily net assets of all funds in the J.P. Morgan Funds Complex covered by the Administration Agreement (excluding certain funds of funds and money market funds) and 0.075% of the average daily net assets in excess of $25 billion of all such funds. For the year ended December 31, 2013, the effective rate was 0.08% of the Portfolio’s average daily net assets, notwithstanding any fee waivers and/or expense reimbursements.
JPMorgan Chase Bank, N.A. (“JPMCB”), a wholly-owned subsidiary of JPMorgan, serves as the Portfolio’s sub-administrator (the “Sub-administrator”). For its services as Sub-administrator, JPMCB receives a portion of the fees payable to the Administrator.
The Administrator waived Administration fees as outlined in Note 3.E
C. Distribution Fees — Pursuant to a Distribution Agreement, JPMorgan Distribution Services, Inc. (the “Distributor”), a wholly-owned subsidiary of JPMorgan, serves as the Trust’s exclusive underwriter and promotes and arranges for the sale of the Portfolio’s shares. The Distributor receives no compensation in its capacity as the Portfolio’s underwriter.
D. Custodian and Accounting Fees — JPMCB provides portfolio custody and accounting services to the Portfolio. The amounts paid directly to JPMCB by the Portfolio for custody and accounting services are included in Custodian and accounting fees in the Statement of Operations. Payments to the custodian may be reduced by credits earned by the Portfolio, based on uninvested cash balances held by the custodian. Such earnings credits, if any, are presented separately in the Statement of Operations.
Interest expense, if any, paid to the custodian related to cash overdrafts is included in Interest expense to affiliates in the Statement of Operations.
E. Waivers and Reimbursements — The Adviser and Administrator have contractually agreed to waive fees and/or reimburse the Portfolio to the extent that total annual operating expenses (excluding acquired fund fees and expenses, dividend expenses related to short sales, interest, taxes, expenses related to litigation and potential litigation, extraordinary expenses and expenses related to the Board of Trustees’ deferred compensation plan) exceed 0.90% of the Portfolio’s average daily net assets.
The expense limitation agreement was in effect for the year ended December 31, 2013. The contractual expense limitation percentage above is in place until at least April 30, 2014.
For the year ended December 31, 2013, the Portfolio’s service providers waived fees for the Portfolio as follows. None of these parties expect the Portfolio to repay any such waived fees in future years.
| Voluntary Waivers | ||||||
Investment Advisory | Total | |||||
| $ 163 | $ | 163 | ||||
Additionally, the Portfolio may invest in one or more money market funds advised by the Adviser or its affiliates. The Adviser and the Administrator waive fees in an amount sufficient to offset the respective fees each charges to the affiliated money market fund on the Portfolio’s investment in such affiliated money market fund. A portion of the waiver is voluntary.
The amount of waivers resulting from investments in these money market funds for the year ended December 31, 2013 was $24,750.
F. Other — Certain officers of the Trust are affiliated with the Adviser, the Administrator and the Distributor. Such officers, with the exception of the Chief Compliance Officer, receive no compensation from the Portfolio for serving in their respective roles.
The Board of Trustees appointed a Chief Compliance Officer to the Portfolio in accordance with Federal securities regulations. The Portfolio, along with other affiliated portfolios, makes reimbursement payments, on a pro-rata basis, to the Administrator for a portion of the fees associated with the Office of the Chief Compliance Officer. Such fees are included in Trustees’ and Chief Compliance Officer’s fees in the Statement of Operations.
The Trust adopted a Trustee Deferred Compensation Plan (the “Plan”) which allows the Independent Trustees to defer the receipt of all or a portion of compensation related to performance of their duties as Trustees. The deferred fees are invested in various J.P. Morgan Funds until distribution in accordance with the Plan.
During the year ended December 31, 2013, the Portfolio may have purchased securities from an underwriting syndicate in which the principal underwriter or members of the syndicate are affiliated with the Adviser.
The Portfolio may use related party broker-dealers. For the year ended December 31, 2013, the Portfolio did not incur any brokerage commissions with broker-dealers affiliated with the Adviser.
The Securities and Exchange Commission has granted an exemptive order permitting the Portfolio to engage in principal transactions with J.P. Morgan Securities, Inc., an affiliated broker, involving taxable money market instruments, subject to certain conditions.
| 16 | JPMORGAN INSURANCE TRUST | DECEMBER 31, 2013 | ||||
Table of Contents
4. Investment Transactions
During the year ended December 31, 2013, purchases and sales of investments (excluding short-term investments) were as follows:
| Purchases (excluding U.S. Government) | Sales (excluding U.S. Government) | |||||
| $105,050,868 | $ | 89,283,819 | ||||
During the year ended December 31, 2013, there were no purchases or sales of U.S. Government securities.
5. Federal Income Tax Matters
For Federal income tax purposes, the cost and unrealized appreciation (depreciation) in value of investment securities held at December 31, 2013, were as follows:
Aggregate Cost | Gross Unrealized Appreciation | Gross Unrealized Depreciation | Net Unrealized Appreciation (Depreciation) | |||||||||||||
| $ | 264,291,299 | $ | 146,488,748 | $ | 1,083,789 | $ | 145,404,959 | |||||||||
The difference between book and tax basis appreciation (depreciation) on investments is primarily attributed to wash sale loss deferrals.
The tax character of distributions paid during the year ended December 31, 2013 was as follows:
| Total Distributions Paid From: | ||||||||||||
Ordinary Income | Net Long-Term Capital Gains | Total Distributions Paid | ||||||||||
| $ | 3,553,458 | $ | 3,818,952 | $ | 7,372,410 | |||||||
The tax character of distributions paid during the year ended December 31, 2012 was as follows:
| Total Distributions Paid From: | ||||||||
Ordinary Income | Total Distributions Paid | |||||||
| $ | 2,911,958 | $ | 2,911,958 | |||||
As of December 31, 2013, the components of net assets (excluding paid-in-capital) on a tax basis were as follows:
Current Distributable Ordinary Income | Current Distributable Long-Term Capital Gain or (Tax Basis Capital Loss Carryover) | Unrealized Appreciation (Depreciation) | ||||||||||
| $ | 6,541,005 | $ | 19,618,567 | $ | 145,404,959 | |||||||
The cumulative timing differences primarily consist of wash sale loss deferrals.
Under the Regulated Investment Company Modernization Act of 2010 (the “Act”), net capital losses recognized by the Portfolio after December 31, 2010 are carried forward indefinitely, and retain their character as short-term and/or long-term losses. Prior to the Act, net capital losses incurred by the Portfolio were carried forward for eight years and treated as short-term losses. The Act requires that post-enactment net capital losses be used before pre-enactment net capital losses.
As of December 31, 2013, the Portfolio did not have any post-enactment net capital loss carryforwards.
As of December 31, 2013, the Portfolio had pre-enactment net capital loss carryforwards, expiring during the year indicated, which are available to offset future realized gains:
| 2017 | Total | |||||||
| $ | 5,413,132 | * | $ | 5,413,132 | * | |||
| * | This entire amount is comprised of capital loss carryforwards from business combinations, which may be limited in future years under the Internal Revenue Code Sections 381-384. |
During the year ended December 31, 2013, the Portfolio utilized capital loss carryforwards in the amount of $1,263,989.
During the year ended December 31, 2013, the Portfolio had expired capital loss carryforwards in the amount of $89,294.
| DECEMBER 31, 2013 | JPMORGAN INSURANCE TRUST | 17 | ||||||
Table of Contents
NOTES TO FINANCIAL STATEMENTS
AS OF DECEMBER 31, 2013 (continued)
6. Borrowings
The Trust and JPMCB have entered into a financing arrangement. Under this arrangement, JPMCB provides an unsecured, uncommitted credit facility in the aggregate amount of $100 million to certain of the J.P. Morgan Funds, including the Portfolio. Advances under the arrangement are taken primarily for temporary or emergency purposes, including the meeting of redemption requests that otherwise might require the untimely disposition of securities, and are subject to the Portfolio’s borrowing restrictions. Interest on borrowings is payable at a rate determined by JPMCB at the time of borrowing. This agreement has been extended until November 10, 2014.
The Portfolio had no borrowings outstanding from the unsecured, uncommitted credit facility at December 31, 2013, or at any time during the year then ended.
Interest expense paid, if any, as a result of borrowings from the unsecured, uncommitted credit facility is included in Interest expense to affiliates in the Statement of Operations.
7. Risks, Concentrations and Indemnifications
In the normal course of business, the Portfolio enters into contracts that contain a variety of representations which provide general indemnifications. The Portfolio’s maximum exposure under these arrangements is unknown. The amount of exposure would depend on future claims that may be made against the Portfolio that have not yet occurred. However, based on experience, the Portfolio expects the risk of loss to be remote.
The Portfolio has several shareholders holding a significant percentage of shares outstanding. Investment activities of these shareholders could have a material impact on the Portfolio.
| 18 | JPMORGAN INSURANCE TRUST | DECEMBER 31, 2013 | ||||
Table of Contents
REPORT OF INDEPENDENT REGISTERED PUBLIC ACCOUNTING FIRM
To the Board of Trustees of JPMorgan Insurance Trust and the Shareholders of JPMorgan Insurance Trust Mid Cap Value Portfolio:
In our opinion, the accompanying statement of assets and liabilities, including the schedule of portfolio investments, and the related statements of operations and of changes in net assets and the financial highlights present fairly, in all material respects, the financial position of JPMorgan Insurance Trust Mid Cap Value Portfolio (a separate Portfolio of JPMorgan Insurance Trust) (hereafter referred to as the “Portfolio”) at December 31, 2013, the results of its operations for the year then ended, the changes in its net assets for each of the two years in the period then ended and the financial highlights for each of the five years in the period then ended, in conformity with accounting principles generally accepted in the United States of America. These financial statements and financial highlights (hereafter referred to as “financial statements”) are the responsibility of the Portfolio’s management. Our responsibility is to express an opinion on these financial statements based on our audits. We conducted our audits of these financial statements in accordance with the standards of the Public Company Accounting Oversight Board (United States). Those standards require that we plan and perform the audit to obtain reasonable assurance about whether the financial statements are free of material misstatement. An audit includes examining, on a test basis, evidence supporting the amounts and disclosures in the financial statements, assessing the accounting principles used and significant estimates made by management, and evaluating the overall financial statement presentation. We believe that our audits, which included confirmation of securities at December 31, 2013 by correspondence with the custodian and brokers, provide a reasonable basis for our opinion.
PricewaterhouseCoopers LLP
New York, New York
February 21, 2014
DECEMBER 31, 2013 | JPMORGAN INSURANCE TRUST | 19 | ||||||
Table of Contents
(Unaudited)
The Portfolio’s Statement of Additional Information includes additional information about the Portfolio’s Trustees and is available, without charge, upon request by calling 1-800-480-4111 or on the J.P. Morgan Funds’ website at www.jpmorganfunds.com.
Name (Year of Birth); Positions With the Portfolio (1) | Principal Occupations During Past 5 Years | Number of Portfolios in Fund Complex Overseen by Trustee (2) | Other Directorships Held Outside Fund Complex During Past 5 Years | |||
Independent Trustees | ||||||
| John F. Finn (1947); Trustee of Trust since 2005; Trustee of heritage One Group Mutual Funds since 1998. | Chairman (1985-present), President and Chief Executive Officer, Gardner, Inc. (supply chain management company serving industrial and consumer markets) (1974-present). | 170 | Director, Cardinal Health, Inc. (CAH) (1994-present); Director, Greif, Inc. (GEF) (industrial package products and services) (2007-present); Trustee, Columbus Association for the Performing Arts. | |||
| Dr. Matthew Goldstein (1941); Chairman since 2013; Trustee of Trust since 2005; Trustee of heritage J.P. Morgan Funds since 2003. | Professor, City University of New York (effective 7/1/13); Chancellor, City University of New York (1999-2013); President, Adelphi University (New York) (1998-1999). | 170 | Trustee, Museum of Jewish Heritage (2011-present). | |||
| Robert J. Higgins (1945); Trustee of Trust since 2005; Trustee of heritage J.P. Morgan Funds since 2002. | Retired; Director of Administration of the State of Rhode Island (2003-2004); President — Consumer Banking and Investment Services, Fleet Boston Financial (1971-2001). | 170 | None | |||
| Peter C. Marshall (1942); Trustee of Trust since 2005; Trustee of heritage One Group Mutual Funds since 1985. | Self-employed business consultant (2002-present). | 170 | None | |||
| Mary E. Martinez (1960); Trustee of Trust since 2013. | Associate, Special Properties, a Christie’s International Real Estate Affiliate (2010-Present); Managing Director, Bank of America (Asset Management) (2007-2008); Chief Operating Officer, U.S. Trust Asset Management; U.S. Trust Company (asset management) (2003-2007); President, Excelsior Funds (registered investment companies) (2004-2005). | 170 | None | |||
| Marilyn McCoy* (1948); Trustee of Trust since 2005; Trustee of heritage One Group Mutual Funds since 1999. | Vice President of Administration and Planning, Northwestern University (1985-present). | 170 | Trustee, Carleton College (2003-present). | |||
| Mitchell M. Merin (1953); Trustee of Trust since 2013. | Retired (2005-Present); President and Chief Operating Officer, Morgan Stanley Investment Management, Member Morgan Stanley & Co. Management Committee (registered investment adviser) (1998-2005). | 170 | Director, Sun Life Financial (SLF) (2007 to Present) (financial services and insurance); Trustee, Trinity College, Hartford, CT (2002-2010). | |||
| William G. Morton, Jr. (1937); Trustee of Trust since 2005; Trustee of heritage J.P. Morgan Funds since 2003. | Retired; Chairman Emeritus (2001-2002), and Chairman and Chief Executive Officer, Boston Stock Exchange (1985-2001). | 170 | Director, Radio Shack Corp. (1987-2008); Director, National Organization of Investment Professionals; Trustee of the Stratton Mountain School (2001-present). | |||
| Dr. Robert A. Oden, Jr. (1946); Trustee of Trust since 2005; Trustee of heritage One Group Mutual Funds since 1997. | Retired; President, Carleton College (2002-2010); President, Kenyon College (1995-2002). | 170 | Trustee, American University in Cairo (1999-present); Chairman, Dartmouth-Hitchcock Medical Center (2011-present); Trustee, American Schools of Oriental Research (2011-present); Trustee, American Museum of Fly Fishing. | |||
| 20 | JPMORGAN INSURANCE TRUST | DECEMBER 31, 2013 | ||||
Table of Contents
Name (Year of Birth); Positions With the Portfolio (1) | Principal Occupations During Past 5 Years | Number of Complex Overseen by Trustee (2) | Other Directorships Held Outside Fund Complex During Past 5 Years | |||
Independent Trustees (continued) | ||||||
| Marian U. Pardo** (1946); Trustee of Trust since 2013. | Managing Director and Founder, Virtual Capital Management LLC (Investment Consulting) (2007-present); Managing Director, Credit Suisse Asset Management (portfolio manager) (2003-2006). | 170 | Member, Board of Governors, Columbus Citizens Foundation (not-for-profit supporting philanthropic and cultural programs) (2006-present). | |||
| Frederick W. Ruebeck (1939); Trustee of Trust since 2005; Trustee of heritage One Group Mutual Funds since 1994. | Consultant (2000-present); Adviser, JP Greene & Associates, LLC (broker-dealer) (2000-2009); Chief Investment Officer, Wabash College (2004-present); Director of Investments, Eli Lilly and Company (pharmaceuticals) (1988-1999). | 170 | Trustee, Wabash College (1988-present); Chairman, Indianapolis Symphony Orchestra Foundation (1994-present). | |||
| James J. Schonbachler (1943); Trustee of Trust since 2005; Trustee of heritage J.P. Morgan Funds since 2001. | Retired; Managing Director of Bankers Trust Company (financial services) (1968-1998). | 170 | None | |||
Interested Trustee Not Affiliated With the Adviser | ||||||
| Frankie D. Hughes*** (1952), Trustee of Trust since 2008. | President and Chief Investment Officer, Hughes Capital Management, Inc. (fixed income asset management) (1993-present). | 170 | Trustee, The Victory Portfolios (2000-2008) (investment companies). | |||
| (1) | The Trustees serve for an indefinite term, subject to the Trust’s current retirement policy, which is age 75 for all Trustees, except that the Board has determined Mr. Morton should continue to serve until December 31, 2014. In order to fill the vacancies created by the retirement of Fergus Reid, III, William J. Armstrong, and Leonard J. Spalding Jr., effective December 31, 2012, the Board appointed Ms. Martinez and Mr. Merin to serve as Trustees effective January 1, 2013 and Ms. Pardo to serve as Trustee effective February 1, 2013. |
| (2) | A Fund Complex means two or more registered investment companies that hold themselves out to investors as related companies for purposes of investment and investor services or have a common investment adviser or have an investment adviser that is an affiliated person of the investment adviser of any of the other registered investment companies. The J.P. Morgan Funds Complex for which the Board of Trustees serves currently includes eleven registered investment companies (170 funds), including JPMorgan Mutual Fund Group which liquidated effective November 29, 2012 and is in the process of winding up its affairs. |
| * | Ms. McCoy has served as Vice President of Administration and Planning for Northwestern University since 1985. William M. Daley was the Head of Corporate Responsibility for JPMorgan Chase & Co. prior to January 2011 and served as a member of the Board of Trustees of Northwestern University from 2005 through 2010. JPMIM, the Portfolio’s investment adviser, is a wholly-owned subsidiary of JPMorgan Chase & Co. Two members of the Board of Trustees of Northwestern University are executive officers of registered investment advisers (not affiliated with JPMorgan) that are under common control with sub-advisers to certain J.P. Morgan Funds. |
| ** | In connection with prior employment with JPMorgan Chase, Ms. Pardo is the recipient of non-qualified pension plan payments from JPMorgan Chase in the amount of approximately $2,055 per month, which she irrevocably waived effective January 1, 2013, and deferred compensation payments from JPMorgan Chase in the amount of approximately $7,294 per year, which ended in January 2013. In addition, Ms. Pardo receives payments from a fully funded qualified plan, which is not an obligation of JPMorgan Chase. |
| *** | Ms. Hughes is treated as an “interested person” based on the portfolio holdings of clients of Hughes Capital Management, Inc. |
The contact address for each of the Trustees is 270 Park Avenue, New York, NY 10017.
| DECEMBER 31, 2013 | JPMORGAN INSURANCE TRUST | 21 | ||||||
Table of Contents
(Unaudited)
Name (Year of Birth), Positions Held with the Trust (Since) | Principal Occupations During Past 5 Years | |
Robert L. Young (1963), | Chief Operating Officer and Director, J.P. Morgan Investment Management Inc. since 2010; Senior Vice President, J.P. Morgan Funds (2005-2010), Chief Operating Officer, J.P. Morgan Funds (2005-2010); Director and various officer positions for JPMorgan Funds Management, Inc. (formerly One Group Administrative Services) and JPMorgan Distribution Services, Inc. (formerly One Group Dealer Services, Inc.) from 1999 to present. Mr. Young has been with JPMorgan Chase & Co. (formerly Bank One Corporation) since 1997. | |
| Joy C. Dowd (1972), Treasurer and Principal Financial Officer (2010) | Assistant Treasurer of the Trusts from 2009 to 2010; Executive Director, JPMorgan Funds Management, Inc. from February 2011; Vice President, JPMorgan Funds Management, Inc. from December 2008 to February 2011; prior to joining JPMorgan Chase, Ms. Dowd worked in MetLife’s investments audit group from 2005 through 2008. | |
| Frank J. Nasta (1964), Secretary (2008) | Managing Director and Associate General Counsel, JPMorgan Chase since 2008; Previously, Director, Managing Director, General Counsel and Corporate Secretary, J. & W. Seligman & Co. Incorporated; Secretary of each of the investment companies of the Seligman Group of Funds and Seligman Data Corp.; Director and Corporate Secretary, Seligman Advisors, Inc. and Seligman Services, Inc. | |
| Stephen M. Ungerman (1953), Chief Compliance Officer (2005) | Managing Director, JPMorgan Chase & Co.; Mr. Ungerman has been with JPMorgan Chase & Co. since 2000. | |
Kathryn A. Jackson (1962), | Vice President and AML Compliance Manager for JPMorgan Asset Management Compliance since 2011; Senior On-Boarding Specialist for JPMorgan Distribution Services, Inc. in Global Liquidity from 2008 to 2011; prior to joining JPMorgan, Ms. Jackson was a Financial Services Analyst responsible for on-boarding, compliance and training with Nationwide Securities LLC and 1717 Capital Management Company, both registered broker-dealers, from 2005 until 2008. | |
Elizabeth A. Davin (1964), Assistant Secretary (2005)** | Executive Director and Assistant General Counsel, JPMorgan Chase since February 2012; formerly Vice President and Assistant General Counsel, JPMorgan Chase from 2005 until February 2012; Senior Counsel, JPMorgan Chase (formerly Bank One Corporation) from 2004 to 2005. | |
| Jessica K. Ditullio (1962), Assistant Secretary (2005)** | Executive Director and Assistant General Counsel, JPMorgan Chase since February 2011; Ms. Ditullio has served as an attorney with various titles for JPMorgan Chase (formerly Bank One Corporation) since 1990. | |
| John T. Fitzgerald (1975), Assistant Secretary (2008) | Executive Director and Assistant General Counsel, JPMorgan Chase since February 2011; formerly, Vice President and Assistant General Counsel, JPMorgan Chase from 2005 until February 2011. | |
| Carmine Lekstutis (1980), Assistant Secretary (2011) | Vice President and Assistant General Counsel, JPMorgan Chase since 2011; Associate, Skadden, Arps, Slate, Meagher & Flom LLP (law firm) from 2006 to 2011. | |
| Gregory S. Samuels (1980), Assistant Secretary (2010) | Vice President and Assistant General Counsel, JPMorgan Chase since 2010; Associate, Ropes & Gray (law firm) from 2008 to 2010; Associate, Clifford Chance LLP (law firm) from 2005 to 2008. | |
| Pamela L. Woodley (1971), Assistant Secretary (2012) | Vice President and Assistant General Counsel, JPMorgan Chase since November 2004. | |
Michael M. D’Ambrosio (1969), Assistant Treasurer (2012) | Executive Director, JPMorgan Funds Management, Inc. from July 2012; prior to joining JPMorgan Chase, Mr. D’Ambrosio was a Tax Director at PricewaterhouseCoopers LLP since 2006. | |
| Joseph Parascondola (1963), Assistant Treasurer (2011) | Vice President, JPMorgan Funds Management, Inc. since August 2006. | |
| Matthew J. Plastina (1970), Assistant Treasurer (2011) | Vice President, JPMorgan Funds Management, Inc. since August 2010; prior to August 2010, Vice President and Controller, Legg Mason Global Asset Management. | |
Julie A. Roach (1971), Assistant Treasurer (2012)** | Vice President, JPMorgan Funds Management, Inc. from August 2012; prior to joining JPMorgan Chase, Ms. Roach was a Senior Manager with Deloitte since 2001. | |
Gillian I. Sands (1969), Assistant Treasurer (2012) | Vice President, JPMorgan Funds Management, Inc. from September 2012; Assistant Treasurer, Wells Fargo Funds Management (2007-2009). | |
The contact address for each of the officers, unless otherwise noted, is 270 Park Avenue, New York, NY 10017.
| * | The contact address for the officer is 500 Stanton Christiana Road, Ops 1, Floor 02, Newark, DE 19173-2107. |
| ** | The contact address for the officer is 460 Polaris Parkway, Westerville, OH 43082. |
| 22 | JPMORGAN INSURANCE TRUST | DECEMBER 31, 2013 | ||||
Table of Contents
SCHEDULE OF SHAREHOLDER EXPENSES
(Unaudited)
Hypothetical $1,000 Investment
As a shareholder of the Portfolio, you incur ongoing costs, including investment advisory fees, administration fees and other Portfolio expenses. Because the Portfolio is a funding vehicle for Policies and Eligible Plans, you may also incur sales charges and other fees relating to the Policies or Eligible Plans. The examples below are intended to help you understand your ongoing costs (in dollars) of investing in the Portfolio, but not the costs of the Policies or Eligible Plans, and to compare these ongoing costs with the ongoing costs of investing in other mutual funds. The examples assume that you had a $1,000 investment in the Portfolio at the beginning of the reporting period, July 1, 2013, and continued to hold your shares at the end of the reporting period, December 31, 2013.
Actual Expenses
The first line provides information about actual account values and actual expenses. You may use the information in this line, together with the amount you invested, to estimate the expenses that you paid over the period. Simply divide your account value by $1,000 (for example, an $8,600 account value divided by $1,000 = 8.6), then multiply the result by the number in the first line under the heading entitled “Expenses Paid During the Period” to estimate the expenses you paid on your account during this period.
Hypothetical Example for Comparison Purposes
The second line in the table below provides information about hypothetical account values and hypothetical expenses based on the actual expense ratio and an assumed rate of return of 5% per year before expenses, which is not the Portfolio’s actual return. The hypothetical account values and expenses may not be used to estimate the actual ending account balance or expenses you paid for the period. You may use this information to compare the ongoing costs of investing in the Portfolio and other funds. To do so, compare this 5% hypothetical example with the 5% hypothetical examples that appear in the shareholder reports of the other funds. Please note that the expenses shown in the table are meant to highlight your ongoing costs only and do not reflect any transaction costs, such as sales charges (loads) or redemption fees or the costs associated with the Policies and Eligible Plans through which the Portfolio is held. Therefore, the second line in the table is useful in comparing ongoing costs only, and will not help you determine the relative total costs of owning different funds. In addition, if these transaction costs were included, your costs would have been higher. The examples also assume all dividends and distributions have been reinvested.
| Beginning Account Value July 1, 2013 | Ending Account Value December 31, 2013 | Expenses Paid During the Period* | Annualized Expense Ratio | |||||||||||||
Mid Cap Value Portfolio | ||||||||||||||||
Class 1 | ||||||||||||||||
Actual | $ | 1,000.00 | $ | 1,145.20 | $ | 4.16 | 0.77 | % | ||||||||
Hypothetical | 1,000.00 | 1,021.32 | 3.92 | 0.77 | ||||||||||||
| * | Expenses are equal to the Portfolio’s annualized expense ratio, multiplied by the average account value over the period, multiplied by 184/365 (to reflect the one-half year period). |
| DECEMBER 31, 2013 | JPMORGAN INSURANCE TRUST | 23 | ||||||
SEE NOTES TO FINANCIAL STATEMENTS.
Table of Contents
BOARD APPROVAL OF INVESTMENT ADVISORY AGREEMENT
(Unaudited)
The Board of Trustees meets regularly throughout the year and considers factors that are relevant to its annual consideration of investment advisory agreements at each meeting. The Board of Trustees has established various standing committees, composed of Trustees with diverse backgrounds, to which the Board of Trustees has assigned specific subject matter responsibilities to further enhance the effectiveness of the Board’s oversight and decision making. The Board of Trustees and its investment committees (money market and alternative products, equity, and fixed income) also meet for the specific purpose of considering advisory contract annual renewals. The Board of Trustees held meetings in person in June and August 2013, at which the Trustees considered the continuation of the investment advisory agreement for the Portfolio whose annual report is contained herein (the “Advisory Agreement”). At the June meeting, the Board’s investment committees met to review and consider performance, expense and related information for the J.P. Morgan Funds. Each investment committee reported to the full Board, which then considered the investment committee’s preliminary findings. At the August meeting, the Trustees continued their review and consideration. The Trustees, including a majority of the Trustees who are not “interested persons” (as defined in the 1940 Act) of any party to the Advisory Agreement or any of their affiliates, approved the continuation of the Advisory Agreement on August 20, 2013.
The Trustees, as part of their review of the investment advisory arrangements for the J.P. Morgan Funds, considered and reviewed performance and other information received from the Adviser on a regular basis over the course of the year, as well as information specifically prepared for their annual review. This information included the Portfolio’s performance compared to the performance of the Portfolio’s peers and benchmarks and analyses by the Adviser of the Portfolio’s performance. The Adviser also periodically provides comparative information regarding the Portfolio’s expense ratios and those of the peer groups. In addition, in preparation for the June and August meetings, the Trustees requested, received and evaluated extensive materials from the Adviser, including, with respect to the Portfolio, performance and expense information compiled by Lipper Inc. (“Lipper”), an independent provider of investment company data. Prior to voting, the Trustees reviewed the proposed approval of the Advisory Agreement with representatives of the Adviser and with counsels to the Portfolio and independent Trustees and received a memorandum from independent counsel to the Trustees discussing the legal standards for their consideration of the proposed approval. The Trustees also discussed the proposed approvals in executive sessions with counsels to the Portfolio and independent Trustees at which no representatives of the Adviser were present. Set forth below is a summary of the material factors evaluated by the Trustees in determining whether to approve the Advisory Agreement.
In their deliberations, there was a comprehensive consideration of the information received by the Trustees. Each Trustee attributed different weights to the various factors and no factor alone was considered determinative. From year to year, the Trustees consider and place emphasis on relevant information in light of changing circumstances in market and economic conditions. The Trustees determined that the compensation to be received by the Adviser from the Portfolio under the Advisory Agreement was fair and reasonable and that the continuance of the investment advisory contract was in the best interests of the Portfolio and its shareholders.
The factors summarized below were considered and discussed by the Trustees in reaching their conclusions:
Nature, Extent and Quality of Services Provided by the Adviser
The Trustees received and considered information regarding the nature, extent and quality of the services provided to the Portfolio under the Advisory Agreement. The Trustees took into account information furnished throughout the year at Trustee meetings, as well as the materials furnished specifically in connection with this annual review process. The Trustees considered the background and experience of the Adviser’s senior management and the expertise of, and the amount of attention given to the Portfolio by, investment personnel of the Adviser. In addition, the Trustees reviewed the qualifications, backgrounds and responsibilities of the portfolio management team primarily responsible for the day-to-day management of the Portfolio and the infrastructure supporting the team. The Trustees also considered information provided by the Adviser and JPMorgan Distribution Services, Inc. (“JPMDS”) about the structure and distribution strategy of the Portfolio. The Trustees also reviewed information relating to the Adviser’s risk governance model and reports showing the Adviser’s compliance structure and ongoing compliance processes. The quality of the administrative services provided by JPMorgan Funds Management, Inc. (“JPMFM”), an affiliate of the Adviser, was also considered.
The Board of Trustees also considered its knowledge of the nature and quality of the services provided by the Adviser to the Portfolio gained from their experience as Trustees of the J.P. Morgan Funds. In addition, they considered the overall reputation and capabilities of the Adviser and its affiliates, the commitment of the Adviser to provide high quality service to the Portfolio, their overall confidence in the Adviser’s integrity and the Adviser’s responsiveness to questions or concerns raised by them, including the Adviser’s willingness to consider and implement organizational and operational changes designed to improve investment results and the services provided to the Portfolio.
Based on these considerations and other factors, the Trustees concluded that they were satisfied with the nature, extent and quality of the investment advisory services provided to the Portfolio by the Adviser.
| 24 | JPMORGAN INSURANCE TRUST | DECEMBER 31, 2013 | ||||
Table of Contents
Costs of Services Provided and Profitability to the Adviser and its Affiliates
The Trustees received and considered information regarding the profitability to the Adviser and its affiliates in providing services to the Portfolio. The Trustees reviewed and discussed this data. The Trustees recognized that this data is not audited and represents the Adviser’s determination of its and its affiliates’ revenues from the contractual services provided to the Portfolio, less expenses of providing such services. Expenses include direct and indirect costs and are calculated using an allocation methodology developed by the Adviser. The Trustees also recognized that it is difficult to make comparisons of profitability from fund investment advisory contracts because comparative information is not generally publicly available and is affected by numerous factors, including the structure of the particular adviser, the types of funds it manages, its business mix, numerous assumptions regarding allocations and the fact that publicly-traded fund managers’ operating profits and net income are net of distribution and marketing expenses. Based on their review, the Trustees concluded that the profitability to the Adviser under the Advisory Agreement was not unreasonable in light of the services and benefits provided to the Portfolio.
Fall-Out Benefits
The Trustees reviewed information regarding potential “fallout” or ancillary benefits received by the Adviser and its affiliates as a result of their relationship with the Portfolio. The Board also reviewed the adviser’s allocation of fund brokerage for the J.P. Morgan Funds complex, including allocations to brokers who provide research to the adviser.
The Trustees also considered that JPMFM earns fees from the Portfolio for providing administrative services. These fees were shown separately in the profitability analysis presented to the Trustees. The Trustees also considered the fees paid to JPMorgan Chase Bank, N.A. (“JPMCB”) for custody and fund accounting and other related services.
Economies of Scale
The Trustees noted that the proposed investment advisory fee schedule for the Portfolio does not contain breakpoints. The Trustees considered whether it would be appropriate to add advisory fee breakpoints and the Trustees concluded that the current fee structure was reasonable in light of the fee waivers and expense limitations that the Adviser has in place that serve to limit the overall net expense ratio at competitive levels. The Trustees also recognized that the fee schedule for the administrative services provided by JPMFM does include a fee breakpoint, which is tied to the overall level of non-money market fund assets excluding certain funds-of-funds, as applicable, advised by the Adviser, and that the Portfolio benefits from that breakpoint. The Trustees concluded that shareholders benefited from the lower expense ratios which resulted from these factors.
Independent Written Evaluation of the Portfolio’s Chief Compliance Officer
The Trustees noted that, upon their direction, the Chief Compliance Officer for the Portfolio had prepared an independent written evaluation in order to assist the Trustees in determining the reasonableness of the proposed management fees. The Trustees considered the written evaluation in determining whether to continue the Advisory Agreement.
Fees Relative to Adviser’s Other Clients
The Trustees received and considered information about the nature and extent of investment advisory services and fee rates offered to other clients of the Adviser for investment management styles substantially similar to that of the Portfolio. The Trustees also considered the complexity of investment management for the Portfolio relative to the Adviser’s other clients and the differences in the nature and extent of the services provided to the different clients. The Trustees concluded that the fee rates charged to the Portfolio in comparison to those charged to the Adviser’s other clients were reasonable.
Investment Performance
The Trustees received and considered absolute and/or relative performance for the Portfolio in a report prepared by Lipper. The Trustees considered the total return performance information, which included the ranking of the Portfolio within a performance universe made up of funds with the same Lipper investment classification and objective (the “Universe Group”) by total return for applicable one-, three- and five-year periods. The Trustees reviewed a description of Lipper’s methodology for selecting mutual funds in the Portfolio’s Universe Group. As part of this review, the Trustees also reviewed the Portfolio’s performance against its benchmark and considered the performance information provided for the Portfolio at regular Board meetings by the Adviser. The Lipper performance data noted by the Trustees as part of their review and the determinations made by the Trustees with respect to the Portfolio’s performance are summarized below:
The Trustees noted the Portfolio’s performance was in the first quintile for the one-, three-, and five-year periods ended December 31, 2012. The Trustees discussed the performance and investment strategy of the Portfolio with the Adviser and, based upon this discussion and various other factors, concluded that the performance was reasonable.
Advisory Fees and Expense Ratios
The Trustees considered the contractual advisory fee rate paid by the Portfolio to the Adviser and compared that rate to the information prepared by Lipper concerning management fee rates paid by other funds in the same Lipper category as the Portfolio. The Trustees recognized that Lipper reported the Portfolio’s management fee rate as the combined contractual
| DECEMBER 31, 2013 | JPMORGAN INSURANCE TRUST | 25 | ||||||
Table of Contents
BOARD APPROVAL OF INVESTMENT ADVISORY AGREEMENT
(Unaudited) (continued)
advisory fee and administration fee rates. The Trustees also reviewed information about other expenses and the expense ratios for the Portfolio. The Trustees considered the fee waiver and/or expense reimbursement arrangements currently in place for the Portfolio and considered the net advisory fee rate after taking into account any waivers and/or reimbursements. The Trustees recognized that it is difficult to make comparisons of advisory fees because there are variations in the services that are included in the fees paid by other funds. The Trustees’
determinations as a result of the review of the Portfolio’s advisory fees and expense ratios are summarized below:
The Trustees noted that the Portfolio’s net advisory fee and actual total expenses were in the fourth and third quintiles, respectively, of their Universe Group. After considering the factors identified above, in light of this information, the Trustees concluded that the advisory fee was reasonable.
| 26 | JPMORGAN INSURANCE TRUST | DECEMBER 31, 2013 | ||||
Table of Contents
(Unaudited)
Certain tax information for the Portfolio is required to be provided to shareholders based upon the Portfolio’s income and distributions for the taxable year ended December 31, 2013. The information and distributions reported in this letter may differ from the information and taxable distributions reported to the shareholders for the calendar year ending December 31, 2013. The information necessary to complete your income tax returns for the calendar year ending December 31, 2013 will be received under separate cover.
Dividends Received Deductions (DRD)
The Portfolio hereby designates 100% or the maximum allowable percentage as ordinary income distributions eligible for the 70% dividend received deduction for corporate rate shareholders for the fiscal year ended December 31, 2013.
Long Term Capital Gain Notice
The Portfolio distributed $3,818,952 as long-term capital gain dividends for the purpose of the dividend paid deduction on its respective tax return for the fiscal year ended December 31, 2013.
| DECEMBER 31, 2013 | JPMORGAN INSURANCE TRUST | 27 | ||||||
Table of Contents
J.P. Morgan Funds are distributed by JPMorgan Distribution Services, Inc., which is an affiliate of JPMorgan Chase & Co. Affiliates of JPMorgan Chase & Co. receive fees for providing various services to the funds.
Contact JPMorgan Distribution Services, Inc. at 1-800-480-4111 for a portfolio prospectus. You can also visit us at www.jpmorganfunds.com. Investors should carefully consider the investment objectives and risk as well as charges and expenses of the mutual fund before investing. The prospectus contains this and other information about the mutual fund. Read the prospectus carefully before investing.
The Portfolio files a complete schedule of its portfolio holdings for the first and third quarters of its fiscal year with the SEC on Form N-Q. The Portfolio’s Forms N-Q are available on the SEC’s website at http://www.sec.gov and may be reviewed and copied at the SEC’s Public Reference Room in Washington, DC. Information on the operation of the SEC’s Public Reference Room may be obtained by calling 1-800-SEC-0330. Shareholders may request the Form N-Q without charge by calling 1-800-480-4111 or by visiting the variable insurance portfolio section of the J.P. Morgan Funds’ website at www.jpmorganfunds.com.
A description of the Portfolio’s policies and procedures with respect to the disclosure of the Portfolio’s holdings is available in the prospectus and Statement of Additional Information.
A copy of proxy policies and procedures is available without charge upon request by calling 1-800-480-4111 and on the Portfolio’s website at www.jpmorganfunds.com. A description of such policies and procedures is on the SEC’s website at www.sec.gov. The Trustees have delegated the authority to vote proxies for securities owned by the Portfolio to the Adviser. A copy of the Portfolio’s voting record for the most recent 12-month period ended June 30 is available on the SEC’s website at www.sec.gov or at the Portfolio’s website at www.jpmorganfunds.com no later than August 31 of each year. The Portfolio’s proxy voting record will include, among other things, a brief description of the matter voted on for each portfolio security, and will state how each vote was cast, for example, for or against the proposal.
Table of Contents
| © JPMorgan Chase & Co., 2014. All rights reserved. December 2013. | AN-JPMITMCVP-1213 |
Table of Contents
Annual Report
JPMorgan Insurance Trust
December 31, 2013
JPMorgan Insurance Trust Small Cap Core Portfolio
NOT FDIC INSURED Ÿ NO BANK GUARANTEE Ÿ MAY LOSE VALUE
|  |
Table of Contents
Investments in the Portfolio are not bank deposits or obligations of, or guaranteed or endorsed by, any bank and are not insured or guaranteed by the FDIC, the Federal Reserve Board or any other government agency. You could lose money if you sell when the Portfolio’s share price is lower than when you invested.
Past performance is no guarantee of future performance. The general market views expressed in this report are opinions based on market and other conditions through the end of the reporting period and are subject to change without notice. These views are not intended to predict the future performance of the Portfolio or the securities markets. References to specific securities and their issuers are for illustrative purposes only and are not intended to be, and should not be interpreted as, recommendations to purchase or sell such securities. Such views are not meant as investment advice and may not be relied on as an indication of trading intent on behalf of the Portfolio.
This Portfolio is intended to be a funding vehicle for variable annuity contracts and variable life insurance policies (collectively “Policies”) offered by separate accounts of participating insurance companies. Portfolio shares are also offered through qualified pension and retirement plans (“Eligible Plans”). Individuals may not purchase shares directly from the Portfolio.
Prospective investors should refer to the Portfolio’s prospectus for a discussion of the Portfolio’s investment objective, strategies and risks. Call J.P. Morgan Funds Service Center at 1-800-480-4111 for a prospectus containing more complete information about the Portfolio, including management fees and other expenses. Please read it carefully before investing.
Table of Contents
JANUARY 23, 2014 (Unaudited)
Dear Shareholder,
Equities markets in developed economies performed strongly in the face of periodic spikes in volatility throughout the twelve months ended December 31, 2013. Healthy corporate earnings and incremental but steady improvements in a range of economic indicators provided a positive backdrop for investors seeking returns in the low interest rate environment. While political discord in Washington injected volatility into the market, a bipartisan budget agreement at the end of the year relieved much of the political uncertainty created by partisan brinkmanship over the so-called fiscal cliff and the partial shutdown of the federal government in October. In the first half of the year, the U.S. Federal Reserve (“Fed”) announced its intention to taper off its $85 billion in monthly asset purchases and the statement weakened investor sentiment and set off widespread speculation about the timing and magnitude of such a move. The Fed followed through in December, deciding to reduce its monthly purchases by $10 billion. The news, along with robust gains in jobs, housing and consumer sentiment, drove U.S. equities to new highs. The S&P 500 stock index hit seven closing highs in the final month of the reporting period, finishing 2013 with its best performance since 1997.
 |
“While a repeat of the equity performance we experienced in 2013 may be a tall order, we believe stocks in the U.S. and Europe may continue to show gains.” |
Overseas, the European Central Bank reaffirmed its commitment to accommodative monetary policy and to the euro itself. In the second quarter of the year, the European Union (EU) returned to positive growth and at the end of the year, Ireland became the first nation to exit from its European Union bailout program. The Fed’s decision to curb its asset purchases also sent equities higher in Europe, as investors viewed the move as a sign of further economic stability. In Japan, equity markets rebounded to their best year since 1988, benefitting from Prime Minister Shinzo Abe’s efforts to revive the economy. Low returns on bonds and short-term debt instruments also drove investors into stocks.
Emerging market equities were weaker overall. As of December 31, 2013, the MSCI Emerging Markets Index returned -2.3% for the year. China’s economy showed signs of slower growth during the year and the Fed’s decision to taper its asset purchase program set off speculation that the maturation of the emerging markets credit cycle would push yield-seeking investors to rotate into developed markets.
Taper Talk Pressures Bonds
Fixed income markets generally remained weak during the year, as central bankers across the globe held interest rates at
historic lows. However, benchmark bond yields rose on an annual basis for the first time since 2009. During the year, the Fed’s talk of tapering off its Quantitative Easing (QE) program hurt fixed income markets. U.S. Treasury security yields continued to be low from a historical perspective, but ended the period higher. The yield for 10-year U.S. Treasury securities ended December 31, 2013 at 3.04%, while the yields for 2- and 30-year U.S. Treasury securities finished the reporting period at 0.38% and 3.96%, respectively. High-yield debt returned 7.4% for the year, as measured by the Barclays US High Yield Corporate Index, while other U.S. debt securities and emerging market debt both had negative returns.
While global economic growth accelerated during the year, the U.S. recovery in particular showed stronger fundamentals and the Fed’s decision to taper its QE program was a response to the improved picture. Europe emerged from its lengthy recession and the worst of the fiscal crises seem to be behind it, though unemployment remains strikingly high in many EU nations. Japan made progress toward ending persistent deflation, but Tokyo’s monetary and fiscal stimulus has sharply weakened the yen, putting other Asian exporting nations — notably China and South Korea — at a competitive disadvantage. Emerging market economies may face further headwinds as foreign investment shrinks and economic growth moderates from recent strength. Moreover, political instability — already apparent in Thailand and Turkey — may surface in other emerging market nations as governments struggle to deliver improved living standards and respond to demands for political reforms.
The Long-Term Lens
We welcome the Fed’s move to curb its QE program as a sign that the U.S. economy’s need for artificial stimulus is waning. While a repeat of the equity performance we experienced in 2013 may be a tall order, we believe stocks in the U.S. and Europe may continue to show gains. In the fixed-income market, persistent weakness has led to attractive valuations in some sectors. The past year’s market swings and intermittent volatility underlined the importance of maintaining a long-term view of your investment portfolio and the benefits derived from diversified holdings.
On behalf of everyone at J.P. Morgan Asset Management, thank you for your continued support. We look forward to managing your investment needs for years to come. Should you have any questions, please visit www.jpmorganfunds.com or contact the J.P. Morgan Funds Service Center at 1-800-480-4111.
Sincerely yours,

George C.W. Gatch
CEO, Global Funds Management
J.P. Morgan Asset Management
| DECEMBER 31, 2013 | JPMORGAN INSURANCE TRUST | 1 | ||||||
Table of Contents
JPMorgan Insurance Trust Small Cap Core Portfolio
TWELVE MONTHS ENDED DECEMBER 31, 2013 (Unaudited)
| REPORTING PERIOD RETURN: | ||||
| Portfolio (Class 1 Shares)* | 42.29% | |||
| Russell 2000 Index | 38.82% | |||
| Net Assets as of 12/31/2013 | $ | 107,384,040 | ||
INVESTMENT OBJECTIVE**
The JPMorgan Insurance Trust Small Cap Core Portfolio (the “Portfolio”) seeks capital growth over the long term.
HOW DID THE MARKET PERFORM?
Overall, the U.S. equity market performed strongly during the 12 months ended December 31, 2013, as a tepid economic recovery continued to gain strength from healthy corporate earnings, along with improvements in employment, housing and consumer sentiment. The Benchmark retreated at mid-year amid investor uncertainty about the U.S. Federal Reserve Board’s (“Fed”) intent to taper off its monthly purchases of $85 billion in Treasuries and mortgage-backed securities. Interest rates rose sharply higher, pressuring prices for both stocks and bonds. Partisan brinkmanship in Washington added to the uncertainty, starting with the standoff over the so-called fiscal cliff in January and followed by the partial shutdown of the federal government in October. A bipartisan budget agreement toward the end of the year relieved some of the political uncertainty. During the year, U.S. unemployment claims fell from 7.9% in January to 6.7% at year end, with slight upticks in joblessness at midyear and in October. Adding to the positive trend were advances in housing prices and auto sales in the second half of the year, and a rebound in consumer sentiment to a five-month high in December.
WHAT WERE THE MAIN DRIVERS OF THE PORTFOLIO’S PERFORMANCE?
The Portfolio (Class 1 Shares) outperformed the Benchmark for the 12 months ended December 31, 2013. The Portfolio’s stock selection in the retail sector and the health service and systems sector were leading contributors to relative performance. The Portfolio’s stock selection in the pharmaceutical sector and the real estate investment trust (REIT) sector were leading detractors from relative performance.
Leading individual contributors to relative performance included the Portfolio’s positions in Conns Inc., Rite Aid Corp. and Lannett Inc. Shares of Conns, a specialty retailer of durable consumer products, rose after it posted stronger-than-expected revenue and raised its profit forecast for fiscal 2014. Shares of Rite Aid, a national drug-store chain, gained as management shed underperforming stores, which helped the company post its first annual profit since 2006. Shares of Lannett, a maker of generic pharmaceuticals, rose on healthy revenue growth, a low debt-to-equity ratio and expanding profit margins.
Leading individual detractors from relative performance included Infinity Pharmaceuticals Inc., Affymax Inc. and Silicon Graphics International Corp. Shares of Infinity Pharmaceuticals, a drug discovery company, fell amid concerns over the prospects for a cancer drug candidate. Shares of Affymax, a biopharmaceutical company, performed poorly as the company was suspended and subsequently delisted by NASDAQ. Shares of Silicon Graphics, a provider of technology to the commercial and government sectors, sank after the company warned in October that revenue and profit would be hurt by the partial shutdown of the federal government.
HOW WAS THE PORTFOLIO POSITIONED?
In accordance with its investment process, the portfolio managers1 take limited sector bets and construct the Portfolio so that stock selection is typically the primary driver of its relative performance versus the Benchmark. The portfolio managers employ a bottom-up approach to stock selection, using quantitative screening and proprietary analysis to construct a portfolio of companies that they believe are attractively valued and possess strong fundamentals. During the reporting period, the Portfolio was managed and positioned in accordance with this investment process.
| 1 | There was a change to the portfolio management team during the reporting period. There was no change to the Portfolio’s investment strategy or objective. |
| 2 | JPMORGAN INSURANCE TRUST | DECEMBER 31, 2013 | ||||
Table of Contents
| TOP TEN EQUITY HOLDINGS OF THE PORTFOLIO*** | ||||||||
| 1. | Andersons, Inc. (The) | 1.1 | % | |||||
| 2. | Unisys Corp. | 1.1 | ||||||
| 3. | Deluxe Corp. | 1.1 | ||||||
| 4. | NuVasive, Inc. | 1.1 | ||||||
| 5. | Rite Aid Corp. | 1.1 | ||||||
| 6. | Pegasystems, Inc. | 1.0 | ||||||
| 7. | WebMD Health Corp. | 1.0 | ||||||
| 8. | Medicines Co. (The) | 1.0 | ||||||
| 9. | Sanmina Corp. | 1.0 | ||||||
| 10. | Amsurg Corp. | 0.9 | ||||||
PORTFOLIO COMPOSITION BY SECTOR*** | ||||
| Financials | 21.5 | % | ||
| Information Technology | 17.1 | |||
| Industrials | 16.0 | |||
| Consumer Discretionary | 12.6 | |||
| Health Care | 11.5 | |||
| Consumer Staples | 5.6 | |||
| Energy | 4.9 | |||
| Materials | 3.8 | |||
| Utilities | 2.6 | |||
| Telecommunication Services | 1.3 | |||
| U.S. Treasury Obligation | 0.2 | |||
| Short-Term Investment | 2.9 | |||
| * | The return shown is based on net asset values calculated for shareholder transactions and may differ from the return shown in the financial highlights, which reflects adjustments made to the net asset values in accordance with accounting principles generally accepted in the United States of America. |
| ** | The adviser seeks to achieve the Portfolio’s objective. There can be no guarantee it will be achieved. |
| *** | Percentages indicated are based on total investments as of December 31, 2013. The Portfolio’s composition is subject to change. |
| DECEMBER 31, 2013 | JPMORGAN INSURANCE TRUST | 3 | ||||||
Table of Contents
JPMorgan Insurance Trust Small Cap Core Portfolio
PORTFOLIO COMMENTARY
TWELVE MONTHS ENDED DECEMBER 31, 2013 (Unaudited) (continued)
AVERAGE ANNUAL TOTAL RETURNS AS OF DECEMBER 31, 2013 | ||||||||||||||||
| INCEPTION DATE OF CLASS | 1 YEAR | 5 YEAR | 10 YEAR | |||||||||||||
CLASS 1 SHARES | 1/3/95 | 42.29 | % | 20.38 | % | 9.39 | % | |||||||||
CLASS 2 SHARES | 4/24/09 | 41.87 | 20.09 | 9.26 | ||||||||||||
TEN YEAR PERFORMANCE (12/31/03 to 12/31/13)
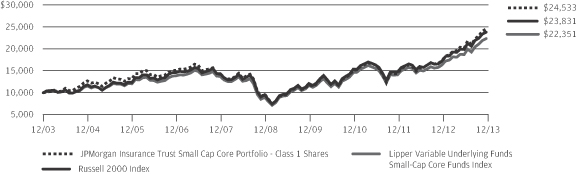
The performance quoted is past performance and is not a guarantee of future results. Mutual funds are subject to certain market risks. Investment returns and principal value of an investment will fluctuate so that an investor’s shares, when redeemed, may be worth more or less than their original cost. Current performance may be higher or lower than the performance data shown. For up-to-date month-end performance information please call 1-800-480-4111.
Inception date for Class 1 Shares is January 3, 1995, which is the inception date of JPMorgan Small Company Portfolio (“Predecessor Portfolio”). The JPMorgan Insurance Trust Small Cap Core Portfolio acquired all of the assets and liabilities of the Predecessor Portfolio in a reorganization on April 24, 2009. The Predecessor Portfolio’s performance and financial history have been adopted by JPMorgan Insurance Trust Small Cap Core Portfolio and have been used since the reorganization. As a result the performance for Class 1 Shares prior to April 25, 2009, is the performance of the Predecessor Portfolio.
Returns for Class 2 Shares prior to April 25, 2009 are based on the performance of Class 1 Shares. The actual returns of Class 2 Shares would have been lower than shown because Class 2 Shares have higher expenses than Class 1 Shares and the Predecessor Portfolio.
The graph illustrates comparative performance for $10,000 invested in Class 1 Shares of the JPMorgan Insurance Trust Small Cap Core Portfolio, the Russell 2000 Index and the Lipper Variable Underlying Funds Small-Cap Core Funds Index from December 31, 2003 to December 31, 2013. The performance of the
Portfolio assumes reinvestment of all dividends and capital gain distributions, if any. The performance of the Russell 2000 Index does not reflect the deduction of expenses associated with a mutual fund and has been adjusted to reflect reinvestment of all dividends and capital gain distributions of the securities included in the benchmark, if applicable. The performance of the Lipper Variable Underlying Funds Small-Cap Core Funds Index includes expenses associated with a mutual fund, such as investment management fees. These expenses are not identical to the expenses incurred by the Portfolio. The Russell 2000 Index is an unmanaged index which measures the performance of the 2000 smallest stocks (on the basis of capitalization) in the Russell 3000 Index. The Lipper Variable Underlying Funds Small-Cap Core Funds Index is an index based on the total returns of certain mutual funds within the Portfolio’s designated category as determined by Lipper, Inc. Investors cannot invest directly in an index.
The Portfolio performance does not reflect any charges imposed by the Policies or Eligible Plans. If these charges were included, the returns would be lower than shown. Portfolio performance may reflect the waiver of the Portfolio’s fees and reimbursement of expenses for certain periods since the inception date. Without these waivers and reimbursements, performance would have been lower.
The returns shown are based on net asset values calculated for shareholder transactions and may differ from the returns shown in the financial highlights, which reflect adjustments made to the net asset values in accordance with accounting principles generally accepted in the United States of America.
| 4 | JPMORGAN INSURANCE TRUST | DECEMBER 31, 2013 | ||||
Table of Contents
JPMorgan Insurance Trust Small Cap Core Portfolio
SCHEDULE OF PORTFOLIO INVESTMENTS
AS OF DECEMBER 31, 2013
| SHARES | SECURITY DESCRIPTION | VALUE($) | ||||||
| Common Stocks — 97.1% |
| ||||||
Consumer Discretionary — 12.6% |
| |||||||
Auto Components — 1.2% |
| |||||||
| 24,400 | Cooper Tire & Rubber Co. | 586,576 | ||||||
| 4,600 | Standard Motor Products, Inc. | 169,280 | ||||||
| 9,400 | Stoneridge, Inc. (a) | 119,850 | ||||||
| 17,800 | Tower International, Inc. (a) | 380,920 | ||||||
|
| |||||||
| 1,256,626 | ||||||||
|
| |||||||
Distributors — 0.3% |
| |||||||
| 3,300 | Core-Mark Holding Co., Inc. | 250,569 | ||||||
| 100 | Stock Building Supply Holdings, Inc. (a) | 1,822 | ||||||
| 1,560 | VOXX International Corp. (a) | 26,052 | ||||||
|
| |||||||
| 278,443 | ||||||||
|
| |||||||
Diversified Consumer Services — 0.4% |
| |||||||
| 1,600 | Capella Education Co. | 106,304 | ||||||
| 15,700 | Corinthian Colleges, Inc. (a) | 27,946 | ||||||
| 3,100 | ITT Educational Services, Inc. (a) | 104,098 | ||||||
| 2,300 | Outerwall, Inc. (a) | 154,721 | ||||||
|
| |||||||
| 393,069 | ||||||||
|
| |||||||
Hotels, Restaurants & Leisure — 1.5% |
| |||||||
| 1,800 | Cracker Barrel Old Country Store, Inc. | 198,126 | ||||||
| 5,600 | Einstein Noah Restaurant Group, Inc. | 81,200 | ||||||
| 10,200 | Jack in the Box, Inc. (a) | 510,204 | ||||||
| 29,968 | Ruth’s Hospitality Group, Inc. | 425,846 | ||||||
| 19,400 | Sonic Corp. (a) | 391,686 | ||||||
|
| |||||||
| 1,607,062 | ||||||||
|
| |||||||
Household Durables — 1.6% |
| |||||||
| 15,900 | Helen of Troy Ltd., (Bermuda) (a) | 787,209 | ||||||
| 3,289 | Jarden Corp. (a) | 201,780 | ||||||
| 11,400 | KB Home | 208,392 | ||||||
| 2,300 | Libbey, Inc. (a) | 48,300 | ||||||
| 8,300 | Lifetime Brands, Inc. | 130,559 | ||||||
| 1,600 | NACCO Industries, Inc., Class A | 99,504 | ||||||
| 6,000 | Universal Electronics, Inc. (a) | 228,660 | ||||||
|
| |||||||
| 1,704,404 | ||||||||
|
| |||||||
Internet & Catalog Retail — 0.4% |
| |||||||
| 12,331 | FTD Cos., Inc. (a) | 401,744 | ||||||
| 1,500 | zulily, Inc., Class A (a) | 62,145 | ||||||
|
| |||||||
| 463,889 | ||||||||
|
| |||||||
Leisure Equipment & Products — 0.1% |
| |||||||
| 1,700 | Johnson Outdoors, Inc., Class A | 45,815 | ||||||
| 900 | Sturm Ruger & Co., Inc. | 65,781 | ||||||
|
| |||||||
| 111,596 | ||||||||
|
| |||||||
| SHARES | SECURITY DESCRIPTION | VALUE($) | ||||||
Media — 1.3% |
| |||||||
| 2,500 | AMC Entertainment Holdings, Inc., Class A (a) | 51,375 | ||||||
| 40,800 | E.W. Scripps Co., Class A (a) | 886,176 | ||||||
| 5,500 | Entercom Communications Corp., Class A (a) | 57,805 | ||||||
| 12,400 | Gray Television, Inc. (a) | 184,512 | ||||||
| 14,400 | Journal Communications, Inc., Class A (a) | 134,064 | ||||||
| 2,000 | Live Nation Entertainment, Inc. (a) | 39,520 | ||||||
| 2,700 | Sinclair Broadcast Group, Inc., Class A | 96,471 | ||||||
|
| |||||||
| 1,449,923 | ||||||||
|
| |||||||
Multiline Retail — 0.9% |
| |||||||
| 3,400 | Burlington Stores, Inc. (a) | 108,800 | ||||||
| 7,200 | Dillard’s, Inc., Class A | 699,912 | ||||||
| 13,200 | Tuesday Morning Corp. (a) | 210,672 | ||||||
|
| |||||||
| 1,019,384 | ||||||||
|
| |||||||
Specialty Retail — 3.0% |
| |||||||
| 17,900 | Brown Shoe Co., Inc. | 503,706 | ||||||
| 6,805 | Cato Corp. (The), Class A | 216,399 | ||||||
| 1,500 | Children’s Place Retail Stores, Inc. (The) (a) | 85,455 | ||||||
| 7,200 | Conn’s, Inc. (a) | 567,288 | ||||||
| 1,000 | Container Store Group, Inc. (The) (a) | 46,610 | ||||||
| 5,100 | Destination Maternity Corp. | 152,388 | ||||||
| 50,700 | Express, Inc. (a) | 946,569 | ||||||
| 112,045 | Office Depot, Inc. (a) | 592,718 | ||||||
| 8,800 | Stein Mart, Inc. | 118,360 | ||||||
| 1,200 | Tilly’s, Inc., Class A (a) | 13,740 | ||||||
| 1,800 | Trans World Entertainment Corp. (a) | 7,956 | ||||||
|
| |||||||
| 3,251,189 | ||||||||
|
| |||||||
Textiles, Apparel & Luxury Goods — 1.9% |
| |||||||
| 12,900 | G-III Apparel Group Ltd. (a) | 951,891 | ||||||
| 20,900 | Iconix Brand Group, Inc. (a) | 829,730 | ||||||
| 6,100 | Perry Ellis International, Inc. (a) | 96,319 | ||||||
| 2,300 | RG Barry Corp. | 44,390 | ||||||
| 2,600 | Vince Holding Corp. (a) | 79,742 | ||||||
|
| |||||||
| 2,002,072 | ||||||||
|
| |||||||
Total Consumer Discretionary | 13,537,657 | |||||||
|
| |||||||
Consumer Staples — 5.6% |
| |||||||
Beverages — 0.1% |
| |||||||
| 1,200 | Coca-Cola Bottling Co. Consolidated | 87,828 | ||||||
|
| |||||||
Food & Staples Retailing — 3.4% |
| |||||||
| 13,400 | Andersons, Inc. (The) | 1,194,878 | ||||||
| 223,400 | Rite Aid Corp. (a) | 1,130,404 | ||||||
| 38,600 | Roundy’s, Inc. | 380,596 | ||||||
| 32,180 | Spartan Stores, Inc. | 781,331 | ||||||
SEE NOTES TO FINANCIAL STATEMENTS.
| DECEMBER 31, 2013 | JPMORGAN INSURANCE TRUST | 5 | ||||||
Table of Contents
JPMorgan Insurance Trust Small Cap Core Portfolio
SCHEDULE OF PORTFOLIO INVESTMENTS
AS OF DECEMBER 31, 2013 (continued)
| SHARES | SECURITY DESCRIPTION | VALUE($) | ||||||
| Common Stocks — Continued |
| ||||||
Food & Staples Retailing — Continued |
| |||||||
| 13,100 | SUPERVALU, Inc. (a) | 95,499 | ||||||
| 1,700 | Village Super Market, Inc., Class A | 52,717 | ||||||
|
| |||||||
| 3,635,425 | ||||||||
|
| |||||||
Food Products — 1.6% |
| |||||||
| 40,500 | Chiquita Brands International, Inc. (a) | 473,850 | ||||||
| 5,700 | Darling International, Inc. (a) | 119,016 | ||||||
| 3,100 | Fresh Del Monte Produce, Inc. | 87,730 | ||||||
| 2,600 | John B Sanfilippo & Son, Inc. | 64,168 | ||||||
| 30,900 | Pilgrim’s Pride Corp. (a) | 502,125 | ||||||
| 8,800 | Pinnacle Foods, Inc. | 241,648 | ||||||
| 2,800 | Sanderson Farms, Inc. | 202,524 | ||||||
|
| |||||||
| 1,691,061 | ||||||||
|
| |||||||
Personal Products — 0.5% |
| |||||||
| 5,225 | Prestige Brands Holdings, Inc. (a) | 187,055 | ||||||
| 4,600 | Revlon, Inc., Class A (a) | 114,816 | ||||||
| 3,600 | USANA Health Sciences, Inc. (a) | 272,088 | ||||||
|
| |||||||
| 573,959 | ||||||||
|
| |||||||
Total Consumer Staples | 5,988,273 | |||||||
|
| |||||||
Energy — 4.9% |
| |||||||
Energy Equipment & Services — 1.4% |
| |||||||
| 9,400 | C&J Energy Services, Inc. (a) | 217,140 | ||||||
| 8,300 | Dawson Geophysical Co. (a) | 280,706 | ||||||
| 10,400 | Forum Energy Technologies, Inc. (a) | 293,904 | ||||||
| 3,200 | Gulfmark Offshore, Inc., Class A | 150,816 | ||||||
| 10,500 | Helix Energy Solutions Group, Inc. (a) | 243,390 | ||||||
| 11,012 | Superior Energy Services, Inc. (a) | 293,029 | ||||||
|
| |||||||
| 1,478,985 | ||||||||
|
| |||||||
Oil, Gas & Consumable Fuels — 3.5% |
| |||||||
| 2,000 | Alon USA Energy, Inc. | 33,080 | ||||||
| 2,300 | Bonanza Creek Energy, Inc. (a) | 99,981 | ||||||
| 11,700 | Delek U.S. Holdings, Inc. | 402,597 | ||||||
| 4,100 | Energy XXI Bermuda Ltd., (Bermuda) | 110,946 | ||||||
| 24,000 | EPL Oil & Gas, Inc. (a) | 684,000 | ||||||
| 8,200 | Equal Energy Ltd. | 43,788 | ||||||
| 64,800 | Gastar Exploration Ltd. (a) | 448,416 | ||||||
| 38,100 | Renewable Energy Group, Inc. (a) | 436,626 | ||||||
| 2,100 | REX American Resources Corp. (a) | 93,891 | ||||||
| 5,100 | Stone Energy Corp. (a) | 176,409 | ||||||
| 16,600 | W&T Offshore, Inc. | 265,600 | ||||||
| 108,800 | Warren Resources, Inc. (a) | 341,632 | ||||||
| 11,600 | Western Refining, Inc. | 491,956 | ||||||
| 700 | Westmoreland Coal Co. (a) | 13,503 | ||||||
| SHARES | SECURITY DESCRIPTION | VALUE($) | ||||||
Oil, Gas & Consumable Fuels — Continued |
| |||||||
| 2,500 | World Fuel Services Corp. | 107,900 | ||||||
|
| |||||||
| 3,750,325 | ||||||||
|
| |||||||
Total Energy | 5,229,310 | |||||||
|
| |||||||
Financials — 21.6% |
| |||||||
Capital Markets — 1.0% |
| |||||||
| 14,700 | BGC Partners, Inc., Class A | 89,082 | ||||||
| 19,100 | Cowen Group, Inc., Class A (a) | 74,681 | ||||||
| 5,289 | Gladstone Capital Corp. | 50,774 | ||||||
| 26,500 | Investment Technology Group, Inc. (a) | 544,840 | ||||||
| 16,000 | Ladenburg Thalmann Financial Services, Inc. (a) | 50,080 | ||||||
| 5,400 | Manning & Napier, Inc. | 95,310 | ||||||
| 3,400 | Piper Jaffray Cos. (a) | 134,470 | ||||||
| 1,354 | Prospect Capital Corp. | 15,192 | ||||||
|
| |||||||
| 1,054,429 | ||||||||
|
| |||||||
Commercial Banks — 7.0% |
| |||||||
| 3,000 | Banco Latinoamericano de Comercio Exterior S.A., (Panama), Class E | 84,060 | ||||||
| 11,400 | BBCN Bancorp, Inc. | 189,126 | ||||||
| 2,500 | BNC Bancorp | 42,850 | ||||||
| 1,200 | Bridge Bancorp, Inc. | 31,200 | ||||||
| 17,000 | Cardinal Financial Corp. | 306,000 | ||||||
| 6,700 | Cathay General Bancorp | 179,091 | ||||||
| 1,300 | Center Bancorp, Inc. | 24,388 | ||||||
| 3,900 | Citizens & Northern Corp. | 80,457 | ||||||
| 725 | City Holding Co. | 33,589 | ||||||
| 1,340 | Community Trust Bancorp, Inc. | 60,514 | ||||||
| 500 | ConnectOne Bancorp, Inc. (a) | 19,815 | ||||||
| 27,300 | East West Bancorp, Inc. | 954,681 | ||||||
| 2,834 | Fidelity Southern Corp. | 47,073 | ||||||
| 4,100 | Financial Institutions, Inc. | 101,311 | ||||||
| 20,100 | First Commonwealth Financial Corp. | 177,282 | ||||||
| 4,900 | First Community Bancshares, Inc. | 81,830 | ||||||
| 4,600 | First Financial Bancorp | 80,178 | ||||||
| 3,800 | First Merchants Corp. | 86,488 | ||||||
| 29,057 | FirstMerit Corp. | 645,937 | ||||||
| 29,325 | Hanmi Financial Corp. | 641,924 | ||||||
| 2,532 | Heartland Financial USA, Inc. | 72,896 | ||||||
| 3,900 | Huntington Bancshares, Inc. | 37,635 | ||||||
| 975 | Iberiabank Corp. | 61,279 | ||||||
| 1,800 | Lakeland Financial Corp. | 70,200 | ||||||
| 3,500 | MainSource Financial Group, Inc. | 63,105 | ||||||
| 3,200 | MetroCorp Bancshares, Inc. | 48,224 | ||||||
| 800 | National Bankshares, Inc. | 29,512 | ||||||
| 2,571 | NBT Bancorp, Inc. | 66,589 | ||||||
SEE NOTES TO FINANCIAL STATEMENTS.
| 6 | JPMORGAN INSURANCE TRUST | DECEMBER 31, 2013 | ||||
Table of Contents
| SHARES | SECURITY DESCRIPTION | VALUE($) | ||||||
| Common Stocks — Continued |
| ||||||
Commercial Banks — Continued |
| |||||||
| 14,300 | OFG Bancorp, (Puerto Rico) | 247,962 | ||||||
| 8,200 | Park Sterling Corp. | 58,548 | ||||||
| 1,200 | Peoples Bancorp, Inc. | 27,012 | ||||||
| 8,300 | Pinnacle Financial Partners, Inc. | 269,999 | ||||||
| 28,400 | Popular, Inc., (Puerto Rico) (a) | 815,932 | ||||||
| 3,900 | Preferred Bank (a) | 78,195 | ||||||
| 4,300 | PrivateBancorp, Inc. | 124,399 | ||||||
| 1,300 | Prosperity Bancshares, Inc. | 82,407 | ||||||
| 4,750 | Sierra Bancorp | 76,428 | ||||||
| 12,635 | Southwest Bancorp, Inc. (a) | 201,149 | ||||||
| 11,700 | Susquehanna Bancshares, Inc. | 150,228 | ||||||
| 1,300 | SVB Financial Group (a) | 136,318 | ||||||
| 3,100 | Texas Capital Bancshares, Inc. (a) | 192,820 | ||||||
| 2,300 | WesBanco, Inc. | 73,600 | ||||||
| 3,600 | West Bancorporation, Inc. | 56,952 | ||||||
| 57,600 | Wilshire Bancorp, Inc. | 629,568 | ||||||
|
| |||||||
| 7,538,751 | ||||||||
|
| |||||||
Consumer Finance — 3.1% |
| |||||||
| 2,000 | Cash America International, Inc. | 76,600 | ||||||
| 16,046 | DFC Global Corp. (a) | 183,727 | ||||||
| 8,600 | Encore Capital Group, Inc. (a) | 432,236 | ||||||
| 4,000 | Ezcorp, Inc., Class A (a) | 46,760 | ||||||
| 15,900 | Green Dot Corp., Class A (a) | 399,885 | ||||||
| 5,600 | JGWPT Holdings, Inc., Class A (a) | 97,384 | ||||||
| 6,400 | Nelnet, Inc., Class A | 269,696 | ||||||
| 5,700 | Portfolio Recovery Associates, Inc. (a) | 301,188 | ||||||
| 19,000 | Regional Management Corp. (a) | 644,670 | ||||||
| 5,500 | Springleaf Holdings, Inc. (a) | 139,040 | ||||||
| 8,025 | World Acceptance Corp. (a) | 702,428 | ||||||
|
| |||||||
| 3,293,614 | ||||||||
|
| |||||||
Insurance — 2.5% |
| |||||||
| 34,100 | American Equity Investment Life Holding Co. | 899,558 | ||||||
| 6,325 | Aspen Insurance Holdings Ltd., (Bermuda) | 261,286 | ||||||
| 43,000 | CNO Financial Group, Inc. | 760,670 | ||||||
| 2,200 | Crawford & Co., Class B | 20,328 | ||||||
| 5,300 | HCI Group, Inc. | 283,550 | ||||||
| 1,500 | Horace Mann Educators Corp. | 47,310 | ||||||
| 11,500 | Maiden Holdings Ltd., (Bermuda) | 125,695 | ||||||
| 1,200 | Montpelier Re Holdings Ltd., (Bermuda) | 34,920 | ||||||
| 3,100 | Selective Insurance Group, Inc. | 83,886 | ||||||
| 1,300 | Stewart Information Services Corp. | 41,951 | ||||||
| 3,400 | United Fire Group, Inc. | 97,444 | ||||||
| 1,006 | Validus Holdings Ltd., (Bermuda) | 40,532 | ||||||
|
| |||||||
| 2,697,130 | ||||||||
|
| |||||||
| SHARES | SECURITY DESCRIPTION | VALUE($) | ||||||
Real Estate Investment Trusts (REITs) — 6.6% |
| |||||||
| 800 | Agree Realty Corp. | 23,216 | ||||||
| 3,783 | American Campus Communities, Inc. | 121,850 | ||||||
| 81,400 | Anworth Mortgage Asset Corp. | 342,694 | ||||||
| 3,480 | Ashford Hospitality Prime, Inc. | 63,336 | ||||||
| 17,400 | Ashford Hospitality Trust, Inc. | 144,072 | ||||||
| 59,700 | Capstead Mortgage Corp. | 721,176 | ||||||
| 12,500 | CBL & Associates Properties, Inc. | 224,500 | ||||||
| 7,700 | Chatham Lodging Trust | 157,465 | ||||||
| 6,700 | Chesapeake Lodging Trust | 169,443 | ||||||
| 10,000 | CoreSite Realty Corp. | 321,900 | ||||||
| 22,200 | Cousins Properties, Inc. | 228,660 | ||||||
| 24,975 | DCT Industrial Trust, Inc. | 178,072 | ||||||
| 8,200 | DDR Corp. | 126,034 | ||||||
| 2,700 | EastGroup Properties, Inc. | 156,411 | ||||||
| 20,200 | Education Realty Trust, Inc. | 178,164 | ||||||
| 36,500 | First Industrial Realty Trust, Inc. | 636,925 | ||||||
| 14,000 | GEO Group, Inc. (The) | 451,080 | ||||||
| 7,400 | Glimcher Realty Trust | 69,264 | ||||||
| 1,350 | Home Properties, Inc. | 72,387 | ||||||
| 5,300 | LaSalle Hotel Properties | 163,558 | ||||||
| 3,400 | LTC Properties, Inc. | 120,326 | ||||||
| 995 | Mid-America Apartment Communities, Inc. | 60,436 | ||||||
| 2,700 | Parkway Properties, Inc. | 52,083 | ||||||
| 6,700 | Pebblebrook Hotel Trust | 206,092 | ||||||
| 9,525 | Pennsylvania Real Estate Investment Trust | 180,785 | ||||||
| 18,400 | Potlatch Corp. | 768,016 | ||||||
| 2,075 | PS Business Parks, Inc. | 158,571 | ||||||
| 14,000 | RAIT Financial Trust | 125,580 | ||||||
| 2,400 | Ramco-Gershenson Properties Trust | 37,776 | ||||||
| 17,400 | Redwood Trust, Inc. | 337,038 | ||||||
| 18,000 | RLJ Lodging Trust | 437,760 | ||||||
| 1,200 | Sun Communities, Inc. | 51,168 | ||||||
| 4,200 | Sunstone Hotel Investors, Inc. | 56,280 | ||||||
|
| |||||||
| 7,142,118 | ||||||||
|
| |||||||
Real Estate Management & Development — 0.2% |
| |||||||
| 6,100 | RE/MAX Holdings, Inc., Class A (a) | 195,627 | ||||||
|
| |||||||
Thrifts & Mortgage Finance — 1.2% |
| |||||||
| 2,000 | BofI Holding, Inc. (a) | 156,860 | ||||||
| 5,100 | HomeStreet, Inc. | 102,000 | ||||||
| 2,500 | OceanFirst Financial Corp. | 42,825 | ||||||
| 17,075 | Ocwen Financial Corp. (a) | 946,809 | ||||||
|
| |||||||
| 1,248,494 | ||||||||
|
| |||||||
Total Financials | 23,170,163 | |||||||
|
| |||||||
SEE NOTES TO FINANCIAL STATEMENTS.
| DECEMBER 31, 2013 | JPMORGAN INSURANCE TRUST | 7 | ||||||
Table of Contents
JPMorgan Insurance Trust Small Cap Core Portfolio
SCHEDULE OF PORTFOLIO INVESTMENTS
AS OF DECEMBER 31, 2013 (continued)
| SHARES | SECURITY DESCRIPTION | VALUE($) | ||||||
| Common Stocks — Continued |
| ||||||
Health Care — 11.5% |
| |||||||
Biotechnology — 2.5% |
| |||||||
| 1,500 | Acorda Therapeutics, Inc. (a) | 43,800 | ||||||
| 6,200 | Aegerion Pharmaceuticals, Inc. (a) | 439,952 | ||||||
| 500 | Agios Pharmaceuticals, Inc. (a) | 11,975 | ||||||
| 2,800 | Alnylam Pharmaceuticals, Inc. (a) | 180,124 | ||||||
| 11,500 | AMAG Pharmaceuticals, Inc. (a) | 279,105 | ||||||
| 6,000 | Celldex Therapeutics, Inc. (a) | 145,260 | ||||||
| 1,900 | Foundation Medicine, Inc. (a) | 45,258 | ||||||
| 12,300 | Infinity Pharmaceuticals, Inc. (a) | 169,863 | ||||||
| 1,900 | Karyopharm Therapeutics, Inc. (a) | 43,548 | ||||||
| 1,000 | MacroGenics, Inc. (a) | 27,430 | ||||||
| 6,700 | Ophthotech Corp. (a) | 216,745 | ||||||
| 4,800 | Pharmacyclics, Inc. (a) | 507,744 | ||||||
| 1,700 | Raptor Pharmaceutical Corp. (a) | 22,134 | ||||||
| 4,800 | Synageva BioPharma Corp. (a) | 310,656 | ||||||
| 53,300 | Threshold Pharmaceuticals, Inc. (a) | 248,911 | ||||||
|
| |||||||
| 2,692,505 | ||||||||
|
| |||||||
Health Care Equipment & Supplies — 2.6% |
| |||||||
| 4,600 | ArthroCare Corp. (a) | 185,104 | ||||||
| 17,100 | Greatbatch, Inc. (a) | 756,504 | ||||||
| 1,300 | Insulet Corp. (a) | 48,230 | ||||||
| 35,000 | NuVasive, Inc. (a) | 1,131,550 | ||||||
| 4,000 | PhotoMedex, Inc. (a) | 51,800 | ||||||
| 2,000 | Sirona Dental Systems, Inc. (a) | 140,400 | ||||||
| 9,600 | STERIS Corp. | 461,280 | ||||||
|
| |||||||
| 2,774,868 | ||||||||
|
| |||||||
Health Care Providers & Services — 2.7% |
| |||||||
| 20,913 | Amsurg Corp. (a) | 960,325 | ||||||
| 10,200 | Centene Corp. (a) | 601,290 | ||||||
| 13,186 | Cross Country Healthcare, Inc. (a) | 131,596 | ||||||
| 35,100 | Gentiva Health Services, Inc. (a) | 435,591 | ||||||
| 13,400 | Molina Healthcare, Inc. (a) | 465,650 | ||||||
| 8,600 | Owens & Minor, Inc. | 314,416 | ||||||
| 1,900 | Providence Service Corp. (The) (a) | 48,868 | ||||||
|
| |||||||
| 2,957,736 | ||||||||
|
| |||||||
Health Care Technology — 0.1% |
| |||||||
| 4,200 | Veeva Systems, Inc., Class A (a) | 134,820 | ||||||
|
| |||||||
Life Sciences Tools & Services — 0.5% |
| |||||||
| 20,300 | Cambrex Corp. (a) | 361,949 | ||||||
| 3,700 | Furiex Pharmaceuticals, Inc. (a) | 155,437 | ||||||
|
| |||||||
| 517,386 | ||||||||
|
| |||||||
Pharmaceuticals — 3.1% |
| |||||||
| 2,200 | Cornerstone Therapeutics, Inc. (a) | 20,878 | ||||||
| 10,000 | Impax Laboratories, Inc. (a) | 251,400 | ||||||
| SHARES | SECURITY DESCRIPTION | VALUE($) | ||||||
Pharmaceuticals — Continued |
| |||||||
| 5,800 | Jazz Pharmaceuticals plc, (Ireland) (a) | 734,048 | ||||||
| 25,300 | Lannett Co., Inc. (a) | 837,430 | ||||||
| 27,300 | Medicines Co. (The) (a) | 1,054,326 | ||||||
| 5,600 | Questcor Pharmaceuticals, Inc. | 304,920 | ||||||
| 17,300 | Sciclone Pharmaceuticals, Inc. (a) | 87,192 | ||||||
|
| |||||||
| 3,290,194 | ||||||||
|
| |||||||
Total Health Care | 12,367,509 | |||||||
|
| |||||||
Industrials — 16.1% |
| |||||||
Aerospace & Defense — 2.2% |
| |||||||
| 13,800 | AAR Corp. (m) | 386,538 | ||||||
| 1,100 | Curtiss-Wright Corp. | 68,453 | ||||||
| 22,300 | Engility Holdings, Inc. (a) | 744,820 | ||||||
| 4,700 | Esterline Technologies Corp. (a) | 479,212 | ||||||
| 9,300 | Triumph Group, Inc. | 707,451 | ||||||
|
| |||||||
| 2,386,474 | ||||||||
|
| |||||||
Air Freight & Logistics — 0.3% |
| |||||||
| 3,400 | Atlas Air Worldwide Holdings, Inc. (a) | 139,910 | ||||||
| 3,200 | Park-Ohio Holdings Corp. (a) | 167,680 | ||||||
|
| |||||||
| 307,590 | ||||||||
|
| |||||||
Airlines — 1.6% |
| |||||||
| 9,700 | Alaska Air Group, Inc. | 711,689 | ||||||
| 76,200 | Republic Airways Holdings, Inc. (a) | 814,578 | ||||||
| 11,800 | SkyWest, Inc. | 174,994 | ||||||
|
| |||||||
| 1,701,261 | ||||||||
|
| |||||||
Building Products — 0.1% |
| |||||||
| 975 | Gibraltar Industries, Inc. (a) | 18,125 | ||||||
| 4,800 | Norcraft Cos., Inc. (a) | 94,176 | ||||||
|
| |||||||
| 112,301 | ||||||||
|
| |||||||
Commercial Services & Supplies — 3.7% | ||||||||
| 10,682 | ABM Industries, Inc. | 305,398 | ||||||
| 14,300 | ARC Document Solutions, Inc. (a) | 117,546 | ||||||
| 6,400 | Ceco Environmental Corp. | 103,488 | ||||||
| 73,500 | Cenveo, Inc. (a) | 252,840 | ||||||
| 21,850 | Deluxe Corp. | 1,140,352 | ||||||
| 2,200 | Herman Miller, Inc. | 64,944 | ||||||
| 23,200 | Kimball International, Inc., Class B | 348,696 | ||||||
| 10,100 | Knoll, Inc. | 184,931 | ||||||
| 15,800 | Quad/Graphics, Inc. | 430,234 | ||||||
| 25,100 | Steelcase, Inc., Class A | 398,086 | ||||||
| 1,100 | UniFirst Corp. | 117,700 | ||||||
| 3,400 | United Stationers, Inc. | 156,026 | ||||||
| 12,700 | Viad Corp. | 352,806 | ||||||
|
| |||||||
| 3,973,047 | ||||||||
|
| |||||||
SEE NOTES TO FINANCIAL STATEMENTS.
| 8 | JPMORGAN INSURANCE TRUST | DECEMBER 31, 2013 | ||||
Table of Contents
| SHARES | SECURITY DESCRIPTION | VALUE($) | ||||||
| Common Stocks — Continued |
| ||||||
Construction & Engineering — 0.8% |
| |||||||
| 2,200 | Argan, Inc. | 60,632 | ||||||
| 9,375 | EMCOR Group, Inc. | 397,875 | ||||||
| 13,318 | Tutor Perini Corp. (a) | 350,263 | ||||||
|
| |||||||
| 808,770 | ||||||||
|
| |||||||
Electrical Equipment — 1.6% |
| |||||||
| 3,700 | Acuity Brands, Inc. | 404,484 | ||||||
| 11,000 | Brady Corp., Class A | 340,230 | ||||||
| 6,100 | EnerSys, Inc. | 427,549 | ||||||
| 5,200 | Generac Holdings, Inc. | 294,528 | ||||||
| 3,900 | LSI Industries, Inc. | 33,813 | ||||||
| 2,800 | Regal-Beloit Corp. | 206,416 | ||||||
|
| |||||||
| 1,707,020 | ||||||||
|
| |||||||
Machinery — 3.2% |
| |||||||
| 8,200 | Albany International Corp., Class A | 294,626 | ||||||
| 4,900 | Barnes Group, Inc. | 187,719 | ||||||
| 4,100 | Columbus McKinnon Corp. (a) | 111,274 | ||||||
| 1,043 | EnPro Industries, Inc. (a) | 60,129 | ||||||
| 13,300 | Federal Signal Corp. (a) | 194,845 | ||||||
| 6,100 | FreightCar America, Inc. | 162,382 | ||||||
| 7,400 | Global Brass & Copper Holdings, Inc. | 122,470 | ||||||
| 3,800 | Hardinge, Inc. | 54,986 | ||||||
| 3,300 | Hyster-Yale Materials Handling, Inc. | 307,428 | ||||||
| 6,300 | Kadant, Inc. | 255,276 | ||||||
| 4,600 | LB Foster Co., Class A | 217,534 | ||||||
| 8,300 | NN, Inc. | 167,577 | ||||||
| 800 | Standex International Corp. | 50,304 | ||||||
| 8,200 | Trimas Corp. (a) | 327,098 | ||||||
| 15,600 | Wabash National Corp. (a) | 192,660 | ||||||
| 7,600 | Wabtec Corp. | 564,452 | ||||||
| 1,000 | Watts Water Technologies, Inc., Class A | 61,870 | ||||||
| 9,200 | Xerium Technologies, Inc. (a) | 151,708 | ||||||
|
| |||||||
| 3,484,338 | ||||||||
|
| |||||||
Professional Services — 1.2% |
| |||||||
| 7,300 | Barrett Business Services, Inc. | 677,002 | ||||||
| 3,000 | Heidrick & Struggles International, Inc. | 60,420 | ||||||
| 4,200 | Insperity, Inc. | 151,746 | ||||||
| 1,700 | Kelly Services, Inc., Class A | 42,398 | ||||||
| 6,500 | RPX Corp. (a) | 109,850 | ||||||
| 5,600 | TrueBlue, Inc. (a) | 144,368 | ||||||
| 1,900 | VSE Corp. | 91,219 | ||||||
|
| |||||||
| 1,277,003 | ||||||||
|
| |||||||
Road & Rail — 0.8% |
| |||||||
| 500 | AMERCO (a) | 118,920 | ||||||
| SHARES | SECURITY DESCRIPTION | VALUE($) | ||||||
Road & Rail — Continued |
| |||||||
| 2,100 | Avis Budget Group, Inc. (a) | 84,882 | ||||||
| 18,700 | Quality Distribution, Inc. (a) | 239,921 | ||||||
| 3,150 | Saia, Inc. (a) | 100,958 | ||||||
| 13,100 | Swift Transportation Co. (a) | 290,951 | ||||||
| 2,200 | Universal Truckload Services, Inc. | 67,122 | ||||||
|
| |||||||
| 902,754 | ||||||||
|
| |||||||
Trading Companies & Distributors — 0.6% |
| |||||||
| 6,975 | Applied Industrial Technologies, Inc. | 342,403 | ||||||
| 900 | Beacon Roofing Supply, Inc. (a) | 36,252 | ||||||
| 2,800 | United Rentals, Inc. (a) | 218,260 | ||||||
|
| |||||||
| 596,915 | ||||||||
|
| |||||||
Total Industrials | 17,257,473 | |||||||
|
| |||||||
Information Technology — 17.1% |
| |||||||
Communications Equipment — 1.1% |
| |||||||
| 20,382 | ARRIS Group, Inc. (a) | 496,607 | ||||||
| 12,400 | Aviat Networks, Inc. (a) | 28,024 | ||||||
| 2,000 | CalAmp Corp. (a) | 55,940 | ||||||
| 23,300 | Extreme Networks, Inc. (a) | 163,100 | ||||||
| 52,400 | Harmonic, Inc. (a) | 386,712 | ||||||
| 1,800 | Oplink Communications, Inc. (a) | 33,480 | ||||||
| 7,100 | PC-Tel, Inc. | 67,947 | ||||||
|
| |||||||
| 1,231,810 | ||||||||
|
| |||||||
Computers & Peripherals — 0.6% |
| |||||||
| 10,700 | Avid Technology, Inc. (a) | 87,205 | ||||||
| 17,200 | QLogic Corp. (a) | 203,476 | ||||||
| 26,700 | Silicon Graphics International Corp. (a) | 358,047 | ||||||
| 5,500 | Violin Memory, Inc. (a) | 21,780 | ||||||
|
| |||||||
| 670,508 | ||||||||
|
| |||||||
Electronic Equipment, Instruments & Components — 2.9% |
| |||||||
| 15,300 | Audience, Inc. (a) | 178,092 | ||||||
| 25,700 | Benchmark Electronics, Inc. (a) | 593,156 | ||||||
| 12,000 | Insight Enterprises, Inc. (a) | 272,520 | ||||||
| 2,100 | Littelfuse, Inc. | 195,153 | ||||||
| 9,500 | Newport Corp. (a) | 171,665 | ||||||
| 62,900 | Sanmina Corp. (a) | 1,050,430 | ||||||
| 10,000 | SYNNEX Corp. (a) | 674,000 | ||||||
|
| |||||||
| 3,135,016 | ||||||||
|
| |||||||
Internet Software & Services — 2.4% |
| |||||||
| 21,100 | Carbonite, Inc. (a) | 249,613 | ||||||
| 5,200 | Chegg, Inc. (a) | 44,252 | ||||||
| 8,700 | Cornerstone OnDemand, Inc. (a) | 464,058 | ||||||
| 1,100 | Digital River, Inc. (a) | 20,350 | ||||||
| 1,800 | IntraLinks Holdings, Inc. (a) | 21,798 | ||||||
SEE NOTES TO FINANCIAL STATEMENTS.
| DECEMBER 31, 2013 | JPMORGAN INSURANCE TRUST | 9 | ||||||
Table of Contents
JPMorgan Insurance Trust Small Cap Core Portfolio
SCHEDULE OF PORTFOLIO INVESTMENTS
AS OF DECEMBER 31, 2013 (continued)
| SHARES | SECURITY DESCRIPTION | VALUE($) | ||||||
| Common Stocks — Continued |
| ||||||
Internet Software & Services — Continued |
| |||||||
| 4,400 | Stamps.com, Inc. (a) | 185,240 | ||||||
| 22,500 | support.com, Inc. (a) | 85,275 | ||||||
| 26,551 | United Online, Inc. | 365,342 | ||||||
| 27,244 | WebMD Health Corp. (a) | 1,076,138 | ||||||
| 900 | Xoom Corp. (a) | 24,633 | ||||||
|
| |||||||
| 2,536,699 | ||||||||
|
| |||||||
IT Services — 2.9% |
| |||||||
| 16,025 | CSG Systems International, Inc. | 471,135 | ||||||
| 2,000 | EVERTEC, Inc., (Puerto Rico) | 49,320 | ||||||
| 38,900 | Global Cash Access Holdings, Inc. (a) | 388,611 | ||||||
| 20,200 | iGATE Corp. (a) | 811,232 | ||||||
| 35,500 | Unisys Corp. (a) | 1,191,735 | ||||||
| 5,902 | VeriFone Systems, Inc. (a) | 158,292 | ||||||
|
| |||||||
| 3,070,325 | ||||||||
|
| |||||||
Semiconductors & Semiconductor Equipment — 4.0% |
| |||||||
| 6,450 | Alpha & Omega Semiconductor Ltd. (a) | 49,729 | ||||||
| 20,875 | Amkor Technology, Inc. (a) | 127,964 | ||||||
| 5,800 | Brooks Automation, Inc. | 60,842 | ||||||
| 18,006 | Entegris, Inc. (a) | 208,869 | ||||||
| 16,000 | First Solar, Inc. (a) | 874,240 | ||||||
| 12,800 | Integrated Silicon Solution, Inc. (a) | 154,752 | ||||||
| 10,400 | Lattice Semiconductor Corp. (a) | 57,304 | ||||||
| 200 | M/A-COM Technology Solutions Holdings, Inc. (a) | 3,398 | ||||||
| 3,800 | Nanometrics, Inc. (a) | 72,390 | ||||||
| 9,400 | Pericom Semiconductor Corp. (a) | 83,284 | ||||||
| 23,922 | Photronics, Inc. (a) | 216,016 | ||||||
| 25,600 | Silicon Image, Inc. (a) | 157,440 | ||||||
| 16,700 | Skyworks Solutions, Inc. (a) | 476,952 | ||||||
| 23,100 | Spansion, Inc., Class A (a) | 320,859 | ||||||
| 73,500 | SunEdison, Inc. (a) | 959,175 | ||||||
| 46,600 | Ultra Clean Holdings, Inc. (a) | 467,398 | ||||||
|
| |||||||
| 4,290,612 | ||||||||
|
| |||||||
Software — 3.2% |
| |||||||
| 28,284 | Actuate Corp. (a) | 218,070 | ||||||
| 10,300 | Advent Software, Inc. | 360,397 | ||||||
| 1,406 | Aspen Technology, Inc. (a) | 58,771 | ||||||
| 2,000 | FireEye, Inc. (a) | 87,220 | ||||||
| 1,500 | Manhattan Associates, Inc. (a) | 176,220 | ||||||
| 2,900 | Monotype Imaging Holdings, Inc. | 92,394 | ||||||
| 22,200 | Pegasystems, Inc. | 1,091,796 | ||||||
| 7,640 | PTC, Inc. (a) | 270,379 | ||||||
| 1,300 | Rovi Corp. (a) | 25,597 | ||||||
| 42,700 | Take-Two Interactive Software, Inc. (a) | 741,699 | ||||||
| SHARES | SECURITY DESCRIPTION | VALUE($) | ||||||
Software — Continued |
| |||||||
| 53,600 | TeleCommunication Systems, Inc., Class A (a) | 124,352 | ||||||
| 15,400 | Telenav, Inc. (a) | 101,486 | ||||||
| 3,700 | TIBCO Software, Inc. (a) | 83,176 | ||||||
|
| |||||||
| 3,431,557 | ||||||||
|
| |||||||
Total Information Technology | 18,366,527 | |||||||
|
| |||||||
Materials — 3.8% |
| |||||||
Chemicals — 1.9% |
| |||||||
| 6,900 | A Schulman, Inc. | 243,294 | ||||||
| 2,600 | American Pacific Corp. (a) | 96,876 | ||||||
| 10,900 | Axiall Corp. | 517,096 | ||||||
| 800 | FutureFuel Corp. | 12,640 | ||||||
| 4,600 | H.B. Fuller Co. | 239,384 | ||||||
| 1,000 | Innospec, Inc. | 46,220 | ||||||
| 6,600 | Koppers Holdings, Inc. | 301,950 | ||||||
| 7,700 | Minerals Technologies, Inc. | 462,539 | ||||||
| 12,000 | OMNOVA Solutions, Inc. (a) | 109,320 | ||||||
|
| |||||||
| 2,029,319 | ||||||||
|
| |||||||
Construction Materials — 0.0% (g) | ||||||||
| 5,300 | Headwaters, Inc. (a) | 51,887 | ||||||
|
| |||||||
Containers & Packaging — 1.0% | ||||||||
| 40,900 | Graphic Packaging Holding Co. (a) | 392,640 | ||||||
| 6,075 | Rock Tenn Co., Class A | 637,936 | ||||||
|
| |||||||
| 1,030,576 | ||||||||
|
| |||||||
Metals & Mining — 0.6% | ||||||||
| 4,500 | SunCoke Energy, Inc. (a) | 102,645 | ||||||
| 12,900 | Worthington Industries, Inc. | 542,832 | ||||||
|
| |||||||
| 645,477 | ||||||||
|
| |||||||
Paper & Forest Products — 0.3% | ||||||||
| 5,400 | Boise Cascade Co. (a) | 159,192 | ||||||
| 9,500 | Resolute Forest Products, Inc., (Canada) (a) | 152,190 | ||||||
|
| |||||||
| 311,382 | ||||||||
|
| |||||||
Total Materials | 4,068,641 | |||||||
|
| |||||||
Telecommunication Services — 1.3% |
| |||||||
Diversified Telecommunication Services — 1.3% |
| |||||||
| 4,300 | Atlantic Tele-Network, Inc. | 243,251 | ||||||
| 9,700 | IDT Corp., Class B | 173,339 | ||||||
| 63,700 | Inteliquent, Inc. | 727,454 | ||||||
| 16,700 | Premiere Global Services, Inc. (a) | 193,553 | ||||||
| 4,850 | Straight Path Communications, Inc., Class B (a) | 39,722 | ||||||
|
| |||||||
| 1,377,319 | ||||||||
|
| |||||||
SEE NOTES TO FINANCIAL STATEMENTS.
| 10 | JPMORGAN INSURANCE TRUST | DECEMBER 31, 2013 | ||||
Table of Contents
| SHARES | SECURITY DESCRIPTION | VALUE($) | ||||||
| Common Stocks — Continued |
| ||||||
Wireless Telecommunication Services — 0.0% (g) |
| |||||||
| 3,700 | USA Mobility, Inc. | 52,836 | ||||||
|
| |||||||
Total Telecommunication Services | 1,430,155 | |||||||
|
| |||||||
Utilities — 2.6% |
| |||||||
Electric Utilities — 1.9% |
| |||||||
| 9,725 | El Paso Electric Co. | 341,445 | ||||||
| 3,400 | Empire District Electric Co. (The) | 77,146 | ||||||
| 5,600 | IDACORP, Inc. | 290,304 | ||||||
| 1,900 | MGE Energy, Inc. | 110,010 | ||||||
| 27,475 | Portland General Electric Co. | 829,745 | ||||||
| 5,425 | UNS Energy Corp. | 324,686 | ||||||
| 1,900 | Westar Energy, Inc. | 61,123 | ||||||
|
| |||||||
| 2,034,459 | ||||||||
|
| |||||||
Gas Utilities — 0.6% |
| |||||||
| 419 | AGL Resources, Inc. | 19,789 | ||||||
| 900 | Chesapeake Utilities Corp. | 54,018 | ||||||
| 3,300 | Laclede Group, Inc. (The) | 150,282 | ||||||
| 4,700 | New Jersey Resources Corp. | 217,328 | ||||||
| 1,500 | Northwest Natural Gas Co. | 64,230 | ||||||
| 2,700 | Southwest Gas Corp. | 150,957 | ||||||
| 1,700 | WGL Holdings, Inc. | 68,102 | ||||||
|
| |||||||
| 724,706 | ||||||||
|
| |||||||
Water Utilities — 0.1% |
| |||||||
| 900 | Artesian Resources Corp., Class A | 20,655 | ||||||
| SHARES | SECURITY DESCRIPTION | VALUE($) | ||||||
Water Utilities — Continued |
| |||||||
| 5,800 | Consolidated Water Co., Ltd., (Cayman Islands) | 81,780 | ||||||
|
| |||||||
| 102,435 | ||||||||
|
| |||||||
Total Utilities | 2,861,600 | |||||||
|
| |||||||
Total Common Stocks | 104,277,308 | |||||||
|
| |||||||
| PRINCIPAL AMOUNT($) | ||||||||
| U.S. Treasury Obligation — 0.2% |
| ||||||
| 215,000 | U.S. Treasury Note, 0.250%, 11/30/14 (k) (Cost $215,225) | 215,193 | ||||||
|
| |||||||
| SHARES | ||||||||
| Short-Term Investment — 2.9% |
| ||||||
Investment Company — 2.9% |
| |||||||
| 3,122,262 | JPMorgan Prime Money Market Fund, Institutional Class Shares, 0.010%, (b) (l) (m) | 3,122,262 | ||||||
|
| |||||||
Total Investments — 100.2% | 107,614,763 | |||||||
Liabilities in Excess of | (230,723 | ) | ||||||
|
| |||||||
NET ASSETS — 100.0% | $ | 107,384,040 | ||||||
|
| |||||||
Percentages indicated are based on net assets.
| Futures Contracts | ||||||||||||||||
| NUMBER OF CONTRACTS | DESCRIPTION | EXPIRATION DATE | NOTIONAL VALUE AT 12/31/13 | NET UNREALIZED APPRECIATION (DEPRECIATION) | ||||||||||||
Long Futures Outstanding | ||||||||||||||||
| 27 | E-mini Russell 2000 | 03/21/14 | $ | 3,135,780 | $ | 136,596 | ||||||||||
|
| |||||||||||||||
NOTES TO SCHEDULE OF PORTFOLIO INVESTMENTS:
| (a) | — Non-income producing security. | |
| (b) | — Investment in affiliate. Money market fund registered under the Investment Company Act of 1940, as amended, and advised by J.P. Morgan Investment Management Inc. | |
| (g) | — Amount rounds to less than 0.1%. | |
| (k) | — All or a portion of this security is deposited with the broker as collateral for futures or with brokers as initial margin for futures contracts. |
| (l) | — The rate shown is the current yield as of December 31, 2013. | |
| (m) | — All or a portion of this security is reserved and/or pledged with the custodian for current or potential holdings of futures, swaps, options, TBAs, when-issued securities, delayed delivery securities, reverse repurchase agreements, unfunded commitments and/or forward foreign currency exchange contracts. |
SEE NOTES TO FINANCIAL STATEMENTS.
| DECEMBER 31, 2013 | JPMORGAN INSURANCE TRUST | 11 | ||||||
Table of Contents
STATEMENT OF ASSETS AND LIABILITIES
AS OF DECEMBER 31, 2013
| Small Cap Core Portfolio | ||||
ASSETS: | ||||
Investments in non-affiliates, at value | $ | 104,492,501 | ||
Investments in affiliates, at value | 3,122,262 | |||
|
| |||
Total investment securities, at value | 107,614,763 | |||
Receivables: | ||||
Investment securities sold | 216,457 | |||
Portfolio shares sold | 272,420 | |||
Interest and dividends from non-affiliates | 93,274 | |||
Dividends from affiliates | 47 | |||
Variation margin on futures contracts | 12,960 | |||
|
| |||
Total Assets | 108,209,921 | |||
|
| |||
LIABILITIES: | ||||
Payables: | ||||
Investment securities purchased | 353,177 | |||
Portfolio shares redeemed | 340,428 | |||
Accrued liabilities: | ||||
Investment advisory fees | 57,029 | |||
Administration fees | 7,430 | |||
Distribution fees | 448 | |||
Custodian and accounting fees | 21,277 | |||
Trustees’ and Chief Compliance Officer’s fees | 36 | |||
Other | 46,056 | |||
|
| |||
Total Liabilities | 825,881 | |||
|
| |||
Net Assets | $ | 107,384,040 | ||
|
| |||
NET ASSETS: |
| |||
Paid-in-Capital | $ | 64,704,019 | ||
Accumulated undistributed net investment income | 214,690 | |||
Accumulated net realized gains (losses) | 7,219,891 | |||
Net unrealized appreciation (depreciation) | 35,245,440 | |||
|
| |||
Total Net Assets | $ | 107,384,040 | ||
|
| |||
Net Assets: | ||||
Class 1 | $ | 105,229,638 | ||
Class 2 | 2,154,402 | |||
|
| |||
Total | $ | 107,384,040 | ||
|
| |||
Outstanding units of beneficial interest (shares) | ||||
(unlimited number of shares authorized, no par value): | ||||
Class 1 | 4,379,243 | |||
Class 2 | 90,122 | |||
Net Asset Value, offering and redemption price per share (a): | ||||
Class 1 | $ | 24.03 | ||
Class 2 | 23.91 | |||
|
| |||
Cost of investments in non-affiliates | $ | 69,383,657 | ||
Cost of investments in affiliates | 3,122,262 | |||
| (a) | Per share amounts may not recalculate due to rounding of net assets and/or shares outstanding. |
SEE NOTES TO FINANCIAL STATEMENTS.
| 12 | JPMORGAN INSURANCE TRUST | DECEMBER 31, 2013 | ||||
Table of Contents
STATEMENT OF OPERATIONS
FOR THE YEAR ENDED DECEMBER 31, 2013
| Small Cap Core Portfolio | ||||
INVESTMENT INCOME: | ||||
Dividend income from non-affiliates | $ | 995,186 | ||
Dividend income from affiliates | 1,009 | |||
Interest income from non-affiliates | 344 | |||
|
| |||
Total investment income | 996,539 | |||
|
| |||
EXPENSES: | ||||
Investment advisory fees | 569,492 | |||
Administration fees | 73,789 | |||
Distribution fees — Class 2 | 5,270 | |||
Custodian and accounting fees | 58,940 | |||
Professional fees | 44,104 | |||
Trustees’ and Chief Compliance Officer’s fees | 892 | |||
Printing and mailing costs | 26,414 | |||
Transfer agent fees | 10,533 | |||
Other | 11,249 | |||
|
| |||
Total expenses | 800,683 | |||
|
| |||
Less amounts waived | (4,734 | ) | ||
|
| |||
Net expenses | 795,949 | |||
|
| |||
Net investment income (loss) | 200,590 | |||
|
| |||
REALIZED/UNREALIZED GAINS (LOSSES): | ||||
Net realized gain (loss) on transactions from: | ||||
Investments in non-affiliates | 10,778,127 | |||
Futures | 734,619 | |||
|
| |||
Net realized gains (losses) | 11,512,746 | |||
|
| |||
Change in net unrealized appreciation/depreciation of: | ||||
Investments in non-affiliates | 18,736,137 | |||
Futures | 68,322 | |||
|
| |||
Change in net unrealized appreciation/depreciation | 18,804,459 | |||
|
| |||
Net realized/unrealized gains (losses) | 30,317,205 | |||
|
| |||
Change in net assets resulting from operations | $ | 30,517,795 | ||
|
| |||
SEE NOTES TO FINANCIAL STATEMENTS.
| DECEMBER 31, 2013 | JPMORGAN INSURANCE TRUST | 13 | ||||||
Table of Contents
STATEMENTS OF CHANGES IN NET ASSETS
FOR THE PERIODS INDICATED
| Small Cap Core Portfolio | ||||||||
| Year Ended 12/31/2013 | Year Ended 12/31/2012 | |||||||
CHANGE IN NET ASSETS RESULTING FROM OPERATIONS: |
| |||||||
Net investment income (loss) | $ | 200,590 | $ | 512,635 | ||||
Net realized gain (loss) | 11,512,746 | 5,187,005 | ||||||
Change in net unrealized appreciation/depreciation | 18,804,459 | 5,749,684 | ||||||
|
|
|
| |||||
Change in net assets resulting from operations | 30,517,795 | 11,449,324 | ||||||
|
|
|
| |||||
DISTRIBUTIONS TO SHAREHOLDERS: | ||||||||
Class 1 | ||||||||
From net investment income | (465,407 | ) | (127,898 | ) | ||||
Class 2 | ||||||||
From net investment income | (8,021 | ) | — | |||||
|
|
|
| |||||
Total distributions to shareholders | (473,428 | ) | (127,898 | ) | ||||
|
|
|
| |||||
CAPITAL TRANSACTIONS: | ||||||||
Change in net assets resulting from capital transactions | 8,630,419 | (2,782,957 | ) | |||||
|
|
|
| |||||
NET ASSETS: | ||||||||
Change in net assets | 38,674,786 | 8,538,469 | ||||||
Beginning of period | 68,709,254 | 60,170,785 | ||||||
|
|
|
| |||||
End of period | $ | 107,384,040 | $ | 68,709,254 | ||||
|
|
|
| |||||
Accumulated undistributed net investment income | $ | 214,690 | $ | 492,227 | ||||
|
|
|
| |||||
CAPITAL TRANSACTIONS: | ||||||||
Class 1 | ||||||||
Proceeds from shares issued | $ | 33,235,115 | $ | 13,872,549 | ||||
Distributions reinvested | 465,407 | 127,898 | ||||||
Cost of shares redeemed | (24,490,483 | ) | (16,667,963 | ) | ||||
|
|
|
| |||||
Change in net assets resulting from Class 1 capital transactions | $ | 9,210,039 | $ | (2,667,516 | ) | |||
|
|
|
| |||||
Class 2 | ||||||||
Proceeds from shares issued | $ | 114,156 | $ | 101,342 | ||||
Distributions reinvested | 8,021 | — | ||||||
Cost of shares redeemed | (701,797 | ) | (216,783 | ) | ||||
|
|
|
| |||||
Change in net assets resulting from Class 2 capital transactions | $ | (579,620 | ) | $ | (115,441 | ) | ||
|
|
|
| |||||
Total change in net assets resulting from capital transactions | $ | 8,630,419 | $ | (2,782,957 | ) | |||
|
|
|
| |||||
SHARE TRANSACTIONS: | ||||||||
Class 1 | ||||||||
Issued | 1,627,113 | 865,809 | ||||||
Reinvested | 25,009 | 8,284 | ||||||
Redeemed | (1,202,427 | ) | (1,051,374 | ) | ||||
|
|
|
| |||||
Change in Class 1 Shares | 449,695 | (177,281 | ) | |||||
|
|
|
| |||||
Class 2 | ||||||||
Issued | 5,488 | 6,653 | ||||||
Reinvested | 432 | — | ||||||
Redeemed | (33,532 | ) | (13,633 | ) | ||||
|
|
|
| |||||
Change in Class 2 Shares | (27,612 | ) | (6,980 | ) | ||||
|
|
|
| |||||
SEE NOTES TO FINANCIAL STATEMENTS.
| 14 | JPMORGAN INSURANCE TRUST | DECEMBER 31, 2013 | ||||
Table of Contents
THIS PAGE IS INTENTIONALLY LEFT BLANK
| DECEMBER 31, 2013 | JPMORGAN INSURANCE TRUST | 15 | ||||||
Table of Contents
FOR THE PERIODS INDICATED
| Per share operating performance | ||||||||||||||||||||||||||||
| Investment operations | Distributions | |||||||||||||||||||||||||||
| Net asset value, beginning of period | Net investment income (loss) | Net realized and unrealized gains (losses) on investments | Total from investment operations | Net investment income | Net realized gain | Total distributions | ||||||||||||||||||||||
Small Cap Core Portfolio (f) | ||||||||||||||||||||||||||||
Class 1 | ||||||||||||||||||||||||||||
Year Ended December 31, 2013 | $ | 16.98 | $ | 0.05 | (g)(h) | $ | 7.11 | $ | 7.16 | $ | (0.11 | ) | $ | — | $ | (0.11 | ) | |||||||||||
Year Ended December 31, 2012 | 14.22 | 0.13 | (i) | 2.66 | 2.79 | (0.03 | ) | — | (0.03 | ) | ||||||||||||||||||
Year Ended December 31, 2011 | 14.95 | 0.04 | (0.75 | ) | (0.71 | ) | (0.02 | ) | — | (0.02 | ) | |||||||||||||||||
Year Ended December 31, 2010 | 11.76 | 0.02 | 3.17 | 3.19 | — | — | — | |||||||||||||||||||||
Year Ended December 31, 2009 | 9.84 | 0.05 | 2.11 | 2.16 | (0.08 | ) | (0.16 | ) | (0.24 | ) | ||||||||||||||||||
Class 2 | ||||||||||||||||||||||||||||
Year Ended December 31, 2013 | 16.90 | (0.01 | )(g)(h) | 7.09 | 7.08 | (0.07 | ) | — | (0.07 | ) | ||||||||||||||||||
Year Ended December 31, 2012 | 14.16 | 0.09 | (i) | 2.65 | 2.74 | — | — | — | ||||||||||||||||||||
Year Ended December 31, 2011 | 14.91 | — | (j) | (0.75 | ) | (0.75 | ) | — | — | — | ||||||||||||||||||
Year Ended December 31, 2010 | 11.76 | (0.01 | ) | 3.16 | 3.15 | — | — | — | ||||||||||||||||||||
April 24, 2009 (k) through | 9.03 | 0.01 | 2.73 | 2.74 | (0.01 | ) | — | (0.01 | ) | |||||||||||||||||||
| (a) | Annualized for periods less than one year. |
| (b) | Not annualized for periods less than one year. |
| (c) | Includes adjustments in accordance with accounting principles generally accepted in the United States of America and as such, the net asset values for financial reporting purposes and the returns based upon those net asset values may differ from the net asset values and returns for shareholder transactions. |
| (d) | Includes earning credits and interest expense, if applicable, each of which is less than 0.01% unless otherwise noted. |
| (e) | Portfolio turnover is calculated by dividing the lesser of total purchases or sales of portfolio securities for the reporting period by the monthly average value of portfolio securities owned during the reporting period. Excluded from both the numerator and denominator are amounts relating to derivatives and securities whose maturities or expiration dates at the time of acquisition were one year or less. |
| (f) | Small Cap Core Portfolio acquired all of the assets and liabilities of JPMorgan Small Company Portfolio (“Predecessor Portfolio”) in a reorganization on April 24, 2009. The Predecessor Portfolio’s performance and financial history have been adopted by Small Cap Core Portfolio and have been used since the reorganization. As a result, the financial highlight information reflects that of the Predecessor Portfolio for the periods prior to its reorganization with Small Cap Core Portfolio. |
| (g) | Reflects special dividends paid out during the period by several of the Portfolio’s holdings. Had the Portfolio not received the special dividends, the net investment income (loss) per share would have been $0.01 and $(0.05) for Class 1 and Class 2 Shares, respectively, and the net investment income (loss) ratio would have been 0.03% and (0.24)% for Class 1 and Class 2 Shares, respectively. |
| (h) | Calculated based upon average shares outstanding. |
| (i) | Reflects special dividends paid out during the period by several of the Portfolio’s holdings. Had the Portfolio not received the special dividends, the net investment income (loss) per share would have been $0.04 and less than $0.01 for Class 1 and Class 2 Shares, respectively, and the net investment income (loss) ratio would have been 0.28% and 0.02% for Class 1 and Class 2 Shares, respectively. |
| (j) | Amount rounds to less than $0.01. |
| (k) | Because of the reorganization with the Predecessor Portfolio in which the performance and financial history of the Small Cap Core Portfolio was replaced with that of the Predecessor Portfolio, the performance and the financial history began on April 24, 2009. |
SEE NOTES TO FINANCIAL STATEMENTS.
| 16 | JPMORGAN INSURANCE TRUST | DECEMBER 31, 2013 | ||||
Table of Contents
| Ratios/Supplemental data | |||||||||||||||||||||||||
| Ratios to average net assets (a) | ||||||||||||||||||||||||||
| Net asset value, end of period | Total return (b)(c) | Net assets, end of period | Net expenses (d) | Net investment income (loss) | Expenses without waivers, reimbursements and earnings credits | Portfolio turnover rate (b)(e) | ||||||||||||||||||||
| $ | 24.03 | 42.38 | % | $ | 105,229,638 | 0.90 | % | 0.24 | %(g) | 0.91 | % | 56 | % | |||||||||||||
| 16.98 | 19.66 | 66,719,964 | 0.94 | 0.80 | (i) | 0.94 | 44 | |||||||||||||||||||
| 14.22 | (4.77 | ) | 58,405,012 | 0.95 | 0.23 | 0.95 | 46 | |||||||||||||||||||
| 14.95 | 27.13 | 70,355,671 | 0.99 | 0.13 | 1.04 | 45 | ||||||||||||||||||||
| 11.76 | 22.58 | 56,761,095 | 0.98 | 0.42 | 1.34 | 55 | ||||||||||||||||||||
| 23.91 | 42.02 | 2,154,402 | 1.16 | (0.03 | )(g) | 1.16 | 56 | |||||||||||||||||||
| 16.90 | 19.35 | 1,989,290 | 1.19 | 0.54 | (i) | 1.19 | 44 | |||||||||||||||||||
| 14.16 | (5.03 | ) | 1,765,773 | 1.20 | (0.02 | ) | 1.20 | 46 | ||||||||||||||||||
| 14.91 | 26.79 | 1,995,231 | 1.24 | (0.09 | ) | 1.28 | 45 | |||||||||||||||||||
| 11.76 |
| 30.37 | 901,951 | 1.17 | 0.26 | 1.45 | 55 | ||||||||||||||||||
SEE NOTES TO FINANCIAL STATEMENTS.
| DECEMBER 31, 2013 | JPMORGAN INSURANCE TRUST | 17 | ||||||
Table of Contents
AS OF DECEMBER 31, 2013
1. Organization
JPMorgan Insurance Trust (the “Trust”) is registered under the Investment Company Act of 1940, as amended (the “1940 Act”), as an open-end management investment company and is a Massachusetts business trust.
The following is a separate Portfolio of the Trust (the “Portfolio”) covered by this report:
| Classes Offered | Diversified/Non-Diversified | |||
| Small Cap Core Portfolio | Class 1 and Class 2 | Diversified |
The investment objective of the Portfolio is to seek capital growth over the long term.
Portfolio shares are offered only to separate accounts of participating insurance companies and Eligible Plans. Individuals may not purchase shares directly from the Portfolio.
All classes of shares have equal rights as to earnings, assets and voting privileges, except that each class may bear different distribution and service fees and each class has exclusive voting rights with respect to its distribution plan and administrative services plan.
2. Significant Accounting Policies
The following is a summary of significant accounting policies followed by the Portfolio in the preparation of its financial statements. The policies are in accordance with accounting principles generally accepted in the United States of America (“GAAP”). The preparation of financial statements requires management to make estimates and assumptions that affect the reported amounts and disclosures in the financial statements. Actual results could differ from those estimates.
A. Valuation of Investments — Equity securities listed on a North American, Central American, South American or Caribbean securities exchange shall generally be valued at the last sale price on the exchange on which the security is principally traded that is reported before the time when the net assets of the Portfolio are valued. Securities listed on the NASDAQ Stock Market LLC are generally valued at the NASDAQ Official Closing Price. Fixed income securities (other than certain short-term investments maturing in less than 61 days) are valued each day based on prices received from independent or affiliated pricing services approved by the Board of Trustees or third party broker-dealers. The pricing services or broker-dealers use multiple valuation techniques to determine fair value. In instances where sufficient market activity exists, the pricing services or broker-dealers may utilize a market-based approach through which quotes from market makers are used to determine fair value. In instances where sufficient market activity may not exist or is limited, the pricing services or broker-dealers also utilize proprietary valuation models which may consider market transactions in comparable securities and the various relationships between securities in determining fair value and/or market characteristics such as benchmark yield curves, option-adjusted spreads, credit spreads, estimated default rates, coupon rates, anticipated timing of principal repayments, underlying collateral, and other unique security features in order to estimate the relevant cash flows, which are then discounted to calculate the fair values. Generally, short-term investments of sufficient credit quality maturing in less than 61 days are valued at amortized cost, which approximates fair value. Investments in open-end investment companies are valued at each investment company’s net asset value per share (“NAV”) as of the report date.
Certain investments of the Portfolio may, depending upon market conditions, trade in relatively thin markets and/or in markets that experience significant volatility. As a result of these conditions, the prices used by the Portfolio to value these securities may differ from the value that would be realized if these securities were sold, and the differences could be material. Futures and options are generally valued on the basis of available market quotations. Swaps and other derivatives are valued daily, primarily using independent or affiliated pricing services approved by the Board of Trustees. If valuations are not available from such pricing services or values received are deemed not representative of fair value, values will be obtained from a third party broker-dealer or counterparty.
Securities or other assets for which market quotations are not readily available or for which market quotations are deemed to not represent the fair value of the security or asset at the time of pricing (including certain illiquid securities) are fair valued in accordance with procedures established by and under the supervision and responsibility of the Board of Trustees. The Board of Trustees has established an Audit and Valuation Committee to assist with the oversight of the valuation of the Portfolio’s securities. JPMorgan Funds Management, Inc. (the “Administrator” or “JPMFM”) has established a Valuation Committee (“VC”) that is comprised of senior representatives from JPMFM, J.P. Morgan Investment Management Inc. (the “Adviser” or “JPMIM”), and J.P. Morgan Asset Management’s Legal, Compliance and Risk Management groups and the Portfolio’s Chief Compliance Officer. The VC’s responsibilities include making determinations regarding Level 3 fair value measurements (“Fair Values”) and/or providing recommendations for approval to the Board of Trustees’ Audit and Valuation Committee, in accordance with the Portfolio’s valuation policies.
The VC or Board of Trustees, as applicable, primarily employs a market-based approach which may use related or comparable assets or liabilities, recent transactions, market multiples, book values, and other relevant information for the investment to determine the fair value of the investment. The VC or Board of Trustees may also use an income-based valuation approach in which the anticipated future cash flows of the investment are discounted to calculate fair value. Discounts may also be applied due to the nature or duration of any restrictions on the disposition of the investments. Valuations may be based upon current market prices of securities that are comparable in coupon, rating, maturity and industry.
It is possible that the estimated values may differ significantly from the values that would have been used had a ready market for the investments existed, and such differences could be material. JPMFM and JPMIM are responsible for monitoring developments that may impact Fair Values and
| 18 | JPMORGAN INSURANCE TRUST | DECEMBER 31, 2013 | ||||
Table of Contents
for discussing and assessing Fair Values on an ongoing, and at least a quarterly, basis with the VC and Board of Trustees, as applicable. The appropriateness of Fair Values is assessed based on results of unchanged price review and consideration of macro or security specific events, back testing, and broker and vendor due diligence.
Valuations reflected in this report are as of the report date. As a result, changes in valuation due to market events and/or issuer related events after the report date and prior to issuance of the report, are not reflected herein.
The various inputs that are used in determining the fair value of the Portfolio’s investments are summarized into the three broad levels listed below.
| Ÿ | Level 1 — quoted prices in active markets for identical securities |
| Ÿ | Level 2 — other significant observable inputs (including quoted prices for similar securities, interest rates, prepayment speeds, credit risk, etc.) |
| Ÿ | Level 3 — significant unobservable inputs (including the Portfolio’s own assumptions in determining the fair value of investments) |
A financial instrument’s level within the fair value hierarchy is based on the lowest level of any input, both individually and in the aggregate, that is significant to the fair value measurement. The inputs or methodology used for valuing securities are not necessarily an indication of the risk associated with investing in those securities.
The following table represents each valuation input as presented on the Schedule of Portfolio Investments (“SOI”):
| Level 1 Quoted prices | Level 2 Other significant observable inputs | Level 3 Significant unobservable inputs | Total | |||||||||||||
Total Investments in Securities (a) | $ | 107,399,570 | $ | 215,193 | $ | — | $ | 107,614,763 | ||||||||
|
|
|
|
|
|
|
| |||||||||
Appreciation in Other Financial Instruments | ||||||||||||||||
Futures Contracts | $ | 136,596 | $ | — | $ | — | $ | 136,596 | ||||||||
|
|
|
|
|
|
|
| |||||||||
| (a) | All portfolio holdings designated in Level 1 and Level 2 are disclosed individually on the SOI. Level 2 consists of a U.S. Treasury Note that is held for future collateral. Please refer to the SOI for industry specifics of portfolio holdings. |
There were no transfers among any levels during the year ended December 31, 2013.
B. Restricted and Illiquid Securities — Certain securities held by the Portfolio may be subject to legal or contractual restrictions on resale and/or are illiquid. Restricted securities generally are resold in transactions exempt from registration under the Securities Act of 1933 (the “Securities Act”). Illiquid securities are securities which cannot be disposed of promptly (within seven days) and in the usual course of business at approximately their fair value and include, but are not limited to, repurchase agreements maturing in excess of seven days, time deposits with a withdrawal penalty, non-negotiable instruments and instruments for which no market exists. Disposal of these securities may involve time-consuming negotiations and expense. Prompt sale at the current valuation may be difficult and could adversely affect the net assets of the Portfolio. As of December 31, 2013, the Portfolio had no investments in restricted securities other than securities sold to the Portfolio under Rule 144A and/or Regulation S under the Securities Act.
As of December 31, 2013 the Portfolio had no investments in illiquid securities.
C. Futures Contracts — The Portfolio uses index futures contracts to gain or reduce exposure to the stock market, maintain liquidity and minimize transaction costs. The Portfolio also buys futures contracts to immediately invest incoming cash in the market or sells futures in response to cash outflows, thereby simulating an invested position in the underlying index while maintaining a cash balance for liquidity. The use of futures contracts exposes the Portfolio to equity price risk.
Futures contracts provide for the delayed delivery of the underlying instrument at a fixed price or are settled for a cash amount based on the change in the value of the underlying instrument at a specific date in the future. Upon entering into a futures contract, the Portfolio is required to deposit with the broker, cash or securities in an amount equal to a certain percentage of the contract amount, which is referred to as the initial margin deposit. Subsequent payments, referred to as variation margin, are made or received by the Portfolio periodically and are based on changes in the market value of open futures contracts. Changes in the market value of open futures contracts are recorded as change in net unrealized appreciation (depreciation) in the Statement of Operations. Realized gains or losses, representing the difference between the value of the contract at the time it was opened and the value at the time it was closed, are reported in the Statement of Operations at the closing or expiration of the futures contract. Securities deposited as initial margin are designated in the SOI and cash deposited is recorded on the Statement of Assets and Liabilities. A receivable from and/or a payable to brokers for the daily variation margin is also recorded on the Statement of Assets and Liabilities.
The Portfolio may be subject to the risk that the change in the value of the futures contract may not correlate perfectly with the underlying instrument. Use of long futures contracts subjects the Portfolio to risk of loss in excess of the amounts shown on the Statement of Assets and Liabilities, up to the notional amount of the futures contracts. Use of short futures contracts subjects the Portfolio to unlimited risk of loss. The Portfolio may enter into futures contracts only on exchanges or boards of trade. The exchange or board of trade acts as the counterparty to each futures transaction; therefore, the Portfolio’s credit risk is limited to failure of the exchange or board of trade. Under some circumstances, futures exchanges may establish daily limits on the amount that the price of a futures contract can vary from the previous day’s settlement price, which could effectively prevent liquidation of positions.
| DECEMBER 31, 2013 | JPMORGAN INSURANCE TRUST | 19 | ||||||
Table of Contents
NOTES TO FINANCIAL STATEMENTS
AS OF DECEMBER 31, 2013 (continued)
The table below discloses the volume of the Portfolio’s futures contracts activity during the year ended December 31, 2013:
Futures Contracts: | ||||
Average Notional Balance Long | $ | 2,544,226 | ||
Ending Notional Balance Long | 3,135,780 |
The Portfolio’s futures contracts are not subject to master netting arrangements.
D. Security Transactions and Investment Income — Investment transactions are accounted for on the trade date (the date the order to buy or sell is executed). Securities gains and losses are calculated on a specifically identified cost basis. Interest income is determined on the basis of coupon interest accrued using the effective interest method which adjusts for amortization of premiums and accretion of discounts. Dividend income, net of foreign taxes withheld, if any, is recorded on the ex-dividend date or when the Portfolio first learns of the dividend.
To the extent such information is publicly available, the Portfolio records distributions received in excess of income earned from underlying investments as a reduction of cost of investments and/or realized gain. Such amounts are based on estimates if actual amounts are not available and actual amounts of income, realized gain and return of capital may differ from the estimated amounts. The Portfolio adjusts the estimated amounts of the components of distributions (and consequently its net investment income) as necessary once the issuers provide information about the actual composition of the distributions.
E. Allocation of Income and Expenses — Expenses directly attributable to a portfolio are charged directly to that portfolio, while the expenses attributable to more than one portfolio of the Trust are allocated among the respective portfolios. In calculating the NAV of each class, investment income, realized and unrealized gains and losses and expenses, other than class specific expenses, are allocated daily to each class of shares based upon the proportion of net assets of each class at the beginning of each day.
F. Federal Income Taxes — The Portfolio is treated as a separate taxable entity for Federal income tax purposes. The Portfolio’s policy is to comply with the provisions of the Internal Revenue Code of 1986, as amended (the “Code”), applicable to regulated investment companies and to distribute to shareholders all of its distributable net investment income and net realized capital gains on investments. Accordingly, no provision for Federal income tax is necessary. The Portfolio is also a segregated portfolio of assets for insurance purposes and intends to comply with the diversification requirements of Subchapter L of the Code. Management has reviewed the Portfolio’s tax positions for all open tax years and has determined that as of December 31, 2013, no liability for income tax is required in the Portfolio’s financial statements for net unrecognized tax benefits. However, management’s conclusions may be subject to future review based on changes in, or the interpretation of, the accounting standards or tax laws and regulations. The Portfolio’s Federal tax returns for the prior three fiscal years remain subject to examination by the Internal Revenue Service.
G. Distributions to Shareholders — Distributions from net investment income are generally declared and paid at least annually and are declared separately for each class. No class has preferential dividend rights; differences in per share rates are due to differences in separate class expenses. Net realized capital gains, if any, are distributed at least annually. The amount of distributions from net investment income and net realized capital gains is determined in accordance with Federal income tax regulations, which may differ from GAAP. To the extent these “book/tax” differences are permanent in nature (i.e., that they result from other than timing of recognition — “temporary differences”), such amounts are reclassified within the capital accounts based on their Federal tax-basis treatment.
The following amounts were reclassified within the capital accounts:
| Paid-in-Capital | Accumulated undistributed net investment income | Accumulated net realized gains (losses) | ||||||||||
| $ | 2,109 | $ | (4,699 | ) | $ | 2,590 | ||||||
The reclassifications for the Portfolio relate primarily to investments in passive foreign investment companies (“PFICs”).
3. Fees and Other Transactions with Affiliates
A. Investment Advisory Fee — Pursuant to the Investment Advisory Agreement, the Adviser, an indirect, wholly-owned subsidiary of JPMorgan Chase & Co. (“JPMorgan”), supervises the investments of the Portfolio and for such services is paid a fee. The fee is accrued daily and paid monthly based on the Portfolio’s average daily net assets at an annual rate of 0.65%.
B. Administration Fee — Pursuant to an Administration Agreement, the Administrator, an indirect, wholly-owned subsidiary of JPMorgan, provides certain administration services to the Portfolio. In consideration of these services, the Administrator receives a fee accrued daily and paid monthly at an annual rate of 0.15% of the first $25 billion of the average daily net assets of all funds in the J.P. Morgan Funds Complex covered by the Administration Agreement (excluding certain funds of funds and money market funds) and 0.075% of the average daily net assets in excess of $25 billion of all such funds. For the year ended December 31, 2013, the effective rate was 0.08% of the Portfolio’s average daily net assets, notwithstanding any fee waivers and/or expense reimbursements.
JPMorgan Chase Bank, N.A. (“JPMCB”), a wholly-owned subsidiary of JPMorgan, serves as the Portfolio’s sub-administrator (the “Sub-administrator”). For its services as Sub-administrator, JPMCB receives a portion of the fees payable to the Administrator.
C. Distribution Fees — Pursuant to a Distribution Agreement, JPMorgan Distribution Services, Inc. (the “Distributor”), a wholly-owned subsidiary of JPMorgan, serves as the Trust’s exclusive underwriter and promotes and arranges for the sale of the Portfolio’s shares.
| 20 | JPMORGAN INSURANCE TRUST | DECEMBER 31, 2013 | ||||
Table of Contents
The Board of Trustees has adopted a Distribution Plan (the “Distribution Plan”) for Class 2 Shares of the Portfolio in accordance with Rule 12b-1 under the 1940 Act. The Distribution Plan provides that the Portfolio shall pay distribution fees, including payments to the Distributor, at an annual rate of 0.25% of the average daily net assets of Class 2 Shares.
D. Custodian and Accounting Fees — JPMCB provides portfolio custody and accounting services to the Portfolio. The amounts paid directly to JPMCB by the Portfolio for custody and accounting services are included in Custodian and accounting fees in the Statement of Operations. Payments to the custodian may be reduced by credits earned by the Portfolio, based on uninvested cash balances held by the custodian. Such earnings credits, if any, are presented separately in the Statement of Operations.
Interest expense, if any, paid to the custodian related to cash overdrafts is included in Interest expense to affiliates in the Statement of Operations.
E. Waivers and Reimbursements — The Adviser, Administrator (for all share classes) and Distributor (for Class 2 Shares) have contractually agreed to waive fees and/or reimburse the Portfolio to the extent that total annual operating expenses (excluding acquired fund fees and expenses, dividend expenses related to short sales, interest, taxes, expenses related to litigation and potential litigation, extraordinary expenses and expenses related to the Board of Trustees’ deferred compensation plan) exceed the percentages of the Portfolio’s respective average daily net assets as shown in the table below:
| Class 1 | Class 2 | |||||||
| 1.03 | % | 1.28 | % | |||||
The expense limitation agreements were in effect for the year ended December 31, 2013. The contractual expense limitation percentages in the table above are in place until at least April 30, 2014.
For the year ended December 31, 2013, the Portfolio’s service providers waived fees for the Portfolio as follows. None of these parties expect the Portfolio to repay any such waived fees in future years.
| Voluntary Waivers | ||||||||
| Investment Advisory | Total | |||||||
| $ | 73 | $ | 73 | |||||
Additionally, the Portfolio may invest in one or more money market funds advised by the Adviser or its affiliates. The Adviser, Administrator and the Distributor waive fees in an amount sufficient to offset the respective fees each charges to the affiliated money market fund on the Portfolio’s investment in such affiliated money market fund. A portion of the waiver is voluntary.
The amount of waivers resulting from investments in these money market funds for the year ended December 31, 2013 was $4,661.
F. Other — Certain officers of the Trust are affiliated with the Adviser, the Administrator and the Distributor. Such officers, with the exception of the Chief Compliance Officer, receive no compensation from the Portfolio for serving in their respective roles.
The Board of Trustees appointed a Chief Compliance Officer to the Portfolio in accordance with Federal securities regulations. The Portfolio, along with other affiliated portfolios, makes reimbursement payments, on a pro-rata basis, to the Administrator for a portion of the fees associated with the Office of the Chief Compliance Officer. Such fees are included in Trustees’ and Chief Compliance Officer’s fees in the Statement of Operations.
The Trust adopted a Trustee Deferred Compensation Plan (the “Plan”) which allows the Independent Trustees to defer the receipt of all or a portion of compensation related to performance of their duties as Trustees. The deferred fees are invested in various J.P. Morgan Funds until distribution in accordance with the Plan.
During the year ended December 31, 2013, the Portfolio may have purchased securities from an underwriting syndicate in which the principal underwriter or members of the syndicate are affiliated with the Adviser.
The Portfolio may use related party broker-dealers. For the year ended December 31, 2013, the Portfolio did not incur any brokerage commissions with broker-dealers affiliated with the Adviser.
The Securities and Exchange Commission has granted an exemptive order permitting the Portfolio to engage in principal transactions with J.P. Morgan Securities, Inc., an affiliated broker, involving taxable money market instruments, subject to certain conditions.
4. Investment Transactions
During the year ended December 31, 2013, purchases and sales of investments (excluding short-term investments) were as follows:
Purchases (excluding | Sales (excluding | Purchases of U.S. Government | Sales of U.S. Government | |||||||||||||
| $ | 56,170,293 | $ | 47,250,233 | $ | 215,252 | $ | 110,000 | |||||||||
| DECEMBER 31, 2013 | JPMORGAN INSURANCE TRUST | 21 | ||||||
Table of Contents
NOTES TO FINANCIAL STATEMENTS
AS OF DECEMBER 31, 2013 (continued)
5. Federal Income Tax Matters
For Federal income tax purposes, the cost and unrealized appreciation (depreciation) in value of investment securities held at December 31, 2013 were as follows:
| Aggregate Cost | Gross Unrealized Appreciation | Gross Unrealized Depreciation | Net Unrealized Appreciation (Depreciation) | |||||||||||||
| $ | 73,322,525 | $ | 35,664,308 | $ | 1,372,070 | $ | 34,292,238 | |||||||||
The difference between book and tax basis appreciation (depreciation) on investments is primarily attributed to wash sale loss deferrals.
The tax character of distributions paid during the year ended December 31, 2013 was as follows:
| Total Distributions Paid From: | ||||||||||||
Ordinary Income | Net Long-Term Capital Gains | Total Distributions Paid | ||||||||||
| $ | 473,428 | $ | — | $ | 473,428 | |||||||
The tax character of distributions paid during the year ended December 31, 2012 was as follows:
| Total Distributions Paid From: | ||||||||||||
Ordinary Income | Net Long-Term Capital Gains | Total Distributions Paid | ||||||||||
| $ | 127,898 | $ | — | $ | 127,898 | |||||||
As of December 31, 2013, the components of net assets (excluding paid-in-capital) on a tax basis were as follows:
Current Distributable Ordinary Income | Current Distributable Long-Term Capital Gain or (Tax Basis Capital Loss Carryover) | Unrealized Appreciation (Depreciation) | ||||||||||
| $ | 605,826 | $ | 7,708,208 | $ | 34,292,238 | |||||||
The cumulative timing differences primarily consist of wash sale loss deferrals, mark to market of futures contracts and deferred REIT distribution.
Under the Regulated Investment Company Modernization Act of 2010 (the “Act”), net capital losses recognized by the Portfolio after December 31, 2010 are carried forward indefinitely, and retain their character as short-term and/or long-term losses. Prior to the Act, net capital losses incurred by the Portfolio were carried forward for eight years and treated as short-term losses. The Act requires that post-enactment net capital losses be used before pre-enactment net capital losses.
As of December 31, 2013, the Portfolio did not have any post-enactment net capital loss carryforwards.
As of December 31, 2013, the Portfolio had pre-enactment net capital loss carryforwards, expiring during the year indicated, which are available to offset future realized gains:
| 2017 | Total | |||||||
| $ | 460,140 | * | $ | 460,140 | * | |||
| * | This entire amount is comprised of capital loss carryforwards from business combinations, which may be limited in future years under the Internal Revenue Code Sections 381-384. |
During the year ended December 31, 2013, the Portfolio utilized capital loss carryforwards of $2,577,894.
6. Borrowings
The Trust and JPMCB have entered into a financing arrangement. Under this arrangement, JPMCB provides an unsecured, uncommitted credit facility in the aggregate amount of $100 million to certain of the J.P. Morgan Funds, including the Portfolio. Advances under the arrangement are taken primarily for temporary or emergency purposes, including the meeting of redemption requests that otherwise might require the untimely disposition of securities, and are subject to the Portfolio’s borrowing restrictions. Interest on borrowings is payable at a rate determined by JPMCB at the time of borrowing. This agreement has been extended until November 10, 2014.
The Portfolio had no borrowings outstanding from the unsecured, uncommitted credit facility at December 31, 2013, or at any time during the year then ended.
| 22 | JPMORGAN INSURANCE TRUST | DECEMBER 31, 2013 | ||||
Table of Contents
Interest expense paid, if any, as a result of borrowings from the unsecured, uncommitted credit facility is included in Interest expense to affiliates in the Statement of Operations.
7. Risks, Concentrations and Indemnifications
In the normal course of business, the Portfolio enters into contracts that contain a variety of representations which provide general indemnifications. The Portfolio’s maximum exposure under these arrangements is unknown. The amount of exposure would depend on future claims that may be made against the Portfolio that have not yet occurred. However, based on experience, the Portfolio expects the risk of loss to be remote.
The Portfolio has a shareholder holding a significant percentage of shares outstanding. Investment activities of this shareholder could have a material impact on the Portfolio.
| DECEMBER 31, 2013 | JPMORGAN INSURANCE TRUST | 23 | ||||||
Table of Contents
REPORT OF INDEPENDENT REGISTERED PUBLIC ACCOUNTING FIRM
To the Board of Trustees of JPMorgan Insurance Trust and the Shareholders of JPMorgan Insurance Trust Small Cap Core Portfolio:
In our opinion, the accompanying statement of assets and liabilities, including the schedule of portfolio investments, and the related statements of operations and of changes in net assets and the financial highlights present fairly, in all material respects, the financial position of JPMorgan Insurance Trust Small Cap Core Portfolio (a separate Portfolio of JPMorgan Insurance Trust) (hereafter referred to as the “Portfolio”) at December 31, 2013, the results of its operations for the year then ended, the changes in its net assets for each of the two years in the period then ended and the financial highlights for each of the periods presented, in conformity with accounting principles generally accepted in the United States of America. These financial statements and financial highlights (hereafter referred to as “financial statements”) are the responsibility of the Portfolio’s management. Our responsibility is to express an opinion on these financial statements based on our audits. We conducted our audits of these financial statements in accordance with the standards of the Public Company Accounting Oversight Board (United States). Those standards require that we plan and perform the audit to obtain reasonable assurance about whether the financial statements are free of material misstatement. An audit includes examining, on a test basis, evidence supporting the amounts and disclosures in the financial statements, assessing the accounting principles used and significant estimates made by management, and evaluating the overall financial statement presentation. We believe that our audits, which included confirmation of securities at December 31, 2013 by correspondence with the custodian and brokers, provide a reasonable basis for our opinion.
PricewaterhouseCoopers LLP
New York, New York
February 21, 2014
| 24 | JPMORGAN INSURANCE TRUST | DECEMBER 31, 2013 | ||||
Table of Contents
(Unaudited)
The Portfolio’s Statement of Additional Information includes additional information about the Portfolio’s Trustees and is available, without charge, upon request by calling 1-800-480-4111 or on the J.P. Morgan Funds’ website at www.jpmorganfunds.com.
Name (Year of Birth); Positions With the Portfolio (1) | Principal Occupations During Past 5 Years | Number of Portfolios in Fund Complex Overseen by Trustee (2) | Other Directorships Held Outside Fund Complex During Past 5 Years | |||
Independent Trustees | ||||||
| John F. Finn (1947); Trustee of Trust since 2005; Trustee of heritage One Group Mutual Funds since 1998. | Chairman (1985-present), President and Chief Executive Officer, Gardner, Inc. (supply chain management company serving industrial and consumer markets) (1974-present). | 170 | Director, Cardinal Health, Inc. (CAH) (1994-present); Director, Greif, Inc. (GEF) (industrial package products and services) (2007-present); Trustee, Columbus Association for the Performing Arts. | |||
| Dr. Matthew Goldstein (1941); Chairman since 2013; Trustee of Trust since 2005; Trustee of heritage J.P. Morgan Funds since 2003. | Professor, City University of New York (effective 7/1/13); Chancellor, City University of New York (1999-2013); President, Adelphi University (New York) (1998-1999). | 170 | Trustee, Museum of Jewish Heritage (2011-present). | |||
| Robert J. Higgins (1945); Trustee of Trust since 2005; Trustee of heritage J.P. Morgan Funds since 2002. | Retired; Director of Administration of the State of Rhode Island (2003-2004); President — Consumer Banking and Investment Services, Fleet Boston Financial (1971-2001). | 170 | None | |||
| Peter C. Marshall (1942); Trustee of Trust since 2005; Trustee of heritage One Group Mutual Funds since 1985. | Self-employed business consultant (2002-present). | 170 | None | |||
| Mary E. Martinez (1960); Trustee of Trust since 2013. | Associate, Special Properties, a Christie’s International Real Estate Affiliate (2010-Present); Managing Director, Bank of America (Asset Management) (2007-2008); Chief Operating Officer, U.S. Trust Asset Management; U.S. Trust Company (asset management) (2003-2007); President, Excelsior Funds (registered investment companies) (2004-2005). | 170 | None | |||
| Marilyn McCoy* (1948); Trustee of Trust since 2005; Trustee of heritage One Group Mutual Funds since 1999. | Vice President of Administration and Planning, Northwestern University (1985-present). | 170 | Trustee, Carleton College (2003-present). | |||
| Mitchell M. Merin (1953); Trustee of Trust since 2013. | Retired (2005-Present); President and Chief Operating Officer, Morgan Stanley Investment Management, Member Morgan Stanley & Co. Management Committee (registered investment adviser) (1998-2005). | 170 | Director, Sun Life Financial (SLF) (2007 to Present) (financial services and insurance); Trustee, Trinity College, Hartford, CT (2002-2010). | |||
| William G. Morton, Jr. (1937); Trustee of Trust since 2005; Trustee of heritage J.P. Morgan Funds since 2003. | Retired; Chairman Emeritus (2001-2002), and Chairman and Chief Executive Officer, Boston Stock Exchange (1985-2001). | 170 | Director, Radio Shack Corp. (1987-2008); Director, National Organization of Investment Professionals; Trustee of the Stratton Mountain School (2001-present). | |||
| Dr. Robert A. Oden, Jr. (1946); Trustee of Trust since 2005; Trustee of heritage One Group Mutual Funds since 1997. | Retired; President, Carleton College (2002-2010); President, Kenyon College (1995-2002). | 170 | Trustee, American University in Cairo (1999-present); Chairman, Dartmouth-Hitchcock Medical Center (2011-present); Trustee, American Schools of Oriental Research (2011-present); Trustee, American Museum of Fly Fishing. | |||
| DECEMBER 31, 2013 | JPMORGAN INSURANCE TRUST | 25 | ||||||
Table of Contents
(Unaudited) (continued)
Name (Year of Birth); Positions With the Portfolio (1) | Principal Occupations During Past 5 Years | Number of Complex Overseen by Trustee (2) | Other Directorships Held Outside Fund Complex During Past 5 Years | |||
Independent Trustees (continued) | ||||||
| Marian U. Pardo** (1946); Trustee of Trust since 2013. | Managing Director and Founder, Virtual Capital Management LLC (Investment Consulting) (2007-present); Managing Director, Credit Suisse Asset Management (portfolio manager) (2003-2006). | 170 | Member, Board of Governors, Columbus Citizens Foundation (not-for-profit supporting philanthropic and cultural programs) (2006-present). | |||
| Frederick W. Ruebeck (1939); Trustee of Trust since 2005; Trustee of heritage One Group Mutual Funds since 1994. | Consultant (2000-present); Adviser, JP Greene & Associates, LLC (broker-dealer) (2000-2009); Chief Investment Officer, Wabash College (2004-present); Director of Investments, Eli Lilly and Company (pharmaceuticals) (1988-1999). | 170 | Trustee, Wabash College (1988-present); Chairman, Indianapolis Symphony Orchestra Foundation (1994-present). | |||
| James J. Schonbachler (1943); Trustee of Trust since 2005; Trustee of heritage J.P. Morgan Funds since 2001. | Retired; Managing Director of Bankers Trust Company (financial services) (1968-1998). | 170 | None | |||
Interested Trustee Not Affiliated With the Adviser | ||||||
| Frankie D. Hughes*** (1952), Trustee of Trust since 2008. | President and Chief Investment Officer, Hughes Capital Management, Inc. (fixed income asset management) (1993-present). | 170 | Trustee, The Victory Portfolios (2000-2008) (investment companies). | |||
| (1) | The Trustees serve for an indefinite term, subject to the Trust’s current retirement policy, which is age 75 for all Trustees, except that the Board has determined Mr. Morton should continue to serve until December 31, 2014. In order to fill the vacancies created by the retirement of Fergus Reid, III, William J. Armstrong, and Leonard J. Spalding Jr., effective December 31, 2012, the Board appointed Ms. Martinez and Mr. Merin to serve as Trustees effective January 1, 2013 and Ms. Pardo to serve as Trustee effective February 1, 2013. |
| (2) | A Fund Complex means two or more registered investment companies that hold themselves out to investors as related companies for purposes of investment and investor services or have a common investment adviser or have an investment adviser that is an affiliated person of the investment adviser of any of the other registered investment companies. The J.P. Morgan Funds Complex for which the Board of Trustees serves currently includes eleven registered investment companies (170 funds), including JPMorgan Mutual Fund Group which liquidated effective November 29, 2012 and is in the process of winding up its affairs. |
| * | Ms. McCoy has served as Vice President of Administration and Planning for Northwestern University since 1985. William M. Daley was the Head of Corporate Responsibility for JPMorgan Chase & Co. prior to January 2011 and served as a member of the Board of Trustees of Northwestern University from 2005 through 2010. JPMIM, the Portfolio’s investment adviser, is a wholly-owned subsidiary of JPMorgan Chase & Co. Two members of the Board of Trustees of Northwestern University are executive officers of registered investment advisers (not affiliated with JPMorgan) that are under common control with sub-advisers to certain J.P. Morgan Funds. |
| ** | In connection with prior employment with JPMorgan Chase, Ms. Pardo is the recipient of non-qualified pension plan payments from JPMorgan Chase in the amount of approximately $2,055 per month, which she irrevocably waived effective January 1, 2013, and deferred compensation payments from JPMorgan Chase in the amount of approximately $7,294 per year, which ended in January 2013. In addition, Ms. Pardo receives payments from a fully funded qualified plan, which is not an obligation of JPMorgan Chase. |
| *** | Ms. Hughes is treated as an “interested person” based on the portfolio holdings of clients of Hughes Capital Management, Inc. |
The contact address for each of the Trustees is 270 Park Avenue, New York, NY 10017.
| 26 | JPMORGAN INSURANCE TRUST | DECEMBER 31, 2013 | ||||
Table of Contents
(Unaudited)
Name (Year of Birth), Positions Held with the Trust (Since) | Principal Occupations During Past 5 Years | |
Robert L. Young (1963), | Chief Operating Officer and Director, J.P. Morgan Investment Management Inc. since 2010; Senior Vice President, J.P. Morgan Funds (2005-2010), Chief Operating Officer, J.P. Morgan Funds (2005-2010); Director and various officer positions for JPMorgan Funds Management, Inc. (formerly One Group Administrative Services) and JPMorgan Distribution Services, Inc. (formerly One Group Dealer Services, Inc.) from 1999 to present. Mr. Young has been with JPMorgan Chase & Co. (formerly Bank One Corporation) since 1997. | |
| Joy C. Dowd (1972), Treasurer and Principal Financial Officer (2010) | Assistant Treasurer of the Trusts from 2009 to 2010; Executive Director, JPMorgan Funds Management, Inc. from February 2011; Vice President, JPMorgan Funds Management, Inc. from December 2008 to February 2011; prior to joining JPMorgan Chase, Ms. Dowd worked in MetLife’s investments audit group from 2005 through 2008. | |
| Frank J. Nasta (1964), Secretary (2008) | Managing Director and Associate General Counsel, JPMorgan Chase since 2008; Previously, Director, Managing Director, General Counsel and Corporate Secretary, J. & W. Seligman & Co. Incorporated; Secretary of each of the investment companies of the Seligman Group of Funds and Seligman Data Corp.; Director and Corporate Secretary, Seligman Advisors, Inc. and Seligman Services, Inc. | |
| Stephen M. Ungerman (1953), Chief Compliance Officer (2005) | Managing Director, JPMorgan Chase & Co.; Mr. Ungerman has been with JPMorgan Chase & Co. since 2000. | |
Kathryn A. Jackson (1962), | Vice President and AML Compliance Manager for JPMorgan Asset Management Compliance since 2011; Senior On-Boarding Specialist for JPMorgan Distribution Services, Inc. in Global Liquidity from 2008 to 2011; prior to joining JPMorgan, Ms. Jackson was a Financial Services Analyst responsible for on-boarding, compliance and training with Nationwide Securities LLC and 1717 Capital Management Company, both registered broker-dealers, from 2005 until 2008. | |
Elizabeth A. Davin (1964), Assistant Secretary (2005)** | Executive Director and Assistant General Counsel, JPMorgan Chase since February 2012; formerly Vice President and Assistant General Counsel, JPMorgan Chase from 2005 until February 2012; Senior Counsel, JPMorgan Chase (formerly Bank One Corporation) from 2004 to 2005. | |
| Jessica K. Ditullio (1962), Assistant Secretary (2005)** | Executive Director and Assistant General Counsel, JPMorgan Chase since February 2011; Ms. Ditullio has served as an attorney with various titles for JPMorgan Chase (formerly Bank One Corporation) since 1990. | |
| John T. Fitzgerald (1975), Assistant Secretary (2008) | Executive Director and Assistant General Counsel, JPMorgan Chase since February 2011; formerly, Vice President and Assistant General Counsel, JPMorgan Chase from 2005 until February 2011. | |
| Carmine Lekstutis (1980), Assistant Secretary (2011) | Vice President and Assistant General Counsel, JPMorgan Chase since 2011; Associate, Skadden, Arps, Slate, Meagher & Flom LLP (law firm) from 2006 to 2011. | |
| Gregory S. Samuels (1980), Assistant Secretary (2010) | Vice President and Assistant General Counsel, JPMorgan Chase since 2010; Associate, Ropes & Gray (law firm) from 2008 to 2010; Associate, Clifford Chance LLP (law firm) from 2005 to 2008. | |
| Pamela L. Woodley (1971), Assistant Secretary (2012) | Vice President and Assistant General Counsel, JPMorgan Chase since November 2004. | |
Michael M. D’Ambrosio (1969), Assistant Treasurer (2012) | Executive Director, JPMorgan Funds Management, Inc. from July 2012; prior to joining JPMorgan Chase, Mr. D’Ambrosio was a Tax Director at PricewaterhouseCoopers LLP since 2006. | |
| Joseph Parascondola (1963), Assistant Treasurer (2011) | Vice President, JPMorgan Funds Management, Inc. since August 2006. | |
| Matthew J. Plastina (1970), Assistant Treasurer (2011) | Vice President, JPMorgan Funds Management, Inc. since August 2010; prior to August 2010, Vice President and Controller, Legg Mason Global Asset Management. | |
Julie A. Roach (1971), Assistant Treasurer (2012)** | Vice President, JPMorgan Funds Management, Inc. from August 2012; prior to joining JPMorgan Chase, Ms. Roach was a Senior Manager with Deloitte since 2001. | |
Gillian I. Sands (1969), Assistant Treasurer (2012) | Vice President, JPMorgan Funds Management, Inc. from September 2012; Assistant Treasurer, Wells Fargo Funds Management (2007-2009). | |
The contact address for each of the officers, unless otherwise noted, is 270 Park Avenue, New York, NY 10017.
| * | The contact address for the officer is 500 Stanton Christiana Road, Ops 1, Floor 02, Newark, DE 19173-2107. |
| ** | The contact address for the officer is 460 Polaris Parkway, Westerville, OH 43082. |
| DECEMBER 31, 2013 | JPMORGAN INSURANCE TRUST | 27 | ||||||
Table of Contents
SCHEDULE OF SHAREHOLDER EXPENSES
(Unaudited)
Hypothetical $1,000 Investment
As a shareholder of the Portfolio, you incur ongoing costs, including investment advisory fees, administration fees, distribution fees (for Class 2 shares) and other Portfolio expenses. Because the Portfolio is a funding vehicle for Policies and Eligible Plans, you may also incur sales charges and other fees relating to the Policies or Eligible Plans. The examples below are intended to help you understand your ongoing costs (in dollars) of investing in the Portfolio, but not the costs of the Policies or Eligible Plans, and to compare these ongoing costs with the ongoing costs of investing in other mutual funds. The examples assume that you had a $1,000 investment in each Class at the beginning of the reporting period, July 1, 2013, and continued to hold your shares at the end of the reporting period, December 31, 2013.
Actual Expenses
For each Class of the Portfolio in the table below, the first line provides information about actual account values and actual expenses. You may use the information in this line, together with the amount you invested, to estimate the expenses that you paid over the period. Simply divide your account value by $1,000 (for example, an $8,600 account value divided by $1,000 = 8.6), then multiply the result by the number in the first line of each Class under the heading entitled “Expenses Paid During the Period” to estimate the expenses you paid on your account during this period.
Hypothetical Example for Comparison Purposes
The second line of each Class in the table below provides information about hypothetical account values and hypothetical expenses based on the Class’ actual expense ratio and an assumed rate of return of 5% per year before expenses, which is not the Class’ actual return. The hypothetical account values and expenses may not be used to estimate the actual ending account balance or expenses you paid for the period. You may use this information to compare the ongoing costs of investing in the Class of the Portfolio and other funds. To do so, compare this 5% hypothetical example with the 5% hypothetical examples that appear in the shareholder reports of the other funds. Please note that the expenses shown in the table are meant to highlight your ongoing costs only and do not reflect any transaction costs, such as sales charges (loads) or redemption fees or the costs associated with the Policies and Eligible Plans through which the Portfolio is held. Therefore, the second line for each Class in the table is useful in comparing ongoing costs only, and will not help you determine the relative total costs of owning different funds. In addition, if these transaction costs were included, your costs would have been higher. The examples also assume all dividends and distributions have been reinvested.
Beginning | Ending | Expenses | Annualized | |||||||||||||
Small Cap Core Portfolio | ||||||||||||||||
Class 1 | ||||||||||||||||
Actual | $ | 1,000.00 | $ | 1,214.90 | $ | 5.02 | 0.90 | % | ||||||||
Hypothetical | 1,000.00 | 1,020.67 | 4.58 | 0.90 | ||||||||||||
Class 2 | ||||||||||||||||
Actual | 1,000.00 | 1,213.70 | 6.47 | 1.16 | ||||||||||||
Hypothetical | 1,000.00 | 1,019.36 | 5.90 | 1.16 | ||||||||||||
| * | Expenses are equal to each Class’ respective annualized expense ratio, multiplied by the average account value over the period, multiplied by 184/365 (to reflect the one-half year period). |
| 28 | JPMORGAN INSURANCE TRUST | DECEMBER 31, 2013 | ||||
Table of Contents
BOARD APPROVAL OF INVESTMENT ADVISORY AGREEMENT
(Unaudited)
The Board of Trustees meets regularly throughout the year and considers factors that are relevant to its annual consideration of investment advisory agreements at each meeting. The Board of Trustees has established various standing committees, composed of Trustees with diverse backgrounds, to which the Board of Trustees has assigned specific subject matter responsibilities to further enhance the effectiveness of the Board’s oversight and decision making. The Board of Trustees and its investment committees (money market and alternative products, equity, and fixed income) also meet for the specific purpose of considering advisory contract annual renewals. The Board of Trustees held meetings in person in June and August 2013, at which the Trustees considered the continuation of the investment advisory agreement for the Portfolio whose annual report is contained herein (the “Advisory Agreement”). At the June meeting, the Board’s investment committees met to review and consider performance, expense and related information for the J.P. Morgan Funds. Each investment committee reported to the full Board, which then considered the investment committee’s preliminary findings. At the August meeting, the Trustees continued their review and consideration. The Trustees, including a majority of the Trustees who are not “interested persons” (as defined in the 1940 Act) of any party to the Advisory Agreement or any of their affiliates, approved the continuation of the Advisory Agreement on August 20, 2013.
The Trustees, as part of their review of the investment advisory arrangements for the J.P. Morgan Funds, considered and reviewed performance and other information received from the Adviser on a regular basis over the course of the year, as well as information specifically prepared for their annual review. This information included the Portfolio’s performance compared to the performance of the Portfolio’s peers and benchmarks and analyses by the Adviser of the Portfolio’s performance. The Adviser also periodically provides comparative information regarding the Portfolio’s expense ratios and those of the peer groups. In addition, in preparation for the June and August meetings, the Trustees requested, received and evaluated extensive materials from the Adviser, including, with respect to the Portfolio, performance and expense information compiled by Lipper Inc. (“Lipper”), an independent provider of investment company data. Prior to voting, the Trustees reviewed the proposed approval of the Advisory Agreement with representatives of the Adviser and with counsels to the Portfolio and independent Trustees and received a memorandum from independent counsel to the Trustees discussing the legal standards for their consideration of the proposed approval. The Trustees also discussed the proposed approvals in executive sessions with counsels to the Portfolio and independent Trustees at which no representatives of the Adviser were present. Set forth below is a summary of the material factors evaluated by the Trustees in determining whether to approve the Advisory Agreement.
In their deliberations, there was a comprehensive consideration of the information received by the Trustees. Each Trustee attributed different weights to the various factors and no factor alone was considered determinative. From year to year, the Trustees consider and place emphasis on relevant information in light of changing circumstances in market and economic conditions. The Trustees determined that the compensation to be received by the Adviser from the Portfolio under the Advisory Agreement was fair and reasonable and that the continuance of the investment advisory contract was in the best interests of the Portfolio and its shareholders.
The factors summarized below were considered and discussed by the Trustees in reaching their conclusions:
Nature, Extent and Quality of Services Provided by the Adviser
The Trustees received and considered information regarding the nature, extent and quality of the services provided to the Portfolio under the Advisory Agreement. The Trustees took into account information furnished throughout the year at Trustee meetings, as well as the materials furnished specifically in connection with this annual review process. The Trustees considered the background and experience of the Adviser’s senior management and the expertise of, and the amount of attention given to the Portfolio by, investment personnel of the Adviser. In addition, the Trustees reviewed the qualifications, backgrounds and responsibilities of the portfolio management team primarily responsible for the day-to-day management of the Portfolio and the infrastructure supporting the team. The Trustees also considered information provided by the Adviser and JPMorgan Distribution Services, Inc. (“JPMDS”) about the structure and distribution strategy of the Portfolio. The Trustees also reviewed information relating to the Adviser’s risk governance model and reports showing the Adviser’s compliance structure and ongoing compliance processes. The quality of the administrative services provided by JPMorgan Funds Management, Inc. (“JPMFM”), an affiliate of the Adviser, was also considered.
The Board of Trustees also considered its knowledge of the nature and quality of the services provided by the Adviser to the Portfolio gained from their experience as Trustees of the J.P. Morgan Funds. In addition, they considered the overall reputation and capabilities of the Adviser and its affiliates, the commitment of the Adviser to provide high quality service to the Portfolio, their overall confidence in the Adviser’s integrity and the Adviser’s responsiveness to questions or concerns raised by them, including the Adviser’s willingness to consider and implement organizational and operational changes designed to improve investment results and the services provided to the Portfolio.
Based on these considerations and other factors, the Trustees concluded that they were satisfied with the nature, extent and quality of the investment advisory services provided to the Portfolio by the Adviser.
| DECEMBER 31, 2013 | JPMORGAN INSURANCE TRUST | 29 | ||||||
Table of Contents
BOARD APPROVAL OF INVESTMENT ADVISORY AGREEMENT
(Unaudited) (continued)
Costs of Services Provided and Profitability to the Adviser and its Affiliates
The Trustees received and considered information regarding the profitability to the Adviser and its affiliates in providing services to the Portfolio. The Trustees reviewed and discussed this data. The Trustees recognized that this data is not audited and represents the Adviser’s determination of its and its affiliates’ revenues from the contractual services provided to the Portfolio, less expenses of providing such services. Expenses include direct and indirect costs and are calculated using an allocation methodology developed by the Adviser. The Trustees also recognized that it is difficult to make comparisons of profitability from fund investment advisory contracts because comparative information is not generally publicly available and is affected by numerous factors, including the structure of the particular adviser, the types of funds it manages, its business mix, numerous assumptions regarding allocations and the fact that publicly-traded fund managers’ operating profits and net income are net of distribution and marketing expenses. Based on their review, the Trustees concluded that the profitability to the Adviser under the Advisory Agreement was not unreasonable in light of the services and benefits provided to the Portfolio.
Fall-Out Benefits
The Trustees reviewed information regarding potential “fallout” or ancillary benefits received by the Adviser and its affiliates as a result of their relationship with the Portfolio. The Board also reviewed the adviser’s allocation of fund brokerage for the J.P. Morgan Funds complex, including allocations to brokers who provide research to the adviser.
The Trustees also considered that JPMFM earns fees from the Portfolio for providing administrative services. These fees were shown separately in the profitability analysis presented to the Trustees. The Trustees also considered the payments of Rule 12b-1 fees to JPMDS, an affiliate of the Adviser, which also acts as the Portfolio’s distributor and that these fees are in turn generally paid to financial intermediaries that sell the Portfolio, including financial intermediaries that are affiliates of the Adviser. The Trustees also considered the fees paid to JPMorgan Chase Bank, N.A. (“JPMCB”) for custody and fund accounting and other related services.
Economies of Scale
The Trustees noted that the proposed investment advisory fee schedule for the Portfolio does not contain breakpoints. The Trustees considered whether it would be appropriate to add advisory fee breakpoints and the Trustees concluded that the current fee structure was reasonable in light of the fee waivers and expense limitations that the Adviser has in place that serve to limit the overall net expense ratio at competitive levels. The Trustees also recognized that the fee schedule for the administrative services provided by JPMFM does include a fee break-
point, which is tied to the overall level of non-money market fund assets excluding certain funds-of-funds, as applicable, advised by the Adviser, and that the Portfolio benefits from that breakpoint. The Trustees concluded that shareholders benefited from the lower expense ratios which resulted from these factors.
Independent Written Evaluation of the Portfolio’s Chief Compliance Officer
The Trustees noted that, upon their direction, the Chief Compliance Officer for the Portfolio had prepared an independent written evaluation in order to assist the Trustees in determining the reasonableness of the proposed management fees. The Trustees considered the written evaluation in determining whether to continue the Advisory Agreement.
Fees Relative to Adviser’s Other Clients
The Trustees received and considered information about the nature and extent of investment advisory services and fee rates offered to other clients of the Adviser for investment management styles substantially similar to that of the Portfolio. The Trustees also considered the complexity of investment management for the Portfolio relative to the Adviser’s other clients and the differences in the nature and extent of the services provided to the different clients. The Trustees concluded that the fee rates charged to the Portfolio in comparison to those charged to the Adviser’s other clients were reasonable.
Investment Performance
The Trustees received and considered absolute and/or relative performance for the Portfolio in a report prepared by Lipper. The Trustees considered the total return performance information, which included the ranking of the Portfolio within a performance universe made up of funds with the same Lipper investment classification and objective (the “Universe Group”) by total return for applicable one-, three- and five-year periods. The Trustees reviewed a description of Lipper’s methodology for selecting mutual funds in the Portfolio’s Universe Group. The Lipper materials provided to the Trustees highlighted information with respect to a representative class to assist the Trustees in their review. As part of this review, the Trustees also reviewed the Portfolio’s performance against its benchmark and considered the performance information provided for the Portfolio at regular Board meetings by the Adviser. The Lipper performance data noted by the Trustees as part of their review and the determinations made by the Trustees with respect to the Portfolio’s performance are summarized below:
The Trustees noted the Portfolio’s performance was in the first, second, and second quintiles for Class 1 shares for the one-, three-, and five-year periods ended December 31, 2012, respectively. The Trustees discussed the performance and investment strategy of the Portfolio with the Adviser and,
| 30 | JPMORGAN INSURANCE TRUST | DECEMBER 31, 2013 | ||||
Table of Contents
based upon this discussion and various other factors, concluded that the performance was reasonable.
Advisory Fees and Expense Ratios
The Trustees considered the contractual advisory fee rate paid by the Portfolio to the Adviser and compared that rate to the information prepared by Lipper concerning management fee rates paid by other funds in the same Lipper category as the Portfolio. The Trustees recognized that Lipper reported the Portfolio’s management fee rate as the combined contractual advisory fee and administration fee rates. The Trustees also reviewed information about other expenses and the expense ratios for the Portfolio. The Trustees considered the fee waiver and/or expense reimbursement arrangements currently in
place for the Portfolio and considered the net advisory fee rate after taking into account any waivers and/or reimbursements. The Trustees recognized that it is difficult to make comparisons of advisory fees because there are variations in the services that are included in the fees paid by other funds. The Trustees’ determinations as a result of the review of the Portfolio’s advisory fees and expense ratios are summarized below:
The Trustees noted that the Portfolio’s net advisory fee and actual total expenses for Class 1 shares were in the first and second quintiles, respectively, of their Universe Group. After considering the factors identified above, in light of this information, the Trustees concluded that the advisory fee was reasonable.
| DECEMBER 31, 2013 | JPMORGAN INSURANCE TRUST | 31 | ||||||
Table of Contents
(Unaudited)
Certain tax information for the Portfolio is required to be provided to shareholders based upon the Portfolio’s income and distributions for the taxable year ended December 31, 2013. The information and distributions reported in this letter may differ from the information and taxable distributions reported to the shareholders for the calendar year ending December 31, 2013. The information necessary to complete your income tax returns for the calendar year ending December 31, 2013 will be provided under separate cover.
Dividends Received Deductions (DRD)
The Portfolio hereby designates 100.00% or the maximum allowable percentage as ordinary income distributions eligible for the 70% dividend received deduction for corporate rate shareholders for the fiscal year ended December 31, 2013.
| 32 | JPMORGAN INSURANCE TRUST | DECEMBER 31, 2013 | ||||
Table of Contents
J.P. Morgan Funds are distributed by JPMorgan Distribution Services, Inc., which is an affiliate of JPMorgan Chase & Co. Affiliates of JPMorgan Chase & Co. receive fees for providing various services to the funds.
Contact JPMorgan Distribution Services, Inc. at 1-800-480-4111 for a portfolio prospectus. You can also visit us at www.jpmorganfunds.com. Investors should carefully consider the investment objectives and risk as well as charges and expenses of the mutual fund before investing. The prospectus contains this and other information about the mutual fund. Read the prospectus carefully before investing.
The Portfolio files a complete schedule of its portfolio holdings for the first and third quarters of its fiscal year with the SEC on Form N-Q. The Portfolio’s Forms N-Q are available on the SEC’s website at http://www.sec.gov and may be reviewed and copied at the SEC’s Public Reference Room in Washington, DC. Information on the operation of the SEC’s Public Reference Room may be obtained by calling 1-800-SEC-0330. Shareholders may request the Form N-Q without charge by calling 1-800-480-4111 or by visiting the variable insurance portfolio section of the J.P. Morgan Funds’ website at www.jpmorganfunds.com.
A description of the Portfolio’s policies and procedures with respect to the disclosure of the Portfolio’s holdings is available in the prospectus and Statement of Additional Information.
A copy of proxy policies and procedures is available without charge upon request by calling 1-800-480-4111 and on the Portfolio’s website at www.jpmorganfunds.com. A description of such policies and procedures is on the SEC’s website at www.sec.gov. The Trustees have delegated the authority to vote proxies for securities owned by the Portfolio to the Adviser. A copy of the Portfolio’s voting record for the most recent 12-month period ended June 30 is available on the SEC’s website at www.sec.gov or at the Portfolio’s website at www.jpmorganfunds.com no later than August 31 of each year. The Portfolio’s proxy voting record will include, among other things, a brief description of the matter voted on for each portfolio security, and will state how each vote was cast, for example, for or against the proposal.
Table of Contents
| © JPMorgan Chase & Co., 2014. All rights reserved. December 2013. | AN-JPMITSCCP-1213 |
Table of Contents
Annual Report
JPMorgan Insurance Trust
December 31, 2013
JPMorgan Insurance Trust U.S. Equity Portfolio
NOT FDIC INSURED Ÿ NO BANK GUARANTEE Ÿ MAY LOSE VALUE
|  |
Table of Contents
Investments in the Portfolio are not bank deposits or obligations of, or guaranteed or endorsed by, any bank and are not insured or guaranteed by the FDIC, the Federal Reserve Board or any other government agency. You could lose money if you sell when the Portfolio’s share price is lower than when you invested.
Past performance is no guarantee of future performance. The general market views expressed in this report are opinions based on market and other conditions through the end of the reporting period and are subject to change without notice. These views are not intended to predict the future performance of the Portfolio or the securities markets. References to specific securities and their issuers are for illustrative purposes only and are not intended to be, and should not be interpreted as, recommendations to purchase or sell such securities. Such views are not meant as investment advice and may not be relied on as an indication of trading intent on behalf of the Portfolio.
This Portfolio is intended to be a funding vehicle for variable annuity contracts and variable life insurance policies (collectively “Policies”) offered by separate accounts of participating insurance companies. Portfolio shares are also offered through qualified pension and retirement plans (“Eligible Plans”). Individuals may not purchase shares directly from the Portfolio.
Prospective investors should refer to the Portfolio’s prospectus for a discussion of the Portfolio’s investment objective, strategies and risks. Call J.P. Morgan Funds Service Center at 1-800-480-4111 for a prospectus containing more complete information about the Portfolio, including management fees and other expenses. Please read it carefully before investing.
Table of Contents
JANUARY 23, 2014 (Unaudited)
Dear Shareholder,
Equities markets in developed economies performed strongly in the face of periodic spikes in volatility throughout the twelve months ended December 31, 2013. Healthy corporate earnings and incremental but steady improvements in a range of economic indicators provided a positive backdrop for investors seeking returns in the low interest rate environment. While political discord in Washington injected volatility into the market, a bipartisan budget agreement at the end of the year relieved much of the political uncertainty created by partisan brinkmanship over the so-called fiscal cliff and the partial shutdown of the federal government in October. In the first half of the year, the U.S. Federal Reserve (“Fed”) announced its intention to taper off its $85 billion in monthly asset purchases and the statement weakened investor sentiment and set off widespread speculation about the timing and magnitude of such a move. The Fed followed through in December, deciding to reduce its monthly purchases by $10 billion. The news, along with robust gains in jobs, housing and consumer sentiment, drove U.S. equities to new highs. The S&P 500 stock index hit seven closing highs in the final month of the reporting period, finishing 2013 with its best performance since 1997.
 |
“While a repeat of the equity performance we experienced in 2013 may be a tall order, we believe stocks in the U.S. and Europe may continue to show gains.” |
Overseas, the European Central Bank reaffirmed its commitment to accommodative monetary policy and to the euro itself. In the second quarter of the year, the European Union (EU) returned to positive growth and at the end of the year, Ireland became the first nation to exit from its European Union bailout program. The Fed’s decision to curb its asset purchases also sent equities higher in Europe, as investors viewed the move as a sign of further economic stability. In Japan, equity markets rebounded to their best year since 1988, benefitting from Prime Minister Shinzo Abe’s efforts to revive the economy. Low returns on bonds and short-term debt instruments also drove investors into stocks.
Emerging market equities were weaker overall. As of December 31, 2013, the MSCI Emerging Markets Index returned -2.3% for the year. China’s economy showed signs of slower growth during the year and the Fed’s decision to taper its asset purchase program set off speculation that the maturation of the emerging markets credit cycle would push yield-seeking investors to rotate into developed markets.
Taper Talk Pressures Bonds
Fixed income markets generally remained weak during the year, as central bankers across the globe held interest rates at
historic lows. However, benchmark bond yields rose on an annual basis for the first time since 2009. During the year, the Fed’s talk of tapering off its Quantitative Easing (QE) program hurt fixed income markets. U.S. Treasury security yields continued to be low from a historical perspective, but ended the period higher. The yield for 10-year U.S. Treasury securities ended December 31, 2013 at 3.04%, while the yields for 2- and 30-year U.S. Treasury securities finished the reporting period at 0.38% and 3.96%, respectively. High-yield debt returned 7.4% for the year, as measured by the Barclays US High Yield Corporate Index, while other U.S. debt securities and emerging market debt both had negative returns.
While global economic growth accelerated during the year, the U.S. recovery in particular showed stronger fundamentals and the Fed’s decision to taper its QE program was a response to the improved picture. Europe emerged from its lengthy recession and the worst of the fiscal crises seem to be behind it, though unemployment remains strikingly high in many EU nations. Japan made progress toward ending persistent deflation, but Tokyo’s monetary and fiscal stimulus has sharply weakened the yen, putting other Asian exporting nations — notably China and South Korea — at a competitive disadvantage. Emerging market economies may face further headwinds as foreign investment shrinks and economic growth moderates from recent strength. Moreover, political instability — already apparent in Thailand and Turkey — may surface in other emerging market nations as governments struggle to deliver improved living standards and respond to demands for political reforms.
The Long-Term Lens
We welcome the Fed’s move to curb its QE program as a sign that the U.S. economy’s need for artificial stimulus is waning. While a repeat of the equity performance we experienced in 2013 may be a tall order, we believe stocks in the U.S. and Europe may continue to show gains. In the fixed-income market, persistent weakness has led to attractive valuations in some sectors. The past year’s market swings and intermittent volatility underlined the importance of maintaining a long-term view of your investment portfolio and the benefits derived from diversified holdings.
On behalf of everyone at J.P. Morgan Asset Management, thank you for your continued support. We look forward to managing your investment needs for years to come. Should you have any questions, please visit www.jpmorganfunds.com or contact the J.P. Morgan Funds Service Center at 1-800-480-4111.
Sincerely yours,

George C.W. Gatch
CEO, Global Funds Management
J.P. Morgan Asset Management
| DECEMBER 31, 2013 | JPMORGAN INSURANCE TRUST | 1 | ||||||
Table of Contents
JPMorgan Insurance Trust U.S. Equity Portfolio
TWELVE MONTHS ENDED DECEMBER 31, 2013 (Unaudited)
| REPORTING PERIOD RETURN: | ||||
| Portfolio (Class 1 Shares)* | 36.22% | |||
| S&P 500 Index | 32.39% | |||
| Net Assets as of 12/31/2013 | $93,009,813 | |||
INVESTMENT OBJECTIVE**
The JPMorgan Insurance Trust U.S. Equity Portfolio (the “Portfolio”) seeks to provide high total return from a portfolio of selected equity securities.
HOW DID THE MARKET PERFORM?
Overall, the U.S. equity market performed strongly during the 12 months ended December 31, 2013, as a tepid economic recovery continued to gain strength from healthy corporate earnings, along with improvements in employment, housing and consumer sentiment. The Standard & Poor’s 500 Index (the “Benchmark”) retreated at mid-year amid investor uncertainty about the U.S. Federal Reserve Board’s (the “Fed”) intent to taper off its monthly purchases of $85 billion in Treasuries and mortgage-backed securities. Interest rates rose sharply higher, pressuring prices for both stocks and bonds. Partisan brinkmanship in Washington added to the uncertainty, starting with the standoff over the so-called fiscal cliff in January and followed by the partial shutdown of the federal government in October. A bipartisan budget agreement toward the end of the year relieved some of the political uncertainty. During the year, U.S. unemployment claims fell from 7.9% in January to 7.0%, with slight upticks in joblessness at midyear and in October. Adding to the positive trend were advances in housing prices and auto sales in the second half of the year, and a rebound in consumer sentiment to a five-month high in December. The Standard & Poor’s 500 Index hit 42 record closings during the year — the most since 1998 — including seven record high closings in the final month of the year. The Benchmark racked up a 32.26% gain for the year.
WHAT WERE THE MAIN DRIVERS OF THE PORTFOLIO’S PERFORMANCE?
The Portfolio (Class 1 Shares) outperformed the Benchmark for the twelve months ended December 31, 2013. The Portfolio’s stock selection in the pharmaceuticals/medical technology sector and its underweight position in the real estate investment trust (REIT) sector contributed to relative performance,
while stock selection in the systems & network hardware sector and the health services & systems sector detracted from relative performance.
Individual contributors to relative performance included the Portfolio’s overweight positions in Avago Technologies Ltd. and Biogen Idec Inc. and its underweight position in IBM Corp. Avago is a semiconductor manufacturer based in Singapore. The company’s shares benefited from its planned $6.6 billion purchase of LSI Corp. Biogen Idec, a biotechnology company, rose sharply after European regulators granted the company 10 years of exclusivity for its multiple sclerosis treatment Tecfidera. IBM, a diversified information technology company, was the worst performing among the 30 components of the Dow Jones Industrial Average during 2013. The company’s inability to increase revenue and reports of weak growth in its Watson model computer pressured the stock throughout the year.
Individual detractors from relative performance included Walter Industries Inc., Ace Ltd. and Gilead Sciences Inc. Shares of Walter Industries, a producer and exporter of coal and related products, fell on weak profitability due to lower prices for its metallurgical coal, used in the global production of steel. Shares of Ace, a provider of property and casualty insurance and reinsurance, came under pressure as investors forecast softness in premiums. While shares of Gilead, a biopharmaceutical company, performed well during the period, the Portfolio’s underweight position in the stock hurt relative performance.
HOW WAS THE PORTFOLIO POSITIONED?
The portfolio managers employed a bottom-up fundamental approach to stock selection, researching companies to determine what they believed to be their underlying value and potential for future earnings growth. As a result of the Portfolio’s bottom-up fundamental approach to stock selection, the Portfolio was overweight versus the Benchmark in the semiconductors, media and auto & transportation sectors. The Portfolio was underweight versus the Benchmark in the consumer stable, REITs and industrial cyclical sectors.
| 2 | JPMORGAN INSURANCE TRUST | DECEMBER 31, 2013 | ||||
Table of Contents
| TOP TEN EQUITY HOLDINGS OF THE PORTFOLIO**** | ||||||||
| 1. | Johnson & Johnson | 3.9 | % | |||||
| 2. | Google, Inc., Class A | 3.0 | ||||||
| 3. | Apple, Inc. | 2.9 | ||||||
| 4. | Wells Fargo & Co. | 2.8 | ||||||
| 5. | Time Warner, Inc. | 2.5 | ||||||
| 6. | Exxon Mobil Corp. | 2.3 | ||||||
| 7. | United Technologies Corp. | 2.2 | ||||||
| 8. | Schlumberger Ltd. | 2.2 | ||||||
| 9. | UnitedHealth Group, Inc. | 2.2 | ||||||
| 10. | Microsoft Corp. | 2.1 | ||||||
PORTFOLIO COMPOSITION BY SECTOR**** | ||||
| Information Technology | 20.8 | % | ||
| Consumer Discretionary | 15.9 | |||
| Financials | 15.3 | |||
| Health Care | 13.2 | |||
| Industrials | 10.6 | |||
| Energy | 10.5 | |||
| Consumer Staples | 6.0 | |||
| Materials | 4.1 | |||
| Utilities | 1.5 | |||
| Telecommunication Services | 0.9 | |||
| Short-Term Investment | 1.2 | |||
| * | The return shown is based on net asset values calculated for shareholder transactions and may differ from the return shown in the financial highlights, which reflects adjustments made to the net asset values in accordance with accounting principles generally accepted in the United States of America. |
| ** | “S&P 500 Index” is a registered service mark of Standard & Poor’s Corporation, which does not sponsor, and is in no way affiliated with, the Portfolio. |
| *** | The adviser seeks to achieve the Portfolio’s objective. There can be no guarantee it will be achieved. |
| **** | Percentages indicated are based on total investments as of December 31, 2013. The Portfolio’s composition is subject to change. |
| DECEMBER 31, 2013 | JPMORGAN INSURANCE TRUST | 3 | ||||||
Table of Contents
JPMorgan Insurance Trust U.S. Equity Portfolio
PORTFOLIO COMMENTARY
TWELVE MONTHS ENDED DECEMBER 31, 2013 (Unaudited) (continued)
AVERAGE ANNUAL TOTAL RETURNS AS OF DECEMBER 31, 2013 | ||||||||||||||||
| INCEPTION DATE OF CLASS | 1 YEAR | 5 YEAR | 10 YEAR | |||||||||||||
CLASS 1 SHARES | 3/30/95 | 36.22 | % | 19.01 | % | 8.14 | % | |||||||||
CLASS 2 SHARES | 8/16/06 | 35.90 | 18.71 | 7.94 | ||||||||||||
TEN YEAR PERFORMANCE (12/31/03 TO 12/31/13)
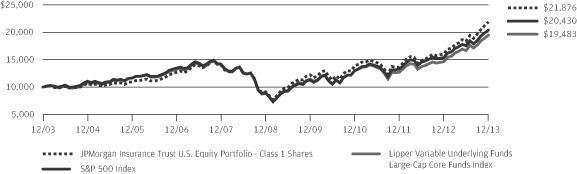
The performance quoted is past performance and is not a guarantee of future results. Mutual funds are subject to certain market risks. Investment returns and principal value of an investment will fluctuate so that an investor’s shares, when redeemed, may be worth more or less than their original cost. Current performance may be higher or lower than the performance data shown. For up-to-date month-end performance information please call 1-800-480-4111. Effective November 1, 2006, the Portfolio’s investment objective and strategies changed. Although past performance is not necessarily an indication of how the Portfolio will perform in the future, in view of these changes, the Portfolio’s performance record prior to this period might be less relevant for investors considering whether to purchase shares of the Portfolio.
Returns for the Class 2 Shares prior to its inception date are based on the performance of Class 1 Shares. The actual returns of Class 2 Shares would have been lower than those shown because Class 2 Shares have higher expenses than Class 1 Shares.
The graph illustrates comparative performance for $10,000 invested in Class 1 Shares of the JPMorgan Insurance Trust U.S. Equity Portfolio, the S&P 500 Index and the Lipper Variable Underlying Funds Large-Cap Core Funds Index from December 31, 2003 to December 31, 2013. The performance of the Portfolio assumes reinvestment of all dividends and capital gain distributions, if
any. The performance of the S&P 500 Index does not reflect the deduction of expenses associated with a mutual fund and has been adjusted to reflect reinvestment of all dividends and capital gain distributions of the securities included in the benchmark, if applicable. The performance of the Lipper Variable Underlying Funds Large-Cap Core Funds Index includes expenses associated with a mutual fund, such as investment management fees. These expenses are not identical to the expenses incurred by the Portfolio. The S&P 500 Index is an unmanaged index generally representative of the performance of large companies in the U.S. stock market. The Lipper Variable Underlying Funds Large-Cap Core Funds Index is an index based on the total returns of certain mutual funds within the Portfolio’s designated category as determined by Lipper, Inc. Investors cannot invest directly in an index.
Portfolio performance does not reflect any charges imposed by the Policies or Eligible Plans. If these charges were included, the returns would be lower than shown. Portfolio performance may reflect the waiver of the Portfolio’s fees and reimbursement of expenses for certain periods since the inception date. Without these waivers and reimbursements, performance would have been lower.
The returns shown are based on net asset values calculated for shareholder transactions and may differ from the returns shown in the financial highlights, which reflect adjustments made to the net asset values in accordance with accounting principles generally accepted in the United States of America.
| 4 | JPMORGAN INSURANCE TRUST | DECEMBER 31, 2013 | ||||
Table of Contents
JPMorgan Insurance Trust U.S. Equity Portfolio
SCHEDULE OF PORTFOLIO INVESTMENTS
AS OF DECEMBER 31, 2013
| SHARES | SECURITY DESCRIPTION | VALUE($) | ||||||
| Common Stocks — 98.9% |
| ||||||
Consumer Discretionary — 15.9% |
| |||||||
Auto Components — 0.4% |
| |||||||
| 1,350 | Dana Holding Corp. | 26,487 | ||||||
| 7,291 | Johnson Controls, Inc. | 374,028 | ||||||
|
| |||||||
| 400,515 | ||||||||
|
| |||||||
Automobiles — 2.1% |
| |||||||
| 47,320 | General Motors Co. (a) | 1,933,968 | ||||||
|
| |||||||
Hotels, Restaurants & Leisure — 1.4% |
| |||||||
| 4,710 | McDonald’s Corp. | 457,011 | ||||||
| 6,950 | Royal Caribbean Cruises Ltd. | 329,569 | ||||||
| 7,082 | Yum! Brands, Inc. | 535,470 | ||||||
|
| |||||||
| 1,322,050 | ||||||||
|
| |||||||
Household Durables — 0.8% |
| |||||||
| 5,930 | Lennar Corp., Class A | 234,591 | ||||||
| 70 | NVR, Inc. (a) | 71,821 | ||||||
| 4,520 | PulteGroup, Inc. | 92,072 | ||||||
| 6,120 | Toll Brothers, Inc. (a) | 226,440 | ||||||
| 390 | Whirlpool Corp. | 61,175 | ||||||
|
| |||||||
| 686,099 | ||||||||
|
| |||||||
Internet & Catalog Retail — 1.5% |
| |||||||
| 2,310 | Amazon.com, Inc. (a) | 921,205 | ||||||
| 410 | priceline.com, Inc. (a) | 476,584 | ||||||
|
| |||||||
| 1,397,789 | ||||||||
|
| |||||||
Media — 5.5% |
| |||||||
| 7,640 | CBS Corp. (Non-Voting), Class B | 486,974 | ||||||
| 25,280 | Comcast Corp., Class A | 1,313,675 | ||||||
| 5,740 | DISH Network Corp., Class A (a) | 332,461 | ||||||
| 2,450 | Time Warner Cable, Inc. | 331,975 | ||||||
| 33,010 | Time Warner, Inc. | 2,301,457 | ||||||
| 4,980 | Walt Disney Co. (The) | 380,472 | ||||||
|
| |||||||
| 5,147,014 | ||||||||
|
| |||||||
Specialty Retail — 3.3% |
| |||||||
| 1,150 | AutoZone, Inc. (a) | 549,631 | ||||||
| 15,570 | Home Depot, Inc. (The) | 1,282,034 | ||||||
| 10,550 | Lowe’s Cos., Inc. | 522,753 | ||||||
| 11,680 | TJX Cos., Inc. | 744,366 | ||||||
|
| |||||||
| 3,098,784 | ||||||||
|
| |||||||
Textiles, Apparel & Luxury Goods — 0.9% |
| |||||||
| 3,680 | Lululemon Athletica, Inc., (Canada) (a) | 217,231 | ||||||
| 9,030 | V.F. Corp. | 562,930 | ||||||
|
| |||||||
| 780,161 | ||||||||
|
| |||||||
Total Consumer Discretionary | 14,766,380 | |||||||
|
| |||||||
| SHARES | SECURITY DESCRIPTION | VALUE($) | ||||||
Consumer Staples — 6.1% |
| |||||||
Beverages — 1.5% | ||||||||
| 19,840 | Coca-Cola Co. (The) | 819,590 | ||||||
| 1,000 | Constellation Brands, Inc., Class A (a) | 70,380 | ||||||
| 100 | Molson Coors Brewing Co., Class B | 5,615 | ||||||
| 6,220 | PepsiCo, Inc. | 515,887 | ||||||
|
| |||||||
| 1,411,472 | ||||||||
|
| |||||||
Food & Staples Retailing — 1.4% |
| |||||||
| 3,820 | Costco Wholesale Corp. | 454,618 | ||||||
| 9,560 | CVS Caremark Corp. | 684,210 | ||||||
| 2,190 | Wal-Mart Stores, Inc. | 172,331 | ||||||
|
| |||||||
| 1,311,159 | ||||||||
|
| |||||||
Food Products — 0.8% |
| |||||||
| 3,828 | General Mills, Inc. | 191,055 | ||||||
| 14,639 | Mondelez International, Inc., Class A | 516,757 | ||||||
|
| |||||||
| 707,812 | ||||||||
|
| |||||||
Household Products — 1.5% |
| |||||||
| 4,320 | Colgate-Palmolive Co. | 281,707 | ||||||
| 13,937 | Procter & Gamble Co. (The) | 1,134,611 | ||||||
|
| |||||||
| 1,416,318 | ||||||||
|
| |||||||
Tobacco — 0.9% |
| |||||||
| 8,930 | Philip Morris International, Inc. | 778,071 | ||||||
|
| |||||||
Total Consumer Staples | 5,624,832 | |||||||
|
| |||||||
Energy — 10.5% | ||||||||
Energy Equipment & Services — 2.9% |
| |||||||
| 4,320 | Ensco plc, (United Kingdom), Class A | 247,018 | ||||||
| 7,770 | Halliburton Co. | 394,327 | ||||||
| 22,528 | Schlumberger Ltd. | 2,029,998 | ||||||
|
| |||||||
| 2,671,343 | ||||||||
|
| |||||||
Oil, Gas & Consumable Fuels — 7.6% |
| |||||||
| 5,370 | Anadarko Petroleum Corp. | 425,948 | ||||||
| 2,140 | Apache Corp. | 183,912 | ||||||
| 4,450 | Cheniere Energy, Inc. (a) | 191,884 | ||||||
| 9,830 | Chevron Corp. | 1,227,865 | ||||||
| 970 | EOG Resources, Inc. | 162,805 | ||||||
| 21,135 | Exxon Mobil Corp. | 2,138,862 | ||||||
| 9,276 | Marathon Oil Corp. | 327,443 | ||||||
| 4,650 | Marathon Petroleum Corp. | 426,545 | ||||||
| 10,757 | Occidental Petroleum Corp. | 1,022,991 | ||||||
| 5,980 | Phillips 66 | 461,237 | ||||||
| 7,320 | QEP Resources, Inc. | 224,358 | ||||||
| 7,220 | Williams Cos., Inc. (The) | 278,475 | ||||||
|
| |||||||
| 7,072,325 | ||||||||
|
| |||||||
Total Energy | 9,743,668 | |||||||
|
| |||||||
SEE NOTES TO FINANCIAL STATEMENTS.
| DECEMBER 31, 2013 | JPMORGAN INSURANCE TRUST | 5 | ||||||
Table of Contents
JPMorgan Insurance Trust U.S. Equity Portfolio
SCHEDULE OF PORTFOLIO INVESTMENTS
AS OF DECEMBER 31, 2013 (continued)
| SHARES | SECURITY DESCRIPTION | VALUE($) | ||||||
| Common Stocks — Continued |
| ||||||
Financials — 15.3% |
| |||||||
Capital Markets — 3.1% |
| |||||||
| 3,610 | Ameriprise Financial, Inc. | 415,331 | ||||||
| 2,896 | Goldman Sachs Group, Inc. (The) | 513,345 | ||||||
| 13,380 | Invesco Ltd. | 487,032 | ||||||
| 27,831 | Morgan Stanley | 872,780 | ||||||
| 990 | Northern Trust Corp. | 61,271 | ||||||
| 5,720 | State Street Corp. | 419,791 | ||||||
| 3,005 | TD Ameritrade Holding Corp. | 92,073 | ||||||
|
| |||||||
| 2,861,623 | ||||||||
|
| |||||||
Commercial Banks — 3.1% |
| |||||||
| 2,510 | SunTrust Banks, Inc. | 92,393 | ||||||
| 57,033 | Wells Fargo & Co. | 2,589,298 | ||||||
| 6,830 | Zions Bancorporation | 204,627 | ||||||
|
| |||||||
| 2,886,318 | ||||||||
|
| |||||||
Consumer Finance — 0.7% |
| |||||||
| 1,500 | American Express Co. | 136,095 | ||||||
| 6,260 | Capital One Financial Corp. | 479,579 | ||||||
|
| |||||||
| 615,674 | ||||||||
|
| |||||||
Diversified Financial Services — 4.3% |
| |||||||
| 104,789 | Bank of America Corp. | 1,631,565 | ||||||
| 27,684 | Citigroup, Inc. | 1,442,613 | ||||||
| 4,250 | IntercontinentalExchange Group, Inc. | 955,910 | ||||||
|
| |||||||
| 4,030,088 | ||||||||
|
| |||||||
Insurance — 3.9% |
| |||||||
| 15,768 | ACE Ltd., (Switzerland) | 1,632,461 | ||||||
| 400 | Axis Capital Holdings Ltd., (Bermuda) | 19,028 | ||||||
| 8,380 | Hartford Financial Services Group, Inc. | 303,607 | ||||||
| 12,170 | Marsh & McLennan Cos., Inc. | 588,541 | ||||||
| 18,600 | MetLife, Inc. | 1,002,912 | ||||||
| 1,290 | Prudential Financial, Inc. | 118,964 | ||||||
|
| |||||||
| 3,665,513 | ||||||||
|
| |||||||
Real Estate Investment Trusts (REITs) — 0.2% |
| |||||||
| 1,070 | Simon Property Group, Inc. | 162,811 | ||||||
|
| |||||||
Total Financials | 14,222,027 | |||||||
|
| |||||||
Health Care — 13.2% |
| |||||||
Biotechnology — 3.1% |
| |||||||
| 560 | Aegerion Pharmaceuticals, Inc. (a) | 39,738 | ||||||
| 3,420 | Alexion Pharmaceuticals, Inc. (a) | 455,065 | ||||||
| 3,786 | Biogen Idec, Inc. (a) | 1,059,133 | ||||||
| 5,109 | Celgene Corp. (a) | 863,217 | ||||||
| 6,310 | Vertex Pharmaceuticals, Inc. (a) | 468,833 | ||||||
|
| |||||||
| 2,885,986 | ||||||||
|
| |||||||
| SHARES | SECURITY DESCRIPTION | VALUE($) | ||||||
Health Care Equipment & Supplies — 0.4% |
| |||||||
| 2,370 | Baxter International, Inc. | 164,833 | ||||||
| 3,020 | Stryker Corp. | 226,923 | ||||||
|
| |||||||
| 391,756 | ||||||||
|
| |||||||
Health Care Providers & Services — 3.1% |
| |||||||
| 4,500 | Humana, Inc. | 464,490 | ||||||
| 2,550 | McKesson Corp. | 411,570 | ||||||
| 26,570 | UnitedHealth Group, Inc. | 2,000,721 | ||||||
|
| |||||||
| 2,876,781 | ||||||||
|
| |||||||
Health Care Technology — 0.3% |
| |||||||
| 4,947 | Cerner Corp. (a) | 275,746 | ||||||
|
| |||||||
Pharmaceuticals — 6.3% |
| |||||||
| 26,270 | Bristol-Myers Squibb Co. | 1,396,251 | ||||||
| 39,680 | Johnson & Johnson | 3,634,291 | ||||||
| 13,702 | Merck & Co., Inc. | 685,785 | ||||||
| 720 | Perrigo Co. plc | 110,491 | ||||||
|
| |||||||
| 5,826,818 | ||||||||
|
| |||||||
Total Health Care | 12,257,087 | |||||||
|
| |||||||
Industrials — 10.6% |
| |||||||
Aerospace & Defense — 3.7% |
| |||||||
| 14,210 | Honeywell International, Inc. | 1,298,368 | ||||||
| 940 | Textron, Inc. | 34,554 | ||||||
| 18,255 | United Technologies Corp. | 2,077,419 | ||||||
|
| |||||||
| 3,410,341 | ||||||||
|
| |||||||
Airlines — 0.4% |
| |||||||
| 12,400 | Delta Air Lines, Inc. | 340,628 | ||||||
| 1,730 | United Continental Holdings, Inc. (a) | 65,446 | ||||||
|
| |||||||
| 406,074 | ||||||||
|
| |||||||
Building Products — 0.5% |
| |||||||
| 18,390 | Masco Corp. | 418,740 | ||||||
|
| |||||||
Construction & Engineering — 1.4% |
| |||||||
| 15,710 | Fluor Corp. | 1,261,356 | ||||||
| 800 | Jacobs Engineering Group, Inc. (a) | 50,392 | ||||||
|
| |||||||
| 1,311,748 | ||||||||
|
| |||||||
Electrical Equipment — 1.3% |
| |||||||
| 6,260 | Eaton Corp. plc, (Ireland) | 476,511 | ||||||
| 10,998 | Emerson Electric Co. | 771,840 | ||||||
|
| |||||||
| 1,248,351 | ||||||||
|
| |||||||
Machinery — 1.5% |
| |||||||
| 2,580 | Flowserve Corp. | 203,382 | ||||||
| 15,583 | PACCAR, Inc. | 922,046 | ||||||
| 890 | Pentair Ltd., (Switzerland) | 69,126 | ||||||
| 2,070 | SPX Corp. | 206,193 | ||||||
|
| |||||||
| 1,400,747 | ||||||||
|
| |||||||
SEE NOTES TO FINANCIAL STATEMENTS.
| 6 | JPMORGAN INSURANCE TRUST | DECEMBER 31, 2013 | ||||
Table of Contents
| SHARES | SECURITY DESCRIPTION | VALUE($) | ||||||
| Common Stocks — Continued |
| ||||||
Road & Rail — 1.6% |
| |||||||
| 31,930 | CSX Corp. | 918,626 | ||||||
| 840 | Norfolk Southern Corp. | 77,977 | ||||||
| 3,130 | Union Pacific Corp. | 525,840 | ||||||
|
| |||||||
| 1,522,443 | ||||||||
|
| |||||||
Trading Companies & Distributors — 0.2% |
| |||||||
| 690 | W.W. Grainger, Inc. | 176,240 | ||||||
|
| |||||||
Total Industrials | 9,894,684 | |||||||
|
| |||||||
Information Technology — 20.8% |
| |||||||
Communications Equipment — 3.0% |
| |||||||
| 60,513 | Cisco Systems, Inc. | 1,358,517 | ||||||
| 18,944 | QUALCOMM, Inc. | 1,406,592 | ||||||
|
| |||||||
| 2,765,109 | ||||||||
|
| |||||||
Computers & Peripherals — 3.2% |
| |||||||
| 4,778 | Apple, Inc. | 2,680,983 | ||||||
| 6,720 | Hewlett-Packard Co. | 188,026 | ||||||
| 1,390 | SanDisk Corp. | 98,051 | ||||||
|
| |||||||
| 2,967,060 | ||||||||
|
| |||||||
Internet Software & Services — 4.2% |
| |||||||
| 18,220 | eBay, Inc. (a) | 1,000,095 | ||||||
| 930 | Facebook, Inc., Class A (a) | 50,834 | ||||||
| 2,452 | Google, Inc., Class A (a) | 2,747,981 | ||||||
| 600 | LinkedIn Corp., Class A (a) | 130,098 | ||||||
|
| |||||||
| 3,929,008 | ||||||||
|
| |||||||
IT Services — 2.0% |
| |||||||
| 2,660 | Accenture plc, (Ireland), Class A | 218,705 | ||||||
| 880 | Alliance Data Systems Corp. (a) | 231,379 | ||||||
| 2,920 | Cognizant Technology Solutions Corp., Class A (a) | 294,862 | ||||||
| 7,027 | Genpact Ltd., (Bermuda) (a) | 129,086 | ||||||
| 4,530 | Visa, Inc., Class A | 1,008,740 | ||||||
|
| |||||||
| 1,882,772 | ||||||||
|
| |||||||
Semiconductors & Semiconductor Equipment — 4.2% |
| |||||||
| 1,940 | Altera Corp. | 63,108 | ||||||
| 34,587 | Applied Materials, Inc. | 611,844 | ||||||
| 22,580 | Avago Technologies Ltd., (Singapore) | 1,194,256 | ||||||
| 4,440 | Broadcom Corp., Class A | 131,646 | ||||||
| 8,830 | Freescale Semiconductor Ltd. (a) | 141,722 | ||||||
| 8,680 | KLA-Tencor Corp. | 559,513 | ||||||
| 15,626 | Lam Research Corp. (a) | 850,836 | ||||||
| 10,770 | Teradyne, Inc. (a) | 189,767 | ||||||
| 3,760 | Xilinx, Inc. | 172,659 | ||||||
|
| |||||||
| 3,915,351 | ||||||||
|
| |||||||
| SHARES | SECURITY DESCRIPTION | VALUE($) | ||||||
Software — 4.2% |
| |||||||
| 8,200 | Adobe Systems, Inc. (a) | 491,016 | ||||||
| 4,310 | Citrix Systems, Inc. (a) | 272,607 | ||||||
| 53,173 | Microsoft Corp. | 1,990,265 | ||||||
| 28,610 | Oracle Corp. | 1,094,619 | ||||||
| 700 | VMware, Inc., Class A (a) | 62,797 | ||||||
|
| |||||||
| 3,911,304 | ||||||||
|
| |||||||
Total Information Technology | 19,370,604 | |||||||
|
| |||||||
Materials — 4.1% |
| |||||||
Chemicals — 1.9% |
| |||||||
| 2,170 | Air Products & Chemicals, Inc. | 242,563 | ||||||
| 4,744 | Axiall Corp. | 225,055 | ||||||
| 13,230 | Dow Chemical Co. (The) | 587,412 | ||||||
| 2,120 | Methanex Corp., (Canada) | 125,589 | ||||||
| 4,940 | Monsanto Co. | 575,757 | ||||||
|
| |||||||
| 1,756,376 | ||||||||
|
| |||||||
Containers & Packaging — 0.1% |
| |||||||
| 2,540 | Ball Corp. | 131,217 | ||||||
|
| |||||||
Metals & Mining — 2.0% |
| |||||||
| 47,264 | Alcoa, Inc. | 502,416 | ||||||
| 26,773 | Freeport-McMoRan Copper & Gold, Inc. | 1,010,413 | ||||||
| 12,120 | United States Steel Corp. | 357,540 | ||||||
|
| |||||||
| 1,870,369 | ||||||||
|
| |||||||
Paper & Forest Products — 0.1% |
| |||||||
| 1,080 | International Paper Co. | 52,952 | ||||||
|
| |||||||
Total Materials | 3,810,914 | |||||||
|
| |||||||
Telecommunication Services — 0.9% |
| |||||||
Diversified Telecommunication Services — 0.9% |
| |||||||
| 17,133 | Verizon Communications, Inc. | 841,916 | ||||||
|
| |||||||
Utilities — 1.5% |
| |||||||
Electric Utilities — 0.9% |
| |||||||
| 5,660 | American Electric Power Co., Inc. | 264,548 | ||||||
| 6,980 | NextEra Energy, Inc. | 597,628 | ||||||
|
| |||||||
| 862,176 | ||||||||
|
| |||||||
Multi-Utilities — 0.6% |
| |||||||
| 1,890 | DTE Energy Co. | 125,477 | ||||||
| 1,890 | NiSource, Inc. | 62,143 | ||||||
| 4,000 | Sempra Energy | 359,040 | ||||||
|
| |||||||
| 546,660 | ||||||||
|
| |||||||
Total Utilities | 1,408,836 | |||||||
|
| |||||||
Total Common Stocks | 91,940,948 | |||||||
|
| |||||||
SEE NOTES TO FINANCIAL STATEMENTS.
| DECEMBER 31, 2013 | JPMORGAN INSURANCE TRUST | 7 | ||||||
Table of Contents
JPMorgan Insurance Trust U.S. Equity Portfolio
SCHEDULE OF PORTFOLIO INVESTMENTS
AS OF DECEMBER 31, 2013 (continued)
| SHARES | SECURITY DESCRIPTION | VALUE($) | ||||||
| Short-Term Investment — 1.2% | |||||||
Investment Company — 1.2% | ||||||||
| 1,125,474 | JPMorgan Liquid Assets Money Market Fund, Institutional Class Shares, 0.020% (b) (l) (m) | 1,125,474 | ||||||
|
| |||||||
Total Investments — 100.1% | 93,066,422 | |||||||
Liabilities in Excess of | (56,609 | ) | ||||||
|
| |||||||
NET ASSETS — 100.0% | $ | 93,009,813 | ||||||
|
| |||||||
Percentages indicated are based on net assets.
NOTES TO SCHEDULE OF PORTFOLIO INVESTMENTS:
| (a) | — Non-income producing security. | |
| (b) | — Investment in affiliate. Money market fund registered under the Investment Company Act of 1940, as amended, and advised by J.P. Morgan Investment Management Inc. | |
| (l) | — The rate shown is the current yield as of December 31, 2013. | |
| (m) | — All or a portion of this security is reserved and/or pledged with the custodian for current or potential holdings of futures, swaps, options, TBAs, when-issued securities, delayed delivery securities, reverse repurchase agreements, unfunded commitments and/or forward foreign currency exchange contracts. |
SEE NOTES TO FINANCIAL STATEMENTS.
| 8 | JPMORGAN INSURANCE TRUST | DECEMBER 31, 2013 | ||||
Table of Contents
STATEMENT OF ASSETS AND LIABILITIES
AS OF DECEMBER 31, 2013
U.S. Equity | ||||
ASSETS: | ||||
Investments in non-affiliates, at value | $ | 91,940,948 | ||
Investments in affiliates, at value | 1,125,474 | |||
|
| |||
Total investment securities, at value | 93,066,422 | |||
Cash | 4 | |||
Deposits at broker for futures contracts | 30,000 | |||
Receivables: | ||||
Investment securities sold | 159,980 | |||
Portfolio shares sold | 13,157 | |||
Dividends from non-affiliates | 116,568 | |||
Dividends from affiliates | 30 | |||
Variation margin on futures contracts | 376 | |||
|
| |||
Total Assets | 93,386,537 | |||
|
| |||
LIABILITIES: | ||||
Payables: | ||||
Investment securities purchased | 167,016 | |||
Portfolio shares redeemed | 98,131 | |||
Accrued liabilities: | ||||
Investment advisory fees | 42,589 | |||
Administration fees | 6,535 | |||
Distribution fees | 1,182 | |||
Custodian and accounting fees | 17,683 | |||
Trustees’ and Chief Compliance Officer’s fees | 6 | |||
Audit fees | 32,627 | |||
Other | 10,955 | |||
|
| |||
Total Liabilities | 376,724 | |||
|
| |||
Net Assets | $ | 93,009,813 | ||
|
| |||
NET ASSETS: | ||||
Paid-in-capital | $ | 83,576,540 | ||
Accumulated undistributed net investment income | 863,588 | |||
Accumulated net realized gains (losses) | (10,916,129 | ) | ||
Net unrealized appreciation (depreciation) | 19,485,814 | |||
|
| |||
Total Net Assets | $ | 93,009,813 | ||
|
| |||
Net Assets: | ||||
Class 1 | $ | 87,386,499 | ||
Class 2 | 5,623,314 | |||
|
| |||
Total | $ | 93,009,813 | ||
|
| |||
Outstanding units of beneficial interest (shares) | ||||
(unlimited number of shares authorized, no par value): | ||||
Class 1 | 3,686,187 | |||
Class 2 | 239,018 | |||
Net Asset Value, offering and redemption price per share (a): | ||||
Class 1 | $ | 23.71 | ||
Class 2 | 23.53 | |||
|
| |||
Cost of investments in non-affiliates | $ | 72,455,134 | ||
Cost of investments in affiliates | 1,125,474 | |||
| (a) | Per share amounts may not recalculate due to rounding of net assets and/or shares outstanding. |
SEE NOTES TO FINANCIAL STATEMENTS.
| DECEMBER 31, 2013 | JPMORGAN INSURANCE TRUST | 9 | ||||||
Table of Contents
STATEMENT OF OPERATIONS
FOR THE YEAR ENDED DECEMBER 31, 2013
U.S. Equity | ||||
INVESTMENT INCOME: | ||||
Dividend income from non-affiliates | $ | 1,553,453 | ||
Dividend income from affiliates | 509 | |||
|
| |||
Total investment income | 1,553,962 | |||
|
| |||
EXPENSES: | ||||
Investment advisory fees | 473,048 | |||
Administration fees | 72,450 | |||
Distribution fees — Class 2 | 10,817 | |||
Custodian and accounting fees | 55,666 | |||
Professional fees | 44,094 | |||
Trustees’ and Chief Compliance Officer’s fees | 967 | |||
Printing and mailing costs | 21,033 | |||
Transfer agent fees | 6,660 | |||
Other | 11,742 | |||
|
| |||
Total expenses | 696,477 | |||
|
| |||
Less amounts waived | (7,242 | ) | ||
|
| |||
Net expenses | 689,235 | |||
|
| |||
Net investment income (loss) | 864,727 | |||
|
| |||
REALIZED/UNREALIZED GAINS (LOSSES): | ||||
Net realized gain (loss) on transactions from: | ||||
Investments in non-affiliates | 14,628,349 | |||
Futures | 10,003 | |||
|
| |||
Net realized gains (losses) | 14,638,352 | |||
|
| |||
Change in net unrealized appreciation/depreciation of investments in non-affiliates | 11,045,456 | |||
|
| |||
Net realized/unrealized gains (losses) | 25,683,808 | |||
|
| |||
Change in net assets resulting from operations | $ | 26,548,535 | ||
|
| |||
SEE NOTES TO FINANCIAL STATEMENTS.
| 10 | JPMORGAN INSURANCE TRUST | DECEMBER 31, 2013 | ||||
Table of Contents
STATEMENTS OF CHANGES IN NET ASSETS
FOR THE PERIODS INDICATED
| U.S. Equity Portfolio | ||||||||
| Year Ended 12/31/2013 | Year Ended 12/31/2012 | |||||||
CHANGE IN NET ASSETS RESULTING FROM OPERATIONS: | ||||||||
Net investment income (loss) | $ | 864,727 | $ | 1,105,544 | ||||
Net realized gain (loss) | 14,638,352 | 6,884,767 | ||||||
Change in net unrealized appreciation/depreciation | 11,045,456 | 4,991,571 | ||||||
|
|
|
| |||||
Change in net assets resulting from operations | 26,548,535 | 12,981,882 | ||||||
|
|
|
| |||||
DISTRIBUTIONS TO SHAREHOLDERS: | ||||||||
Class 1 | ||||||||
From net investment income | (1,052,526 | ) | (1,180,771 | ) | ||||
Class 2 | ||||||||
From net investment income | (48,143 | ) | (6,619 | ) | ||||
|
|
|
| |||||
Total distributions to shareholders | (1,100,669 | ) | (1,187,390 | ) | ||||
|
|
|
| |||||
CAPITAL TRANSACTIONS: | ||||||||
Change in net assets resulting from capital transactions | (9,581,704 | ) | (12,575,245 | ) | ||||
|
|
|
| |||||
NET ASSETS: | ||||||||
Change in net assets | 15,866,162 | (780,753 | ) | |||||
Beginning of period | 77,143,651 | 77,924,404 | ||||||
|
|
|
| |||||
End of period | $ | 93,009,813 | $ | 77,143,651 | ||||
|
|
|
| |||||
Accumulated undistributed net investment income | $ | 863,588 | $ | 1,099,051 | ||||
|
|
|
| |||||
CAPITAL TRANSACTIONS: | ||||||||
Class 1 | ||||||||
Proceeds from shares issued | $ | 2,543,616 | $ | 4,403,061 | ||||
Distributions reinvested | 1,052,526 | 1,180,771 | ||||||
Cost of shares redeemed | (16,291,346 | ) | (19,321,461 | ) | ||||
|
|
|
| |||||
Change in net assets resulting from Class 1 capital transactions | $ | (12,695,204 | ) | $ | (13,737,629 | ) | ||
|
|
|
| |||||
Class 2 | ||||||||
Proceeds from shares issued | $ | 6,820,537 | $ | 2,637,685 | ||||
Distributions reinvested | 48,143 | 6,619 | ||||||
Cost of shares redeemed | (3,755,180 | ) | (1,481,920 | ) | ||||
|
|
|
| |||||
Change in net assets resulting from Class 2 capital transactions | $ | 3,113,500 | $ | 1,162,384 | ||||
|
|
|
| |||||
Total change in net assets resulting from capital transactions | $ | (9,581,704 | ) | $ | (12,575,245 | ) | ||
|
|
|
| |||||
SHARE TRANSACTIONS: | ||||||||
Class 1 | ||||||||
Issued | 123,990 | 266,533 | ||||||
Reinvested | 54,705 | 71,389 | ||||||
Redeemed | (797,599 | ) | (1,146,973 | ) | ||||
|
|
|
| |||||
Change in Class 1 Shares | (618,904 | ) | (809,051 | ) | ||||
|
|
|
| |||||
Class 2 | ||||||||
Issued | 339,617 | 152,326 | ||||||
Reinvested | 2,517 | 401 | ||||||
Redeemed | (173,975 | ) | (86,904 | ) | ||||
|
|
|
| |||||
Change in Class 2 Shares | 168,159 | 65,823 | ||||||
|
|
|
| |||||
SEE NOTES TO FINANCIAL STATEMENTS.
| DECEMBER 31, 2013 | JPMORGAN INSURANCE TRUST | 11 | ||||||
Table of Contents
FOR THE PERIODS INDICATED
| Per share operating performance | ||||||||||||||||||||
| Investment operations | Distributions | |||||||||||||||||||
| Net asset value, beginning of period | Net investment income (loss) | Net realized and unrealized gains (losses) on investments | Total from investment operations | Net investment income | ||||||||||||||||
U.S. Equity Portfolio | ||||||||||||||||||||
Class 1 | ||||||||||||||||||||
Year Ended December 31, 2013 | $ | 17.63 | $ | 0.21 | (d) | $ | 6.13 | $ | 6.34 | $ | (0.26 | ) | ||||||||
Year Ended December 31, 2012 | 15.22 | 0.23 | (d) | 2.43 | 2.66 | (0.25 | ) | |||||||||||||
Year Ended December 31, 2011 | 15.69 | 0.18 | (d) | (0.46 | ) | (0.28 | ) | (0.19 | ) | |||||||||||
Year Ended December 31, 2010 | 13.93 | 0.16 | (d) | 1.73 | 1.89 | (0.13 | ) | |||||||||||||
Year Ended December 31, 2009 | 10.74 | 0.19 | 3.32 | 3.51 | (0.32 | ) | ||||||||||||||
Class 2 | ||||||||||||||||||||
Year Ended December 31, 2013 | 17.54 | 0.16 | (d) | 6.08 | 6.24 | (0.25 | ) | |||||||||||||
Year Ended December 31, 2012 | 15.18 | 0.22 | (d) | 2.39 | 2.61 | (0.25 | ) | |||||||||||||
Year Ended December 31, 2011 | 15.65 | 0.14 | (d) | (0.46 | ) | (0.32 | ) | (0.15 | ) | |||||||||||
Year Ended December 31, 2010 | 13.91 | 0.12 | (d) | 1.72 | 1.84 | (0.10 | ) | |||||||||||||
Year Ended December 31, 2009 | 10.71 | 0.13 | 3.35 | 3.48 | (0.28 | ) | ||||||||||||||
| (a) | Includes adjustments in accordance with accounting principles generally accepted in the United States of America and as such, the net asset values for financial reporting purposes and the returns based upon those net asset values may differ from the net asset values and returns for shareholder transactions. |
| (b) | Includes earnings credits and interest expense, if applicable, each of which is less than 0.01% unless otherwise noted. |
| (c) | Portfolio turnover is calculated by dividing the lesser of total purchases or sales of portfolio securities for the reporting period by the monthly average value of portfolio securities owned during the reporting period. Excluded from both the numerator and denominator are amounts relating to derivatives and securities whose maturities or expiration dates at the time of acquisition were one year or less. |
| (d) | Calculated based upon average shares outstanding. |
SEE NOTES TO FINANCIAL STATEMENTS.
| 12 | JPMORGAN INSURANCE TRUST | DECEMBER 31, 2013 | ||||
Table of Contents
| Ratios/Supplemental data | |||||||||||||||||||||||||
| Ratios to average net assets | ||||||||||||||||||||||||||
| Net asset value, end of period | Total return (a) | Net assets, end of period | Net expenses (b) | Net investment income (loss) | Expenses without waivers, reimbursements and earnings credits | Portfolio turnover rate (c) | ||||||||||||||||||||
| $ | 23.71 | 36.29 | % | $ | 87,386,499 | 0.79 | % | 1.02 | % | 0.80 | % | 80 | % | |||||||||||||
| 17.63 | 17.58 | 75,900,979 | 0.79 | 1.40 | 0.81 | 71 | ||||||||||||||||||||
| 15.22 | (1.87 | ) | 77,847,972 | 0.79 | 1.15 | 0.79 | 70 | |||||||||||||||||||
| 15.69 | 13.58 | 132,548,805 | 0.79 | 1.10 | 0.82 | 75 | ||||||||||||||||||||
| 13.93 | 33.68 | 150,671,602 | 0.80 | 1.45 | 0.91 | 88 | ||||||||||||||||||||
| 23.53 | 35.90 | 5,623,314 | 1.02 | 0.77 | 1.04 | 80 | ||||||||||||||||||||
| 17.54 | 17.28 | 1,242,672 | 1.01 | 1.27 | 1.05 | 71 | ||||||||||||||||||||
| 15.18 | (2.09 | ) | 76,432 | 1.04 | 0.94 | 1.05 | 70 | |||||||||||||||||||
| 15.65 | 13.28 | 18,015 | 1.04 | 0.86 | 1.07 | 75 | ||||||||||||||||||||
| 13.91 | 33.34 | 15,902 | 1.05 | 1.21 | 1.17 | 88 | ||||||||||||||||||||
SEE NOTES TO FINANCIAL STATEMENTS.
| DECEMBER 31, 2013 | JPMORGAN INSURANCE TRUST | 13 | ||||||
Table of Contents
AS OF DECEMBER 31, 2013
1. Organization
JPMorgan Insurance Trust (the “Trust”) is registered under the Investment Company Act of 1940, as amended (the “1940 Act”), as an open-end management investment company and is a Massachusetts business trust.
The following is a separate Portfolio of the Trust (the “Portfolio”) covered by this report:
| Classes Offered | Diversified/Non-Diversified | |||
| U.S. Equity Portfolio | Class 1 and Class 2 | Diversified |
The investment objective of the Portfolio is to seek to provide high total return from a portfolio of selected equity securities.
Portfolio shares are offered only to separate accounts of participating insurance companies and Eligible Plans. Individuals may not purchase shares directly from the Portfolio.
All classes of shares have equal rights as to earnings, assets and voting privileges, except that each class may bear different distribution and service fees and each class has exclusive voting rights with respect to its distribution plan and administrative services plan.
2. Significant Accounting Policies
The following is a summary of significant accounting policies followed by the Portfolio in the preparation of its financial statements. The policies are in accordance with accounting principles generally accepted in the United States of America (“GAAP”). The preparation of financial statements requires management to make estimates and assumptions that affect the reported amounts and disclosures in the financial statements. Actual results could differ from those estimates.
A. Valuation of Investments — Equity securities listed on a North American, Central American, South American or Caribbean securities exchange shall generally be valued at the last sale price on the exchange on which the security is principally traded that is reported before the time when the net assets of the Portfolio are valued. Securities listed on the NASDAQ Stock Market LLC are generally valued at the NASDAQ Official Closing Price. Generally, short-term investments of sufficient credit quality maturing in less than 61 days are valued at amortized cost, which approximates fair value. Investments in open-end investment companies are valued at each investment company’s net asset value per share (“NAV”) as of the report date.
Certain investments of the Portfolio may, depending upon market conditions, trade in relatively thin markets and/or in markets that experience significant volatility. As a result of these conditions, the prices used by the Portfolio to value these securities may differ from the value that would be realized if these securities were sold, and the differences could be material. Futures and options are generally valued on the basis of available market quotations. Swaps and other derivatives are valued daily, primarily using independent or affiliated pricing services approved by the Board of Trustees. If valuations are not available from such pricing services or values received are deemed not representative of fair value, values will be obtained from a third party broker-dealer or counterparty.
Securities or other assets for which market quotations are not readily available or for which market quotations are deemed to not represent the fair value of the security or asset at the time of pricing (including certain illiquid securities) are fair valued in accordance with procedures established by and under the supervision and responsibility of the Board of Trustees. The Board of Trustees has established an Audit and Valuation Committee to assist with the oversight of the valuation of the Portfolio’s securities. JPMorgan Funds Management, Inc. (the “Administrator” or “JPMFM”) has established a Valuation Committee (“VC”) that is comprised of senior representatives from JPMFM, J.P. Morgan Investment Management Inc. (the “Adviser” or “JPMIM”), and J.P. Morgan Asset Management’s Legal, Compliance and Risk Management groups and the Portfolio’s Chief Compliance Officer. The VC’s responsibilities include making determinations regarding Level 3 fair value measurements (“Fair Values”) and/or providing recommendations for approval to the Board of Trustees’ Audit and Valuation Committee, in accordance with the Portfolio’s valuation policies.
The VC or Board of Trustees, as applicable, primarily employs a market-based approach which may use related or comparable assets or liabilities, recent transactions, market multiples, book values, and other relevant information for the investment to determine the fair value of the investment. The VC or Board of Trustees may also use an income-based valuation approach in which the anticipated future cash flows of the investment are discounted to calculate fair value. Discounts may also be applied due to the nature or duration of any restrictions on the disposition of the investments. Valuations may be based upon current market prices of securities that are comparable in coupon, rating, maturity and industry.
It is possible that the estimated values may differ significantly from the values that would have been used had a ready market for the investments existed, and such differences could be material. JPMFM and JPMIM are responsible for monitoring developments that may impact Fair Values and for discussing and assessing Fair Values on an ongoing, and at least a quarterly, basis with the VC and Board of Trustees, as applicable. The appropriateness of Fair Values is assessed based on results of unchanged price review and consideration of macro or security specific events, back testing, and broker and vendor due diligence.
Valuations reflected in this report are as of the report date. As a result, changes in valuation due to market events and/or issuer related events after the report date and prior to issuance of the report, are not reflected herein.
| 14 | JPMORGAN INSURANCE TRUST | DECEMBER 31, 2013 | ||||
Table of Contents
The various inputs that are used in determining the fair value of the Portfolio’s investments are summarized into the three broad levels listed below.
| Ÿ | Level 1 — quoted prices in active markets for identical securities |
| Ÿ | Level 2 — other significant observable inputs (including quoted prices for similar securities, interest rates, prepayment speeds, credit risk, etc.) |
| Ÿ | Level 3 — significant unobservable inputs (including the Portfolio’s own assumptions in determining the fair value of investments) |
A financial instrument’s level within the fair value hierarchy is based on the lowest level of any input, both individually and in the aggregate, that is significant to the fair value measurement. The inputs or methodology used for valuing securities are not necessarily an indication of the risk associated with investing in those securities.
The following table represents each valuation input as presented on the Schedule of Portfolio Investments (“SOI”):
| Level 1 Quoted prices | Level 2 Other significant observable inputs | Level 3 Significant unobservable inputs | Total | |||||||||||||
Total Investments in Securities (a) | $ | 93,066,422 | $ | — | $ | — | $ | 93,066,422 | ||||||||
|
|
|
|
|
|
|
| |||||||||
| (a) | All Portfolio holdings designated as Level 1 are disclosed individually on the SOI. Please refer to the SOI for industry specifics of portfolio holdings. |
There were no transfers among any levels during the year ended December 31, 2013.
B. Futures Contracts — The Portfolio uses index futures contracts to gain or reduce exposure to the stock market, maintain liquidity and minimize transaction costs. The Portfolio also buys futures contracts to immediately invest incoming cash in the market or sells futures in response to cash outflows, thereby simulating an invested position in the underlying index while maintaining a cash balance for liquidity. The use of futures contracts exposes the Portfolio to equity price risk.
Futures contracts provide for the delayed delivery of the underlying instrument at a fixed price or are settled for a cash amount based on the change in the value of the underlying instrument at a specific date in the future. Upon entering into a futures contract, the Portfolio is required to deposit with the broker, cash or securities in an amount equal to a certain percentage of the contract amount, which is referred to as the initial margin deposit. Subsequent payments, referred to as variation margin, are made or received by the Portfolio periodically and are based on changes in the market value of open futures contracts. Changes in the market value of open futures contracts are recorded as change in net unrealized appreciation (depreciation) in the Statement of Operations. Realized gains or losses, representing the difference between the value of the contract at the time it was opened and the value at the time it was closed, are reported in the Statement of Operations at the closing or expiration of the futures contract. Securities deposited as initial margin are designated in the SOI and cash deposited is recorded on the Statement of Assets and Liabilities. A receivable from and/or a payable to brokers for the daily variation margin is also recorded on the Statement of Assets and Liabilities.
The Portfolio may be subject to the risk that the change in the value of the futures contract may not correlate perfectly with the underlying instrument. Use of long futures contracts subjects the Portfolio to risk of loss in excess of the amounts shown on the Statement of Assets and Liabilities, up to the notional amount of the futures contracts. Use of short futures contracts subjects the Portfolio to unlimited risk of loss. The Portfolio may enter into futures contracts only on exchanges or boards of trade. The exchange or board of trade acts as the counterparty to each futures transaction; therefore, the Portfolio’s credit risk is limited to failure of the exchange or board of trade. Under some circumstances, futures exchanges may establish daily limits on the amount that the price of a futures contract can vary from the previous day’s settlement price, which could effectively prevent liquidation of positions.
The table below discloses the volume of the Portfolio’s futures contracts activity during the year ended December 31, 2013:
Futures Contracts: | ||||
Average Notional Balance Long | $ | 127,876 | ||
Ending Notional Balance Long | — |
The Portfolio’s futures contracts are not subject to master netting arrangements.
C. Security Transactions and Investment Income — Investment transactions are accounted for on the trade date (the date the order to buy or sell is executed). Securities gains and losses are calculated on a specifically identified cost basis. Interest income is determined on the basis of coupon interest accrued using the effective interest method which adjusts for amortization of premiums and accretion of discounts. Dividend income, net of foreign taxes withheld, if any, is recorded on the ex-dividend date or when the Portfolio first learns of the dividend.
To the extent such information is publicly available, the Portfolio records distributions received in excess of income earned from underlying investments as a reduction of cost of investments and/or realized gain. Such amounts are based on estimates if actual amounts are not available and actual amounts of income, realized gain and return of capital may differ from the estimated amounts. The Portfolio adjusts the estimated amounts of the components of distributions (and consequently its net investment income) as necessary once the issuers provide information about the actual composition of the distributions.
D. Allocation of Income and Expenses — Expenses directly attributable to a portfolio are charged directly to that portfolio, while the expenses attributable to more than one portfolio of the Trust are allocated among the respective portfolios. In calculating the NAV of each class, investment
| DECEMBER 31, 2013 | JPMORGAN INSURANCE TRUST | 15 | ||||||
Table of Contents
NOTES TO FINANCIAL STATEMENTS
AS OF DECEMBER 31, 2013 (continued)
income, realized and unrealized gains and losses and expenses, other than class specific expenses, are allocated daily to each class of shares based upon the proportion of net assets of each class at the beginning of each day.
E. Federal Income Taxes — The Portfolio is treated as a separate taxable entity for Federal income tax purposes. The Portfolio’s policy is to comply with the provisions of the Internal Revenue Code of 1986, as amended (the “Code”), applicable to regulated investment companies and to distribute to shareholders all of its distributable net investment income and net realized capital gains on investments. Accordingly, no provision for Federal income tax is necessary. The Portfolio is also a segregated portfolio of assets for insurance purposes and intends to comply with the diversification requirements of Subchapter L of the Code. Management has reviewed the Portfolio’s tax positions for all open tax years and has determined that as of December 31, 2013, no liability for income tax is required in the Portfolio’s financial statements for net unrecognized tax benefits. However, management’s conclusions may be subject to future review based on changes in, or the interpretation of, the accounting standards or tax laws and regulations. The Portfolio’s Federal tax returns for the prior three fiscal years remain subject to examination by the Internal Revenue Service.
F. Distributions to Shareholders — Distributions from net investment income are generally declared and paid at least annually and are declared separately for each class. No class has preferential dividend rights; differences in per share rates are due to differences in separate class expenses. Net realized capital gains, if any, are distributed at least annually. The amount of distributions from net investment income and net realized capital gains is determined in accordance with Federal income tax regulations, which may differ from GAAP. To the extent these “book/tax” differences are permanent in nature (i.e., that they result from other than timing of recognition — “temporary differences”), such amounts are reclassified within the capital accounts based on their Federal tax-basis treatment.
The following amounts were reclassified within the capital accounts:
| Paid-in-Capital | Accumulated undistributed net investment income | Accumulated net realized gains (losses) | ||||||||||
| $ | (1 | ) | $ | 479 | $ | (478 | ) | |||||
The reclassifications for the Portfolio relate primarily to non-taxable dividends.
3. Fees and Other Transactions with Affiliates
A. Investment Advisory Fee — Pursuant to the Investment Advisory Agreement, the Adviser, an indirect, wholly-owned subsidiary of JPMorgan Chase & Co. (“JPMorgan”), supervises the investments of the Portfolio and for such services is paid a fee. The fee is accrued daily and paid monthly based on the Portfolio’s average daily net assets at an annual rate of 0.55%.
B. Administration Fee — Pursuant to an Administration Agreement, the Administrator, an indirect, wholly-owned subsidiary of JPMorgan, provides certain administration services to the Portfolio. In consideration of these services, the Administrator receives a fee accrued daily and paid monthly at an annual rate of 0.15% of the first $25 billion of the average daily net assets of all funds in the J.P. Morgan Funds Complex covered by the Administration Agreement (excluding certain funds of funds and money market funds) and 0.075% of the average daily net assets in excess of $25 billion of all such funds. For the year ended December 31, 2013, the effective rate was 0.08% of the Portfolio’s average daily net assets, notwithstanding any fee waivers and/or expense reimbursements.
JPMorgan Chase Bank, N.A. (“JPMCB”), a wholly-owned subsidiary of JPMorgan, serves as the Portfolio’s sub-administrator (the “Sub-administrator”). For its services as Sub-administrator, JPMCB receives a portion of the fees payable to the Administrator.
The Administrator waived Administration fees as outlined in Note 3.E.
C. Distribution Fees — Pursuant to a Distribution Agreement, JPMorgan Distribution Services, Inc. (the “Distributor”), a wholly-owned subsidiary of JPMorgan, serves as the Trust’s exclusive underwriter and promotes and arranges for the sale of the Portfolio’s shares.
The Board of Trustees has adopted a Distribution Plan (the “Distribution Plan”) for Class 2 Shares of the Portfolio in accordance with Rule 12b-1 under the 1940 Act. The Distribution Plan provides that the Portfolio shall pay distribution fees, including payments to the Distributor, at an annual rate of 0.25% of the average daily net assets of Class 2 Shares.
D. Custodian and Accounting Fees — JPMCB provides portfolio custody and accounting services to the Portfolio. The amounts paid directly to JPMCB by the Portfolio for custody and accounting services are included in Custodian and accounting fees in the Statement of Operations. Payments to the custodian may be reduced by credits earned by the Portfolio, based on uninvested cash balances held by the custodian. Such earnings credits, if any, are presented separately in the Statement of Operations.
Interest expense, if any, paid to the custodian related to cash overdrafts is included in Interest expense to affiliates in the Statement of Operations.
E. Waivers and Reimbursements — The Adviser, Administrator (for all share classes) and Distributor (for Class 2 Shares) have contractually agreed to waive fees and/or reimburse the Portfolio to the extent that total annual operating expenses (excluding acquired fund fees and expenses, dividend expenses related to short sales, interest, taxes, expenses related to litigation and potential litigation, extraordinary expenses and expenses related to the Board of Trustees’ deferred compensation plan) exceed the percentages of the Portfolio’s respective average daily net assets as shown in the table below:
| Class 1 | Class 2 | |||||||
| 0.80 | % | 1.05 | % | |||||
| 16 | JPMORGAN INSURANCE TRUST | DECEMBER 31, 2013 | ||||
Table of Contents
The expense limitation agreement was in effect for the year ended December 31, 2013. The contractual expense limitation percentages in the table above are in place until at least April 30, 2014.
For the year ended December 31, 2013, the Portfolio’s service providers waived fees for the Portfolio as follows. None of these parties expect the Portfolio to repay any such waived fees in future years.
| Contractual Waivers | ||||||||
| Administration | Total | |||||||
| $ | 5,309 | $ | 5,309 | |||||
| Voluntary Waivers | ||||||||
| Investment Advisory | Total | |||||||
| $ | 33 | $ | 33 | |||||
Additionally, the Portfolio may invest in one or more money market funds advised by the Adviser or its affiliates. The Adviser, Administrator and the Distributor waive fees in an amount sufficient to offset the respective fees each charges to the affiliated money market fund on the Portfolio’s investment in such affiliated money market fund. A portion of the waiver is voluntary.
The amount of waivers resulting from investments in these money market funds for the year ended December 31, 2013 was $1,900.
F. Other — Certain officers of the Trust are affiliated with the Adviser, the Administrator and the Distributor. Such officers, with the exception of the Chief Compliance Officer, receive no compensation from the Portfolio for serving in their respective roles.
The Board of Trustees appointed a Chief Compliance Officer to the Portfolio in accordance with Federal securities regulations. The Portfolio, along with other affiliated portfolios, makes reimbursement payments, on a pro-rata basis, to the Administrator for a portion of the fees associated with the Office of the Chief Compliance Officer. Such fees are included in Trustees’ and Chief Compliance Officer’s fees in the Statement of Operations.
The Trust adopted a Trustee Deferred Compensation Plan (the “Plan”) which allows the Independent Trustees to defer the receipt of all or a portion of compensation related to performance of their duties as Trustees. The deferred fees are invested in various J.P. Morgan Funds until distribution in accordance with the Plan.
During the year ended December 31, 2013, the Portfolio may have purchased securities from an underwriting syndicate in which the principal underwriter or members of the syndicate are affiliated with the Adviser.
The Portfolio may use related party broker-dealers. For the year ended December 31, 2013, the Portfolio did not incur any brokerage commissions with broker-dealers affiliated with the Adviser.
The Securities and Exchange Commission has granted an exemptive order permitting the Portfolio to engage in principal transactions with J.P. Morgan Securities, Inc., an affiliated broker, involving taxable money market instruments, subject to certain conditions.
4. Investment Transactions
During the year ended December 31, 2013, purchases and sales of investments (excluding short-term investments) were as follows:
| Purchases (excluding U.S. Government) | Sales (excluding U.S. Government) | |||||||
| $ | 67,244,869 | $ | 77,441,892 | |||||
During the year ended December 31, 2013, there were no purchases or sales of U.S. Government securities.
5. Federal Income Tax Matters
For Federal income tax purposes, the cost and unrealized appreciation (depreciation) in value of investment securities held at December 31, 2013 were as follows:
| Aggregate Cost | Gross Unrealized Appreciation | Gross Unrealized Depreciation | Net Unrealized Appreciation (Depreciation) | |||||||||||||
| $ | 75,339,108 | $ | 17,851,964 | $ | 124,650 | $ | 17,727,314 | |||||||||
The difference between book and tax basis appreciation (depreciation) on investments is primarily attributed to wash sale loss deferrals.
| DECEMBER 31, 2013 | JPMORGAN INSURANCE TRUST | 17 | ||||||
Table of Contents
NOTES TO FINANCIAL STATEMENTS
AS OF DECEMBER 31, 2013 (continued)
The tax character of distributions paid during the year ended December 31, 2013 was as follows:
| Total Distributions Paid From: | ||||||||
| Ordinary Income | Total Distributions Paid | |||||||
| $ | 1,100,669 | $ | 1,100,669 | |||||
The tax character of distributions paid during the year ended December 31, 2012 was as follows:
| Total Distributions Paid From: | ||||||||
Ordinary Income | Total Distributions Paid | |||||||
| $ | 1,187,390 | $ | 1,187,390 | |||||
As of December 31, 2013, the components of net assets (excluding paid-in-capital) on a tax basis were as follows:
Current Distributable Ordinary Income | Current Distributable Long-Term Capital Gain or (Tax Basis Capital Loss Carryover) | Unrealized Appreciation (Depreciation) | ||||||||||
| $ | 867,655 | $ | (9,157,629 | ) | $ | 17,727,314 | ||||||
The cumulative timing differences primarily consist of wash sale loss deferrals.
Under the Regulated Investment Company Modernization Act of 2010 (the “Act”), net capital losses recognized by the Portfolio after December 31, 2010 are carried forward indefinitely, and retain their character as short-term and/or long-term losses. Prior to the Act, net capital losses incurred by the Portfolio were carried forward for eight years and treated as short-term losses. The Act requires that post-enactment net capital losses be used before pre-enactment net capital losses.
As of December 31, 2013, the Portfolio did not have any post-enactment net capital loss carryforwards.
As of December 31, 2013, the Portfolio had pre-enactment net capital loss carryforwards, expiring during the year indicated, which are available to offset future realized gains:
| 2017 | ||||
| $ | 9,157,629 | |||
During the year ended December 31, 2013, the Portfolio utilized capital loss carryforwards of $13,245,969.
6. Borrowings
The Trust and JPMCB have entered into a financing arrangement. Under this arrangement, JPMCB provides an unsecured, uncommitted credit facility in the aggregate amount of $100 million to certain of the J.P. Morgan Funds, including the Portfolio. Advances under the arrangement are taken primarily for temporary or emergency purposes, including the meeting of redemption requests that otherwise might require the untimely disposition of securities, and are subject to the Portfolio’s borrowing restrictions. Interest on borrowings is payable at a rate determined by JPMCB at the time of borrowing. This agreement has been extended until November 10, 2014.
The Portfolio had no borrowings outstanding from the unsecured, uncommitted credit facility at December 31, 2013, or at any time during the year then ended.
Interest expense paid, if any, as a result of borrowings from the unsecured, uncommitted credit facility is included in Interest expense to affiliates in the Statement of Operations.
7. Risks, Concentrations and Indemnifications
In the normal course of business, the Portfolio enters into contracts that contain a variety of representations which provide general indemnifications. The Portfolio’s maximum exposure under these arrangements is unknown. The amount of exposure would depend on future claims that may be made against the Portfolio that have not yet occurred. However, based on experience, the Portfolio expects the risk of loss to be remote.
The Portfolio has several shareholders holding a significant percentage of shares outstanding. Investment activities of these shareholders could have a material impact on the Portfolio.
| 18 | JPMORGAN INSURANCE TRUST | DECEMBER 31, 2013 | ||||
Table of Contents
REPORT OF INDEPENDENT REGISTERED PUBLIC ACCOUNTING FIRM
To the Board of Trustees of JPMorgan Insurance Trust and the Shareholders of JPMorgan Insurance Trust U.S. Equity Portfolio:
In our opinion, the accompanying statement of assets and liabilities, including the schedule of portfolio investments, and the related statements of operations and of changes in net assets and the financial highlights present fairly, in all material respects, the financial position of JPMorgan Insurance Trust U.S. Equity Portfolio (a separate Portfolio of JPMorgan Insurance Trust) (hereafter referred to as the “Portfolio”) at December 31, 2013, the results of its operations for the year then ended, the changes in its net assets for each of the two years in the period then ended and the financial highlights for each of the five years in the period then ended, in conformity with accounting principles generally accepted in the United States of America. These financial statements and financial highlights (hereafter referred to as “financial statements”) are the responsibility of the Portfolio’s management. Our responsibility is to express an opinion on these financial statements based on our audits. We conducted our audits of these financial statements in accordance with the standards of the Public Company Accounting Oversight Board (United States). Those standards require that we plan and perform the audit to obtain reasonable assurance about whether the financial statements are free of material misstatement. An audit includes examining, on a test basis, evidence supporting the amounts and disclosures in the financial statements, assessing the accounting principles used and significant estimates made by management, and evaluating the overall financial statement presentation. We believe that our audits, which included confirmation of securities at December 31, 2013 by correspondence with the custodian and brokers, provide a reasonable basis for our opinion.
PricewaterhouseCoopers LLP
New York, New York
February 21, 2014
| DECEMBER 31, 2013 | JPMORGAN INSURANCE TRUST | 19 | ||||||
Table of Contents
(Unaudited)
The Portfolio’s Statement of Additional Information includes additional information about the Portfolio’s Trustees and is available, without charge, upon request by calling 1-800-480-4111 or on the J.P. Morgan Funds’ website at www.jpmorganfunds.com.
Name (Year of Birth); Positions With the Portfolio (1) | Principal Occupations During Past 5 Years | Number of Portfolios in Fund Complex Overseen by Trustee (2) | Other Directorships Held Outside Fund Complex During Past 5 Years | |||
Independent Trustees | ||||||
| John F. Finn (1947); Trustee of Trust since 2005; Trustee of heritage One Group Mutual Funds since 1998. | Chairman (1985-present), President and Chief Executive Officer, Gardner, Inc. (supply chain management company serving industrial and consumer markets) (1974-present). | 170 | Director, Cardinal Health, Inc. (CAH) (1994-present); Director, Greif, Inc. (GEF) (industrial package products and services) (2007-present); Trustee, Columbus Association for the Performing Arts. | |||
| Dr. Matthew Goldstein (1941); Chairman since 2013; Trustee of Trust since 2005; Trustee of heritage J.P. Morgan Funds since 2003. | Professor, City University of New York (effective 7/1/13); Chancellor, City University of New York (1999-2013); President, Adelphi University (New York) (1998-1999). | 170 | Trustee, Museum of Jewish Heritage (2011-present). | |||
| Robert J. Higgins (1945); Trustee of Trust since 2005; Trustee of heritage J.P. Morgan Funds since 2002. | Retired; Director of Administration of the State of Rhode Island (2003-2004); President — Consumer Banking and Investment Services, Fleet Boston Financial (1971-2001). | 170 | None | |||
| Peter C. Marshall (1942); Trustee of Trust since 2005; Trustee of heritage One Group Mutual Funds since 1985. | Self-employed business consultant (2002-present). | 170 | None | |||
| Mary E. Martinez (1960); Trustee of Trust since 2013. | Associate, Special Properties, a Christie’s International Real Estate Affiliate (2010-Present); Managing Director, Bank of America (Asset Management) (2007-2008); Chief Operating Officer, U.S. Trust Asset Management; U.S. Trust Company (asset management) (2003-2007); President, Excelsior Funds (registered investment companies) (2004-2005). | 170 | None | |||
| Marilyn McCoy* (1948); Trustee of Trust since 2005; Trustee of heritage One Group Mutual Funds since 1999. | Vice President of Administration and Planning, Northwestern University (1985-present). | 170 | Trustee, Carleton College (2003-present). | |||
| Mitchell M. Merin (1953); Trustee of Trust since 2013. | Retired (2005-Present); President and Chief Operating Officer, Morgan Stanley Investment Management, Member Morgan Stanley & Co. Management Committee (registered investment adviser) (1998-2005). | 170 | Director, Sun Life Financial (SLF) (2007 to Present) (financial services and insurance); Trustee, Trinity College, Hartford, CT (2002-2010). | |||
| William G. Morton, Jr. (1937); Trustee of Trust since 2005; Trustee of heritage J.P. Morgan Funds since 2003. | Retired; Chairman Emeritus (2001-2002), and Chairman and Chief Executive Officer, Boston Stock Exchange (1985-2001). | 170 | Director, Radio Shack Corp. (1987-2008); Director, National Organization of Investment Professionals; Trustee of the Stratton Mountain School (2001-present). | |||
| Dr. Robert A. Oden, Jr. (1946); Trustee of Trust since 2005; Trustee of heritage One Group Mutual Funds since 1997. | Retired; President, Carleton College (2002-2010); President, Kenyon College (1995-2002). | 170 | Trustee, American University in Cairo (1999-present); Chairman, Dartmouth-Hitchcock Medical Center (2011-present); Trustee, American Schools of Oriental Research (2011-present); Trustee, American Museum of Fly Fishing. | |||
| 20 | JPMORGAN INSURANCE TRUST | DECEMBER 31, 2013 | ||||
Table of Contents
Name (Year of Birth); Positions With the Portfolio (1) | Principal Occupations During Past 5 Years | Number of Complex Overseen by Trustee (2) | Other Directorships Held Outside Fund Complex During Past 5 Years | |||
Independent Trustees (continued) | ||||||
| Marian U. Pardo** (1946); Trustee of Trust since 2013. | Managing Director and Founder, Virtual Capital Management LLC (Investment Consulting) (2007-present); Managing Director, Credit Suisse Asset Management (portfolio manager) (2003-2006). | 170 | Member, Board of Governors, Columbus Citizens Foundation (not-for-profit supporting philanthropic and cultural programs) (2006-present). | |||
| Frederick W. Ruebeck (1939); Trustee of Trust since 2005; Trustee of heritage One Group Mutual Funds since 1994. | Consultant (2000-present); Adviser, JP Greene & Associates, LLC (broker-dealer) (2000-2009); Chief Investment Officer, Wabash College (2004-present); Director of Investments, Eli Lilly and Company (pharmaceuticals) (1988-1999). | 170 | Trustee, Wabash College (1988-present); Chairman, Indianapolis Symphony Orchestra Foundation (1994-present). | |||
| James J. Schonbachler (1943); Trustee of Trust since 2005; Trustee of heritage J.P. Morgan Funds since 2001. | Retired; Managing Director of Bankers Trust Company (financial services) (1968-1998). | 170 | None | |||
Interested Trustee Not Affiliated With the Adviser | ||||||
| Frankie D. Hughes*** (1952), Trustee of Trust since 2008. | President and Chief Investment Officer, Hughes Capital Management, Inc. (fixed income asset management) (1993-present). | 170 | Trustee, The Victory Portfolios (2000-2008) (investment companies). | |||
| (1) | The Trustees serve for an indefinite term, subject to the Trust’s current retirement policy, which is age 75 for all Trustees, except that the Board has determined Mr. Morton should continue to serve until December 31, 2014. In order to fill the vacancies created by the retirement of Fergus Reid, III, William J. Armstrong, and Leonard J. Spalding Jr., effective December 31, 2012, the Board appointed Ms. Martinez and Mr. Merin to serve as Trustees effective January 1, 2013 and Ms. Pardo to serve as Trustee effective February 1, 2013. |
| (2) | A Fund Complex means two or more registered investment companies that hold themselves out to investors as related companies for purposes of investment and investor services or have a common investment adviser or have an investment adviser that is an affiliated person of the investment adviser of any of the other registered investment companies. The J.P. Morgan Funds Complex for which the Board of Trustees serves currently includes eleven registered investment companies (170 funds), including JPMorgan Mutual Fund Group which liquidated effective November 29, 2012 and is in the process of winding up its affairs. |
| * | Ms. McCoy has served as Vice President of Administration and Planning for Northwestern University since 1985. William M. Daley was the Head of Corporate Responsibility for JPMorgan Chase & Co. prior to January 2011 and served as a member of the Board of Trustees of Northwestern University from 2005 through 2010. JPMIM, the Portfolio’s investment adviser, is a wholly-owned subsidiary of JPMorgan Chase & Co. Two members of the Board of Trustees of Northwestern University are executive officers of registered investment advisers (not affiliated with JPMorgan) that are under common control with sub-advisers to certain J.P. Morgan Funds. |
| ** | In connection with prior employment with JPMorgan Chase, Ms. Pardo is the recipient of non-qualified pension plan payments from JPMorgan Chase in the amount of approximately $2,055 per month, which she irrevocably waived effective January 1, 2013, and deferred compensation payments from JPMorgan Chase in the amount of approximately $7,294 per year, which ended in January 2013. In addition, Ms. Pardo receives payments from a fully funded qualified plan, which is not an obligation of JPMorgan Chase. |
| *** | Ms. Hughes is treated as an “interested person” based on the portfolio holdings of clients of Hughes Capital Management, Inc. |
The contact address for each of the Trustees is 270 Park Avenue, New York, NY 10017.
| DECEMBER 31, 2013 | JPMORGAN INSURANCE TRUST | 21 | ||||||
Table of Contents
(Unaudited)
Name (Year of Birth), Positions Held with the Trust (Since) | Principal Occupations During Past 5 Years | |
| Robert L. Young (1963), President and Principal Executive Officer (2013)** | Chief Operating Officer and Director, J.P. Morgan Investment Management Inc. since 2010; Senior Vice President, J.P. Morgan Funds (2005-2010), Chief Operating Officer, J.P. Morgan Funds (2005-2010); Director and various officer positions for JPMorgan Funds Management, Inc. (formerly One Group Administrative Services) and JPMorgan Distribution Services, Inc. (formerly One Group Dealer Services, Inc.) from 1999 to present. Mr. Young has been with JPMorgan Chase & Co. (formerly Bank One Corporation) since 1997. | |
| Joy C. Dowd (1972), Treasurer and Principal Financial Officer (2010) | Assistant Treasurer of the Trusts from 2009 to 2010; Executive Director, JPMorgan Funds Management, Inc. from February 2011; Vice President, JPMorgan Funds Management, Inc. from December 2008 to February 2011; prior to joining JPMorgan Chase, Ms. Dowd worked in MetLife’s investments audit group from 2005 through 2008. | |
| Frank J. Nasta (1964), Secretary (2008) | Managing Director and Associate General Counsel, JPMorgan Chase since 2008; Previously, Director, Managing Director, General Counsel and Corporate Secretary, J. & W. Seligman & Co. Incorporated; Secretary of each of the investment companies of the Seligman Group of Funds and Seligman Data Corp.; Director and Corporate Secretary, Seligman Advisors, Inc. and Seligman Services, Inc. | |
| Stephen M. Ungerman (1953), Chief Compliance Officer (2005) | Managing Director, JPMorgan Chase & Co.; Mr. Ungerman has been with JPMorgan Chase & Co. since 2000. | |
| Kathryn A. Jackson (1962), AML Compliance Officer (2012)* | Vice President and AML Compliance Manager for JPMorgan Asset Management Compliance since 2011; Senior On-Boarding Specialist for JPMorgan Distribution Services, Inc. in Global Liquidity from 2008 to 2011; prior to joining JPMorgan, Ms. Jackson was a Financial Services Analyst responsible for on-boarding, compliance and training with Nationwide Securities LLC and 1717 Capital Management Company, both registered broker-dealers, from 2005 until 2008. | |
Elizabeth A. Davin (1964), Assistant Secretary (2005)** | Executive Director and Assistant General Counsel, JPMorgan Chase since February 2012; formerly Vice President and Assistant General Counsel, JPMorgan Chase from 2005 until February 2012; Senior Counsel, JPMorgan Chase (formerly Bank One Corporation) from 2004 to 2005. | |
| Jessica K. Ditullio (1962), Assistant Secretary (2005)** | Executive Director and Assistant General Counsel, JPMorgan Chase since February 2011; Ms. Ditullio has served as an attorney with various titles for JPMorgan Chase (formerly Bank One Corporation) since 1990. | |
| John T. Fitzgerald (1975), Assistant Secretary (2008) | Executive Director and Assistant General Counsel, JPMorgan Chase since February 2011; formerly, Vice President and Assistant General Counsel, JPMorgan Chase from 2005 until February 2011. | |
| Carmine Lekstutis (1980), Assistant Secretary (2011) | Vice President and Assistant General Counsel, JPMorgan Chase since 2011; Associate, Skadden, Arps, Slate, Meagher & Flom LLP (law firm) from 2006 to 2011. | |
| Gregory S. Samuels (1980), Assistant Secretary (2010) | Vice President and Assistant General Counsel, JPMorgan Chase since 2010; Associate, Ropes & Gray (law firm) from 2008 to 2010; Associate, Clifford Chance LLP (law firm) from 2005 to 2008. | |
| Pamela L. Woodley (1971), Assistant Secretary (2012) | Vice President and Assistant General Counsel, JPMorgan Chase since November 2004. | |
Michael M. D’Ambrosio (1969), Assistant Treasurer (2012) | Executive Director, JPMorgan Funds Management, Inc. from July 2012; prior to joining JPMorgan Chase, Mr. D’Ambrosio was a Tax Director at PricewaterhouseCoopers LLP since 2006. | |
| Joseph Parascondola (1963), Assistant Treasurer (2011) | Vice President, JPMorgan Funds Management, Inc. since August 2006. | |
| Matthew J. Plastina (1970), Assistant Treasurer (2011) | Vice President, JPMorgan Funds Management, Inc. since August 2010; prior to August 2010, Vice President and Controller, Legg Mason Global Asset Management. | |
Julie A. Roach (1971), Assistant Treasurer (2012)** | Vice President, JPMorgan Funds Management, Inc. from August 2012; prior to joining JPMorgan Chase, Ms. Roach was a Senior Manager with Deloitte since 2001. | |
Gillian I. Sands (1969), Assistant Treasurer (2012) | Vice President, JPMorgan Funds Management, Inc. from September 2012; Assistant Treasurer, Wells Fargo Funds Management (2007-2009). | |
The contact address for each of the officers, unless otherwise noted, is 270 Park Avenue, New York, NY 10017.
| * | The contact address for the officer is 500 Stanton Christiana Road, Ops 1, Floor 02, Newark, DE 19173-2107. |
| ** | The contact address for the officer is 460 Polaris Parkway, Westerville, OH 43082. |
| 22 | JPMORGAN INSURANCE TRUST | DECEMBER 31, 2013 | ||||
Table of Contents
SCHEDULE OF SHAREHOLDER EXPENSES
(Unaudited)
Hypothetical $1,000 Investment
As a shareholder of the Portfolio, you incur ongoing costs, including investment advisory fees, administration fees, distribution fees (for Class 2 Shares) and other Portfolio expenses. Because the Portfolio is a funding vehicle for Policies and Eligible Plans, you may also incur sales charges and other fees relating to the Policies or Eligible Plans. The examples below are intended to help you understand your ongoing costs (in dollars) of investing in the Portfolio, but not the costs of the Policies or Eligible Plans, and to compare these ongoing costs with the ongoing costs of investing in other mutual funds. The examples assume that you had a $1,000 investment in each Class at the beginning of the reporting period, July 1, 2013, and continued to hold your shares at the end of the reporting period, December 31, 2013.
Actual Expenses
For each Class of the Portfolio in the table below, the first line provides information about actual account values and actual expenses. You may use the information in this line, together with the amount you invested, to estimate the expenses that you paid over the period. Simply divide your account value by $1,000 (for example, an $8,600 account value divided by $1,000 = 8.6), then multiply the result by the number in the first line of each Class under the heading entitled “Expenses Paid During the Period” to estimate the expenses you paid on your account during this period.
Hypothetical Example for Comparison Purposes
The second line of each Class in the table below provides information about hypothetical account values and hypothetical expenses based on the Class’ actual expense ratio and an assumed rate of return of 5% per year before expenses, which is not the Class’ actual return. The hypothetical account values and expenses may not be used to estimate the actual ending account balance or expenses you paid for the period. You may use this information to compare the ongoing costs of investing in the Class of the Portfolio and other funds. To do so, compare this 5% hypothetical example with the 5% hypothetical examples that appear in the shareholder reports of the other funds. Please note that the expenses shown in the table are meant to highlight your ongoing costs only and do not reflect any transaction costs, such as sales charges (loads) or redemption fees or the costs associated with the Policies and Eligible Plans through which the Portfolio is held. Therefore, the second line for each Class in the table is useful in comparing ongoing costs only, and will not help you determine the relative total costs of owning different funds. In addition, if these transaction costs were included, your costs would have been higher. The examples also assume all dividends and distributions have been reinvested.
| Beginning Account Value July 1, 2013 | Ending Account Value December 31, 2013 | Expenses Paid During the Period* | Annualized Expense Ratio | |||||||||||||
U.S. Equity Portfolio | ||||||||||||||||
Class 1 | ||||||||||||||||
Actual | $ | 1,000.00 | $ | 1,187.90 | $ | 4.30 | 0.78 | % | ||||||||
Hypothetical | 1,000.00 | 1,021.27 | 3.97 | 0.78 | ||||||||||||
Class 2 | ||||||||||||||||
Actual | 1,000.00 | 1,186.60 | 5.68 | 1.03 | ||||||||||||
Hypothetical | 1,000.00 | 1,020.01 | 5.24 | 1.03 | ||||||||||||
| * | Expenses are equal to each Class’ respective annualized expense ratio, multiplied by the average account value over the period, multiplied by 184/365 (to reflect the one-half year period). |
| DECEMBER 31, 2013 | JPMORGAN INSURANCE TRUST | 23 | ||||||
Table of Contents
BOARD APPROVAL OF INVESTMENT ADVISORY AGREEMENT
(Unaudited)
The Board of Trustees meets regularly throughout the year and considers factors that are relevant to its annual consideration of investment advisory agreements at each meeting. The Board of Trustees has established various standing committees, composed of Trustees with diverse backgrounds, to which the Board of Trustees has assigned specific subject matter responsibilities to further enhance the effectiveness of the Board’s oversight and decision making. The Board of Trustees and its investment committees (money market and alternative products, equity, and fixed income) also meet for the specific purpose of considering advisory contract annual renewals. The Board of Trustees held meetings in person in June and August 2013, at which the Trustees considered the continuation of the investment advisory agreement for the Portfolio whose annual report is contained herein (the “Advisory Agreement”). At the June meeting, the Board’s investment committees met to review and consider performance, expense and related information for the J.P. Morgan Funds. Each investment committee reported to the full Board, which then considered the investment committee’s preliminary findings. At the August meeting, the Trustees continued their review and consideration. The Trustees, including a majority of the Trustees who are not “interested persons” (as defined in the 1940 Act) of any party to the Advisory Agreement or any of their affiliates, approved the continuation of the Advisory Agreement on August 20, 2013.
The Trustees, as part of their review of the investment advisory arrangements for the J.P. Morgan Funds, considered and reviewed performance and other information received from the Adviser on a regular basis over the course of the year, as well as information specifically prepared for their annual review. This information included the Portfolio’s performance compared to the performance of the Portfolio’s peers and benchmarks and analyses by the Adviser of the Portfolio’s performance. The Adviser also periodically provides comparative information regarding the Portfolio’s expense ratios and those of the peer groups. In addition, in preparation for the June and August meetings, the Trustees requested, received and evaluated extensive materials from the Adviser, including, with respect to the Portfolio, performance and expense information compiled by Lipper Inc. (“Lipper”), an independent provider of investment company data. Prior to voting, the Trustees reviewed the proposed approval of the Advisory Agreement with representatives of the Adviser and with counsels to the Portfolio and independent Trustees and received a memorandum from independent counsel to the Trustees discussing the legal standards for their consideration of the proposed approval. The Trustees also discussed the proposed approvals in executive sessions with counsels to the Portfolio and independent Trustees at which no representatives of the Adviser were present. Set forth below is a summary of the material factors evaluated by the Trustees in determining whether to approve the Advisory Agreement.
In their deliberations, there was a comprehensive consideration of the information received by the Trustees. Each Trustee attributed different weights to the various factors and no factor alone was considered determinative. From year to year, the Trustees consider and place emphasis on relevant information in light of changing circumstances in market and economic conditions. The Trustees determined that the compensation to be received by the Adviser from the Portfolio under the Advisory Agreement was fair and reasonable and that the continuance of the investment advisory contract was in the best interests of the Portfolio and its shareholders.
The factors summarized below were considered and discussed by the Trustees in reaching their conclusions:
Nature, Extent and Quality of Services Provided by the Adviser
The Trustees received and considered information regarding the nature, extent and quality of the services provided to the Portfolio under the Advisory Agreement. The Trustees took into account information furnished throughout the year at Trustee meetings, as well as the materials furnished specifically in connection with this annual review process. The Trustees considered the background and experience of the Adviser’s senior management and the expertise of, and the amount of attention given to the Portfolio by, investment personnel of the Adviser. In addition, the Trustees reviewed the qualifications, backgrounds and responsibilities of the portfolio management team primarily responsible for the day-to-day management of the Portfolio and the infrastructure supporting the team. The Trustees also considered information provided by the Adviser and JPMorgan Distribution Services, Inc. (“JPMDS”) about the structure and distribution strategy of the Portfolio. The Trustees also reviewed information relating to the Adviser’s risk governance model and reports showing the Adviser’s compliance structure and ongoing compliance processes. The quality of the administrative services provided by JPMorgan Funds Management, Inc. (“JPMFM”), an affiliate of the Adviser, was also considered.
The Board of Trustees also considered its knowledge of the nature and quality of the services provided by the Adviser to the Portfolio gained from their experience as Trustees of the J.P. Morgan Funds. In addition, they considered the overall reputation and capabilities of the Adviser and its affiliates, the commitment of the Adviser to provide high quality service to the Portfolio, their overall confidence in the Adviser’s integrity and the Adviser’s responsiveness to questions or concerns raised by them, including the Adviser’s willingness to consider and implement organizational and operational changes designed to improve investment results and the services provided to the Portfolio.
Based on these considerations and other factors, the Trustees concluded that they were satisfied with the nature, extent and quality of the investment advisory services provided to the Portfolio by the Adviser.
| 24 | JPMORGAN INSURANCE TRUST | DECEMBER 31, 2013 | ||||
Table of Contents
Costs of Services Provided and Profitability to the Adviser and its Affiliates
The Trustees received and considered information regarding the profitability to the Adviser and its affiliates in providing services to the Portfolio. The Trustees reviewed and discussed this data. The Trustees recognized that this data is not audited and represents the Adviser’s determination of its and its affiliates’ revenues from the contractual services provided to the Portfolio, less expenses of providing such services. Expenses include direct and indirect costs and are calculated using an allocation methodology developed by the Adviser. The Trustees also recognized that it is difficult to make comparisons of profitability from fund investment advisory contracts because comparative information is not generally publicly available and is affected by numerous factors, including the structure of the particular adviser, the types of funds it manages, its business mix, numerous assumptions regarding allocations and the fact that publicly-traded fund managers’ operating profits and net income are net of distribution and marketing expenses. Based on their review, the Trustees concluded that the profitability to the Adviser under the Advisory Agreement was not unreasonable in light of the services and benefits provided to the Portfolio.
Fall-Out Benefits
The Trustees reviewed information regarding potential “fallout” or ancillary benefits received by the Adviser and its affiliates as a result of their relationship with the Portfolio. The Board also reviewed the adviser’s allocation of fund brokerage for the J.P. Morgan Funds complex, including allocations to brokers who provide research to the adviser.
The Trustees also considered that JPMFM earns fees from the Portfolio for providing administrative services. These fees were shown separately in the profitability analysis presented to the Trustees. The Trustees also considered the payments of Rule 12b-1 fees to JPMDS, an affiliate of the Adviser, which also acts as the Portfolio’s distributor and that these fees are in turn generally paid to financial intermediaries that sell the Portfolio, including financial intermediaries that are affiliates of the Adviser. The Trustees also considered the fees paid to JPMorgan Chase Bank, N.A. (“JPMCB”) for custody and fund accounting and other related services.
Economies of Scale
The Trustees noted that the proposed investment advisory fee schedule for the Portfolio does not contain breakpoints. The Trustees considered whether it would be appropriate to add advisory fee breakpoints and the Trustees concluded that the current fee structure was reasonable in light of the fee waivers and expense limitations that the Adviser has in place that serve to limit the overall net expense ratio at competitive levels. The Trustees also recognized that the fee schedule for the administrative services provided by JPMFM does include a fee breakpoint, which is tied to the overall level of non-money market
fund assets excluding certain funds-of-funds, as applicable, advised by the Adviser, and that the Portfolio benefits from that breakpoint. The Trustees concluded that shareholders benefited from the lower expense ratios which resulted from these factors.
Independent Written Evaluation of the Portfolio’s Chief Compliance Officer
The Trustees noted that, upon their direction, the Chief Compliance Officer for the Portfolio had prepared an independent written evaluation in order to assist the Trustees in determining the reasonableness of the proposed management fees. The Trustees considered the written evaluation in determining whether to continue the Advisory Agreement.
Fees Relative to Adviser’s Other Clients
The Trustees received and considered information about the nature and extent of investment advisory services and fee rates offered to other clients of the Adviser for investment management styles substantially similar to that of the Portfolio. The Trustees also considered the complexity of investment management for the Portfolio relative to the Adviser’s other clients and the differences in the nature and extent of the services provided to the different clients. The Trustees concluded that the fee rates charged to the Portfolio in comparison to those charged to the Adviser’s other clients were reasonable.
Investment Performance
The Trustees received and considered absolute and/or relative performance for the Portfolio in a report prepared by Lipper. The Trustees considered the total return performance information, which included the ranking of the Portfolio within a performance universe made up of funds with the same Lipper investment classification and objective (the “Universe Group”) by total return for applicable one-, three- and five-year periods. The Trustees reviewed a description of Lipper’s methodology for selecting mutual funds in the Portfolio’s Universe Group. The Lipper materials provided to the Trustees highlighted information with respect to a representative class to assist the Trustees in their review. As part of this review, the Trustees also reviewed the Portfolio’s performance against its benchmark and considered the performance information provided for the Portfolio at regular Board meetings by the Adviser. The Lipper performance data noted by the Trustees as part of their review and the determinations made by the Trustees with respect to the Portfolio’s performance are summarized below:
The Trustees noted the Portfolio’s performance was in the first, second, and first quintiles for Class 1 shares for the one-, three-, and five-year periods ended December 31, 2012, respectively. The Trustees discussed the performance and investment strategy of the Portfolio with the Adviser and, based upon this discussion and various other factors, concluded that the performance was reasonable.
| DECEMBER 31, 2013 | JPMORGAN INSURANCE TRUST | 25 | ||||||
Table of Contents
BOARD APPROVAL OF INVESTMENT ADVISORY AGREEMENT
(Unaudited) (continued)
Advisory Fees and Expense Ratios
The Trustees considered the contractual advisory fee rate paid by the Portfolio to the Adviser and compared that rate to the information prepared by Lipper concerning management fee rates paid by other funds in the same Lipper category as the Portfolio. The Trustees recognized that Lipper reported the Portfolio’s management fee rate as the combined contractual advisory fee and administration fee rates. The Trustees also reviewed information about other expenses and the expense ratios for the Portfolio. The Trustees considered the fee waiver and/or expense reimbursement arrangements currently in place for the Portfolio and considered the net advisory fee rate
after taking into account any waivers and/or reimbursements. The Trustees recognized that it is difficult to make comparisons of advisory fees because there are variations in the services that are included in the fees paid by other funds. The Trustees’ determinations as a result of the review of the Portfolio’s advisory fees and expense ratios are summarized below:
The Trustees noted that the Portfolio’s net advisory fee and actual total expenses for Class 1 shares were in the second and third quintiles, respectively, of their Universe Group. After considering the factors identified above, in light of this information, the Trustees concluded that the advisory fee was reasonable.
| 26 | JPMORGAN INSURANCE TRUST | DECEMBER 31, 2013 | ||||
Table of Contents
(Unaudited)
Certain tax information for the Portfolio is required to be provided to shareholders based upon the Portfolio’s income and distributions for the taxable year ended December 31, 2013. The information and distributions reported in this letter may differ from the information and taxable distributions reported to the shareholders for the calendar year ending December 31, 2013. The information necessary to complete your income tax returns for the calendar year ending December 31, 2013 will be provided under separate cover.
Dividends Received Deductions (DRD)
The Portfolio hereby designates 100% or the maximum allowable percentage as ordinary income distributions eligible for the 70% dividend received deduction for corporate rate shareholders for the fiscal year ended December 31, 2013.
| DECEMBER 31, 2013 | JPMORGAN INSURANCE TRUST | 27 | ||||||
Table of Contents
J.P. Morgan Funds are distributed by JPMorgan Distribution Services, Inc., which is an affiliate of JPMorgan Chase & Co. Affiliates of JPMorgan Chase & Co. receive fees for providing various services to the funds.
Contact JPMorgan Distribution Services, Inc. at 1-800-480-4111 for a portfolio prospectus. You can also visit us at www.jpmorganfunds.com. Investors should carefully consider the investment objectives and risk as well as charges and expenses of the mutual fund before investing. The prospectus contains this and other information about the mutual fund. Read the prospectus carefully before investing.
The Portfolio files a complete schedule of its portfolio holdings for the first and third quarters of its fiscal year with the SEC on Form N-Q. The Portfolio’s Forms N-Q are available on the SEC’s website at http://www.sec.gov and may be reviewed and copied at the SEC’s Public Reference Room in Washington, DC. Information on the operation of the SEC’s Public Reference Room may be obtained by calling 1-800-SEC-0330. Shareholders may request the Form N-Q without charge by calling 1-800-480-4111 or by visiting the variable insurance portfolio section of the J.P. Morgan Funds’ website at www.jpmorganfunds.com.
A description of the Portfolio’s policies and procedures with respect to the disclosure of the Portfolio’s holdings is available in the prospectus and Statement of Additional Information.
A copy of proxy policies and procedures is available without charge upon request by calling 1-800-480-4111 and on the Portfolio’s website at www.jpmorganfunds.com. A description of such policies and procedures is on the SEC’s website at www.sec.gov. The Trustees have delegated the authority to vote proxies for securities owned by the Portfolio to the Adviser. A copy of the Portfolio’s voting record for the most recent 12-month period ended June 30 is available on the SEC’s website at www.sec.gov or at the Portfolio’s website at www.jpmorganfunds.com no later than August 31 of each year. The Portfolio’s proxy voting record will include, among other things, a brief description of the matter voted on for each portfolio security, and will state how each vote was cast, for example, for or against the proposal.
Table of Contents
| © JPMorgan Chase & Co., 2014. All rights reserved. December 2013. | AN-JPMITUSEP-1213 |
Table of Contents
ITEM 2. CODE OF ETHICS.
Disclose whether, as of the end of the period covered by the report, the registrant has adopted a code of ethics that applies to the registrant’s principal executive officer, principal financial officer, principal accounting officer or controller, or persons performing similar functions, regardless of whether these individuals are employed by the registrant or a third party. If the registrant has not adopted such a code of ethics, explain why it has not done so.
The registrant must briefly describe the nature of any amendment, during the period covered by the report, to a provision of its code of ethics that applies to the registrant’s principal executive officer, principal financial officer, principal accounting officer or controller, or persons performing similar functions, regardless of whether these individuals are employed by the registrant or a third party, and that relates to any element of the code of ethics definition enumerated in paragraph (b) of this Item. The registrant must file a copy of any such amendment as an exhibit pursuant to Item 12(a)(1), unless the registrant has elected to satisfy paragraph (f) of this Item by positing its code of ethics on its website pursuant to paragraph (f)(2) of this Item, or by undertaking to provide its code of ethics to any person without charge, upon request, pursuant to paragraph (f)(3) of this Item.
If the registrant has, during the period covered by the report, granted a waiver, including an implicit waiver, from a provision of the code of ethics that applies to the registrant’s principal executive officer, principal financial officer, principal accounting officer or controller, or persons performing similar functions, regardless of whether these individuals are employed by the registrant or third party, that relates to one or more items set forth in paragraph (b) of this Item, the registrant must briefly describe the nature of the waiver, the name of the person to whom the waiver was granted, and the date of the waiver.
The Registrant has adopted a code of ethics that applies to the Registrant’s principal executive officer and principal financial officer. There were no amendments to the code of ethics or waivers granted with respect to the code of ethics in the period covered by the report.
ITEM 3. AUDIT COMMITTEE FINANCIAL EXPERT.
(a) (1) Disclose that the registrant’s board of directors has determined that the registrant either:
(i) Has at least one audit committee financial expert serving on its audit committee; or
(ii) Does not have an audit committee financial expert serving on its audit committee.
The Registrant’s Board of Trustees has determined that the Registrant has at least one audit committee financial expert serving on its audit committee. The Securities and Exchange Commission has stated that the designation or identification of a person as an audit committee financial expert pursuant to this Item 3 of Form N-CSR does not impose on such person any duties, obligations or liabilities that are greater than the duties, obligations and liabilities imposed on such person as a member of the Audit Committee and the Board of Trustees in the absence of such designation or identification.
(2) If the registrant provides the disclosure required by paragraph (a)(1)(i) of this Item, it must disclose the name of the audit committee financial expert and whether that person is “independent.” In order to be considered “independent” for purposes of this Item, a member of an audit committee may not, other than in his or her capacity as a member of the audit committee, the board of directors, or any other board committee:
(i) Accept directly or indirectly any consulting, advisory, or other compensatory fee from the issuer; or
(ii) Be an “interested person” of the investment company as defined in Section 2(a)(19) of the
Act (15 U.S.C. 80a-2(a)(19)).
The audit committee financial expert is Mitch Merin. He is not an “interested person” of the Registrant and is also “independent” as defined by the U.S. Securities and Exchange Commission for purposes of audit committee financial expert determinations.
(3) If the registrant provides the disclosure required by paragraph (a)(1)(ii) of this Item, it must explain why it does not have an audit committee financial expert.
Not applicable.
Table of Contents
ITEM 4. PRINCIPAL ACCOUNTANT FEES AND SERVICES.
(a) Disclose, under the caption Audit Fees, the aggregate fees billed for each of the last two fiscal years for professional services rendered by the principal accountant for the audit of the registrant’s annual financial statements or services that are normally provided by the accountant in connection with statutory and regulatory filings or engagements for those fiscal years.
AUDIT FEES |
2013 – $284,515 |
2012 – $273,200 |
(b) Disclose, under the caption Audit-Related Fees, the aggregate fees billed in each of the last two fiscal years for assurance and related services by the principal accountant that are reasonably related to the performance of the audit of the registrant’s financial statements and are not reported under paragraph (a) of this Item. Registrants shall describe the nature of the services comprising the fees disclosed under this category.
AUDIT-RELATED FEES
2013 – $66,450 |
2012 – $108,070 |
Audit-related fees consists of semi-annual financial statement reviews and security count procedures performed as required under Rule 17f-2 of the Investment Company Act of 1940 during the Registrant’s fiscal year.
(c) Disclose, under the caption Tax Fees, the aggregate fees billed in each of the last two fiscal years for professional services rendered by the principal accountant for tax compliance, tax advice, and tax planning. Registrants shall describe the nature of the services comprising the fees disclosed under this category.
TAX FEES |
2013 – $67,690 |
2012 – $53,900 |
The tax fees consist of fees billed in connection with preparing the federal regulated investment company income tax returns for the Registrant for the tax years ended December 31, 2013 and 2012, respectively.
For the last fiscal year, no tax fees were required to be approved pursuant to paragraph (c)(7)(ii) of Rule 2-01 of Regulation S-X.
(d) Disclose, under the caption All Other Fees, the aggregate fees billed in each of the last two fiscal years for products and services provided by the principal accountant, other than the services reported in paragraphs (a) through (c) of this Item. Registrants shall describe the nature of the services comprising the fees disclosed under this category.
ALL OTHER FEES
2013 – Not applicable |
2012 – Not applicable |
(e) (1) Disclose the audit committee’s pre-approval policies and procedures described in paragraph (c)(7) of Rule 2-01 of Regulation S-X.
Pursuant to the Registrant’s Audit Committee Charter and written policies and procedures for the pre-approval of audit and non-audit services (the “Pre-approval Policy”), the Audit Committee pre-approves all audit and non-audit services performed by the Registrant’s independent public registered accounting firm for the Registrant. In addition, the Audit Committee pre-approves the auditor’s engagement for non-audit services with the Registrant’s investment adviser (not including a sub-adviser whose role is primarily portfolio management and is sub-contracted or overseen by another investment adviser) and any Service Affiliate in accordance with paragraph (c)(7)(ii) of Rule 2-01 of Regulation S-X, if the engagement relates directly to the operations and financial reporting of the Registrant. Proposed services may be pre-approved either 1) without consideration of specific case-by-case services or 2) require the specific pre-approval of the Audit Committee. Therefore, initially the Pre-approval Policy listed a number of audit and non-audit services that have
Table of Contents
been approved by the Audit Committee, or which were not subject to pre-approval under the transition provisions of Sarbanes-Oxley Act of 2002 (the “Pre-approval List”). The Audit Committee annually reviews and pre-approves the services included on the Pre-approval List that may be provided by the independent public registered accounting firm without obtaining additional specific pre-approval of individual services from the Audit Committee. The Audit Committee adds to, or subtracts from, the list of general pre-approved services from time to time, based on subsequent determinations. All other audit and non-audit services not on the Pre-approval List must be specifically pre-approved by the Audit Committee.
One or more members of the Audit Committee may be appointed as the Committee’s delegate for the purposes of considering whether to approve such services. Any pre-approvals granted by the delegate will be reported, for informational purposes only, to the Audit Committee at its next scheduled meeting. The Audit Committee’s responsibilities to pre-approve services performed by the independent public registered accounting firm are not delegated to management.
(2) Disclose the percentage of services described in each of paragraphs (b) through (d) of this Item that were approved by the audit committee pursuant to paragraph (c)(7)(i)(C) of Rule 2-01 of Regulation S-X.
2013 – 0.0% | ||
2012 – 0.0% |
(f) If greater than 50 percent, disclose the percentage of hours expended on the principal accountant’s engagement to audit the registrant’s financial statements for the most recent fiscal year that were attributed to work performed by persons other than the principal accountant’s full-time, permanent employees.
None.
(g) Disclose the aggregate non-audit fees billed by the registrant’s accountant for services rendered to the registrant, and rendered to the registrant’s investment adviser (not including any sub-adviser whose role is primarily portfolio management and is subcontracted with or overseen by another investment adviser), and any entity controlling, controlled by, or under common control with the adviser that provides ongoing services to the registrant for each of the last two fiscal years of the registrant.
The aggregate non-audit fees billed by the independent registered public accounting firm for services rendered to the Registrant, and rendered to Service Affiliates, for the last two calendar year ends were:
2013 - $33.9 million | ||
2012 - $33.2 million |
(h) Disclose whether the registrant’s audit committee of the board of directors has considered whether the provision of non-audit services that were rendered to the registrant’s investment adviser (not including any subadviser whose role is primarily portfolio management and is subcontracted with or overseen by another investment adviser), and any entity controlling, controlled by, or under common control with the investment adviser that provides ongoing services to the registrant that were not pre-approved pursuant to paragraph (c)(7)(ii) of Rule 2-01 of Regulation S-X is compatible with maintaining the principal accountant’s independence.
The Registrant’s Audit Committee has considered whether the provision of the non-audit services that were rendered to Service Affiliates that were not pre-approved (not requiring pre-approval) is compatible with maintaining the independent public registered accounting firm’s independence. All services provided by the independent public registered accounting firm to the Registrant or to Service Affiliates that were required to be pre-approved were pre-approved as required.
ITEM 5. AUDIT COMMITTEE OF LISTED REGISTRANTS.
(a) If the registrant is a listed issuer as defined in Rule 10A-3 under the Exchange Act (17CFR 240.10A-3), state whether or not the registrant has a separately-designated standing audit committee established in accordance with Section 3(a)(58)(A) of the Exchange Act (15 U.S.C. 78c(a)(58)(A)). If the registrant has such a committee, however designated, identify each committee member. If the entire board of directors is acting as the registrant’s audit committee as specified in Section 3(a)(58)(B) of the Exchange Act (15 U.S.C. 78c(a)(58)(B)), so state.
(b) If applicable, provide the disclosure required by Rule 10A-3(d) under the Exchange Act (17CFR 240.10A-3(d)) regarding an exemption from the listing standards for all audit committees.
Table of Contents
Not applicable.
ITEM 6. SCHEDULE OF INVESTMENTS.
File Schedule I – Investments in securities of unaffiliated issuers as of the close of the reporting period as set forth in Section 210.12-12 of Regulation S-X, unless the schedule is included as part of the report to shareholders filed under Item 1 of this Form.
Included in Item 1.
ITEM 7. DISCLOSURE OF PROXY VOTING POLICIES AND PROCEDURES FOR CLOSED-END MANAGEMENT INVESTMENT COMPANIES.
A closed-end management investment company that is filing an annual report on this Form N-CSR must, unless it invests exclusively in non-voting securities, describe the policies and procedures that it uses to determine how to vote proxies relating to portfolio securities, including the procedures that the company uses when a vote presents a conflict between the interests of its shareholders, on the one hand, and those of the company’s investment adviser; principal underwriter; or any affiliated person (as defined in Section 2(a)(3) of the Investment Company Act of 1940 (15 U.S.C. 80a-2(a)(3)) and the rules thereunder) of the company, its investment adviser, or its principal underwriter, on the other. Include any policies and procedures of the company’s investment adviser, or any other third party, that the company uses, or that are used on the company’s behalf, to determine how to vote proxies relating to portfolio securities.
Not applicable.
ITEM 8. PORTFOLIO MANAGERS OF CLOSED-END MANAGEMENT INVESTMENT COMPANIES.
Not applicable.
ITEM 9. PURCHASE OF EQUITY SECURITIES BY CLOSED-END MANAGEMENT INVESTMENT COMPANY AND AFFILIATED PURCHASERS.
(a) If the registrant is a closed-end management investment company, provide the information specified in paragraph (b) of this Item with respect to any purchase made by or on behalf of the registrant or any “affiliated purchaser,” as defined in Rule 10b-18(a)(3) under the Exchange Act (17 CFR 240.10b-18(a)(3)), of shares or other units of any class of the registrant’s equity securities that is registered by the registrant pursuant to Section 12 of the Exchange Act (15 U.S.C. 781).
Not applicable.
ITEM 10. SUBMISSION OF MATTERS TO A VOTE OF SECURITY HOLDERS.
Describe any material changes to the procedures by which shareholders may recommend nominees to the registrant’s board of directors, where those changes were implemented after the registrant last provided disclosure in response to the requirements of Item 7(d)(2)(ii)(G) of Schedule 14A (17 CFR 240.14a-101), or this Item.
No material changes to report.
ITEM 11. CONTROLS AND PROCEDURES.
(a) Disclose the conclusions of the registrant’s principal executive and principal financial officers, or persons performing similar functions, regarding the effectiveness of the registrant’s disclosure controls and procedures (as defined in Rule 30a-3(c) under the Act (17 CFR 270.30a-3(c))) as of a date within 90 days of the filing date of the report that includes the disclosure required by this paragraph, based on the evaluation of these controls and procedures required by Rule 30a-3(b) under the Act (17 CFR 270.30a-3(b)) and
Rules 13a-15(b) or 15d-15(b) under the Exchange Act (17 CFR 240.13a-15(b) or 240.15d-15(b)).
The Registrant’s principal executive and principal financial officers have concluded, based on their evaluation of the Registrant’s disclosure controls and procedures as of a date within 90 days of the filing date of this report, that the Registrant’s disclosure controls and procedures are reasonably designed to ensure that information required to be disclosed by the Registrant on Form N-CSR is recorded, processed, summarized and reported within the required time
Table of Contents
periods and that information required to be disclosed by the Registrant in the reports that it files or submits on Form N-CSR is accumulated and communicated to the Registrant’s management, including its principal executive and principal financial officers, as appropriate to allow timely decisions regarding required disclosure.
(b) Disclose any change in the registrant’s internal control over financial reporting (as defined in Rule 30a-3(d) under the Act (17 CFR 270.30a-3(d)) that occurred during the registrant’s second fiscal quarter of the period covered by this report that has materially affected, or is reasonably likely to materially affect, the registrant’s internal control over financial reporting.
There were no changes in the Registrant’s internal control over financial reporting that occurred during the last fiscal quarter covered by this report that have materially affected, or are reasonably likely to materially affect, the Registrant’s internal control over financial reporting.
ITEM 12. EXHIBITS.
(a) File the exhibits listed below as part of this Form. Letter or number the exhibits in the sequence indicated.
(a)(1) Any code of ethics, or amendment thereto, that is the subject of the disclosure required by Item 2, to the extent that the registrant intends to satisfy the Item 2 requirements through filing of an exhibit.
Code of Ethics applicable to its Principal Executive and Principal Financial Officers pursuant to Section 406 of the Sarbanes-Oxley Act of 2002 attached hereto.
(a)(2) A separate certification for each principal executive officer and principal financial officer of the registrant as required by Rule 30a-2(a) under the Act (17 CFR 270.30a-2).
Certifications pursuant to Rule 30a-2(a) under the Investment Company Act of 1940 are attached hereto.
(a)(3) Any written solicitation to purchase securities under Rule 23c-1 under the Act (17 CFR 270.23c-1) sent or given during the period covered by the report by or on behalf of the registrant to 10 or more persons.
Not applicable.
(b) A separate or combined certification for each principal executive officer and principal officer of the registrant as required by Rule 30a-2(b) under the Act of 1940.
Certifications pursuant to Rule 30a-2(b) under the Investment Company Act of 1940 are attached hereto.
Table of Contents
SIGNATURES
Pursuant to the requirements of the Securities Exchange Act of 1934 and the Investment Company Act of 1940, the registrant has duly caused this report to be signed on its behalf by the undersigned, thereunto duly authorized.
JPMorgan Insurance Trust
| By: | /s/ Robert L. Young | |
| Robert L. Young | ||
| President and Principal Executive Officer | ||
| March 4, 2014 |
Pursuant to the requirements of the Securities Exchange Act of 1934 and the Investment Company Act of 1940, this report has been signed below by the following persons on behalf of the registrant and in the capacities and on the dates indicated.
| By: | /s/ Robert L. Young | |
| Robert L. Young | ||
| President and Principal Executive Officer | ||
| March 4, 2014 |
| By: | /s/ Joy C. Dowd | |
| Joy C. Dowd | ||
| Treasurer and Principal Financial Officer | ||
| March 4, 2014 |