UNITED STATES
SECURITIES AND EXCHANGE COMMISSION
Washington, D.C. 20549
FORM N-CSR
CERTIFIED SHAREHOLDER REPORT OF REGISTERED
MANAGEMENT INVESTMENT COMPANIES
Investment Company Act file number: 811-07874
JPMorgan Insurance Trust
(Exact name of registrant as specified in charter)
270 Park Avenue
New York, NY 10017
(Address of principal executive offices) (Zip code)
Frank J. Nasta
270 Park Avenue
New York, NY 10017
(Name and Address of Agent for Service)
Registrant’s telephone number, including area code: (800) 480-4111
Date of fiscal year end: December 31
Date of reporting period: January 1, 2013 through June 30, 2013
Form N-CSR is to be used by management investment companies to file reports with the Commission not later than 10 days after the transmission to stockholders of any report that is required to be transmitted to stockholders under Rule 30e-1 under the Investment Company Act of 1940 (17 CFR 270.30e-1). The Commission may use the information provided on Form N-CSR in its regulatory, disclosure review, inspection, and policymaking roles.
A registrant is required to disclose the information specified by Form N-CSR, and the Commission will make this information public. A registrant is not required to respond to the collection of information contained in Form N-CSR unless the Form displays a currently valid Office of Management and Budget (“OMB”) control number. Please direct comments concerning the accuracy of the information collection burden estimate and any suggestions for reducing the burden to Secretary, Securities and Exchange Commission, 450 Fifth Street, NW, Washington, DC 20549-0609. The OMB has reviewed this collection of information under the clearance requirements of 44 U.S.C. Section 3507.
ITEM 1. REPORTS TO STOCKHOLDERS.
The following is a copy of the report transmitted to shareholders pursuant to Rule 30e-1 under the Investment Company Act of 1940 (17 CFR 270.30e-1).
Semi-Annual Report
JPMorgan Insurance Trust
June 30, 2013 (Unaudited)
JPMorgan Insurance Trust Core Bond Portfolio
| | | | |
NOT FDIC INSURED Ÿ NO BANK GUARANTEE Ÿ MAY LOSE VALUE
| | |  | |
CONTENTS
Investments in the Portfolio are not bank deposits or obligations of, or guaranteed or endorsed by, any bank and are not insured or guaranteed by the FDIC, the Federal Reserve Board or any other government agency. You could lose money if you sell when the Portfolio’s share price is lower than when you invested.
Past performance is no guarantee of future performance. The general market views expressed in this report are opinions based on market and other conditions through the end of the reporting period and are subject to change without notice. These views are not intended to predict the future performance of the Portfolio or the securities markets. References to specific securities and their issuers are for illustrative purposes only and are not intended to be, and should not be interpreted as, recommendations to purchase or sell such securities. Such views are not meant as investment advice and may not be relied on as an indication of trading intent on behalf of the Portfolio.
This Portfolio is intended to be a funding vehicle for variable annuity contracts and variable life insurance policies (collectively “Policies”) offered by separate accounts of participating insurance companies. Portfolio shares are also offered through qualified pension and retirement plans (“Eligible Plans”). Individuals may not purchase shares directly from the Portfolio.
Prospective investors should refer to the Portfolio’s prospectus for a discussion of the Portfolio’s investment objective, strategies and risks. Call J.P. Morgan Funds Service Center at 1-800-480-4111 for a prospectus containing more complete information about the Portfolio, including management fees and other expenses. Please read it carefully before investing.
CEO’S LETTER
July 26, 2013 (Unaudited)
Dear Shareholder:
While somewhat overshadowed by increased volatility at the end of the reporting period, developed market equities in aggregate posted solid returns for the six months ended June 30, 2013. For much of the period, stocks were supported by solid corporate earnings and robust demand from investors looking to generate higher returns in the low interest rate environment. Despite signaling a potential policy shift in June 2013, the U.S. Federal Reserve (“Fed”) continued to pursue its highly accommodative policies in an attempt to lower unemployment and spur the economy. Central banks overseas also did their part to support their economies. The European Central Bank (“ECB”) remained committed to preserving the euro, as it cut rates and introduced new programs designed to aid struggling euro zone members. Elsewhere, the Bank of Japan stepped up its major asset purchase program as a new pro-growth government came into power late in 2012.
| | |
 | | “We are encouraged by the stock market’s resiliency in the face of recent volatility.” |
Positive investor sentiment was temporarily interrupted, however, in May 2013 when Fed Chairman Bernanke indicated that the central bank may begin to “taper” its asset purchase program later this year. This triggered a sharp decline in global equities, although they quickly regained their footing and have continued to rally in July. All told, U.S. stocks rose sharply during the six months ended June 30, 2013. Overseas, international developed stocks produced more modest gains, while emerging market equities performed poorly given concerns regarding China’s economy and falling commodity prices.
U.S. Treasury Yields Rise Sharply
Talk of Fed tapering negatively impacted the fixed income markets. While U.S. Treasury security yields continued to be low from a historical perspective, they ended the period sharply
higher than when the reporting period began. The yield for 10-year U.S. Treasury securities ended June 30, 2013 at 2.52%, while the yields for 2- and 30-year U.S. Treasury securities finished the reporting period at 0.36% and 3.52%, respectively. Amid the rising interest rate environment, the overall U.S. fixed income market generated a negative return for the reporting period. In contrast, high yield bonds posted a modest gain, while emerging market debt securities fell sharply.
Positive Signs for Stocks
Although the global economy is far from robust, it is still on a growth path. The expansion in the U.S. certainly appears to be sustainable and, while Europe remains in a recession, there are indications that its economy may be bottoming. Elsewhere, pro-growth initiatives in Japan have thus far yielded positive results. While growth in China has moderated, we believe the government has the tools at its disposal to avoid a “hard landing.”
We are encouraged by the stock market’s resiliency in the face of recent volatility. In addition, there have been signs that equity market correlations are decreasing, which could create a more favorable environment for active managers. In addition, given the recent sell-off in the bond market, valuations in a number of fixed income sectors have become more attractive.
On behalf of everyone at J.P. Morgan Asset Management, thank you for your continued support. We look forward to managing your investment needs for years to come. Should you have any questions, please visit www.jpmorganfunds.com or contact the J.P. Morgan Funds Service Center at 1-800-480-4111.
Sincerely yours,

George C.W. Gatch
CEO, Global Funds Management
J.P. Morgan Asset Management
| | | | | | | | |
| | | |
| JUNE 30, 2013 | | JPMORGAN INSURANCE TRUST | | | | | 1 | |
JPMorgan Insurance Trust Core Bond Portfolio
PORTFOLIO COMMENTARY
SIX MONTHS ENDED JUNE 30, 2013 (Unaudited)
| | | | |
| REPORTING PERIOD RETURN: | |
| Portfolio (Class 1 Shares)* | | | -1.74% | |
| Barclays U.S. Aggregate Index | | | -2.44% | |
| |
| Net Assets as of 6/30/2013 | | | 207,380,783 | |
| Duration as of 6/30/2013 | | | 4.81 years | |
INVESTMENT OBJECTIVE**
The JPMorgan Insurance Trust Core Bond Portfolio (the “Portfolio”) seeks to maximize total return by investing primarily in a diversified portfolio of intermediate- and long-term debt securities.
HOW DID THE MARKET PERFORM?
The U.S. fixed income market generated weak results overall during the six- month period ended June 30, 2013. Generally positive economic data and indications that the U.S. Federal Reserve Board (“Fed”) may become less accommodative with its monetary policy undermined the fixed income market.
During the first half of the period, yields for U.S. Treasury securities moved modestly higher, as the economy remained resilient despite the impact from sequestration (the $85 billion in government spending cuts that began in March 2013). More specifically, consumer spending improved versus the last three months of 2012, the U.S. housing market demonstrated signs of strength and the manufacturing sector continued to expand. Against this backdrop, most U.S. spread sectors (non-Treasury taxable fixed income securities) treaded water during the first three months of 2013.
After a solid start in April, the U.S. fixed income market then sold off sharply in May and June. This turnaround began following Fed Chairman Bernanke’s testimony to Congress in May, as he indicated that the Fed might begin reducing its $85 billion in monthly asset purchases at one of its next few meetings. The market’s decline gathered momentum following the Fed’s meeting on June 19 at which Mr. Bernanke said that the Central Bank may begin “tapering” its asset purchases later in the year, and end the program by mid-2014 if incoming data were consistent with the Fed’s economic forecasts. This caused U.S. Treasury yields to move sharply higher and bond prices to decline.
For the reporting period as a whole, U.S. Treasury rates moved higher across the yield curve (the yield curve shows the relationship between yields and maturity dates for a set of similar
bonds) and the spread sectors generated negative absolute returns. For the six months ended June 30, 2013, the Barclays U.S. Aggregate Index (the “Benchmark”) returned -2.44%.
WHAT WERE THE MAIN DRIVERS OF THE PORTFOLIO’S PERFORMANCE?
The Portfolio (Class 1 Shares) outperformed the Benchmark for the six months ended June 30, 2013. The Portfolio’s short duration versus that of the Benchmark was a positive for relative performance given the rising interest rate environment. An underweight to certain mortgage passthrough securities was beneficial as they underperformed the Benchmark, in part due to the Fed’s plans to taper its asset purchase program. Within the mortgage-backed security market, owning issues that were not as sensitive to rising interest rates aided the Portfolio’s performance. Finally, some of the Portfolio’s sovereign debt exposures contributed to relative results as they outperformed the Benchmark.
Having an overweight to the five- to ten- year portion of the Treasury yield curve detracted from the Portfolio’s relative performance, as this was the weakest performing portion of the curve during the reporting period. The Portfolio’s allocation to agency securities generated mixed results. While their spreads widened, issue selection was additive in some cases.
HOW WAS THE PORTFOLIO POSITIONED?
The Portfolio’s primary strategy continued to be security selection and relative value, which seeks to exploit pricing discrepancies between individual securities or market sectors. The Portfolio managers used bottom-up fundamental research to construct, in their view, a portfolio of undervalued fixed income securities. The Portfolio was underweight U.S. Treasury securities and overweight mortgage-backed securities. The Portfolio was overweight the intermediate part of the yield curve (U.S. Treasury securities with five- to ten- year maturities) as the Portfolio managers believed that these U.S. Treasuries had the most attractive risk/reward profile.
| | | | | | |
| | | |
| 2 | | | | JPMORGAN INSURANCE TRUST | | JUNE 30, 2013 |
| | | | |
PORTFOLIO COMPOSITION*** | |
Collateralized Mortgage Obligations | | | 31.8 | % |
U.S. Treasury Obligations | | | 24.4 | |
Corporate Bonds | | | 16.2 | |
U.S. Government Agency Securities | | | 13.4 | |
Mortgage Pass-Through Securities | | | 8.4 | |
Commercial Mortgage-Backed Securities | | | 2.6 | |
Asset-Backed Securities | | | 1.4 | |
Others (each less than 1.0%) | | | 0.4 | |
Short-Term Investment | | | 1.4 | |
| * | | The return shown is based on net asset values calculated for shareholder transactions and may differ from the return shown in the financial highlights, which reflects adjustments made to the net asset values in accordance with accounting principles generally accepted in the United States of America. |
| ** | | The advisor seeks to achieve the Portfolio’s objective. There can be no guarantee it will be achieved. |
| *** | | Percentages indicated are based on total investments as of June 30, 2013. The Portfolio’s composition is subject to change. |
| | | | | | | | |
| | | |
| JUNE 30, 2013 | | JPMORGAN INSURANCE TRUST | | | | | 3 | |
| | | | | | | | | | | | | | | | | | | | |
AVERAGE ANNUAL TOTAL RETURNS AS OF JUNE 30, 2013 | |
| | | | | |
| | | INCEPTION DATE
OF CLASS | | | 6 MONTH* | | | 1 YEAR | | | 5 YEAR | | | 10 YEAR | |
CLASS 1 SHARES | | | 5/1/97 | | | | (1.74 | )% | | | 0.39 | % | | | 5.92 | % | | | 4.81 | % |
CLASS 2 SHARES | | | 8/16/06 | | | | (1.83 | ) | | | 0.22 | | | | 5.67 | | | | 4.64 | |
TEN YEAR PERFORMANCE (6/30/03 TO 6/30/13)
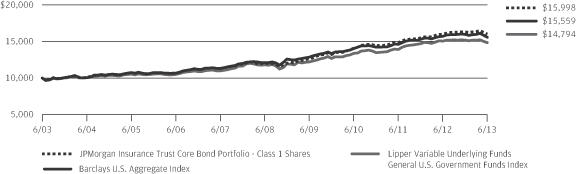
The performance quoted is past performance and is not a guarantee of future results. Mutual funds are subject to certain market risks. Investment returns and principal value of an investment will fluctuate so that an investor’s shares, when redeemed, may be worth more or less than their original cost. Current performance may be higher or lower than the performance data shown. For up-to-date month-end performance information please call 1-800-480-4111.
Returns for Class 2 Shares prior to its inception date are based on the performance of Class 1 Shares. The actual returns of Class 2 Shares would have been lower than those shown because Class 2 Shares have higher expenses than Class 1 Shares.
The graph illustrates comparative performance for $10,000 invested in Class 1 Shares of the JPMorgan Insurance Trust Core Bond Portfolio, the Barclays U.S. Aggregate Index and the Lipper Variable Underlying Funds General U.S. Government Funds Index from June 30, 2003 to June 30, 2013. The performance of the Portfolio assumes reinvestment of all dividends and capital gain distributions, if any. The performance of the Barclays U.S. Aggregate Index does not reflect the deduction of expenses associated with a mutual fund and has been adjusted to reflect reinvestment of all dividends and capital gain distributions of the securities included in the benchmark, if applicable. The performance of the Lipper Variable Underlying Funds General U.S. Government
Funds Index includes expenses associated with a mutual fund, such as investment management fees. These expenses are not identical to the expenses incurred by the Portfolio. The Barclays U.S. Aggregate Index is an unmanaged index that represents securities that are SEC-registered, taxable, and dollar denominated. The index covers the U.S. investment grade fixed rate bond market, with index components for government and corporate securities, mortgage pass-through securities, and asset-backed securities. The Lipper Variable Underlying Funds General U.S. Government Funds Index is an index based on the total returns of certain mutual funds within the Portfolio’s designated category as determined by Lipper, Inc. Investors cannot invest directly in an index.
Portfolio performance does not reflect any charges imposed by the Policies or Eligible Plans. If these charges were included, the returns would be lower than shown. Portfolio performance may reflect the waiver of the Portfolio’s fees and reimbursement of expenses for certain periods since the inception date. Without these waivers and reimbursements, performance would have been lower. The returns shown are based on net asset values calculated for shareholder transactions and may differ from the returns shown in the financial highlights, which reflect adjustments made to the net asset values in accordance with accounting principles generally accepted in the United States of America.
| | | | | | |
| | | |
| 4 | | | | JPMORGAN INSURANCE TRUST | | JUNE 30, 2013 |
JPMorgan Insurance Trust Core Bond Portfolio
SCHEDULE OF PORTFOLIO INVESTMENTS
AS OF JUNE 30, 2013 (Unaudited)
| | | | | | | | |
PRINCIPAL
AMOUNT($) | | | SECURITY DESCRIPTION | | VALUE($) | |
| | | | | | | | |
| Asset-Backed Securities — 1.4% | | | | |
| | 35,736 | | | American Credit Acceptance Receivables Trust, Series 2012-1, Class A2, 3.040%, 10/15/15 (e) | | | 35,921 | |
| | 27,134 | | | Bear Stearns Asset-Backed Securities Trust, Series 2006-SD1, Class A, VAR, 0.563%, 04/25/36 | | | 25,215 | |
| | 161,138 | | | Centex Home Equity Loan Trust,
Series 2004-D, Class AF4, SUB, 4.680%, 06/25/32 | | | 167,852 | |
| | | | CNH Equipment Trust, | | | | |
| | 28,178 | | | Series 2011-A, Class A3, 1.200%, 05/16/16 | | | 28,261 | |
| | 80,000 | | | Series 2011-A, Class A4, 2.040%, 10/17/16 | | | 81,246 | |
| | | | Countrywide Asset-Backed Certificates, | | | | |
| | 1,056 | | | Series 2004-1, Class 3A, VAR, 0.753%, 04/25/34 | | | 1,020 | |
| | 120,000 | | | Series 2004-1, Class M1, VAR, 0.943%, 03/25/34 | | | 111,230 | |
| | 30,796 | | | Series 2004-1, Class M2, VAR, 1.018%, 03/25/34 | | | 29,505 | |
| | 15,886 | | | CWABS Revolving Home Equity Loan Trust, Series 2004-K, Class 2A, VAR, 0.493%, 02/15/34 | | | 13,287 | |
| | | | HLSS Servicer Advance Receivables Backed Notes, | | | | |
| | 257,000 | | | Series 2013-T1, Class A1, 0.898%, 01/15/44 (e) | | | 256,100 | |
| | 180,000 | | | Series 2013-T1, Class A2, 1.495%, 01/16/46 (e) | | | 177,642 | |
| | | | Hyundai Auto Receivables Trust, | | | | |
| | 169,000 | | | Series 2013-A, Class A3, 0.560%, 07/17/17 | | | 168,529 | |
| | 200,000 | | | Series 2013-A, Class A4, 0.750%, 09/17/18 | | | 197,675 | |
| | 63,680 | | | Lake Country Mortgage Loan Trust, Series 2006-HE1, Class A3, VAR, 0.543%, 07/25/34 (e) | | | 62,801 | |
| | | | Long Beach Mortgage Loan Trust, | | | | |
| | 158,534 | | | Series 2003-4, Class M1, VAR, 1.213%, 08/25/33 | | | 145,877 | |
| | 190,000 | | | Series 2004-1, Class M1, VAR, 0.943%, 02/25/34 | | | 173,473 | |
| | 58,177 | | | Series 2004-1, Class M2, VAR, 1.018%, 02/25/34 | | | 56,150 | |
| | 23,222 | | | Series 2006-WL2, Class 2A3, VAR, 0.393%, 01/25/36 | | | 20,905 | |
| | 102,000 | | | Nationstar Agency Advance Funding Trust, Series 2013-T1A, Class AT1, 0.997%, 02/15/45 (e) | | | 101,031 | |
| | | | | | | | |
PRINCIPAL
AMOUNT($) | | | SECURITY DESCRIPTION | | VALUE($) | |
| | | | | | | | |
| | | | | | | | |
| | 125,000 | | | New Century Home Equity Loan Trust, Series 2005-1, Class M1, VAR, 0.643%, 03/25/35 | | | 118,626 | |
| | 155,301 | | | Park Place Securities, Inc., Asset-Backed Pass-Through Certificates, Series 2004-MCW1, Class M1, VAR, 1.131%, 10/25/34 | | | 150,799 | |
| | 9,172 | | | RASC Trust, Series 2003-KS9, Class A2B, VAR, 0.833%, 11/25/33 | | | 6,800 | |
| | 149,953 | | | Residential Credit Solutions Trust, Series 2011-1, Class A1, 6.000%, 03/25/41 (e) (i) | | | 149,953 | |
| | | | Santander Drive Auto Receivables Trust, | | | | |
| | 100,000 | | | Series 2011-1, Class B, 2.350%, 11/16/15 | | | 100,825 | |
| | 15,245 | | | Series 2011-S2A, Class B, 2.060%, 06/15/17 (e) | | | 15,292 | |
| | 61,385 | | | SNAAC Auto Receivables Trust, Series 2013-1A, Class A, 1.140%, 07/16/18 (e) | | | 61,331 | |
| | 450,000 | | | Springleaf Funding Trust, Series 2013-AA, Class A, 2.580%, 09/15/21 (e) | | | 450,000 | |
| | 44,046 | | | World Omni Auto Receivables Trust, Series 2010-A, Class A4, 2.210%, 05/15/15 | | | 44,257 | |
| | | | | | | | |
| | | | Total Asset-Backed Securities
(Cost $2,994,099) | | | 2,951,603 | |
| | | | | | | | |
| Collateralized Mortgage Obligations — 31.7% | | | | |
| | | | Agency CMO — 22.4% | | | | |
| | 167,098 | | | Federal Home Loan Mortgage Corp. - Government National Mortgage Association, Series 8, Class ZA, 7.000%, 03/25/23 | | | 187,336 | |
| | | | Federal Home Loan Mortgage Corp. REMIC, | | | | |
| | 3,586 | | | Series 11, Class D, 9.500%, 07/15/19 | | | 3,840 | |
| | 4,308 | | | Series 22, Class C, 9.500%, 04/15/20 | | | 4,812 | |
| | 723 | | | Series 47, Class F, 10.000%, 06/15/20 | | | 826 | |
| | 548 | | | Series 99, Class Z, 9.500%, 01/15/21 | | | 627 | |
| | 916 | | | Series 1065, Class J, 9.000%, 04/15/21 | | | 1,089 | |
| | 82,927 | | | Series 1113, Class J, 8.500%, 06/15/21 | | | 90,422 | |
| | 5,148 | | | Series 1250, Class J, 7.000%, 05/15/22 | | | 6,048 | |
| | 10,263 | | | Series 1316, Class Z, 8.000%, 06/15/22 | | | 11,696 | |
| | 17,650 | | | Series 1324, Class Z, 7.000%, 07/15/22 | | | 19,910 | |
| | 75,407 | | | Series 1343, Class LA, 8.000%, 08/15/22 | | | 89,073 | |
| | 15,522 | | | Series 1343, Class LB, 7.500%, 08/15/22 | | | 18,359 | |
| | 11,339 | | | Series 1394, Class ID, IF, 9.566%, 10/15/22 | | | 13,263 | |
| | 10,387 | | | Series 1395, Class G, 6.000%, 10/15/22 | | | 11,286 | |
SEE NOTES TO FINANCIAL STATEMENTS.
| | | | | | | | |
| | | |
| JUNE 30, 2013 | | JPMORGAN INSURANCE TRUST | | | | | 5 | |
JPMorgan Insurance Trust Core Bond Portfolio
SCHEDULE OF PORTFOLIO INVESTMENTS
AS OF JUNE 30, 2013 (Unaudited) (continued)
| | | | | | | | |
PRINCIPAL
AMOUNT($) | | | SECURITY DESCRIPTION | | VALUE($) | |
| | | | | | | | |
| Collateralized Mortgage Obligations — Continued | |
| | | | Agency CMO — Continued | | | | |
| | 7,860 | | | Series 1505, Class Q, 7.000%, 05/15/23 | | | 8,702 | |
| | 13,821 | | | Series 1518, Class G, IF, 8.854%, 05/15/23 | | | 16,266 | |
| | 13,884 | | | Series 1541, Class O, VAR, 1.420%, 07/15/23 | | | 14,361 | |
| | 308,010 | | | Series 1577, Class PV, 6.500%, 09/15/23 | | | 319,826 | |
| | 257,874 | | | Series 1584, Class L, 6.500%, 09/15/23 | | | 285,974 | |
| | 620 | | | Series 1596, Class D, 6.500%, 10/15/13 | | | 622 | |
| | 314 | | | Series 1607, Class SA, HB, IF, 21.204%, 10/15/13 | | | 321 | |
| | 5,746 | | | Series 1609, Class LG, IF, 16.792%, 11/15/23 | | | 6,670 | |
| | 278,689 | | | Series 1633, Class Z, 6.500%, 12/15/23 | | | 310,794 | |
| | 311,371 | | | Series 1638, Class H, 6.500%, 12/15/23 | | | 346,114 | |
| | 2,387 | | | Series 1671, Class QC, IF, 10.000%, 02/15/24 | | | 2,632 | |
| | 52,303 | | | Series 1694, Class PK, 6.500%, 03/15/24 | | | 54,926 | |
| | 10,302 | | | Series 1700, Class GA, PO, 02/15/24 | | | 9,644 | |
| | 35,935 | | | Series 1798, Class F, 5.000%, 05/15/23 | | | 38,799 | |
| | 72,029 | | | Series 1863, Class Z, 6.500%, 07/15/26 | | | 80,052 | |
| | 4,026 | | | Series 1865, Class D, PO, 02/15/24 | | | 3,347 | |
| | 25,656 | | | Series 1981, Class Z, 6.000%, 05/15/27 | | | 28,989 | |
| | 32,080 | | | Series 1987, Class PE, 7.500%, 09/15/27 | | | 35,744 | |
| | 132,151 | | | Series 1999, Class PU, 7.000%, 10/15/27 | | | 151,148 | |
| | 186,222 | | | Series 2031, Class PG, 7.000%, 02/15/28 | | | 210,931 | |
| | 8,263 | | | Series 2033, Class SN, HB, IF, 27.075%, 03/15/24 | | | 5,282 | |
| | 189,068 | | | Series 2035, Class PC, 6.950%, 03/15/28 | | | 217,144 | |
| | 13,742 | | | Series 2038, Class PN, IO, 7.000%, 03/15/28 | | | 1,619 | |
| | 43,747 | | | Series 2054, Class PV, 7.500%, 05/15/28 | | | 50,601 | |
| | 214,829 | | | Series 2057, Class PE, 6.750%, 05/15/28 | | | 244,025 | |
| | 66,906 | | | Series 2064, Class TE, 7.000%, 06/15/28 | | | 76,967 | |
| | 45,629 | | | Series 2075, Class PH, 6.500%, 08/15/28 | | | 51,560 | |
| | 158,984 | | | Series 2095, Class PE, 6.000%, 11/15/28 | | | 177,676 | |
| | 2,568 | | | Series 2102, Class TU, 6.000%, 12/15/13 | | | 2,589 | |
| | | | | | | | |
PRINCIPAL
AMOUNT($) | | | SECURITY DESCRIPTION | | VALUE($) | |
| | | | | | | | |
| | | | | | | | |
| | | | Agency CMO — Continued | | | | |
| | 5,947 | | | Series 2115, Class PE, 6.000%, 01/15/14 | | | 6,008 | |
| | 9,439 | | | Series 2132, Class SB, HB, IF, 29.710%, 03/15/29 | | | 16,246 | |
| | 16,390 | | | Series 2134, Class PI, IO, 6.500%, 03/15/19 | | | 1,885 | |
| | 433 | | | Series 2135, Class UK, IO, 6.500%, 03/15/14 | | | 7 | |
| | 74,419 | | | Series 2178, Class PB, 7.000%, 08/15/29 | | | 85,327 | |
| | 115,474 | | | Series 2182, Class ZB, 8.000%, 09/15/29 | | | 135,429 | |
| | 19,346 | | | Series 2247, Class Z, 7.500%, 08/15/30 | | | 22,567 | |
| | 233,357 | | | Series 2259, Class ZC, 7.350%, 10/15/30 | | | 270,392 | |
| | 3,850 | | | Series 2261, Class ZY, 7.500%, 10/15/30 | | | 4,474 | |
| | 71,264 | | | Series 2283, Class K, 6.500%, 12/15/23 | | | 79,156 | |
| | 9,484 | | | Series 2306, Class K, PO, 05/15/24 | | | 9,049 | |
| | 22,762 | | | Series 2306, Class SE, IF, IO, 8.670%, 05/15/24 | | | 4,130 | |
| | 25,633 | | | Series 2325, Class PM, 7.000%, 06/15/31 | | | 27,581 | |
| | 153,778 | | | Series 2344, Class ZD, 6.500%, 08/15/31 | | | 166,330 | |
| | 28,008 | | | Series 2344, Class ZJ, 6.500%, 08/15/31 | | | 31,417 | |
| | 14,652 | | | Series 2345, Class NE, 6.500%, 08/15/31 | | | 16,581 | |
| | 79,695 | | | Series 2345, Class PQ, 6.500%, 08/15/16 | | | 83,688 | |
| | 30,319 | | | Series 2355, Class BP, 6.000%, 09/15/16 | | | 31,987 | |
| | 98,315 | | | Series 2359, Class ZB, 8.500%, 06/15/31 | | | 117,407 | |
| | 213,611 | | | Series 2367, Class ME, 6.500%, 10/15/31 | | | 227,888 | |
| | 23,989 | | | Series 2390, Class DO, PO, 12/15/31 | | | 22,445 | |
| | 44,048 | | | Series 2391, Class QR, 5.500%, 12/15/16 | | | 46,412 | |
| | 39,933 | | | Series 2394, Class MC, 6.000%, 12/15/16 | | | 42,291 | |
| | 39,820 | | | Series 2410, Class OE, 6.375%, 02/15/32 | | | 43,209 | |
| | 41,272 | | | Series 2410, Class QS, IF, 19.000%, 02/15/32 | | | 52,262 | |
| | 40,499 | | | Series 2410, Class QX, IF, IO, 8.458%, 02/15/32 | | | 9,735 | |
| | 34,907 | | | Series 2412, Class SP, IF, 15.715%, 02/15/32 | | | 48,773 | |
SEE NOTES TO FINANCIAL STATEMENTS.
| | | | | | |
| | | |
| 6 | | | | JPMORGAN INSURANCE TRUST | | JUNE 30, 2013 |
| | | | | | | | |
PRINCIPAL
AMOUNT($) | | | SECURITY DESCRIPTION | | VALUE($) | |
| | | | | | | | |
| Collateralized Mortgage Obligations — Continued | |
| | | | Agency CMO — Continued | | | | |
| | 81,165 | | | Series 2423, Class MC, 7.000%, 03/15/32 | | | 93,885 | |
| | 139,268 | | | Series 2423, Class MT, 7.000%, 03/15/32 | | | 160,236 | |
| | 227,841 | | | Series 2435, Class CJ, 6.500%, 04/15/32 | | | 251,360 | |
| | 55,253 | | | Series 2444, Class ES, IF, IO, 7.757%, 03/15/32 | | | 12,223 | |
| | 36,836 | | | Series 2450, Class SW, IF, IO, 7.808%, 03/15/32 | | | 8,450 | |
| | 118,885 | | | Series 2455, Class GK, 6.500%, 05/15/32 | | | 134,629 | |
| | 78,297 | | | Series 2484, Class LZ, 6.500%, 07/15/32 | | | 87,904 | |
| | 372,499 | | | Series 2500, Class MC, 6.000%, 09/15/32 | | | 415,405 | |
| | 21,361 | | | Series 2503, Class BH, 5.500%, 09/15/17 | | | 22,805 | |
| | 926 | | | Series 2515, Class DE, 4.000%, 03/15/32 | | | 926 | |
| | 183,138 | | | Series 2527, Class BP, 5.000%, 11/15/17 | | | 194,929 | |
| | 115,213 | | | Series 2535, Class BK, 5.500%, 12/15/22 | | | 127,334 | |
| | 3,374,777 | | | Series 2543, Class YX, 6.000%, 12/15/32 | | | 3,773,038 | |
| | 273,874 | | | Series 2544, Class HC, 6.000%, 12/15/32 | | | 306,474 | |
| | 442,735 | | | Series 2575, Class ME, 6.000%, 02/15/33 | | | 494,932 | |
| | 1,474,542 | | | Series 2578, Class PG, 5.000%, 02/15/18 | | | 1,573,373 | |
| | 34,760 | | | Series 2586, Class WI, IO, 6.500%, 03/15/33 | | | 7,453 | |
| | 1,051 | | | Series 2597, Class DS, IF, IO, 7.358%, 02/15/33 | | | 9 | |
| | 69 | | | Series 2599, Class DS, IF, IO, 6.807%, 02/15/33 | | | — | (h) |
| | 222 | | | Series 2610, Class DS, IF, IO, 6.908%, 03/15/33 | | | — | (h) |
| | 70,163 | | | Series 2626, Class NS, IF, IO, 6.357%, 06/15/23 | | | 6,609 | |
| | 42,451 | | | Series 2638, Class DS, IF, 8.408%, 07/15/23 | | | 47,239 | |
| | 164,087 | | | Series 2647, Class A, 3.250%, 04/15/32 | | | 169,360 | |
| | 773,385 | | | Series 2651, Class VZ, 4.500%, 07/15/18 | | | 818,669 | |
| | 1,556,902 | | | Series 2656, Class BG, 5.000%, 10/15/32 | | | 1,613,742 | |
| | | | | | | | |
PRINCIPAL
AMOUNT($) | | | SECURITY DESCRIPTION | | VALUE($) | |
| | | | | | | | |
| | | | | | | | |
| | | | Agency CMO — Continued | | | | |
| | 205,216 | | | Series 2682, Class LC, 4.500%, 07/15/32 | | | 212,018 | |
| | 17,660 | | | Series 2755, Class SA, IF, 13.815%, 05/15/30 | | | 18,827 | |
| | 19,952 | | | Series 2780, Class JG, 4.500%, 04/15/19 | | | 20,483 | |
| | 625,000 | | | Series 2827, Class DG, 4.500%, 07/15/19 | | | 666,629 | |
| | 11,244 | | | Series 2989, Class PO, PO, 06/15/23 | | | 11,222 | |
| | 300,000 | | | Series 3047, Class OD, 5.500%, 10/15/35 | | | 345,333 | |
| | 254,952 | | | Series 3085, Class VS, HB, IF, 27.950%, 12/15/35 | | | 430,985 | |
| | 82,094 | | | Series 3117, Class EO, PO, 02/15/36 | | | 77,203 | |
| | 76,244 | | | Series 3260, Class CS, IF, IO, 5.947%, 01/15/37 | | | 10,777 | |
| | 228,027 | | | Series 3385, Class SN, IF, IO, 5.807%, 11/15/37 | | | 29,368 | |
| | 234,664 | | | Series 3387, Class SA, IF, IO, 6.227%, 11/15/37 | | | 31,402 | |
| | 217,119 | | | Series 3451, Class SA, IF, IO, 5.857%, 05/15/38 | | | 33,881 | |
| | 583,276 | | | Series 3455, Class SE, IF, IO, 6.008%, 06/15/38 | | | 91,589 | |
| | 585,610 | | | Series 3688, Class NI, IO, 5.000%, 04/15/32 | | | 78,520 | |
| | 190,779 | | | Series 3759, Class HI, IO, 4.000%, 08/15/37 | | | 19,656 | |
| | 283,942 | | | Series 3772, Class IO, IO, 3.500%, 09/15/24 | | | 19,032 | |
| | | | Federal Home Loan Mortgage Corp. STRIPS, | | | | |
| | 213,542 | | | Series 233, Class 11, IO, 5.000%, 09/15/35 | | | 31,028 | |
| | 296,676 | | | Series 239, Class S30, IF, IO, 7.508%, 08/15/36 | | | 35,803 | |
| | 482,072 | | | Series 262, Class 35, 3.500%, 07/15/42 | | | 488,723 | |
| | 492,847 | | | Series 299, Class 300, 3.000%, 01/15/43 | | | 481,514 | |
| | | | Federal Home Loan Mortgage Corp. Structured Pass-Through Securities, | | | | |
| | 18,762 | | | Series T-41, Class 3A, VAR, 6.705%, 07/25/32 | | | 22,008 | |
| | 121,364 | | | Series T-54, Class 2A, 6.500%, 02/25/43 | | | 147,234 | |
| | 55,998 | | | Series T-54, Class 3A, 7.000%, 02/25/43 | | | 67,135 | |
| | 229,581 | | | Series T-56, Class APO, PO, 05/25/43 | | | 193,127 | |
| | 33,237 | | | Series T-58, Class APO, PO, 09/25/43 | | | 24,271 | |
| | | | Federal National Mortgage Association REMIC Trust, | | | | |
| | 59,660 | | | Series 1999-W1, Class PO, PO, 02/25/29 | | | 51,157 | |
SEE NOTES TO FINANCIAL STATEMENTS.
| | | | | | | | |
| | | |
| JUNE 30, 2013 | | JPMORGAN INSURANCE TRUST | | | | | 7 | |
JPMorgan Insurance Trust Core Bond Portfolio
SCHEDULE OF PORTFOLIO INVESTMENTS
AS OF JUNE 30, 2013 (Unaudited) (continued)
| | | | | | | | |
PRINCIPAL
AMOUNT($) | | | SECURITY DESCRIPTION | | VALUE($) | |
| | | | | | | | |
| Collateralized Mortgage Obligations — Continued | |
| | | | Agency CMO — Continued | | | | |
| | 258,274 | | | Series 1999-W4, Class A9, 6.250%, 02/25/29 | | | 290,732 | |
| | 469,282 | | | Series 2002-W7, Class A4, 6.000%, 06/25/29 | | | 536,416 | |
| | 415,694 | | | Series 2003-W1, Class 1A1, VAR, 6.062%, 12/25/42 | | | 463,094 | |
| | 55,086 | | | Series 2003-W1, Class 2A, VAR, 6.830%, 12/25/42 | | | 65,524 | |
| | | | Federal National Mortgage Association REMIC, | | | | |
| | 7,052 | | | Series 1988-16, Class B, 9.500%, 06/25/18 | | | 7,802 | |
| | 4,583 | | | Series 1989-83, Class H, 8.500%, 11/25/19 | | | 5,186 | |
| | 1,073 | | | Series 1990-1, Class D, 8.800%, 01/25/20 | | | 1,221 | |
| | 6,302 | | | Series 1990-10, Class L, 8.500%, 02/25/20 | | | 7,151 | |
| | 689 | | | Series 1990-93, Class G, 5.500%, 08/25/20 | | | 751 | |
| | 21 | | | Series 1990-140, Class K, HB, 652.145%, 12/25/20 | | | 256 | |
| | 1,671 | | | Series 1990-143, Class J, 8.750%, 12/25/20 | | | 1,946 | |
| | 21,260 | | | Series 1992-101, Class J, 7.500%, 06/25/22 | | | 24,110 | |
| | 12,118 | | | Series 1992-143, Class MA, 5.500%, 09/25/22 | | | 13,202 | |
| | 37,406 | | | Series 1993-146, Class E, PO, 05/25/23 | | | 34,355 | |
| | 88,324 | | | Series 1993-155, Class PJ, 7.000%, 09/25/23 | | | 101,917 | |
| | 2,726 | | | Series 1993-165, Class SD, IF, 12.799%, 09/25/23 | | | 3,485 | |
| | 13,592 | | | Series 1993-165, Class SK, IF, 12.500%, 09/25/23 | | | 15,645 | |
| | 118,317 | | | Series 1993-203, Class PL, 6.500%, 10/25/23 | | | 131,419 | |
| | 11,852 | | | Series 1993-205, Class H, PO, 09/25/23 | | | 10,750 | |
| | 652,038 | | | Series 1993-223, Class PZ, 6.500%, 12/25/23 | | | 722,048 | |
| | 113,248 | | | Series 1993-225, Class UB, 6.500%, 12/25/23 | | | 131,321 | |
| | 3,248 | | | Series 1993-230, Class FA, VAR, 0.819%, 12/25/23 | | | 3,272 | |
| | 173,643 | | | Series 1993-250, Class Z, 7.000%, 12/25/23 | | | 180,161 | |
| | 281,326 | | | Series 1994-37, Class L, 6.500%, 03/25/24 | | | 312,591 | |
| | 2,426,520 | | | Series 1994-72, Class K, 6.000%, 04/25/24 | | | 2,683,074 | |
| | | | | | | | |
PRINCIPAL
AMOUNT($) | | | SECURITY DESCRIPTION | | VALUE($) | |
| | | | | | | | |
| | | | | | | | |
| | | | Agency CMO — Continued | | | | |
| | 24,938 | | | Series 1995-2, Class Z, 8.500%, 01/25/25 | | | 29,306 | |
| | 83,206 | | | Series 1995-19, Class Z, 6.500%, 11/25/23 | | | 95,658 | |
| | 5,291 | | | Series 1996-59, Class J, 6.500%, 08/25/22 | | | 5,819 | |
| | 181,239 | | | Series 1997-20, Class IB, IO, VAR, 1.840%, 03/25/27 | | | 6,507 | |
| | 21,129 | | | Series 1997-39, Class PD, 7.500%, 05/20/27 | | | 24,886 | |
| | 45,119 | | | Series 1997-46, Class PL, 6.000%, 07/18/27 | | | 49,813 | |
| | 108,756 | | | Series 1997-61, Class ZC, 7.000%, 02/25/23 | | | 122,443 | |
| | 21,245 | | | Series 1998-36, Class ZB, 6.000%, 07/18/28 | | | 23,367 | |
| | 40,750 | | | Series 1998-43, Class SA, IF, IO, 19.103%, 04/25/23 | | | 15,354 | |
| | 59,668 | | | Series 1998-46, Class GZ, 6.500%, 08/18/28 | | | 67,387 | |
| | 111,389 | | | Series 1998-58, Class PC, 6.500%, 10/25/28 | | | 125,802 | |
| | 262,627 | | | Series 1999-39, Class JH, IO, 6.500%, 08/25/29 | | | 46,184 | |
| | 7,241 | | | Series 2000-52, Class IO, IO, 8.500%, 01/25/31 | | | 1,112 | |
| | 103,387 | | | Series 2001-4, Class PC, 7.000%, 03/25/21 | | | 115,104 | |
| | 84,125 | | | Series 2001-30, Class PM, 7.000%, 07/25/31 | | | 96,535 | |
| | 305,478 | | | Series 2001-33, Class ID, IO, 6.000%, 07/25/31 | | | 55,290 | |
| | 126,388 | | | Series 2001-36, Class DE, 7.000%, 08/25/31 | | | 145,882 | |
| | 14,939 | | | Series 2001-44, Class PD, 7.000%, 09/25/31 | | | 16,998 | |
| | 25,987 | | | Series 2001-52, Class XN, 6.500%, 11/25/15 | | | 27,220 | |
| | 211,272 | | | Series 2001-61, Class Z, 7.000%, 11/25/31 | | | 240,509 | |
| | 49,070 | | | Series 2001-69, Class PG, 6.000%, 12/25/16 | | | 51,789 | |
| | 36,064 | | | Series 2001-71, Class QE, 6.000%, 12/25/16 | | | 38,078 | |
| | 31,947 | | | Series 2002-1, Class HC, 6.500%, 02/25/22 | | | 35,348 | |
| | 9,608 | | | Series 2002-1, Class SA, HB, IF, 24.560%, 02/25/32 | | | 15,718 | |
SEE NOTES TO FINANCIAL STATEMENTS.
| | | | | | |
| | | |
| 8 | | | | JPMORGAN INSURANCE TRUST | | JUNE 30, 2013 |
| | | | | | | | |
PRINCIPAL
AMOUNT($) | | | SECURITY DESCRIPTION | | VALUE($) | |
| | | | | | | | |
| Collateralized Mortgage Obligations — Continued | |
| | | | Agency CMO — Continued | | | | |
| | 57,937 | | | Series 2002-2, Class UC, 6.000%, 02/25/17 | | | 61,475 | |
| | 59,097 | | | Series 2002-3, Class OG, 6.000%, 02/25/17 | | | 62,392 | |
| | 250,871 | | | Series 2002-13, Class SJ, IF, IO, 1.600%, 03/25/32 | | | 10,934 | |
| | 216,532 | | | Series 2002-15, Class PO, PO, 04/25/32 | | | 201,171 | |
| | 100,480 | | | Series 2002-28, Class PK, 6.500%, 05/25/32 | | | 113,793 | |
| | 330,702 | | | Series 2002-62, Class ZE, 5.500%, 11/25/17 | | | 352,794 | |
| | 202,658 | | | Series 2002-68, Class SH, IF, IO, 7.808%, 10/18/32 | | | 39,475 | |
| | 22,991 | | | Series 2002-77, Class S, IF, 14.129%, 12/25/32 | | | 30,302 | |
| | 227,977 | | | Series 2002-94, Class BK, 5.500%, 01/25/18 | | | 241,822 | |
| | 287,069 | | | Series 2003-7, Class A1, 6.500%, 12/25/42 | | | 329,613 | |
| | 293,000 | | | Series 2003-22, Class UD, 4.000%, 04/25/33 | | | 308,532 | |
| | 96,239 | | | Series 2003-44, Class IU, IO, 7.000%, 06/25/33 | | | 11,768 | |
| | 82,410 | | | Series 2003-47, Class PE, 5.750%, 06/25/33 | | | 89,683 | |
| | 17,567 | | | Series 2003-64, Class SX, IF, 13.266%, 07/25/33 | | | 20,712 | |
| | 33,630 | | | Series 2003-66, Class PA, 3.500%, 02/25/33 | | | 34,973 | |
| | 52,245 | | | Series 2003-71, Class DS, IF, 7.208%, 08/25/33 | | | 50,892 | |
| | 145,504 | | | Series 2003-71, Class IM, IO, 5.500%, 12/25/31 | | | 8,249 | |
| | 128,921 | | | Series 2003-80, Class SY, IF, IO, 7.457%, 06/25/23 | | | 12,913 | |
| | 1,822,237 | | | Series 2003-81, Class MC, 5.000%, 12/25/32 | | | 1,892,918 | |
| | 506,777 | | | Series 2003-82, Class VB, 5.500%, 08/25/33 | | | 550,372 | |
| | 33,084 | | | Series 2003-91, Class SD, IF, 12.178%, 09/25/33 | | | 39,732 | |
| | 267,876 | | | Series 2003-116, Class SB, IF, IO, 7.407%, 11/25/33 | | | 55,706 | |
| | 1,547,152 | | | Series 2003-128, Class DY, 4.500%, 01/25/24 | | | 1,677,591 | |
| | 19,861 | | | Series 2003-130, Class SX, IF, 11.230%, 01/25/34 | | | 23,648 | |
| | 43,561 | | | Series 2003-132, Class OA, PO, 08/25/33 | | | 42,018 | |
| | | | | | | | |
PRINCIPAL
AMOUNT($) | | | SECURITY DESCRIPTION | | VALUE($) | |
| | | | | | | | |
| | | | | | | | |
| | | | Agency CMO — Continued | | | | |
| | 1,117,373 | | | Series 2004-2, Class OE, 5.000%, 05/25/23 | | | 1,178,639 | |
| | 125,591 | | | Series 2004-4, Class QM, IF, 13.814%, 06/25/33 | | | 156,096 | |
| | 75,003 | | | Series 2004-10, Class SC, HB, IF, 27.828%, 02/25/34 | | | 105,661 | |
| | 175,071 | | | Series 2004-36, Class SA, IF, 18.994%, 05/25/34 | | | 237,038 | |
| | 117,540 | | | Series 2004-46, Class SK, IF, 15.969%, 05/25/34 | | | 159,265 | |
| | 19,532 | | | Series 2004-51, Class SY, IF, 13.854%, 07/25/34 | | | 25,088 | |
| | 94,005 | | | Series 2004-61, Class SK, IF, 8.500%, 11/25/32 | | | 94,000 | |
| | 627,864 | | | Series 2004-75, Class VK, 4.500%, 09/25/22 | | | 634,394 | |
| | 104,740 | | | Series 2004-76, Class CL, 4.000%, 10/25/19 | | | 110,157 | |
| | 2,754 | | | Series 2004-92, Class JO, PO, 12/25/34 | | | 2,753 | |
| | 258,525 | | | Series 2005-45, Class DC, HB, IF, 23.602%, 06/25/35 | | | 395,247 | |
| | 56,883 | | | Series 2005-52, Class PA, 6.500%, 06/25/35 | | | 61,315 | |
| | 536,942 | | | Series 2005-68, Class BC, 5.250%, 06/25/35 | | | 586,986 | |
| | 310,096 | | | Series 2005-84, Class XM, 5.750%, 10/25/35 | | | 344,890 | |
| | 700,000 | | | Series 2005-110, Class MN, 5.500%, 06/25/35 | | | 759,539 | |
| | 99,993 | | | Series 2006-22, Class AO, PO, 04/25/36 | | | 91,126 | |
| | 46,373 | | | Series 2006-46, Class SW, HB, IF, 23.492%, 06/25/36 | | | 67,517 | |
| | 108,637 | | | Series 2006-59, Class QO, PO, 01/25/33 | | | 108,291 | |
| | 143,370 | | | Series 2006-110, Class PO, PO, 11/25/36 | | | 132,580 | |
| | 263,134 | | | Series 2006-117, Class GS, IF, IO, 6.457%, 12/25/36 | | | 41,646 | |
| | 97,134 | | | Series 2007-7, Class SG, IF, IO, 6.307%, 08/25/36 | | | 19,551 | |
| | 449,873 | | | Series 2007-53, Class SH, IF, IO, 5.907%, 06/25/37 | | | 73,326 | |
| | 320,114 | | | Series 2007-88, Class VI, IF, IO, 6.347%, 09/25/37 | | | 50,190 | |
| | 334,471 | | | Series 2007-100, Class SM, IF, IO, 6.257%, 10/25/37 | | | 39,533 | |
| | 339,992 | | | Series 2008-1, Class BI, IF, IO, 5.717%, 02/25/38 | | | 43,222 | |
| | 101,883 | | | Series 2008-16, Class IS, IF, IO, 6.007%, 03/25/38 | | | 12,154 | |
SEE NOTES TO FINANCIAL STATEMENTS.
| | | | | | | | |
| | | |
| JUNE 30, 2013 | | JPMORGAN INSURANCE TRUST | | | | | 9 | |
JPMorgan Insurance Trust Core Bond Portfolio
SCHEDULE OF PORTFOLIO INVESTMENTS
AS OF JUNE 30, 2013 (Unaudited) (continued)
| | | | | | | | |
PRINCIPAL
AMOUNT($) | | | SECURITY DESCRIPTION | | VALUE($) | |
| | | | | | | | |
| Collateralized Mortgage Obligations — Continued | |
| | | | Agency CMO — Continued | | | | |
| | 156,561 | | | Series 2008-46, Class HI, IO, VAR, 1.889%, 06/25/38 | | | 11,629 | |
| | 128,062 | | | Series 2008-53, Class CI, IF, IO, 7.007%, 07/25/38 | | | 20,097 | |
| | 301,292 | | | Series 2009-112, Class ST, IF, IO, 6.057%, 01/25/40 | | | 34,816 | |
| | 156,143 | | | Series 2010-35, Class SB, IF, IO, 6.227%, 04/25/40 | | | 21,591 | |
| | 2,749 | | | Series G92-42, Class Z, 7.000%, 07/25/22 | | | 3,065 | |
| | 50,067 | | | Series G92-44, Class ZQ, 8.000%, 07/25/22 | | | 55,201 | |
| | 29,557 | | | Series G92-54, Class ZQ, 7.500%, 09/25/22 | | | 33,025 | |
| | 1,945 | | | Series G92-59, Class F, VAR, 1.670%, 10/25/22 | | | 1,964 | |
| | 5,217 | | | Series G92-61, Class Z, 7.000%, 10/25/22 | | | 6,054 | |
| | 12,089 | | | Series G92-66, Class KA, 6.000%, 12/25/22 | | | 13,226 | |
| | 57,177 | | | Series G92-66, Class KB, 7.000%, 12/25/22 | | | 64,273 | |
| | 15,825 | | | Series G93-1, Class KA, 7.900%, 01/25/23 | | | 18,072 | |
| | 16,723 | | | Series G93-17, Class SI, IF, 6.000%, 04/25/23 | | | 17,514 | |
| | | | Federal National Mortgage Association STRIPS, | | | | |
| | 19,927 | | | Series 329, Class 1, PO, 01/01/33 | | | 18,103 | |
| | 94,958 | | | Series 365, Class 8, IO, 5.500%, 05/01/36 | | | 12,797 | |
| | 58,882 | | | Federal National Mortgage Association Trust, Series 2004-W2, Class 2A2, 7.000%, 02/25/44 | | | 68,465 | |
| | | | Government National Mortgage Association, | | | | |
| | 197,563 | | | Series 1994-7, Class PQ, 6.500%, 10/16/24 | | | 228,045 | |
| | 113,176 | | | Series 1998-22, Class PD, 6.500%, 09/20/28 | | | 121,080 | |
| | 58,437 | | | Series 1998-26, Class K, 7.500%, 09/17/25 | | | 66,549 | |
| | 35,911 | | | Series 1999-17, Class L, 6.000%, 05/20/29 | | | 38,351 | |
| | 44,309 | | | Series 1999-41, Class Z, 8.000%, 11/16/29 | | | 52,652 | |
| | 32,362 | | | Series 1999-44, Class PC, 7.500%, 12/20/29 | | | 38,028 | |
| | 40,927 | | | Series 1999-44, Class ZG, 8.000%, 12/20/29 | | | 48,836 | |
| | | | | | | | |
PRINCIPAL
AMOUNT($) | | | SECURITY DESCRIPTION | | VALUE($) | |
| | | | | | | | |
| | | | | | | | |
| | | | Agency CMO — Continued | | | | |
| | 180,446 | | | Series 2000-21, Class Z, 9.000%, 03/16/30 | | | 215,989 | |
| | 3,775 | | | Series 2000-36, Class IK, IO, 9.000%, 11/16/30 | | | 656 | |
| | 658,552 | | | Series 2000-36, Class PB, 7.500%, 11/16/30 | | | 747,461 | |
| | 1,301,160 | | | Series 2001-10, Class PE, 6.500%, 03/16/31 | | | 1,470,765 | |
| | 202,855 | | | Series 2001-22, Class PS, HB, IF, 20.508%, 03/17/31 | | | 336,714 | |
| | 78,531 | | | Series 2001-36, Class S, IF, IO, 7.858%, 08/16/31 | | | 17,442 | |
| | 102,442 | | | Series 2001-53, Class SR, IF, IO, 7.958%, 10/20/31 | | | 9,480 | |
| | 100,465 | | | Series 2001-64, Class MQ, 6.500%, 12/20/31 | | | 116,826 | |
| | 1,000,000 | | | Series 2001-64, Class PB, 6.500%, 12/20/31 | | | 1,163,600 | |
| | 13,609 | | | Series 2002-24, Class SB, IF, 11.636%, 04/16/32 | | | 17,707 | |
| | 2,915 | | | Series 2003-4, Class NI, IO, 5.500%, 01/20/32 | | | 5 | |
| | 7,469 | | | Series 2003-24, Class PO, PO, 03/16/33 | | | 6,520 | |
| | 39,934 | | | Series 2003-76, Class LS, IF, IO, 7.008%, 09/20/31 | | | 1,117 | |
| | 390,157 | | | Series 2004-11, Class SW, IF, IO, 5.308%, 02/20/34 | | | 54,118 | |
| | 40,929 | | | Series 2004-28, Class S, IF, 19.133%, 04/16/34 | | | 58,416 | |
| | 295,026 | | | Series 2007-45, Class QA, IF, IO, 6.448%, 07/20/37 | | | 45,280 | |
| | 243,320 | | | Series 2007-76, Class SA, IF, IO, 6.338%, 11/20/37 | | | 36,553 | |
| | 225,585 | | | Series 2008-2, Class MS, IF, IO, 6.968%, 01/16/38 | | | 37,237 | |
| | 172,078 | | | Series 2008-55, Class SA, IF, IO, 6.008%, 06/20/38 | | | 24,264 | |
| | 147,608 | | | Series 2009-6, Class SA, IF, IO, 5.907%, 02/16/39 | | | 23,261 | |
| | 367,546 | | | Series 2009-6, Class SH, IF, IO, 5.848%, 02/20/39 | | | 48,836 | |
| | 248,739 | | | Series 2009-14, Class KI, IO, 6.500%, 03/20/39 | | | 40,930 | |
| | 171,320 | | | Series 2009-14, Class NI, IO, 6.500%, 03/20/39 | | | 28,102 | |
| | 525,651 | | | Series 2009-22, Class SA, IF, IO, 6.078%, 04/20/39 | | | 72,486 | |
| | 487,807 | | | Series 2009-31, Class ST, IF, IO, 6.158%, 03/20/39 | | | 68,454 | |
SEE NOTES TO FINANCIAL STATEMENTS.
| | | | | | |
| | | |
| 10 | | | | JPMORGAN INSURANCE TRUST | | JUNE 30, 2013 |
| | | | | | | | |
PRINCIPAL
AMOUNT($) | | | SECURITY DESCRIPTION | | VALUE($) | |
| | | | | | | | |
| Collateralized Mortgage Obligations — Continued | |
| | | | Agency CMO — Continued | | | | |
| | 487,807 | | | Series 2009-31, Class TS, IF, IO, 6.108%, 03/20/39 | | | 69,950 | |
| | 511,226 | | | Series 2009-64, Class SN, IF, IO, 5.907%, 07/16/39 | | | 74,131 | |
| | 165,173 | | | Series 2009-79, Class OK, PO, 11/16/37 | | | 141,442 | |
| | 266,252 | | | Series 2009-102, Class SM, IF, IO, 6.208%, 06/16/39 | | | 29,908 | |
| | 717,699 | | | Series 2009-106, Class ST, IF, IO, 5.808%, 02/20/38 | | | 97,916 | |
| | 234,164 | | | Series 2010-130, Class CP, 7.000%, 10/16/40 | | | 271,080 | |
| | 485,759 | | | Series 2011-75, Class SM, IF, IO, 6.408%, 05/20/41 | | | 65,300 | |
| | 993,264 | | | Series 2013-H08, Class FC, VAR, 0.450%, 02/20/63 | | | 990,523 | |
| | 501,033 | | | Series 2013-H09, Class HA, 1.650%, 04/20/63 | | | 487,618 | |
| | | | Vendee Mortgage Trust, | | | | |
| | 71,934 | | | Series 1994-1, Class 1, VAR, 5.627%, 02/15/24 | | | 79,799 | |
| | 166,807 | | | Series 1996-1, Class 1Z, 6.750%, 02/15/26 | | | 189,025 | |
| | 94,159 | | | Series 1996-2, Class 1Z, 6.750%, 06/15/26 | | | 108,034 | |
| | 342,350 | | | Series 1997-1, Class 2Z, 7.500%, 02/15/27 | | | 392,560 | |
| | 90,783 | | | Series 1998-1, Class 2E, 7.000%, 03/15/28 | | | 104,880 | |
| | | | | | | | |
| | | | | | | 46,505,535 | |
| | | | | | | | |
| | | | Non-Agency CMO — 9.3% | | | | |
| | | | Alternative Loan Trust, | | | | |
| | 62,441 | | | Series 2002-8, Class A4, 6.500%, 07/25/32 | | | 64,563 | |
| | 23,685 | | | Series 2003-J1, Class PO, PO, 10/25/33 | | | 19,388 | |
| | 1,888,241 | | | Series 2004-2CB, Class 1A9, 5.750%, 03/25/34 | | | 1,857,151 | |
| | 63,104 | | | Series 2004-18CB, Class 2A4, 5.700%, 09/25/34 | | | 64,294 | |
| | 689,200 | | | Series 2005-20CB, Class 3A8, IF, IO, 4.557%, 07/25/35 | | | 98,303 | |
| | 980,262 | | | Series 2005-28CB, Class 1A4, 5.500%, 08/25/35 | | | 922,146 | |
| | 496,509 | | | Series 2005-54CB, Class 1A11, 5.500%, 11/25/35 | | | 447,881 | |
| | 942,920 | | | Series 2005-22T1, Class A2, IF, IO, 4.877%, 06/25/35 | | | 168,621 | |
| | 899,564 | | | Series 2005-J1, Class 1A4, IF, IO, 4.907%, 02/25/35 | | | 118,371 | |
| | | | | | | | |
PRINCIPAL
AMOUNT($) | | | SECURITY DESCRIPTION | | VALUE($) | |
| | | | | | | | |
| | | | | | | | |
| | | | Non-Agency CMO — Continued | | | | |
| | 39,742 | | | Alternative Loan Trust Resecuritization, Series 2005-5R, Class A1, 5.250%, 12/25/18 | | | 40,245 | |
| | 200,000 | | | American General Mortgage Loan Trust, Series 2009-1, Class A7, VAR, 5.750%, 09/25/48 (e) | | | 205,924 | |
| | | | Banc of America Alternative Loan Trust, | | | | |
| | 79,739 | | | Series 2003-9, Class 1CB2, 5.500%, 11/25/33 | | | 81,699 | |
| | 314,167 | | | Series 2004-5, Class 3A3, PO, 06/25/34 | | | 237,835 | |
| | 51,232 | | | Series 2004-6, Class 15PO, PO, 07/25/19 | | | 50,306 | |
| | | | Banc of America Funding Trust, | | | | |
| | 52,351 | | | Series 2004-1, Class PO, PO, 03/25/34 | | | 47,036 | |
| | 414,390 | | | Series 2005-6, Class 2A7, 5.500%, 10/25/35 | | | 407,420 | |
| | 64,273 | | | Series 2005-7, Class 30PO, PO, 11/25/35 | | | 50,361 | |
| | 234,011 | | | Series 2005-E, Class 4A1, VAR, 2.687%, 03/20/35 | | | 232,614 | |
| | | | Banc of America Mortgage Trust, | | | | |
| | 19,300 | | | Series 2003-8, Class APO, PO, 11/25/33 | | | 16,332 | |
| | 124,001 | | | Series 2004-3, Class 1A26, 5.500%, 04/25/34 | | | 126,673 | |
| | 14,474 | | | Series 2004-4, Class APO, PO, 05/25/34 | | | 12,178 | |
| | 384,855 | | | Series 2004-5, Class 2A2, 5.500%, 06/25/34 | | | 397,363 | |
| | 181,285 | | | Series 2004-6, Class 2A5, PO, 07/25/34 | | | 144,502 | |
| | 50,483 | | | Series 2004-6, Class APO, PO, 07/25/34 | | | 45,340 | |
| | 162,177 | | | Series 2004-7, Class 1A19, PO, 08/25/34 | | | 149,680 | |
| | 191,062 | | | Series 2004-J, Class 3A1, VAR, 3.231%, 11/25/34 | | | 187,077 | |
| | | | BCAP LLC Trust, | | | | |
| | 172,807 | | | Series 2011-RR5, Class 11A3, VAR, 0.343%, 05/28/36 (e) | | | 159,323 | |
| | 67,230 | | | Series 2011-RR5, Class 14A3, VAR, 2.660%, 07/26/36 (e) | | | 67,038 | |
| | | | Bear Stearns ARM Trust, | | | | |
| | 66,540 | | | Series 2003-7, Class 3A, VAR, 2.567%, 10/25/33 | | | 66,000 | |
| | 138,192 | | | Series 2005-5, Class A1, VAR, 2.240%, 08/25/35 | | | 136,662 | |
| | 419,263 | | | Series 2006-1, Class A1, VAR, 2.370%, 02/25/36 | | | 402,505 | |
| | 279,403 | | | CAM Mortgage Trust, Series 2013-1, Class A, VAR, 3.967%, 11/25/57 (e) (i) | | | 275,910 | |
| | | | CHL Mortgage Pass-Through Trust, | | | | |
| | 170,245 | | | Series 2003-26, Class 1A6, 3.500%, 08/25/33 | | | 169,954 | |
SEE NOTES TO FINANCIAL STATEMENTS.
| | | | | | | | |
| | | |
| JUNE 30, 2013 | | JPMORGAN INSURANCE TRUST | | | | | 11 | |
JPMorgan Insurance Trust Core Bond Portfolio
SCHEDULE OF PORTFOLIO INVESTMENTS
AS OF JUNE 30, 2013 (Unaudited) (continued)
| | | | | | | | |
PRINCIPAL
AMOUNT($) | | | SECURITY DESCRIPTION | | VALUE($) | |
| | | | | | | | |
| Collateralized Mortgage Obligations — Continued | |
| | | | Non-Agency CMO — Continued | | | | |
| | 25,705 | | | Series 2003-J7, Class 4A3, IF, 9.523%, 08/25/18 | | | 26,960 | |
| | 89,273 | | | Series 2004-7, Class 2A1, VAR, 2.708%, 06/25/34 | | | 86,740 | |
| | 55,515 | | | Series 2004-HYB1, Class 2A, VAR, 2.811%, 05/20/34 | | | 51,726 | |
| | 76,386 | | | Series 2004-HYB3, Class 2A, VAR, 2.589%, 06/20/34 | | | 70,022 | |
| | 95,871 | | | Series 2004-J8, Class 1A2, 4.750%, 11/25/19 | | | 98,426 | |
| | 36,328 | | | Series 2004-J8, Class POA, PO, 11/25/19 | | | 33,524 | |
| | 259,409 | | | Series 2005-16, Class A23, 5.500%, 09/25/35 | | | 252,415 | |
| | 378,038 | | | Series 2005-22, Class 2A1, VAR, 2.997%, 11/25/35 | | | 303,189 | |
| | 73,779 | | | Citicorp Mortgage Securities, Inc., Series 2004-5, Class 2A5, 4.500%, 08/25/34 | | | 76,134 | |
| | 99,259 | | | Citigroup Mortgage Loan Trust, 2.110%, 01/12/18 | | | 99,434 | |
| | 409,891 | | | Series 2010-8, Class 6A6, 4.500%, 12/25/36 (e) | | | 420,261 | |
| | | | Citigroup Mortgage Loan Trust, Inc., | | | | |
| | 12,987 | | | Series 2003-UP3, Class A3, 7.000%, 09/25/33 | | | 13,475 | |
| | 25,233 | | | Series 2003-UST1, Class A1, 5.500%, 12/25/18 | | | 26,380 | |
| | 7,588 | | | Series 2003-UST1, Class PO1, PO, 12/25/18 | | | 6,912 | |
| | 5,998 | | | Series 2003-UST1, Class PO3, PO, 12/25/18 | | | 5,560 | |
| | 119,732 | | | Series 2005-1, Class 2A1A, VAR, 2.807%, 04/25/35 | | | 92,339 | |
| | 10,996 | | | Credit Suisse First Boston Mortgage Securities Corp., Series 2004-5, Class 5P, PO, 08/25/19 | | | 10,120 | |
| | | | CSMC, | | | | |
| | 223,692 | | | Series 2010-11R, Class A6, VAR, 1.198%, 06/28/47 (e) | | | 207,286 | |
| | 112,233 | | | Series 2011-7R, Class A1, VAR, 1.444%, 08/28/47 (e) | | | 111,737 | |
| | 219,218 | | | Series 2011-9R, Class A1, VAR, 2.194%, 03/27/46 (e) | | | 219,104 | |
| | 300,467 | | | First Horizon Alternative Mortgage Securities Trust, Series 2005-FA8, Class 1A19, 5.500%, 11/25/35 | | | 262,515 | |
| | | | First Horizon Mortgage Pass-Through Trust, | | | | |
| | 293,370 | | | Series 2004-AR7, Class 2A2, VAR, 2.545%, 02/25/35 | | | 291,184 | |
| | | | | | | | |
PRINCIPAL
AMOUNT($) | | | SECURITY DESCRIPTION | | VALUE($) | |
| | | | | | | | |
| | | | | | | | |
| | | | Non-Agency CMO — Continued | | | | |
| | 193,049 | | | Series 2005-AR1, Class 2A2, VAR, 2.657%, 04/25/35 | | | 191,185 | |
| | | | GMACM Mortgage Loan Trust, | | | | |
| | 169,070 | | | Series 2003-AR1, Class A4, VAR, 3.372%, 10/19/33 | | | 169,928 | |
| | 160,931 | | | Series 2004-J5, Class A7, 6.500%, 01/25/35 | | | 170,795 | |
| | 640,039 | | | Series 2005-AR3, Class 3A4, VAR, 3.310%, 06/19/35 | | | 600,156 | |
| | | | GSR Mortgage Loan Trust, | | | | |
| | 175,719 | | | Series 2004-6F, Class 1A2, 5.000%, 05/25/34 | | | 181,617 | |
| | 466,403 | | | Series 2004-6F, Class 3A4, 6.500%, 05/25/34 | | | 501,233 | |
| | 81,133 | | | Series 2004-13F, Class 3A3, 6.000%, 11/25/34 | | | 80,231 | |
| | 76,564 | | | Impac Secured Assets Trust, Series 2006-1, Class 2A1, VAR, 0.543%, 05/25/36 | | | 74,825 | |
| | 1,544,647 | | | IndyMac INDX Mortgage Loan Trust, Series 2005-AR11, Class A7, IO, VAR, 0.000%, 08/25/35 | | | 241 | |
| | 161,543 | | | JP Morgan Mortgage Trust, Series 2006-A2, Class 5A3, VAR, 2.888%, 11/25/33 | | | 160,952 | |
| | 96,237 | | | MASTR Adjustable Rate Mortgages Trust, Series 2004-13, Class 2A1, VAR, 2.672%, 04/21/34 | | | 97,395 | |
| | | | MASTR Alternative Loan Trust, | | | | |
| | 133,429 | | | Series 2003-9, Class 8A1, 6.000%, 01/25/34 | | | 136,702 | |
| | 279,487 | | | Series 2004-4, Class 10A1, 5.000%, 05/25/24 | | | 290,213 | |
| | 238,209 | | | Series 2004-6, Class 7A1, 6.000%, 07/25/34 | | | 244,640 | |
| | 32,080 | | | Series 2004-7, Class 30PO, PO, 08/25/34 | | | 23,556 | |
| | 173,086 | | | Series 2004-8, Class 6A1, 5.500%, 09/25/19 | | | 181,507 | |
| | 134,490 | | | Series 2004-10, Class 1A1, 4.500%, 09/25/19 | | | 137,431 | |
| | | | MASTR Asset Securitization Trust, | | | | |
| | 379,632 | | | Series 2003-11, Class 9A6, 5.250%, 12/25/33 | | | 395,672 | |
| | 22,027 | | | Series 2003-12, Class 15PO, PO, 12/25/18 | | | 19,976 | |
| | 50,521 | | | Series 2004-6, Class 15PO, PO, 07/25/19 | | | 46,215 | |
| | 30,986 | | | Series 2004-8, Class PO, PO, 08/25/19 | | | 28,553 | |
| | 95,037 | | | Series 2004-10, Class 15PO, PO, 10/25/19 | | | 86,525 | |
SEE NOTES TO FINANCIAL STATEMENTS.
| | | | | | |
| | | |
| 12 | | | | JPMORGAN INSURANCE TRUST | | JUNE 30, 2013 |
| | | | | | | | |
PRINCIPAL
AMOUNT($) | | | SECURITY DESCRIPTION | | VALUE($) | |
| | | | | | | | |
| Collateralized Mortgage Obligations — Continued | |
| | | | Non-Agency CMO — Continued | | | | |
| | 186,363 | | | MASTR Resecuritization Trust, Series 2005-PO, Class 3PO, PO, 05/28/35 (e) | | | 149,090 | |
| | 73,096 | | | MortgageIT Trust, Series 2005-1, Class 1A1, VAR, 0.513%, 02/25/35 | | | 69,345 | |
| | 60,246 | | | NACC Reperforming Loan REMIC Trust, Series 2004-R2, Class A1, VAR, 6.500%, 10/25/34 (e) | | | 61,730 | |
| | 462,346 | | | PHH Alternative Mortgage Trust, Series 2007-2, Class 2X, IO, 6.000%, 05/25/37 | | | 94,303 | |
| | | | RALI Trust, | | | | |
| | 62,002 | | | Series 2002-QS8, Class A5, 6.250%, 06/25/17 | | | 63,361 | |
| | 923,853 | | | Series 2003-QR19, Class CB4, 5.750%, 10/25/33 | | | 953,834 | |
| | 18,175 | | | Series 2003-QS3, Class A2, IF, 16.075%, 02/25/18 | | | 19,924 | |
| | 40,230 | | | Series 2003-QS3, Class A8, IF, IO, 7.407%, 02/25/18 | | | 2,401 | |
| | 127,214 | | | Series 2003-QS9, Class A3, IF, IO, 7.357%, 05/25/18 | | | 15,739 | |
| | 166,323 | | | Series 2003-QS14, Class A1, 5.000%, 07/25/18 | | | 169,762 | |
| | 54,111 | | | Series 2003-QS18, Class A1, 5.000%, 09/25/18 | | | 55,685 | |
| | 13,670 | | | Residential Asset Securitization Trust, Series 2003-A14, Class A1, 4.750%, 02/25/19 | | | 14,024 | |
| | 166,373 | | | RFMSI Trust, Series 2005-SA4, Class 1A1, VAR, 3.089%, 09/25/35 | | | 134,069 | |
| | 5,706 | | | SACO I, Inc., Series 1997-2, Class 1A5, 7.000%, 08/25/36 (e) | | | 5,939 | |
| | | | Salomon Brothers Mortgage Securities VII, Inc., | | | | |
| | 99,071 | | | Series 2003-HYB1, Class A, VAR, 3.095%, 09/25/33 | | | 98,710 | |
| | 4,454 | | | Series 2003-UP2, Class PO1, PO, 12/25/18 | | | 4,019 | |
| | | | Springleaf Mortgage Loan Trust, | | | | |
| | 63,365 | | | Series 2011-1A, Class A1, VAR, 4.050%, 01/25/58 (e) | | | 65,472 | |
| | 96,575 | | | Series 2012-2A, Class A, VAR, 2.220%, 10/25/57 (e) | | | 97,976 | |
| | 301,164 | | | Series 2013-1A, Class A, VAR, 1.270%, 06/25/58 (e) | | | 301,687 | |
| | 124,000 | | | Series 2013-1A, Class M1, VAR, 2.310%, 06/25/58 (e) | | | 124,214 | |
| | 108,000 | | | Series 2013-1A, Class M2, VAR, 3.140%, 06/25/58 (e) | | | 108,316 | |
| | | | | | | | |
PRINCIPAL
AMOUNT($) | | | SECURITY DESCRIPTION | | VALUE($) | |
| | | | | | | | |
| | | | | | | | |
| | | | Non-Agency CMO — Continued | | | | |
| | 382,026 | | | Structured Adjustable Rate Mortgage Loan Trust, Series 2004-6, Class 5A4, VAR, 4.876%, 06/25/34 | | | 382,562 | |
| | | | Structured Asset Securities Corp. Mortgage Pass-Through Certificates, | | | | |
| | 43,861 | | | Series 2003-8, Class 1A2, 5.000%, 04/25/18 | | | 44,617 | |
| | 137,248 | | | Series 2003-33H, Class 1A1, 5.500%, 10/25/33 | | | 140,665 | |
| | | | WaMu Mortgage Pass-Through Certificates, | | | | |
| | 25,141 | | | Series 2003-AR8, Class A, VAR, 2.457%, 08/25/33 | | | 25,172 | |
| | 126,135 | | | Series 2003-AR9, Class 1A6, VAR, 2.429%, 09/25/33 | | | 126,184 | |
| | 49,547 | | | Series 2003-S4, Class 3A, 5.500%, 06/25/33 | | | 51,078 | |
| | 45,770 | | | Series 2004-AR3, Class A2, VAR, 2.458%, 06/25/34 | | | 45,556 | |
| | | | Washington Mutual Mortgage Pass-Through Certificates WMALT, | | | | |
| | 1,648,720 | | | Series 2005-2, Class 1A4, IF, IO, 4.857%, 04/25/35 | | | 295,477 | |
| | 511,073 | | | Series 2005-2, Class 2A3, IF, IO, 4.807%, 04/25/35 | | | 83,944 | |
| | 444,295 | | | Series 2005-3, Class CX, IO, 5.500%, 05/25/35 | | | 120,811 | |
| | 408,035 | | | Series 2005-4, Class CB7, 5.500%, 06/25/35 | | | 378,464 | |
| | 24,394 | | | Series 2005-4, Class DP, PO, 06/25/20 | | | 23,808 | |
| | 147,135 | | | Series 2005-6, Class 2A4, 5.500%, 08/25/35 | | | 133,858 | |
| | | | Wells Fargo Mortgage-Backed Securities Trust, | | | | |
| | 39,264 | | | Series 2003-K, Class 1A1, VAR, 4.484%, 11/25/33 | | | 39,336 | |
| | 78,527 | | | Series 2003-K, Class 1A2, VAR, 4.484%, 11/25/33 | | | 79,306 | |
| | 88,131 | | | Series 2004-EE, Class 3A1, VAR, 2.889%, 12/25/34 | | | 87,660 | |
| | 236,771 | | | Series 2004-P, Class 2A1, VAR, 2.614%, 09/25/34 | | | 237,057 | |
| | 136,004 | | | Series 2005-AR8, Class 2A1, VAR, 2.720%, 06/25/35 | | | 136,469 | |
| | 95,332 | | | Series 2005-AR16, Class 2A1, VAR, 2.717%, 02/25/34 | | | 94,988 | |
| | | | | | | | |
| | | | | | | 19,192,298 | |
| | | | | | | | |
| | | | Total Collateralized Mortgage Obligations (Cost $60,833,533) | | | 65,697,833 | |
| | | | | | | | |
SEE NOTES TO FINANCIAL STATEMENTS.
| | | | | | | | |
| | | |
| JUNE 30, 2013 | | JPMORGAN INSURANCE TRUST | | | | | 13 | |
JPMorgan Insurance Trust Core Bond Portfolio
SCHEDULE OF PORTFOLIO INVESTMENTS
AS OF JUNE 30, 2013 (Unaudited) (continued)
| | | | | | | | |
PRINCIPAL
AMOUNT($) | | | SECURITY DESCRIPTION | | VALUE($) | |
| | | | | | | | |
| Commercial Mortgage-Backed Securities — 2.6% | |
| | 250,000 | | | A10 Securitization LLC, Series 2013-1, Class A, 2.400%, 11/15/25 (e) | | | 247,777 | |
| | 250,000 | | | Banc of America Commercial Mortgage Trust, Series 2006-4, Class A4, 5.634%, 07/10/46 | | | 274,330 | |
| | | | Banc of America Merrill Lynch Commercial Mortgage, Inc., | | | | |
| | 125,000 | | | Series 2005-3, Class A4, 4.668%, 07/10/43 | | | 132,358 | |
| | 125,000 | | | Series 2005-3, Class AM, 4.727%, 07/10/43 | | | 130,473 | |
| | 220,512 | | | Series 2005-6, Class ASB, VAR, 5.358%, 09/10/47 | | | 222,959 | |
| | | | BB-UBS Trust, | | | | |
| | 100,000 | | | Series 2012-SHOW, Class A, 3.430%, 11/05/36 (e) | | | 93,648 | |
| | 100,000 | | | Series 2012-TFT, Class A, 2.892%, 06/05/30 (e) | | | 93,917 | |
| | | | Bear Stearns Commercial Mortgage Securities Trust, | | | | |
| | 250,000 | | | Series 2005-PWR8, Class A4, 4.674%, 06/11/41 | | | 263,057 | |
| | 84,500 | | | Series 2005-PWR9, Class AAB, 4.804%, 09/11/42 | | | 85,952 | |
| | 360,000 | | | Series 2006-PW11, Class A4, VAR, 5.611%, 03/11/39 | | | 392,590 | |
| | 11,974,921 | | | CD Commercial Mortgage Trust, Series 2007-CD4, Class XC, IO, VAR, 0.219%, 12/11/49 (e) | | | 92,482 | |
| | 100,000 | | | Citigroup Commercial Mortgage Trust, Series 2005-C3, Class AM, VAR, 4.830%, 05/15/43 | | | 104,376 | |
| | 125,000 | | | COMM Mortgage Trust, Series 2013-SFS, Class A2, VAR, 3.086%, 04/12/35 (e) | | | 115,803 | |
| | 565,000 | | | Commercial Mortgage Pass-Through Certificates, Series 2006-C1, Class A4, VAR, 5.569%, 02/15/39 | | | 617,211 | |
| | 100,000 | | | GMAC Commercial Mortgage Securities, Inc. Trust, Series 2006-C1, Class A4, VAR, 5.238%, 11/10/45 | | | 106,900 | |
| | 336,346 | | | Government National Mortgage Association, Series 2003-59, Class XA, IO, VAR, 1.002%, 06/16/34 | | | 2,566 | |
| | 200,000 | | | GS Mortgage Securities Corp. II Commercial Mortgage Pass-Through Certificates, Series 2004-GG2, Class A6, VAR, 5.396%, 08/10/38 | | | 205,686 | |
| | 122,000 | | | GS Mortgage Securities Corp. Trust, Series 2013-NYC5, Class A, 2.318%, 01/10/30 (e) | | | 122,363 | |
| | | | | | | | |
PRINCIPAL
AMOUNT($) | | | SECURITY DESCRIPTION | | VALUE($) | |
| | | | | | | | |
| | | | | |
| | 95,992 | | | JP Morgan Chase Commercial Mortgage Securities Corp., Series 2004-CB8, Class A4, 4.404%, 01/12/39 | | | 97,441 | |
| | | | LB-UBS Commercial Mortgage Trust, | | | | |
| | 107,000 | | | Series 2004-C2, Class A4, 4.367%, 03/15/36 | | | 108,869 | |
| | 75,000 | | | Series 2005-C1, Class A4, 4.742%, 02/15/30 | | | 78,347 | |
| | 102,442 | | | Merrill Lynch Mortgage Trust,
Series 2005-MCP1, Class ASB, VAR, 4.674%, 06/12/43 | | | 102,330 | |
| | 3,516,526 | | | Morgan Stanley Capital I Trust,
Series 2006-IQ12, Class X1, IO, VAR, 0.195%, 12/15/43 (e) | | | 48,106 | |
| | 91,479 | | | Morgan Stanley Re-REMIC Trust, Series 2011-IO, Class A, 2.500%, 03/23/51 (e) | | | 92,308 | |
| | 724,356 | | | NCUA Guaranteed Notes Trust,
Series 2010-C1, Class APT, 2.650%, 10/29/20 | | | 752,060 | |
| | 321,925 | | | TIAA Seasoned Commercial Mortgage Trust, Series 2007-C4, Class A3, VAR, 5.526%, 08/15/39 | | | 335,005 | |
| | 116,000 | | | UBS-BAMLL Trust, Series 2012-WRM, Class A, 3.663%, 06/10/30 (e) | | | 112,693 | |
| | 104,000 | | | UBS-Barclays Commercial Mortgage Trust, Series 2012-C2, Class A4, 3.525%, 05/10/63 | | | 102,299 | |
| | 111,572 | | | Wachovia Bank Commercial Mortgage Trust, Series 2004-C11, Class A5, VAR, 5.215%, 01/15/41 | | | 114,706 | |
| | 110,000 | | | WFRBS Commercial Mortgage Trust, Series 2011-C3, Class A4, 4.375%, 03/15/44 (e) | | | 115,550 | |
| | | | | | | | |
| | | | Total Commercial Mortgage-Backed Securities
(Cost $5,368,815) | | | 5,364,162 | |
| | | | | | | | |
| | | | Corporate Bonds — 16.2% | | | | |
| | | | Consumer Discretionary — 1.2% | | | | |
| | | | Automobiles — 0.1% | | | | |
| | 150,000 | | | Daimler Finance North America LLC, 1.875%, 01/11/18 (e) | | | 146,375 | |
| | | | | | | | |
| | | | Household Durables — 0.0% (g) | | | | |
| | 50,000 | | | Newell Rubbermaid, Inc., 4.700%, 08/15/20 | | | 53,397 | |
| | | | | | | | |
| | | | Media — 1.0% | | | | |
| | | | CBS Corp., | | | | |
| | 21,000 | | | 5.750%, 04/15/20 | | | 23,819 | |
| | 100,000 | | | 7.875%, 07/30/30 | | | 127,413 | |
SEE NOTES TO FINANCIAL STATEMENTS.
| | | | | | |
| | | |
| 14 | | | | JPMORGAN INSURANCE TRUST | | JUNE 30, 2013 |
| | | | | | | | |
PRINCIPAL
AMOUNT($) | | | SECURITY DESCRIPTION | | VALUE($) | |
| | | | | | | | |
| Corporate Bonds — Continued | |
| | | | Media — Continued | | | | |
| | 75,000 | | | Comcast Cable Holdings LLC, 10.125%, 04/15/22 | | | 102,700 | |
| | | | Comcast Corp., | | | | |
| | 87,000 | | | 4.250%, 01/15/33 | | | 83,242 | |
| | 50,000 | | | 5.900%, 03/15/16 | | | 56,289 | |
| | 50,000 | | | 6.450%, 03/15/37 | | | 59,785 | |
| | 30,000 | | | 6.500%, 01/15/17 | | | 34,848 | |
| | 35,000 | | | 6.500%, 11/15/35 | | | 42,355 | |
| | | | COX Communications, Inc., | | | | |
| | 9,000 | | | 5.450%, 12/15/14 | | | 9,603 | |
| | 20,000 | | | 8.375%, 03/01/39 (e) | | | 27,107 | |
| | | | DIRECTV Holdings LLC/DIRECTV Financing Co., Inc., | | | | |
| | 125,000 | | | 4.600%, 02/15/21 | | | 129,643 | |
| | 67,000 | | | 5.000%, 03/01/21 | | | 70,574 | |
| | 125,000 | | | 6.000%, 08/15/40 | | | 124,873 | |
| | 78,000 | | | Discovery Communications LLC, 4.375%, 06/15/21 | | | 81,880 | |
| | 100,000 | | | Historic TW, Inc., 9.150%, 02/01/23 | | | 135,776 | |
| | 75,000 | | | NBCUniversal Media LLC, 5.950%, 04/01/41 | | | 85,660 | |
| | | | News America, Inc., | | | | |
| | 50,000 | | | 6.650%, 11/15/37 | | | 57,537 | |
| | 50,000 | | | 7.250%, 05/18/18 | | | 61,008 | |
| | 150,000 | | | 7.300%, 04/30/28 | | | 175,469 | |
| | 84,000 | | | Thomson Reuters Corp., (Canada), 3.950%, 09/30/21 | | | 86,329 | |
| | | | Time Warner Cable, Inc., | | | | |
| | 50,000 | | | 6.550%, 05/01/37 | | | 50,072 | |
| | 50,000 | | | 6.750%, 07/01/18 | | | 57,233 | |
| | 50,000 | | | 7.300%, 07/01/38 | | | 54,340 | |
| | 70,000 | | | 8.250%, 02/14/14 | | | 73,208 | |
| | | | Time Warner Entertainment Co. LP, | | | | |
| | 50,000 | | | 8.375%, 03/15/23 | | | 62,279 | |
| | 25,000 | | | 8.375%, 07/15/33 | | | 29,465 | |
| | | | Time Warner, Inc., | | | | |
| | 35,000 | | | 4.750%, 03/29/21 | | | 37,651 | |
| | 75,000 | | | 6.200%, 03/15/40 | | | 82,553 | |
| | 7,000 | | | 6.250%, 03/29/41 | | | 7,724 | |
| | 15,000 | | | 6.500%, 11/15/36 | | | 16,965 | |
| | | | Viacom, Inc., | | | | |
| | 13,000 | | | 1.250%, 02/27/15 | | | 13,038 | |
| | 22,000 | | | 3.250%, 03/15/23 | | | 20,720 | |
| | 43,000 | | | 3.875%, 12/15/21 | | | 43,547 | |
| | 20,000 | | | 4.500%, 02/27/42 | | | 17,476 | |
| | | | | | | | |
| | | | | | | 2,142,181 | |
| | | | | | | | |
| | | | | | | | |
PRINCIPAL
AMOUNT($) | | | SECURITY DESCRIPTION | | VALUE($) | |
| | | | | | | | |
| | | | | |
| | | | Multiline Retail — 0.0% (g) | | | | |
| | 9,000 | | | Macy’s Retail Holdings, Inc., 5.125%, 01/15/42 | | | 8,683 | |
| | | | | | | | |
| | | | Specialty Retail — 0.1% | | | | |
| | 30,000 | | | Gap, Inc. (The), 5.950%, 04/12/21 | | | 33,181 | |
| | 70,000 | | | Home Depot, Inc. (The), 5.400%, 03/01/16 | | | 78,000 | |
| | 75,000 | | | Lowe’s Cos., Inc., 7.110%, 05/15/37 | | | 94,609 | |
| | | | | | | | |
| | | | | | | 205,790 | |
| | | | | | | | |
| | | | Total Consumer Discretionary | | | 2,556,426 | |
| | | | | | | | |
| | | | Consumer Staples — 0.6% | | | | |
| | | | Beverages — 0.2% | | | | |
| | 125,000 | | | Anheuser-Busch InBev Worldwide, Inc., 7.750%, 01/15/19 | | | 158,104 | |
| | 95,000 | | | Diageo Capital plc, (United Kingdom), 5.750%, 10/23/17 | | | 109,273 | |
| | 20,000 | | | Diageo Finance B.V., (Netherlands), 5.300%, 10/28/15 | | | 22,009 | |
| | 15,000 | | | FBG Finance Ltd., (Australia), 5.125%, 06/15/15 (e) | | | 16,134 | |
| | 40,000 | | | SABMiller plc, (United Kingdom), 5.700%, 01/15/14 (e) | | | 41,072 | |
| | | | | | | | |
| | | | | | | 346,592 | |
| | | | | | | | |
| | | | Food & Staples Retailing — 0.1% | | | | |
| | | | CVS Caremark Corp., | | | | |
| | 60,000 | | | 5.750%, 05/15/41 | | | 67,634 | |
| | 30,000 | | | 6.125%, 09/15/39 | | | 35,057 | |
| | | | Kroger Co. (The), | | | | |
| | 18,000 | | | 5.400%, 07/15/40 | | | 18,187 | |
| | 25,000 | | | 7.500%, 04/01/31 | | | 30,273 | |
| | 70,000 | | | Wal-Mart Stores, Inc., 6.500%, 08/15/37 | | | 88,451 | |
| | | | | | | | |
| | | | | | | 239,602 | |
| | | | | | | | |
| | | | Food Products — 0.3% | | | | |
| | 25,000 | | | Archer-Daniels-Midland Co., 5.935%, 10/01/32 | | | 28,479 | |
| | 55,000 | | | Bunge Ltd. Finance Corp., 8.500%, 06/15/19 | | | 67,881 | |
| | 27,000 | | | Bunge N.A. Finance LP, 5.900%, 04/01/17 | | | 29,740 | |
| | 10,000 | | | ConAgra Foods, Inc., 2.100%, 03/15/18 | | | 9,906 | |
| | | | Kellogg Co., | | | | |
| | 13,000 | | | 1.750%, 05/17/17 | | | 12,902 | |
| | 22,000 | | | 3.125%, 05/17/22 | | | 21,427 | |
| | | | Kraft Foods Group, Inc., | | | | |
| | 66,000 | | | 5.375%, 02/10/20 | | | 74,446 | |
| | 122,000 | | | 6.125%, 08/23/18 | | | 143,246 | |
| | 100,000 | | | 6.875%, 01/26/39 | | | 121,315 | |
SEE NOTES TO FINANCIAL STATEMENTS.
| | | | | | | | |
| | | |
| JUNE 30, 2013 | | JPMORGAN INSURANCE TRUST | | | | | 15 | |
JPMorgan Insurance Trust Core Bond Portfolio
SCHEDULE OF PORTFOLIO INVESTMENTS
AS OF JUNE 30, 2013 (Unaudited) (continued)
| | | | | | | | |
PRINCIPAL
AMOUNT($) | | | SECURITY DESCRIPTION | | VALUE($) | |
| | | | | | | | |
| Corporate Bonds — Continued | |
| | | | Food Products — Continued | | | | |
| | | | Mondelez International, Inc., | | | | |
| | 61,000 | | | 5.375%, 02/10/20 | | | 68,421 | |
| | 43,000 | | | 6.125%, 02/01/18 | | | 49,696 | |
| | | | | | | | |
| | | | | | | 627,459 | |
| | | | | | | | |
| | | | Personal Products — 0.0% (g) | | | | |
| | 67,129 | | | Procter & Gamble—ESOP, 9.360%, 01/01/21 | | | 87,155 | |
| | | | | | | | |
| | | | Total Consumer Staples | | | 1,300,808 | |
| | | | | | | | |
| | | | Energy — 1.1% | | | | |
| | | | Energy Equipment & Services — 0.1% | | | | |
| | 5,000 | | | Noble Holding International Ltd., (Cayman Islands), 3.950%, 03/15/22 | | | 4,892 | |
| | | | Transocean, Inc., (Cayman Islands), | | | | |
| | 18,000 | | | 6.375%, 12/15/21 | | | 20,231 | |
| | 75,000 | | | 6.500%, 11/15/20 | | | 84,421 | |
| | 14,000 | | | 7.350%, 12/15/41 | | | 16,125 | |
| | | | | | | | |
| | | | | | | 125,669 | |
| | | | | | | | |
| | | | Oil, Gas & Consumable Fuels — 1.0% | | | | |
| | 50,000 | | | Apache Corp., 6.900%, 09/15/18 | | | 60,846 | |
| | | | BP Capital Markets plc, (United Kingdom), | | | | |
| | 71,000 | | | 2.750%, 05/10/23 | | | 65,648 | |
| | 150,000 | | | 4.742%, 03/11/21 | | | 163,214 | |
| | 100,000 | | | Canadian Natural Resources Ltd., (Canada), 5.900%, 02/01/18 | | | 114,933 | |
| | | | Cenovus Energy, Inc., (Canada), | | | | |
| | 13,000 | | | 3.000%, 08/15/22 | | | 12,370 | |
| | 31,000 | | | 4.450%, 09/15/42 | | | 27,795 | |
| | 20,000 | | | Chevron Corp., 2.427%, 06/24/20 | | | 19,886 | |
| | | | ConocoPhillips, | | | | |
| | 25,000 | | | 5.750%, 02/01/19 | | | 29,287 | |
| | 120,000 | | | 6.000%, 01/15/20 | | | 142,794 | |
| | 75,000 | | | ConocoPhillips Canada Funding Co. I, (Canada), 5.625%, 10/15/16 | | | 85,537 | |
| | | | Devon Energy Corp., | | | | |
| | 47,000 | | | 3.250%, 05/15/22 | | | 45,522 | |
| | 21,000 | | | 4.750%, 05/15/42 | | | 19,603 | |
| | 15,000 | | | EOG Resources, Inc., 2.625%, 03/15/23 | | | 14,036 | |
| | 50,000 | | | Kerr-McGee Corp., 7.875%, 09/15/31 | | | 62,429 | |
| | 150,000 | | | Marathon Oil Corp., 6.000%, 10/01/17 | | | 171,775 | |
| | 56,000 | | | Petrobras Global Finance B.V., (Netherlands), 4.375%, 05/20/23 | | | 51,371 | |
| | | | Petrobras International Finance Co.-Pifco, (Cayman Islands), | | | | |
| | 45,000 | | | 5.375%, 01/27/21 | | | 45,211 | |
| | 25,000 | | | 7.875%, 03/15/19 | | | 28,909 | |
| | | | | | | | |
PRINCIPAL
AMOUNT($) | | | SECURITY DESCRIPTION | | VALUE($) | |
| | | | | | | | |
| | | | | | | | |
| | | | Oil, Gas & Consumable Fuels — Continued | | | | |
| | 60,000 | | | Petro-Canada, (Canada), 6.800%, 05/15/38 | | | 69,533 | |
| | | | Shell International Finance B.V., (Netherlands), | | | | |
| | 42,000 | | | 1.125%, 08/21/17 | | | 41,085 | |
| | 60,000 | | | 6.375%, 12/15/38 | | | 77,300 | |
| | | | Spectra Energy Capital LLC, | | | | |
| | 47,000 | | | 3.300%, 03/15/23 | | | 42,403 | |
| | 45,000 | | | 7.500%, 09/15/38 | | | 56,202 | |
| | 50,000 | | | 8.000%, 10/01/19 | | | 63,280 | |
| | | | Statoil ASA, (Norway), | | | | |
| | 143,000 | | | 2.650%, 01/15/24 | | | 132,619 | |
| | 50,000 | | | 3.125%, 08/17/17 | | | 52,757 | |
| | 45,000 | | | Suncor Energy, Inc., (Canada), 6.850%, 06/01/39 | | | 53,006 | |
| | | | Talisman Energy, Inc., (Canada), | | | | |
| | 45,000 | | | 5.500%, 05/15/42 | | | 44,060 | |
| | 5,000 | | | 5.850%, 02/01/37 | | | 5,105 | |
| | 10,000 | | | 6.250%, 02/01/38 | | | 10,740 | |
| | 40,000 | | | 7.750%, 06/01/19 | | | 48,617 | |
| | 28,000 | | | Total Capital International S.A., (France), 1.550%, 06/28/17 | | | 27,750 | |
| | 150,000 | | | Total Capital S.A., (France), 2.300%, 03/15/16 | | | 154,879 | |
| | | | TransCanada PipeLines Ltd., (Canada), | | | | |
| | 50,000 | | | 6.500%, 08/15/18 | | | 60,073 | |
| | 50,000 | | | 7.125%, 01/15/19 | | | 60,977 | |
| | | | | | | | |
| | | | | | | 2,161,552 | |
| | | | | | | | |
| | | | Total Energy | | | 2,287,221 | |
| | | | | | | | |
| | | | Financials — 8.0% | | | | |
| | | | Capital Markets — 1.9% | | | | |
| | | | Bank of New York Mellon Corp. (The), | | | | |
| | 75,000 | | | 2.950%, 06/18/15 | | | 78,094 | |
| | 55,000 | | | 4.600%, 01/15/20 | | | 60,089 | |
| | | | BlackRock, Inc., | | | | |
| | 80,000 | | | 3.500%, 12/10/14 | | | 83,228 | |
| | 130,000 | | | 5.000%, 12/10/19 | | | 147,450 | |
| | 65,000 | | | 6.250%, 09/15/17 | | | 76,525 | |
| | 100,000 | | | Blackstone Holdings Finance Co. LLC, 5.875%, 03/15/21 (e) | | | 113,034 | |
| | 50,000 | | | Credit Suisse USA, Inc., 4.875%, 01/15/15 | | | 52,947 | |
| | | | Goldman Sachs Group, Inc. (The), | | | | |
| | 75,000 | | | 3.625%, 02/07/16 | | | 78,290 | |
| | 20,000 | | | 3.700%, 08/01/15 | | | 20,837 | |
| | 375,000 | | | 4.750%, 07/15/13 | | | 375,572 | |
SEE NOTES TO FINANCIAL STATEMENTS.
| | | | | | |
| | | |
| 16 | | | | JPMORGAN INSURANCE TRUST | | JUNE 30, 2013 |
| | | | | | | | |
PRINCIPAL
AMOUNT($) | | | SECURITY DESCRIPTION | | VALUE($) | |
| | | | | | | | |
| Corporate Bonds — Continued | |
| | | | Capital Markets — Continued | | | | |
| | 150,000 | | | 5.150%, 01/15/14 | | | 153,165 | |
| | 23,000 | | | 5.250%, 07/27/21 | | | 24,608 | |
| | 156,000 | | | 5.375%, 03/15/20 | | | 169,268 | |
| | 100,000 | | | 5.500%, 11/15/14 | | | 105,680 | |
| | 150,000 | | | 5.950%, 01/18/18 | | | 167,826 | |
| | 75,000 | | | 5.950%, 01/15/27 | | | 77,120 | |
| | 100,000 | | | 6.250%, 09/01/17 | | | 113,320 | |
| | 80,000 | | | 6.750%, 10/01/37 | | | 81,949 | |
| | 125,000 | | | 7.500%, 02/15/19 | | | 148,447 | |
| | | | Jefferies Group LLC, | | | | |
| | 55,000 | | | 3.875%, 11/09/15 | | | 56,925 | |
| | 110,000 | | | 6.450%, 06/08/27 | | | 108,350 | |
| | 100,000 | | | 8.500%, 07/15/19 | | | 120,500 | |
| | 50,000 | | | Macquarie Group Ltd., (Australia), 7.300%, 08/01/14 (e) | | | 52,732 | |
| | | | Merrill Lynch & Co., Inc., | | | | |
| | 120,000 | | | 5.450%, 07/15/14 | | | 125,143 | |
| | 135,000 | | | 6.400%, 08/28/17 | | | 152,437 | |
| | 90,000 | | | 6.875%, 04/25/18 | | | 103,583 | |
| | | | Morgan Stanley, | | | | |
| | 100,000 | | | 4.200%, 11/20/14 | | | 103,448 | |
| | 100,000 | | | 4.750%, 04/01/14 | | | 102,173 | |
| | 35,000 | | | 5.500%, 07/28/21 | | | 37,374 | |
| | 200,000 | | | 5.625%, 09/23/19 | | | 214,966 | |
| | 130,000 | | | 5.950%, 12/28/17 | | | 144,240 | |
| | 65,000 | | | Nomura Holdings, Inc., (Japan), 6.700%, 03/04/20 | | | 74,496 | |
| | 24,000 | | | State Street Corp., 3.100%, 05/15/23 | | | 22,480 | |
| | | | UBS AG, (Switzerland), | | | | |
| | 250,000 | | | 3.875%, 01/15/15 | | | 260,549 | |
| | 100,000 | | | 5.750%, 04/25/18 | | | 115,562 | |
| | | | | | | | |
| | | | | | | 3,922,407 | |
| | | | | | | | |
| | | | Commercial Banks — 1.9% | | | | |
| | | | Bank of Nova Scotia, (Canada), | | | | |
| | 100,000 | | | 2.550%, 01/12/17 | | | 102,921 | |
| | 82,000 | | | 3.400%, 01/22/15 | | | 85,268 | |
| | | | Barclays Bank plc, (United Kingdom), | | | | |
| | 106,000 | | | 2.750%, 02/23/15 | | | 108,671 | |
| | 100,000 | | | 5.200%, 07/10/14 | | | 104,320 | |
| | 150,000 | | | 6.050%, 12/04/17 (e) | | | 162,258 | |
| | | | BB&T Corp., | | | | |
| | 50,000 | | | 3.375%, 09/25/13 | | | 50,329 | |
| | 100,000 | | | 3.950%, 04/29/16 | | | 107,133 | |
| | 50,000 | | | 4.900%, 06/30/17 | | | 54,546 | |
| | 50,000 | | | 5.700%, 04/30/14 | | | 52,045 | |
| | | | | | | | |
PRINCIPAL
AMOUNT($) | | | SECURITY DESCRIPTION | | VALUE($) | |
| | | | | | | | |
| | | | | | | | |
| | | | Commercial Banks — Continued | | | | |
| | 200,000 | | | Cooperatieve Centrale Raiffeisen-Boerenleenbank B.A., (Netherlands), 3.200%, 03/11/15 (e) | | | 207,377 | |
| | 150,000 | | | Credit Suisse, (Switzerland), 5.500%, 05/01/14 | | | 156,113 | |
| | 350,000 | | | Glitnir Banki HF, (Iceland), 0.000%, 10/15/08 (d) (e) (i) | | | 100,625 | |
| | | | HSBC Bank plc, (United Kingdom), | | | | |
| | 100,000 | | | 3.500%, 06/28/15 (e) | | | 104,859 | |
| | 111,000 | | | 4.125%, 08/12/20 (e) | | | 116,268 | |
| | 223,000 | | | Macquarie Bank Ltd., (Australia), 5.000%, 02/22/17 (e) | | | 238,942 | |
| | | | National Australia Bank Ltd., (Australia), | | | | |
| | 200,000 | | | 2.750%, 09/28/15 (e) | | | 207,440 | |
| | 100,000 | | | 3.750%, 03/02/15 (e) | | | 104,720 | |
| | 100,000 | | | Nordea Bank AB, (Sweden), 1.750%, 10/04/13 (e) | | | 100,343 | |
| | | | PNC Funding Corp., | | | | |
| | 150,000 | | | 5.125%, 02/08/20 | | | 164,816 | |
| | 25,000 | | | 5.250%, 11/15/15 | | | 27,207 | |
| | 25,000 | | | 5.625%, 02/01/17 | | | 27,736 | |
| | 25,000 | | | 6.700%, 06/10/19 | | | 29,976 | |
| | 72,000 | | | Toronto-Dominion Bank (The), (Canada), 2.500%, 07/14/16 | | | 74,637 | |
| | | | U.S. Bancorp, | | | | |
| | 90,000 | | | 2.450%, 07/27/15 | | | 92,715 | |
| | 100,000 | | | 7.500%, 06/01/26 | | | 129,036 | |
| | | | Wachovia Bank N.A., | | | | |
| | 250,000 | | | 6.000%, 11/15/17 | | | 285,278 | |
| | 250,000 | | | 6.600%, 01/15/38 | | | 305,485 | |
| | 250,000 | | | VAR, 0.603%, 03/15/16 | | | 246,846 | |
| | 50,000 | | | Wachovia Corp., 5.750%, 02/01/18 | | | 57,588 | |
| | 200,000 | | | Wells Fargo & Co., SUB, 3.676%, 06/15/16 | | | 213,684 | |
| | | | Westpac Banking Corp., (Australia), | | | | |
| | 65,000 | | | 4.200%, 02/27/15 | | | 68,613 | |
| | 121,000 | | | 4.875%, 11/19/19 | | | 135,623 | |
| | | | | | | | |
| | | | | | | 4,023,418 | |
| | | | | | | | |
| | | | Consumer Finance — 1.0% | | | | |
| | 50,000 | | | American Express Co., 7.000%, 03/19/18 | | | 60,154 | |
| | 50,000 | | | American Express Credit Corp., 7.300%, 08/20/13 | | | 50,453 | |
| | 200,000 | | | American Honda Finance Corp., 1.600%, 02/16/18 (e) | | | 196,637 | |
| | | | Capital One Financial Corp., | | | | |
| | 110,000 | | | 3.500%, 06/15/23 (e) | | | 103,545 | |
| | 185,000 | | | 7.375%, 05/23/14 | | | 195,518 | |
SEE NOTES TO FINANCIAL STATEMENTS.
| | | | | | | | |
| | | |
| JUNE 30, 2013 | | JPMORGAN INSURANCE TRUST | | | | | 17 | |
JPMorgan Insurance Trust Core Bond Portfolio
SCHEDULE OF PORTFOLIO INVESTMENTS
AS OF JUNE 30, 2013 (Unaudited) (continued)
| | | | | | | | |
PRINCIPAL
AMOUNT($) | | | SECURITY DESCRIPTION | | VALUE($) | |
| | | | | | | | |
| Corporate Bonds — Continued | |
| | | | Consumer Finance — Continued | | | | |
| | | | Caterpillar Financial Services Corp., | | | | |
| | 80,000 | | | 5.450%, 04/15/18 | | | 92,280 | |
| | 100,000 | | | 6.200%, 09/30/13 | | | 101,392 | |
| | 100,000 | | | 7.050%, 10/01/18 | | | 123,880 | |
| | 50,000 | | | 7.150%, 02/15/19 | | | 62,371 | |
| | 200,000 | | | Ford Motor Credit Co. LLC, 3.984%, 06/15/16 | | | 209,526 | |
| | | | HSBC Finance Corp., | | | | |
| | 13,000 | | | 4.750%, 07/15/13 | | | 13,021 | |
| | 150,000 | | | 5.000%, 06/30/15 | | | 160,441 | |
| | 150,000 | | | 5.250%, 01/15/14 | | | 153,512 | |
| | 50,000 | | | 7.350%, 11/27/32 | | | 57,190 | |
| | 100,000 | | | VAR, 0.527%, 01/15/14 | | | 99,904 | |
| | 100,000 | | | HSBC USA, Inc., 1.625%, 01/16/18 | | | 97,561 | |
| | | | John Deere Capital Corp., | | | | |
| | 39,000 | | | 1.200%, 10/10/17 | | | 37,944 | |
| | 42,000 | | | 3.150%, 10/15/21 | | | 41,581 | |
| | | | Toyota Motor Credit Corp., | | | | |
| | 80,000 | | | 1.000%, 02/17/15 | | | 80,526 | |
| | 100,000 | | | 2.000%, 09/15/16 | | | 102,014 | |
| | 87,000 | | | 3.200%, 06/17/15 | | | 90,953 | |
| | | | | | | | |
| | | | | | | 2,130,403 | |
| | | | | | | | |
| | | | Diversified Financial Services — 1.8% | | | | |
| | | | Bank of America Corp., | | | | |
| | 50,000 | | | 2.000%, 01/11/18 | | | 48,431 | |
| | 295,000 | | | 5.650%, 05/01/18 | | | 327,740 | |
| | 245,000 | | | 5.750%, 12/01/17 | | | 272,287 | |
| | 50,000 | | | 6.500%, 08/01/16 | | | 56,372 | |
| | 200,000 | | | 7.375%, 05/15/14 | | | 210,417 | |
| | 25,000 | | | 7.625%, 06/01/19 | | | 30,044 | |
| | | | Citigroup, Inc., | | | | |
| | 100,000 | | | 1.250%, 01/15/16 | | | 98,805 | |
| | 60,000 | | | 2.250%, 08/07/15 | | | 61,009 | |
| | 22,000 | | | 4.500%, 01/14/22 | | | 22,920 | |
| | 150,000 | | | 4.700%, 05/29/15 | | | 159,326 | |
| | 62,000 | | | 4.750%, 05/19/15 | | | 65,571 | |
| | 300,000 | | | 5.000%, 09/15/14 | | | 311,768 | |
| | 36,000 | | | 5.375%, 08/09/20 | | | 39,809 | |
| | 5,000 | | | 6.000%, 08/15/17 | | | 5,634 | |
| | 150,000 | | | 6.010%, 01/15/15 | | | 160,189 | |
| | 55,000 | | | 6.500%, 08/19/13 | | | 55,396 | |
| | 100,000 | | | 8.125%, 07/15/39 | | | 132,074 | |
| | 45,000 | | | 8.500%, 05/22/19 | | | 56,701 | |
| | | | | | | | |
PRINCIPAL
AMOUNT($) | | | SECURITY DESCRIPTION | | VALUE($) | |
| | | | | | | | |
| | | | | | | | |
| | | | Diversified Financial Services — Continued | | | | |
| | | | CME Group, Inc., | | | | |
| | 30,000 | | | 5.400%, 08/01/13 | | | 30,120 | |
| | 70,000 | | | 5.750%, 02/15/14 | | | 72,164 | |
| | 32,000 | | | EADS Finance B.V., (Netherlands), 2.700%, 04/17/23 (e) | | | 29,448 | |
| | | | General Electric Capital Corp., | | | | |
| | 200,000 | | | 4.750%, 09/15/14 | | | 209,556 | |
| | 190,000 | | | 5.500%, 01/08/20 | | | 214,222 | |
| | 400,000 | | | 5.625%, 05/01/18 | | | 458,802 | |
| | 100,000 | | | 5.875%, 01/14/38 | | | 110,076 | |
| | 115,000 | | | 5.900%, 05/13/14 | | | 120,430 | |
| | 200,000 | | | 6.750%, 03/15/32 | | | 239,805 | |
| | 100,000 | | | MassMutual Global Funding II, 3.125%, 04/14/16 (e) | | | 105,123 | |
| | 50,000 | | | National Rural Utilities Cooperative Finance Corp., 10.375%, 11/01/18 | | | 69,274 | |
| | | | | | | | |
| | | | | | | 3,773,513 | |
| | | | | | | | |
| | | | Insurance — 0.9% | | | | |
| | 35,000 | | | ACE INA Holdings, Inc., 5.600%, 05/15/15 | | | 37,955 | |
| | | | Aflac, Inc., | | | | |
| | 63,000 | | | 3.625%, 06/15/23 | | | 61,235 | |
| | 25,000 | | | 6.450%, 08/15/40 | | | 29,363 | |
| | 20,000 | | | 8.500%, 05/15/19 | | | 25,563 | |
| | 31,000 | | | Allstate Corp. (The), 3.150%, 06/15/23 | | | 30,099 | |
| | | | Aon Corp., | | | | |
| | 40,000 | | | 3.125%, 05/27/16 | | | 41,728 | |
| | 23,000 | | | 3.500%, 09/30/15 | | | 24,118 | |
| | 18,000 | | | 6.250%, 09/30/40 | | | 20,919 | |
| | | | Berkshire Hathaway Finance Corp., | | | | |
| | 33,000 | | | 2.450%, 12/15/15 | | | 34,316 | |
| | 62,000 | | | 4.300%, 05/15/43 | | | 56,310 | |
| | 50,000 | | | 5.400%, 05/15/18 | | | 57,438 | |
| | 100,000 | | | 5.750%, 01/15/40 | | | 111,473 | |
| | 75,000 | | | CNA Financial Corp., 5.875%, 08/15/20 | | | 84,880 | |
| | 27,000 | | | Liberty Mutual Group, Inc., 5.000%, 06/01/21 (e) | | | 28,481 | |
| | 20,000 | | | Lincoln National Corp., 4.850%, 06/24/21 | | | 21,252 | |
| | | | Metropolitan Life Global Funding I, | | | | |
| | 100,000 | | | 1.700%, 06/29/15 (e) | | | 101,569 | |
| | 175,000 | | | 3.650%, 06/14/18 (e) | | | 185,880 | |
| | 100,000 | | | 5.200%, 09/18/13 (e) | | | 101,026 | |
| | 75,000 | | | Nationwide Mutual Insurance Co., 9.375%, 08/15/39 (e) | | | 101,481 | |
| | 250,000 | | | New York Life Global Funding, 5.375%, 09/15/13 (e) | | | 252,463 | |
SEE NOTES TO FINANCIAL STATEMENTS.
| | | | | | |
| | | |
| 18 | | | | JPMORGAN INSURANCE TRUST | | JUNE 30, 2013 |
| | | | | | | | |
PRINCIPAL
AMOUNT($) | | | SECURITY DESCRIPTION | | VALUE($) | |
| | | | | | | | |
| Corporate Bonds — Continued | |
| | | | Insurance — Continued | | | | |
| | 100,000 | | | Pacific Life Global Funding, 5.000%, 05/15/17 (e) | | | 103,499 | |
| | 35,000 | | | Principal Life Income Funding Trusts, 5.100%, 04/15/14 | | | 36,238 | |
| | 150,000 | | | Prudential Insurance Co. of America (The), 8.300%, 07/01/25 (e) | | | 193,803 | |
| | 25,000 | | | Travelers Cos., Inc. (The), 5.800%, 05/15/18 | | | 29,241 | |
| | | | | | | | |
| | | | | | | 1,770,330 | |
| | | | | | | | |
| | | | Real Estate Investment Trusts (REITs) — 0.3% | |
| | | | CommonWealth REIT, | | | | |
| | 75,000 | | | 5.875%, 09/15/20 | | | 77,646 | |
| | 100,000 | | | 6.650%, 01/15/18 | | | 109,146 | |
| | 92,000 | | | HCP, Inc., 5.375%, 02/01/21 | | | 99,796 | |
| | | | Simon Property Group LP, | | | | |
| | 8,000 | | | 4.200%, 02/01/15 | | | 8,333 | |
| | 20,000 | | | 4.375%, 03/01/21 | | | 21,284 | |
| | 50,000 | | | 5.625%, 08/15/14 | | | 52,652 | |
| | 50,000 | | | 5.650%, 02/01/20 | | | 57,127 | |
| | 45,000 | | | 6.100%, 05/01/16 | | | 50,465 | |
| | 30,000 | | | 6.750%, 05/15/14 | | | 31,088 | |
| | 102,000 | | | WEA Finance LLC/WT Finance Aust Pty Ltd., 6.750%, 09/02/19 (e) | | | 120,462 | |
| | | | | | | | |
| | | | | | | 627,999 | |
| | | | | | | | |
| | | | Thrifts & Mortgage Finance — 0.2% | | | | |
| | 75,000 | | | Countrywide Financial Corp., 6.250%, 05/15/16 | | | 81,786 | |
| | 250,000 | | | Stadshypotek AB, (Sweden), 1.450%, 09/30/13 (e) | | | 250,675 | |
| | | | | | | | |
| | | | | | | 332,461 | |
| | | | | | | | |
| | | | Total Financials | | | 16,580,531 | |
| | | | | | | | |
| | | | Health Care — 0.4% | | | | |
| | | | Biotechnology — 0.1% | | | | |
| | | | Amgen, Inc., | | | | |
| | 25,000 | | | 4.500%, 03/15/20 | | | 27,231 | |
| | 100,000 | | | 5.150%, 11/15/41 | | | 99,594 | |
| | 40,000 | | | 5.700%, 02/01/19 | | | 45,923 | |
| | 82,000 | | | 5.750%, 03/15/40 | | | 88,004 | |
| | 49,000 | | | Celgene Corp., 3.250%, 08/15/22 | | | 46,473 | |
| | | | | | | | |
| | | | | | | 307,225 | |
| | | | | | | | |
| | | | Health Care Equipment & Supplies — 0.0% (g) | |
| | 10,000 | | | Baxter International, Inc., 4.000%, 03/01/14 | | | 10,219 | |
| | | | | | | | |
| | | | | | | | |
PRINCIPAL
AMOUNT($) | | | SECURITY DESCRIPTION | | VALUE($) | |
| | | | | | | | |
| | | | | | | | |
| | | | Health Care Providers & Services — 0.1% | | | | |
| | 30,000 | | | Medco Health Solutions, Inc., 2.750%, 09/15/15 | | | 30,846 | |
| | 50,000 | | | UnitedHealth Group, Inc., 6.625%, 11/15/37 | | | 60,828 | |
| | | | WellPoint, Inc., | | | | |
| | 18,000 | | | 3.300%, 01/15/23 | | | 17,135 | |
| | 18,000 | | | 4.650%, 01/15/43 | | | 16,778 | |
| | 13,000 | | | 5.875%, 06/15/17 | | | 14,770 | |
| | 9,000 | | | 7.000%, 02/15/19 | | | 10,805 | |
| | | | | | | | |
| | | | | | | 151,162 | |
| | | | | | | | |
| | | | Pharmaceuticals — 0.2% | | | | |
| | | | AbbVie, Inc., | | | | |
| | 45,000 | | | 1.750%, 11/06/17 (e) | | | 44,087 | |
| | 22,000 | | | 2.900%, 11/06/22 (e) | | | 20,573 | |
| | 35,000 | | | AstraZeneca plc, (United Kingdom), 5.400%, 06/01/14 | | | 36,604 | |
| | 50,000 | | | GlaxoSmithKline Capital, Inc., 4.375%, 04/15/14 | | | 51,548 | |
| | 63,000 | | | Merck & Co., Inc., 2.800%, 05/18/23 | | | 59,605 | |
| | 80,000 | | | Novartis Capital Corp., 4.125%, 02/10/14 | | | 81,751 | |
| | | | Zoetis, Inc., | | | | |
| | 14,000 | | | 1.875%, 02/01/18 (e) | | | 13,705 | |
| | 9,000 | | | 4.700%, 02/01/43 (e) | | | 8,405 | |
| | | | | | | | |
| | | | | | | 316,278 | |
| | | | | | | | |
| | | | Total Health Care | | | 784,884 | |
| | | | | | | | |
| | | | Industrials — 0.8% | | | | |
| | | | Aerospace & Defense — 0.1% | | | | |
| | 51,000 | | | BAE Systems plc, (United Kingdom), 5.800%, 10/11/41 (e) | | | 54,969 | |
| | | | Lockheed Martin Corp., | | | | |
| | 33,000 | | | 2.125%, 09/15/16 | | | 33,689 | |
| | 30,000 | | | 4.850%, 09/15/41 | | | 29,290 | |
| | 100,000 | | | United Technologies Corp., 6.125%, 02/01/19 | | | 118,632 | |
| | | | | | | | |
| | | | | | | 236,580 | |
| | | | | | | | |
| | | | Airlines — 0.1% | | | | |
| | 26,000 | | | Air Canada 2013-1 Class A Pass-Through Trust, (Canada), 4.125%, 05/15/25 (e) | | | 25,935 | |
| | 28,855 | | | American Airlines 2011-1 Class A Pass-Through Trust, 5.250%, 01/31/21 | | | 30,658 | |
| | 31,850 | | | American Airlines 2011-2 Class A Pass-Through Trust, 8.625%, 10/15/21 | | | 33,840 | |
| | 45,172 | | | Delta Air Lines 2010-2 Class A Pass-Through Trust, 4.950%, 05/23/19 | | | 47,996 | |
| | | | | | | | |
| | | | | | | 138,429 | |
| | | | | | | | |
SEE NOTES TO FINANCIAL STATEMENTS.
| | | | | | | | |
| | | |
| JUNE 30, 2013 | | JPMORGAN INSURANCE TRUST | | | | | 19 | |
JPMorgan Insurance Trust Core Bond Portfolio
SCHEDULE OF PORTFOLIO INVESTMENTS
AS OF JUNE 30, 2013 (Unaudited) (continued)
| | | | | | | | |
PRINCIPAL
AMOUNT($) | | | SECURITY DESCRIPTION | | VALUE($) | |
| | | | | | | | |
| Corporate Bonds — Continued | |
| | | | Commercial Services & Supplies — 0.1% | | | | |
| | | | ADT Corp. (The), | | | | |
| | 35,000 | | | 3.500%, 07/15/22 | | | 32,184 | |
| | 17,000 | | | 4.125%, 06/15/23 | | | 16,012 | |
| | 28,000 | | | 4.875%, 07/15/42 | | | 23,771 | |
| | 21,000 | | | Republic Services, Inc., 3.550%, 06/01/22 | | | 20,438 | |
| | 43,000 | | | Waste Management, Inc., 4.750%, 06/30/20 | | | 46,313 | |
| | | | | | | | |
| | | | | | | 138,718 | |
| | | | | | | | |
| | | | Construction & Engineering — 0.0% (g) | | | | |
| | 23,000 | | | ABB Finance USA, Inc., 2.875%, 05/08/22 | | | 22,036 | |
| | 44,000 | | | Fluor Corp., 3.375%, 09/15/21 | | | 43,832 | |
| | | | | | | | |
| | | | | | | 65,868 | |
| | | | | | | | |
| | | | Industrial Conglomerates — 0.1% | | | | |
| | 44,000 | | | Danaher Corp., 3.900%, 06/23/21 | | | 46,500 | |
| | 65,000 | | | General Electric Co., 5.250%, 12/06/17 | | | 73,395 | |
| | 22,000 | | | Koninklijke Philips Electronics N.V., (Netherlands), 5.750%, 03/11/18 | | | 25,479 | |
| | | | | | | | |
| | | | | | | 145,374 | |
| | | | | | | | |
| | | | Machinery — 0.0% (g) | | | | |
| | 80,000 | | | Illinois Tool Works, Inc., 3.900%, 09/01/42 | | | 71,325 | |
| | 25,000 | | | Parker Hannifin Corp., 5.500%, 05/15/18 | | | 28,573 | |
| | | | | | | | |
| | | | | | | 99,898 | |
| | | | | | | | |
| | | | Road & Rail — 0.4% | | | | |
| | | | Burlington Northern Santa Fe LLC, | | | | |
| | 50,000 | | | 3.000%, 03/15/23 | | | 47,646 | |
| | 25,000 | | | 3.600%, 09/01/20 | | | 25,930 | |
| | 25,000 | | | 4.375%, 09/01/42 | | | 22,875 | |
| | 75,000 | | | 5.400%, 06/01/41 | | | 79,637 | |
| | 100,000 | | | 5.650%, 05/01/17 | | | 113,451 | |
| | 85,000 | | | 5.750%, 05/01/40 | | | 94,664 | |
| | | | CSX Corp., | | | | |
| | 33,000 | | | 4.250%, 06/01/21 | | | 35,265 | |
| | 50,000 | | | 5.500%, 04/15/41 | | | 53,360 | |
| | 25,000 | | | 7.375%, 02/01/19 | | | 30,835 | |
| | | | ERAC USA Finance LLC, | | | | |
| | 45,000 | | | 4.500%, 08/16/21 (e) | | | 47,059 | |
| | 12,000 | | | 5.625%, 03/15/42 (e) | | | 12,046 | |
| | | | Norfolk Southern Corp., | | | | |
| | 70,000 | | | 3.950%, 10/01/42 | | | 60,332 | |
| | 78,000 | | | 6.000%, 05/23/11 † | | | 85,716 | |
| | 27,000 | | | Penske Truck Leasing Co. LP/PTL Finance Corp., 2.875%, 07/17/18 (e) | | | 27,269 | |
| | 35,000 | | | Ryder System, Inc., 3.600%, 03/01/16 | | | 36,793 | |
| | | | | | | | |
PRINCIPAL
AMOUNT($) | | | SECURITY DESCRIPTION | | VALUE($) | |
| | | | | | | | |
| | | | | | | | |
| | | | Road & Rail — Continued | | | | |
| | 35,000 | | | United Parcel Service of America, Inc., 8.375%, 04/01/20 | | | 46,110 | |
| | | | | | | | |
| | | | | | | 818,988 | |
| | | | | | | | |
| | | | Total Industrials | | | 1,643,855 | |
| | | | | | | | |
| | | | Information Technology — 1.1% | | | | |
| | | | Communications Equipment — 0.1% | | | | |
| | | | Cisco Systems, Inc., | | | | |
| | 80,000 | | | 5.500%, 02/22/16 | | | 89,332 | |
| | 75,000 | | | 5.900%, 02/15/39 | | | 88,984 | |
| | | | | | | | |
| | | | | | | 178,316 | |
| | | | | | | | |
| | | | Computers & Peripherals — 0.4% | | | | |
| | | | Apple, Inc., | | | | |
| | 142,000 | | | 2.400%, 05/03/23 | | | 131,700 | |
| | 69,000 | | | VAR, 0.523%, 05/03/18 | | | 68,704 | |
| | 25,000 | | | Dell, Inc., 7.100%, 04/15/28 | | | 24,663 | |
| | | | EMC Corp., | | | | |
| | 40,000 | | | 1.875%, 06/01/18 | | | 39,540 | |
| | 50,000 | | | 3.375%, 06/01/23 | | | 49,076 | |
| | | | Hewlett-Packard Co., | | | | |
| | 83,000 | | | 2.600%, 09/15/17 | | | 82,891 | |
| | 50,000 | | | 4.300%, 06/01/21 | | | 48,889 | |
| | 39,000 | | | 4.650%, 12/09/21 | | | 39,004 | |
| | 75,000 | | | 4.750%, 06/02/14 | | | 77,348 | |
| | 200,000 | | | 6.000%, 09/15/41 | | | 192,951 | |
| | | | | | | | |
| | | | | | | 754,766 | |
| | | | | | | | |
| | | | Electronic Equipment, Instruments & Components — 0.1% | |
| | | | Arrow Electronics, Inc., | | | | |
| | 13,000 | | | 3.000%, 03/01/18 | | | 12,981 | |
| | 25,000 | | | 3.375%, 11/01/15 | | | 25,875 | |
| | 8,000 | | | 4.500%, 03/01/23 | | | 7,871 | |
| | 25,000 | | | 6.000%, 04/01/20 | | | 27,056 | |
| | 80,000 | | | 6.875%, 06/01/18 | | | 91,684 | |
| | 7,000 | | | 7.500%, 01/15/27 | | | 8,021 | |
| | | | | | | | |
| | | | | | | 173,488 | |
| | | | | | | | |
| | | | IT Services — 0.2% | | | | |
| | 50,000 | | | HP Enterprise Services LLC, 7.450%, 10/15/29 | | | 56,471 | |
| | | | International Business Machines Corp., | | | | |
| | 174,000 | | | 1.625%, 05/15/20 | | | 162,886 | |
| | 169,000 | | | 4.000%, 06/20/42 | | | 158,594 | |
| | 50,000 | | | 6.220%, 08/01/27 | | | 61,625 | |
| | | | | | | | |
| | | | | | | 439,576 | |
| | | | | | | | |
SEE NOTES TO FINANCIAL STATEMENTS.
| | | | | | |
| | | |
| 20 | | | | JPMORGAN INSURANCE TRUST | | JUNE 30, 2013 |
| | | | | | | | |
PRINCIPAL
AMOUNT($) | | | SECURITY DESCRIPTION | | VALUE($) | |
| | | | | | | | |
| Corporate Bonds — Continued | |
| | | | Office Electronics — 0.0% (g) | | | | |
| | | | Xerox Corp., | | | | |
| | 17,000 | | | 4.500%, 05/15/21 | | | 17,535 | |
| | 35,000 | | | 5.625%, 12/15/19 | | | 38,638 | |
| | 50,000 | | | 6.750%, 02/01/17 | | | 56,564 | |
| | | | | | | | |
| | | | | | | 112,737 | |
| | | | | | | | |
| | | | Semiconductors & Semiconductor Equipment — 0.1% | |
| | 110,000 | | | National Semiconductor Corp., 6.600%, 06/15/17 | | | 129,250 | |
| | | | | | | | |
| | | | Software — 0.2% | | | | |
| | | | Microsoft Corp., | | | | |
| | 75,000 | | | 1.625%, 09/25/15 | | | 76,695 | |
| | 108,000 | | | 2.375%, 05/01/23 | | | 99,944 | |
| | | | Oracle Corp., | | | | |
| | 50,000 | | | 5.250%, 01/15/16 | | | 55,297 | |
| | 50,000 | | | 5.750%, 04/15/18 | | | 58,182 | |
| | 100,000 | | | 6.500%, 04/15/38 | | | 125,203 | |
| | | | | | | | |
| | | | | | | 415,321 | |
| | | | | | | | |
| | | | Total Information Technology | | | 2,203,454 | |
| | | | | | | | |
| | | | Materials — 0.4% | | | | |
| | | | Chemicals — 0.3% | | | | |
| | 30,000 | | | Dow Chemical Co. (The), 7.375%, 11/01/29 | | | 37,780 | |
| | | | E.I. du Pont de Nemours & Co., | | | | |
| | 58,000 | | | 1.950%, 01/15/16 | | | 59,472 | |
| | 25,000 | | | 4.900%, 01/15/41 | | | 26,216 | |
| | | | Mosaic Co. (The), | | | | |
| | 24,000 | | | 3.750%, 11/15/21 | | | 24,019 | |
| | 8,000 | | | 4.875%, 11/15/41 | | | 7,654 | |
| | | | PPG Industries, Inc., | | | | |
| | 14,000 | | | 5.500%, 11/15/40 | | | 15,043 | |
| | 50,000 | | | 9.000%, 05/01/21 | | | 66,822 | |
| | 90,000 | | | Praxair, Inc., 5.250%, 11/15/14 | | | 95,684 | |
| | | | Union Carbide Corp., | | | | |
| | 100,000 | | | 7.500%, 06/01/25 | | | 117,031 | |
| | 80,000 | | | 7.750%, 10/01/96 | | | 90,630 | |
| | | | | | | | |
| | | | | | | 540,351 | |
| | | | | | | | |
| | | | Construction Materials — 0.0% (g) | | | | |
| | 18,000 | | | CRH America, Inc., 6.000%, 09/30/16 | | | 20,270 | |
| | | | | | | | |
| | | | Metals & Mining — 0.1% | | | | |
| | | | BHP Billiton Finance USA Ltd., (Australia), | | | | |
| | 40,000 | | | 5.400%, 03/29/17 | | | 45,101 | |
| | 80,000 | | | 6.500%, 04/01/19 | | | 95,777 | |
| | | | | | | | |
PRINCIPAL
AMOUNT($) | | | SECURITY DESCRIPTION | | VALUE($) | |
| | | | | | | | |
| | | | | | | | |
| | | | Metals & Mining — Continued | | | | |
| | | | Rio Tinto Finance USA Ltd., (Australia), | | | | |
| | 12,000 | | | 3.500%, 11/02/20 | | | 11,940 | |
| | 60,000 | | | 8.950%, 05/01/14 | | | 63,940 | |
| | 29,000 | | | Rio Tinto Finance USA plc, (United Kingdom), 1.625%, 08/21/17 | | | 28,443 | |
| | | | | | | | |
| | | | | | | 245,201 | |
| | | | | | | | |
| | | | Total Materials | | | 805,822 | |
| | | | | | | | |
| | | | Telecommunication Services — 1.2% | | | | |
| | | | Diversified Telecommunication Services — 1.1% | |
| | | | AT&T, Inc., | | | | |
| | 70,000 | | | 3.875%, 08/15/21 | | | 72,197 | |
| | 10,000 | | | 4.300%, 12/15/42 | | | 8,709 | |
| | 205,000 | | | 5.350%, 09/01/40 | | | 207,427 | |
| | 100,000 | | | 5.500%, 02/01/18 | | | 114,376 | |
| | 70,000 | | | 5.800%, 02/15/19 | | | 81,186 | |
| | 45,000 | | | 6.300%, 01/15/38 | | | 50,030 | |
| | 145,000 | | | BellSouth Corp., 5.200%, 09/15/14 | | | 152,258 | |
| | 121,260 | | | BellSouth Telecommunications, Inc., 6.300%, 12/15/15 | | | 125,482 | |
| | 50,000 | | | Centel Capital Corp., 9.000%, 10/15/19 | | | 60,178 | |
| | | | CenturyLink, Inc., | | | | |
| | 90,000 | | | 6.450%, 06/15/21 | | | 93,825 | |
| | 60,000 | | | 7.600%, 09/15/39 | | | 57,000 | |
| | 70,000 | | | Deutsche Telekom International Finance B.V., (Netherlands), 8.750%, 06/15/30 | | | 97,109 | |
| | 200,000 | | | GTE Corp., 6.840%, 04/15/18 | | | 237,774 | |
| | 125,000 | | | GTP Acquisition Partners I LLC, 4.347%, 06/15/16 (e) | | | 131,384 | |
| | 35,000 | | | Orange S.A., (France), 2.750%, 09/14/16 | | | 35,869 | |
| | 130,000 | | | Telecom Italia Capital S.A., (Luxembourg), 5.250%, 11/15/13 | | | 131,629 | |
| | | | Telefonica Emisiones S.A.U., (Spain), | | | | |
| | 19,000 | | | 5.462%, 02/16/21 | | | 19,588 | |
| | 25,000 | | | 5.877%, 07/15/19 | | | 26,989 | |
| | | | Verizon Communications, Inc., | | | | |
| | 90,000 | | | 6.400%, 02/15/38 | | | 104,796 | |
| | 200,000 | | | 7.750%, 12/01/30 | | | 259,106 | |
| | 100,000 | | | Verizon Pennsylvania LLC, 8.350%, 12/15/30 | | | 127,917 | |
| | | | | | | | |
| | | | | | | 2,194,829 | |
| | | | | | | | |
| | | | Wireless Telecommunication Services — 0.1% | |
| | 40,000 | | | Crown Castle Towers LLC, 3.214%, 08/15/15 (e) | | | 41,180 | |
SEE NOTES TO FINANCIAL STATEMENTS.
| | | | | | | | |
| | | |
| JUNE 30, 2013 | | JPMORGAN INSURANCE TRUST | | | | | 21 | |
JPMorgan Insurance Trust Core Bond Portfolio
SCHEDULE OF PORTFOLIO INVESTMENTS
AS OF JUNE 30, 2013 (Unaudited) (continued)
| | | | | | | | |
PRINCIPAL
AMOUNT($) | | | SECURITY DESCRIPTION | | VALUE($) | |
| | | | | | | | |
| Corporate Bonds — Continued | |
| | | | Wireless Telecommunication Services — Continued | |
| | | | Rogers Communications, Inc., (Canada), | | | | |
| | 70,000 | | | 6.375%, 03/01/14 | | | 72,614 | |
| | 50,000 | | | 6.800%, 08/15/18 | | | 60,364 | |
| | | | Vodafone Group plc, (United Kingdom), | | | | |
| | 50,000 | | | 1.500%, 02/19/18 | | | 47,864 | |
| | 50,000 | | | 1.625%, 03/20/17 | | | 48,783 | |
| | 50,000 | | | 5.000%, 09/15/15 | | | 54,235 | |
| | | | | | | | |
| | | | | | | 325,040 | |
| | | | | | | | |
| | | | Total Telecommunication Services | | | 2,519,869 | |
| | | | | | | | |
| | | | Utilities — 1.4% | | | | |
| | | | Electric Utilities — 1.0% | | | | |
| | 62,000 | | | Alabama Power Co., 6.125%, 05/15/38 | | | 73,980 | |
| | 9,000 | | | Arizona Public Service Co., 4.500%, 04/01/42 | | | 8,666 | |
| | | | Duke Energy Carolinas LLC, | | | | |
| | 39,000 | | | 4.300%, 06/15/20 | | | 42,444 | |
| | 75,000 | | | 5.100%, 04/15/18 | | | 85,323 | |
| | 60,000 | | | Duke Energy Indiana, Inc., 6.350%, 08/15/38 | | | 73,113 | |
| | | | Duke Energy Progress, Inc., | | | | |
| | 100,000 | | | 5.125%, 09/15/13 | | | 100,919 | |
| | 25,000 | | | 5.300%, 01/15/19 | | | 28,718 | |
| | | | Florida Power & Light Co., | | | | |
| | 55,000 | | | 5.950%, 10/01/33 | | | 66,869 | |
| | 30,000 | | | 5.950%, 02/01/38 | | | 36,240 | |
| | 25,000 | | | Georgia Power Co., 5.950%, 02/01/39 | | | 28,855 | |
| | 18,000 | | | Great Plains Energy, Inc., 4.850%, 06/01/21 | | | 19,118 | |
| | 100,000 | | | Hydro-Quebec, (Canada), 8.050%, 07/07/24 | | | 137,533 | |
| | | | Kansas City Power & Light Co., | | | | |
| | 24,000 | | | 3.150%, 03/15/23 | | | 22,784 | |
| | 50,000 | | | 5.300%, 10/01/41 | | | 50,829 | |
| | 40,000 | | | Niagara Mohawk Power Corp., 4.881%, 08/15/19 (e) | | | 44,523 | |
| | 25,000 | | | Northern States Power Co., 6.250%, 06/01/36 | | | 30,856 | |
| | 40,000 | | | Ohio Power Co., 6.050%, 05/01/18 | | | 46,731 | |
| | | | Oncor Electric Delivery Co. LLC, | | | | |
| | 30,000 | | | 6.800%, 09/01/18 | | | 36,253 | |
| | 25,000 | | | 7.000%, 09/01/22 | | | 31,033 | |
| | | | Pacific Gas & Electric Co., | | | | |
| | 24,000 | | | 4.500%, 12/15/41 | | | 23,116 | |
| | 75,000 | | | 5.625%, 11/30/17 | | | 86,681 | |
| | 100,000 | | | 6.050%, 03/01/34 | | | 116,592 | |
| | | | | | | | |
PRINCIPAL
AMOUNT($) | | | SECURITY DESCRIPTION | | VALUE($) | |
| | | | | | | | |
| | | | | | | | |
| | | | Electric Utilities — Continued | | | | |
| | 75,000 | | | Potomac Electric Power Co., 6.500%, 11/15/37 | | | 95,265 | |
| | 35,000 | | | Progress Energy, Inc., 4.400%, 01/15/21 | | | 37,169 | |
| | 18,000 | | | Public Service Co. of Colorado, 3.200%, 11/15/20 | | | 18,442 | |
| | 175,000 | | | Public Service Co. of Oklahoma, 6.625%, 11/15/37 | | | 213,740 | |
| | | | Public Service Electric & Gas Co., | | | | |
| | 28,000 | | | 5.375%, 11/01/39 | | | 32,341 | |
| | 25,000 | | | 6.330%, 11/01/13 | | | 25,488 | |
| | 50,000 | | | Southwestern Public Service Co., 8.750%, 12/01/18 | | | 64,367 | |
| | 200,000 | | | State Grid Overseas Investment Ltd., (United Kingdom), 1.750%, 05/22/18 (e) | | | 191,687 | |
| | | | Virginia Electric and Power Co., | | | | |
| | 50,000 | | | 5.400%, 04/30/18 | | | 57,749 | |
| | 70,000 | | | 5.950%, 09/15/17 | | | 81,351 | |
| | 70,000 | | | 6.350%, 11/30/37 | | | 87,409 | |
| | 20,000 | | | Xcel Energy, Inc., 6.500%, 07/01/36 | | | 24,585 | |
| | | | | | | | |
| | | | | | | 2,120,769 | |
| | | | | | | | |
| | | | Gas Utilities — 0.2% | | | | |
| | | | AGL Capital Corp., | | | | |
| | 37,000 | | | 3.500%, 09/15/21 | | | 37,752 | |
| | 42,000 | | | 4.400%, 06/01/43 | | | 38,923 | |
| | 96,000 | | | 5.875%, 03/15/41 | | | 109,348 | |
| | 22,000 | | | Boston Gas Co., 4.487%, 02/15/42 (e) | | | 21,142 | |
| | 25,000 | | | CenterPoint Energy Resources Corp., 6.125%, 11/01/17 | | | 29,127 | |
| | 100,000 | | | NGPL PipeCo LLC, 7.119%, 12/15/17 (e) | | | 97,000 | |
| | | | | | | | |
| | | | | | | 333,292 | |
| | | | | | | | |
| | | | Independent Power Producers & Energy Traders — 0.1% | |
| | | | Exelon Generation Co. LLC, | | | | |
| | 78,000 | | | 4.000%, 10/01/20 | | | 79,133 | |
| | 29,000 | | | 5.750%, 10/01/41 | | | 29,874 | |
| | 37,000 | | | PSEG Power LLC, 5.125%, 04/15/20 | | | 40,675 | |
| | | | | | | | |
| | | | | | | 149,682 | |
| | | | | | | | |
| | | | Multi-Utilities — 0.1% | | | | |
| | 38,000 | | | Consolidated Edison Co. of New York, Inc., 5.700%, 06/15/40 | | | 43,536 | |
| | | | Sempra Energy, | | | | |
| | 100,000 | | | 6.500%, 06/01/16 | | | 114,669 | |
| | 40,000 | | | 8.900%, 11/15/13 | | | 41,204 | |
| | | | | | | | |
| | | | | | | 199,409 | |
| | | | | | | | |
SEE NOTES TO FINANCIAL STATEMENTS.
| | | | | | |
| | | |
| 22 | | | | JPMORGAN INSURANCE TRUST | | JUNE 30, 2013 |
| | | | | | | | |
PRINCIPAL
AMOUNT($) | | | SECURITY DESCRIPTION | | VALUE($) | |
| | | | | | | | |
| Corporate Bonds — Continued | |
| | | | Water Utilities — 0.0% (g) | | | | |
| | 100,000 | | | American Water Capital Corp., 6.085%, 10/15/17 | | | 115,340 | |
| | | | | | | | |
| | | | Total Utilities | | | 2,918,492 | |
| | | | | | | | |
| | | | Total Corporate Bonds
(Cost $31,973,038) | | | 33,601,362 | |
| | | | | | | | |
| Foreign Government Securities — 0.2% | |
| | | | Province of Ontario, (Canada), | | | | |
| | 75,000 | | | 2.700%, 06/16/15 | | | 77,976 | |
| | 200,000 | | | 2.950%, 02/05/15 | | | 207,577 | |
| | 100,000 | | | United Mexican States, (Mexico), 6.625%, 03/03/15 | | | 108,500 | |
| | | | | | | | |
| | | | Total Foreign Government Securities (Cost $375,466) | | | 394,053 | |
| | | | | | | | |
| Mortgage Pass-Through Securities — 8.4% | |
| | | | Federal Home Loan Mortgage Corp., | | | | |
| | 71,483 | | | ARM, 2.263%, 01/01/27 | | | 76,145 | |
| | 21,274 | | | ARM, 2.328%, 04/01/30 | | | 22,640 | |
| | 122,849 | | | ARM, 2.459%, 03/01/35 | | | 130,442 | |
| | 137,657 | | | ARM, 2.559%, 04/01/34 | | | 145,836 | |
| | 36,800 | | | ARM, 5.918%, 01/01/37 | | | 39,695 | |
| | | | Federal Home Loan Mortgage Corp. Gold Pools, 15 Year, Single Family, | | | | |
| | 25,177 | | | 4.500%, 08/01/18 | | | 26,439 | |
| | 13,134 | | | 5.000%, 12/01/13 - 04/01/14 | | | 13,862 | |
| | 1,132 | | | 5.500%, 03/01/14 | | | 1,200 | |
| | 1,056 | | | 6.000%, 04/01/14 | | | 1,063 | |
| | 124,336 | | | 6.500%, 06/01/14 - 02/01/19 | | | 132,097 | |
| | 1,060 | | | 8.500%, 11/01/15 | | | 1,065 | |
| | | | Federal Home Loan Mortgage Corp. Gold Pools, 20 Year, Single Family, | | | | |
| | 29,834 | | | 6.000%, 12/01/22 | | | 32,379 | |
| | 62,641 | | | 6.500%, 11/01/22 | | | 69,540 | |
| | | | Federal Home Loan Mortgage Corp. Gold Pools, 30 Year, Single Family, | | | | |
| | 111,118 | | | 5.500%, 10/01/33 | | | 119,472 | |
| | 223,968 | | | 6.000%, 04/01/26 - 02/01/39 | | | 244,376 | |
| | 298,090 | | | 6.500%, 11/01/25 - 11/01/34 | | | 333,920 | |
| | 91,808 | | | 7.000%, 04/01/35 | | | 106,448 | |
| | 6,097 | | | 8.500%, 07/01/28 | | | 7,072 | |
| | | | Federal Home Loan Mortgage Corp. Gold Pools, Other, | | | | |
| | 1,953,771 | | | 3.500%, 04/01/33 - 06/01/42 | | | 1,997,194 | |
| | 482,824 | | | 4.000%, 06/01/42 | | | 506,090 | |
| | 69,191 | | | 7.000%, 07/01/29 | | | 78,020 | |
| | | | | | | | |
PRINCIPAL
AMOUNT($) | | | SECURITY DESCRIPTION | | VALUE($) | |
| | | | | | | | |
| | | | Federal Home Loan Mortgage Corp., 30 Year, Single Family, | | | | |
| | 24,658 | | | 10.000%, 01/01/20 - 09/01/20 | | | 26,958 | |
| | 484 | | | 12.000%, 07/01/19 | | | 505 | |
| | | | Federal National Mortgage Association, | | | | |
| | 496,253 | | | VAR, 0.648%, 01/01/23 | | | 496,990 | |
| | 1,743 | | | ARM, 1.904%, 03/01/19 | | | 1,768 | |
| | 440,411 | | | ARM, 1.987%, 01/01/35 | | | 465,404 | |
| | 99,595 | | | ARM, 2.277%, 07/01/33 | | | 105,960 | |
| | 134,380 | | | ARM, 2.294%, 08/01/34 | | | 142,757 | |
| | 29,088 | | | ARM, 2.387%, 04/01/34 | | | 31,001 | |
| | 92,245 | | | ARM, 2.397%, 05/01/35 | | | 96,809 | |
| | 96,829 | | | ARM, 2.423%, 04/01/33 | | | 102,861 | |
| | 140,074 | | | ARM, 2.547%, 10/01/34 | | | 148,639 | |
| | 89,925 | | | ARM, 2.622%, 01/01/34 | | | 95,395 | |
| | 4,879 | | | ARM, 3.786%, 03/01/29 | | | 5,227 | |
| | | | Federal National Mortgage Association, 15 Year, Single Family, | | | | |
| | 109,035 | | | 3.500%, 09/01/18 - 05/01/19 | | | 113,727 | |
| | 18,383 | | | 4.000%, 07/01/18 | | | 19,418 | |
| | 125,599 | | | 4.500%, 03/01/23 - 05/01/23 | | | 133,390 | |
| | 17,580 | | | 5.000%, 06/01/18 | | | 18,778 | |
| | 85,947 | | | 5.500%, 04/01/22 | | | 90,756 | |
| | 142,762 | | | 6.000%, 08/01/14 - 09/01/22 | | | 153,257 | |
| | 44,896 | | | 6.500%, 08/01/20 | | | 48,915 | |
| | 3,404 | | | 8.000%, 01/01/16 | | | 3,468 | |
| | | | Federal National Mortgage Association, 20 Year, Single Family, | | | | |
| | 60,492 | | | 4.500%, 01/01/25 | | | 64,976 | |
| | 374,496 | | | 5.000%, 11/01/23 | | | 406,473 | |
| | 106,440 | | | 6.500%, 03/01/19 - 12/01/22 | | | 118,041 | |
| | | | Federal National Mortgage Association, 30 Year, FHA/VA, | | | | |
| | 35,977 | | | 8.500%, 10/01/26 - 06/01/30 | | | 38,893 | |
| | 74,360 | | | 9.000%, 04/01/25 | | | 86,365 | |
| | | | Federal National Mortgage Association, 30 Year, Single Family, | | | | |
| | 232,879 | | | 3.000%, 09/01/31 | | | 227,904 | |
| | 80,125 | | | 4.500%, 04/01/38 - 05/01/39 | | | 84,751 | |
| | 156,903 | | | 5.000%, 09/01/35 | | | 168,936 | |
| | 59,745 | | | 5.500%, 01/01/38 - 06/01/38 | | | 64,797 | |
| | 139,158 | | | 6.000%, 01/01/29 - 03/01/33 | | | 153,852 | |
| | 481,401 | | | 6.500%, 09/01/25 - 11/01/36 | | | 536,971 | |
| | 1,603 | | | 7.000%, 08/01/32 | | | 1,737 | |
| | 23,812 | | | 7.500%, 03/01/30 | | | 26,164 | |
| | 121,562 | | | 8.000%, 03/01/27 - 11/01/28 | | | 144,692 | |
SEE NOTES TO FINANCIAL STATEMENTS.
| | | | | | | | |
| | | |
| JUNE 30, 2013 | | JPMORGAN INSURANCE TRUST | | | | | 23 | |
JPMorgan Insurance Trust Core Bond Portfolio
SCHEDULE OF PORTFOLIO INVESTMENTS
AS OF JUNE 30, 2013 (Unaudited) (continued)
| | | | | | | | |
PRINCIPAL
AMOUNT($) | | | SECURITY DESCRIPTION | | VALUE($) | |
| | | | | | | | |
| Mortgage Pass-Through Securities — Continued | | | | |
| | | | Federal National Mortgage Association, Other, | | | | |
| | 1,000,000 | | | 2.010%, 06/01/20 | | | 967,073 | |
| | 297,705 | | | 2.418%, 12/01/22 | | | 282,581 | |
| | 1,000,000 | | | 2.480%, 12/01/22 - 02/01/23 | | | 953,928 | |
| | 500,000 | | | 2.531%, 11/01/22 | | | 475,021 | |
| | 500,000 | | | 2.583%, 04/01/23 | | | 468,980 | |
| | 1,000,000 | | | 2.604%, 05/01/23 | | | 937,850 | |
| | 996,485 | | | 3.500%, 05/01/43 | | | 995,615 | |
| | 1,434,738 | | | 4.000%, 07/01/42 | | | 1,479,996 | |
| | 479,518 | | | 4.130%, 07/01/20 | | | 524,311 | |
| | 225,390 | | | 5.500%, 09/01/33 - 04/01/38 | | | 243,124 | |
| | 108,161 | | | 6.000%, 09/01/28 | | | 118,597 | |
| | 187,023 | | | 6.500%, 10/01/35 | | | 211,042 | |
| | | | Government National Mortgage Association II, 30 Year, Single Family, | | | | |
| | 3,683 | | | 7.500%, 12/20/26 | | | 4,515 | |
| | 76,088 | | | 8.000%, 11/20/26 - 01/20/27 | | | 95,042 | |
| | 2,556 | | | 8.500%, 05/20/25 | | | 2,980 | |
| | | | Government National Mortgage Association II, Other, | | | | |
| | 536,194 | | | VAR, 2.250%, 07/20/34 - 09/20/34 | | | 558,447 | |
| | 6,237 | | | Government National Mortgage Association, 15 Year, Single Family, 8.000%, 01/15/16 | | | 6,471 | |
| | | | Government National Mortgage Association, 30 Year, Single Family, | | | | |
| | 145,538 | | | 6.000%, 05/15/37 - 10/15/38 | | | 161,587 | |
| | 136,846 | | | 6.500%, 03/15/28 - 12/15/38 | | | 155,223 | |
| | 33,885 | | | 7.000%, 12/15/25 - 06/15/33 | | | 39,561 | |
| | 20,259 | | | 7.500%, 05/15/23 - 09/15/28 | | | 22,461 | |
| | 18,254 | | | 8.000%, 09/15/22 - 10/15/27 | | | 20,935 | |
| | 5,562 | | | 9.000%, 11/15/24 | | | 6,077 | |
| | 172,377 | | | 9.500%, 10/15/24 | | | 196,703 | |
| | | | | | | | |
| | | | Total Mortgage Pass-Through Securities
(Cost $17,334,898) | | | 17,439,650 | |
| | | | | | | | |
| Municipal Bonds — 0.2% (t) | |
| | | | Illinois — 0.1% | | | | |
| | 160,000 | | | State of Illinois, Taxable Pension, Series 2003, GO, 5.100%, 06/01/33 | | | 150,877 | |
| | | | | | | | |
| | | | New York — 0.1% | | | | |
| | 30,000 | | | New York State Dormitory Authority, State Personal Income Tax, Series D, Rev., 5.600%, 03/15/40 | | | 33,444 | |
| | 130,000 | | | Port Authority of New York & New Jersey, Taxable Consolidated 164th, Rev., 5.647%, 11/01/40 | | | 144,744 | |
| | | | | | | | |
| | | | | | | 178,188 | |
| | | | | | | | |
| | | | | | | | |
PRINCIPAL
AMOUNT($) | | | SECURITY DESCRIPTION | | VALUE($) | |
| | | | | | | | |
| | | | | | | | |
| | | | Ohio — 0.0% (g) | | | | |
| | 98,000 | | | Ohio State University, General Receipts, Series A, Rev., 4.800%, 06/01/11 † | | | 85,834 | |
| | | | | | | | |
| | | | Total Municipal Bonds
(Cost $416,202) | | | 414,899 | |
| | | | | | | | |
| U.S. Government Agency Securities — 13.3% | |
| | | | Federal Home Loan Mortgage Corp., | | | | |
| | 30,000 | | | 4.875%, 06/13/18 | | | 34,600 | |
| | 125,000 | | | 5.125%, 10/18/16 | | | 142,102 | |
| | | | Federal National Mortgage Association, | | | | |
| | 3,000,000 | | | Zero Coupon, 10/09/19 | | | 2,520,000 | |
| | 195,000 | | | 2.750%, 03/13/14 | | | 198,462 | |
| | 150,000 | | | 5.000%, 02/13/17 | | | 170,984 | |
| | | | Federal National Mortgage Association STRIPS, | | | | |
| | 6,000,000 | | | Zero Coupon, 09/23/20 | | | 4,998,420 | |
| | 630,000 | | | Zero Coupon, 03/23/28 | | | 349,502 | |
| | | | Financing Corp. Fico STRIPS, | | | | |
| | 2,000,000 | | | Zero Coupon, 11/02/18 | | | 1,804,788 | |
| | 8,000,000 | | | Zero Coupon, 12/06/18 | | | 7,185,752 | |
| | 100,000 | | | Zero Coupon, 09/26/19 | | | 87,139 | |
| | 4,100,000 | | | Residual Funding Corp. STRIPS, Zero Coupon, 07/15/20 | | | 3,503,393 | |
| | 2,000,000 | | | Resolution Funding Corp. STRIPS, Zero Coupon, 01/15/20 | | | 1,735,894 | |
| | | | Tennessee Valley Authority, | | | | |
| | 33,000 | | | 4.625%, 09/15/60 | | | 31,703 | |
| | 100,000 | | | 5.250%, 09/15/39 | | | 112,512 | |
| | 5,000,000 | | | Tennessee Valley Authority STRIPS, Zero Coupon, 07/15/16 | | | 4,826,980 | |
| | | | | | | | |
| | | | Total U.S. Government Agency Securities
(Cost $22,219,937) | | | 27,702,231 | |
| | | | | | | | |
| U.S. Treasury Obligations — 24.3% | |
| | | | U.S. Treasury Bonds, | | | | |
| | 415,000 | | | 4.375%, 02/15/38 | | | 485,939 | |
| | 150,000 | | | 4.500%, 02/15/36 | | | 178,617 | |
| | 75,000 | | | 4.500%, 05/15/38 | | | 89,484 | |
| | 100,000 | | | 4.750%, 02/15/37 | | | 123,375 | |
| | 455,000 | | | 5.000%, 05/15/37 | | | 580,765 | |
| | 50,000 | | | 5.375%, 02/15/31 | | | 65,133 | |
| | 200,000 | | | 6.125%, 11/15/27 | | | 274,438 | |
| | 50,000 | | | 6.250%, 05/15/30 | | | 70,836 | |
| | 10,000 | | | 6.375%, 08/15/27 | | | 14,000 | |
| | 150,000 | | | 6.750%, 08/15/26 | | | 214,781 | |
| | 80,000 | | | 7.250%, 08/15/22 | | | 112,906 | |
| | 250,000 | | | 8.000%, 11/15/21 | | | 362,442 | |
SEE NOTES TO FINANCIAL STATEMENTS.
| | | | | | |
| | | |
| 24 | | | | JPMORGAN INSURANCE TRUST | | JUNE 30, 2013 |
| | | | | | | | |
PRINCIPAL
AMOUNT($) | | | SECURITY DESCRIPTION | | VALUE($) | |
| | | | | | | | |
| U.S. Treasury Obligations — Continued | |
| | | | U.S. Treasury Bonds STRIPS, | | | | |
| | 600,000 | | | 11/15/14 | | | 598,008 | |
| | 1,750,000 | | | 02/15/15 | | | 1,741,143 | |
| | 500,000 | | | 05/15/15 | | | 496,732 | |
| | 4,715,000 | | | 11/15/15 | | | 4,658,043 | |
| | 3,300,000 | | | 02/15/16 | | | 3,249,880 | |
| | 1,615,000 | | | 05/15/16 | | | 1,585,313 | |
| | 1,925,000 | | | 08/15/16 | | | 1,880,881 | |
| | 3,050,000 | | | 11/15/16 | | | 2,964,695 | |
| | 825,000 | | | 02/15/17 | | | 797,575 | |
| | 3,625,000 | | | 08/15/17 | | | 3,460,541 | |
| | 2,900,000 | | | 11/15/17 | | | 2,749,510 | |
| | 150,000 | | | 02/15/18 | | | 141,117 | |
| | 280,000 | | | 02/15/19 | | | 255,725 | |
| | 100,000 | | | 05/15/19 | | | 90,501 | |
| | 400,000 | | | 08/15/19 | | | 359,222 | |
| | 250,000 | | | 02/15/20 | | | 220,472 | |
| | 2,653,000 | | | 05/15/20 | | | 2,317,433 | |
| | 10,000,000 | | | 05/15/20 | | | 8,752,100 | |
| | 350,000 | | | 08/15/20 | | | 302,913 | |
| | 65,000 | | | 11/15/20 | | | 55,755 | |
| | 35,000 | | | 02/15/21 | | | 29,668 | |
| | 750,000 | | | 05/15/21 | | | 629,858 | |
| | 100,000 | | | 08/15/21 | | | 83,022 | |
| | 725,000 | | | 11/15/21 | | | 595,704 | |
| | 100,000 | | | 02/15/22 | | | 81,366 | |
| | 10,000 | | | 11/15/24 | | | 7,193 | |
| | 100,000 | | | 05/15/26 | | | 67,140 | |
| | 23,000 | | | 08/15/26 | | | 15,250 | |
| | 250,000 | | | 11/15/26 | | | 163,822 | |
| | 600,000 | | | 02/15/27 | | | 388,799 | |
| | 175,000 | | | 05/15/27 | | | 112,002 | |
| | 150,000 | | | 08/15/27 | | | 94,916 | |
| | 500,000 | | | 11/15/27 | | | 312,969 | |
| | 27,000 | | | 02/15/28 | | | 16,696 | |
| | 100,000 | | | 05/15/28 | | | 61,160 | |
| | 50,000 | | | 08/15/28 | | | 30,247 | |
| | 100,000 | | | 11/15/28 | | | 59,817 | |
| | 250,000 | | | 08/15/29 | | | 144,826 | |
| | 100,000 | | | 11/15/29 | | | 57,313 | |
| | 725,000 | | | 02/15/30 | | | 411,295 | |
| | 50,000 | | | 08/15/30 | | | 27,757 | |
| | 50,000 | | | 11/15/30 | | | 27,449 | |
| | 175,000 | | | 05/15/31 | | | 94,088 | |
| | 100,000 | | | 02/15/32 | | | 52,072 | |
| | 100,000 | | | 05/15/32 | | | 51,536 | |
| | | | | | | | |
PRINCIPAL
AMOUNT($) | | | SECURITY DESCRIPTION | | VALUE($) | |
| | | | | | | | |
| | 400,000 | | | 11/15/32 | | | 202,056 | |
| | 325,000 | | | 05/15/33 | | | 160,909 | |
| | 100,000 | | | 08/15/33 | | | 49,012 | |
| | 350,000 | | | 11/15/33 | | | 169,704 | |
| | 225,000 | | | 02/15/34 | | | 108,043 | |
| | 100,000 | | | 05/15/34 | | | 47,492 | |
| | 50,000 | | | 11/15/34 | | | 23,292 | |
| | 150,000 | | | 02/15/35 | | | 69,180 | |
| | 250,000 | | | 05/15/35 | | | 114,102 | |
| | | | U.S. Treasury Inflation Indexed Bonds, | | | | |
| | 100,000 | | | 2.500%, 01/15/29 | | | 133,587 | |
| | 300,000 | | | 3.625%, 04/15/28 | | | 598,603 | |
| | | | U.S. Treasury Inflation Indexed Notes, | | | | |
| | 500,000 | | | 0.500%, 04/15/15 | | | 549,865 | |
| | 170,000 | | | 1.375%, 07/15/18 | | | 200,216 | |
| | | | U.S. Treasury Notes, | | | | |
| | 125,000 | | | 1.375%, 11/30/18 | | | 124,141 | |
| | 400,000 | | | 1.375%, 12/31/18 | | | 396,688 | |
| | 400,000 | | | 1.500%, 08/31/18 | | | 401,125 | |
| | 150,000 | | | 1.750%, 10/31/18 | | | 152,109 | |
| | 400,000 | | | 2.250%, 07/31/18 | | | 416,625 | |
| | 200,000 | | | 2.625%, 11/15/20 | | | 208,390 | |
| | 742,000 | | | 3.125%, 05/15/19 | | | 805,244 | |
| | 400,000 | | | 3.125%, 05/15/21 | | | 429,531 | |
| | 200,000 | | | 3.250%, 12/31/16 | | | 216,422 | |
| | 200,000 | | | 3.500%, 02/15/18 | | | 220,078 | |
| | 450,000 | | | 3.500%, 05/15/20 | | | 497,847 | |
| | 650,000 | | | 3.625%, 02/15/21 | | | 722,465 | |
| | 500,000 | | | 4.750%, 08/15/17 | | | 573,906 | |
| | | | | | | | |
| | | | Total U.S. Treasury Obligations
(Cost $45,843,182) | | | 50,456,872 | |
| | | | | | | | |
| | |
| SHARES | | | | | | |
| Short-Term Investment — 1.4% | |
| | | | Investment Company — 1.4% | | | | |
| | 2,810,698 | | | JPMorgan Liquid Assets Money Market Fund, Institutional Class Shares,
0.030% (b) (l)
(Cost $2,810,698) | | | 2,810,698 | |
| | | | | | | | |
| | | | Total Investments — 99.7%
(Cost $190,169,868) | | | 206,833,363 | |
| | | | Other Assets in Excess of
Liabilities — 0.3% | | | 547,420 | |
| | | | | | | | |
| | | | NET ASSETS — 100.0% | | $ | 207,380,783 | |
| | | | | | | | |
Percentages indicated are based on net assets.
SEE NOTES TO FINANCIAL STATEMENTS.
| | | | | | | | |
| | | |
| JUNE 30, 2013 | | JPMORGAN INSURANCE TRUST | | | | | 25 | |
NOTES TO SCHEDULE OF PORTFOLIO INVESTMENTS
AS OF JUNE 30, 2013 (Unaudited)
| | |
| ARM | | — Adjustable Rate Mortgage. The interest rate shown is the rate in effect as of June 30, 2013. |
| CMO | | — Collateralized Mortgage Obligation |
| ESOP | | — Employee Stock Ownership Program |
| FHA | | — Federal Housing Administration |
| GMAC | | — General Motors Acceptance Corp. |
| GO | | — General Obligation |
| HB | | — High Coupon Bonds (a.k.a. “IOettes”) represent the right to receive interest payments on an underlying pool of mortgages with similar features as those associated with IO securities. Unlike IO’s the owner also has a right to receive a very small portion of principal. The high interest rates result from taking interest payments from other classes in the Real Estate Mortgage Investment Conduit trust and allocating them to the small principal of the HB class. |
| IF | | — Inverse Floaters represent securities that pay interest at a rate that increases (decreases) with a decline (incline) in a specified index. The interest rate shown is the rate in effect as of June 30, 2013. The rate may be subject to a cap and floor. |
| IO | | — Interest Only represents the right to receive the monthly interest payments on an underlying pool of mortgage loans. The principal amount shown represents the par value on the underlying pool. The yields on these securities are subject to accelerated principal paydowns as a result of prepayment or refinancing of the underlying pool of mortgage instruments. As a result, interest income may be reduced considerably. |
| PO | | — Principal Only represents the right to receive the principal portion only on an underlying pool of mortgage loans. The market value of these securities is extremely volatile in response to changes in market interest rates. As prepayments on the underlying mortgages of these securities increase, the yield on these securities increases. |
| | |
| REMIC | | — Real Estate Mortgage Investment Conduit |
| Rev. | | — Revenue |
| STRIPS | | — Separate Trading of Registered Interest and Principal of Securities. The STRIPS Program lets investors hold and trade individual interest and principal components of eligible notes and bonds as separate securities. |
| SUB | | — Step-Up Bond. The interest rate shown is the rate in effect as of June 30, 2013. |
| VA | | — Veterans Administration |
| VAR | | — Variable Rate Security. The interest rate shown is the rate in effect as of June 30, 2013. |
| |
| (b) | | — Investment in affiliate. Money market fund registered under the Investment Company Act of 1940, as amended, and advised by J.P. Morgan Investment Management Inc. |
| (d) | | — Defaulted Security. |
| (e) | | — Security is exempt from registration under Rule 144A of the Securities Act of 1933, as amended. Unless otherwise indicated, this security has been determined to be liquid under procedures established by the Board of Trustees and may be resold in transactions exempt from registration, normally to qualified institutional buyers. |
| (g) | | — Amount rounds to less than 0.1%. |
| (h) | | — Amount rounds to less than one thousand (shares or dollars). |
| (i) | | — Security has been deemed illiquid pursuant to procedures approved by the Board of Trustees and may be difficult to sell. |
| (l) | | — The rate shown is the current yield as of June 30, 2013. |
| (t) | | — The date shown represents the earliest of the prerefunded date, next put date or final maturity date. |
| † | | — Security matures in 2111. |
SEE NOTES TO FINANCIAL STATEMENTS.
| | | | | | |
| | | |
| 26 | | | | JPMORGAN INSURANCE TRUST | | JUNE 30, 2013 |
STATEMENT OF ASSETS AND LIABILITIES
AS OF JUNE 30, 2013 (Unaudited)
| | | | |
| | |
Core Bond
Portfolio | |
ASSETS: | |
Investments in non-affiliates, at value | | $ | 204,022,665 | |
Investments in affiliates, at value | | | 2,810,698 | |
| | | | |
Total investment securities, at value | | | 206,833,363 | |
Receivables: | | | | |
Investment securities sold | | | 7,770 | |
Portfolio shares sold | | | 23,805 | |
Interest from non-affiliates | | | 867,321 | |
Dividends from affiliates | | | 56 | |
| | | | |
Total Assets | | | 207,732,315 | |
| | | | |
| |
LIABILITIES: | | | | |
Payables: | | | | |
Portfolio shares redeemed | | | 98,830 | |
Accrued liabilities: | | | | |
Investment advisory fees | | | 68,311 | |
Administration fees | | | 14,154 | |
Distribution fees | | | 3,356 | |
Custodian and accounting fees | | | 60,436 | |
Trustees’ and Chief Compliance Officer’s fees | | | 39 | |
Audit Fees | | | 49,807 | |
Other | | | 56,599 | |
| | | | |
Total Liabilities | | | 351,532 | |
| | | | |
Net Assets | | $ | 207,380,783 | |
| | | | |
|
NET ASSETS : | |
Paid-in-Capital | | $ | 193,194,480 | |
Accumulated undistributed net investment income | | | 4,159,357 | |
Accumulated net realized gains (losses) | | | (6,636,549 | ) |
Net unrealized appreciation (depreciation) | | | 16,663,495 | |
| | | | |
Total Net Assets | | $ | 207,380,783 | |
| | | | |
| |
Net Assets: | | | | |
Class 1 | | $ | 190,626,110 | |
Class 2 | | | 16,754,673 | |
| | | | |
Total | | $ | 207,380,783 | |
| | | | |
Outstanding units of beneficial interest (shares) | | | | |
(unlimited number of shares authorized, no par value): | | | | |
Class 1 | | | 17,235,792 | |
Class 2 | | | 1,523,608 | |
Net Asset Value, offering and redemption price per share (a): | | | | |
Class 1 | | $ | 11.06 | |
Class 2 | | | 11.00 | |
Cost of investments in non-affiliates | | $ | 187,359,170 | |
Cost of investments in affiliates | | | 2,810,698 | |
| (a) | Per share amounts may not recalculate due to rounding of net assets and/or shares outstanding. |
SEE NOTES TO FINANCIAL STATEMENTS.
| | | | | | | | |
| | | |
| JUNE 30, 2013 | | JPMORGAN INSURANCE TRUST | | | | | 27 | |
STATEMENT OF OPERATIONS
FOR THE SIX MONTHS ENDED JUNE 30, 2013 (Unaudited)
| | | | |
| | |
Core Bond
Portfolio | |
INVESTMENT INCOME: | |
Interest income from non-affiliates | | $ | 4,829,982 | |
Dividend income from affiliates | | | 1,439 | |
| | | | |
Total investment income | | | 4,831,421 | |
| | | | |
| |
EXPENSES: | | | | |
Investment advisory fees | | | 427,108 | |
Administration fees | | | 90,042 | |
Distribution fees — Class 2 | | | 16,843 | |
Custodian and accounting fees | | | 56,081 | |
Professional fees | | | 38,759 | |
Trustees’ and Chief Compliance Officer’s fees | | | 1,214 | |
Printing and mailing costs | | | 16,018 | |
Transfer agent fees | | | 3,204 | |
Other | | | 13,020 | |
| | | | |
Total expenses | | | 662,289 | |
| | | | |
Less amounts waived | | | (10,115 | ) |
| | | | |
Net expenses | | | 652,174 | |
| | | | |
Net investment income (loss) | | | 4,179,247 | |
| | | | |
| |
REALIZED/UNREALIZED GAINS (LOSSES): | | | | |
Net realized gain (loss) on transactions from investments in non-affiliates | | | (100,460 | ) |
Change in net unrealized appreciation/depreciation of investments in non-affiliates | | | (7,785,609 | ) |
| | | | |
Net realized/unrealized gains (losses) | | | (7,886,069 | ) |
| | | | |
Change in net assets resulting from operations | | | (3,706,822 | ) |
| | | | |
SEE NOTES TO FINANCIAL STATEMENTS.
| | | | | | |
| | | |
| 28 | | | | JPMORGAN INSURANCE TRUST | | JUNE 30, 2013 |
STATEMENTS OF CHANGES IN NET ASSETS
FOR THE PERIODS INDICATED
| | | | | | | | |
| | | Core Bond Portfolio | |
| | | Six Months Ended
6/30/2013
(Unaudited) | | | Year Ended
12/31/2012 | |
CHANGE IN NET ASSETS RESULTING FROM OPERATIONS: | |
Net investment income (loss) | | $ | 4,179,247 | | | $ | 9,740,791 | |
Net realized gain (loss) | | | (100,460 | ) | | | (307,285 | ) |
Change in net unrealized appreciation/depreciation | | | (7,785,609 | ) | | | 2,266,991 | |
| | | | | | | | |
Change in net assets resulting from operations | | | (3,706,822 | ) | | | 11,700,497 | |
| | | | | | | | |
| | |
DISTRIBUTIONS TO SHAREHOLDERS: | | | | | | | | |
Class 1 | | | | | | | | |
From net investment income | | | (9,052,968 | ) | | | (9,992,343 | ) |
Class 2 | | | | | | | | |
From net investment income | | | (680,242 | ) | | | (135,209 | ) |
| | | | | | | | |
Total distributions to shareholders | | | (9,733,210 | ) | | | (10,127,552 | ) |
| | | | | | | | |
| | |
CAPITAL TRANSACTIONS: | | | | | | | | |
Change in net assets resulting from capital transactions | | | 3,428,502 | | | | (11,119,967 | ) |
| | | | | | | | |
| | |
NET ASSETS: | | | | | | | | |
Change in net assets | | | (10,011,530 | ) | | | (9,547,022 | ) |
Beginning of period | | | 217,392,313 | | | | 226,939,335 | |
| | | | | | | | |
End of period | | $ | 207,380,783 | | | $ | 217,392,313 | |
| | | | | | | | |
Accumulated undistributed net investment income | | $ | 4,159,357 | | | $ | 9,713,320 | |
| | | | | | | | |
| | |
CAPITAL TRANSACTIONS: | | | | | | | | |
Class 1 | | | | | | | | |
Proceeds from shares issued | | $ | 6,674,291 | | | $ | 30,432,330 | |
Distributions reinvested | | | 9,052,968 | | | | 9,992,343 | |
Cost of shares redeemed | | | (20,721,666 | ) | | | (58,978,592 | ) |
| | | | | | | | |
Change in net assets resulting from Class 1 capital transactions | | $ | (4,994,407 | ) | | $ | (18,553,919 | ) |
| | | | | | | | |
Class 2 | | | | | | | | |
Proceeds from shares issued | | $ | 9,995,574 | | | $ | 8,625,937 | |
Distributions reinvested | | | 680,242 | | | | 135,209 | |
Cost of shares redeemed | | | (2,252,907 | ) | | | (1,327,194 | ) |
| | | | | | | | |
Change in net assets resulting from Class 2 capital transactions | | $ | 8,422,909 | | | $ | 7,433,952 | |
| | | | | | | | |
Total change in net assets resulting from capital transactions | | $ | 3,428,502 | | | $ | (11,119,967 | ) |
| | | | | | | | |
| | |
SHARE TRANSACTIONS: | | | | | | | | |
Class 1 | | | | | | | | |
Issued | | | 571,776 | | | | 2,605,209 | |
Reinvested | | | 797,618 | | | | 877,291 | |
Redeemed | | | (1,794,048 | ) | | | (5,047,684 | ) |
| | | | | | | | |
Change in Class 1 Shares | | | (424,654 | ) | | | (1,565,184 | ) |
| | | | | | | | |
Class 2 | | | | | | | | |
Issued | | | 863,892 | | | | 743,482 | |
Reinvested | | | 60,252 | | | | 11,902 | |
Redeemed | | | (196,610 | ) | | | (113,458 | ) |
| | | | | | | | |
Change in Class 2 Shares | | | 727,534 | | | | 641,926 | |
| | | | | | | | |
SEE NOTES TO FINANCIAL STATEMENTS.
| | | | | | | | |
| | | |
| JUNE 30, 2013 | | JPMORGAN INSURANCE TRUST | | | | | 29 | |
FINANCIAL HIGHLIGHTS
FOR THE PERIODS INDICATED
| | | | | | | | | | | | | | | | | | | | | | | | |
| | | Per share operating performance | |
| | | | | | Investment operations | | | Distributions | | | | |
| | | Net asset
value,
beginning
of period | | | Net
investment
income
(loss) | | | Net realized
and unrealized
gains
(losses) on
investments | | | Total from
investment
operations | | | Net
investment
income | | | Net asset
value,
end of
period | |
Core Bond Portfolio | | | | | | | | | | | | | | | | | | | | | | | | |
Class 1 | | | | | | | | | | | | | | | | | | | | | | | | |
Six Months Ended June 30, 2013 (Unaudited) | | $ | 11.78 | | | $ | 0.23 | (f) | | $ | (0.42 | ) | | $ | (0.19 | ) | | $ | (0.53 | ) | | $ | 11.06 | |
Year Ended December 31, 2012 | | | 11.71 | | | | 0.51 | (f) | | | 0.10 | | | | 0.61 | | | | (0.54 | ) | | | 11.78 | |
Year Ended December 31, 2011 | | | 11.54 | | | | 0.54 | (f) | | | 0.28 | | | | 0.82 | | | | (0.65 | ) | | | 11.71 | |
Year Ended December 31, 2010 | | | 10.99 | | | | 0.57 | (f) | | | 0.42 | | | | 0.99 | | | | (0.44 | ) | | | 11.54 | |
Year Ended December 31, 2009 | | | 10.94 | | | | 0.61 | (f) | | | 0.38 | | | | 0.99 | | | | (0.94 | ) | | | 10.99 | |
Year Ended December 31, 2008 | | | 11.41 | | | | 0.56 | (f) | | | (0.41 | ) | | | 0.15 | | | | (0.62 | ) | | | 10.94 | |
| | | | | | |
Class 2 | | | | | | | | | | | | | | | | | | | | | | | | |
Six Months Ended June 30, 2013 (Unaudited) | | | 11.72 | | | | 0.21 | (f) | | | (0.41 | ) | | | (0.20 | ) | | | (0.52 | ) | | | 11.00 | |
Year Ended December 31, 2012 | | | 11.68 | | | | 0.47 | (f) | | | 0.11 | | | | 0.58 | | | | (0.54 | ) | | | 11.72 | |
Year Ended December 31, 2011 | | | 11.51 | | | | 0.50 | (f) | | | 0.29 | | | | 0.79 | | | | (0.62 | ) | | | 11.68 | |
Year Ended December 31, 2010 | | | 10.97 | | | | 0.54 | (f) | | | 0.42 | | | | 0.96 | | | | (0.42 | ) | | | 11.51 | |
Year Ended December 31, 2009 | | | 10.92 | | | | 0.59 | (f) | | | 0.37 | | | | 0.96 | | | | (0.91 | ) | | | 10.97 | |
Year Ended December 31, 2008 | | | 11.38 | | | | 0.54 | (f) | | | (0.41 | ) | | | 0.13 | | | | (0.59 | ) | | | 10.92 | |
| (a) | Annualized for periods less than one year. |
| (b) | Not annualized for periods less than one year. |
| (c) | Includes adjustments in accordance with accounting principles generally accepted in the United States of America and as such, the net asset values for financial reporting purposes and the returns based upon those net asset values may differ from the net asset values and returns for shareholder transactions. |
| (d) | Includes earnings credits and interest expense, if applicable, each of which is less than 0.01% unless otherwise noted. |
| (e) | Portfolio turnover is calculated by dividing the lesser of total purchases or sales of portfolio securities for the reporting period by the monthly average value of portfolio securities owned during the reporting period. Excluded from both the numerator and denominator are amounts relating to derivatives and securities whose maturities or expiration dates at the time of acquisition were one year or less. |
| (f) | Calculated based upon average shares outstanding. |
SEE NOTES TO FINANCIAL STATEMENTS.
| | | | | | |
| | | |
| 30 | | | | JPMORGAN INSURANCE TRUST | | JUNE 30, 2013 |
| | | | | | | | | | | | | | | | | | | | | | |
| | | Ratios/Supplemental data | |
| | | | | | | Ratios to average net assets (a) | | | | |
Total
return (b)(c) | | | Net assets,
end of
period | | | Net
expenses (d) | | |
Net
investment
income
(loss) | | | Expenses
without waivers,
reimbursements and
earnings credits | | | Portfolio
turnover
rate (b)(e) | |
| | | | | | | | | | | | | | | | | | | | | | |
| | | | | | | | | | | | | | | | | | | | | | |
| | (1.74 | )% | | $ | 190,626,110 | | | | 0.60 | % | | | 3.93 | % | | | 0.60 | % | | | 8 | % |
| | 5.33 | | | | 208,061,368 | | | | 0.60 | | | | 4.36 | | | | 0.62 | | | | 8 | |
| | 7.46 | | | | 225,138,765 | | | | 0.59 | | | | 4.74 | | | | 0.61 | | | | 9 | |
| | 9.24 | | | | 245,677,262 | | | | 0.60 | | | | 5.06 | | | | 0.62 | | | | 10 | |
| | 9.65 | | | | 263,558,623 | | | | 0.59 | | | | 5.63 | | | | 0.67 | | | | 17 | |
| | 1.31 | | | | 145,805,357 | | | | 0.60 | | | | 5.04 | | | | 0.63 | | | | 3 | |
| | | | | |
| | | | | | | | | | | | | | | | | | | | | | |
| | (1.83 | ) | | | 16,754,673 | | | | 0.85 | | | | 3.67 | | | | 0.85 | | | | 8 | |
| | 5.07 | | | | 9,330,945 | | | | 0.85 | | | | 4.00 | | | | 0.87 | | | | 8 | |
| | 7.21 | | | | 1,800,570 | | | | 0.84 | | | | 4.33 | | | | 0.84 | | | | 9 | |
| | 8.97 | | | | 19,644 | | | | 0.85 | | | | 4.80 | | | | 0.88 | | | | 10 | |
| | 9.32 | | | | 18,033 | | | | 0.84 | | | | 5.47 | | | | 0.92 | | | | 17 | |
| | 1.15 | | | | 16,490 | | | | 0.85 | | | | 4.83 | | | | 0.87 | | | | 3 | |
SEE NOTES TO FINANCIAL STATEMENTS.
| | | | | | | | |
| | | |
| JUNE 30, 2013 | | JPMORGAN INSURANCE TRUST | | | | | 31 | |
NOTES TO FINANCIAL STATEMENTS
AS OF JUNE 30, 2013 (Unaudited)
1. Organization
JPMorgan Insurance Trust (the “Trust”) is registered under the Investment Company Act of 1940, as amended (the “1940 Act”), as an open-end management investment company and is a Massachusetts business trust.
The following is a separate Portfolio of the Trust (the “Portfolio”) covered by this report:
| | | | |
| | | Classes Offered | | Diversified/Non-Diversified |
| Core Bond Portfolio | | Class 1 and Class 2 | | Diversified |
The investment objective of the Portfolio is to maximize total return by investing primarily in a diversified portfolio of intermediate- and long-term debt securities.
Portfolio shares are offered only to separate accounts of participating insurance companies and Eligible Plans. Individuals may not purchase shares directly from the Portfolio.
All classes of shares have equal rights as to earnings, assets and voting privileges, except that each class may bear different distribution and service fees and each class has exclusive voting rights with respect to its distribution plan and administrative services plan.
2. Significant Accounting Policies
The following is a summary of significant accounting policies followed by the Portfolio in the preparation of its financial statements. The policies are in accordance with accounting principles generally accepted in the United States of America (“GAAP”). The preparation of financial statements requires management to make estimates and assumptions that affect the reported amounts and disclosures in the financial statements. Actual results could differ from those estimates.
A. Valuation of Investments — Fixed income securities (other than certain short-term investments maturing in less than 61 days) are valued each day based on prices received from independent or affiliated pricing services approved by the Board of Trustees or third party broker-dealers. The pricing services or broker-dealers use multiple valuation techniques to determine fair value. In instances where sufficient market activity exists, the pricing services or broker-dealers may utilize a market-based approach through which quotes from market makers are used to determine fair value. In instances where sufficient market activity may not exist or is limited, the pricing services or broker-dealers also utilize proprietary valuation models which may consider market transactions in comparable securities and the various relationships between securities in determining fair value and/or market characteristics such as benchmark yield curves, option-adjusted spreads, credit spreads, estimated default rates, coupon-rates, anticipated timing of principal repayments, underlying collateral, and other unique security features in order to estimate the relevant cash flows, which are then discounted to calculate the fair values. Generally, short-term investments of sufficient credit quality maturing in less than 61 days are valued at amortized cost, which approximates fair value. Investments in other open-end investment companies are valued at each investment company’s net asset value per share (“NAV”) as of the report date.
Certain investments of the Portfolio may, depending upon market conditions, trade in relatively thin markets and/or in markets that experience significant volatility. As a result of these conditions, the prices used by the Portfolio to value these securities may differ from the value that would be realized if these securities were sold, and the differences could be material. Futures and options are generally valued on the basis of available market quotations. Swaps and other derivatives are valued daily, primarily using independent or affiliated pricing services approved by the Board of Trustees. If valuations are not available from such services or values received are deemed not representative of fair value, values will be obtained from a third party broker-dealer or counterparty.
Securities or other assets for which market quotations are not readily available or for which market quotations are deemed to not represent the fair value of the security or asset at the time of pricing (including certain illiquid securities) are fair valued in accordance with procedures established by and under the supervision and responsibility of the Board of Trustees. The Board of Trustees has established an Audit and Valuation Committee to assist with the oversight of the valuation of the Portfolio’s securities. JPMorgan Funds Management, Inc. (the “Administrator”, or “JPMFM”), an indirect, wholly-owned subsidiary of JPMorgan Chase & Co. (“JPMorgan”), has established a Valuation Committee (“VC”) that is comprised of senior representatives from JPMFM, J.P. Morgan Investment Management Inc. (“JPMIM” or the “Advisor”), a wholly-owned subsidiary of JPMorgan Asset Management Holdings Inc. (“JPMAM”), which is a wholly-owned subsidiary of JPMorgan, JPMorgan’s Legal and Compliance and JPMAM’s Risk Management and the Portfolio’s Chief Compliance Officer. The VC’s responsibilities include making determinations regarding Level 3 fair value measurements (“Fair Values”) and/or providing recommendations for approval to the Board of Trustees’ Audit and Valuation Committee, in accordance with the Portfolio’s valuation policies.
The VC or Board of Trustees, as applicable, primarily employs a market-based approach which may use related or comparable assets or liabilities, recent transactions, market multiples, book values, and other relevant information for the investment to determine the fair value of the investment. The VC or Board of Trustees may also use an income-based valuation approach in which the anticipated future cash flows of the investment are discounted to calculate fair value. Discounts may also be applied due to the nature or duration of any restrictions on the disposition of the investments. Valuations may be based upon current market prices of securities that are comparable in coupon, rating, maturity and industry.
It is possible that the estimated values may differ significantly from the values that would have been used had a ready market for the investments existed, and such differences could be material. JPMFM and JPMIM are responsible for monitoring developments that may impact Fair Values and for discussing and assessing Fair Values on an ongoing, and at least a quarterly, basis with the VC and Board of Trustees, as applicable. The
| | | | | | |
| | | |
| 32 | | | | JPMORGAN INSURANCE TRUST | | JUNE 30, 2013 |
appropriateness of Fair Values is assessed based on results of unchanged price review and consideration of macro or security specific events, back testing and broker and vendor due diligence.
Valuations reflected in this report are as of the report date. As a result, changes in valuation due to market events and/or issuer related events after the report date and prior to issuance of the report are not reflected herein.
The various inputs that are used in determining the fair value of the Portfolio’s investments are summarized into the three broad levels listed below.
| Ÿ | | Level 1 — quoted prices in active markets for identical securities |
| Ÿ | | Level 2 — other significant observable inputs (including quoted prices for similar securities, interest rates, prepayment speeds, credit risk, etc.) |
| Ÿ | | Level 3 — significant unobservable inputs (including the Portfolio’s own assumptions in determining the fair value of investments) |
A financial instrument’s level within the fair value hierarchy is based on the lowest level of any input, both individually and in the aggregate, that is significant to the fair value measurement. The inputs or methodology used for valuing securities are not necessarily an indication of the risk associated with investing in those securities.
The following table represents each valuation input as presented on the Schedule of Portfolio Investments (“SOI”):
| | | | | | | | | | | | | | | | |
| | | Level 1
Quoted prices | | | Level 2
Other significant
observable inputs | | | Level 3
Significant
unobservable inputs | | | Total | |
Investments in Securities | | | | | | | | | |
Debt Securities | | | | | | | | | | | | | | | | |
Asset-Backed Securities | | $ | – | | | $ | 1,867,819 | | | $ | 1,083,784 | | | $ | 2,951,603 | |
Collateralized Mortgage Obligations | | | | | | | | | | | | | | | | |
Agency CMO | | | – | | | | 44,577,351 | | | | 1,928,184 | | | | 46,505,535 | |
Non-Agency CMO | | | – | | | | 16,474,831 | | | | 2,717,467 | | | | 19,192,298 | |
| | | | | | | | | | | | | | | | |
Total Collateralized Mortgage Obligations | | | – | | | | 61,052,182 | | | | 4,645,651 | | | | 65,697,833 | |
| | | | | | | | | | | | | | | | |
Commercial Mortgage-Backed Securities | | | – | | | | 5,128,700 | | | | 235,462 | | | | 5,364,162 | |
Corporate Bonds | | | | | | | | | | | | | | | | |
Consumer Discretionary | | | – | | | | 2,556,426 | | | | – | | | | 2,556,426 | |
Consumer Staples | | | – | | | | 1,300,808 | | | | – | | | | 1,300,808 | |
Energy | | | – | | | | 2,287,221 | | | | – | | | | 2,287,221 | |
Financials | | | – | | | | 16,479,906 | | | | 100,625 | | | | 16,580,531 | |
Health Care | | | – | | | | 784,884 | | | | – | | | | 784,884 | |
Industrials | | | – | | | | 1,553,422 | | | | 90,433 | | | | 1,643,855 | |
Information Technology | | | – | | | | 2,203,454 | | | | – | | | | 2,203,454 | |
Materials | | | – | | | | 805,822 | | | | – | | | | 805,822 | |
Telecommunication Services | | | – | | | | 2,388,485 | | | | 131,384 | | | | 2,519,869 | |
Utilities | | | – | | | | 2,918,492 | | | | – | | | | 2,918,492 | |
| | | | | | | | | | | | | | | | |
Total Corporate Bonds | | | – | | | | 33,278,920 | | | | 322,442 | | | | 33,601,362 | |
| | | | | | | | | | | | | | | | |
Foreign Government Securities | | | – | | | | 394,053 | | | | – | | | | 394,053 | |
Mortgage Pass-Through Securities | | | – | | | | 17,439,650 | | | | – | | | | 17,439,650 | |
Municipal Bonds | | | – | | | | 414,899 | | | | – | | | | 414,899 | |
U.S. Government Agency Securities | | | – | | | | 27,702,231 | | | | – | | | | 27,702,231 | |
U.S. Treasury Obligations | | | – | | | | 50,456,872 | | | | – | | | | 50,456,872 | |
Short-Term Investment | | | | | | | | | | | | | | | | |
Investment Company | | | 2,810,698 | | | | – | | | | – | | | | 2,810,698 | |
| | | | | | | | | | | | | | | | |
Total Investments in Securities | | $ | 2,810,698 | | | $ | 197,735,326 | | | $ | 6,287,339 | | | $ | 206,833,363 | |
| | | | | | | | | | | | | | | | |
There were no transfers between Levels 1 and 2 during the six months ended June 30, 2013.
| | | | | | | | |
| | | |
| JUNE 30, 2013 | | JPMORGAN INSURANCE TRUST | | | | | 33 | |
NOTES TO FINANCIAL STATEMENTS
AS OF JUNE 30, 2013 (Unaudited) (continued)
The following is a summary of investments for which significant unobservable inputs (Level 3) were used in determining fair value:
| | | | | | | | | | | | | | | | | | | | | | | | | | | | | | | | | | | | |
| | | Balance as
of 12/31/12 | | | Realized
gain (loss) | | | Change in
unrealized
appreciation
(depreciation) | | | Net
accretion
(amortization) | | | Purchases1 | | | Sales2 | | | Transfers
into Level 3 | | | Transfers
out
of Level 3 | | | Balance as
of 06/30/13 | |
Investments in Securities | | | | | | | | | | | | | | | | | | | | | | | | | | | | | | | | | | | | |
Asset-Backed Securities | | $ | 167,769 | | | $ | — | | | $ | (6,626 | ) | | $ | 193 | | | $ | 101,998 | | | $ | (75,214 | ) | | $ | 895,664 | | | $ | — | | | $ | 1,083,784 | |
Collateralized Mortgage Obligations | | | | | | | | | | | | | | | | | | | | | | | | | | | | | | | | | | | | |
Agency CMO | | | 57,154 | | | | — | | | | (316,126 | ) | | | 5,689 | | | | 6,832 | | | | (247,750 | ) | | | 2,479,539 | | | | (57,154 | ) | | | 1,928,184 | |
Non-Agency CMO | | | 398,751 | | | | 14,327 | | | | (40,479 | ) | | | 766 | | | | 727,216 | | | | (446,578 | ) | | | 2,276,093 | | | | (212,629 | ) | | | 2,717,467 | |
Commercial Mortgage-Backed Securities | | | 135,464 | | | | — | | | | 788 | | | | (647 | ) | | | — | | | | (52,820 | ) | | | 152,677 | | | | — | | | | 235,462 | |
Corporate Bonds — Financials | | | 95,375 | | | | — | | | | 5,250 | | | | — | | | | — | | | | — | | | | — | | | | | | | | 100,625 | |
Corporate Bonds — Industrials | | | 117,753 | | | | — | | | | 1,309 | | | | — | | | | 26,000 | | | | (2,513 | ) | | | — | | | | (52,116 | ) | | | 90,433 | |
Corporate Bonds —Telecommunication Services | | | — | | | | — | | | | (1,086 | ) | | | — | | | | — | | | | — | | | | 132,470 | | | | — | | | | 131,384 | |
| | | | | | | | | | | | | | | | | | | | | | | | | | | | | | | | | | | | |
Total | | $ | 972,266 | | | $ | 14,327 | | | $ | (356,970 | ) | | $ | 6,001 | | | $ | 862,046 | | | $ | (824,875 | ) | | $ | 5,936,443 | | | $ | (321,899 | ) | | $ | 6,287,339 | |
| | | | | | | | | | | | | | | | | | | | | | | | | | | | | | | | | | | | |
| (1) | Purchases include all purchases of securities and securities received in corporate actions. |
| (2) | Sales include all sales of securities, maturities, paydowns and securities tendered in corporate actions. |
Transfers into and out of Level 3 are valued using values as of the beginning of the period.
Transfers from Level 2 to Level 3 or from Level 3 to Level 2 are due to a decline or an increase in market activity (e.g. frequency of trades), respectively, which resulted in a lack of or increase in available market inputs to determine price.
The change in unrealized appreciation (depreciation) attributable to securities owned at June 30, 2013, which were valued using significant unobservable inputs (Level 3) amounted to $(356,970). This amount is included in Change in net unrealized appreciation (depreciation) of investments in non-affiliates on the Statement of Operations.
Insurance Trust Core Bond Portfolio
Quantitative Information about Level 3 Fair Value Measurements #
| | | | | | | | | | | | |
| | | Fair Value
at 6/30/13 | | | Valuation Technique(s) | | Unobservable Input(s) | | Range (Weighted Average) | |
| | $ | 5,719,341 | | | Discounted Cash Flow | | Prepayment Speed | | | 0.00 - 487.00 (174.40) | |
| | | | | | | | Constant Default Rate | | | 0.00 - 12.00 (2.42) | |
| | | | | | | | Yield (Discount Rate of Cash Flows) | | | (56.04%) - 44.77% (6.65%) | |
| | | | | | | | | | | | |
Asset-backed securities | | | 5,719,341 | | | | | | | | | |
| | | | | | | | | | | | |
Total | | $ | 5,719,341 | | | | | | | | | |
| | | | | | | | | | | | |
| # | The table above does not include level 3 securities that are valued by brokers and pricing services. At 6/30/13, the value of these securities was $567,998. The inputs for these securities are not readily available or cannot be reasonably estimated and are generally those inputs described in Note 2A. The appropriateness of fair values for these securities is monitored on an ongoing basis which may include results of back testing, unchanged price review, results of broker and vendor due diligence and consideration of macro or security specific events. |
| | The significant unobservable inputs used in the fair value measurement of the Fund’s investments are listed above. Generally, a change in the assumptions used in any input in isolation may be accompanied by a change in another input. Significant changes in any of the unobservable inputs may significantly impact the fair value measurement. The impact is based on the relationship between each unobservable input and the fair value measurement. Significant increases (decreases) in the default rates and yield may decrease (increase) the fair value measurement. A significant change in prepayment speeds could result in a significantly higher or lower value in such Level 3 instruments. |
B. Restricted and Illiquid Securities — Certain securities held by the Portfolio may be subject to legal or contractual restrictions on resale and/or are illiquid. Restricted securities generally are resold in transactions exempt from registration under the Securities Act of 1933 (the “Securities Act”). An illiquid security is a security which cannot be disposed of promptly (within seven days) and in the usual course of business at approximately its fair value and includes, but is not limited to, repurchase agreements maturing in excess of seven days, time deposits with a withdrawal penalty,
| | | | | | |
| | | |
| 34 | | | | JPMORGAN INSURANCE TRUST | | JUNE 30, 2013 |
non-negotiable instruments and instruments for which no market exists. Disposal of these securities may involve time-consuming negotiations and expense. Prompt sale at the current valuation may be difficult and could adversely affect the net assets of the Portfolio. As of June 30, 2013, the Portfolio had no investments in restricted securities other than securities sold to the Portfolio under Rule 144A and/or Regulation S under the Securities Act.
The value and percentage of net assets of illiquid securities as of June 30, 2013 were $526,488 and 0.3%, respectively.
C. Security Transactions and Investment Income — Investment transactions are accounted for on the trade date (the date the order to buy or sell is executed). Securities gains and losses are calculated on a specifically identified cost basis. Interest income is determined on the basis of coupon interest accrued using the effective interest method which adjusts for amortization of premiums and accretion of discounts. Dividend income, net of foreign taxes withheld, if any, is recorded on the ex-dividend date or when the Portfolio first learns of the dividend.
D. Allocation of Income and Expenses — Expenses directly attributable to a portfolio are charged directly to that portfolio, while the expenses attributable to more than one portfolio of the Trust are allocated among the respective portfolios. In calculating the NAV of each class, investment income, realized and unrealized gains and losses and expenses, other than class specific expenses, are allocated daily to each class of shares based upon the proportion of net assets of each class at the beginning of each day.
E. Federal Income Taxes — The Portfolio is treated as a separate taxable entity for Federal income tax purposes. The Portfolio’s policy is to comply with the provisions of the Internal Revenue Code of 1986, as amended (the “Code”), applicable to regulated investment companies and to distribute to shareholders all of its distributable net investment income and net realized gain on investments. Accordingly, no provision for Federal income tax is necessary. The Portfolio is also a segregated portfolio of assets for insurance purposes and intends to comply with the diversification requirements of Subchapter L of the Code. Management has reviewed the Portfolio’s tax positions for all open tax years and has determined that as of June 30, 2013, no liability for income tax is required in the Portfolio’s financial statements for net unrecognized tax benefits. However, management’s conclusions may be subject to future review based on changes in, or the interpretation of, the accounting standards or tax laws and regulations. The Portfolio’s Federal tax returns for the prior three fiscal years remain subject to examination by the Internal Revenue Service.
F. Distributions to Shareholders — Distributions from net investment income are generally declared and paid at least annually and are declared separately for each class. No class has preferential dividend rights; differences in per share rates are due to differences in separate class expenses. Net realized capital gains, if any, are distributed at least annually. The amount of distributions from net investment income and net realized capital gains is determined in accordance with Federal income tax regulations, which may differ from GAAP. To the extent these “book/tax” differences are permanent in nature (i.e., that they result from other than timing of recognition — “temporary differences”), such amounts are reclassified within the capital accounts based on their Federal tax-basis treatment.
3. Fees and Other Transactions with Affiliates
A. Investment Advisory Fee — Pursuant to the Investment Advisory Agreement, JPMIM supervises the investments of the Portfolio and for such services is paid a fee. The fee is accrued daily and paid monthly based on the Portfolio’s average daily net assets at an annual rate of 0.40%.
B. Administration Fee — Pursuant to an Administration Agreement, the Administrator provides certain administration services to the Portfolio. In consideration of these services, the Administrator receives a fee accrued daily and paid monthly at an annual rate of 0.15% of the first $25 billion of the average daily net assets of all funds in the J.P. Morgan Funds Complex (excluding certain funds of funds and money market funds) and 0.075% of the average daily net assets in excess of $25 billion of all such funds. For the six months ended June 30, 2013, the annualized effective rate was 0.08% of the Portfolio’s average daily net assets, notwithstanding any fee waivers and/or expense reimbursements.
JPMorgan Chase Bank, N.A (“JPMCB”), a wholly-owned subsidiary of JPMorgan serves as the Portfolio’s sub-administrator (the “Sub-administrator”). For its services as Sub-administrator, JPMCB receives a portion of the fees payable to the Administrator.
The Administrator waived Administration fees as outlined in Note 3.E.
C. Distribution Fees — Pursuant to a Distribution Agreement, JPMorgan Distribution Services, Inc. (the “Distributor”), a wholly-owned subsidiary of JPMorgan, serves as the Trust’s exclusive underwriter and promotes and arranges for the sale of the Portfolio’s shares.
The Board of Trustees has adopted a Distribution Plan (the “Distribution Plan”) for Class 2 Shares of the Portfolio in accordance with Rule 12b-1 under the 1940 Act. The Distribution Plan provides that the Portfolio shall pay distribution fees, including payments to the Distributor, at an annual rate of 0.25% of the average daily net assets of Class 2 Shares.
D. Custodian and Accounting Fees — JPMCB provides portfolio custody and accounting services to the Portfolio. The amounts paid directly to JPMCB by the Portfolio for custody and accounting services are included in Custodian and accounting fees in the Statement of Operations. Payments to the custodian may be reduced by credits earned by the Portfolio, based on uninvested cash balances held by the custodian. Such earnings credits, if any, are presented separately in the Statement of Operations.
Interest expense, if any, paid to the custodian related to cash overdrafts is included in Interest expense to affiliates in the Statement of Operations.
E. Waivers and Reimbursements — The Advisor, Administrator and Distributor (for Class 2 Shares) have contractually agreed to waive fees and/or reimburse the Portfolio to the extent that total annual operating expenses (excluding acquired fund fees and expenses, dividend expenses related to
| | | | | | | | |
| | | |
| JUNE 30, 2013 | | JPMORGAN INSURANCE TRUST | | | | | 35 | |
NOTES TO FINANCIAL STATEMENTS
AS OF JUNE 30, 2013 (Unaudited) (continued)
short sales, interest, taxes, expenses related to litigation and potential litigation, extraordinary expenses and expenses related to the Board of Trustees’ deferred compensation plan) exceed the percentages of the Portfolio’s respective average daily net assets as shown in the table below:
| | | | | | | | |
| | | Class 1 | | | Class 2 | |
| | | 0.60 | % | | | 0.85 | % |
The expense limitation agreements were in effect for the six months ended June 30, 2013. The contractual expense limitation percentages in the table above are in place until at least April 30, 2014.
For the six months ended June 30, 2013, the Portfolio’s service providers waived fees for the Portfolio as follows. None of these parties expect the Portfolio to repay any such waived fees in future years.
| | | | | | | | |
| | | Contractual Waivers | |
| | | Administration | | | Total | |
| | $ | 4,782 | | | $ | 4,782 | |
Additionally, the Portfolio may invest in one or more money market funds advised by the Advisor or its affiliates. The Advisor, Administrator and the Distributor waive fees in an amount sufficient to offset the respective fees each charges to the affiliated money market fund on the Portfolio’s investment in such affiliated money market fund. A portion of the waiver is voluntary.
The amount of waivers resulting from investments in these money market funds for the six months ended June 30, 2013 was $5,333.
F. Other — Certain officers of the Trust are affiliated with the Advisor, the Administrator and the Distributor. Such officers, with the exception of the Chief Compliance Officer, receive no compensation from the Portfolio for serving in their respective roles.
The Board of Trustees appointed a Chief Compliance Officer to the Portfolio in accordance with Federal securities regulations. The Portfolio, along with other affiliated portfolios, makes reimbursement payments, on a pro-rata basis, to the Administrator for a portion of the fees associated with the Office of the Chief Compliance Officer. Such fees are included in Trustees’ and Chief Compliance Officer’s fees on the Statement of Operations.
The Trust adopted a Trustee Deferred Compensation Plan (the “Plan”) which allows the Independent Trustees to defer the receipt of all or a portion of compensation related to performance of their duties as Trustees. The deferred fees are invested in various J.P. Morgan Funds until distribution in accordance with the Plan.
During the six months ended June 30, 2013, the Portfolio may have purchased securities from an underwriting syndicate in which the principal underwriter or members of the syndicate are affiliated with the Advisor.
The Portfolio may use related party broker-dealers. For the six months ended June 30, 2013, the Portfolio did not incur any brokerage commissions with broker-dealers affiliated with the Advisor.
The Securities and Exchange Commission has granted an exemptive order permitting the Portfolio to engage in principal transactions with J.P. Morgan Securities, Inc., an affiliated broker, involving taxable money market instruments, subject to certain conditions.
4. Investment Transactions
During the six months ended June 30, 2013, purchases and sales of investments (excluding short-term investments) were as follows:
| | | | | | | | | | | | | | | | |
| | | Purchases (excluding U.S. Government) | | | Sales (excluding U.S. Government) | | | Purchases of U.S. Government | | | Sales of U.S. Government | |
| | $ | 14,586,406 | | | $ | 17,828,512 | | | $ | 1,994,988 | | | $ | 1,190,757 | |
5. Federal Income Tax Matters
For Federal income tax purposes, the cost and unrealized appreciation (depreciation) in value of investment securities held at June 30, 2013 were as follows:
| | | | | | | | | | | | | | | | |
| | | Aggregate Cost | | | Gross Unrealized Appreciation | | | Gross Unrealized Depreciation | | | Net Unrealized Appreciation (Depreciation) | |
| | $ | 190,169,868 | | | $ | 19,432,636 | | | $ | 2,769,141 | | | $ | 16,663,495 | |
Under the Regulated Investment Company Modernization Act of 2010 (the “Act”), net capital losses recognized by the Portfolio after December 31, 2010, may get carried forward indefinitely, and retain their character as short-term and/or long-term losses. Prior to the Act, net capital losses incurred by the Portfolio were carried forward for eight years and treated as short-term losses. The Act requires that post-enactment net capital losses be used before pre-enactment net capital losses.
At December 31, 2012, the Portfolio had post-enactment net long-term capital loss carryforwards of $307,289.
| | | | | | |
| | | |
| 36 | | | | JPMORGAN INSURANCE TRUST | | JUNE 30, 2013 |
At December 31, 2012, the Portfolio had pre-enactment net capital loss carryforwards, expiring during the years indicated, which are available to offset future realized gains:
| | | | | | | | | | | | |
| | | 2016 | | | 2017 | | | Total | |
| | $ | 779,717 | | | $ | 5,440,874 | | | $ | 6,220,591 | * |
| * | The entire amount is comprised of capital loss carryforwards from business combinations, which may be limited in future years under the Internal Revenue Code Sections 381-384. |
6. Borrowings
The Trust and JPMCB have entered into a financing arrangement. Under this arrangement, JPMCB provides an unsecured, uncommitted credit facility in the aggregate amount of $100 million to certain of the J.P. Morgan Funds, including the Portfolio. Advances under the arrangement are taken primarily for temporary or emergency purposes, including the meeting of redemption requests that otherwise might require the untimely disposition of securities, and are subject to the Portfolio’s borrowing restrictions. Interest on borrowings is payable at a rate determined by JPMCB at the time of borrowing. This agreement has been extended until November 11, 2013.
The Portfolio had no borrowings outstanding from the unsecured, uncommitted credit facility at June 30, 2013, or at any time during the six months then ended.
Interest expense paid, if any, as a result of borrowings from the unsecured, uncommitted credit facility is included in Interest expense to affiliates in the Statement of Operations.
7. Risks, Concentrations and Indemnifications
In the normal course of business, the Portfolio enters into contracts that contain a variety of representations which provide general indemnifications. The Portfolio’s maximum exposure under these arrangements is unknown. The amount of exposure would depend on future claims that may be made against the Portfolio that have not yet occurred. However, based on experience, the Portfolio expects the risk of loss to be remote.
The Portfolio has several shareholders holding a significant percentage of shares outstanding. Investment activities of these shareholders could have a material impact on the Portfolio.
The Portfolio is subject to interest rate and credit risk. The value of debt securities may decline as interest rates increase. The Portfolio could lose money if the issuer of a fixed income security is unable to pay interest or repay principal when it is due. The ability of the issuers of debt to meet their obligations may be affected by the economic and political developments in a specific industry or region.
The Portfolio is also subject to counterparty credit risk, which is the risk that a counterparty fails to perform on agreements with the Portfolio such as swap and option contracts, credit-linked notes and TBA securities.
The Portfolio is subject to risks associated with securities with contractual cash flows including asset-backed and mortgage-related securities such as collateralized mortgage obligations, mortgage pass-through securities and commercial mortgage-backed securities, including securities backed by sub-prime mortgage loans. The value, liquidity and related income of these securities are sensitive to changes in economic conditions, including real estate value, prepayments, delinquencies and/or defaults, and may be adversely affected by shifts in the market’s perception of the issuers and changes in interest rates.
The Portfolio is subject to the risk that should the Portfolio decide to sell an illiquid investment when a ready buyer is not available at a price the Portfolio deems representative of its value, the value of the Portfolio’s net assets could be adversely affected.
| | | | | | | | |
| | | |
| JUNE 30, 2013 | | JPMORGAN INSURANCE TRUST | | | | | 37 | |
SCHEDULE OF SHAREHOLDER EXPENSES
(Unaudited)
Hypothetical $1,000 Investment
As a shareholder of the Portfolio, you incur ongoing costs, including investment advisory fees, administration fees, distribution fees (for Class 2 Shares) and other Portfolio expenses. Because the Portfolio is a funding vehicle for Policies and Eligible Plans, you may also incur sales charges and other fees relating to the Policies or Eligible Plans. The examples below are intended to help you understand your ongoing costs (in dollars) of investing in the Portfolio, but not the costs of the Policies or Eligible Plans, and to compare these ongoing costs with the ongoing costs of investing in other mutual funds. The examples assume that you had a $1,000 investment in each Class at the beginning of the reporting period, January 1, 2013, and continued to hold your shares at the end of the reporting period, June 30, 2013.
Actual Expenses
For each Class of the Portfolio in the table below, the first line provides information about actual account values and actual expenses. You may use the information in this line, together with the amount you invested, to estimate the expenses that you paid over the period. Simply divide your account value by $1,000 (for example, an $8,600 account value divided by $1,000 = 8.6), then multiply the result by the number in the first line of each Class under the heading entitled “Expenses Paid During the Period” to estimate the expenses you paid on your account during this period.
Hypothetical Example for Comparison Purposes
The second line of each Class in the table below provides information about hypothetical account values and hypothetical expenses based on the Class’ actual expense ratio and an assumed rate of return of 5% per year before expenses, which is not the Class’ actual return. The hypothetical account values and expenses may not be used to estimate the actual ending account balance or expenses you paid for the period. You may use this information to compare the ongoing costs of investing in the Class of the Portfolio and other portfolios. To do so, compare this 5% hypothetical example with the 5% hypothetical examples that appear in the shareholder reports of the other funds. Please note that the expenses shown in the table are meant to highlight your ongoing costs only and do not reflect any transaction costs, such as sales charges (loads) or redemption fees or the costs associated with the Policies and Eligible Plans through which the Portfolio is held. Therefore, the second line for each Class in the table is useful in comparing ongoing costs only, and will not help you determine the relative total costs of owning different portfolios. In addition, if these transaction costs were included, your costs would have been higher. The examples also assume all dividends and distributions have been reinvested.
Expense Example
| | | | | | | | | | | | | | | | |
| | | Beginning
Account Value,
January 1, 2013 | | | Ending
Account Value
June 30, 2013 | | | Expenses
Paid During the
Period | | | Annualized
Expense
Ratio | |
Core Bond Portfolio | | | | | | | | | | | | | | | | |
Class 1 | | | | | | | | | | | | | | | | |
Actual | | $ | 1,000.00 | | | $ | 982.60 | | | $ | 2.95 | | | | 0.60 | % |
Hypothetical | | | 1,000.00 | | | | 1,021.82 | | | | 3.01 | | | | 0.60 | |
Class 2 | | | | | | | | | | | | | | | | |
Actual | | | 1,000.00 | | | | 981.70 | | | | 4.18 | | | | 0.85 | |
Hypothetical | | | 1,000.00 | | | | 1,020.58 | | | | 4.26 | | | | 0.85 | |
| * | Expenses are equal to each Class' respective annualized expense ratio, multiplied by the average account value over the period, multiplied by 181/365 (to reflect the one-half year period). |
| | | | | | |
| | | |
| 38 | | | | JPMORGAN INSURANCE TRUST | | JUNE 30, 2013 |
J.P. Morgan Funds are distributed by JPMorgan Distribution Services, Inc., which is an affiliate of JPMorgan Chase & Co. Affiliates of JPMorgan Chase & Co. receive fees for providing various services to the funds.
Contact JPMorgan Distribution Services, Inc. at 1-800-480-4111 for a portfolio prospectus. You can also visit us at www.jpmorganfunds.com. Investors should carefully consider the investment objectives and risk as well as charges and expenses of the mutual fund before investing. The prospectus contains this and other information about the mutual fund. Read the prospectus carefully before investing.
The Portfolio files a complete schedule of its portfolio holdings for the first and third quarters of its fiscal year with the SEC on Form N-Q. The Portfolio’s Forms N-Q are available on the SEC’s website at http://www.sec.gov and may be reviewed and copied at the SEC’s Public Reference Room in Washington, DC. Information on the operation of the SEC’s Public Reference Room may be obtained by calling 1-800-SEC-0330. Shareholders may request the Form N-Q without charge by calling 1-800-480-4111 or by visiting the variable insurance portfolio section of the J.P. Morgan Funds’ website at www.jpmorganfunds.com.
A description of the Portfolio’s policies and procedures with respect to the disclosure of the Portfolio’s holdings is available in the prospectus and Statement of Additional Information.
A copy of proxy policies and procedures is available without charge upon request by calling 1-800-480-4111 and on the Portfolio’s website at www.jpmorganfunds.com. A description of such policies and procedures is on the SEC’s website at www.sec.gov. The Trustees have delegated the authority to vote proxies for securities owned by the Portfolio to the Advisor. A copy of the Portfolio’s voting record for the most recent 12-month period ended June 30 is available on the SEC’s website at www.sec.gov or at the Portfolio’s website at www.jpmorganfunds.com no later than August 31 of each year. The Portfolio’s proxy voting record will include, among other things, a brief description of the matter voted on for each portfolio security, and will state how each vote was cast, for example, for or against the proposal.

| | | | |
| | © JPMorgan Chase & Co., 2013. All rights reserved. June 2013. | | SAN-JPMITCBP-613 |
Semi-Annual Report
JPMorgan Insurance Trust
June 30, 2013 (Unaudited)
JPMorgan Insurance Trust Equity Index Portfolio
| | | | |
NOT FDIC INSURED Ÿ NO BANK GUARANTEE Ÿ MAY LOSE VALUE
| | |  | |
CONTENTS
Investments in the Portfolio are not bank deposits or obligations of, or guaranteed or endorsed by, any bank and are not insured or guaranteed by the FDIC, the Federal Reserve Board or any other government agency. You could lose money if you sell when the Portfolio’s share price is lower than when you invested.
Past performance is no guarantee of future performance. The general market views expressed in this report are opinions based on market and other conditions through the end of the reporting period and are subject to change without notice. These views are not intended to predict the future performance of the Portfolio or the securities markets. References to specific securities and their issuers are for illustrative purposes only and are not intended to be, and should not be interpreted as, recommendations to purchase or sell such securities. Such views are not meant as investment advice and may not be relied on as an indication of trading intent on behalf of the Portfolio.
This Portfolio is intended to be a funding vehicle for variable annuity contracts and variable life insurance policies (collectively “Policies”) offered by separate accounts of participating insurance companies. Portfolio shares are also offered through qualified pension and retirement plans (“Eligible Plans”). Individuals may not purchase shares directly from the Portfolio.
Prospective investors should refer to the Portfolio’s prospectus for a discussion of the Portfolio’s investment objective, strategies and risks. Call J.P. Morgan Funds Service Center at 1-800-480-4111 for a prospectus containing more complete information about the Portfolio, including management fees and other expenses. Please read it carefully before investing.
CEO’s LETTER
JULY 26, 2013 (Unaudited)
Dear Shareholder:
While somewhat overshadowed by increased volatility at the end of the reporting period, developed market equities in aggregate posted solid returns for the six months ended June 30, 2013. For much of the period, stocks were supported by solid corporate earnings and robust demand from investors looking to generate higher returns in the low interest rate environment. Despite signaling a potential policy shift in June 2013, the U.S. Federal Reserve (“Fed”) continued to pursue its highly accommodative policies in an attempt to lower unemployment and spur the economy. Central banks overseas also did their part to support their economies. The European Central Bank (“ECB”) remained committed to preserving the euro, as it cut rates and introduced new programs designed to aid struggling euro zone members. Elsewhere, the Bank of Japan stepped up its major asset purchase program as a new pro-growth government came into power late in 2012.
| | |
 | | “We are encouraged by the stock market’s resiliency in the face of recent volatility.” |
Positive investor sentiment was temporarily interrupted, however, in May 2013 when Fed Chairman Bernanke indicated that the central bank may begin to “taper” its asset purchase program later this year. This triggered a sharp decline in global equities, although they quickly regained their footing and have continued to rally in July. All told, U.S. stocks rose sharply during the six months ended June 30, 2013. Overseas, international developed stocks produced more modest gains, while emerging market equities performed poorly given concerns regarding China’s economy and falling commodity prices.
U.S. Treasury Yields Rise Sharply
Talk of Fed tapering negatively impacted the fixed income markets. While U.S. Treasury security yields continued to be low from a historical perspective, they ended the period
sharply higher than when the reporting period began. The yield for 10-year U.S. Treasury securities ended June 30, 2013 at 2.52%, while the yields for 2- and 30-year U.S. Treasury securities finished the reporting period at 0.36% and 3.52%, respectively. Amid the rising interest rate environment, the overall U.S. fixed income market generated a negative return for the reporting period. In contrast, high yield bonds posted a modest gain, while emerging market debt securities fell sharply.
Positive Signs for Stocks
Although the global economy is far from robust, it is still on a growth path. The expansion in the U.S. certainly appears to be sustainable and, while Europe remains in a recession, there are indications that its economy may be bottoming. Elsewhere, pro-growth initiatives in Japan have thus far yielded positive results. While growth in China has moderated, we believe the government has the tools at its disposal to avoid a “hard landing.”
We are encouraged by the stock market’s resiliency in the face of recent volatility. In addition, there have been signs that equity market correlations are decreasing, which could create a more favorable environment for active managers. In addition, given the recent sell-off in the bond market, valuations in a number of fixed income sectors have become more attractive.
On behalf of everyone at J.P. Morgan Asset Management, thank you for your continued support. We look forward to managing your investment needs for years to come. Should you have any questions, please visit www.jpmorganfunds.com or contact the J.P. Morgan Funds Service Center at 1-800-480-4111.
Sincerely yours,

George C.W. Gatch
CEO, Global Funds Management
J.P. Morgan Asset Management
| | | | | | | | |
| | | |
| JUNE 30, 2013 | | JPMORGAN INSURANCE TRUST | | | | | 1 | |
JPMorgan Insurance Trust Equity Index Portfolio
PORTFOLIO COMMENTARY
SIX MONTHS ENDED JUNE 30, 2013 (Unaudited)
| | | | |
| REPORTING PERIOD RETURN: | |
| Portfolio (Class 1 Shares)* | | | 13.59% | |
| S&P 500 Index** | | | 13.82% | |
| |
| Net Assets as of 6/30/2013 | | $ | 58,811,704 | |
INVESTMENT OBJECTIVE***
The JPMorgan Insurance Trust Equity Index Portfolio (the “Portfolio”) seeks investment results that correspond to the aggregate price and dividend performance of securities in the S&P 500 Index (the “Benchmark”).
WHAT WERE THE MAIN DRIVERS OF THE PORTFOLIO’S PERFORMANCE?
The Portfolio (Class 1 Shares) performed largely in line with the Benchmark for the six months ended June 30, 2013. This was consistent with its indexing strategy and investment objective, as the Portfolio looks to generate returns that are comparable to those of the Benchmark.
Despite periods of heightened volatility and a setback in June, the overall U.S. equity market, as measured by the Benchmark, generated strong results for the six months ended June 30, 2013. The Benchmark generated a positive return for each of the first five months of the reporting period. Supporting the market were overall solid corporate profits, improving economic growth and generally robust investor demand. These factors helped the Benchmark to post several all-time highs over the first five months of 2013. The Benchmark then reversed course and declined during the last month of the reporting period. This turnaround was triggered by indications that the U.S. Federal Reserve Board (“Fed”) would begin tapering its monthly purchases of bonds — $85 billion of mortgage-backed securities and Treasury securities — if economic conditions continued to improve. This caused interest rates to move sharply higher and both stock and bond prices fell sharply. However, the Benchmark again rallied in late June, as concerns regarding Fed tapering abated somewhat. All told, the Benchmark finished the six months ended June 30, 2013 with a 13.82% gain. Each of the ten sectors in the Benchmark produced a positive return for the six-month period. The health care and consumer discretionary sectors produced the strongest returns. Materials and information technology were the worst performing sectors.
HOW WAS THE PORTFOLIO POSITIONED?
Regardless of the market outlook, the Fund was managed in strict conformity with a full index replication strategy and aimed to hold the same stocks in nearly the same proportions as those found in the Benchmark.
| | | | | | | | |
| TOP TEN EQUITY HOLDINGS OF THE PORTFOLIO**** | |
| | 1. | | | Exxon Mobil Corp. | | | 2.8 | % |
| | 2. | | | Apple, Inc. | | | 2.6 | |
| | 3. | | | Microsoft Corp. | | | 1.8 | |
| | 4. | | | Johnson & Johnson | | | 1.7 | |
| | 5. | | | General Electric Co. | | | 1.7 | |
| | 6. | | | Google, Inc., Class A | | | 1.6 | |
| | 7. | | | Chevron Corp. | | | 1.6 | |
| | 8. | | | Procter & Gamble Co. (The) | | | 1.5 | |
| | 9. | | | Berkshire Hathaway, Inc., Class B | | | 1.4 | |
| | 10. | | | Wells Fargo & Co. | | | 1.4 | |
| | | | |
PORTFOLIO COMPOSITION BY SECTOR**** | |
| Information Technology | | | 17.6 | % |
| Financials | | | 16.4 | |
| Health Care | | | 12.6 | |
| Consumer Discretionary | | | 12.0 | |
| Energy | | | 10.4 | |
| Consumer Staples | | | 10.3 | |
| Industrials | | | 10.1 | |
| Utilities | | | 3.3 | |
| Materials | | | 3.2 | |
| Telecommunication Services | | | 2.8 | |
| Short-Term Investments | | | 1.3 | |
| * | | The return shown is based on net asset values calculated for shareholder transactions and may differ from the return shown in the financial highlights, which reflects adjustments made to the net asset values in accordance with accounting principles generally accepted in the United States of America. |
| ** | | “S&P 500 Index” is a registered service mark of Standard & Poor’s Corporation, which does not sponsor, and is in no way affiliated with, the Portfolio. |
| *** | | The advisor seeks to achieve the Portfolio’s objective. There can be no guarantee it will be achieved. |
| **** | | Percentages indicated are based on total investments as of June 30, 2013. The Portfolio’s composition is subject to change. |
| | | | | | |
| | | |
| 2 | | | | JPMORGAN INSURANCE TRUST | | JUNE 30, 2013 |
| | | | | | | | | | | | | | | | | | | | |
AVERAGE ANNUAL TOTAL RETURNS AS OF JUNE 30, 2013 | |
| | | | | |
| | | INCEPTION DATE
OF CLASS | | | 6 MONTH* | | | 1 YEAR | | | 5 YEAR | | | 10 YEAR | |
CLASS 1 SHARES | | | 5/01/98 | | | | 13.59 | % | | | 20.18 | % | | | 6.65 | % | | | 6.90 | % |
TEN YEAR PERFORMANCE (6/30/03 TO 6/30/13)
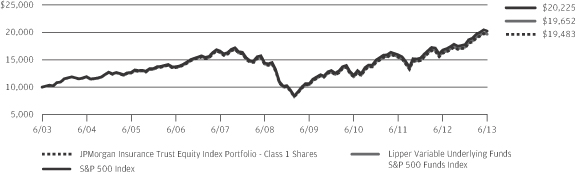
The performance quoted is past performance and is not a guarantee of future results. Mutual funds are subject to certain market risks. Investment returns and principal value of an investment will fluctuate so that an investor’s shares, when redeemed, may be worth more or less than their original cost. Current performance may be higher or lower than the performance data shown. For up-to-date month-end performance information please call 1-800-480-4111.
The graph illustrates comparative performance for $10,000 invested in Class 1 Shares of the JPMorgan Insurance Trust Equity Index Portfolio, the S&P 500 Index and the Lipper Variable Underlying Funds S&P 500 Funds Index from June 30, 2003 to June 30, 2013. The performance of the Portfolio assumes reinvestment of all dividends and capital gain distributions, if any. The performance of the S&P 500 Index does not reflect the deduction of expenses associated with a mutual fund and has been adjusted to reflect reinvestment of all dividends and capital gain distributions of the securities included in the benchmark, if applicable. The performance of the Lipper Variable Underlying Funds S&P 500 Funds Index includes expenses associated with a mutual fund,
such as investment management fees. These expenses are not identical to the expenses incurred by the Portfolio. The S&P 500 Index is an unmanaged index generally representative of the performance of large companies in the U.S. stock market. The Lipper Variable Underlying Funds S&P 500 Funds Index is an index based on the total returns of certain mutual funds within the Portfolio’s designated category as determined by Lipper, Inc. Investors cannot invest directly in an index.
Portfolio performance does not reflect any charges imposed by the Policies or Eligible Plans. If these charges were included, the returns would be lower than shown. Portfolio performance may reflect the waiver of the Portfolio’s fees and reimbursement of expenses for certain periods since the inception date. Without these waivers and reimbursements, performance would have been lower.
The returns shown are based on net asset values calculated for shareholder transactions and may differ from the returns shown in the financial highlights, which reflect adjustments made to the net asset values in accordance with accounting principles generally accepted in the United States of America.
| | | | | | | | |
| | | |
| JUNE 30, 2013 | | JPMORGAN INSURANCE TRUST | | | | | 3 | |
JPMorgan Insurance Trust Equity Index Portfolio
SCHEDULE OF PORTFOLIO INVESTMENTS
AS OF JUNE 30, 2013 (Unaudited)
| | | | | | | | |
| SHARES | | | SECURITY DESCRIPTION | | VALUE($) | |
| | | | | | | | |
| Common Stocks — 98.7% | |
| | | | Consumer Discretionary — 12.0% | |
| | | | Auto Components — 0.4% | |
| | 468 | | | BorgWarner, Inc. (a) | | | 40,318 | |
| | 1,179 | | | Delphi Automotive plc, (United Kingdom) | | | 59,763 | |
| | 995 | | | Goodyear Tire & Rubber Co. (The) (a) | | | 15,214 | |
| | 2,776 | | | Johnson Controls, Inc. | | | 99,353 | |
| | | | | | | | |
| | | | | | | 214,648 | |
| | | | | | | | |
| | | | Automobiles — 0.7% | |
| | 15,934 | | | Ford Motor Co. | | | 246,499 | |
| | 3,120 | | | General Motors Co. (a) | | | 103,927 | |
| | 908 | | | Harley-Davidson, Inc. | | | 49,777 | |
| | | | | | | | |
| | | | | | | 400,203 | |
| | | | | | | | |
| | | | Distributors — 0.1% | |
| | 628 | | | Genuine Parts Co. | | | 49,028 | |
| | | | | | | | |
| | | | Diversified Consumer Services — 0.0% (g) | |
| | 1,104 | | | H&R Block, Inc. | | | 30,636 | |
| | | | | | | | |
| | | | Hotels, Restaurants & Leisure — 1.8% | |
| | 1,800 | | | Carnival Corp. | | | 61,722 | |
| | 125 | | | Chipotle Mexican Grill, Inc. (a) | | | 45,544 | |
| | 526 | | | Darden Restaurants, Inc. | | | 26,552 | |
| | 1,055 | | | International Game Technology | | | 17,629 | |
| | 971 | | | Marriott International, Inc., Class A | | | 39,199 | |
| | 4,064 | | | McDonald's Corp. | | | 402,336 | |
| | 3,035 | | | Starbucks Corp. | | | 198,762 | |
| | 789 | | | Starwood Hotels & Resorts Worldwide, Inc. | | | 49,857 | |
| | 551 | | | Wyndham Worldwide Corp. | | | 31,534 | |
| | 323 | | | Wynn Resorts Ltd. | | | 41,344 | |
| | 1,823 | | | Yum! Brands, Inc. | | | 126,407 | |
| | | | | | | | |
| | | | | | | 1,040,886 | |
| | | | | | | | |
| | | | Household Durables — 0.3% | |
| | 1,136 | | | D.R. Horton, Inc. | | | 24,174 | |
| | 444 | | | Garmin Ltd., (Switzerland) | | | 16,055 | |
| | 275 | | | Harman International Industries, Inc. | | | 14,905 | |
| | 579 | | | Leggett & Platt, Inc. | | | 18,001 | |
| | 671 | | | Lennar Corp., Class A | | | 24,183 | |
| | 1,169 | | | Newell Rubbermaid, Inc. | | | 30,686 | |
| | 1,382 | | | PulteGroup, Inc. (a) | | | 26,216 | |
| | 321 | | | Whirlpool Corp. | | | 36,710 | |
| | | | | | | | |
| | | | | | | 190,930 | |
| | | | | | | | |
| | | | Internet & Catalog Retail — 1.2% | |
| | 1,476 | | | Amazon.com, Inc. (a) | | | 409,870 | |
| | 378 | | | Expedia, Inc. | | | 22,737 | |
| | 228 | | | Netflix, Inc. (a) | | | 48,129 | |
| | 209 | | | priceline.com, Inc. (a) | | | 172,870 | |
| | | | | | | | |
| SHARES | | | SECURITY DESCRIPTION | | VALUE($) | |
| | | | | | | | |
| | | | | | | | |
| | | | Internet & Catalog Retail — Continued | | | | |
| | 447 | | | TripAdvisor, Inc. (a) | | | 27,209 | |
| | | | | | | | |
| | | | | | | 680,815 | |
| | | | | | | | |
| | | | Leisure Equipment & Products — 0.1% | |
| | 467 | | | Hasbro, Inc. | | | 20,936 | |
| | 1,400 | | | Mattel, Inc. | | | 63,434 | |
| | | | | | | | |
| | | | | | | 84,370 | |
| | | | | | | | |
| | | | Media — 3.6% | |
| | 877 | | | Cablevision Systems Corp., Class A | | | 14,751 | |
| | 2,313 | | | CBS Corp. (Non-Voting), Class B | | | 113,036 | |
| | 10,674 | | | Comcast Corp., Class A | | | 447,027 | |
| | 2,264 | | | DIRECTV (a) | | | 139,508 | |
| | 992 | | | Discovery Communications, Inc., Class A (a) | | | 76,592 | |
| | 932 | | | Gannett Co., Inc. | | | 22,797 | |
| | 1,736 | | | Interpublic Group of Cos., Inc. (The) | | | 25,259 | |
| | 8,068 | | | News Corp., Class A | | | 263,017 | |
| | 1,048 | | | Omnicom Group, Inc. | | | 65,888 | |
| | 345 | | | Scripps Networks Interactive, Inc., Class A | | | 23,032 | |
| | 1,179 | | | Time Warner Cable, Inc. | | | 132,614 | |
| | 3,778 | | | Time Warner, Inc. | | | 218,444 | |
| | 1,808 | | | Viacom, Inc., Class B | | | 123,034 | |
| | 7,300 | | | Walt Disney Co. (The) | | | 460,995 | |
| | 18 | | | Washington Post Co. (The), Class B | | | 8,708 | |
| | | | | | | | |
| | | | | | | 2,134,702 | |
| | | | | | | | |
| | | | Multiline Retail — 0.8% | |
| | 1,221 | | | Dollar General Corp. (a) | | | 61,575 | |
| | 907 | | | Dollar Tree, Inc. (a) | | | 46,112 | |
| | 387 | | | Family Dollar Stores, Inc. | | | 24,114 | |
| | 580 | | | J.C. Penney Co., Inc. (a) | | | 9,906 | |
| | 826 | | | Kohl's Corp. | | | 41,721 | |
| | 1,555 | | | Macy's, Inc. | | | 74,640 | |
| | 603 | | | Nordstrom, Inc. | | | 36,144 | |
| | 2,601 | | | Target Corp. | | | 179,105 | |
| | | | | | | | |
| | | | | | | 473,317 | |
| | | | | | | | |
| | | | Specialty Retail — 2.3% | |
| | 318 | | | Abercrombie & Fitch Co., Class A | | | 14,390 | |
| | 157 | | | AutoNation, Inc. (a) | | | 6,812 | |
| | 147 | | | AutoZone, Inc. (a) | | | 62,282 | |
| | 886 | | | Bed Bath & Beyond, Inc. (a) | | | 62,817 | |
| | 1,088 | | | Best Buy Co., Inc. | | | 29,735 | |
| | 910 | | | CarMax, Inc. (a) | | | 42,006 | |
| | 482 | | | GameStop Corp., Class A | | | 20,258 | |
| | 1,175 | | | Gap, Inc. (The) | | | 49,033 | |
| | 5,921 | | | Home Depot, Inc. (The) | | | 458,700 | |
SEE NOTES TO FINANCIAL STATEMENTS.
| | | | | | |
| | | |
| 4 | | | | JPMORGAN INSURANCE TRUST | | JUNE 30, 2013 |
| | | | | | | | |
| SHARES | | | SECURITY DESCRIPTION | | VALUE($) | |
| | | | | | | | |
| Common Stocks — Continued | |
| | | | Specialty Retail — Continued | |
| | 974 | | | L Brands, Inc. | | | 47,970 | |
| | 4,347 | | | Lowe's Cos., Inc. | | | 177,792 | |
| | 448 | | | O'Reilly Automotive, Inc. (a) | | | 50,454 | |
| | 419 | | | PetSmart, Inc. | | | 28,069 | |
| | 891 | | | Ross Stores, Inc. | | | 57,746 | |
| | 2,691 | | | Staples, Inc. | | | 42,679 | |
| | 486 | | | Tiffany & Co. | | | 35,400 | |
| | 2,917 | | | TJX Cos., Inc. | | | 146,025 | |
| | 447 | | | Urban Outfitters, Inc. (a) | | | 17,978 | |
| | | | | | | | |
| | | | | | | 1,350,146 | |
| | | | | | | | |
| | | | Textiles, Apparel & Luxury Goods — 0.7% | |
| | 1,139 | | | Coach, Inc. | | | 65,026 | |
| | 214 | | | Fossil Group, Inc. (a) | | | 22,108 | |
| | 2,934 | | | NIKE, Inc., Class B | | | 186,837 | |
| | 329 | | | PVH Corp. | | | 41,142 | |
| | 247 | | | Ralph Lauren Corp. | | | 42,914 | |
| | 355 | | | V.F. Corp. | | | 68,536 | |
| | | | | | | | |
| | | | | | | 426,563 | |
| | | | | | | | |
| | | | Total Consumer Discretionary | | | 7,076,244 | |
| | | | | | | | |
| | | | Consumer Staples — 10.3% | |
| | | | Beverages — 2.4% | |
| | 652 | | | Beam, Inc. | | | 41,148 | |
| | 615 | | | Brown-Forman Corp., Class B | | | 41,543 | |
| | 15,525 | | | Coca-Cola Co. (The) | | | 622,708 | |
| | 1,044 | | | Coca-Cola Enterprises, Inc. | | | 36,707 | |
| | 625 | | | Constellation Brands, Inc., Class A (a) | | | 32,575 | |
| | 827 | | | Dr. Pepper Snapple Group, Inc. | | | 37,984 | |
| | 637 | | | Molson Coors Brewing Co., Class B | | | 30,487 | |
| | 585 | | | Monster Beverage Corp. (a) | | | 35,550 | |
| | 6,268 | | | PepsiCo, Inc. | | | 512,660 | |
| | | | | | | | |
| | | | | | | 1,391,362 | |
| | | | | | | | |
| | | | Food & Staples Retailing — 2.3% | |
| | 1,770 | | | Costco Wholesale Corp. | | | 195,709 | |
| | 4,963 | | | CVS Caremark Corp. | | | 283,784 | |
| | 2,108 | | | Kroger Co. (The) | | | 72,810 | |
| | 977 | | | Safeway, Inc. | | | 23,116 | |
| | 2,406 | | | Sysco Corp. | | | 82,189 | |
| | 3,495 | | | Walgreen Co. | | | 154,479 | |
| | 6,641 | | | Wal-Mart Stores, Inc. | | | 494,688 | |
| | 1,398 | | | Whole Foods Market, Inc. | | | 71,969 | |
| | | | | | | | |
| | | | | | | 1,378,744 | |
| | | | | | | | |
| | | | Food Products — 1.6% | |
| | 2,671 | | | Archer-Daniels-Midland Co. | | | 90,574 | |
| | 723 | | | Campbell Soup Co. | | | 32,383 | |
| | | | | | | | |
| SHARES | | | SECURITY DESCRIPTION | | VALUE($) | |
| | | | | | | | |
| | | | | | | | |
| | | | Food Products — Continued | |
| | 1,689 | | | ConAgra Foods, Inc. | | | 58,997 | |
| | 2,613 | | | General Mills, Inc. | | | 126,809 | |
| | 608 | | | Hershey Co. (The) | | | 54,282 | |
| | 547 | | | Hormel Foods Corp. | | | 21,103 | |
| | 435 | | | JM Smucker Co. (The) | | | 44,870 | |
| | 1,029 | | | Kellogg Co. | | | 66,093 | |
| | 2,410 | | | Kraft Foods Group, Inc. | | | 134,647 | |
| | 535 | | | McCormick & Co., Inc. (Non-Voting) | | | 37,642 | |
| | 821 | | | Mead Johnson Nutrition Co. | | | 65,048 | |
| | 7,233 | | | Mondelez International, Inc., Class A | | | 206,357 | |
| | 1,151 | | | Tyson Foods, Inc., Class A | | | 29,558 | |
| | | | | | | | |
| | | | | | | 968,363 | |
| | | | | | | | |
| | | | Household Products — 2.1% | |
| | 534 | | | Clorox Co. (The) | | | 44,397 | |
| | 3,554 | | | Colgate-Palmolive Co. | | | 203,609 | |
| | 1,559 | | | Kimberly-Clark Corp. | | | 151,441 | |
| | 11,109 | | | Procter & Gamble Co. (The) | | | 855,282 | |
| | | | | | | | |
| | | | | | | 1,254,729 | |
| | | | | | | | |
| | | | Personal Products — 0.2% | |
| | 1,755 | | | Avon Products, Inc. | | | 36,907 | |
| | 975 | | | Estee Lauder Cos., Inc. (The), Class A | | | 64,126 | |
| | | | | | | | |
| | | | | | | 101,033 | |
| | | | | | | | |
| | | | Tobacco — 1.7% | |
| | 8,142 | | | Altria Group, Inc. | | | 284,889 | |
| | 1,531 | | | Lorillard, Inc. | | | 66,874 | |
| | 6,629 | | | Philip Morris International, Inc. | | | 574,204 | |
| | 1,290 | | | Reynolds American, Inc. | | | 62,397 | |
| | | | | | | | |
| | | | | | | 988,364 | |
| | | | | | | | |
| | | | Total Consumer Staples | | | 6,082,595 | |
| | | | | | | | |
| | | | Energy — 10.4% | |
| | | | Energy Equipment & Services — 1.8% | |
| | 1,791 | | | Baker Hughes, Inc. | | | 82,619 | |
| | 1,005 | | | Cameron International Corp. (a) | | | 61,466 | |
| | 282 | | | Diamond Offshore Drilling, Inc. | | | 19,399 | |
| | 944 | | | Ensco plc, (United Kingdom), Class A | | | 54,865 | |
| | 961 | | | FMC Technologies, Inc. (a) | | | 53,508 | |
| | 3,778 | | | Halliburton Co. | | | 157,618 | |
| | 431 | | | Helmerich & Payne, Inc. | | | 26,916 | |
| | 1,194 | | | Nabors Industries Ltd., (Bermuda) | | | 18,280 | |
| | 1,732 | | | National Oilwell Varco, Inc. | | | 119,335 | |
| | 1,027 | | | Noble Corp., (Switzerland) | | | 38,595 | |
| | 503 | | | Rowan Cos. plc, Class A (a) | | | 17,137 | |
SEE NOTES TO FINANCIAL STATEMENTS.
| | | | | | | | |
| | | |
| JUNE 30, 2013 | | JPMORGAN INSURANCE TRUST | | | | | 5 | |
JPMorgan Insurance Trust Equity Index Portfolio
SCHEDULE OF PORTFOLIO INVESTMENTS
AS OF JUNE 30, 2013 (Unaudited) (continued)
| | | | | | | | |
| SHARES | | | SECURITY DESCRIPTION | | VALUE($) | |
| | | | | | | | |
| Common Stocks — Continued | |
| | | | Energy Equipment & Services — Continued | |
| | 5,389 | | | Schlumberger Ltd. | | | 386,176 | |
| | | | | | | | |
| | | | | | | 1,035,914 | |
| | | | | | | | |
| | | | Oil, Gas & Consumable Fuels — 8.6% | |
| | 2,033 | | | Anadarko Petroleum Corp. | | | 174,696 | |
| | 1,588 | | | Apache Corp. | | | 133,122 | |
| | 854 | | | Cabot Oil & Gas Corp. | | | 60,651 | |
| | 2,103 | | | Chesapeake Energy Corp. | | | 42,859 | |
| | 7,859 | | | Chevron Corp. | | | 930,034 | |
| | 4,956 | | | ConocoPhillips | | | 299,838 | |
| | 927 | | | CONSOL Energy, Inc. | | | 25,122 | |
| | 1,513 | | | Denbury Resources, Inc. (a) | | | 26,205 | |
| | 1,530 | | | Devon Energy Corp. | | | 79,376 | |
| | 1,103 | | | EOG Resources, Inc. | | | 145,243 | |
| | 610 | | | EQT Corp. | | | 48,416 | |
| | 18,022 | | | Exxon Mobil Corp. | | | 1,628,288 | |
| | 1,211 | | | Hess Corp. | | | 80,519 | |
| | 2,561 | | | Kinder Morgan, Inc. | | | 97,702 | |
| | 2,873 | | | Marathon Oil Corp. | | | 99,348 | |
| | 1,316 | | | Marathon Petroleum Corp. | | | 93,515 | |
| | 735 | | | Murphy Oil Corp. | | | 44,754 | |
| | 549 | | | Newfield Exploration Co. (a) | | | 13,116 | |
| | 1,456 | | | Noble Energy, Inc. | | | 87,418 | |
| | 3,265 | | | Occidental Petroleum Corp. | | | 291,336 | |
| | 1,093 | | | Peabody Energy Corp. | | | 16,002 | |
| | 2,510 | | | Phillips 66 | | | 147,864 | |
| | 554 | | | Pioneer Natural Resources Co. | | | 80,192 | |
| | 727 | | | QEP Resources, Inc. | | | 20,196 | |
| | 661 | | | Range Resources Corp. | | | 51,109 | |
| | 1,425 | | | Southwestern Energy Co. (a) | | | 52,055 | |
| | 2,712 | | | Spectra Energy Corp. | | | 93,456 | |
| | 550 | | | Tesoro Corp. | | | 28,776 | |
| | 2,211 | | | Valero Energy Corp. | | | 76,876 | |
| | 2,767 | | | Williams Cos., Inc. (The) | | | 89,844 | |
| | 812 | | | WPX Energy, Inc. (a) | | | 15,379 | |
| | | | | | | | |
| | | | | | | 5,073,307 | |
| | | | | | | | |
| | | | Total Energy | | | 6,109,221 | |
| | | | | | | | |
| | | | Financials — 16.4% | |
| | | | Capital Markets — 2.1% | |
| | 827 | | | Ameriprise Financial, Inc. | | | 66,888 | |
| | 4,704 | | | Bank of New York Mellon Corp. (The) | | | 131,947 | |
| | 506 | | | BlackRock, Inc. | | | 129,966 | |
| | 4,462 | | | Charles Schwab Corp. (The) | | | 94,728 | |
| | 1,163 | | | E*TRADE Financial Corp. (a) | | | 14,724 | |
| | 560 | | | Franklin Resources, Inc. | | | 76,171 | |
| | | | | | | | |
| SHARES | | | SECURITY DESCRIPTION | | VALUE($) | |
| | | | | | | | |
| | | | | | | | |
| | | | Capital Markets — Continued | |
| | 1,747 | | | Goldman Sachs Group, Inc. (The) | | | 264,234 | |
| | 1,802 | | | Invesco Ltd. | | | 57,304 | |
| | 452 | | | Legg Mason, Inc. | | | 14,016 | |
| | 5,561 | | | Morgan Stanley | | | 135,855 | |
| | 882 | | | Northern Trust Corp. | | | 51,068 | |
| | 1,849 | | | State Street Corp. | | | 120,573 | |
| | 1,052 | | | T. Rowe Price Group, Inc. | | | 76,954 | |
| | | | | | | | |
| | | | | | | 1,234,428 | |
| | | | | | | | |
| | | | Commercial Banks — 2.9% | |
| | 2,844 | | | BB&T Corp. | | | 96,355 | |
| | 757 | | | Comerica, Inc. | | | 30,151 | |
| | 3,545 | | | Fifth Third Bancorp | | | 63,987 | |
| | 3,400 | | | Huntington Bancshares, Inc. | | | 26,792 | |
| | 3,731 | | | KeyCorp | | | 41,190 | |
| | 493 | | | M&T Bank Corp. | | | 55,093 | |
| | 2,146 | | | PNC Financial Services Group, Inc. | | | 156,486 | |
| | 5,729 | | | Regions Financial Corp. | | | 54,597 | |
| | 2,185 | | | SunTrust Banks, Inc. | | | 68,981 | |
| | 7,497 | | | U.S. Bancorp | | | 271,017 | |
| | 19,965 | | | Wells Fargo & Co. | | | 823,956 | |
| | 747 | | | Zions Bancorporation | | | 21,573 | |
| | | | | | | | |
| | | | | | | 1,710,178 | |
| | | | | | | | |
| | | | Consumer Finance — 1.0% | |
| | 3,874 | | | American Express Co. | | | 289,620 | |
| | 2,368 | | | Capital One Financial Corp. | | | 148,734 | |
| | 1,988 | | | Discover Financial Services | | | 94,709 | |
| | 1,800 | | | SLM Corp. | | | 41,148 | |
| | | | | | | | |
| | | | | | | 574,211 | |
| | | | | | | | |
| | | | Diversified Financial Services — 3.9% | |
| | 43,695 | | | Bank of America Corp. | | | 561,918 | |
| | 12,333 | | | Citigroup, Inc. | | | 591,614 | |
| | 1,245 | | | CME Group, Inc. | | | 94,595 | |
| | 295 | | | IntercontinentalExchange, Inc. (a) | | | 52,439 | |
| | 15,324 | | | JPMorgan Chase & Co. (q) | | | 808,954 | |
| | 1,196 | | | Leucadia National Corp. | | | 31,359 | |
| | 1,111 | | | McGraw Hill Financial, Inc. | | | 59,094 | |
| | 786 | | | Moody's Corp. | | | 47,891 | |
| | 477 | | | NASDAQ OMX Group, Inc. (The) | | | 15,641 | |
| | 985 | | | NYSE Euronext | | | 40,779 | |
| | | | | | | | |
| | | | | | | 2,304,284 | |
| | | | | | | | |
| | | | Insurance — 4.3% | |
| | 1,379 | | | ACE Ltd., (Switzerland) | | | 123,393 | |
| | 1,890 | | | Aflac, Inc. | | | 109,847 | |
| | 1,900 | | | Allstate Corp. (The) | | | 91,428 | |
SEE NOTES TO FINANCIAL STATEMENTS.
| | | | | | |
| | | |
| 6 | | | | JPMORGAN INSURANCE TRUST | | JUNE 30, 2013 |
| | | | | | | | |
| SHARES | | | SECURITY DESCRIPTION | | VALUE($) | |
| | | | | | | | |
| Common Stocks — Continued | |
| | | | Insurance — Continued | |
| | 5,984 | | | American International Group, Inc. (a) | | | 267,485 | |
| | 1,253 | | | Aon plc, (United Kingdom) | | | 80,631 | |
| | 312 | | | Assurant, Inc. | | | 15,884 | |
| | 7,394 | | | Berkshire Hathaway, Inc., Class B (a) | | | 827,536 | |
| | 1,050 | | | Chubb Corp. (The) | | | 88,882 | |
| | 596 | | | Cincinnati Financial Corp. | | | 27,356 | |
| | 1,999 | | | Genworth Financial, Inc., Class A (a) | | | 22,809 | |
| | 1,848 | | | Hartford Financial Services Group, Inc. | | | 57,140 | |
| | 1,088 | | | Lincoln National Corp. | | | 39,679 | |
| | 1,245 | | | Loews Corp. | | | 55,278 | |
| | 2,231 | | | Marsh & McLennan Cos., Inc. | | | 89,062 | |
| | 4,438 | | | MetLife, Inc. | | | 203,083 | |
| | 1,118 | | | Principal Financial Group, Inc. | | | 41,869 | |
| | 2,246 | | | Progressive Corp. (The) | | | 57,093 | |
| | 1,889 | | | Prudential Financial, Inc. | | | 137,954 | |
| | 375 | | | Torchmark Corp. | | | 24,427 | |
| | 1,526 | | | Travelers Cos., Inc. (The) | | | 121,958 | |
| | 1,082 | | | Unum Group | | | 31,778 | |
| | 1,174 | | | XL Group plc, (Ireland) | | | 35,596 | |
| | | | | | | | |
| | | | | | | 2,550,168 | |
| | | | | | | | |
| | | | Real Estate Investment Trusts (REITs) — 2.1% | |
| | 1,603 | | | American Tower Corp. | | | 117,291 | |
| | 591 | | | Apartment Investment & Management Co., Class A | | | 17,754 | |
| | 493 | | | AvalonBay Communities, Inc. | | | 66,511 | |
| | 615 | | | Boston Properties, Inc. | | | 64,864 | |
| | 1,299 | | | Equity Residential | | | 75,420 | |
| | 1,842 | | | HCP, Inc. | | | 83,700 | |
| | 1,153 | | | Health Care REIT, Inc. | | | 77,286 | |
| | 3,019 | | | Host Hotels & Resorts, Inc. | | | 50,931 | |
| | 1,657 | | | Kimco Realty Corp. | | | 35,510 | |
| | 557 | | | Macerich Co. (The) | | | 33,960 | |
| | 660 | | | Plum Creek Timber Co., Inc. | | | 30,802 | |
| | 2,019 | | | Prologis, Inc. | | | 76,157 | |
| | 585 | | | Public Storage | | | 89,698 | |
| | 1,260 | | | Simon Property Group, Inc. | | | 198,979 | |
| | 1,188 | | | Ventas, Inc. | | | 82,518 | |
| | 689 | | | Vornado Realty Trust | | | 57,084 | |
| | 2,341 | | | Weyerhaeuser Co. | | | 66,695 | |
| | | | | | | | |
| | | | | | | 1,225,160 | |
| | | | | | | | |
| | | | Real Estate Management & Development — 0.0% (g) | |
| | 1,231 | | | CBRE Group, Inc., Class A (a) | | | 28,756 | |
| | | | | | | | |
| | | | | | | | |
| SHARES | | | SECURITY DESCRIPTION | | VALUE($) | |
| | | | | | | | |
| | | | | | | | |
| | | | Thrifts & Mortgage Finance — 0.1% | |
| | 1,927 | | | Hudson City Bancorp, Inc. | | | 17,651 | |
| | 1,374 | | | People's United Financial, Inc. | | | 20,473 | |
| | | | | | | | |
| | | | | | | 38,124 | |
| | | | | | | | |
| | | | Total Financials | | | 9,665,309 | |
| | | | | | | | |
| | | | Health Care — 12.6% | |
| | | | Biotechnology — 2.0% | |
| | 791 | | | Alexion Pharmaceuticals, Inc. (a) | | | 72,962 | |
| | 3,040 | | | Amgen, Inc. | | | 299,926 | |
| | 962 | | | Biogen Idec, Inc. (a) | | | 207,022 | |
| | 1,691 | | | Celgene Corp. (a) | | | 197,695 | |
| | 6,183 | | | Gilead Sciences, Inc. (a) | | | 316,632 | |
| | 310 | | | Regeneron Pharmaceuticals, Inc. (a) | | | 69,713 | |
| | | �� | | | | | |
| | | | | | | 1,163,950 | |
| | | | | | | | |
| | | | Health Care Equipment & Supplies — 2.1% | |
| | 6,318 | | | Abbott Laboratories | | | 220,372 | |
| | 2,197 | | | Baxter International, Inc. | | | 152,186 | |
| | 787 | | | Becton, Dickinson & Co. | | | 77,779 | |
| | 5,468 | | | Boston Scientific Corp. (a) | | | 50,688 | |
| | 303 | | | C.R. Bard, Inc. | | | 32,930 | |
| | 891 | | | CareFusion Corp. (a) | | | 32,833 | |
| | 1,907 | | | Covidien plc, (Ireland) | | | 119,836 | |
| | 581 | | | DENTSPLY International, Inc. | | | 23,798 | |
| | 458 | | | Edwards Lifesciences Corp. (a) | | | 30,778 | |
| | 163 | | | Intuitive Surgical, Inc. (a) | | | 82,573 | |
| | 4,099 | | | Medtronic, Inc. | | | 210,975 | |
| | 1,149 | | | St. Jude Medical, Inc. | | | 52,429 | |
| | 1,165 | | | Stryker Corp. | | | 75,352 | |
| | 439 | | | Varian Medical Systems, Inc. (a) | | | 29,611 | |
| | 682 | | | Zimmer Holdings, Inc. | | | 51,109 | |
| | | | | | | | |
| | | | | | | 1,243,249 | |
| | | | | | | | |
| | | | Health Care Providers & Services — 2.0% | |
| | 1,533 | | | Aetna, Inc. | | | 97,407 | |
| | 936 | | | AmerisourceBergen Corp. | | | 52,257 | |
| | 1,385 | | | Cardinal Health, Inc. | | | 65,372 | |
| | 1,156 | | | Cigna Corp. | | | 83,799 | |
| | 343 | | | DaVita HealthCare Partners, Inc. (a) | | | 41,434 | |
| | 3,309 | | | Express Scripts Holding Co. (a) | | | 204,132 | |
| | 638 | | | Humana, Inc. | | | 53,835 | |
| | 377 | | | Laboratory Corp. of America Holdings (a) | | | 37,738 | |
| | 998 | | | McKesson Corp. | | | 114,271 | |
| | 339 | | | Patterson Cos., Inc. | | | 12,746 | |
| | 640 | | | Quest Diagnostics, Inc. | | | 38,803 | |
| | 420 | | | Tenet Healthcare Corp. (a) | | | 19,362 | |
| | 4,134 | | | UnitedHealth Group, Inc. | | | 270,694 | |
SEE NOTES TO FINANCIAL STATEMENTS.
| | | | | | | | |
| | | |
| JUNE 30, 2013 | | JPMORGAN INSURANCE TRUST | | | | | 7 | |
JPMorgan Insurance Trust Equity Index Portfolio
SCHEDULE OF PORTFOLIO INVESTMENTS
AS OF JUNE 30, 2013 (Unaudited) (continued)
| | | | | | | | |
| SHARES | | | SECURITY DESCRIPTION | | VALUE($) | |
| | | | | | | | |
| Common Stocks — Continued | |
| | | | Health Care Providers & Services — Continued | |
| | 1,217 | | | WellPoint, Inc. | | | 99,599 | |
| | | | | | | | |
| | | | | | | 1,191,449 | |
| | | | | | | | |
| | | | Health Care Technology — 0.1% | |
| | 592 | | | Cerner Corp. (a) | | | 56,885 | |
| | | | | | | | |
| | | | Life Sciences Tools & Services — 0.5% | |
| | 1,396 | | | Agilent Technologies, Inc. | | | 59,693 | |
| | 698 | | | Life Technologies Corp. (a) | | | 51,659 | |
| | 454 | | | PerkinElmer, Inc. | | | 14,755 | |
| | 1,455 | | | Thermo Fisher Scientific, Inc. | | | 123,137 | |
| | 347 | | | Waters Corp. (a) | | | 34,717 | |
| | | | | | | | |
| | | | | | | 283,961 | |
| | | | | | | | |
| | | | Pharmaceuticals — 5.9% | |
| | 6,419 | | | AbbVie, Inc. | | | 265,361 | |
| | 518 | | | Actavis, Inc. (a) | | | 65,382 | |
| | 1,201 | | | Allergan, Inc. | | | 101,172 | |
| | 6,658 | | | Bristol-Myers Squibb Co. | | | 297,546 | |
| | 4,018 | | | Eli Lilly & Co. | | | 197,364 | |
| | 951 | | | Forest Laboratories, Inc. (a) | | | 38,991 | |
| | 671 | | | Hospira, Inc. (a) | | | 25,706 | |
| | 11,385 | | | Johnson & Johnson | | | 977,516 | |
| | 12,239 | | | Merck & Co., Inc. | | | 568,502 | |
| | 1,545 | | | Mylan, Inc. (a) | | | 47,941 | |
| | 358 | | | Perrigo Co. | | | 43,318 | |
| | 27,048 | | | Pfizer, Inc. | | | 757,615 | |
| | 2,027 | | | Zoetis, Inc. | | | 62,614 | |
| | | | | | | | |
| | | | | | | 3,449,028 | |
| | | | | | | | |
| | | | Total Health Care | | | 7,388,522 | |
| | | | | | | | |
| | | | Industrials — 10.1% | |
| | | | Aerospace & Defense — 2.5% | |
| | 2,768 | | | Boeing Co. (The) | | | 283,554 | |
| | 1,346 | | | General Dynamics Corp. | | | 105,432 | |
| | 3,189 | | | Honeywell International, Inc. | | | 253,015 | |
| | 365 | | | L-3 Communications Holdings, Inc. | | | 31,295 | |
| | 1,078 | | | Lockheed Martin Corp. | | | 116,920 | |
| | 953 | | | Northrop Grumman Corp. | | | 78,909 | |
| | 593 | | | Precision Castparts Corp. | | | 134,024 | |
| | 1,316 | | | Raytheon Co. | | | 87,014 | |
| | 550 | | | Rockwell Collins, Inc. | | | 34,876 | |
| | 1,126 | | | Textron, Inc. | | | 29,332 | |
| | 3,428 | | | United Technologies Corp. | | | 318,598 | |
| | | | | | | | |
| | | | | | | 1,472,969 | |
| | | | | | | | |
| | | | | | | | |
| SHARES | | | SECURITY DESCRIPTION | | VALUE($) | |
| | | | | | | | |
| | | | | | | | |
| | | | Air Freight & Logistics — 0.7% | |
| | 651 | | | C.H. Robinson Worldwide, Inc. | | | 36,658 | |
| | 837 | | | Expeditors International of Washington, Inc. | | | 31,814 | |
| | 1,194 | | | FedEx Corp. | | | 117,705 | |
| | 2,880 | | | United Parcel Service, Inc., Class B | | | 249,062 | |
| | | | | | | | |
| | | | | | | 435,239 | |
| | | | | | | | |
| | | | Airlines — 0.1% | |
| | 2,928 | | | Southwest Airlines Co. | | | 37,742 | |
| | | | | | | | |
| | | | Building Products — 0.0% (g) | |
| | 1,446 | | | Masco Corp. | | | 28,182 | |
| | | | | | | | |
| | | | Commercial Services & Supplies — 0.5% | |
| | 887 | | | ADT Corp. (The) (a) | | | 35,347 | |
| | 404 | | | Avery Dennison Corp. | | | 17,275 | |
| | 422 | | | Cintas Corp. | | | 19,218 | |
| | 680 | | | Iron Mountain, Inc. | | | 18,095 | |
| | 817 | | | Pitney Bowes, Inc. | | | 11,994 | |
| | 1,203 | | | Republic Services, Inc. | | | 40,830 | |
| | 350 | | | Stericycle, Inc. (a) | | | 38,650 | |
| | 1,881 | | | Tyco International Ltd., (Switzerland) | | | 61,979 | |
| | 1,779 | | | Waste Management, Inc. | | | 71,747 | |
| | | | | | | | |
| | | | | | | 315,135 | |
| | | | | | | | |
| | | | Construction & Engineering — 0.2% | |
| | 660 | | | Fluor Corp. | | | 39,144 | |
| | 530 | | | Jacobs Engineering Group, Inc. (a) | | | 29,219 | |
| | 863 | | | Quanta Services, Inc. (a) | | | 22,835 | |
| | | | | | | | |
| | | | | | | 91,198 | |
| | | | | | | | |
| | | | Electrical Equipment — 0.7% | |
| | 1,918 | | | Eaton Corp. plc, (Ireland) | | | 126,224 | |
| | 2,914 | | | Emerson Electric Co. | | | 158,930 | |
| | 566 | | | Rockwell Automation, Inc. | | | 47,057 | |
| | 401 | | | Roper Industries, Inc. | | | 49,812 | |
| | | | | | | | |
| | | | | | | 382,023 | |
| | | | | | | | |
| | | | Industrial Conglomerates — 2.4% | |
| | 2,574 | | | 3M Co. | | | 281,467 | |
| | 2,358 | | | Danaher Corp. | | | 149,261 | |
| | 41,911 | | | General Electric Co. | | | 971,916 | |
| | | | | | | | |
| | | | | | | 1,402,644 | |
| | | | | | | | |
| | | | Machinery — 1.8% | |
| | 2,665 | | | Caterpillar, Inc. | | | 219,836 | |
| | 715 | | | Cummins, Inc. | | | 77,549 | |
| | 1,573 | | | Deere & Co. | | | 127,806 | |
| | 694 | | | Dover Corp. | | | 53,896 | |
| | 1,740 | | | Flowserve Corp. | | | 93,977 | |
| | 1,680 | | | Illinois Tool Works, Inc. | | | 116,206 | |
SEE NOTES TO FINANCIAL STATEMENTS.
| | | | | | |
| | | |
| 8 | | | | JPMORGAN INSURANCE TRUST | | JUNE 30, 2013 |
| | | | | | | | |
| SHARES | | | SECURITY DESCRIPTION | | VALUE($) | |
| | | | | | | | |
| Common Stocks — Continued | |
| | | | Machinery — Continued | |
| | 1,127 | | | Ingersoll-Rand plc, (Ireland) | | | 62,571 | |
| | 431 | | | Joy Global, Inc. | | | 20,916 | |
| | 1,434 | | | PACCAR, Inc. | | | 76,949 | |
| | 452 | | | Pall Corp. | | | 30,026 | |
| | 605 | | | Parker Hannifin Corp. | | | 57,717 | |
| | 828 | | | Pentair Ltd., (Switzerland) | | | 47,767 | |
| | 236 | | | Snap-on, Inc. | | | 21,094 | |
| | 656 | | | Stanley Black & Decker, Inc. | | | 50,709 | |
| | 751 | | | Xylem, Inc. | | | 20,232 | |
| | | | | | | | |
| | | | | | | 1,077,251 | |
| | | | | | | | |
| | | | Professional Services — 0.1% | |
| | 162 | | | Dun & Bradstreet Corp. (The) | | | 15,787 | |
| | 489 | | | Equifax, Inc. | | | 28,817 | |
| | 566 | | | Robert Half International, Inc. | | | 18,808 | |
| | | | | | | | |
| | | | | | | 63,412 | |
| | | | | | | | |
| | | | Road & Rail — 0.9% | |
| | 4,142 | | | CSX Corp. | | | 96,053 | |
| | 447 | | | Kansas City Southern | | | 47,364 | |
| | 1,277 | | | Norfolk Southern Corp. | | | 92,774 | |
| | 210 | | | Ryder System, Inc. | | | 12,766 | |
| | 1,892 | | | Union Pacific Corp. | | | 291,898 | |
| | | | | | | | |
| | | | | | | 540,855 | |
| | | | | | | | |
| | | | Trading Companies & Distributors — 0.2% | |
| | 1,094 | | | Fastenal Co. | | | 50,160 | |
| | 242 | | | W.W. Grainger, Inc. | | | 61,027 | |
| | | | | | | | |
| | | | | | | 111,187 | |
| | | | | | | | |
| | | | Total Industrials | | | 5,957,837 | |
| | | | | | | | |
| | | | Information Technology — 17.6% | |
| | | | Communications Equipment — 1.9% | |
| | 21,662 | | | Cisco Systems, Inc. | | | 526,603 | |
| | 319 | | | F5 Networks, Inc. (a) | | | 21,947 | |
| | 444 | | | Harris Corp. | | | 21,867 | |
| | 959 | | | JDS Uniphase Corp. (a) | | | 13,791 | |
| | 2,052 | | | Juniper Networks, Inc. (a) | | | 39,624 | |
| | 1,101 | | | Motorola Solutions, Inc. | | | 63,561 | |
| | 7,003 | | | QUALCOMM, Inc. | | | 427,743 | |
| | | | | | | | |
| | | | | | | 1,115,136 | |
| | | | | | | | |
| | | | Computers & Peripherals — 3.8% | |
| | 3,805 | | | Apple, Inc. | | | 1,507,084 | |
| | 5,949 | | | Dell, Inc. | | | 79,419 | |
| | 8,515 | | | EMC Corp. | | | 201,124 | |
| | 7,817 | | | Hewlett-Packard Co. | | | 193,862 | |
| | 1,461 | | | NetApp, Inc. (a) | | | 55,196 | |
| | | | | | | | |
| SHARES | | | SECURITY DESCRIPTION | | VALUE($) | |
| | | | | | | | |
| | | | | | | | |
| | | | Computers & Peripherals — Continued | |
| | 986 | | | SanDisk Corp. (a) | | | 60,245 | |
| | 1,293 | | | Seagate Technology plc, (Ireland) | | | 57,965 | |
| | 862 | | | Western Digital Corp. | | | 53,522 | |
| | | | | | | | |
| | | | | | | 2,208,417 | |
| | | | | | | | |
| | | | Electronic Equipment, Instruments & Components — 0.4% | |
| | 648 | | | Amphenol Corp., Class A | | | 50,505 | |
| | 5,979 | | | Corning, Inc. | | | 85,081 | |
| | 575 | | | FLIR Systems, Inc. | | | 15,508 | |
| | 747 | | | Jabil Circuit, Inc. | | | 15,224 | |
| | 562 | | | Molex, Inc. | | | 16,489 | |
| | 1,684 | | | TE Connectivity Ltd., (Switzerland) | | | 76,689 | |
| | | | | | | | |
| | | | | | | 259,496 | |
| | | | | | | | |
| | | | Internet Software & Services — 2.3% | |
| | 720 | | | Akamai Technologies, Inc. (a) | | | 30,636 | |
| | 4,734 | | | eBay, Inc. (a) | | | 244,843 | |
| | 1,089 | | | Google, Inc., Class A (a) | | | 958,723 | |
| | 611 | | | VeriSign, Inc. (a) | | | 27,287 | |
| | 3,862 | | | Yahoo!, Inc. (a) | | | 96,975 | |
| | | | | | | | |
| | | | | | | 1,358,464 | |
| | | | | | | | |
| | | | IT Services — 3.6% | |
| | 2,635 | | | Accenture plc, (Ireland), Class A | | | 189,615 | |
| | 1,967 | | | Automatic Data Processing, Inc. | | | 135,448 | |
| | 1,223 | | | Cognizant Technology Solutions Corp., Class A (a) | | | 76,572 | |
| | 609 | | | Computer Sciences Corp. | | | 26,656 | |
| | 1,188 | | | Fidelity National Information Services, Inc. | | | 50,894 | |
| | 540 | | | Fiserv, Inc. (a) | | | 47,201 | |
| | 4,225 | | | International Business Machines Corp. | | | 807,440 | |
| | 424 | | | MasterCard, Inc., Class A | | | 243,588 | |
| | 1,313 | | | Paychex, Inc. | | | 47,951 | |
| | 1,152 | | | SAIC, Inc. | | | 16,047 | |
| | 662 | | | Teradata Corp. (a) | | | 33,252 | |
| | 652 | | | Total System Services, Inc. | | | 15,961 | |
| | 2,054 | | | Visa, Inc., Class A | | | 375,369 | |
| | 2,258 | | | Western Union Co. (The) | | | 38,634 | |
| | | | | | | | |
| | | | | | | 2,104,628 | |
| | | | | | | | |
| | | | Office Electronics — 0.1% | |
| | 4,977 | | | Xerox Corp. | | | 45,141 | |
| | | | | | | | |
| | | | Semiconductors & Semiconductor Equipment — 2.1% | |
| | 2,462 | | | Advanced Micro Devices, Inc. (a) | | | 10,045 | |
| | 1,298 | | | Altera Corp. | | | 42,821 | |
| | 1,249 | | | Analog Devices, Inc. | | | 56,280 | |
| | 4,870 | | | Applied Materials, Inc. | | | 72,612 | |
SEE NOTES TO FINANCIAL STATEMENTS.
| | | | | | | | |
| | | |
| JUNE 30, 2013 | | JPMORGAN INSURANCE TRUST | | | | | 9 | |
JPMorgan Insurance Trust Equity Index Portfolio
SCHEDULE OF PORTFOLIO INVESTMENTS
AS OF JUNE 30, 2013 (Unaudited) (continued)
| | | | | | | | |
| SHARES | | | SECURITY DESCRIPTION | | VALUE($) | |
| | | | | | | | |
| Common Stocks — Continued | |
| | | | Semiconductors & Semiconductor Equipment — Continued | |
| | 2,129 | | | Broadcom Corp., Class A | | | 71,875 | |
| | 269 | | | First Solar, Inc. (a) | | | 12,032 | |
| | 20,149 | | | Intel Corp. | | | 488,009 | |
| | 672 | | | KLA-Tencor Corp. | | | 37,450 | |
| | 660 | | | Lam Research Corp. (a) | | | 29,264 | |
| | 945 | | | Linear Technology Corp. | | | 34,814 | |
| | 2,227 | | | LSI Corp. (a) | | | 15,901 | |
| | 799 | | | Microchip Technology, Inc. | | | 29,763 | |
| | 4,175 | | | Micron Technology, Inc. (a) | | | 59,828 | |
| | 2,342 | | | NVIDIA Corp. | | | 32,858 | |
| | 773 | | | Teradyne, Inc. (a) | | | 13,582 | |
| | 4,496 | | | Texas Instruments, Inc. | | | 156,775 | |
| | 1,070 | | | Xilinx, Inc. | | | 42,383 | |
| | | | | | | | |
| | | | | | | 1,206,292 | |
| | | | | | | | |
| | | | Software — 3.4% | |
| | 2,034 | | | Adobe Systems, Inc. (a) | | | 92,669 | |
| | 911 | | | Autodesk, Inc. (a) | | | 30,920 | |
| | 537 | | | BMC Software, Inc. (a) | | | 24,240 | |
| | 1,343 | | | CA, Inc. | | | 38,450 | |
| | 758 | | | Citrix Systems, Inc. (a) | | | 45,730 | |
| | 1,227 | | | Electronic Arts, Inc. (a) | | | 28,184 | |
| | 1,131 | | | Intuit, Inc. | | | 69,025 | |
| | 30,464 | | | Microsoft Corp. | | | 1,051,922 | |
| | 14,893 | | | Oracle Corp. | | | 457,513 | |
| | 768 | | | Red Hat, Inc. (a) | | | 36,726 | |
| | 2,200 | | | Salesforce.com, Inc. (a) | | | 83,996 | |
| | 2,824 | | | Symantec Corp. | | | 63,455 | |
| | | | | | | | |
| | | | | | | 2,022,830 | |
| | | | | | | | |
| | | | Total Information Technology | | | 10,320,404 | |
| | | | | | | | |
| | | | Materials — 3.2% | |
| | | | Chemicals — 2.4% | |
| | 844 | | | Air Products & Chemicals, Inc. | | | 77,285 | |
| | 267 | | | Airgas, Inc. | | | 25,488 | |
| | 240 | | | CF Industries Holdings, Inc. | | | 41,160 | |
| | 4,903 | | | Dow Chemical Co. (The) | | | 157,730 | |
| | 3,731 | | | E.I. du Pont de Nemours & Co. | | | 195,878 | |
| | 628 | | | Eastman Chemical Co. | | | 43,966 | |
| | 1,080 | | | Ecolab, Inc. | | | 92,005 | |
| | 552 | | | FMC Corp. | | | 33,705 | |
| | 330 | | | International Flavors & Fragrances, Inc. | | | 24,803 | |
| | 1,540 | | | LyondellBasell Industries N.V., (Netherlands), Class A | | | 102,040 | |
| | 2,164 | | | Monsanto Co. | | | 213,803 | |
| | 1,122 | | | Mosaic Co. (The) | | | 60,375 | |
| | | | | | | | |
| SHARES | | | SECURITY DESCRIPTION | | VALUE($) | |
| | | | | | | | |
| | | | | | | | |
| | | | Chemicals — Continued | |
| | 578 | | | PPG Industries, Inc. | | | 84,625 | |
| | 1,199 | | | Praxair, Inc. | | | 138,077 | |
| | 347 | | | Sherwin-Williams Co. (The) | | | 61,280 | |
| | 488 | | | Sigma-Aldrich Corp. | | | 39,216 | |
| | | | | | | | |
| | | | | | | 1,391,436 | |
| | | | | | | | |
| | | | Construction Materials — 0.0% (g) | |
| | 527 | | | Vulcan Materials Co. | | | 25,512 | |
| | | | | | | | |
| | | | Containers & Packaging — 0.2% | |
| | 603 | | | Ball Corp. | | | 25,049 | |
| | 417 | | | Bemis Co., Inc. | | | 16,321 | |
| | 717 | | | MeadWestvaco Corp. | | | 24,457 | |
| | 667 | | | Owens-Illinois, Inc. (a) | | | 18,536 | |
| | 794 | | | Sealed Air Corp. | | | 19,016 | |
| | | | | | | | |
| | | | | | | 103,379 | |
| | | | | | | | |
| | | | Metals & Mining — 0.5% | |
| | 4,334 | | | Alcoa, Inc. | | | 33,892 | |
| | 438 | | | Allegheny Technologies, Inc. | | | 11,524 | |
| | 621 | | | Cliffs Natural Resources, Inc. | | | 10,091 | |
| | 4,208 | | | Freeport-McMoRan Copper & Gold, Inc. | | | 116,183 | |
| | 2,015 | | | Newmont Mining Corp. | | | 60,349 | |
| | 1,288 | | | Nucor Corp. | | | 55,796 | |
| | 585 | | | United States Steel Corp. | | | 10,255 | |
| | | | | | | | |
| | | | | | | 298,090 | |
| | | | | | | | |
| | | | Paper & Forest Products — 0.1% | |
| | 1,803 | | | International Paper Co. | | | 79,891 | |
| | | | | | | | |
| | | | Total Materials | | | 1,898,308 | |
| | | | | | | | |
| | | | Telecommunication Services — 2.8% | |
| | | | Diversified Telecommunication Services — 2.5% | |
| | 21,806 | | | AT&T, Inc. | | | 771,933 | |
| | 2,469 | | | CenturyLink, Inc. | | | 87,279 | |
| | 4,044 | | | Frontier Communications Corp. | | | 16,378 | |
| | 11,597 | | | Verizon Communications, Inc. | | | 583,793 | |
| | 2,403 | | | Windstream Corp. | | | 18,527 | |
| | | | | | | | |
| | | | | | | 1,477,910 | |
| | | | | | | | |
| | | | Wireless Telecommunication Services — 0.3% | |
| | 1,188 | | | Crown Castle International Corp. (a) | | | 85,999 | |
| | 12,233 | | | Sprint Nextel Corp. (a) | | | 85,876 | |
| | | | | | | | |
| | | | | | | 171,875 | |
| | | | | | | | |
| | | | Total Telecommunication Services | | | 1,649,785 | |
| | | | | | | | |
SEE NOTES TO FINANCIAL STATEMENTS.
| | | | | | |
| | | |
| 10 | | | | JPMORGAN INSURANCE TRUST | | JUNE 30, 2013 |
| | | | | | | | |
| SHARES | | | SECURITY DESCRIPTION | | VALUE($) | |
| | | | | | | | |
| Common Stocks — Continued | |
| | | | Utilities — 3.3% | |
| | | | Electric Utilities — 1.9% | |
| | 1,970 | | | American Electric Power Co., Inc. | | | 88,217 | |
| | 2,860 | | | Duke Energy Corp. | | | 193,050 | |
| | 1,321 | | | Edison International | | | 63,619 | |
| | 722 | | | Entergy Corp. | | | 50,309 | |
| | 3,469 | | | Exelon Corp. | | | 107,123 | |
| | 1,695 | | | FirstEnergy Corp. | | | 63,291 | |
| | 1,721 | | | NextEra Energy, Inc. | | | 140,227 | |
| | 1,275 | | | Northeast Utilities | | | 53,575 | |
| | 1,008 | | | Pepco Holdings, Inc. | | | 20,321 | |
| | 446 | | | Pinnacle West Capital Corp. | | | 24,740 | |
| | 2,401 | | | PPL Corp. | | | 72,654 | |
| | 3,528 | | | Southern Co. (The) | | | 155,691 | |
| | 2,015 | | | Xcel Energy, Inc. | | | 57,105 | |
| | | | | | | | |
| | | | | | | 1,089,922 | |
| | | | | | | | |
| | | | Gas Utilities — 0.1% | |
| | 479 | | | AGL Resources, Inc. | | | 20,530 | |
| | 835 | | | ONEOK, Inc. | | | 34,494 | |
| | | | | | | | |
| | | | | | | 55,024 | |
| | | | | | | | |
| | | | Independent Power Producers & Energy Traders — 0.1% | |
| | 2,511 | | | AES Corp. | | | 30,107 | |
| | 1,307 | | | NRG Energy, Inc. | | | 34,897 | |
| | | | | | | | |
| | | | | | | 65,004 | |
| | | | | | | | |
| | | | Multi-Utilities — 1.2% | |
| | 983 | | | Ameren Corp. | | | 33,854 | |
| | 1,737 | | | CenterPoint Energy, Inc. | | | 40,802 | |
| | 1,077 | | | CMS Energy Corp. | | | 29,262 | |
| | 1,187 | | | Consolidated Edison, Inc. | | | 69,214 | |
| | 2,341 | | | Dominion Resources, Inc. | | | 133,016 | |
| | 705 | | | DTE Energy Co. | | | 47,242 | |
| | | | | | | | |
| SHARES | | | SECURITY DESCRIPTION | | VALUE($) | |
| | | | Multi-Utilities — Continued | |
| | 321 | | | Integrys Energy Group, Inc. | | | 18,788 | |
| | 1,265 | | | NiSource, Inc. | | | 36,230 | |
| | 1,792 | | | PG&E Corp. | | | 81,948 | |
| | 2,051 | | | Public Service Enterprise Group, Inc. | | | 66,986 | |
| | 565 | | | SCANA Corp. | | | 27,741 | |
| | 914 | | | Sempra Energy | | | 74,729 | |
| | 829 | | | TECO Energy, Inc. | | | 14,250 | |
| | 927 | | | Wisconsin Energy Corp. | | | 37,998 | |
| | | | | | | | |
| | | | | | | 712,060 | |
| | | | | | | | |
| | | | Total Utilities | | | 1,922,010 | |
| | | | | | | | |
| | | | Total Common Stocks
(Cost $38,837,728) | | | 58,070,235 | |
| | | | | | | | |
| Short-Term Investments — 1.3% | |
| | | | Investment Company — 1.2% | |
| | 685,315 | | | JPMorgan Liquid Assets Money Market Fund, Institutional Class Shares, 0.030% (b) (l) (m) | | | 685,315 | |
| | | | | | | | |
| | |
PRINCIPAL
AMOUNT($) | | | | | | |
| | | | U.S. Treasury Bill — 0.1% | |
| | 80,000 | | | U.S. Treasury Bills, 0.032%, 09/12/13 (k) (n) | | | 79,997 | |
| | | | | | | | |
| | | | Total Short-Term Investments
(Cost $765,308) | | | 765,312 | |
| | | | | | | | |
| | | | Total Investments — 100.0%
(Cost $39,603,036) | | | 58,835,547 | |
| | | | Liabilities in Excess of
Other Assets — 0.0% (g) | | | (23,843 | ) |
| | | | | | | | |
| | | | NET ASSETS — 100.0% | | $ | 58,811,704 | |
| | | | | | | | |
Percentages indicated are based on net assets.
| | | | | | | | | | | | | | | | |
| Futures Contracts | | | | | | | | | |
NUMBER OF
CONTRACTS | | | DESCRIPTION | | EXPIRATION
DATE | | | NOTIONAL
VALUE AT
06/30/13 | | | NET
UNREALIZED
APPRECIATION
(DEPRECIATION) | |
| | | | Long Futures Outstanding | | | | | | | | | | | | |
| | 9 | | | E-mini S&P 500 | | | 09/20/13 | | | $ | 719,685 | | | $ | (383 | ) |
| | | | | | | | | | | | | | | | |
SEE NOTES TO FINANCIAL STATEMENTS.
| | | | | | | | |
| | | |
| JUNE 30, 2013 | | JPMORGAN INSURANCE TRUST | | | | | 11 | |
JPMorgan Insurance Trust Equity Index Portfolio
NOTES TO SCHEDULE OF PORTFOLIO INVESTMENTS
AS OF JUNE 30, 2013 (Unaudited) (continued)
| | |
| REIT | | — Real Estate Investment Trust. |
| |
| (a) | | — Non-income producing security. |
| (b) | | — Investment in affiliate. Money market fund registered under the Investment Company Act of 1940, as amended, and advised by J.P. Morgan Investment Management Inc. |
| (g) | | — Amount rounds to less than 0.1%. |
| (k) | | — All or a portion of this security is deposited with the broker as collateral for futures or with brokers as initial margin for futures contracts. |
| (l) | | — The rate shown is the current yield as of June 30, 2013. |
| | |
| (m) | | — All or a portion of this security is reserved and/or pledged with the custodian for current or potential holdings of futures, swaps, options, TBAs, when-issued securities, delayed delivery securities, reverse repurchase agreements, unfunded commitments and/or forward foreign currency exchange contracts. |
| (n) | | — The rate shown is the effective yield at the date of purchase. |
| (q) | | — Investment in affiliate. This security is included in an index in which the Portfolio, as an index fund, invests. |
SEE NOTES TO FINANCIAL STATEMENTS.
| | | | | | |
| | | |
| 12 | | | | JPMORGAN INSURANCE TRUST | | JUNE 30, 2013 |
STATEMENT OF ASSETS AND LIABILITIES
AS OF JUNE 30, 2013 (Unaudited)
| | | | |
| | | | |
| | |
Equity Index
Portfolio | |
ASSETS: | | | | |
Investments in non-affiliates, at value | | $ | 57,341,278 | |
Investments in affiliates, at value | | | 1,494,269 | |
| | | | |
Total investment securities, at value | | | 58,835,547 | |
Receivables: | | | | |
Investment securities sold | | | 7,194 | |
Dividends from non-affiliates | | | 72,167 | |
Dividends from affiliates | | | 26 | |
Prepaid expenses | | | 2,581 | |
| | | | |
Total Assets | | | 58,917,515 | |
| | | | |
| |
LIABILITIES: | | | | |
Payables: | | | | |
Investment securities purchased | | | 3,445 | |
Portfolio shares redeemed | | | 33,371 | |
Variation margin on futures contracts | | | 3,285 | |
Accrued liabilities: | | | | |
Investment advisory fees | | | 10,478 | |
Custodian and accounting fees | | | 11,980 | |
Trustees' and Chief Compliance Officer's fees | | | 178 | |
Audit Fees | | | 31,955 | |
Printing and mailing costs | | | 9,285 | |
Other | | | 1,834 | |
| | | | |
Total Liabilities | | | 105,811 | |
| | | | |
Net Assets | | $ | 58,811,704 | |
| | | | |
|
NET ASSETS: | |
Paid-in-Capital | | $ | 45,294,708 | |
Accumulated undistributed net investment income | | | 522,181 | |
Accumulated net realized gains (losses) | | | (6,237,313 | ) |
Net unrealized appreciation (depreciation) | | | 19,232,128 | |
| | | | |
Total Net Assets | | $ | 58,811,704 | |
| | | | |
| |
Outstanding units of beneficial interest (shares) | | | | |
(unlimited number of shares authorized, no par value): | | | 4,429,179 | |
| | | | |
Net Asset Value, offering and redemption price per share (a): | | $ | 13.28 | |
| | | | |
Cost of investments in non-affiliates | | $ | 38,340,445 | |
Cost of investments in affiliates | | | 1,262,591 | |
| (a) | Per share amounts may not recalculate due to rounding of net assets and/or shares outstanding. |
SEE NOTES TO FINANCIAL STATEMENTS.
| | | | | | | | |
| | | |
| JUNE 30, 2013 | | JPMORGAN INSURANCE TRUST | | | | | 13 | |
STATEMENT OF OPERATIONS
For the Six Months Ended June 30, 2013 (Unaudited)
| | | | |
| | | | |
| | |
Equity Index
Portfolio | |
INVESTMENT INCOME: | |
Dividend income from non-affiliates | | $ | 627,612 | |
Dividend income from affiliates | | | 10,266 | |
Interest income from non-affiliates | | | 22 | |
Income from securities lending (net) | | | 3 | |
| | | | |
Total investment income | | | 637,903 | |
| | | | |
| |
EXPENSES: | | | | |
Investment advisory fees | | | 75,029 | |
Administration fees | | | 25,308 | |
Custodian and accounting fees | | | 24,345 | |
Interest expense to affiliates | | | 6 | |
Professional fees | | | 24,091 | |
Trustees' and Chief Compliance Officer's fees | | | 340 | |
Printing and mailing costs | | | 10,001 | |
Transfer agent fees | | | 1,501 | |
Other | | | 5,246 | |
| | | | |
Total expenses | | | 165,867 | |
| | | | |
Less amounts waived | | | (46,415 | ) |
| | | | |
Net expenses | | | 119,452 | |
| | | | |
Net investment income (loss) | | | 518,451 | |
| | | | |
| |
REALIZED/UNREALIZED GAINS (LOSSES): | | | | |
Net realized gain (loss) on transactions from: | | | | |
Investments in non-affiliates | | | 2,369,448 | |
Investment in affiliates | | | 28,116 | |
Futures | | | 112,202 | |
| | | | |
Net realized gains (losses) | | | 2,509,766 | |
| | | | |
Change in net unrealized appreciation/depreciation of: | | | | |
Investments in non-affiliates | | | 4,565,131 | |
Investments in affiliates | | | 117,423 | |
Futures | | | 2,869 | |
| | | | |
Change in net unrealized appreciation/depreciation | | | 4,685,423 | |
| | | | |
Net realized/unrealized gains (losses) | | | 7,195,189 | |
| | | | |
Change in net assets resulting from operations | | $ | 7,713,640 | |
| | | | |
SEE NOTES TO FINANCIAL STATEMENTS.
| | | | | | |
| | | |
| 14 | | | | JPMORGAN INSURANCE TRUST | | JUNE 30, 2013 |
STATEMENTS OF CHANGES IN NET ASSETS
FOR THE PERIODS INDICATED
| | | | | | | | |
| | | Equity Index Portfolio | |
| | | Six Months Ended
6/30/2013
(Unaudited) | | | Year Ended
12/31/2012 | |
CHANGE IN NET ASSETS RESULTING FROM OPERATIONS: | | | | | | | | |
Net investment income (loss) | | $ | 518,451 | | | $ | 1,209,397 | |
Net realized gain (loss) | | | 2,509,766 | | | | 4,651,011 | |
Change in net unrealized appreciation/depreciation | | | 4,685,423 | | | | 3,663,404 | |
| | | | | | | | |
Change in net assets resulting from operations | | | 7,713,640 | | | | 9,523,812 | |
| | | | | | | | |
| | |
DISTRIBUTIONS TO SHAREHOLDERS: | | | | | | | | |
From net investment income | | | (1,177,217 | ) | | | (1,198,609 | ) |
From net realized gains | | | (2,249,549 | ) | | | — | |
| | | | | | | | |
Total distributions to shareholders | | | (3,426,766 | ) | | | (1,198,609 | ) |
| | | | | | | | |
| | |
CAPITAL TRANSACTIONS: | | | | | | | | |
Proceeds from shares issued | | $ | 476,850 | | | $ | 1,802,034 | |
Distributions reinvested | | | 3,426,766 | | | | 1,198,609 | |
Cost of shares redeemed | | | (7,683,479 | ) | | | (20,209,373 | ) |
| | | | | | | | |
Total change in net assets resulting from capital transactions | | $ | (3,779,863 | ) | | $ | (17,208,730 | ) |
| | | | | | | | |
| | |
NET ASSETS: | | | | | | | | |
Change in net assets | | | 507,011 | | | | (8,883,527 | ) |
Beginning of period | | | 58,304,693 | | | | 67,188,220 | |
| | | | | | | | |
End of period | | $ | 58,811,704 | | | $ | 58,304,693 | |
| | | | | | | | |
Accumulated undistributed net investment income | | $ | 522,181 | | | $ | 1,180,947 | |
| | | | | | | | |
|
SHARE TRANSACTIONS: | |
Issued | | | 36,765 | | | | 154,619 | |
Reinvested | | | 264,207 | | | | 102,096 | |
Redeemed | | | (575,517 | ) | | | (1,699,371 | ) |
| | | | | | | | |
Change in Shares | | | (274,545 | ) | | | (1,442,656 | ) |
| | | | | | | | |
SEE NOTES TO FINANCIAL STATEMENTS.
| | | | | | | | |
| | | |
| JUNE 30, 2013 | | JPMORGAN INSURANCE TRUST | | | | | 15 | |
FINANCIAL HIGHLIGHTS
FOR THE PERIODS INDICATED
| | | | | | | | | | | | | | | | | | | | | | | | | | | | |
| | | | | | Per share operating performance | |
| | | | | | Investment operations | | | Distributions | |
| | | Net asset
value,
beginning
of period | | | Net
investment
income
(loss) | | | Net realized
and unrealized
gains
(losses) on
investments | | | Total from
investment
operations | | | Net
investment
income | | | Net
realized
gain | | | Total
distributions | |
Equity Index Portfolio | | | | | | | | | | | | | | | | | | | | | | | | | | | | |
Six Months Ended June 30, 2013 (Unaudited) | | $ | 12.40 | | | $ | 0.11 | (f) | | $ | 1.56 | | | $ | 1.67 | | | $ | (0.27 | ) | | $ | (0.52 | ) | | $ | (0.79 | ) |
Year Ended December 31, 2012 | | | 10.93 | | | | 0.23 | (f) | | | 1.46 | | | | 1.69 | | | | (0.22 | ) | | | — | | | | (0.22 | ) |
Year Ended December 31, 2011 | | | 10.93 | | | | 0.19 | (f) | | | — | (g) | | | 0.19 | | | | (0.19 | ) | | | — | | | | (0.19 | ) |
Year Ended December 31, 2010 | | | 9.75 | | | | 0.16 | (f) | | | 1.23 | | | | 1.39 | | | | (0.21 | ) | | | — | | | | (0.21 | ) |
Year Ended December 31, 2009 | | | 7.93 | | | | 0.20 | | | | 1.83 | | | | 2.03 | | | | (0.21 | ) | | | — | | | | (0.21 | ) |
Year Ended December 31, 2008 | | | 12.87 | | | | 0.21 | (f) | | | (4.93 | ) | | | (4.72 | ) | | | (0.22 | ) | | | — | | | | (0.22 | ) |
| (a) | Annualized for periods less than one year. |
| (b) | Not annualized for periods less than one year. |
| (c) | Includes adjustments in accordance with accounting principles generally accepted in the United States of America and as such, the net asset values for financial reporting purposes and the returns based upon those net asset values may differ from the net asset values and returns for shareholder transactions. |
| (d) | Includes earnings credits and interest expense, if applicable, each of which is less than 0.01% unless otherwise noted. |
| (e) | Portfolio turnover is calculated by dividing the lesser of total purchases or sales of portfolio securities for the reporting period by the monthly average value of portfolio securities owned during the reporting period. Excluded from both the numerator and denominator are amounts relating to derivatives and securities whose maturities or expiration dates at the time of acquisition were one year or less. |
| (f) | Calculated based upon average shares outstanding. |
| (g) | Amount rounds to less than $0.01. |
SEE NOTES TO FINANCIAL STATEMENTS.
| | | | | | |
| | | |
| 16 | | | | JPMORGAN INSURANCE TRUST | | JUNE 30, 2013 |
| | | | | | | | | | | | | | | | | | | | | | | | | | |
| | | Ratios/Supplemental data | |
| | | | | | | | | | Ratios to average net assets (a) | | | | |
Net asset
value,
end of
period | | | Total
return (b)(c) | | | Net assets,
end of
period | | | Net
expenses (d) | | | Net
investment
income
(loss) | | |
Expenses
without waivers,
reimbursements and
earnings credits | | | Portfolio
turnover
rate (b)(e) | |
| | | | | | | | | | | | | | | | | | | | | | | | | | |
| $ | 13.28 | | | | 13.59 | % | | $ | 58,811,704 | | | | 0.40 | % | | | 1.73 | % | | | 0.55 | % | | | 1 | % |
| | 12.40 | | | | 15.58 | | | | 58,304,693 | | | | 0.40 | | | | 1.90 | | | | 0.53 | | | | 3 | |
| | 10.93 | | | | 1.71 | | | | 67,188,220 | | | | 0.40 | | | | 1.69 | | | | 0.50 | | | | 4 | |
| | 10.93 | | | | 14.41 | | | | 78,874,043 | | | | 0.40 | | | | 1.67 | | | | 0.60 | | | | 11 | |
| | 9.75 | | | | 26.44 | | | | 82,015,865 | | | | 0.40 | | | | 2.25 | | | | 0.62 | | | | 13 | |
| | 7.93 | | | | (37.21 | ) | | | 74,329,183 | | | | 0.40 | | | | 1.95 | | | | 0.52 | | | | 12 | |
SEE NOTES TO FINANCIAL STATEMENTS.
| | | | | | | | |
| | | |
| JUNE 30, 2013 | | JPMORGAN INSURANCE TRUST | | | | | 17 | |
NOTES TO FINANCIAL STATEMENTS
AS OF JUNE 30, 2013 (Unaudited)
1. Organization
JPMorgan Insurance Trust (the “Trust”) is registered under the Investment Company Act of 1940, as amended (the “1940 Act”), as an open-end management investment company and is a Massachusetts business trust.
The following is a separate Portfolio of the Trust (the “Portfolio”) covered by this report:
| | | | |
| | | Classes Offered | | Diversified/Non-Diversified |
| Equity Index Portfolio | | Class 1 | | Diversified |
The investment objective of the Portfolio is to seek investment results that correspond to the aggregate price and dividend performance of securities in the Standard & Poor’s 500 Composite Stock Price Index (S&P 500 Index).
Portfolio shares are offered only to separate accounts of participating insurance companies and Eligible Plans. Individuals may not purchase shares directly from the Portfolio.
2. Significant Accounting Policies
The following is a summary of significant accounting policies followed by the Portfolio in the preparation of its financial statements. The policies are in accordance with accounting principles generally accepted in the United States of America (“GAAP”). The preparation of financial statements requires management to make estimates and assumptions that affect the reported amounts and disclosures in the financial statements. Actual results could differ from those estimates.
A. Valuation of Investments — Equity securities listed on a North American, Central American, South American or Caribbean securities exchange shall generally be valued at the last sale price on the exchange on which the security is principally traded that is reported before the time when the net assets of the Portfolio are valued. Securities listed on the NASDAQ Stock Market LLC are generally valued at the NASDAQ Official Closing Price. Fixed income securities (other than certain short-term investments maturing in less than 61 days) are valued each day based on prices received from independent or affiliated pricing services approved by the Board of Trustees or third party broker-dealers. The pricing services or broker-dealers use multiple valuation techniques to determine fair value. In instances where sufficient market activity exists, the pricing services or broker-dealers may utilize a market-based approach through which quotes from market makers are used to determine fair value. In instances where sufficient market activity may not exist or is limited, the pricing services or broker-dealers also utilize proprietary valuation models which may consider market transactions in comparable securities and the various relationships between securities in determining fair value and/or market characteristics such as benchmark yield curves, option-adjusted spreads, credit spreads, estimated default rates, coupon-rates, anticipated timing of principal repayments, underlying collateral, and other unique security features in order to estimate the relevant cash flows, which are then discounted to calculate the fair values. Generally, short-term investments of sufficient credit quality maturing in less than 61 days are valued at amortized cost, which approximates fair value. Investments in other open-end investment companies are valued at each investment company’s net asset value per share (“NAV”) as of the report date.
Certain investments of the Portfolio may, depending upon market conditions, trade in relatively thin markets and/or in markets that experience significant volatility. As a result of these conditions, the prices used by the Portfolio to value these securities may differ from the value that would be realized if these securities were sold, and the differences could be material. Futures and options are generally valued on the basis of available market quotations. Swaps and other derivatives are valued daily, primarily using independent or affiliated pricing services approved by the Board of Trustees. If valuations are not available from such services or values received are deemed not representative of fair value, values will be obtained from a third party broker-dealer or counterparty.
Securities or other assets for which market quotations are not readily available or for which market quotations are deemed to not represent the fair value of the security or asset at the time of pricing (including certain illiquid securities) are fair valued in accordance with procedures established by and under the supervision and responsibility of the Board of Trustees. The Board of Trustees has established an Audit and Valuation Committee to assist with the oversight of the valuation of the Portfolio’s securities. JPMorgan Funds Management, Inc. (the “Administrator”, or “JPMFM”), an indirect, wholly-owned subsidiary of JPMorgan Chase & Co. (“JPMorgan”), has established a Valuation Committee (“VC”) that is comprised of senior representatives from JPMFM, J.P. Morgan Investment Management Inc. (“JPMIM” or the “Advisor”), a wholly-owned subsidiary of JPMorgan Asset Management Holdings Inc. (“JPMAM”), which is a wholly-owned subsidiary of JPMorgan, JPMorgan’s Legal and Compliance and JPMAM’s Risk Management and the Portfolio’s Chief Compliance Officer. The VC’s responsibilities include making determinations regarding Level 3 fair value measurements (“Fair Values”) and/or providing recommendations for approval to the Board of Trustees’ Audit and Valuation Committee, in accordance with the Portfolio’s valuation policies.
The VC or Board of Trustees, as applicable, primarily employs a market-based approach which may use related or comparable assets or liabilities, recent transactions, market multiples, book values, and other relevant information for the investment to determine the fair value of the investment. The VC or Board of Trustees may also use an income-based valuation approach in which the anticipated future cash flows of the investment are discounted to calculate fair value. Discounts may also be applied due to the nature or duration of any restrictions on the disposition of the investments. Valuations may be based upon current market prices of securities that are comparable in coupon, rating, maturity and industry.
It is possible that the estimated values may differ significantly from the values that would have been used had a ready market for the investments existed, and such differences could be material. JPMFM and JPMIM are responsible for monitoring developments that may impact Fair Values and
| | | | | | |
| | | |
| 18 | | | | JPMORGAN INSURANCE TRUST | | JUNE 30, 2013 |
for discussing and assessing Fair Values on an ongoing, and at least a quarterly, basis with the VC and Board of Trustees, as applicable. The appropriateness of Fair Values is assessed based on results of unchanged price review and consideration of macro or security specific events, back testing and broker and vendor due diligence.
Valuations reflected in this report are as of the report date. As a result, changes in valuation due to market events and/or issuer related events after the report date and prior to issuance of the report, are not reflected herein.
The various inputs that are used in determining the fair value of the Portfolio’s investments are summarized into the three broad levels listed below.
| Ÿ | | Level 1 — quoted prices in active markets for identical securities |
| Ÿ | | Level 2 — other significant observable inputs (including quoted prices for similar securities, interest rates, prepayment speeds, credit risk, etc.) |
| Ÿ | | Level 3 — significant unobservable inputs (including the Portfolio’s own assumptions in determining the fair value of investments) |
A financial instrument’s level within the fair value hierarchy is based on the lowest level of any input, both individually and in the aggregate, that is significant to the fair value measurement. The inputs or methodology used for valuing securities are not necessarily an indication of the risk associated with investing in those securities.
The following table represents each valuation input as presented on the Schedule of Portfolio Investments (“SOI”):
| | | | | | | | | | | | | | | | |
| | | Level 1
Quoted prices | | | Level 2
Other significant
observable inputs | | | Level 3
Significant
unobservable inputs | | | Total | |
Total Investments in Securities (a) | | $ | 58,755,550 | | | $ | 79,997 | | | $ | — | | | $ | 58,835,547 | |
| | | | | | | | | | | | | | | | |
Depreciation in Other Financial Instruments | | | | | | | | | | | | | | | | |
Futures Contracts | | $ | (383 | ) | | $ | — | | | $ | — | | | $ | (383 | ) |
| | | | | | | | | | | | | | | | |
| (a) | All portfolio holdings designated as Level 1 and Level 2 are disclosed individually on the SOI. Level 2 consists of a U.S. Treasury Bill that is held for futures collateral. Please refer to the SOI for industry specifics of portfolio holdings. |
There were no transfers between any levels during the six months ended June 30, 2013.
B. Futures Contracts — The Portfolio uses index futures contracts to gain or reduce exposure to its index, maintain liquidity and minimize transaction costs. The Portfolio also buys futures contracts to immediately invest incoming cash in the market or sells futures in response to cash outflows, thereby simulating an invested position in the underlying index while maintaining a cash balance for liquidity. The use of futures contracts exposes the Portfolio to equity price risk.
Futures contracts provide for the delayed delivery of the underlying instrument at a fixed price or are settled for a cash amount based on the change in the value of the underlying instrument at a specific date in the future. Upon entering into a futures contract, the Portfolio is required to deposit with the broker, cash or securities in an amount equal to a certain percentage of the contract amount, which is referred to as the initial margin deposit. Subsequent payments, referred to as variation margin, are made or received by the Portfolio periodically and are based on changes in the market value of open futures contracts. Changes in the market value of open futures contracts are recorded as unrealized appreciation or depreciation in the Statement of Operations. Realized gains or losses, representing the difference between the value of the contract at the time it was opened and the value at the time it was closed, are reported in the Statement of Operations at the closing or expiration of the futures contract. Securities deposited as initial margin are designated in the SOI and cash deposited is recorded on the Statement of Assets and Liabilities. A receivable from and/or a payable to brokers for the daily variation margin is also recorded on the Statement of Assets and Liabilities.
The Portfolio may be subject to the risk that the change in the value of the futures contract may not correlate perfectly with the underlying instrument. Use of long futures contracts subjects the Portfolio to risk of loss in excess of the amounts shown on the Statement of Assets and Liabilities, up to the notional amount of the futures contracts. Use of short futures contracts subjects the Portfolio to unlimited risk of loss. The Portfolio may enter into futures contracts only on exchanges or boards of trade. The exchange or board of trade acts as the counterparty to each futures transaction; therefore, the Portfolio’s credit risk is limited to failure of the exchange or board of trade. Under some circumstances, futures exchanges may establish daily limits on the amount that the price of a futures contract can vary from the previous day’s settlement price, which could effectively prevent liquidation of positions.
The table below discloses the volume of the Portfolio’s futures contracts activity during the six months ended June 30, 2013:
| | | | |
Futures Contracts: | | | | |
Average Notional Balance Long | | $ | 755,351 | |
Ending Notional Balance Long | | | 719,685 | |
| | | | | | | | |
| | | |
| JUNE 30, 2013 | | JPMORGAN INSURANCE TRUST | | | | | 19 | |
NOTES TO FINANCIAL STATEMENTS
AS OF JUNE 30, 2013 (Unaudited) (continued)
C. Investment Transactions with Affiliates — An issuer which is under common control with the Portfolio may be considered an affiliate. For the purposes of the financial statements, the Portfolio assumes the following to be affiliated issuers:
| | | | | | | | | | | | | | | | | | | | | | | | | | | | |
| | | For the six months ended June 30, 2013 | |
| Affiliate | | Value at
December 31,
2012 | | | Purchase
Cost | | | Sales
Proceeds | | | Realized
Gain/(Loss) | | | Dividend
Income | | | Shares at
June 30,
2013 | | | Value at
June 30,
2013 | |
JPMorgan Chase & Co. (Common stock)* | | $ | 753,645 | | | $ | 8,089 | | | $ | 98,319 | | | $ | 28,116 | | | $ | 10,061 | | | | 15,324 | | | $ | 808,954 | |
JPMorgan Liquid Assets Money Market Fund, Institutional Class Shares | | | 806,028 | | | | 6,684,338 | | | | 6,805,051 | | | | — | | | | 205 | | | | 685,315 | | | | 685,315 | |
JPMorgan Prime Money Market Fund, Capital Shares** | | | 35,500 | | | | 2,923 | | | | 38,423 | | | | — | | | | 5 | | | | — | | | | — | |
| | | | | | | | | | | | | | | | | | | | | | | | | | | | |
Total | | $ | 1,595,173 | | | | | | | | | | | $ | 28,116 | | | $ | 10,271 | | | | | | | $ | 1,494,269 | |
| | | | | | | | | | | | | | | | | | | | | | | | | | | | |
| * | Security is included in an index in which the Portfolio, as an index fund, invests. |
| ** | Represents investment of cash collateral related to securities on loan, as described in Note 2.D. Divided income earned from this investment is included in Income from securities lending (net) in the Statement of Operations. |
D. Securities Lending — The Portfolio may lend securities to brokers approved by the Advisor in order to generate additional income. Goldman Sachs Bank USA, doing business as Goldman Sachs Agency Lending (“GSAL”), serves as lending agent for the Portfolio pursuant to a Securities Lending Agreement (the “GSAL Securities Lending Agreement”). The Portfolio receives cash collateral, which is invested in Capital Shares of the JPMorgan Prime Money Market Fund (“Collateral Investments”). Upon termination of the loan, the Portfolio is required to return to the borrower the posted cash collateral. Loans are subject to termination by the Portfolio or the borrower at any time.
Securities lending income is comprised of income earned on Collateral Investments, net amount of a rebate received from or paid to borrowers for use of cash collateral and lending agent fees. This amount is recorded as Income from securities lending (net) on the Statement of Operations. The Portfolio also receives payments from the borrower during the period of the loan, equivalent to dividends and interest earned on the securities loaned, which are recorded as Dividend or Interest income, respectively, on the Statement of Operations.
For the six months ended June 30, 2013, the Portfolio earned $5 from the investment of cash collateral, prior to rebates or fees, in collateral investments as described below.
At the inception of a loan, securities are exchanged for cash collateral equal to at least 102% of the value of the loaned U.S. dollar-denominated securities, plus accrued interest. The GSAL Securities Lending Agreement requires that the loaned securities be marked to market on a daily basis and additional cash collateral is requested from borrowers when the cash received from borrowers becomes less than 102% of the value of loaned securities.
The value of the cash collateral received is recorded as a liability on the Statement of Assets and Liabilities and details of Collateral Investments are disclosed in the SOI. At June 30, 2013, there were no outstanding securities on loan.
The Portfolio bears the risk of loss associated with the Collateral Investments and is not entitled to additional collateral from the borrower to cover any such losses. To the extent that the value of the Collateral Investments declines below the amount owed to a borrower, the Portfolio may incur losses that exceed the amount it earned on lending the security. Upon termination of a loan, the Portfolio may use leverage (borrow money) to repay the borrower for cash collateral posted if the Advisor does not believe that it is prudent to sell the Collateral Investments to fund the payment of this liability.
Securities lending also involves counterparty risks, including the risk that the loaned securities may not be returned in a timely manner or at all. Subject to certain conditions, GSAL has agreed to indemnify the Portfolio from losses resulting from a borrower’s failure to return a loaned security.
The Advisor may waive fees associated with the Portfolio’s investment in JPMorgan Prime Money Market Fund. This amount offsets the administration fees and shareholder servicing fees incurred by JPMorgan Prime Money Market Fund related to the Portfolio’s investment in such fund. A portion of the waiver is voluntary. For the six months ended June 30, 2013, there were no fees waived by Advisor in association with the Portfolio’s investment in JPMorgan Prime Money Market Fund.
E. Security Transactions and Investment Income — Investment transactions are accounted for on the trade date (the date the order to buy or sell is executed). Securities gains and losses are calculated on a specifically identified cost basis. Interest income is determined on the basis of coupon interest accrued using the effective interest method which adjusts for amortization of premiums and accretion of discounts. Dividend income, net of foreign taxes withheld, if any, is recorded on the ex-dividend date or when the Portfolio first learns of the dividend.
F. Allocation of Expenses — Expenses directly attributable to a portfolio are charged directly to that portfolio, while the expenses attributable to more than one portfolio of the Trust are allocated among the respective portfolios.
G. Federal Income Taxes — The Portfolio is treated as a separate taxable entity for Federal income tax purposes. The Portfolio’s policy is to comply with the provisions of the Internal Revenue Code of 1986, as amended (the “Code”), applicable to regulated investment companies and to distribute to shareholders all of its distributable net investment income and net realized gain on investments. Accordingly, no provision for Federal income tax
| | | | | | |
| | | |
| 20 | | | | JPMORGAN INSURANCE TRUST | | JUNE 30, 2013 |
is necessary. The Portfolio is also a segregated portfolio of assets for insurance purposes and intends to comply with the diversification requirements of Subchapter L of the Code. Management has reviewed the Portfolio’s tax positions for all open tax years and has determined that as of June 30, 2013, no liability for income tax is required in the Portfolio’s financial statements for net unrecognized tax benefits. However, management’s conclusions may be subject to future review based on changes in, or the interpretation of, the accounting standards or tax laws and regulations. The Portfolio’s Federal tax returns for the prior three fiscal years remain subject to examination by the Internal Revenue Service.
H. Distributions to Shareholders — Distributions from net investment income and net realized capital gains, if any, are generally declared and paid at least annually. The amount of distributions from net investment income and net realized capital gains is determined in accordance with Federal income tax regulations, which may differ from GAAP. To the extent these “book/tax” differences are permanent in nature (i.e., that they result from other than timing of recognition — “temporary differences”), such amounts are reclassified within the capital accounts based on their Federal tax-basis treatment.
3. Fees and Other Transactions with Affiliates
A. Investment Advisory Fee — Pursuant to the Investment Advisory Agreement, JPMIM supervises the investments of the Portfolio and for such services is paid a fee. The fee is accrued daily and paid monthly based on the Portfolio’s average daily net assets at an annual rate of 0.25%.
The Advisor waived Investment Advisory fees and/or reimbursed expenses as outlined in Note 3.E.
B. Administration Fee — Pursuant to an Administration Agreement, the Administrator provides certain administration services to the Portfolio. In consideration of these services, the Administrator receives a fee accrued daily and paid monthly at an annual rate of 0.15% of the first $25 billion of the average daily net assets of all funds in the J.P. Morgan Funds Complex (excluding certain funds of funds and money market funds) and 0.075% of the average daily net assets in excess of $25 billion of all such funds. For the six months ended June 30, 2013, the annualized effective rate was 0.08% of the Portfolio’s average daily net assets, notwithstanding any fee waivers and/or expense reimbursements.
JPMorgan Chase Bank, N.A. (“JPMCB”), a wholly-owned subsidiary of JPMorgan, serves as the Portfolio’s sub-administrator (the “Sub-administrator”). For its services as Sub-administrator, JPMCB receives a portion of the fees payable to the Administrator.
The Administrator waived Administration fees as outlined in Note 3.E.
C. Distribution Fees — Pursuant to a Distribution Agreement, JPMorgan Distribution Services, Inc. (the “Distributor”), a wholly-owned subsidiary of JPMorgan, serves as the Trust’s exclusive underwriter and promotes and arranges for the sale of the Portfolio’s shares. The Distributor receives no compensation in its capacity as the Portfolio’s underwriter.
D. Custodian and Accounting Fees — JPMCB provides portfolio custody and accounting services to the Portfolio. The amounts paid directly to JPMCB by the Portfolio for custody and accounting services are included in Custodian and accounting fees in the Statement of Operations. Payments to the custodian may be reduced by credits earned by the Portfolio, based on uninvested cash balances held by the custodian. Such earnings credits, if any, are presented separately in the Statement of Operations.
Interest expense, if any, paid to the custodian related to cash overdrafts is included in Interest expense to affiliates in the Statement of Operations.
E. Waivers and Reimbursements — The Advisor and Administrator have contractually agreed to waive fees and/or reimburse the Portfolio to the extent that total annual operating expenses (excluding acquired fund fees and expenses, dividend expenses related to short sales, interest, taxes, expenses related to litigation and potential litigation, extraordinary expenses and expenses related to the Board of Trustees’ deferred compensation plan) exceed 0.40% of the Portfolio’s average daily net assets.
The expense limitation agreements were in effect for the six months ended June 30, 2013. The contractual expense limitation percentage above is in place until at least April 30, 2014.
For the six months ended June 30, 2013, the Portfolio’s service providers waived fees for the Portfolio as follows. None of these parties expect the Portfolio to repay any such waived fees in future years.
| | | | | | | | | | |
| | | Contractual Waivers | |
| | | Investment
Advisory | | Administration | | | Total | |
| | $20,507 | | $ | 25,308 | | | $ | 45,815 | |
Additionally, the Portfolio may invest in one or more money market funds advised by the Advisor or its affiliates. The Advisor, Administrator and the Distributor waive fees in an amount sufficient to offset the respective fees each charges to the affiliated money market fund on the Portfolio’s investment in such affiliated money market fund. A portion of the waiver is voluntary.
The amount of waivers resulting from investments in these money market funds for the six months ended June 30, 2013 (excluding the waiver disclosed in Note 2.D. regarding cash collateral for securities lending invested in JPMorgan Prime Money Market Fund) was $600.
F. Other — Certain officers of the Trust are affiliated with the Advisor, the Administrator and the Distributor. Such officers, with the exception of the Chief Compliance Officer, receive no compensation from the Portfolio for serving in their respective roles.
| | | | | | | | |
| | | |
| JUNE 30, 2013 | | JPMORGAN INSURANCE TRUST | | | | | 21 | |
NOTES TO FINANCIAL STATEMENTS
AS OF JUNE 30, 2013 (Unaudited) (continued)
The Board of Trustees appointed a Chief Compliance Officer to the Portfolio in accordance with Federal securities regulations. The Portfolio, along with other affiliated portfolios, makes reimbursement payments, on a pro-rata basis, to the Administrator for a portion of the fees associated with the Office of the Chief Compliance Officer. Such fees are included in Trustees’ and Chief Compliance Officer’s fees in the Statement of Operations.
The Trust adopted a Trustee Deferred Compensation Plan (the “Plan”) which allows the Independent Trustees to defer the receipt of all or a portion of compensation related to performance of their duties as Trustees. The deferred fees are invested in various J.P. Morgan Funds until distribution in accordance with the Plan.
During the six months ended June 30, 2013, the Portfolio may have purchased securities from an underwriting syndicate in which the principal underwriter or members of the syndicate are affiliated with the Advisor.
The Portfolio may use related party broker-dealers. For the six months ended June 30, 2013, the Portfolio did not incur any brokerage commissions with broker-dealers affiliated with the Advisor.
The Securities and Exchange Commission has granted an exemptive order permitting the Portfolio to engage in principal transactions with J.P. Morgan Securities, Inc., an affiliated broker, involving taxable money market instruments, subject to certain conditions.
4. Investment Transactions
During the six months ended June 30, 2013, purchases and sales of investments (excluding short-term investments) were as follows:
| | | | | | | | |
| | | Purchases
(excluding U.S.
Government) | | | Sales (excluding U.S. Government) | |
| | $ | 768,536 | | | $ | 7,226,949 | |
During the six months ended June 30, 2013, there were no purchases or sales of U.S. Government securities.
5. Federal Income Tax Matters
For Federal income tax purposes, the cost and unrealized appreciation (depreciation) in value of investment securities held at June 30, 2013 were as follows:
| | | | | | | | | | | | | | |
| | | Aggregate
Cost | | Gross Unrealized Appreciation | | | Gross Unrealized Depreciation | | | Net Unrealized
Appreciation
(Depreciation) | |
| | $39,603,036 | | $ | 20,193,795 | | | $ | 961,284 | | | $ | 19,232,511 | |
Under the Regulated Investment Company Modernization Act of 2010 (the “Act”), net capital losses recognized by the Portfolio after December 31, 2010 may get carried forward indefinitely, and retain their character as short-term and/or long-term losses. Prior to the Act, net capital losses incurred by the Portfolio were carried forward for eight years and treated as short-term losses. The Act requires that post-enactment net capital losses be used before pre-enactment net capital losses.
At December 31, 2012, the Portfolio did not have any post-enactment or pre-enactment net capital loss carryforwards.
6. Borrowings
The Trust and JPMCB have entered into a financing arrangement. Under this arrangement, JPMCB provides an unsecured, uncommitted credit facility in the aggregate amount of $100 million to certain of the J.P. Morgan Funds, including the Portfolio. Advances under the arrangement are taken primarily for temporary or emergency purposes, including the meeting of redemption requests that otherwise might require the untimely disposition of securities, and are subject to the Portfolio’s borrowing restrictions. Interest on borrowings is payable at a rate determined by JPMCB at the time of borrowing. This agreement has been extended until November 11, 2013.
The Portfolio had no borrowings outstanding from the unsecured, uncommitted credit facility at June 30, 2013, or at any time during the six months then ended.
Interest expense paid, if any, as a result of borrowings from the unsecured, uncommitted credit facility is included in Interest expense to affiliates in the Statement of Operations.
7. Risks, Concentrations and Indemnifications
In the normal course of business, the Portfolio enters into contracts that contain a variety of representations which provide general indemnifications. The Portfolio’s maximum exposure under these arrangements is unknown. The amount of exposure would depend on future claims that may be made against the Portfolio that have not yet occurred. However, based on experience, the Portfolio expects the risk of loss to be remote.
The Portfolio has several shareholders holding a significant percentage of shares outstanding. Investment activities of these shareholders could have a material impact on the Portfolio.
| | | | | | |
| | | |
| 22 | | | | JPMORGAN INSURANCE TRUST | | JUNE 30, 2013 |
SCHEDULE OF SHAREHOLDER EXPENSES
(Unaudited)
Hypothetical $1,000 Investment
As a shareholder of the Portfolio, you incur ongoing costs: including investment advisory fees, administration fees and other Portfolio expenses. Because the Portfolio is a funding vehicle for Policies and Eligible Plans, you may also incur sales charges and other fees relating to the Policies or Eligible Plans. The examples below are intended to help you understand your ongoing costs (in dollars) of investing in the Portfolio, but not the costs of the Policies or Eligible Plans, and to compare these ongoing costs with the ongoing costs of investing in other mutual funds. The examples assume that you had a $1,000 investment in the Portfolio at the beginning of the reporting period, January 1, 2013, and continued to hold your shares at the end of the reporting period, June 30, 2013.
Actual Expenses
The first line provides information about actual account values and actual expenses. You may use the information in this line, together with the amount you invested, to estimate the expenses that you paid over the period. Simply divide your account value by $1,000 (for example, an $8,600 account value divided by $1,000 = 8.6), then multiply the result by the number in the first line under the heading entitled “Expenses Paid During the Period” to estimate the expenses you paid on your account during this period.
Hypothetical Example for Comparison Purposes
The second line in the table below provides information about hypothetical account values and hypothetical expenses based on the actual expense ratio and an assumed rate of return of 5% per year before expenses, which is not the Portfolio’s actual return. The hypothetical account values and expenses may not be used to estimate the actual ending account balance or expenses you paid for the period. You may use this information to compare the ongoing costs of investing in the Portfolio and other portfolios. To do so, compare this 5% hypothetical example with the 5% hypothetical examples that appear in the shareholder reports of the other funds. Please note that the expenses shown in the table are meant to highlight your ongoing costs only and do not reflect any transaction costs, such as sales charges (loads) or redemption fees or the costs associated with the Policies and Eligible Plans through which the Portfolio is held. Therefore, the second line in the table is useful in comparing ongoing costs only, and will not help you determine the relative total costs of owning different portfolios. In addition, if these transaction costs were included, your costs would have been higher. The examples also assume all dividends and distributions have been reinvested.
| | | | | | | | | | | | | | | | |
| | | Beginning
Account Value,
January 1, 2013 | | | Ending
Account Value
June 30, 2013 | | | Expenses
Paid During
the Period* | | | Annualized
Expense
Ratio | |
Equity Index Portfolio | | | | | | | | | | | | | | | | |
Actual | | $ | 1,000.00 | | | $ | 1,135.90 | | | $ | 2.12 | | | | 0.40 | % |
Hypothetical | | | 1,000.00 | | | | 1,022.81 | | | | 2.01 | | | | 0.40 | |
| * | Expenses are equal to the Portfolio’s annualized expense ratio, multiplied by the average account value over the period, multiplied by 181/365 (to reflect the one-half year period). |
| | | | | | | | |
| | | |
| JUNE 30, 2013 | | JPMORGAN INSURANCE TRUST | | | | | 23 | |
J.P. Morgan Funds are distributed by JPMorgan Distribution Services, Inc., which is an affiliate of JPMorgan Chase & Co. Affiliates of JPMorgan Chase & Co. receive fees for providing various services to the funds.
Contact JPMorgan Distribution Services, Inc. at 1-800-480-4111 for a portfolio prospectus. You can also visit us at www.jpmorganfunds.com. Investors should carefully consider the investment objectives and risk as well as charges and expenses of the mutual fund before investing. The prospectus contains this and other information about the mutual fund. Read the prospectus carefully before investing.
The Portfolio files a complete schedule of its portfolio holdings for the first and third quarters of its fiscal year with the SEC on Form N-Q. The Portfolio’s Forms N-Q are available on the SEC’s website at http://www.sec.gov and may be reviewed and copied at the SEC’s Public Reference Room in Washington, DC. Information on the operation of the SEC’s Public Reference Room may be obtained by calling 1-800-SEC-0330. Shareholders may request the Form N-Q without charge by calling 1-800-480-4111 or by visiting the variable insurance portfolio section of the J.P. Morgan Funds’ website at www.jpmorganfunds.com.
A description of the Portfolio’s policies and procedures with respect to the disclosure of the Portfolio’s holdings is available in the prospectus and Statement of Additional Information.
A copy of proxy policies and procedures is available without charge upon request by calling 1-800-480-4111 and on the Portfolio’s website at www.jpmorganfunds.com. A description of such policies and procedures is on the SEC’s website at www.sec.gov. The Trustees have delegated the authority to vote proxies for securities owned by the Portfolio to the Advisor. A copy of the Portfolio’s voting record for the most recent 12-month period ended June 30 is available on the SEC’s website at www.sec.gov or at the Portfolio’s website at www.jpmorganfunds.com no later than August 31 of each year. The Portfolio’s proxy voting record will include, among other things, a brief description of the matter voted on for each portfolio security, and will state how each vote was cast, for example, for or against the proposal.
| | | | |
| | © JPMorgan Chase & Co., 2013. All rights reserved. June 2013. | | SAN-JPMITEIP-613 |
Semi-Annual Report
JPMorgan Insurance Trust
June 30, 2013 (Unaudited)
JPMorgan Insurance Trust International Equity Portfolio
| | | | |
NOT FDIC INSURED Ÿ NO BANK GUARANTEE Ÿ MAY LOSE VALUE
| | |  | |
CONTENTS
Investments in the Portfolio are not bank deposits or obligations of, or guaranteed or endorsed by, any bank and are not insured or guaranteed by the FDIC, the Federal Reserve Board or any other government agency. You could lose money if you sell when the Portfolio’s share price is lower than when you invested.
Past performance is no guarantee of future performance. The general market views expressed in this report are opinions based on market and other conditions through the end of the reporting period and are subject to change without notice. These views are not intended to predict the future performance of the Portfolio or the securities markets. References to specific securities and their issuers are for illustrative purposes only and are not intended to be, and should not be interpreted as, recommendations to purchase or sell such securities. Such views are not meant as investment advice and may not be relied on as an indication of trading intent on behalf of the Portfolio.
This Portfolio is intended to be a funding vehicle for variable annuity contracts and variable life insurance policies (collectively “Policies”) offered by separate accounts of participating insurance companies. Portfolio shares are also offered through qualified pension and retirement plans (“Eligible Plans”). Individuals may not purchase shares directly from the Portfolio.
Prospective investors should refer to the Portfolio’s prospectus for a discussion of the Portfolio’s investment objective, strategies and risks. Call J.P. Morgan Funds Service Center at 1-800-480-4111 for a prospectus containing more complete information about the Portfolio, including management fees and other expenses. Please read it carefully before investing.
CEO’S LETTER
JULY 26, 2013 (Unaudited)
Dear Shareholder:
While somewhat overshadowed by increased volatility at the end of the reporting period, developed market equities in aggregate posted solid returns for the six months ended June 30, 2013. For much of the period, stocks were supported by solid corporate earnings and robust demand from investors looking to generate higher returns in the low interest rate environment. Despite signaling a potential policy shift in June 2013, the U.S. Federal Reserve (“Fed”) continued to pursue its highly accommodative policies in an attempt to lower unemployment and spur the economy. Central banks overseas also did their part to support their economies. The European Central Bank (“ECB”) remained committed to preserving the euro, as it cut rates and introduced new programs designed to aid struggling euro zone members. Elsewhere, the Bank of Japan stepped up its major asset purchase program as a new pro-growth government came into power late in 2012.
| | |
 | | “We are encouraged by the stock market’s resiliency in the face of recent volatility.” |
Positive investor sentiment was temporarily interrupted, however, in May 2013 when Fed Chairman Bernanke indicated that the central bank may begin to “taper” its asset purchase program later this year. This triggered a sharp decline in global equities, although they quickly regained their footing and have continued to rally in July. All told, U.S. stocks rose sharply during the six months ended June 30, 2013. Overseas, international developed stocks produced more modest gains, while emerging market equities performed poorly given concerns regarding China’s economy and falling commodity prices.
U.S. Treasury Yields Rise Sharply
Talk of Fed tapering negatively impacted the fixed income markets. While U.S. Treasury security yields continued to be low
from a historical perspective, they ended the period sharply higher than when the reporting period began. The yield for 10-year U.S. Treasury securities ended June 30, 2013 at 2.52%, while the yields for 2- and 30-year U.S. Treasury securities finished the reporting period at 0.36% and 3.52%, respectively. Amid the rising interest rate environment, the overall U.S. fixed income market generated a negative return for the reporting period. In contrast, high yield bonds posted a modest gain, while emerging market debt securities fell sharply.
Positive Signs for Stocks
Although the global economy is far from robust, it is still on a growth path. The expansion in the U.S. certainly appears to be sustainable and, while Europe remains in a recession, there are indications that its economy may be bottoming. Elsewhere, pro-growth initiatives in Japan have thus far yielded positive results. While growth in China has moderated, we believe the government has the tools at its disposal to avoid a “hard landing.”
We are encouraged by the stock market’s resiliency in the face of recent volatility. In addition, there have been signs that equity market correlations are decreasing, which could create a more favorable environment for active managers. In addition, given the recent sell-off in the bond market, valuations in a number of fixed income sectors have become more attractive.
On behalf of everyone at J.P. Morgan Asset Management, thank you for your continued support. We look forward to managing your investment needs for years to come. Should you have any questions, please visit www.jpmorganfunds.com or contact the J.P. Morgan Funds Service Center at 1-800-480-4111.
Sincerely yours,

George C.W. Gatch
CEO, Global Funds Management
J.P. Morgan Asset Management
| | | | | | | | |
| | | |
| JUNE 30, 2013 | | JPMORGAN INSURANCE TRUST | | | | | 1 | |
JPMorgan Insurance Trust International Equity Portfolio
PORTFOLIO COMMENTARY
SIX MONTHS ENDED JUNE 30, 2013 (Unaudited)
| | | | |
| REPORTING PERIOD RETURN: | |
| Portfolio (Class 1 Shares)* | | | 0.04% | |
Morgan Stanley Capital International (“MSCI”) Europe, Australasia and Far East (“EAFE”) Index
(net of foreign withholding taxes) | | | 4.10% | |
| |
| Net Assets as of 6/30/2013 | | $ | 31,151,686 | |
INVESTMENT OBJECTIVE**
The JPMorgan Insurance Trust International Equity Portfolio (the “Portfolio”) seeks to provide high total return from a portfolio of equity securities of foreign companies. Total return consists of capital growth and current income.
HOW DID THE MARKET PERFORM?
After generating very strong returns in 2012, international equities rose at a less robust pace during the six-month reporting period ended June 30, 2013. Europe’s economy remained in a recession, with gross domestic product (“GDP”) in the euro zone shrinking for the sixth consecutive quarter during the first quarter of 2013. The European Central Bank remained committed to doing whatever was necessary to preserve the euro currency and kept interest rates low in an effort to boost economic activity. China’s once red-hot economy, which for years grew at or near double-digit rates, is moderating, although still at an enviable pace versus most developed countries. According to China’s finance minister, GDP growth for 2013 as a whole would likely fall into the 6.5% to 7.0% range, well below government targets. Elsewhere, Japan’s economy showed signs of improvement during the reporting period. This was due, in part, to the Bank of Japan’s aggressive initiatives to stimulate growth and end its lengthy deflationary cycle.
The MSCI EAFE Index (net of foreign withholding taxes) (the “Benchmark”) finished the six months ended June 30, 2013 with a 4.10% gain. After producing a positive return for three of the first four months of the reporting period, a large portion of those gains was given back during a sharp sell-off in May and June. This was triggered by concerns regarding moderating global growth and indications that the U.S. Federal Reserve Board may begin to taper its quantitative easing program later this year
WHAT WERE THE MAIN DRIVERS OF THE PORTFOLIO’S PERFORMANCE?
The Portfolio (Class 1 Shares) underperformed the Benchmark for the six months ended June 30, 2013. The Portfolio’s stock selection in the consumer discretionary and financial sectors detracted from relative performance, while stock selection in the health care and materials sectors contributed.
Individual detractors to relative performance included Rio Tinto PLC, Tullow Oil PLC and BHP Billiton, Ltd. Shares in Rio Tinto PLC, a multinational metals and mining company, fell steadily during the period as commodity prices weakened. Tullow Oil PLC, a multinational oil and gas exploration company, fell sharply as several drilling projects yielded disappointing results. Shares of BHP Billiton, Ltd., a multinational mining and petroleum company, also fell amid general weakness in commodity prices.
Individual contributors to relative performance included Kubota Corp., Japan Tobacco, Inc. and Prudential PLC. Kubota Corp., a Japanese company that manufactures tractors and pipes, reported strong gains in revenue and earnings on the back of weaker yen, continued mechanization of agriculture in Asia and a pick-up in North American demand. Japan Tobacco, Inc., a cigarette manufacturing company, raised its projected annual dividend after forecasting record profits. Prudential PLC, a multinational life insurance and financial services company, raised its dividend following a sharp increase in profits.
HOW WAS THE PORTFOLIO POSITIONED?
The portfolio managers focused on stock selection to build a portfolio of international equities. They used bottom-up fundamental research to identify what they believed were attractively priced stocks of well-managed companies with the potential to grow their earnings faster than their industry peers.
| | | | | | |
| | | |
| 2 | | | | JPMORGAN INSURANCE TRUST | | JUNE 30, 2013 |
| | | | | | | | |
| TOP TEN EQUITY HOLDINGS OF THE PORTFOLIO*** | |
| | 1. | | | Royal Dutch Shell plc, Class A (Netherlands) | | | 2.7 | % |
| | 2. | | | HSBC Holdings plc (United Kingdom) | | | 2.7 | |
| | 3. | | | Nestle S.A. (Switzerland) | | | 2.5 | |
| | 4. | | | Novartis AG (Switzerland) | | | 2.2 | |
| | 5. | | | Roche Holding AG (Switzerland) | | | 2.1 | |
| | 6. | | | Standard Chartered plc (United Kingdom) | | | 2.1 | |
| | 7. | | | Toyota Motor Corp. (Japan) | | | 2.0 | |
| | 8. | | | Vodafone Group plc (United Kingdom) | | | 1.9 | |
| | 9. | | | BHP Billiton Ltd. (Australia) | | | 1.9 | |
| | 10. | | | BG Group plc (United Kingdom) | | | 1.9 | |
| | | | |
PORTFOLIO COMPOSITION BY COUNTRY*** | |
| United Kingdom | | | 24.1 | % |
| Japan | | | 18.7 | |
| Switzerland | | | 14.7 | |
| France | | | 12.4 | |
| Germany | | | 9.1 | |
| Netherlands | | | 5.1 | |
| Hong Kong | | | 3.4 | |
| China | | | 3.0 | |
| Australia | | | 2.7 | |
| South Korea | | | 1.5 | |
| Belgium | | | 1.3 | |
| Others (each less than 1.0%) | | | 3.4 | |
| Short-Term Investment | | | 0.6 | |
| * | | The return shown is based on net asset values calculated for shareholder transactions and may differ from the return shown in the financial highlights, which reflects adjustments made to the net asset values in accordance with accounting principles gener- ally accepted in the United States of America. |
| ** | | The advisor seeks to achieve the Portfolio’s objective. There can be no guarantee it will be achieved. |
| *** | | Percentages indicated are based on total investments as of June 30, 2013. The Portfolio’s composition is subject to change. |
| | | | | | | | |
| | | |
| JUNE 30, 2013 | | JPMORGAN INSURANCE TRUST | | | | | 3 | |
JPMorgan Insurance Trust International Equity Portfolio
PORTFOLIO COMMENTARY
SIX MONTHS ENDED JUNE 30, 2013 (Unaudited) (continued)
| | | | | | | | | | | | | | | | | | | | |
AVERAGE ANNUAL TOTAL RETURNS AS OF JUNE 30, 2013 | |
| | | | | |
| | | INCEPTION DATE
OF CLASS | | | 6 MONTH* | | | 1 YEAR | | | 5 YEAR | | | 10 YEAR | |
CLASS 1 SHARES | | | 1/3/95 | | | | 0.04 | % | | | 16.03 | % | | | 0.24 | % | | | 7.01 | % |
CLASS 2 SHARES | | | 4/24/09 | | | | (0.09 | ) | | | 15.71 | | | | 0.03 | | | | 6.90 | |
TEN YEAR PERFORMANCE (6/30/03 TO 6/30/13)
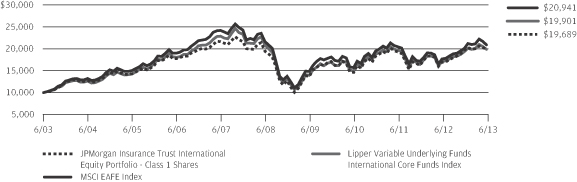
The performance quoted is past performance and is not a guarantee of future results. Mutual Funds are subject to certain market risks. Investment returns and principal value of an investment will fluctuate so that an investor’s shares, when redeemed, may be worth more or less than their original cost. Current performance may be higher or lower than the performance data shown. For up-to-date, month-end performance information please call 1-800-480-4111.
Inception date for Class 1 Shares is January 3, 1995, which is the inception date of JPMorgan International Equity Portfolio (“Predecessor Portfolio”). The JPMorgan Insurance Trust International Equity Portfolio acquired all of the assets and liabilities of the Predecessor Portfolio in a reorganization on April 24, 2009. The Predecessor Portfolio’s performance and financial history have been adopted by the JPMorgan Insurance Trust International Equity Portfolio and have been used since the reorganization. As a result the performance for Class 1 Shares prior to April 25, 2009 is the performance of the Predecessor Portfolio.
Returns for Class 2 Shares prior to its inception date are based on the performance of Class 1 Shares. The actual returns of Class 2 Shares would have been lower than shown because Class 2 Shares have higher expenses than Class 1 Shares and the Predecessor Portfolio.
The graph illustrates comparative performance for $10,000 invested in Class 1 Shares of the JPMorgan Insurance Trust International Equity Portfolio, the MSCI EAFE Index and the Lipper Variable Underlying Funds International Core Funds Index from June 30, 2003 to June 30, 2013. The performance of the Portfolio assumes reinvestment of all dividends and capital gain distributions, if any. The performance of the MSCI EAFE Index does not reflect the deduction of expenses associated with a mutual fund and approximates the minimum possible dividend reinvestment of the securities included in the benchmark.
The dividend is reinvested after deduction of withholding tax, applying the maximum rate to non-resident institutional investors who do not benefit from double taxation treaties. The performance of the Lipper Variable Underlying Funds International Core Funds Index includes expenses associated with a mutual fund, such as investment management fees. These expenses are not identical to the expenses incurred by the Portfolio. The MSCI EAFE Index is a free float-adjusted market capitalization weighted index that is designed to measure the equity market performance of developed markets, excluding U.S. and Canada. The Lipper Variable Underlying Funds International Core Funds Index is an index based on the total returns of certain mutual funds within the Portfolio’s designated category as determined by Lipper, Inc. Investors cannot invest directly in an index.
Portfolio performance does not reflect any charges imposed by the Policies or Eligible Plans. If these charges were included, the returns would be lower than shown. Performance may reflect the waiver of the Portfolio’s fees and reimbursement of expenses for certain periods since the inception date. Without these waivers and reimbursements, performance would have been lower.
International investing involves a greater degree of risk and increased volatility. Changes in currency exchange rates and differences in accounting and taxation policies outside the United States can raise or lower returns. Also, some overseas markets may not be as politically and economically stable as the United States and other nations. The Portfolio may also be subject to the additional risk of “regional” investing, which involves focusing investments in a particular geographic region or regions.
The returns shown are based on net asset values calculated for shareholder transactions and may differ from the returns shown in the financial highlights, which reflect adjustments made to the net asset values in accordance with accounting principles generally accepted in the United States of America.
| | | | | | |
| | | |
| 4 | | | | JPMORGAN INSURANCE TRUST | | JUNE 30, 2013 |
JPMorgan Insurance Trust International Equity Portfolio
SCHEDULE OF PORTFOLIO INVESTMENTS
AS OF JUNE 30, 2013 (Unaudited)
| | | | | | | | |
| SHARES | | | SECURITY DESCRIPTION | | VALUE($) | |
| | | | | | | | |
| Common Stocks — 98.2% | | | | |
| | | | Australia — 2.7% | | | | |
| | 21,160 | | | BHP Billiton Ltd. (m) | | | 609,045 | |
| | 4,697 | | | Rio Tinto Ltd. (m) | | | 225,105 | |
| | | | | | | | |
| | | | 834,150 | |
| | | | | | | | |
| | | | Belgium — 1.3% | |
| | 4,580 | | | Anheuser-Busch InBev N.V. (m) | | | 412,352 | |
| | | | | | | | |
| | | | China — 3.1% | |
| | 402,000 | | | China Construction Bank Corp., Class H (m) | | | 282,493 | |
| | 145,000 | | | CNOOC Ltd. (m) | | | 242,863 | |
| | 438,500 | | | Industrial & Commercial Bank of China Ltd., Class H (m) | | | 274,822 | |
| | 23,000 | | | Ping An Insurance Group Co. of China Ltd., Class H (m) | | | 153,541 | |
| | | | | | | | |
| | | | 953,719 | |
| | | | | | | | |
| | | | France — 12.5% | |
| | 5,993 | | | Accor S.A. (m) | | | 210,658 | |
| | 20,549 | | | AXA S.A. (m) | | | 405,077 | |
| | 5,289 | | | BNP Paribas S.A. (m) | | | 289,547 | |
| | 766 | | | Essilor International S.A. (m) | | | 81,608 | |
| | 3,245 | | | Imerys S.A. (m) | | | 199,241 | |
| | 4,440 | | | Lafarge S.A. (m) | | | 272,630 | |
| | 1,942 | | | LVMH Moet Hennessy Louis Vuitton S.A. (m) | | | 315,292 | |
| | 2,323 | | | Pernod-Ricard S.A. (m) | | | 257,839 | |
| | 1,650 | | | PPR (m) | | | 335,754 | |
| | 4,117 | | | Sanofi (m) | | | 425,618 | |
| | 4,132 | | | Schneider Electric S.A. (m) | | | 300,094 | |
| | 2,960 | | | Technip S.A. (m) | | | 300,832 | |
| | 10,176 | | | Total S.A. (m) | | | 497,028 | |
| | | | | | | | |
| | | | 3,891,218 | |
| | | | | | | | |
| | | | Germany — 7.1% | |
| | 3,100 | | | Allianz SE (m) | | | 452,480 | |
| | 3,910 | | | Bayer AG (m) | | | 416,300 | |
| | 2,670 | | | Fresenius Medical Care AG & Co. KGaA (m) | | | 189,253 | |
| | 1,539 | | | Linde AG (m) | | | 286,789 | |
| | 6,798 | | | SAP AG (m) | | | 496,411 | |
| | 3,500 | | | Siemens AG (m) | | | 354,422 | |
| | | | | | | | |
| | | | 2,195,655 | |
| | | | | | | | |
| | | | Hong Kong — 3.4% | |
| | 67,000 | | | Belle International Holdings Ltd. (m) | | | 91,594 | |
| | 37,000 | | | Cheung Kong Holdings Ltd. (m) | | | 498,924 | |
| | 89,000 | | | Hang Lung Properties Ltd. (m) | | | 308,281 | |
| | 36,400 | | | Sands China Ltd. (m) | | | 170,100 | |
| | | | | | | | |
| | | | 1,068,899 | |
| | | | | | | | |
| | | | | | | | |
| SHARES | | | SECURITY DESCRIPTION | | VALUE($) | |
| | | | | | | | |
| | | | | | | | |
| | | | Indonesia — 0.3% | |
| | 127,500 | | | Astra International Tbk PT (m) | | | 89,631 | |
| | | | | | | | |
| | | | Israel — 0.7% | |
| | 5,930 | | | Teva Pharmaceutical Industries Ltd., ADR (m) | | | 232,456 | |
| | | | | | | | |
| | | | Japan — 18.8% | |
| | 5,900 | | | Astellas Pharma, Inc. (m) | | | 320,512 | |
| | 6,500 | | | Canon, Inc. (m) | | | 213,026 | |
| | 6,300 | | | Daikin Industries Ltd. (m) | | | 254,645 | |
| | 4,400 | | | East Japan Railway Co. (m) | | | 342,463 | |
| | 1,800 | | | FANUC Corp. (m) | | | 260,509 | |
| | 15,000 | | | Honda Motor Co., Ltd. (m) | | | 557,241 | |
| | 13,000 | | | Japan Tobacco, Inc. (m) | | | 458,868 | |
| | 16,500 | | | Komatsu Ltd. (m) | | | 380,027 | |
| | 29,000 | | | Kubota Corp. (m) | | | 422,048 | |
| | 4,500 | | | Makita Corp. (m) | | | 241,930 | |
| | 16,000 | | | Mitsubishi Corp. (m) | | | 273,339 | |
| | 3,000 | | | Nidec Corp. (m) | | | 209,887 | |
| | 2,500 | | | Nitto Denko Corp. (m) | | | 160,339 | |
| | 6,700 | | | Shin-Etsu Chemical Co., Ltd. (m) | | | 443,442 | |
| | 1,400 | | | SMC Corp. (m) | | | 280,666 | |
| | 22,900 | | | Sumitomo Corp. (m) | | | 285,416 | |
| | 10,200 | | | Toyota Motor Corp. (m) | | | 615,242 | |
| | 308 | | | Yahoo! Japan Corp. (m) | | | 151,664 | |
| | | | | | | | |
| | | | 5,871,264 | |
| | | | | | | | |
| | | | Netherlands — 5.1% | |
| | 5,240 | | | Akzo Nobel N.V. (m) | | | 295,672 | |
| | 1,217 | | | ASML Holding N.V. (m) | | | 96,071 | |
| | 37,843 | | | ING Groep N.V., CVA (a) (m) | | | 345,851 | |
| | 26,689 | | | Royal Dutch Shell plc, Class A (m) | | | 852,816 | |
| | | | | | | | |
| | | | 1,590,410 | |
| | | | | | | | |
| | | | South Korea — 1.5% | |
| | 620 | | | Hyundai Mobis (m) | | | 147,605 | |
| | 286 | | | Samsung Electronics Co., Ltd. (m) | | | 334,284 | |
| | | | | | | | |
| | | | 481,889 | |
| | | | | | | | |
| | | | Spain — 0.9% | |
| | 32,445 | | | Banco Bilbao Vizcaya Argentaria S.A. (m) | | | 272,663 | |
| | | | | | | | |
| | | | Sweden — 0.7% | |
| | 9,530 | | | Atlas Copco AB, Class A (m) | | | 229,691 | |
| | | | | | | | |
| | | | Switzerland — 14.9% | |
| | 14,960 | | | ABB Ltd. (a) (m) | | | 324,063 | |
| | 3,060 | | | Cie Financiere Richemont S.A., Class A (m) | | | 269,856 | |
| | 15,550 | | | Credit Suisse Group AG (a) (m) | | | 411,672 | |
| | 53,326 | | | Glencore International plc (m) | | | 220,742 | |
SEE NOTES TO FINANCIAL STATEMENTS.
| | | | | | | | |
| | | |
| JUNE 30, 2013 | | JPMORGAN INSURANCE TRUST | | | | | 5 | |
JPMorgan Insurance Trust International Equity Portfolio
SCHEDULE OF PORTFOLIO INVESTMENTS
AS OF JUNE 30, 2013 (Unaudited) (continued)
| | | | | | | | |
| SHARES | | | SECURITY DESCRIPTION | | VALUE($) | |
| | | | | | | | |
| Common Stocks — Continued | | | | |
| | | | Switzerland — Continued | |
| | 4,101 | | | Holcim Ltd. (a) (m) | | | 285,455 | |
| | 11,962 | | | Nestle S.A. (m) | | | 784,951 | |
| | 9,674 | | | Novartis AG (m) | | | 685,215 | |
| | 2,695 | | | Roche Holding AG (m) | | | 668,892 | |
| | 58 | | | SGS S.A. (m) | | | 124,522 | |
| | 25,229 | | | UBS AG (a) (m) | | | 428,233 | |
| | 1,675 | | | Zurich Insurance Group AG (a) (m) | | | 434,175 | |
| | | | | | | | |
| | | | 4,637,776 | |
| | | | | | | | |
| | | | Taiwan — 0.9% | |
| | 14,557 | | | Taiwan Semiconductor Manufacturing Co., Ltd., ADR (m) | | | 266,684 | |
| | | | | | | | |
| | | | United Kingdom — 24.3% | |
| | 6,600 | | | Aggreko plc (m) | | | 164,964 | |
| | 107,907 | | | Barclays plc (m) | | | 459,548 | |
| | 35,791 | | | BG Group plc (m) | | | 608,234 | |
| | 9,330 | | | British American Tobacco plc (m) | | | 478,532 | |
| | 14,780 | | | Burberry Group plc (m) | | | 304,061 | |
| | 43,679 | | | Centrica plc (m) | | | 238,912 | |
| | 14,343 | | | GlaxoSmithKline plc (m) | | | 358,521 | |
| | 81,366 | | | HSBC Holdings plc (m) | | | 843,381 | |
| | 9,141 | | | Imperial Tobacco Group plc (m) | | | 316,961 | |
| | 40,270 | | | Marks & Spencer Group plc (m) | | | 263,496 | |
| | 29,050 | | | Meggitt plc (m) | | | 228,876 | |
| | 28,899 | | | Prudential plc (m) | | | 471,712 | |
| | 7,378 | | | Rio Tinto plc (m) | | | 300,056 | |
| | 30,784 | | | Standard Chartered plc (m) | | | 668,333 | |
| | 52,278 | | | Tesco plc (m) | | | 263,262 | |
| | 11,330 | | | Tullow Oil plc (m) | | | 172,474 | |
| | 10,432 | | | Unilever plc (m) | | | 422,310 | |
| | 213,978 | | | Vodafone Group plc (m) | | | 613,192 | |
| | 22,843 | | | WPP plc (m) | | | 390,451 | |
| | | | | | | | |
| | | | 7,567,276 | |
| | | | | | | | |
| | | | Total Common Stocks
(Cost $21,229,091) | | | 30,595,733 | |
| | | | | | | | |
| | | | | | | | |
| SHARES | | | SECURITY DESCRIPTION | | VALUE($) | |
| Preferred Stocks — 2.1% | |
| | | | Germany — 2.1% | |
| | 2,330 | | | Henkel AG & Co. KGaA (m) | | | 218,810 | |
| | 2,150 | | | Volkswagen AG (m) | | | 434,265 | |
| | | | | | | | |
| | | | Total Preferred Stocks
(Cost $365,794) | | | 653,075 | |
| | | | | | | | |
NUMBER OF
RIGHTS | | | | | | |
| | | | | | | | |
| Rights — 0.1% | | | | |
| | | | Consumer Staples — 0.1% | | | | |
| | | | Food & Staples Retailing — 0.1% | |
| | 1,650 | | | Groupe Fnac, expiring 05/15/15 (a) (m) (Cost $–) | | | 4,302 | |
| | | | | | | | |
| SHARES | | | | | | |
| Short-Term Investment — 0.6% | | | | |
| | | | Investment Company — 0.6% | | | | |
| | 200,004 | | | JPMorgan Prime Money Market Fund, Institutional Class Shares, 0.030% (b)(l)(m)
(Cost $200,004) | | | 200,004 | |
| | | | | | | | |
| | | | Total Investments — 101.0%
(Cost $21,794,889) | | | 31,453,114 | |
| | | | Liabilities in Excess of Other Assets — (1.0)% | | | (301,428 | ) |
| | | | | | | | |
| | | | NET ASSETS — 100.0% | | $ | 31,151,686 | |
| | | | | | | | |
Percentages indicated are based on net assets.
SEE NOTES TO FINANCIAL STATEMENTS.
| | | | | | |
| | | |
| 6 | | | | JPMORGAN INSURANCE TRUST | | JUNE 30, 2013 |
Summary of Investments by Industry, June 30, 2013
The following table represents the portfolio investments of the Portfolio by industry classifications as a percentage of total investments:
| | | | |
| INDUSTRY | | PERCENTAGE | |
Pharmaceuticals | | | 9.9 | % |
Commercial Banks | | | 9.8 | |
Oil, Gas & Consumable Fuels | | | 7.5 | |
Insurance | | | 6.1 | |
Machinery | | | 5.8 | |
Automobiles | | | 5.4 | |
Metals & Mining | | | 4.3 | |
Tobacco | | | 4.0 | |
Food Products | | | 3.8 | |
Chemicals | | | 3.8 | |
Textiles, Apparel & Luxury Goods | | | 2.8 | |
Capital Markets | | | 2.7 | |
Electrical Equipment | | | 2.7 | |
Real Estate Management & Development | | | 2.6 | |
Construction Materials | | | 2.4 | |
Semiconductors & Semiconductor Equipment | | | 2.2 | |
Beverages | | | 2.1 | |
Wireless Telecommunication Services | | | 1.9 | |
Multiline Retail | | | 1.9 | |
Trading Companies & Distributors | | | 1.8 | |
Software | | | 1.6 | |
Media | | | 1.2 | |
Hotels, Restaurants & Leisure | | | 1.2 | |
Industrial Conglomerates | | | 1.1 | |
Diversified Financial Services | | | 1.1 | |
Road & Rail | | | 1.1 | |
Energy Equipment & Services | | | 1.0 | |
Others (each less than 1.0%) | | | 8.2 | |
NOTES TO SCHEDULE OF PORTFOLIO INVESTMENTS:
| | |
| ADR | | — American Depositary Receipt |
| CVA | | — Dutch Certification |
| (a) | | — Non-income producing security. |
| (b) | | — Investment in affiliate. Money market fund registered under the Investment Company Act of 1940, as amended, and advised by J.P. Morgan Investment Management Inc. |
| (l) | | — The rate shown is the current yield as of June 30, 2013. |
| (m) | | — All or a portion of this security is reserved and/or pledged with the custodian for current or potential holdings of futures, swaps, options, TBAs, when-issued securities, delayed delivery securities, reverse repurchase agreements, unfunded commitments and/or forward foreign currency exchange contracts. |
The value and percentage, based on total investments, of the investments that apply the fair valuation policy for the international investments described in Note 2.A. are $30,753,969 which amounts to 97.8% of total investments.
SEE NOTES TO FINANCIAL STATEMENTS.
| | | | | | | | |
| | | |
| JUNE 30, 2013 | | JPMORGAN INSURANCE TRUST | | | | | 7 | |
STATEMENT OF ASSETS AND LIABILITIES
AS OF JUNE 30, 2013 (Unaudited)
| | | | |
| | | International
Equity Portfolio | |
ASSETS: | |
Investments in non-affiliates, at value | | $ | 31,253,110 | |
Investments in affiliates, at value | | | 200,004 | |
| | | | |
Total investment securities, at value | | | 31,453,114 | |
Cash | | | 11,240 | |
Foreign currency, at value | | | 56,807 | |
Receivables: | | | | |
Investment securities sold | | | 303,766 | |
Portfolio shares sold | | | 17,665 | |
Dividends from non-affiliates | | | 102,112 | |
Dividends from affiliates | | | 4 | |
Tax reclaims | | | 44,037 | |
| | | | |
Total Assets | | | 31,988,745 | |
| | | | |
| |
LIABILITIES: | | | | |
Payables: | | | | |
Investment securities purchased | | | 324,653 | |
Portfolio shares redeemed | | | 430,322 | |
Accrued liabilities: | | | | |
Investment advisory fees | | | 15,969 | |
Administration fees | | | 400 | |
Distribution fees | | | 13 | |
Custodian and accounting fees | | | 16,994 | |
Trustees' and Chief Compliance Officer's fees | | | 13 | |
Other | | | 48,695 | |
| | | | |
Total Liabilities | | | 837,059 | |
| | | | |
Net Assets | | $ | 31,151,686 | |
| | | | |
|
NET ASSETS : | |
Paid-in-capital | | $ | 23,760,199 | |
Accumulated undistributed net investment income | | | 501,714 | |
Accumulated net realized gains (losses) | | | (2,767,557 | ) |
Net unrealized appreciation (depreciation) | | | 9,657,330 | |
| | | | |
Total Net Assets | | $ | 31,151,686 | |
| | | | |
| |
Net Assets: | | | | |
Class 1 | | $ | 31,089,704 | |
Class 2 | | | 61,982 | |
| | | | |
Total | | $ | 31,151,686 | |
| | | | |
| |
Outstanding units of beneficial interest (shares) | | | | |
(unlimited number of shares authorized, no par value): | | | | |
Class 1 | | | 3,013,346 | |
Class 2 | | | 5,944 | |
| |
Net Asset Value, offering and redemption price per share (a): | | | | |
Class 1 | | $ | 10.32 | |
Class 2 | | | 10.43 | |
| |
Cost of investments in non-affiliates | | $ | 21,594,885 | |
Cost of investments in affiliates | | | 200,004 | |
Cost of foreign currency | | | 57,406 | |
| (a) | Per share amounts may not recalculate due to rounding of net assets and/or shares outstanding. |
SEE NOTES TO FINANCIAL STATEMENTS.
| | | | | | |
| | | |
| 8 | | | | JPMORGAN INSURANCE TRUST | | JUNE 30, 2013 |
STATEMENT OF OPERATIONS
FOR THE SIX MONTHS ENDED JUNE 30, 2013 (Unaudited)
| | | | |
| | | International
Equity Portfolio | |
INVESTMENT INCOME: | |
Dividend income from non-affiliates | | $ | 693,738 | |
Dividend income from affiliates | | | 26 | |
Foreign taxes withheld | | | (23,398 | ) |
| | | | |
Total investment income | | | 670,366 | |
| | | | |
| |
EXPENSES: | | | | |
Investment advisory fees | | | 98,347 | |
Administration fees | | | 13,822 | |
Distribution fees: | | | | |
Class 2 | | | 79 | |
Custodian and accounting fees | | | 29,391 | |
Professional fees | | | 26,565 | |
Trustees' and Chief Compliance Officer's fees | | | 186 | |
Printing and mailing costs | | | 9,645 | |
Transfer agent fees | | | 3,307 | |
Other | | | 3,721 | |
| | | | |
Total expenses | | | 185,063 | |
| | | | |
Less amounts waived | | | (16,228 | ) |
| | | | |
Net expenses | | | 168,835 | |
| | | | |
Net investment income (loss) | | | 501,531 | |
| | | | |
| |
REALIZED/UNREALIZED GAINS (LOSSES): | | | | |
Net realized gain (loss) on transactions from: | | | | |
Investments in non-affiliates | | | 418,212 | |
Foreign currency transactions | | | (7,980 | ) |
| | | | |
Net realized gains (losses) | | | 410,232 | |
| | | | |
Change in net unrealized appreciation/depreciation of: | | | | |
Investments in non-affiliates | | | (824,385 | ) |
Foreign currency translations | | | (1,096 | ) |
| | | | |
Change in net unrealized appreciation/depreciation | | | (825,481 | ) |
| | | | |
Net realized/unrealized gains (losses) | | | (415,249 | ) |
| | | | |
Change in net assets resulting from operations | | $ | 86,282 | |
| | | | |
SEE NOTES TO FINANCIAL STATEMENTS.
| | | | | | | | |
| | | |
| JUNE 30, 2013 | | JPMORGAN INSURANCE TRUST | | | | | 9 | |
STATEMENTS OF CHANGES IN NET ASSETS
FOR THE PERIODS INDICATED
| | | | | | | | |
| | | International Equity Portfolio | |
| | | Six Months Ended
6/30/2013
(Unaudited) | | | Year Ended
12/31/2012 | |
CHANGE IN NET ASSETS RESULTING FROM OPERATIONS: | |
Net investment income (loss) | | $ | 501,531 | | | $ | 639,466 | |
Net realized gain (loss) | | | 410,232 | | | | (254,318 | ) |
Change in net unrealized appreciation/depreciation | | | (825,481 | ) | | | 5,772,708 | |
| | | | | | | | |
Change in net assets resulting from operations | | | 86,282 | | | | 6,157,856 | |
| | | | | | | | |
| | |
DISTRIBUTIONS TO SHAREHOLDERS: | | | | | | | | |
Class 1 | | | | | | | | |
From net investment income | | | (640,625 | ) | | | (709,688 | ) |
Class 2 | | | | | | | | |
From net investment income | | | (1,082 | ) | | | (1,044 | ) |
| | | | | | | | |
Total distributions to shareholders | | | (641,707 | ) | | | (710,732 | ) |
| | | | | | | | |
| | |
CAPITAL TRANSACTIONS: | | | | | | | | |
Change in net assets resulting from capital transactions | | | (1,357,873 | ) | | | (4,119,582 | ) |
| | | | | | | | |
| | |
NET ASSETS: | | | | | | | | |
Change in net assets | | | (1,913,298 | ) | | | 1,327,542 | |
Beginning of period | | | 33,064,984 | | | | 31,737,442 | |
| | | | | | | | |
End of period | | $ | 31,151,686 | | | $ | 33,064,984 | |
| | | | | | | | |
Accumulated undistributed net investment income | | $ | 501,714 | | | $ | 641,890 | |
| | | | | | | | |
| | |
CAPITAL TRANSACTIONS: | | | | | | | | |
Class 1 | | | | | | | | |
Proceeds from shares issued | | $ | 1,596,894 | | | $ | 2,801,328 | |
Distributions reinvested | | | 640,625 | | | | 709,688 | |
Cost of shares redeemed | | | (3,596,474 | ) | | | (7,631,642 | ) |
| | | | | | | | |
Change in net assets resulting from Class 1 capital transactions | | $ | (1,358,955 | ) | | $ | (4,120,626 | ) |
| | | | | | | | |
Class 2 | | | | | | | | |
Proceeds from shares issued | | $ | — | | | $ | 2 | |
Distributions reinvested | | | 1,082 | | | | 1,044 | |
Cost of shares redeemed | | | — | | | | (2 | ) |
| | | | | | | | |
Change in net assets resulting from Class 2 capital transactions | | $ | 1,082 | | | $ | 1,044 | |
| | | | | | | | |
Total change in net assets resulting from capital transactions | | $ | (1,357,873 | ) | | $ | (4,119,582 | ) |
| | | | | | | | |
| | |
SHARE TRANSACTIONS: | | | | | | | | |
Class 1 | | | | | | | | |
Issued | | | 149,119 | | | | 295,263 | |
Reinvested | | | 60,608 | | | | 75,100 | |
Redeemed | | | (337,355 | ) | | | (798,272 | ) |
| | | | | | | | |
Change in Class 1 Shares | | | (127,628 | ) | | | (427,909 | ) |
| | | | | | | | |
Class 2 | | | | | | | | |
Issued | | | — | | | | — | (a) |
Reinvested | | | 102 | | | | 109 | |
Redeemed | | | — | | | | — | (a) |
| | | | | | | | |
Change in Class 2 Shares | | | 102 | | | | 109 | |
| | | | | | | | |
| (a) | Amount rounds to less than 1 (share or dollar). |
SEE NOTES TO FINANCIAL STATEMENTS.
| | | | | | |
| | | |
| 10 | | | | JPMORGAN INSURANCE TRUST | | JUNE 30, 2013 |
THIS PAGE IS INTENTIONALLY LEFT BLANK
| | | | | | | | |
| | | |
| JUNE 30, 2013 | | JPMORGAN INSURANCE TRUST | | | | | 11 | |
FINANCIAL HIGHLIGHTS
FOR THE PERIODS INDICATED
| | | | | | | | | | | | | | | | | | | | | | | | | | | | |
| | | | | | Per share operating performance | |
| | | | | | Investment operations | | | Distributions | |
| | | Net asset
value,
beginning
of period | | | Net
investment
income
(loss) | | | Net realized
and unrealized
gains
(losses) on
investments | | | Total from
investment
operations | | | Net
investment
income | | | Net
realized
gain | | | Total
distributions | |
International Equity Portfolio | | | | | | | | | | | | | | | | | | | | | | | | | | | | |
Class 1 (f) | | | | | | | | | | | | | | | | | | | | | | | | | | | | |
Six Months Ended June 30, 2013 (Unaudited) | | $ | 10.51 | | | $ | 0.16 | (g) | | $ | (0.14 | ) | | $ | 0.02 | | | $ | (0.21 | ) | | $ | — | | | $ | (0.21 | ) |
Year Ended December 31, 2012 | | | 8.88 | | | | 0.19 | (g) | | | 1.65 | | | | 1.84 | | | | (0.21 | ) | | | — | | | | (0.21 | ) |
Year Ended December 31, 2011 | | | 10.17 | | | | 0.19 | (g) | | | (1.30 | ) | | | (1.11 | ) | | | (0.18 | ) | | | — | | | | (0.18 | ) |
Year Ended December 31, 2010 | | | 9.54 | | | | 0.15 | (g) | | | 0.50 | | | | 0.65 | | | | (0.02 | ) | | | — | | | | (0.02 | ) |
Year Ended December 31, 2009 | | | 7.93 | | | | 0.16 | (g) | | | 2.31 | | | | 2.47 | | | | (0.50 | ) | | | (0.36 | ) | | | (0.86 | ) |
Year Ended December 31, 2008 | | | 15.95 | | | | 0.34 | | | | (6.00 | ) | | | (5.66 | ) | | | (0.23 | ) | | | (2.13 | ) | | | (2.36 | ) |
| | | | | | | |
Class 2 | | | | | | | | | | | | | | | | | | | | | | | | | | | | |
Six Months Ended June 30, 2013 (Unaudited) | | | 10.61 | | | | 0.15 | (g) | | | (0.14 | ) | | | 0.01 | | | | (0.19 | ) | | | — | | | | (0.19 | ) |
Year Ended December 31, 2012 | | | 8.96 | | | | 0.16 | (g) | | | 1.67 | | | | 1.83 | | | | (0.18 | ) | | | — | | | | (0.18 | ) |
Year Ended December 31, 2011 | | | 10.26 | | | | 0.17 | (g) | | | (1.31 | ) | | | (1.14 | ) | | | (0.16 | ) | | | — | | | | (0.16 | ) |
Year Ended December 31, 2010 | | | 9.65 | | | | 0.13 | (g) | | | 0.50 | | | | 0.63 | | | | (0.02 | ) | | | — | | | | (0.02 | ) |
April 24, 2009 (i) through December 31, 2009 | | | 6.88 | | | | 0.45 | (g) | | | 2.33 | | | | 2.78 | | | | (0.01 | ) | | | — | | | | (0.01 | ) |
| (a) | Annualized for periods less than one year. |
| (b) | Not annualized for periods less than one year. |
| (c) | Includes adjustments in accordance with accounting principles generally accepted in the United States of America and as such, the net asset values for financial reporting purposes and the returns based upon those net asset values may differ from the net asset values and returns for shareholder transactions. |
| (d) | Includes interest expense, if applicable, each of which is less than 0.01% unless otherwise noted. |
| (e) | Portfolio turnover is calculated by dividing the lesser of total purchases or sales of portfolio securities for the reporting period by the monthly average value of portfolio securities owned during the reporting period. Excluded from both the numerator and denominator are amounts relating to derivatives and securities whose maturities or expiration dates at the time of acquisition were one year or less. |
| (f) | International Equity Portfolio acquired all of the assets and liabilities of JPMorgan International Equity Portfolio ("Predecessor Portfolio") in a reorganization on April 24, 2009. The Predecessor Portfolio's performance and financial history have been adopted by International Equity Portfolio and have been used since the reorganization. As a result, the financial highlight information reflects that of the Predecessor Portfolio for the periods prior to reorganization with International Equity Portfolio. |
| (g) | Calculated based upon average shares outstanding. |
| (h) | Ratios are disproportionate between classes due to the size of net assets and fixed expense. |
| (i) | Because of the reorganization with the Predecessor Portfolio in which the performance and financial history of the International Equity Portfolio was replaced with that of the Predecessor Portfolio, the performance and the financial history began on April 24, 2009. |
SEE NOTES TO FINANCIAL STATEMENTS.
| | | | | | |
| | | |
| 12 | | | | JPMORGAN INSURANCE TRUST | | JUNE 30, 2013 |
| | | | | | | | | | | | | | | | | | | | | | | | | | |
| | | Ratios/Supplemental data | |
| | | | | | | | | | Ratios to average net assets (a) | | | | |
Net asset
value,
end of
period | | | Total
return (b)(c) | | | Net assets,
end of
period | | | Net
expenses (d) | | |
Net
investment
income
(loss) | | | Expenses
without waivers
and reimbursements | | | Portfolio
turnover
rate (b)(e) | |
| | | | | | | | | | | | | | | | | | | | | | | | | | |
| | | | | | | | | | | | | | | | | | | | | | | | | | |
| $ | 10.32 | | | | 0.13 | % | | $ | 31,089,704 | | | | 1.03 | % | | | 3.06 | % | | | 1.13 | % | | | 7 | % |
| | 10.51 | | | | 20.95 | | | | 33,003,010 | | | | 1.03 | | | | 1.97 | | | | 1.20 | | | | 8 | |
| | 8.88 | | | | (11.19 | ) | | | 31,686,069 | | | | 1.03 | | | | 1.94 | | | | 1.11 | | | | 16 | |
| | 10.17 | | | | 6.84 | | | | 39,089,569 | | | | 1.02 | | | | 1.66 | | | | 1.13 | | | | 15 | |
| | 9.54 | | | | 34.91 | | | | 43,938,093 | | | | 1.01 | | | | 2.00 | (h) | | | 1.38 | | | | 13 | |
| | 7.93 | | | | (41.35 | ) | | | 41,741,133 | | | | 1.09 | | | | 2.68 | | | | 1.20 | | | | 21 | |
| | | | | | |
| | | | | | | | | | | | | | | | | | | | | | | | | | |
| | 10.43 | | | | 0.01 | | | | 61,982 | | | | 1.27 | | | | 2.82 | | | | 1.38 | | | | 7 | |
| | 10.61 | | | | 20.67 | | | | 61,974 | | | | 1.27 | | | | 1.70 | | | | 1.45 | | | | 8 | |
| | 8.96 | | | | (11.38 | ) | | | 51,373 | | | | 1.28 | | | | 1.69 | | | | 1.36 | | | | 16 | |
| | 10.26 | | | | 6.56 | | | | 57,983 | | | | 1.27 | | | | 1.39 | | | | 1.38 | | | | 15 | |
| | 9.65 | | | | 40.42 | | | | 54,418 | | | | 1.26 | | | | 8.82 | (h) | | | 1.44 | | | | 13 | |
SEE NOTES TO FINANCIAL STATEMENTS.
| | | | | | | | |
| | | |
| JUNE 30, 2013 | | JPMORGAN INSURANCE TRUST | | | | | 13 | |
NOTES TO FINANCIAL STATEMENTS
AS OF JUNE 30, 2013 (Unaudited)
1. Organization
JPMorgan Insurance Trust (the “Trust”) is registered under the Investment Company Act of 1940, as amended (the “1940 Act”), as an open-end management investment company and is a Massachusetts business trust.
The following is a separate Portfolio of the Trust (the “Portfolio”) covered by this report:
| | | | |
| | | Classes Offered | | Diversified/Non-Diversified |
| International Equity Portfolio | | Class 1 and Class 2 | | Diversified |
The investment objective of the Portfolio is to seek to provide high total return from a portfolio of equity securities of foreign companies. Total return consists of capital growth and current income.
Portfolio shares are offered only to separate accounts of participating insurance companies and Eligible Plans. Individuals may not purchase shares directly from the Portfolio.
All classes of shares have equal rights as to earnings, assets and voting privileges, except that each class may bear different distribution and service fees and each class has exclusive voting rights with respect to its distribution plan and administrative services plan.
2. Significant Accounting Policies
The following is a summary of significant accounting policies followed by the Portfolio in the preparation of its financial statements. The policies are in accordance with accounting principles generally accepted in the United States of America (“GAAP”). The preparation of financial statements requires management to make estimates and assumptions that affect the reported amounts and disclosures in the financial statements. Actual results could differ from those estimates.
A. Valuation of Investments — Equity securities listed on a North American, Central American, South American or Caribbean securities exchange shall generally be valued at the last sale price on the exchange on which the security is principally traded that is reported before the time when the net assets of the Portfolio are valued. Securities listed on the NASDAQ Stock Market LLC are generally valued at the NASDAQ Official Closing Price. Generally, short-term investments of sufficient credit quality maturing in less than 61 days are valued at amortized cost, which approximates fair value. Investments in other open-end investment companies are valued at each investment company’s net asset value per share (“NAV”) as of the report date.
Certain investments of the Portfolio may, depending upon market conditions, trade in relatively thin markets and/or in markets that experience significant volatility. As a result of these conditions, the prices used by the Portfolio to value these securities may differ from the value that would be realized if these securities were sold, and the differences could be material. Futures and options are generally valued on the basis of available market quotations. Swaps and other derivatives are valued daily, primarily using independent or affiliated pricing services approved by the Board of Trustees. If valuations are not available from such services or values received are deemed not representative of fair value, values will be obtained from a third party broker-dealer or counterparty.
Securities or other assets for which market quotations are not readily available or for which market quotations are deemed to not represent the fair value of the security or asset at the time of pricing (including certain illiquid securities) are fair valued in accordance with procedures established by and under the supervision and responsibility of the Board of Trustees. The Board of Trustees has established an Audit and Valuation Committee to assist with the oversight of the valuation of the Portfolio’s securities. JPMorgan Funds Management, Inc. (the “Administrator”, or “JPMFM”), an indirect, wholly-owned subsidiary of JPMorgan Chase & Co. (“JPMorgan”), has established a Valuation Committee (“VC”) that is comprised of senior representatives from JPMFM, J.P. Morgan Investment Management Inc. (“JPMIM” or the “Advisor”), a wholly-owned subsidiary of JPMorgan Asset Management Holdings Inc. (“JPMAM”), which is a wholly-owned subsidiary of JPMorgan, JPMorgan’s Legal and Compliance and JPMAM’s Risk Management and the Portfolio’s Chief Compliance Officer. The VC’s responsibilities include making determinations regarding Level 3 fair value measurements (“Fair Values”) and/or providing recommendations for approval to the Board of Trustees’ Audit and Valuation Committee, in accordance with the Portfolio’s valuation policies.
The VC or Board of Trustees, as applicable, primarily employs a market-based approach which may use related or comparable assets or liabilities, recent transactions, market multiples, book values, and other relevant information for the investment to determine the fair value of the investment. The VC or Board of Trustees may also use an income-based valuation approach in which the anticipated future cash flows of the investment are discounted to calculate fair value. Discounts may also be applied due to the nature or duration of any restrictions on the disposition of the investments. Valuations may be based upon current market prices of securities that are comparable in coupon, rating, maturity and industry. Trading in securities on most foreign exchanges and over-the-counter markets is normally completed before the close of the domestic market and may also take place on days when the domestic market is closed. In accordance with procedures adopted by the Board of Trustees, the Portfolio applies fair value pricing on equity securities on a daily basis, except for North American, Central American, South American and Caribbean equity securities held in its portfolio, by utilizing the quotations of an independent pricing service, unless the Advisor determines that use of another valuation methodology is appropriate. The pricing service uses statistical analyses and quantitative models to adjust local market prices using factors such as subsequent movement and changes in the prices of indices, securities and exchange rates in other markets, in determining fair value as of the time the Portfolio calculates its net asset values.
| | | | | | |
| | | |
| 14 | | | | JPMORGAN INSURANCE TRUST | | JUNE 30, 2013 |
It is possible that the estimated values may differ significantly from the values that would have been used had a ready market for the investments existed, and such differences could be material. JPMFM and JPMIM are responsible for monitoring developments that may impact Fair Values and for discussing and assessing Fair Values on an ongoing, and at least a quarterly, basis with the VC and Board of Trustees, as applicable. The appropriateness of Fair Values is assessed based on results of unchanged price review and consideration of macro or security specific events, back testing and broker and vendor due diligence.
Valuations reflected in this report are as of the report date. As a result, changes in valuation due to market events and/or issuer related events after the report date and prior to issuance of the report are not reflected herein.
The various inputs that are used in determining the fair value of the Portfolio’s investments are summarized into the three broad levels listed below.
| Ÿ | | Level 1 — quoted prices in active markets for identical securities |
| Ÿ | | Level 2 — other significant observable inputs (including quoted prices for similar securities, interest rates, prepayment speeds, credit risk, etc.) |
| Ÿ | | Level 3 — significant unobservable inputs (including the Portfolio’s own assumptions in determining the fair value of investments) |
A financial instrument’s level within the fair value hierarchy is based on the lowest level of any input, both individually and in the aggregate, that is significant to the fair value measurement. The inputs or methodology used for valuing securities are not necessarily an indication of the risk associated with investing in those securities.
The following table represents each valuation input as presented on the Schedule of Portfolio Investments (“SOI”):
| | | | | | | | | | | | | | | | |
| | | Level 1
Quoted prices | | | Level 2
Other significant
observable inputs | | | Level 3
Significant
unobservable inputs | | | Total | |
Total Investments in Securities (a) | | $ | 699,144 | | | $ | 30,753,970 | | | $ | — | | | $ | 31,453,114 | |
| | | | | | | | | | | | | | | | |
| (a) | All portfolio holdings designated as Level 1 and Level 2 are disclosed individually on the SOI. Level 1 consists of a money market mutual fund that is held for daily investments of cash and certain ADRs. Please refer to the SOI for country specifics of portfolio holdings. |
There were no transfers between any levels during the six months ended June 30, 2013.
B. Foreign Currency Translation — The books and records of the Portfolio are maintained in U.S. dollars. Foreign currency amounts are translated into U.S. dollars at the prevailing exchange rates of such currencies against the U.S. dollar. The market value of investment securities and other assets and liabilities are translated at the exchange rate as of the valuation date. Purchases and sales of investment securities, income and expenses are translated at the exchange rate prevailing on the respective dates of such transactions.
Although the net assets of the Portfolio are presented at the foreign exchange rates and market values at the close of the period, the Portfolio does not isolate that portion of the results of operations arising as a result of changes in the foreign exchange rates from the fluctuations arising from changes in the market prices of securities held or sold during the period. Accordingly, such foreign currency gains (losses) are included in the reported net realized and unrealized gains (losses) on investment transactions on the Statement of Operations.
Reported realized foreign currency gains or losses arise from the disposition of foreign currency, purchase of foreign currency in certain countries (such as Brazil) that impose a tax on such purchases, currency gains or losses realized between the trade and settlement dates on securities transactions, and the difference between the amounts of dividends, interest and foreign withholding taxes recorded on the Portfolio’s books on the transaction date and the U.S. dollar equivalent of the amounts actually received or paid. Unrealized foreign currency gains and losses arise from changes (due to changes in the exchange rate) in the value of foreign currency and other assets and liabilities denominated in foreign currencies, which are held at period end.
C. Security Transactions and Investment Income — Investment transactions are accounted for on the trade date (the date the order to buy or sell is executed). Securities gains and losses are calculated on a specifically identified cost basis. Interest income is determined on the basis of coupon interest accrued using the effective interest method which adjusts for amortization of premiums and accretion of discounts. Dividend income, net of foreign taxes withheld, if any, is recorded on the ex-dividend date or when the Portfolio first learns of the dividend.
D. Allocation of Income and Expenses — Expenses directly attributable to a portfolio are charged directly to that portfolio, while the expenses attributable to more than one portfolio of the Trust are allocated among the respective portfolios. In calculating the NAV of each class, investment income, realized and unrealized gains and losses and expenses, other than class specific expenses, are allocated daily to each class of shares based upon the proportion of net assets of each class at the beginning of each day.
E. Federal Income Taxes — The Portfolio is treated as a separate taxable entity for Federal income tax purposes. The Portfolio’s policy is to comply with the provisions of the Internal Revenue Code of 1986, as amended (the “Code”), applicable to regulated investment companies and to distribute to shareholders all of its distributable net investment income and net realized gain on investments. Accordingly, no provision for Federal income tax is necessary. The Portfolio is also a segregated portfolio of assets for insurance purposes and intends to comply with the diversification requirements of Subchapter L of the Code. Management has reviewed the Portfolio’s tax positions for all open tax years and has determined that as of June 30, 2013, no liability for income tax is required in the Portfolio’s financial statements for net unrecognized tax benefits. However,
| | | | | | | | |
| | | |
| JUNE 30, 2013 | | JPMORGAN INSURANCE TRUST | | | | | 15 | |
NOTES TO FINANCIAL STATEMENTS
AS OF JUNE 30, 2013 (Unaudited) (continued)
management’s conclusions may be subject to future review based on changes in, or the interpretation of, the accounting standards or tax laws and regulations. The Portfolio’s Federal tax returns for the prior three fiscal years remain subject to examination by the Internal Revenue Service.
F. Foreign Taxes — The Portfolio may be subject to foreign taxes on income, gains on investments or currency purchases/repatriation, a portion of which may be recoverable. The Portfolio will accrue such taxes and recoveries as applicable, based upon its current interpretation of tax rules and regulations that exist in the markets in which it invests.
G. Distributions to Shareholders — Distributions from net investment income are generally declared and paid at least annually and are declared separately for each class. No class has preferential dividend rights; differences in per share rates are due to differences in separate class expenses. Net realized capital gains, if any, are distributed at least annually. The amount of distributions from net investment income and net realized capital gains is determined in accordance with Federal income tax regulations, which may differ from GAAP. To the extent these “book/tax” differences are permanent in nature (i.e., that they result from other than timing of recognition — “temporary differences”), such amounts are reclassified within the capital accounts based on their Federal tax-basis treatment.
3. Fees and Other Transactions with Affiliates
A. Investment Advisory Fee — Pursuant to the Investment Advisory Agreement, JPMIM supervises the investments of the Portfolio and for such services is paid a fee. The fee is accrued daily and paid monthly based on the Portfolio’s average daily net assets at an annual rate of 0.60%.
The Advisor waived Investment Advisory fees and/or reimbursed expenses as outlined in Note 3.E.
B. Administration Fee — Pursuant to an Administration Agreement, the Administrator provides certain administration services to the Portfolio. In consideration of these services, the Administrator receives a fee accrued daily and paid monthly at an annual rate of 0.15% of the first $25 billion of the average daily net assets of all funds in the J.P. Morgan Funds Complex (excluding certain funds of funds and money market funds) and 0.075% of the average daily net assets in excess of $25 billion of all such funds. For the six months ended June 30, 2013, the annualized effective rate was 0.08% of the Portfolio’s average daily net assets, notwithstanding any fee waivers and/or expense reimbursements.
JPMorgan Chase Bank, N.A. (“JPMCB”), a wholly-owned subsidiary of JPMorgan, serves as the Portfolio’s sub-administrator (the “Sub-administrator”). For its services as Sub-administrator, JPMCB receives a portion of the fees payable to the Administrator.
The Administrator waived Administration fees as outlined in Note 3.E.
C. Distribution Fees — Pursuant to a Distribution Agreement, JPMorgan Distribution Services, Inc. (the “Distributor”), a wholly-owned subsidiary of JPMorgan, serves as the Trust’s exclusive underwriter and promotes and arranges for the sale of the Portfolio’s shares.
The Board of Trustees has adopted a Distribution Plan (the “Distribution Plan”) for Class 2 Shares of the Portfolio in accordance with Rule 12b-1 under the 1940 Act. The Distribution Plan provides that the Portfolio shall pay distribution fees, including payments to the Distributor, at an annual rate of 0.25% of the average daily net assets of Class 2 Shares.
D. Custodian and Accounting Fees — JPMCB provides portfolio custody and accounting services to the Portfolio. The amounts paid directly to JPMCB by the Portfolio for custody and accounting services are included in Custodian and accounting fees in the Statement of Operations. The Portfolio earns interest on uninvested cash balances held by the custodian. Such interest amounts are presented separately in the Statement of Operations.
Interest income, if any, earned on cash balances at the custodian is included in Interest income from affiliates in the Statement of Operations.
Interest expense, if any, paid to the custodian related to cash overdrafts is included in Interest expense to affiliates in the Statement of Operations.
E. Waivers and Reimbursements — The Advisor, Administrator and Distributor (for Class 2 Shares) have contractually agreed to waive fees and/or reimburse the Portfolio to the extent that total annual operating expenses (excluding acquired fund fees and expenses, dividend expenses related to short sales, interest, taxes, expenses related to litigation and potential litigation, extraordinary expenses and expenses related to the Board of Trustees’ deferred compensation plan) exceed the percentages of the Portfolio’s respective average daily net assets as shown in the table below:
| | | | | | |
| | | Class 1 | | Class 2 | |
| | 1.03% | | | 1.28 | % |
The expense limitation agreements were in effect for the six months ended June 30, 2013. The contractual expense limitation percentages in the table above are in place until at least April 30, 2014.
For the six months ended June 30, 2013, the Portfolio’s service providers waived fees for the Portfolio as follows. None of these parties expect the Portfolio to repay any such waived fees in future years.
| | | | | | | | | | | | |
| | | Contractual Waivers | |
| | | Investment Advisory | | | Administration | | | Total | |
| | $ | 2,731 | | | $ | 13,423 | | | $ | 16,154 | |
| | | | | | |
| | | |
| 16 | | | | JPMORGAN INSURANCE TRUST | | JUNE 30, 2013 |
Additionally, the Portfolio may invest in one or more money market funds advised by the Advisor or its affiliates. The Advisor, Administrator and the Distributor waive fees in an amount sufficient to offset the respective fees each charges to the affiliated money market fund on the Portfolio’s investment in such affiliated money market fund. A portion of the waiver is voluntary.
The amount of waivers resulting from investments in these money market funds for the six months ended June 30, 2013 was $74.
F. Other — Certain officers of the Trust are affiliated with the Advisor, the Administrator and the Distributor. Such officers, with the exception of the Chief Compliance Officer, receive no compensation from the Portfolio for serving in their respective roles.
The Board of Trustees appointed a Chief Compliance Officer to the Portfolio in accordance with Federal securities regulations. The Portfolio, along with other affiliated portfolios, makes reimbursement payments, on a pro-rata basis, to the Administrator for a portion of the fees associated with the Office of the Chief Compliance Officer. Such fees are included in Trustees’ and Chief Compliance Officer’s fees in the Statement of Operations.
The Trust adopted a Trustee Deferred Compensation Plan (the “Plan”) which allows the Independent Trustees to defer the receipt of all or a portion of compensation related to performance of their duties as Trustees. The deferred fees are invested in various J.P. Morgan Funds until distribution in accordance with the Plan.
During the six months ended June 30, 2013, the Portfolio may have purchased securities from an underwriting syndicate in which the principal underwriter or members of the syndicate are affiliated with the Advisor.
The Portfolio may use related party broker-dealers. For the six months ended June 30, 2013, the Portfolio incurred $7 in brokerage commissions with broker-dealers affiliated with the Advisor.
The Securities and Exchange Commission has granted an exemptive order permitting the Portfolio to engage in principal transactions with J.P. Morgan Securities, Inc., an affiliated broker, involving taxable money market instruments, subject to certain conditions.
4. Investment Transactions
During the six months ended June 30, 2013, purchases and sales of investments (excluding short-term investments) were as follows:
| | | | | | |
| | | Purchases
(excluding U.S.
Government) | | Sales
(excluding U.S.
Government) | |
| | $2,304,838 | | $ | 3,526,853 | |
During the six months ended June 30, 2013, there were no purchases or sales of U.S. Government securities.
5. Federal Income Tax Matters
For Federal income tax purposes, the cost and unrealized appreciation (depreciation) in value of investment securities held at June 30, 2013 were as follows:
| | | | | | | | | | | | | | | | |
| | | Aggregate Cost | | | Gross Unrealized Appreciation | | | Gross Unrealized Depreciation | | | Net Unrealized Appreciation (Depreciation) | |
| | $ | 21,794,889 | | | $ | 10,528,922 | | | $ | 870,697 | | | $ | 9,658,225 | |
Under the Regulated Investment Company Modernization Act of 2010 (the “Act”), net capital losses recognized by the Portfolio after December 31, 2010, may get carried forward indefinitely, and retain their character as short-term and/or long term losses. Prior to the Act, net capital losses incurred by the Portfolio were carried forward for eight years and treated as short-term losses. The Act requires that post-enactment net capital losses be used before pre-enactment net capital losses.
At December 31, 2012, the Portfolio had post-enactment net long-term capital loss carryforwards of $274,549.
At December 31, 2012, the Portfolio had pre-enactment net capital loss carryforwards, expiring during the year indicated, which are available to offset future realized gains:
| | | | | | | | | | | | |
| | | 2016 | | | 2017 | | | Total | |
| | $ | 959,016 | | | $ | 1,648,388 | * | | $ | 2,607,404 | |
| * | This amount includes $1,648,388 of capital loss carryforwards from business combinations, which may be limited in future years under the Internal Revenue Code Sections 381-384. |
6. Borrowings
The Trust and JPMCB have entered into a financing arrangement. Under this arrangement, JPMCB provides an unsecured, uncommitted credit facility in the aggregate amount of $100 million to certain of the J.P. Morgan Funds, including the Portfolio. Advances under the arrangement are taken primarily for temporary or emergency purposes, including the meeting of redemption requests that otherwise might require the untimely
| | | | | | | | |
| | | |
| JUNE 30, 2013 | | JPMORGAN INSURANCE TRUST | | | | | 17 | |
NOTES TO FINANCIAL STATEMENTS
AS OF JUNE 30, 2013 (Unaudited) (continued)
disposition of securities, and are subject to the Portfolio’s borrowing restrictions. Interest on borrowings is payable at a rate determined by JPMCB at the time of borrowing. This agreement has been extended until November 11, 2013.
The Portfolio had no borrowings outstanding from the unsecured, uncommitted credit facility at June 30, 2013, or at any time during the six months then ended.
Interest expense paid, if any, as a result of borrowings from the unsecured, uncommitted credit facility is included in Interest expense to affiliates in the Statement of Operations.
7. Risks, Concentrations and Indemnifications
In the normal course of business, the Portfolio enters into contracts that contain a variety of representations which provide general indemnifications. The Portfolio’s maximum exposure under these arrangements is unknown. The amount of exposure would depend on future claims that may be made against the Portfolio that have not yet occurred. However, based on experience, the Portfolio expects the risk of loss to be remote.
The Portfolio has several shareholders holding a significant percentage of shares outstanding. Investment activities of these shareholders could have a material impact on the Portfolio.
The Portfolio may have elements of risk not typically associated with investments in the United States of America due to concentrated investments in a limited number of countries or regions, which may vary throughout the period. Such concentrations may subject the Portfolio to additional risks resulting from political or economic conditions in such countries or regions and the possible imposition of adverse governmental laws or currency exchange restrictions could cause the Portfolio’s securities and their markets to be less liquid and their prices to be more volatile than those of comparable U.S. securities.
As of June 30, 2013, substantially all of the Portfolio’s net assets consisted of securities that are denominated in foreign currencies. Changes in currency exchange rates will affect the value of, and investment income from, such securities.
As of June 30, 2013, the Portfolio invested approximately 24.1%, 18.7%, 14.7% and 12.4% of its total investments in issuers in the United Kingdom, Japan, Switzerland and France, respectively.
| | | | | | |
| | | |
| 18 | | | | JPMORGAN INSURANCE TRUST | | JUNE 30, 2013 |
SCHEDULE OF SHAREHOLDER EXPENSES
(Unaudited)
Hypothetical $1,000 Investment
As a shareholder of the Portfolio, you incur ongoing costs, including investment advisory fees, administration fees, distribution fees (for Class 2 Shares) and other Portfolio expenses. Because the Portfolio is a funding vehicle for Policies and Eligible Plans, you may also incur sales charges and other fees relating to the Policies or Eligible Plans. The examples below are intended to help you understand your ongoing costs (in dollars) of investing in the Portfolio, but not the costs of the Policies or Eligible Plans, and to compare these ongoing costs with the ongoing costs of investing in other mutual funds. The examples assume that you had a $1,000 investment in each Class at the beginning of the reporting period, January 1, 2013, and continued to hold your shares at the end of the reporting period, June 30, 2013.
Actual Expenses
For each Class of the Portfolio in the table below, the first line provides information about actual account values and actual expenses. You may use the information in this line, together with the amount you invested, to estimate the expenses that you paid over the period. Simply divide your account value by $1,000 (for example, an $8,600 account value divided by $1,000 = 8.6), then multiply the result by the number in the first line of each Class under the heading entitled “Expenses Paid During the Period” to estimate the expenses you paid on your account during this period.
Hypothetical Example for Comparison Purposes
The second line of each Class in the table below provides information about hypothetical account values and hypothetical expenses based on the Class’ actual expense ratio and an assumed rate of return of 5% per year before expenses, which is not the Class’ actual return. The hypothetical account values and expenses may not be used to estimate the actual ending account balance or expenses you paid for the period. You may use this information to compare the ongoing costs of investing in the Class of the Portfolio and other portfolios. To do so, compare this 5% hypothetical example with the 5% hypothetical examples that appear in the shareholder reports of the other funds. Please note that the expenses shown in the table are meant to highlight your ongoing costs only and do not reflect any transaction costs, such as sales charges (loads) or redemption fees or the costs associated with the Policies and Eligible Plans through which the Portfolio is held. Therefore, the second line for each Class in the table is useful in comparing ongoing costs only, and will not help you determine the relative total costs of owning different portfolios. In addition, if these transaction costs were included, your costs would have been higher. The examples also assume all dividends and distributions have been reinvested.
| | | | | | | | | | | | | | | | |
| | | Beginning
Account Value,
January 1, 2013 | | | Ending
Account Value
June 30, 2013 | | | Expenses
Paid During
the Period* | | | Annualized
Expense
Ratio | |
International Equity Portfolio | | | | | | | | | | | | | | | | |
Class 1 | | | | | | | | | | | | | | | | |
Actual | | $ | 1,000.00 | | | $ | 1,001.30 | | | $ | 5.11 | | | | 1.03 | % |
Hypothetical | | | 1,000.00 | | | | 1,019.69 | | | | 5.16 | | | | 1.03 | |
Class 2 | | | | | | | | | | | | | | | | |
Actual | | | 1,000.00 | | | | 1,000.10 | | | | 6.30 | | | | 1.27 | |
Hypothetical | | | 1,000.00 | | | | 1,018.50 | | | | 6.36 | | | | 1.27 | |
| * | Expenses are equal to each Class' respective annualized expense ratio, multiplied by the average account value over the period, multiplied by 181/365 (to reflect the one-half year period). |
| | | | | | | | |
| | | |
| JUNE 30, 2013 | | JPMORGAN INSURANCE TRUST | | | | | 19 | |
J.P. Morgan Funds are distributed by JPMorgan Distribution Services, Inc., which is an affiliate of JPMorgan Chase & Co. Affiliates of JPMorgan Chase & Co. receive fees for providing various services to the funds.
Contact JPMorgan Distribution Services, Inc. at 1-800-480-4111 for a portfolio prospectus. You can also visit us at www.jpmorganfunds.com. Investors should carefully consider the investment objectives and risk as well as charges and expenses of the mutual fund before investing. The prospectus contains this and other information about the mutual fund. Read the prospectus carefully before investing.
The Portfolio files a complete schedule of its portfolio holdings for the first and third quarters of its fiscal year with the SEC on Form N-Q. The Portfolio’s Forms N-Q are available on the SEC’s website at http://www.sec.gov and may be reviewed and copied at the SEC’s Public Reference Room in Washington, DC. Information on the operation of the SEC’s Public Reference Room may be obtained by calling 1-800-SEC-0330. Shareholders may request the Form N-Q without charge by calling 1-800-480-4111 or by visiting the variable insurance portfolio section of the J.P. Morgan Funds’ website at www.jpmorganfunds.com.
A description of the Portfolio’s policies and procedures with respect to the disclosure of the Portfolio’s holdings is available in the prospectus and Statement of Additional Information.
A copy of proxy policies and procedures is available without charge upon request by calling 1-800-480-4111 and on the Portfolio’s website at www.jpmorganfunds.com. A description of such policies and procedures is on the SEC’s website at www.sec.gov. The Trustees have delegated the authority to vote proxies for securities owned by the Portfolio to the Advisor. A copy of the Portfolio’s voting record for the most recent 12-month period ended June 30 is available on the SEC’s website at www.sec.gov or at the Portfolio’s website at www.jpmorganfunds.com no later than August 31 of each year. The Portfolio’s proxy voting record will include, among other things, a brief description of the matter voted on for each portfolio security, and will state how each vote was cast, for example, for or against the proposal.
| | | | |
| | © JPMorgan Chase & Co., 2013. All rights reserved. June 2013. | | SAN-JPMITIEP-613 |
Semi-Annual Report
JPMorgan Insurance Trust
June 30, 2013 (Unaudited)
JPMorgan Insurance Trust Intrepid Growth Portfolio
| | | | |
NOT FDIC INSURED Ÿ NO BANK GUARANTEE Ÿ MAY LOSE VALUE
| | |  | |
CONTENTS
Investments in the Portfolio are not bank deposits or obligations of, or guaranteed or endorsed by, any bank and are not insured or guaranteed by the FDIC, the Federal Reserve Board or any other government agency. You could lose money if you sell when the Portfolio’s share price is lower than when you invested.
Past performance is no guarantee of future performance. The general market views expressed in this report are opinions based on market and other conditions through the end of the reporting period and are subject to change without notice. These views are not intended to predict the future performance of the Portfolio or the securities markets. References to specific securities and their issuers are for illustrative purposes only and are not intended to be, and should not be interpreted as, recommendations to purchase or sell such securities. Such views are not meant as investment advice and may not be relied on as an indication of trading intent on behalf of the Portfolio.
This Portfolio is intended to be a funding vehicle for variable annuity contracts and variable life insurance policies (collectively “Policies”) offered by separate accounts of participating insurance companies. Portfolio shares are also offered through qualified pension and retirement plans (“Eligible Plans”). Individuals may not purchase shares directly from the Portfolio.
Prospective investors should refer to the Portfolio’s prospectus for a discussion of the Portfolio’s investment objective, strategies and risks. Call J.P. Morgan Funds Service Center at 1-800-480-4111 for a prospectus containing more complete information about the Portfolio, including management fees and other expenses. Please read it carefully before investing.
CEO’S LETTER
JULY 26, 2013 (Unaudited)
Dear Shareholder:
While somewhat overshadowed by increased volatility at the end of the reporting period, developed market equities in aggregate posted solid returns for the six months ended June 30, 2013. For much of the period, stocks were supported by solid corporate earnings and robust demand from investors looking to generate higher returns in the low interest rate environment. Despite signaling a potential policy shift in June 2013, the U.S. Federal Reserve (“Fed”) continued to pursue its highly accommodative policies in an attempt to lower unemployment and spur the economy. Central banks overseas also did their part to support their economies. The European Central Bank (“ECB”) remained committed to preserving the euro, as it cut rates and introduced new programs designed to aid struggling euro zone members. Elsewhere, the Bank of Japan stepped up its major asset purchase program as a new pro-growth government came into power late in 2012.
| | |
 | | “We are encouraged by the stock market’s resiliency in the face of recent volatility.” |
Positive investor sentiment was temporarily interrupted, however, in May 2013 when Fed Chairman Bernanke indicated that the central bank may begin to “taper” its asset purchase program later this year. This triggered a sharp decline in global equities, although they quickly regained their footing and have continued to rally in July. All told, U.S. stocks rose sharply during the six months ended June 30, 2013. Overseas, international developed stocks produced more modest gains, while emerging market equities performed poorly given concerns regarding China’s economy and falling commodity prices.
U.S. Treasury Yields Rise Sharply
Talk of Fed tapering negatively impacted the fixed income markets. While U.S. Treasury security yields continued to be low from
a historical perspective, they ended the period sharply higher than when the reporting period began. The yield for 10-year U.S. Treasury securities ended June 30, 2013 at 2.52%, while the yields for 2- and 30-year U.S. Treasury securities finished the reporting period at 0.36% and 3.52%, respectively. Amid the rising interest rate environment, the overall U.S. fixed income market generated a negative return for the reporting period. In contrast, high yield bonds posted a modest gain, while emerging market debt securities fell sharply.
Positive Signs for Stocks
Although the global economy is far from robust, it is still on a growth path. The expansion in the U.S. certainly appears to be sustainable and, while Europe remains in a recession, there are indications that its economy may be bottoming. Elsewhere, pro-growth initiatives in Japan have thus far yielded positive results. While growth in China has moderated, we believe the government has the tools at its disposal to avoid a “hard landing.”
We are encouraged by the stock market’s resiliency in the face of recent volatility. In addition, there have been signs that equity market correlations are decreasing, which could create a more favorable environment for active managers. In addition, given the recent sell-off in the bond market, valuations in a number of fixed income sectors have become more attractive.
On behalf of everyone at J.P. Morgan Asset Management, thank you for your continued support. We look forward to managing your investment needs for years to come. Should you have any questions, please visit www.jpmorganfunds.com or contact the J.P. Morgan Funds Service Center at 1-800-480-4111.
Sincerely yours,

George C.W. Gatch
CEO, Global Funds Management
J.P. Morgan Asset Management
| | | | | | | | |
| | | |
| JUNE 30, 2013 | | JPMORGAN INSURANCE TRUST | | | | | 1 | |
JPMorgan Insurance Trust Intrepid Growth Portfolio
PORTFOLIO COMMENTARY
SIX MONTHS ENDED JUNE 30, 2013 (Unaudited)
| | | | |
| REPORTING PERIOD RETURN: | |
| Portfolio (Class 1 Shares)* | | | 12.87% | |
| Russell 1000 Growth Index | | | 11.80% | |
| |
| Net Assets as of 6/30/2013 | | | $38,002,852 | |
INVESTMENT OBJECTIVE**
The JPMorgan Insurance Trust Intrepid Growth Portfolio (the “Portfolio”) seeks to provide long-term capital growth.
HOW DID THE MARKET PERFORM?
Despite periods of heightened volatility and a setback in June, the overall U.S. equity market, as measured by the S&P 500 Index (“S&P 500”), generated strong results for the six months ended June 30, 2013. The S&P 500 generated a positive return for each of the first five months of the reporting period. Supporting the market were overall solid corporate profits, improving economic growth and generally robust investor demand. These factors helped the S&P 500 to post several all-time highs over the first five months of 2013. The S&P 500 then reversed course and declined during the last month of the reporting period. This turnaround was triggered by indications that the U.S. Federal Reserve Board (“Fed”) would begin tapering its monthly purchases of bonds — $85 billion of mortgage-backed securities and Treasury securities — if economic conditions continued to improve. This caused interest rates to move sharply higher and both stock and bond prices fell sharply. However, the S&P 500 again rallied in late June, as concerns regarding Fed tapering abated somewhat. All told, large-cap growth stocks, as measured by the Russell 1000 Growth Index (the “Benchmark”) finished the six months ended June 30, 2013 with an 11.80% gain.
WHAT WERE THE MAIN DRIVERS OF THE PORTFOLIO’S PERFORMANCE?
The Portfolio (Class 1 Shares) outperformed the Benchmark for the six months ended June 30, 2013. Stock selection in the industrials and consumer discretionary sectors was the main contributor to the Portfolio’s relative performance. Stock selection in the telecommunication services and energy sectors detracted from relative performance.
Individual contributors to relative performance included Gilead Sciences, Inc., Microsoft Corp. and SeagateTechnology PLC. Shares of Gilead Sciences, Inc., a biotechnology company that discovers, develops and commercializes therapeutics, rose sharply amid positive clinical results for several of its drugs.
Microsoft Corp., a software and technology company, reported strong revenue and earnings in its fiscal third quarter. Shares of Seagate Technology PLC, a manufacturer of hard disk drives for consumer and enterprise computing, rallied after the company raised its revenue forecast.
Individual detractors to relative performance included Eli Lilly & Co., CenturyLink, Inc. and Google, Inc. An overweight in Eli Lilly, a global pharmaceutical company, was detrimental to relative performance as its shares declined during the reporting period. The company instituted layoffs and pay freezes ahead of the pending expiration of key drug patents. Likewise, an overweight in CenturyLink, Inc., which provides communications and data services to residential, business, governmental and wholesale customers, detracted from relative performance as its shares also fell during the reporting period. The Portfolio’s underweight in shares of Google, Inc., the Internet search and technology company, detracted as the company’s shares rallied as spending on Internet search advertising increased.
HOW WAS THE PORTFOLIO POSITIONED?
The JPMorgan Intrepid Investment Team (the “Team”) employs a philosophy that is rooted in behavioral finance, a field of study that emphasizes the importance of human psychology in financial markets. Behavioral finance examines how investor behavior can be affected by emotional biases and reactions. The field theorizes that inefficiencies arise in the stock market because investors are consistently irrational in making many investment decisions.
The Team aims to capitalize on these market inefficiencies by targeting what it believes are attractively valued stocks with strong fundamentals and momentum characteristics, and looking to sell these stocks when they no longer exhibit these criteria. A disciplined quantitative ranking methodology is utilized to identify attractive stocks in each sector, a process that is combined with qualitative research and value-added trading. Portfolios are constructed with limited sector bets so that stock selection is typically the primary driver of relative performance.
During the reporting period, the Portfolio was managed and positioned in accordance with this investment philosophy and process.
| | | | | | |
| | | |
| 2 | | | | JPMORGAN INSURANCE TRUST | | JUNE 30, 2013 |
| | | | | | | | |
| TOP TEN EQUITY HOLDINGS OF THE PORTFOLIO*** | |
| | 1. | | | Microsoft Corp. | | | 4.8 | % |
| | 2. | | | Home Depot, Inc. (The) | | | 2.9 | |
| | 3. | | | Oracle Corp. | | | 2.7 | |
| | 4. | | | Gilead Sciences, Inc. | | | 2.5 | |
| | 5. | | | Amgen, Inc. | | | 2.3 | |
| | 6. | | | Honeywell International, Inc. | | | 2.2 | |
| | 7. | | | Visa, Inc., Class A | | | 2.1 | |
| | 8. | | | Google, Inc., Class A | | | 1.9 | |
| | 9. | | | Altria Group, Inc. | | | 1.8 | |
| | 10. | | | Ingersoll-Rand plc | | | 1.8 | |
| | | | |
PORTFOLIO COMPOSITION BY SECTOR*** | |
| Information Technology | | | 27.5 | % |
| Consumer Discretionary | | | 17.9 | |
| Consumer Staples | | | 12.6 | |
| Health Care | | | 12.5 | |
| Industrials | | | 12.3 | |
| Financials | | | 5.0 | |
| Energy | | | 4.6 | |
| Materials | | | 4.0 | |
| Telecommunication Services | | | 1.9 | |
| Utilities | | | 0.4 | |
| Short-Term Investment | | | 1.3 | |
| * | | The return shown is based on net asset values calculated for shareholder transactions and may differ from the return shown in the financial highlights, which reflects adjustments made to the net asset values in accordance with accounting principles generally accepted in the United States of America. |
| ** | | The advisor seeks to achieve the Portfolio’s objective. There can be no guarantee it will be achieved. |
| *** | | Percentages indicated are based on total investments as of June 30, 2013. The Portfolio’s composition is subject to change. |
| | | | | | | | |
| | | |
| JUNE 30, 2013 | | JPMORGAN INSURANCE TRUST | | | | | 3 | |
JPMorgan Insurance Trust Intrepid Growth Portfolio
PORTFOLIO COMMENTARY
SIX MONTHS ENDED JUNE 30, 2013 (Unaudited) (continued)
| | | | | | | | | | | | | | | | | | | | |
AVERAGE ANNUAL TOTAL RETURNS AS OF JUNE 30, 2013 | |
| | | | | |
| | | INCEPTION DATE
OF CLASS | | | 6 MONTH* | | | 1 YEAR | | | 5 YEAR | | | 10 YEAR | |
CLASS 1 SHARES | | | 8/1/94 | | | | 12.87 | % | | | 18.81 | % | | | 7.16 | % | | | 6.54 | % |
CLASS 2 SHARES | | | 8/16/06 | | | | 12.78 | | | | 18.52 | | | | 6.90 | | | | 6.36 | |
TEN YEAR PERFORMANCE (6/30/03 TO 6/30/13)
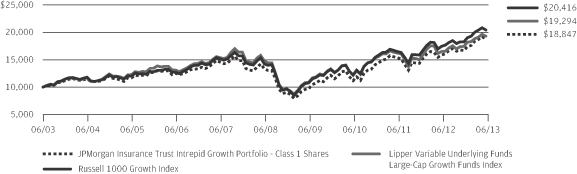
The performance quoted is past performance and is not a guarantee of future results. Mutual funds are subject to certain market risks. Investment returns and principal value of an investment will fluctuate so that an investor’s shares, when redeemed, may be worth more or less than their original cost. Current performance may be higher or lower than the performance data shown. For up-to-date month-end performance information please call 1-800-480-4111. Effective November 1, 2006, the Portfolio’s investment objective and strategies changed. Although past performance is not necessarily an indication of how the Portfolio will perform in the future, in view of these changes, the Portfolio’s performance record prior to this period might be less relevant for investors considering whether to purchase shares of the Portfolio.
Returns for Class 2 Shares prior to its inception date are based on the performance of Class 1 Shares. The actual returns of Class 2 Shares would have been lower than those shown because Class 2 Shares have higher expenses than Class 1 Shares.
The graph illustrates comparative performance for $10,000 invested in Class 1 Shares of the JPMorgan Insurance Trust Intrepid Growth Portfolio, the Russell 1000 Growth Index and the Lipper Variable Underlying Funds Large-Cap Growth Funds Index from June 30, 2003 to June 30, 2013. The performance of the Portfolio assumes reinvestment of all dividends and capital gain distributions, if any. The performance of the Russell 1000 Growth Index does not
reflect the deduction of expenses associated with a mutual fund and has been adjusted to reflect reinvestment of all dividends and capital gain distributions of the securities included in the benchmark, if applicable. The performance of the Lipper Variable Underlying Funds Large-Cap Growth Funds Index includes expenses associated with a mutual fund, such as investment management fees. These expenses are not identical to the expenses incurred by the Portfolio. The Russell 1000 Growth Index is an unmanaged index which measures the performance of those Russell 1000 companies with higher price-to-book ratios and higher forecasted growth values. The Lipper Variable Underlying Funds Large-Cap Growth Funds Index is an index based on the total returns of certain mutual funds within the Portfolio’s designated category as determined by Lipper, Inc. Investors cannot invest directly in an index.
Portfolio performance does not reflect any charges imposed by the Policies or Eligible Plans. If these charges were included, the returns would be lower than shown. Portfolio performance may reflect the waiver of the Portfolio’s fees and reimbursement of expenses for certain periods since the inception date. Without these waivers and reimbursements, performance would have been lower.
The returns shown are based on net asset values calculated for shareholder transactions and may differ from the returns shown in the financial highlights, which reflect adjustments made to the net asset values in accordance with accounting principles generally accepted in the United States of America.
| | | | | | |
| | | |
| 4 | | | | JPMORGAN INSURANCE TRUST | | JUNE 30, 2013 |
JPMorgan Insurance Trust Intrepid Growth Portfolio
SCHEDULE OF PORTFOLIO INVESTMENTS
AS OF JUNE 30, 2013 (Unaudited)
| | | | | | | | |
| SHARES | | | SECURITY DESCRIPTION | | VALUE($) | |
| | | | | | | | |
| Common Stocks — 97.8% | |
| | | | Consumer Discretionary — 17.8% | |
| | | | Auto Components — 0.5% | | | | |
| | 3,700 | | | Delphi Automotive plc, (United Kingdom) | | | 187,553 | |
| | | | | | | | |
| | | | Diversified Consumer Services — 0.8% | |
| | 5,500 | | | H&R Block, Inc. | | | 152,625 | |
| | 7,700 | | | Service Corp. International | | | 138,831 | |
| | | | | | | | |
| | | | | | | 291,456 | |
| | | | | | | | |
| | | | Hotels, Restaurants & Leisure — 2.3% | |
| | 3,000 | | | Bally Technologies, Inc. (a) | | | 169,260 | |
| | 4,600 | | | Brinker International, Inc. | | | 181,378 | |
| | 4,100 | | | Dunkin’ Brands Group, Inc. | | | 175,562 | |
| | 4,000 | | | Six Flags Entertainment Corp. | | | 140,640 | |
| | 2,300 | | | Wyndham Worldwide Corp. | | | 131,629 | |
| | 580 | | | Wynn Resorts Ltd. | | | 74,240 | |
| | | | | | | | |
| | | | | | | 872,709 | |
| | | | | | | | |
| | | | Household Durables — 1.2% | |
| | 3,400 | | | Jarden Corp. (a) | | | 148,750 | |
| | 7,200 | | | PulteGroup, Inc. (a) | | | 136,584 | |
| | 1,800 | | | Tempur Sealy International, Inc. (a) | | | 79,020 | |
| | 900 | | | Whirlpool Corp. | | | 102,924 | |
| | | | | | | | |
| | | | | | | 467,278 | |
| | | | | | | | |
| | | | Internet & Catalog Retail — 2.0% | |
| | 2,400 | | | Expedia, Inc. | | | 144,360 | |
| | 3,600 | | | Liberty Ventures, Series A, (a) | | | 306,036 | |
| | 400 | | | priceline.com, Inc. (a) | | | 330,852 | |
| | | | | | | | |
| | | | | | | 781,248 | |
| | | | | | | | |
| | | | Media — 4.4% | |
| | 10,500 | | | Comcast Corp., Class A | | | 439,740 | |
| | 6,300 | | | DIRECTV (a) | | | 388,206 | |
| | 1,600 | | | Scripps Networks Interactive, Inc., Class A | | | 106,816 | |
| | 2,700 | | | Time Warner Cable, Inc. | | | 303,696 | |
| | 6,200 | | | Viacom, Inc., Class B | | | 421,910 | |
| | | | | | | | |
| | | | | | | 1,660,368 | |
| | | | | | | | |
| | | | Multiline Retail — 1.7% | |
| | 1,800 | | | Dillard’s, Inc., Class A | | | 147,546 | |
| | 10,050 | | | Macy’s, Inc. | | | 482,400 | |
| | | | | | | | |
| | | | | | | 629,946 | |
| | | | | | | | |
| | | | Specialty Retail — 4.5% | |
| | 10,700 | | | Gap, Inc. (The) | | | 446,511 | |
| | 14,200 | | | Home Depot, Inc. (The) | | | 1,100,074 | |
| | 3,100 | | | TJX Cos., Inc. | | | 155,186 | |
| | | | | | | | |
| | | | | | | 1,701,771 | |
| | | | | | | | |
| | | | | | | | |
| SHARES | | | SECURITY DESCRIPTION | | VALUE($) | |
| | | | | | | | |
| | | | | | | | |
| | | | Textiles, Apparel & Luxury Goods — 0.4% | |
| | 3,100 | | | Hanesbrands, Inc. | | | 159,402 | |
| | | | | | | | |
| | | | Total Consumer Discretionary | | | 6,751,731 | |
| | | | | | | | |
| | | | Consumer Staples — 12.5% | |
| | | | Beverages — 3.8% | |
| | 14,700 | | | Coca-Cola Co. (The) | | | 589,617 | |
| | 4,800 | | | Coca-Cola Enterprises, Inc. | | | 168,768 | |
| | 3,000 | | | Molson Coors Brewing Co., Class B | | | 143,580 | |
| | 6,700 | | | PepsiCo, Inc. | | | 547,993 | |
| | | | | | | | |
| | | | | | | 1,449,958 | |
| | | | | | | | |
| | | | Food & Staples Retailing — 2.8% | |
| | 5,500 | | | CVS Caremark Corp. | | | 314,490 | |
| | 6,800 | | | Kroger Co. (The) | | | 234,872 | |
| | 11,600 | | | Walgreen Co. | | | 512,720 | |
| | | | | | | | |
| | | | | | | 1,062,082 | |
| | | | | | | | |
| | | | Food Products — 2.8% | |
| | 4,100 | | | Campbell Soup Co. | | | 183,639 | |
| | 2,800 | | | ConAgra Foods, Inc. | | | 97,804 | |
| | 5,400 | | | General Mills, Inc. | | | 262,062 | |
| | 2,100 | | | Ingredion, Inc. | | | 137,802 | |
| | 1,500 | | | JM Smucker Co. (The) | | | 154,725 | |
| | 2,600 | | | Mead Johnson Nutrition Co. | | | 205,998 | |
| | | | | | | | |
| | | | | | | 1,042,030 | |
| | | | | | | | |
| | | | Household Products — 0.9% | |
| | 3,200 | | | Colgate-Palmolive Co. | | | 183,328 | |
| | 1,550 | | | Energizer Holdings, Inc. | | | 155,790 | |
| | | | | | | | |
| | | | | | | 339,118 | |
| | | | | | | | |
| | | | Personal Products — 0.4% | |
| | 2,700 | | | Nu Skin Enterprises, Inc., Class A | | | 165,024 | |
| | | | | | | | |
| | | | Tobacco — 1.8% | |
| | 19,300 | | | Altria Group, Inc. (m) | | | 675,307 | |
| | | | | | | | |
| | | | Total Consumer Staples | | | 4,733,519 | |
| | | | | | | | |
| | | | Energy — 4.5% | |
| | | | Energy Equipment & Services — 0.6% | |
| | 2,200 | | | Diamond Offshore Drilling, Inc. | | | 151,338 | |
| | 900 | | | Schlumberger Ltd. | | | 64,494 | |
| | | | | | | | |
| | | | | | | 215,832 | |
| | | | | | | | |
| | | | Oil, Gas & Consumable Fuels — 3.9% | |
| | 4,800 | | | Anadarko Petroleum Corp. | | | 412,464 | |
| | 2,134 | | | Chevron Corp. | | | 252,537 | |
| | 3,200 | | | ConocoPhillips | | | 193,600 | |
| | 2,900 | | | Exxon Mobil Corp. | | | 262,015 | |
| | 800 | | | Marathon Petroleum Corp. | | | 56,848 | |
SEE NOTES TO FINANCIAL STATEMENTS.
| | | | | | | | |
| | | |
| JUNE 30, 2013 | | JPMORGAN INSURANCE TRUST | | | | | 5 | |
JPMorgan Insurance Trust Intrepid Growth Portfolio
SCHEDULE OF PORTFOLIO INVESTMENTS
AS OF JUNE 30, 2013 (Unaudited) (continued)
| | | | | | | | |
| SHARES | | | SECURITY DESCRIPTION | | VALUE($) | |
| | | | | | | | |
| Common Stocks — Continued | |
| | | | Oil, Gas & Consumable Fuels — Continued | |
| | 3,900 | | | Oasis Petroleum, Inc. (a) | | | 151,593 | |
| | 700 | | | Phillips 66 | | | 41,237 | |
| | 4,700 | | | Western Refining, Inc. | | | 131,929 | |
| | | | | | | | |
| | | | | | | 1,502,223 | |
| | | | | | | | |
| | | | Total Energy | | | 1,718,055 | |
| | | | | | | | |
| | | | Financials — 4.9% | |
| | | | Capital Markets — 0.3% | |
| | 3,200 | | | American Capital Ltd. (a) | | | 40,544 | |
| | 2,100 | | | Morgan Stanley | | | 51,303 | |
| | | | | | | | |
| | | | | | | 91,847 | |
| | | | | | | | |
| | | | Consumer Finance — 1.5% | |
| | 12,100 | | | Discover Financial Services | | | 576,444 | |
| | | | | | | | |
| | | | Insurance — 0.5% | |
| | 1,300 | | | Prudential Financial, Inc. | | | 94,939 | |
| | 400 | | | RenaissanceRe Holdings Ltd., (Bermuda) | | | 34,716 | |
| | 1,600 | | | Validus Holdings Ltd., (Bermuda) | | | 57,792 | |
| | | | | | | | |
| | | | | | | 187,447 | |
| | | | | | | | |
| | | | Real Estate Investment Trusts (REITs) — 2.2% | |
| | 7,600 | | | American Tower Corp. | | | 556,092 | |
| | 3,900 | | | Extra Space Storage, Inc. | | | 163,527 | |
| | 1,900 | | | Ventas, Inc. | | | 131,974 | |
| | | | | | | | |
| | | | | | | 851,593 | |
| | | | | | | | |
| | | | Thrifts & Mortgage Finance — 0.4% | |
| | 3,900 | | | Ocwen Financial Corp. (a) | | | 160,758 | |
| | | | | | | | |
| | | | Total Financials | | | 1,868,089 | |
| | | | | | | | |
| | | | Health Care — 12.4% | |
| | | | Biotechnology — 6.8% | | | | |
| | 8,750 | | | Amgen, Inc. | | | 863,275 | |
| | 18,300 | | | Gilead Sciences, Inc. (a) | | | 937,143 | |
| | 1,900 | | | Pharmacyclics, Inc. (a) | | | 150,993 | |
| | 8,100 | | | Vertex Pharmaceuticals, Inc. (a) | | | 646,947 | |
| | | | | | | | |
| | | | | | | 2,598,358 | |
| | | | | | | | |
| | | | Health Care Equipment & Supplies — 0.4% | |
| | 4,500 | | | CareFusion Corp. (a) | | | 165,825 | |
| | | | | | | | |
| | | | Health Care Providers & Services — 1.7% | |
| | 2,800 | | | AmerisourceBergen Corp. | | | 156,324 | |
| | 2,200 | | | Centene Corp. (a) | | | 115,412 | |
| | 3,900 | | | Express Scripts Holding Co. (a) | | | 240,591 | |
| | 1,500 | | | Omnicare, Inc. | | | 71,565 | |
| | 600 | | | WellPoint, Inc. | | | 49,104 | |
| | | | | | | | |
| | | | | | | 632,996 | |
| | | | | | | | |
| | | | | | | | |
| SHARES | | | SECURITY DESCRIPTION | | VALUE($) | |
| | | | | | | | |
| | | | | | | | |
| | | | Pharmaceuticals — 3.5% | |
| | 3,900 | | | AbbVie, Inc. (m) | | | 161,226 | |
| | 11,600 | | | Eli Lilly & Co. | | | 569,792 | |
| | 21,000 | | | Pfizer, Inc. | | | 588,210 | |
| | | | | | | | |
| | | | | | | 1,319,228 | |
| | | | | | | | |
| | | | Total Health Care | | | 4,716,407 | |
| | | | | | | | |
| | | | Industrials — 12.1% | |
| | | | Aerospace & Defense — 3.4% | |
| | 10,500 | | | Honeywell International, Inc. | | | 833,070 | |
| | 1,800 | | | Huntington Ingalls Industries, Inc. | | | 101,664 | |
| | 4,500 | | | Northrop Grumman Corp. | | | 372,600 | |
| | | | | | | | |
| | | | | | | 1,307,334 | |
| | | | | | | | |
| | | | Air Freight & Logistics — 0.9% | |
| | 3,800 | | | United Parcel Service, Inc., Class B | | | 328,624 | |
| | | | | | | | |
| | | | Airlines — 0.8% | |
| | 10,800 | | | Delta Air Lines, Inc. (a) | | | 202,068 | |
| | 4,000 | | | United Continental Holdings, Inc. (a) | | | 125,160 | |
| | | | | | | | |
| | | | | | | 327,228 | |
| | | | | | | | |
| | | | Commercial Services & Supplies — 0.6% | |
| | 10,800 | | | Pitney Bowes, Inc. | | | 158,544 | |
| | 4,700 | | | R.R. Donnelley & Sons Co. | | | 65,847 | |
| | | | | | | | |
| | | | | | | 224,391 | |
| | | | | | | | |
| | | | Construction & Engineering — 0.8% | |
| | 4,400 | | | AECOM Technology Corp. (a) (m) | | | 139,876 | |
| | 2,600 | | | Chicago Bridge & Iron Co. N.V., (Netherlands) | | | 155,116 | |
| | | | | | | | |
| | | | | | | 294,992 | |
| | | | | | | | |
| | | | Industrial Conglomerates — 0.8% | | | | |
| | 4,700 | | | Danaher Corp. | | | 297,510 | |
| | | | | | | | |
| | | | Machinery — 3.8% | | | | |
| | 12,100 | | | Ingersoll-Rand plc, (Ireland) | | | 671,792 | |
| | 1,100 | | | Middleby Corp. (a) | | | 187,099 | |
| | 2,400 | | | Oshkosh Corp. (a) | | | 91,128 | |
| | 2,300 | | | Parker Hannifin Corp. | | | 219,420 | |
| | 3,091 | | | Pentair Ltd., (Switzerland) | | | 178,320 | |
| | 1,200 | | | Stanley Black & Decker, Inc. | | | 92,760 | |
| | | | | | | | |
| | | | | | | 1,440,519 | |
| | | | | | | | |
| | | | Professional Services — 0.4% | | | | |
| | 1,500 | | | Dun & Bradstreet Corp. (The) | | | 146,175 | |
| | | | | | | | |
| | | | Road & Rail — 0.6% | | | | |
| | 1,600 | | | Union Pacific Corp. | | | 246,848 | |
| | | | | | | | |
| | | | Total Industrials | | | 4,613,621 | |
| | | | | | | | |
SEE NOTES TO FINANCIAL STATEMENTS.
| | | | | | |
| | | |
| 6 | | | | JPMORGAN INSURANCE TRUST | | JUNE 30, 2013 |
| | | | | | | | |
| SHARES | | | SECURITY DESCRIPTION | | VALUE($) | |
| | | | | | | | |
| Common Stocks — Continued | |
| | | | Information Technology — 27.3% | |
| | | | Communications Equipment — 1.9% | |
| | 24,200 | | | Cisco Systems, Inc. | | | 588,302 | |
| | 2,050 | | | QUALCOMM, Inc. | | | 125,214 | |
| | | | | | | | |
| | | | | | | 713,516 | |
| | | | | | | | |
| | | | Computers & Peripherals — 3.7% | |
| | 605 | | | Apple, Inc. | | | 239,628 | |
| | 8,400 | | | Hewlett-Packard Co. | | | 208,320 | |
| | 4,000 | | | NetApp, Inc. (a) | | | 151,120 | |
| | 14,200 | | | Seagate Technology plc, (Ireland) | | | 636,586 | |
| | 2,600 | | | Western Digital Corp. | | | 161,434 | |
| | | | | | | | |
| | | | | | | 1,397,088 | |
| | | | | | | | |
| | | | Internet Software & Services — 3.6% | |
| | 3,800 | | | AOL, Inc. (a) (m) | | | 138,624 | |
| | 800 | | | Google, Inc., Class A (a) | | | 704,296 | |
| | 20,400 | | | Yahoo!, Inc. (a) | | | 512,244 | |
| | | | | | | | |
| | | | | | | 1,355,164 | |
| | | | | | | | |
| | | | IT Services — 4.9% | |
| | 950 | | | Alliance Data Systems Corp. (a) (m) | | | 171,979 | |
| | 3,300 | | | Computer Sciences Corp. | | | 144,441 | |
| | 5,600 | | | CoreLogic, Inc. (a) | | | 129,752 | |
| | 2,400 | | | International Business Machines Corp. | | | 458,664 | |
| | 3,400 | | | NeuStar, Inc., Class A (a) | | | 165,512 | |
| | 4,400 | | | Visa, Inc., Class A | | | 804,100 | |
| | | | | | | | |
| | | | | | | 1,874,448 | |
| | | | | | | | |
| | | | Semiconductors & Semiconductor Equipment — 3.2% | |
| | 8,600 | | | Applied Materials, Inc. | | | 128,226 | |
| | 8,000 | | | Avago Technologies Ltd., (Singapore) | | | 299,040 | |
| | 3,300 | | | Broadcom Corp., Class A | | | 111,408 | |
| | 2,200 | | | Freescale Semiconductor Ltd. (a) | | | 29,810 | |
| | 7,900 | | | Lam Research Corp. (a) | | | 350,286 | |
| | 7,300 | | | ON Semiconductor Corp. (a) | | | 58,984 | |
| | 6,000 | | | Xilinx, Inc. | | | 237,660 | |
| | | | | | | | |
| | | | | | | 1,215,414 | |
| | | | | | | | |
| | | | Software — 10.0% | |
| | 4,200 | | | Adobe Systems, Inc. (a) (m) | | | 191,352 | |
| | 5,100 | | | Aspen Technology, Inc. (a) | | | 146,829 | |
| | 52,400 | | | Microsoft Corp. | | | 1,809,372 | |
| | 32,640 | | | Oracle Corp. | | | 1,002,701 | |
| | 6,200 | | | Rovi Corp. (a) | | | 141,608 | |
| | 23,100 | | | Symantec Corp. | | | 519,057 | |
| | | | | | | | |
| | | | | | | 3,810,919 | |
| | | | | | | | |
| | | | Total Information Technology | | | 10,366,549 | |
| | | | | | | | |
| | | | | | | | |
| SHARES | | | SECURITY DESCRIPTION | | VALUE($) | |
| | | | | | | | |
| | | | | | | | |
| | | | Materials — 4.0% | |
| | | | Chemicals — 3.6% | |
| | 900 | | | CF Industries Holdings, Inc. | | | 154,350 | |
| | 6,400 | | | LyondellBasell Industries N.V., (Netherlands), Class A | | | 424,064 | |
| | 4,100 | | | Monsanto Co. | | | 405,080 | |
| | 2,639 | | | PPG Industries, Inc. | | | 386,376 | |
| | | | | | | | |
| | | | | | | 1,369,870 | |
| | | | | | | | |
| | | | Containers & Packaging — 0.4% | |
| | 3,200 | | | Silgan Holdings, Inc. | | | 150,272 | |
| | | | | | | | |
| | | | Total Materials | | | 1,520,142 | |
| | | | | | | | |
| | | | Telecommunication Services — 1.9% | |
| | | | Diversified Telecommunication Services — 1.9% | |
| | 14,800 | | | AT&T, Inc. (m) | | | 523,920 | |
| | 5,402 | | | CenturyLink, Inc. | | | 190,961 | |
| | | | | | | | |
| | | | Total Telecommunication Services | | | 714,881 | |
| | | | | | | | |
| | | | Utilities — 0.4% | |
| | | | Gas Utilities — 0.4% | |
| | 4,100 | | | UGI Corp. | | | 160,351 | |
| | | | | | | | |
| | | | Total Common Stocks
(Cost $31,006,330) | | | 37,163,345 | |
| | | | | | | | |
| Short-Term Investment — 1.3% | |
| | | | Investment Company — 1.3% | |
| | 488,440 | | | JPMorgan Liquid Assets Money Market Fund, Institutional Class Shares,
0.030% (b) (l) (m)
(Cost $488,440) | | | 488,440 | |
| | | | | | | | |
| | | | Total Investments — 99.1%
(Cost $31,494,770) | | | 37,651,785 | |
| | | | Other Assets in Excess of
Liabilities — 0.9% | | | 351,067 | |
| | | | | | | | |
| | | | NET ASSETS — 100.0% | | $ | 38,002,852 | |
| | | | | | | | |
Percentages indicated are based on net assets.
SEE NOTES TO FINANCIAL STATEMENTS.
| | | | | | | | |
| | | |
| JUNE 30, 2013 | | JPMORGAN INSURANCE TRUST | | | | | 7 | |
JPMorgan Insurance Trust Intrepid Growth Portfolio
SCHEDULE OF PORTFOLIO INVESTMENTS
AS OF JUNE 30, 2013 (Unaudited) (continued)
| | | | | | | | | | | | | | | | |
| Futures Contracts | |
NUMBER OF
CONTRACTS | | | DESCRIPTION | | EXPIRATION
DATE | | | NOTIONAL
VALUE AT
06/30/13 | | | NET
UNREALIZED
APPRECIATION
(DEPRECIATION) | |
| | | | Long Futures Outstanding | | | | | | | | | | | | |
| | 11 | | | E-mini S&P 500 | | | 09/20/13 | | | $ | 879,615 | | | $ | (1,507 | ) |
| | | | | | | | | | | | | | | | |
NOTES TO SCHEDULE OF PORTFOLIO INVESTMENTS:
| | |
| (a) | | — Non-income producing security. |
| (b) | | — Investment in affiliate. Money market fund registered under the Investment Company Act of 1940, as amended, and advised by J.P. Morgan Investment Management Inc. |
| (l) | | — The rate shown is the current yield as of June 30, 2013. |
| | |
| (m) | | — All or a portion of this security is reserved and/or pledged with the custodian for current or potential holdings of futures, swaps, options, TBAs, when-issued securities, delayed delivery securities, reverse repurchase agreements, unfunded commitments and/or forward foreign currency exchange contracts. |
SEE NOTES TO FINANCIAL STATEMENTS.
| | | | | | |
| | | |
| 8 | | | | JPMORGAN INSURANCE TRUST | | JUNE 30, 2013 |
STATEMENT OF ASSETS AND LIABILITIES
AS OF JUNE 30, 2013 (Unaudited)
| | | | |
| | |
Intrepid Growth
Portfolio | |
ASSETS: | | | | |
Investments in non-affiliates, at value | | $ | 37,163,345 | |
Investments in affiliates, at value | | | 488,440 | |
| | | | |
Total investment securities, at value | | | 37,651,785 | |
Deposits at broker for futures contracts | | | 90,000 | |
Receivables: | | | | |
Investment securities sold | | | 2,087,535 | |
Portfolio shares sold | | | 6,058 | |
Dividends from non-affiliates | | | 25,232 | |
Dividends from affiliates | | | 26 | |
| | | | |
Total Assets | | | 39,860,636 | |
| | | | |
| |
LIABILITIES: | | | | |
Payables: | | | | |
Investment securities purchased | | | 1,768,512 | |
Portfolio shares redeemed | | | 15,511 | |
Variation margin on futures contracts | | | 2,403 | |
Accrued liabilities: | | | | |
Investment advisory fees | | | 19,778 | |
Distribution fees | | | 5 | |
Custodian and accounting fees | | | 7,602 | |
Trustees’ and Chief Compliance Officer’s fees | | | 92 | |
Other | | | 43,881 | |
| | | | |
Total Liabilities | | | 1,857,784 | |
| | | | |
Net Assets | | $ | 38,002,852 | |
| | | | |
| |
NET ASSETS: | | | | |
Paid-in-Capital | | $ | 47,766,318 | |
Accumulated undistributed net investment income | | | 154,397 | |
Accumulated net realized gains (losses) | | | (16,073,371 | ) |
Net unrealized appreciation (depreciation) | | | 6,155,508 | |
| | | | |
Total Net Assets | | $ | 38,002,852 | |
| | | | |
| |
Net Assets: | | | | |
Class 1 | | $ | 37,980,774 | |
Class 2 | | | 22,078 | |
| | | | |
Total | | $ | 38,002,852 | |
| | | | |
| |
Outstanding units of beneficial interest (shares)
(unlimited number of shares authorized, no par value): | | | | |
Class 1 | | | 1,932,961 | |
Class 2 | | | 1,125 | |
| |
Net Asset Value, offering and redemption price per share (a): | | | | |
Class 1 | | $ | 19.65 | |
Class 2 | | | 19.62 | |
| | | | |
| |
Cost of investments in non-affiliates | | $ | 31,006,330 | |
Cost of investments in affiliates | | | 488,440 | |
| (a) | Per share amounts may not recalculate due to rounding of net assets and/or shares outstanding. |
SEE NOTES TO FINANCIAL STATEMENTS.
| | | | | | | | |
| | | |
| JUNE 30, 2013 | | JPMORGAN INSURANCE TRUST | | | | | 9 | |
STATEMENT OF OPERATIONS
FOR THE SIX MONTHS ENDED JUNE 30, 2013 (Unaudited)
| | | | |
| | |
Intrepid Growth
Portfolio | |
INVESTMENT INCOME: | | | | |
Dividend income from non-affiliates | | $ | 316,895 | |
Dividend income from affiliates | | | 228 | |
| | | | |
Total investment income | | | 317,123 | |
| | | | |
| |
EXPENSES: | | | | |
Investment advisory fees | | | 120,731 | |
Administration fees | | | 15,661 | |
Distribution fees — Class 2 | | | 27 | |
Custodian and accounting fees | | | 14,329 | |
Professional fees | | | 24,472 | |
Trustees’ and Chief Compliance Officer’s fees | | | 210 | |
Printing and mailing costs | | | 8,823 | |
Transfer agent fees | | | 2,266 | |
Other | | | 4,009 | |
| | | | |
Total expenses | | | 190,528 | |
| | | | |
Less amounts waived | | | (24,102 | ) |
| | | | |
Net expenses | | | 166,426 | |
| | | | |
Net investment income (loss) | | | 150,697 | |
| | | | |
| |
REALIZED/UNREALIZED GAINS (LOSSES): | | | | |
Net realized gain (loss) on transactions from: | | | | |
Investments in non-affiliates | | | 3,060,037 | |
Futures | | | 59,968 | |
| | | | |
Net realized gains (losses) | | | 3,120,005 | |
| | | | |
Change in net unrealized appreciation/depreciation of: | | | | |
Investments in non-affiliates | | | 1,155,577 | |
Futures | | | (59 | ) |
| | | | |
Change in net unrealized appreciation/depreciation | | | 1,155,518 | |
| | | | |
Net realized/unrealized gains (losses) | | | 4,275,523 | |
| | | | |
Change in net assets resulting from operations | | $ | 4,426,220 | |
| | | | |
SEE NOTES TO FINANCIAL STATEMENTS.
| | | | | | |
| | | |
| 10 | | | | JPMORGAN INSURANCE TRUST | | JUNE 30, 2013 |
STATEMENTS OF CHANGES IN NET ASSETS
FOR THE PERIODS INDICATED
| | | | | | | | |
| | | Intrepid Growth Portfolio | |
| | | Six Months Ended
6/30/2013
(Unaudited) | | | Year Ended
12/31/2012 | |
CHANGE IN NET ASSETS RESULTING FROM OPERATIONS: | | | | | | | | |
Net investment income (loss) | | $ | 150,697 | | | $ | 411,101 | |
Net realized gain (loss) | | | 3,120,005 | | | | 3,036,996 | |
Change in net unrealized appreciation/depreciation | | | 1,155,518 | | | | 2,520,271 | |
| | | | | | | | |
Change in net assets resulting from operations | | | 4,426,220 | | | | 5,968,368 | |
| | | | | | | | |
| | |
DISTRIBUTIONS TO SHAREHOLDERS: | | | | | | | | |
Class 1 | | | | | | | | |
From net investment income | | | (401,033 | ) | | | (279,331 | ) |
Class 2 | | | | | | | | |
From net investment income | | | (188 | ) | | | (90 | ) |
| | | | | | | | |
Total distributions to shareholders | | | (401,221 | ) | | | (279,421 | ) |
| | | | | | | | |
| | |
CAPITAL TRANSACTIONS: | | | | | | | | |
Change in net assets resulting from capital transactions | | | (1,341,934 | ) | | | (8,355,185 | ) |
| | | | | | | | |
| | |
NET ASSETS: | | | | | | | | |
Change in net assets | | | 2,683,065 | | | | (2,666,238 | ) |
Beginning of period | | | 35,319,787 | | | | 37,986,025 | |
| | | | | | | | |
End of period | | $ | 38,002,852 | | | $ | 35,319,787 | |
| | | | | | | | |
Accumulated undistributed net investment income | | $ | 154,397 | | | $ | 404,921 | |
| | | | | | | | |
| | |
CAPITAL TRANSACTIONS: | | | | | | | | |
Class 1 | | | | | | | | |
Proceeds from shares issued | | $ | 1,998,150 | | | $ | 3,631,249 | |
Distributions reinvested | | | 401,033 | | | | 273,331 | |
Cost of shares redeemed | | | (3,741,305 | ) | | | (12,265,855 | ) |
| | | | | | | | |
Change in net assets resulting from Class 1 capital transactions | | $ | (1,342,122 | ) | | $ | (8,355,275 | ) |
| | | | | | | | |
Class 2 | | | | | | | | |
Distributions reinvested | | $ | 188 | | | $ | 90 | |
| | | | | | | | |
Change in net assets resulting from Class 2 capital transactions | | $ | 188 | | | $ | 90 | |
| | | | | | | | |
Total change in net assets resulting from capital transactions | | $ | (1,341,934 | ) | | $ | (8,355,185 | ) |
| | | | | | | | |
| | |
SHARE TRANSACTIONS: | | | | | | | | |
Class 1 | | | | | | | | |
Issued | | | 101,008 | | | | 214,321 | |
Reinvested | | | 20,909 | | | | 16,568 | |
Redeemed | | | (195,062 | ) | | | (716,074 | ) |
| | | | | | | | |
Change in Class 1 Shares | | | (73,145 | ) | | | (485,185 | ) |
| | | | | | | | |
Class 2 | | | | | | | | |
Reinvested | | | 10 | | | | 5 | |
| | | | | | | | |
Change in Class 2 Shares | | | 10 | | | | 5 | |
| | | | | | | | |
SEE NOTES TO FINANCIAL STATEMENTS.
| | | | | | | | |
| | | |
| JUNE 30, 2013 | | JPMORGAN INSURANCE TRUST | | | | | 11 | |
FINANCIAL HIGHLIGHTS
FOR THE PERIODS INDICATED
| | | | | | | | | | | | | | | | | | | | |
| | | Per share operating performance | |
| | | | | | Investment operations | | | Distributions | |
| | | Net asset
value,
beginning
of period | | | Net
investment
income
(loss) | | | Net realized
and unrealized
gains
(losses) on
investments | | | Total from
investment
operations | | | Net
investment
income | |
Intrepid Growth Portfolio | | | | | | | | | | | | | | | | | | | | |
Class 1 | | | | | | | | | | | | | | | | | | | | |
Six Months Ended June 30, 2013 (Unaudited) | | $ | 17.60 | | | $ | 0.08 | (f) | | $ | 2.18 | | | $ | 2.26 | | | $ | (0.21 | ) |
Year Ended December 31, 2012 | | | 15.24 | | | | 0.18 | (f)(g) | | | 2.30 | | | | 2.48 | | | | (0.12 | ) |
Year Ended December 31, 2011 | | | 15.14 | | | | 0.10 | (f) | | | 0.16 | | | | 0.26 | | | | (0.16 | ) |
Year Ended December 31, 2010 | | | 13.13 | | | | 0.13 | (f) | | | 2.01 | | | | 2.14 | | | | (0.13 | ) |
Year Ended December 31, 2009 | | | 9.86 | | | | 0.12 | | | | 3.23 | | | | 3.35 | | | | (0.08 | ) |
Year Ended December 31, 2008 | | | 16.37 | | | | 0.09 | | | | (6.47 | ) | | | (6.38 | ) | | | (0.13 | ) |
| | | | | |
Class 2 | | | | | | | | | | | | | | | | | | | | |
Six Months Ended June 30, 2013 (Unaudited) | | | 17.55 | | | | 0.05 | (f) | | | 2.19 | | | | 2.24 | | | | (0.17 | ) |
Year Ended December 31, 2012 | | | 15.21 | | | | 0.15 | (f)(g) | | | 2.27 | | | | 2.42 | | | | (0.08 | ) |
Year Ended December 31, 2011 | | | 15.11 | | | | 0.07 | (f) | | | 0.15 | | | | 0.22 | | | | (0.12 | ) |
Year Ended December 31, 2010 | | | 13.12 | | | | 0.10 | (f) | | | 1.99 | | | | 2.09 | | | | (0.10 | ) |
Year Ended December 31, 2009 | | | 9.84 | | | | 0.08 | | | | 3.25 | | | | 3.33 | | | | (0.05 | ) |
Year Ended December 31, 2008 | | | 16.33 | | | | 0.04 | | | | (6.44 | ) | | | (6.40 | ) | | | (0.09 | ) |
| (a) | Annualized for periods less than one year. |
| (b) | Not annualized for periods less than one year. |
| (c) | Includes adjustments in accordance with accounting principles generally accepted in the United States of America and as such, the net asset values for financial reporting purposes and the returns based upon those net asset values may differ from the net asset values and returns for shareholder transactions. |
| (d) | Includes earnings credits and interest expense, if applicable, each of which is less than 0.01% unless otherwise noted. |
| (e) | Portfolio turnover is calculated by dividing the lesser of total purchases or sales of portfolio securities for the reporting period by the monthly average value of portfolio securities owned during the reporting period. Excluded from both the numerator and denominator are amounts relating to derivatives and securities whose maturities or expiration dates at the time of acquisition were one year or less. |
| (f) | Calculated based upon average shares outstanding. |
| (g) | Reflects special dividends paid out during the period by several of the Portfolio’s holdings. Had the Portfolio not received the special dividends, the net investment income (loss) per share would have been $0.13 and $0.11 for Class 1 and Class 2 Shares, respectively, and the net investment income (loss) ratio would have been 0.85% and 0.63% for Class 1 and Class 2 Shares, respectively. |
SEE NOTES TO FINANCIAL STATEMENTS.
| | | | | | |
| | | |
| 12 | | | | JPMORGAN INSURANCE TRUST | | JUNE 30, 2013 |
| | | | | | | | | | | | | | | | | | | | | | | | | | |
| | | Ratios/Supplemental data | |
| | | | | | | | | | Ratios to average net assets (a) | | | | |
Net asset
value,
end of
period | | | Total return (b)(c) | | | Net assets,
end of
period | | | Net
expenses (d) | | | Net
investment
income
(loss) | | | Expenses
without waivers,
reimbursements and
earnings credits | | | Portfolio
turnover
rate (b)(e) | |
| | | | | | | | | | | | | | | | | | | | | | | | | | |
| | | | | | | | | | | | | | | | | | | | | | | | | | |
| $ | 19.65 | | | | 12.87 | % | | $ | 37,980,774 | | | | 0.90 | % | | | 0.81 | % | | | 1.03 | % | | | 40 | % |
| | 17.60 | | | | 16.30 | | | | 35,300,206 | | | | 0.89 | | | | 1.07 | (g) | | | 1.02 | | | | 70 | |
| | 15.24 | | | | 1.65 | | | | 37,969,142 | | | | 0.89 | | | | 0.67 | | | | 1.00 | | | | 121 | |
| | 15.14 | | | | 16.33 | | | | 45,426,077 | | | | 0.90 | | | | 0.95 | | | | 1.02 | | | | 126 | |
| | 13.13 | | | | 34.32 | | | | 50,786,376 | | | | 0.90 | | | | 0.96 | | | | 1.07 | | | | 134 | |
| | 9.86 | | | | (39.22 | ) | | | 46,462,195 | | | | 0.90 | | | | 0.54 | | | | 0.94 | | | | 132 | |
| | | | | | |
| | | | | | | | | | | | | | | | | | | | | | | | | | |
| | 19.62 | | | | 12.78 | | | | 22,078 | | | | 1.15 | | | | 0.55 | | | | 1.28 | | | | 40 | |
| | 17.55 | | | | 15.94 | | | | 19,581 | | | | 1.14 | | | | 0.85 | (g) | | | 1.27 | | | | 70 | |
| | 15.21 | | | | 1.44 | | | | 16,883 | | | | 1.15 | | | | 0.43 | | | | 1.25 | | | | 121 | |
| | 15.11 | | | | 15.96 | | | | 16,645 | | | | 1.15 | | | | 0.72 | | | | 1.27 | | | | 126 | |
| | 13.12 | | | | 34.03 | | | | 14,354 | | | | 1.15 | | | | 0.70 | | | | 1.32 | | | | 134 | |
| | 9.84 | | | | (39.36 | ) | | | 10,713 | | | | 1.15 | | | | 0.30 | | | | 1.19 | | | | 132 | |
SEE NOTES TO FINANCIAL STATEMENTS.
| | | | | | | | |
| | | |
| JUNE 30, 2013 | | JPMORGAN INSURANCE TRUST | | | | | 13 | |
NOTES TO FINANCIAL STATEMENTS
AS OF JUNE 30, 2013 (Unaudited)
1. Organization
JPMorgan Insurance Trust (the “Trust”) is registered under the Investment Company Act of 1940, as amended (the “1940 Act”), as an open-end management investment company and is a Massachusetts business trust.
The following is a separate Portfolio of the Trust (the “Portfolio”) covered by this report:
| | | | |
| | | Classes Offered | | Diversified/Non-Diversified |
| Intrepid Growth Portfolio | | Class 1 and Class 2 | | Diversified |
The investment objective of the Portfolio is to provide long-term capital growth.
Portfolio shares are offered only to separate accounts of participating insurance companies and Eligible Plans. Individuals may not purchase shares directly from the Portfolio.
All classes of shares have equal rights as to earnings, assets and voting privileges, except that each class may bear different distribution and service fees and each class has exclusive voting rights with respect to its distribution plan and administrative services plan.
2. Significant Accounting Policies
The following is a summary of significant accounting policies followed by the Portfolio in the preparation of its financial statements. The policies are in accordance with accounting principles generally accepted in the United States of America (“GAAP”). The preparation of financial statements requires management to make estimates and assumptions that affect the reported amounts and disclosures in the financial statements. Actual results could differ from those estimates.
A. Valuation of Investments — Equity securities listed on a North American, Central American, South American or Caribbean securities exchange shall generally be valued at the last sale price on the exchange on which the security is principally traded that is reported before the time when the net assets of the Portfolio are valued. Securities listed on the NASDAQ Stock Market LLC are generally valued at the NASDAQ Official Closing Price. Generally, short-term investments of sufficient credit quality maturing in less than 61 days are valued at amortized cost, which approximates fair value. Investments in other open-end investment companies are valued at each investment company’s net asset value per share (“NAV”) as of the report date.
Certain investments of the Portfolio may, depending upon market conditions, trade in relatively thin markets and/or in markets that experience significant volatility. As a result of these conditions, the prices used by the Portfolio to value these securities may differ from the value that would be realized if these securities were sold, and the differences could be material. Futures and options are generally valued on the basis of available market quotations. Swaps and other derivatives are valued daily, primarily using independent or affiliated pricing services approved by the Board of Trustees. If valuations are not available from such services or values received are deemed not representative of fair value, values will be obtained from a third party broker-dealer or counterparty.
Securities or other assets for which market quotations are not readily available or for which market quotations are deemed to not represent the fair value of the security or asset at the time of pricing (including certain illiquid securities) are fair valued in accordance with procedures established by and under the supervision and responsibility of the Board of Trustees. The Board of Trustees has established an Audit and Valuation Committee to assist with the oversight of the valuation of the Portfolio’s securities. JPMorgan Funds Management, Inc. (the “Administrator”, or “JPMFM”), an indirect, wholly-owned subsidiary of JPMorgan Chase & Co. (“JPMorgan”), has established a Valuation Committee (“VC”) that is comprised of senior representatives from JPMFM, J.P. Morgan Investment Management Inc. (“JPMIM” or the “Advisor”), a wholly-owned subsidiary of JPMorgan Asset Management Holdings Inc. (“JPMAM”), which is a wholly-owned subsidiary of JPMorgan, JPMorgan’s Legal and Compliance and JPMAM’s Risk Management and the Portfolio’s Chief Compliance Officer. The VC’s responsibilities include making determinations regarding Level 3 fair value measurements (“Fair Values”) and/or providing recommendations for approval to the Board of Trustees’ Audit and Valuation Committee, in accordance with the Portfolio’s valuation policies.
The VC or Board of Trustees, as applicable, primarily employs a market-based approach which may use related or comparable assets or liabilities, recent transactions, market multiples, book values, and other relevant information for the investment to determine the fair value of the investment. The VC or Board of Trustees may also use an income-based valuation approach in which the anticipated future cash flows of the investment are discounted to calculate fair value. Discounts may also be applied due to the nature or duration of any restrictions on the disposition of the investments. Valuations may be based upon current market prices of securities that are comparable in coupon, rating, maturity and industry.
It is possible that the estimated values may differ significantly from the values that would have been used had a ready market for the investments existed, and such differences could be material. JPMFM and JPMIM are responsible for monitoring developments that may impact Fair Values and for discussing and assessing Fair Values on an ongoing, and at least a quarterly, basis with the VC and Board of Trustees, as applicable. The appropriateness of Fair Values is assessed based on results of unchanged price review and consideration of macro or security specific events, back testing and broker and vendor due diligence.
Valuations reflected in this report are as of the report date. As a result, changes in valuation due to market events and/or issuer related events after the report date and prior to issuance of the report, are not reflected herein.
| | | | | | |
| | | |
| 14 | | | | JPMORGAN INSURANCE TRUST | | JUNE 30, 2013 |
The various inputs that are used in determining the fair value of the Portfolio’s investments are summarized into the three broad levels listed below.
| Ÿ | | Level 1 — quoted prices in active markets for identical securities |
| Ÿ | | Level 2 — other significant observable inputs (including quoted prices for similar securities, interest rates, prepayment speeds, credit risk, etc.) |
| Ÿ | | Level 3 — significant unobservable inputs (including the Portfolio’s own assumptions in determining the fair value of investments) |
A financial instrument’s level within the fair value hierarchy is based on the lowest level of any input, both individually and in the aggregate, that is significant to the fair value measurement. The inputs or methodology used for valuing securities are not necessarily an indication of the risk associated with investing in those securities.
The following table represents each valuation input as presented on the Schedule of Portfolio Investments (“SOI”):
| | | | | | | | | | | | | | | | |
| | | Level 1 Quoted prices | | | Level 2 Other significant observable inputs | | | Level 3 Significant unobservable inputs | | | Total | |
Total Investments in Securities (a) | | $ | 37,651,785 | | | $ | — | | | $ | — | | | $ | 37,651,785 | |
| | | | | | | | | | | | | | | | |
Depreciation in Other Financial Instruments | | | | | | | | | | | | | | | | |
Futures Contracts | | $ | (1,507 | ) | | $ | — | | | $ | — | | | $ | (1,507 | ) |
| | | | | | | | | | | | | | | | |
| (a) | All portfolio holdings designated as Level 1 are disclosed individually on the SOI. Please refer to the SOI for industry specifics of portfolio holdings. |
There were no transfers between any levels during the period ended June 30, 2013.
B. Futures Contracts — The Portfolio uses index futures contracts to gain or reduce exposure to the stock market, maintain liquidity and minimize transaction costs. The Portfolio also buys futures contracts to immediately invest incoming cash in the market or sells futures in response to cash outflows, thereby simulating an invested position in the underlying index while maintaining a cash balance for liquidity. The use of futures contracts exposes the Portfolio to equity price risk.
Futures contracts provide for the delayed delivery of the underlying instrument at a fixed price or are settled for a cash amount based on the change in the value of the underlying instrument at a specific date in the future. Upon entering into a futures contract, the Portfolio is required to deposit with the broker, cash or securities in an amount equal to a certain percentage of the contract amount, which is referred to as the initial margin deposit. Subsequent payments, referred to as variation margin, are made or received by the Portfolio periodically and are based on changes in the market value of open futures contracts. Changes in the market value of open futures contracts are recorded as unrealized appreciation or depreciation in the Statement of Operations. Realized gains or losses, representing the difference between the value of the contract at the time it was opened and the value at the time it was closed, are reported in the Statement of Operations at the closing or expiration of the futures contract. Securities deposited as initial margin are designated in the SOI and cash deposited is recorded on the Statement of Assets and Liabilities. A receivable from and/or a payable to brokers for the daily variation margin is also recorded on the Statement of Assets and Liabilities.
The Portfolio may be subject to the risk that the change in the value of the futures contract may not correlate perfectly with the underlying instrument. Use of long futures contracts subjects the Portfolio to risk of loss in excess of the amounts shown on the Statement of Assets and Liabilities, up to the notional amount of the futures contracts. Use of short futures contracts subjects the Portfolio to unlimited risk of loss. The Portfolio may enter into futures contracts only on exchanges or boards of trade. The exchange or board of trade acts as the counterparty to each futures transaction; therefore, the Portfolio’s credit risk is limited to failure of the exchange or board of trade. Under some circumstances, futures exchanges may establish daily limits on the amount that the price of a futures contract can vary from the previous day’s settlement price, which could effectively prevent liquidation of positions.
The table below discloses the volume of the Portfolio’s futures contracts activity during the six months ended June 30, 2013:
| | | | |
Futures Contracts: | | | | |
Average Notional Balance Long | | $ | 649,512 | |
Ending Notional Balance Long | | | 879,615 | |
C. Security Transactions and Investment Income — Investment transactions are accounted for on the trade date (the date the order to buy or sell is executed). Securities gains and losses are calculated on a specifically identified cost basis. Interest income is determined on the basis of coupon interest accrued using the effective interest method which adjusts for amortization of premiums and accretion of discounts. Dividend income, net of foreign taxes withheld, if any, is recorded on the ex-dividend date or when the Portfolio first learns of the dividend.
D. Allocation of Income and Expenses — Expenses directly attributable to a portfolio are charged directly to that portfolio, while the expenses attributable to more than one portfolio of the Trust are allocated among the respective portfolios. In calculating the NAV of each class, investment income, realized and unrealized gains and losses and expenses, other than class specific expenses, are allocated daily to each class of shares based upon the proportion of net assets of each class at the beginning of each day.
E. Federal Income Taxes — The Portfolio is treated as a separate taxable entity for Federal income tax purposes. The Portfolio’s policy is to comply with the provisions of the Internal Revenue Code of 1986, as amended (the “Code”), applicable to regulated investment companies and to distribute
| | | | | | | | |
| | | |
| JUNE 30, 2013 | | JPMORGAN INSURANCE TRUST | | | | | 15 | |
NOTES TO FINANCIAL STATEMENTS
AS OF JUNE 30, 2013 (Unaudited) (continued)
to shareholders all of its distributable net investment income and net realized gain on investments. Accordingly, no provision for Federal income tax is necessary. The Portfolio is also a segregated portfolio of assets for insurance purposes and intends to comply with the diversification requirements of Subchapter L of the Code. Management has reviewed the Portfolio’s tax positions for all open tax years and has determined that as of June 30, 2013, no liability for income tax is required in the Portfolio’s financial statements for net unrecognized tax benefits. However, management’s conclusions may be subject to future review based on changes in, or the interpretation of, the accounting standards or tax laws and regulations. The Portfolio’s Federal tax returns for the prior three fiscal years remain subject to examination by the Internal Revenue Service.
F. Distributions to Shareholders — Distributions from net investment income are generally declared and paid at least annually and are declared separately for each class. No class has preferential dividend rights; differences in per share rates are due to differences in separate class expenses. Net realized capital gains, if any, are distributed at least annually. The amount of distributions from net investment income and net realized capital gains is determined in accordance with Federal income tax regulations, which may differ from GAAP. To the extent these “book/tax” differences are permanent in nature (i.e., that they result from other than timing of recognition — “temporary differences”), such amounts are reclassified within the capital accounts based on their Federal tax-basis treatment.
3. Fees and Other Transactions with Affiliates
A. Investment Advisory Fee — Pursuant to the Investment Advisory Agreement, JPMIM supervises the investments of the Portfolio and for such services is paid a fee. The fee is accrued daily and paid monthly based on the Portfolio’s average daily net assets at an annual rate of 0.65%.
The Advisor waived Investment Advisory fees and/or reimbursed expenses as outlined in Note 3.E.
B. Administration Fee — Pursuant to an Administration Agreement, the Administrator provides certain administration services to the Portfolio. In consideration of these services, the Administrator receives a fee accrued daily and paid monthly at an annual rate of 0.15% of the first $25 billion of the average daily net assets of all funds in the J.P. Morgan Funds Complex (excluding certain funds of funds and money market funds) and 0.075% of the average daily net assets in excess of $25 billion of all such funds. For the six months ended June 30, 2013, the annualized effective rate was 0.08% of the Portfolio’s average daily net assets, notwithstanding any fee waivers and/or expense reimbursements.
JPMorgan Chase Bank, N.A. (“JPMCB”), a wholly-owned subsidiary of JPMorgan, serves as the Portfolio’s sub-administrator (the “Sub-administrator”). For its services as Sub-administrator, JPMCB receives a portion of the fees payable to the Administrator.
The Administrator waived Administration fees as outlined in Note 3.E.
C. Distribution Fees — Pursuant to a Distribution Agreement, JPMorgan Distribution Services, Inc. (the “Distributor”), a wholly-owned subsidiary of JPMorgan, serves as the Trust’s exclusive underwriter and promotes and arranges for the sale of the Portfolio’s shares.
The Board of Trustees has adopted a Distribution Plan (the “Distribution Plan”) for Class 2 Shares of the Portfolio in accordance with Rule 12b-1 under the 1940 Act. The Distribution Plan provides that the Portfolio shall pay distribution fees, including payments to the Distributor, at an annual rate of 0.25% of the average daily net assets of Class 2 Shares.
D. Custodian and Accounting Fees — JPMCB provides portfolio custody and accounting services to the Portfolio. The amounts paid directly to JPMCB by the Portfolio for custody and accounting services are included in Custodian and accounting fees in the Statement of Operations. Payments to the custodian may be reduced by credits earned by the Portfolio, based on uninvested cash balances held by the custodian. Such earnings credits, if any, are presented separately in the Statement of Operations.
Interest expense, if any, paid to the custodian related to cash overdrafts is included in Interest expense to affiliates in the Statement of Operations.
E. Waivers and Reimbursements — The Advisor, Administrator and Distributor (for Class 2 Shares) have contractually agreed to waive fees and/or reimburse the Portfolio to the extent that total annual operating expenses (excluding acquired fund fees and expenses, dividend expenses related to short sales, interest, taxes, expenses related to litigation and potential litigation, extraordinary expenses and expenses related to the Board of Trustees’ deferred compensation plan) exceed the percentages of the Portfolio’s respective average daily net assets as shown in the table below:
| | | | | | | | |
| | | Class 1 | | | Class 2 | |
| | | 0.90 | % | | | 1.15 | % |
The expense limitation agreements were in effect for the six months ended June 30, 2013. The contractual expense limitation percentages in the table above are in place until at least April 30, 2014.
For the six months ended June 30, 2013, the Portfolio’s service providers waived fees for the Portfolio as follows. None of these parties expect the Portfolio to repay any such waived fees in future years.
| | | | | | | | | | | | |
| | | Contractual Waivers | |
| | | Investment
Advisory | | | Administration | | | Total | |
| | $ | 7,675 | | | $ | 15,661 | | | $ | 23,336 | |
| | | | | | |
| | | |
| 16 | | | | JPMORGAN INSURANCE TRUST | | JUNE 30, 2013 |
Additionally, the Portfolio may invest in one or more money market funds advised by the Advisor or its affiliates. The Advisor, Administrator and the Distributor waive fees in an amount sufficient to offset the respective fees each charges to the affiliated money market fund on the Portfolio’s investment in such affiliated money market fund. A portion of the waiver is voluntary.
The amount of waivers resulting from investments in these money market funds for the six months ended June 30, 2013 was $766.
F. Other — Certain officers of the Trust are affiliated with the Advisor, the Administrator and the Distributor. Such officers, with the exception of the Chief Compliance Officer, receive no compensation from the Portfolio for serving in their respective roles.
The Board of Trustees appointed a Chief Compliance Officer to the Portfolio in accordance with Federal securities regulations. The Portfolio, along with other affiliated portfolios, makes reimbursement payments, on a pro-rata basis, to the Administrator for a portion of the fees associated with the Office of the Chief Compliance Officer. Such fees are included in Trustees’ and Chief Compliance Officer’s fees in the Statement of Operations.
The Trust adopted a Trustee Deferred Compensation Plan (the “Plan”) which allows the Independent Trustees to defer the receipt of all or a portion of compensation related to performance of their duties as Trustees. The deferred fees are invested in various J.P. Morgan Funds until distribution in accordance with the Plan.
During the six months ended June 30, 2013, the Portfolio may have purchased securities from an underwriting syndicate in which the principal underwriter or members of the syndicate are affiliated with the Advisor.
The Portfolio may use related party broker-dealers. For the six months ended June 30, 2013, the Portfolio did not incur any brokerage commissions with broker-dealers affiliated with the Advisor.
The Securities and Exchange Commission has granted an exemptive order permitting the Portfolio to engage in principal transactions with J.P. Morgan Securities, Inc., an affiliated broker, involving taxable money market instruments, subject to certain conditions.
4. Investment Transactions
During the six months ended June 30, 2013, purchases and sales of investments (excluding short-term investments) were as follows:
| | | | | | | | |
| | | Purchases
(excluding U.S.
Government) | | | Sales
(excluding U.S.
Government) | |
| | $ | 14,681,362 | | | $ | 15,965,719 | |
During the six months ended June 30, 2013, there were no purchases or sales of U.S. Government securities.
5. Federal Income Tax Matters
For Federal income tax purposes, the cost and unrealized appreciation (depreciation) in value of investment securities held at June 30, 2013 were as follows:
| | | | | | | | | | | | | | | | |
| | | Aggregate
Cost | | | Gross
Unrealized
Appreciation | | | Gross
Unrealized
Depreciation | | | Net Unrealized
Appreciation
(Depreciation) | |
| | $ | 31,494,770 | | | $ | 6,538,721 | | | $ | 381,706 | | | $ | 6,157,015 | |
Under the Regulated Investment Company Modernization Act of 2010 (the “Act”), net capital losses recognized by the Portfolio after December 31, 2010 may get carried forward indefinitely, and retain their character as short-term and/or long-term losses. Prior to the Act, net capital losses incurred by the Portfolio were carried forward for eight years and treated as short-term losses. The Act requires that post-enactment net capital losses be used before pre-enactment net capital losses.
At December 31, 2012, the Portfolio did not have any post-enactment net capital loss carryforwards.
At December 31, 2012, the Portfolio had pre-enactment net capital loss carryforwards, expiring during the year indicated, which are available to offset future realized gains:
| | | | | | | | | | | | | | | | |
| | | 2013 | | | 2016 | | | 2017 | | | Total | |
| | $ | 1,798,808 | | | $ | 5,636,634 | | | $ | 11,650,439 | | | $ | 19,085,881 | |
6. Borrowings
The Trust and JPMCB have entered into a financing arrangement. Under this arrangement, JPMCB provides an unsecured, uncommitted credit facility in the aggregate amount of $100 million to certain of the J.P. Morgan Funds, including the Portfolio. Advances under the arrangement are taken primarily for temporary or emergency purposes, including the meeting of redemption requests that otherwise might require the untimely disposition of securities, and are subject to the Portfolio’s borrowing restrictions. Interest on borrowings is payable at a rate determined by JPMCB at the time of borrowing. This agreement has been extended until November 11, 2013.
| | | | | | | | |
| | | |
| JUNE 30, 2013 | | JPMORGAN INSURANCE TRUST | | | | | 17 | |
NOTES TO FINANCIAL STATEMENTS
AS OF JUNE 30, 2013 (Unaudited) (continued)
The Portfolio had no borrowings outstanding from the unsecured, uncommitted credit facility at June 30, 2013, or at any time during the six months then ended.
Interest expense paid, if any, as a result of borrowings from the unsecured, uncommitted credit facility is included in Interest expense to affiliates in the Statement of Operations.
7. Risks, Concentrations and Indemnifications
In the normal course of business, the Portfolio enters into contracts that contain a variety of representations which provide general indemnifications. The Portfolio’s maximum exposure under these arrangements is unknown. The amount of exposure would depend on future claims that may be made against the Portfolio that have not yet occurred. However, based on experience, the Portfolio expects the risk of loss to be remote.
The Portfolio has several shareholders holding a significant percentage of shares outstanding. Investment activities of these shareholders could have a material impact on the Portfolio.
| | | | | | |
| | | |
| 18 | | | | JPMORGAN INSURANCE TRUST | | JUNE 30, 2013 |
SCHEDULE OF SHAREHOLDER EXPENSES
(Unaudited)
Hypothetical $1,000 Investment
As a shareholder of the Portfolio, you incur ongoing costs, including investment advisory fees, administration fees, distribution fees (for Class 2 Shares) and other Portfolio expenses. Because the Portfolio is a funding vehicle for Policies and Eligible Plans, you may also incur sales charges and other fees relating to the Policies or Eligible Plans. The examples below are intended to help you understand your ongoing costs (in dollars) of investing in the Portfolio, but not the costs of the Policies or Eligible Plans, and to compare these ongoing costs with the ongoing costs of investing in other mutual funds. The examples assume that you had a $1,000 investment in each Class at the beginning of the reporting period, January 1, 2013, and continued to hold your shares at the end of the reporting period, June 30, 2013.
Actual Expenses
For each Class of the Portfolio in the table below, the first line provides information about actual account values and actual expenses. You may use the information in this line, together with the amount you invested, to estimate the expenses that you paid over the period. Simply divide your account value by $1,000 (for example, an $8,600 account value divided by $1,000 = 8.6), then multiply the result by the number in the first line of each Class under the heading entitled “Expenses Paid During the Period” to estimate the expenses you paid on your account during this period.
Hypothetical Example for Comparison Purposes
The second line of each Class in the table below provides information about hypothetical account values and hypothetical expenses based on the Class’ actual expense ratio and an assumed rate of return of 5% per year before expenses, which is not the Class’ actual return. The hypothetical account values and expenses may not be used to estimate the actual ending account balance or expenses you paid for the period. You may use this information to compare the ongoing costs of investing in the Class of the Portfolio and other portfolios. To do so, compare this 5% hypothetical example with the 5% hypothetical examples that appear in the shareholder reports of the other funds. Please note that the expenses shown in the table are meant to highlight your ongoing costs only and do not reflect any transaction costs, such as sales charges (loads) or redemption fees or the costs associated with the Policies and Eligible Plans through which the Portfolio is held. Therefore, the second line for each Class in the table is useful in comparing ongoing costs only, and will not help you determine the relative total costs of owning different portfolios. In addition, if these transaction costs were included, your costs would have been higher. The examples also assume all dividends and distributions have been reinvested.
| | | | | | | | | | | | | | | | |
| | | Beginning
Account Value,
January 1, 2013 | | | Ending
Account Value
June 30, 2013 | | | Expenses
Paid During
the Period* | | | Annualized
Expense
Ratio | |
Intrepid Growth Portfolio | | | | | | | | | | | | | | | | |
Class 1 | | | | | | | | | | | | | | | | |
Actual | | $ | 1,000.00 | | | $ | 1,128.70 | | | $ | 4.75 | | | | 0.90 | % |
Hypothetical | | | 1,000.00 | | | | 1,020.33 | | | | 4.51 | | | | 0.90 | |
| | | | |
Class 2 | | | | | | | | | | | | | | | | |
Actual | | | 1,000.00 | | | | 1,127.80 | | | | 6.07 | | | | 1.15 | |
Hypothetical | | | 1,000.00 | | | | 1,019.09 | | | | 5.76 | | | | 1.15 | |
| * | Expenses are equal to each Class’ respective annualized expense ratio, multiplied by the average account value over the period, multiplied by 181/365 (to reflect the one-half year period). |
| | | | | | | | |
| | | |
| JUNE 30, 2013 | | JPMORGAN INSURANCE TRUST | | | | | 19 | |
J.P. Morgan Funds are distributed by JPMorgan Distribution Services, Inc., which is an affiliate of JPMorgan Chase & Co. Affiliates of JPMorgan Chase & Co. receive fees for providing various services to the funds.
Contact JPMorgan Distribution Services, Inc. at 1-800-480-4111 for a portfolio prospectus. You can also visit us at www.jpmorganfunds.com. Investors should carefully consider the investment objectives and risk as well as charges and expenses of the mutual fund before investing. The prospectus contains this and other information about the mutual fund. Read the prospectus carefully before investing.
The Portfolio files a complete schedule of its portfolio holdings for the first and third quarters of its fiscal year with the SEC on Form N-Q. The Portfolio’s Forms N-Q are available on the SEC’s website at http://www.sec.gov and may be reviewed and copied at the SEC’s Public Reference Room in Washington, DC. Information on the operation of the SEC’s Public Reference Room may be obtained by calling 1-800-SEC-0330. Shareholders may request the Form N-Q without charge by calling 1-800-480-4111 or by visiting the variable insurance portfolio section of the J.P. Morgan Funds’ website at www.jpmorganfunds.com.
A description of the Portfolio’s policies and procedures with respect to the disclosure of the Portfolio’s holdings is available in the prospectus and Statement of Additional Information.
A copy of proxy policies and procedures is available without charge upon request by calling 1-800-480-4111 and on the Portfolio’s website at www.jpmorganfunds.com. A description of such policies and procedures is on the SEC’s website at www.sec.gov. The Trustees have delegated the authority to vote proxies for securities owned by the Portfolio to the Advisor. A copy of the Portfolio’s voting record for the most recent 12-month period ended June 30 is available on the SEC’s website at www.sec.gov or at the Portfolio’s website at www.jpmorganfunds.com no later than August 31 of each year. The Portfolio’s proxy voting record will include, among other things, a brief description of the matter voted on for each portfolio security, and will state how each vote was cast, for example, for or against the proposal.
| | | | |
| | © JPMorgan Chase & Co., 2013. All rights reserved. June 2013. | | SAN-JPMITIGP-613 |
Semi-Annual Report
JPMorgan Insurance Trust
June 30, 2013 (Unaudited)
JPMorgan Insurance Trust Intrepid Mid Cap Portfolio
| | | | |
NOT FDIC INSURED Ÿ NO BANK GUARANTEE Ÿ MAY LOSE VALUE
| | |  | |
CONTENTS
Investments in the Portfolio are not bank deposits or obligations of, or guaranteed or endorsed by, any bank and are not insured or guaranteed by the FDIC, the Federal Reserve Board or any other government agency. You could lose money if you sell when the Portfolio’s share price is lower than when you invested.
Past performance is no guarantee of future performance. The general market views expressed in this report are opinions based on market and other conditions through the end of the reporting period and are subject to change without notice. These views are not intended to predict the future performance of the Portfolio or the securities markets. References to specific securities and their issuers are for illustrative purposes only and are not intended to be, and should not be interpreted as, recommendations to purchase or sell such securities. Such views are not meant as investment advice and may not be relied on as an indication of trading intent on behalf of the Portfolio.
This Portfolio is intended to be a funding vehicle for variable annuity contracts and variable life insurance policies (collectively “Policies”) offered by separate accounts of participating insurance companies. Portfolio shares are also offered through qualified pension and retirement plans (“Eligible Plans”). Individuals may not purchase shares directly from the Portfolio.
Prospective investors should refer to the Portfolio’s prospectus for a discussion of the Portfolio’s investment objective, strategies and risks. Call J.P. Morgan Funds Service Center at 1-800-480-4111 for a prospectus containing more complete information about the Portfolio, including management fees and other expenses. Please read it carefully before investing.
CEO’S LETTER
July 26, 2013 (Unaudited)
Dear Shareholder:
While somewhat overshadowed by increased volatility at the end of the reporting period, developed market equities in aggregate posted solid returns for the six months ended June 30, 2013. For much of the period, stocks were supported by solid corporate earnings and robust demand from investors looking to generate higher returns in the low interest rate environment. Despite signaling a potential policy shift in June 2013, the U.S. Federal Reserve (“Fed”) continued to pursue its highly accommodative policies in an attempt to lower unemployment and spur the economy. Central banks overseas also did their part to support their economies. The European Central Bank (“ECB”) remained committed to preserving the euro, as it cut rates and introduced new programs designed to aid struggling euro zone members. Elsewhere, the Bank of Japan stepped up its major asset purchase program as a new pro-growth government came into power late in 2012.
| | |
 | | “We are encouraged by the stock market’s resiliency in the face of recent volatility.” |
Positive investor sentiment was temporarily interrupted, however, in May 2013 when Fed Chairman Bernanke indicated that the central bank may begin to “taper” its asset purchase program later this year. This triggered a sharp decline in global equities, although they quickly regained their footing and have continued to rally in July. All told, U.S. stocks rose sharply during the six months ended June 30, 2013. Overseas, international developed stocks produced more modest gains, while emerging market equities performed poorly given concerns regarding China’s economy and falling commodity prices.
U.S. Treasury Yields Rise Sharply
Talk of Fed tapering negatively impacted the fixed income markets. While U.S. Treasury security yields continued to be low
from a historical perspective, they ended the period sharply higher than when the reporting period began. The yield for 10-year U.S. Treasury securities ended June 30, 2013 at 2.52%, while the yields for 2- and 30-year U.S. Treasury securities finished the reporting period at 0.36% and 3.52%, respectively. Amid the rising interest rate environment, the overall U.S. fixed income market generated a negative return for the reporting period. In contrast, high yield bonds posted a modest gain, while emerging market debt securities fell sharply.
Positive Signs for Stocks
Although the global economy is far from robust, it is still on a growth path. The expansion in the U.S. certainly appears to be sustainable and, while Europe remains in a recession, there are indications that its economy may be bottoming. Elsewhere, pro-growth initiatives in Japan have thus far yielded positive results. While growth in China has moderated, we believe the government has the tools at its disposal to avoid a “hard landing.”
We are encouraged by the stock market’s resiliency in the face of recent volatility. In addition, there have been signs that equity market correlations are decreasing, which could create a more favorable environment for active managers. In addition, given the recent sell-off in the bond market, valuations in a number of fixed income sectors have become more attractive.
On behalf of everyone at J.P. Morgan Asset Management, thank you for your continued support. We look forward to managing your investment needs for years to come. Should you have any questions, please visit www.jpmorganfunds.com or contact the J.P. Morgan Funds Service Center at 1-800-480-4111.
Sincerely yours,

George C.W. Gatch
CEO, Global Funds Management
J.P. Morgan Asset Management
| | | | | | | | |
| | | |
| JUNE 30, 2013 | | JPMORGAN INSURANCE TRUST | | | | | 1 | |
JPMorgan Insurance Trust Intrepid Mid Cap Portfolio
PORTFOLIO COMMENTARY
SIX MONTHS ENDED JUNE 30, 2013 (Unaudited)
| | | | |
| REPORTING PERIOD RETURN: | | | |
| Portfolio (Class 1 Shares)* | | | 17.68% | |
| Russell Midcap Index | | | 15.45% | |
| |
| Net Assets as of 6/30/2013 | | $ | 36,684,005 | |
INVESTMENT OBJECTIVE**
The JPMorgan Insurance Trust Intrepid Mid Cap Portfolio (the “Portfolio”) seeks long-term capital growth by investing primarily in equity securities of companies with intermediate capitalizations.
HOW DID THE MARKET PERFORM?
Despite periods of heightened volatility and a setback in June, the overall U.S. equity market, as measured by the S&P 500 Index (“S&P 500”), generated strong results for the six months ended June 30, 2013. The S&P 500 generated a positive return for each of the first five months of the reporting period. Supporting the market were overall solid corporate profits, improving economic growth and generally robust investor demand. These factors helped the S&P 500 to post several all-time highs over the first five months of 2013. The S&P 500 then reversed course and declined during the last month of the reporting period. This turnaround was triggered by indications that the U.S. Federal Reserve Board (“Fed”) would begin tapering its monthly purchases of bonds — $85 billion of mortgage-backed securities and Treasury securities — if economic conditions continued to improve. This caused interest rates to move sharply higher and both stock and bond prices fell sharply. However, the S&P 500 again rallied in late June, as concerns regarding Fed tapering abated somewhat. All told, mid-cap stocks, as measured by the Russell Midcap Index (the “Benchmark”), finished the six months ended June 30, 2013 with a 15.45% gain.
WHAT WERE THE MAIN DRIVERS OF THE PORTFOLIO’S PERFORMANCE?
The Portfolio (Class 1 Shares) outperformed the Benchmark for the six months ended June 30, 2013. The Portfolio’s stock selection in the software and services and industrial cyclical sectors was the main contributor to relative performance. The Portfolio’s stock selection in the basic materials and telecommunications services sectors detracted from relative performance.
Individual contributors to relative performance included LinkedIn Corp., Constellation Brands, Inc. and Western Digital Corp. LinkedIn Corp., a networking website for people in professional occupations, reported strong revenue and earnings growth during the reporting period. Shares of Constellation Brands, Inc., a global manufacturer and distributor of liquor,
rallied as the company reached an agreement to acquire the remaining interest in Crown Imports. The market feels this transaction has the potential to be a significant driver of Constellation Brands’ long-term growth. Shares of Western Digital Corp., a hard disk drive manufacturer, rose to an all-time high as demand grew for high capacity disk drive and cloud computing solutions.
Individual detractors from relative performance included Frontier Communications Corp., PulteGroup, Inc. and IAC Interactive Network, Inc. Frontier Communications Corp. is a communications company providing services primarily to rural areas and small and medium-sized towns and cities in the U.S. Its shares underperformed the Benchmark as the company reported flat earnings growth during the reporting period. Shares of homebuilder PulteGroup, Inc. also underperformed the Benchmark due to concerns related to rising interest and mortgage rates. Shares of IAC Interactive Network, Inc., an internet company with over 50 brands, performed poorly due to increased competition for advertising dollars.
HOW WAS THE PORTFOLIO POSITIONED?
The JPMorgan Intrepid Investment Team (the “Team”) employs a philosophy that is rooted in behavioral finance, a field of study that emphasizes the importance of human psychology in financial markets. Behavioral finance examines how investor behavior can be affected by emotional biases and reactions. The field theorizes that inefficiencies arise in the stock market because investors are consistently irrational in making many investment decisions.
The Team aims to capitalize on these market inefficiencies by targeting what it believes are attractively valued stocks with strong fundamentals and momentum characteristics, and looking to sell these stocks when they no longer exhibit these criteria. A disciplined quantitative ranking methodology is utilized to identify attractive stocks in each sector, a process that is combined with qualitative research and value-added trading. Portfolios are constructed with limited sector bets so that stock selection is typically the primary driver of relative performance.
During the reporting period, the Portfolio was managed and positioned in accordance with this investment philosophy and process.
| | | | | | |
| | | |
| 2 | | | | JPMORGAN INSURANCE TRUST | | JUNE 30, 2013 |
| | | | | | | | |
| TOP TEN EQUITY HOLDINGS OF THE PORTFOLIO*** | |
| | 1. | | | Discover Financial Services | | | 1.7 | % |
| | 2. | | | Lorillard, Inc. | | | 1.7 | |
| | 3. | | | Macy’s, Inc. | | | 1.7 | |
| | 4. | | | Alliance Data Systems Corp. | | | 1.6 | |
| | 5. | | | Campbell Soup Co. | | | 1.4 | |
| | 6. | | | Western Digital Corp. | | | 1.3 | |
| | 7. | | | PulteGroup, Inc. | | | 1.3 | |
| | 8. | | | KAR Auction Services, Inc. | | | 1.3 | |
| | 9. | | | AmerisourceBergen Corp. | | | 1.3 | |
| | 10. | | | Activision Blizzard, Inc. | | | 1.3 | |
| | | | |
PORTFOLIO COMPOSITION BY SECTOR*** | |
| Financials | | | 18.4 | % |
| Information Technology | | | 16.3 | |
| Consumer Discretionary | | | 14.1 | |
| Industrials | | | 13.7 | |
| Health Care | | | 10.7 | |
| Consumer Staples | | | 6.7 | |
| Utilities | | | 6.3 | |
| Energy | | | 6.2 | |
| Materials | | | 4.8 | |
| Telecommunication Services | | | 1.7 | |
| U.S. Treasury Obligation | | | 0.2 | |
| Short-Term Investment | | | 0.9 | |
| * | | The return shown is based on net asset values calculated for shareholder transactions and may differ from the return shown in the financial highlights, which reflects adjustments made to the net asset values in accordance with accounting principles generally accepted in the United States of America. |
| ** | | The advisor seeks to achieve the Portfolio’s objective. There can be no guarantee it will be achieved. |
| *** | | Percentages indicated are based on total investments as of June 30, 2013. The Portfolio’s composition is subject to change. |
| | | | | | | | |
| | | |
| JUNE 30, 2013 | | JPMORGAN INSURANCE TRUST | | | | | 3 | |
JPMorgan Insurance Trust Intrepid Mid Cap Portfolio
PORTFOLIO COMMENTARY
SIX MONTHS ENDED JUNE 30, 2013 (Unaudited) (continued)
| | | | | | | | | | | | | | | | | | | | |
AVERAGE ANNUAL TOTAL RETURNS AS OF JUNE 30, 2013 | |
| | | | | |
| | | INCEPTION DATE
OF CLASS | | | 6 MONTH* | | | 1 YEAR | | | 5 YEAR | | | 10 YEAR | |
CLASS 1 SHARES | | | 3/30/95 | | | | 17.68 | % | | | 26.68 | % | | | 7.43 | % | | | 9.39 | % |
CLASS 2 SHARES | | | 8/16/06 | | | | 17.58 | | | | 26.37 | | | | 7.17 | | | | 9.21 | |
TEN YEAR PERFORMANCE (6/30/03 TO 6/30/13)
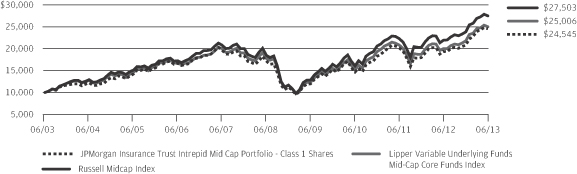
The performance quoted is past performance and is not a guarantee of future results. Mutual funds are subject to certain market risks. Investment returns and principal value of an investment will fluctuate so that an investor’s shares, when redeemed, may be worth more or less than their original cost. Current performance may be higher or lower than the performance data shown. For up-to-date month-end performance information please call 1-800-480-4111.
Returns for the Class 2 Shares prior to its inception date are based on the performance of Class 1 Shares. The actual returns of Class 2 Shares would have been lower than shown because Class 2 Shares have higher expenses than Class 1 Shares.
The graph illustrates comparative performance for $10,000 invested in Class 1 Shares of the JPMorgan Insurance Trust Intrepid Mid Cap Portfolio, the Russell Midcap Index and the Lipper Variable Underlying Funds Mid-Cap Core Funds Index from June 30, 2003 to June 30, 2013. The performance of the Portfolio assumes reinvestment of all dividends and capital gain distributions, if any. The performance of the Russell Midcap Index does not reflect the deduction of expenses associated with a mutual fund and has been adjusted to reflect reinvestment of all dividends and capital gain distributions of the secu-
rities included in the benchmark, if applicable. The performance of the Lipper Variable Underlying Funds Mid-Cap Core Funds Index includes expenses associated with a mutual fund, such as investment management fees. These expenses are not identical to the expenses incurred by the Portfolio. The Russell Midcap Index is an unmanaged index which measures the performance of the 800 smallest companies in the Russell 1000 Index. The Lipper Variable Underlying Funds Mid-Cap Core Funds Index is an index based on the total returns of certain mutual funds within the Portfolio’s designated category as determined by Lipper, Inc. Investors cannot invest directly in an index.
The performance does not reflect any charges imposed by the Policies or Eligible Plans. If these charges were included, the returns would be lower than shown. Portfolio performance may reflect the waiver of the Portfolio’s fees and reimbursement of expenses for certain periods since the inception date. Without these waivers and reimbursements, performance would have been lower.
The returns shown are based on net asset values calculated for shareholder transactions and may differ from the returns shown in the financial highlights, which reflect adjustments made to the net asset values in accordance with accounting principles generally accepted in the United States of America.
| | | | | | |
| | | |
| 4 | | | | JPMORGAN INSURANCE TRUST | | JUNE 30, 2013 |
JPMorgan Insurance Trust Intrepid Mid Cap Portfolio
SCHEDULE OF PORTFOLIO INVESTMENTS
AS OF JUNE 30, 2013 (Unaudited)
| | | | | | | | |
| SHARES | | | SECURITY DESCRIPTION | | VALUE($) | |
| | | | | | | | |
| Common Stocks — 98.8% | |
| | | | Consumer Discretionary — 14.1% | |
| | | | Auto Components — 0.6% | |
| | 2,600 | | | Delphi Automotive plc, (United Kingdom) | | | 131,794 | |
| | 1,000 | | | TRW Automotive Holdings Corp. (a) | | | 66,440 | |
| | | | | | | | |
| | | | | | | 198,234 | |
| | | | | | | | |
| | | | Distributors — 0.5% | | | | |
| | 200 | | | Genuine Parts Co. | | | 15,614 | |
| | 7,000 | | | LKQ Corp. (a) | | | 180,250 | |
| | | | | | | | |
| | | | | | | 195,864 | |
| | | | | | | | |
| | | | Diversified Consumer Services — 0.9% | | | | |
| | 19,100 | | | Service Corp. International | | | 344,373 | |
| | | | | | | | |
| | | | Hotels, Restaurants & Leisure — 1.8% | | | | |
| | 5,300 | | | Brinker International, Inc. | | | 208,979 | |
| | 8,100 | | | Wyndham Worldwide Corp. | | | 463,563 | |
| | | | | | | | |
| | | | | | | 672,542 | |
| | | | | | | | |
| | | | Household Durables — 2.2% | | | | |
| | 3,650 | | | Jarden Corp. (a) | | | 159,687 | |
| | 4,750 | | | Leggett & Platt, Inc. | | | 147,678 | |
| | 25,800 | | | PulteGroup, Inc. (a) | | | 489,426 | |
| | 300 | | | Tupperware Brands Corp. | | | 23,307 | |
| | | | | | | | |
| | | | | | | 820,098 | |
| | | | | | | | |
| | | | Internet & Catalog Retail — 1.8% | | | | |
| | 700 | | | Expedia, Inc. | | | 42,105 | |
| | 3,100 | | | Groupon, Inc. (a) | | | 26,350 | |
| | 5,200 | | | Liberty Ventures, Series A, (a) | | | 442,052 | |
| | 700 | | | Netflix, Inc. (a) | | | 147,763 | |
| | | | | | | | |
| | | | | | | 658,270 | |
| | | | | | | | |
| | | | Leisure Equipment & Products — 0.2% | | | | |
| | 1,200 | | | Mattel, Inc. | | | 54,372 | |
| | | | | | | | |
| | | | Media — 0.3% | | | | |
| | 1,000 | | | AMC Networks, Inc., Class A (a) (m) | | | 65,410 | |
| | 1,100 | | | Cinemark Holdings, Inc. | | | 30,712 | |
| | | | | | | | |
| | | | | | | 96,122 | |
| | | | | | | | |
| | | | Multiline Retail — 2.2% | | | | |
| | 1,400 | | | Dillard’s, Inc., Class A | | | 114,758 | |
| | 1,300 | | | Dollar Tree, Inc. (a) | | | 66,092 | |
| | 13,000 | | | Macy’s, Inc. | | | 624,000 | |
| | | | | | | | |
| | | | | | | 804,850 | |
| | | | | | | | |
| | | | Specialty Retail — 3.1% | | | | |
| | 400 | | | CST Brands, Inc. (a) | | | 12,324 | |
| | 3,000 | | | Foot Locker, Inc. | | | 105,390 | |
| | 5,400 | | | GameStop Corp., Class A | | | 226,962 | |
| | | | | | | | |
| SHARES | | | SECURITY DESCRIPTION | | VALUE($) | |
| | | | | | | | |
| | |
| | | | Specialty Retail — Continued | |
| | 6,000 | | | Gap, Inc. (The) | | | 250,380 | |
| | 1,700 | | | O’Reilly Automotive, Inc. (a) | | | 191,454 | |
| | 1,900 | | | Ross Stores, Inc. | | | 123,139 | |
| | 2,800 | | | TJX Cos., Inc. | | | 140,168 | |
| | 2,500 | | | Urban Outfitters, Inc. (a) | | | 100,550 | |
| | | | | | | | |
| | | | | | | 1,150,367 | |
| | | | | | | | |
| | | | Textiles, Apparel & Luxury Goods — 0.5% | | | | |
| | 400 | | | Carter’s, Inc. | | | 29,628 | |
| | 2,300 | | | Michael Kors Holdings Ltd., (Hong Kong) (a) | | | 142,646 | |
| | | | | | | | |
| | | | | | | 172,274 | |
| | | | | | | | |
| | | | Total Consumer Discretionary | | | 5,167,366 | |
| | | | | | | | |
| | | | Consumer Staples — 6.7% | |
| | | | Beverages — 0.8% | |
| | 5,600 | | | Constellation Brands, Inc., Class A (a) | | | 291,872 | |
| | | | | | | | |
| | | | Food & Staples Retailing — 0.6% | | | | |
| | 6,600 | | | Kroger Co. (The) | | | 227,964 | |
| | | | | | | | |
| | | | Food Products — 3.3% | | | | |
| | 11,300 | | | Campbell Soup Co. | | | 506,127 | |
| | 6,500 | | | Ingredion, Inc. | | | 426,530 | |
| | 10,900 | | | Tyson Foods, Inc., Class A | | | 279,912 | |
| | | | | | | | |
| | | | | | | 1,212,569 | |
| | | | | | | | |
| | | | Personal Products — 0.2% | | | | |
| | 4,500 | | | Coty, Inc., Class A (a) | | | 77,310 | |
| | | | | | | | |
| | | | Tobacco — 1.8% | | | | |
| | 14,500 | | | Lorillard, Inc. | | | 633,360 | |
| | | | | | | | |
| | | | Total Consumer Staples | | | 2,443,075 | |
| | | | | | | | |
| | | | Energy — 6.2% | |
| | | | Energy Equipment & Services — 1.6% | |
| | 601 | | | Baker Hughes, Inc. | | | 27,724 | |
| | 1,000 | | | Dresser-Rand Group, Inc. (a) | | | 59,980 | |
| | 1,168 | | | National Oilwell Varco, Inc. | | | 80,476 | |
| | 4,000 | | | Oil States International, Inc. (a) | | | 370,560 | |
| | 700 | | | Unit Corp. (a) | | | 29,806 | |
| | | | | | | | |
| | | | | | | 568,546 | |
| | | | | | | | |
| | | | Oil, Gas & Consumable Fuels — 4.6% | |
| | 1,500 | | | Cabot Oil & Gas Corp. | | | 106,530 | |
| | 2,500 | | | Cimarex Energy Co. | | | 162,475 | |
| | 700 | | | Continental Resources, Inc. (a) | | | 60,242 | |
| | 5,395 | | | Energen Corp. | | | 281,943 | |
| | 3,200 | | | EQT Corp. | | | 253,984 | |
| | 1,300 | | | Marathon Petroleum Corp. | | | 92,378 | |
| | 4,200 | | | Murphy Oil Corp. | | | 255,738 | |
SEE NOTES TO FINANCIAL STATEMENTS.
| | | | | | | | |
| | | |
| JUNE 30, 2013 | | JPMORGAN INSURANCE TRUST | | | | | 5 | |
JPMorgan Insurance Trust Intrepid Mid Cap Portfolio
SCHEDULE OF PORTFOLIO INVESTMENTS
AS OF JUNE 30, 2013 (Unaudited) (continued)
| | | | | | | | |
| SHARES | | | SECURITY DESCRIPTION | | VALUE($) | |
| | | | | | | | |
| Common Stocks — Continued | |
| | | | Oil, Gas & Consumable Fuels — Continued | |
| | 2,700 | | | Newfield Exploration Co. (a) | | | 64,503 | |
| | 2,440 | | | Noble Energy, Inc. | | | 146,497 | |
| | 4,600 | | | Peabody Energy Corp. | | | 67,344 | |
| | 2,400 | | | Tesoro Corp. | | | 125,568 | |
| | 2,400 | | | Valero Energy Corp. | | | 83,448 | |
| | | | | | | | |
| | | | | | | 1,700,650 | |
| | | | | | | | |
| | | | Total Energy | | | 2,269,196 | |
| | | | | | | | |
| | | | Financials — 18.4% | |
| | | | Capital Markets — 1.3% | |
| | 2,000 | | | Affiliated Managers Group, Inc. (a) (m) | | | 327,880 | |
| | 9,800 | | | American Capital Ltd. (a) | | | 124,166 | |
| | | | | | | | |
| | | | | | | 452,046 | |
| | | | | | | | |
| | | | Commercial Banks — 2.5% | |
| | 800 | | | BankUnited, Inc. | | | 20,808 | |
| | 1,250 | | | BOK Financial Corp. | | | 80,063 | |
| | 6,700 | | | Huntington Bancshares, Inc. | | | 52,796 | |
| | 14,400 | | | KeyCorp | | | 158,976 | |
| | 600 | | | M&T Bank Corp. | | | 67,050 | |
| | 8,600 | | | Regions Financial Corp. | | | 81,958 | |
| | 2,100 | | | Signature Bank (a) | | | 174,342 | |
| | 3,400 | | | SVB Financial Group (a) | | | 283,288 | |
| | | | | | | | |
| | | | | | | 919,281 | |
| | | | | | | | |
| | | | Consumer Finance — 1.7% | |
| | 13,300 | | | Discover Financial Services | | | 633,612 | |
| | | | | | | | |
| | | | Diversified Financial Services — 0.3% | |
| | 3,050 | | | NASDAQ OMX Group, Inc. (The) | | | 100,010 | |
| | | | | | | | |
| | | | Insurance — 4.7% | |
| | 1,850 | | | Allied World Assurance Co. Holdings AG, (Switzerland) | | | 169,293 | |
| | 4,950 | | | American Financial Group, Inc. | | | 242,105 | |
| | 1,500 | | | Aon plc, (United Kingdom) | | | 96,525 | |
| | 1,850 | | | Arch Capital Group Ltd., (Bermuda) (a) | | | 95,108 | |
| | 1,700 | | | Assurant, Inc. | | | 86,547 | |
| | 8,100 | | | Assured Guaranty Ltd., (Bermuda) | | | 178,686 | |
| | 1,150 | | | Axis Capital Holdings Ltd., (Bermuda) | | | 52,647 | |
| | 500 | | | Everest Re Group Ltd., (Bermuda) | | | 64,130 | |
| | 3,200 | | | Hartford Financial Services Group, Inc. | | | 98,944 | |
| | 2,200 | | | Lincoln National Corp. | | | 80,234 | |
| | 2,900 | | | Principal Financial Group, Inc. | | | 108,605 | |
| | 2,800 | | | Protective Life Corp. | | | 107,548 | |
| | 1,000 | | | Torchmark Corp. | | | 65,140 | |
| | 6,800 | | | Unum Group | | | 199,716 | |
| | 2,300 | | | Validus Holdings Ltd., (Bermuda) | | | 83,076 | |
| | | | | | | | |
| | | | | | | 1,728,304 | |
| | | | | | | | |
| | | | | | | | |
| SHARES | | | SECURITY DESCRIPTION | | VALUE($) | |
| | | | | | | | |
| | | | | | | | |
| | | | Real Estate Investment Trusts (REITs) — 7.6% | |
| | 1,100 | | | American Capital Agency Corp. | | | 25,289 | |
| | 5,900 | | | Annaly Capital Management, Inc. | | | 74,163 | |
| | 5,400 | | | Apartment Investment & Management Co., Class A | | | 162,216 | |
| | 200 | | | AvalonBay Communities, Inc. | | | 26,982 | |
| | 5,200 | | | Brandywine Realty Trust | | | 70,304 | |
| | 1,000 | | | Camden Property Trust | | | 69,140 | |
| | 1,600 | | | Chimera Investment Corp. | | | 4,800 | |
| | 3,225 | | | CommonWealth REIT | | | 74,562 | |
| | 3,500 | | | DDR Corp. | | | 58,275 | |
| | 3,900 | | | Digital Realty Trust, Inc. | | | 237,900 | |
| | 3,000 | | | Douglas Emmett, Inc. (m) | | | 74,850 | |
| | 20,100 | | | Duke Realty Corp. | | | 313,359 | |
| | 1,400 | | | Equity Residential | | | 81,284 | |
| | 1,300 | | | Extra Space Storage, Inc. | | | 54,509 | |
| | 2,900 | | | Health Care REIT, Inc. | | | 194,387 | |
| | 10,310 | | | Hospitality Properties Trust | | | 270,947 | |
| | 6,900 | | | Host Hotels & Resorts, Inc. | | | 116,403 | |
| | 1,850 | | | Mack-Cali Realty Corp. | | | 45,306 | |
| | 1,000 | | | Mid-America Apartment Communities, Inc. | | | 67,770 | |
| | 2,700 | | | Post Properties, Inc. | | | 133,623 | |
| | 4,700 | | | Retail Properties of America, Inc., Class A | | | 67,116 | |
| | 500 | | | SL Green Realty Corp. | | | 44,095 | |
| | 2,400 | | | Taubman Centers, Inc. | | | 180,360 | |
| | 2,622 | | | Ventas, Inc. | | | 182,124 | |
| | 2,500 | | | WP Carey, Inc. | | | 165,425 | |
| | | | | | | | |
| | | | | | | 2,795,189 | |
| | | | | | | | |
| | | | Real Estate Management & Development — 0.3% | |
| | 200 | | | Jones Lang LaSalle, Inc. | | | 18,228 | |
| | 4,900 | | | St. Joe Co. (The) (a) | | | 103,145 | |
| | | | | | | | |
| | | | | | | 121,373 | |
| | | | | | | | |
| | | | Total Financials | | | 6,749,815 | |
| | | | | | | | |
| | | | Health Care — 10.7% | |
| | | | Biotechnology — 3.3% | |
| | 2,500 | | | Alexion Pharmaceuticals, Inc. (a) | | | 230,600 | |
| | 2,600 | | | BioMarin Pharmaceutical, Inc. (a) | | | 145,054 | |
| | 3,600 | | | Medivation, Inc. (a) | | | 177,120 | |
| | 1,700 | | | Pharmacyclics, Inc. (a) | | | 135,099 | |
| | 4,300 | | | Quintiles Transnational Holdings, Inc. (a) | | | 183,008 | |
| | 4,400 | | | Vertex Pharmaceuticals, Inc. (a) | | | 351,428 | |
| | | | | | | | |
| | | | | | | 1,222,309 | |
| | | | | | | | |
| | | | Health Care Equipment & Supplies — 2.3% | |
| | 14,500 | | | Alere, Inc. (a) | | | 355,250 | |
| | 800 | | | Cooper Cos., Inc. (The) | | | 95,240 | |
SEE NOTES TO FINANCIAL STATEMENTS.
| | | | | | |
| | | |
| 6 | | | | JPMORGAN INSURANCE TRUST | | JUNE 30, 2013 |
| | | | | | | | |
| SHARES | | | SECURITY DESCRIPTION | | VALUE($) | |
| | | | | | | | |
| Common Stocks — Continued | |
| | | | Health Care Equipment & Supplies — Continued | |
| | 6,700 | | | Hologic, Inc. (a) | | | 129,310 | |
| | 3,700 | | | Zimmer Holdings, Inc. | | | 277,278 | |
| | | | | | | | |
| | | | | | | 857,078 | |
| | | | | | | | |
| | | | Health Care Providers & Services — 3.9% | |
| | 8,400 | | | AmerisourceBergen Corp. | | | 468,972 | |
| | 3,100 | | | Catamaran Corp. (a) | | | 151,032 | |
| | 5,300 | | | Community Health Systems, Inc. | | | 248,464 | |
| | 5,600 | | | HCA Holdings, Inc. | | | 201,936 | |
| | 4,100 | | | Humana, Inc. | | | 345,958 | |
| | | | | | | | |
| | | | | | | 1,416,362 | |
| | | | | | | | |
| | | | Life Sciences Tools & Services — 0.7% | |
| | 3,200 | | | Life Technologies Corp. (a) | | | 236,832 | |
| | | | | | | | |
| | | | Pharmaceuticals — 0.5% | |
| | 1,500 | | | Perrigo Co. | | | 181,500 | |
| | | | | | | | |
| | | | Total Health Care | | | 3,914,081 | |
| | | | | | | | |
| | | | Industrials — 13.7% | |
| | | | Aerospace & Defense — 1.7% | |
| | 1,200 | | | Alliant Techsystems, Inc. | | | 98,796 | |
| | 6,166 | | | Huntington Ingalls Industries, Inc. | | | 348,256 | |
| | 2,050 | | | L-3 Communications Holdings, Inc. | | | 175,767 | |
| | 200 | | | Northrop Grumman Corp. | | | 16,560 | |
| | | | | | | | |
| | | | | | | 639,379 | |
| | | | | | | | |
| | | | Airlines — 0.6% | |
| | 1,700 | | | Copa Holdings S.A., (Panama), Class A | | | 222,904 | |
| | | | | | | | |
| | | | Commercial Services & Supplies — 1.4% | |
| | 20,700 | | | KAR Auction Services, Inc. | | | 473,409 | |
| | 3,030 | | | R.R. Donnelley & Sons Co. | | | 42,450 | |
| | | | | | | | |
| | | | | | | 515,859 | |
| | | | | | | | |
| | | | Construction & Engineering — 2.6% | |
| | 13,800 | | | AECOM Technology Corp. (a) (m) | | | 438,702 | |
| | 3,000 | | | Chicago Bridge & Iron Co. N.V., (Netherlands) | | | 178,980 | |
| | 5,600 | | | KBR, Inc. | | | 182,000 | |
| | 3,200 | | | URS Corp. | | | 151,104 | |
| | | | | | | | |
| | | | | | | 950,786 | |
| | | | | | | | |
| | | | Electrical Equipment — 1.0% | |
| | 2,100 | | | Babcock & Wilcox Co. (The) | | | 63,063 | |
| | 2,950 | | | Hubbell, Inc., Class B | | | 292,050 | |
| | 500 | | | Regal-Beloit Corp. | | | 32,420 | |
| | | | | | | | |
| | | | | | | 387,533 | |
| | | | | | | | |
| | | | Machinery — 4.5% | |
| | 3,400 | | | AGCO Corp. (m) | | | 170,646 | |
| | 700 | | | Gardner Denver, Inc. | | | 52,626 | |
| | | | | | | | |
| SHARES | | | SECURITY DESCRIPTION | | VALUE($) | |
| | | | | | | | |
| | |
| | | | Machinery — Continued | | | | |
| | 5,700 | | | Ingersoll-Rand plc, (Ireland) | | | 316,464 | |
| | 2,200 | | | Lincoln Electric Holdings, Inc. | | | 125,994 | |
| | 2,000 | | | Oshkosh Corp. (a) | | | 75,940 | |
| | 4,745 | | | Parker Hannifin Corp. | | | 452,673 | |
| | 5,200 | | | Timken Co. | | | 292,656 | |
| | 2,500 | | | Toro Co. (The) | | | 113,525 | |
| | 500 | | | WABCO Holdings, Inc. (a) | | | 37,345 | |
| | | | | | | | |
| | | | | | | 1,637,869 | |
| | | | | | | | |
| | | | Marine — 0.3% | |
| | 1,200 | | | Kirby Corp. (a) | | | 95,448 | |
| | | | | | | | |
| | | | Professional Services — 1.0% | |
| | 6,600 | | | Manpowergroup, Inc. | | | 361,680 | |
| | | | | | | | |
| | | | Road & Rail — 0.5% | |
| | 5,000 | | | CSX Corp. | | | 115,950 | |
| | 1,300 | | | Landstar System, Inc. | | | 66,950 | |
| | | | | | | | |
| | | | | | | 182,900 | |
| | | | | | | | |
| | | | Trading Companies & Distributors — 0.1% | |
| | 1,300 | | | Air Lease Corp. | | | 35,867 | |
| | | | | | | | |
| | | | Total Industrials | | | 5,030,225 | |
| | | | | | | | |
| | | | Information Technology — 16.3% | |
| | | | Communications Equipment — 0.6% | |
| | 2,700 | | | Harris Corp. | | | 132,975 | |
| | 1,700 | | | Motorola Solutions, Inc. | | | 98,141 | |
| | | | | | | | |
| | | | | | | 231,116 | |
| | | | | | | | |
| | | | Computers & Peripherals — 1.4% | |
| | 7,950 | | | Western Digital Corp. | | | 493,616 | |
| | | | | | | | |
| | | | Electronic Equipment, Instruments & Components — 1.8% | |
| | 3,800 | | | Arrow Electronics, Inc. (a) | | | 151,430 | |
| | 7,200 | | | Avnet, Inc. (a) | | | 241,920 | |
| | 6,800 | | | CDW Corp. (a) | | | 126,616 | |
| | 1,800 | | | Tech Data Corp. (a) | | | 84,762 | |
| | 4,200 | | | Vishay Intertechnology, Inc. (a) | | | 58,338 | |
| | | | | | | | |
| | | | | | | 663,066 | |
| | | | | | | | |
| | | | Internet Software & Services — 1.1% | |
| | 2,200 | | | LinkedIn Corp., Class A (a) | | | 392,260 | |
| | | | | | | | |
| | | | IT Services — 4.1% | |
| | 3,150 | | | Alliance Data Systems Corp. (a) | | | 570,244 | |
| | 2,900 | | | Booz Allen Hamilton Holding Corp. | | | 50,402 | |
| | 9,900 | | | Computer Sciences Corp. | | | 433,323 | |
| | 1,300 | | | DST Systems, Inc. | | | 84,929 | |
| | 3,000 | | | Fidelity National Information Services, Inc. | | | 128,520 | |
| | 3,300 | | | Lender Processing Services, Inc. | | | 106,755 | |
SEE NOTES TO FINANCIAL STATEMENTS.
| | | | | | | | |
| | | |
| JUNE 30, 2013 | | JPMORGAN INSURANCE TRUST | | | | | 7 | |
JPMorgan Insurance Trust Intrepid Mid Cap Portfolio
SCHEDULE OF PORTFOLIO INVESTMENTS
AS OF JUNE 30, 2013 (Unaudited) (continued)
| | | | | | | | |
| SHARES | | | SECURITY DESCRIPTION | | VALUE($) | |
| | | | | | | | |
| Common Stocks — Continued | |
| | | | IT Services — Continued | |
| | 7,800 | | | VeriFone Systems, Inc. (a) | | | 131,118 | |
| | | | | | | | |
| | | | | | | 1,505,291 | |
| | | | | | | | |
| | | | Office Electronics — 0.7% | |
| | 28,700 | | | Xerox Corp. | | | 260,309 | |
| | | | | | | | |
| | | | Semiconductors & Semiconductor Equipment — 2.8% | |
| | 1,300 | | | Analog Devices, Inc. | | | 58,578 | |
| | 11,900 | | | Applied Materials, Inc. | | | 177,429 | |
| | 1,600 | | | KLA-Tencor Corp. | | | 89,168 | |
| | 1,500 | | | Lam Research Corp. (a) | | | 66,510 | |
| | 13,500 | | | LSI Corp. (a) | | | 96,390 | |
| | 25,200 | | | Marvell Technology Group Ltd., (Bermuda) | | | 295,092 | |
| | 10,600 | | | NVIDIA Corp. | | | 148,718 | |
| | 6,100 | | | Teradyne, Inc. (a) | | | 107,177 | |
| | | | | | | | |
| | | | | | | 1,039,062 | |
| | | | | | | | |
| | | | Software — 3.8% | |
| | 32,800 | | | Activision Blizzard, Inc. (m) | | | 467,728 | |
| | 700 | | | Autodesk, Inc. (a) | | | 23,758 | |
| | 14,900 | | | CA, Inc. | | | 426,587 | |
| | 2,000 | | | Cadence Design Systems, Inc. (a) | | | 28,960 | |
| | 3,100 | | | Rovi Corp. (a) | | | 70,804 | |
| | 13,300 | | | Symantec Corp. | | | 298,851 | |
| | 2,200 | | | Synopsys, Inc. (a) | | | 78,650 | |
| | | | | | | | |
| | | | | | | 1,395,338 | |
| | | | | | | | |
| | | | Total Information Technology | | | 5,980,058 | |
| | | | | | | | |
| | | | Materials — 4.7% | |
| | | | Chemicals — 2.3% | |
| | 1,200 | | | CF Industries Holdings, Inc. | | | 205,800 | |
| | 2,300 | | | Huntsman Corp. | | | 38,088 | |
| | 2,916 | | | PPG Industries, Inc. | | | 426,931 | |
| | 2,500 | | | Valspar Corp. (The) | | | 161,675 | |
| | | | | | | | |
| | | | | | | 832,494 | |
| | | | | | | | |
| | | | Containers & Packaging — 0.6% | |
| | 2,100 | | | Crown Holdings, Inc. (a) | | | 86,373 | |
| | 500 | | | Greif, Inc., Class A | | | 26,335 | |
| | 400 | | | Rock Tenn Co., Class A | | | 39,952 | |
| | 3,500 | | | Sealed Air Corp. | | | 83,825 | |
| | | | | | | | |
| | | | | | | 236,485 | |
| | | | | | | | |
| | | | Metals & Mining — 0.9% | |
| | 800 | | | Nucor Corp. | | | 34,656 | |
| | 4,000 | | | Reliance Steel & Aluminum Co. | | | 262,240 | |
| | 3,400 | | | Steel Dynamics, Inc. | | | 50,694 | |
| | | | | | | | |
| | | | | | | 347,590 | |
| | | | | | | | |
| | | | | | | | |
| SHARES | | | SECURITY DESCRIPTION | | VALUE($) | |
| | | | | | | | |
| | | | | | | | |
| | | | Paper & Forest Products — 0.9% | |
| | 1,700 | | | Domtar Corp., (Canada) | | | 113,050 | |
| | 4,800 | | | International Paper Co. | | | 212,688 | |
| | | | | | | | |
| | | | | | | 325,738 | |
| | | | | | | | |
| | | | Total Materials | | | 1,742,307 | |
| | | | | | | | |
| | | | Telecommunication Services — 1.7% | |
| | | | Diversified Telecommunication Services — 0.9% | |
| | 85,200 | | | Frontier Communications Corp. | | | 345,060 | |
| | | | | | | | |
| | | | Wireless Telecommunication Services — 0.8% | |
| | 2,400 | | | Crown Castle International Corp. (a) | | | 173,736 | |
| | 1,600 | | | SBA Communications Corp., Class A (a) | | | 118,592 | |
| | | | | | | | |
| | | | | | | 292,328 | |
| | | | | | | | |
| | | | Total Telecommunication Services | | | 637,388 | |
| | | | | | | | |
| | | | Utilities — 6.3% | |
| | | | Electric Utilities — 0.2% | |
| | 2,300 | | | NV Energy, Inc. | | | 53,958 | |
| | 500 | | | Pinnacle West Capital Corp. | | | 27,735 | |
| | | | | | | | |
| | | | | | | 81,693 | |
| | | | | | | | |
| | | | Gas Utilities — 0.6% | |
| | 5,350 | | | UGI Corp. | | | 209,239 | |
| | | | | | | | |
| | | | Independent Power Producers & Energy Traders — 0.8% | |
| | 25,800 | | | AES Corp. (m) | | | 309,342 | |
| | | | | | | | |
| | | | Multi-Utilities — 4.7% | |
| | 2,550 | | | Alliant Energy Corp. | | | 128,571 | |
| | 3,600 | | | Ameren Corp. | | | 123,984 | |
| | 11,030 | | | CenterPoint Energy, Inc. | | | 259,095 | |
| | 4,800 | | | CMS Energy Corp. | | | 130,416 | |
| | 2,400 | | | Consolidated Edison, Inc. | | | 139,944 | |
| | 4,100 | | | DTE Energy Co. | | | 274,741 | |
| | 3,150 | | | MDU Resources Group, Inc. | | | 81,616 | |
| | 3,100 | | | SCANA Corp. | | | 152,210 | |
| | 3,800 | | | Sempra Energy | | | 310,688 | |
| | 6,800 | | | TECO Energy, Inc. | | | 116,892 | |
| | | | | | | | |
| | | | | | | 1,718,157 | |
| | | | | | | | |
| | | | Total Utilities | | | 2,318,431 | |
| | | | | | | | |
| | | | Total Common Stocks
(Cost $28,162,054) | | | 36,251,942 | |
| | | | | | | | |
| | |
PRINCIPAL
AMOUNT($) | | | | | | |
| U.S. Treasury Obligation — 0.1% | |
| | 60,000 | | | U.S. Treasury Note, 0.250%, 11/30/13 (k) (Cost $60,010) | | | 60,035 | |
| | | | | | | | |
SEE NOTES TO FINANCIAL STATEMENTS.
| | | | | | |
| | | |
| 8 | | | | JPMORGAN INSURANCE TRUST | | JUNE 30, 2013 |
| | | | | | | | |
| | |
| SHARES | | | SECURITY DESCRIPTION | | VALUE($) | |
| | | | | | | | |
| Short-Term Investment — 0.9% | | | | |
| | | | Investment Company — 0.9% | | | | |
| | 314,310 | | | JPMorgan Liquid Assets Money Market Fund, Institutional Class Shares, 0.030% (b) (l) (m)
(Cost $314,310) | | | 314,310 | |
| | | | | | | | |
| | | | Total Investments — 99.8%
(Cost $28,536,374) | | | 36,626,287 | |
| | | | Other Assets in Excess of
Liabilities — 0.2% | | | 57,718 | |
| | | | | | | | |
| | | | NET ASSETS — 100.0% | | $ | 36,684,005 | |
| | | | | | | | |
Percentages indicated are based on net assets.
| | | | | | | | | | | | | | | | |
| Futures Contracts | |
NUMBER OF
CONTRACTS | | | DESCRIPTION | | EXPIRATION
DATE | | | NOTIONAL
VALUE AT
06/30/13 | | | NET UNREALIZED
APPRECIATION
(DEPRECIATION) | |
| | | | Long Futures Outstanding | | | | | | | | | | | | |
| | 4 | | | S&P Mid Cap 400 | | | 09/20/13 | | | $ | 463,160 | | | $ | (923 | ) |
| | | | | | | | | | | | | | | | |
NOTES TO SCHEDULE OF PORTFOLIO INVESTMENTS:
| | |
| REIT | | — Real Estate Investment Trust. |
| (a) | | — Non-income producing security. |
| (b) | | — Investment in affiliate. Money market fund registered under the Investment Company Act of 1940, as amended, and advised by J.P. Morgan Investment Management Inc. |
| (k) | | — All or a portion of this security is deposited with the broker as collateral for futures or with brokers as initial margin for futures contracts. |
| | |
| (l) | | — The rate shown is the current yield as of June 30, 2013. |
| (m) | | — All or a portion of this security is reserved and/or pledged with the custodian for current or potential holdings of futures, swaps, options, TBAs, when-issued securities, delayed delivery securities, reverse repurchase agreements, unfunded commitments and/or forward foreign currency exchange contracts. |
SEE NOTES TO FINANCIAL STATEMENTS.
| | | | | | | | |
| | | |
| JUNE 30, 2013 | | JPMORGAN INSURANCE TRUST | | | | | 9 | |
STATEMENT OF ASSETS AND LIABILITIES
AS OF JUNE 30, 2013 (Unaudited)
| | | | |
| | |
Intrepid Mid
Cap Portfolio | |
ASSETS: | | | | |
Investments in non-affiliates, at value | | $ | 36,311,977 | |
Investments in affiliates, at value | | | 314,310 | |
| | | | |
Total investment securities, at value | | | 36,626,287 | |
Receivables: | | | | |
Investment securities sold | | | 1,760,333 | |
Portfolio shares sold | | | 750 | |
Interest and dividends from non-affiliates | | | 44,793 | |
Dividends from affiliates | | | 20 | |
Variation margin on futures contracts | | | 146 | |
| | | | |
Total Assets | | | 38,432,329 | |
| | | | |
| |
LIABILITIES: | | | | |
Payables: | | | | |
Investment securities purchased | | | 1,660,126 | |
Portfolio shares redeemed | | | 17,473 | |
Accrued liabilities: | | | | |
Investment advisory fees | | | 19,307 | |
Distribution fees | | | 5 | |
Custodian and accounting fees | | | 6,670 | |
Trustees’ and Chief Compliance Officer’s fees | | | 19 | |
Other | | | 44,724 | |
| | | | |
Total Liabilities | | | 1,748,324 | |
| | | | |
Net Assets | | $ | 36,684,005 | |
| | | | |
| |
NET ASSETS: | | | | |
Paid-in-Capital | | $ | 27,291,646 | |
Accumulated undistributed (distributed in excess of) net investment income | | | 150,955 | |
Accumulated net realized gains (losses) | | | 1,152,414 | |
Net unrealized appreciation (depreciation) | | | 8,088,990 | |
| | | | |
Total Net Assets | | $ | 36,684,005 | |
| | | | |
| |
Net Assets: | | | | |
Class 1 | | $ | 36,661,909 | |
Class 2 | | | 22,096 | |
| | | | |
Total | | $ | 36,684,005 | |
| | | | |
| |
Outstanding units of beneficial interest (shares) (unlimited number of shares authorized, no par value): | | | | |
Class 1 | | | 1,791,989 | |
Class 2 | | | 1,081 | |
| |
Net Asset Value, offering and redemption price per share (a): | | | | |
Class 1 | | $ | 20.46 | |
Class 2 | | | 20.44 | |
| | | | |
| |
Cost of investments in non-affiliates | | $ | 28,222,064 | |
Cost of investments in affiliates | | | 314,310 | |
| (a) | Per share amounts may not recalculate due to rounding of net assets and/or shares outstanding. |
SEE NOTES TO FINANCIAL STATEMENTS.
| | | | | | |
| | | |
| 10 | | | | JPMORGAN INSURANCE TRUST | | JUNE 30, 2013 |
STATEMENT OF OPERATIONS
FOR THE SIX MONTHS ENDED JUNE 30, 2013 (Unaudited)
| | | | |
| | |
Intrepid Mid
Cap Portfolio | |
INVESTMENT INCOME: | | | | |
Dividend income from non-affiliates | | $ | 314,063 | |
Dividend income from affiliates | | | 223 | |
Interest income from non-affiliates | | | 63 | |
| | | | |
Total investment income | | | 314,349 | |
| | | | |
| |
EXPENSES: | | | | |
Investment advisory fees | | | 123,115 | |
Administration fees | | | 15,972 | |
Distribution fees — Class 2 | | | 26 | |
Custodian and accounting fees | | | 16,118 | |
Professional fees | | | 23,870 | |
Trustees’ and Chief Compliance Officer’s fees | | | 215 | |
Printing and mailing costs | | | 7,666 | |
Transfer agent fees | | | 2,337 | |
Other | | | 3,636 | |
| | | | |
Total expenses | | | 192,955 | |
| | | | |
Less amounts waived | | | (23,123 | ) |
| | | | |
Net expenses | | | 169,832 | |
| | | | |
Net investment income (loss) | | | 144,517 | |
| | | | |
| |
REALIZED/UNREALIZED GAINS (LOSSES): | | | | |
Net realized gain (loss) on transactions from: | | | | |
Investments in non-affiliates | | | 3,259,426 | |
Futures | | | 149,902 | |
| | | | |
Net realized gains (losses) | | | 3,409,328 | |
| | | | |
Change in net unrealized appreciation/depreciation of: | | | | |
Investments in non-affiliates | | | 2,698,942 | |
Futures | | | (12,663 | ) |
| | | | |
Change in net unrealized appreciation/depreciation | | | 2,686,279 | |
| | | | |
Net realized/unrealized gains (losses) | | | 6,095,607 | |
| | | | |
Change in net assets resulting from operations | | $ | 6,240,124 | |
| | | | |
SEE NOTES TO FINANCIAL STATEMENTS.
| | | | | | | | |
| | | |
| JUNE 30, 2013 | | JPMORGAN INSURANCE TRUST | | | | | 11 | |
STATEMENT OF CHANGES IN NET ASSETS
FOR THE PERIODS INDICATED
| | | | | | | | |
| | | Intrepid Mid Cap Portfolio | |
| | | Six Months Ended
6/30/2013
(Unaudited) | | | Year Ended
12/31/2012 | |
CHANGE IN NET ASSETS RESULTING FROM OPERATIONS: | | | | | | | | |
Net investment income (loss) | | $ | 144,517 | | | $ | 433,636 | |
Net realized gain (loss) | | | 3,409,328 | | | | 1,618,289 | |
Change in net unrealized appreciation/depreciation | | | 2,686,279 | | | | 3,079,445 | |
| | | | | | | | |
Change in net assets resulting from operations | | | 6,240,124 | | | | 5,131,370 | |
| | | | | | | | |
| | |
DISTRIBUTIONS TO SHAREHOLDERS: | | | | | | | | |
Class 1 | | | | | | | | |
From net investment income | | | (425,516 | ) | | | (257,920 | ) |
Class 2 | | | | | | | | |
From net investment income | | | (190 | ) | | | (100 | ) |
| | | | | | | | |
Total distributions to shareholders | | | (425,706 | ) | | | (258,020 | ) |
| | | | | | | | |
| | |
CAPITAL TRANSACTIONS: | | | | | | | | |
Change in net assets resulting from capital transactions | | | (5,187,341 | ) | | | (414,429 | ) |
| | | | | | | | |
| | |
NET ASSETS: | | | | | | | | |
Change in net assets | | | 627,077 | | | | 4,458,921 | |
Beginning of period | | | 36,056,928 | | | | 31,598,007 | |
| | | | | | | | |
End of period | | $ | 36,684,005 | | | $ | 36,056,928 | |
| | | | | | | | |
Accumulated undistributed (distributed in excess of) net investment income | | $ | 150,955 | | | $ | 432,144 | |
| | | | | | | | |
| | |
CAPITAL TRANSACTIONS: | | | | | | | | |
Class 1 | | | | | | | | |
Proceeds from shares issued | | $ | 968,464 | | | $ | 7,029,673 | |
Distributions reinvested | | | 425,516 | | | | 257,920 | |
Cost of shares redeemed | | | (6,581,511 | ) | | | (7,702,122 | ) |
| | | | | | | | |
Change in net assets resulting from Class 1 capital transactions | | $ | (5,187,531 | ) | | $ | (414,529 | ) |
| | | | | | | | |
Class 2 | | | | | | | | |
Proceeds from shares issued | | $ | — | | | $ | 2 | |
Distributions reinvested | | | 190 | | | | 100 | |
Cost of shares redeemed | | | — | | | | (2 | ) |
| | | | | | | | |
Change in net assets resulting from Class 2 capital transactions | | $ | 190 | | | $ | 100 | |
| | | | | | | | |
Total change in net assets resulting from capital transactions | | $ | (5,187,341 | ) | | $ | (414,429 | ) |
| | | | | | | | |
| | |
SHARE TRANSACTIONS: | | | | | | | | |
Class 1 | | | | | | | | |
Issued | | | 48,558 | | | | 424,954 | |
Reinvested | | | 21,567 | | | | 15,528 | |
Redeemed | | | (328,357 | ) | | | (459,751 | ) |
| | | | | | | | |
Change in Class 1 Shares | | | (258,232 | ) | | | (19,269 | ) |
| | | | | | | | |
Class 2 | | | | | | | | |
Issued | | | — | | | | 1 | |
Reinvested | | | 9 | | | | 6 | |
Redeemed | | | — | | | | — | (a) |
| | | | | | | | |
Change in Class 2 Shares | | | 9 | | | | 7 | |
| | | | | | | | |
| (a) | Amount rounds to less than 1 share. |
SEE NOTES TO FINANCIAL STATEMENTS.
| | | | | | |
| | | |
| 12 | | | | JPMORGAN INSURANCE TRUST | | JUNE 30, 2013 |
THIS PAGE IS INTENTIONALLY LEFT BLANK
| | | | | | | | |
| | | |
| JUNE 30, 2013 | | JPMORGAN INSURANCE TRUST | | | | | 13 | |
FINANCIAL HIGHLIGHTS
FOR THE PERIODS INDICATED
| | | | | | | | | | | | | | | | | | | | | | | | | | | | |
| | | | | | Per share operating performance | |
| | | | | | Investment operations | | | Distributions | |
| | | Net asset
value,
beginning
of period | | | Net
investment
income
(loss) | | | Net realized
and unrealized
gains
(losses) on
investments | | | Total from
investment
operations | | | Net
investment
income | | | Net
realized
gain | | | Total
distributions | |
Intrepid Mid Cap Portfolio | | | | | | | | | | | | | | | | | | | | | | | | | | | | |
Class 1 | | | | | | | | | | | | | | | | | | | | | | | | | | | | |
Six Months Ended June 30, 2013 (Unaudited) | | $ | 17.58 | | | $ | 0.07 | (f) | | $ | 3.03 | | | $ | 3.10 | | | $ | (0.22 | ) | | $ | — | | | $ | (0.22 | ) |
Year Ended December 31, 2012 | | | 15.26 | | | | 0.21 | (f)(g) | | | 2.24 | | | | 2.45 | | | | (0.13 | ) | | | — | | | | (0.13 | ) |
Year Ended December 31, 2011 | | | 15.62 | | | | 0.12 | (f) | | | (0.34 | ) | | | (0.22 | ) | | | (0.14 | ) | | | — | | | | (0.14 | ) |
Year Ended December 31, 2010 | | | 13.23 | | | | 0.11 | (f) | | | 2.46 | | | | 2.57 | | | | (0.18 | ) | | | — | | | | (0.18 | ) |
Year Ended December 31, 2009 | | | 9.92 | | | | 0.18 | | | | 3.30 | | | | 3.48 | | | | (0.17 | ) | | | — | | | | (0.17 | ) |
Year Ended December 31, 2008 | | | 17.82 | | | | 0.16 | | | | (6.63 | ) | | | (6.47 | ) | | | (0.08 | ) | | | (1.35 | ) | | | (1.43 | ) |
| | | | | | | |
Class 2 | | | | | | | | | | | | | | | | | | | | | | | | | | | | |
Six Months Ended June 30, 2013 (Unaudited) | | | 17.54 | | | | 0.05 | (f) | | | 3.03 | | | | 3.08 | | | | (0.18 | ) | | | — | | | | (0.18 | ) |
Year Ended December 31, 2012 | | | 15.23 | | | | 0.17 | (f)(g) | | | 2.23 | | | | 2.40 | | | | (0.09 | ) | | | — | | | | (0.09 | ) |
Year Ended December 31, 2011 | | | 15.60 | | | | 0.08 | (f) | | | (0.35 | ) | | | (0.27 | ) | | | (0.10 | ) | | | — | | | | (0.10 | ) |
Year Ended December 31, 2010 | | | 13.22 | | | | 0.08 | (f) | | | 2.46 | | | | 2.54 | | | | (0.16 | ) | | | — | | | | (0.16 | ) |
Year Ended December 31, 2009 | | | 9.90 | | | | 0.12 | | | | 3.33 | | | | 3.45 | | | | (0.13 | ) | | | — | | | | (0.13 | ) |
Year Ended December 31, 2008 | | | 17.78 | | | | 0.12 | | | | (6.61 | ) | | | (6.49 | ) | | | (0.04 | ) | | | (1.35 | ) | | | (1.39 | ) |
| (a) | Annualized for periods less than one year. |
| (b) | Not annualized for periods less than one year. |
| (c) | Includes adjustments in accordance with accounting principles generally accepted in the United States of America and as such, the net asset values for financial reporting purposes and the returns based upon those net asset values may differ from the net assets values and returns for shareholder transactions. |
| (d) | Includes earnings credits and interest expense, if applicable, each of which is less than 0.01% unless otherwise noted. |
| (e) | Portfolio turnover is calculated by dividing the lesser of total purchases or sales of portfolio securities for the reporting period by the monthly average value of portfolio securities owned during the reporting period. Excluded from both the numerator and denominator are amounts relating to derivatives and securities whose maturities or expiration dates at the time of acquisition were one year or less. |
| (f)) | Calculated based upon average shares outstanding. |
| (g) | Reflects special dividends paid out during the period by several of the Portfolio’s holdings. Had the Portfolio not received the special dividends, the net investment income (loss) per share would have been $0.16 and $0.11 for Class 1 and Class 2 Shares, respectively, and the net investment income (loss) ratio would have been 0.93% and 0.66% for Class 1 and Class 2 Shares, respectively. |
SEE NOTES TO FINANCIAL STATEMENTS.
| | | | | | |
| | | |
| 14 | | | | JPMORGAN INSURANCE TRUST | | JUNE 30, 2013 |
| | | | | | | | | | | | | | | | | | | | | | | | | | |
| | | Ratios/Supplemental data | |
| | | | | | | | | | Ratios to average net assets (a) | | | | |
Net asset
value,
end of
period | | | Total return (b)(c) | | | Net assets,
end of
period | | | Net
expenses (d) | | | Net
investment
income
(loss) | | | Expenses
without waivers,
reimbursements and
earnings credits | | | Portfolio
turnover
rate (b)(e) | |
| | | | | | | | | | | | | | | | | | | | | | | | | | |
| | | | | | | | | | | | | | | | | | | | | | | | | | |
| $ | 20.46 | | | | 17.68 | % | | $ | 36,661,909 | | | | 0.90 | % | | | 0.76 | % | | | 1.02 | % | | | 28 | % |
| | 17.58 | | | | 16.13 | | | | 36,038,129 | | | | 0.90 | | | | 1.28 | (g) | | | 1.02 | | | | 54 | |
| | 15.26 | | | | (1.52 | ) | | | 31,581,775 | | | | 0.90 | | | | 0.75 | | | | 1.08 | | | | 47 | |
| | 15.62 | | | | 19.52 | | | | 38,556,642 | | | | 0.90 | | | | 0.81 | | | | 1.22 | | | | 46 | |
| | 13.23 | | | | 35.66 | | | | 42,810,183 | | | | 0.90 | | | | 1.37 | | | | 1.15 | | | | 74 | |
| | 9.92 | | | | (38.82 | ) | | | 39,157,400 | | | | 0.90 | | | | 1.10 | | | | 1.01 | | | | 101 | |
| | | | | | |
| | | | | | | | | | | | | | | | | | | | | | | | | | |
| | 20.44 | | | | 17.58 | | | | 22,096 | | | | 1.14 | | | | 0.54 | | | | 1.27 | | | | 28 | |
| | 17.54 | | | | 15.82 | | | | 18,799 | | | | 1.15 | | | | 1.00 | (g) | | | 1.27 | | | | 54 | |
| | 15.23 | | | | (1.79 | ) | | | 16,232 | | | | 1.15 | | | | 0.52 | | | | 1.33 | | | | 47 | |
| | 15.60 | | | | 19.24 | | | | 16,528 | | | | 1.15 | | | | 0.57 | | | | 1.48 | | | | 46 | |
| | 13.22 | | | | 35.37 | | | | 13,862 | | | | 1.15 | | | | 1.14 | | | | 1.40 | | | | 74 | |
| | 9.90 | | | | (38.98 | ) | | | 10,240 | | | | 1.15 | | | | 0.87 | | | | 1.27 | | | | 101 | |
SEE NOTES TO FINANCIAL STATEMENTS.
| | | | | | | | |
| | | |
| JUNE 30, 2013 | | JPMORGAN INSURANCE TRUST | | | | | 15 | |
NOTES TO FINANCIAL STATEMENTS
AS OF JUNE 30, 2013 (Unaudited)
1. Organization
JPMorgan Insurance Trust (the “Trust”) is registered under the Investment Company Act of 1940, as amended (the “1940 Act”), as an open-end management investment company and is a Massachusetts business trust.
The following is a separate Portfolio of the Trust (the “Portfolio”) covered by this report:
| | | | |
| | | Classes Offered | | Diversified/Non-Diversified |
| Intrepid Mid Cap Portfolio | | Class 1 and Class 2 | | Diversified |
The investment objective of the Portfolio is to seek long-term capital growth by investing primarily in equity securities of companies with intermediate capitalizations.
Portfolio shares are offered only to separate accounts of participating insurance companies and Eligible Plans. Individuals may not purchase shares directly from the Portfolio.
All classes of shares have equal rights as to earnings, assets and voting privileges, except that each class may bear different distribution and service fees and each class has exclusive voting rights with respect to its distribution plan and administrative services plan.
2. Significant Accounting Policies
The following is a summary of significant accounting policies followed by the Portfolio in the preparation of its financial statements. The policies are in accordance with accounting principles generally accepted in the United States of America (“GAAP”). The preparation of financial statements requires management to make estimates and assumptions that affect the reported amounts and disclosures in the financial statements. Actual results could differ from those estimates.
A. Valuation of Investments — Equity securities listed on a North American, Central American, South American or Caribbean securities exchange shall generally be valued at the last sale price on the exchange on which the security is principally traded that is reported before the time when the net assets of the Portfolio are valued. Securities listed on the NASDAQ Stock Market LLC are generally valued at the NASDAQ Official Closing Price. Fixed income securities (other than certain short-term investments maturing in less than 61 days) are valued each day based on prices received from independent or affiliated pricing services approved by the Board of Trustees or third party broker-dealers. The pricing services or broker-dealers use multiple valuation techniques to determine fair value. In instances where sufficient market activity exists, the pricing services or broker-dealers may utilize a market-based approach through which quotes from market makers are used to determine fair value. In instances where sufficient market activity may not exist or is limited, the pricing services or broker-dealers also utilize proprietary valuation models which may consider market transactions in comparable securities and the various relationships between securities in determining fair value and/or market characteristics such as benchmark yield curves, option-adjusted spreads, credit spreads, estimated default rates, coupon-rates, anticipated timing of principal repayments, underlying collateral, and other unique security features in order to estimate the relevant cash flows, which are then discounted to calculate the fair values. Generally, short-term investments of sufficient credit quality maturing in less than 61 days are valued at amortized cost, which approximates fair value. Investments in other open-end investment companies are valued at each investment company’s net asset value per share (“NAV”) as of the report date.
Certain investments of the Portfolio may, depending upon market conditions, trade in relatively thin markets and/or in markets that experience significant volatility. As a result of these conditions, the prices used by the Portfolio to value these securities may differ from the value that would be realized if these securities were sold, and the differences could be material. Futures and options are generally valued on the basis of available market quotations. Swaps and other derivatives are valued daily, primarily using independent or affiliated pricing services approved by the Board of Trustees. If valuations are not available from such services or values received are deemed not representative of fair value, values will be obtained from a third party broker-dealer or counterparty.
Securities or other assets for which market quotations are not readily available or for which market quotations are deemed to not represent the fair value of the security or asset at the time of pricing (including certain illiquid securities) are fair valued in accordance with procedures established by and under the supervision and responsibility of the Board of Trustees. The Board of Trustees has established an Audit and Valuation Committee to assist with the oversight of the valuation of the Portfolio’s securities. JPMorgan Funds Management, Inc. (the “Administrator”, or “JPMFM”), an indirect, wholly-owned subsidiary of JPMorgan Chase & Co. (“JPMorgan”), has established a Valuation Committee (“VC”) that is comprised of senior representatives from JPMFM, J.P. Morgan Investment Management Inc. (“JPMIM” or the “Advisor”), a wholly-owned subsidiary of JPMorgan Asset Management Holdings Inc. (“JPMAM”), which is a wholly-owned subsidiary of JPMorgan, JPMorgan’s Legal and Compliance and JPMAM’s Risk Management and the Portfolio’s Chief Compliance Officer. The VC’s responsibilities include making determinations regarding Level 3 fair value measurements (“Fair Values”) and/or providing recommendations for approval to the Board of Trustees’ Audit and Valuation Committee, in accordance with the Portfolio’s valuation policies.
The VC or Board of Trustees, as applicable, primarily employs a market-based approach which may use related or comparable assets or liabilities, recent transactions, market multiples, book values, and other relevant information for the investment to determine the fair value of the investment. The VC or Board of Trustees may also use an income-based valuation approach in which the anticipated future cash flows of the investment are discounted to calculate fair value. Discounts may also be applied due to the nature or duration of any restrictions on the disposition of the investments. Valuations may be based upon current market prices of securities that are comparable in coupon, rating, maturity and industry.
| | | | | | |
| | | |
| 16 | | | | JPMORGAN INSURANCE TRUST | | JUNE 30, 2013 |
It is possible that the estimated values may differ significantly from the values that would have been used had a ready market for the investments existed, and such differences could be material. JPMFM and JPMIM are responsible for monitoring developments that may impact Fair Values and for discussing and assessing Fair Values on an ongoing, and at least a quarterly, basis with the VC and Board of Trustees, as applicable. The appropriateness of Fair Values is assessed based on results of unchanged price review and consideration of macro or security specific events, back testing and broker and vendor due diligence.
Valuations reflected in this report are as of the report date. As a result, changes in valuation due to market events and/or issuer related events after the report date and prior to issuance of the report, are not reflected herein.
The various inputs that are used in determining the fair value of the Portfolio’s investments are summarized into the three broad levels listed below.
| Ÿ | | Level 1 — quoted prices in active markets for identical securities |
| Ÿ | | Level 2 — other significant observable inputs (including quoted prices for similar securities, interest rates, prepayment speeds, credit risk, etc.) |
| Ÿ | | Level 3 — significant unobservable inputs (including the Portfolio’s own assumptions in determining the fair value of investments) |
A financial instrument’s level within the fair value hierarchy is based on the lowest level of any input, both individually and in the aggregate, that is significant to the fair value measurement. The inputs or methodology used for valuing securities are not necessarily an indication of the risk associated with investing in those securities.
The following table represents each valuation input as presented on the Schedule of Portfolio Investments (“SOI”):
| | | | | | | | | | | | | | | | |
| | | Level 1 Quoted prices | | | Level 2 Other significant observable inputs | | | Level 3 Significant unobservable inputs | | | Total | |
Total Investments in Securities (a) | | $ | 36,566,252 | | | $ | 60,035 | | | $ | — | | | $ | 36,626,287 | |
| | | | | | | | | | | | | | | | |
Depreciation in Other Financial Instruments | | | | | | | | | | | | | | | | |
Futures Contracts | | $ | (923 | ) | | $ | — | | | $ | — | | | $ | (923 | ) |
| | | | | | | | | | | | | | | | |
| (a) | All portfolio holdings designated as Level 1 and Level 2 are disclosed individually on the SOI. Level 2 consists of a U.S. Treasury Note that is held for futures collateral. Please refer to the SOI for industry specifics of portfolio holdings. |
There were no transfers between any levels during the six months ended June 30, 2013.
B. Futures Contracts — The Portfolio uses index futures contracts to gain or reduce exposure to the stock market, maintain liquidity and minimize transaction costs. The Portfolio also buys futures contracts to immediately invest incoming cash in the market or sells futures in response to cash outflows, thereby simulating an invested position in the underlying index while maintaining a cash balance for liquidity. The use of futures contracts exposes the Portfolio to equity price risk.
Futures contracts provide for the delayed delivery of the underlying instrument at a fixed price or are settled for a cash amount based on the change in the value of the underlying instrument at a specific date in the future. Upon entering into a futures contract, the Portfolio is required to deposit with the broker, cash or securities in an amount equal to a certain percentage of the contract amount, which is referred to as the initial margin deposit. Subsequent payments, referred to as variation margin, are made or received by the Portfolio periodically and are based on changes in the market value of open futures contracts. Changes in the market value of open futures contracts are recorded as unrealized appreciation or depreciation in the Statement of Operations. Realized gains or losses, representing the difference between the value of the contract at the time it was opened and the value at the time it was closed, are reported in the Statement of Operations at the closing or expiration of the futures contract. Securities deposited as initial margin are designated in the SOI and cash deposited is recorded on the Statement of Assets and Liabilities. A receivable from and/or a payable to brokers for the daily variation margin is also recorded on the Statement of Assets and Liabilities.
The Portfolio may be subject to the risk that the change in the value of the futures contract may not correlate perfectly with the underlying instrument. Use of long futures contracts subjects the Portfolio to risk of loss in excess of the amounts shown on the Statement of Assets and Liabilities, up to the notional amount of the futures contracts. Use of short futures contracts subjects the Portfolio to unlimited risk of loss. The Portfolio may enter into futures contracts only on exchanges or boards of trade. The exchange or board of trade acts as the counterparty to each futures transaction; therefore, the Portfolio’s credit risk is limited to failure of the exchange or board of trade. Under some circumstances, futures exchanges may establish daily limits on the amount that the price of a futures contract can vary from the previous day’s settlement price, which could effectively prevent liquidation of positions.
The table below discloses the volume of the Portfolio’s futures contracts activity during the six months ended June 30, 2013:
| | | | |
Futures Contracts: | | | | |
Average Notional Balance Long | | $ | 749,586 | |
Ending Notional Balance Long | | | 463,160 | |
| | | | | | | | |
| | | |
| JUNE 30, 2013 | | JPMORGAN INSURANCE TRUST | | | | | 17 | |
NOTES TO FINANCIAL STATEMENTS
AS OF JUNE 30, 2013 (Unaudited) (continued)
C. Security Transactions and Investment Income — Investment transactions are accounted for on the trade date (the date the order to buy or sell is executed). Securities gains and losses are calculated on a specifically identified cost basis. Interest income is determined on the basis of coupon interest accrued using the effective interest method which adjusts for amortization of premiums and accretion of discounts. Dividend income, net of foreign taxes withheld, if any, is recorded on the ex-dividend date or when the Portfolio first learns of the dividend.
To the extent such information is publicly available, the Portfolio records distributions received in excess of income earned from underlying investments as a reduction of cost of investments and/or realized gain. Such amounts are based on estimates if actual amounts are not available and actual amounts of income, realized gain and return of capital may differ from the estimated amounts. The Portfolio adjusts the estimated amounts of the components of distributions (and consequently its net investment income) as necessary once the issuers provide information about the actual composition of the distributions.
D. Allocation of Income and Expenses — Expenses directly attributable to a portfolio are charged directly to that portfolio, while the expenses attributable to more than one portfolio of the Trust are allocated among the respective portfolios. In calculating the NAV of each class, investment income, realized and unrealized gains and losses and expenses, other than class specific expenses, are allocated daily to each class of shares based upon the proportion of net assets of each class at the beginning of each day.
E. Federal Income Taxes — The Portfolio is treated as a separate taxable entity for Federal income tax purposes. The Portfolio’s policy is to comply with the provisions of the Internal Revenue Code of 1986, as amended (the “Code”), applicable to regulated investment companies and to distribute to shareholders all of its distributable net investment income and net realized gain on investments. Accordingly, no provision for Federal income tax is necessary. The Portfolio is also a segregated portfolio of assets for insurance purposes and intends to comply with the diversification requirements of Subchapter L of the Code. Management has reviewed the Portfolio’s tax positions for all open tax years and has determined that as of June 30, 2013, no liability for income tax is required in the Portfolio’s financial statements for net unrecognized tax benefits. However, management’s conclusions may be subject to future review based on changes in, or the interpretation of, the accounting standards or tax laws and regulations. The Portfolio’s Federal tax returns for the prior three fiscal years remain subject to examination by the Internal Revenue Service.
F. Distributions to Shareholders — Distributions from net investment income are generally declared and paid at least annually and are declared separately for each class. No class has preferential dividend rights; differences in per share rates are due to differences in separate class expenses. Net realized capital gains, if any, are distributed at least annually. The amount of distributions from net investment income and net realized capital gains is determined in accordance with Federal income tax regulations, which may differ from GAAP. To the extent these “book/tax” differences are permanent in nature (i.e., that they result from other than timing of recognition — “temporary differences”), such amounts are reclassified within the capital accounts based on their Federal tax-basis treatment.
3. Fees and Other Transactions with Affiliates
A. Investment Advisory Fee — Pursuant to the Investment Advisory Agreement, JPMIM supervises the investments of the Portfolio and for such services is paid a fee. The fee is accrued daily and paid monthly based on the Portfolio’s average daily net assets at an annual rate of 0.65%.
The Advisor waived Investment Advisory fees and/or reimbursed expenses as outlined in Note 3.E.
B. Administration Fee — Pursuant to an Administration Agreement, the Administrator provides certain administration services to the Portfolio. In consideration of these services, the Administrator receives a fee accrued daily and paid monthly at an annual rate of 0.15% of the first $25 billion of the average daily net assets of all funds in the J.P. Morgan Funds Complex (excluding certain funds of funds and money market funds) and 0.075% of the average daily net assets in excess of $25 billion of all such funds. For the six months ended June 30, 2013, the annualized effective rate was 0.08% of the Portfolio’s average daily net assets, notwithstanding any fee waivers and/or reimbursements.
JPMorgan Chase Bank, N.A. (“JPMCB”), a wholly-owned subsidiary of JPMorgan, serves as the Portfolio’s sub-administrator (the “Sub-administrator”). For its services as Sub-administrator, JPMCB receives a portion of the fees payable to the Administrator.
The Administrator waived Administration fees as outlined in Note 3.E.
C. Distribution Fees — Pursuant to a Distribution Agreement, JPMorgan Distribution Services, Inc. (the “Distributor”), a wholly-owned subsidiary of JPMorgan, serves as the Trust’s exclusive underwriter and promotes and arranges for the sale of the Portfolio’s shares.
The Board of Trustees has adopted a Distribution Plan (the “Distribution Plan”) for Class 2 Shares of the Portfolio in accordance with Rule 12b-1 under the 1940 Act. The Distribution Plan provides that the Portfolio shall pay distribution fees, including payments to the Distributor, at an annual rate of 0.25% of the average daily net assets of Class 2 Shares.
D. Custodian and Accounting Fees — JPMCB provides portfolio custody and accounting services to the Portfolio. The amounts paid directly to JPMCB by the Portfolio for custody and accounting services are included in Custodian and accounting fees in the Statement of Operations. Payments to the custodian may be reduced by credits earned by the Portfolio, based on uninvested cash balances held by the custodian. Such earnings credits, if any, are presented separately in the Statement of Operations.
Interest expense, if any, paid to the custodian related to cash overdrafts is included in Interest expense to affiliates in the Statement of Operations.
| | | | | | |
| | | |
| 18 | | | | JPMORGAN INSURANCE TRUST | | JUNE 30, 2013 |
E. Waivers and Reimbursements — The Advisor, Administrator and Distributor (for Class 2 Shares) have contractually agreed to waive fees and/or reimburse the Portfolio to the extent that total annual operating expenses (excluding acquired fund fees and expenses, dividend expenses related to short sales, interest, taxes, expenses related to litigation and potential litigation, extraordinary expenses and expenses related to the Board of Trustees’ deferred compensation plan) exceed the percentages of the Portfolio’s respective average daily net assets as shown in the table below:
| | | | | | |
| | | Class 1 | | Class 2 | |
| | 0.90% | | | 1.15 | % |
The expense limitation agreements were in effect for the six months ended June 30, 2013. The contractual expense limitation percentages in the table above are in place until at least April 30, 2014.
For the six months ended June 30, 2013, the Portfolio’s service providers waived fees for the Portfolio as follows. None of these parties expect the Portfolio to repay any such waived fees in future years.
| | | | | | | | | | | | |
| | | Contractual Waivers | |
| | | Investment
Advisory | | | Administration | | | Total | |
| | $ | 6,488 | | | $ | 15,972 | | | $ | 22,460 | |
Additionally, the Portfolio may invest in one or more money market funds advised by the Advisor or its affiliates. The Advisor, Administrator and the Distributor waive fees in an amount sufficient to offset the respective fees each charges to the affiliated money market fund on the Portfolio’s investment in such affiliated money market fund. A portion of the waiver is voluntary.
The amount of waivers resulting from investments in these money market funds for the six months ended June 30, 2013 was $663.
F. Other — Certain officers of the Trust are affiliated with the Advisor, the Administrator and the Distributor. Such officers, with the exception of the Chief Compliance Officer, receive no compensation from the Portfolio for serving in their respective roles.
The Board of Trustees appointed a Chief Compliance Officer to the Portfolio in accordance with Federal securities regulations. The Portfolio, along with other affiliated portfolios, makes reimbursement payments, on a pro-rata basis, to the Administrator for a portion of the fees associated with the Office of the Chief Compliance Officer. Such fees are included in Trustees’ and Chief Compliance Officer’s fees in the Statement of Operations.
The Trust adopted a Trustee Deferred Compensation Plan (the “Plan”) which allows the Independent Trustees to defer the receipt of all or a portion of compensation related to performance of their duties as Trustees. The deferred fees are invested in various J.P. Morgan Funds until distribution in accordance with the Plan.
During the six months ended June 30, 2013, the Portfolio may have purchased securities from an underwriting syndicate in which the principal underwriter or members of the syndicate are affiliated with the Advisor.
The Portfolio may use related party broker-dealers. For the six months ended June 30, 2013, the Portfolio did not incur any brokerage commissions with broker-dealers affiliated with the Advisor.
The Securities and Exchange Commission has granted an exemptive order permitting the Portfolio to engage in principal transactions with J.P. Morgan Securities, Inc., an affiliated broker, involving taxable money market instruments, subject to certain conditions.
4. Investment Transactions
During the six months ended June 30, 2013, purchases and sales of investments (excluding short-term investments) were as follows:
| | | | | | | | |
| | | Purchases
(excluding U.S.
Government) | | | Sales
(excluding U.S.
Government) | |
| | $ | 10,308,320 | | | $ | 15,047,570 | |
During the six months ended June 30, 2013, there were no purchases or sales of U.S. Government securities.
5. Federal Income Tax Matters
For Federal income tax purposes, the cost and unrealized appreciation (depreciation) in value of investment securities held at June 30, 2013 were as follows:
| | | | | | | | | | | | | | | | |
| | | Aggregate
Cost | | | Gross
Unrealized
Appreciation | | | Gross
Unrealized
Depreciation | | | Net Unrealized
Appreciation
(Depreciation) | |
| | $ | 28,536,374 | | | $ | 8,552,009 | | | $ | 462,096 | | | $ | 8,089,913 | |
| | | | | | | | |
| | | |
| JUNE 30, 2013 | | JPMORGAN INSURANCE TRUST | | | | | 19 | |
NOTES TO FINANCIAL STATEMENTS
AS OF JUNE 30, 2013 (Unaudited) (continued)
Under the Regulated Investment Company Modernization Act of 2010 (the “Act”), net capital losses recognized by the Portfolio after December 31, 2010 may get carried forward indefinitely, and retain their character as short-term and/or long-term losses. Prior to the Act, net capital losses incurred by the Portfolio were carried forward for eight years and treated as short-term losses. The Act requires that post-enactment net capital losses be used before pre-enactment net capital losses.
At December 31, 2012, the Portfolio did not have any post-enactment net capital loss carryforwards.
At December 31, 2012, the Portfolio had pre-enactment net capital loss carryforwards, expiring during the year indicated, which are available to offset future realized gains:
| | | | | | | | |
| | | 2017 | | | Total | |
| | $ | 2,125,334 | | | $ | 2,125,334 | |
6. Borrowings
The Trust and JPMCB have entered into a financing arrangement. Under this arrangement, JPMCB provides an unsecured, uncommitted credit facility in the aggregate amount of $100 million to certain of the J.P. Morgan Funds, including the Portfolio. Advances under the arrangement are taken primarily for temporary or emergency purposes, including the meeting of redemption requests that otherwise might require the untimely disposition of securities, and are subject to the Portfolio’s borrowing restrictions. Interest on borrowings is payable at a rate determined by JPMCB at the time of borrowing. This agreement has been extended until November 11, 2013.
The Portfolio had no borrowings outstanding from the unsecured, uncommitted credit facility at June 30, 2013, or at any time during the six months then ended.
Interest expense paid, if any, as a result of borrowings from the unsecured, uncommitted credit facility is included in Interest expense to affiliates in the Statement of Operations.
7. Risks, Concentrations and Indemnifications
In the normal course of business, the Portfolio enters into contracts that contain a variety of representations which provide general indemnifications. The Portfolio’s maximum exposure under these arrangements is unknown. The amount of exposure would depend on future claims that may be made against the Portfolio that have not yet occurred. However, based on experience, the Portfolio expects the risk of loss to be remote.
The Portfolio has several shareholders holding a significant percentage of shares outstanding. Investment activities of these shareholders could have a material impact on the Portfolio.
| | | | | | |
| | | |
| 20 | | | | JPMORGAN INSURANCE TRUST | | JUNE 30, 2013 |
SCHEDULE OF SHAREHOLDER EXPENSES
(Unaudited)
Hypothetical $1,000 Investment
As a shareholder of the Portfolio, you incur ongoing costs, including investment advisory fees, administration fees, distribution fees (for Class 2 Shares) and other Portfolio expenses. Because the Portfolio is a funding vehicle for Policies and Eligible Plans, you may also incur sales charges and other fees relating to the Policies or Eligible Plans. The examples below are intended to help you understand your ongoing costs (in dollars) of investing in the Portfolio, but not the costs of the Policies or Eligible Plans, and to compare these ongoing costs with the ongoing costs of investing in other mutual funds. The examples assume that you had a $1,000 investment in each Class at the beginning of the reporting period, January 1, 2013, and continued to hold your shares at the end of the reporting period, June 30, 2013.
Actual Expenses
For each Class of the Portfolio in the table below, the first line provides information about actual account values and actual expenses. You may use the information in this line, together with the amount you invested, to estimate the expenses that you paid over the period. Simply divide your account value by $1,000 (for example, an $8,600 account value divided by $1,000 = 8.6), then multiply the result by the number in the first line of each Class under the heading entitled “Expenses Paid During the Period” to estimate the expenses you paid on your account during this period.
Hypothetical Example for Comparison Purposes
The second line of each Class in the table below provides information about hypothetical account values and hypothetical expenses based on the Class’ actual expense ratio and an assumed rate of return of 5% per year before expenses, which is not the Class’ actual return. The hypothetical account values and expenses may not be used to estimate the actual ending account balance or expenses you paid for the period. You may use this information to compare the ongoing costs of investing in the Class of the Portfolio and other portfolios. To do so, compare this 5% hypothetical example with the 5% hypothetical examples that appear in the shareholder reports of the other funds. Please note that the expenses shown in the table are meant to highlight your ongoing costs only and do not reflect any transaction costs, such as sales charges (loads) or redemption fees or the costs associated with the Policies and Eligible Plans through which the Portfolio is held. Therefore, the second line for each Class in the table is useful in comparing ongoing costs only, and will not help you determine the relative total costs of owning different portfolios. In addition, if these transaction costs were included, your costs would have been higher. The examples also assume all dividends and distributions have been reinvested.
| | | | | | | | | | | | | | | | |
| | | Beginning
Account Value,
January 1, 2013 | | | Ending
Account Value
June 30, 2013 | | | Expenses
Paid During
the Period* | | | Annualized
Expense
Ratio | |
Intrepid Mid Cap Portfolio | | | | | | | | | | | | | | | | |
Class 1 | | | | | | | | | | | | | | | | |
Actual | | $ | 1,000.00 | | | $ | 1,176.80 | | | $ | 4.86 | | | | 0.90 | % |
Hypothetical | | | 1,000.00 | | | | 1,020.33 | | | | 4.51 | | | | 0.90 | |
Class 2 | | | | | | | | | | | | | | | | |
Actual | | | 1,000.00 | | | | 1,175.80 | | | | 6.15 | | | | 1.14 | |
Hypothetical | | | 1,000.00 | | | | 1,019.14 | | | | 5.71 | | | | 1.14 | |
| * | Expenses are equal to each Class’ respective annualized expense ratio, multiplied by the average account value over the period, multiplied by 181/365 (to reflect the one-half year period). |
| | | | | | | | |
| | | |
| JUNE 30, 2013 | | JPMORGAN INSURANCE TRUST | | | | | 21 | |
J.P. Morgan Funds are distributed by JPMorgan Distribution Services, Inc., which is an affiliate of JPMorgan Chase & Co. Affiliates of JPMorgan Chase & Co. receive fees for providing various services to the funds.
Contact JPMorgan Distribution Services, Inc. at 1-800-480-4111 for a portfolio prospectus. You can also visit us at www.jpmorganfunds.com. Investors should carefully consider the investment objectives and risk as well as charges and expenses of the mutual fund before investing. The prospectus contains this and other information about the mutual fund. Read the prospectus carefully before investing.
The Portfolio files a complete schedule of its portfolio holdings for the first and third quarters of its fiscal year with the SEC on Form N-Q. The Portfolio’s Forms N-Q are available on the SEC’s website at http://www.sec.gov and may be reviewed and copied at the SEC’s Public Reference Room in Washington, DC. Information on the operation of the SEC’s Public Reference Room may be obtained by calling 1-800-SEC-0330. Shareholders may request the Form N-Q without charge by calling 1-800-480-4111 or by visiting the variable insurance portfolio section of the J.P. Morgan Funds’ website at www.jpmorganfunds.com.
A description of the Portfolio’s policies and procedures with respect to the disclosure of the Portfolio’s holdings is available in the prospectus and Statement of Additional Information.
A copy of proxy policies and procedures is available without charge upon request by calling 1-800-480-4111 and on the Portfolio’s website at www.jpmorganfunds.com. A description of such policies and procedures is on the SEC’s website at www.sec.gov. The Trustees have delegated the authority to vote proxies for securities owned by the Portfolio to the Advisor. A copy of the Portfolio’s voting record for the most recent 12-month period ended June 30 is available on the SEC’s website at www.sec.gov or at the Portfolio’s website at www.jpmorganfunds.com no later than August 31 of each year. The Portfolio’s proxy voting record will include, among other things, a brief description of the matter voted on for each portfolio security, and will state how each vote was cast, for example, for or against the proposal.
| | | | |
| | © JPMorgan Chase & Co., 2013. All rights reserved. June 2013 | | SAN-JPMITIMCP-613 |
Semi-Annual Report
JPMorgan Insurance Trust
June 30, 2013 (Unaudited)
JPMorgan Insurance Trust Mid Cap Growth Portfolio
| | | | |
NOT FDIC INSURED Ÿ NO BANK GUARANTEE Ÿ MAY LOSE VALUE
| | |  | |
CONTENTS
Investments in the Portfolio are not bank deposits or obligations of, or guaranteed or endorsed by, any bank and are not insured or guaranteed by the FDIC, the Federal Reserve Board or any other government agency. You could lose money if you sell when the Portfolio’s share price is lower than when you invested.
Past performance is no guarantee of future performance. The general market views expressed in this report are opinions based on market and other conditions through the end of the reporting period and are subject to change without notice. These views are not intended to predict the future performance of the Portfolio or the securities markets. References to specific securities and their issuers are for illustrative purposes only and are not intended to be, and should not be interpreted as, recommendations to purchase or sell such securities. Such views are not meant as investment advice and may not be relied on as an indication of trading intent on behalf of the Portfolio.
This Portfolio is intended to be a funding vehicle for variable annuity contracts and variable life insurance policies (collectively “Policies”) offered by separate accounts of participating insurance companies. Portfolio shares are also offered through qualified pension and retirement plans (“Eligible Plans”). Individuals may not purchase shares directly from the Portfolio.
Prospective investors should refer to the Portfolio’s prospectus for a discussion of the Portfolio’s investment objective, strategies and risks. Call J.P. Morgan Funds Service Center at 1-800-480-4111 for a prospectus containing more complete information about the Portfolio, including management fees and other expenses. Please read it carefully before investing.
CEO’s LETTER
July 26, 2013 (Unaudited)
Dear Shareholder:
While somewhat overshadowed by increased volatility at the end of the reporting period, developed market equities in aggregate posted solid returns for the six months ended June 30, 2013. For much of the period, stocks were supported by solid corporate earnings and robust demand from investors looking to generate higher returns in the low interest rate environment. Despite signaling a potential policy shift in June 2013, the U.S. Federal Reserve (“Fed”) continued to pursue its highly accommodative policies in an attempt to lower unemployment and spur the economy. Central banks overseas also did their part to support their economies. The European Central Bank (“ECB”) remained committed to preserving the euro, as it cut rates and introduced new programs designed to aid struggling euro zone members. Elsewhere, the Bank of Japan stepped up its major asset purchase program as a new pro-growth government came into power late in 2012.
| | |
 | | “We are encouraged by the stock market’s resiliency in the face of recent volatility.” |
Positive investor sentiment was temporarily interrupted, however, in May 2013 when Fed Chairman Bernanke indicated that the central bank may begin to “taper” its asset purchase program later this year. This triggered a sharp decline in global equities, although they quickly regained their footing and have continued to rally in July. All told, U.S. stocks rose sharply during the six months ended June 30, 2013. Overseas, international developed stocks produced more modest gains, while emerging market equities performed poorly given concerns regarding China’s economy and falling commodity prices.
U.S. Treasury Yields Rise Sharply
Talk of Fed tapering negatively impacted the fixed income markets. While U.S. Treasury security yields continued to be low
from a historical perspective, they ended the period sharply higher than when the reporting period began. The yield for 10-year U.S. Treasury securities ended June 30, 2013 at 2.52%, while the yields for 2- and 30-year U.S. Treasury securities finished the reporting period at 0.36% and 3.52%, respectively. Amid the rising interest rate environment, the overall U.S. fixed income market generated a negative return for the reporting period. In contrast, high yield bonds posted a modest gain, while emerging market debt securities fell sharply.
Positive Signs for Stocks
Although the global economy is far from robust, it is still on a growth path. The expansion in the U.S. certainly appears to be sustainable and, while Europe remains in a recession, there are indications that its economy may be bottoming. Elsewhere, pro-growth initiatives in Japan have thus far yielded positive results. While growth in China has moderated, we believe the government has the tools at its disposal to avoid a “hard landing.”
We are encouraged by the stock market’s resiliency in the face of recent volatility. In addition, there have been signs that equity market correlations are decreasing, which could create a more favorable environment for active managers. In addition, given the recent sell-off in the bond market, valuations in a number of fixed income sectors have become more attractive.
On behalf of everyone at J.P. Morgan Asset Management, thank you for your continued support. We look forward to managing your investment needs for years to come. Should you have any questions, please visit www.jpmorganfunds.com or contact the J.P. Morgan Funds Service Center at 1-800-480-4111.
Sincerely yours,

George C.W. Gatch
CEO, Global Funds Management
J.P. Morgan Asset Management
| | | | | | | | |
| | | |
| JUNE 30, 2013 | | JPMORGAN INSURANCE TRUST | | | | | 1 | |
JPMorgan Insurance Trust Mid Cap Growth Portfolio
PORTFOLIO COMMENTARY
SIX MONTHS ENDED JUNE 30, 2013 (Unaudited)
| | | | |
| REPORTING PERIOD RETURN: | |
| Portfolio (Class 1 Shares)* | | | 15.91% | |
| Russell Midcap Growth Index | | | 14.70% | |
| |
| Net Assets as of 6/30/2013 | | $ | 50,726,311 | |
INVESTMENT OBJECTIVE**
The JPMorgan Insurance Trust Mid Cap Growth Portfolio (the “Portfolio”) seeks capital growth over the long term.
HOW DID THE MARKET PERFORM?
Despite periods of heightened volatility and a setback in June, the overall U.S. equity market, as measured by the S&P 500 Index (“S&P 500”), generated strong results for the six months ended June 30, 2013. The S&P 500 generated a positive return for each of the first five months of the reporting period. Supporting the market were overall solid corporate profits, improving economic growth and generally robust investor demand. These factors helped the S&P 500 to post several all-time highs over the first five months of 2013. The S&P 500 then reversed course and declined during the last month of the reporting period. This turnaround was triggered by indications that the U.S. Federal Reserve Board (“Fed”) would begin tapering its monthly purchases of bonds — $85 billion of mortgage-backed securities and Treasury securities — if economic conditions continued to improve. This caused interest rates to move sharply higher and both stock and bond prices fell sharply. However, the S&P 500 again rallied in late June, as concerns regarding Fed tapering abated somewhat. All told, mid-cap growth stocks, as measured by the Russell Midcap Growth Index (the “Benchmark”), finished the six months ended June 30, 2013 with a 14.70% gain.
WHAT WERE THE MAIN DRIVERS OF THE PORTFOLIO’S PERFORMANCE?
The Portfolio (Class 1 Shares) outperformed the Benchmark for the six months ended June 30, 2013. The Portfolio’s stock selection in the financial services and health care sectors was the main contributor to relative performance. The Portfolio’s stock selection in the consumer discretionary sector, and an underweight to consumer staples, detracted from relative performance.
Individual contributors to relative performance included the Portfolio’s positions in Tesla Motors, Inc., FleetCor Technologies, Inc. and Valeant Pharmaceuticals International, Inc. Tesla Motors, Inc., an electric car maker, released strong first
quarter 2013 results, as the company showed that it was a successful new entrant into the automotive industry. The company was ramping up production of its technology-leading Model S luxury electric sedan, and appeared to be moving into positive free cash flow territory. Shares of FleetCor Technologies, Inc., a global payments solutions provider in the transportation sector, rose as the company continued to have organic growth and make progress on improving its recent acquisitions in international markets where the industry is in its infancy of development. Shares of Valeant Pharmaceuticals International, Inc. continued to benefit from solid execution on the firm’s core strategy, including the announced acquisition of Bausch and Lomb, which could be a highly accretive deal set to close later this year.
Individual detractors to relative performance included positions in F5 Networks Inc., a leader in application delivery networking, Thoratec Corp., a circulatory medical device maker, and Aruba Networks, Inc., a networking vendor selling enterprise wireless local area network (LAN) and networking equipment. F5 Networks has struggled as investors have questioned the validity of its growth rate. Thoratec Corp. has underperformed due to poor execution and declining market share, as well as company growth falling below expectations. Aruba Networks has struggled with meeting high growth expectations and, as a result, has experienced a sharply declining share price.
HOW WAS THE PORTFOLIO POSITIONED?
The portfolio managers utilized a bottom-up approach to stock selection, rigorously researching individual companies in an effort to construct a portfolio of stocks that have strong fundamentals. The portfolio managers preferred to invest in high quality companies with durable franchises that, in their view, possessed the ability to generate strong future earnings growth.
As a result of this bottom-up stock selection process, the Portfolio’s largest overweights versus the Benchmark were in the producer durables and financial services sectors. The Portfolio’s largest underweights versus the Benchmark were in the consumer staples and consumer durables sectors.
| | | | | | |
| | | |
| 2 | | | | JPMORGAN INSURANCE TRUST | | JUNE 30, 2013 |
| | | | | | | | |
| TOP TEN EQUITY HOLDINGS OF THE PORTFOLIO*** | |
| | 1. | | | O’Reilly Automotive, Inc. | | | 2.6 | % |
| | 2. | | | Sherwin-Williams Co. (The) | | | 2.1 | |
| | 3. | | | Alliance Data Systems Corp. | | | 1.9 | |
| | 4. | | | Harley-Davidson, Inc. | | | 1.8 | |
| | 5. | | | Michael Kors Holdings Ltd. (Hong Kong) | | | 1.8 | |
| | 6. | | | Pall Corp. | | | 1.8 | |
| | 7. | | | Valeant Pharmaceuticals International, Inc. | | | 1.8 | |
| | 8. | | | Avago Technologies Ltd. (Singapore) | | | 1.7 | |
| | 9. | | | Amphenol Corp., Class A | | | 1.7 | |
| | 10. | | | J.B. Hunt Transport Services, Inc. | | | 1.6 | |
| | | | |
PORTFOLIO COMPOSITION BY SECTOR*** | |
| Consumer Discretionary | | | 22.4 | % |
| Industrials | | | 20.0 | |
| Information Technology | | | 18.7 | |
| Health Care | | | 15.1 | |
| Financials | | | 10.5 | |
| Energy | | | 6.6 | |
| Materials | | | 3.6 | |
| Consumer Staples | | | 1.4 | |
| Short-Term Investment | | | 1.7 | |
| * | | The return shown is based on net asset values calculated for shareholder transactions and may differ from the return shown in the financial highlights, which reflects adjustments made to the net asset values in accordance with accounting principles generally accepted in the United States of America. |
| ** | | The advisor seeks to achieve the Portfolio’s objective. There can be no guarantee it will be achieved. |
| *** | | Percentages indicated are based on total investments as of June 30, 2013. The Portfolio’s composition is subject to change. |
| | | | | | | | |
| | | |
| JUNE 30, 2013 | | JPMORGAN INSURANCE TRUST | | | | | 3 | |
JPMorgan Insurance Trust Mid Cap Growth Portfolio
PORTFOLIO COMMENTARY
SIX MONTHS ENDED JUNE 30, 2013 (Unaudited) (continued)
| | | | | | | | | | | | | | | | | | | | |
AVERAGE ANNUAL TOTAL RETURNS AS OF JUNE 30, 2013 | |
| | | | | |
| | | INCEPTION DATE
OF CLASS | | | 6 MONTH* | | | 1 YEAR | | | 5 YEAR | | | 10 YEAR | |
CLASS 1 SHARES | | | 8/1/94 | | | | 15.91 | % | | | 24.45 | % | | | 6.65 | % | | | 9.08 | % |
CLASS 2 SHARES | | | 8/16/06 | | | | 15.77 | | | | 24.10 | | | | 6.37 | | | | 8.89 | |
TEN YEAR PERFORMANCE (06/30/03 TO 06/30/13)
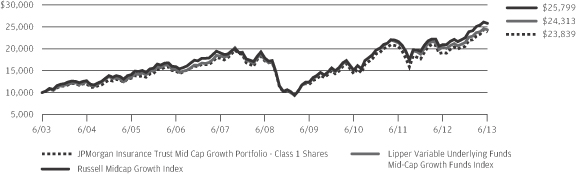
The performance quoted is past performance and is not a guarantee of future results. Mutual funds are subject to certain market risks. Investment returns and principal value of an investment will fluctuate so that an investor’s shares, when redeemed, may be worth more or less than their original cost. Current performance may be higher or lower than the performance data shown. For up-to-date month-end performance information please call 1-800-480-4111.
Returns for Class 2 Shares prior to its inception date are based on the performance of Class 1 Shares. The actual returns of Class 2 Shares would have been lower than shown because Class 2 Shares have higher expenses than Class 1 Shares.
The graph illustrates comparative performance for $10,000 invested in Class 1 Shares of the JPMorgan Insurance Trust Mid Cap Growth Portfolio, the Russell Midcap Growth Index and the Lipper Variable Underlying Funds Mid-Cap Growth Funds Index from June 30, 2003 to June 30, 2013. The performance of the Portfolio assumes reinvestment of all dividends and capital gains distributions, if any. The performance of the Russell Midcap Growth Index does not reflect the deduction of expenses associated with a mutual fund and has been adjusted to reflect reinvestment of all dividends and capital gains distributions
of the securities included in the benchmark, if applicable. The performance of the Lipper Variable Underlying Funds Mid-Cap Growth Funds Index includes expenses associated with a mutual fund, such as investment management fees. These expenses are not identical to the expenses incurred by the Portfolio. The Russell Midcap Growth Index is an unmanaged index which measures the performance of those Russell Midcap companies with higher price-to-book ratios and higher forecasted growth values. The Lipper Variable Underlying Funds Mid-Cap Growth Funds Index is an index based on the total returns of certain mutual funds within the Portfolio’s designated category as determined by Lipper, Inc. Investors cannot invest directly in an index.
Portfolio performance does not reflect any charges imposed by the Policies or Eligible Plans. If these charges were included, the returns would be lower than shown. Portfolio performance may reflect the waiver of the Portfolio’s fees and reimbursement of expenses for certain periods since the inception date. Without these waivers and reimbursements, performance would have been lower.
The returns shown are based on net asset values calculated for shareholder transactions and may differ from the returns shown in the financial highlights, which reflect adjustments made to the net asset values in accordance with accounting principles generally accepted in the United States of America.
| | | | | | |
| | | |
| 4 | | | | JPMORGAN INSURANCE TRUST | | JUNE 30, 2013 |
JPMorgan Insurance Trust Mid Cap Growth Portfolio
SCHEDULE OF PORTFOLIO INVESTMENTS
AS OF JUNE 30, 2013 (Unaudited)
| | | | | | | | |
| SHARES | | | SECURITY DESCRIPTION | | VALUE($) | |
| | | | | | | | |
| Common Stocks — 97.9% | |
| | | | Consumer Discretionary — 22.3% | | | | |
| | | | Automobiles — 2.6% | |
| | 17,000 | | | Harley-Davidson, Inc. | | | 931,940 | |
| | 3,625 | | | Tesla Motors, Inc. (a) | | | 389,434 | |
| | | | | | | | |
| | | | | | | 1,321,374 | |
| | | | | | | | |
| | | | Hotels, Restaurants & Leisure — 3.0% | |
| | 20,100 | | | Marriott International, Inc., Class A | | | 811,437 | |
| | 5,700 | | | Wynn Resorts Ltd. | | | 729,600 | |
| | | | | | | | |
| | | | | | | 1,541,037 | |
| | | | | | | | |
| | | | Household Durables — 1.1% | |
| | 5,100 | | | Mohawk Industries, Inc. (a) | | | 573,699 | |
| | | | | | | | |
| | | | Media — 1.6% | | | | |
| | 6,000 | | | Discovery Communications, Inc., Class A (a) | | | 463,260 | |
| | 5,800 | | | Madison Square Garden Co. (The), Class A (a) | | | 343,650 | |
| | | | | | | | |
| | | | | | | 806,910 | |
| | | | | | | | |
| | | | Specialty Retail — 10.3% | |
| | 9,800 | | | GameStop Corp., Class A | | | 411,894 | |
| | 15,100 | | | GNC Holdings, Inc., Class A | | | 667,571 | |
| | 11,500 | | | O’Reilly Automotive, Inc. (a) | | | 1,295,130 | |
| | 1,100 | | | PetSmart, Inc. | | | 73,689 | |
| | 11,900 | | | Ross Stores, Inc. | | | 771,239 | |
| | 5,825 | | | Tractor Supply Co. | | | 685,078 | |
| | 15,100 | | | Urban Outfitters, Inc. (a) | | | 607,322 | |
| | 13,000 | | | Williams-Sonoma, Inc. | | | 726,570 | |
| | | | | | | | |
| | | | | | | 5,238,493 | |
| | | | | | | | |
| | | | Textiles, Apparel & Luxury Goods — 3.7% | |
| | 8,400 | | | Lululemon Athletica, Inc., (Canada) (a) | | | 550,368 | |
| | 14,800 | | | Michael Kors Holdings Ltd., (Hong Kong) (a) | | | 917,896 | |
| | 6,400 | | | Under Armour, Inc., Class A (a) | | | 382,144 | |
| | | | | | | | |
| | | | | | | 1,850,408 | |
| | | | | | | | |
| | | | Total Consumer Discretionary | | | 11,331,921 | |
| | | | | | | | |
| | | | Consumer Staples — 1.4% | | | | |
| | | | Food Products — 0.6% | |
| | 18,800 | | | WhiteWave Foods Co., Class A (a) | | | 305,500 | |
| | | | | | | | |
| | | | Personal Products — 0.8% | | | | |
| | 18,900 | | | Avon Products, Inc. | | | 397,467 | |
| | | | | | | | |
| | | | Total Consumer Staples | | | 702,967 | |
| | | | | | | | |
| | | | Energy — 6.6% | | | | |
| | | | Energy Equipment & Services — 2.0% | |
| | 7,070 | | | Cameron International Corp. (a) | | | 432,401 | |
| | 8,000 | | | Oceaneering International, Inc. | | | 577,600 | |
| | | | | | | | |
| | | | | | | 1,010,001 | |
| | | | | | | | |
| | | | | | | | |
| SHARES | | | SECURITY DESCRIPTION | | VALUE($) | |
| | | | | | | | |
| | | | | | | | |
| | | | Oil, Gas & Consumable Fuels — 4.6% | |
| | 10,600 | | | Cabot Oil & Gas Corp. | | | 752,812 | |
| | 7,500 | | | Concho Resources, Inc. (a) | | | 627,900 | |
| | 8,800 | | | Plains All American Pipeline LP | | | 491,128 | |
| | 6,100 | | | Range Resources Corp. | | | 471,652 | |
| | | | | | | | |
| | | | | | | 2,343,492 | |
| | | | | | | | |
| | | | Total Energy | | | 3,353,493 | |
| | | | | | | | |
| | | | Financials — 10.4% | | | | |
| | | | Capital Markets — 3.0% | |
| | 24,200 | | | Blackstone Group LP (The) | | | 509,652 | |
| | 11,900 | | | Lazard Ltd., (Bermuda), Class A | | | 382,585 | |
| | 8,730 | | | T. Rowe Price Group, Inc. | | | 638,599 | |
| | | | | | | | |
| | | | | | | 1,530,836 | |
| | | | | | | | |
| | | | Commercial Banks — 2.8% | | | | |
| | 15,400 | | | East West Bancorp, Inc. | | | 423,500 | |
| | 4,400 | | | M&T Bank Corp. | | | 491,700 | |
| | 5,825 | | | Signature Bank (a) | | | 483,592 | |
| | | | | | | | |
| | | | | | | 1,398,792 | |
| | | | | | | | |
| | | | Diversified Financial Services — 1.6% | | | | |
| | 13,100 | | | Moody’s Corp. | | | 798,183 | |
| | | | | | | | |
| | | | Insurance — 2.0% | | | | |
| | 6,300 | | | Aon plc, (United Kingdom) | | | 405,405 | |
| | 13,300 | | | Axis Capital Holdings Ltd., (Bermuda) | | | 608,874 | |
| | | | | | | | |
| | | | | | | 1,014,279 | |
| | | | | | | | |
| | | | Real Estate Investment Trusts (REITs) — 0.7% | |
| | 10,000 | | | Prologis, Inc. | | | 377,200 | |
| | | | | | | | |
| | | | Real Estate Management & Development — 0.3% | |
| | 7,200 | | | CBRE Group, Inc., Class A (a) | | | 168,192 | |
| | | | | | | | |
| | | | Total Financials | | | 5,287,482 | |
| | | | | | | | |
| | | | Health Care — 15.1% | | | | |
| | | | Biotechnology — 3.8% | |
| | 3,340 | | | Alexion Pharmaceuticals, Inc. (a) | | | 308,082 | |
| | 5,600 | | | Onyx Pharmaceuticals, Inc. (a) | | | 610,400 | |
| | 1,525 | | | Regeneron Pharmaceuticals, Inc. (a) | | | 342,942 | |
| | 8,000 | | | Vertex Pharmaceuticals, Inc. (a) | | | 638,960 | |
| | | | | | | | |
| | | | | | | 1,900,384 | |
| | | | | | | | |
| | | | Health Care Equipment & Supplies — 1.0% | | | | |
| | 8,000 | | | Sirona Dental Systems, Inc. (a) | | | 527,040 | |
| | | | | | | | |
| | | | Health Care Providers & Services — 3.7% | | | | |
| | 19,900 | | | Brookdale Senior Living, Inc. (a) | | | 526,156 | |
| | 3,300 | | | DaVita HealthCare Partners, Inc. (a) | | | 398,640 | |
| | 12,000 | | | Health Net, Inc. (a) | | | 381,840 | |
| | 6,510 | | | Humana, Inc. | | | 549,314 | |
| | | | | | | | |
| | | | | | | 1,855,950 | |
| | | | | | | | |
SEE NOTES TO FINANCIAL STATEMENTS.
| | | | | | | | |
| | | |
| JUNE 30, 2013 | | JPMORGAN INSURANCE TRUST | | | | | 5 | |
JPMorgan Insurance Trust Mid Cap Growth Portfolio
SCHEDULE OF PORTFOLIO INVESTMENTS
AS OF JUNE 30, 2013 (Unaudited) (continued)
| | | | | | | | |
| SHARES | | | SECURITY DESCRIPTION | | VALUE($) | |
| | | | | | | | |
| Common Stocks — Continued | |
| | | | Life Sciences Tools & Services — 3.6% | | | | |
| | 17,700 | | | Agilent Technologies, Inc. | | | 756,852 | |
| | 20,200 | | | Bruker Corp. (a) | | | 326,230 | |
| | 9,720 | | | Illumina, Inc. (a) | | | 727,445 | |
| | | | | | | | |
| | | | | | | 1,810,527 | |
| | | | | | | | |
| | | | Pharmaceuticals — 3.0% | | | | |
| | 5,175 | | | Actavis, Inc. (a) | | | 653,188 | |
| | 10,300 | | | Valeant Pharmaceuticals International, Inc. (a) | | | 886,624 | |
| | | | | | | | |
| | | | | | | 1,539,812 | |
| | | | | | | | |
| | | | Total Health Care | | | 7,633,713 | |
| | | | | | | | |
| | | | Industrials — 19.9% | | | | |
| | | | Airlines — 1.3% | |
| | 35,000 | | | Delta Air Lines, Inc. (a) | | | 654,850 | |
| | | | | | | | |
| | | | Building Products — 1.1% | |
| | 14,700 | | | Fortune Brands Home & Security, Inc. | | | 569,478 | |
| | | | | | | | |
| | | | Commercial Services & Supplies — 1.4% | |
| | 6,340 | | | Stericycle, Inc. (a) | | | 700,126 | |
| | | | | | | | |
| | | | Construction & Engineering — 1.2% | |
| | 10,200 | | | Fluor Corp. | | | 604,962 | |
| | | | | | | | |
| | | | Electrical Equipment — 1.8% | |
| | 7,100 | | | Acuity Brands, Inc. | | | 536,192 | |
| | 10,900 | | | Generac Holdings, Inc. | | | 403,409 | |
| | | | | | | | |
| | | | | | | 939,601 | |
| | | | | | | | |
| | | | Industrial Conglomerates — 1.5% | |
| | 12,200 | | | Carlisle Cos., Inc. | | | 760,182 | |
| | | | | | | | |
| | | | Machinery — 3.8% | |
| | 11,075 | | | Flowserve Corp. | | | 598,161 | |
| | 13,500 | | | Pall Corp. | | | 896,805 | |
| | 7,994 | | | Wabtec Corp. | | | 427,119 | |
| | | | | | | | |
| | | | | | | 1,922,085 | |
| | | | | | | | |
| | | | Marine — 1.2% | | | | |
| | 7,700 | | | Kirby Corp. (a) | | | 612,458 | |
| | | | | | | | |
| | | | Professional Services — 0.9% | |
| | 14,300 | | | Nielsen Holdings N.V. | | | 480,337 | |
| | | | | | | | |
| | | | Road & Rail — 2.6% | |
| | 3,900 | | | Canadian Pacific Railway Ltd., (Canada) | | | 473,382 | |
| | 11,500 | | | J.B. Hunt Transport Services, Inc. | | | 830,760 | |
| | | | | | | | |
| | | | | | | 1,304,142 | |
| | | | | | | | |
| | | | Trading Companies & Distributors — 3.1% | |
| | 18,900 | | | Air Lease Corp. | | | 521,451 | |
| | 25,100 | | | HD Supply Holdings, Inc. (a) | | | 471,629 | |
| | | | | | | | |
| SHARES | | | SECURITY DESCRIPTION | | VALUE($) | |
| | | | | | | | |
| | | | | | | | |
| | | | Trading Companies & Distributors — Continued | |
| | 7,450 | | | MSC Industrial Direct Co., Inc., Class A | | | 577,077 | |
| | | | | | | | |
| | | | | | | 1,570,157 | |
| | | | | | | | |
| | | | Total Industrials | | | 10,118,378 | |
| | | | | | | | |
| | | | Information Technology — 18.6% | | | | |
| | | | Communications Equipment — 1.7% | |
| | 15,800 | | | Aruba Networks, Inc. (a) | | | 242,688 | |
| | 4,400 | | | F5 Networks, Inc. (a) | | | 302,720 | |
| | 7,300 | | | Palo Alto Networks, Inc. (a) | | | 307,768 | |
| | | | | | | | |
| | | | | | | 853,176 | |
| | | | | | | | |
| | | | Electronic Equipment, Instruments & Components — 1.7% | |
| | 10,800 | | | Amphenol Corp., Class A | | | 841,752 | |
| | | | | | | | |
| | | | Internet Software & Services — 2.9% | |
| | 12,200 | | | Akamai Technologies, Inc. (a) | | | 519,110 | |
| | 3,500 | | | LinkedIn Corp., Class A (a) | | | 624,050 | |
| | 5,150 | | | OpenTable, Inc. (a) | | | 329,343 | |
| | | | | | | | |
| | | �� | | | | 1,472,503 | |
| | | | | | | | |
| | | | IT Services — 4.1% | | | | |
| | 5,170 | | | Alliance Data Systems Corp. (a) | | | 935,925 | |
| | 15,100 | | | CoreLogic, Inc. (a) | | | 349,867 | |
| | 9,475 | | | FleetCor Technologies, Inc. (a) | | | 770,318 | |
| | | | | | | | |
| | | | | | | 2,056,110 | |
| | | | | | | | |
| | | | Semiconductors & Semiconductor Equipment — 5.2% | |
| | 43,600 | | | Applied Materials, Inc. | | | 650,076 | |
| | 23,500 | | | Avago Technologies Ltd., (Singapore) | | | 878,430 | |
| | 6,800 | | | KLA-Tencor Corp. | | | 378,964 | |
| | 19,100 | | | Xilinx, Inc. | | | 756,551 | |
| | | | | | | | |
| | | | | | | 2,664,021 | |
| | | | | | | | |
| | | | Software — 3.0% | | | | |
| | 11,100 | | | Red Hat, Inc. (a) | | | 530,802 | |
| | 5,800 | | | SolarWinds, Inc. (a) | | | 225,098 | |
| | 8,100 | | | Splunk, Inc. (a) | | | 375,516 | |
| | 6,200 | | | Workday, Inc., Class A (a) | | | 397,358 | |
| | | | | | | | |
| | | | | | | 1,528,774 | |
| | | | | | | | |
| | | | Total Information Technology | | | 9,416,336 | |
| | | | | | | | |
| | | | Materials — 3.6% | |
| | | | Chemicals — 3.6% | |
| | 5,125 | | | PPG Industries, Inc. | | | 750,351 | |
| | 6,000 | | | Sherwin-Williams Co. (The) | | | 1,059,600 | |
| | | | | | | | |
| | | | Total Materials | | | 1,809,951 | |
| | | | | | | | |
| | | | Total Common Stocks
(Cost $41,229,269) | | | 49,654,241 | |
| | | | | | | | |
SEE NOTES TO FINANCIAL STATEMENTS.
| | | | | | |
| | | |
| 6 | | | | JPMORGAN INSURANCE TRUST | | JUNE 30, 2013 |
| | | | | | | | |
| SHARES | | | SECURITY DESCRIPTION | | VALUE($) | |
| | | | | | | | |
| Short-Term Investment — 1.7% | |
| | | | Investment Company — 1.7% | |
| | 866,831 | | | JPMorgan Liquid Assets Money Market Fund, Institutional Class Shares,
0.030% (b) (l) (m)
(Cost $866,831) | | | 866,831 | |
| | | | | | | | |
| | | | Total Investments — 99.6%
(Cost $42,096,100) | | | 50,521,072 | |
| | | | Other Assets in Excess of
Liabilities — 0.4% | | | 205,239 | |
| | | | | | | | |
| | | | NET ASSETS — 100.0% | | $ | 50,726,311 | |
| | | | | | | | |
Percentages indicated are based on net assets.
NOTES TO SCHEDULE OF PORTFOLIO INVESTMENTS:
| | |
| (a) | | — Non-income producing security. |
| (b) | | — Investment in affiliate. Money market fund registered under the Investment Company Act of 1940, as amended, and advised by J.P. Morgan Investment Management Inc. |
| (l) | | — The rate shown is the current yield as of June 30, 2013. |
| (m) | | — All or a portion of this security is reserved and/or pledged with the custodian for current or potential holdings of futures, swaps, options, TBAs, when-issued securities, delayed delivery securities, reverse repurchase agreements, unfunded commitments and/or forward foreign currency exchange contracts. |
SEE NOTES TO FINANCIAL STATEMENTS.
| | | | | | | | |
| | | |
| JUNE 30, 2013 | | JPMORGAN INSURANCE TRUST | | | | | 7 | |
STATEMENT OF ASSETS AND LIABILITIES
AS OF JUNE 30, 2013 (Unaudited)
| | | | |
| | |
Mid Cap
Growth
Portfolio | |
ASSETS: | | | | |
Investments in non-affiliates, at value | | $ | 49,654,241 | |
Investments in affiliates, at value | | | 866,831 | |
| | | | |
Total investment securities, at value | | | 50,521,072 | |
Receivables: | | | | |
Investment securities sold | | | 953,018 | |
Portfolio shares sold | | | 2,494 | |
Dividends from non-affiliates | | | 15,146 | |
Dividends from affiliates | | | 36 | |
| | | | |
Total Assets | | | 51,491,766 | |
| | | | |
| |
LIABILITIES: | | | | |
Payables: | | | | |
Investment securities purchased | | | 629,516 | |
Portfolio shares redeemed | | | 61,443 | |
Accrued liabilities: | | | | |
Investment advisory fees | | | 27,137 | |
Administration fees | | | 1,321 | |
Distribution fees | | | 5 | |
Custodian and accounting fees | | | 7,068 | |
Trustees’ and Chief Compliance Officer’s fees | | | 27 | |
Other | | | 38,938 | |
| | | | |
Total Liabilities | | | 765,455 | |
| | | | |
Net Assets | | $ | 50,726,311 | |
| | | | |
| |
NET ASSETS: | | | | |
Paid-in-Capital | | $ | 32,272,413 | |
Accumulated undistributed net investment income | | | 32,828 | |
Accumulated net realized gains (losses) | | | 9,996,098 | |
Net unrealized appreciation (depreciation) | | | 8,424,972 | |
| | | | |
Total Net Assets | | $ | 50,726,311 | |
| | | | |
| |
Net Assets: | | | | |
Class 1 | | $ | 50,702,462 | |
Class 2 | | | 23,849 | |
| | | | |
Total | | $ | 50,726,311 | |
| | | | |
| |
Outstanding units of beneficial interest (shares) | | | | |
(unlimited number of shares authorized, no par value): | | | | |
Class 1 | | | 2,554,142 | |
Class 2 | | | 1,225 | |
| |
Net Asset Value, offering and redemption price per share (a): | | | | |
Class 1 | | $ | 19.85 | |
Class 2 | | | 19.47 | |
Cost of investments in non-affiliates | | $ | 41,229,269 | |
Cost of investments in affiliates | | | 866,831 | |
| (a) | Per share amounts may not recalculate due to rounding of net assets and/or shares outstanding. |
SEE NOTES TO FINANCIAL STATEMENTS.
| | | | | | |
| | | |
| 8 | | | | JPMORGAN INSURANCE TRUST | | JUNE 30, 2013 |
STATEMENT OF OPERATIONS
FOR THE SIX MONTHS ENDED JUNE 30, 2013 (Unaudited)
| | | | |
| | | Mid Cap
Growth
Portfolio | |
INVESTMENT INCOME: | | | | |
Dividend income from non-affiliates | | $ | 293,681 | |
Dividend income from affiliates | | | 274 | |
| | | | |
Total investment income | | | 293,955 | |
| | | | |
| |
EXPENSES: | | | | |
Investment advisory fees | | | 208,450 | |
Administration fees | | | 27,052 | |
Distribution fees — Class 2 | | | 28 | |
Custodian and accounting fees | | | 15,160 | |
Interest expense to affiliates | | | 236 | |
Professional fees | | | 24,289 | |
Trustees’ and Chief Compliance Officer’s fees | | | 392 | |
Printing and mailing costs | | | 11,126 | |
Transfer agent fees | | | 2,256 | |
Other | | | 5,494 | |
| | | | |
Total expenses | | | 294,483 | |
| | | | |
Less amounts waived | | | (6,623 | ) |
| | | | |
Net expenses | | | 287,860 | |
| | | | |
Net investment income (loss) | | | 6,095 | |
| | | | |
| |
REALIZED/UNREALIZED GAINS (LOSSES): | | | | |
Net realized gain (loss) on transactions from investments in non-affiliates | | | 10,248,105 | |
Change in net unrealized appreciation/depreciation of investments in non-affiliates | | | (397,466 | ) |
| | | | |
Net realized/unrealized gains (losses) | | | 9,850,639 | |
| | | | |
Change in net assets resulting from operations | | $ | 9,856,734 | |
| | | | |
SEE NOTES TO FINANCIAL STATEMENTS.
| | | | | | | | |
| | | |
| JUNE 30, 2013 | | JPMORGAN INSURANCE TRUST | | | | | 9 | |
STATEMENTS OF CHANGES IN NET ASSETS
FOR THE PERIODS INDICATED
| | | | | | | | |
| | | Mid Cap Growth Portfolio | |
| | | Six Months Ended
6/30/2013
(Unaudited) | | | Year Ended
12/31/2012 | |
CHANGE IN NET ASSETS RESULTING FROM OPERATIONS: | | | | | | | | |
Net investment income (loss) | | $ | 6,095 | | | $ | 85,706 | |
Net realized gain (loss) | | | 10,248,105 | | | | 5,174,762 | |
Change in net unrealized appreciation/depreciation | | | (397,466 | ) | | | 4,973,723 | |
| | | | | | | | |
Change in net assets resulting from operations | | | 9,856,734 | | | | 10,234,191 | |
| | | | | | | | |
| | |
DISTRIBUTIONS TO SHAREHOLDERS: | | | | | | | | |
Class 1 | | | | | | | | |
From net investment income | | | (46,208 | ) | | | — | |
From net realized gains | | | (4,354,443 | ) | | | (817,797 | ) |
Class 2 | | | | | | | | |
From net realized gains | | | (1,413 | ) | | | (243 | ) |
| | | | | | | | |
Total distributions to shareholders | | | (4,402,064 | ) | | | (818,040 | ) |
| | | | | | | | |
| | |
CAPITAL TRANSACTIONS: | | | | | | | | |
Change in net assets resulting from capital transactions | | | (21,986,584 | ) | | | (6,760,984 | ) |
| | | | | | | | |
| | |
NET ASSETS: | | | | | | | | |
Change in net assets | | | (16,531,914 | ) | | | 2,655,167 | |
Beginning of period | | | 67,258,225 | | | | 64,603,058 | |
| | | | | | | | |
End of period | | $ | 50,726,311 | | | $ | 67,258,225 | |
| | | | | | | | |
Accumulated undistributed net investment income | | $ | 32,828 | | | $ | 72,941 | |
| | | | | | | | |
| | |
CAPITAL TRANSACTIONS: | | | | | | | | |
Class 1 | | | | | | | | |
Proceeds from shares issued | | $ | 1,518,079 | | | $ | 6,031,656 | |
Distributions reinvested | | | 4,400,651 | | | | 817,797 | |
Cost of shares redeemed | | | (27,906,727 | ) | | | (13,610,680 | ) |
| | | | | | | | |
Change in net assets resulting from Class 1 capital transactions | | $ | (21,987,997 | ) | | $ | (6,761,227 | ) |
| | | | | | | | |
Class 2 | | | | | | | | |
Distributions reinvested | | | 1,413 | | | | 243 | |
| | | | | | | | |
Change in net assets resulting from Class 2 capital transactions | | $ | 1,413 | | | $ | 243 | |
| | | | | | | | |
Total change in net assets resulting from capital transactions | | $ | (21,986,584 | ) | | $ | (6,760,984 | ) |
| | | | | | | | |
| | |
SHARE TRANSACTIONS: | | | | | | | | |
Class 1 | | | | | | | | |
Issued | | | 78,087 | | | | 347,136 | |
Reinvested | | | 233,456 | | | | 45,458 | |
Redeemed | | | (1,450,439 | ) | | | (767,875 | ) |
| | | | | | | | |
Change in Class 1 Shares | | | (1,138,896 | ) | | | (375,281 | ) |
| | | | | | | | |
Class 2 | | | | | | | | |
Reinvested | | | 76 | | | | 14 | |
| | | | | | | | |
Change in Class 2 Shares | | | 76 | | | | 14 | |
| | | | | | | | |
SEE NOTES TO FINANCIAL STATEMENTS.
| | | | | | |
| | | |
| 10 | | | | JPMORGAN INSURANCE TRUST | | JUNE 30, 2013 |
THIS PAGE IS INTENTIONALLY LEFT BLANK
| | | | | | | | |
| | | |
JUNE 30, 2013 | | JPMORGAN INSURANCE TRUST | | | | | 11 | |
FINANCIAL HIGHLIGHTS
FOR THE PERIODS INDICATED
| | | | | | | | | | | | | | | | | | | | | | | | | | | | |
| | | | | | Per share operating performance | | | | |
| | | | | | Investment operations | | | Distributions | |
| | | Net asset
value,
beginning
of period | | | Net
investment
income
(loss) | | | Net realized
and unrealized
gains
(losses) on
investments | | | Total from
investment
operations | | | Net
investment
income | | | Net
realized
gain | | | Total
distributions | |
Mid Cap Growth Portfolio | | | | | | | | | | | | | | | | | | | | | | | | | | | | |
Class 1 | | | | | | | | | | | | | | | | | | | | | | | | | | | | |
Six Months Ended June 30, 2013 (Unaudited) | | $ | 18.21 | | | $ | — | (f)(g)(h) | | $ | 2.88 | | | $ | 2.88 | | | $ | (0.01 | ) | | $ | (1.23 | ) | | $ | (1.24 | ) |
Year Ended December 31, 2012 | | | 15.88 | | | | 0.02 | (i) | | | 2.52 | | | | 2.54 | | | | — | | | | (0.21 | ) | | | (0.21 | ) |
Year Ended December 31, 2011 | | | 16.91 | | | | (0.02 | ) | | | (1.01 | ) | | | (1.03 | ) | | | — | | | | — | | | | — | |
Year Ended December 31, 2010 | | | 13.46 | | | | (0.02 | ) | | | 3.47 | | | | 3.45 | | | | — | | | | — | | | | — | |
Year Ended December 31, 2009 | | | 9.41 | | | | (0.02 | ) | | | 4.07 | | | | 4.05 | | | | — | | | | — | | | | — | |
Year Ended December 31, 2008 | | | 20.69 | | | | (0.05 | ) | | | (7.84 | ) | | | (7.89 | ) | | | — | | | | (3.39 | ) | | | (3.39 | ) |
| | | | | | | |
Class 2 | | | | | | | | | | | | | | | | | | | | | | | | | | | | |
Six Months Ended June 30, 2013 (Unaudited) | | | 17.89 | | | | (0.01 | )(g)(h) | | | 2.82 | | | | 2.81 | | | | — | | | | (1.23 | ) | | | (1.23 | ) |
Year Ended December 31, 2012 | | | 15.64 | | | | (0.02 | )(i) | | | 2.48 | | | | 2.46 | | | | — | | | | (0.21 | ) | | | (0.21 | ) |
Year Ended December 31, 2011 | | | 16.71 | | | | (0.05 | ) | | | (1.02 | ) | | | (1.07 | ) | | | — | | | | — | | | | — | |
Year Ended December 31, 2010 | | | 13.33 | | | | (0.04 | ) | | | 3.42 | | | | 3.38 | | | | — | | | | — | | | | — | |
Year Ended December 31, 2009 | | | 9.34 | | | | (0.03 | ) | | | 4.02 | | | | 3.99 | | | | — | | | | — | | | | — | |
Year Ended December 31, 2008 | | | 20.62 | | | | (0.06 | ) | | | (7.83 | ) | | | (7.89 | ) | | | — | | | | (3.39 | ) | | | (3.39 | ) |
| (a) | Annualized for periods less than one year. |
| (b) | Not annualized for periods less than one year. |
| (c) | Includes adjustments in accordance with accounting principles generally accepted in the United States of America and as such, the net asset values for financial reporting purposes and the returns based upon those net asset values may differ from the net assets values and returns for shareholder transactions. |
| (d) | Includes earnings credits and interest expense, if applicable, each of which is less than 0.01% unless otherwise noted. |
| (e) | Portfolio turnover is calculated by dividing the lesser of total purchases or sales of portfolio securities for the reporting period by the monthly average value of portfolio securities owned during the reporting period. Excluded from both the numerator and denominator are amounts relating to derivatives and securities whose maturities or expiration dates at the time of acquisition were one year or less. |
| (f) | Amount rounds to less than $0.01. |
| (g) | Calculated based upon average shares outstanding. |
| (h) | Reflects special dividends paid out during the period by several of the Portfolio’s holdings. Had the Portfolio not received the special dividends, the net investment income (loss) per share would have been $(0.02) and $(0.03) for Class 1 and Class 2 Shares, respectively, and the net investment income (loss) ratio would have been (0.15)% and (0.32)% for Class 1 and Class 2 Shares, respectively. |
| (i) | Reflects special dividends paid out during the period by several of the Portfolio’s holdings. Had the Portfolio not received the special dividends, the net investment income (loss) per share would have been $(0.03) and $(0.08) for Class 1 and Class 2 Shares, respectively, and the net investment income (loss) ratio would have been (0.20)% and (0.45)% for Class 1 and Class 2 Shares, respectively. |
SEE NOTES TO FINANCIAL STATEMENTS.
| | | | | | |
| | | |
| 12 | | | | JPMORGAN INSURANCE TRUST | | JUNE 30, 2013 |
| | | | | | | | | | | | | | | | | | | | | | | | | | |
| | | Ratios/Supplemental data | |
| | | | | | | | | | Ratios to average net assets (a) | |
Net asset
value,
end of
period | | | Total return (b)(c) | | | Net assets,
end of
period | | | Net
expenses (d) | | | Net
investment
income
(loss) | | |
Expenses
without waivers,
reimbursements and
earnings credits | | | Portfolio
turnover
rate (b)(e) | |
| | | | | | | | | | | | | | | | | | | | | | | | | | |
| | | | | | | | | | | | | | | | | | | | | | | | | | |
| $ | 19.85 | | | | 16.20 | % | | $ | 50,702,462 | | | | 0.90 | % | | | 0.02 | %(h) | | | 0.92 | % | | | 37 | % |
| | 18.21 | | | | 16.04 | | | | 67,237,679 | | | | 0.89 | | | | 0.13 | (i) | | | 0.90 | | | | 69 | |
| | 15.88 | | | | (6.09 | ) | | | 64,585,309 | | | | 0.85 | | | | (0.08 | ) | | | 0.86 | | | | 72 | |
| | 16.91 | | | | 25.63 | | | | 80,620,361 | | | | 0.90 | | | | (0.10 | ) | | | 0.97 | | | | 76 | |
| | 13.46 | | | | 43.04 | | | | 80,982,829 | | | | 0.90 | | | | (0.14 | ) | | | 1.03 | | | | 85 | |
| | 9.41 | | | | (43.78 | ) | | | 66,522,316 | | | | 0.90 | | | | (0.31 | ) | | | 0.91 | | | | 95 | |
| | | | | | | | | | | | | | | | | | | | | | | | | | |
| | 19.47 | | | | 16.07 | | | | 23,849 | | | | 1.15 | | | | (0.14 | )(h) | | | 1.17 | | | | 37 | |
| | 17.89 | | | | 15.77 | | | | 20,546 | | | | 1.14 | | | | (0.12 | )(i) | | | 1.15 | | | | 69 | |
| | 15.64 | | | | (6.40 | ) | | | 17,749 | | | | 1.09 | | | | (0.32 | ) | | | 1.11 | | | | 72 | |
| | 16.71 | | | | 25.36 | | | | 18,957 | | | | 1.15 | | | | (0.34 | ) | | | 1.22 | | | | 76 | |
| | 13.33 | | | | 42.72 | | | | 15,126 | | | | 1.15 | | | | (0.40 | ) | | | 1.28 | | | | 85 | |
| | 9.34 | | | | (43.96 | ) | | | 10,596 | | | | 1.15 | | | | (0.56 | ) | | | 1.16 | | | | 95 | |
| | | | | | | | |
| | | |
| JUNE 30, 2013 | | JPMORGAN INSURANCE TRUST | | | | | 13 | |
NOTES TO FINANCIAL STATEMENTS
AS OF JUNE 30, 2013 (Unaudited)
1. Organization
JPMorgan Insurance Trust (the “Trust”) is registered under the Investment Company Act of 1940, as amended (the “1940 Act”), as an open-end management investment company and is a Massachusetts business trust.
The following is a separate Portfolio of the Trust (the “Portfolio”) covered by this report:
| | | | |
| | | Classes Offered | | Diversified/Non-Diversified |
| Mid Cap Growth Portfolio | | Class 1 and Class 2 | | Diversified |
The investment objective of the Portfolio is to seek capital growth over the long term.
Portfolio shares are offered only to separate accounts of participating insurance companies and Eligible Plans. Individuals may not purchase shares directly from the Portfolio.
All classes of shares have equal rights as to earnings, assets and voting privileges, except that each class may bear different distribution and service fees and each class has exclusive voting rights with respect to its distribution plan and administrative services plan.
2. Significant Accounting Policies
The following is a summary of significant accounting policies followed by the Portfolio in the preparation of its financial statements. The policies are in accordance with accounting principles generally accepted in the United States of America (“GAAP”). The preparation of financial statements requires management to make estimates and assumptions that affect the reported amounts and disclosures in the financial statements. Actual results could differ from those estimates.
A. Valuation of Investments — Equity securities listed on a North American, Central American, South American or Caribbean securities exchange shall generally be valued at the last sale price on the exchange on which the security is principally traded that is reported before the time when the net assets of the Portfolio are valued. Securities listed on the NASDAQ Stock Market LLC are generally valued at the NASDAQ Official Closing Price. Generally, short-term investments of sufficient credit quality maturing in less than 61 days are valued at amortized cost, which approximates fair value. Investments in other open-end investment companies are valued at each investment company’s net asset value per share (“NAV”) as of the report date.
Certain investments of the Portfolio may, depending upon market conditions, trade in relatively thin markets and/or in markets that experience significant volatility. As a result of these conditions, the prices used by the Portfolio to value these securities may differ from the value that would be realized if these securities were sold, and the differences could be material. Futures and options are generally valued on the basis of available market quotations. Swaps and other derivatives are valued daily, primarily using independent or affiliated pricing services approved by the Board of Trustees. If valuations are not available from such services or values received are deemed not representative of fair value, values will be obtained from a third party broker-dealer or counterparty.
Securities or other assets for which market quotations are not readily available or for which market quotations are deemed to not represent the fair value of the security or asset at the time of pricing (including certain illiquid securities) are fair valued in accordance with procedures established by and under the supervision and responsibility of the Board of Trustees. The Board of Trustees has established an Audit and Valuation Committee to assist with the oversight of the valuation of the Portfolio’s securities. JPMorgan Funds Management, Inc. (the “Administrator”, or “JPMFM”), an indirect, wholly-owned subsidiary of JPMorgan Chase & Co. (“JPMorgan”), has established a Valuation Committee (“VC”) that is comprised of senior representatives from JPMFM, J.P. Morgan Investment Management Inc. (“JPMIM” or the “Advisor”), a wholly-owned subsidiary of JPMorgan Asset Management Holdings Inc. (“JPMAM”), which is a wholly-owned subsidiary of JPMorgan, JPMorgan’s Legal and Compliance and JPMAM’s Risk Management and the Portfolio’s Chief Compliance Officer. The VC’s responsibilities include making determinations regarding Level 3 fair value measurements (“Fair Values”) and/or providing recommendations for approval to the Board of Trustees’ Audit and Valuation Committee, in accordance with the Portfolio’s valuation policies.
The VC or Board of Trustees, as applicable, primarily employs a market-based approach which may use related or comparable assets or liabilities, recent transactions, market multiples, book values, and other relevant information for the investment to determine the fair value of the investment. The VC or Board of Trustees may also use an income-based valuation approach in which the anticipated future cash flows of the investment are discounted to calculate fair value. Discounts may also be applied due to the nature or duration of any restrictions on the disposition of the investments. Valuations may be based upon current market prices of securities that are comparable in coupon, rating, maturity and industry.
It is possible that the estimated values may differ significantly from the values that would have been used had a ready market for the investments existed, and such differences could be material. JPMFM and JPMIM are responsible for monitoring developments that may impact Fair Values and for discussing and assessing Fair Values on an ongoing, and at least a quarterly, basis with the VC and Board of Trustees, as applicable. The appropriateness of Fair Values is assessed based on results of unchanged price review and consideration of macro or security specific events, back testing and broker and vendor due diligence.
Valuations reflected in this report are as of the report date. As a result, changes in valuation due to market events and/or issuer related events after the report date and prior to issuance of the report, are not reflected herein.
| | | | | | |
| | | |
| 14 | | | | JPMORGAN INSURANCE TRUST | | JUNE 30, 2013 |
The various inputs that are used in determining the fair value of the Portfolio’s investments are summarized into the three broad levels listed below.
| Ÿ | | Level 1 — quoted prices in active markets for identical securities |
| Ÿ | | Level 2 — other significant observable inputs (including quoted prices for similar securities, interest rates, prepayment speeds, credit risk, etc.) |
| Ÿ | | Level 3 — significant unobservable inputs (including the Portfolio’s own assumptions in determining the fair value of investments) |
A financial instrument’s level within the fair value hierarchy is based on the lowest level of any input, both individually and in the aggregate, that is significant to the fair value measurement. The inputs or methodology used for valuing securities are not necessarily an indication of the risk associated with investing in those securities.
The following table represents each valuation input as presented on the Schedule of Portfolio Investments (“SOI”):
| | | | | | | | | | | | | | | | |
| | | Level 1 Quoted Prices | | | Level 2 Other significant observable inputs | | | Level 3
Significant unobservable inputs | | | Total | |
Total Investments in Securities (a) | | $ | 50,521,072 | | | $ | — | | | $ | — | | | $ | 50,521,072 | |
| | | | | | | | | | | | | | | | |
| (a) | All portfolio holdings designated as Level 1 are disclosed individually on the SOI. Please refer to the SOI for industry specifics of portfolio holdings. |
There were no transfers between any levels during the period ended June 30, 2013.
B. Security Transactions and Investment Income — Investment transactions are accounted for on the trade date (the date the order to buy or sell is executed). Securities gains and losses are calculated on a specifically identified cost basis. Interest income is determined on the basis of coupon interest accrued using the effective interest method which adjusts for amortization of premiums and accretion of discounts. Dividend income, net of foreign taxes withheld, if any, is recorded on the ex-dividend date or when the Portfolio first learns of the dividend.
C. Allocation of Income and Expenses — Expenses directly attributable to a portfolio are charged directly to that portfolio, while the expenses attributable to more than one portfolio of the Trust are allocated among the respective portfolios. In calculating the NAV per share of each class, investment income, realized and unrealized gains and losses and expenses, other than class specific expenses, are allocated daily to each class of shares based upon the proportion of net assets of each class at the beginning of each day.
D. Federal Income Taxes — The Portfolio is treated as a separate taxable entity for Federal income tax purposes. The Portfolio’s policy is to comply with the provisions of the Internal Revenue Code of 1986, as amended (the “Code”), applicable to regulated investment companies and to distribute to shareholders all of its distributable net investment income and net realized gain on investments. Accordingly, no provision for Federal income tax is necessary. The Portfolio is also a segregated portfolio of assets for insurance purposes and intends to comply with the diversification requirements of Subchapter L of the Code. Management has reviewed the Portfolio tax positions for all open tax years and has determined that as of June 30, 2013, no liability for income tax is required in the portfolio’s financial statements for net unrecognized tax benefits. However, management’s conclusions may be subject to future review based on changes in, or the interpretation of, the accounting standards or tax laws and regulations. The Portfolio’s Federal tax returns for the prior three fiscal years remain subject to examination by the Internal Revenue Service.
E. Distributions to Shareholders — Distributions from net investment income are generally declared and paid at least annually and are declared separately for each class. No class has preferential dividend rights; differences in per share rates are due to differences in separate class expenses. Net realized capital gains, if any, are distributed at least annually. The amount of distributions from net investment income and net realized capital gains is determined in accordance with Federal income tax regulations, which may differ from GAAP. To the extent these “book/tax” differences are permanent in nature (i.e., that they result from other than timing of recognition — “temporary differences”), such amounts are reclassified within the capital accounts based on their Federal tax-basis treatment.
3. Fees and Other Transactions with Affiliates
A. Investment Advisory Fee — Pursuant to the Investment Advisory Agreement, JPMIM supervises the investments of the Portfolio and for such services is paid a fee. The fee is accrued daily and paid monthly based on the Portfolio’s average daily net assets at an annual rate of 0.65%.
The Advisor waived Investment Advisory fees and/or reimbursed expenses as outlined in Note 3.E.
B. Administration Fee — Pursuant to an Administration Agreement, the Administrator provides certain administration services to the Portfolio. In consideration of these services, the Administrator receives a fee accrued daily and paid monthly at an annual rate of 0.15% of the first $25 billion of the average daily net assets of all funds in the J.P. Morgan Funds Complex (excluding certain funds of funds and money market funds) and 0.075% of the average daily net assets in excess of $25 billion of all such funds. For the six months ended June 30, 2013, the annualized effective rate was 0.08% of the Portfolio’s average daily net assets, notwithstanding any fee waivers and/or expense reimbursements.
The Administrator waived Administration fees as outlined in Note 3.E.
JPMorgan Chase Bank, N.A. (“JPMCB”), a wholly-owned subsidiary of JPMorgan, serves as the Portfolio’s sub-administrator (the “Sub-administrator”). For its services as Sub-administrator, JPMCB receives a portion of the fees payable to the Administrator.
| | | | | | | | |
| | | |
| JUNE 30, 2013 | | JPMORGAN INSURANCE TRUST | | | | | 15 | |
NOTES TO FINANCIAL STATEMENTS
AS OF JUNE 30, 2013 (Unaudited) (continued)
C. Distribution Fees — Pursuant to a Distribution Agreement, JPMorgan Distribution Services, Inc. (the “Distributor”), a wholly-owned subsidiary of JPMorgan, serves as the Trust’s exclusive underwriter and promotes and arranges for the sale of the Portfolio’s shares.
The Board of Trustees has adopted a Distribution Plan (the “Distribution Plan”) for Class 2 Shares of the Portfolio in accordance with Rule 12b-1 under the 1940 Act. The Distribution Plan provides that the Portfolio shall pay distribution fees, including payments to the Distributor, at an annual rate of 0.25% of the average daily net assets of Class 2 Shares.
D. Custodian and Accounting Fees — JPMCB provides portfolio custody and accounting services to the Portfolio. The amounts paid directly to JPMCB by the Portfolio for custody and accounting services are included in Custodian and accounting fees in the Statement of Operations. Payments to the custodian may be reduced by credits earned by the Portfolio, based on uninvested cash balances held by the custodian. Such earnings credits, if any, are presented separately in the Statement of Operations.
Interest expense, if any, paid to the custodian related to cash overdrafts is included in Interest expense to affiliates in the Statement of Operations.
E. Waivers and Reimbursements — The Advisor, Administrator and Distributor (for Class 2 Shares) have contractually agreed to waive fees and/or reimburse the Portfolio to the extent that total annual operating expenses (excluding acquired fund fees and expenses, dividend expenses related to short sales, interest, taxes, expenses related to litigation and potential litigation, extraordinary expenses and expenses related to the Board of Trustees’ deferred compensation plan) exceed the percentages of the Portfolio’s respective average daily net assets as shown in the table below:
| | | | | | |
| | | Class 1 | | Class 2 | |
| | 0.90% | | | 1.15 | % |
The expense limitation agreements were in effect for the six months ended June 30, 2013. The contractual expense limitation percentages in the table above are in place until at least April 30, 2014.
For the six months ended June 30, 2013, the Portfolio’s service providers waived fees for the Portfolio as follows. None of these parties expect the Portfolio to repay any such waived fees in future years.
| | | | | | | | | | | | |
| | | Contractual Waivers | |
| | | Investment Advisory | | | Administration | | | Total | |
| | $ | 2,619 | | | $ | 3,179 | | | $ | 5,798 | |
Additionally, the Portfolio may invest in one or more money market funds advised by the Advisor or its affiliates. The Advisor, Administrator and the Distributor waive fees in an amount sufficient to offset the respective fees each charges to the affiliated money market fund on the Portfolio’s investment in such affiliated money market fund. A portion of the waiver is voluntary.
The amount of waivers resulting from investments in these money market funds for the six months ended June 30, 2013 was $825.
F. Other — Certain officers of the Trust are affiliated with the Advisor, the Administrator and the Distributor. Such officers, with the exception of the Chief Compliance Officer, receive no compensation from the Portfolio for serving in their respective roles.
The Board of Trustees appointed a Chief Compliance Officer to the Portfolio in accordance with Federal securities regulations. The Portfolio, along with other affiliated portfolios, makes reimbursement payments, on a pro-rata basis, to the Administrator for a portion of the fees associated with the Office of the Chief Compliance Officer. Such fees are included in Trustees’ and Chief Compliance Officer’s fees on the Statement of Operations.
The Trust adopted a Trustee Deferred Compensation Plan (the “Plan”) which allows the Independent Trustees to defer the receipt of all or a portion of compensation related to performance of their duties as Trustees. The deferred fees are invested in various J.P. Morgan Funds until distribution in accordance with the Plan.
During the six months ended June 30, 2013, the Portfolio may have purchased securities from an underwriting syndicate in which the principal underwriter or members of the syndicate are affiliated with the Advisor.
The Portfolio may use related party broker-dealers. For the six months ended June 30, 2013, the Portfolio did not incur any brokerage commissions with broker-dealers affiliated with the Advisor.
The Securities and Exchange Commission has granted an exemptive order permitting the Portfolio to engage in principal transactions with J.P. Morgan Securities, Inc., an affiliated broker, involving taxable money market instruments, subject to certain conditions.
4. Investment Transactions
During the six months ended June 30, 2013, purchases and sales of investments (excluding short-term investments) were as follows:
| | | | | | | | |
| | | Purchases (excluding U.S. Government) | | | Sales (excluding U.S. Government) | |
| | $ | 23,741,676 | | | $ | 50,443,136 | |
| | | | | | |
| | | |
| 16 | | | | JPMORGAN INSURANCE TRUST | | JUNE 30, 2013 |
During the six months ended June 30, 2013, there were no purchases or sales of U.S. Government securities.
5. Federal Income Tax Matters
For Federal income tax purposes, the cost and unrealized appreciation (depreciation) in value of investment securities held at June 30, 2013 were as follows:
| | | | | | | | | | | | | | | | |
| | | Aggregate Cost | | | Gross Unrealized Appreciation | | | Gross Unrealized Depreciation | | | Net Unrealized Appreciation (Depreciation) | |
| | $ | 42,096,100 | | | $ | 9,160,232 | | | $ | 735,260 | | | $ | 8,424,972 | |
Under the Regulated Investment Company Modernization Act of 2010 (the “Act”), net capital losses recognized by the Portfolio after December 31, 2010 may get carried forward indefinitely, and retain their character as short-term and/or long-term losses. Prior to the Act, net capital losses incurred by the Portfolio were carried forward for eight years and treated as short-term losses. The Act requires that post-enactment net capital losses be used before pre-enactment net capital losses.
At December 31, 2012, the Portfolio did not have any post-enactment or pre-enactment net capital loss carryforwards.
6. Borrowings
The Trust and JPMCB have entered into a financing arrangement. Under this arrangement, JPMCB provides an unsecured, uncommitted credit facility in the aggregate amount of $100 million to certain of the J.P. Morgan Funds, including the Portfolio. Advances under the arrangement are taken primarily for temporary or emergency purposes, including the meeting of redemption requests that otherwise might require the untimely disposition of securities, and are subject to the Portfolio’s borrowing restrictions. Interest on borrowings is payable at a rate determined by JPMCB at the time of borrowing. This agreement has been extended until November 11, 2013.
The Portfolio had no borrowings outstanding from the unsecured, uncommitted credit facility at June 30, 2013, or at any time during the six months then ended.
Interest expense paid, if any, as a result of borrowings from the unsecured, uncommitted credit facility is included in Interest expense to affiliates in the Statement of Operations.
7. Risks, Concentrations and Indemnifications
In the normal course of business, the Portfolio enters into contracts that contain a variety of representations which provide general indemnifications. The Portfolio’s maximum exposure under these arrangements is unknown. The amount of exposure would depend on future claims that may be made against the Portfolio that have not yet occurred. However, based on experience, the Portfolio expects the risk of loss to be remote.
The Portfolio has several shareholders holding a significant percentage of shares outstanding. Investment activities of these shareholders could have a material impact on the Portfolio.
| | | | | | | | |
| | | |
| JUNE 30, 2013 | | JPMORGAN INSURANCE TRUST | | | | | 17 | |
SCHEDULE OF SHAREHOLDER EXPENSES
(Unaudited)
Hypothetical $1,000 Investment
As a shareholder of the Portfolio, you incur ongoing costs, including investment advisory fees, administration fees, distribution fees (for Class 2 Shares) and other Portfolio expenses. Because the Portfolio is a funding vehicle for Policies and Eligible Plans, you may also incur sales charges and other fees relating to the Policies or Eligible Plans. The examples below are intended to help you understand your ongoing costs (in dollars) of investing in the Portfolio, but not the costs of the Policies or Eligible Plans, and to compare these ongoing costs with the ongoing costs of investing in other mutual funds. The examples assume that you had a $1,000 investment in each Class at the beginning of the reporting period, January 1, 2013, and continued to hold your shares at the end of the reporting period, June 30, 2013.
Actual Expenses
For each Class of the Portfolio in the table below, the first line provides information about actual account values and actual expenses. You may use the information in this line, together with the amount you invested, to estimate the expenses that you paid over the period. Simply divide your account value by $1,000 (for example, an $8,600 account value divided by $1,000 = 8.6), then multiply the result by the number in the first line of each Class under the heading entitled “Expenses Paid During the Period” to estimate the expenses you paid on your account during this period.
Hypothetical Example for Comparison Purposes
The second line of each Class in the table below provides information about hypothetical account values and hypothetical expenses based on the Class’ actual expense ratio and an assumed rate of return of 5% per year before expenses, which is not the Class’ actual return. The hypothetical account values and expenses may not be used to estimate the actual ending account balance or expenses you paid for the period. You may use this information to compare the ongoing costs of investing in the Class of the Portfolio and other portfolios. To do so, compare this 5% hypothetical example with the 5% hypothetical examples that appear in the shareholder reports of the other funds. Please note that the expenses shown in the table are meant to highlight your ongoing costs only and do not reflect any transaction costs, such as sales charges (loads) or redemption fees or the costs associated with the Policies and Eligible Plans through which the Portfolio is held. Therefore, the second line for each Class in the table is useful in comparing ongoing costs only, and will not help you determine the relative total costs of owning different portfolios. In addition, if these transaction costs were included, your costs would have been higher. The examples also assume all dividends and distributions have been reinvested.
| | | | | | | | | | | | | | | | |
| | | Beginning
Account Value,
January 1, 2013 | | | Ending
Account Value
June 30, 2013 | | | Expenses
Paid During
the Period* | | | Annualized
Expense
Ratio | |
Mid Cap Growth Portfolio | | | | | | | | | | | | | | | | |
Class 1 | | | | | | | | | | | | | | | | |
Actual | | $ | 1,000.00 | | | $ | 1,162.00 | | | $ | 4.82 | | | | 0.90 | % |
Hypothetical | | | 1,000.00 | | | | 1,020.33 | | | | 4.51 | | | | 0.90 | |
Class 2 | | | | | | | | | | | | | | | | |
Actual | | | 1,000.00 | | | | 1,160.70 | | | | 6.16 | | | | 1.15 | |
Hypothetical | | | 1,000.00 | | | | 1,019.09 | | | | 5.76 | | | | 1.15 | |
| * | Expenses are equal to each Class’ respective annualized expense ratio, multiplied by the average account value over the period, multiplied by 181/365 (to reflect the one-half year period). |
| | | | | | |
| | | |
| 18 | | | | JPMORGAN INSURANCE TRUST | | JUNE 30, 2013 |
J.P. Morgan Funds are distributed by JPMorgan Distribution Services, Inc., which is an affiliate of JPMorgan Chase & Co. Affiliates of JPMorgan Chase & Co. receive fees for providing various services to the funds.
Contact JPMorgan Distribution Services, Inc. at 1-800-480-4111 for a portfolio prospectus. You can also visit us at www.jpmorganfunds.com. Investors should carefully consider the investment objectives and risk as well as charges and expenses of the mutual fund before investing. The prospectus contains this and other information about the mutual fund. Read the prospectus carefully before investing.
The Portfolio files a complete schedule of its portfolio holdings for the first and third quarters of its fiscal year with the SEC on Form N-Q. The Portfolio’s Forms N-Q are available on the SEC’s website at http://www.sec.gov and may be reviewed and copied at the SEC’s Public Reference Room in Washington, DC. Information on the operation of the SEC’s Public Reference Room may be obtained by calling 1-800-SEC-0330. Shareholders may request the Form N-Q without charge by calling 1-800-480-4111 or by visiting the variable insurance portfolio section of the J.P. Morgan Funds’ website at www.jpmorganfunds.com.
A description of the Portfolio’s policies and procedures with respect to the disclosure of the Portfolio’s holdings is available in the prospectus and Statement of Additional Information.
A copy of proxy policies and procedures is available without charge upon request by calling 1-800-480-4111 and on the Portfolio’s website at www.jpmorganfunds.com. A description of such policies and procedures is on the SEC’s website at www.sec.gov. The Trustees have delegated the authority to vote proxies for securities owned by the Portfolio to the Advisor. A copy of the Portfolio’s voting record for the most recent 12-month period ended June 30 is available on the SEC’s website at www.sec.gov or at the Portfolio’s website at www.jpmorganfunds.com no later than August 31 of each year. The Portfolio’s proxy voting record will include, among other things, a brief description of the matter voted on for each portfolio security, and will state how each vote was cast, for example, for or against the proposal.
| | | | |
| | © JPMorgan Chase & Co., 2013. All rights reserved. June 2013. | | SAN-JPMITMCGP-613 |
Semi-Annual Report
JPMorgan Insurance Trust
June 30, 2013 (Unaudited)
JPMorgan Insurance Trust Mid Cap Value Portfolio
| | | | |
NOT FDIC INSURED Ÿ NO BANK GUARANTEE Ÿ MAY LOSE VALUE
| | |  | |
CONTENTS
Investments in the Portfolio are not bank deposits or obligations of, or guaranteed or endorsed by, any bank and are not insured or guaranteed by the FDIC, the Federal Reserve Board or any other government agency. You could lose money if you sell when the Portfolio’s share price is lower than when you invested.
Past performance is no guarantee of future performance. The general market views expressed in this report are opinions based on market and other conditions through the end of the reporting period and are subject to change without notice. These views are not intended to predict the future performance of the Portfolio or the securities markets. References to specific securities and their issuers are for illustrative purposes only and are not intended to be, and should not be interpreted as, recommendations to purchase or sell such securities. Such views are not meant as investment advice and may not be relied on as an indication of trading intent on behalf of the Portfolio.
This Portfolio is intended to be a funding vehicle for variable annuity contracts and variable life insurance policies (collectively “Policies”) offered by separate accounts of participating insurance companies. Portfolio shares are also offered through qualified pension and retirement plans (“Eligible Plans”). Individuals may not purchase shares directly from the Portfolio.
Prospective investors should refer to the Portfolio’s prospectus for a discussion of the Portfolio’s investment objective, strategies and risks. Call J.P. Morgan Funds Service Center at 1-800-480-4111 for a prospectus containing more complete information about the Portfolio, including management fees and other expenses. Please read it carefully before investing.
CEO’S LETTER
July 26, 2013 (Unaudited)
Dear Shareholder:
While somewhat overshadowed by increased volatility at the end of the reporting period, developed market equities in aggregate posted solid returns for the six months ended June 30, 2013. For much of the period, stocks were supported by solid corporate earnings and robust demand from investors looking to generate higher returns in the low interest rate environment. Despite signaling a potential policy shift in June 2013, the U.S. Federal Reserve (“Fed”) continued to pursue its highly accommodative policies in an attempt to lower unemployment and spur the economy. Central banks overseas also did their part to support their economies. The European Central Bank (“ECB”) remained committed to preserving the euro, as it cut rates and introduced new programs designed to aid struggling euro zone members. Elsewhere, the Bank of Japan stepped up its major asset purchase program as a new pro-growth government came into power late in 2012.
| | |
 | | “We are encouraged by the stock market’s resiliency in the face of recent volatility.” |
Positive investor sentiment was temporarily interrupted, however, in May 2013 when Fed Chairman Bernanke indicated that the central bank may begin to “taper” its asset purchase program later this year. This triggered a sharp decline in global equities, although they quickly regained their footing and have continued to rally in July. All told, U.S. stocks rose sharply during the six months ended June 30, 2013. Overseas, international developed stocks produced more modest gains, while emerging market equities performed poorly given concerns regarding China’s economy and falling commodity prices.
U.S. Treasury Yields Rise Sharply
Talk of Fed tapering negatively impacted the fixed income markets. While U.S. Treasury security yields continued to be
low from a historical perspective, they ended the period sharply higher than when the reporting period began. The yield for 10-year U.S. Treasury securities ended June 30, 2013 at 2.52%, while the yields for 2- and 30-year U.S. Treasury securities finished the reporting period at 0.36% and 3.52%, respectively. Amid the rising interest rate environment, the overall U.S. fixed income market generated a negative return for the reporting period. In contrast, high yield bonds posted a modest gain, while emerging market debt securities fell sharply.
Positive Signs for Stocks
Although the global economy is far from robust, it is still on a growth path. The expansion in the U.S. certainly appears to be sustainable and, while Europe remains in a recession, there are indications that its economy may be bottoming. Elsewhere, pro-growth initiatives in Japan have thus far yielded positive results. While growth in China has moderated, we believe the government has the tools at its disposal to avoid a “hard landing.”
We are encouraged by the stock market’s resiliency in the face of recent volatility. In addition, there have been signs that equity market correlations are decreasing, which could create a more favorable environment for active managers. In addition, given the recent sell-off in the bond market, valuations in a number of fixed income sectors have become more attractive.
On behalf of everyone at J.P. Morgan Asset Management, thank you for your continued support. We look forward to managing your investment needs for years to come. Should you have any questions, please visit www.jpmorganfunds.com or contact the J.P. Morgan Funds Service Center at 1-800-480-4111.
Sincerely yours,

George C.W. Gatch
CEO, Global Funds Management
J.P. Morgan Asset Management
| | | | | | | | |
| | | |
| JUNE 30, 2013 | | JPMORGAN INSURANCE TRUST | | | | | 1 | |
JPMorgan Insurance Trust Mid Cap Value Portfolio
PORTFOLIO COMMENTARY
SIX MONTHS ENDED JUNE 30, 2013 (Unaudited)
| | | | |
| REPORTING PERIOD RETURN: | |
| Portfolio (Class 1 Shares)* | | | 15.53% | |
| Russell Midcap Value Index | | | 16.10% | |
| |
| Net Assets as of 6/30/2013 | | $ | 348,219,774 | |
INVESTMENT OBJECTIVE**
The JPMorgan Insurance Trust Mid Cap Value Portfolio (the “Portfolio”) seeks capital appreciation with the secondary goal of achieving current income by investing primarily in equity securities.
HOW DID THE MARKET PERFORM?
Despite periods of heightened volatility and a setback in June, the overall U.S. equity market, as measured by the S&P 500 Index (“S&P 500”), generated strong results during the six months ended June 30, 2013. The S&P 500 generated a positive return during each of the first five months of the reporting period. Supporting the market were overall solid corporate profits, improving economic growth and generally robust investor demand. These factors helped the S&P 500 to post several all-time highs over the first five months of 2013. The S&P 500 then reversed course and declined during the last month of the reporting period. This turnaround was triggered by indications that the U.S. Federal Reserve Board (“Fed”) would begin tapering its monthly purchases of bonds — $85 billion of mortgage-backed securities and Treasury securities — if economic conditions continued to improve. This caused interest rates to move sharply higher and both stock and bond prices fell sharply. However, the S&P 500 again rallied in late June, as concerns regarding Fed tapering abated somewhat. All told, mid-cap value stocks, as measured by the Russell Midcap Value Index (the “Benchmark”), finished the six months ended June 30, 2013 with a 16.10% return.
WHAT WERE THE MAIN DRIVERS OF THE PORTFOLIO’S PERFORMANCE?
The Portfolio (Class 1 Shares) underperformed the Benchmark for the six months ended June 30, 2013. The Portfolio’s stock selection in the information technology and industrials sectors was the main detractor to relative performance. The Portfolio’s stock selection and underweights versus the Benchmark in the financials and energy sectors contributed to relative performance.
Individual detractors from relative performance included three stocks that were in the Benchmark but not in the Portfolio during the reporting period: Micron Technology, Inc., a manufacturer and marketer of semiconductor devices, Boston Scientific Co., a worldwide developer, manufacturer and marketer of medical devices, and Eaton Corp. PLC, a diversified power management company. Stocks of all three companies performed well during the reporting period and not owning them was detrimental to the Portfolio’s relative performance.
Individual contributors to relative performance included the Portfolio’s positions in Charles Schwab Corp., Gap, Inc. and Bed, Bath & Beyond, Inc. Charles Schwab Corp., a brokerage and financial services company, rose as investors began shifting assets from cash and fixed income products into equities. Shares of Gap, Inc., a multinational clothing and accessories retailer, rose sharply during the period as the company closed underperforming stores and opened new outlets that it believed will be more appealing to cost-conscious shoppers. Bed, Bath & Beyond, Inc., which operates a chain of domestic merchandise retail stores, gained market share on its rivals, partially due to better merchandising and strategy execution.
HOW WAS THE PORTFOLIO POSITIONED?
The Portfolio managers utilized a bottom-up approach to stock selection and sought to identify durable franchises possessing the ability to generate, in their view, sustainable levels of free cash flow. The Portfolio managers believed that these types of companies should perform relatively well in what they view as a slow but sustainable economic recovery in the United States. The Portfolio’s largest overweight versus the Benchmark continued to be in the consumer discretionary sector. The Portfolio managers sought to own retailers with strong brands and business models that produce recurring revenue, believing that these factors, coupled with lower levels of capital spending, should contribute to their sustainable generation of free cash flow.
| | | | | | |
| | | |
| 2 | | | | JPMORGAN INSURANCE TRUST | | JUNE 30, 2013 |
| | | | | | | | |
| TOP TEN EQUITY HOLDINGS OF THE PORTFOLIO*** | |
| | 1. | | | Marsh & McLennan Cos., Inc. | | | 1.7 | % |
| | 2. | | | Ball Corp. | | | 1.7 | |
| | 3. | | | Loews Corp. | | | 1.7 | |
| | 4. | | | Energen Corp. | | | 1.6 | |
| | 5. | | | Kohl’s Corp. | | | 1.5 | |
| | 6. | | | AutoZone, Inc. | | | 1.5 | |
| | 7. | | | Analog Devices, Inc. | | | 1.5 | |
| | 8. | | | Ameriprise Financial, Inc. | | | 1.5 | |
| | 9. | | | Amphenol Corp., Class A | | | 1.4 | |
| | 10. | | | Fifth Third Bancorp | | | 1.4 | |
| | | | |
PORTFOLIO COMPOSITION BY SECTOR*** | |
| Financials | | | 26.8 | % |
| Consumer Discretionary | | | 21.2 | |
| Industrials | | | 9.7 | |
| Utilities | | | 9.2 | |
| Information Technology | | | 8.4 | |
| Materials | | | 7.4 | |
| Energy | | | 5.5 | |
| Health Care | | | 4.9 | |
| Consumer Staples | | | 4.5 | |
| Telecommunication Services | | | 0.3 | |
| Short-Term Investment | | | 2.1 | |
| * | | The return shown is based on net asset values calculated for shareholder transactions and may differ from the return shown in the financial highlights, which reflects adjustments made to the net asset values in accordance with accounting principles generally accepted in the United States of America. |
| ** | | The advisor seeks to achieve the Portfolio’s objective. There can be no guarantee it will be achieved. |
| *** | | Percentages indicated are based on total investments as of June 30, 2013. The Portfolio’s composition is subject to change. |
| | | | | | | | |
| | | |
| JUNE 30, 2013 | | JPMORGAN INSURANCE TRUST | | | | | 3 | |
JPMorgan Insurance Trust Mid Cap Value Portfolio
PORTFOLIO COMMENTARY
SIX MONTHS ENDED JUNE 30, 2013 (Unaudited) (continued)
| | | | | | | | | | | | | | | | | | | | |
AVERAGE ANNUAL TOTAL RETURNS AS OF JUNE 30, 2013 | |
| | | | | |
| | | INCEPTION DATE
OF CLASS | | | 6 MONTH* | | | 1 YEAR | | | 5 YEAR | | | 10 YEAR | |
CLASS 1 SHARES | | | 9/28/01 | | | | 15.53 | % | | | 25.85 | % | | | 10.30 | % | | | 10.53 | % |
TEN YEAR PERFORMANCE (6/30/03 TO 6/30/13)
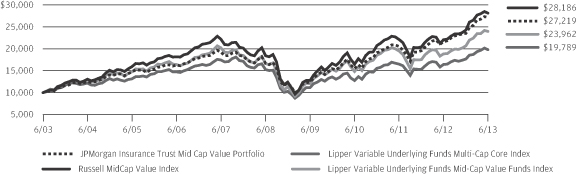
The performance quoted is past performance and is not a guarantee of future results. Mutual funds are subject to certain market risks. Investment returns and principal value of an investment will fluctuate so that an investor’s shares, when redeemed, may be worth more or less than their original cost. Current performance may be higher or lower than the performance data shown. For up-to-date month-end performance information please call 1-800-480-4111.
Inception date for JPMorgan Insurance Trust Mid Cap Value Portfolio is September 28, 2001, which is the inception date of JPMorgan Mid Cap Value Portfolio (“Predecessor Portfolio”). JPMorgan Insurance Trust Mid Cap Value Portfolio acquired all of the assets and liabilities of the Predecessor Portfolio in a reorganization on April 24, 2009. The Predecessor Portfolio’s performance and financial history have been adopted by the JPMorgan Insurance Trust Mid Cap Value Portfolio and have been used since the reorganization. As a result, the performance prior to April 25, 2009, is the performance of the Predecessor Portfolio.
The graph illustrates comparative performance for $10,000 invested in Class 1 Shares of the JPMorgan Insurance Trust Mid Cap Value Portfolio, the Russell Midcap Value Index, the Lipper Variable Underlying Funds Multi-Cap Core Index and the Lipper Variable Underlying Funds Mid-Cap Value Funds Index from June 30, 2003 to June 30, 2013. The performance of the Portfolio assumes reinvestment of all dividends and capital gain distributions, if any. The performance of the Russell Midcap Value Index does not reflect the
deduction of expenses associated with a mutual fund and has been adjusted to reflect reinvestment of all dividends and capital gain distributions of the securities included in the benchmark, if applicable. The performance of the Lipper Variable Underlying Funds Multi-Cap Core Index and the Lipper Variable Underlying Funds Mid-Cap Value Funds Index includes expenses associated with a mutual fund, such as investment management fees. These expenses are not identical to expenses incurred by the Portfolio. The Russell Midcap Value Index is an unmanaged index which measures the performance of those Russell Midcap companies with lower price-to-book ratios and lower forecasted growth values. The Lipper Variable Underlying Funds Multi-Cap Core Index and the Lipper Variable Underlying Funds Mid-Cap Value Funds Index are indices based on the total returns of certain mutual funds within the Portfolio’s designated category as determined by Lipper, Inc. Investors cannot invest directly in an index.
The performance does not reflect any charges imposed by the Policies or Eligible Plans. If these charges were included, the returns would be lower than shown. Portfolio performance may reflect the waiver of the Portfolio’s fees and reimbursement of expenses for certain periods since the inception date. Without these waivers and reimbursements, performance would have been lower.
The returns shown are based on net asset values calculated for shareholder transactions and may differ from the returns shown in the financial highlights, which reflect adjustments made to the net asset values in accordance with accounting principles generally accepted in the United States of America.
| | | | | | |
| | | |
| 4 | | | | JPMORGAN INSURANCE TRUST | | JUNE 30, 2013 |
JPMorgan Insurance Trust Mid Cap Value Portfolio
SCHEDULE OF PORTFOLIO INVESTMENTS
AS OF JUNE 30, 2013 (Unaudited)
| | | | | | | | |
| SHARES | | | SECURITY DESCRIPTION | | VALUE($) | |
| Common Stocks — 97.9% | | | | |
| | | | Consumer Discretionary — 21.2% | | | | |
| | | | Distributors — 0.8% | | | | |
| | 38,130 | | | Genuine Parts Co. | | | 2,976,809 | |
| | | | | | | | |
| | | | Hotels, Restaurants & Leisure — 2.2% | | | | |
| | 31,951 | | | Darden Restaurants, Inc. | | | 1,612,886 | |
| | 81,986 | | | Marriott International, Inc., Class A | | | 3,309,775 | |
| | 40,400 | | | Yum! Brands, Inc. | | | 2,801,336 | |
| | | | | | | | |
| | | | | | | 7,723,997 | |
| | | | | | | | |
| | | | Household Durables — 1.5% | | | | |
| | 36,620 | | | Jarden Corp. (a) | | | 1,602,125 | |
| | 32,690 | | | Mohawk Industries, Inc. (a) | | | 3,677,298 | |
| | | | | | | | |
| | | | | | | 5,279,423 | |
| | | | | | | | |
| | | | Internet & Catalog Retail — 1.6% | | | | |
| | 56,510 | | | Expedia, Inc. | | | 3,399,077 | |
| | 33,490 | | | TripAdvisor, Inc. (a) | | | 2,038,536 | |
| | | | | | | | |
| | | | | | | 5,437,613 | |
| | | | | | | | |
| | | | Media — 2.7% | | | | |
| | 41,720 | | | Cablevision Systems Corp., Class A | | | 701,731 | |
| | 52,830 | | | CBS Corp. (Non-Voting), Class B | | | 2,581,802 | |
| | 93,004 | | | Clear Channel Outdoor Holdings, Inc.,
Class A (a) | | | 693,810 | |
| | 98,770 | | | DISH Network Corp., Class A | | | 4,199,700 | |
| | 48,900 | | | Gannett Co., Inc. | | | 1,196,094 | |
| | | | | | | | |
| | | | | | | 9,373,137 | |
| | | | | | | | |
| | | | Multiline Retail — 2.8% | | | | |
| | 71,070 | | | Family Dollar Stores, Inc. | | | 4,428,372 | |
| | 105,200 | | | Kohl’s Corp. | | | 5,313,652 | |
| | | | | | | | |
| | | | | | | 9,742,024 | |
| | | | | | | | |
| | | | Specialty Retail — 7.7% | | | | |
| | 12,460 | | | AutoZone, Inc. (a) | | | 5,279,177 | |
| | 67,170 | | | Bed Bath & Beyond, Inc. (a) | | | 4,762,353 | |
| | 113,290 | | | Gap, Inc. (The) | | | 4,727,592 | |
| | 41,700 | | | PetSmart, Inc. | | | 2,793,483 | |
| | 28,810 | | | Tiffany & Co. | | | 2,098,520 | |
| | 66,010 | | | TJX Cos., Inc. | | | 3,304,461 | |
| | 70,430 | | | Williams-Sonoma, Inc. | | | 3,936,333 | |
| | | | | | | | |
| | | | | | | 26,901,919 | |
| | | | | | | | |
| | | | Textiles, Apparel & Luxury Goods — 1.9% | | | | |
| | 28,500 | | | PVH Corp. | | | 3,563,925 | |
| | 15,290 | | | V.F. Corp. | | | 2,951,887 | |
| | | | | | | | |
| | | | | | | 6,515,812 | |
| | | | | | | | |
| | | | Total Consumer Discretionary | | | 73,950,734 | |
| | | | | | | | |
| | | | | | | | |
| SHARES | | | SECURITY DESCRIPTION | | VALUE($) | |
| | | | | | | | |
| | | | Consumer Staples — 4.5% | | | | |
| | | | Beverages — 2.4% | | | | |
| | 61,130 | | | Beam, Inc. | | | 3,857,914 | |
| | 24,043 | | | Brown-Forman Corp., Class B | | | 1,624,105 | |
| | 65,791 | | | Dr. Pepper Snapple Group, Inc. | | | 3,021,781 | |
| | | | | | | | |
| | | | | | | 8,503,800 | |
| | | | | | | | |
| | | | Food Products — 1.2% | | | | |
| | 35,380 | | | Hershey Co. (The) | | | 3,158,726 | |
| | 9,220 | | | JM Smucker Co. (The) | | | 951,043 | |
| | | | | | | | |
| | | | | | | 4,109,769 | |
| | | | | | | | |
| | | | Household Products — 0.9% | | | | |
| | 31,000 | | | Energizer Holdings, Inc. | | | 3,115,810 | |
| | | | | | | | |
| | | | Total Consumer Staples | | | 15,729,379 | |
| | | | | | | | |
| | | | Energy — 5.5% | | | | |
| | | | Oil, Gas & Consumable Fuels — 5.5% | | | | |
| | 52,204 | | | Devon Energy Corp. | | | 2,708,343 | |
| | 107,190 | | | Energen Corp. | | | 5,601,749 | |
| | 46,710 | | | EQT Corp. | | | 3,707,373 | |
| | 72,640 | | | PBF Energy, Inc. | | | 1,881,376 | |
| | 81,650 | | | QEP Resources, Inc. | | | 2,268,237 | |
| | 86,610 | | | Williams Cos., Inc. (The) | | | 2,812,227 | |
| | | | | | | | |
| | | | Total Energy | | | 18,979,305 | |
| | | | | | | | |
| | | | Financials — 26.8% | | | | |
| | | | Capital Markets — 5.6% | | | | |
| | 64,000 | | | Ameriprise Financial, Inc. | | | 5,176,320 | |
| | 165,800 | | | Charles Schwab Corp. (The) | | | 3,519,934 | |
| | 135,640 | | | Invesco Ltd. | | | 4,313,352 | |
| | 54,320 | | | Northern Trust Corp. | | | 3,145,128 | |
| | 47,740 | | | T. Rowe Price Group, Inc. | | | 3,492,181 | |
| | | | | | | | |
| | | | | | | 19,646,915 | |
| | | | | | | | |
| | | | Commercial Banks — 6.5% | | | | |
| | 40,770 | | | City National Corp. | | | 2,583,595 | |
| | 26,640 | | | Cullen/Frost Bankers, Inc. | | | 1,778,753 | |
| | 271,200 | | | Fifth Third Bancorp | | | 4,895,160 | |
| | 45,170 | | | First Republic Bank | | | 1,738,142 | |
| | 188,830 | | | Huntington Bancshares, Inc. | | | 1,487,980 | |
| | 38,820 | | | M&T Bank Corp. | | | 4,338,135 | |
| | 111,800 | | | SunTrust Banks, Inc. | | | 3,529,526 | |
| | 73,700 | | | Zions Bancorporation | | | 2,128,456 | |
| | | | | | | | |
| | | | | | | 22,479,747 | |
| | | | | | | | |
| | | | Insurance — 9.4% | | | | |
| | 8,498 | | | Alleghany Corp. (a) | | | 3,257,368 | |
| | 34,500 | | | Chubb Corp. (The) | | | 2,920,425 | |
SEE NOTES TO FINANCIAL STATEMENTS.
| | | | | | | | |
| | | |
| JUNE 30, 2013 | | JPMORGAN INSURANCE TRUST | | | | | 5 | |
JPMorgan Insurance Trust Mid Cap Value Portfolio
SCHEDULE OF PORTFOLIO INVESTMENTS
AS OF JUNE 30, 2013 (Unaudited) (continued)
| | | | | | | | |
| SHARES | | | SECURITY DESCRIPTION | | VALUE($) | |
| Common Stocks — Continued | | | | |
| | | | Insurance — Continued | | | | |
| | 91,830 | | | Hartford Financial Services Group, Inc. | | | 2,839,384 | |
| | 130,050 | | | Loews Corp. | | | 5,774,220 | |
| | 149,960 | | | Marsh & McLennan Cos., Inc. | | | 5,986,403 | |
| | 175,774 | | | Old Republic International Corp. | | | 2,262,211 | |
| | 15,293 | | | OneBeacon Insurance Group Ltd., Class A | | | 221,443 | |
| | 114,400 | | | Unum Group | | | 3,359,928 | |
| | 71,670 | | | W.R. Berkley Corp. | | | 2,928,436 | |
| | 104,200 | | | XL Group plc, (Ireland) | | | 3,159,344 | |
| | | | | | | | |
| | | | | | | 32,709,162 | |
| | | | | | | | |
| | | | Real Estate Investment Trusts (REITs) — 3.7% | |
| | 136,710 | | | Annaly Capital Management, Inc. | | | 1,718,445 | |
| | 63,940 | | | HCP, Inc. | | | 2,905,434 | |
| | 88,330 | | | Kimco Realty Corp. | | | 1,892,912 | |
| | 49,420 | | | Regency Centers Corp. | | | 2,511,030 | |
| | 44,724 | | | Vornado Realty Trust | | | 3,705,383 | |
| | | | | | | | |
| | | | | | | 12,733,204 | |
| | | | | | | | |
| | | | Real Estate Management & Development — 0.6% | |
| | 131,880 | | | Brookfield Office Properties, Inc. | | | 2,199,758 | |
| | | | | | | | |
| | | | Thrifts & Mortgage Finance — 1.0% | | | | |
| | 19,400 | | | Capitol Federal Financial, Inc. | | | 235,516 | |
| | 103,600 | | | Hudson City Bancorp, Inc. | | | 948,976 | |
| | 165,180 | | | People’s United Financial, Inc. | | | 2,461,182 | |
| | | | | | | | |
| | | | | | | 3,645,674 | |
| | | | | | | | |
| | | | Total Financials | | | 93,414,460 | |
| | | | | | | | |
| | | | Health Care — 4.9% | | | | |
| | | | Health Care Equipment & Supplies — 0.8% | |
| | 71,260 | | | CareFusion Corp. (a) | | | 2,625,931 | |
| | | | | | | | |
| | | | Health Care Providers & Services — 4.1% | | | | |
| | 56,700 | | | AmerisourceBergen Corp. | | | 3,165,561 | |
| | 65,690 | | | Cigna Corp. | | | 4,761,868 | |
| | 25,620 | | | Henry Schein, Inc. (a) | | | 2,453,115 | |
| | 46,890 | | | Humana, Inc. | | | 3,956,578 | |
| | | | | | | | |
| | | | | | | 14,337,122 | |
| | | | | | | | |
| | | | Total Health Care | | | 16,963,053 | |
| | | | | | | | |
| | | | Industrials — 9.7% | | | | |
| | | | Building Products — 0.8% | | | | |
| | 73,250 | | | Fortune Brands Home & Security, Inc. | | | 2,837,705 | |
| | | | | | | | |
| | | | Commercial Services & Supplies — 0.3% | | | | |
| | 30,830 | | | Republic Services, Inc. | | | 1,046,370 | |
| | | | | | | | |
| | | | Electrical Equipment — 2.7% | | | | |
| | 81,530 | | | AMETEK, Inc. | | | 3,448,719 | |
| | 22,890 | | | Hubbell, Inc., Class B | | | 2,266,110 | |
| | | | | | | | |
| SHARES | | | SECURITY DESCRIPTION | | VALUE($) | |
| | | | | | | | |
| | | | Electrical Equipment — Continued | | | | |
| | 55,300 | | | Regal-Beloit Corp. | | | 3,585,652 | |
| | | | | | | | |
| | | | | | | 9,300,481 | |
| | | | | | | | |
| | | | Industrial Conglomerates — 1.1% | | | | |
| | 62,600 | | | Carlisle Cos., Inc. | | | 3,900,606 | |
| | | | | | | | |
| | | | Machinery — 2.6% | | | | |
| | 75,320 | | | IDEX Corp. | | | 4,052,969 | |
| | 85,900 | | | Rexnord Corp. (a) | | | 1,447,415 | |
| | 41,220 | | | Snap-on, Inc. | | | 3,684,244 | |
| | | | | | | | |
| | | | | | | 9,184,628 | |
| | | | | | | | |
| | | | Professional Services — 1.1% | | | | |
| | 62,940 | | | Equifax, Inc. | | | 3,709,054 | |
| | | | | | | | |
| | | | Trading Companies & Distributors — 1.1% | | | | |
| | 49,380 | | | MSC Industrial Direct Co., Inc., Class A | | | 3,824,975 | |
| | | | | | | | |
| | | | Total Industrials | | | 33,803,819 | |
| | | | | | | | |
| | | | Information Technology — 8.4% | | | | |
| | | | Electronic Equipment, Instruments & Components — 2.9% | |
| | 63,380 | | | Amphenol Corp., Class A | | | 4,939,837 | |
| | 113,890 | | | Arrow Electronics, Inc. (a) | | | 4,538,517 | |
| | 38,900 | | | CDW Corp. (a) | | | 724,318 | |
| | | | | | | | |
| | | | | | | 10,202,672 | |
| | | | | | | | |
| | | | IT Services — 1.3% | | | | |
| | 93,390 | | | Jack Henry & Associates, Inc. | | | 4,401,471 | |
| | | | | | | | |
| | | | Semiconductors & Semiconductor Equipment — 3.2% | |
| | 115,130 | | | Analog Devices, Inc. | | | 5,187,758 | |
| | 34,310 | | | KLA-Tencor Corp. | | | 1,912,096 | |
| | 105,600 | | | Xilinx, Inc. | | | 4,182,816 | |
| | | | | | | | |
| | | | | | | 11,282,670 | |
| | | | | | | | |
| | | | Software — 1.0% | | | | |
| | 91,700 | | | Synopsys, Inc. (a) | | | 3,278,275 | |
| | | | | | | | |
| | | | Total Information Technology | | | 29,165,088 | |
| | | | | | | | |
| | | | Materials — 7.4% | | | | |
| | | | Chemicals — 3.8% | | | | |
| | 40,700 | | | Airgas, Inc. | | | 3,885,222 | |
| | 65,346 | | | Albemarle Corp. | | | 4,070,402 | |
| | 11,530 | | | Sherwin-Williams Co. (The) | | | 2,036,198 | |
| | 41,660 | | | Sigma-Aldrich Corp. | | | 3,347,798 | |
| | | | | | | | |
| | | | | | | 13,339,620 | |
| | | | | | | | |
| | | | Containers & Packaging — 3.6% | | | | |
| | 142,080 | | | Ball Corp. | | | 5,902,003 | |
| | 31,970 | | | Rock Tenn Co., Class A | | | 3,193,164 | |
| | 71,900 | | | Silgan Holdings, Inc. | | | 3,376,424 | |
| | | | | | | | |
| | | | | | | 12,471,591 | |
| | | | | | | | |
| | | | Total Materials | | | 25,811,211 | |
| | | | | | | | |
SEE NOTES TO FINANCIAL STATEMENTS.
| | | | | | |
| | | |
| 6 | | | | JPMORGAN INSURANCE TRUST | | JUNE 30, 2013 |
| | | | | | | | |
| SHARES | | | SECURITY DESCRIPTION | | VALUE($) | |
| Common Stocks — Continued | | | | |
| | | | Telecommunication Services — 0.3% | | | | |
| | | | Wireless Telecommunication Services — 0.3% | |
| | 43,390 | | | Telephone & Data Systems, Inc. | | | 1,069,564 | |
| | | | | | | | |
| | | | Utilities — 9.2% | | | | |
| | | | Electric Utilities — 3.3% | | | | |
| | 69,740 | | | Edison International | | | 3,358,679 | |
| | 37,170 | | | NV Energy, Inc. | | | 872,008 | |
| | 109,840 | | | Westar Energy, Inc. | | | 3,510,486 | |
| | 127,620 | | | Xcel Energy, Inc. | | | 3,616,751 | |
| | | | | | | | |
| | | | | | | 11,357,924 | |
| | | | | | | | |
| | | | Gas Utilities — 0.6% | | | | |
| | 87,820 | | | Questar Corp. | | | 2,094,507 | |
| | | | | | | | |
| | | | Multi-Utilities — 5.3% | | | | |
| | 147,640 | | | CenterPoint Energy, Inc. | | | 3,468,063 | |
| | 133,740 | | | CMS Energy Corp. | | | 3,633,716 | |
| | 141,440 | | | NiSource, Inc. | | | 4,050,842 | |
| | 54,670 | | | Sempra Energy | | | 4,469,819 | |
| | 73,200 | | | Wisconsin Energy Corp. | | | 3,000,468 | |
| | | | | | | | |
| | | | | | | 18,622,908 | |
| | | | | | | | |
| | | | Total Utilities | | | 32,075,339 | |
| | | | | | | | |
| | | | Total Common Stocks
(Cost $229,127,884) | | | 340,961,952 | |
| | | | | | | | |
| | | | | | | | |
| SHARES | | | SECURITY DESCRIPTION | | VALUE($) | |
| Short-Term Investment — 2.1% | |
| | | | Investment Company — 2.1% | | | | |
| | 7,214,366 | | | JPMorgan Prime Money Market Fund, Institutional Class Shares,
0.030% (b) (l) (m)
(Cost $7,214,366) | | | 7,214,366 | |
| | | | | | | | |
| | | | Total Investments — 100.0%
(Cost $236,342,250) | | | 348,176,318 | |
| | | | Other Assets in Excess of
Liabilities — 0.0% (g) | | | 43,456 | |
| | | | | | | | |
| | | | NET ASSETS — 100.0% | | $ | 348,219,774 | |
| | | | | | | | |
Percentages indicated are based on net assets.
NOTES TO SCHEDULE OF PORTFOLIO INVESTMENTS:
| | |
| (a) | | — Non-income producing security. |
| (b) | | — Investment in affiliate. Money market fund registered under the Investment Company Act of 1940, as amended, and advised by J.P. Morgan Investment Management Inc. |
| (g) | | — Amount rounds to less than 0.1%. |
| (l) | | — The rate shown is the current yield as of June 30, 2013. |
| (m) | | — All or a portion of this security is reserved and/or pledged with the custodian for current or potential holdings of futures, swaps, options, TBAs, when-issued securities, delayed delivery securities, reverse repurchase agreements, unfunded commitments and/or forward foreign currency exchange contracts. |
SEE NOTES TO FINANCIAL STATEMENTS.
| | | | | | | | |
| | | |
| JUNE 30, 2013 | | JPMORGAN INSURANCE TRUST | | | | | 7 | |
STATEMENT OF ASSETS AND LIABILITIES
AS OF JUNE 30, 2013 (Unaudited)
| | | | |
| | |
Mid Cap Value
Portfolio | |
ASSETS: | | | | |
Investments in non-affiliates, at value | | $ | 340,961,952 | |
Investments in affiliates, at value | | | 7,214,366 | |
| | | | |
Total investment securities, at value | | | 348,176,318 | |
Receivables: | | | | |
Investment securities sold | | | 3,584,191 | |
Portfolio shares sold | | | 120,155 | |
Dividends from non-affiliates | | | 417,254 | |
Dividends from affiliates | | | 367 | |
| | | | |
Total Assets | | | 352,298,285 | |
| | | | |
| |
LIABILITIES: | | | | |
Payables: | | | | |
Investment securities purchased | | | 3,646,462 | |
Portfolio shares redeemed | | | 182,388 | |
Accrued liabilities: | | | | |
Investment advisory fees | | | 183,838 | |
Administration fees | | | 24,075 | |
Custodian and accounting fees | | | 7,444 | |
Trustees’ and Chief Compliance Officer’s fees | | | 86 | |
Other | | | 34,218 | |
| | | | |
Total Liabilities | | | 4,078,511 | |
| | | | |
Net Assets | | $ | 348,219,774 | |
| | | | |
|
NET ASSETS: | |
Paid-in-Capital | | $ | 233,525,686 | |
Accumulated undistributed net investment income | | | 1,664,340 | |
Accumulated net realized gains (losses) | | | 1,195,680 | |
Net unrealized appreciation (depreciation) | | | 111,834,068 | |
| | | | |
Total Net Assets | | $ | 348,219,774 | |
| | | | |
Outstanding units of beneficial interest (shares) | | | | |
(unlimited number of shares authorized, no par value) | | | 37,731,206 | |
| |
Net Asset Value, offering and redemption price per share (a) | | $ | 9.23 | |
| |
Cost of investments in non-affiliates | | $ | 229,127,884 | |
Cost of investments in affiliates | | | 7,214,366 | |
| (a) | Per share amounts may not recalculate due to rounding of net assets and/or shares outstanding. |
SEE NOTES TO FINANCIAL STATEMENTS.
| | | | | | |
| | | |
| 8 | | | | JPMORGAN INSURANCE TRUST | | JUNE 30, 2013 |
STATEMENT OF OPERATIONS
FOR THE SIX MONTHS ENDED JUNE 30, 2013 (Unaudited)
| | | | |
| | |
Mid Cap Value
Portfolio | |
INVESTMENT INCOME: | |
Dividend income from non-affiliates | | $ | 2,904,856 | |
Dividend income from affiliates | | | 3,272 | |
| | | | |
Total investment income | | | 2,908,128 | |
| | | | |
| |
EXPENSES: | | | | |
Investment advisory fees | | | 1,068,575 | |
Administration fees | | | 138,600 | |
Custodian and accounting fees | | | 13,629 | |
Professional fees | | | 26,518 | |
Trustees’ and Chief Compliance Officer’s fees | | | 1,852 | |
Printing and mailing costs | | | 16,140 | |
Transfer agent fees | | | 3,288 | |
Other | | | 16,564 | |
| | | | |
Total expenses | | | 1,285,166 | |
| | | | |
Less amounts waived | | | (11,266 | ) |
| | | | |
Net expenses | | | 1,273,900 | |
| | | | |
Net investment income (loss) | | | 1,634,228 | |
| | | | |
| |
REALIZED/UNREALIZED GAINS (LOSSES): | | | | |
Net realized gain (loss) on transactions from investments in non-affiliates | | | 10,419,317 | |
| | | | |
Change in net unrealized appreciation/depreciation of investments in non-affiliates | | | 33,960,687 | |
| | | | |
Net realized/unrealized gains (losses) | | | 44,380,004 | |
| | | | |
Change in net assets resulting from operations | | $ | 46,014,232 | |
| | | | |
SEE NOTES TO FINANCIAL STATEMENTS.
| | | | | | | | |
| | | |
| JUNE 30, 2013 | | JPMORGAN INSURANCE TRUST | | | | | 9 | |
STATEMENT OF CHANGES IN NET ASSETS
FOR THE PERIODS INDICATED
| | | | | | | | |
| | | Mid Cap Value Portfolio | |
| | | Six Months Ended
6/30/2013
(Unaudited) | | | Year Ended
12/31/2012 | |
CHANGE IN NET ASSETS RESULTING FROM OPERATIONS: | |
Net investment income (loss) | | $ | 1,634,228 | | | $ | 3,638,284 | |
Net realized gain (loss) | | | 10,419,317 | | | | 19,429,054 | |
Change in net unrealized appreciation/depreciation | | | 33,960,687 | | | | 28,356,212 | |
| | | | | | | | |
Change in net assets resulting from operations | | | 46,014,232 | | | | 51,423,550 | |
| | | | | | | | |
| | |
DISTRIBUTIONS TO SHAREHOLDERS: | | | | | | | | |
From net investment income | | | (3,553,610 | ) | | | (2,911,958 | ) |
From net realized gains | | | (3,818,800 | ) | | | — | |
| | | | | | | | |
Total distributions to shareholders | | | (7,372,410 | ) | | | (2,911,958 | ) |
| | | | | | | | |
| | |
CAPITAL TRANSACTIONS: | | | | | | | | |
Change in net assets resulting from capital transactions | | | 12,183,066 | | | | (5,495,491 | ) |
| | | | | | | | |
| | |
NET ASSETS: | | | | | | | | |
Change in net assets | | | 50,824,888 | | | | 43,016,101 | |
Beginning of period | | | 297,394,886 | | | | 254,378,785 | |
| | | | | | | | |
End of period | | $ | 348,219,774 | | | $ | 297,394,886 | |
| | | | | | | | |
Accumulated undistributed net investment income | | $ | 1,664,340 | | | $ | 3,583,722 | |
| | | | | | | | |
| | |
CAPITAL TRANSACTIONS: | | | | | | | | |
Proceeds from shares issued | | $ | 43,491,274 | | | $ | 58,715,688 | |
Distributions reinvested | | | 7,372,410 | | | | 2,911,958 | |
Cost of shares redeemed | | | (38,680,618 | ) | | | (67,123,137 | ) |
| | | | | | | | |
Change in net assets resulting from capital transactions | | $ | 12,183,066 | | | $ | (5,495,491 | ) |
| | | | | | | | |
| | |
SHARE TRANSACTIONS: | | | | | | | | |
Issued | | | 4,845,282 | | | | 7,685,775 | |
Reinvested | | | 824,654 | | | | 392,977 | |
Redeemed | | | (4,320,437 | ) | | | (8,799,999 | ) |
| | | | | | | | |
Change in Shares | | | 1,349,499 | | | | (721,247 | ) |
| | | | | | | | |
SEE NOTES TO FINANCIAL STATEMENTS.
| | | | | | |
| | | |
| 10 | | | | JPMORGAN INSURANCE TRUST | | JUNE 30, 2013 |
THIS PAGE IS INTENTIONALLY LEFT BLANK
FINANCIAL HIGHLIGHTS
FOR THE PERIODS INDICATED
| | | | | | | | | | | | | | | | | | | | | | | | | | | | |
| | | | | | Per share operating performance | |
| | | | | | Investment operations | | | Distributions | |
| | | Net asset
value,
beginning
of period | | | Net
investment
income
(loss) | | | Net realized
and unrealized
gains
(losses) on
investments | | | Total from
investment
operations | | | Net
investment
income | | | Net
realized
gain | | | Total
distributions | |
Mid Cap Value Portfolio (f) | | | | | | | | | |
Six Months Ended June 30, 2013 (Unaudited) | | $ | 8.17 | | | $ | 0.04 | | | $ | 1.22 | | | $ | 1.26 | | | $ | (0.10 | ) | | $ | (0.10 | ) | | $ | (0.20 | ) |
Year Ended December 31, 2012 | | | 6.86 | | | | 0.10 | | | | 1.29 | | | | 1.39 | | | | (0.08 | ) | | | — | | | | (0.08 | ) |
Year Ended December 31, 2011 | | | 6.80 | | | | 0.09 | | | | 0.06 | | | | 0.15 | | | | (0.09 | ) | | | — | | | | (0.09 | ) |
Year Ended December 31, 2010 | | | 5.57 | | | | 0.09 | | | | 1.21 | | | | 1.30 | | | | (0.07 | ) | | | — | | | | (0.07 | ) |
Year Ended December 31, 2009* | | | 4.52 | | | | 0.09 | | | | 1.08 | | | | 1.17 | | | | (0.11 | ) | | | (0.01 | ) | | | (0.12 | ) |
Year Ended December 31, 2008* | | | 7.33 | | | | 0.08 | (g) | | | (2.35 | ) | | | (2.27 | ) | | | (0.07 | ) | | | (0.47 | ) | | | (0.54 | ) |
| (a) | Annualized for periods less than one year. |
| (b) | Not annualized for periods less than one year. |
| (c) | Includes adjustments in accordance with accounting principles generally accepted in the United States of America and as such, the net asset values for financial reporting purposes and the returns based upon those net asset values may differ from the net asset values and returns for shareholder transactions. |
| (d) | Includes earnings credits and interest expense, if applicable, each of which is less than 0.01% unless otherwise noted. |
| (e) | Portfolio turnover is calculated by dividing the lesser of total purchases or sales of portfolio securities for the reporting period by the monthly average value of portfolio securities owned during the reporting period. Excluded from both the numerator and denominator are amounts relating to derivatives and securities whose maturities or expiration dates at the time of acquisition were one year or less. |
| (f) | Mid Cap Value Portfolio acquired all of the assets and liabilities of JPMorgan Mid Cap Value Portfolio ("Predecessor Portfolio") in a reorganization on April 24, 2009. The Predecessor Portfolio's performance and financial history have been adopted by Mid Cap Value Portfolio and have been used since the reorganization. As a result, the financial highlight information reflects that of the Predecessor Portfolio for the periods prior to its reorganization with Mid Cap Value Portfolio. |
| (g) | Calculated based upon average shares outstanding. |
| * | Reflects a 4.187:1 stock split that occurred on April 24, 2009. All per share amounts presented for periods prior to the stock split have been adjusted to reflect the stock split. |
SEE NOTES TO FINANCIAL STATEMENTS.
| | | | | | |
| | | |
| 12 | | | | JPMORGAN INSURANCE TRUST | | JUNE 30, 2013 |
| | | | | | | | | | | | | | | | | | | | | | | | | | |
| | | Ratios/Supplemental data | |
| | | | | | | | | | Ratios to average net assets (a) | | | | |
Net asset
value,
end of
period | | | Total
return (b)(c) | | | Net assets,
end of
period | | | Net
expenses (d) | | | Net
investment
income
(loss) | | | Expenses
without waivers,
reimbursements and
earnings credits | | | Portfolio
turnover
rate (b)(e) | |
| | | | | | | | | | | | | | | | | | | | | | | | | | |
| $ | 9.23 | | | | 15.53 | % | | $ | 348,219,774 | | | | 0.77 | % | | | 0.99 | % | | | 0.78 | % | | | 12 | % |
| | 8.17 | | | | 20.38 | | | | 297,394,886 | | | | 0.78 | | | | 1.30 | | | | 0.79 | | | | 30 | |
| | 6.86 | | | | 2.16 | | | | 254,378,785 | | | | 0.80 | | | | 1.22 | | | | 0.80 | | | | 43 | |
| | 6.80 | | | | 23.45 | | | | 257,312,179 | | | | 0.81 | | | | 1.36 | | | | 0.82 | | | | 32 | |
| | 5.57 | | | | 26.68 | | | | 238,433,429 | | | | 0.88 | | | | 1.93 | | | | 1.02 | | | | 39 | |
| | 4.52 | | | | (33.21 | ) | | | 181,965,679 | | | | 1.00 | | | | 1.31 | | | | 1.25 | | | | 41 | |
SEE NOTES TO FINANCIAL STATEMENTS.
| | | | | | | | |
| | | |
| JUNE 30, 2013 | | JPMORGAN INSURANCE TRUST | | | | | 13 | |
NOTES TO FINANCIAL STATEMENTS
AS OF JUNE 30, 2013 (Unaudited)
1. Organization
JPMorgan Insurance Trust (the “Trust”) is registered under the Investment Company Act of 1940, as amended (the “1940 Act”), as an open-end management investment company and is a Massachusetts business trust.
The following is a separate Portfolio of the Trust (the “Portfolio”) covered by this report:
| | | | |
| | | Class Offered | | Diversified/Non-Diversified |
| Mid Cap Value Portfolio | | Class 1 | | Diversified |
The investment objective of the Portfolio is to seek capital appreciation with the secondary goal of achieving current income by investing primarily in equity securities.
Portfolio shares are offered only to separate accounts of participating insurance companies and Eligible Plans. Individuals may not purchase shares directly from the Portfolio.
Effective as of the close of business on May 1, 2013, the Portfolio is offered only on a limited basis. Investors are not eligible to purchase shares of the Portfolio unless they meet certain requirements as described in its prospectus.
2. Significant Accounting Policies
The following is a summary of significant accounting policies followed by the Portfolio in the preparation of its financial statements. The policies are in accordance with accounting principles generally accepted in the United States of America (“GAAP”). The preparation of financial statements requires management to make estimates and assumptions that affect the reported amounts and disclosures in the financial statements. Actual results could differ from those estimates.
A. Valuation of Investments — Equity securities listed on a North American, Central American, South American or Caribbean securities exchange shall generally be valued at the last sale price on the exchange on which the security is principally traded that is reported before the time when the net assets of the Portfolio are valued. Securities listed on the NASDAQ Stock Market LLC are generally valued at the NASDAQ Official Closing Price. Generally, short-term investments of sufficient credit quality maturing in less than 61 days are valued at amortized cost, which approximates fair value. Investments in other open-end investment companies are valued at each investment company’s net asset value per share (“NAV”) as of the report date.
Certain investments of the Portfolio may, depending upon market conditions, trade in relatively thin markets and/or in markets that experience significant volatility. As a result of these conditions, the prices used by the Portfolio to value these securities may differ from the value that would be realized if these securities were sold, and the differences could be material. Futures and options are generally valued on the basis of available market quotations. Swaps and other derivatives are valued daily, primarily using independent or affiliated pricing services approved by the Board of Trustees. If valuations are not available from such services or values received are deemed not representative of fair value, values will be obtained from a third party broker-dealer or counterparty.
Securities or other assets for which market quotations are not readily available or for which market quotations are deemed to not represent the fair value of the security or asset at the time of pricing (including certain illiquid securities) are fair valued in accordance with procedures established by and under the supervision and responsibility of the Board of Trustees. The Board of Trustees has established an Audit and Valuation Committee to assist with the oversight of the valuation of the Portfolio’s securities. JPMorgan Funds Management, Inc. (the “Administrator”, or “JPMFM”), an indirect, wholly-owned subsidiary of JPMorgan Chase & Co. (“JPMorgan”), has established a Valuation Committee (“VC”) that is comprised of senior representatives from JPMFM, J.P. Morgan Investment Management Inc. (“JPMIM” or the “Advisor”), a wholly-owned subsidiary of JPMorgan Asset Management Holdings Inc. (“JPMAM”), which is a wholly-owned subsidiary of JPMorgan, JPMorgan’s Legal and Compliance and JPMAM’s Risk Management and the Portfolio’s Chief Compliance Officer. The VC’s responsibilities include making determinations regarding Level 3 fair value measurements (“Fair Values”) and/or providing recommendations for approval to the Board of Trustees’ Audit and Valuation Committee, in accordance with the Portfolio’s valuation policies.
The VC or Board of Trustees, as applicable, primarily employs a market-based approach which may use related or comparable assets or liabilities, recent transactions, market multiples, book values, and other relevant information for the investment to determine the fair value of the investment. The VC or Board of Trustees may also use an income-based valuation approach in which the anticipated future cash flows of the investment are discounted to calculate fair value. Discounts may also be applied due to the nature or duration of any restrictions on the disposition of the investments. Valuations may be based upon current market prices of securities that are comparable in coupon, rating, maturity and industry.
It is possible that the estimated values may differ significantly from the values that would have been used had a ready market for the investments existed, and such differences could be material. JPMFM and JPMIM are responsible for monitoring developments that may impact Fair Values and for discussing and assessing Fair Values on an ongoing, and at least a quarterly, basis with the VC and Board of Trustees, as applicable. The appropriateness of Fair Values is assessed based on results of unchanged price review and consideration of macro or security specific events, back testing and broker and vendor due diligence.
Valuations reflected in this report are as of the report date. As a result, changes in valuation due to market events and/or issuer related events after the report date and prior to issuance of the report, are not reflected herein.
| | | | | | |
| | | |
| 14 | | | | JPMORGAN INSURANCE TRUST | | JUNE 30, 2013 |
The various inputs that are used in determining the fair value of the Portfolio’s investments are summarized into the three broad levels listed below.
| Ÿ | | Level 1 — quoted prices in active markets for identical securities |
| Ÿ | | Level 2 — other significant observable inputs (including quoted prices for similar securities, interest rates, prepayment speeds, credit risk, etc.) |
| Ÿ | | Level 3 — significant unobservable inputs (including the Portfolio’s own assumptions in determining the fair value of investments) |
A financial instrument’s level within the fair value hierarchy is based on the lowest level of any input, both individually and in the aggregate, that is significant to the fair value measurement. The inputs or methodology used for valuing securities are not necessarily an indication of the risk associated with investing in those securities.
The following table represents each valuation input as presented on the Schedule of Portfolio Investments (“SOI”):
| | | | | | | | | | | | | | | | |
| | | Level 1
Quoted prices | | | Level 2
Other significant
observable inputs | | | Level 3
Significant
unobservable inputs | | | Total | |
Total Investments in Securities (a) | | $ | 348,176,318 | | | $ | – | | | $ | – | | | $ | 348,176,318 | |
| | | | | | | | | | | | | | | | |
| (a) | All portfolio holdings designated as Level 1 are disclosed individually on the SOI. Please refer to the SOI for industry specifics of portfolio holdings. |
There were no transfers between any levels during the period ended June 30, 2013.
B. Security Transactions and Investment Income — Investment transactions are accounted for on the trade date (the date the order to buy or sell is executed). Securities gains and losses are calculated on a specifically identified cost basis. Interest income is determined on the basis of coupon interest accrued using the effective interest method which adjusts for amortization of premiums and accretion of discounts. Dividend income, net of foreign taxes withheld, if any, is recorded on the ex-dividend date or when the Portfolio first learns of the dividend.
To the extent such information is publicly available, the Portfolio records distributions received in excess of income earned from underlying investments as a reduction of cost of investments and/or realized gain. Such amounts are based on estimates if actual amounts are not available and actual amounts of income, realized gain and return of capital may differ from the estimated amounts. The Portfolio adjusts the estimated amounts of the components of distributions (and consequently its net investment income) as necessary once the issuers provide information about the actual composition of the distributions.
C. Allocation of Expenses — Expenses directly attributable to a portfolio are charged directly to that portfolio, while the expenses attributable to more than one portfolio of the Trust are allocated among the respective portfolios.
D. Federal Income Taxes — The Portfolio is treated as a separate taxable entity for Federal income tax purposes. The Portfolio’s policy is to comply with the provisions of the Internal Revenue Code of 1986, as amended (the “Code”), applicable to regulated investment companies and to distribute to shareholders all of its distributable net investment income and net realized gain on investments. Accordingly, no provision for Federal income tax is necessary. The Portfolio is also a segregated portfolio of assets for insurance purposes and intends to comply with the diversification requirements of Subchapter L of the Code. Management has reviewed the Portfolio’s tax positions for all open tax years and has determined that as of June 30, 2013, no liability for income tax is required in the Portfolio’s financial statements for net unrecognized tax benefits. However, management’s conclusions may be subject to future review based on changes in, or the interpretation of, the accounting standards or tax laws and regulations. The Portfolio’s Federal tax returns for the prior three fiscal years remain subject to examination by the Internal Revenue Service.
E. Distributions to Shareholders — Distributions from net investment income and net realized capital gains, if any, are generally declared and paid at least annually. The amount of distributions from net investment income and net realized capital gains is determined in accordance with Federal income tax regulations, which may differ from GAAP. To the extent these “book/tax” differences are permanent in nature (i.e., that they result from other than timing of recognition — “temporary differences”), such amounts are reclassified within the capital accounts based on their Federal tax-basis treatment.
3. Fees and Other Transactions with Affiliates
A. Investment Advisory Fee — Pursuant to the Investment Advisory Agreement, JPMIM supervises the investments of the Portfolio and for such services is paid a fee. The fee is accrued daily and paid monthly based on the Portfolio’s average daily net assets at an annual rate of 0.65%.
The Advisor waived Investment Advisory fees and/or reimbursed expenses as outlined in Note 3.E.
B. Administration Fee — Pursuant to an Administration Agreement, the Administrator provides certain administration services to the Portfolio. In consideration of these services, the Administrator receives a fee accrued daily and paid monthly at an annual rate of 0.15% of the first $25 billion of the average daily net assets of all funds in the J.P. Morgan Funds Complex (excluding certain funds of funds and money market funds) and 0.075% of the average daily net assets in excess of $25 billion of all such funds. For the six months ended June 30, 2013, the annualized effective rate was 0.08% of the Portfolio’s average daily net assets, notwithstanding any fee waivers and/or reimbursements.
JPMorgan Chase Bank, N.A. (“JPMCB”), a wholly-owned subsidiary of JPMorgan, serves as the Portfolio’s sub-administrator (the “Sub-administrator”). For its services as Sub-administrator, JPMCB receives a portion of the fees payable to the Administrator.
| | | | | | | | |
| | | |
| JUNE 30, 2013 | | JPMORGAN INSURANCE TRUST | | | | | 15 | |
NOTES TO FINANCIAL STATEMENTS
AS OF JUNE 30, 2013 (Unaudited) (continued)
The Administrator waived Administration fees as outlined in Note 3.E
C. Distribution Fees — Pursuant to a Distribution Agreement, JPMorgan Distribution Services, Inc. (the “Distributor”), a wholly-owned subsidiary of JPMorgan, serves as the Trust’s exclusive underwriter and promotes and arranges for the sale of the Portfolio’s shares. The Distributor receives no compensation in its capacity as the Portfolio’s underwriter.
D. Custodian and Accounting Fees — JPMCB provides portfolio custody and accounting services to the Portfolio. The amounts paid directly to JPMCB by the Portfolio for custody and accounting services are included in Custodian and accounting fees in the Statement of Operations. Payments to the custodian may be reduced by credits earned by the Portfolio, based on uninvested cash balances held by the custodian. Such earnings credits, if any, are presented separately in the Statement of Operations.
Interest expense, if any, paid to the custodian related to cash overdrafts is included in Interest expense to affiliates in the Statement of Operations.
E. Waivers and Reimbursements — The Advisor and Administrator have contractually agreed to waive fees and/or reimburse the Portfolio to the extent that total annual operating expenses (excluding acquired fund fees and expenses, dividend expenses related to short sales, interest, taxes, expenses related to litigation and potential litigation, extraordinary expenses and expenses related to the Board of Trustees’ deferred compensation plan) exceed 0.90% of the Portfolio’s respective average daily net assets.
The expense limitation agreement was in effect for the six months ended June 30, 2013. The contractual expense limitation percentage above is in place until at least April 30, 2014. For the six months ended June 30, 2013, there were no waived fees relating to the expense limitation agreement.
Additionally, the Portfolio may invest in one or more money market funds advised by the Advisor or its affiliates. The Advisor and the Administrator waive fees in an amount sufficient to offset the respective fees each charges to the affiliated money market fund on the Portfolio’s investment in such affiliated money market fund. A portion of the waiver is voluntary.
The amount of waivers resulting from investments in these money market funds for the six months ended June 30, 2013 was $11,266.
F. Other — Certain officers of the Trust are affiliated with the Advisor, the Administrator and the Distributor. Such officers, with the exception of the Chief Compliance Officer, receive no compensation from the Portfolio for serving in their respective roles.
The Board of Trustees appointed a Chief Compliance Officer to the Portfolio in accordance with Federal securities regulations. The Portfolio, along with other affiliated portfolios, makes reimbursement payments, on a pro-rata basis, to the Administrator for a portion of the fees associated with the Office of the Chief Compliance Officer. Such fees are included in Trustees’ and Chief Compliance Officer’s fees in the Statement of Operations.
The Trust adopted a Trustee Deferred Compensation Plan (the “Plan”) which allows the Independent Trustees to defer the receipt of all or a portion of compensation related to performance of their duties as Trustees. The deferred fees are invested in various J.P. Morgan Funds until distribution in accordance with the Plan.
During the six months ended June 30, 2013, the Portfolio may have purchased securities from an underwriting syndicate in which the principal underwriter or members of the syndicate are affiliated with the Advisor.
The Portfolio may use related party broker-dealers. For the six months ended June 30, 2013, the Portfolio did not incur any brokerage commissions with broker-dealers affiliated with the Advisor.
The Securities and Exchange Commission has granted an exemptive order permitting the Portfolio to engage in principal transactions with J.P. Morgan Securities, Inc., an affiliated broker, involving taxable money market instruments, subject to certain conditions.
4. Investment Transactions
During the six months ended June 30, 2013, purchases and sales of investments (excluding short-term investments) were as follows:
| | | | | | | | |
| | | Purchases
(excluding U.S.
Government) | | | Sales (excluding U.S. Government) | |
| | $ | 47,345,144 | | | $ | 38,236,729 | |
During the six months ended June 30, 2013, there were no purchases or sales of U.S. Government securities.
5. Federal Income Tax Matters
For Federal income tax purposes, the cost and unrealized appreciation (depreciation) in value of investment securities held at June 30, 2013, were as follows:
| | | | | | | | | | | | | | | | |
| | | Aggregate Cost | | | Gross Unrealized Appreciation | | | Gross Unrealized Depreciation | | | Net Unrealized Appreciation (Depreciation) | |
| | $ | 236,342,250 | | | $ | 112,710,404 | | | $ | 876,336 | | | $ | 111,834,068 | |
| | | | | | |
| | | |
| 16 | | | | JPMORGAN INSURANCE TRUST | | JUNE 30, 2013 |
Under the Regulated Investment Company Modernization Act of 2010 (the “Act”), net capital losses recognized by the Portfolio after December 31, 2010 may get carried forward indefinitely, and retain their character as short-term and/or long-term losses. Prior to the Act, net capital losses incurred by the Portfolio were carried forward for eight years and treated as short-term losses. The Act requires that post-enactment net capital losses be used before pre-enactment net capital losses.
At December 31, 2012, the Portfolio did not have any post-enactment net capital loss carryforwards.
At December 31, 2012, the Portfolio had pre-enactment net capital loss carryforwards, expiring during the year indicated, which are available to offset future realized gains:
| | | | | | | | |
| | | 2017 | | | Total | |
| | $ | 6,766,415 | * | | $ | 6,766,415 | * |
| * | This entire amount is comprised of capital loss carryforwards from business combinations, which may be limited in future years under the Internal Revenue Code Sections 381-384. |
6. Borrowings
The Trust and JPMCB have entered into a financing arrangement. Under this arrangement, JPMCB provides an unsecured, uncommitted credit facility in the aggregate amount of $100 million to certain of the J.P. Morgan Funds, including the Portfolio. Advances under the arrangement are taken primarily for temporary or emergency purposes, including the meeting of redemption requests that otherwise might require the untimely disposition of securities, and are subject to the Portfolio’s borrowing restrictions. Interest on borrowings is payable at a rate determined by JPMCB at the time of borrowing. This agreement has been extended until November 11, 2013.
The Portfolio had no borrowings outstanding from the unsecured, uncommitted credit facility at June 30, 2013, or at any time during the six months then ended.
Interest expense paid, if any, as a result of borrowings from the unsecured, uncommitted credit facility is included in Interest expense to affiliates in the Statement of Operations.
7. Risks, Concentrations and Indemnifications
In the normal course of business, the Portfolio enters into contracts that contain a variety of representations which provide general indemnifications. The Portfolio’s maximum exposure under these arrangements is unknown. The amount of exposure would depend on future claims that may be made against the Portfolio that have not yet occurred. However, based on experience, the Portfolio expects the risk of loss to be remote.
The Portfolio has a shareholder holding a significant percentage of shares outstanding. Investment activities of this shareholder could have a material impact on the Portfolio.
| | | | | | | | |
| | | |
| JUNE 30, 2013 | | JPMORGAN INSURANCE TRUST | | | | | 17 | |
SCHEDULE OF SHAREHOLDER EXPENSES
(Unaudited)
Hypothetical $1,000 Investment
As a shareholder of the Portfolio, you incur ongoing costs, including investment advisory fees, administration fees and other Portfolio expenses. Because the Portfolio is a funding vehicle for Policies and Eligible Plans, you may also incur sales charges and other fees relating to the Policies or Eligible Plans. The examples below are intended to help you understand your ongoing costs (in dollars) of investing in the Portfolio, but not the costs of the Policies or Eligible Plans, and to compare these ongoing costs with the ongoing costs of investing in other mutual funds. The examples assume that you had a $1,000 investment in the Portfolio at the beginning of the reporting period, January 1, 2013, and continued to hold your shares at the end of the reporting period, June 30, 2013.
Actual Expenses
The first line provides information about actual account values and actual expenses. You may use the information in this line, together with the amount you invested, to estimate the expenses that you paid over the period. Simply divide your account value by $1,000 (for example, an $8,600 account value divided by $1,000 = 8.6), then multiply the result by the number in the first line under the heading entitled “Expenses Paid During the Period” to estimate the expenses you paid on your account during this period.
Hypothetical Example for Comparison Purposes
The second line in the table below provides information about hypothetical account values and hypothetical expenses based on the actual expense ratio and an assumed rate of return of 5% per year before expenses, which is not the Portfolio’s actual return. The hypothetical account values and expenses may not be used to estimate the actual ending account balance or expenses you paid for the period. You may use this information to compare the ongoing costs of investing in the Portfolio and other portfolios. To do so, compare this 5% hypothetical example with the 5% hypothetical examples that appear in the shareholder reports of the other funds. Please note that the expenses shown in the table are meant to highlight your ongoing costs only and do not reflect any transaction costs, such as sales charges (loads) or redemption fees or the costs associated with the Policies and Eligible Plans through which the Portfolio is held. Therefore, the second line in the table is useful in comparing ongoing costs only, and will not help you determine the relative total costs of owning different portfolios. In addition, if these transaction costs were included, your costs would have been higher. The examples also assume all dividends and distributions have been reinvested.
| | | | | | | | | | | | | | | | |
| | | Beginning
Account Value,
January 1, 2013 | | | Ending
Account Value
June 30, 2013 | | | Expenses
Paid During
the Period* | | | Annualized
Expense
Ratio | |
Mid Cap Value Portfolio | | | | | | | | | | | | | | | | |
Class 1 | | | | | | | | | | | | | | | | |
Actual | | $ | 1,000.00 | | | $ | 1,155.30 | | | $ | 4.11 | | | | 0.77 | % |
Hypothetical | | | 1,000.00 | | | | 1,020.98 | | | | 3.86 | | | | 0.77 | |
| * | Expenses are equal to the Portfolio’s annualized expense ratio, multiplied by the average account value over the period, multiplied by 181/365 (to reflect the one-half year period). |
SEE NOTES TO FINANCIAL STATEMENTS.
| | | | | | |
| | | |
| 18 | | | | JPMORGAN INSURANCE TRUST | | JUNE 30, 2013 |
J.P. Morgan Funds are distributed by JPMorgan Distribution Services, Inc., which is an affiliate of JPMorgan Chase & Co. Affiliates of JPMorgan Chase & Co. receive fees for providing various services to the funds.
Contact JPMorgan Distribution Services, Inc. at 1-800-480-4111 for a portfolio prospectus. You can also visit us at www.jpmorganfunds.com. Investors should carefully consider the investment objectives and risk as well as charges and expenses of the mutual fund before investing. The prospectus contains this and other information about the mutual fund. Read the prospectus carefully before investing.
The Portfolio files a complete schedule of its portfolio holdings for the first and third quarters of its fiscal year with the SEC on Form N-Q. The Portfolio’s Forms N-Q are available on the SEC’s website at http://www.sec.gov and may be reviewed and copied at the SEC’s Public Reference Room in Washington, DC. Information on the operation of the SEC’s Public Reference Room may be obtained by calling 1-800-SEC-0330. Shareholders may request the Form N-Q without charge by calling 1-800-480-4111 or by visiting the variable insurance portfolio section of the J.P. Morgan Funds’ website at www.jpmorganfunds.com.
A description of the Portfolio’s policies and procedures with respect to the disclosure of the Portfolio’s holdings is available in the prospectus and Statement of Additional Information.
A copy of proxy policies and procedures is available without charge upon request by calling 1-800-480-4111 and on the Portfolio’s website at www.jpmorganfunds.com. A description of such policies and procedures is on the SEC’s website at www.sec.gov. The Trustees have delegated the authority to vote proxies for securities owned by the Portfolio to the Advisor. A copy of the Portfolio’s voting record for the most recent 12-month period ended June 30 is available on the SEC’s website at www.sec.gov or at the Portfolio’s website at www.jpmorganfunds.com no later than August 31 of each year. The Portfolio’s proxy voting record will include, among other things, a brief description of the matter voted on for each portfolio security, and will state how each vote was cast, for example, for or against the proposal.
| | | | |
| | © JPMorgan Chase & Co., 2013. All rights reserved. June 2013. | | SAN-JPMITMCVP-613 |
Semi-Annual Report
JPMorgan Insurance Trust
June 30, 2013 (Unaudited)
JPMorgan Insurance Trust Small Cap Core Portfolio
| | | | |
NOT FDIC INSURED Ÿ NO BANK GUARANTEE Ÿ MAY LOSE VALUE
| | |  | |
CONTENTS
Investments in the Portfolio are not bank deposits or obligations of, or guaranteed or endorsed by, any bank and are not insured or guaranteed by the FDIC, the Federal Reserve Board or any other government agency. You could lose money if you sell when the Portfolio’s share price is lower than when you invested.
Past performance is no guarantee of future performance. The general market views expressed in this report are opinions based on market and other conditions through the end of the reporting period and are subject to change without notice. These views are not intended to predict the future performance of the Portfolio or the securities markets. References to specific securities and their issuers are for illustrative purposes only and are not intended to be, and should not be interpreted as, recommendations to purchase or sell such securities. Such views are not meant as investment advice and may not be relied on as an indication of trading intent on behalf of the Portfolio.
This Portfolio is intended to be a funding vehicle for variable annuity contracts and variable life insurance policies (collectively “Policies”) offered by separate accounts of participating insurance companies. Portfolio shares are also offered through qualified pension and retirement plans (“Eligible Plans”). Individuals may not purchase shares directly from the Portfolio.
Prospective investors should refer to the Portfolio’s prospectus for a discussion of the Portfolio’s investment objective, strategies and risks. Call J.P. Morgan Funds Service Center at 1-800-480-4111 for a prospectus containing more complete information about the Portfolio, including management fees and other expenses. Please read it carefully before investing.
CEO’S LETTER
July 26, 2013 (Unaudited)
Dear Shareholder:
While somewhat overshadowed by increased volatility at the end of the reporting period, developed market equities in aggregate posted solid returns for the six months ended June 30, 2013. For much of the period, stocks were supported by solid corporate earnings and robust demand from investors looking to generate higher returns in the low interest rate environment. Despite signaling a potential policy shift in June 2013, the U.S. Federal Reserve (“Fed”) continued to pursue its highly accommodative policies in an attempt to lower unemployment and spur the economy. Central banks overseas also did their part to support their economies. The European Central Bank (“ECB”) remained committed to preserving the euro, as it cut rates and introduced new programs designed to aid struggling euro zone members. Elsewhere, the Bank of Japan stepped up its major asset purchase program as a new pro-growth government came into power late in 2012.
| | |
 | | “We are encouraged by the stock market’s resiliency in the face of recent volatility.” |
Positive investor sentiment was temporarily interrupted, however, in May 2013 when Fed Chairman Bernanke indicated that the central bank may begin to “taper” its asset purchase program later this year. This triggered a sharp decline in global equities, although they quickly regained their footing and have continued to rally in July. All told, U.S. stocks rose sharply during the six months ended June 30, 2013. Overseas, international developed stocks produced more modest gains, while emerging market equities performed poorly given concerns regarding China’s economy and falling commodity prices.
U.S. Treasury Yields Rise Sharply
Talk of Fed tapering negatively impacted the fixed income markets. While U.S. Treasury security yields continued to be low from a historical perspective, they ended the period sharply higher than when the reporting period began. The yield for 10-year U.S. Treasury securities ended June 30, 2013 at 2.52%, while the yields for 2- and 30-year U.S. Treasury securities finished the reporting period at 0.36% and 3.52%, respectively. Amid the rising interest rate environment, the overall U.S. fixed income market generated a negative return for the reporting period. In contrast, high yield bonds posted a modest gain, while emerging market debt securities fell sharply.
Positive Signs for Stocks
Although the global economy is far from robust, it is still on a growth path. The expansion in the U.S. certainly appears to be sustainable and, while Europe remains in a recession, there are indications that its economy may be bottoming. Elsewhere, pro-growth initiatives in Japan have thus far yielded positive results. While growth in China has moderated, we believe the government has the tools at its disposal to avoid a “hard landing.”
We are encouraged by the stock market’s resiliency in the face of recent volatility. In addition, there have been signs that equity market correlations are decreasing, which could create a more favorable environment for active managers. In addition, given the recent sell-off in the bond market, valuations in a number of fixed income sectors have become more attractive.
On behalf of everyone at J.P. Morgan Asset Management, thank you for your continued support. We look forward to managing your investment needs for years to come. Should you have any questions, please visit www.jpmorganfunds.com or contact the J.P. Morgan Funds Service Center at 1-800-480-4111.
Sincerely yours,

George C.W. Gatch
CEO, Global Funds Management
J.P. Morgan Asset Management
| | | | | | | | |
| | | |
| JUNE 30, 2013 | | JPMORGAN INSURANCE TRUST | | | | | 1 | |
JPMorgan Insurance Trust Small Cap Core Portfolio
PORTFOLIO COMMENTARY
SIX MONTHS ENDED JUNE 30, 2013 (Unaudited)
| | | | |
| REPORTING PERIOD RETURN: | |
| Portfolio (Class 1 Shares)* | | | 17.13% | |
| Russell 2000 Index | | | 15.86% | |
| |
| Net Assets as of 6/30/2013 | | $ | 84,139,741 | |
INVESTMENT OBJECTIVE**
The JPMorgan Insurance Trust Small Cap Core Portfolio (the “Portfolio”) seeks capital growth over the long term.
HOW DID THE MARKET PERFORM?
Despite periods of heightened volatility and a setback in June, the overall U.S. equity market, as measured by the S&P 500 Index (“S&P 500”), generated strong results for the six months ended June 30, 2013. The S&P 500 generated a positive return for each of the first five months of the reporting period. Supporting the market were overall solid corporate profits, improving economic growth and generally robust investor demand. These factors helped the S&P 500 to post several all-time highs over the first five months of 2013. The S&P 500 then reversed course and declined during the last month of the reporting period. This turnaround was triggered by indications that the U.S. Federal Reserve Board (“Fed”) would begin tapering its monthly purchases of bonds — $85 billion of mortgage-backed securities and Treasury securities — if economic conditions continued to improve. This caused interest rates to move sharply higher and both stock and bond prices fell sharply. However, the S&P 500 again rallied in late June, as concerns regarding Fed tapering abated somewhat. All told, small-cap stocks, as measured by the Russell 2000 Index (the “Benchmark”), finished the six months ended June 30, 2013 with a 15.86% gain.
WHAT WERE THE MAIN DRIVERS OF THE PORTFOLIO’S PERFORMANCE?
The Portfolio (Class 1 Shares) outperformed the Benchmark for the six months ended June 30, 2013. The Portfolio’s stock selection in the software and services sector and the industrial cyclical sector contributed to relative performance. The Portfolio’s stock selection in the basic materials and telecommunication services sectors detracted from relative performance.
Individual contributors to relative performance included the Portfolio’s positions in Aegerion Pharmaceuticals Inc., Conn’s, Inc. and Rock-Tenn Co. Aegerion Pharmaceuticals Inc., a biopharmaceutical company focused on the development and commercialization of therapeutics to treat lipid disorders, was upgraded by analysts amid optimism over its product pipeline. Conn’s Inc., a specialty retailer of durable consumer products, reported stronger-than-expected revenue and raised its profit forecast for fiscal 2014. Shares of Rock-Tenn Co., a container and packaging company, rose on the news that the company would initiate a quarterly dividend to investors.
Individual detractors from relative performance included Infinity Pharmaceuticals, Inc., Affymax, Inc. and Idenix Pharmaceuticals, Inc. Shares of Infinity Pharmaceuticals, Inc. fell amid concerns over a new cancer drug. Affymax, Inc. is a biopharmaceutical company that develops peptide-based drugs for the treatment of life-threatening conditions. Its shares performed poorly as the company was suspended and subsequently delisted by NASDAQ. Shares of Idenix Pharmaceuticals, Inc. fell sharply during the reporting period. Investor sentiment for the company remained challenged given the U.S. Food and Drug Administration’s halting of its hepatitis C treatment drug, which had been about to enter the clinical study phase.
HOW WAS THE PORTFOLIO POSITIONED?
In accordance with its investment process, the portfolio managers take limited sector bets and construct the Portfolio so that stock selection is typically the primary driver of its relative performance versus the Benchmark. The portfolio managers employ a bottom-up approach to stock selection, using quantitative screening and proprietary analysis to construct a portfolio of companies that they believe exhibit improving business trends that also trade at a discount to their peers. During the reporting period, the Portfolio was managed and positioned in accordance with this investment process.
| | | | | | |
| | | |
| 2 | | | | JPMORGAN INSURANCE TRUST | | JUNE 30, 2013 |
| | | | | | | | |
| TOP TEN EQUITY HOLDINGS OF THE PORTFOLIO*** | |
| | 1. | | | Sanmina Corp. | | | 1.3 | % |
| | 2. | | | East West Bancorp, Inc. | | | 1.1 | |
| | 3. | | | Rite Aid Corp. | | | 1.1 | |
| | 4. | | | NuVasive, Inc. | | | 1.0 | |
| | 5. | | | Unisys Corp. | | | 1.0 | |
| | 6. | | | Pegasystems, Inc. | | | 1.0 | |
| | 7. | | | WebMD Health Corp. | | | 1.0 | |
| | 8. | | | Popular, Inc. | | | 1.0 | |
| | 9. | | | Conn’s, Inc. | | | 1.0 | |
| | 10. | | | Medicines Co. (The) | | | 1.0 | |
| | | | |
PORTFOLIO COMPOSITION BY SECTOR*** | |
| Financials | | | 22.7 | % |
| Information Technology | | | 16.7 | |
| Industrials | | | 15.8 | |
| Consumer Discretionary | | | 13.8 | |
| Health Care | | | 10.8 | |
| Energy | | | 4.9 | |
| Materials | | | 4.7 | |
| Consumer Staples | | | 4.6 | |
| Utilities | | | 3.1 | |
| Telecommunication Services | | | 1.2 | |
| U.S. Treasury Obligation | | | 0.2 | |
| Short-Term Investment | | | 1.5 | |
| * | | The return shown is based on net asset values calculated for shareholder transactions and may differ from the return shown in the financial highlights, which reflects adjustments made to the net asset values in accordance with accounting principles generally accepted in the United States of America. |
| ** | | The advisor seeks to achieve the Portfolio’s objective. There can be no guarantee it will be achieved. |
| *** | | Percentages indicated are based on total investments as of June 30, 2013. The Portfolio’s composition is subject to change. |
| | | | | | | | |
| | | |
| JUNE 30, 2013 | | JPMORGAN INSURANCE TRUST | | | | | 3 | |
JPMorgan Insurance Trust Small Cap Core Portfolio
PORTFOLIO COMMENTARY
SIX MONTHS ENDED JUNE 30, 2013 (Unaudited) (continued)
| | | | | | | | | | | | | | | | | | | | |
AVERAGE ANNUAL TOTAL RETURNS AS OF JUNE 30, 2013 | |
| | | | | |
| | | INCEPTION DATE
OF CLASS | | | 6 MONTH* | | | 1 YEAR | | | 5 YEAR | | | 10 YEAR | |
CLASS 1 SHARES | | | 1/3/95 | | | | 17.13 | % | | | 29.39 | % | | | 8.75 | % | | | 9.50 | % |
CLASS 2 SHARES | | | 4/24/09 | | | | 16.94 | | | | 28.99 | | | | 8.52 | | | | 9.38 | |
TEN YEAR PERFORMANCE (6/30/03 to 6/30/13)
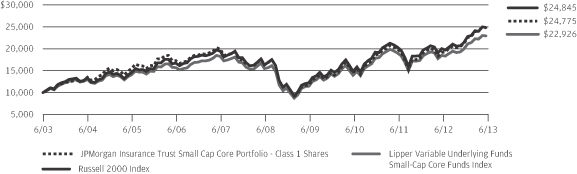
The performance quoted is past performance and is not a guarantee of future results. Mutual funds are subject to certain market risks. Investment returns and principal value of an investment will fluctuate so that an investor’s shares, when redeemed, may be worth more or less than their original cost. Current performance may be higher or lower than the performance data shown. For up-to-date month-end performance information please call 1-800-480-4111.
Inception date for Class 1 Shares is January 3, 1995, which is the inception date of JPMorgan Small Company Portfolio (“Predecessor Portfolio”). The JPMorgan Insurance Trust Small Cap Core Portfolio acquired all of the assets and liabilities of the Predecessor Portfolio in a reorganization on April 24, 2009. The Predecessor Portfolio’s performance and financial history have been adopted by the Small Cap Core Portfolio and have been used since the reorganization. As a result the performance for Class 1 Shares prior to April 25, 2009, is the performance of the Predecessor Portfolio.
Returns for Class 2 Shares prior to April 25, 2009 are based on the performance of Class 1 Shares. The actual returns of Class 2 Shares would have been lower than shown because Class 2 Shares have higher expenses than Class 1 Shares and the Predecessor Portfolio.
The graph illustrates comparative performance for $10,000 invested in Class 1 Shares of the JPMorgan Insurance Trust Small Cap Core Portfolio, the Russell 2000 Index and the Lipper Variable Underlying Funds Small-Cap Core Funds Index from June 30, 2003 to June 30, 2013. The performance of the Portfolio
assumes reinvestment of all dividends and capital gain distributions, if any. The performance of the Russell 2000 Index does not reflect the deduction of expenses associated with a mutual fund and has been adjusted to reflect reinvestment of all dividends and capital gain distributions of the securities included in the benchmark, if applicable. The performance of the Lipper Variable Underlying Funds Small-Cap Core Funds Index includes expenses associated with a mutual fund, such as investment management fees. These expenses are not identical to the expenses incurred by the Portfolio. The Russell 2000 Index is an unmanaged index which measures the performance of the 2000 smallest stocks (on the basis of capitalization) in the Russell 3000 Index. The Lipper Variable Underlying Funds Small-Cap Core Funds Index is an index based on the total returns of certain mutual funds within the Portfolio’s designated category as determined by Lipper, Inc. Investors cannot invest directly in an index.
The performance does not reflect any charges imposed by the Policies or Eligible Plans. If these charges were included, the returns would be lower than shown. Portfolio performance may reflect the waiver of the Portfolio’s fees and reimbursement of expenses for certain periods since the inception date. Without these waivers and reimbursements, performance would have been lower.
The returns shown are based on net asset values calculated for shareholder transactions and may differ from the returns shown in the financial highlights, which reflect adjustments made to the net asset values in accordance with accounting principles generally accepted in the United States of America.
| | | | | | |
| | | |
| 4 | | | | JPMORGAN INSURANCE TRUST | | JUNE 30, 2013 |
JPMorgan Insurance Trust Small Cap Core Portfolio
SCHEDULE OF PORTFOLIO INVESTMENTS
AS OF JUNE 30, 2013 (Unaudited)
| | | | | | | | |
| SHARES | | | SECURITY DESCRIPTION | | VALUE($) | |
| | | | | | | | |
| Common Stocks — 98.0% | |
| | | | Consumer Discretionary — 13.8% | |
| | | | Auto Components — 1.5% | |
| | 23,600 | | | Cooper Tire & Rubber Co. | | | 782,812 | |
| | 12,900 | | | Standard Motor Products, Inc. | | | 442,986 | |
| | 6,166 | | | Stoneridge, Inc. (a) | | | 71,772 | |
| | | | | | | | |
| | | | | | | 1,297,570 | |
| | | | | | | | |
| | | | Distributors — 0.4% | |
| | 3,200 | | | Core-Mark Holding Co., Inc. | | | 203,200 | |
| | 8,009 | | | VOXX International Corp. (a) | | | 98,270 | |
| | | | | | | | |
| | | | | | | 301,470 | |
| | | | | | | | |
| | | | Diversified Consumer Services — 0.2% | |
| | 2,190 | | | Bridgepoint Education, Inc. (a) | | | 26,674 | |
| | 1,500 | | | Capella Education Co. (a) | | | 62,475 | |
| | 1,403 | | | Carriage Services, Inc. | | | 23,781 | |
| | 800 | | | Coinstar, Inc. (a) | | | 46,936 | |
| | 15,100 | | | Corinthian Colleges, Inc. (a) | | | 33,824 | |
| | | | | | | | |
| | | | | | | 193,690 | |
| | | | | | | | |
| | | | Hotels, Restaurants & Leisure — 2.2% | |
| | 11,100 | | | Ameristar Casinos, Inc. | | | 291,819 | |
| | 1,700 | | | Cracker Barrel Old Country Store, Inc. | | | 160,922 | |
| | 6,500 | | | Domino’s Pizza, Inc. | | | 377,975 | |
| | 4,005 | | | Jack in the Box, Inc. (a) | | | 157,356 | |
| | 29,068 | | | Ruth’s Hospitality Group, Inc. | | | 350,851 | |
| | 7,400 | | | SeaWorld Entertainment, Inc. | | | 259,740 | |
| | 18,800 | | | Sonic Corp. (a) | | | 273,728 | |
| | | | | | | | |
| | | | | | | 1,872,391 | |
| | | | | | | | |
| | | | Household Durables — 2.1% | |
| | 42 | | | CSS Industries, Inc. | | | 1,047 | |
| | 15,400 | | | Helen of Troy Ltd., (Bermuda) (a) | | | 590,898 | |
| | 3,189 | | | Jarden Corp. (a) | | | 139,519 | |
| | 11,100 | | | KB Home | | | 217,893 | |
| | 2,300 | | | Libbey, Inc. (a) | | | 55,131 | |
| | 8,000 | | | Lifetime Brands, Inc. | | | 108,640 | |
| | 2,300 | | | MDC Holdings, Inc. | | | 74,773 | |
| | 1,600 | | | NACCO Industries, Inc., Class A | | | 91,648 | |
| | 14,000 | | | Taylor Morrison Home Corp., Class A (a) | | | 341,320 | |
| | 4,500 | | | William Lyon Homes, Class A (a) | | | 113,445 | |
| | | | | | | | |
| | | | | | | 1,734,314 | |
| | | | | | | | |
| | | | Leisure Equipment & Products — 0.3% | |
| | 300 | | | Arctic Cat, Inc. | | | 13,494 | |
| | 1,700 | | | Johnson Outdoors, Inc., Class A (a) | | | 42,330 | |
| | 13,600 | | | LeapFrog Enterprises, Inc. (a) | | | 133,824 | |
| | 900 | | | Sturm Ruger & Co., Inc. | | | 43,236 | |
| | | | | | | | |
| | | | | | | 232,884 | |
| | | | | | | | |
| | | | | | | | |
| SHARES | | | SECURITY DESCRIPTION | | VALUE($) | |
| | | | | | | | |
| | | | | | | | |
| | | | Media — 0.9% | |
| | 4,000 | | | Carmike Cinemas, Inc. (a) | | | 77,440 | |
| | 13,200 | | | Entercom Communications Corp., Class A (a) | | | 124,608 | |
| | 12,100 | | | Gray Television, Inc. (a) | | | 87,120 | |
| | 14,000 | | | Journal Communications, Inc., Class A (a) | | | 104,860 | |
| | 21,300 | | | LIN TV Corp., Class A (a) | | | 325,890 | |
| | 2,600 | | | Sinclair Broadcast Group, Inc., Class A | | | 76,388 | |
| | | | | | | | |
| | | | | | | 796,306 | |
| | | | | | | | |
| | | | Multiline Retail — 0.9% | |
| | 7,000 | | | Dillard’s, Inc., Class A | | | 573,790 | |
| | 16,100 | | | Tuesday Morning Corp. (a) | | | 166,957 | |
| | | | | | | | |
| | | | | | | 740,747 | |
| | | | | | | | |
| | | | Specialty Retail — 3.6% | |
| | 17,300 | | | Brown Shoe Co., Inc. | | | 372,469 | |
| | 9,300 | | | Cabela’s, Inc. (a) | | | 602,268 | |
| | 16,000 | | | Conn’s, Inc. (a) | | | 828,160 | |
| | 4,900 | | | Destination Maternity Corp. | | | 120,540 | |
| | 19,810 | | | Express, Inc. (a) | | | 415,416 | |
| | 2,025 | | | Finish Line, Inc. (The), Class A | | | 44,267 | |
| | 40,400 | | | OfficeMax, Inc. | | | 413,292 | |
| | 5,326 | | | Rent-A-Center, Inc. | | | 199,991 | |
| | 1,900 | | | Tilly’s, Inc., Class A (a) | | | 30,400 | |
| | 200 | | | Trans World Entertainment Corp. | | | 972 | |
| | | | | | | | |
| | | | | | | 3,027,775 | |
| | | | | | | | |
| | | | Textiles, Apparel & Luxury Goods — 1.7% | |
| | 12,500 | | | G-III Apparel Group Ltd. (a) | | | 601,500 | |
| | 20,200 | | | Iconix Brand Group, Inc. (a) | | | 594,082 | |
| | 9,000 | | | Perry Ellis International, Inc. | | | 182,790 | |
| | 2,300 | | | RG Barry Corp. | | | 37,352 | |
| | | | | | | | |
| | | | | | | 1,415,724 | |
| | | | | | | | |
| | | | Total Consumer Discretionary | | | 11,612,871 | |
| | | | | | | | |
| | | | Consumer Staples — 4.6% | |
| | | | Beverages — 0.1% | |
| | 1,100 | | | Coca-Cola Bottling Co. Consolidated | | | 67,265 | |
| | | | | | | | |
| | | | Food & Staples Retailing — 2.3% | |
| | 1,500 | | | Andersons, Inc. (The) | | | 79,785 | |
| | 2,300 | | | Fairway Group Holdings Corp. (a) | | | 55,591 | |
| | 3,400 | | | Nash Finch Co. | | | 74,834 | |
| | 309,900 | | | Rite Aid Corp. (a) | | | 886,314 | |
| | 6,508 | | | Roundy’s, Inc. | | | 54,212 | |
| | 27,800 | | | Spartan Stores, Inc. | | | 512,632 | |
| | 27,500 | | | SUPERVALU, Inc. (a) | | | 171,050 | |
| | 1,700 | | | Village Super Market, Inc., Class A | | | 56,253 | |
| | | | | | | | |
| | | | | | | 1,890,671 | |
| | | | | | | | |
SEE NOTES TO FINANCIAL STATEMENTS.
| | | | | | | | |
| | | |
| JUNE 30, 2013 | | JPMORGAN INSURANCE TRUST | | | | | 5 | |
JPMorgan Insurance Trust Small Cap Core Portfolio
SCHEDULE OF PORTFOLIO INVESTMENTS
AS OF JUNE 30, 2013 (Unaudited) (continued)
| | | | | | | | |
| SHARES | | | SECURITY DESCRIPTION | | VALUE($) | |
| | | | | | | | |
| Common Stocks — Continued | |
| | | | Food Products — 1.5% | |
| | 6,600 | | | B&G Foods, Inc. | | | 224,730 | |
| | 5,600 | | | Darling International, Inc. (a) | | | 104,496 | |
| | 3,000 | | | Fresh Del Monte Produce, Inc. | | | 83,640 | |
| | 2,600 | | | John B Sanfilippo & Son, Inc. | | | 52,416 | |
| | 29,900 | | | Pilgrim’s Pride Corp. (a) | | | 446,706 | |
| | 8,500 | | | Pinnacle Foods, Inc. | | | 205,275 | |
| | 2,700 | | | Sanderson Farms, Inc. | | | 179,334 | |
| | | | | | | | |
| | | | | | | 1,296,597 | |
| | | | | | | | |
| | | | Personal Products — 0.7% | |
| | 9,425 | | | Prestige Brands Holdings, Inc. (a) | | | 274,644 | |
| | 4,500 | | | Revlon, Inc., Class A (a) | | | 99,270 | |
| | 3,500 | | | USANA Health Sciences, Inc. (a) | | | 253,330 | |
| | | | | | | | |
| | | | | | | 627,244 | |
| | | | | | | | |
| | | | Total Consumer Staples | | | 3,881,777 | |
| | | | | | | | |
| | | | Energy — 4.9% | |
| | | | Energy Equipment & Services — 1.7% | |
| | 9,200 | | | C&J Energy Services, Inc. (a) | | | 178,204 | |
| | 8,000 | | | Dawson Geophysical Co. (a) | | | 294,880 | |
| | 10,100 | | | Forum Energy Technologies, Inc. (a) | | | 307,343 | |
| | 3,100 | | | Gulfmark Offshore, Inc., Class A | | | 139,779 | |
| | 10,200 | | | Helix Energy Solutions Group, Inc. (a) | | | 235,008 | |
| | 10,712 | | | Superior Energy Services, Inc. (a) | | | 277,869 | |
| | | | | | | | |
| | | | | | | 1,433,083 | |
| | | | | | | | |
| | | | Oil, Gas & Consumable Fuels — 3.2% | |
| | 1,900 | | | Alon USA Energy, Inc. | | | 27,474 | |
| | 2,200 | | | Bonanza Creek Energy, Inc. (a) | | | 78,012 | |
| | 3,100 | | | Ceres, Inc. (a) | | | 9,703 | |
| | 11,200 | | | Delek U.S. Holdings, Inc. | | | 322,336 | |
| | 5,600 | | | Energy XXI Bermuda Ltd., (Bermuda) | | | 124,208 | |
| | 23,300 | | | EPL Oil & Gas, Inc. (a) | | | 684,088 | |
| | 10,200 | | | EXCO Resources, Inc. | | | 77,928 | |
| | 14,229 | | | Gastar Exploration Ltd. (a) | | | 37,992 | |
| | 30,800 | | | Renewable Energy Group, Inc. (a) | | | 438,284 | |
| | 2,000 | | | REX American Resources Corp. (a) | | | 57,540 | |
| | 3,807 | | | Vaalco Energy, Inc. (a) | | | 21,776 | |
| | 16,100 | | | W&T Offshore, Inc. | | | 230,069 | |
| | 50,331 | | | Warren Resources, Inc. (a) | | | 128,344 | |
| | 11,200 | | | Western Refining, Inc. | | | 314,384 | |
| | 700 | | | Westmoreland Coal Co. (a) | | | 7,861 | |
| | 2,400 | | | World Fuel Services Corp. | | | 95,952 | |
| | | | | | | | |
| | | | | | | 2,655,951 | |
| | | | | | | | |
| | | | Total Energy | | | 4,089,034 | |
| | | | | | | | |
| | | | | | | | |
| SHARES | | | SECURITY DESCRIPTION | | VALUE($) | |
| | | | | | | | |
| | | | | | | | |
| | | | Financials — 22.7% | |
| | | | Capital Markets — 0.7% | |
| | 1,200 | | | Artisan Partners Asset Management, Inc. (a) | | | 59,892 | |
| | 14,200 | | | BGC Partners, Inc., Class A | | | 83,638 | |
| | 18,500 | | | Cowen Group, Inc., Class A (a) | | | 53,650 | |
| | 5,089 | | | Gladstone Capital Corp. | | | 41,577 | |
| | 15,000 | | | KCAP Financial, Inc. | | | 168,900 | |
| | 5,200 | | | Manning & Napier, Inc. | | | 92,352 | |
| | 3,300 | | | Piper Jaffray Cos. (a) | | | 104,313 | |
| | 1,243 | | | Prospect Capital Corp. | | | 13,424 | |
| | 1,119 | | | SWS Group, Inc. (a) | | | 6,099 | |
| | | | | | | | |
| | | | | | | 623,845 | |
| | | | | | | | |
| | | | Commercial Banks — 7.4% | |
| | 2,900 | | | Banco Latinoamericano de Comercio Exterior S.A., (Panama), Class E | | | 64,931 | |
| | 11,100 | | | BBCN Bancorp, Inc. | | | 157,842 | |
| | 2,140 | | | BNC Bancorp | | | 24,439 | |
| | 1,100 | | | Bridge Bancorp, Inc. | | | 24,750 | |
| | 16,400 | | | Cardinal Financial Corp. | | | 240,096 | |
| | 6,500 | | | Cathay General Bancorp | | | 132,275 | |
| | 1,200 | | | Center Bancorp, Inc. | | | 15,228 | |
| | 3,700 | | | Citizens & Northern Corp. | | | 71,484 | |
| | 625 | | | City Holding Co. | | | 24,344 | |
| | 1,240 | | | Community Trust Bancorp, Inc. | | | 44,169 | |
| | 32,900 | | | East West Bancorp, Inc. | | | 904,750 | |
| | 2,706 | | | Fidelity Southern Corp. (a) | | | 33,473 | |
| | 4,000 | | | Financial Institutions, Inc. | | | 73,640 | |
| | 24,101 | | | First Commonwealth Financial Corp. | | | 177,624 | |
| | 4,800 | | | First Community Bancshares, Inc. | | | 75,264 | |
| | 4,700 | | | First Financial Bancorp | | | 70,030 | |
| | 600 | | | First M&F Corp. | | | 9,486 | |
| | 3,700 | | | First Merchants Corp. | | | 63,455 | |
| | 8,057 | | | FirstMerit Corp. | | | 161,381 | |
| | 12,200 | | | FNB Corp. | | | 147,376 | |
| | 28,425 | | | Hanmi Financial Corp. (a) | | | 502,270 | |
| | 3,800 | | | Heartland Financial USA, Inc. | | | 104,462 | |
| | 3,800 | | | Huntington Bancshares, Inc. | | | 29,944 | |
| | 875 | | | Iberiabank Corp. | | | 46,909 | |
| | 1,700 | | | Lakeland Financial Corp. | | | 47,175 | |
| | 3,400 | | | MainSource Financial Group, Inc. | | | 45,662 | |
| | 3,100 | | | MetroCorp Bancshares, Inc. | | | 30,256 | |
| | 700 | | | National Bankshares, Inc. | | | 24,871 | |
| | 2,471 | | | NBT Bancorp, Inc. | | | 52,311 | |
| | 13,800 | | | OFG Bancorp, (Puerto Rico) | | | 249,918 | |
| | 1,215 | | | PacWest Bancorp | | | 37,240 | |
| | 8,000 | | | Park Sterling Corp. (a) | | | 47,280 | |
SEE NOTES TO FINANCIAL STATEMENTS.
| | | | | | |
| | | |
| 6 | | | | JPMORGAN INSURANCE TRUST | | JUNE 30, 2013 |
| | | | | | | | |
| SHARES | | | SECURITY DESCRIPTION | | VALUE($) | |
| | | | | | | | |
| Common Stocks — Continued | |
| | | | Commercial Banks — Continued | |
| | 1,790 | | | Peoples Bancorp, Inc. | | | 37,733 | |
| | 8,100 | | | Pinnacle Financial Partners, Inc. (a) | | | 208,251 | |
| | 27,600 | | | Popular, Inc. (a) | | | 837,108 | |
| | 2,400 | | | Preferred Bank (a) | | | 39,552 | |
| | 4,100 | | | PrivateBancorp, Inc. | | | 86,961 | |
| | 1,200 | | | Prosperity Bancshares, Inc. | | | 62,148 | |
| | 200 | | | Renasant Corp. | | | 4,868 | |
| | 4,650 | | | Sierra Bancorp | | | 68,820 | |
| | 12,935 | | | Southwest Bancorp, Inc. (a) | | | 170,742 | |
| | 11,300 | | | Susquehanna Bancshares, Inc. | | | 145,205 | |
| | 1,300 | | | SVB Financial Group (a) | | | 108,316 | |
| | 3,000 | | | Texas Capital Bancshares, Inc. (a) | | | 133,080 | |
| | 6,000 | | | Tristate Capital Holdings, Inc. (a) | | | 82,500 | |
| | 2,200 | | | WesBanco, Inc. | | | 58,146 | |
| | 3,600 | | | West Bancorporation, Inc. | | | 42,300 | |
| | 55,800 | | | Wilshire Bancorp, Inc. | | | 369,396 | |
| | | | | | | | |
| | | | | | | 6,189,461 | |
| | | | | | | | |
| | | | Consumer Finance — 2.9% | |
| | 3,100 | | | Cash America International, Inc. | | | 140,926 | |
| | 15,546 | | | DFC Global Corp. (a) | | | 214,690 | |
| | 15,300 | | | Encore Capital Group, Inc. (a) | | | 506,583 | |
| | 3,900 | | | Ezcorp, Inc., Class A (a) | | | 65,832 | |
| | 13,700 | | | Green Dot Corp., Class A (a) | | | 273,315 | |
| | 6,200 | | | Nelnet, Inc., Class A | | | 223,758 | |
| | 2,100 | | | Portfolio Recovery Associates, Inc. (a) | | | 322,623 | |
| | 7,825 | | | World Acceptance Corp. (a) | | | 680,306 | |
| | | | | | | | |
| | | | | | | 2,428,033 | |
| | | | | | | | |
| | | | Insurance — 2.5% | |
| | 35,100 | | | American Equity Investment Life Holding Co. | | | 551,070 | |
| | 3,700 | | | American Safety Insurance Holdings Ltd., (Bermuda) (a) | | | 107,115 | |
| | 6,125 | | | Aspen Insurance Holdings Ltd., (Bermuda) | | | 227,176 | |
| | 41,700 | | | CNO Financial Group, Inc. | | | 540,432 | |
| | 2,200 | | | Crawford & Co., Class B | | | 12,364 | |
| | 1,400 | | | Horace Mann Educators Corp. | | | 34,132 | |
| | 9,275 | | | Meadowbrook Insurance Group, Inc. | | | 74,478 | |
| | 1,100 | | | Montpelier Re Holdings Ltd., (Bermuda) | | | 27,511 | |
| | 14,900 | | | National Financial Partners Corp. (a) | | | 377,119 | |
| | 3,000 | | | Selective Insurance Group, Inc. | | | 69,060 | |
| | 1,200 | | | Stewart Information Services Corp. | | | 31,428 | |
| | 1,006 | | | Validus Holdings Ltd., (Bermuda) | | | 36,337 | |
| | | | | | | | |
| | | | | | | 2,088,222 | |
| | | | | | | | |
| | | | | | | | |
| SHARES | | | SECURITY DESCRIPTION | | VALUE($) | |
| | | | | | | | |
| | | | | | | | |
| | | | Real Estate Investment Trusts (REITs) — 7.9% | |
| | 800 | | | Agree Realty Corp. (m) | | | 23,616 | |
| | 3,683 | | | American Campus Communities, Inc. | | | 149,751 | |
| | 78,900 | | | Anworth Mortgage Asset Corp. | | | 441,840 | |
| | 16,900 | | | Ashford Hospitality Trust, Inc. | | | 193,505 | |
| | 12,400 | | | CapLease, Inc. | | | 104,656 | |
| | 57,800 | | | Capstead Mortgage Corp. | | | 699,380 | |
| | 12,100 | | | CBL & Associates Properties, Inc. | | | 259,182 | |
| | 7,500 | | | Chatham Lodging Trust | | | 128,850 | |
| | 6,400 | | | Chesapeake Lodging Trust | | | 133,056 | |
| | 2,764 | | | Colonial Properties Trust | | | 66,668 | |
| | 9,700 | | | Coresite Realty Corp. | | | 308,557 | |
| | 24,275 | | | DCT Industrial Trust, Inc. | | | 173,566 | |
| | 7,900 | | | DDR Corp. | | | 131,535 | |
| | 2,600 | | | EastGroup Properties, Inc. | | | 146,302 | |
| | 19,600 | | | Education Realty Trust, Inc. | | | 200,508 | |
| | 35,400 | | | First Industrial Realty Trust, Inc. | | | 537,018 | |
| | 13,200 | | | GEO Group, Inc. (The) | | | 448,140 | |
| | 7,200 | | | Glimcher Realty Trust | | | 78,624 | |
| | 1,250 | | | Home Properties, Inc. | | | 81,712 | |
| | 5,200 | | | LaSalle Hotel Properties | | | 128,440 | |
| | 42,209 | | | Lexington Realty Trust | | | 493,001 | |
| | 3,300 | | | LTC Properties, Inc. | | | 128,865 | |
| | 1,200 | | | Mission West Properties, Inc. (a) (i) | | | – | |
| | 2,600 | | | Parkway Properties, Inc. | | | 43,576 | |
| | 11,211 | | | Pennsylvania Real Estate Investment Trust | | | 211,664 | |
| | 17,800 | | | Potlatch Corp. | | | 719,832 | |
| | 1,975 | | | PS Business Parks, Inc. | | | 142,536 | |
| | 13,500 | | | RAIT Financial Trust | | | 101,520 | |
| | 2,400 | | | Ramco-Gershenson Properties Trust | | | 37,272 | |
| | 16,800 | | | Redwood Trust, Inc. | | | 285,600 | |
| | 1,200 | | | Sun Communities, Inc. | | | 59,712 | |
| | | | | | | | |
| | | | | | | 6,658,484 | |
| | | | | | | | |
| | | | Thrifts & Mortgage Finance — 1.3% | |
| | 1,900 | | | BofI Holding, Inc. (a) | | | 87,058 | |
| | 1,728 | | | Heritage Financial Group, Inc. | | | 25,488 | |
| | 5,000 | | | HomeStreet, Inc. | | | 107,250 | |
| | 2,400 | | | OceanFirst Financial Corp. | | | 37,320 | |
| | 18,575 | | | Ocwen Financial Corp. (a) | | | 765,661 | |
| | 2,000 | | | PennyMac Financial Services, Inc., Class A (a) | | | 42,540 | |
| | | | | | | | |
| | | | | | | 1,065,317 | |
| | | | | | | | |
| | | | Total Financials | | | 19,053,362 | |
| | | | | | | | |
| | | | Health Care — 10.8% | |
| | | | Biotechnology — 2.6% | |
| | 1,500 | | | Acorda Therapeutics, Inc. (a) (m) | | | 49,485 | |
| | 6,000 | | | Aegerion Pharmaceuticals, Inc. (a) (m) | | | 380,040 | |
SEE NOTES TO FINANCIAL STATEMENTS.
| | | | | | | | |
| | | |
| JUNE 30, 2013 | | JPMORGAN INSURANCE TRUST | | | | | 7 | |
JPMorgan Insurance Trust Small Cap Core Portfolio
SCHEDULE OF PORTFOLIO INVESTMENTS
AS OF JUNE 30, 2013 (Unaudited) (continued)
| | | | | | | | |
| SHARES | | | SECURITY DESCRIPTION | | VALUE($) | |
| | | | | | | | |
| Common Stocks — Continued | |
| | | | Biotechnology — Continued | |
| | 2,700 | | | Alnylam Pharmaceuticals, Inc. (a) | | | 83,727 | |
| | 11,200 | | | AMAG Pharmaceuticals, Inc. (a) (m) | | | 249,200 | |
| | 16,900 | | | Ambit Biosciences Corp. (a) | | | 118,300 | |
| | 1,800 | | | Bluebird Bio, Inc. (a) | | | 44,946 | |
| | 5,800 | | | Celldex Therapeutics, Inc. (a) | | | 90,538 | |
| | 1,600 | | | Cytokinetics, Inc. (a) | | | 18,512 | |
| | 856 | | | Durata Therapeutics, Inc. (a) | | | 6,163 | |
| �� | 4,600 | | | Esperion Therapeutics, Inc. (a) | | | 64,860 | |
| | 11,900 | | | Infinity Pharmaceuticals, Inc. (a) | | | 193,375 | |
| | 300 | | | MiMedx Group, Inc. (a) | | | 2,118 | |
| | 7,000 | | | Pharmacyclics, Inc. (a) | | | 556,290 | |
| | 2,900 | | | PTC Therapeutics, Inc. (a) | | | 43,500 | |
| | 1,700 | | | Raptor Pharmaceutical Corp. (a) | | | 15,895 | |
| | 51,700 | | | Threshold Pharmaceuticals, Inc. (a) | | | 271,942 | |
| | | | | | | | |
| | | | | | | 2,188,891 | |
| | | | | | | | |
| | | | Health Care Equipment & Supplies — 2.6% | |
| | 16,600 | | | Greatbatch, Inc. (a) | | | 544,314 | |
| | 5,400 | | | MAKO Surgical Corp. (a) | | | 65,070 | |
| | 3,240 | | | Medical Action Industries, Inc. (a) | | | 24,948 | |
| | 35,405 | | | NuVasive, Inc. (a) | | | 877,690 | |
| | 2,200 | | | Orthofix International N.V., (Netherlands) (a) | | | 59,180 | |
| | 3,800 | | | PhotoMedex, Inc. (a) | | | 60,572 | |
| | 35,700 | | | RTI Biologics, Inc. (a) | | | 134,232 | |
| | 3,200 | | | Sirona Dental Systems, Inc. (a) | | | 210,816 | |
| | 5,000 | | | STERIS Corp. | | | 214,400 | |
| | | | | | | | |
| | | | | | | 2,191,222 | |
| | | | | | | | |
| | | | Health Care Providers & Services — 2.7% | |
| | 20,713 | | | Amsurg Corp. (a) | | | 727,026 | |
| | 9,900 | | | Centene Corp. (a) | | | 519,354 | |
| | 18,700 | | | Gentiva Health Services, Inc. (a) | | | 186,252 | |
| | 13,000 | | | Molina Healthcare, Inc. (a) | | | 483,340 | |
| | 8,300 | | | Owens & Minor, Inc. | | | 280,789 | |
| | 5,600 | | | Select Medical Holdings Corp. | | | 45,920 | |
| | 1,200 | | | Triple-S Management Corp., Class B (a) | | | 25,764 | |
| | | | | | | | |
| | | | | | | 2,268,445 | |
| | | | | | | | |
| | | | Health Care Technology — 0.2% | |
| | 6,800 | | | MedAssets, Inc. (a) | | | 120,632 | |
| | | | | | | | |
| | | | Life Sciences Tools & Services — 0.7% | |
| | 14,253 | | | Cambrex Corp. (a) | | | 199,115 | |
| | 7,500 | | | Furiex Pharmaceuticals, Inc. (a) | | | 255,525 | |
| | 12,100 | | | NanoString Technologies, Inc. (a) | | | 96,800 | |
| | | | | | | | |
| | | | | | | 551,440 | |
| | | | | | | | |
| | | | | | | | |
| SHARES | | | SECURITY DESCRIPTION | | VALUE($) | |
| | | | | | | | |
| | | | | | | | |
| | | | Pharmaceuticals — 2.0% | |
| | 2,200 | | | Cornerstone Therapeutics, Inc. (a) | | | 17,600 | |
| | 9,700 | | | Impax Laboratories, Inc. (a) | | | 193,515 | |
| | 5,600 | | | Jazz Pharmaceuticals plc, (Ireland) (a) | | | 384,888 | |
| | 13,099 | | | Lannett Co., Inc. (a) | | | 156,009 | |
| | 26,500 | | | Medicines Co. (The) (a) | | | 815,140 | |
| | 16,800 | | | Sciclone Pharmaceuticals, Inc. (a) | | | 83,328 | |
| | 2,400 | | | ViroPharma, Inc. (a) | | | 68,760 | |
| | | | | | | | |
| | | | | | | 1,719,240 | |
| | | | | | | | |
| | | | Total Health Care | | | 9,039,870 | |
| | | | | | | | |
| | | | Industrials — 15.7% | |
| | | | Aerospace & Defense — 1.9% | |
| | 9,400 | | | AAR Corp. (m) | | | 206,612 | |
| | 1,100 | | | Curtiss-Wright Corp. | | | 40,766 | |
| | 5,900 | | | Engility Holdings, Inc. (a) | | | 167,678 | |
| | 4,600 | | | Esterline Technologies Corp. (a) | | | 332,534 | |
| | 4,581 | | | LMI Aerospace, Inc. (a) | | | 85,848 | |
| | 9,800 | | | Sypris Solutions, Inc. | | | 31,458 | |
| | 9,100 | | | Triumph Group, Inc. | | | 720,265 | |
| | | | | | | | |
| | | | | | | 1,585,161 | |
| | | | | | | | |
| | | | Air Freight & Logistics — 0.3% | |
| | 3,300 | | | Atlas Air Worldwide Holdings, Inc. (a) | | | 144,408 | |
| | 3,100 | | | Park-Ohio Holdings Corp. (a) | | | 102,238 | |
| | | | | | | | |
| | | | | | | 246,646 | |
| | | | | | | | |
| | | | Airlines — 1.3% | |
| | 9,400 | | | Alaska Air Group, Inc. (a) (m) | | | 488,800 | |
| | 38,910 | | | Republic Airways Holdings, Inc. (a) | | | 440,850 | |
| | 11,400 | | | SkyWest, Inc. | | | 154,356 | |
| | | | | | | | |
| | | | | | | 1,084,006 | |
| | | | | | | | |
| | | | Building Products — 0.1% | |
| | 975 | | | Gibraltar Industries, Inc. (a) | | | 14,196 | |
| | 2,800 | | | Ply Gem Holdings, Inc. (a) | | | 56,168 | |
| | | | | | | | |
| | | | | | | 70,364 | |
| | | | | | | | |
| | | | Commercial Services & Supplies — 3.2% | |
| | 6,200 | | | Ceco Environmental Corp. | | | 76,260 | |
| | 71,200 | | | Cenveo, Inc. (a) | | | 151,656 | |
| | 1,100 | | | Courier Corp. | | | 15,708 | |
| | 21,250 | | | Deluxe Corp. | | | 736,312 | |
| | 2,200 | | | Herman Miller, Inc. | | | 59,554 | |
| | 23,000 | | | Kimball International, Inc., Class B | | | 223,330 | |
| | 9,800 | | | Knoll, Inc. | | | 139,258 | |
| | 16,277 | | | Quad/Graphics, Inc. | | | 392,276 | |
| | 24,400 | | | Steelcase, Inc., Class A | | | 355,752 | |
SEE NOTES TO FINANCIAL STATEMENTS.
| | | | | | |
| | | |
| 8 | | | | JPMORGAN INSURANCE TRUST | | JUNE 30, 2013 |
| | | | | | | | |
| SHARES | | | SECURITY DESCRIPTION | | VALUE($) | |
| | | | | | | | |
| Common Stocks — Continued | |
| | | | Commercial Services & Supplies — Continued | |
| | 2,200 | | | TMS International Corp. | | | 32,626 | |
| | 1,000 | | | UniFirst Corp. | | | 91,250 | |
| | 3,300 | | | United Stationers, Inc. | | | 110,715 | |
| | 12,300 | | | Viad Corp. | | | 301,596 | |
| | | | | | | | |
| | | | | | | 2,686,293 | |
| | | | | | | | |
| | | | Construction & Engineering — 0.8% | |
| | 2,200 | | | Argan, Inc. | | | 34,320 | |
| | 9,175 | | | EMCOR Group, Inc. | | | 372,964 | |
| | 2,100 | | | Michael Baker Corp. | | | 56,931 | |
| | 12,918 | | | Tutor Perini Corp. (a) | | | 233,687 | |
| | | | | | | | |
| | | | | | | 697,902 | |
| | | | | | | | |
| | | | Electrical Equipment — 1.6% | |
| | 3,600 | | | Acuity Brands, Inc. (m) | | | 271,872 | |
| | 11,900 | | | Brady Corp., Class A | | | 365,687 | |
| | 6,000 | | | EnerSys, Inc. | | | 294,240 | |
| | 5,000 | | | Generac Holdings, Inc. | | | 185,050 | |
| | 3,800 | | | LSI Industries, Inc. | | | 30,742 | |
| | 2,700 | | | Regal-Beloit Corp. | | | 175,068 | |
| | | | | | | | |
| | | | | | | 1,322,659 | |
| | | | | | | | |
| | | | Machinery — 4.0% | |
| | 3,033 | | | Albany International Corp., Class A | | | 100,028 | |
| | 4,800 | | | Barnes Group, Inc. | | | 143,952 | |
| | 4,000 | | | Columbus McKinnon Corp. (a) | | | 85,280 | |
| | 11,400 | | | EnPro Industries, Inc. (a) | | | 578,664 | |
| | 12,900 | | | Federal Signal Corp. (a) | | | 112,875 | |
| | 6,000 | | | FreightCar America, Inc. | | | 101,940 | |
| | 5,500 | | | Global Brass & Copper Holdings, Inc. (a) | | | 72,820 | |
| | 3,700 | | | Hardinge, Inc. | | | 54,686 | |
| | 3,200 | | | Hyster-Yale Materials Handling, Inc. | | | 200,928 | |
| | 6,100 | | | Kadant, Inc. | | | 184,037 | |
| | 4,500 | | | LB Foster Co., Class A | | | 194,265 | |
| | 8,100 | | | NN, Inc. | | | 92,421 | |
| | 200 | | | Proto Labs, Inc. (a) | | | 12,994 | |
| | 800 | | | Standex International Corp. | | | 42,200 | |
| | 7,900 | | | Trimas Corp. (a) | | | 294,512 | |
| | 15,100 | | | Wabash National Corp. (a) | | | 153,718 | |
| | 14,700 | | | Wabtec Corp. | | | 785,421 | |
| | 1,000 | | | Watts Water Technologies, Inc., Class A | | | 45,340 | |
| | 7,000 | | | Xerium Technologies, Inc. (a) | | | 71,260 | |
| | | | | | | | |
| | | | | | | 3,327,341 | |
| | | | | | | | |
| | | | Professional Services — 1.1% | |
| | 7,100 | | | Barrett Business Services, Inc. | | | 370,691 | |
| | 1,600 | | | Kelly Services, Inc., Class A | | | 27,952 | |
| | | | | | | | |
| SHARES | | | SECURITY DESCRIPTION | | VALUE($) | |
| | | | | | | | |
| | | | | | | | |
| | | | Professional Services — Continued | |
| | 22,060 | | | RPX Corp. (a) | | | 370,608 | |
| | 5,400 | | | TrueBlue, Inc. (a) | | | 113,670 | |
| | 1,900 | | | VSE Corp. | | | 78,033 | |
| | | | | | | | |
| | | | | | | 960,954 | |
| | | | | | | | |
| | | | Road & Rail — 0.8% | |
| | 500 | | | AMERCO | | | 80,950 | |
| | 2,100 | | | Avis Budget Group, Inc. (a) | | | 60,375 | |
| | 3,375 | | | Celadon Group, Inc. | | | 61,594 | |
| | 18,100 | | | Quality Distribution, Inc. (a) | | | 160,004 | |
| | 3,150 | | | Saia, Inc. (a) | | | 94,405 | |
| | 12,700 | | | Swift Transportation Co. (a) | | | 210,058 | |
| | 2,100 | | | Universal Truckload Services, Inc. (a) | | | 50,631 | |
| | | | | | | | |
| | | | | | | 718,017 | |
| | | | | | | | |
| | | | Trading Companies & Distributors — 0.6% | |
| | 6,775 | | | Applied Industrial Technologies, Inc. | | | 327,436 | |
| | 1,400 | | | Beacon Roofing Supply, Inc. (a) | | | 53,032 | |
| | 2,999 | | | Edgen Group, Inc. (a) | | | 19,134 | |
| | 2,700 | | | United Rentals, Inc. (a) | | | 134,757 | |
| | | | | | | | |
| | | | | | | 534,359 | |
| | | | | | | | |
| | | | Total Industrials | | | 13,233,702 | |
| | | | | | | | |
| | | | Information Technology — 16.6% | |
| | | | Communications Equipment — 1.1% | |
| | 400 | | | Alliance Fiber Optic Products, Inc. | | | 8,004 | |
| | 19,782 | | | ARRIS Group, Inc. (a) | | | 283,872 | |
| | 11,900 | | | Aviat Networks, Inc. (a) | | | 31,178 | |
| | 2,000 | | | CalAmp Corp. (a) | | | 29,200 | |
| | 3,300 | | | Comtech Telecommunications Corp. | | | 88,737 | |
| | 54,633 | | | Harmonic, Inc. (a) | | | 346,919 | |
| | 1,800 | | | Oplink Communications, Inc. (a) | | | 31,266 | |
| | 3,900 | | | PC-Tel, Inc. | | | 33,072 | |
| | 2,400 | | | Plantronics, Inc. | | | 105,408 | |
| | | | | | | | |
| | | | | | | 957,656 | |
| | | | | | | | |
| | | | Computers & Peripherals — 0.5% | |
| | 10,300 | | | Avid Technology, Inc. (a) | | | 60,564 | |
| | 8,200 | | | Datalink Corp. (a) | | | 87,248 | |
| | 100 | | | Hutchinson Technology, Inc. (a) | | | 473 | |
| | 14,000 | | | Silicon Graphics International Corp. (a) | | | 187,320 | |
| | 2,500 | | | Synaptics, Inc. (a) | | | 96,400 | |
| | | | | | | | |
| | | | | | | 432,005 | |
| | | | | | | | |
| | | | Electronic Equipment, Instruments & Components — 3.1% | |
| | 25,100 | | | Audience, Inc. (a) | | | 331,571 | |
| | 14,900 | | | Benchmark Electronics, Inc. (a) | | | 299,490 | |
SEE NOTES TO FINANCIAL STATEMENTS.
| | | | | | | | |
| | | |
| JUNE 30, 2013 | | JPMORGAN INSURANCE TRUST | | | | | 9 | |
JPMorgan Insurance Trust Small Cap Core Portfolio
SCHEDULE OF PORTFOLIO INVESTMENTS
AS OF JUNE 30, 2013 (Unaudited) (continued)
| | | | | | | | |
| SHARES | | | SECURITY DESCRIPTION | | VALUE($) | |
| | | | | | | | |
| Common Stocks — Continued | |
| | | | Electronic Equipment, Instruments & Components — Continued | |
| | 11,700 | | | Insight Enterprises, Inc. (a) | | | 207,558 | |
| | 2,100 | | | Littelfuse, Inc. | | | 156,681 | |
| | 7,463 | | | Newport Corp. (a) | | | 103,959 | |
| | 73,216 | | | Sanmina Corp. (a) | | | 1,050,650 | |
| | 8,900 | | | SYNNEX Corp. (a) | | | 376,292 | |
| | 5,300 | | | TTM Technologies, Inc. (a) | | | 44,520 | |
| | | | | | | | |
| | | | | | | 2,570,721 | |
| | | | | | | | |
| | | | Internet Software & Services — 2.9% | |
| | 23,100 | | | Digital River, Inc. (a) | | | 433,587 | |
| | 5,300 | | | Gogo, Inc. (a) | | | 74,041 | |
| | 1,400 | | | Marketo, Inc. (a) | | | 34,818 | |
| | 1,727 | | | RealNetworks, Inc. (a) | | | 13,056 | |
| | 2,400 | | | Textura Corp. (a) | | | 62,424 | |
| | 31,500 | | | Tremor Video, Inc. (a) | | | 283,500 | |
| | 86,759 | | | United Online, Inc. | | | 657,633 | |
| | 28,700 | | | WebMD Health Corp. (a) | | | 842,919 | |
| | 900 | | | Xoom Corp. (a) | | | 20,628 | |
| | | | | | | | |
| | | | | | | 2,422,606 | |
| | | | | | | | |
| | | | IT Services — 2.2% | |
| | 1,900 | | | Blackhawk Network Holdings, Inc. (a) | | | 44,080 | |
| | 1,948 | | | CACI International, Inc., Class A (a) | | | 123,679 | |
| | 21,325 | | | CSG Systems International, Inc. (a) | | | 462,752 | |
| | 1,900 | | | EVERTEC, Inc. (a) | | | 41,743 | |
| | 375 | | | Gartner, Inc. (a) | | | 21,371 | |
| | 5,700 | | | Global Cash Access Holdings, Inc. (a) | | | 35,682 | |
| | 7,800 | | | Hackett Group, Inc. (The) | | | 40,482 | |
| | 11,255 | | | Lionbridge Technologies, Inc. (a) | | | 32,640 | |
| | 1,100 | | | ManTech International Corp., Class A | | | 28,732 | |
| | 2,900 | | | TeleTech Holdings, Inc. (a) | | | 67,947 | |
| | 39,600 | | | Unisys Corp. (a) | | | 873,972 | |
| | 5,802 | | | VeriFone Systems, Inc. (a) | | | 97,532 | |
| | | | | | | | |
| | | | | | | 1,870,612 | |
| | | | | | | | |
| | | | Semiconductors & Semiconductor Equipment — 3.0% | |
| | 2,750 | | | Alpha & Omega Semiconductor Ltd. (a) | | | 21,010 | |
| | 20,275 | | | Amkor Technology, Inc. (a) | | | 85,358 | |
| | 5,600 | | | Brooks Automation, Inc. | | | 54,488 | |
| | 725 | | | Cirrus Logic, Inc. (a) | | | 12,586 | |
| | 17,406 | | | Entegris, Inc. (a) | | | 163,443 | |
| | 15,500 | | | First Solar, Inc. (a) | | | 693,315 | |
| | 12,400 | | | Integrated Silicon Solution, Inc. (a) | | | 135,904 | |
| | 700 | | | Intermolecular, Inc. (a) | | | 5,089 | |
| | 10,000 | | | Lattice Semiconductor Corp. (a) | | | 50,700 | |
| | | | | | | | |
| SHARES | | | SECURITY DESCRIPTION | | VALUE($) | |
| | | | | | | | |
| | | | | | | | |
| | | | Semiconductors & Semiconductor Equipment — Continued | |
| | 1,500 | | | M/A-COM Technology Solutions Holdings, Inc. (a) | | | 21,900 | |
| | 10,300 | | | Nanometrics, Inc. (a) | | | 151,101 | |
| | 9,100 | | | Pericom Semiconductor Corp. (a) | | | 64,792 | |
| | 5,522 | | | Photronics, Inc. (a) | | | 44,507 | |
| | 22,900 | | | PMC-Sierra, Inc. (a) | | | 145,415 | |
| | 16,200 | | | Skyworks Solutions, Inc. (a) | | | 354,618 | |
| | 35,800 | | | Spansion, Inc., Class A (a) | | | 448,216 | |
| | 18,483 | | | Ultra Clean Holdings (a) | | | 111,822 | |
| | | | | | | | |
| | | | | | | 2,564,264 | |
| | | | | | | | |
| | | | Software — 3.8% | |
| | 11,484 | | | Actuate Corp. (a) (m) | | | 76,254 | |
| | 6,200 | | | Advent Software, Inc. (a) (m) | | | 217,372 | |
| | 14,206 | | | Aspen Technology, Inc. (a) | | | 408,991 | |
| | 7,000 | | | Cyan, Inc. (a) | | | 73,150 | |
| | 3,000 | | | Gigamon, Inc. (a) | | | 82,680 | |
| | 1,500 | | | Manhattan Associates, Inc. (a) | | | 115,740 | |
| | 2,800 | | | Monotype Imaging Holdings, Inc. | | | 71,148 | |
| | 25,970 | | | Pegasystems, Inc. | | | 860,126 | |
| | 4,600 | | | Progress Software Corp. (a) | | | 105,846 | |
| | 7,340 | | | PTC, Inc. (a) | | | 180,050 | |
| | 1,300 | | | Rovi Corp. (a) | | | 29,692 | |
| | 2,800 | | | Tableau Software, Inc., Class A (a) | | | 155,176 | |
| | 41,400 | | | Take-Two Interactive Software, Inc. (a) | | | 619,758 | |
| | 16,000 | | | TeleCommunication Systems, Inc., Class A (a) | | | 37,280 | |
| | 8,600 | | | Telenav, Inc. (a) | | | 44,978 | |
| | 3,600 | | | TIBCO Software, Inc. (a) | | | 77,040 | |
| | | | | | | | |
| | | | | | | 3,155,281 | |
| | | | | | | | |
| | | | Total Information Technology | | | 13,973,145 | |
| | | | | | | | |
| | | | Materials — 4.6% | |
| | | | Chemicals — 1.9% | |
| | 6,600 | | | A Schulman, Inc. | | | 177,012 | |
| | 2,500 | | | American Pacific Corp. (a) | | | 70,875 | |
| | 10,600 | | | Axiall Corp. | | | 451,348 | |
| | 800 | | | FutureFuel Corp. | | | 11,336 | |
| | 4,500 | | | H.B. Fuller Co. | | | 170,145 | |
| | 900 | | | Innospec, Inc. | | | 36,162 | |
| | 6,400 | | | Koppers Holdings, Inc. | | | 244,352 | |
| | 7,500 | | | Minerals Technologies, Inc. | | | 310,050 | |
| | 11,600 | | | OMNOVA Solutions, Inc. (a) | | | 92,916 | |
| | | | | | | | |
| | | | | | | 1,564,196 | |
| | | | | | | | |
| | | | Construction Materials — 0.3% | |
| | 30,200 | | | Headwaters, Inc. (a) | | | 266,968 | |
| | | | | | | | |
SEE NOTES TO FINANCIAL STATEMENTS.
| | | | | | |
| | | |
| 10 | | | | JPMORGAN INSURANCE TRUST | | JUNE 30, 2013 |
| | | | | | | | |
| SHARES | | | SECURITY DESCRIPTION | | VALUE($) | |
| | | | | | | | |
| Common Stocks — Continued | |
| | | | Containers & Packaging — 1.1% | |
| | 4,000 | | | Boise, Inc. | | | 34,160 | |
| | 39,600 | | | Graphic Packaging Holding Co. (a) | | | 306,504 | |
| | 5,875 | | | Rock Tenn Co., Class A | | | 586,795 | |
| | | | | | | | |
| | | | | | | 927,459 | |
| | | | | | | | |
| | | | Metals & Mining — 0.8% | |
| | 15,200 | | | Coeur Mining, Inc. (a) | | | 202,160 | |
| | 5,100 | | | Revett Minerals, Inc. (a) | | | 3,299 | |
| | 4,300 | | | SunCoke Energy, Inc. (a) | | | 60,286 | |
| | 1,700 | | | U.S. Silica Holdings, Inc. | | | 35,326 | |
| | 12,500 | | | Worthington Industries, Inc. | | | 396,375 | |
| | | | | | | | |
| | | | | | | 697,446 | |
| | | | | | | | |
| | | | Paper & Forest Products — 0.5% | |
| | 3,800 | | | Boise Cascade Co. (a) | | | 96,558 | |
| | 6,275 | | | Buckeye Technologies, Inc. | | | 232,426 | |
| | 9,200 | | | Resolute Forest Products, Inc., (Canada) (a) | | | 121,164 | |
| | | | | | | | |
| | | | | | | 450,148 | |
| | | | | | | | |
| | | | Total Materials | | | 3,906,217 | |
| | | | | | | | |
| | | | Telecommunication Services — 1.2% | |
| | | | Diversified Telecommunication Services — 1.1% | |
| | 4,900 | | | Atlantic Tele-Network, Inc. | | | 243,334 | |
| | 892 | | | Consolidated Communications Holdings, Inc. | | | 15,530 | |
| | 9,400 | | | IDT Corp., Class B | | | 175,686 | |
| | 15,063 | | | Neutral Tandem, Inc. | | | 86,612 | |
| | 17,600 | | | Premiere Global Services, Inc. (a) | | | 212,432 | |
| | 78,488 | | | Vonage Holdings Corp. (a) | | | 222,121 | |
| | | | | | | | |
| | | | | | | 955,715 | |
| | | | | | | | |
| | | | Wireless Telecommunication Services — 0.1% | |
| | 3,100 | | | NII Holdings, Inc. (a) | | | 20,677 | |
| | 3,600 | | | USA Mobility, Inc. | | | 48,852 | |
| | | | | | | | |
| | | | | | | 69,529 | |
| | | | | | | | |
| | | | Total Telecommunication Services | | | 1,025,244 | |
| | | | | | | | |
| | | | Utilities — 3.1% | |
| | | | Electric Utilities — 2.2% | |
| | 9,425 | | | El Paso Electric Co. | | | 332,797 | |
| | 3,300 | | | Empire District Electric Co. (The) | | | 73,623 | |
| | 5,400 | | | IDACORP, Inc. | | | 257,904 | |
| | 1,900 | | | MGE Energy, Inc. | | | 104,044 | |
| | | | | | | | |
| SHARES | | | SECURITY DESCRIPTION | | VALUE($) | |
| | | | | | | | |
| | | | | | | | |
| | | | Electric Utilities — Continued | |
| | 26,575 | | | Portland General Electric Co. | | | 812,929 | |
| | 5,225 | | | UNS Energy Corp. | | | 233,714 | |
| | 1,900 | | | Westar Energy, Inc. | | | 60,724 | |
| | | | | | | | |
| | | | | | | 1,875,735 | |
| | | | | | | | |
| | | | Gas Utilities — 0.8% | |
| | 419 | | | AGL Resources, Inc. (m) | | | 17,959 | |
| | 900 | | | Chesapeake Utilities Corp. | | | 46,341 | |
| | 3,200 | | | Laclede Group, Inc. (The) | | | 146,112 | |
| | 4,600 | | | New Jersey Resources Corp. | | | 191,038 | |
| | 1,400 | | | Northwest Natural Gas Co. | | | 59,472 | |
| | 2,600 | | | Southwest Gas Corp. | | | 121,654 | |
| | 1,700 | | | WGL Holdings, Inc. | | | 73,474 | |
| | | | | | | | |
| | | | | | | 656,050 | |
| | | | | | | | |
| | | | Water Utilities — 0.1% | |
| | 900 | | | Artesian Resources Corp., Class A | | | 20,052 | |
| | 4,105 | | | Consolidated Water Co., Ltd., (Cayman Islands) | | | 46,920 | |
| | | | | | | | |
| | | | | | | 66,972 | |
| | | | | | | | |
| | | | Total Utilities | | | 2,598,757 | |
| | | | | | | | |
| | | | Total Common Stocks (Cost $59,584,600) | | | 82,413,979 | |
| | | | | | | | |
| | |
PRINCIPAL
AMOUNT($) | | | | | | |
| U.S. Treasury Obligation — 0.2% | |
| | 200,000 | | | U.S. Treasury Note, 0.250%, 11/30/13 (k) (Cost $200,059) | | | 200,117 | |
| | | | | | | | |
| | |
| SHARES | | | | | | |
| Short-Term Investment — 1.5% | |
| | | | Investment Company — 1.5% | |
| | 1,285,693 | | | JPMorgan Prime Money Market Fund, Institutional Class Shares, 0.030% (b) (l) (m)
(Cost $1,285,693) | | | 1,285,693 | |
| | | | | | | | |
| | | | Total Investments — 99.7% (Cost $61,070,352) | | | 83,899,789 | |
| | | | Other Assets in Excess of
Liabilities — 0.3% | | | 239,952 | |
| | | | | | | | |
| | | | NET ASSETS — 100.0% | | $ | 84,139,741 | |
| | | | | | | | |
Percentages indicated are based on net assets.
SEE NOTES TO FINANCIAL STATEMENTS.
| | | | | | | | |
| | | |
| JUNE 30, 2013 | | JPMORGAN INSURANCE TRUST | | | | | 11 | |
JPMorgan Insurance Trust Small Cap Core Portfolio
SCHEDULE OF PORTFOLIO INVESTMENTS
AS OF JUNE 30, 2013 (Unaudited) (continued)
| | | | | | | | | | | | | | | | |
| Futures Contracts | | | | | | | | | |
NUMBER OF
CONTRACTS | | | DESCRIPTION | | EXPIRATION
DATE | | | NOTIONAL
VALUE AT
06/30/13 | | | NET UNREALIZED
APPRECIATION
(DEPRECIATION) | |
| | | | Long Futures Outstanding | | | | | | | | | | | | |
| | 16 | | | E-mini Russell 2000 | | | 09/20/13 | | | $ | 1,559,520 | | | $ | 16,698 | |
| | | | | | | | | | | | | | | | |
NOTES TO SCHEDULE OF PORTFOLIO INVESTMENTS:
| | |
| (a) | | — Non-income producing security. |
| (b) | | — Investment in affiliate. Money market fund registered under the Investment Company Act of 1940, as amended, and advised by J.P. Morgan Investment Management Inc. |
| (i) | | — Security has been deemed illiquid pursuant to procedures approved by the Board of Trustees and may be difficult to sell. |
| (k) | | — All or a portion of this security is deposited with the broker as collateral for futures or with brokers as initial margin for futures contracts. |
| | |
| (l) | | — The rate shown is the current yield as of June 30, 2013. |
| (m) | | — All or a portion of this security is reserved and/or pledged with the custodian for current or potential holdings of futures, swaps, options, TBAs, when-issued securities, delayed delivery securities, reverse repurchase agreements, unfunded commitments and/or forward foreign currency exchange contracts. |
SEE NOTES TO FINANCIAL STATEMENTS.
| | | | | | |
| | | |
| 12 | | | | JPMORGAN INSURANCE TRUST | | JUNE 30, 2013 |
STATEMENT OF ASSETS AND LIABILITIES
AS OF JUNE 30, 2013 (Unaudited)
| | | | |
| | | Small Cap Core
Portfolio | |
ASSETS: | |
Investments in non-affiliates, at value | | $ | 82,614,096 | |
Investments in affiliates, at value | | | 1,285,693 | |
| | | | |
Total investment securities, at value | | | 83,899,789 | |
Receivables: | | | | |
Investment securities sold | | | 2,378,416 | |
Portfolio shares sold | | | 80,739 | |
Interest and dividends from non-affiliates | | | 144,752 | |
Dividends from affiliates | | | 71 | |
Variation margin on futures contracts | | | 314 | |
| | | | |
Total Assets | | | 86,504,081 | |
| | | | |
| |
LIABILITIES: | | | | |
Payables: | | | | |
Investment securities purchased | | | 2,205,509 | |
Portfolio shares redeemed | | | 57,287 | |
Accrued liabilities: | | | | |
Investment advisory fees | | | 44,774 | |
Administration fees | | | 5,828 | |
Distribution fees | | | 457 | |
Custodian and accounting fees | | | 10,290 | |
Trustees’ and Chief Compliance Officer’s fees | | | 69 | |
Other | | | 40,126 | |
| | | | |
Total Liabilities | | | 2,364,340 | |
| | | | |
Net Assets | | $ | 84,139,741 | |
| | | | |
|
NET ASSETS: | |
Paid-in-Capital | | $ | 60,095,258 | |
Accumulated undistributed (distributed in excess of) net investment income | | | 149,946 | |
Accumulated net realized gains (losses) | | | 1,048,402 | |
Net unrealized appreciation (depreciation) | | | 22,846,135 | |
| | | | |
Total Net Assets | | $ | 84,139,741 | |
| | | | |
Net Assets: | | | | |
Class 1 | | $ | 81,943,465 | |
Class 2 | | | 2,196,276 | |
| | | | |
Total | | $ | 84,139,741 | |
| | | | |
Outstanding units of beneficial interest (shares) | | | | |
(unlimited number of shares authorized, no par value): | | | | |
Class 1 | | | 4,143,474 | |
Class 2 | | | 111,484 | |
Net Asset Value, offering and redemption price per share (a): | | | | |
Class 1 | | $ | 19.78 | |
Class 2 | | | 19.70 | |
| | | | |
Cost of investments in non-affiliates | | $ | 59,784,659 | |
Cost of investments in affiliates | | | 1,285,693 | |
| (a) | Per share amounts may not recalculate due to rounding of net assets and/or shares outstanding. |
SEE NOTES TO FINANCIAL STATEMENTS.
| | | | | | | | |
| | | |
| JUNE 30, 2013 | | JPMORGAN INSURANCE TRUST | | | | | 13 | |
STATEMENT OF OPERATIONS
For the Six Months Ended June 30, 2013 (Unaudited)
| | | | |
| | | Small Cap Core
Portfolio | |
INVESTMENT INCOME: | |
Dividend income from non-affiliates | | $ | 484,489 | |
Dividend income from affiliates | | | 717 | |
Interest income from non-affiliates | | | 159 | |
| | | | |
Total investment income | | | 485,365 | |
| | | | |
| |
EXPENSES: | | | | |
Investment advisory fees | | | 252,955 | |
Administration fees | | | 32,808 | |
Distribution fees — Class 2 | | | 2,683 | |
Custodian and accounting fees | | | 20,872 | |
Professional fees | | | 24,918 | |
Trustees’ and Chief Compliance Officer’s fees | | | 437 | |
Printing and mailing costs | | | 11,024 | |
Transfer agent fees | | | 5,230 | |
Other | | | 5,720 | |
| | | | |
Total expenses | | | 356,647 | |
| | | | |
Less amounts waived | | | (2,429 | ) |
| | | | |
Net expenses | | | 354,218 | |
| | | | |
Net investment income (loss) | | | 131,147 | |
| | | | |
| |
REALIZED/UNREALIZED GAINS (LOSSES): | | | | |
Net realized gain (loss) on transactions from: | | | | |
Investments in non-affiliates | | | 5,040,889 | |
Futures | | | 302,958 | |
| | | | |
Net realized gains (losses) | | | 5,343,847 | |
| | | | |
Change in net unrealized appreciation/depreciation of: | | | | |
Investments in non-affiliates | | | 6,456,730 | |
Futures | | | (51,576 | ) |
| | | | |
Change in net unrealized appreciation/depreciation | | | 6,405,154 | |
| | | | |
Net realized/unrealized gains (losses) | | | 11,749,001 | |
| | | | |
Change in net assets resulting from operations | | $ | 11,880,148 | |
| | | | |
SEE NOTES TO FINANCIAL STATEMENTS.
| | | | | | |
| | | |
| 14 | | | | JPMORGAN INSURANCE TRUST | | JUNE 30, 2013 |
STATEMENTS OF CHANGES IN NET ASSETS
FOR THE PERIODS INDICATED
| | | | | | | | |
| | | Small Cap Core Portfolio | |
| | | Six Months Ended
6/30/2013
(Unaudited) | | | Year Ended
12/31/2012 | |
CHANGE IN NET ASSETS RESULTING FROM OPERATIONS: | |
Net investment income (loss) | | $ | 131,147 | | | $ | 512,635 | |
Net realized gain (loss) | | | 5,343,847 | | | | 5,187,005 | |
Change in net unrealized appreciation/depreciation | | | 6,405,154 | | | | 5,749,684 | |
| | | | | | | | |
Change in net assets resulting from operations | | | 11,880,148 | | | | 11,449,324 | |
| | | | | | | | |
| | |
DISTRIBUTIONS TO SHAREHOLDERS: | | | | | | | | |
Class 1 | | | | | | | | |
From net investment income | | | (465,407 | ) | | | (127,898 | ) |
Class 2 | | | | | | | | |
From net investment income | | | (8,021 | ) | | | — | |
| | | | | | | | |
Total distributions to shareholders | | | (473,428 | ) | | | (127,898 | ) |
| | | | | | | | |
| | |
CAPITAL TRANSACTIONS: | | | | | | | | |
Change in net assets resulting from capital transactions | | | 4,023,767 | | | | (2,782,957 | ) |
| | | | | | | | |
| | |
NET ASSETS: | | | | | | | | |
Change in net assets | | | 15,430,487 | | | | 8,538,469 | |
Beginning of period | | | 68,709,254 | | | | 60,170,785 | |
| | | | | | | | |
End of period | | $ | 84,139,741 | | | $ | 68,709,254 | |
| | | | | | | | |
Accumulated undistributed (distributed in excess of) net investment income | | $ | 149,946 | | | $ | 492,227 | |
| | | | | | | | |
| | |
CAPITAL TRANSACTIONS: | | | | | | | | |
Class 1 | | | | | | | | |
Proceeds from shares issued | | $ | 15,614,924 | | | $ | 13,872,549 | |
Distributions reinvested | | | 465,407 | | | | 127,898 | |
Cost of shares redeemed | | | (11,937,899 | ) | | | (16,667,963 | ) |
| | | | | | | | |
Change in net assets resulting from Class 1 capital transactions | | $ | 4,142,432 | | | $ | (2,667,516 | ) |
| | | | | | | | |
Class 2 | | | | | | | | |
Proceeds from shares issued | | $ | 36,573 | | | $ | 101,342 | |
Distributions reinvested | | | 8,021 | | | | — | |
Cost of shares redeemed | | | (163,259 | ) | | | (216,783 | ) |
| | | | | | | | |
Change in net assets resulting from Class 2 capital transactions | | $ | (118,665 | ) | | $ | (115,441 | ) |
| | | | | | | | |
Total change in net assets resulting from capital transactions | | $ | 4,023,767 | | | $ | (2,782,957 | ) |
| | | | | | | | |
| | |
SHARE TRANSACTIONS: | | | | | | | | |
Class 1 | | | | | | | | |
Issued | | | 822,029 | | | | 865,809 | |
Reinvested | | | 25,009 | | | | 8,284 | |
Redeemed | | | (633,112 | ) | | | (1,051,374 | ) |
| | | | | | | | |
Change in Class 1 Shares | | | 213,926 | | | | (177,281 | ) |
| | | | | | | | |
Class 2 | | | | | | | | |
Issued | | | 1,975 | | | | 6,653 | |
Reinvested | | | 432 | | | | — | |
Redeemed | | | (8,657 | ) | | | (13,633 | ) |
| | | | | | | | |
Change in Class 2 Shares | | | (6,250 | ) | | | (6,980 | ) |
| | | | | | | | |
SEE NOTES TO FINANCIAL STATEMENTS.
| | | | | | | | |
| | | |
| JUNE 30, 2013 | | JPMORGAN INSURANCE TRUST | | | | | 15 | |
FINANCIAL HIGHLIGHTS
FOR THE PERIODS INDICATED
| | | | | | | | | | | | | | | | | | | | | | | | | | | | |
| | | Per share operating performance | |
| | | | | | Investment operations | | | Distributions | |
| | | Net asset
value,
beginning
of period | | | Net
investment
income
(loss) | | | Net realized
and unrealized
gains
(losses) on
investments | | | Total from
investment
operations | | | Net
investment
income | | | Net
realized
gain | | | Total
distributions | |
Small Cap Core Portfolio (f) | | | | | | | | | | | | | | | | | | | | | | | | | | | | |
Class 1 | | | | | | | | | | | | | | | | | | | | | | | | | | | | |
Six Months Ended June 30, 2013 (Unaudited) | | $ | 16.98 | | | $ | 0.03 | (g) | | $ | 2.88 | | | $ | 2.91 | | | $ | (0.11 | ) | | $ | — | | | $ | (0.11 | ) |
Year Ended December 31, 2012 | | | 14.22 | | | | 0.13 | (h) | | | 2.66 | | | | 2.79 | | | | (0.03 | ) | | | — | | | | (0.03 | ) |
Year Ended December 31, 2011 | | | 14.95 | | | | 0.04 | | | | (0.75 | ) | | | (0.71 | ) | | | (0.02 | ) | | | — | | | | (0.02 | ) |
Year Ended December 31, 2010 | | | 11.76 | | | | 0.02 | | | | 3.17 | | | | 3.19 | | | | — | | | | — | | | | — | |
Year Ended December 31, 2009 | | | 9.84 | | | | 0.05 | | | | 2.11 | | | | 2.16 | | | | (0.08 | ) | | | (0.16 | ) | | | (0.24 | ) |
Year Ended December 31, 2008 | | | 16.06 | | | | 0.04 | | | | (4.73 | ) | | | (4.69 | ) | | | (0.03 | ) | | | (1.50 | ) | | | (1.53 | ) |
| | | | | | | |
Class 2 | | | | | | | | | | | | | | | | | | | | | | | | | | | | |
Six Months Ended June 30, 2013 (Unaudited) | | | 16.90 | | | | 0.01 | (g) | | | 2.86 | | | | 2.87 | | | | (0.07 | ) | | | — | | | | (0.07 | ) |
Year Ended December 31, 2012 | | | 14.16 | | | | 0.09 | (h) | | | 2.65 | | | | 2.74 | | | | — | | | | — | | | | — | |
Year Ended December 31, 2011 | | | 14.91 | | | | — | (i) | | | (0.75 | ) | | | (0.75 | ) | | | — | | | | — | | | | — | |
Year Ended December 31, 2010 | | | 11.76 | | | | (0.01 | ) | | | 3.16 | | | | 3.15 | | | | — | | | | — | | | | — | |
April 24, 2009 (j) through December 31, 2009 | | | 9.03 | | | | 0.01 | | | | 2.73 | | | | 2.74 | | | | (0.01 | ) | | | — | | | | (0.01 | ) |
| (a) | Annualized for periods less than one year. |
| (b) | Not annualized for periods less than one year. |
| (c) | Includes adjustments in accordance with accounting principles generally accepted in the United States of America and as such, the net asset values for financial reporting purposes and the returns based upon those net asset values may differ from the net asset values and returns for shareholder transactions. |
| (d) | Includes earnings credits and interest expense, if applicable, each of which is less than 0.01% unless otherwise noted. |
| (e) | Portfolio turnover is calculated by dividing the lesser of total purchases or sales of portfolio securities for the reporting period by the monthly average of portfolio securities owned during the reporting period. Excluded from both the numerator and denominator are amounts relating to derivatives and securities whose maturities or expiration dates at the time of acquisition were one year or less. |
| (f) | Small Cap Core Portfolio acquired all of the assets and liabilities of JPMorgan Small Company Portfolio (“Predecessor Portfolio”) in a reorganization on April 24, 2009. The Predecessor Portfolio’s performance and financial history have been adopted by Small Cap Core Portfolio and have been used since the reorganization. As a result, the financial highlight information reflects that of the Predecessor Portfolio for the periods prior to its reorganization with Small Cap Core Portfolio. |
| (g) | Reflects special dividends paid out during the period by several of the Portfolio’s holdings. Had the Portfolio not received the special dividends the net investment income (loss) per share would have been $0.03 and $0.00 for Class 1 and Class 2 Shares, respectively and the net investment income (loss) ratio would have been 0.27% and 0.01% for Class 1 and Class 2 Shares, respectively. |
| (h) | Reflects special dividends paid out during the period by several of the Portfolio’s holdings. Had the Portfolio not received the special dividends the net investment income (loss) per share would have been $0.04 and less than $0.01 for Class 1 and Class 2 Shares, respectively and the net investment income (loss) ratio would have been 0.28% and 0.02% for Class 1 and Class 2 Shares, respectively. |
| (i) | Amount rounds to less than $0.01. |
| (j) | Because of the reorganization with the Predecessor Portfolio in which the performance and financial history of the Small Cap Core Portfolio was replaced with that of the Predecessor Portfolio, the performance and the financial history began on April 24, 2009. |
SEE NOTES TO FINANCIAL STATEMENTS.
| | | | | | |
| | | |
| 16 | | | | JPMORGAN INSURANCE TRUST | | JUNE 30, 2013 |
| | | | | | | | | | | | | | | | | | | | | | | | | | |
| | | Ratios/Supplemental data | |
| | | | | | | | | | Ratios to average net assets (a) | | | | |
Net asset
value,
end of
period | | | Total return (b)(c) | | | Net assets,
end of
period | | | Net
expenses (d) | | | Net
investment
income
(loss) | | | Expenses
without waivers,
reimbursements and
earnings credits | | | Portfolio
turnover
rate (b)(e) | |
| | | | | | | | | | | | | | | | | | | | | | | | | | |
| | | | | | | | | | | | | | | | | | | | | | | | | | |
$ | 19.78 | | | | 17.20 | % | | $ | 81,943,465 | | | | 0.90 | % | | | 0.34 | %(g) | | | 0.91 | % | | | 34 | % |
| | 16.98 | | | | 19.66 | | | | 66,719,964 | | | | 0.94 | | | | 0.80 | (h) | | | 0.94 | | | | 44 | |
| | 14.22 | | | | (4.77 | ) | | | 58,405,012 | | | | 0.95 | | | | 0.23 | | | | 0.95 | | | | 46 | |
| | 14.95 | | | | 27.13 | | | | 70,355,671 | | | | 0.99 | | | | 0.13 | | | | 1.04 | | | | 45 | |
| | 11.76 | | | | 22.58 | | | | 56,761,095 | | | | 0.98 | | | | 0.42 | | | | 1.34 | | | | 55 | |
| | 9.84 | | | | (31.98 | ) | | | 49,825,124 | | | | 1.08 | | | | 0.29 | | | | 1.15 | | | | 45 | |
| | | | | | |
| | | | | | | | | | | | | | | | | | | | | | | | | | |
| 19.70 | | | | 17.01 | | | | 2,196,276 | | | | 1.15 | | | | 0.08 | (g) | | | 1.16 | | | | 34 | |
| | 16.90 | | | | 19.35 | | | | 1,989,290 | | | | 1.19 | | | | 0.54 | (h) | | | 1.19 | | | | 44 | |
| | 14.16 | | | | (5.03 | ) | | | 1,765,773 | | | | 1.20 | | | | (0.02 | ) | | | 1.20 | | | | 46 | |
| | 14.91 | | | | 26.79 | | | | 1,995,231 | | | | 1.24 | | | | (0.09 | ) | | | 1.28 | | | | 45 | |
| 11.76 | | | | 30.37 | | | | 901,951 | | | | 1.17 | | | | 0.26 | | | | 1.45 | | | | 55 | |
SEE NOTES TO FINANCIAL STATEMENTS.
| | | | | | | | |
| | | |
| JUNE 30, 2013 | | JPMORGAN INSURANCE TRUST | | | | | 17 | |
NOTES TO FINANCIAL STATEMENTS
AS OF JUNE 30, 2013 (Unaudited)
1. Organization
JPMorgan Insurance Trust (the “Trust”) is registered under the Investment Company Act of 1940, as amended (the “1940 Act”), as an open-end management investment company and is a Massachusetts business trust.
The following is a separate Portfolio of the Trust (the “Portfolio”) covered by this report:
| | | | |
| | | Classes Offered | | Diversified/Non-Diversified |
| Small Cap Core Portfolio | | Class 1 and Class 2 | | Diversified |
The investment objective of the Portfolio is to seek capital growth over the long term.
Portfolio shares are offered only to separate accounts of participating insurance companies and Eligible Plans. Individuals may not purchase shares directly from the Portfolio.
All classes of shares have equal rights as to earnings, assets and voting privileges, except that each class may bear different distribution and service fees and each class has exclusive voting rights with respect to its distribution plan and administrative services plan.
2. Significant Accounting Policies
The following is a summary of significant accounting policies followed by the Portfolio in the preparation of its financial statements. The policies are in accordance with accounting principles generally accepted in the United States of America (“GAAP”). The preparation of financial statements requires management to make estimates and assumptions that affect the reported amounts and disclosures in the financial statements. Actual results could differ from those estimates.
A. Valuation of Investments — Equity securities listed on a North American, Central American, South American or Caribbean securities exchange shall generally be valued at the last sale price on the exchange on which the security is principally traded that is reported before the time when the net assets of the Portfolio are valued. Securities listed on the NASDAQ Stock Market LLC are generally valued at the NASDAQ Official Closing Price. Fixed income securities (other than certain short-term investments maturing in less than 61 days) are valued each day based on prices received from independent or affiliated pricing services approved by the Board of Trustees or third party broker-dealers. The pricing services or broker-dealers use multiple valuation techniques to determine fair value. In instances where sufficient market activity exists, the pricing services or broker-dealers may utilize a market-based approach through which quotes from market makers are used to determine fair value. In instances where sufficient market activity may not exist or is limited, the pricing services or broker-dealers also utilize proprietary valuation models which may consider market transactions in comparable securities and the various relationships between securities in determining fair value and/or market characteristics such as benchmark yield curves, option-adjusted spreads, credit spreads, estimated default rates, coupon-rates, anticipated timing of principal repayments, underlying collateral, and other unique security features in order to estimate the relevant cash flows, which are then discounted to calculate the fair values. Generally, short-term investments of sufficient credit quality maturing in less than 61 days are valued at amortized cost, which approximates fair value. Investments in other open-end investment companies are valued at each investment company’s net asset value per share (“NAV”) as of the report date.
Certain investments of the Portfolio may, depending upon market conditions, trade in relatively thin markets and/or in markets that experience significant volatility. As a result of these conditions, the prices used by the Portfolio to value these securities may differ from the value that would be realized if these securities were sold, and the differences could be material. Futures and options are generally valued on the basis of available market quotations. Swaps and other derivatives are valued daily, primarily using independent or affiliated pricing services approved by the Board of Trustees. If valuations are not available from such services or values received are deemed not representative of fair value, values will be obtained from a third party broker-dealer or counterparty.
Securities or other assets for which market quotations are not readily available or for which market quotations are deemed to not represent the fair value of the security or asset at the time of pricing (including certain illiquid securities) are fair valued in accordance with procedures established by and under the supervision and responsibility of the Board of Trustees. The Board of Trustees has established an Audit and Valuation Committee to assist with the oversight of the valuation of the Portfolio’s securities. JPMorgan Funds Management, Inc. (the “Administrator”, or “JPMFM”), an indirect, wholly-owned subsidiary of JPMorgan Chase & Co. (“JPMorgan”), has established a Valuation Committee (“VC”) that is comprised of senior representatives from JPMFM, J.P. Morgan Investment Management Inc. (“JPMIM” or the “Advisor”), a wholly-owned subsidiary of JPMorgan Asset Management Holdings Inc. (“JPMAM”), which is a wholly-owned subsidiary of JPMorgan, JPMorgan’s Legal and Compliance and JPMAM’s Risk Management and the Portfolio’s Chief Compliance Officer. The VC’s responsibilities include making determinations regarding Level 3 fair value measurements (“Fair Values”) and/or providing recommendations for approval to the Board of Trustees’ Audit and Valuation Committee, in accordance with the Portfolio’s valuation policies.
The VC or Board of Trustees, as applicable, primarily employs a market-based approach which may use related or comparable assets or liabilities, recent transactions, market multiples, book values, and other relevant information for the investment to determine the fair value of the investment. The VC or Board of Trustees may also use an income-based valuation approach in which the anticipated future cash flows of the investment are discounted to calculate fair value. Discounts may also be applied due to the nature or duration of any restrictions on the disposition of the investments. Valuations may be based upon current market prices of securities that are comparable in coupon, rating, maturity and industry.
| | | | | | |
| | | |
| 18 | | | | JPMORGAN INSURANCE TRUST | | JUNE 30, 2013 |
It is possible that the estimated values may differ significantly from the values that would have been used had a ready market for the investments existed, and such differences could be material. JPMFM and JPMIM are responsible for monitoring developments that may impact Fair Values and for discussing and assessing Fair Values on an ongoing, and at least a quarterly, basis with the VC and Board of Trustees, as applicable. The appropriateness of Fair Values is assessed based on results of unchanged price review and consideration of macro or security specific events, back testing and broker and vendor due diligence.
Valuations reflected in this report are as of the report date. As a result, changes in valuation due to market events and/or issuer related events after the report date and prior to issuance of the report, are not reflected herein.
The various inputs that are used in determining the fair value of the Portfolio’s investments are summarized into the three broad levels listed below.
| Ÿ | | Level 1 — quoted prices in active markets for identical securities |
| Ÿ | | Level 2 — other significant observable inputs (including quoted prices for similar securities, interest rates, prepayment speeds, credit risk, etc.) |
| Ÿ | | Level 3 — significant unobservable inputs (including the Portfolio’s own assumptions in determining the fair value of investments) |
A financial instrument’s level within the fair value hierarchy is based on the lowest level of any input, both individually and in the aggregate, that is significant to the fair value measurement. The inputs or methodology used for valuing securities are not necessarily an indication of the risk associated with investing in those securities.
The following table represents each valuation input as presented on the Schedule of Portfolio Investments (“SOI”):
| | | | | | | | | | | | | | | | |
| | | Level 1
Quoted prices | | | Level 2
Other significant
observable inputs | | | Level 3
Significant
unobservable inputs | | | Total | |
Investments in Securities | | | | | | | | | | | | | | | | |
Common Stocks | | | | | | | | | | | | | | | | |
Consumer Discretionary | | $ | 11,612,871 | | | $ | — | | | $ | — | | | $ | 11,612,871 | |
Consumer Staples | | | 3,881,777 | | | | — | | | | — | | | | 3,881,777 | |
Energy | | | 4,089,034 | | | | — | | | | — | | | | 4,089,034 | |
Financials | | | 19,053,362 | | | | — | | | | — | (a) | | | 19,053,362 | |
Health Care | | | 9,039,870 | | | | — | | | | — | | | | 9,039,870 | |
Industrials | | | 13,233,702 | | | | — | | | | — | | | | 13,233,702 | |
Information Technology | | | 13,973,145 | | | | — | | | | — | | | | 13,973,145 | |
Materials | | | 3,906,217 | | | | — | | | | — | | | | 3,906,217 | |
Telecommunication Services | | | 1,025,244 | | | | — | | | | — | | | | 1,025,244 | |
Utilities | | | 2,598,757 | | | | — | | | | — | | | | 2,598,757 | |
| | | | | | | | | | | | | | | | |
Total Common Stocks | | | 82,413,979 | | | | — | | | | — | (a) | | | 82,413,979 | |
| | | | | | | | | | | | | | | | |
Debt Securities | | | | | | | | | | | | | | | | |
U.S. Treasury Obligation | | | — | | | | 200,117 | | | | — | | | | 200,117 | |
Short-Term Investment | | | | | | | | | | | | | | | | |
Investment Company | | | 1,285,693 | | | | — | | | | — | | | | 1,285,693 | |
| | | | | | | | | | | | | | | | |
Total Investments in Securities | | $ | 83,699,672 | | | $ | 200,117 | | | $ | — | (a) | | $ | 83,899,789 | |
| | | | | | | | | | | | | | | | |
Appreciation in Other Financial Instruments | | | | | | | | | | | | | | | | |
| | | | | | | | | | | | | | | | |
Futures Contracts | | $ | 16,698 | | | $ | — | | | $ | — | | | $ | 16,698 | |
| | | | | | | | | | | | | | | | |
There were no transfers between any levels during the period ended June 30, 2013.
B. Restricted and Illiquid Securities — Certain securities held by the Portfolio may be subject to legal or contractual restrictions on resale and/or are illiquid. Restricted securities generally are resold in transactions exempt from registration under the Securities Act of 1933 (the “Securities Act”). An illiquid security is a security which cannot be disposed of promptly (within seven days) and in the usual course of business at approximately its fair value and includes, but is not limited to, repurchase agreements maturing in excess of seven days, time deposits with a withdrawal penalty, non-negotiable instruments and instruments for which no market exists. Disposal of these securities may involve time-consuming negotiations and expense. Prompt sale at the current valuation may be difficult and could adversely affect the net assets of the Portfolio. As of June 30, 2013, the Portfolio had no investments in restricted securities other than securities sold to the Portfolio under Rule 144A and/or Regulation S under the Securities Act.
The value and percentage of net assets of illiquid securities as of June 30, 2013 were $0 and 0.0%, respectively.
| | | | | | | | |
| | | |
| JUNE 30, 2013 | | JPMORGAN INSURANCE TRUST | | | | | 19 | |
NOTES TO FINANCIAL STATEMENTS
AS OF JUNE 30, 2013 (Unaudited) (continued)
C. Futures Contracts — The Portfolio uses index futures contracts to gain or reduce exposure to the stock market, maintain liquidity and minimize transaction costs. The Portfolio also buys futures contracts to immediately invest incoming cash in the market or sells futures in response to cash outflows, thereby simulating an invested position in the underlying index while maintaining a cash balance for liquidity. The use of futures contracts exposes the Portfolio to equity price risk.
Futures contracts provide for the delayed delivery of the underlying instrument at a fixed price or are settled for a cash amount based on the change in the value of the underlying instrument at a specific date in the future. Upon entering into a futures contract, the Portfolio is required to deposit with the broker, cash or securities in an amount equal to a certain percentage of the contract amount, which is referred to as the initial margin deposit. Subsequent payments, referred to as variation margin, are made or received by the Portfolio periodically and are based on changes in the market value of open futures contracts. Changes in the market value of open futures contracts are recorded as unrealized appreciation or depreciation in the Statement of Operations. Realized gains or losses, representing the difference between the value of the contract at the time it was opened and the value at the time it was closed, are reported in the Statement of Operations at the closing or expiration of the futures contract. Securities deposited as initial margin are designated in the SOI and cash deposited is recorded on the Statement of Assets and Liabilities. A receivable from and/or a payable to brokers for the daily variation margin is also recorded on the Statement of Assets and Liabilities.
The Portfolio may be subject to the risk that the change in the value of the futures contract may not correlate perfectly with the underlying instrument. Use of long futures contracts subjects the Portfolio to risk of loss in excess of the amounts shown on the Statement of Assets and Liabilities, up to the notional amount of the futures contracts. Use of short futures contracts subjects the Portfolio to unlimited risk of loss. The Portfolio may enter into futures contracts only on exchanges or boards of trade. The exchange or board of trade acts as the counterparty to each futures transaction; therefore, the Portfolio’s credit risk is limited to failure of the exchange or board of trade. Under some circumstances, futures exchanges may establish daily limits on the amount that the price of a futures contract can vary from the previous day’s settlement price, which could effectively prevent liquidation of positions.
The table below discloses the volume of the Portfolio’s futures contracts activity during the six months ended June 30, 2013:
| | | | |
Futures Contracts: | | | | |
Average Notional Balance Long | | $ | 2,576,624 | |
Ending Notional Balance Long | | | 1,559,520 | |
D. Security Transactions and Investment Income — Investment transactions are accounted for on the trade date (the date the order to buy or sell is executed). Securities gains and losses are calculated on a specifically identified cost basis. Interest income is determined on the basis of coupon interest accrued using the effective interest method which adjusts for amortization of premiums and accretion of discounts. Dividend income, net of foreign taxes withheld, if any, is recorded on the ex-dividend date or when the Portfolio first learns of the dividend.
To the extent such information is publicly available, the Portfolio records distributions received in excess of income earned from underlying investments as a reduction of cost of investments and/or realized gain. Such amounts are based on estimates if actual amounts are not available and actual amounts of income, realized gain and return of capital may differ from the estimated amounts. The Portfolio adjusts the estimated amounts of the components of distributions (and consequently its net investment income) as necessary once the issuers provide information about the actual composition of the distributions.
E. Allocation of Income and Expenses — Expenses directly attributable to a portfolio are charged directly to that portfolio, while the expenses attributable to more than one portfolio of the Trust are allocated among the respective portfolios. In calculating the NAV of each class, investment income, realized and unrealized gains and losses and expenses, other than class specific expenses, are allocated daily to each class of shares based upon the proportion of net assets of each class at the beginning of each day.
F. Federal Income Taxes — The Portfolio is treated as a separate taxable entity for Federal income tax purposes. The Portfolio’s policy is to comply with the provisions of the Internal Revenue Code of 1986, as amended (the “Code”), applicable to regulated investment companies and to distribute to shareholders all of its distributable net investment income and net realized gain on investments. Accordingly, no provision for Federal income tax is necessary. The Portfolio is also a segregated portfolio of assets for insurance purposes and intends to comply with the diversification requirements of Subchapter L of the Code. Management has reviewed the Portfolio’s tax positions for all open tax years and has determined that as of June 30, 2013, no liability for income tax is required in the Portfolio’s financial statements for net unrecognized tax benefits. However, management’s conclusions may be subject to future review based on changes in, or the interpretation of, the accounting standards or tax laws and regulations. The Portfolio’s Federal tax returns for the prior three fiscal years remain subject to examination by the Internal Revenue Service.
G. Distributions to Shareholders — Distributions from net investment income are generally declared and paid at least annually and are declared separately for each class. No class has preferential dividend rights; differences in per share rates are due to differences in separate class expenses. Net realized capital gains, if any, are distributed at least annually. The amount of distributions from net investment income and net realized capital gains is determined in accordance with Federal income tax regulations, which may differ from GAAP. To the extent these “book/tax” differences are permanent in nature (i.e., that they result from other than timing of recognition — “temporary differences”), such amounts are reclassified within the capital accounts based on their Federal tax-basis treatment.
| | | | | | |
| | | |
| 20 | | | | JPMORGAN INSURANCE TRUST | | JUNE 30, 2013 |
3. Fees and Other Transactions with Affiliates
A. Investment Advisory Fee — Pursuant to the Investment Advisory Agreement, JPMIM supervises the investments of the Portfolio and for such services is paid a fee. The fee is accrued daily and paid monthly based on the Portfolio’s average daily net assets at an annual rate of 0.65%.
B. Administration Fee — Pursuant to an Administration Agreement, the Administrator provides certain administration services to the Portfolio. In consideration of these services, the Administrator receives a fee accrued daily and paid monthly at an annual rate of 0.15% of the first $25 billion of the average daily net assets of all funds in the J.P. Morgan Funds Complex (excluding certain funds of funds and money market funds) and 0.075% of the average daily net assets in excess of $25 billion of all such funds. For the six months ended June 30, 2013, the annualized effective rate was 0.08% of the Portfolio’s average daily net assets, notwithstanding any fee waivers and/or expense reimbursements.
JPMorgan Chase Bank, N.A. (“JPMCB”), a wholly-owned subsidiary of JPMorgan, serves as the Portfolio’s sub-administrator (the “Sub-administrator”). For its services as Sub-administrator, JPMCB receives a portion of the fees payable to the Administrator.
C. Distribution Fees — Pursuant to a Distribution Agreement, JPMorgan Distribution Services, Inc. (the “Distributor”), a wholly-owned subsidiary of JPMorgan, serves as the Trust’s exclusive underwriter and promotes and arranges for the sale of the Portfolio’s shares.
The Board of Trustees has adopted a Distribution Plan (the “Distribution Plan”) for Class 2 Shares of the Portfolio in accordance with Rule 12b-1 under the 1940 Act. The Distribution Plan provides that the Portfolio shall pay distribution fees, including payments to the Distributor, at an annual rate of 0.25% of the average daily net assets of Class 2 Shares.
D. Custodian and Accounting Fees — JPMCB provides portfolio custody and accounting services to the Portfolio. The amounts paid directly to JPMCB by the Portfolio for custody and accounting services are included in Custodian and accounting fees in the Statement of Operations. Payments to the custodian may be reduced by credits earned by the Portfolio, based on uninvested cash balances held by the custodian. Such earnings credits, if any, are presented separately in the Statement of Operations.
Interest expense, if any, paid to the custodian related to cash overdrafts is included in Interest expense to affiliates in the Statement of Operations.
E. Waivers and Reimbursements — The Advisor, Administrator and Distributor (for Class 2 Shares) have contractually agreed to waive fees and/or reimburse the Portfolio to the extent that total annual operating expenses (excluding acquired fund fees and expenses, dividend expenses related to short sales, interest, taxes, expenses related to litigation and potential litigation, extraordinary expenses and expenses related to the Board of Trustees’ deferred compensation plan) exceed the percentages of the Portfolio’s respective average daily net assets as shown in the table below:
| | | | | | | | |
| | | Class 1 | | | Class 2 | |
| | | 1.03 | % | | | 1.28 | % |
The expense limitation agreements were in effect for the six months ended June 30, 2013. The contractual expense limitation percentages in the table above are in place until at least April 30, 2014.
Additionally, the Portfolio may invest in one or more money market funds advised by the Advisor or its affiliates. The Advisor, Administrator and the Distributor waive fees in an amount sufficient to offset the respective fees each charges to the affiliated money market fund on the Portfolio’s investment in such affiliated money market fund. A portion of the waiver is voluntary.
The amount of waivers resulting from investments in these money market funds for the six months ended June 30, 2013 was $2,429.
F. Other — Certain officers of the Trust are affiliated with the Advisor, the Administrator and the Distributor. Such officers, with the exception of the Chief Compliance Officer, receive no compensation from the Portfolio for serving in their respective roles.
The Board of Trustees appointed a Chief Compliance Officer to the Portfolio in accordance with Federal securities regulations. The Portfolio, along with other affiliated portfolios, makes reimbursement payments, on a pro-rata basis, to the Administrator for a portion of the fees associated with the Office of the Chief Compliance Officer. Such fees are included in Trustees’ and Chief Compliance Officer’s fees in the Statement of Operations.
The Trust adopted a Trustee Deferred Compensation Plan (the “Plan”) which allows the Independent Trustees to defer the receipt of all or a portion of compensation related to performance of their duties as Trustees. The deferred fees are invested in various J.P. Morgan Funds until distribution in accordance with the Plan.
During the six months ended June 30, 2013, the Portfolio may have purchased securities from an underwriting syndicate in which the principal underwriter or members of the syndicate are affiliated with the Advisor.
The Portfolio may use related party broker-dealers. For the six months ended June 30, 2013, the Portfolio did not incur any brokerage commissions with broker-dealers affiliated with the Advisor.
The Securities and Exchange Commission has granted an exemptive order permitting the Portfolio to engage in principal transactions with J.P. Morgan Securities, Inc., an affiliated broker, involving taxable money market instruments, subject to certain conditions.
| | | | | | | | |
| | | |
| JUNE 30, 2013 | | JPMORGAN INSURANCE TRUST | | | | | 21 | |
NOTES TO FINANCIAL STATEMENTS
AS OF JUNE 30, 2013 (Unaudited) (continued)
4. Investment Transactions
During the six months ended June 30, 2013, purchases and sales of investments (excluding short-term investments) were as follows:
| | | | | | | | |
| | | Purchases
(excluding U.S.
Government) | | | Sales
(excluding U.S.
Government) | |
| | $ | 30,770,843 | | | $ | 25,889,077 | |
During the six months ended June 30, 2013, there were no purchases or sales of U.S. Government Securities.
5. Federal Income Tax Matters
For Federal income tax purposes, the cost and unrealized appreciation (depreciation) in value of investment securities held at June 30, 2013 were as follows:
| | | | | | | | | | | | | | | | |
| | | Aggregate
Cost | | | Gross
Unrealized
Appreciation | | | Gross
Unrealized
Depreciation | | | Net Unrealized
Appreciation
(Depreciation) | |
| | $ | 61,070,352 | | | $ | 24,487,471 | | | $ | 1,658,034 | | | $ | 22,829,437 | |
Under the Regulated Investment Company Modernization Act of 2010 (the “Act”), net capital losses recognized by the Portfolio after December 31, 2010 may get carried forward indefinitely, and retain their character as short-term and/or long term losses. Prior to the Act, net capital losses incurred by the Portfolio were carried forward for eight years and treated as short-term losses. The Act requires that post-enactment net capital losses be used before pre-enactment net capital losses.
At December 31, 2012, the Portfolio did not have any post-enactment net capital loss carryforwards.
At December 31, 2012, the Portfolio had pre-enactment net capital loss carryforwards, expiring during the year indicated, which are available to offset future realized gains:
| | | | | | | | |
| | | 2017 | | | Total | |
| | $ | 3,042,721 | * | | $ | 3,042,721 | |
| * | This amount includes $575,175 of capital loss carryforwards from business combinations, which may be limited in future years under the Internal Revenue Code Sections 381-384. |
6. Borrowings
The Trust and JPMCB have entered into a financing arrangement. Under this arrangement, JPMCB provides an unsecured, uncommitted credit facility in the aggregate amount of $100 million to certain of the J.P. Morgan Funds, including the Portfolio. Advances under the arrangement are taken primarily for temporary or emergency purposes, including the meeting of redemption requests that otherwise might require the untimely disposition of securities, and are subject to the Portfolio’s borrowing restrictions. Interest on borrowings is payable at a rate determined by JPMCB at the time of borrowing. This agreement has been extended until November 11, 2013.
The Portfolio had no borrowings outstanding from the unsecured, uncommitted credit facility at June 30, 2013, or at any time during the six months then ended.
Interest expense paid, if any, as a result of borrowings from the unsecured, uncommitted credit facility is included in Interest expense to affiliates in the Statement of Operations.
7. Risks, Concentrations and Indemnifications
In the normal course of business, the Portfolio enters into contracts that contain a variety of representations which provide general indemnifications. The Portfolio’s maximum exposure under these arrangements is unknown. The amount of exposure would depend on future claims that may be made against the Portfolio that have not yet occurred. However, based on experience, the Portfolio expects the risk of loss to be remote.
The Portfolio has a shareholder holding a significant percentage of shares outstanding. Investment activities of this shareholder could have a material impact on the Portfolio.
| | | | | | |
| | | |
| 22 | | | | JPMORGAN INSURANCE TRUST | | JUNE 30, 2013 |
SCHEDULE OF SHAREHOLDER EXPENSES
(Unaudited)
Hypothetical $1,000 Investment
As a shareholder of the Portfolio, you incur ongoing costs, including investment advisory fees, administration fees, distribution fees (for Class 2 shares) and other Portfolio expenses. Because the Portfolio is a funding vehicle for Policies and Eligible Plans, you may also incur sales charges and other fees relating to the Policies or Eligible Plans. The examples below are intended to help you understand your ongoing costs (in dollars) of investing in the Portfolio, but not the costs of the Policies or Eligible Plans, and to compare these ongoing costs with the ongoing costs of investing in other mutual funds. The examples assume that you had a $1,000 investment in each Class at the beginning of the reporting period, January 1, 2013, and continued to hold your shares at the end of the reporting period, June 30, 2013.
Actual Expenses
For each Class of the Portfolio in the table below, the first line provides information about actual account values and actual expenses. You may use the information in this line, together with the amount you invested, to estimate the expenses that you paid over the period. Simply divide your account value by $1,000 (for example, an $8,600 account value divided by $1,000 = 8.6), then multiply the result by the number in the first line of each Class under the heading entitled “Expenses Paid During the Period” to estimate the expenses you paid on your account during this period.
Hypothetical Example for Comparison Purposes
The second line of each Class in the table below provides information about hypothetical account values and hypothetical expenses based on the Class’ actual expense ratio and an assumed rate of return of 5% per year before expenses, which is not the Class’ actual return. The hypothetical account values and expenses may not be used to estimate the actual ending account balance or expenses you paid for the period. You may use this information to compare the ongoing costs of investing in the Class of the Portfolio and other portfolios. To do so, compare this 5% hypothetical example with the 5% hypothetical examples that appear in the shareholder reports of the other funds. Please note that the expenses shown in the table are meant to highlight your ongoing costs only and do not reflect any transaction costs, such as sales charges (loads) or redemption fees or the costs associated with the Policies and Eligible Plans through which the Portfolio is held. Therefore, the second line for each Class in the table is useful in comparing ongoing costs only, and will not help you determine the relative total costs of owning different portfolios. In addition, if these transaction costs were included, your costs would have been higher. The examples also assume all dividends and distributions have been reinvested.
| | | | | | | | | | | | | | | | |
| | | Beginning
Account Value,
January 1, 2013 | | | Ending
Account Value
June 30, 2013 | | | Expenses
Paid During
the Period* | | | Annualized
Expense
Ratio | |
Small Cap Core Portfolio | | | | | | | | | | | | | | | | |
Class 1 | | | | | | | | | | | | | | | | |
Actual | | $ | 1,000.00 | | | $ | 1,172.00 | | | $ | 4.85 | | | | 0.90 | % |
Hypothetical | | | 1,000.00 | | | | 1,020.33 | | | | 4.51 | | | | 0.90 | |
Class 2 | | | | | | | | | | | | | | | | |
Actual | | | 1,000.00 | | | | 1,170.10 | | | | 6.19 | | | | 1.15 | |
Hypothetical | | | 1,000.00 | | | | 1,019.09 | | | | 5.76 | | | | 1.15 | |
| * | Expenses are equal to each Class’ respective annualized expense ratio, multiplied by the average account value over the period, multiplied by 181/365 (to reflect the one-half year period). |
| | | | | | | | |
| | | |
| JUNE 30, 2013 | | JPMORGAN INSURANCE TRUST | | | | | 23 | |
J.P. Morgan Funds are distributed by JPMorgan Distribution Services, Inc., which is an affiliate of JPMorgan Chase & Co. Affiliates of JPMorgan Chase & Co. receive fees for providing various services to the funds.
Contact JPMorgan Distribution Services, Inc. at 1-800-480-4111 for a portfolio prospectus. You can also visit us at www.jpmorganfunds.com. Investors should carefully consider the investment objectives and risk as well as charges and expenses of the mutual fund before investing. The prospectus contains this and other information about the mutual fund. Read the prospectus carefully before investing.
The Portfolio files a complete schedule of its portfolio holdings for the first and third quarters of its fiscal year with the SEC on Form N-Q. The Portfolio’s Forms N-Q are available on the SEC’s website at http://www.sec.gov and may be reviewed and copied at the SEC’s Public Reference Room in Washington, DC. Information on the operation of the SEC’s Public Reference Room may be obtained by calling 1-800-SEC-0330. Shareholders may request the Form N-Q without charge by calling 1-800-480-4111 or by visiting the variable insurance portfolio section of the J.P. Morgan Funds’ website at www.jpmorganfunds.com.
A description of the Portfolio’s policies and procedures with respect to the disclosure of the Portfolio’s holdings is available in the prospectus and Statement of Additional Information.
A copy of proxy policies and procedures is available without charge upon request by calling 1-800-480-4111 and on the Portfolio’s website at www.jpmorganfunds.com. A description of such policies and procedures is on the SEC’s website at www.sec.gov. The Trustees have delegated the authority to vote proxies for securities owned by the Portfolio to the Advisor. A copy of the Portfolio’s voting record for the most recent 12-month period ended June 30 is available on the SEC’s website at www.sec.gov or at the Portfolio’s website at www.jpmorganfunds.com no later than August 31 of each year. The Portfolio’s proxy voting record will include, among other things, a brief description of the matter voted on for each portfolio security, and will state how each vote was cast, for example, for or against the proposal.
| | | | |
| | © JPMorgan Chase & Co., 2013. All rights reserved. June 2013. | | SAN-JPMITSCCP-613 |
Semi-Annual Report
JPMorgan Insurance Trust
June 30, 2013 (Unaudited)
JPMorgan Insurance Trust U.S. Equity Portfolio
| | | | |
NOT FDIC INSURED Ÿ NO BANK GUARANTEE Ÿ MAY LOSE VALUE
| | |  | |
CONTENTS
Investments in the Portfolio are not bank deposits or obligations of, or guaranteed or endorsed by, any bank and are not insured or guaranteed by the FDIC, the Federal Reserve Board or any other government agency. You could lose money if you sell when the Portfolio’s share price is lower than when you invested.
Past performance is no guarantee of future performance. The general market views expressed in this report are opinions based on market and other conditions through the end of the reporting period and are subject to change without notice. These views are not intended to predict the future performance of the Portfolio or the securities markets. References to specific securities and their issuers are for illustrative purposes only and are not intended to be, and should not be interpreted as, recommendations to purchase or sell such securities. Such views are not meant as investment advice and may not be relied on as an indication of trading intent on behalf of the Portfolio.
This Portfolio is intended to be a funding vehicle for variable annuity contracts and variable life insurance policies (collectively “Policies”) offered by separate accounts of participating insurance companies. Portfolio shares are also offered through qualified pension and retirement plans (“Eligible Plans”). Individuals may not purchase shares directly from the Portfolio.
Prospective investors should refer to the Portfolio’s prospectus for a discussion of the Portfolio’s investment objective, strategies and risks. Call J.P. Morgan Funds Service Center at 1-800-480-4111 for a prospectus containing more complete information about the Portfolio, including management fees and other expenses. Please read it carefully before investing.
CEO’S LETTER
JULY 26, 2013 (Unaudited)
Dear Shareholder:
While somewhat overshadowed by increased volatility at the end of the reporting period, developed market equities in aggregate posted solid returns for the six months ended June 30, 2013. For much of the period, stocks were supported by solid corporate earnings and robust demand from investors looking to generate higher returns in the low interest rate environment. Despite signaling a potential policy shift in June 2013, the U.S. Federal Reserve (“Fed”) continued to pursue its highly accommodative policies in an attempt to lower unemployment and spur the economy. Central banks overseas also did their part to support their economies. The European Central Bank (“ECB”) remained committed to preserving the euro, as it cut rates and introduced new programs designed to aid struggling euro zone members. Elsewhere, the Bank of Japan stepped up its major asset purchase program as a new pro-growth government came into power late in 2012.
| | |
 | | “We are encouraged by the stock market’s resiliency in the face of recent volatility.” |
Positive investor sentiment was temporarily interrupted, however, in May 2013 when Fed Chairman Bernanke indicated that the central bank may begin to “taper” its asset purchase program later this year. This triggered a sharp decline in global equities, although they quickly regained their footing and have continued to rally in July. All told, U.S. stocks rose sharply during the six months ended June 30, 2013. Overseas, international developed stocks produced more modest gains, while emerging market equities performed poorly given concerns regarding China’s economy and falling commodity prices.
U.S. Treasury Yields Rise Sharply
Talk of Fed tapering negatively impacted the fixed income markets. While U.S. Treasury security yields continued to be low
from a historical perspective, they ended the period sharply higher than when the reporting period began. The yield for 10-year U.S. Treasury securities ended June 30, 2013 at 2.52%, while the yields for 2- and 30-year U.S. Treasury securities finished the reporting period at 0.36% and 3.52%, respectively. Amid the rising interest rate environment, the overall U.S. fixed income market generated a negative return for the reporting period. In contrast, high yield bonds posted a modest gain, while emerging market debt securities fell sharply.
Positive Signs for Stocks
Although the global economy is far from robust, it is still on a growth path. The expansion in the U.S. certainly appears to be sustainable and, while Europe remains in a recession, there are indications that its economy may be bottoming. Elsewhere, pro-growth initiatives in Japan have thus far yielded positive results. While growth in China has moderated, we believe the government has the tools at its disposal to avoid a “hard landing.”
We are encouraged by the stock market’s resiliency in the face of recent volatility. In addition, there have been signs that equity market correlations are decreasing, which could create a more favorable environment for active managers. In addition, given the recent sell-off in the bond market, valuations in a number of fixed income sectors have become more attractive.
On behalf of everyone at J.P. Morgan Asset Management, thank you for your continued support. We look forward to managing your investment needs for years to come. Should you have any questions, please visit www.jpmorganfunds.com or contact the J.P. Morgan Funds Service Center at 1-800-480-4111.
Sincerely yours,

George C.W. Gatch
CEO, Global Funds Management
J.P. Morgan Asset Management
| | | | | | | | |
| | | |
| JUNE 30, 2013 | | JPMORGAN INSURANCE TRUST | | | | | 1 | |
JPMorgan Insurance Trust U.S. Equity Portfolio
PORTFOLIO COMMENTARY
SIX MONTHS ENDED JUNE 30, 2013 (Unaudited)
| | | | |
| REPORTING PERIOD RETURN: | |
| Portfolio (Class 1 Shares)* | | | 14.56% | |
| S&P 500 Index | | | 13.82% | |
| |
| Net Assets as of 6/30/2013 | | $ | 83,295,941 | |
INVESTMENT OBJECTIVE**
The JPMorgan Insurance Trust U.S. Equity Portfolio (the “Portfolio”) seeks to provide high total return from a portfolio of selected equity securities.
HOW DID THE MARKET PERFORM?
Despite periods of heightened volatility and a setback in June, the overall U.S. equity market, as measured by the S&P 500 Index (the “Benchmark”), generated strong results for the six months ended June 30, 2013. The Benchmark generated a positive return for each of the first five months of the reporting period. Supporting the market were overall solid corporate profits, improving economic growth and generally robust investor demand. These factors helped the Benchmark to post several all-time highs over the first five months of 2013. The Benchmark then reversed course and declined during the last month of the reporting period. This turnaround was triggered by indications that the U.S. Federal Reserve Board (“Fed”) would begin tapering its monthly purchases of bonds — $85 billion of mortgage-backed securities and Treasury securities — if economic conditions continued to improve. This caused interest rates to move sharply higher and both stock and bond prices fell sharply. However, the Benchmark again rallied in late June, as concerns regarding Fed tapering abated somewhat. All told, the Benchmark finished the six months ended June 30, 2013 with a 13.82% gain. Each of the ten sectors in the Benchmark produced a positive return for the six-month period. The health care and consumer discretionary sectors produced the strongest returns. Materials and information technology were the worst performing sectors.
WHAT WERE THE MAIN DRIVERS OF THE PORTFOLIO’S PERFORMANCE?
The Portfolio (Class 1 Shares) outperformed the Benchmark for the six months ended June 30, 2013. The Portfolio’s stock selection in the pharmaceutical and medical technology and the financial services sectors contributed to relative performance. Detracting from relative performance was the Portfolio’s
stock selection in the systems and network hardware sector and the consumer stable sector.
Individual contributors to relative performance included the Portfolio’s positions in Biogen Idec, Inc., Cisco Systems, Inc. and Vertex Pharmaceuticals Corp. Biogen Idec, Inc., a biotechnology company specializing in drugs for neurological disorders, autoimmune disorders and cancer, received patent protection for a key drug. Shares of Cisco Systems, Inc., a manufacturer of networking equipment, rose due to higher-than- expected earnings during the company’s fiscal third quarter. Vertex Pharmaceuticals Corp. is a biotech/pharmaceutical company specializing in the development of small molecule drugs. Its shares moved sharply higher in April 2013 after announcing positive clinical results for ALS-2200 (VX-135), its drug used in the treatment of hepatitis C.
Individual detractors from relative performance included Walter Energy, Inc., ACE Ltd. and Merck & Co. Inc. Walter Energy, Inc. is a producer and exporter of metallurgical coals. Its shares declined during the reporting period, underscoring the continued deterioration in global met coal fundamentals. ACE Ltd., a global provider of insurance products, reported a sizable drop in operating profit due to losses related to Superstorm Sandy. Merck & Co. Inc., a leading pharmaceutical company, lost patent protection for a key drug and encountered headwinds from both U.S. health care reform and European austerity pricing.
HOW WAS THE PORTFOLIO POSITIONED?
The portfolio managers employed a bottom-up fundamental approach to stock selection, researching companies to determine what they believed to be their underlying value and potential for future earnings growth. As a result of the Portfolio’s bottom-up fundamental approach to stock selection, the Portfolio was overweight versus the Benchmark in the semiconductors and media sectors. The Portfolio was underweight versus the Benchmark in the real estate investment trusts and consumer stable sectors.
| | | | | | |
| | | |
| 2 | | | | JPMORGAN INSURANCE TRUST | | JUNE 30, 2013 |
| | | | | | | | |
| TOP TEN EQUITY HOLDINGS OF THE PORTFOLIO*** | |
| | 1. | | | Johnson & Johnson | | | 3.4 | % |
| | 2. | | | Time Warner, Inc. | | | 3.1 | |
| | 3. | | | Google, Inc., Class A | | | 2.9 | |
| | 4. | | | United Technologies Corp. | | | 2.6 | |
| | 5. | | | Schlumberger Ltd. | | | 2.6 | |
| | 6. | | | Wells Fargo & Co. | | | 2.5 | |
| | 7. | | | Apple, Inc. | | | 2.5 | |
| | 8. | | | Microsoft Corp. | | | 2.0 | |
| | 9. | | | ACE Ltd. | | | 1.8 | |
| | 10. | | | UnitedHealth Group, Inc. | | | 1.8 | |
| | | | |
PORTFOLIO COMPOSITION BY SECTOR*** | |
| Information Technology | | | 19.6 | % |
| Consumer Discretionary | | | 18.1 | |
| Financials | | | 15.1 | |
| Health Care | | | 13.5 | |
| Industrials | | | 10.4 | |
| Energy | | | 10.3 | |
| Consumer Staples | | | 7.1 | |
| Materials | | | 2.2 | |
| Utilities | | | 1.4 | |
| Others (each less than 1.0%) | | | 1.0 | |
| Short-Term Investment | | | 1.3 | |
| * | | The return shown is based on net asset values calculated for shareholder transactions and may differ from the return shown in the financial highlights, which reflects adjustments made to the net asset values in accordance with accounting principles generally accepted in the United States of America. |
| ** | | The advisor seeks to achieve the Portfolio’s objective. There can be no guarantee it will be achieved. |
| *** | | Percentages indicated are based on total investments as of June 30, 2013. The Portfolio’s composition is subject to change. |
| | | | | | | | |
| | | |
| JUNE 30, 2013 | | JPMORGAN INSURANCE TRUST | | | | | 3 | |
JPMorgan Insurance Trust U.S. Equity Portfolio
PORTFOLIO COMMENTARY
SIX MONTHS ENDED JUNE 30, 2013 (Unaudited) (continued)
| | | | | | | | | | | | | | | | | | | | |
AVERAGE ANNUAL TOTAL RETURNS AS OF JUNE 30, 2013 | |
| | | | | |
| | | INCEPTION DATE
OF CLASS | | | 6 MONTH* | | | 1 YEAR | | | 5 YEAR | | | 10 YEAR | |
CLASS 1 SHARES | | | 3/30/95 | | | | 14.56 | % | | | 23.67 | % | | | 8.04 | % | | | 7.59 | % |
CLASS 2 SHARES | | | 8/16/06 | | | | 14.41 | | | | 23.34 | | | | 7.76 | | | | 7.40 | |
TEN YEAR PERFORMANCE (6/30/03 TO 6/30/13)
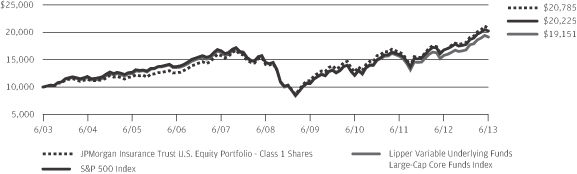
The performance quoted is past performance and is not a guarantee of future results. Mutual funds are subject to certain market risks. Investment returns and principal value of an investment will fluctuate so that an investor’s shares, when redeemed, may be worth more or less than their original cost. Current performance may be higher or lower than the performance data shown. For up-to-date month-end performance information please call 1-800-480-4111. Effective November 1, 2006, the Portfolio’s investment objective and strategies changed. Although past performance is not necessarily an indication of how the Portfolio will perform in the future, in view of these changes, the Portfolio’s performance record prior to this period might be less relevant for investors considering whether to purchase shares of the Portfolio.
Returns for the Class 2 Shares prior to its inception date are based on the performance of Class 1 Shares. The actual returns of Class 2 Shares would have been lower than those shown because Class 2 Shares have higher expenses than Class 1 Shares.
The graph illustrates comparative performance for $10,000 invested in Class 1 Shares of the JPMorgan Insurance Trust U.S. Equity Portfolio, the S&P 500 Index and the Lipper Variable Underlying Funds Large-Cap Core Funds Index from June 30, 2003 to June 30, 2013. The performance of the Portfolio assumes reinvestment of all dividends and capital gain distributions, if any. The performance of the S&P 500 Index does not reflect the deduction of expenses
associated with a mutual fund and has been adjusted to reflect reinvestment of all dividends and capital gain distributions of the securities included in the benchmark, if applicable. The performance of the Lipper Variable Underlying Funds Large-Cap Core Funds Index includes expenses associated with a mutual fund, such as investment management fees. These expenses are not identical to the expenses incurred by the Portfolio. The S&P 500 Index is an unmanaged index generally representative of the performance of large companies in the U.S. stock market. The Lipper Variable Underlying Funds Large-Cap Core Funds Index is an index based on the total returns of certain mutual funds within the Portfolio’s designated category as determined by Lipper, Inc. Investors cannot invest directly in an index.
Portfolio performance does not reflect any charges imposed by the Policies or Eligible Plans. If these charges were included, the returns would be lower than shown. Portfolio performance may reflect the waiver of the Portfolio’s fees and reimbursement of expenses for certain periods since the inception date. Without these waivers and reimbursements, performance would have been lower.
The returns shown are based on net asset values calculated for shareholder transactions and may differ from the returns shown in the financial highlights, which reflect adjustments made to the net asset values in accordance with accounting principles generally accepted in the United States of America.
| | | | | | |
| | | |
| 4 | | | | JPMORGAN INSURANCE TRUST | | JUNE 30, 2013 |
JPMorgan Insurance Trust U.S. Equity Portfolio
SCHEDULE OF PORTFOLIO INVESTMENTS
AS OF JUNE 30, 2013 (Unaudited)
| | | | | | | | |
| SHARES | | | SECURITY DESCRIPTION | | VALUE($) | |
| | | | | | | | |
| Long Positions — 100.0% | |
| | | | Common Stocks — 98.7% | |
| | | | Consumer Discretionary — 18.1% | |
| | | | Auto Components — 1.0% | |
| | 22,581 | | | Johnson Controls, Inc. | | | 808,174 | |
| | | | | | | | |
| | | | Automobiles — 1.6% | |
| | 4,010 | | | Ford Motor Co. | | | 62,035 | |
| | 38,520 | | | General Motors Co. (a) | | | 1,283,101 | |
| | | | | | | | |
| | | | | | | 1,345,136 | |
| | | | | | | | |
| | | | Hotels, Restaurants & Leisure — 1.9% | |
| | 6,590 | | | McDonald’s Corp. | | | 652,410 | |
| | 11,970 | | | Royal Caribbean Cruises Ltd. | | | 399,080 | |
| | 7,602 | | | Yum! Brands, Inc. | | | 527,122 | |
| | | | | | | | |
| | | | | | | 1,578,612 | |
| | | | | | | | |
| | | | Household Durables — 0.7% | |
| | 6,610 | | | Lennar Corp., Class A | | | 238,225 | |
| | 130 | | | NVR, Inc. (a) | | | 119,860 | |
| | 9,960 | | | PulteGroup, Inc. (a) | | | 188,941 | |
| | 1,710 | | | Toll Brothers, Inc. (a) | | | 55,797 | |
| | | | | | | | |
| | | | | | | 602,823 | |
| | | | | | | | |
| | | | Internet & Catalog Retail — 1.7% | |
| | 3,290 | | | Amazon.com, Inc. (a) | | | 913,600 | |
| | 1,790 | | | Expedia, Inc. | | | 107,668 | |
| | 450 | | | priceline.com, Inc. (a) | | | 372,209 | |
| | | | | | | | |
| | | | | | | 1,393,477 | |
| | | | | | | | |
| | | | Media — 5.6% | |
| | 30,960 | | | Comcast Corp., Class A | | | 1,296,605 | |
| | 9,910 | | | DISH Network Corp., Class A | | | 421,373 | |
| | 3,080 | | | Time Warner Cable, Inc. | | | 346,438 | |
| | 44,775 | | | Time Warner, Inc. | | | 2,588,891 | |
| | | | | | | | |
| | | | | | | 4,653,307 | |
| | | | | | | | |
| | | | Multiline Retail — 0.9% | |
| | 1,410 | | | Nordstrom, Inc. | | | 84,516 | |
| | 10,240 | | | Target Corp. | | | 705,126 | |
| | | | | | | | |
| | | | | | | 789,642 | |
| | | | | | | | |
| | | | Specialty Retail — 3.8% | |
| | 1,660 | | | AutoZone, Inc. (a) | | | 703,325 | |
| | 11,400 | | | Home Depot, Inc. (The) | | | 883,158 | |
| | 13,320 | | | Lowe’s Cos., Inc. | | | 544,788 | |
| | 6,670 | | | Ross Stores, Inc. | | | 432,283 | |
| | 11,460 | | | TJX Cos., Inc. | | | 573,688 | |
| | | | | | | | |
| | | | | | | 3,137,242 | |
| | | | | | | | |
| | | | | | | | |
| SHARES | | | SECURITY DESCRIPTION | | VALUE($) | |
| | | | | | | | |
| | |
| | | | Textiles, Apparel & Luxury Goods — 0.9% | |
| | 3,060 | | | Lululemon Athletica, Inc., (Canada) (a) | | | 200,491 | |
| | 3,130 | | | V.F. Corp. | | | 604,278 | |
| | | | | | | | |
| | | | | | | 804,769 | |
| | | | | | | | |
| | | | Total Consumer Discretionary | | | 15,113,182 | |
| | | | | | | | |
| | | | Consumer Staples — 7.1% | |
| | | | Beverages — 2.0% | |
| | 28,010 | | | Coca-Cola Co. (The) | | | 1,123,481 | |
| | 6,760 | | | PepsiCo, Inc. | | | 552,901 | |
| | | | | | | | |
| | | | | | | 1,676,382 | |
| | | | | | | | |
| | | | Food & Staples Retailing — 1.1% | |
| | 15,770 | | | CVS Caremark Corp. | | | 901,729 | |
| | | | | | | | |
| | | | Food Products — 1.5% | |
| | 5,790 | | | Archer-Daniels-Midland Co. | | | 196,339 | |
| | 5,368 | | | General Mills, Inc. | | | 260,509 | |
| | 3,130 | | | Kellogg Co. | | | 201,040 | |
| | 20,669 | | | Mondelez International, Inc., Class A | | | 589,686 | |
| | | | | | | | |
| | | | | | | 1,247,574 | |
| | | | | | | | |
| | | | Household Products — 1.4% | |
| | 4,620 | | | Colgate-Palmolive Co. | | | 264,680 | |
| | 11,637 | | | Procter & Gamble Co. (The) | | | 895,932 | |
| | | | | | | | |
| | | | | | | 1,160,612 | |
| | | | | | | | |
| | | | Tobacco — 1.1% | |
| | 10,370 | | | Philip Morris International, Inc. | | | 898,249 | |
| | | | | | | | |
| | | | Total Consumer Staples | | | 5,884,546 | |
| | | | | | | | |
| | | | Energy — 10.3% | |
| | | | Energy Equipment & Services — 3.5% | |
| | 5,060 | | | Cameron International Corp. (a) | | | 309,470 | |
| | 7,400 | | | Ensco plc, (United Kingdom), Class A | | | 430,088 | |
| | 1,490 | | | National Oilwell Varco, Inc. | | | 102,661 | |
| | 29,678 | | | Schlumberger Ltd. | | | 2,126,725 | |
| | | | | | | | |
| | | | | | | 2,968,944 | |
| | | | | | | | |
| | | | Oil, Gas & Consumable Fuels — 6.8% | |
| | 5,580 | | | Anadarko Petroleum Corp. | | | 479,489 | |
| | 6,870 | | | Apache Corp. | | | 575,912 | |
| | 2,620 | | | Cheniere Energy, Inc. (a) | | | 72,731 | |
| | 8,400 | | | Chevron Corp. | | | 994,056 | |
| | 6,780 | | | ConocoPhillips | | | 410,190 | |
| | 2,140 | | | EOG Resources, Inc. | | | 281,795 | |
| | 12,085 | | | Exxon Mobil Corp. | | | 1,091,880 | |
| | 1,600 | | | Marathon Petroleum Corp. | | | 113,696 | |
| | 8,617 | | | Occidental Petroleum Corp. | | | 768,895 | |
| | 3,750 | | | Peabody Energy Corp. | | | 54,900 | |
SEE NOTES TO FINANCIAL STATEMENTS.
| | | | | | | | |
| | | |
| JUNE 30, 2013 | | JPMORGAN INSURANCE TRUST | | | | | 5 | |
JPMorgan Insurance Trust U.S. Equity Portfolio
SCHEDULE OF PORTFOLIO INVESTMENTS
AS OF JUNE 30, 2013 (Unaudited) (continued)
| | | | | | | | |
| SHARES | | | SECURITY DESCRIPTION | | VALUE($) | |
| | | | | | | | |
| Long Positions — Continued | |
| | | | Oil, Gas & Consumable Fuels — Continued | |
| | 5,990 | | | Phillips 66 | | | 352,871 | |
| | 13,870 | | | Williams Cos., Inc. (The) | | | 450,359 | |
| | | | | | | | |
| | | | | | | 5,646,774 | |
| | | | | | | | |
| | | | Total Energy | | | 8,615,718 | |
| | | | | | | | |
| | | | Financials — 15.0% | |
| | | | Capital Markets — 3.4% | |
| | 4,430 | | | Ameriprise Financial, Inc. | | | 358,299 | |
| | 2,866 | | | Goldman Sachs Group, Inc. (The) | | | 433,483 | |
| | 20,660 | | | Invesco Ltd. | | | 656,988 | |
| | 28,621 | | | Morgan Stanley | | | 699,211 | |
| | 6,140 | | | State Street Corp. | | | 400,389 | |
| | 11,735 | | | TD Ameritrade Holding Corp. | | | 285,043 | |
| | | | | | | | |
| | | | | | | 2,833,413 | |
| | | | | | | | |
| | | | Commercial Banks — 2.8% | |
| | 2,300 | | | BB&T Corp. | | | 77,924 | |
| | 1,913 | | | East West Bancorp, Inc. | | | 52,608 | |
| | 2,800 | | | Huntington Bancshares, Inc. | | | 22,064 | |
| | 860 | | | PNC Financial Services Group, Inc. | | | 62,711 | |
| | 50,753 | | | Wells Fargo & Co. | | | 2,094,576 | |
| | | | | | | | |
| | | | | | | 2,309,883 | |
| | | | | | | | |
| | | | Consumer Finance — 0.8% | |
| | 1,650 | | | American Express Co. | | | 123,354 | |
| | 9,320 | | | Capital One Financial Corp. | | | 585,389 | |
| | | | | | | | |
| | | | | | | 708,743 | |
| | | | | | | | |
| | | | Diversified Financial Services — 4.0% | |
| | 108,659 | | | Bank of America Corp. | | | 1,397,355 | |
| | 26,034 | | | Citigroup, Inc. | | | 1,248,851 | |
| | 478 | | | CME Group, Inc. | | | 36,319 | |
| | 3,640 | | | IntercontinentalExchange, Inc. (a) | | | 647,046 | |
| | | | | | | | |
| | | | | | | 3,329,571 | |
| | | | | | | | |
| | | | Insurance — 3.8% | |
| | 17,188 | | | ACE Ltd., (Switzerland) | | | 1,537,982 | |
| | 1,520 | | | Aflac, Inc. | | | 88,342 | |
| | 4,600 | | | Aon plc, (United Kingdom) | | | 296,010 | |
| | 3,900 | | | Hartford Financial Services Group, Inc. | | | 120,588 | |
| | 22,730 | | | MetLife, Inc. | | | 1,040,125 | |
| | 1,450 | | | Prudential Financial, Inc. | | | 105,894 | |
| | | | | | | | |
| | | | | | | 3,188,941 | |
| | | | | | | | |
| | | | Real Estate Investment Trusts (REITs) — 0.2% | |
| | 1,070 | | | Simon Property Group, Inc. | | | 168,974 | |
| | | | | | | | |
| | | | Total Financials | | | 12,539,525 | |
| | | | | | | | |
| | | | | | | | |
| SHARES | | | SECURITY DESCRIPTION | | VALUE($) | |
| | | | | | | | |
| | | | | | | | |
| | | | Health Care — 13.6% | |
| | | | Biotechnology — 3.2% | |
| | 3,010 | | | Alexion Pharmaceuticals, Inc. (a) | | | 277,642 | |
| | 4,940 | | | Biogen Idec, Inc. (a) | | | 1,063,088 | |
| | 850 | | | BioMarin Pharmaceutical, Inc. (a) | | | 47,422 | |
| | 5,069 | | | Celgene Corp. (a) | | | 592,617 | |
| | 3,640 | | | Onyx Pharmaceuticals, Inc. (a) | | | 396,760 | |
| | 4,070 | | | Vertex Pharmaceuticals, Inc. (a) | | | 325,071 | |
| | | | | | | | |
| | | | | | | 2,702,600 | |
| | | | | | | | |
| | | | Health Care Equipment & Supplies — 1.2% | |
| | 2,860 | | | CareFusion Corp. (a) | | | 105,391 | |
| | 8,186 | | | Covidien plc, (Ireland) | | | 514,408 | |
| | 710 | | | Intuitive Surgical, Inc. (a) | | | 359,672 | |
| | | | | | | | |
| | | | | | | 979,471 | |
| | | | | | | | |
| | | | Health Care Providers & Services — 3.1% | |
| | 6,770 | | | Cardinal Health, Inc. | | | 319,544 | |
| | 3,470 | | | DaVita HealthCare Partners, Inc. (a) | | | 419,176 | |
| | 4,100 | | | Humana, Inc. | | | 345,958 | |
| | 22,620 | | | UnitedHealth Group, Inc. | | | 1,481,158 | |
| | | | | | | | |
| | | | | | | 2,565,836 | |
| | | | | | | | |
| | | | Health Care Technology — 0.2% | |
| | 1,780 | | | Cerner Corp. (a) | | | 171,040 | |
| | | | | | | | |
| | | | Life Sciences Tools & Services — 0.3% | |
| | 1,090 | | | Mettler-Toledo International, Inc. (a) | | | 219,308 | |
| | | | | | | | |
| | | | Pharmaceuticals — 5.6% | |
| | 2,500 | | | Allergan, Inc. | | | 210,600 | |
| | 24,500 | | | Bristol-Myers Squibb Co. | | | 1,094,905 | |
| | 33,210 | | | Johnson & Johnson | | | 2,851,410 | |
| | 10,902 | | | Merck & Co., Inc. | | | 506,398 | |
| | | | | | | | |
| | | | | | | 4,663,313 | |
| | | | | | | | |
| | | | Total Health Care | | | 11,301,568 | |
| | | | | | | | |
| | | | Industrials — 10.4% | |
| | | | Aerospace & Defense — 4.0% | |
| | 15,090 | | | Honeywell International, Inc. | | | 1,197,241 | |
| | 22,965 | | | United Technologies Corp. | | | 2,134,367 | |
| | | | | | | | |
| | | | | | | 3,331,608 | |
| | | | | | | | |
| | | | Airlines — 0.4% | |
| | 13,100 | | | Delta Air Lines, Inc. (a) | | | 245,101 | |
| | 3,160 | | | United Continental Holdings, Inc. (a) | | | 98,876 | |
| | | | | | | | |
| | | | | | | 343,977 | |
| | | | | | | | |
| | | | Building Products — 0.5% | |
| | 20,860 | | | Masco Corp. | | | 406,561 | |
| | | | | | | | |
SEE NOTES TO FINANCIAL STATEMENTS.
| | | | | | |
| | | |
| 6 | | | | JPMORGAN INSURANCE TRUST | | JUNE 30, 2013 |
| | | | | | | | |
| SHARES | | | SECURITY DESCRIPTION | | VALUE($) | |
| | | | | | | | |
| Long Positions — Continued | |
| | | | Commercial Services & Supplies — 0.3% | |
| | 6,910 | | | Tyco International Ltd., (Switzerland) | | | 227,685 | |
| | | | | | | | |
| | | | Construction & Engineering — 1.1% | |
| | 15,720 | | | Fluor Corp. | | | 932,353 | |
| | | | | | | | |
| | | | Electrical Equipment — 0.7% | |
| | 10,488 | | | Emerson Electric Co. | | | 572,016 | |
| | | | | | | | |
| | | | Machinery — 1.4% | |
| | 18,613 | | | PACCAR, Inc. | | | 998,773 | |
| | 2,360 | | | SPX Corp. | | | 169,873 | |
| | | | | | | | |
| | | | | | | 1,168,646 | |
| | | | | | | | |
| | | | Road & Rail — 1.7% | |
| | 34,220 | | | CSX Corp. | | | 793,562 | |
| | 3,930 | | | Norfolk Southern Corp. | | | 285,515 | |
| | 2,580 | | | Union Pacific Corp. | | | 398,042 | |
| | | | | | | | |
| | | | | | | 1,477,119 | |
| | | | | | | | |
| | | | Trading Companies & Distributors — 0.3% | |
| | 960 | | | W.W. Grainger, Inc. | | | 242,093 | |
| | | | | | | | |
| | | | Total Industrials | | | 8,702,058 | |
| | | | | | | | |
| | | | Information Technology — 19.6% | |
| | | | Communications Equipment — 2.5% | |
| | 49,873 | | | Cisco Systems, Inc. | | | 1,212,413 | |
| | 14,774 | | | QUALCOMM, Inc. | | | 902,396 | |
| | | | | | | | |
| | | | | | | 2,114,809 | |
| | | | | | | | |
| | | | Computers & Peripherals — 2.7% | |
| | 5,218 | | | Apple, Inc. | | | 2,066,745 | |
| | 7,840 | | | Hewlett-Packard Co. | | | 194,432 | |
| | | | | | | | |
| | | | | | | 2,261,177 | |
| | | | | | | | |
| | | | Internet Software & Services — 3.8% | |
| | 9,420 | | | eBay, Inc. (a) | | | 487,203 | |
| | 2,782 | | | Google, Inc., Class A (a) | | | 2,449,189 | |
| | 1,380 | | | LinkedIn Corp., Class A (a) | | | 246,054 | |
| | | | | | | | |
| | | | | | | 3,182,446 | |
| | | | | | | | |
| | | | IT Services — 1.6% | |
| | 350 | | | Alliance Data Systems Corp. (a) | | | 63,361 | |
| | 2,230 | | | Cognizant Technology Solutions Corp., Class A (a) | | | 139,620 | |
| | 9,467 | | | Genpact Ltd., (Bermuda) | | | 182,145 | |
| | 330 | | | MasterCard, Inc., Class A | | | 189,585 | |
| | 4,080 | | | Visa, Inc., Class A | | | 745,620 | |
| | | | | | | | |
| | | | | | | 1,320,331 | |
| | | | | | | | |
| | | | | | | | |
| SHARES | | | SECURITY DESCRIPTION | | VALUE($) | |
| | | | | | | | |
| | | | | | | | |
| | | | Semiconductors & Semiconductor Equipment — 5.1% | |
| | 7,130 | | | Altera Corp. | | | 235,219 | |
| | 31,910 | | | Applied Materials, Inc. | | | 475,778 | |
| | 3,123 | | | ASML Holding N.V., (Netherlands) | | | 247,029 | |
| | 29,290 | | | Avago Technologies Ltd., (Singapore) | | | 1,094,860 | |
| | 12,730 | | | Broadcom Corp., Class A | | | 429,765 | |
| | 7,720 | | | Freescale Semiconductor Ltd. (a) | | | 104,606 | |
| | 5,820 | | | KLA-Tencor Corp. | | | 324,349 | |
| | 18,776 | | | Lam Research Corp. (a) | | | 832,528 | |
| | 13,880 | | | ON Semiconductor Corp. (a) | | | 112,150 | |
| | 8,740 | | | Xilinx, Inc. | | | 346,191 | |
| | | | | | | | |
| | | | | | | 4,202,475 | |
| | | | | | | | |
| | | | | | | | |
| | | | Software — 3.9% | |
| | 7,370 | | | Adobe Systems, Inc. (a) | | | 335,777 | |
| | 3,790 | | | Citrix Systems, Inc. (a) | | | 228,651 | |
| | 47,703 | | | Microsoft Corp. | | | 1,647,184 | |
| | 28,990 | | | Oracle Corp. | | | 890,573 | |
| | 1,400 | | | Splunk, Inc. (a) | | | 64,904 | |
| | 1,310 | | | VMware, Inc., Class A (a) | | | 87,757 | |
| | | | | | | | |
| | | | | | | 3,254,846 | |
| | | | | | | | |
| | | | Total Information Technology | | | 16,336,084 | |
| | | | | | | | |
| | | | Materials — 2.2% | |
| | | | Chemicals — 1.8% | |
| | 4,300 | | | Air Products & Chemicals, Inc. | | | 393,751 | |
| | 7,804 | | | Axiall Corp. | | | 332,294 | |
| | 19,580 | | | Dow Chemical Co. (The) | | | 629,889 | |
| | 3,290 | | | Methanex Corp., (Canada) | | | 140,779 | |
| | | | | | | | |
| | | | | | | 1,496,713 | |
| | | | | | | | |
| | | | Containers & Packaging — 0.2% | |
| | 3,790 | | | Crown Holdings, Inc. (a) | | | 155,882 | |
| | | | | | | | |
| | | | Metals & Mining — 0.2% | |
| | 16,923 | | | Alcoa, Inc. | | | 132,338 | |
| | 5,780 | | | Walter Energy, Inc. | | | 60,112 | |
| | | | | | | | |
| | | | | | | 192,450 | |
| | | | | | | | |
| | | | Total Materials | | | 1,845,045 | |
| | | | | | | | |
| | | | Telecommunication Services — 1.0% | |
| | | | Diversified Telecommunication Services — 1.0% | |
| | 15,843 | | | Verizon Communications, Inc. | | | 797,537 | |
| | | | | | | | |
| | | | Utilities — 1.4% | |
| | | | Electric Utilities — 1.0% | |
| | 5,860 | | | Edison International | | | 282,218 | |
| | 6,040 | | | NextEra Energy, Inc. | | | 492,139 | |
SEE NOTES TO FINANCIAL STATEMENTS.
| | | | | | | | |
| | | |
| JUNE 30, 2013 | | JPMORGAN INSURANCE TRUST | | | | | 7 | |
JPMorgan Insurance Trust U.S. Equity Portfolio
SCHEDULE OF PORTFOLIO INVESTMENTS
AS OF JUNE 30, 2013 (Unaudited) (continued)
| | | | | | | | |
| SHARES | | | SECURITY DESCRIPTION | | VALUE($) | |
| | | | | | | | |
| Long Positions — Continued | |
| | | | Electric Utilities — Continued | |
| | 2,820 | | | Xcel Energy, Inc. | | | 79,919 | |
| | | | | | | | |
| | | | | | | 854,276 | |
| | | | | | | | |
| | | | Multi-Utilities — 0.4% | |
| | 3,820 | | | NiSource, Inc. | | | 109,405 | |
| | 2,040 | | | Sempra Energy | | | 166,790 | |
| | | | | | | | |
| | | | | | | 276,195 | |
| | | | | | | | |
| | | | Total Utilities | | | 1,130,471 | |
| | | | | | | | |
| | | | Total Common Stocks
(Cost $69,789,538) | | | 82,265,734 | |
| | | | | | | | |
| | | | | | | | |
| SHARES | | | SECURITY DESCRIPTION | | VALUE($) | |
| Short-Term Investment — 1.3% | |
| | | | Investment Company — 1.3% | | | | |
| | 1,047,185 | | | JPMorgan Liquid Assets Money Market Fund, Institutional Class Shares,
0.030% (b) (l) (m)
(Cost $1,047,185) | | | 1,047,185 | |
| | | | | | | | |
| | | | Total Investments — 100.0%
(Cost $70,836,723) | | | 83,312,919 | |
| | | | Liabilities in Excess of
Other Assets — 0.0% (g) | | | (16,978 | ) |
| | | | | | | | |
| | | | NET ASSETS — 100.0% | | $ | 83,295,941 | |
| | | | | | | | |
| Short Position — 0.0% (g) | |
| Common Stock — 0.0% (g) | |
| | | | Health Care — 0.0% (g) | | | | |
| | | | Pharmaceuticals — 0.0% (g) | | | | |
| | 920 | | | Mallinckrodt plc, (Ireland) (a) † | | | 41,796 | |
| | | | | | | | |
| | | | Total Short Position
(Proceeds $ 39,532) | | $ | 41,796 | |
| | | | | | | | |
Percentages indicated are based on net assets.
| | | | | | | | | | | | | | | | |
| Futures Contracts | |
NUMBER OF
CONTRACTS | | | DESCRIPTION | | EXPIRATION
DATE | | | NOTIONAL VALUE
AT 06/30/13 | | | NET
UNREALIZED
APPRECIATION
(DEPRECIATION) | |
| | | | Long Futures Outstanding | | | | | | | | | | | | |
| | 2 | | | E-mini S&P 500 | | | 09/20/13 | | | $ | 159,930 | | | $ | (24 | ) |
| | | | | | | | | | | | | | | | |
NOTES TO SCHEDULE OF PORTFOLIO INVESTMENTS:
| | |
| (a) | | — Non-income producing security. |
| (b) | | — Investment in affiliate. Money market fund registered under the Investment Company Act of 1940, as amended, and advised by J.P. Morgan Investment Management Inc. |
| (g) | | — Amount rounds to less than 0.1%. |
| (l) | | — The rate shown is the current yield as of June 30, 2013. |
| | |
| (m) | | — All or a portion of this security is reserved and/or pledged with the custodian for current or potential holdings of futures, swaps, options, TBAs, when-issued securities, delayed delivery securities, reverse repurchase agreements, unfunded commitments and/or forward foreign currency exchange contracts. |
| † | | — Short position is the result of the sale of a when issued security from a pending corporate action on Covidien plc. |
SEE NOTES TO FINANCIAL STATEMENTS.
| | | | | | |
| | | |
| 8 | | | | JPMORGAN INSURANCE TRUST | | JUNE 30, 2013 |
STATEMENT OF ASSETS AND LIABILITIES
AS OF JUNE 30, 2013 (Unaudited)
| | | | |
| | |
U.S. Equity
Portfolio | |
ASSETS: | |
Investments in non-affiliates, at value | | $ | 82,265,734 | |
Investments in affiliates, at value | | | 1,047,185 | |
| | | | |
Total investment securities, at value | | | 83,312,919 | |
Deposits at broker for futures contracts | | | 25,000 | |
Receivables: | | | | |
Investment securities sold | | | 560,680 | |
Portfolio shares sold | | | 4,919 | |
Dividends from non-affiliates | | | 71,167 | |
Dividends from affiliates | | | 23 | |
| | | | |
Total Assets | | | 83,974,708 | |
| | | | |
| |
LIABILITIES: | | | | |
Payables: | | | | |
Securities sold short, at value | | | 41,796 | |
Investment securities purchased | | | 480,034 | |
Portfolio shares redeemed | | | 49,274 | |
Variation margin on futures contracts | | | 5,730 | |
Accrued liabilities: | | | | |
Investment advisory fees | | | 38,100 | |
Administration fees | | | 5,843 | |
Distribution fees | | | 809 | |
Custodian and accounting fees | | | 12,426 | |
Other | | | 44,755 | |
| | | | |
Total Liabilities | | | 678,767 | |
| | | | |
Net Assets | | $ | 83,295,941 | |
| | | | |
|
NET ASSETS: | |
Paid-in-Capital | | $ | 89,183,689 | |
Accumulated undistributed net investment income | | | 422,406 | |
Accumulated net realized gains (losses) | | | (18,784,062 | ) |
Net unrealized appreciation (depreciation) | | | 12,473,908 | |
| | | | |
Total Net Assets | | $ | 83,295,941 | |
| | | | |
| |
Net Assets: | | | | |
Class 1 | | $ | 79,479,972 | |
Class 2 | | | 3,815,969 | |
| | | | |
Total | | $ | 83,295,941 | |
| | | | |
| |
Outstanding units of beneficial interest (shares) | | | | |
(unlimited number of shares authorized, no par value): | | | | |
Class 1 | | | 3,982,616 | |
Class 2 | | | 192,424 | |
| |
Net Asset Value, offering and redemption price per share (a): | | | | |
Class 1 | | $ | 19.96 | |
Class 2 | | | 19.83 | |
| | | | |
| |
Cost of investments in non-affiliates | | $ | 69,789,538 | |
Cost of investments in affiliates | | | 1,047,185 | |
Proceeds received from securities sold short | | | 39,532 | |
| (a) | Per share amounts may not recalculate due to rounding of net assets and/or shares outstanding. |
SEE NOTES TO FINANCIAL STATEMENTS.
| | | | | | | | |
| | | |
| JUNE 30, 2013 | | JPMORGAN INSURANCE TRUST | | | | | 9 | |
STATEMENT OF OPERATIONS
FOR THE SIX MONTHS ENDED JUNE 30, 2013 (Unaudited)
| | | | |
| | |
U.S. Equity
Portfolio | |
INVESTMENT INCOME: | |
Dividend income from non-affiliates | | $ | 756,670 | |
Dividend income from affiliates | | | 326 | |
| | | | |
Total investment income | | | 756,996 | |
| | | | |
| |
EXPENSES: | | | | |
Investment advisory fees | | | 226,937 | |
Administration fees | | | 34,790 | |
Distribution fees – Class 2 | | | 3,948 | |
Custodian and accounting fees | | | 27,332 | |
Professional fees | | | 24,554 | |
Trustees’ and Chief Compliance Officer’s fees | | | 466 | |
Printing and mailing costs | | | 11,130 | |
Transfer agent fees | | | 3,405 | |
Other | | | 6,413 | |
| | | | |
Total expenses | | | 338,975 | |
| | | | |
Less amounts waived | | | (6,003 | ) |
| | | | |
Net expenses | | | 332,972 | |
| | | | |
Net investment income (loss) | | | 424,024 | |
| | | | |
| |
REALIZED/UNREALIZED GAINS (LOSSES): | | | | |
Net realized gain (loss) on transactions from: | | | | |
Investments in non-affiliates | | | 6,770,197 | |
Futures | | | (256 | ) |
| | | | |
Net realized gains (losses) | | | 6,769,941 | |
| | | | |
Change in net unrealized appreciation/depreciation of: | | | | |
Investments in non-affiliates | | | 4,035,838 | |
Futures | | | (24 | ) |
Securities sold short | | | (2,264 | ) |
| | | | |
Change in net unrealized appreciation/depreciation | | | 4,033,550 | |
| | | | |
Net realized/unrealized gains (losses) | | | 10,803,491 | |
| | | | |
Change in net assets resulting from operations | | $ | 11,227,515 | |
| | | | |
SEE NOTES TO FINANCIAL STATEMENTS.
| | | | | | |
| | | |
| 10 | | | | JPMORGAN INSURANCE TRUST | | JUNE 30, 2013 |
STATEMENTS OF CHANGES IN NET ASSETS
FOR THE PERIODS INDICATED
| | | | | | | | |
| | | U.S. Equity Portfolio | |
| | | Six Months Ended
6/30/2013
(Unaudited) | | | Year Ended
12/31/2012 | |
CHANGE IN NET ASSETS RESULTING FROM OPERATIONS: | |
Net investment income (loss) | | $ | 424,024 | | | $ | 1,105,544 | |
Net realized gain (loss) | | | 6,769,941 | | | | 6,884,767 | |
Change in net unrealized appreciation/depreciation | | | 4,033,550 | | | | 4,991,571 | |
| | | | | | | | |
Change in net assets resulting from operations | | | 11,227,515 | | | | 12,981,882 | |
| | | | | | | | |
| | |
DISTRIBUTIONS TO SHAREHOLDERS: | | | | | | | | |
Class 1 | | | | | | | | |
From net investment income | | | (1,052,526 | ) | | | (1,180,771 | ) |
Class 2 | | | | | | | | |
From net investment income | | | (48,143 | ) | | | (6,619 | ) |
| | | | | | | | |
Total distributions to shareholders | | | (1,100,669 | ) | | | (1,187,390 | ) |
| | | | | | | | |
| | |
CAPITAL TRANSACTIONS: | | | | | | | | |
Change in net assets resulting from capital transactions | | | (3,974,556 | ) | | | (12,575,245 | ) |
| | | | | | | | |
| | |
NET ASSETS: | | | | | | | | |
Change in net assets | | | 6,152,290 | | | | (780,753 | ) |
Beginning of period | | | 77,143,651 | | | | 77,924,404 | |
| | | | | | | | |
End of period | | $ | 83,295,941 | | | $ | 77,143,651 | |
| | | | | | | | |
Accumulated undistributed net investment income | | $ | 422,406 | | | $ | 1,099,051 | |
| | | | | | | | |
| | |
CAPITAL TRANSACTIONS: | | | | | | | | |
Class 1 | | | | | | | | |
Proceeds from shares issued | | $ | 1,095,453 | | | $ | 4,403,061 | |
Distributions reinvested | | | 1,052,526 | | | | 1,180,771 | |
Cost of shares redeemed | | | (8,387,580 | ) | | | (19,321,461 | ) |
| | | | | | | | |
Change in net assets resulting from Class 1 capital transactions | | $ | (6,239,601 | ) | | $ | (13,737,629 | ) |
| | | | | | | | |
Class 2 | | | | | | | | |
Proceeds from shares issued | | $ | 2,961,378 | | | $ | 2,637,685 | |
Distributions reinvested | | | 48,143 | | | | 6,619 | |
Cost of shares redeemed | | | (744,476 | ) | | | (1,481,920 | ) |
| | | | | | | | |
Change in net assets resulting from Class 2 capital transactions | | $ | 2,265,045 | | | $ | 1,162,384 | |
| | | | | | | | |
Total change in net assets resulting from capital transactions | | $ | (3,974,556 | ) | | $ | (12,575,245 | ) |
| | | | | | | | |
| | |
SHARE TRANSACTIONS: | | | | | | | | |
Class 1 | | | | | | | | |
Issued | | | 57,075 | | | | 266,533 | |
Reinvested | | | 54,705 | | | | 71,389 | |
Redeemed | | | (434,255 | ) | | | (1,146,973 | ) |
| | | | | | | | |
Change in Class 1 Shares | | | (322,475 | ) | | | (809,051 | ) |
| | | | | | | | |
Class 2 | | | | | | | | |
Issued | | | 156,984 | | | | 152,326 | |
Reinvested | | | 2,517 | | | | 401 | |
Redeemed | | | (37,936 | ) | | | (86,904 | ) |
| | | | | | | | |
Change in Class 2 Shares | | | 121,565 | | | | 65,823 | |
| | | | | | | | |
SEE NOTES TO FINANCIAL STATEMENTS.
| | | | | | | | |
| | | |
| JUNE 30, 2013 | | JPMORGAN INSURANCE TRUST | | | | | 11 | |
FINANCIAL HIGHLIGHTS
FOR THE PERIODS INDICATED
| | | | | | | | | | | | | | | | | | | | | | | | | | | | |
| | | | | | Per share operating performance | |
| | | | | | Investment operations | | | Distributions | |
| | | Net asset
value,
beginning
of period | | | Net
investment
income
(loss) | | | Net realized
and unrealized
gains
(losses) on
investments | | | Total from
investment
operations | | | Net
investment
income | | | Net
realized
gain | | | Total
distributions | |
U.S. Equity Portfolio | | | | | | | | | | | | | | | | | | | | | | | | | | | | |
Class 1 | | | | | | | | | | | | | | | | | | | | | | | | | | | | |
Six Months Ended June 30, 2013 (Unaudited) | | $ | 17.63 | | | $ | 0.10 | (f) | | $ | 2.49 | | | $ | 2.59 | | | $ | (0.26 | ) | | $ | — | | | $ | (0.26 | ) |
Year Ended December 31, 2012 | | | 15.22 | | | | 0.23 | (f) | | | 2.43 | | | | 2.66 | | | | (0.25 | ) | | | — | | | | (0.25 | ) |
Year Ended December 31, 2011 | | | 15.69 | | | | 0.18 | (f) | | | (0.46 | ) | | | (0.28 | ) | | | (0.19 | ) | | | — | | | | (0.19 | ) |
Year Ended December 31, 2010 | | | 13.93 | | | | 0.16 | (f) | | | 1.73 | | | | 1.89 | | | | (0.13 | ) | | | — | | | | (0.13 | ) |
Year Ended December 31, 2009 | | | 10.74 | | | | 0.19 | | | | 3.32 | | | | 3.51 | | | | (0.32 | ) | | | — | | | | (0.32 | ) |
Year Ended December 31, 2008 | | | 18.34 | | | | 0.22 | (f) | | | (6.12 | ) | | | (5.90 | ) | | | (0.18 | ) | | | (1.52 | ) | | | (1.70 | ) |
| | | | | | | |
Class 2 | | | | | | | | | | | | | | | | | | | | | | | | | | | | |
Six Months Ended June 30, 2013 (Unaudited) | | | 17.54 | | | | 0.08 | (f) | | | 2.46 | | | | 2.54 | | | | (0.25 | ) | | | — | | | | (0.25 | ) |
Year Ended December 31, 2012 | | | 15.18 | | | | 0.22 | (f) | | | 2.39 | | | | 2.61 | | | | (0.25 | ) | | | — | | | | (0.25 | ) |
Year Ended December 31, 2011 | | | 15.65 | | | | 0.14 | (f) | | | (0.46 | ) | | | (0.32 | ) | | | (0.15 | ) | | | — | | | | (0.15 | ) |
Year Ended December 31, 2010 | | | 13.91 | | | | 0.12 | (f) | | | 1.72 | | | | 1.84 | | | | (0.10 | ) | | | — | | | | (0.10 | ) |
Year Ended December 31, 2009 | | | 10.71 | | | | 0.13 | | | | 3.35 | | | | 3.48 | | | | (0.28 | ) | | | — | | | | (0.28 | ) |
Year Ended December 31, 2008 | | | 18.28 | | | | 0.19 | (f) | | | (6.11 | ) | | | (5.92 | ) | | | (0.13 | ) | | | (1.52 | ) | | | (1.65 | ) |
| (a) | Annualized for periods less than one year. |
| (b) | Not annualized for periods less than one year. |
| (c) | Includes adjustments in accordance with accounting principles generally accepted in the United States of America and as such, the net asset values for financial reporting purposes and the returns based upon those net asset values may differ from the net asset values and returns for shareholder transactions. |
| (d) | Includes earning credits and interest expense, if applicable, each of which is less than 0.01% unless otherwise noted. |
| (e) | Portfolio turnover is calculated by dividing the lesser of total purchases or sales of portfolio securities for the reporting period by the monthly average value of portfolio securities owned during the reporting period. Excluded from both the numerator and denominator are amounts relating to derivatives and securities whose maturities or expiration dates at the time of acquisition were one year or less. |
| (f) | Calculated based upon average shares outstanding. |
SEE NOTES TO FINANCIAL STATEMENTS.
| | | | | | |
| | | |
| 12 | | | | JPMORGAN INSURANCE TRUST | | JUNE 30, 2013 |
| | | | | | | | | | | | | | | | | | | | | | | | | | |
| | | Ratios/Supplemental data | |
| | | | | | | | | | Ratios to average net assets (a) | | | | |
Net asset
value,
end of
period | | | Total return (b)(c) | | | Net assets,
end of
period | | | Net
expenses (d) | | | Net
investment
income
(loss) | | |
Expenses
without waivers,
reimbursements and
earnings credits | | | Portfolio
turnover
rate (b)(e) | |
| | | | | | | | | | | | | | | | | | | | | | | | | | |
| | | | | | | | | | | | | | | | | | | | | | | | | | |
| $ | 19.96 | | | | 14.74 | % | | $ | 79,479,972 | | | | 0.80 | % | | | 1.03 | % | | | 0.81 | % | | | 44 | % |
| | 17.63 | | | | 17.58 | | | | 75,900,979 | | | | 0.79 | | | | 1.40 | | | | 0.81 | | | | 71 | |
| | 15.22 | | | | (1.87 | ) | | | 77,847,972 | | | | 0.79 | | | | 1.15 | | | | 0.79 | | | | 70 | |
| | 15.69 | | | | 13.58 | | | | 132,548,805 | | | | 0.79 | | | | 1.10 | | | | 0.82 | | | | 75 | |
| | 13.93 | | | | 33.68 | | | | 150,671,602 | | | | 0.80 | | | | 1.45 | | | | 0.91 | | | | 88 | |
| | 10.74 | | | | (34.80 | ) | | | 123,301,034 | | | | 0.76 | | | | 1.50 | | | | 0.78 | | | | 93 | |
| | | | | | |
| | | | | | | | | | | | | | | | | | | | | | | | | | |
| | 19.83 | | | | 14.53 | | | | 3,815,969 | | | | 1.00 | | | | 0.88 | | | | 1.06 | | | | 44 | |
| | 17.54 | | | | 17.28 | | | | 1,242,672 | | | | 1.01 | | | | 1.27 | | | | 1.05 | | | | 71 | |
| | 15.18 | | | | (2.09 | ) | | | 76,432 | | | | 1.04 | | | | 0.94 | | | | 1.05 | | | | 70 | |
| | 15.65 | | | | 13.28 | | | | 18,015 | | | | 1.04 | | | | 0.86 | | | | 1.07 | | | | 75 | |
| | 13.91 | | | | 33.34 | | | | 15,902 | | | | 1.05 | | | | 1.21 | | | | 1.17 | | | | 88 | |
| | 10.71 | | | | (34.94 | ) | | | 11,930 | | | | 1.01 | | | | 1.30 | | | | 1.04 | | | | 93 | |
SEE NOTES TO FINANCIAL STATEMENTS.
| | | | | | | | |
| | | |
| JUNE 30, 2013 | | JPMORGAN INSURANCE TRUST | | | | | 13 | |
NOTES TO FINANCIAL STATEMENTS
AS OF JUNE 30, 2013 (Unaudited)
1. Organization
JPMorgan Insurance Trust (the “Trust”) is registered under the Investment Company Act of 1940, as amended (the “1940 Act”), as an open-end management investment company and is a Massachusetts business trust.
The following is a separate Portfolio of the Trust (the “Portfolio”) covered by this report:
| | | | |
| | | Classes Offered | | Diversified/Non-Diversified |
| U.S. Equity Portfolio | | Class 1 and Class 2 | | Diversified |
The investment objective of the Portfolio is to seek to provide high total return from a portfolio of selected equity securities.
Portfolio shares are offered only to separate accounts of participating insurance companies and Eligible Plans. Individuals may not purchase shares directly from the Portfolio.
All classes of shares have equal rights as to earnings, assets and voting privileges, except that each class may bear different distribution and service fees and each class has exclusive voting rights with respect to its distribution plan and administrative services plan.
2. Significant Accounting Policies
The following is a summary of significant accounting policies followed by the Portfolio in the preparation of its financial statements. The policies are in accordance with accounting principles generally accepted in the United States of America (“GAAP”). The preparation of financial statements requires management to make estimates and assumptions that affect the reported amounts and disclosures in the financial statements. Actual results could differ from those estimates.
A. Valuation of Investments — Equity securities listed on a North American, Central American, South American or Caribbean securities exchange shall generally be valued at the last sale price on the exchange on which the security is principally traded that is reported before the time when the net assets of the Portfolio are valued. Securities listed on the NASDAQ Stock Market LLC are generally valued at the NASDAQ Official Closing Price. Generally, short-term investments of sufficient credit quality maturing in less than 61 days are valued at amortized cost, which approximates fair value. Investments in other open-end investment companies are valued at each investment company’s net asset value per share (“NAV”) as of the report date.
Certain investments of the Portfolio may, depending upon market conditions, trade in relatively thin markets and/or in markets that experience significant volatility. As a result of these conditions, the prices used by the Portfolio to value these securities may differ from the value that would be realized if these securities were sold, and the differences could be material. Futures and options are generally valued on the basis of available market quotations. Swaps and other derivatives are valued daily, primarily using independent or affiliated pricing services approved by the Board of Trustees. If valuations are not available from such services or values received are deemed not representative of fair value, values will be obtained from a third party broker-dealer or counterparty.
Securities or other assets for which market quotations are not readily available or for which market quotations are deemed to not represent the fair value of the security or asset at the time of pricing (including certain illiquid securities) are fair valued in accordance with procedures established by and under the supervision and responsibility of the Board of Trustees. The Board of Trustees has established an Audit and Valuation Committee to assist with the oversight of the valuation of the Portfolio’s securities. JPMorgan Funds Management, Inc. (the “Administrator”, or “JPMFM”), an indirect, wholly-owned subsidiary of JPMorgan Chase & Co. (“JPMorgan”), has established a Valuation Committee (“VC”) that is comprised of senior representatives from JPMFM, J.P. Morgan Investment Management Inc. (“JPMIM” or the “Advisor”), a wholly-owned subsidiary of JPMorgan Asset Management Holdings Inc. (“JPMAM”), which is a wholly-owned subsidiary of JPMorgan, JPMorgan’s Legal and Compliance and JPMAM’s Risk Management and the Portfolio’s Chief Compliance Officer. The VC’s responsibilities include making determinations regarding Level 3 fair value measurements (“Fair Values”) and/or providing recommendations for approval to the Board of Trustees’ Audit and Valuation Committee, in accordance with the Portfolio’s valuation policies.
The VC or Board of Trustees, as applicable, primarily employs a market-based approach which may use related or comparable assets or liabilities, recent transactions, market multiples, book values, and other relevant information for the investment to determine the fair value of the investment. The VC or Board of Trustees may also use an income-based valuation approach in which the anticipated future cash flows of the investment are discounted to calculate fair value. Discounts may also be applied due to the nature or duration of any restrictions on the disposition of the investments. Valuations may be based upon current market prices of securities that are comparable in coupon, rating, maturity and industry.
It is possible that the estimated values may differ significantly from the values that would have been used had a ready market for the investments existed, and such differences could be material. JPMFM and JPMIM are responsible for monitoring developments that may impact Fair Values and for discussing and assessing Fair Values on an ongoing, and at least a quarterly, basis with the VC and Board of Trustees, as applicable. The appropriateness of Fair Values is assessed based on results of unchanged price review and consideration of macro or security specific events, back testing and broker and vendor due diligence.
Valuations reflected in this report are as of the report date. As a result, changes in valuation due to market events and/or issuer related events after the report date and prior to issuance of the report, are not reflected herein.
| | | | | | |
| | | |
| 14 | | | | JPMORGAN INSURANCE TRUST | | JUNE 30, 2013 |
The various inputs that are used in determining the fair value of the Portfolio’s investments are summarized into the three broad levels listed below.
| Ÿ | | Level 1 — quoted prices in active markets for identical securities |
| Ÿ | | Level 2 — other significant observable inputs (including quoted prices for similar securities, interest rates, prepayment speeds, credit risk, etc.) |
| Ÿ | | Level 3 — significant unobservable inputs (including the Portfolio’s own assumptions in determining the fair value of investments) |
A financial instrument’s level within the fair value hierarchy is based on the lowest level of any input, both individually and in the aggregate, that is significant to the fair value measurement. The inputs or methodology used for valuing securities are not necessarily an indication of the risk associated with investing in those securities.
The following table represents each valuation input as presented on the Schedule of Portfolio Investments (“SOI”):
| | | | | | | | | | | | | | | | |
| | | Level 1
Quoted prices | | | Level 2
Other significant
observable inputs | | | Level 3
Significant
unobservable inputs | | | Total | |
Total Investments in Securities (a) | | $ | 83,312,919 | | | $ | — | | | $ | — | | | $ | 83,312,919 | |
| | | | | | | | | | | | | | | | |
Total Liabilities in Securities Sold Short (a) | | $ | (41,796 | ) | | $ | — | | | $ | — | | | $ | (41,796 | ) |
| | | | | | | | | | | | | | | | |
Depreciation in Other Financial Instruments | | | | | | | | | | | | | | | | |
Futures Contracts | | $ | (24 | ) | | $ | — | | | $ | — | | | $ | (24 | ) |
| | | | | | | | | | | | | | | | |
| (a) | All Portfolio holdings designated as Level 1 are disclosed individually on the SOI. Please refer to the SOI for industry specifics of portfolio holdings. |
There were no transfers between any levels during the six months ended June 30, 2013.
B. Futures Contracts — The Portfolio uses index futures contracts to gain or reduce exposure to the stock market, maintain liquidity and minimize transaction costs. The Portfolio also buys futures contracts to immediately invest incoming cash in the market or sells futures in response to cash outflows, thereby simulating an invested position in the underlying index while maintaining a cash balance for liquidity. The use of futures contracts exposes the Portfolio to equity price risk.
Futures contracts provide for the delayed delivery of the underlying instrument at a fixed price or are settled for a cash amount based on the change in the value of the underlying instrument at a specific date in the future. Upon entering into a futures contract, the Portfolio is required to deposit with the broker, cash or securities in an amount equal to a certain percentage of the contract amount, which is referred to as the initial margin deposit. Subsequent payments, referred to as variation margin, are made or received by the Portfolio periodically and are based on changes in the market value of open futures contracts. Changes in the market value of open futures contracts are recorded as unrealized appreciation or depreciation in the Statement of Operations. Realized gains or losses, representing the difference between the value of the contract at the time it was opened and the value at the time it was closed, are reported in the Statement of Operations at the closing or expiration of the futures contract. Securities deposited as initial margin are designated in the SOI and cash deposited is recorded on the Statement of Assets and Liabilities. A receivable from and/or a payable to brokers for the daily variation margin is also recorded on the Statement of Assets and Liabilities.
The Portfolio may be subject to the risk that the change in the value of the futures contract may not correlate perfectly with the underlying instrument. Use of long futures contracts subjects the Portfolio to risk of loss in excess of the amounts shown on the Statement of Assets and Liabilities, up to the notional amount of the futures contracts. Use of short futures contracts subjects the Portfolio to unlimited risk of loss. The Portfolio may enter into futures contracts only on exchanges or boards of trade. The exchange or board of trade acts as the counterparty to each futures transaction; therefore, the Portfolio’s credit risk is limited to failure of the exchange or board of trade. Under some circumstances, futures exchanges may establish daily limits on the amount that the price of a futures contract can vary from the previous day’s settlement price, which could effectively prevent liquidation of positions.
The table below discloses the volume of the Portfolio’s futures contracts activity during the six months ended June 30, 2013:
| | | | |
Futures Contracts: | | | | |
Average Notional Balance Long | | $ | 179,400 | |
Ending Notional Balance Long | | | 159,930 | |
C. Security Transactions and Investment Income — Investment transactions are accounted for on the trade date (the date the order to buy or sell is executed). Securities gains and losses are calculated on a specifically identified cost basis. Interest income is determined on the basis of coupon interest accrued using the effective interest method which adjusts for amortization of premiums and accretion of discounts. Dividend income, net of foreign taxes withheld, if any, is recorded on the ex-dividend date or when the Portfolio first learns of the dividend.
D. Allocation of Income and Expenses — Expenses directly attributable to a portfolio are charged directly to that portfolio, while the expenses attributable to more than one portfolio of the Trust are allocated among the respective portfolios. In calculating the NAV of each class, investment income, realized and unrealized gains and losses and expenses, other than class specific expenses, are allocated daily to each class of shares based upon the proportion of net assets of each class at the beginning of each day.
| | | | | | | | |
| | | |
| JUNE 30, 2013 | | JPMORGAN INSURANCE TRUST | | | | | 15 | |
NOTES TO FINANCIAL STATEMENTS
AS OF JUNE 30, 2013 (Unaudited) (continued)
E. Federal Income Taxes — The Portfolio is treated as a separate taxable entity for Federal income tax purposes. The Portfolio’s policy is to comply with the provisions of the Internal Revenue Code of 1986, as amended (the “Code”), applicable to regulated investment companies and to distribute to shareholders all of its distributable net investment income and net realized gain on investments. Accordingly, no provision for Federal income tax is necessary. The Portfolio is also a segregated portfolio of assets for insurance purposes and intends to comply with the diversification requirements of Subchapter L of the Code. Management has reviewed the Portfolio’s tax positions for all open tax years and has determined that as of June 30, 2013, no liability for income tax is required in the Portfolio’s financial statements for net unrecognized tax benefits. However, management’s conclusions may be subject to future review based on changes in, or the interpretation of, the accounting standards or tax laws and regulations. The Portfolio’s Federal tax returns for the prior three fiscal years remain subject to examination by the Internal Revenue Service.
F. Distributions to Shareholders — Distributions from net investment income are generally declared and paid at least annually and are declared separately for each class. No class has preferential dividend rights; differences in per share rates are due to differences in separate class expenses. Net realized capital gains, if any, are distributed at least annually. The amount of distributions from net investment income and net realized capital gains is determined in accordance with Federal income tax regulations, which may differ from GAAP. To the extent these “book/tax” differences are permanent in nature (i.e., that they result from other than timing of recognition — “temporary differences”), such amounts are reclassified within the capital accounts based on their Federal tax-basis treatment.
3. Fees and Other Transactions with Affiliates
A. Investment Advisory Fee — Pursuant to the Investment Advisory Agreement, JPMIM supervises the investments of the Portfolio and for such services is paid a fee. The fee is accrued daily and paid monthly based on the Portfolio’s average daily net assets at an annual rate of 0.55%.
B. Administration Fee — Pursuant to an Administration Agreement, the Administrator provides certain administration services to the Portfolio. In consideration of these services, the Administrator receives a fee accrued daily and paid monthly at an annual rate of 0.15% of the first $25 billion of the average daily net assets of all funds in the J.P. Morgan Funds Complex (excluding certain funds of funds and money market funds) and 0.075% of the average daily net assets in excess of $25 billion of all such funds. For the six months ended June 30, 2013, the annualized effective rate was 0.08% of the Portfolio’s average daily net assets, notwithstanding any fee waivers and/or expense reimbursements.
JPMorgan Chase Bank, N.A. (“JPMCB”), a wholly-owned subsidiary of JPMorgan, serves as the Portfolio’s sub-administrator (the “Sub-administrator”). For its services as Sub-administrator, JPMCB receives a portion of the fees payable to the Administrator.
The Administrator waived Administration fees as outlined in Note 3.E.
C. Distribution Fees — Pursuant to a Distribution Agreement, JPMorgan Distribution Services, Inc. (the “Distributor”), a wholly-owned subsidiary of JPMorgan, serves as the Trust’s exclusive underwriter and promotes and arranges for the sale of the Portfolio’s shares.
The Board of Trustees has adopted a Distribution Plan (the “Distribution Plan”) for Class 2 Shares of the Portfolio in accordance with Rule 12b-1 under the 1940 Act. The Distribution Plan provides that the Portfolio shall pay distribution fees, including payments to the Distributor, at an annual rate of 0.25% of the average daily net assets of Class 2 Shares.
D. Custodian and Accounting Fees — JPMCB provides portfolio custody and accounting services to the Portfolio. The amounts paid directly to JPMCB by the Portfolio for custody and accounting services are included in Custodian and accounting fees in the Statement of Operations. Payments to the custodian may be reduced by credits earned by the Portfolio, based on uninvested cash balances held by the custodian. Such earnings credits, if any, are presented separately in the Statement of Operations.
Interest expense, if any, paid to the custodian related to cash overdrafts is included in Interest expense to affiliates in the Statement of Operations.
E. Waivers and Reimbursements — The Advisor, Administrator and Distributor (for Class 2 Shares) have contractually agreed to waive fees and/or reimburse the Portfolio to the extent that total annual operating expenses (excluding acquired fund fees and expenses, dividend expenses related to short sales, interest, taxes, expenses related to litigation and potential litigation, extraordinary expenses and expenses related to the Board of Trustees’ deferred compensation plan) exceed the percentages of the Portfolio’s respective average daily net assets as shown in the table below:
| | | | | | |
| | | Class 1 | | Class 2 | |
| | 0.80% | | | 1.05 | % |
The expense limitation agreement was in effect for the six months ended June 30, 2013. The contractual expense limitation percentages in the table above are in place until at least April 30, 2014.
For the six months ended June 30, 2013, the Advisor contractually waived fees for the Portfolio in the amount of $5,048. The Advisor does not expect the Portfolio to repay any such waived fees in future years. Additionally, the Portfolio may invest in one or more money market funds advised by the Advisor or its affiliates. The Advisor, Administrator and the Distributor waive fees in an amount sufficient to offset the respective fees each charges to the affiliated money market fund on the Portfolio’s investment in such affiliated money market fund. A portion of the waiver is voluntary.
The amount of waivers resulting from investments in these money market funds for the six months ended June 30, 2013 was $955.
F. Other — Certain officers of the Trust are affiliated with the Advisor, the Administrator and the Distributor. Such officers, with the exception of the Chief Compliance Officer, receive no compensation from the Portfolio for serving in their respective roles.
| | | | | | |
| | | |
| 16 | | | | JPMORGAN INSURANCE TRUST | | JUNE 30, 2013 |
The Board of Trustees appointed a Chief Compliance Officer to the Portfolio in accordance with Federal securities regulations. The Portfolio, along with other affiliated portfolios, makes reimbursement payments, on a pro-rata basis, to the Administrator for a portion of the fees associated with the Office of the Chief Compliance Officer. Such fees are included in Trustees’ and Chief Compliance Officer’s fees in the Statement of Operations.
The Trust adopted a Trustee Deferred Compensation Plan (the “Plan”) which allows the Independent Trustees to defer the receipt of all or a portion of compensation related to performance of their duties as Trustees. The deferred fees are invested in various J.P. Morgan Funds until distribution in accordance with the Plan.
During the six months ended June 30, 2013, the Portfolio may have purchased securities from an underwriting syndicate in which the principal underwriter or members of the syndicate are affiliated with the Advisor.
The Portfolio may use related party broker-dealers. For the six months ended June 30, 2013, the Portfolio did not incur any brokerage commissions with broker-dealers affiliated with the Advisor.
The Securities and Exchange Commission has granted an exemptive order permitting the Portfolio to engage in principal transactions with J.P. Morgan Securities, Inc., an affiliated broker, involving taxable money market instruments, subject to certain conditions.
4. Investment Transactions
During the six months ended June 30, 2013, purchases and sales of investments (excluding short-term investments) were as follows:
| | | | | | |
| | | Purchases
(excluding U.S.
Government) | | Sales
(excluding U.S.
Government) | |
| | $36,038,324 | | $ | 41,017,314 | |
During the six months ended June 30, 2013, there were no purchases or sales of U.S. Government securities.
5. Federal Income Tax Matters
For Federal income tax purposes, the cost and unrealized appreciation (depreciation) in value of investment securities held at June 30, 2013 were as follows:
| | | | | | | | | | | | | | | | |
| | | Aggregate
Cost | | | Gross
Unrealized
Appreciation | | | Gross
Unrealized
Depreciation | | | Net Unrealized
Appreciation
(Depreciation) | |
| | $ | 70,836,723 | | | $ | 12,937,626 | | | $ | 461,430 | | | $ | 12,476,196 | |
Under the Regulated Investment Company Modernization Act of 2010 (the “Act”), net capital losses recognized by the Portfolio after December 31, 2010 may get carried forward indefinitely, and retain their character as short-term and/or long-term losses. Prior to the Act, net capital losses incurred by the Portfolio were carried forward for eight years and treated as short-term losses. The Act requires that post-enactment net capital losses be used before pre-enactment net capital losses.
At December 31, 2012, the Portfolio did not have any post-enactment net capital loss carryforwards.
At December 31, 2012, the Portfolio had pre-enactment net capital loss carryforwards, expiring during the years indicated, which are available to offset future realized gains:
| | | | | | | | | | | | |
| | | 2016 | | | 2017 | | | Total | |
| | $ | 1,187,063 | * | | $ | 21,218,972 | | | $ | 22,406,035 | |
| * | This amount includes $1,187,063 of capital loss carryforwards from business combinations, which may be limited in future years under the Internal Revenue Code Sections 381-384. |
6. Borrowings
The Trust and JPMCB have entered into a financing arrangement. Under this arrangement, JPMCB provides an unsecured, uncommitted credit facility in the aggregate amount of $100 million to certain of the J.P. Morgan Funds, including the Portfolio. Advances under the arrangement are taken primarily for temporary or emergency purposes, including the meeting of redemption requests that otherwise might require the untimely disposition of securities, and are subject to the Portfolio’s borrowing restrictions. Interest on borrowings is payable at a rate determined by JPMCB at the time of borrowing. This agreement has been extended until November 11, 2013.
The Portfolio had no borrowings outstanding from the unsecured, uncommitted credit facility at June 30, 2013, or at any time during the six months then ended.
Interest expense paid, if any, as a result of borrowings from the unsecured, uncommitted credit facility is included in Interest expense to affiliates in the Statement of Operations.
| | | | | | | | |
| | | |
| JUNE 30, 2013 | | JPMORGAN INSURANCE TRUST | | | | | 17 | |
NOTES TO FINANCIAL STATEMENTS
AS OF JUNE 30, 2013 (Unaudited) (continued)
7. Risks, Concentrations and Indemnifications
In the normal course of business, the Portfolio enters into contracts that contain a variety of representations which provide general indemnifications. The Portfolio’s maximum exposure under these arrangements is unknown. The amount of exposure would depend on future claims that may be made against the Portfolio that have not yet occurred. However, based on experience, the Portfolio expects the risk of loss to be remote.
The Portfolio has several shareholders holding a significant percentage of shares outstanding. Investment activities of these shareholders could have a material impact on the Portfolio.
| | | | | | |
| | | |
| 18 | | | | JPMORGAN INSURANCE TRUST | | JUNE 30, 2013 |
SCHEDULE OF SHAREHOLDER EXPENSES
(Unaudited)
Hypothetical $1,000 Investment
As a shareholder of the Portfolio, you incur ongoing costs, including investment advisory fees, administration fees, distribution fees (for Class 2 Shares) and other Portfolio expenses. Because the Portfolio is a funding vehicle for Policies and Eligible Plans, you may also incur sales charges and other fees relating to the Policies or Eligible Plans. The examples below are intended to help you understand your ongoing costs (in dollars) of investing in the Portfolio, but not the costs of the Policies or Eligible Plans, and to compare these ongoing costs with the ongoing costs of investing in other mutual funds. The examples assume that you had a $1,000 investment in each Class at the beginning of the reporting period, January 1, 2013, and continued to hold your shares at the end of the reporting period, June 30, 2013.
Actual Expenses
For each Class of the Portfolio in the table below, the first line provides information about actual account values and actual expenses. You may use the information in this line, together with the amount you invested, to estimate the expenses that you paid over the period. Simply divide your account value by $1,000 (for example, an $8,600 account value divided by $1,000 = 8.6), then multiply the result by the number in the first line of each Class under the heading entitled “Expenses Paid During the Period” to estimate the expenses you paid on your account during this period.
Hypothetical Example for Comparison Purposes
The second line of each Class in the table below provides information about hypothetical account values and hypothetical expenses based on the Class’ actual expense ratio and an assumed rate of return of 5% per year before expenses, which is not the Class’ actual return. The hypothetical account values and expenses may not be used to estimate the actual ending account balance or expenses you paid for the period. You may use this information to compare the ongoing costs of investing in the Class of the Portfolio and other portfolios. To do so, compare this 5% hypothetical example with the 5% hypothetical examples that appear in the shareholder reports of the other funds. Please note that the expenses shown in the table are meant to highlight your ongoing costs only and do not reflect any transaction costs, such as sales charges (loads) or redemption fees or the costs associated with the Policies and Eligible Plans through which the Portfolio is held. Therefore, the second line for each Class in the table is useful in comparing ongoing costs only, and will not help you determine the relative total costs of owning different portfolios. In addition, if these transaction costs were included, your costs would have been higher. The examples also assume all dividends and distributions have been reinvested.
| | | | | | | | | | | | | | | | |
| | | Beginning
Account Value,
January 1, 2013 | | | Ending
Account Value
June 30, 2013 | | | Expenses
Paid During
the Period* | | | Annualized
Expense
Ratio | |
U.S. Equity Portfolio | | | | | | | | | | | | | | | | |
Class 1 | | | | | | | | | | | | | | | | |
Actual | | $ | 1,000.00 | | | $ | 1,147.40 | | | $ | 4.26 | | | | 0.80 | % |
Hypothetical | | | 1,000.00 | | | | 1,020.83 | | | | 4.01 | | | | 0.80 | |
Class 2 | | | | | | | | | | | | | | | | |
Actual | | | 1,000.00 | | | | 1,145.30 | | | | 5.32 | | | | 1.00 | |
Hypothetical | | | 1,000.00 | | | | 1,019.84 | | | | 5.01 | | | | 1.00 | |
| * | Expenses are equal to each Class’ respective annualized expense ratio, multiplied by the average account value over the period, multiplied by 181/365 (to reflect the one-half year period). |
| | | | | | | | |
| | | |
| JUNE 30, 2013 | | JPMORGAN INSURANCE TRUST | | | | | 19 | |
J.P. Morgan Funds are distributed by JPMorgan Distribution Services, Inc., which is an affiliate of JPMorgan Chase & Co. Affiliates of JPMorgan Chase & Co. receive fees for providing various services to the funds.
Contact JPMorgan Distribution Services, Inc. at 1-800-480-4111 for a portfolio prospectus. You can also visit us at www.jpmorganfunds.com. Investors should carefully consider the investment objectives and risk as well as charges and expenses of the mutual fund before investing. The prospectus contains this and other information about the mutual fund. Read the prospectus carefully before investing.
The Portfolio files a complete schedule of its portfolio holdings for the first and third quarters of its fiscal year with the SEC on Form N-Q. The Portfolio’s Forms N-Q are available on the SEC’s website at http://www.sec.gov and may be reviewed and copied at the SEC’s Public Reference Room in Washington, DC. Information on the operation of the SEC’s Public Reference Room may be obtained by calling 1-800-SEC-0330. Shareholders may request the Form N-Q without charge by calling 1-800-480-4111 or by visiting the variable insurance portfolio section of the J.P. Morgan Funds’ website at www.jpmorganfunds.com.
A description of the Portfolio’s policies and procedures with respect to the disclosure of the Portfolio’s holdings is available in the prospectus and Statement of Additional Information.
A copy of proxy policies and procedures is available without charge upon request by calling 1-800-480-4111 and on the Portfolio’s website at www.jpmorganfunds.com. A description of such policies and procedures is on the SEC’s website at www.sec.gov. The Trustees have delegated the authority to vote proxies for securities owned by the Portfolio to the Advisor. A copy of the Portfolio’s voting record for the most recent 12-month period ended June 30 is available on the SEC’s website at www.sec.gov or at the Portfolio’s website at www.jpmorganfunds.com no later than August 31 of each year. The Portfolio’s proxy voting record will include, among other things, a brief description of the matter voted on for each portfolio security, and will state how each vote was cast, for example, for or against the proposal.
| | | | |
| | © JPMorgan Chase & Co., 2013. All rights reserved. June 2013. | | SAN-JPMITUSEP-613 |
ITEM 2. CODE OF ETHICS.
Disclose whether, as of the end of the period covered by the report, the registrant has adopted a code of ethics that applies to the registrant’s principal executive officer, principal financial officer, principal accounting officer or controller, or persons performing similar functions, regardless of whether these individuals are employed by the registrant or a third party. If the registrant has not adopted such a code of ethics, explain why it has not done so.
The registrant must briefly describe the nature of any amendment, during the period covered by the report, to a provision of its code of ethics that applies to the registrant’s principal executive officer, principal financial officer, principal accounting officer or controller, or persons performing similar functions, regardless of whether these individuals are employed by the registrant or a third party, and that relates to any element of the code of ethics definition enumerated in paragraph (b) of this Item. The registrant must file a copy of any such amendment as an exhibit pursuant to Item 12(a)(1), unless the registrant has elected to satisfy paragraph (f) of this Item by positing its code of ethics on its website pursuant to paragraph (f)(2) of this Item, or by undertaking to provide its code of ethics to any person without charge, upon request, pursuant to paragraph (f)(3) of this Item.
If the registrant has, during the period covered by the report, granted a waiver, including an implicit waiver, from a provision of the code of ethics that applies to the registrant’s principal executive officer, principal financial officer, principal accounting officer or controller, or persons performing similar functions, regardless of whether these individuals are employed by the registrant or third party, that relates to one or more items set forth in paragraph (b) of this Item, the registrant must briefly describe the nature of the waiver, the name of the person to whom the waiver was granted, and the date of the waiver.
Not applicable to a semi-annual report.
ITEM 3. AUDIT COMMITTEE FINANCIAL EXPERT.
(a) (1) Disclose that the registrant’s board of directors has determined that the registrant either:
(i) Has at least one audit committee financial expert serving on its audit committee; or
(ii) Does not have an audit committee financial expert serving on its audit committee.
(2) If the registrant provides the disclosure required by paragraph (a)(1)(i) of this Item, it must disclose the name of the audit committee financial expert and whether that person is “independent.” In order to be considered “independent” for purposes of this Item, a member of an audit committee may not, other than in his or her capacity as a member of the audit committee, the board of directors, or any other board committee:
(i) Accept directly or indirectly any consulting, advisory, or other compensatory fee from the issuer; or
(ii) Be an “interested person” of the investment company as defined in Section 2(a)(19) of the Act (15 U.S.C. 80a-2(a)(19)).
(3) If the registrant provides the disclosure required by paragraph (a)(1)(ii) of this Item, it must explain why it does not have an audit committee financial expert.
Not applicable to a semi-annual report.
ITEM 4. PRINCIPAL ACCOUNTANT FEES AND SERVICES.
(a) Disclose, under the caption Audit Fees, the aggregate fees billed for each of the last two fiscal years for professional services rendered by the principal accountant for the audit of the registrant’s annual financial statements or services that are normally provided by the accountant in connection with statutory and regulatory filings or engagements for those fiscal years.
(b) Disclose, under the caption Audit-Related Fees, the aggregate fees billed in each of the last two fiscal years for assurance and related services by the principal accountant that are reasonably related to the performance of the audit of the registrant’s financial statements and are not reported under paragraph (a) of this Item. Registrants shall describe the nature of the services comprising the fees disclosed under this category.
(c) Disclose, under the caption Tax Fees, the aggregate fees billed in each of the last two fiscal years for professional services rendered by the principal accountant for tax compliance, tax advice, and tax planning. Registrants shall describe the nature of the services comprising the fees disclosed under this category.
(d) Disclose, under the caption All Other Fees, the aggregate fees billed in each of the last two fiscal years for products and services provided by the principal accountant, other than the services reported in paragraphs (a) through (c) of this Item. Registrants shall describe the nature of the services comprising the fees disclosed under this category.
(e) (1) Disclose the audit committee’s pre-approval policies and procedures described in paragraph (c)(7) of Rule 2-01 of Regulation S-X.
(2) Disclose the percentage of services described in each of paragraphs (b) through (d) of this Item that were approved by the audit committee pursuant to paragraph (c)(7)(i)(C) of Rule 2-01 of Regulation S-X.
(f) If greater than 50 percent, disclose the percentage of hours expended on the principal accountant’s engagement to audit the registrant’s financial statements for the most recent fiscal year that were attributed to work performed by persons other than the principal accountant’s full-time, permanent employees.
(g) Disclose the aggregate non-audit fees billed by the registrant’s accountant for services rendered to the registrant, and rendered to the registrant’s investment adviser (not including any sub-adviser whose role is primarily portfolio management and is subcontracted with or overseen by another investment adviser), and any entity controlling, controlled by, or under common control with the adviser that provides ongoing services to the registrant for each of the last two fiscal years of the registrant.
(h) Disclose whether the registrant’s audit committee of the board of directors has considered whether the provision of non-audit services that were rendered to the registrant’s investment adviser (not including any subadviser whose role is primarily portfolio management and is subcontracted with or overseen by another investment adviser), and any entity controlling, controlled by, or under common control with the investment adviser that provides ongoing services to the registrant that were not pre-approved pursuant to paragraph (c)(7)(ii) of Rule 2-01 of Regulation S-X is compatible with maintaining the principal accountant’s independence.
Not applicable to a semi-annual report.
ITEM 5. AUDIT COMMITTEE OF LISTED REGISTRANTS.
(a) If the registrant is a listed issuer as defined in Rule 10A-3 under the Exchange Act (17CFR 240.10A-3), state whether or not the registrant has a separately-designated standing audit committee established in accordance with Section 3(a)(58)(A) of the Exchange Act (15 U.S.C. 78c(a)(58)(A)). If the registrant has such a committee, however designated, identify each committee member. If the entire board of directors is acting as the registrant’s audit committee as specified in Section 3(a)(58)(B) of the Exchange Act (15 U.S.C. 78c(a)(58)(B)), so state.
(b) If applicable, provide the disclosure required by Rule 10A-3(d) under the Exchange Act (17CFR 240.10A-3(d)) regarding an exemption from the listing standards for all audit committees.
Not applicable to a semi-annual report.
ITEM 6. SCHEDULE OF INVESTMENTS.
File Schedule I – Investments in securities of unaffiliated issuers as of the close of the reporting period as set forth in Section 210.12-12 of Regulation S-X, unless the schedule is included as part of the report to shareholders filed under Item 1 of this Form.
Included in Item 1.
ITEM 7. DISCLOSURE OF PROXY VOTING POLICIES AND PROCEDURES FOR CLOSED-END MANAGEMENT INVESTMENT COMPANIES.
A closed-end management investment company that is filing an annual report on this Form N-CSR must, unless it invests exclusively in non-voting securities, describe the policies and procedures that it uses to determine how to vote proxies relating to portfolio securities, including the procedures that the company uses when a vote presents a conflict between the interests of its shareholders, on the one hand, and those of the company’s investment adviser; principal underwriter; or any affiliated person (as defined in Section 2(a)(3) of the Investment Company Act of 1940 (15 U.S.C. 80a-2(a)(3)) and the rules thereunder) of the company, its investment adviser, or its principal underwriter, on the other. Include any policies and procedures of the company’s investment adviser, or any other third party, that the company uses, or that are used on the company’s behalf, to determine how to vote proxies relating to portfolio securities.
Not applicable.
ITEM 8. PORTFOLIO MANAGERS OF CLOSED-END MANAGEMENT INVESTMENT COMPANIES.
Not applicable.
ITEM 9. PURCHASE OF EQUITY SECURITIES BY CLOSED-END MANAGEMENT INVESTMENT COMPANY AND AFFILIATED PURCHASERS.
(a) If the registrant is a closed-end management investment company, provide the information specified in paragraph (b) of this Item with respect to any purchase made by or on behalf of the registrant or any “affiliated purchaser,” as defined in Rule 10b-18(a)(3) under the Exchange Act (17 CFR 240.10b-18(a)(3)), of shares or other units of any class of the registrant’s equity securities that is registered by the registrant pursuant to Section 12 of the Exchange Act (15 U.S.C. 781).
Not applicable.
ITEM 10. SUBMISSION OF MATTERS TO A VOTE OF SECURITY HOLDERS.
Describe any material changes to the procedures by which shareholders may recommend nominees to the registrant’s board of directors, where those changes were implemented after the registrant last provided disclosure in response to the requirements of Item 7(d)(2)(ii)(G) of Schedule 14A (17 CFR 240.14a-101), or this Item.
No material changes to report.
ITEM 11. CONTROLS AND PROCEDURES.
(a) Disclose the conclusions of the registrant’s principal executive and principal financial officers, or persons performing similar functions, regarding the effectiveness of the registrant’s disclosure controls and procedures (as defined in Rule 30a-3(c) under the Act (17 CFR 270.30a-3(c))) as of a date within 90 days of the filing date of the report that includes the disclosure required by this paragraph, based on the evaluation of these controls and procedures required by Rule 30a-3(b) under the Act (17 CFR 270.30a-3(b)) and Rules 13a-15(b) or 15d-15(b) under the Exchange Act (17 CFR 240.13a-15(b) or 240.15d-15(b)).
The Registrant’s principal executive and principal financial officers have concluded, based on their evaluation of the Registrant’s disclosure controls and procedures as of a date within 90 days of the filing date of this report, that the Registrant’s disclosure controls and procedures are reasonably designed to ensure that information required to be disclosed by the Registrant on Form N-CSR is recorded, processed, summarized and reported within the required time periods and that information required to be disclosed by the Registrant in the reports that it files or submits on Form N-CSR is accumulated and communicated to the Registrant’s management, including its principal executive and principal financial officers, as appropriate to allow timely decisions regarding required disclosure.
(b) Disclose any change in the registrant’s internal control over financial reporting (as defined in Rule 30a-3(d) under the Act (17 CFR 270.30a-3(d)) that occurred during the registrant’s second fiscal quarter of the period covered by this report that has materially affected, or is reasonably likely to materially affect, the registrant’s internal control over financial reporting.
There were no changes in the Registrant’s internal control over financial reporting that occurred during the last fiscal quarter covered by this report that have materially affected, or are reasonably likely to materially affect, the Registrant’s internal control over financial reporting.
ITEM 12. EXHIBITS.
(a) File the exhibits listed below as part of this Form. Letter or number the exhibits in the sequence indicated.
(a)(1) Any code of ethics, or amendment thereto, that is the subject of the disclosure required by Item 2, to the extent that the registrant intends to satisfy the Item 2 requirements through filing of an exhibit.
Not applicable.
(a)(2) A separate certification for each principal executive officer and principal financial officer of the registrant as required by Rule 30a-2(a) under the Act (17 CFR 270.30a-2).
Certifications pursuant to Rule 30a-2(a) under the Investment Company Act of 1940 are attached hereto.
(a)(3) Any written solicitation to purchase securities under Rule 23c-1 under the Act (17 CFR 270.23c-1) sent or given during the period covered by the report by or on behalf of the registrant to 10 or more persons.
Not applicable.
(b) A separate or combined certification for each principal executive officer and principal officer of the registrant as required by Rule 30a-2(b) under the Act of 1940.
Certifications pursuant to Rule 30a-2(b) under the Investment Company Act of 1940 are attached hereto.
SIGNATURES
Pursuant to the requirements of the Securities Exchange Act of 1934 and the Investment Company Act of 1940, the registrant has duly caused this report to be signed on its behalf by the undersigned, thereunto duly authorized.
| | |
| JPMorgan Insurance Trust |
| |
| By: | | /s/ Patricia A. Maleski |
| | Patricia A. Maleski |
| | President and Principal Executive Officer |
| | August 23, 2013 |
Pursuant to the requirements of the Securities Exchange Act of 1934 and the Investment Company Act of 1940, this report has been signed below by the following persons on behalf of the registrant and in the capacities and on the dates indicated.
| | |
| By: | | /s/ Patricia A. Maleski |
| | Patricia A. Maleski |
| | President and Principal Executive Officer |
| | August 23, 2013 |
| |
| By: | | /s/ Joy C. Dowd |
| | Joy C. Dowd |
| | Treasurer and Principal Financial Officer |
| | August 23, 2013 |