UNITED STATES
SECURITIES AND EXCHANGE COMMISSION
Washington, D.C. 20549
FORM N-CSR
CERTIFIED SHAREHOLDER REPORT OF REGISTERED
MANAGEMENT INVESTMENT COMPANIES
Investment Company Act file number: 811-07874
JPMorgan Insurance Trust
(Exact name of registrant as specified in charter)
270 Park Avenue
New York, NY 10017
(Address of principal executive offices) (Zip code)
Frank J. Nasta
270 Park Avenue
New York, NY 10017
(Name and Address of Agent for Service)
Registrant’s telephone number, including area code: (800) 480-4111
Date of fiscal year end: December 31
Date of reporting period: January 1, 2017 through June 30, 2017
Form N-CSR is to be used by management investment companies to file reports with the Commission not later than 10 days after the transmission to stockholders of any report that is required to be transmitted to stockholders under Rule 30e-1 under the Investment Company Act of 1940 (17 CFR 270.30e-1). The Commission may use the information provided on Form N-CSR in its regulatory, disclosure review, inspection, and policymaking roles.
A registrant is required to disclose the information specified by Form N-CSR, and the Commission will make this information public. A registrant is not required to respond to the collection of information contained in Form N-CSR unless the Form displays a currently valid Office of Management and Budget (“OMB”) control number. Please direct comments concerning the accuracy of the information collection burden estimate and any suggestions for reducing the burden to Secretary, Securities and Exchange Commission, 450 Fifth Street, NW, Washington, DC 20549-0609. The OMB has reviewed this collection of information under the clearance requirements of 44 U.S.C. Section 3507.
ITEM 1. REPORTS TO STOCKHOLDERS.
The following is a copy of the report transmitted to shareholders pursuant to Rule 30e-1 under the Investment Company Act of 1940 (17 CFR 270.30e-1).
Semi-Annual Report
JPMorgan Insurance Trust
June 30, 2017 (Unaudited)
JPMorgan Insurance Trust Core Bond Portfolio
| | | | |
NOT FDIC INSURED • NO BANK GUARANTEE • MAY LOSE VALUE
| | |  | |
CONTENTS
Investments in the Portfolio are not deposits or obligations of, or guaranteed or endorsed by, any bank and are not insured or guaranteed by the FDIC, the Federal Reserve Board or any other government agency. You could lose money if you sell when the Portfolio’s share price is lower than when you invested.
Past performance is no guarantee of future performance. The general market views expressed in this report are opinions based on market and other conditions through the end of the reporting period and are subject to change without notice. These views are not intended to predict the future performance of the Portfolio or the securities markets. References to specific securities and their issuers are for illustrative purposes only and are not intended to be, and should not be interpreted as, recommendations to purchase or sell such securities. Such views are not meant as investment advice and may not be relied on as an indication of trading intent on behalf of the Portfolio.
This Portfolio is intended to be a funding vehicle for variable annuity contracts and variable life insurance policies (collectively “Policies”) offered by the separate accounts of various insurance companies. Portfolio shares may also be offered to qualified pension and retirement plans and accounts permitting accumulation of assets on a tax-deferred basis (“Eligible Plans”). Individuals may not purchase shares directly from the Portfolio.
Prospective investors should refer to the Portfolio’s prospectus for a discussion of the Portfolio’s investment objective, strategies and risks. Call J.P. Morgan Funds Service Center at 1-800-480-4111 for a prospectus containing more complete information about the Portfolio, including management fees and other expenses. Please read it carefully before investing.
CEO’S LETTER
August 4, 2017 (Unaudited)
Dear Shareholder,
As the U.S. economic expansion entered its eighth year in 2017, growth in both developed and emerging market economies became increasingly synchronized even as U.S. growth cooled in the early part of the year. Amid an environment of economic growth, low inflation and rising corporate earnings, global financial markets overall produced positive returns.
| | |
 | | “In the U.S., the continued economic expansion, muted inflation, corporate earnings growth and historically low volatility in financial markets helped to drive key equity market indexes to multiple record closing highs throughout the first half of 2017.” — George C.W. Gatch |
While U.S. gross domestic product (GDP) growth slowed to 1.2% in the first quarter of 2017, it rebounded to 2.6% growth in the second quarter of 2017 on the back of a surge in consumer spending. Meanwhile, the U.S. jobless rate continued to shrink and fell to 4.4% in June 2017 from 4.8% six months earlier. In response to these numbers, along with nascent signs of price inflation, the U.S. Federal Reserve (the “Fed”) raised interest rates in June 2017 and signaled it would raise rates once more before the end of the year. Fed Chairwoman Janet Yellen also indicated she was prepared to begin partially unwinding the central bank’s $4.5 trillion balance sheet of assets purchased through its quantitative easing program.
Despite the apparent health of the U.S. economy, by mid-2017 domestic price inflation was below the Fed’s target of 2% growth and wage growth remained below economists’ expectations, the latter despite an environment of essentially full employment for U.S. workers. These trends — and the Fed’s acknowledgment of them — provided some near-term uncertainty about the central bank’s commitment to tightening monetary policy.
Throughout the first half of 2017, global energy prices continued to fall amid an oversupply of crude oil and natural gas. Despite efforts by the Organization of Petroleum Exporting
Countries to curb global production, the price of a barrel of benchmark West Texas Intermediate crude oil dropped to $46 by the end of June 2017.
Meanwhile, the leading economies of the European Union (the “EU”) continued to strengthen. Annualized GDP for the 19 core EU nations rose 1.9% in the first quarter of 2017 and 2.1% in the second quarter. The June 2017 aggregate unemployment rate for those nations fell to 9.1%, the lowest level since March 2009. Also, in separate elections, voters in the Netherlands and France largely rejected populist campaigns espousing policies to limit free trade and immigration. The election results provided another boost to global equity prices.
In the U.S., the continued economic expansion, muted inflation, corporate earnings growth and historically low volatility in financial markets helped to drive key equity market indexes to multiple record closing highs throughout the first half of 2017. U.S. investors appeared to shrug off intermittent political and policy dramas emanating from Washington, D.C. and extended the run-up in U.S. equity prices into its eighth consecutive year — one of the longest on record. For the six months ended June 30, 2017, the Standard & Poor’s 500 Index returned 9.34%.
U.S. and foreign financial markets largely rewarded those investors who remained fully invested throughout the first half of 2017, reaffirming the fundamental virtues of patience and diversification within a prudent investment strategy.
We look forward to managing your investment needs for years to come. Should you have any questions, please visit www.jpmorganfunds.com or contact the J.P. Morgan Funds Service Center at 1-800-480-4111.
Sincerely yours,

George C.W. Gatch
CEO, Global Funds Management & Institutional,
J.P. Morgan Asset Management
| | | | | | | | |
| | | |
| JUNE 30, 2017 | | JPMORGAN INSURANCE TRUST | | | | | 1 | |
JPMorgan Insurance Trust Core Bond Portfolio
PORTFOLIO COMMENTARY
SIX MONTHS ENDED JUNE 30, 2017 (Unaudited)
| | | | |
| REPORTING PERIOD RETURN: | |
| Portfolio (Class 1 Shares)* | | | 2.34% | |
| Bloomberg Barclays U.S. Aggregate Index | | | 2.27% | |
| |
| Net Assets as of 6/30/2017 | | | $267,462,584 | |
| Duration as of 6/30/2017 | | | 5.8 years | |
INVESTMENT OBJECTIVE**
The JPMorgan Insurance Trust Core Bond Portfolio (the “Portfolio”) seeks to maximize total return by investing primarily in a diversified portfolio of intermediate- and long-term debt securities.
HOW DID THE MARKET PERFORM?
While emerging market bonds and high-yield U.S. bonds (also known as “junk bonds”) generally provided positive returns, investment grade corporate bonds and U.S. Treasury bonds underperformed equity securities amid investor expectations for rising interest rates in the U.S.
While the U.S. Federal Reserve raised benchmark interest rates by 0.25 points at its June 2017 meeting, the central bank also acknowledged a slowdown in price inflation in the second quarter of 2017. Bond yields, which generally move in the opposite direction of bond prices, rose on two-year U.S. Treasury bonds and fell on 10-year and 30-year Treasury bonds during the six month reporting period. For the six months ended June 30, 2017, the Bloomberg Barclays U.S. Aggregate Index returned 2.27%.
WHAT WERE THE MAIN DRIVERS OF THE PORTFOLIO’S PERFORMANCE?
The Portfolio’s Class 1 shares outperformed the Bloomberg Barclays U.S. Aggregate Index (the “Benchmark”) for the six months ended June 30, 2017. Relative to the Benchmark, the Portfolio’s underweight allocation to U.S. Treasury bonds and its overweight allocation to non-agency mortgages, asset-backed securities, commercial mortgage-backed securities and corporate bonds made a positive contribution to performance.
The Portfolio’s duration and yield curve positioning detracted from relative performance during the reporting period. Compared with the Benchmark, the Portfolio was overweight in the 5-10 year portion of the yield curve and underweight in the 20-plus year portion of the yield curve. Duration measures the price sensitivity of a bond or a portfolio of bonds to relative changes in interest rates. Generally, bonds with longer duration will experience a larger change in price as interest rates rise or fall. The yield curve shows the relationship between yields and maturity dates for a set of similar bonds.
HOW WAS THE PORTFOLIO POSITIONED?
The Portfolio’s primary strategy was to focus on security selection and relative value, which seeks to identify undervalued bonds among individual securities and across market sectors. The Portfolio managers used bottom-up fundamental research to construct what they believed to be a portfolio of undervalued fixed income securities. Portfolio construction is strategic in nature, so sector allocation changes should be gradual and a function of relative value.
Relative to the Benchmark, the Portfolio was underweight in U.S. Treasury securities and corporate credit debt and overweight in securitized debt sectors, including asset-backed, commercial-backed and mortgage-backed securities, which include both agency and non-agency debt. The Portfolio was overweight in the intermediate part of the yield curve (5 to 10 year maturities). The Portfolio maintained a shorter duration posture versus the Benchmark during the six month reporting period.
| | | | |
PORTFOLIO COMPOSITION*** | |
| Corporate Bonds | | | 25.6 | % |
| U.S. Treasury Obligations | | | 22.8 | |
| Collateralized Mortgage Obligations | | | 14.1 | |
| Mortgage-Backed Securities | | | 13.7 | |
| Asset-Backed Securities | | | 11.3 | |
| U.S. Government Agency Securities | | | 9.2 | |
| Commercial Mortgage-Backed Securities | | | 2.4 | |
| Others (each less than 1.0%) | | | 0.5 | |
| Short-Term Investment | | | 0.4 | |
| * | | The return shown is based on net asset values calculated for shareholder transactions and may differ from the return shown in the financial highlights, which reflects adjustments made to the net asset values in accordance with accounting principles generally accepted in the United States of America. |
| ** | | The adviser seeks to achieve the Portfolio’s objective. There can be no guarantee it will be achieved. |
| *** | | Percentages indicated are based on total investments as of June 30, 2017. The Portfolio’s composition is subject to change. |
| | | | | | |
| | | |
| 2 | | | | JPMORGAN INSURANCE TRUST | | JUNE 30, 2017 |
JPMorgan Insurance Trust Core Bond Portfolio
PORTFOLIO COMMENTARY
SIX MONTHS ENDED JUNE 30, 2017 (Unaudited) (continued)
| | | | | | | | | | | | | | | | | | |
AVERAGE ANNUAL TOTAL RETURNS AS OF JUNE 30, 2017 | |
| | | | | |
| | | INCEPTION DATE OF
CLASS | | 6 MONTH* | | | 1 YEAR | | | 5 YEAR | | | 10 YEAR | |
CLASS 1 SHARES | | May 1, 1997 | | | 2.34 | % | | | (0.41 | )% | | | 2.22 | % | | | 4.69 | % |
CLASS 2 SHARES | | August 16, 2006 | | | 2.25 | | | | (0.71 | ) | | | 1.98 | | | | 4.43 | |
TEN YEAR PERFORMANCE (6/30/07 TO 6/30/17)
The performance quoted is past performance and is not a guarantee of future results. Mutual funds are subject to certain market risks. Investment returns and principal value of an investment will fluctuate so that an investor’s shares, when redeemed, may be worth more or less than their original cost. Current performance may be higher or lower than the performance data shown. For up-to-date month-end performance information please call 1-800-480-4111.
The graph illustrates comparative performance for $10,000 invested in Class 1 Shares of the JPMorgan Insurance Trust Core Bond Portfolio, the Bloomberg Barclays U.S. Aggregate Index and the Lipper Variable Underlying Funds Core Bond Funds Index from June 30, 2007 to June 30, 2017. The performance of the Portfolio assumes reinvestment of all dividends and capital gain distributions, if any. The performance of the Bloomberg Barclays U.S. Aggregate Index does not reflect the deduction of expenses associated with a mutual fund and has been adjusted to reflect reinvestment of all dividends and capital gain distributions of the securities included in the benchmark, if applicable. The performance of the Lipper Variable Underlying Funds Core Bond Funds Index includes expenses associated with a mutual fund, such as investment management fees. These
expenses are not identical to the expenses incurred by the Portfolio. The Bloomberg Barclays U.S. Aggregate Index is an unmanaged index that represents securities that are SEC-registered, taxable, and dollar denominated. The index covers the U.S. investment grade fixed rate bond market, with index components for government and corporate securities, mortgage pass-through securities, and asset-backed securities. The Lipper Variable Underlying Funds Core Bond Funds Index is an index based on the total returns of certain mutual funds within the Portfolio’s designated category as determined by Lipper, Inc. Investors cannot invest directly in an index.
Portfolio performance does not reflect any charges imposed by the Policies or Eligible Plans. If these charges were included, the returns would be lower than shown. Portfolio performance may reflect the waiver of the Portfolio’s fees and reimbursement of expenses for certain periods since the inception date. Without these waivers and reimbursements, performance would have been lower. The returns shown are based on net asset values calculated for shareholder transactions and may differ from the returns shown in the financial highlights, which reflect adjustments made to the net asset values in accordance with accounting principles generally accepted in the United States of America.
| | | | | | | | |
| | | |
| JUNE 30, 2017 | | JPMORGAN INSURANCE TRUST | | | | | 3 | |
JPMorgan Insurance Trust Core Bond Portfolio
SCHEDULE OF PORTFOLIO INVESTMENTS
AS OF JUNE 30, 2017 (Unaudited)
| | | | | | | | |
PRINCIPAL
AMOUNT($) | | | SECURITY DESCRIPTION | | VALUE($) | |
| | Asset-Backed Securities — 11.4% | | | | |
| | 21,660 | | | Air Canada Pass-Through Trust, (Canada), Series 2013-1, Class A, 4.125%, 05/15/25 (e) | | | 22,472 | |
| | | | American Airlines Pass-Through Trust, | | | | |
| | 17,617 | | | Series 2011-1, Class A, 5.250%, 01/31/21 | | | 18,629 | |
| | 82,562 | | | Series 2013-1, Class A, 4.000%, 07/15/25 | | | 86,278 | |
| | 15,584 | | | Series 2016-2, Class A, 3.650%, 06/15/28 | | | 15,818 | |
| | 196,000 | | | Series 2016-3, Class AA, 3.000%, 10/15/28 | | | 192,080 | |
| | 61,000 | | | Series 2017-1, Class AA, 3.650%, 02/15/29 | | | 62,830 | |
| | | | American Credit Acceptance Receivables Trust, | | | | |
| | 37,047 | | | Series 2016-3, Class A, 1.700%, 11/12/20 (e) | | | 36,995 | |
| | 247,474 | | | Series 2016-4, Class A, 1.500%, 06/12/20 (e) | | | 247,185 | |
| | 116,000 | | | Series 2016-4, Class C, 2.910%, 02/13/23 (e) | | | 116,474 | |
| | | | American Homes 4 Rent, | | | | |
| | 380,000 | | | Series 2015-SFR1, Class D, 4.407%, 04/17/52 (e) | | | 388,889 | |
| | 100,000 | | | Series 2015-SFR1, Class E, 5.639%, 04/17/52 (e) | | | 107,435 | |
| | | | American Homes 4 Rent Trust, | | | | |
| | 429,699 | | | Series 2014-SFR2, Class A, 3.786%, 10/17/36 (e) | | | 448,891 | |
| | 200,000 | | | Series 2014-SFR2, Class C, 4.705%, 10/17/36 (e) | | | 212,389 | |
| | 238,794 | | | Series 2014-SFR3, Class A, 3.678%, 12/17/36 (e) | | | 248,650 | |
| | 200,000 | | | Series 2014-SFR3, Class E, 6.418%, 12/17/36 (e) | | | 224,391 | |
| | 200,000 | | | Series 2015-SFR2, Class C, 4.691%, 10/17/45 (e) | | | 212,831 | |
| | | | Americredit Automobile Receivables Trust, | | | | |
| | 50,000 | | | Series 2016-3, Class A3, 1.460%, 05/10/21 | | | 49,855 | |
| | 600,000 | | | Series 2016-4, Class B, SUB, 1.830%, 12/08/21 | | | 594,940 | |
| | 347,601 | | | AXIS Equipment Finance Receivables IV LLC, Series 2016-1A, Class A, 2.210%, 11/20/21 (e) | | | 346,163 | |
| | | | B2R Mortgage Trust, | | | | |
| | 83,941 | | | Series 2015-1, Class A1, 2.524%, 05/15/48 (e) | | | 83,353 | |
| | 240,303 | | | Series 2015-2, Class A, 3.336%, 11/15/48 (e) | | | 243,249 | |
| | | | | | | | |
PRINCIPAL
AMOUNT($) | | | SECURITY DESCRIPTION | | VALUE($) | |
| | | | | |
| | 100,000 | | | BA Credit Card Trust, Series 2015-A2, Class A, 1.360%, 09/15/20 | | | 99,923 | |
| | 175,085 | | | BCC Funding XIII LLC, Series 2016-1, Class A2, 2.200%, 12/20/21 (e) | | | 175,041 | |
| | 8,884 | | | Bear Stearns Asset-Backed Securities Trust, Series 2006-SD1, Class A, VAR, 1.586%, 04/25/36 | | | 8,681 | |
| | 250,000 | | | BMW Vehicle Lease Trust, Series 2016-2, Class A4, 1.570%, 02/20/20 | | | 248,914 | |
| | 77,000 | | | Cabela’s Credit Card Master Note Trust, Series 2015-2, Class A1, 2.250%, 07/17/23 | | | 77,460 | |
| | 140,735 | | | CAM Mortgage Trust, Series 2017-1, Class A1, SUB, 3.220%, 08/01/57 (e) | | | 140,831 | |
| | 377,337 | | | Camillo Issuer LLC, Series 2016-SFR, Class 1A1, 5.000%, 12/05/23 | | | 376,512 | |
| | | | Capital Auto Receivables Asset Trust, | | | | |
| | 49,543 | | | Series 2016-2, Class A2A, 1.320%, 01/20/19 | | | 49,521 | |
| | 63,000 | | | Series 2016-2, Class A4, 1.630%, 01/20/21 | | | 62,786 | |
| | 23,980 | | | CarFinance Capital Auto Trust, Series 2014-2A, Class A, 1.440%, 11/16/20 (e) | | | 23,955 | |
| | 37,338 | | | CarMax Auto Owner Trust, Series 2013-4, Class A4, 1.280%, 05/15/19 | | | 37,313 | |
| | 225,886 | | | Carnow Auto Receivables Trust, Series 2016-1A, Class A, 2.260%, 05/15/19 (e) | | | 226,018 | |
| | | | Chrysler Capital Auto Receivables Trust, | | | | |
| | 232,000 | | | Series 2016-AA, Class A3, 1.770%, 10/15/20 (e) | | | 232,258 | |
| | 328,000 | | | Series 2016-BA, Class A3, 1.640%, 07/15/21 (e) | | | 327,046 | |
| | 145,275 | | | Citi Held For Asset Issuance, Series 2016-MF1, Class A, 4.480%, 08/15/22 (e) | | | 147,120 | |
| | 100,000 | | | CLUB Credit Trust, Series 2017-NP1, Class A, 2.390%, 04/17/23 (e) | | | 100,077 | |
| | 188,519 | | | Continental Credit Card, Series 2016-1A, Class A, 4.560%, 01/15/23 (e) | | | 188,500 | |
| | | | CPS Auto Receivables Trust, | | | | |
| | 31,854 | | | Series 2014-D, Class A, 1.490%, 04/15/19 (e) | | | 31,847 | |
| | 50,883 | | | Series 2015-B, Class A, 1.650%, 11/15/19 (e) | | | 50,906 | |
| | 172,000 | | | Series 2015-C, Class D, 4.630%, 08/16/21 (e) | | | 175,496 | |
| | 87,319 | | | Series 2016-A, Class A, 2.250%, 10/15/19 (e) | | | 87,500 | |
| | 43,646 | | | Series 2016-B, Class A, 2.070%, 11/15/19 (e) | | | 43,701 | |
SEE NOTES TO FINANCIAL STATEMENTS.
| | | | | | |
| | | |
| 4 | | | | JPMORGAN INSURANCE TRUST | | JUNE 30, 2017 |
| | | | | | | | |
PRINCIPAL
AMOUNT($) | | | SECURITY DESCRIPTION | | VALUE($) | |
| | Asset-Backed Securities — continued | | | | |
| | | | Credit Acceptance Auto Loan Trust, | | | | |
| | 250,000 | | | Series 2015-2A, Class A, 2.400%, 02/15/23 (e) | | | 250,937 | |
| | 250,000 | | | Series 2017-1A, Class A, 2.560%, 10/15/25 (e) | | | 250,765 | |
| | 85,603 | | | CVS Pass-Through Trust, 5.926%, 01/10/34 (e) | | | 98,145 | |
| | 4,805 | | | CWABS Revolving Home Equity Loan Trust, Series 2004-K, Class 2A, VAR, 1.459%, 02/15/34 | | | 4,473 | |
| | | | CWABS, Inc. Asset-Backed Certificates, | | | | |
| | 1,056 | | | Series 2004-1, Class 3A, VAR, 1.776%, 04/25/34 | | | 1,042 | |
| | 51,175 | | | Series 2004-1, Class M1, VAR, 1.966%, 03/25/34 | | | 51,068 | |
| | 8,450 | | | Series 2004-1, Class M2, VAR, 2.041%, 03/25/34 | | | 8,223 | |
| | 22,418 | | | Delta Air Lines Pass-Through Trust, Series 2010-2, Class A, 4.950%, 05/23/19 | | | 23,287 | |
| | | | Drive Auto Receivables Trust, | | | | |
| | 132,000 | | | Series 2015-DA, Class D, 4.590%, 01/17/23 (e) | | | 136,481 | |
| | 139,346 | | | Series 2016-AA, Class B, 3.170%, 05/15/20 (e) | | | 139,783 | |
| | 243,000 | | | Series 2016-AA, Class C, 3.910%, 05/17/21 (e) | | | 246,755 | |
| | 80,000 | | | Series 2016-BA, Class B, 2.560%, 06/15/20 (e) | | | 80,263 | |
| | 220,000 | | | Series 2016-CA, Class D, 4.180%, 03/15/24 (e) | | | 224,645 | |
| | 231,000 | | | Series 2017-1, Class C, 2.840%, 04/15/22 | | | 231,601 | |
| | 262,000 | | | Series 2017-1, Class D, 3.840%, 03/15/23 | | | 263,058 | |
| | 60,000 | | | Series 2017-AA, Class B, 2.510%, 01/15/21 (e) | | | 60,226 | |
| | 95,000 | | | Series 2017-AA, Class C, 2.980%, 01/18/22 (e) | | | 95,692 | |
| | 127,000 | | | Series 2017-AA, Class D, 4.160%, 05/15/24 (e) | | | 129,123 | |
| | | | DT Auto Owner Trust, | | | | |
| | 236,716 | | | Series 2016-1A, Class B, 2.790%, 05/15/20 (e) | | | 237,231 | |
| | 33,334 | | | Series 2016-2A, Class A, 1.730%, 08/15/19 (e) | | | 33,336 | |
| | 100,030 | | | Series 2016-3A, Class A, 1.750%, 11/15/19 (e) | | | 100,066 | |
| | 185,000 | | | Series 2016-3A, Class B, 2.650%, 07/15/20 (e) | | | 185,809 | |
| | | | | | | | |
PRINCIPAL
AMOUNT($) | | | SECURITY DESCRIPTION | | VALUE($) | |
| | | | | |
| | 66,000 | | | Series 2016-4A, Class B, 2.020%, 08/17/20 (e) | | | 65,901 | |
| | 113,300 | | | Series 2016-4A, Class D, 3.770%, 10/17/22 (e) | | | 114,095 | |
| | 115,000 | | | Series 2017-1A, Class D, 3.550%, 11/15/22 (e) | | | 115,242 | |
| | 196,000 | | | Series 2017-2A, Class C, 3.030%, 01/17/23 (e) | | | 196,130 | |
| | 262,716 | | | Engs Commercial Finance Trust, Series 2016-1A, Class A2, 2.630%, 02/22/22 (e) | | | 262,326 | |
| | | | Exeter Automobile Receivables Trust, | | | | |
| | 10,165 | | | Series 2015-2A, Class A, 1.540%, 11/15/19 (e) | | | 10,161 | |
| | 52,627 | | | Series 2016-1A, Class A, 2.350%, 07/15/20 (e) | | | 52,699 | |
| | 135,000 | | | Series 2016-1A, Class C, 5.520%, 10/15/21 (e) | | | 140,676 | |
| | 58,010 | | | Series 2016-2A, Class A, 2.210%, 07/15/20 (e) | | | 58,043 | |
| | 295,075 | | | Series 2016-3A, Class A, 1.840%, 11/16/20 (e) | | | 294,391 | |
| | 82,000 | | | Series 2016-3A, Class B, 2.840%, 08/16/21 (e) | | | 82,321 | |
| | 60,000 | | | Series 2017-1A, Class C, 3.950%, 12/15/22 (e) | | | 60,707 | |
| | | | First Investors Auto Owner Trust, | | | | |
| | 20,731 | | | Series 2015-2A, Class A1, 1.590%, 12/16/19 (e) | | | 20,731 | |
| | 81,698 | | | Series 2016-2A, Class A1, 1.530%, 11/16/20 (e) | | | 81,562 | |
| | 247,556 | | | FirstKey Lending Trust, Series 2015-SFR1, Class A, 2.553%, 03/09/47 (e) | | | 247,490 | |
| | | | Flagship Credit Auto Trust, | | | | |
| | 13,335 | | | Series 2014-2, Class A, 1.430%, 12/16/19 (e) | | | 13,336 | |
| | 45,000 | | | Series 2014-2, Class B, 2.840%, 11/16/20 (e) | | | 45,292 | |
| | 22,000 | | | Series 2014-2, Class C, 3.950%, 12/15/20 (e) | | | 22,242 | |
| | 153,641 | | | Series 2015-3, Class A, 2.380%, 10/15/20 (e) | | | 153,829 | |
| | 126,000 | | | Series 2015-3, Class B, 3.680%, 03/15/22 (e) | | | 128,060 | |
| | 76,000 | | | Series 2015-3, Class C, 4.650%, 03/15/22 (e) | | | 78,198 | |
| | 178,900 | | | Series 2016-1, Class A, 2.770%, 12/15/20 (e) | | | 180,283 | |
| | 250,000 | | | Series 2016-1, Class C, 6.220%, 06/15/22 (e) | | | 267,430 | |
SEE NOTES TO FINANCIAL STATEMENTS.
| | | | | | | | |
| | | |
| JUNE 30, 2017 | | JPMORGAN INSURANCE TRUST | | | | | 5 | |
JPMorgan Insurance Trust Core Bond Portfolio
SCHEDULE OF PORTFOLIO INVESTMENTS
AS OF JUNE 30, 2017 (Unaudited) (continued)
| | | | | | | | |
PRINCIPAL
AMOUNT($) | | | SECURITY DESCRIPTION | | VALUE($) | |
| | Asset-Backed Securities — continued | | | | |
| | 327,000 | | | Series 2016-4, Class A2, 1.960%, 02/16/21 (e) | | | 326,927 | |
| | 249,000 | | | Series 2016-4, Class C, SUB, 2.710%, 11/15/22 (e) | | | 247,368 | |
| | 203,908 | | | GCAT, Series 2015-2, Class A1, SUB, 3.750%, 07/25/20 (e) | | | 204,336 | |
| | | | GO Financial Auto Securitization Trust, | | | | |
| | 11,542 | | | Series 2015-2, Class A, 3.270%, 11/15/18 (e) | | | 11,544 | |
| | 160,000 | | | Series 2015-2, Class B, 4.800%, 08/17/20 (e) | | | 161,201 | |
| | 49,799 | | | Gold Key Resorts LLC, Series 2014-A, Class A, 3.220%, 03/17/31 (e) | | | 49,948 | |
| | 99,285 | | | Goodgreen Trust, Series 2017-1A, Class A, 3.740%, 10/15/52 (e) | | | 100,447 | |
| | | | Green Tree Agency Advance Funding Trust I, | | | | |
| | 123,000 | | | Series 2016-T1, Class AT1, 2.380%, 10/15/48 (e) | | | 122,491 | |
| | 114,000 | | | Series 2016-T1, Class BT1, 3.122%, 10/15/48 (e) | | | 113,296 | |
| | | | HERO Funding Trust, | | | | |
| | 115,483 | | | Series 2016-3A, Class A1, 3.080%, 09/20/42 (e) | | | 117,107 | |
| | 282,795 | | | Series 2017-1A, Class A2, 4.460%, 09/20/47 (e) | | | 291,580 | |
| | 228,738 | | | Hilton Grand Vacations Trust, Series 2017-AA, Class A, 2.660%, 12/26/28 (e) | | | 228,827 | |
| | 700,000 | | | Kabbage Asset Securitization LLC, Series 2017-1, Class A, 4.571%, 03/15/22 (e) | | | 716,111 | |
| | 124,817 | | | LendingClub Issuance Trust, Series 2016-NP1, Class A, 3.750%, 06/15/22 (e) | | | 125,566 | |
| | | | Lendmark Funding Trust, | | | | |
| | 171,000 | | | Series 2016-A, Class A, 4.820%, 08/21/23 (e) | | | 175,339 | |
| | 162,000 | | | Series 2017-1A, Class A, 2.830%, 01/22/24 (e) | | | 161,967 | |
| | | | Long Beach Mortgage Loan Trust, | | | | |
| | 59,675 | | | Series 2003-4, Class M1, VAR, 2.236%, 08/25/33 | | | 58,780 | |
| | 109,953 | | | Series 2004-1, Class M1, VAR, 1.966%, 02/25/34 | | | 109,536 | |
| | 9,307 | | | Series 2004-1, Class M2, VAR, 2.041%, 02/25/34 | | | 9,209 | |
| | 6,258 | | | Series 2006-WL2, Class 2A3, VAR, 1.416%, 01/25/36 | | | 6,222 | |
| | 176,000 | | | Mariner Finance Issuance Trust, Series 2017-AA, Class A, 3.620%, 02/20/29 (e) | | | 177,086 | |
| | | | | | | | |
PRINCIPAL
AMOUNT($) | | | SECURITY DESCRIPTION | | VALUE($) | |
| | | | | |
| | | | Marlette Funding Trust, | | | | |
| | 118,100 | | | Series 2016-1A, Class A, 3.060%, 01/17/23 (e) | | | 118,632 | |
| | 330,218 | | | Series 2017-1A, Class A, 2.827%, 03/15/24 (e) | | | 331,409 | |
| | 145,707 | | | Murray Hill Marketplace Trust, Series 2016-LC1, Class A, 4.190%, 11/25/22 (e) | | | 147,014 | |
| | | | Nationstar HECM Loan Trust, | | | | |
| | 20,856 | | | Series 2015-2A, Class A, 2.883%, 11/25/25 (e) | | | 20,863 | |
| | 158,000 | | | Series 2015-2A, Class M1, 4.115%, 11/25/25 (e) | | | 158,051 | |
| | 140,000 | | | Series 2016-1A, Class M1, VAR, 4.360%, 02/25/26 (e) | | | 140,045 | |
| | 39,691 | | | Series 2016-2A, Class A, VAR, 2.239%, 06/25/26 (e) | | | 40,139 | |
| | 125,000 | | | New Century Home Equity Loan Trust, Series 2005-1, Class M1, VAR, 1.891%, 03/25/35 | | | 118,590 | |
| | 180,000 | | | New Residential Advance Receivables Trust Advance, Series 2016-T2, Class AT2, 2.575%, 10/15/49 (e) | | | 178,836 | |
| | 219,785 | | | NRPL Trust, Series 2015-2A, Class A1, SUB, 3.750%, 10/25/57 (e) | | | 220,002 | |
| | 50,000 | | | NRZ Advance Receivables Trust Advance Receivables Backed, Series 2016-T1, Class AT1, 2.751%, 06/15/49 (e) | | | 49,609 | |
| | | | Ocwen Master Advance Receivables Trust, | | | | |
| | 367,000 | | | Series 2015-T3, Class AT3, 3.211%, 11/15/47 (e) | | | 366,134 | |
| | 164,000 | | | Series 2015-T3, Class BT3, 3.704%, 11/15/47 (e) | | | 164,000 | |
| | 100,000 | | | Series 2016-T1, Class AT1, 2.521%, 08/17/48 (e) | | | 99,541 | |
| | 150,000 | | | Series 2016-T1, Class CT1, 3.607%, 08/17/48 (e) | | | 147,408 | |
| | 184,211 | | | Series 2016-T1, Class DT1, 4.246%, 08/17/48 (e) | | | 181,639 | |
| | 155,000 | | | OnDeck Asset Securitization Trust II LLC, Series 2016-1A, Class A, 4.210%, 05/17/20 (e) | | | 155,271 | |
| | 93,607 | | | OneMain Direct Auto Receivables Trust, Series 2016-1A, Class A, 2.040%, 01/15/21 (e) | | | 93,713 | |
| | | | OneMain Financial Issuance Trust, | | | | |
| | 55,923 | | | Series 2014-1A, Class A, 2.430%, 06/18/24 (e) | | | 55,945 | |
| | 100,000 | | | Series 2014-1A, Class B, 3.240%, 06/18/24 (e) | | | 100,102 | |
| | 113,129 | | | Series 2014-2A, Class A, 2.470%, 09/18/24 (e) | | | 113,276 | |
SEE NOTES TO FINANCIAL STATEMENTS.
| | | | | | |
| | | |
| 6 | | | | JPMORGAN INSURANCE TRUST | | JUNE 30, 2017 |
| | | | | | | | |
PRINCIPAL
AMOUNT($) | | | SECURITY DESCRIPTION | | VALUE($) | |
| | Asset-Backed Securities — continued | | | | |
| | 230,000 | | | Series 2015-1A, Class A, 3.190%, 03/18/26 (e) | | | 232,294 | |
| | 100,000 | | | Series 2015-1A, Class B, 3.850%, 03/18/26 (e) | | | 101,417 | |
| | 307,105 | | | Series 2015-2A, Class A, 2.570%, 07/18/25 (e) | | | 307,456 | |
| | 100,000 | | | Series 2015-2A, Class B, 3.100%, 07/18/25 (e) | | | 99,761 | |
| | 215,000 | | | Series 2016-1A, Class A, 3.660%, 02/20/29 (e) | | | 220,036 | |
| | 250,000 | | | Oportun Funding II LLC, Series 2016-A, Class A, 4.700%, 03/08/21 (e) | | | 254,665 | |
| | | | Oportun Funding IV LLC, | | | | |
| | 250,000 | | | Series 2016-C, Class A, 3.280%, 11/08/21 (e) | | | 251,337 | |
| | 250,000 | | | Series 2016-C, Class B, 4.850%, 11/08/21 (e) | | | 255,025 | |
| | 250,000 | | | Oportun Funding VI LLC, Series 2017-A, Class A, 3.230%, 06/08/23 (e) | | | 251,306 | |
| | | | Progress Residential Trust, | | | | |
| | 224,842 | | | Series 2015-SFR2, Class A, 2.740%, 06/12/32 (e) | | | 225,986 | |
| | 150,000 | | | Series 2015-SFR2, Class B, 3.138%, 06/12/32 (e) | | | 150,122 | |
| | 436,250 | | | Series 2015-SFR3, Class A, 3.067%, 11/12/32 (e) | | | 442,721 | |
| | 100,000 | | | Series 2015-SFR3, Class D, 4.673%, 11/12/32 (e) | | | 103,527 | |
| | 191,000 | | | Prosper Marketplace Issuance Trust, Series 2017-1A, Class A, 2.560%, 06/15/23 (e) | | | 191,418 | |
| | | | Purchasing Power Funding LLC, | | | | |
| | 350,000 | | | Series 2015-A, Class A2, 4.750%, 12/15/19 (e) | | | 351,203 | |
| | 147,003 | | | Series 2016-A, VAR, 5.741%, 02/27/19 | | | 147,003 | |
| | 5,298 | | | RASC Trust, Series 2003-KS9, Class A2B, VAR, 1.856%, 11/25/33 | | | 4,466 | |
| | 112,797 | | | Renew, (Cayman Islands), Series 2017-1A, Class A, 3.670%, 09/20/52 (e) | | | 113,829 | |
| | 490,158 | | | Rice Park Financing Trust, Series 2016-A, Class A, 4.625%, 10/31/41 (e) | | | 490,158 | |
| | 374,000 | | | Santander Drive Auto Receivables Trust, Series 2016-3, Class B, SUB, 1.890%, 06/15/21 | | | 373,407 | |
| | 23,591 | | | Sierra Auto Receivables Securitization Trust, Series 2016-1A, Class A, 2.850%, 01/18/22 (e) | | | 23,603 | |
| | 26,587 | | | Skopos Auto Receivables Trust, Series 2015-2A, Class A, 3.550%, 02/15/20 (e) | | | 26,602 | |
| | | | | | | | |
PRINCIPAL
AMOUNT($) | | | SECURITY DESCRIPTION | | VALUE($) | |
| | | | | | | | |
| | 107,591 | | | SoFi Consumer Loan Program LLC, Series 2016-2, Class A, 3.090%, 10/27/25 (e) | | | 108,486 | |
| | 183,208 | | | SpringCastle America Funding LLC, Series 2016-AA, Class A, 3.050%, 04/25/29 (e) | | | 184,288 | |
| | 308,000 | | | Springleaf Funding Trust, Series 2015-AA, Class A, 3.160%, 11/15/24 (e) | | | 310,788 | |
| | 200,000 | | | Sprint Spectrum Co. LLC, 3.360%, 09/20/21 (e) | | | 201,750 | |
| | 95,074 | | | Spruce ABS Trust, Series 2016-E1, Class A, 4.320%, 06/15/28 (e) | | | 94,133 | |
| | 400,000 | | | SPS Servicer Advance Receivables Trust Advance Receivables Backed Notes, Series 2016-T1, Class AT1, 2.530%, 11/16/48 (e) | | | 396,514 | |
| | 404,750 | | | TCF Auto Receivables Owner Trust, Series 2016-PT1A, Class A, 1.930%, 06/15/22 (e) | | | 404,374 | |
| | 218,669 | | | Tricolor Auto Securitization Trust, Series 2017-1, Class A, 5.090%, 05/15/20 (e) | | | 218,714 | |
| | 131,000 | | | Tricon American Homes Trust, Series 2016-SFR1, Class A, 2.589%, 11/17/33 (e) | | | 129,551 | |
| | 87,724 | | | United Airlines Pass-Through Trust, Series 2013-1, Class A, 4.300%, 08/15/25 | | | 93,207 | |
| | 167,000 | | | Upstart Securitization Trust, Series 2017-1, Class A, 2.639%, 06/20/24 (e) | | | 167,041 | |
| | 126,976 | | | US Residential Opportunity Fund III Trust, Series 2016-1III, Class A, SUB, 3.475%, 07/27/36 (e) | | | 127,836 | |
| | 393,000 | | | Verizon Owner Trust, Series 2017-2A, Class A, 1.920%, 12/20/21 (e) | | | 392,940 | |
| | 300,000 | | | VM DEBT LLC, Series 2017-1, Class A, 6.500%, 10/02/24 (e) | | | 300,000 | |
| | 257,754 | | | VOLT LI LLC, Series 2016-NP11, Class A1, SUB, 3.500%, 10/25/46 (e) | | | 257,978 | |
| | 220,007 | | | VOLT LIII LLC, Series 2016-NP13, Class A1, SUB, 3.875%, 12/26/46 (e) | | | 220,780 | |
| | 160,144 | | | VOLT LIV LLC, Series 2017-NPL1, Class A1, SUB, 3.625%, 02/25/47 (e) | | | 160,676 | |
| | 120,736 | | | VOLT LV LLC, Series 2017-NPL2, Class A1, SUB, 3.500%, 03/25/47 (e) | | | 120,939 | |
| | 256,792 | | | VOLT LVI LLC, Series 2017-NPL3, Class A1, SUB, 3.500%, 03/25/47 (e) | | | 257,112 | |
| | 245,824 | | | VOLT LVII LLC, Series 2017-NPL4, Class A1, SUB, 3.375%, 04/25/47 (e) | | | 245,642 | |
| | 129,427 | | | VOLT LIX LLC, Series 2017-NPL6, Class A1, SUB, 3.250%, 05/25/47 (e) | | | 129,589 | |
SEE NOTES TO FINANCIAL STATEMENTS.
| | | | | | | | |
| | | |
| JUNE 30, 2017 | | JPMORGAN INSURANCE TRUST | | | | | 7 | |
JPMorgan Insurance Trust Core Bond Portfolio
SCHEDULE OF PORTFOLIO INVESTMENTS
AS OF JUNE 30, 2017 (Unaudited) (continued)
| | | | | | | | |
PRINCIPAL
AMOUNT($) | | | SECURITY DESCRIPTION | | VALUE($) | |
| | Asset-Backed Securities — continued | | | | |
| | 213,000 | | | VOLT LX LLC, Series 2017-NPL7, Class A1, SUB, 3.250%, 04/25/59 (e) | | | 212,813 | |
| | 257,000 | | | VOLT LXI LLC, Series 2017-NPL8, Class A1, SUB, 3.125%, 06/25/47 (e) | | | 257,000 | |
| | 100,969 | | | VOLT XL LLC, Series 2015-NP14, Class A1, SUB, 4.375%, 11/27/45 (e) | | | 101,334 | |
| | 257,017 | | | VOLT XXV LLC, Series 2015-NPL8, Class A1, SUB, 3.500%, 06/26/45 (e) | | | 257,647 | |
| | 235,840 | | | Westgate Resorts LLC, Series 2017-1A, Class A, 3.050%, 12/20/30 (e) | | | 236,434 | |
| | | | Westlake Automobile Receivables Trust, | | | | |
| | 100,000 | | | Series 2015-3A, Class D, 4.400%, 05/17/21 (e) | | | 101,429 | |
| | 746,800 | | | Series 2016-2A, Class A2, 1.570%, 06/17/19 (e) | | | 746,752 | |
| | 645,000 | | | Series 2016-3A, Class C, SUB, 2.460%, 01/18/22 (e) | | | 643,335 | |
| | 77,000 | | | Series 2017-1A, Class C, 2.700%, 10/17/22 (e) | | | 77,239 | |
| | | | | | | | |
| | | | Total Asset-Backed Securities
(Cost $30,547,915) | | | 30,703,127 | |
| | | | | | | | |
| | Collateralized Mortgage Obligations — 13.8% | | | | |
| | 81,535 | | | Ajax Mortgage Loan Trust, Series 2015-B, Class A, SUB, 3.875%, 07/25/60 (e) | | | 81,438 | |
| | | | Alternative Loan Trust, | | | | |
| | 1,291,955 | | | Series 2004-2CB, Class 1A9, 5.750%, 03/25/34 | | | 1,287,877 | |
| | 362,188 | | | Series 2005-20CB, Class 3A8, IF, IO, 3.534%, 07/25/35 | | | 46,658 | |
| | 528,236 | | | Series 2005-22T1, Class A2, IF, IO, 3.854%, 06/25/35 | | | 73,670 | |
| | 494,019 | | | Series 2005-28CB, Class 1A4, 5.500%, 08/25/35 | | | 455,581 | |
| | 225,180 | | | Series 2005-54CB, Class 1A11, 5.500%, 11/25/35 | | | 210,834 | |
| | 211,980 | | | Series 2005-J1, Class 1A4, IF, IO, 3.884%, 02/25/35 | | | 7,817 | |
| | 46,481 | | | Angel Oak Mortgage Trust LLC, Series 2015-1, Class A, SUB, 4.500%, 11/25/45 (e) | | | 46,542 | |
| | | | Banc of America Alternative Loan Trust, | | | | |
| | 179,306 | | | Series 2004-5, Class 3A3, PO, Zero Coupon, 06/25/34 | | | 154,460 | |
| | 10,861 | | | Series 2004-6, Class 15PO, PO, Zero Coupon, 07/25/19 | | | 10,338 | |
| | | | Banc of America Funding Trust, | | | | |
| | 25,108 | | | Series 2004-1, Class PO, PO, Zero Coupon, 03/25/34 | | | 20,655 | |
| | 160,144 | | | Series 2005-6, Class 2A7, 5.500%, 10/25/35 | | | 154,627 | |
| | | | | | | | |
PRINCIPAL
AMOUNT($) | | | SECURITY DESCRIPTION | | VALUE($) | |
| | | | | | | | |
| | 21,297 | | | Series 2005-7, Class 30PO, PO, Zero Coupon, 11/25/35 | | | 16,823 | |
| | 79,551 | | | Series 2005-E, Class 4A1, VAR, 3.146%, 03/20/35 | | | 80,300 | |
| | 69,115 | | | Banc of America Mortgage Trust, Series 2004-J, Class 3A1, VAR, 3.659%, 11/25/34 | | | 68,211 | |
| | | | Bear Stearns ARM Trust, | | | | |
| | 45,557 | | | Series 2003-7, Class 3A, VAR, 3.144%, 10/25/33 | | | 44,849 | |
| | 57,718 | | | Series 2005-5, Class A1, VAR, 2.580%, 08/25/35 | | | 58,578 | |
| | 188,131 | | | Series 2006-1, Class A1, VAR, 2.910%, 02/25/36 | | | 187,577 | |
| | | | CHL Mortgage Pass-Through Trust, | | | | |
| | 39,160 | | | Series 2004-7, Class 2A1, VAR, 3.524%, 06/25/34 | | | 38,516 | |
| | 21,655 | | | Series 2004-HYB1, Class 2A, VAR, 3.224%, 05/20/34 | | | 20,625 | |
| | 38,954 | | | Series 2004-HYB3, Class 2A, VAR, 3.243%, 06/20/34 | | | 37,356 | |
| | 14,206 | | | Series 2004-J8, Class 1A2, 4.750%, 11/25/19 | | | 14,332 | |
| | 2,605 | | | Series 2004-J8, Class POA, PO, Zero Coupon, 11/25/19 | | | 2,596 | |
| | 80,598 | | | Series 2005-16, Class A23, 5.500%, 09/25/35 | | | 75,755 | |
| | 187,657 | | | Series 2005-22, Class 2A1, VAR, 3.193%, 11/25/35 | | | 161,027 | |
| | | | Citigroup Global Markets Mortgage Securities VII, Inc., | | | | |
| | 32,517 | | | Series 2003-HYB1, Class A, VAR, 3.240%, 09/25/33 | | | 32,469 | |
| | 207 | | | Series 2003-UP2, Class PO1, PO, Zero Coupon, 12/25/18 | | | 185 | |
| | | | Citigroup Mortgage Loan Trust, Inc., | | | | |
| | 3,257 | | | Series 2003-UP3, Class A3, 7.000%, 09/25/33 | | | 3,304 | |
| | 3,734 | | | Series 2003-UST1, Class A1, 5.500%, 12/25/18 | | | 3,739 | |
| | 1,764 | | | Series 2003-UST1, Class PO1, PO, Zero Coupon, 12/25/18 | | | 1,736 | |
| | 515 | | | Series 2003-UST1, Class PO3, PO, Zero Coupon, 12/25/18 | | | 504 | |
| | 65,075 | | | Series 2005-1, Class 2A1A, VAR, 3.117%, 02/25/35 | | | 47,493 | |
| | 999 | | | Credit Suisse First Boston Mortgage Securities Corp., Series 2004-5, Class 5P, PO, Zero Coupon, 08/25/19 | | | 996 | |
| | 28,990 | | | CSMC, Series 2010-11R, Class A6, VAR, 2.295%, 06/28/47 (e) | | | 28,896 | |
SEE NOTES TO FINANCIAL STATEMENTS.
| | | | | | |
| | | |
| 8 | | | | JPMORGAN INSURANCE TRUST | | JUNE 30, 2017 |
| | | | | | | | |
PRINCIPAL
AMOUNT($) | | | SECURITY DESCRIPTION | | VALUE($) | |
| | Collateralized Mortgage Obligations — continued | |
| | 63,417 | | | FHLMC — GNMA REMIC, Series 8, Class ZA, 7.000%, 03/25/23 | | | 68,300 | |
| | | | FHLMC REMIC, | | | | |
| | 301 | | | Series 22, Class C, 9.500%, 04/15/20 | | | 306 | |
| | 84 | | | Series 47, Class F, 10.000%, 06/15/20 | | | 88 | |
| | 113 | | | Series 99, Class Z, 9.500%, 01/15/21 | | | 121 | |
| | 271 | | | Series 1065, Class J, 9.000%, 04/15/21 | | | 299 | |
| | 371 | | | Series 1113, Class J, 8.500%, 06/15/21 | | | 381 | |
| | 1,354 | | | Series 1250, Class J, 7.000%, 05/15/22 | | | 1,374 | |
| | 4,084 | | | Series 1316, Class Z, 8.000%, 06/15/22 | | | 4,493 | |
| | 6,472 | | | Series 1324, Class Z, 7.000%, 07/15/22 | | | 6,999 | |
| | 28,772 | | | Series 1343, Class LA, 8.000%, 08/15/22 | | | 31,771 | |
| | 5,923 | | | Series 1343, Class LB, 7.500%, 08/15/22 | | | 6,571 | |
| | 3,904 | | | Series 1394, Class ID, IF, 9.566%, 10/15/22 | | | 4,563 | |
| | 3,440 | | | Series 1395, Class G, 6.000%, 10/15/22 | | | 3,671 | |
| | 2,540 | | | Series 1505, Class Q, 7.000%, 05/15/23 | | | 2,788 | |
| | 4,957 | | | Series 1518, Class G, IF, 7.894%, 05/15/23 | | | 5,564 | |
| | 5,140 | | | Series 1541, Class O, VAR, 1.480%, 07/15/23 | | | 5,123 | |
| | 149,942 | | | Series 1577, Class PV, 6.500%, 09/15/23 | | | 162,883 | |
| | 87,459 | | | Series 1584, Class L, 6.500%, 09/15/23 | | | 95,585 | |
| | 93,741 | | | Series 1633, Class Z, 6.500%, 12/15/23 | | | 100,737 | |
| | 113,073 | | | Series 1638, Class H, 6.500%, 12/15/23 | | | 122,361 | |
| | 2,387 | | | Series 1671, Class QC, IF, 10.000%, 02/15/24 | | | 3,209 | |
| | 12,379 | | | Series 1694, Class PK, 6.500%, 03/15/24 | | | 13,438 | |
| | 3,515 | | | Series 1700, Class GA, PO, Zero Coupon, 02/15/24 | | | 3,388 | |
| | 12,888 | | | Series 1798, Class F, 5.000%, 05/15/23 | | | 13,592 | |
| | 23,817 | | | Series 1863, Class Z, 6.500%, 07/15/26 | | | 26,386 | |
| | 4,026 | | | Series 1865, Class D, PO, Zero Coupon, 02/15/24 | | | 3,645 | |
| | 11,113 | | | Series 1981, Class Z, 6.000%, 05/15/27 | | | 12,132 | |
| | 15,068 | | | Series 1987, Class PE, 7.500%, 09/15/27 | | | 17,506 | |
| | 47,716 | | | Series 1999, Class PU, 7.000%, 10/15/27 | | | 53,105 | |
| | 86,600 | | | Series 2031, Class PG, 7.000%, 02/15/28 | | | 99,138 | |
| | 3,082 | | | Series 2033, Class SN, HB, IF, 28.534%, 03/15/24 | | | 1,179 | |
| | 82,820 | | | Series 2035, Class PC, 6.950%, 03/15/28 | | | 92,930 | |
| | | | | | | | |
PRINCIPAL
AMOUNT($) | | | SECURITY DESCRIPTION | | VALUE($) | |
| | | | | | | | |
| | 5,795 | | | Series 2038, Class PN, IO, 7.000%, 03/15/28 | | | 1,135 | |
| | 16,416 | | | Series 2054, Class PV, 7.500%, 05/15/28 | | | 18,898 | |
| | 102,611 | | | Series 2057, Class PE, 6.750%, 05/15/28 | | | 116,534 | |
| | 19,751 | | | Series 2064, Class TE, 7.000%, 06/15/28 | | | 22,441 | |
| | 18,295 | | | Series 2075, Class PH, 6.500%, 08/15/28 | | | 20,511 | |
| | 57,567 | | | Series 2095, Class PE, 6.000%, 11/15/28 | | | 63,955 | |
| | 3,716 | | | Series 2132, Class SB, HB, IF, 25.998%, 03/15/29 | | | 6,095 | |
| | 2,331 | | | Series 2134, Class PI, IO, 6.500%, 03/15/19 | | | 88 | |
| | 33,259 | | | Series 2178, Class PB, 7.000%, 08/15/29 | | | 38,191 | |
| | 58,296 | | | Series 2182, Class ZB, 8.000%, 09/15/29 | | | 68,401 | |
| | 657 | | | Series 2204, Class GB, VAR, 8.000%, 12/20/29 | | | 657 | |
| | 10,354 | | | Series 2247, Class Z, 7.500%, 08/15/30 | | | 12,195 | |
| | 157,389 | | | Series 2259, Class ZC, 7.350%, 10/15/30 | | | 185,480 | |
| | 2,060 | | | Series 2261, Class ZY, 7.500%, 10/15/30 | | | 2,425 | |
| | 16,557 | | | Series 2283, Class K, 6.500%, 12/15/23 | | | 17,963 | |
| | 3,683 | | | Series 2306, Class K, PO, Zero Coupon, 05/15/24 | | | 3,485 | |
| | 8,837 | | | Series 2306, Class SE, IF, IO, 8.330%, 05/15/24 | | | 1,665 | |
| | 10,143 | | | Series 2325, Class PM, 7.000%, 06/15/31 | | | 11,695 | |
| | 65,042 | | | Series 2344, Class ZD, 6.500%, 08/15/31 | | | 75,711 | |
| | 10,369 | | | Series 2344, Class ZJ, 6.500%, 08/15/31 | | | 11,467 | |
| | 5,796 | | | Series 2345, Class NE, 6.500%, 08/15/31 | | | 6,574 | |
| | 37,005 | | | Series 2359, Class ZB, 8.500%, 06/15/31 | | | 43,011 | |
| | 98,045 | | | Series 2367, Class ME, 6.500%, 10/15/31 | | | 108,626 | |
| | 9,150 | | | Series 2390, Class DO, PO, Zero Coupon, 12/15/31 | | | 8,416 | |
| | 15,411 | | | Series 2410, Class OE, 6.375%, 02/15/32 | | | 16,925 | |
| | 15,615 | | | Series 2410, Class QS, IF, 16.487%, 02/15/32 | | | 23,417 | |
SEE NOTES TO FINANCIAL STATEMENTS.
| | | | | | | | |
| | | |
| JUNE 30, 2017 | | JPMORGAN INSURANCE TRUST | | | | | 9 | |
JPMorgan Insurance Trust Core Bond Portfolio
SCHEDULE OF PORTFOLIO INVESTMENTS
AS OF JUNE 30, 2017 (Unaudited) (continued)
| | | | | | | | |
PRINCIPAL
AMOUNT($) | | | SECURITY DESCRIPTION | | VALUE($) | |
| | Collateralized Mortgage Obligations — continued | |
| | 17,820 | | | Series 2410, Class QX, IF, IO, 7.491%, 02/15/32 | | | 4,864 | |
| | 19,644 | | | Series 2412, Class SP, IF, 13.782%, 02/15/32 | | | 25,175 | |
| | 37,445 | | | Series 2423, Class MC, 7.000%, 03/15/32 | | | 43,218 | |
| | 62,104 | | | Series 2423, Class MT, 7.000%, 03/15/32 | | | 72,005 | |
| | 119,400 | | | Series 2435, Class CJ, 6.500%, 04/15/32 | | | 136,225 | |
| | 22,382 | | | Series 2444, Class ES, IF, IO, 6.791%, 03/15/32 | | | 5,319 | |
| | 14,921 | | | Series 2450, Class SW, IF, IO, 6.841%, 03/15/32 | | | 3,237 | |
| | 44,121 | | | Series 2455, Class GK, 6.500%, 05/15/32 | | | 50,317 | |
| | 28,010 | | | Series 2484, Class LZ, 6.500%, 07/15/32 | | | 31,570 | |
| | 97,435 | | | Series 2500, Class MC, 6.000%, 09/15/32 | | | 110,401 | |
| | 210 | | | Series 2503, Class BH, 5.500%, 09/15/17 | | | 210 | |
| | 5,767 | | | Series 2527, Class BP, 5.000%, 11/15/17 | | | 5,784 | |
| | 33,724 | | | Series 2535, Class BK, 5.500%, 12/15/22 | | | 35,642 | |
| | 1,139,062 | | | Series 2543, Class YX, 6.000%, 12/15/32 | | | 1,271,718 | |
| | 94,274 | | | Series 2544, Class HC, 6.000%, 12/15/32 | | | 107,029 | |
| | 465,190 | | | Series 2574, Class PE, 5.500%, 02/15/33 | | | 518,376 | |
| | 164,589 | | | Series 2575, Class ME, 6.000%, 02/15/33 | | | 184,679 | |
| | 64,914 | | | Series 2578, Class PG, 5.000%, 02/15/18 | | | 65,300 | |
| | 12,970 | | | Series 2586, Class WI, IO, 6.500%, 03/15/33 | | | 2,451 | |
| | 4,326 | | | Series 2626, Class NS, IF, IO, 5.391%, 06/15/23 | | | 82 | |
| | 25,777 | | | Series 2638, Class DS, IF, 7.441%, 07/15/23 | | | 27,958 | |
| | 67,466 | | | Series 2647, Class A, 3.250%, 04/15/32 | | | 68,961 | |
| | 57,197 | | | Series 2651, Class VZ, 4.500%, 07/15/18 | | | 57,637 | |
| | 58,395 | | | Series 2656, Class BG, 5.000%, 10/15/32 | | | 58,592 | |
| | 260,000 | | | Series 2764, Class UG, 5.000%, 03/15/34 | | | 289,567 | |
| | 65,838 | | | Series 2827, Class DG, 4.500%, 07/15/19 | | | 67,338 | |
| | | | | | | | |
PRINCIPAL
AMOUNT($) | | | SECURITY DESCRIPTION | | VALUE($) | |
| | | | | | | | |
| | 465,496 | | | Series 2949, Class GE, 5.500%, 03/15/35 | | | 516,080 | |
| | 694 | | | Series 2989, Class PO, PO, Zero Coupon, 06/15/23 | | | 687 | |
| | 300,000 | | | Series 3047, Class OD, 5.500%, 10/15/35 | | | 342,569 | |
| | 91,291 | | | Series 3085, Class VS, HB, IF, 24.084%, 12/15/35 | | | 154,003 | |
| | 30,953 | | | Series 3117, Class EO, PO, Zero Coupon, 02/15/36 | | | 27,250 | |
| | 31,225 | | | Series 3260, Class CS, IF, IO, 4.981%, 01/15/37 | | | 4,675 | |
| | 1,639,996 | | | Series 3380, Class SI, IF, IO, 5.211%, 10/15/37 | | | 288,890 | |
| | 43,062 | | | Series 3385, Class SN, IF, IO, 4.841%, 11/15/37 | | | 4,296 | |
| | 70,440 | | | Series 3387, Class SA, IF, IO, 5.261%, 11/15/37 | | | 9,551 | |
| | 383,281 | | | Series 3423, Class PB, 5.500%, 03/15/38 | | | 427,105 | |
| | 39,672 | | | Series 3451, Class SA, IF, IO, 4.891%, 05/15/38 | | | 5,683 | |
| | 246,042 | | | Series 3455, Class SE, IF, IO, 5.041%, 06/15/38 | | | 31,821 | |
| | 125,552 | | | Series 3688, Class NI, IO, 5.000%, 04/15/32 | | | 6,372 | |
| | 35,358 | | | Series 3759, Class HI, IO, 4.000%, 08/15/37 | | | 1,550 | |
| | 33,299 | | | Series 3772, Class IO, IO, 3.500%, 09/15/24 | | | 411 | |
| | 407,000 | | | Series 3786, Class PD, 4.500%, 01/15/41 | | | 453,501 | |
| | | | FHLMC STRIPS REMIC, | | | | |
| | 63,669 | | | Series 233, Class 11, IO, 5.000%, 09/15/35 | | | 13,367 | |
| | 67,730 | | | Series 239, Class S30, IF, IO, 6.541%, 08/15/36 | | | 12,883 | |
| | 330,124 | | | Series 262, Class 35, 3.500%, 07/15/42 | | | 339,980 | |
| | 313,234 | | | Series 299, Class 300, 3.000%, 01/15/43 | | | 310,986 | |
| | 164,662 | | | FHLMC Structured Pass-Through Securities, Series T-56, Class APO, PO, Zero Coupon, 05/25/43 | | | 147,965 | |
| | | | FHLMC Structured Pass-Through Securities Certificates REMIC, | | | | |
| | 11,763 | | | Series T-41, Class 3A, VAR, 5.662%, 07/25/32 | | | 12,810 | |
| | 78,836 | | | Series T-54, Class 2A, 6.500%, 02/25/43 | | | 92,872 | |
| | 35,291 | | | Series T-54, Class 3A, 7.000%, 02/25/43 | | | 41,266 | |
| | 18,569 | | | Series T-58, Class APO, PO, Zero Coupon, 09/25/43 | | | 15,541 | |
SEE NOTES TO FINANCIAL STATEMENTS.
| | | | | | |
| | | |
| 10 | | | | JPMORGAN INSURANCE TRUST | | JUNE 30, 2017 |
| | | | | | | | |
PRINCIPAL
AMOUNT($) | | | SECURITY DESCRIPTION | | VALUE($) | |
| | Collateralized Mortgage Obligations — continued | |
| | | | FHLMC, Multifamily Structured Pass-Through Certificates REMIC, | | | | |
| | 229,000 | | | Series K038, Class A2, 3.389%, 03/25/24 | | | 241,133 | |
| | 322,190 | | | Series KF12, Class A, VAR, 1.916%, 09/25/22 | | | 323,401 | |
| | 53,832 | | | Series KJ02, Class A2, 2.597%, 09/25/20 | | | 54,821 | |
| | 196,000 | | | Series KJ09, Class A2, 2.838%, 09/25/22 | | | 200,950 | |
| | 289,000 | | | Series KJ11, Class A2, 2.932%, 01/25/23 | | | 297,628 | |
| | 591,000 | | | Series KJ14, Class A2, 2.811%, 09/25/24 | | | 600,948 | |
| | 250,000 | | | Series KPLB, Class A, 2.770%, 05/25/25 | | | 251,214 | |
| | 132,622 | | | First Horizon Alternative Mortgage Securities Trust, Series 2005-FA8, Class 1A19, 5.500%, 11/25/35 | | | 118,841 | |
| | | | First Horizon Mortgage Pass-Through Trust, | | | | |
| | 107,645 | | | Series 2004-AR7, Class 2A2, VAR, 3.184%, 02/25/35 | | | 107,699 | |
| | 68,310 | | | Series 2005-AR1, Class 2A2, VAR, 3.173%, 04/25/35 | | | 69,088 | |
| | | | FNMA REMIC, | | | | |
| | 102 | | | Series 1988-16, Class B, 9.500%, 06/25/18 | | | 103 | |
| | 1,114 | | | Series 1989-83, Class H, 8.500%, 11/25/19 | | | 1,176 | |
| | 267 | | | Series 1990-1, Class D, 8.800%, 01/25/20 | | | 282 | |
| | 1,388 | | | Series 1990-10, Class L, 8.500%, 02/25/20 | | | 1,474 | |
| | 184 | | | Series 1990-93, Class G, 5.500%, 08/25/20 | | | 190 | |
| | 6 | | | Series 1990-140, Class K, HB, 652.145%, 12/25/20 | | | 57 | |
| | 360 | | | Series 1990-143, Class J, 8.750%, 12/25/20 | | | 388 | |
| | 10,221 | | | Series 1992-101, Class J, 7.500%, 06/25/22 | | | 11,218 | |
| | 2,841 | | | Series 1992-143, Class MA, 5.500%, 09/25/22 | | | 2,979 | |
| | 822,678 | | | Series 1993-84, Class M, 7.500%, 06/25/23 | | | 913,920 | |
| | 13,042 | | | Series 1993-146, Class E, PO, Zero Coupon, 05/25/23 | | | 12,399 | |
| | 32,852 | | | Series 1993-155, Class PJ, 7.000%, 09/25/23 | | | 36,279 | |
| | 1,019 | | | Series 1993-165, Class SD, IF, 13.489%, 09/25/23 | | | 1,227 | |
| | 5,081 | | | Series 1993-165, Class SK, IF, 12.500%, 09/25/23 | | | 5,687 | |
| | 43,298 | | | Series 1993-203, Class PL, 6.500%, 10/25/23 | | | 47,997 | |
| | | | | | | | |
PRINCIPAL
AMOUNT($) | | | SECURITY DESCRIPTION | | VALUE($) | |
| | | | | | | | |
| | 4,442 | | | Series 1993-205, Class H, PO, Zero Coupon, 09/25/23 | | | 4,215 | |
| | 145,648 | | | Series 1993-223, Class PZ, 6.500%, 12/25/23 | | | 157,178 | |
| | 45,629 | | | Series 1993-225, Class UB, 6.500%, 12/25/23 | | | 49,978 | |
| | 1,360 | | | Series 1993-230, Class FA, VAR, 1.816%, 12/25/23 | | | 1,363 | |
| | 102,937 | | | Series 1994-37, Class L, 6.500%, 03/25/24 | | | 112,295 | |
| | 866,970 | | | Series 1994-72, Class K, 6.000%, 04/25/24 | | | 978,049 | |
| | 9,670 | | | Series 1995-2, Class Z, 8.500%, 01/25/25 | | | 10,247 | |
| | 52,227 | | | Series 1995-19, Class Z, 6.500%, 11/25/23 | | | 57,895 | |
| | 1,747 | | | Series 1996-59, Class J, 6.500%, 08/25/22 | | | 1,880 | |
| | 53,029 | | | Series 1997-20, Class IB, IO, VAR, 1.840%, 03/25/27 | | | 1,633 | |
| | 11,191 | | | Series 1997-39, Class PD, 7.500%, 05/20/27 | | | 12,930 | |
| | 18,465 | | | Series 1997-46, Class PL, 6.000%, 07/18/27 | | | 20,271 | |
| | 43,179 | | | Series 1997-61, Class ZC, 7.000%, 02/25/23 | | | 47,282 | |
| | 6,288 | | | Series 1998-36, Class ZB, 6.000%, 07/18/28 | | | 7,088 | |
| | 15,471 | | | Series 1998-43, Class SA, IF, IO, 17.470%, 04/25/23 | | | 4,884 | |
| | 23,099 | | | Series 1998-46, Class GZ, 6.500%, 08/18/28 | | | 25,606 | |
| | 44,731 | | | Series 1998-58, Class PC, 6.500%, 10/25/28 | | | 50,166 | |
| | 101,799 | | | Series 1999-39, Class JH, IO, 6.500%, 08/25/29 | | | 11,275 | |
| | 3,672 | | | Series 2000-52, Class IO, IO, 8.500%, 01/25/31 | | | 803 | |
| | 28,525 | | | Series 2001-4, Class PC, 7.000%, 03/25/21 | | | 29,938 | |
| | 35,506 | | | Series 2001-30, Class PM, 7.000%, 07/25/31 | | | 41,238 | |
| | 121,123 | | | Series 2001-33, Class ID, IO, 6.000%, 07/25/31 | | | 27,108 | |
| | 53,268 | | | Series 2001-36, Class DE, 7.000%, 08/25/31 | | | 60,933 | |
| | 5,324 | | | Series 2001-44, Class PD, 7.000%, 09/25/31 | | | 6,141 | |
| | 89,808 | | | Series 2001-61, Class Z, 7.000%, 11/25/31 | | | 104,590 | |
SEE NOTES TO FINANCIAL STATEMENTS.
| | | | | | | | |
| | | |
| JUNE 30, 2017 | | JPMORGAN INSURANCE TRUST | | | | | 11 | |
JPMorgan Insurance Trust Core Bond Portfolio
SCHEDULE OF PORTFOLIO INVESTMENTS
AS OF JUNE 30, 2017 (Unaudited) (continued)
| | | | | | | | |
PRINCIPAL
AMOUNT($) | | | SECURITY DESCRIPTION | | VALUE($) | |
| | Collateralized Mortgage Obligations — continued | |
| | 10,173 | | | Series 2002-1, Class HC, 6.500%, 02/25/22 | | | 10,912 | |
| | 2,762 | | | Series 2002-1, Class SA, HB, IF, 21.235%, 02/25/32 | | | 4,586 | |
| | 115,890 | | | Series 2002-13, Class SJ, IF, IO, 1.600%, 03/25/32 | | | 6,120 | |
| | 82,847 | | | Series 2002-15, Class PO, PO, Zero Coupon, 04/25/32 | | | 75,812 | |
| | 39,992 | | | Series 2002-28, Class PK, 6.500%, 05/25/32 | | | 45,480 | |
| | 4,766 | | | Series 2002-62, Class ZE, 5.500%, 11/25/17 | | | 4,784 | |
| | 80,354 | | | Series 2002-68, Class SH, IF, IO, 6.791%, 10/18/32 | | | 17,991 | |
| | 8,076 | | | Series 2002-77, Class S, IF, 12.254%, 12/25/32 | | | 9,612 | |
| | 176,366 | | | Series 2003-7, Class A1, 6.500%, 12/25/42 | | | 201,009 | |
| | 193,093 | | | Series 2003-22, Class UD, 4.000%, 04/25/33 | | | 203,801 | |
| | 43,594 | | | Series 2003-44, Class IU, IO, 7.000%, 06/25/33 | | | 10,685 | |
| | 31,382 | | | Series 2003-47, Class PE, 5.750%, 06/25/33 | | | 35,288 | |
| | 6,752 | | | Series 2003-64, Class SX, IF, 11.124%, 07/25/33 | | | 8,226 | |
| | 4,555 | | | Series 2003-66, Class PA, 3.500%, 02/25/33 | | | 4,610 | |
| | 33,968 | | | Series 2003-71, Class DS, IF, 6.066%, 08/25/33 | | | 36,550 | |
| | 11,831 | | | Series 2003-91, Class SD, IF, 10.473%, 09/25/33 | | | 13,901 | |
| | 112,185 | | | Series 2003-116, Class SB, IF, IO, 6.384%, 11/25/33 | | | 22,866 | |
| | 549,249 | | | Series 2003-128, Class DY, 4.500%, 01/25/24 | | | 580,470 | |
| | 4,469 | | | Series 2003-130, Class SX, IF, 9.696%, 01/25/34 | | | 5,227 | |
| | 148,420 | | | Series 2003-131, Class CH, 5.500%, 01/25/34 | | | 167,388 | |
| | 13,563 | | | Series 2003-132, Class OA, PO, Zero Coupon, 08/25/33 | | | 12,618 | |
| | 49,543 | | | Series 2004-4, Class QM, IF, 11.768%, 06/25/33 | | | 57,609 | |
| | 17,388 | | | Series 2004-10, Class SC, HB, IF, 23.736%, 02/25/34 | | | 19,449 | |
| | 177,853 | | | Series 2004-35, Class AZ, 4.500%, 05/25/34 | | | 191,423 | |
| | 81,176 | | | Series 2004-36, Class SA, IF, 16.181%, 05/25/34 | | | 118,552 | |
| | | | | | | | |
PRINCIPAL
AMOUNT($) | | | SECURITY DESCRIPTION | | VALUE($) | |
| | | | | | | | |
| | 46,796 | | | Series 2004-46, Class SK, IF, 13.156%, 05/25/34 | | | 58,958 | |
| | 7,117 | | | Series 2004-51, Class SY, IF, 11.808%, 07/25/34 | | | 9,078 | |
| | 41,816 | | | Series 2004-61, Class SK, IF, 8.500%, 11/25/32 | | | 48,811 | |
| | 8,758 | | | Series 2004-76, Class CL, 4.000%, 10/25/19 | | | 8,827 | |
| | 447,874 | | | Series 2004-79, Class ZE, 5.500%, 11/25/34 | | | 527,554 | |
| | 687,847 | | | Series 2004-91, Class HC, 6.000%, 12/25/34 | | | 821,122 | |
| | 124,478 | | | Series 2005-45, Class DC, IF, 19.851%, 06/25/35 | | | 177,245 | |
| | 4,756 | | | Series 2005-52, Class PA, 6.500%, 06/25/35 | | | 4,865 | |
| | 146,796 | | | Series 2005-68, Class BC, 5.250%, 06/25/35 | | | 151,982 | |
| | 106,770 | | | Series 2005-84, Class XM, 5.750%, 10/25/35 | | | 118,240 | |
| | 106,571 | | | Series 2005-110, Class MN, 5.500%, 06/25/35 | | | 108,977 | |
| | 49,056 | | | Series 2006-22, Class AO, PO, Zero Coupon, 04/25/36 | | | 43,621 | |
| | 15,907 | | | Series 2006-46, Class SW, IF, 19.740%, 06/25/36 | | | 22,905 | |
| | 8,190 | | | Series 2006-59, Class QO, PO, Zero Coupon, 01/25/33 | | | 8,107 | |
| | 44,158 | | | Series 2006-110, Class PO, PO, Zero Coupon, 11/25/36 | | | 39,062 | |
| | 79,877 | | | Series 2006-117, Class GS, IF, IO, 5.434%, 12/25/36 | | | 11,157 | |
| | 42,337 | | | Series 2007-7, Class SG, IF, IO, 5.284%, 08/25/36 | | | 11,291 | |
| | 112,100 | | | Series 2007-53, Class SH, IF, IO, 4.884%, 06/25/37 | | | 17,843 | |
| | 131,136 | | | Series 2007-88, Class VI, IF, IO, 5.324%, 09/25/37 | | | 25,543 | |
| | 98,472 | | | Series 2007-100, Class SM, IF, IO, 5.234%, 10/25/37 | | | 15,709 | |
| | 94,180 | | | Series 2008-1, Class BI, IF, IO, 4.694%, 02/25/38 | | | 13,478 | |
| | 20,467 | | | Series 2008-16, Class IS, IF, IO, 4.984%, 03/25/38 | | | 2,765 | |
| | 113,156 | | | Series 2008-46, Class HI, IO, VAR, 1.774%, 06/25/38 | | | 6,442 | |
| | 35,189 | | | Series 2008-53, Class CI, IF, IO, 5.984%, 07/25/38 | | | 5,364 | |
| | 75,554 | | | Series 2009-112, Class ST, IF, IO, 5.034%, 01/25/40 | | | 12,084 | |
SEE NOTES TO FINANCIAL STATEMENTS.
| | | | | | |
| | | |
| 12 | | | | JPMORGAN INSURANCE TRUST | | JUNE 30, 2017 |
| | | | | | | | |
PRINCIPAL
AMOUNT($) | | | SECURITY DESCRIPTION | | VALUE($) | |
| | Collateralized Mortgage Obligations — continued | |
| | 39,697 | | | Series 2010-35, Class SB, IF, IO, 5.204%, 04/25/40 | | | 6,012 | |
| | 283,607 | | | Series 2010-80, Class PZ, 5.000%, 07/25/40 | | | 334,740 | |
| | 580,000 | | | Series 2010-102, Class PN, 5.000%, 09/25/40 | | | 657,264 | |
| | 282,942 | | | Series 2013-128, Class PO, PO, Zero Coupon, 12/25/43 | | | 231,807 | |
| | 226,860 | | | Series 2016-38, Class NA, 3.000%, 01/25/46 | | | 231,482 | |
| | 939 | | | Series G92-42, Class Z, 7.000%, 07/25/22 | | | 1,001 | |
| | 481 | | | Series G92-44, Class ZQ, 8.000%, 07/25/22 | | | 481 | |
| | 7,903 | | | Series G92-54, Class ZQ, 7.500%, 09/25/22 | | | 8,509 | |
| | 580 | | | Series G92-59, Class F, VAR, 1.345%, 10/25/22 | | | 587 | |
| | 1,940 | | | Series G92-61, Class Z, 7.000%, 10/25/22 | | | 2,113 | |
| | 4,620 | | | Series G92-66, Class KA, 6.000%, 12/25/22 | | | 4,920 | |
| | 21,849 | | | Series G92-66, Class KB, 7.000%, 12/25/22 | | | 23,986 | |
| | 5,870 | | | Series G93-1, Class KA, 7.900%, 01/25/23 | | | 6,505 | |
| | 6,283 | | | Series G93-17, Class SI, IF, 6.000%, 04/25/23 | | | 6,964 | |
| | | | FNMA REMIC Trust, | | | | |
| | 30,347 | | | Series 1999-W1, Class PO, PO, Zero Coupon, 02/25/29 | | | 26,449 | |
| | 120,400 | | | Series 1999-W4, Class A9, 6.250%, 02/25/29 | | | 130,816 | |
| | 271,506 | | | Series 2002-W7, Class A4, 6.000%, 06/25/29 | | | 299,289 | |
| | 246,120 | | | Series 2003-W1, Class 1A1, VAR, 5.542%, 12/25/42 | | | 268,319 | |
| | 35,210 | | | Series 2003-W1, Class 2A, VAR, 6.123%, 12/25/42 | | | 40,288 | |
| | 24,521 | | | Series 2004-W2, Class 2A2, 7.000%, 02/25/44 | | | 28,611 | |
| | | | FNMA STRIPS REMIC, | | | | |
| | 6,475 | | | Series 329, Class 1, PO, Zero Coupon, 01/25/33 | | | 5,746 | |
| | 27,406 | | | Series 365, Class 8, IO, 5.500%, 05/25/36 | | | 5,943 | |
| | | | FREMF Mortgage REMIC Trust, | | | | |
| | 220,000 | | | Series 2014-K40, Class C, VAR, 4.208%, 11/25/47 (e) | | | 219,233 | |
| | | | | | | | |
PRINCIPAL
AMOUNT($) | | | SECURITY DESCRIPTION | | VALUE($) | |
| | | | | | | | |
| | 640,000 | | | Series 2015-K44, Class B, VAR, 3.810%, 01/25/48 (e) | | | 645,774 | |
| | 500,000 | | | Series 2015-K45, Class B, VAR, 3.714%, 04/25/48 (e) | | | 497,813 | |
| | 180,000 | | | Series 2016-K59, Class B, VAR, 3.695%, 11/25/49 (e) | | | 175,617 | |
| | 110,000 | | | Series 2016-K722, Class B, VAR, 3.966%, 07/25/49 (e) | | | 112,182 | |
| | | | GMACM Mortgage Loan Trust, | | | | |
| | 61,610 | | | Series 2003-AR1, Class A4, VAR, 3.685%, 10/19/33 | | | 60,980 | |
| | 272,124 | | | Series 2005-AR3, Class 3A4, VAR, 3.735%, 06/19/35 | | | 266,705 | |
| | | | GNMA REMIC, | | | | |
| | 80,429 | | | Series 1994-7, Class PQ, 6.500%, 10/16/24 | | | 87,296 | |
| | 83,930 | | | Series 2000-21, Class Z, 9.000%, 03/16/30 | | | 97,079 | |
| | 1,173 | | | Series 2000-36, Class IK, IO, 9.000%, 11/16/30 | | | 170 | |
| | 204,576 | | | Series 2000-36, Class PB, 7.500%, 11/16/30 | | | 241,395 | |
| | 598,882 | | | Series 2001-10, Class PE, 6.500%, 03/16/31 | | | 652,779 | |
| | 87,135 | | | Series 2001-22, Class PS, IF, 17.962%, 03/17/31 | | | 120,635 | |
| | 52,052 | | | Series 2001-36, Class S, IF, IO, 6.878%, 08/16/31 | | | 14,963 | |
| | 6,928 | | | Series 2002-24, Class SB, IF, 10.168%, 04/16/32 | | | 8,323 | |
| | 3,268 | | | Series 2003-24, Class PO, PO, Zero Coupon, 03/16/33 | | | 2,938 | |
| | 24,191 | | | Series 2004-28, Class S, IF, 16.440%, 04/16/34 | | | 34,372 | |
| | 500,000 | | | Series 2006-38, Class OH, 6.500%, 08/20/36 | | | 602,243 | |
| | 106,678 | | | Series 2007-45, Class QA, IF, IO, 5.428%, 07/20/37 | | | 17,059 | |
| | 81,119 | | | Series 2007-76, Class SA, IF, IO, 5.318%, 11/20/37 | | | 13,636 | |
| | 71,286 | | | Series 2008-2, Class MS, IF, IO, 5.988%, 01/16/38 | | | 15,071 | |
| | 52,148 | | | Series 2008-55, Class SA, IF, IO, 4.988%, 06/20/38 | | | 8,149 | |
| | 32,638 | | | Series 2009-6, Class SA, IF, IO, 4.928%, 02/16/39 | | | 4,363 | |
| | 107,751 | | | Series 2009-6, Class SH, IF, IO, 4.828%, 02/20/39 | | | 14,902 | |
| | 79,291 | | | Series 2009-14, Class KI, IO, 6.500%, 03/20/39 | | | 17,649 | |
SEE NOTES TO FINANCIAL STATEMENTS.
| | | | | | | | |
| | | |
| JUNE 30, 2017 | | JPMORGAN INSURANCE TRUST | | | | | 13 | |
JPMorgan Insurance Trust Core Bond Portfolio
SCHEDULE OF PORTFOLIO INVESTMENTS
AS OF JUNE 30, 2017 (Unaudited) (continued)
| | | | | | | | |
PRINCIPAL
AMOUNT($) | | | SECURITY DESCRIPTION | | VALUE($) | |
| | Collateralized Mortgage Obligations — continued | |
| | 58,531 | | | Series 2009-14, Class NI, IO, 6.500%, 03/20/39 | | | 15,276 | |
| | 157,795 | | | Series 2009-22, Class SA, IF, IO, 5.058%, 04/20/39 | | | 20,277 | |
| | 133,996 | | | Series 2009-31, Class TS, IF, IO, 5.088%, 03/20/39 | | | 13,944 | |
| | 135,674 | | | Series 2009-64, Class SN, IF, IO, 4.928%, 07/16/39 | | | 16,083 | |
| | 67,348 | | | Series 2009-79, Class OK, PO, Zero Coupon, 11/16/37 | | | 61,464 | |
| | 44,175 | | | Series 2009-102, Class SM, IF, IO, 5.228%, 06/16/39 | | | 2,907 | |
| | 276,621 | | | Series 2009-106, Class ST, IF, IO, 4.788%, 02/20/38 | | | 44,344 | |
| | 93,987 | | | Series 2010-130, Class CP, 7.000%, 10/16/40 | | | 108,971 | |
| | 173,761 | | | Series 2011-75, Class SM, IF, IO, 5.388%, 05/20/41 | | | 32,532 | |
| | 678,225 | | | Series 2011-H19, Class FA, VAR, 1.463%, 08/20/61 | | | 677,669 | |
| | 674,497 | | | Series 2012-H23, Class SA, VAR, 1.523%, 10/20/62 | | | 673,397 | |
| | 703,394 | | | Series 2013-H08, Class FC, VAR, 1.443%, 02/20/63 | | | 701,147 | |
| | 434,896 | | | Series 2013-H09, Class HA, 1.650%, 04/20/63 | | | 429,459 | |
| | 349,351 | | | Series 2014-H17, Class FC, VAR, 1.493%, 07/20/64 | | | 348,676 | |
| | 482,380 | | | Series 2015-137, Class WA, VAR, 5.474%, 01/20/38 | | | 539,405 | |
| | 789,362 | | | Series 2015-H16, Class FG, VAR, 1.433%, 07/20/65 | | | 785,709 | |
| | 917,883 | | | Series 2015-H30, Class FE, VAR, 1.593%, 11/20/65 | | | 920,639 | |
| | 225,752 | | | Series 2016-H11, Class FD, VAR, 2.202%, 05/20/66 | | | 227,967 | |
| | 172,440 | | | Series 2016-H26, Class FC, VAR, 1.993%, 12/20/66 | | | 175,782 | |
| | 540,000 | | | Series 2017-H14, Class FV, VAR, 1.650%, 06/20/67 | | | 539,072 | |
| | | | GSR Mortgage Loan Trust, | | | | |
| | 52,894 | | | Series 2004-6F, Class 1A2, 5.000%, 05/25/34 | | | 53,478 | |
| | 176,983 | | | Series 2004-6F, Class 3A4, 6.500%, 05/25/34 | | | 188,299 | |
| | 70,837 | | | Series 2004-13F, Class 3A3, 6.000%, 11/25/34 | | | 72,531 | |
| | 43,383 | | | Impac Secured Assets Trust, Series 2006-1, Class 2A1, VAR, 1.566%, 05/25/36 | | | 41,196 | |
| | | | | | | | |
PRINCIPAL
AMOUNT($) | | | SECURITY DESCRIPTION | | VALUE($) | |
| | | | | | | | |
| | 54,149 | | | JP Morgan Mortgage Trust, Series 2006-A2, Class 5A3, VAR, 3.142%, 11/25/33 | | | 55,033 | |
| | 33,388 | | | MASTR Adjustable Rate Mortgages Trust, Series 2004-13, Class 2A1, VAR, 3.081%, 04/21/34 | | | 34,323 | |
| | | | MASTR Alternative Loan Trust, | | | | |
| | 70,090 | | | Series 2003-9, Class 8A1, 6.000%, 01/25/34 | | | 72,326 | |
| | 113,260 | | | Series 2004-4, Class 10A1, 5.000%, 05/25/24 | | | 117,816 | |
| | 120,593 | | | Series 2004-6, Class 7A1, 6.000%, 07/25/34 | | | 120,929 | |
| | 13,120 | | | Series 2004-7, Class 30PO, PO, Zero Coupon, 08/25/34 | | | 10,666 | |
| | 26,805 | | | Series 2004-8, Class 6A1, 5.500%, 09/25/19 | | | 27,198 | |
| | 22,064 | | | Series 2004-10, Class 1A1, 4.500%, 09/25/19 | | | 22,135 | |
| | | | MASTR Asset Securitization Trust, | | | | |
| | 148,783 | | | Series 2003-11, Class 9A6, 5.250%, 12/25/33 | | | 150,379 | |
| | 2,040 | | | Series 2003-12, Class 15PO, PO, Zero Coupon, 12/25/18 | | | 2,035 | |
| | 5,300 | | | Series 2004-6, Class 15PO, PO, Zero Coupon, 07/25/19 | | | 5,195 | |
| | 4,292 | | | Series 2004-8, Class PO, PO, Zero Coupon, 08/25/19 | | | 4,126 | |
| | 13,833 | | | Series 2004-10, Class 15PO, PO, Zero Coupon, 10/25/19 | | | 13,397 | |
| | 27,686 | | | MASTR Resecuritization Trust, Series 2005-PO, Class 3PO, PO, Zero Coupon, 05/28/35 (e) | | | 20,987 | |
| | 34,136 | | | MortgageIT Trust, Series 2005-1, Class 1A1, VAR, 1.856%, 02/25/35 | | | 33,111 | |
| | 37,817 | | | NACC Reperforming Loan REMIC Trust, Series 2004-R2, Class A1, VAR, 6.500%, 10/25/34 (e) | | | 37,040 | |
| | 264,654 | | | PHH Alternative Mortgage Trust, Series 2007-2, Class 2X, IO, 6.000%, 05/25/37 | | | 64,936 | |
| | | | RALI Trust, | | | | |
| | 862 | | | Series 2003-QS3, Class A2, IF, 13.825%, 02/25/18 | | | 882 | |
| | 8,956 | | | Series 2003-QS9, Class A3, IF, IO, 6.334%, 05/25/18 | | | 146 | |
| | 18,073 | | | Series 2003-QS14, Class A1, 5.000%, 07/25/18 | | | 18,094 | |
| | 5,811 | | | Series 2003-QS18, Class A1, 5.000%, 09/25/18 | | | 5,831 | |
SEE NOTES TO FINANCIAL STATEMENTS.
| | | | | | |
| | | |
| 14 | | | | JPMORGAN INSURANCE TRUST | | JUNE 30, 2017 |
| | | | | | | | |
PRINCIPAL
AMOUNT($) | | | SECURITY DESCRIPTION | | VALUE($) | |
| | Collateralized Mortgage Obligations — continued | |
| | 1,991 | | | Residential Asset Securitization Trust, Series 2003-A14, Class A1, 4.750%, 02/25/19 | | | 1,916 | |
| | 69,348 | | | RFMSI Trust, Series 2005-SA4, Class 1A1, VAR, 3.270%, 09/25/35 | | | 57,476 | |
| | 3,558 | | | SACO I, Inc., Series 1997-2, Class 1A5, 7.000%, 08/25/36 (e) | | | 3,578 | |
| | | | Springleaf Mortgage Loan Trust, | | | | |
| | 48,266 | | | Series 2013-2A, Class A, VAR, 1.780%, 12/25/65 (e) | | | 48,168 | |
| | 125,000 | | | Series 2013-2A, Class M1, VAR, 3.520%, 12/25/65 (e) | | | 124,798 | |
| | 68,059 | | | Structured Asset Securities Corp. Mortgage Pass-Through Certificates, Series 2003-33H, Class 1A1, 5.500%, 10/25/33 | | | 69,295 | |
| | | | Vendee Mortgage Trust, | | | | |
| | 36,947 | | | Series 1994-1, Class 1, VAR, 5.364%, 02/15/24 | | | 39,279 | |
| | 484,008 | | | Series 1994-1, Class 2ZB, 6.500%, 02/15/24 | | | 529,037 | |
| | 90,552 | | | Series 1996-1, Class 1Z, 6.750%, 02/15/26 | | | 101,832 | |
| | 48,642 | | | Series 1996-2, Class 1Z, 6.750%, 06/15/26 | | | 54,393 | |
| | 182,804 | | | Series 1997-1, Class 2Z, 7.500%, 02/15/27 | | | 209,258 | |
| | 47,271 | | | Series 1998-1, Class 2E, 7.000%, 03/15/28 | | | 54,534 | |
| | | | WaMu Mortgage Pass-Through Certificates Trust, | | | | |
| | 12,276 | | | Series 2003-AR8, Class A, VAR, 2.701%, 08/25/33 | | | 12,514 | |
| | 54,339 | | | Series 2003-AR9, Class 1A6, VAR, 2.795%, 09/25/33 | | | 55,037 | |
| | 20,225 | | | Series 2004-AR3, Class A2, VAR, 3.134%, 06/25/34 | | | 20,497 | |
| | | | Washington Mutual Mortgage Pass-Through Certificates WMALT Trust, | | | | |
| | 855,169 | | | Series 2005-2, Class 1A4, IF, IO, 3.834%, 04/25/35 | | | 117,892 | |
| | 299,643 | | | Series 2005-2, Class 2A3, IF, IO, 3.784%, 04/25/35 | | | 38,790 | |
| | 244,819 | | | Series 2005-3, Class CX, IO, 5.500%, 05/25/35 | | | 48,586 | |
| | 213,949 | | | Series 2005-4, Class CB7, 5.500%, 06/25/35 | | | 200,239 | |
| | 8,366 | | | Series 2005-4, Class DP, PO, Zero Coupon, 06/25/20 | | | 7,919 | |
| | | | | | | | |
PRINCIPAL
AMOUNT($) | | | SECURITY DESCRIPTION | | VALUE($) | |
| | | | | | | | |
| | 68,057 | | | Series 2005-6, Class 2A4, 5.500%, 08/25/35 | | | 65,968 | |
| | | | Wells Fargo Mortgage-Backed Securities Trust, | | | | |
| | 14,813 | | | Series 2003-K, Class 1A1, VAR, 2.904%, 11/25/33 | | | 14,917 | |
| | 29,625 | | | Series 2003-K, Class 1A2, VAR, 2.904%, 11/25/33 | | | 29,960 | |
| | 35,756 | | | Series 2004-EE, Class 3A1, VAR, 3.583%, 12/25/34 | | | 36,981 | |
| | 86,589 | | | Series 2004-P, Class 2A1, VAR, 3.031%, 09/25/34 | | | 88,308 | |
| | 155,377 | | | Series 2005-AR3, Class 1A1, VAR, 3.311%, 03/25/35 | | | 158,869 | |
| | 46,723 | | | Series 2005-AR8, Class 2A1, VAR, 3.260%, 06/25/35 | | | 47,723 | |
| | 44,107 | | | Series 2005-AR16, Class 2A1, VAR, 3.185%, 02/25/34 | | | 44,942 | |
| | | | | | | | |
| | | | Total Collateralized Mortgage Obligations
(Cost $35,644,125) | | | 37,136,477 | |
| | | | | | | | |
| | Commercial Mortgage-Backed Securities — 2.4% | |
| | 24,717 | | | A10 Term Asset Financing LLC, Series 2013-2, Class A, 2.620%, 11/15/27 (e) | | | 24,704 | |
| | 286,000 | | | BAMLL Re-REMIC Trust, Series 2015-FR11, Class A705, VAR, 1.843%, 09/27/44 (e) | | | 279,069 | |
| | 100,000 | | | BB-UBS Trust, Series 2012-SHOW, Class A, 3.430%, 11/05/36 (e) | | | 102,366 | |
| | 332,229 | | | CD Commercial Mortgage Trust, Series 2007-CD4, Class XC, IO, VAR, 0.744%, 12/11/49 (e) | | | 24 | |
| | 86,477 | | | Citigroup Commercial Mortgage Trust, Series 2013-SMP, Class A, 2.110%, 01/12/30 (e) | | | 86,593 | |
| | | | Commercial Mortgage Trust, | | | | |
| | 125,000 | | | Series 2013-SFS, Class A2, VAR, 3.086%, 04/12/35 (e) | | | 126,520 | |
| | 200,000 | | | Series 2014-CR19, Class A5, 3.796%, 08/10/47 | | | 209,966 | |
| | 156,000 | | | Series 2015-CR25, Class A4, 3.759%, 08/10/48 | | | 163,206 | |
| | 100,000 | | | CSMC OA LLC, Series 2014-USA, Class D, 4.373%, 09/15/37 (e) | | | 94,389 | |
| | | | FNMA — ACES, | | | | |
| | 1,000,000 | | | Series 2014-M3, Class A2, VAR, 3.501%, 01/25/24 | | | 1,061,082 | |
| | 1,000,000 | | | Series 2015-M3, Class A2, 2.723%, 10/25/24 | | | 1,003,201 | |
| | 389,000 | | | Series 2015-M10, Class A2, VAR, 3.092%, 04/25/27 | | | 394,878 | |
SEE NOTES TO FINANCIAL STATEMENTS.
| | | | | | | | |
| | | |
| JUNE 30, 2017 | | JPMORGAN INSURANCE TRUST | | | | | 15 | |
JPMorgan Insurance Trust Core Bond Portfolio
SCHEDULE OF PORTFOLIO INVESTMENTS
AS OF JUNE 30, 2017 (Unaudited) (continued)
| | | | | | | | |
PRINCIPAL
AMOUNT($) | | | SECURITY DESCRIPTION | | VALUE($) | |
| | Commercial Mortgage-Backed Securities — continued | |
| | 352,816 | | | Series 2015-M17, Class FA, VAR, 1.981%, 11/25/22 | | | 354,797 | |
| | 500,000 | | | Series 2016-M2, Class AV2, 2.152%, 01/25/23 | | | 493,968 | |
| | 305,000 | | | Series 2017-M5, Class A2, 3.303%, 04/25/29 | | | 309,620 | |
| | 278,000 | | | Series 2017-M7, Class A2, VAR, 2.961%, 02/25/27 | | | 278,898 | |
| | 429,000 | | | FNMA Grantor Trust, Series 2017-T1, Class A, 2.898%, 06/25/27 | | | 425,966 | |
| | 122,000 | | | GS Mortgage Securities Corp. Trust, Series 2013-NYC5, Class A, 2.318%, 01/10/30 (e) | | | 122,305 | |
| | 408,351 | | | Morgan Stanley Capital I Trust, Series 2006-IQ12, Class X1, IO, VAR, 0.650%, 12/15/43 (e) | | | 5 | |
| | 102,297 | | | PFP Ltd., (Cayman Islands), Series 2015-2, Class A, VAR, 2.622%, 07/14/34 (e) | | | 102,289 | |
| | 250,000 | | | RAIT Trust, Series 2015-FL5, Class B, VAR, 5.059%, 01/15/31 (e) | | | 250,408 | |
| | 44,322 | | | Resource Capital Corp. Ltd., (Cayman Islands), Series 2015-CRE4, Class A, VAR, 2.572%, 08/15/32 (e) | | | 44,199 | |
| | 116,000 | | | UBS-BAMLL Trust, Series 2012-WRM, Class A, 3.663%, 06/10/30 (e) | | | 118,988 | |
| | 104,000 | | | UBS-Barclays Commercial Mortgage Trust, Series 2012-C2, Class A4, 3.525%, 05/10/63 | | | 108,272 | |
| | 200,000 | | | VNDO Mortgage Trust, Series 2013-PENN, Class A, 3.808%, 12/13/29 (e) | | | 209,481 | |
| | 110,000 | | | WFRBS Commercial Mortgage Trust, Series 2011-C3, Class A4, 4.375%, 03/15/44 (e) | | | 116,819 | |
| | | | | | | | |
| | | | Total Commercial Mortgage-Backed Securities
(Cost $6,400,268) | | | 6,482,013 | |
| | | | | | | | |
| | Corporate Bonds — 26.0% | |
| | | | Consumer Discretionary — 1.7% | |
| | | | Automobiles — 0.4% | |
| | 45,000 | | | BMW US Capital LLC, (Germany), 2.250%, 09/15/23 (e) | | | 43,688 | |
| | | | Daimler Finance North America LLC, (Germany), | | | | |
| | 150,000 | | | 1.750%, 10/30/19 (e) | | | 149,033 | |
| | 150,000 | | | 1.875%, 01/11/18 (e) | | | 150,178 | |
| | | | Ford Motor Co., | | | | |
| | 46,000 | | | 4.346%, 12/08/26 | | | 47,374 | |
| | 240,000 | | | 7.450%, 07/16/31 | | | 303,479 | |
| | 240,000 | | | General Motors Co., 6.600%, 04/01/36 | | | 278,342 | |
| | | | | | | | |
PRINCIPAL
AMOUNT($) | | | SECURITY DESCRIPTION | | VALUE($) | |
| | | | | | | | |
| | | | Automobiles — continued | |
| | | | Hyundai Capital America, | | | | |
| | 34,000 | | | 2.000%, 07/01/19 (e) | | | 33,729 | |
| | 65,000 | | | 2.400%, 10/30/18 (e) | | | 65,127 | |
| | | | Nissan Motor Acceptance Corp., | | | | |
| | 29,000 | | | 1.900%, 09/14/21 (e) | | | 28,309 | |
| | 50,000 | | | 2.800%, 01/13/22 (e) | | | 50,494 | |
| | | | | | | | |
| | | | | | | 1,149,753 | |
| | | | | | | | |
| | | | Diversified Consumer Services — 0.0% (g) | |
| | 86,000 | | | President and Fellows of Harvard College, 3.300%, 07/15/56 | | | 82,412 | |
| | | | | | | | |
| | | | Hotels, Restaurants & Leisure — 0.1% | |
| | 33,000 | | | Darden Restaurants, Inc., 3.850%, 05/01/27 | | | 33,533 | |
| | 60,000 | | | McDonald’s Corp., 4.700%, 12/09/35 | | | 66,294 | |
| | 28,000 | | | Starbucks Corp., 2.700%, 06/15/22 | | | 28,517 | |
| | | | | | | | |
| | | | | | | 128,344 | |
| | | | | | | | |
| | | | Internet & Direct Marketing Retail — 0.1% | |
| | | | Amazon.com, Inc., | | | | |
| | 66,000 | | | 3.800%, 12/05/24 | | | 70,361 | |
| | 65,000 | | | 4.800%, 12/05/34 | | | 74,907 | |
| | | | | | | | |
| | | | | | | 145,268 | |
| | | | | | | | |
| | | | Media — 1.0% | |
| | | | 21st Century Fox America, Inc., | | | | |
| | 50,000 | | | 6.650%, 11/15/37 | | | 66,034 | |
| | 50,000 | | | 7.250%, 05/18/18 | | | 52,319 | |
| | 150,000 | | | 7.300%, 04/30/28 | | | 191,715 | |
| | | | CBS Corp., | | | | |
| | 99,000 | | | 3.700%, 08/15/24 | | | 101,596 | |
| | 42,000 | | | 4.000%, 01/15/26 | | | 43,464 | |
| | | | Charter Communications Operating LLC, | | | | |
| | 194,000 | | | 4.908%, 07/23/25 | | | 209,600 | |
| | 100,000 | | | 5.375%, 05/01/47 (e) | | | 105,936 | |
| | 75,000 | | | Comcast Cable Holdings LLC, 10.125%, 04/15/22 | | | 95,160 | |
| | | | Comcast Corp., | | | | |
| | 89,000 | | | 4.200%, 08/15/34 | | | 94,347 | |
| | 87,000 | | | 4.250%, 01/15/33 | | | 92,816 | |
| �� | 130,000 | | | 6.450%, 03/15/37 | | | 173,165 | |
| | 35,000 | | | 6.500%, 11/15/35 | | | 46,448 | |
| | | | Cox Communications, Inc., | | | | |
| | 67,000 | | | 3.350%, 09/15/26 (e) | | | 65,797 | |
| | 20,000 | | | 8.375%, 03/01/39 (e) | | | 26,534 | |
| | | | Discovery Communications LLC, | | | | |
| | 78,000 | | | 4.375%, 06/15/21 | | | 82,321 | |
| | 30,000 | | | 6.350%, 06/01/40 | | | 33,102 | |
SEE NOTES TO FINANCIAL STATEMENTS.
| | | | | | |
| | | |
| 16 | | | | JPMORGAN INSURANCE TRUST | | JUNE 30, 2017 |
| | | | | | | | |
PRINCIPAL
AMOUNT($) | | | SECURITY DESCRIPTION | | VALUE($) | |
| | Corporate Bonds — continued | |
| | | | Media — continued | |
| | 100,000 | | | Historic TW, Inc., 9.150%, 02/01/23 | | | 128,257 | |
| | 75,000 | | | NBCUniversal Media LLC, 5.950%, 04/01/41 | | | 96,150 | |
| | | | Time Warner Cable LLC, | | | | |
| | 50,000 | | | 6.550%, 05/01/37 | | | 59,768 | |
| | 50,000 | | | 6.750%, 07/01/18 | | | 52,311 | |
| | 50,000 | | | 7.300%, 07/01/38 | | | 63,975 | |
| | 175,000 | | | Time Warner Entertainment Co. LP, 8.375%, 07/15/33 | | | 240,470 | |
| | | | Time Warner, Inc., | | | | |
| | 200,000 | | | 3.550%, 06/01/24 | | | 202,680 | |
| | 35,000 | | | 4.750%, 03/29/21 | | | 37,689 | |
| | 75,000 | | | 6.200%, 03/15/40 | | | 89,679 | |
| | 7,000 | | | 6.250%, 03/29/41 | | | 8,562 | |
| | | | Viacom, Inc., | | | | |
| | 22,000 | | | 3.250%, 03/15/23 | | | 21,803 | |
| | 58,000 | | | 3.875%, 04/01/24 | | | 59,062 | |
| | 16,000 | | | 4.850%, 12/15/34 | | | 15,918 | |
| | 70,000 | | | 6.875%, 04/30/36 | | | 81,873 | |
| | | | Walt Disney Co. (The), | | | | |
| | 31,000 | | | 1.850%, 07/30/26 | | | 28,220 | |
| | 50,000 | | | 2.950%, 06/15/27 | | | 49,531 | |
| | 14,000 | | | 3.000%, 07/30/46 | | | 12,260 | |
| | | | | | | | |
| | | | | | | 2,728,562 | |
| | | | | | | | |
| | | | Multiline Retail — 0.0% (g) | |
| | | | Macy’s Retail Holdings, Inc., | | | | |
| | 18,000 | | | 4.375%, 09/01/23 | | | 17,685 | |
| | 60,000 | | | 6.375%, 03/15/37 | | | 61,207 | |
| | 30,000 | | | 6.900%, 04/01/29 | | | 32,030 | |
| | | | | | | | |
| | | | | | | 110,922 | |
| | | | | | | | |
| | | | Specialty Retail — 0.1% | |
| | 41,000 | | | AutoZone, Inc., 3.750%, 06/01/27 | | | 41,094 | |
| | | | Home Depot, Inc. (The), | | | | |
| | 21,000 | | | 2.125%, 09/15/26 | | | 19,634 | |
| | 37,000 | | | 3.000%, 04/01/26 | | | 37,201 | |
| | 13,000 | | | 3.500%, 09/15/56 | | | 11,800 | |
| | 34,000 | | | 4.200%, 04/01/43 | | | 36,150 | |
| | 72,000 | | | Lowe’s Cos., Inc., 3.375%, 09/15/25 | | | 74,379 | |
| | 80,000 | | | O’Reilly Automotive, Inc., 3.550%, 03/15/26 | | | 80,556 | |
| | | | | | | | |
| | | | | | | 300,814 | |
| | | | | | | | |
| | | | Total Consumer Discretionary | | | 4,646,075 | |
| | | | | | | | |
| | | | | | | | |
PRINCIPAL
AMOUNT($) | | | SECURITY DESCRIPTION | | VALUE($) | |
| | | | | | | | |
| | | | Consumer Staples — 1.1% | |
| | | | Beverages — 0.5% | |
| | | | Anheuser-Busch InBev Finance, Inc., (Belgium), | | | | |
| | 23,000 | | | 1.900%, 02/01/19 | | | 23,052 | |
| | 234,000 | | | 3.300%, 02/01/23 | | | 240,927 | |
| | 260,000 | | | 3.650%, 02/01/26 | | | 267,896 | |
| | 241,000 | | | 4.700%, 02/01/36 | | | 266,245 | |
| | 131,000 | | | Anheuser-Busch InBev Worldwide, Inc., (Belgium), 4.439%, 10/06/48 (e) | | | 139,586 | |
| | 38,000 | | | Brown-Forman Corp., 4.500%, 07/15/45 | | | 41,549 | |
| | 25,000 | | | Constellation Brands, Inc., 4.250%, 05/01/23 | | | 26,611 | |
| | 95,000 | | | Diageo Capital plc, (United Kingdom), 5.750%, 10/23/17 | | | 96,223 | |
| | 20,000 | | | Dr Pepper Snapple Group, Inc., 3.430%, 06/15/27 (e) | | | 20,142 | |
| | 53,000 | | | Molson Coors Brewing Co., 3.000%, 07/15/26 | | | 50,983 | |
| | | | PepsiCo, Inc., | | | | |
| | 70,000 | | | 3.450%, 10/06/46 | | | 65,873 | |
| | 107,000 | | | 4.450%, 04/14/46 | | | 116,808 | |
| | | | | | | | |
| | | | | | | 1,355,895 | |
| | | | | | | | |
| | | | Food & Staples Retailing — 0.3% | |
| | 21,000 | | | Costco Wholesale Corp., 2.250%, 02/15/22 | | | 21,032 | |
| | | | CVS Health Corp., | | | | |
| | 102,000 | | | 2.125%, 06/01/21 | | | 100,747 | |
| | 62,000 | | | 2.875%, 06/01/26 | | | 60,090 | |
| | 116,000 | | | 4.000%, 12/05/23 | | | 122,515 | |
| | 16,000 | | | 5.300%, 12/05/43 | | | 18,463 | |
| | | | Kroger Co. (The), | | | | |
| | 67,000 | | | 4.000%, 02/01/24 | | | 69,418 | |
| | 18,000 | | | 5.400%, 07/15/40 | | | 19,418 | |
| | 100,000 | | | 7.500%, 04/01/31 | | | 132,620 | |
| | 50,000 | | | Walgreen Co., 4.400%, 09/15/42 | | | 50,130 | |
| | | | Walgreens Boots Alliance, Inc., | | | | |
| | 47,000 | | | 3.800%, 11/18/24 | | | 48,818 | |
| | 23,000 | | | 4.500%, 11/18/34 | | | 24,161 | |
| | 70,000 | | | Wal-Mart Stores, Inc., 6.500%, 08/15/37 | | | 98,709 | |
| | | | | | | | |
| | | | | | | 766,121 | |
| | | | | | | | |
| | | | Food Products — 0.3% | |
| | | | Bunge Ltd. Finance Corp., | | | | |
| | 28,000 | | | 3.250%, 08/15/26 | | | 26,756 | |
| | 55,000 | | | 8.500%, 06/15/19 | | | 61,516 | |
| | | | Kraft Heinz Foods Co., | | | | |
| | 20,000 | | | 3.500%, 06/06/22 | | | 20,706 | |
| | 15,000 | | | 3.950%, 07/15/25 | | | 15,470 | |
SEE NOTES TO FINANCIAL STATEMENTS.
| | | | | | | | |
| | | |
| JUNE 30, 2017 | | JPMORGAN INSURANCE TRUST | | | | | 17 | |
JPMorgan Insurance Trust Core Bond Portfolio
SCHEDULE OF PORTFOLIO INVESTMENTS
AS OF JUNE 30, 2017 (Unaudited) (continued)
| | | | | | | | |
PRINCIPAL
AMOUNT($) | | | SECURITY DESCRIPTION | | VALUE($) | |
| | Corporate Bonds — continued | |
| | | | Food Products — continued | |
| | 100,000 | | | 5.000%, 07/15/35 | | | 108,251 | |
| | 31,000 | | | 5.375%, 02/10/20 | | | 33,409 | |
| | 122,000 | | | 6.125%, 08/23/18 | | | 127,806 | |
| | 30,000 | | | 6.750%, 03/15/32 | | | 37,154 | |
| | 133,000 | | | 6.875%, 01/26/39 | | | 171,249 | |
| | 27,000 | | | Mead Johnson Nutrition Co., (United Kingdom), 4.125%, 11/15/25 | | | 29,115 | |
| | 23,000 | | | Smithfield Foods, Inc., 4.250%, 02/01/27 (e) | | | 23,588 | |
| | | | Tyson Foods, Inc., | | | | |
| | 49,000 | | | 3.950%, 08/15/24 | | | 51,278 | |
| | 100,000 | | | 4.875%, 08/15/34 | | | 109,522 | |
| | | | | | | | |
| | | | | | | 815,820 | |
| | | | | | | | |
| | | | Household Products — 0.0% (g) | |
| | 41,659 | | | Procter & Gamble — ESOP, Series A, 9.360%, 01/01/21 | | | 47,156 | |
| | | | | | | | |
| | | | Total Consumer Staples | | | 2,984,992 | |
| | | | | | | | |
| | | | Energy — 2.9% | |
| | | | Energy Equipment & Services — 0.1% | |
| | 40,000 | | | Baker Hughes, Inc., 5.125%, 09/15/40 | | | 45,758 | |
| | | | Halliburton Co., | | | | |
| | 54,000 | | | 3.500%, 08/01/23 | | | 55,574 | |
| | 77,000 | | | 4.850%, 11/15/35 | | | 82,410 | |
| | 60,000 | | | 6.700%, 09/15/38 | | | 76,928 | |
| | | | Nabors Industries, Inc., | | | | |
| | 15,000 | | | 4.625%, 09/15/21 | | | 14,247 | |
| | 15,000 | | | 5.000%, 09/15/20 | | | 14,962 | |
| | 60,000 | | | Schlumberger Holdings Corp., 3.625%, 12/21/22 (e) | | | 62,420 | |
| | | | | | | | |
| | | | | | | 352,299 | |
| | | | | | | | |
| | | | Oil, Gas & Consumable Fuels — 2.8% | |
| | | | Apache Corp., | | | | |
| | 50,000 | | | 6.000%, 01/15/37 | | | 57,911 | |
| | 50,000 | | | 6.900%, 09/15/18 | | | 52,837 | |
| | 73,000 | | | APT Pipelines Ltd., (Australia), 4.250%, 07/15/27 (e) | | | 74,740 | |
| | | | Boardwalk Pipelines LP, | | | | |
| | 22,000 | | | 4.450%, 07/15/27 | | | 22,526 | |
| | 118,000 | | | 4.950%, 12/15/24 | | | 125,017 | |
| | 16,000 | | | 5.950%, 06/01/26 | | | 17,818 | |
| | | | BP Capital Markets plc, (United Kingdom), | | | | |
| | 35,000 | | | 3.017%, 01/16/27 | | | 34,055 | |
| | 221,000 | | | 3.224%, 04/14/24 | | | 223,126 | |
| | 15,000 | | | 3.506%, 03/17/25 | | | 15,357 | |
| | | | | | | | |
PRINCIPAL
AMOUNT($) | | | SECURITY DESCRIPTION | | VALUE($) | |
| | | | | | | | |
| | | | Oil, Gas & Consumable Fuels — continued | |
| | 50,000 | | | 3.588%, 04/14/27 | | | 50,738 | |
| | 140,000 | | | 3.723%, 11/28/28 | | | 143,953 | |
| | 150,000 | | | 3.814%, 02/10/24 | | | 156,443 | |
| | | | Buckeye Partners LP, | | | | |
| | 32,000 | | | 3.950%, 12/01/26 | | | 31,678 | |
| | 30,000 | | | 4.350%, 10/15/24 | | | 30,902 | |
| | 15,000 | | | 4.875%, 02/01/21 | | | 15,878 | |
| | 100,000 | | | 5.850%, 11/15/43 | | | 107,402 | |
| | | | Canadian Natural Resources Ltd., (Canada), | | | | |
| | 65,000 | | | 3.900%, 02/01/25 | | | 65,804 | |
| | 50,000 | | | 5.850%, 02/01/35 | | | 55,509 | |
| | 100,000 | | | 5.900%, 02/01/18 | | | 102,298 | |
| | | | Cenovus Energy, Inc., (Canada), | | | | |
| | 13,000 | | | 3.000%, 08/15/22 | | | 12,428 | |
| | 23,000 | | | 4.450%, 09/15/42 | | | 18,749 | |
| | 158,000 | | | 6.750%, 11/15/39 | | | 166,151 | |
| | | | Chevron Corp., | | | | |
| | 20,000 | | | 2.355%, 12/05/22 | | | 19,905 | |
| | 150,000 | | | 2.411%, 03/03/22 | | | 150,557 | |
| | 200,000 | | | 2.566%, 05/16/23 | | | 200,311 | |
| | 200,000 | | | CNOOC Nexen Finance 2014 ULC, (China), 4.250%, 04/30/24 | | | 210,484 | |
| | | | ConocoPhillips Co., | | | | |
| | 43,000 | | | 3.350%, 11/15/24 | | | 43,795 | |
| | 145,000 | | | 4.200%, 03/15/21 | | | 153,723 | |
| | | | Devon Energy Corp., | | | | |
| | 47,000 | | | 3.250%, 05/15/22 | | | 46,705 | |
| | 21,000 | | | 4.750%, 05/15/42 | | | 20,386 | |
| | | | Ecopetrol SA, (Colombia), | | | | |
| | 33,000 | | | 4.125%, 01/16/25 | | | 32,340 | |
| | 39,000 | | | 5.375%, 06/26/26 | | | 40,658 | |
| | 28,000 | | | 5.875%, 09/18/23 | | | 30,576 | |
| | | | Enbridge, Inc., (Canada), | | | | |
| | 27,000 | | | 3.700%, 07/15/27 | | | 26,983 | |
| | 75,000 | | | 5.500%, 12/01/46 | | | 84,639 | |
| | | | Encana Corp., (Canada), | | | | |
| | 30,000 | | | 6.500%, 08/15/34 | | | 34,262 | |
| | 80,000 | | | 7.200%, 11/01/31 | | | 95,254 | |
| | | | Energy Transfer LP, | | | | |
| | 9,000 | | | 3.600%, 02/01/23 | | | 9,057 | |
| | 45,000 | | | 4.050%, 03/15/25 | | | 45,184 | |
| | 32,000 | | | 4.200%, 04/15/27 | | | 31,873 | |
| | 68,000 | | | 4.900%, 02/01/24 | | | 71,761 | |
| | 100,000 | | | 6.050%, 06/01/41 | | | 106,494 | |
| | 17,000 | | | 6.500%, 02/01/42 | | | 19,011 | |
| | 50,000 | | | Eni USA, Inc., (United Kingdom), 7.300%, 11/15/27 | | | 62,405 | |
SEE NOTES TO FINANCIAL STATEMENTS.
| | | | | | |
| | | |
| 18 | | | | JPMORGAN INSURANCE TRUST | | JUNE 30, 2017 |
| | | | | | | | |
PRINCIPAL
AMOUNT($) | | | SECURITY DESCRIPTION | | VALUE($) | |
| | Corporate Bonds — continued | |
| | | | Oil, Gas & Consumable Fuels — continued | |
| | | | EnLink Midstream Partners LP, | | | | |
| | 22,000 | | | 4.150%, 06/01/25 | | | 21,727 | |
| | 65,000 | | | 5.050%, 04/01/45 | | | 60,398 | |
| | | | Enterprise Products Operating LLC, | | | | |
| | 38,000 | | | 3.700%, 02/15/26 | | | 38,707 | |
| | 25,000 | | | 3.750%, 02/15/25 | | | 25,747 | |
| | 25,000 | | | 3.900%, 02/15/24 | | | 26,005 | |
| | 6,000 | | | 4.950%, 10/15/54 | | | 6,237 | |
| | 16,000 | | | 5.100%, 02/15/45 | | | 17,593 | |
| | 170,000 | | | 7.550%, 04/15/38 | | | 229,848 | |
| | 86,000 | | | Series D, 6.875%, 03/01/33 | | | 109,090 | |
| | 15,000 | | | EOG Resources, Inc., 2.625%, 03/15/23 | | | 14,803 | |
| | 61,000 | | | Exxon Mobil Corp., 3.043%, 03/01/26 | | | 61,528 | |
| | | | Hess Corp., | | | | |
| | 30,000 | | | 7.125%, 03/15/33 | | | 33,919 | |
| | 100,000 | | | 7.300%, 08/15/31 | | | 115,120 | |
| | 120,000 | | | Kerr-McGee Corp., 7.875%, 09/15/31 | | | 154,302 | |
| | | | Magellan Midstream Partners LP, | | | | |
| | 14,000 | | | 3.200%, 03/15/25 | | | 13,579 | |
| | 27,000 | | | 4.200%, 12/01/42 | | | 25,535 | |
| | 70,000 | | | 6.400%, 05/01/37 | | | 84,307 | |
| | 150,000 | | | Marathon Oil Corp., 6.000%, 10/01/17 | | | 151,425 | |
| | 29,000 | | | Marathon Petroleum Corp., 3.625%, 09/15/24 | | | 29,305 | |
| | 140,000 | | | MPLX LP, 4.875%, 12/01/24 | | | 149,275 | |
| | 100,000 | | | NGPL PipeCo LLC, 7.119%, 12/15/17 (e) | | | 101,875 | |
| | | | Noble Energy, Inc., | | | | |
| | 15,000 | | | 5.625%, 05/01/21 | | | 15,430 | |
| | 114,000 | | | 6.000%, 03/01/41 | | | 127,712 | |
| | | | Occidental Petroleum Corp., | | | | |
| | 55,000 | | | 3.000%, 02/15/27 | | | 53,563 | |
| | 45,000 | | | 3.500%, 06/15/25 | | | 45,962 | |
| | | | ONEOK Partners LP, | | | | |
| | 25,000 | | | 3.200%, 09/15/18 | | | 25,293 | |
| | 8,000 | | | 3.375%, 10/01/22 | | | 8,072 | |
| | 100,000 | | | 4.900%, 03/15/25 | | | 107,078 | |
| | 17,000 | | | 5.000%, 09/15/23 | | | 18,365 | |
| | 15,000 | | | 6.650%, 10/01/36 | | | 18,071 | |
| | 40,000 | | | 8.625%, 03/01/19 | | | 44,003 | |
| | 105,000 | | | Petro-Canada, (Canada), 6.800%, 05/15/38 | | | 136,990 | |
| | | | Petroleos Mexicanos, (Mexico), | | | | |
| | 100,000 | | | 4.625%, 09/21/23 | | | 101,200 | |
| | 20,000 | | | 4.875%, 01/18/24 | | | 20,258 | |
| | 11,000 | | | 5.500%, 06/27/44 | | | 9,669 | |
| | 42,000 | | | 6.375%, 01/23/45 | | | 41,026 | |
| | | | | | | | |
PRINCIPAL
AMOUNT($) | | | SECURITY DESCRIPTION | | VALUE($) | |
| | | | | | | | |
| | | | Oil, Gas & Consumable Fuels — continued | |
| | 111,000 | | | 6.500%, 03/13/27 (e) | | | 119,103 | |
| | 50,000 | | | 6.625%, 06/15/35 | | | 51,750 | |
| | 110,000 | | | 6.750%, 09/21/47 | | | 110,949 | |
| | 26,000 | | | 6.875%, 08/04/26 | | | 28,857 | |
| | 37,000 | | | Phillips 66 Partners LP, 4.900%, 10/01/46 | | | 36,540 | |
| | | | Plains All American Pipeline LP, | | | | |
| | 50,000 | | | 3.600%, 11/01/24 | | | 48,600 | |
| | 15,000 | | | 3.650%, 06/01/22 | | | 15,301 | |
| | 50,000 | | | 4.300%, 01/31/43 | | | 42,837 | |
| | 130,000 | | | 4.650%, 10/15/25 | | | 133,260 | |
| | 141,000 | | | Regency Energy Partners LP, 5.000%, 10/01/22 | | | 151,207 | |
| | | | Spectra Energy Capital LLC, | | | | |
| | 47,000 | | | 3.300%, 03/15/23 | | | 47,170 | |
| | 50,000 | | | 5.650%, 03/01/20 | | | 53,721 | |
| | 45,000 | | | 7.500%, 09/15/38 | | | 59,155 | |
| | 50,000 | | | 8.000%, 10/01/19 | | | 55,711 | |
| | | | Spectra Energy Partners LP, | | | | |
| | 34,000 | | | 2.950%, 09/25/18 | | | 34,383 | |
| | 19,000 | | | 3.500%, 03/15/25 | | | 18,808 | |
| | 7,000 | | | 4.500%, 03/15/45 | | | 6,908 | |
| | 25,000 | | | 5.950%, 09/25/43 | | | 28,884 | |
| | | | Statoil ASA, (Norway), | | | | |
| | 50,000 | | | 1.150%, 05/15/18 | | | 49,835 | |
| | 143,000 | | | 2.650%, 01/15/24 | | | 141,165 | |
| | 23,000 | | | 3.250%, 11/10/24 | | | 23,503 | |
| | 60,000 | | | Suncor Energy, Inc., (Canada), 5.950%, 12/01/34 | | | 72,356 | |
| | | | Sunoco Logistics Partners Operations LP, | | | | |
| | 24,000 | | | 3.900%, 07/15/26 | | | 23,551 | |
| | 13,000 | | | 4.250%, 04/01/24 | | | 13,328 | |
| | 53,000 | | | 5.350%, 05/15/45 | | | 52,014 | |
| | 60,000 | | | 6.100%, 02/15/42 | | | 63,116 | |
| | 26,000 | | | TC PipeLines LP, 3.900%, 05/25/27 | | | 25,946 | |
| | 25,000 | | | Total Capital Canada Ltd., (France), 2.750%, 07/15/23 | | | 25,131 | |
| | 50,000 | | | Total Capital International SA, (France), 2.750%, 06/19/21 | | | 50,979 | |
| | | | TransCanada PipeLines Ltd., (Canada), | | | | |
| | 70,000 | | | 6.200%, 10/15/37 | | | 89,299 | |
| | 50,000 | | | 6.500%, 08/15/18 | | | 52,521 | |
| | 50,000 | | | 7.125%, 01/15/19 | | | 53,820 | |
| | 20,000 | | | Valero Energy Corp., 7.500%, 04/15/32 | | | 25,664 | |
| | | | Western Gas Partners LP, | | | | |
| | 29,000 | | | 4.650%, 07/01/26 | | | 29,688 | |
| | 26,000 | | | 5.450%, 04/01/44 | | | 26,426 | |
SEE NOTES TO FINANCIAL STATEMENTS.
| | | | | | | | |
| | | |
| JUNE 30, 2017 | | JPMORGAN INSURANCE TRUST | | | | | 19 | |
JPMorgan Insurance Trust Core Bond Portfolio
SCHEDULE OF PORTFOLIO INVESTMENTS
AS OF JUNE 30, 2017 (Unaudited) (continued)
| | | | | | | | |
PRINCIPAL
AMOUNT($) | | | SECURITY DESCRIPTION | | VALUE($) | |
| | Corporate Bonds — continued | |
| | | | Oil, Gas & Consumable Fuels — continued | |
| | | | Williams Partners LP, | | | | |
| | 25,000 | | | 3.900%, 01/15/25 | | | 25,277 | |
| | 100,000 | | | 4.875%, 05/15/23 | | | 103,762 | |
| | | | | | | | |
| | | | | | | 7,351,225 | |
| | | | | | | | |
| | | | Total Energy | | | 7,703,524 | |
| | | | | | | | |
| | | | Financials — 9.9% | |
| | | | Banks — 4.4% | |
| | 200,000 | | | ABN AMRO Bank NV, (Netherlands), 4.750%, 07/28/25 (e) | | | 210,848 | |
| | | | Bank of America Corp., | | | | |
| | 100,000 | | | 2.000%, 01/11/18 | | | 100,154 | |
| | 250,000 | | | 3.300%, 01/11/23 | | | 254,892 | |
| | 114,000 | | | 3.500%, 04/19/26 | | | 114,400 | |
| | 388,000 | | | 3.875%, 08/01/25 | | | 401,427 | |
| | 114,000 | | | 4.000%, 01/22/25 | | | 115,995 | |
| | 69,000 | | | 4.450%, 03/03/26 | | | 71,818 | |
| | 295,000 | | | 5.650%, 05/01/18 | | | 304,267 | |
| | 245,000 | | | 5.750%, 12/01/17 | | | 249,149 | |
| | 135,000 | | | 6.400%, 08/28/17 | | | 135,959 | |
| | 90,000 | | | 6.875%, 04/25/18 | | | 93,657 | |
| | 25,000 | | | 7.625%, 06/01/19 | | | 27,581 | |
| | 92,000 | | | Series L, 3.950%, 04/21/25 | | | 93,227 | |
| | 260,000 | | | VAR, 3.705%, 04/24/28 | | | 261,961 | |
| | 65,000 | | | Bank of Montreal, (Canada), 1.500%, 07/18/19 | | | 64,392 | |
| | | | Bank of Nova Scotia (The), (Canada), | | | | |
| | 100,000 | | | 1.450%, 04/25/18 | | | 99,899 | |
| | 100,000 | | | 1.700%, 06/11/18 | | | 100,131 | |
| | 150,000 | | | Barclays Bank plc, (United Kingdom), 6.050%, 12/04/17 (e) | | | 152,576 | |
| | 200,000 | | | Barclays plc, (United Kingdom), 3.650%, 03/16/25 | | | 199,006 | |
| | 50,000 | | | BB&T Corp., 5.250%, 11/01/19 | | | 53,445 | |
| | 250,000 | | | BNZ International Funding Ltd., (New Zealand), 2.900%, 02/21/22 (e) | | | 252,473 | |
| | 200,000 | | | Canadian Imperial Bank of Commerce, (Canada), 1.600%, 09/06/19 | | | 198,117 | |
| | | | Citigroup, Inc., | | | | |
| | 100,000 | | | 1.700%, 04/27/18 | | | 99,900 | |
| | 40,000 | | | 1.750%, 05/01/18 | | | 39,983 | |
| | 137,000 | | | 2.150%, 07/30/18 | | | 137,434 | |
| | 23,000 | | | 2.350%, 08/02/21 | | | 22,789 | |
| | 50,000 | | | 2.400%, 02/18/20 | | | 50,195 | |
| | 200,000 | | | 2.750%, 04/25/22 | | | 200,010 | |
| | 100,000 | | | 2.900%, 12/08/21 | | | 101,003 | |
| | | | | | | | |
PRINCIPAL
AMOUNT($) | | | SECURITY DESCRIPTION | | VALUE($) | |
| | | | | | | | |
| | | | Banks — continued | |
| | 75,000 | | | 3.400%, 05/01/26 | | | 74,200 | |
| | 50,000 | | | 4.300%, 11/20/26 | | | 51,362 | |
| | 20,000 | | | 4.400%, 06/10/25 | | | 20,827 | |
| | 210,000 | | | 4.450%, 09/29/27 | | | 218,428 | |
| | 49,000 | | | 4.650%, 07/30/45 | | | 53,358 | |
| | 50,000 | | | 4.750%, 05/18/46 | | | 52,559 | |
| | 58,000 | | | 5.500%, 09/13/25 | | | 64,503 | |
| | 56,000 | | | 8.125%, 07/15/39 | | | 86,073 | |
| | 24,000 | | | Citizens Financial Group, Inc., 2.375%, 07/28/21 | | | 23,790 | |
| | 10,000 | | | Comerica, Inc., 3.800%, 07/22/26 | | | 10,113 | |
| | 200,000 | | | Commonwealth Bank of Australia, (Australia), 2.000%, 09/06/21 (e) | | | 196,295 | |
| | 250,000 | | | Cooperatieve Rabobank UA, (Netherlands), 4.375%, 08/04/25 | | | 262,190 | |
| | | | Credit Suisse Group Funding Guernsey Ltd., (Switzerland), | | | | |
| | 250,000 | | | 3.750%, 03/26/25 | | | 252,611 | |
| | 350,000 | | | 3.800%, 06/09/23 | | | 360,786 | |
| | 200,000 | | | Danske Bank A/S, (Denmark), 2.000%, 09/08/21 (e) | | | 196,567 | |
| | 83,000 | | | Fifth Third Bancorp, 2.875%, 07/27/20 | | | 84,725 | |
| | 350,000 | | | Glitnir HoldCo ehf, (Iceland), VAR, 0.000%, 10/15/08 (e) (d) | | | – | |
| | | | HSBC Holdings plc, (United Kingdom), | | | | |
| | 400,000 | | | 2.650%, 01/05/22 | | | 398,647 | |
| | 229,000 | | | 3.600%, 05/25/23 | | | 236,620 | |
| | 200,000 | | | 4.375%, 11/23/26 | | | 207,545 | |
| | | | Huntington Bancshares, Inc., | | | | |
| | 88,000 | | | 2.300%, 01/14/22 | | | 86,669 | |
| | 73,000 | | | 3.150%, 03/14/21 | | | 74,433 | |
| | 200,000 | | | ING Groep NV, (Netherlands), 3.950%, 03/29/27 | | | 207,991 | |
| | 56,000 | | | KeyCorp, 2.900%, 09/15/20 | | | 56,964 | |
| | | | Lloyds Banking Group plc, (United Kingdom), | | | | |
| | 200,000 | | | 3.750%, 01/11/27 | | | 201,243 | |
| | 200,000 | | | 4.582%, 12/10/25 | | | 207,374 | |
| | 38,000 | | | Mitsubishi UFJ Financial Group, Inc., (Japan), 2.998%, 02/22/22 | | | 38,560 | |
| | 9,000 | | | MUFG Americas Holdings Corp., 2.250%, 02/10/20 | | | 9,005 | |
| | 200,000 | | | Nordea Bank AB, (Sweden), 1.625%, 09/30/19 (e) | | | 198,382 | |
| | | | PNC Financial Services Group, Inc. (The), | | | | |
| | 13,000 | | | 4.375%, 08/11/20 | | | 13,836 | |
| | 150,000 | | | 5.125%, 02/08/20 | | | 161,346 | |
| | 12,000 | | | 6.700%, 06/10/19 | | | 13,048 | |
SEE NOTES TO FINANCIAL STATEMENTS.
| | | | | | |
| | | |
| 20 | | | | JPMORGAN INSURANCE TRUST | | JUNE 30, 2017 |
| | | | | | | | |
PRINCIPAL
AMOUNT($) | | | SECURITY DESCRIPTION | | VALUE($) | |
| | Corporate Bonds — continued | |
| | | | Banks — continued | |
| | 54,000 | | | Regions Financial Corp., 3.200%, 02/08/21 | | | 55,206 | |
| | | | Royal Bank of Canada, (Canada), | | | | |
| | 50,000 | | | 1.875%, 02/05/20 | | | 49,730 | |
| | 50,000 | | | 2.000%, 10/01/18 | | | 50,200 | |
| | 66,000 | | | 2.750%, 02/01/22 | | | 67,113 | |
| | 30,000 | | | 4.650%, 01/27/26 | | | 32,157 | |
| | 69,000 | | | Santander UK Group Holdings plc, (United Kingdom), 3.125%, 01/08/21 | | | 70,047 | |
| | 87,000 | | | Santander UK plc, (United Kingdom), 2.500%, 03/14/19 | | | 87,707 | |
| | 200,000 | | | Standard Chartered plc, (United Kingdom), 4.050%, 04/12/26 (e) | | | 203,355 | |
| | | | Sumitomo Mitsui Financial Group, Inc., (Japan), | | | | |
| | 49,000 | | | 2.058%, 07/14/21 | | | 48,204 | |
| | 45,000 | | | 2.442%, 10/19/21 | | | 44,807 | |
| | 130,000 | | | 2.846%, 01/11/22 | | | 131,422 | |
| | 25,000 | | | 3.010%, 10/19/26 | | | 24,465 | |
| | 200,000 | | | Sumitomo Mitsui Trust Bank Ltd., (Japan), 2.050%, 10/18/19 (e) | | | 199,436 | |
| | 91,000 | | | SunTrust Banks, Inc., 2.700%, 01/27/22 | | | 91,180 | |
| | | | Toronto-Dominion Bank (The), (Canada), | | | | |
| | 229,000 | | | 1.750%, 07/23/18 | | | 229,379 | |
| | 47,000 | | | VAR, 3.625%, 09/15/31 | | | 46,633 | |
| | 200,000 | | | UBS Group Funding Switzerland AG, (Switzerland), 4.125%, 09/24/25 (e) | | | 209,666 | |
| | | | US Bancorp, | | | | |
| | 100,000 | | | 7.500%, 06/01/26 | | | 129,823 | |
| | 100,000 | | | Series V, 2.375%, 07/22/26 | | | 94,253 | |
| | 50,000 | | | Wachovia Corp., 5.750%, 02/01/18 | | | 51,172 | |
| | | | Wells Fargo & Co., | | | | |
| | 65,000 | | | 2.600%, 07/22/20 | | | 65,911 | |
| | 200,000 | | | 3.000%, 02/19/25 | | | 196,913 | |
| | 84,000 | | | 3.000%, 04/22/26 | | | 82,047 | |
| | 180,000 | | | 3.069%, 01/24/23 | | | 182,392 | |
| | 80,000 | | | 3.300%, 09/09/24 | | | 81,152 | |
| | 24,000 | | | 4.100%, 06/03/26 | | | 24,825 | |
| | 7,000 | | | 4.300%, 07/22/27 | | | 7,341 | |
| | 284,000 | | | 5.606%, 01/15/44 | | | 338,168 | |
| | 250,000 | | | Wells Fargo Bank NA, 6.000%, 11/15/17 | | | 253,958 | |
| | | | Westpac Banking Corp., (Australia), | | | | |
| | 40,000 | | | 3.350%, 03/08/27 | | | 40,238 | |
| | 121,000 | | | 4.875%, 11/19/19 | | | 128,858 | |
| | 100,000 | | | VAR, 4.322%, 11/23/31 | | | 102,504 | |
| | | | | | | | |
| | | | | | | 11,747,000 | |
| | | | | | | | |
| | | | | | | | |
PRINCIPAL
AMOUNT($) | | | SECURITY DESCRIPTION | | VALUE($) | |
| | | | | | | | |
| | | | Capital Markets — 2.3% | |
| | 63,000 | | | Ameriprise Financial, Inc., 2.875%, 09/15/26 | | | 61,176 | |
| | | | Bank of New York Mellon Corp. (The), | | | | |
| | 100,000 | | | 3.000%, 10/30/28 | | | 96,791 | |
| | 100,000 | | | 3.250%, 09/11/24 | | | 102,075 | |
| | 55,000 | | | 4.600%, 01/15/20 | | | 58,432 | |
| | 83,000 | | | Series 0012, 3.650%, 02/04/24 | | | 86,560 | |
| | | | BlackRock, Inc., | | | | |
| | 65,000 | | | 4.250%, 05/24/21 | | | 70,051 | |
| | 65,000 | | | Series 2, 5.000%, 12/10/19 | | | 69,795 | |
| | | | Blackstone Holdings Finance Co. LLC, | | | | |
| | 21,000 | | | 4.450%, 07/15/45 (e) | | | 21,127 | |
| | 100,000 | | | 5.875%, 03/15/21 (e) | | | 111,014 | |
| | 100,000 | | | Charles Schwab Corp. (The), 3.200%, 03/02/27 | | | 100,477 | |
| | | | CME Group, Inc., | | | | |
| | 97,000 | | | 3.000%, 03/15/25 | | | 97,875 | |
| | 16,000 | | | 5.300%, 09/15/43 | | | 19,918 | |
| | 49,000 | | | Daiwa Securities Group, Inc., (Japan), 3.129%, 04/19/22 (e) | | | 49,335 | |
| | | | Deutsche Bank AG, (Germany), | | | | |
| | 77,000 | | | 3.125%, 01/13/21 | | | 77,377 | |
| | 300,000 | | | 4.250%, 10/14/21 | | | 314,119 | |
| | | | Goldman Sachs Group, Inc. (The), | | | | |
| | 300,000 | | | 2.350%, 11/15/21 | | | 296,354 | |
| | 36,000 | | | 2.600%, 04/23/20 | | | 36,332 | |
| | 55,000 | | | 2.625%, 01/31/19 | | | 55,572 | |
| | 20,000 | | | 2.625%, 04/25/21 | | | 20,038 | |
| | 188,000 | | | 2.750%, 09/15/20 | | | 190,250 | |
| | 80,000 | | | 2.875%, 02/25/21 | | | 80,851 | |
| | 100,000 | | | 3.500%, 01/23/25 | | | 101,095 | |
| | 142,000 | | | 3.500%, 11/16/26 | | | 141,262 | |
| | 10,000 | | | 3.750%, 05/22/25 | | | 10,241 | |
| | 105,000 | | | 4.250%, 10/21/25 | | | 108,544 | |
| | 13,000 | | | 5.250%, 07/27/21 | | | 14,247 | |
| | 206,000 | | | 5.375%, 03/15/20 | | | 222,421 | |
| | 120,000 | | | 5.950%, 01/18/18 | | | 122,683 | |
| | 40,000 | | | 5.950%, 01/15/27 | | | 46,693 | |
| | 80,000 | | | 6.750%, 10/01/37 | | | 104,075 | |
| | 125,000 | | | 7.500%, 02/15/19 | | | 135,592 | |
| | 209,000 | | | VAR, 3.691%, 06/05/28 | | | 209,853 | |
| | | | Intercontinental Exchange, Inc., | | | | |
| | 23,000 | | | 2.500%, 10/15/18 | | | 23,215 | |
| | 59,000 | | | 4.000%, 10/15/23 | | | 63,254 | |
SEE NOTES TO FINANCIAL STATEMENTS.
| | | | | | | | |
| | | |
| JUNE 30, 2017 | | JPMORGAN INSURANCE TRUST | | | | | 21 | |
JPMorgan Insurance Trust Core Bond Portfolio
SCHEDULE OF PORTFOLIO INVESTMENTS
AS OF JUNE 30, 2017 (Unaudited) (continued)
| | | | | | | | |
PRINCIPAL
AMOUNT($) | | | SECURITY DESCRIPTION | | VALUE($) | |
| | Corporate Bonds — continued | |
| | | | Capital Markets — continued | |
| | | | Invesco Finance plc, | | | | |
| | 36,000 | | | 3.750%, 01/15/26 | | | 37,328 | |
| | 29,000 | | | 4.000%, 01/30/24 | | | 30,764 | |
| | | | Jefferies Group LLC, | | | | |
| | 110,000 | | | 6.450%, 06/08/27 | | | 126,040 | |
| | 100,000 | | | 6.875%, 04/15/21 | | | 113,812 | |
| | | | Macquarie Bank Ltd., (Australia), | | | | |
| | 285,000 | | | 1.600%, 10/27/17 (e) | | | 285,026 | |
| | 100,000 | | | 2.850%, 07/29/20 (e) | | | 101,549 | |
| | 100,000 | | | 4.000%, 07/29/25 (e) | | | 104,618 | |
| | | | Morgan Stanley, | | | | |
| | 170,000 | | | 2.625%, 11/17/21 | | | 169,732 | |
| | 25,000 | | | 2.650%, 01/27/20 | | | 25,262 | |
| | 100,000 | | | 2.750%, 05/19/22 | | | 99,967 | |
| | 142,000 | | | 2.800%, 06/16/20 | | | 144,112 | |
| | 69,000 | | | 3.700%, 10/23/24 | | | 70,818 | |
| | 141,000 | | | 3.875%, 01/27/26 | | | 145,171 | |
| | 198,000 | | | 4.000%, 07/23/25 | | | 206,678 | |
| | 100,000 | | | 4.100%, 05/22/23 | | | 104,382 | |
| | 20,000 | | | 4.350%, 09/08/26 | | | 20,795 | |
| | 70,000 | | | 5.000%, 11/24/25 | | | 76,129 | |
| | 35,000 | | | 5.500%, 07/28/21 | | | 38,806 | |
| | 200,000 | | | 5.625%, 09/23/19 | | | 214,872 | |
| | 130,000 | | | 6.625%, 04/01/18 | | | 134,617 | |
| | 65,000 | | | Nomura Holdings, Inc., (Japan), 6.700%, 03/04/20 | | | 71,995 | |
| | 29,000 | | | Northern Trust Corp., VAR, 3.375%, 05/08/32 | | | 28,991 | |
| | | | State Street Corp., | | | | |
| | 24,000 | | | 3.100%, 05/15/23 | | | 24,423 | |
| | 147,000 | | | 3.550%, 08/18/25 | | | 153,086 | |
| | 77,000 | | | 3.700%, 11/20/23 | | | 81,465 | |
| | 17,000 | | | TD Ameritrade Holding Corp., 2.950%, 04/01/22 | | | 17,394 | |
| | | | Thomson Reuters Corp., (Canada), | | | | |
| | 25,000 | | | 3.850%, 09/29/24 | | | 25,758 | |
| | 84,000 | | | 3.950%, 09/30/21 | | | 87,559 | |
| | | | | | | | |
| | | | | | | 6,059,843 | |
| | | | | | | | |
| | | | Consumer Finance — 1.2% | |
| | 50,000 | | | American Express Co., 7.000%, 03/19/18 | | | 51,859 | |
| | | | American Express Credit Corp., | | | | |
| | 130,000 | | | 1.800%, 07/31/18 | | | 130,034 | |
| | 73,000 | | | 2.250%, 05/05/21 | | | 72,880 | |
| | 105,000 | | | 2.700%, 03/03/22 | | | 105,873 | |
| | | | | | | | |
PRINCIPAL
AMOUNT($) | | | SECURITY DESCRIPTION | | VALUE($) | |
| | | | | | | | |
| | | | Consumer Finance — continued | |
| | | | American Honda Finance Corp., | | | | |
| | 200,000 | | | 1.600%, 02/16/18 (e) | | | 200,185 | |
| | 33,000 | | | 2.250%, 08/15/19 | | | 33,281 | |
| | 17,000 | | | 2.300%, 09/09/26 | | | 16,057 | |
| | | | Capital One Financial Corp., | | | | |
| | 130,000 | | | 3.750%, 04/24/24 | | | 132,848 | |
| | 196,000 | | | 3.750%, 07/28/26 | | | 191,282 | |
| | 186,000 | | | 4.200%, 10/29/25 | | | 187,569 | |
| | | | Caterpillar Financial Services Corp., | | | | |
| | 175,000 | | | 1.931%, 10/01/21 | | | 171,928 | |
| | 50,000 | | | 7.150%, 02/15/19 | | | 54,210 | |
| | | | Ford Motor Credit Co. LLC, | | | | |
| | 200,000 | | | 3.096%, 05/04/23 | | | 197,608 | |
| | 200,000 | | | 3.339%, 03/28/22 | | | 202,925 | |
| | | | General Motors Financial Co., Inc., | | | | |
| | 75,000 | | | 3.450%, 01/14/22 | | | 76,241 | |
| | 114,000 | | | 3.450%, 04/10/22 | | | 115,857 | |
| | 68,000 | | | 3.700%, 05/09/23 | | | 69,042 | |
| | 120,000 | | | 3.950%, 04/13/24 | | | 121,674 | |
| | 20,000 | | | 4.000%, 01/15/25 | | | 20,087 | |
| | 84,000 | | | 4.000%, 10/06/26 | | | 83,522 | |
| | 35,000 | | | 4.300%, 07/13/25 | | | 35,701 | |
| | 57,000 | | | 4.350%, 01/17/27 | | | 57,708 | |
| | 50,000 | | | HSBC Finance Corp., 7.350%, 11/27/32 | | | 64,581 | |
| | | | HSBC USA, Inc., | | | | |
| | 100,000 | | | 1.625%, 01/16/18 | | | 100,035 | |
| | 135,000 | | | 2.350%, 03/05/20 | | | 135,783 | |
| | | | John Deere Capital Corp., | | | | |
| | 39,000 | | | 1.200%, 10/10/17 | | | 38,983 | |
| | 44,000 | | | 1.600%, 07/13/18 | | | 44,042 | |
| | 42,000 | | | 3.150%, 10/15/21 | | | 43,414 | |
| | 82,000 | | | 3.350%, 06/12/24 | | | 84,870 | |
| | 251,000 | | | Synchrony Financial, 3.700%, 08/04/26 | | | 242,252 | |
| | | | Toyota Motor Credit Corp., | | | | |
| | 100,000 | | | 2.125%, 07/18/19 | | | 100,698 | |
| | 60,000 | | | 2.800%, 07/13/22 | | | 61,016 | |
| | | | | | | | |
| | | | | | | 3,244,045 | |
| | | | | | | | |
| | | | Diversified Financial Services — 0.7% | |
| | 100,000 | | | AIG Global Funding, 1.900%, 10/06/21 (e) | | | 97,619 | |
| | 200,000 | | | CK Hutchison International 16 Ltd., (Hong Kong), 1.875%, 10/03/21 (e) | | | 194,049 | |
| | 251,000 | | | GE Capital International Funding Co. Unlimited Co., 2.342%, 11/15/20 | | | 252,985 | |
SEE NOTES TO FINANCIAL STATEMENTS.
| | | | | | |
| | | |
| 22 | | | | JPMORGAN INSURANCE TRUST | | JUNE 30, 2017 |
| | | | | | | | |
PRINCIPAL
AMOUNT($) | | | SECURITY DESCRIPTION | | VALUE($) | |
| | Corporate Bonds — continued | |
| | | | Diversified Financial Services — continued | |
| | | | GTP Acquisition Partners I LLC, | | | | |
| | 58,000 | | | 2.350%, 06/15/20 (e) | | | 57,342 | |
| | 67,000 | | | 3.482%, 06/16/25 (e) | | | 68,336 | |
| | | | National Rural Utilities Cooperative Finance Corp., | | | | |
| | 44,000 | | | 2.950%, 02/07/24 | | | 44,405 | |
| | 50,000 | | | 10.375%, 11/01/18 | | | 55,607 | |
| | 180,000 | | | Protective Life Global Funding, 1.999%, 09/14/21 (e) | | | 175,186 | |
| | | | Shell International Finance BV, (Netherlands), | | | | |
| | 42,000 | | | 1.125%, 08/21/17 | | | 41,987 | |
| | 70,000 | | | 2.125%, 05/11/20 | | | 70,369 | |
| | 161,000 | | | 2.875%, 05/10/26 | | | 158,885 | |
| | 97,000 | | | 3.750%, 09/12/46 | | | 91,932 | |
| | 155,000 | | | 4.000%, 05/10/46 | | | 153,361 | |
| | 47,000 | | | 4.125%, 05/11/35 | | | 48,990 | |
| | 60,000 | | | 6.375%, 12/15/38 | | | 79,927 | |
| | 250,000 | | | Siemens Financieringsmaatschappij NV, (Germany), 3.300%, 09/15/46 (e) | | | 225,897 | |
| | 20,000 | | | Voya Financial, Inc., 3.650%, 06/15/26 | | | 20,040 | |
| | | | | | | | |
| | | | | | | 1,836,917 | |
| | | | | | | | |
| | | | Insurance — 1.2% | |
| | 31,000 | | | Allstate Corp. (The), 3.150%, 06/15/23 | | | 31,763 | |
| | | | American International Group, Inc., | | | | |
| | 24,000 | | | 3.750%, 07/10/25 | | | 24,448 | |
| | 50,000 | | | 3.875%, 01/15/35 | | | 48,521 | |
| | 59,000 | | | 4.125%, 02/15/24 | | | 62,297 | |
| | 90,000 | | | 4.700%, 07/10/35 | | | 95,753 | |
| | 18,000 | | | Aon Corp., 6.250%, 09/30/40 | | | 22,713 | |
| | 46,000 | | | Aon plc, 3.875%, 12/15/25 | | | 48,073 | |
| | 57,000 | | | Arch Capital Finance LLC, 5.031%, 12/15/46 | | | 63,458 | |
| | | | Athene Global Funding, | | | | |
| | 106,000 | | | 2.750%, 04/20/20 (e) | | | 106,224 | |
| | 44,000 | | | 4.000%, 01/25/22 (e) | | | 45,700 | |
| | | | Berkshire Hathaway Finance Corp., | | | | |
| | 62,000 | | | 4.300%, 05/15/43 | | | 66,284 | |
| | 50,000 | | | 5.400%, 05/15/18 | | | 51,640 | |
| | 100,000 | | | 5.750%, 01/15/40 | | | 128,537 | |
| | 150,000 | | | Brighthouse Financial, Inc., 3.700%, 06/22/27 (e) | | | 147,698 | |
| | | | Chubb INA Holdings, Inc., | | | | |
| | 120,000 | | | 2.700%, 03/13/23 | | | 120,083 | |
| | 42,000 | | | 2.875%, 11/03/22 | | | 42,721 | |
| | | | | | | | |
PRINCIPAL
AMOUNT($) | | | SECURITY DESCRIPTION | | VALUE($) | |
| | | | | | | | |
| | | | Insurance — continued | |
| | | | CNA Financial Corp., | | | | |
| | 44,000 | | | 3.950%, 05/15/24 | | | 45,645 | |
| | 32,000 | | | 4.500%, 03/01/26 | | | 34,334 | |
| | 200,000 | | | Dai-ichi Life Insurance Co. Ltd. (The), (Japan), VAR, 4.000%, 07/24/26 (e) (x) (y) | | | 198,200 | |
| | 75,000 | | | Great-West Lifeco Finance Delaware LP, (Canada), 4.150%, 06/03/47 (e) | | | 75,224 | |
| | 21,000 | | | Guardian Life Insurance Co. of America (The), 4.850%, 01/24/77 (e) | | | 22,277 | |
| | | | Jackson National Life Global Funding, | | | | |
| | 97,000 | | | 1.875%, 10/15/18 (e) | | | 97,176 | |
| | 104,000 | | | 3.050%, 04/29/26 (e) | | | 102,089 | |
| | | | Liberty Mutual Group, Inc., | | | | |
| | 27,000 | | | 4.950%, 05/01/22 (e) | | | 29,610 | |
| | 50,000 | | | 6.500%, 03/15/35 (e) | | | 62,578 | |
| | | | Lincoln National Corp., | | | | |
| | 50,000 | | | 4.000%, 09/01/23 | | | 52,669 | |
| | 20,000 | | | 4.200%, 03/15/22 | | | 21,282 | |
| | 100,000 | | | Manulife Financial Corp., (Canada), VAR, 4.061%, 02/24/32 | | | 100,902 | |
| | | | Marsh & McLennan Cos., Inc., | | | | |
| | 24,000 | | | 2.750%, 01/30/22 | | | 24,232 | |
| | 25,000 | | | 3.300%, 03/14/23 | | | 25,690 | |
| | 19,000 | | | Massachusetts Mutual Life Insurance Co., 8.875%, 06/01/39 (e) | | | 31,166 | |
| | | | MetLife, Inc., | | | | |
| | 87,000 | | | 3.600%, 11/13/25 | | | 90,249 | |
| | 28,000 | | | 4.050%, 03/01/45 | | | 28,278 | |
| | | | Metropolitan Life Global Funding I, | | | | |
| | 100,000 | | | 1.500%, 01/10/18 (e) | | | 99,975 | |
| | 175,000 | | | 2.300%, 04/10/19 (e) | | | 176,471 | |
| | 100,000 | | | Nationwide Mutual Insurance Co., 9.375%, 08/15/39 (e) | | | 167,162 | |
| | | | New York Life Global Funding, | | | | |
| | 29,000 | | | 2.000%, 04/13/21 (e) | | | 28,741 | |
| | 65,000 | | | 2.350%, 07/14/26 (e) | | | 62,203 | |
| | 50,000 | | | Pacific Life Insurance Co., 9.250%, 06/15/39 (e) | | | 81,587 | |
| | 30,000 | | | Principal Financial Group, Inc., 3.125%, 05/15/23 | | | 30,235 | |
| | 100,000 | | | Principal Life Global Funding II, 2.150%, 01/10/20 (e) | | | 100,107 | |
| | 60,000 | | | Progressive Corp. (The), 2.450%, 01/15/27 | | | 56,903 | |
| | 150,000 | | | Prudential Insurance Co. of America (The), 8.300%, 07/01/25 (e) | | | 198,196 | |
SEE NOTES TO FINANCIAL STATEMENTS.
| | | | | | | | |
| | | |
| JUNE 30, 2017 | | JPMORGAN INSURANCE TRUST | | | | | 23 | |
JPMorgan Insurance Trust Core Bond Portfolio
SCHEDULE OF PORTFOLIO INVESTMENTS
AS OF JUNE 30, 2017 (Unaudited) (continued)
| | | | | | | | |
PRINCIPAL
AMOUNT($) | | | SECURITY DESCRIPTION | | VALUE($) | |
| | Corporate Bonds — continued | |
| | | | Insurance — continued | |
| | 100,000 | | | Reliance Standard Life Global Funding II, 2.500%, 01/15/20 (e) | | | 100,158 | |
| | 50,000 | | | Teachers Insurance & Annuity Association of America, 4.270%, 05/15/47 (e) | | | 51,261 | |
| | 25,000 | | | Travelers Cos., Inc. (The), 5.800%, 05/15/18 | | | 25,902 | |
| | | | | | | | |
| | | | | | | 3,326,415 | |
| | | | | | | | |
| | | | Thrifts & Mortgage Finance — 0.1% | |
| | 200,000 | | | BPCE SA, (France), 4.625%, 07/11/24 (e) | | | 207,312 | |
| | | | | | | | |
| | | | Total Financials | | | 26,421,532 | |
| | | | | | | | |
| | | | Health Care — 1.3% | |
| | | | Biotechnology — 0.6% | |
| | | | AbbVie, Inc., | | | | |
| | 45,000 | | | 2.000%, 11/06/18 | | | 45,108 | |
| | 22,000 | | | 2.850%, 05/14/23 | | | 21,948 | |
| | 30,000 | | | 3.200%, 11/06/22 | | | 30,766 | |
| | 134,000 | | | 3.600%, 05/14/25 | | | 136,701 | |
| | 200,000 | | | 4.300%, 05/14/36 | | | 203,768 | |
| | 169,000 | | | 4.500%, 05/14/35 | | | 178,424 | |
| | | | Amgen, Inc., | | | | |
| | 25,000 | | | 3.625%, 05/15/22 | | | 26,109 | |
| | 209,000 | | | 4.663%, 06/15/51 | | | 221,702 | |
| | 40,000 | | | 5.700%, 02/01/19 | | | 42,404 | |
| | | | Baxalta, Inc., | | | | |
| | 22,000 | | | 3.600%, 06/23/22 | | | 22,779 | |
| | 8,000 | | | 5.250%, 06/23/45 | | | 9,402 | |
| | 79,000 | | | Biogen, Inc., 2.900%, 09/15/20 | | | 80,686 | |
| | | | Celgene Corp., | | | | |
| | 49,000 | | | 3.250%, 08/15/22 | | | 50,367 | |
| | 41,000 | | | 3.625%, 05/15/24 | | | 42,459 | |
| | 53,000 | | | 5.700%, 10/15/40 | | | 61,157 | |
| | | | Gilead Sciences, Inc., | | | | |
| | 28,000 | | | 2.500%, 09/01/23 | | | 27,581 | |
| | 40,000 | | | 3.500%, 02/01/25 | | | 41,053 | |
| | 29,000 | | | 3.650%, 03/01/26 | | | 29,870 | |
| | 36,000 | | | 3.700%, 04/01/24 | | | 37,416 | |
| | 29,000 | | | 4.000%, 09/01/36 | | | 28,871 | |
| | 130,000 | | | 4.600%, 09/01/35 | | | 139,539 | |
| | | | | | | | |
| | | | | | | 1,478,110 | |
| | | | | | | | |
| | | | Health Care Equipment & Supplies — 0.0% (g) | |
| | 90,000 | | | Abbott Laboratories, 3.875%, 09/15/25 | | | 92,576 | |
| | 19,000 | | | Liberty Property LP, 3.250%, 10/01/26 | | | 18,406 | |
| | | | | | | | |
| | | | | | | 110,982 | |
| | | | | | | | |
| | | | | | | | |
PRINCIPAL
AMOUNT($) | | | SECURITY DESCRIPTION | | VALUE($) | |
| | | | | | | | |
| | | | Health Care Providers & Services — 0.3% | |
| | 30,000 | | | Aetna, Inc., 2.800%, 06/15/23 | | | 29,944 | |
| | | | Anthem, Inc., | | | | |
| | 47,000 | | | 2.300%, 07/15/18 | | | 47,265 | |
| | 18,000 | | | 3.300%, 01/15/23 | | | 18,356 | |
| | 18,000 | | | 4.650%, 01/15/43 | | | 19,425 | |
| | 65,000 | | | 4.650%, 08/15/44 | | | 70,503 | |
| | | | Cardinal Health, Inc., | | | | |
| | 23,000 | | | 2.400%, 11/15/19 | | | 23,132 | |
| | 50,000 | | | 3.410%, 06/15/27 | | | 49,787 | |
| | 28,000 | | | 3.750%, 09/15/25 | | | 29,099 | |
| | | | Express Scripts Holding Co., | | | | |
| | 48,000 | | | 3.500%, 06/15/24 | | | 48,407 | |
| | 127,000 | | | 4.500%, 02/25/26 | | | 134,608 | |
| | 36,000 | | | Providence St Joseph Health Obligated Group, Series H, 2.746%, 10/01/26 | | | 34,483 | |
| | 17,000 | | | Quest Diagnostics, Inc., 3.450%, 06/01/26 | | | 17,034 | |
| | | | UnitedHealth Group, Inc., | | | | |
| | 36,000 | | | 1.625%, 03/15/19 | | | 35,879 | |
| | 175,000 | | | 2.125%, 03/15/21 | | | 174,549 | |
| | 42,000 | | | 2.750%, 02/15/23 | | | 42,308 | |
| | 34,000 | | | 4.625%, 07/15/35 | | | 38,256 | |
| | 50,000 | | | 6.625%, 11/15/37 | | | 68,988 | |
| | | | | | | | |
| | | | | | | 882,023 | |
| | | | | | | | |
| | | | Life Sciences Tools & Services — 0.0% (g) | |
| | 30,000 | | | Thermo Fisher Scientific, Inc., 2.950%, 09/19/26 | | | 29,175 | |
| | | | | | | | |
| | | | Pharmaceuticals — 0.4% | |
| | | | Allergan Funding SCS, | | | | |
| | 42,000 | | | 3.850%, 06/15/24 | | | 43,803 | |
| | 111,000 | | | 4.550%, 03/15/35 | | | 118,571 | |
| | | | Allergan, Inc., | | | | |
| | 100,000 | | | 2.800%, 03/15/23 | | | 99,005 | |
| | 43,000 | | | 3.375%, 09/15/20 | | | 44,285 | |
| | 52,000 | | | Forest Laboratories LLC, 5.000%, 12/15/21 (e) | | | 56,769 | |
| | 19,000 | | | Johnson & Johnson, 4.375%, 12/05/33 | | | 21,632 | |
| | | | Merck & Co., Inc., | | | | |
| | 21,000 | | | 2.400%, 09/15/22 | | | 21,138 | |
| | 63,000 | | | 2.800%, 05/18/23 | | | 64,185 | |
| | 10,000 | | | 3.700%, 02/10/45 | | | 9,988 | |
| | | | Mylan NV, | | | | |
| | 35,000 | | | 3.950%, 06/15/26 | | | 35,467 | |
| | 24,000 | | | 5.250%, 06/15/46 | | | 26,289 | |
| | 50,000 | | | Mylan, Inc., 3.125%, 01/15/23 (e) | | | 49,739 | |
| | 150,000 | | | Pfizer, Inc., 3.000%, 12/15/26 | | | 150,435 | |
SEE NOTES TO FINANCIAL STATEMENTS.
| | | | | | |
| | | |
| 24 | | | | JPMORGAN INSURANCE TRUST | | JUNE 30, 2017 |
| | | | | | | | |
PRINCIPAL
AMOUNT($) | | | SECURITY DESCRIPTION | | VALUE($) | |
| | Corporate Bonds — continued | |
| | | | Pharmaceuticals — continued | |
| | 83,000 | | | Shire Acquisitions Investments Ireland DAC, 2.875%, 09/23/23 | | | 82,256 | |
| | | | Teva Pharmaceutical Finance Netherlands III BV, (Israel), | | | | |
| | 223,000 | | | 2.800%, 07/21/23 | | | 217,146 | |
| | 30,000 | | | 3.150%, 10/01/26 | | | 28,463 | |
| | 10,000 | | | 4.100%, 10/01/46 | | | 9,218 | |
| | | | Zoetis, Inc., | | | | |
| | 14,000 | | | 1.875%, 02/01/18 | | | 14,008 | |
| | 9,000 | | | 4.700%, 02/01/43 | | | 9,790 | |
| | | | | | | | |
| | | | | | | 1,102,187 | |
| | | | | | | | |
| | | | Total Health Care | | | 3,602,477 | |
| | | | | | | | |
| | | | Industrials — 1.7% | |
| | | | Aerospace & Defense — 0.3% | |
| | 32,000 | | | Airbus Group Finance BV, (France), 2.700%, 04/17/23 (e) | | | 32,174 | |
| | 164,000 | | | Airbus SE, (France), 3.150%, 04/10/27 (e) | | | 165,403 | |
| | 45,000 | | | BAE Systems Holdings, Inc., (United Kingdom), 3.800%, 10/07/24 (e) | | | 46,942 | |
| | 51,000 | | | BAE Systems plc, (United Kingdom), 5.800%, 10/11/41 (e) | | | 62,250 | |
| | 23,000 | | | L3 Technologies, Inc., 3.850%, 12/15/26 | | | 23,712 | |
| | | | Lockheed Martin Corp., | | | | |
| | 100,000 | | | 4.500%, 05/15/36 | | | 109,181 | |
| | 30,000 | | | 4.850%, 09/15/41 | | | 34,017 | |
| | 22,000 | | | Series B, 6.150%, 09/01/36 | | | 28,624 | |
| | 76,000 | | | Northrop Grumman Corp., 3.200%, 02/01/27 | | | 76,530 | |
| | 45,000 | | | Precision Castparts Corp., 3.250%, 06/15/25 | | | 45,961 | |
| | 28,000 | | | Rockwell Collins, Inc., 3.200%, 03/15/24 | | | 28,375 | |
| | | | Textron, Inc., | | | | |
| | 57,000 | | | 3.650%, 03/15/27 | | | 57,229 | |
| | 50,000 | | | 4.300%, 03/01/24 | | | 53,099 | |
| | 25,000 | | | United Technologies Corp., 4.150%, 05/15/45 | | | 25,922 | |
| | | | | | | | |
| | | | | | | 789,419 | |
| | | | | | | | |
| | | | Air Freight & Logistics — 0.1% | |
| | | | FedEx Corp., | | | | |
| | 66,000 | | | 3.900%, 02/01/35 | | | 65,583 | |
| | 50,000 | | | 4.100%, 04/15/43 | | | 49,511 | |
| | 35,000 | | | United Parcel Service of America, Inc., 8.375%, 04/01/20 | | | 40,860 | |
| | | | | | | | |
| | | | | | | 155,954 | |
| | | | | | | | |
| | | | | | | | |
PRINCIPAL
AMOUNT($) | | | SECURITY DESCRIPTION | | VALUE($) | |
| | | | | | | | |
| | | | Building Products — 0.0% (g) | |
| | | | Johnson Controls International plc, | | | | |
| | 26,000 | | | 3.900%, 02/14/26 | | | 27,225 | |
| | 30,000 | | | 5.700%, 03/01/41 | | | 35,534 | |
| | 27,000 | | | SUB, 4.950%, 07/02/64 | | | 28,964 | |
| | | | | | | | |
| | | | | | | 91,723 | |
| | | | | | | | |
| | | | Commercial Services & Supplies — 0.1% | |
| | 70,000 | | | Brambles USA, Inc., (Australia), 4.125%, 10/23/25 (e) | | | 71,802 | |
| | | | Republic Services, Inc., | | | | |
| | 21,000 | | | 2.900%, 07/01/26 | | | 20,591 | |
| | 21,000 | | | 3.550%, 06/01/22 | | | 21,855 | |
| | | | | | | | |
| | | | | | | 114,248 | |
| | | | | | | | |
| | | | Construction & Engineering — 0.0% (g) | |
| | 23,000 | | | ABB Finance USA, Inc., (Switzerland), 2.875%, 05/08/22 | | | 23,520 | |
| | 44,000 | | | Fluor Corp., 3.375%, 09/15/21 | | | 45,682 | |
| | | | | | | | |
| | | | | | | 69,202 | |
| | | | | | | | |
| | | | Industrial Conglomerates — 0.3% | |
| | | | General Electric Co., | | | | |
| | 100,000 | | | 3.100%, 01/09/23 | | | 103,690 | |
| | 88,000 | | | 5.500%, 01/08/20 | | | 95,847 | |
| | 100,000 | | | 5.875%, 01/14/38 | | | 129,619 | |
| | 99,000 | | | 6.750%, 03/15/32 | | | 135,714 | |
| | 150,000 | | | Honeywell International, Inc., 2.500%, 11/01/26 | | | 143,815 | |
| | 56,000 | | | Pentair Finance SA, (United Kingdom), 2.900%, 09/15/18 | | | 56,580 | |
| | 25,000 | | | Roper Technologies, Inc., 3.800%, 12/15/26 | | | 25,689 | |
| | | | | | | | |
| | | | | | | 690,954 | |
| | | | | | | | |
| | | | Machinery — 0.1% | |
| | 80,000 | | | Illinois Tool Works, Inc., 4.875%, 09/15/41 | | | 93,588 | |
| | | | Parker-Hannifin Corp., | | | | |
| | 21,000 | | | 4.100%, 03/01/47 (e) | | | 21,977 | |
| | 30,000 | | | 4.450%, 11/21/44 | | | 32,868 | |
| | 25,000 | | | 5.500%, 05/15/18 | | | 25,846 | |
| | 40,000 | | | Xylem, Inc., 4.375%, 11/01/46 | | | 41,460 | |
| | | | | | | | |
| | | | | | | 215,739 | |
| | | | | | | | |
| | | | Professional Services — 0.0% (g) | |
| | 37,000 | | | Equifax, Inc., 2.300%, 06/01/21 | | | 36,743 | |
| | | | | | | | |
SEE NOTES TO FINANCIAL STATEMENTS.
| | | | | | | | |
| | | |
| JUNE 30, 2017 | | JPMORGAN INSURANCE TRUST | | | | | 25 | |
JPMorgan Insurance Trust Core Bond Portfolio
SCHEDULE OF PORTFOLIO INVESTMENTS
AS OF JUNE 30, 2017 (Unaudited) (continued)
| | | | | | | | |
PRINCIPAL
AMOUNT($) | | | SECURITY DESCRIPTION | | VALUE($) | |
| | Corporate Bonds — continued | |
| | | | Road & Rail — 0.6% | |
| | | | Burlington Northern Santa Fe LLC, | | | | |
| | 50,000 | | | 3.000%, 03/15/23 | | | 51,267 | |
| | 25,000 | | | 3.600%, 09/01/20 | | | 26,126 | |
| | 25,000 | | | 4.375%, 09/01/42 | | | 26,891 | |
| | 40,000 | | | 4.400%, 03/15/42 | | | 43,141 | |
| | 35,000 | | | 4.700%, 09/01/45 | | | 39,474 | |
| | 77,000 | | | 5.150%, 09/01/43 | | | 92,297 | |
| | 126,000 | | | 5.400%, 06/01/41 | | | 153,671 | |
| | 85,000 | | | 5.750%, 05/01/40 | | | 107,467 | |
| | | | Canadian Pacific Railway Co., (Canada), | | | | |
| | 35,000 | | | 4.500%, 01/15/22 | | | 37,520 | |
| | 137,000 | | | 6.125%, 09/15/151 | | | 172,154 | |
| | | | CSX Corp., | | | | |
| | 39,000 | | | 3.250%, 06/01/27 | | | 39,371 | |
| | 19,000 | | | 3.950%, 05/01/50 | | | 18,555 | |
| | 33,000 | | | 4.250%, 06/01/21 | | | 35,180 | |
| | 50,000 | | | 5.500%, 04/15/41 | | | 60,278 | |
| | | | ERAC USA Finance LLC, | | | | |
| | 50,000 | | | 2.600%, 12/01/21 (e) | | | 49,797 | |
| | 45,000 | | | 4.500%, 08/16/21 (e) | | | 48,184 | |
| | 12,000 | | | 5.625%, 03/15/42 (e) | | | 13,645 | |
| | 160,000 | | | 7.000%, 10/15/37 (e) | | | 207,917 | |
| | 70,000 | | | JB Hunt Transport Services, Inc., 3.850%, 03/15/24 | | | 72,310 | |
| | | | Norfolk Southern Corp., | | | | |
| | 70,000 | | | 3.950%, 10/01/42 | | | 69,529 | |
| | 66,000 | | | 6.000%, 05/23/112 | | | 79,606 | |
| | | | Penske Truck Leasing Co. LP, | | | | |
| | 27,000 | | | 2.875%, 07/17/18 (e) | | | 27,271 | |
| | 25,000 | | | 3.400%, 11/15/26 (e) | | | 24,570 | |
| | 75,000 | | | 4.200%, 04/01/27 (e) | | | 77,487 | |
| | 100,000 | | | Ryder System, Inc., 2.250%, 09/01/21 | | | 98,715 | |
| | | | | | | | |
| | | | | | | 1,672,423 | |
| | | | | | | | |
| | | | Trading Companies & Distributors — 0.2% | |
| | | | Air Lease Corp., | | | | |
| | 100,000 | | | 2.125%, 01/15/20 | | | 99,515 | |
| | 48,000 | | | 3.000%, 09/15/23 | | | 47,717 | |
| | 35,000 | | | 3.875%, 04/01/21 | | | 36,506 | |
| | 100,000 | | | Aviation Capital Group Corp., 2.875%, 01/20/22 (e) | | | 99,636 | |
| | | | International Lease Finance Corp., | | | | |
| | 150,000 | | | 5.875%, 08/15/22 | | | 169,325 | |
| | 70,000 | | | 8.625%, 01/15/22 | | | 86,188 | |
| | | | | | | | |
PRINCIPAL
AMOUNT($) | | | SECURITY DESCRIPTION | | VALUE($) | |
| | | | | | | | |
| | | | Trading Companies & Distributors — continued | |
| | 77,000 | | | WW Grainger, Inc., 4.600%, 06/15/45 | | | 83,931 | |
| | | | | | | | |
| | | | | | | 622,818 | |
| | | | | | | | |
| | | | Total Industrials | | | 4,459,223 | |
| | | | | | | | |
| | | | Information Technology — 1.8% | |
| | | | Communications Equipment — 0.1% | |
| | | | Cisco Systems, Inc., | | | | |
| | 50,000 | | | 1.850%, 09/20/21 | | | 49,379 | |
| | 56,000 | | | 3.000%, 06/15/22 | | | 57,585 | |
| | 75,000 | | | 5.900%, 02/15/39 | | | 97,637 | |
| | | | Harris Corp., | | | | |
| | 60,000 | | | 3.832%, 04/27/25 | | | 62,114 | |
| | 50,000 | | | 4.854%, 04/27/35 | | | 54,805 | |
| | | | | | | | |
| | | | | | | 321,520 | |
| | | | | | | | |
| | | | Electronic Equipment, Instruments & Components — 0.0% (g) | |
| | | | Arrow Electronics, Inc., | | | | |
| | 13,000 | | | 3.000%, 03/01/18 | | | 13,093 | |
| | 22,000 | | | 3.875%, 01/12/28 | | | 21,902 | |
| | 8,000 | | | 4.500%, 03/01/23 | | | 8,460 | |
| | | | | | | | |
| | | | | | | 43,455 | |
| | | | | | | | |
| | | | Internet Software & Services — 0.1% | |
| | | | eBay, Inc., | | | | |
| | 50,000 | | | 2.600%, 07/15/22 | | | 49,554 | |
| | 70,000 | | | 3.450%, 08/01/24 | | | 70,461 | |
| | | | | | | | |
| | | | | | | 120,015 | |
| | | | | | | | |
| | | | IT Services — 0.2% | |
| | 34,000 | | | DXC Technology Co., 4.250%, 04/15/24 (e) | | | 35,226 | |
| | 50,000 | | | HP Enterprise Services LLC, 7.450%, 10/15/29 | | | 60,918 | |
| | | | International Business Machines Corp., | | | | |
| | 174,000 | | | 2.250%, 02/19/21 | | | 174,927 | |
| | 169,000 | | | 4.000%, 06/20/42 | | | 169,017 | |
| | 50,000 | | | 6.220%, 08/01/27 | | | 62,540 | |
| | | | Western Union Co. (The), | | | | |
| | 100,000 | | | 3.600%, 03/15/22 | | | 101,909 | |
| | 30,000 | | | 6.200%, 06/21/40 | | | 31,563 | |
| | | | | | | | |
| | | | | | | 636,100 | |
| | | | | | | | |
| | | | Semiconductors & Semiconductor Equipment — 0.2% | |
| | 64,000 | | | Analog Devices, Inc., 4.500%, 12/05/36 | | | 66,390 | |
| | | | Broadcom Corp., | | | | |
| | 120,000 | | | 3.625%, 01/15/24 (e) | | | 122,730 | |
| | 140,000 | | | 3.875%, 01/15/27 (e) | | | 143,781 | |
SEE NOTES TO FINANCIAL STATEMENTS.
| | | | | | |
| | | |
| 26 | | | | JPMORGAN INSURANCE TRUST | | JUNE 30, 2017 |
| | | | | | | | |
PRINCIPAL
AMOUNT($) | | | SECURITY DESCRIPTION | | VALUE($) | |
| | Corporate Bonds — continued | |
| | | | Semiconductors & Semiconductor Equipment — continued | |
| | | | Intel Corp., | | | | |
| | 49,000 | | | 3.700%, 07/29/25 | | | 51,447 | |
| | 60,000 | | | 4.000%, 12/15/32 | | | 63,313 | |
| | 38,000 | | | 4.100%, 05/19/46 | | | 39,443 | |
| | 24,000 | | | 4.900%, 07/29/45 | | | 27,924 | |
| | | | QUALCOMM, Inc., | | | | |
| | 10,000 | | | 2.600%, 01/30/23 | | | 9,967 | |
| | 75,000 | | | 3.250%, 05/20/27 | | | 75,180 | |
| | | | | | | | |
| | | | | | | 600,175 | |
| | | | | | | | |
| | | | Software — 0.7% | |
| | | | Microsoft Corp., | | | | |
| | 125,000 | | | 2.000%, 08/08/23 | | | 121,792 | |
| | 30,000 | | | 2.375%, 02/12/22 | | | 30,217 | |
| | 53,000 | | | 2.375%, 05/01/23 | | | 52,777 | |
| | 160,000 | | | 2.650%, 11/03/22 | | | 162,258 | |
| | 90,000 | | | 2.875%, 02/06/24 | | | 91,441 | |
| | 125,000 | | | 3.450%, 08/08/36 | | | 125,229 | |
| | 68,000 | | | 3.500%, 02/12/35 | | | 68,639 | |
| | 48,000 | | | 3.950%, 08/08/56 | | | 48,091 | |
| | 19,000 | | | 4.000%, 02/12/55 | | | 19,273 | |
| | 119,000 | | | 4.500%, 02/06/57 | | | 130,918 | |
| | | | Oracle Corp., | | | | |
| | 101,000 | | | 2.400%, 09/15/23 | | | 99,675 | |
| | 52,000 | | | 2.500%, 05/15/22 | | | 52,488 | |
| | 100,000 | | | 3.850%, 07/15/36 | | | 103,639 | |
| | 200,000 | | | 3.900%, 05/15/35 | | | 206,325 | |
| | 449,000 | | | 4.300%, 07/08/34 | | | 487,685 | |
| | 50,000 | | | 5.750%, 04/15/18 | | | 51,588 | |
| | | | | | | | |
| | | | | | | 1,852,035 | |
| | | | | | | | |
| | | | Technology Hardware, Storage & Peripherals — 0.5% | |
| | | | Apple, Inc., | | | | |
| | 181,000 | | | 2.150%, 02/09/22 | | | 179,944 | |
| | 142,000 | | | 2.400%, 05/03/23 | | | 141,239 | |
| | 74,000 | | | 2.450%, 08/04/26 | | | 70,831 | |
| | 126,000 | | | 2.850%, 05/06/21 | | | 129,537 | |
| | 117,000 | | | 3.000%, 02/09/24 | | | 118,745 | |
| | 56,000 | | | 3.000%, 06/20/27 | | | 55,725 | |
| | 32,000 | | | 3.200%, 05/13/25 | | | 32,685 | |
| | 57,000 | | | 3.200%, 05/11/27 | | | 57,541 | |
| | 31,000 | | | 3.450%, 02/09/45 | | | 29,174 | |
| | 117,000 | | | 3.850%, 08/04/46 | | | 117,099 | |
| | 43,000 | | | 4.500%, 02/23/36 | | | 48,305 | |
| | 69,000 | | | VAR, 1.422%, 05/03/18 | | | 69,145 | |
| | 25,000 | | | Dell, Inc., 7.100%, 04/15/28 | | | 27,438 | |
| | | | | | | | |
PRINCIPAL
AMOUNT($) | | | SECURITY DESCRIPTION | | VALUE($) | |
| | | | | | | | |
| | | | Technology Hardware, Storage & Peripherals — continued | |
| | | | Diamond 1 Finance Corp., | | | | |
| | 75,000 | | | 5.450%, 06/15/23 (e) | | | 81,378 | |
| | 60,000 | | | 6.020%, 06/15/26 (e) | | | 66,096 | |
| | | | HP, Inc., | | | | |
| | 24,000 | | | 4.300%, 06/01/21 | | | 25,506 | |
| | 20,000 | | | 4.650%, 12/09/21 | | | 21,583 | |
| | 71,000 | | | 6.000%, 09/15/41 | | | 75,291 | |
| | | | | | | | |
| | | | | | | 1,347,262 | |
| | | | | | | | |
| | | | Total Information Technology | | | 4,920,562 | |
| | | | | | | | |
| | | | Materials — 0.7% | |
| | | | Chemicals — 0.5% | |
| | | | Agrium, Inc., (Canada), | | | | |
| | 22,000 | | | 3.375%, 03/15/25 | | | 22,004 | |
| | 130,000 | | | 4.125%, 03/15/35 | | | 129,511 | |
| | 38,000 | | | 5.250%, 01/15/45 | | | 43,197 | |
| | | | CF Industries, Inc., | | | | |
| | 67,000 | | | 4.500%, 12/01/26 (e) | | | 68,893 | |
| | 80,000 | | | 7.125%, 05/01/20 | | | 88,400 | |
| | 45,000 | | | Chevron Phillips Chemical Co. LLC, 3.400%, 12/01/26 (e) | | | 45,755 | |
| | 30,000 | | | Dow Chemical Co. (The), 7.375%, 11/01/29 | | | 40,288 | |
| | 90,000 | | | Ecolab, Inc., 3.250%, 01/14/23 | | | 92,831 | |
| | 25,000 | | | EI du Pont de Nemours & Co., 4.900%, 01/15/41 | | | 27,954 | |
| | 9,000 | | | Monsanto Co., 4.700%, 07/15/64 | | | 9,080 | |
| | | | Mosaic Co. (The), | | | | |
| | 95,000 | | | 4.250%, 11/15/23 | | | 99,949 | |
| | 8,000 | | | 4.875%, 11/15/41 | | | 7,514 | |
| | 36,000 | | | 5.450%, 11/15/33 | | | 38,017 | |
| | 22,000 | | | 5.625%, 11/15/43 | | | 22,488 | |
| | | | Potash Corp. of Saskatchewan, Inc., (Canada), | | | | |
| | 10,000 | | | 3.250%, 12/01/17 | | | 10,062 | |
| | 70,000 | | | 4.000%, 12/15/26 | | | 72,185 | |
| | | | PPG Industries, Inc., | | | | |
| | 14,000 | | | 5.500%, 11/15/40 | | | 16,622 | |
| | 50,000 | | | 9.000%, 05/01/21 | | | 61,142 | |
| | 16,000 | | | Praxair, Inc., 2.650%, 02/05/25 | | | 15,844 | |
| | | | Sherwin-Williams Co. (The), | | | | |
| | 29,000 | | | 3.125%, 06/01/24 | | | 29,139 | |
| | 24,000 | | | 3.450%, 06/01/27 | | | 24,171 | |
| | | | Union Carbide Corp., | | | | |
| | 100,000 | | | 7.500%, 06/01/25 | | | 122,355 | |
| | 80,000 | | | 7.750%, 10/01/96 | | | 106,078 | |
| | | | | | | | |
| | | | | | | 1,193,479 | |
| | | | | | | | |
SEE NOTES TO FINANCIAL STATEMENTS.
| | | | | | | | |
| | | |
| JUNE 30, 2017 | | JPMORGAN INSURANCE TRUST | | | | | 27 | |
JPMorgan Insurance Trust Core Bond Portfolio
SCHEDULE OF PORTFOLIO INVESTMENTS
AS OF JUNE 30, 2017 (Unaudited) (continued)
| | | | | | | | |
PRINCIPAL
AMOUNT($) | | | SECURITY DESCRIPTION | | VALUE($) | |
| | Corporate Bonds — continued | |
| | | | Construction Materials — 0.0% (g) | |
| | 52,000 | | | Martin Marietta Materials, Inc., 3.450%, 06/01/27 | | | 51,735 | |
| | | | | | | | |
| | | | Containers & Packaging — 0.0% (g) | |
| | | | International Paper Co., | | | | |
| | 57,000 | | | 3.000%, 02/15/27 | | | 54,863 | |
| | 40,000 | | | 7.300%, 11/15/39 | | | 54,153 | |
| | | | | | | | |
| | | | | | | 109,016 | |
| | | | | | | | |
| | | | Metals & Mining — 0.2% | |
| | 44,000 | | | BHP Billiton Finance USA Ltd., (Australia), 3.850%, 09/30/23 | | | 46,821 | |
| | | | Nucor Corp., | | | | |
| | 213,000 | | | 4.000%, 08/01/23 | | | 225,103 | |
| | 30,000 | | | 6.400%, 12/01/37 | | | 38,824 | |
| | 80,000 | | | Vale Canada Ltd., (Brazil), 7.200%, 09/15/32 | | | 85,800 | |
| | | | Vale Overseas Ltd., (Brazil), | | | | |
| | 38,000 | | | 6.250%, 08/10/26 | | | 41,059 | |
| | 140,000 | | | 6.875%, 11/21/36 | | | 150,150 | |
| | | | | | | | |
| | | | | | | 587,757 | |
| | | | | | | | |
| | | | Total Materials | | | 1,941,987 | |
| | | | | | | | |
| | | | Real Estate — 1.2% | | | | |
| | | | Equity Real Estate Investment Trusts (REITs) — 1.1% | |
| | | | American Tower Corp., | | | | |
| | 44,000 | | | 3.375%, 10/15/26 | | | 43,054 | |
| | 87,000 | | | 3.500%, 01/31/23 | | | 89,215 | |
| | 71,000 | | | 5.000%, 02/15/24 | | | 78,456 | |
| | 30,000 | | | 5.900%, 11/01/21 | | | 33,796 | |
| | 80,000 | | | American Tower Trust I, 3.070%, 03/15/23 (e) | | | 80,600 | |
| | | | AvalonBay Communities, Inc., | | | | |
| | 50,000 | | | 2.850%, 03/15/23 | | | 49,744 | |
| | 50,000 | | | 3.500%, 11/15/24 | | | 51,263 | |
| | 32,000 | | | 3.900%, 10/15/46 | | | 30,895 | |
| | | | Boston Properties LP, | | | | |
| | 30,000 | | | 2.750%, 10/01/26 | | | 28,328 | |
| | 30,000 | | | 3.125%, 09/01/23 | | | 30,367 | |
| | 67,000 | | | 3.650%, 02/01/26 | | | 67,807 | |
| | 50,000 | | | Brixmor Operating Partnership LP, 3.850%, 02/01/25 | | | 49,348 | |
| | | | Crown Castle International Corp., | | | | |
| | 24,000 | | | 4.000%, 03/01/27 | | | 24,706 | |
| | 88,000 | | | 4.875%, 04/15/22 | | | 96,123 | |
| | 60,000 | | | 5.250%, 01/15/23 | | | 66,642 | |
| | 70,000 | | | DDR Corp., 3.625%, 02/01/25 | | | 66,598 | |
| | | | | | | | |
PRINCIPAL
AMOUNT($) | | | SECURITY DESCRIPTION | | VALUE($) | |
| | | | | | | | |
| | | | Equity Real Estate Investment Trusts (REITs) — continued | |
| | 18,000 | | | Duke Realty LP, 3.250%, 06/30/26 | | | 17,678 | |
| | 54,000 | | | EPR Properties, 4.500%, 06/01/27 | | | 54,330 | |
| | | | Equity Commonwealth, | | | | |
| | 75,000 | | | 5.875%, 09/15/20 | | | 80,202 | |
| | 100,000 | | | 6.650%, 01/15/18 | | | 100,120 | |
| | | | ERP Operating LP, | | | | |
| | 46,000 | | | 2.850%, 11/01/26 | | | 44,237 | |
| | 50,000 | | | 3.000%, 04/15/23 | | | 50,205 | |
| | 79,000 | | | GAIF Bond Issuer Pty. Ltd., (Australia), 3.400%, 09/30/26 (e) | | | 77,603 | |
| | 115,000 | | | HCP, Inc., 3.875%, 08/15/24 | | | 117,249 | |
| | 62,000 | | | Hospitality Properties Trust, 4.950%, 02/15/27 | | | 64,749 | |
| | | | Kimco Realty Corp., | | | | |
| | 67,000 | | | 2.700%, 03/01/24 | | | 63,951 | |
| | 100,000 | | | 3.800%, 04/01/27 | | | 100,029 | |
| | 58,000 | | | National Retail Properties, Inc., 3.600%, 12/15/26 | | | 57,534 | |
| | | | Prologis LP, | | | | |
| | 24,000 | | | 3.750%, 11/01/25 | | | 24,988 | |
| | 27,000 | | | 4.250%, 08/15/23 | | | 29,143 | |
| | | | Realty Income Corp., | | | | |
| | 57,000 | | | 3.000%, 01/15/27 | | | 53,991 | |
| | 20,000 | | | 3.875%, 07/15/24 | | | 20,655 | |
| | 38,000 | | | 4.650%, 03/15/47 | | | 39,599 | |
| | 170,000 | | | Scentre Group Trust 1, (Australia), 3.500%, 02/12/25 (e) | | | 170,642 | |
| | | | Simon Property Group LP, | | | | |
| | 119,000 | | | 2.500%, 07/15/21 | | | 119,009 | |
| | 70,000 | | | 4.375%, 03/01/21 | | | 74,542 | |
| | 28,000 | | | UDR, Inc., 2.950%, 09/01/26 | | | 26,459 | |
| | | | Ventas Realty LP, | | | | |
| | 9,000 | | | 3.500%, 02/01/25 | | | 8,942 | |
| | 74,000 | | | 3.750%, 05/01/24 | | | 75,274 | |
| | 49,000 | | | 3.850%, 04/01/27 | | | 49,261 | |
| | 34,000 | | | 4.125%, 01/15/26 | | | 34,970 | |
| | 170,000 | | | VEREIT Operating Partnership LP, 4.600%, 02/06/24 | | | 177,555 | |
| | | | Welltower, Inc., | | | | |
| | 50,000 | | | 3.750%, 03/15/23 | | | 51,875 | |
| | 70,000 | | | 4.000%, 06/01/25 | | | 72,383 | |
| | 37,000 | | | 4.500%, 01/15/24 | | | 39,490 | |
| | 60,000 | | | Weyerhaeuser Co., 7.375%, 03/15/32 | | | 82,624 | |
| | | | | | | | |
| | | | | | | 2,866,231 | |
| | | | | | | | |
SEE NOTES TO FINANCIAL STATEMENTS.
| | | | | | |
| | | |
| 28 | | | | JPMORGAN INSURANCE TRUST | | JUNE 30, 2017 |
| | | | | | | | |
PRINCIPAL
AMOUNT($) | | | SECURITY DESCRIPTION | | VALUE($) | |
| | Corporate Bonds — continued | |
| | | | Real Estate Management & Development — 0.1% | |
| | 200,000 | | | Ontario Teachers’ Cadillac Fairview Properties Trust, (Canada), 3.125%, 03/20/22 (e) | | | 202,840 | |
| | | | | | | | |
| | | | Total Real Estate | | | 3,069,071 | |
| | | | | | | | |
| | | | Telecommunication Services — 1.4% | |
| | | | Diversified Telecommunication Services — 1.3% | |
| | | | AT&T, Inc., | | | | |
| | 172,000 | | | 3.000%, 06/30/22 | | | 172,302 | |
| | 110,000 | | | 3.400%, 05/15/25 | | | 108,150 | |
| | 175,000 | | | 3.600%, 02/17/23 | | | 179,083 | |
| | 40,000 | | | 3.950%, 01/15/25 | | | 40,771 | |
| | 4,000 | | | 4.300%, 12/15/42 | | | 3,719 | |
| | 51,000 | | | 4.450%, 04/01/24 | | | 53,692 | |
| | 5,000 | | | 4.500%, 05/15/35 | | | 4,924 | |
| | 125,000 | | | 4.600%, 02/15/21 | | | 133,306 | |
| | 26,000 | | | 4.750%, 05/15/46 | | | 25,531 | |
| | 100,000 | | | 5.250%, 03/01/37 | | | 106,653 | |
| | 228,000 | | | 5.350%, 09/01/40 | | | 241,711 | |
| | 50,000 | | | 5.500%, 02/01/18 | | | 51,075 | |
| | 50,000 | | | 5.800%, 02/15/19 | | | 53,042 | |
| | 125,000 | | | 6.000%, 08/15/40 | | | 141,307 | |
| | 60,000 | | | 6.150%, 09/15/34 | | | 68,615 | |
| | 45,000 | | | 6.300%, 01/15/38 | | | 52,960 | |
| | 50,000 | | | Centel Capital Corp., 9.000%, 10/15/19 | | | 56,779 | |
| | 70,000 | | | Deutsche Telekom International Finance BV, (Germany), 8.750%, 06/15/30 | | | 103,828 | |
| | 30,000 | | | Orange SA, (France), SUB, 9.000%, 03/01/31 | | | 45,382 | |
| | | | Telefonica Emisiones SAU, (Spain), | | | | |
| | 150,000 | | | 4.570%, 04/27/23 | | | 163,271 | |
| | 25,000 | | | 5.134%, 04/27/20 | | | 26,961 | |
| | 19,000 | | | 5.462%, 02/16/21 | | | 20,884 | |
| | 50,000 | | | 7.045%, 06/20/36 | | | 65,750 | |
| | | | Verizon Communications, Inc., | | | | |
| | 69,000 | | | 2.946%, 03/15/22 (e) | | | 69,472 | |
| | 53,000 | | | 3.450%, 03/15/21 | | | 54,868 | |
| | 89,000 | | | 3.500%, 11/01/24 | | | 89,922 | |
| | 20,000 | | | 4.272%, 01/15/36 | | | 19,325 | |
| | 409,000 | | | 4.400%, 11/01/34 | | | 405,403 | |
| | 89,000 | | | 4.522%, 09/15/48 | | | 84,383 | |
| | 81,000 | | | 4.672%, 03/15/55 | | | 75,831 | |
| | 218,000 | | | 4.812%, 03/15/39 (e) | | | 220,620 | |
| | 285,000 | | | 4.862%, 08/21/46 | | | 284,929 | |
| | 38,000 | | | 5.012%, 08/21/54 | | | 37,451 | |
| | 69,000 | | | 5.250%, 03/16/37 | | | 74,256 | |
| | | | | | | | |
| | | | | | | 3,336,156 | |
| | | | | | | | |
| | | | | | | | |
PRINCIPAL
AMOUNT($) | | | SECURITY DESCRIPTION | | VALUE($) | |
| | | | | | | | |
| | | | Wireless Telecommunication Services — 0.1% | |
| | 42,000 | | | Crown Castle Towers LLC, 3.222%, 05/15/22 (e) | | | 43,022 | |
| | | | Rogers Communications, Inc., (Canada), | | | | |
| | 80,000 | | | 4.100%, 10/01/23 | | | 84,845 | |
| | 50,000 | | | 6.800%, 08/15/18 | | | 52,746 | |
| | 25,000 | | | 8.750%, 05/01/32 | | | 35,900 | |
| | 75,000 | | | Vodafone Group plc, (United Kingdom), 1.500%, 02/19/18 | | | 74,984 | |
| | | | | | | | |
| | | | | | | 291,497 | |
| | | | | | | | |
| | | | Total Telecommunication Services | | | 3,627,653 | |
| | | | | | | | |
| | | | Utilities — 2.3% | |
| | | | Electric Utilities — 1.5% | |
| | 62,000 | | | Alabama Power Co., 6.125%, 05/15/38 | | | 78,344 | |
| | 9,000 | | | Arizona Public Service Co., 4.500%, 04/01/42 | | | 9,843 | |
| | 47,000 | | | Baltimore Gas & Electric Co., 3.500%, 08/15/46 | | | 44,881 | |
| | 200,000 | | | China Southern Power Grid International Finance BVI Co. Ltd., (China), 3.500%, 05/08/27 (e) | | | 199,304 | |
| | 30,000 | | | Commonwealth Edison Co., 3.650%, 06/15/46 | | | 29,251 | |
| | | | Duke Energy Carolinas LLC, | | | | |
| | 100,000 | | | 2.950%, 12/01/26 | | | 99,538 | |
| | 39,000 | | | 4.300%, 06/15/20 | | | 41,590 | |
| | 75,000 | | | 5.100%, 04/15/18 | | | 77,023 | |
| | | | Duke Energy Indiana LLC, | | | | |
| | 60,000 | | | 3.750%, 05/15/46 | | | 59,353 | |
| | 60,000 | | | 6.350%, 08/15/38 | | | 79,749 | |
| | 46,000 | | | Duke Energy Ohio, Inc., 3.700%, 06/15/46 | | | 45,162 | |
| | | | Duke Energy Progress LLC, | | | | |
| | 54,000 | | | 3.700%, 10/15/46 | | | 53,156 | |
| | 25,000 | | | 5.300%, 01/15/19 | | | 26,384 | |
| | | | Electricite de France SA, (France), | | | | |
| | 40,000 | | | 2.150%, 01/22/19 (e) | | | 40,130 | |
| | 75,000 | | | 6.000%, 01/22/143 (e) | | | 82,538 | |
| | 220,000 | | | Enel Finance International NV, (Italy), 3.625%, 05/25/27 (e) | | | 217,900 | |
| | 22,000 | | | Entergy Arkansas, Inc., 3.500%, 04/01/26 | | | 22,715 | |
| | 21,000 | | | Entergy Corp., 2.950%, 09/01/26 | | | 20,111 | |
| | | | Entergy Louisiana LLC, | | | | |
| | 59,000 | | | 2.400%, 10/01/26 | | | 55,618 | |
| | 38,000 | | | 3.050%, 06/01/31 | | | 36,698 | |
| | 33,000 | | | Entergy Mississippi, Inc., 2.850%, 06/01/28 | | | 31,884 | |
SEE NOTES TO FINANCIAL STATEMENTS.
| | | | | | | | |
| | | |
| JUNE 30, 2017 | | JPMORGAN INSURANCE TRUST | | | | | 29 | |
JPMorgan Insurance Trust Core Bond Portfolio
SCHEDULE OF PORTFOLIO INVESTMENTS
AS OF JUNE 30, 2017 (Unaudited) (continued)
| | | | | | | | |
PRINCIPAL
AMOUNT($) | | | SECURITY DESCRIPTION | | VALUE($) | |
| | Corporate Bonds — continued | |
| | | | Electric Utilities — continued | |
| | | | FirstEnergy Corp., | | | | |
| | 27,000 | | | Series B, 3.900%, 07/15/27 | | | 27,005 | |
| | 26,000 | | | Series C, 4.850%, 07/15/47 | | | 26,353 | |
| | | | Florida Power & Light Co., | | | | |
| | 50,000 | | | 5.400%, 09/01/35 | | | 60,252 | |
| | 30,000 | | | 5.950%, 02/01/38 | | | 39,174 | |
| | 200,000 | | | Fortis, Inc., (Canada), 3.055%, 10/04/26 (e) | | | 193,019 | |
| | 18,000 | | | Great Plains Energy, Inc., 4.850%, 06/01/21 | | | 19,181 | |
| | 100,000 | | | Hydro-Quebec, (Canada), Series IO, 8.050%, 07/07/24 | | | 131,229 | |
| | 30,000 | | | Jersey Central Power & Light Co., 6.150%, 06/01/37 | | | 36,050 | |
| | | | Kansas City Power & Light Co., | | | | |
| | 24,000 | | | 3.150%, 03/15/23 | | | 24,206 | |
| | 50,000 | | | 5.300%, 10/01/41 | | | 58,518 | |
| | 56,000 | | | Massachusetts Electric Co., 4.004%, 08/15/46 (e) | | | 56,597 | |
| | | | MidAmerican Energy Co., | | | | |
| | 93,000 | | | 3.100%, 05/01/27 | | | 93,712 | |
| | 59,000 | | | 3.500%, 10/15/24 | | | 61,524 | |
| | 27,000 | | | NextEra Energy Capital Holdings, Inc., 3.550%, 05/01/27 | | | 27,416 | |
| | | | Niagara Mohawk Power Corp., | | | | |
| | 19,000 | | | 3.508%, 10/01/24 (e) | | | 19,655 | |
| | 40,000 | | | 4.881%, 08/15/19 (e) | | | 42,330 | |
| | 65,000 | | | Northern States Power Co., 6.250%, 06/01/36 | | | 85,911 | |
| | 50,000 | | | NSTAR Electric Co., 2.700%, 06/01/26 | | | 48,191 | |
| | 40,000 | | | Ohio Power Co., 6.050%, 05/01/18 | | | 41,403 | |
| | | | Oncor Electric Delivery Co. LLC, | | | | |
| | 30,000 | | | 6.800%, 09/01/18 | | | 31,684 | |
| | 25,000 | | | 7.000%, 09/01/22 | | | 30,092 | |
| | | | Pacific Gas & Electric Co., | | | | |
| | 43,000 | | | 2.950%, 03/01/26 | | | 42,706 | |
| | 16,000 | | | 3.500%, 06/15/25 | | | 16,544 | |
| | 24,000 | | | 4.500%, 12/15/41 | | | 25,940 | |
| | 75,000 | | | 5.625%, 11/30/17 | | | 76,232 | |
| | 100,000 | | | 6.050%, 03/01/34 | | | 129,167 | |
| | 75,000 | | | Potomac Electric Power Co., 6.500%, 11/15/37 | | | 102,128 | |
| | 30,000 | | | PPL Capital Funding, Inc., 3.400%, 06/01/23 | | | 30,827 | |
| | 35,000 | | | Progress Energy, Inc., 4.400%, 01/15/21 | | | 37,178 | |
| | 18,000 | | | Public Service Co. of Colorado, 3.200%, 11/15/20 | | | 18,560 | |
| | | | | | | | |
PRINCIPAL
AMOUNT($) | | | SECURITY DESCRIPTION | | VALUE($) | |
| | | | | | | | |
| | | | Electric Utilities — continued | |
| | 175,000 | | | Public Service Co. of Oklahoma, Series G, 6.625%, 11/15/37 | | | 231,091 | |
| | | | Public Service Electric & Gas Co., | | | | |
| | 83,000 | | | 3.000%, 05/15/25 | | | 83,819 | |
| | 28,000 | | | 5.375%, 11/01/39 | | | 33,959 | |
| | | | Southern California Edison Co., | | | | |
| | 13,571 | | | 1.845%, 02/01/22 | | | 13,401 | |
| | 53,000 | | | Series C, 3.500%, 10/01/23 | | | 55,343 | |
| | 50,000 | | | Southwestern Public Service Co., Series G, 8.750%, 12/01/18 | | | 54,685 | |
| | 200,000 | | | State Grid Overseas Investment 2013 Ltd., (China), 1.750%, 05/22/18 (e) | | | 199,396 | |
| | 50,000 | | | Toledo Edison Co. (The), 6.150%, 05/15/37 | | | 62,153 | |
| | 36,000 | | | Union Electric Co., 2.950%, 06/15/27 | | | 35,633 | |
| | | | Virginia Electric & Power Co., | | | | |
| | 120,000 | | | 5.400%, 04/30/18 | | | 123,670 | |
| | 70,000 | | | 6.350%, 11/30/37 | | | 93,179 | |
| | | | Xcel Energy, Inc., | | | | |
| | 74,000 | | | 3.300%, 06/01/25 | | | 74,662 | |
| | 20,000 | | | 6.500%, 07/01/36 | | | 26,335 | |
| | | | | | | | |
| | | | | | | 4,071,282 | |
| | | | | | | | |
| | | | Gas Utilities — 0.1% | |
| | | | Atmos Energy Corp., | | | | |
| | 50,000 | | | 3.000%, 06/15/27 | | | 49,673 | |
| | 50,000 | | | 4.125%, 10/15/44 | | | 52,697 | |
| | 22,000 | | | Boston Gas Co., 4.487%, 02/15/42 (e) | | | 23,550 | |
| | 25,000 | | | CenterPoint Energy Resources Corp., 4.500%, 01/15/21 | | | 26,251 | |
| | 49,000 | | | Dominion Energy Gas Holdings LLC, 2.800%, 11/15/20 | | | 49,591 | |
| | | | Southern Natural Gas Co. LLC, | | | | |
| | 26,000 | | | 4.800%, 03/15/47 (e) | | | 27,553 | |
| | 53,000 | | | 8.000%, 03/01/32 | | | 71,699 | |
| | 44,000 | | | Southwest Gas Corp., 3.800%, 09/29/46 | | | 42,511 | |
| | | | | | | | |
| | | | | | | 343,525 | |
| | | | | | | | |
| | | | Independent Power and Renewable Electricity Producers — 0.2% | |
| | | | Exelon Generation Co. LLC, | | | | |
| | 15,000 | | | 2.950%, 01/15/20 | | | 15,266 | |
| | 78,000 | | | 4.250%, 06/15/22 | | | 82,063 | |
| | 29,000 | | | 5.750%, 10/01/41 | | | 29,538 | |
| | 100,000 | | | 6.250%, 10/01/39 | | | 109,234 | |
| | 37,000 | | | PSEG Power LLC, 4.150%, 09/15/21 | | | 38,850 | |
| | | | Southern Power Co., | | | | |
| | 86,000 | | | 1.850%, 12/01/17 | | | 86,076 | |
| | 50,000 | | | 5.150%, 09/15/41 | | | 52,709 | |
SEE NOTES TO FINANCIAL STATEMENTS.
| | | | | | |
| | | |
| 30 | | | | JPMORGAN INSURANCE TRUST | | JUNE 30, 2017 |
| | | | | | | | |
PRINCIPAL
AMOUNT($) | | | SECURITY DESCRIPTION | | VALUE($) | |
| | Corporate Bonds — continued | |
| | | | Independent Power and Renewable Electricity Producers — continued | |
| | 25,000 | | | Tri-State Generation & Transmission Association, Inc., 4.250%, 06/01/46 | | | 24,670 | |
| | | | | | | | |
| | | | | | | 438,406 | |
| | | | | | | | |
| | | | Multi-Utilities — 0.5% | |
| | | | CMS Energy Corp., | | | | |
| | 47,000 | | | 2.950%, 02/15/27 | | | 45,077 | |
| | 110,000 | | | 3.875%, 03/01/24 | | | 115,069 | |
| | | | Consolidated Edison Co. of New York, Inc., | | | | |
| | 38,000 | | | 5.700%, 06/15/40 | | | 47,754 | |
| | 108,000 | | | Series C, 4.300%, 12/01/56 | | | 112,767 | |
| | 19,000 | | | Consumers Energy Co., 3.250%, 08/15/46 | | | 17,445 | |
| | 50,000 | | | Delmarva Power & Light Co., 4.150%, 05/15/45 | | | 52,957 | |
| | 60,000 | | | Dominion Energy, Inc., Series B, 2.750%, 01/15/22 | | | 60,320 | |
| | 30,000 | | | DTE Energy Co., Series B, 3.300%, 06/15/22 | | | 30,779 | |
| | 50,000 | | | New York State Electric & Gas Corp., 3.250%, 12/01/26 (e) | | | 50,074 | |
| | 130,000 | | | NiSource Finance Corp., 6.250%, 12/15/40 | | | 162,898 | |
| | 70,000 | | | San Diego Gas & Electric Co., 5.350%, 05/15/35 | | | 83,486 | |
| | | | Sempra Energy, | | | | |
| | 47,000 | | | 3.550%, 06/15/24 | | | 48,140 | |
| | 62,000 | | | 4.050%, 12/01/23 | | | 65,381 | |
| | | | Southern Co. Gas Capital Corp., | | | | |
| | 19,000 | | | 2.450%, 10/01/23 | | | 18,430 | |
| | 17,000 | | | 3.250%, 06/15/26 | | | 16,684 | |
| | 37,000 | | | 3.500%, 09/15/21 | | | 38,201 | |
| | 21,000 | | | 3.950%, 10/01/46 | | | 20,075 | |
| | 42,000 | | | 4.400%, 06/01/43 | | | 42,756 | |
| | 96,000 | | | 5.875%, 03/15/41 | | | 116,283 | |
| | 43,000 | | | WEC Energy Group, Inc., 3.550%, 06/15/25 | | | 44,345 | |
| | | | | | | | |
| | | | | | | 1,188,921 | |
| | | | | | | | |
| | | | Water Utilities — 0.0% (g) | |
| | | | American Water Capital Corp., | | | | |
| | 34,000 | | | 3.400%, 03/01/25 | | | 35,162 | |
| | 52,000 | | | 4.000%, 12/01/46 | | | 54,004 | |
| | | | | | | | |
| | | | | | | 89,166 | |
| | | | | | | | |
| | | | Total Utilities | | | 6,131,300 | |
| | | | | | | | |
| | | | Total Corporate Bonds
(Cost $67,867,499) | | | 69,508,396 | |
| | | | | | | | |
| | | | | | | | |
PRINCIPAL
AMOUNT($) | | | SECURITY DESCRIPTION | | VALUE($) | |
| | Foreign Government Securities — 0.4% | |
| | 100,000 | | | Republic of Colombia, (Colombia), 7.375%, 09/18/37 | | | 128,625 | |
| | 7,000 | | | Republic of Peru, (Peru), 5.625%, 11/18/50 | | | 8,496 | |
| | 50,000 | | | Republic of Poland, (Poland), 4.000%, 01/22/24 | | | 53,500 | |
| | | | United Mexican States, (Mexico), | | | | |
| | 200,000 | | | 3.600%, 01/30/25 | | | 202,800 | |
| | 204,000 | | | 3.625%, 03/15/22 | | | 211,752 | |
| | 58,000 | | | 4.000%, 10/02/23 | | | 60,755 | |
| | 200,000 | | | 4.125%, 01/21/26 | | | 207,900 | |
| | 58,000 | | | 4.350%, 01/15/47 | | | 54,665 | |
| | 48,000 | | | 5.550%, 01/21/45 | | | 53,760 | |
| | | | | | | | |
| | | | Total Foreign Government Securities
(Cost $972,897) | | | 982,253 | |
| | | | | | | | |
| | Mortgage-Backed Securities — 14.4% | |
| | | | FHLMC, | | | | |
| | 13,454 | | | ARM, 2.777%, 04/01/30 | | | 14,129 | |
| | 37,156 | | | ARM, 2.822%, 01/01/27 | | | 38,745 | |
| | 45,833 | | | ARM, 3.301%, 03/01/35 | | | 47,898 | |
| | 24,128 | | | ARM, 3.464%, 01/01/37 | | | 25,714 | |
| | 56,011 | | | ARM, 3.485%, 04/01/34 | | | 59,135 | |
| | | | FHLMC Gold Pools, 15 Year, Single Family, | | | | |
| | 1,577 | | | 4.500%, 08/01/18 | | | 1,612 | |
| | 1,253 | | | 6.500%, 10/01/17 - 02/01/19 | | | 1,258 | |
| | 9,233 | | | FHLMC Gold Pools, 20 Year, Single Family, 6.000%, 12/01/22 | | | 10,377 | |
| | | | FHLMC Gold Pools, 30 Year, Single Family, | | | | |
| | 364,577 | | | 4.500%, 05/01/47 | | | 390,445 | |
| | 52,180 | | | 5.500%, 10/01/33 | | | 59,541 | |
| | 103,546 | | | 6.000%, 04/01/26 - 02/01/39 | | | 116,586 | |
| | 86,745 | | | 6.500%, 02/01/29 - 11/01/34 | | | 97,290 | |
| | 56,739 | | | 7.000%, 04/01/35 | | | 66,694 | |
| | 2,756 | | | 8.500%, 07/01/28 | | | 3,270 | |
| | | | FHLMC Gold Pools, Other, | | | | |
| | 1,388,692 | | | 3.500%, 04/01/33 - 06/01/42 | | | 1,439,331 | |
| | 659,556 | | | 4.000%, 06/01/42 - 01/01/46 | | | 700,963 | |
| | 38,800 | | | 7.000%, 07/01/29 | | | 42,513 | |
| | | | FHLMC, 30 Year, Single Family, | | | | |
| | 3,299 | | | 10.000%, 01/01/20 - 09/01/20 | | | 3,333 | |
| | | | FNMA, | | | | |
| | 489,000 | | | ARM, 1.785%, 12/01/25 | | | 489,625 | |
| | 95 | | | ARM, 2.477%, 03/01/19 | | | 96 | |
| | 34,604 | | | ARM, 2.652%, 07/01/33 | | | 36,450 | |
| | 67,295 | | | ARM, 2.806%, 08/01/34 | | | 70,619 | |
| | 159,972 | | | ARM, 2.850%, 01/01/35 | | | 166,054 | |
SEE NOTES TO FINANCIAL STATEMENTS.
| | | | | | | | |
| | | |
| JUNE 30, 2017 | | JPMORGAN INSURANCE TRUST | | | | | 31 | |
JPMorgan Insurance Trust Core Bond Portfolio
SCHEDULE OF PORTFOLIO INVESTMENTS
AS OF JUNE 30, 2017 (Unaudited) (continued)
| | | | | | | | |
PRINCIPAL
AMOUNT($) | | | SECURITY DESCRIPTION | | VALUE($) | |
| | Mortgage-Backed Securities — continued | |
| | 47,412 | | | ARM, 2.974%, 04/01/33 | | | 49,739 | |
| | 52,745 | | | ARM, 3.050%, 10/01/34 | | | 55,817 | |
| | 51,437 | | | ARM, 3.225%, 01/01/34 | | | 53,951 | |
| | 45,377 | | | ARM, 3.418%, 05/01/35 | | | 47,425 | |
| | 1,147 | | | ARM, 3.936%, 03/01/29 | | | 1,186 | |
| | | | FNMA, 15 Year, Single Family, | | | | |
| | 10,843 | | | 3.500%, 05/01/19 | | | 11,287 | |
| | 34,360 | | | 4.500%, 03/01/23 - 05/01/23 | | | 35,878 | |
| | 1,114 | | | 5.000%, 06/01/18 | | | 1,140 | |
| | 10,610 | | | 5.500%, 04/01/22 | | | 10,714 | |
| | 12,817 | | | 6.000%, 03/01/18 - 09/01/22 | | | 13,249 | |
| | 7,710 | | | 6.500%, 08/01/20 | | | 7,937 | |
| | | | FNMA, 20 Year, Single Family, | | | | |
| | 18,539 | | | 4.500%, 01/01/25 | | | 19,879 | |
| | 140,094 | | | 5.000%, 11/01/23 | | | 152,918 | |
| | 25,249 | | | 6.500%, 03/01/19 - 12/01/22 | | | 27,943 | |
| | | | FNMA, 30 Year, FHA/VA, | | | | |
| | 16,642 | | | 8.500%, 10/01/26 - 06/01/30 | | | 17,350 | |
| | 34,330 | | | 9.000%, 04/01/25 | | | 38,081 | |
| | | | FNMA, 30 Year, Single Family, | | | | |
| | 152,373 | | | 3.000%, 09/01/31 | | | 152,328 | |
| | 1,497,000 | | | 4.000%, 06/01/47 (w) | | | 1,604,766 | |
| | 14,376 | | | 4.500%, 04/01/38 - 05/01/39 | | | 15,426 | |
| | 43,738 | | | 5.000%, 09/01/35 | | | 48,004 | |
| | 14,542 | | | 5.500%, 01/01/38 - 06/01/38 | | | 16,139 | |
| | 70,768 | | | 6.000%, 01/01/29 - 03/01/33 | | | 81,933 | |
| | 158,525 | | | 6.500%, 09/01/25 - 11/01/36 | | | 179,973 | |
| | 694 | | | 7.000%, 08/01/32 | | | 707 | |
| | 10,723 | | | 7.500%, 03/01/30 | | | 11,339 | |
| | 57,961 | | | 8.000%, 03/01/27 - 11/01/28 | | | 67,834 | |
| | | | FNMA, Other, | | | | |
| | 1,000,000 | | | 2.010%, 06/01/20 | | | 1,004,054 | |
| | 277,520 | | | 2.340%, 12/01/22 | | | 279,325 | |
| | 1,000,000 | | | 2.400%, 12/01/22 - 02/01/23 | | | 1,008,056 | |
| | 500,000 | | | 2.450%, 11/01/22 | | | 505,311 | |
| | 500,000 | | | 2.500%, 04/01/23 | | | 504,685 | |
| | 1,000,000 | | | 2.520%, 05/01/23 | | | 1,010,214 | |
| | 500,000 | | | 2.570%, 08/01/28 | | | 482,471 | |
| | 900,000 | | | 2.590%, 06/01/28 | | | 877,481 | |
| | 500,000 | | | 2.630%, 03/01/26 | | | 497,421 | |
| | 1,000,000 | | | 3.020%, 07/01/23 | | | 1,034,123 | |
| | 650,000 | | | 3.030%, 04/01/30 | | | 646,758 | |
| | 900,000 | | | 3.040%, 07/01/29 | | | 900,000 | |
| | 3,000,000 | | | 3,060%, 07/01/29 | | | 3,015,000 | |
| | 500,000 | | | 3.080%, 04/01/30 | | | 501,957 | |
| | 1,000,000 | | | 3.100%, 09/01/25 | | | 1,026,283 | |
| | 1,000,000 | | | 3.120%, 11/01/26 | | | 1,008,203 | |
| | | | | | | | |
PRINCIPAL
AMOUNT($) | | | SECURITY DESCRIPTION | | VALUE($) | |
| | | | | | | | |
| | 2,500,000 | | | 3.210%, 03/01/29 | | | 2,546,741 | |
| | 1,925,000 | | | 3.290%, 08/01/26 | | | 1,991,400 | |
| | 1,000,000 | | | 3.340%, 02/01/27 | | | 1,048,608 | |
| | 3,222,058 | | | 3.500%, 05/01/43 - 10/01/46 | | | 3,321,420 | |
| | 670,606 | | | 3.690%, 10/01/29 | | | 710,997 | |
| | 300,000 | | | 3.765%, 12/01/25 | | | 321,678 | |
| | 2,000,000 | | | 3.980%, 08/01/25 | | | 2,171,027 | |
| | 1,212,768 | | | 4.000%, 07/01/42 - 09/01/42 | | | 1,285,559 | |
| | 75,536 | | | 5.500%, 09/01/33 - 04/01/38 | | | 83,937 | |
| | 87,324 | | | 5.855%, 10/01/17 | | | 88,065 | |
| | 22,540 | | | 6.000%, 09/01/28 | | | 25,325 | |
| | 130,311 | | | 6.500%, 10/01/35 | | | 142,775 | |
| | | | GNMA I, 30 Year, Single Family, | | | | |
| | 2,745,372 | | | 5.500%, 06/15/38 - 09/15/38 | | | 3,198,465 | |
| | 93,098 | | | 6.000%, 05/15/37 - 10/15/38 | | | 104,974 | |
| | 40,925 | | | 6.500%, 03/15/28 - 12/15/38 | | | 45,997 | |
| | 11,654 | | | 7.000%, 12/15/25 - 06/15/33 | | | 13,532 | |
| | 8,655 | | | 7.500%, 05/15/23 - 09/15/28 | | | 9,418 | |
| | 6,638 | | | 8.000%, 10/15/27 | | | 7,318 | |
| | 1,511 | | | 9.000%, 11/15/24 | | | 1,622 | |
| | 21,276 | | | 9.500%, 10/15/24 | | | 22,873 | |
| | | | GNMA II, 30 Year, Single Family, | | | | |
| | 1,596 | | | 7.500%, 12/20/26 | | | 1,866 | |
| | 35,206 | | | 8.000%, 11/20/26 - 01/20/27 | | | 41,499 | |
| | 1,623 | | | 8.500%, 05/20/25 | | | 1,792 | |
| | | | GNMA II, Other, | | | | |
| | 182,348 | | | ARM, 2.625%, 07/20/34 - 09/20/34 | | | 187,356 | |
| | 156,828 | | | 3.750%, 12/20/32 | | | 163,052 | |
| | | | GNMA, 30 Year, Single Family, | | | | |
| | 6,097 | | | 7.000%, 06/15/28 | | | 6,731 | |
| | 684 | | | 7.500%, 06/15/23 | | | 690 | |
| | | | | | | | |
| | | | Total Mortgage-Backed Securities
(Cost $38,292,929) | | | 38,450,680 | |
| | | | | | | | |
| | Municipal Bonds — 0.1% (t) | |
| | | | New York — 0.1% | |
| | 30,000 | | | New York State Dormitory Authority, State Personal Income Tax, General Purpose, Series D, Rev., 5.600%, 03/15/40 | | | 37,800 | |
| | 130,000 | | | Port Authority of New York & New Jersey, Consolidated, 164th Series, Series 164, Rev., 5.647%, 11/01/40 | | | 164,518 | |
| | | | | | | | |
| | | | | | | 202,318 | |
| | | | | | | | |
| | | | Ohio — 0.0% (g) | |
| | 98,000 | | | Ohio State University, General Receipts, Series A, Rev., 4.800%, 06/01/112 | | | 100,689 | |
| | | | | | | | |
| | | | Total Municipal Bonds
(Cost $256,174) | | | 303,007 | |
| | | | | | | | |
SEE NOTES TO FINANCIAL STATEMENTS.
| | | | | | |
| | | |
| 32 | | | | JPMORGAN INSURANCE TRUST | | JUNE 30, 2017 |
| | | | | | | | |
PRINCIPAL
AMOUNT($) | | | SECURITY DESCRIPTION | | VALUE($) | |
| | U.S. Government Agency Securities — 9.4% | |
| | 30,000 | | | FHLMC, 0.750%, 04/09/18 | | | 29,887 | |
| | 2,000,000 | | | Financing Corp., 15.267%, 11/02/18 (n) | | | 1,960,222 | |
| | 5,770,000 | | | FNMA, 5.430%, 10/09/19 (n) | | | 5,535,276 | |
| | 630,000 | | | FNMA STRIPS, 14.173%, 03/23/28 (n) | | | 457,599 | |
| | | | Resolution Funding Corp. STRIPS, | | | | |
| | 5,230,000 | | | 1.232%, 10/15/19 (n) | | | 5,039,853 | |
| | 65,000 | | | 1.417%, 01/15/21 (n) | | | 60,764 | |
| | 8,000,000 | | | 1.941%, 10/15/20 (n) | | | 7,537,056 | |
| | 15,000 | | | 2.185%, 10/15/25 (n) | | | 12,151 | |
| | 20,000 | | | 2.877%, 01/15/26 (n) | | | 16,051 | |
| | 4,100,000 | | | 12.378%, 07/15/20 (n) | | | 3,886,140 | |
| | | | Tennessee Valley Authority, | | | | |
| | 161,000 | | | 4.250%, 09/15/65 | | | 181,469 | |
| | 33,000 | | | 4.625%, 09/15/60 | | | 39,943 | |
| | 140,000 | | | 5.250%, 09/15/39 | | | 183,966 | |
| | | | | | | | |
| | | | Total U.S. Government Agency Securities
(Cost $23,918,608) | | | 24,940,377 | |
| | | | | | | | |
| | U.S. Treasury Obligations — 23.1% | |
| | | | U.S. Treasury Bond, | | | | |
| | 200,000 | | | 2.875%, 05/15/43 | | | 202,172 | |
| | 1,000,000 | | | 3.000%, 11/15/45 | | | 1,031,680 | |
| | 280,000 | | | 3.500%, 02/15/39 | | | 316,739 | |
| | 270,000 | | | 3.625%, 08/15/43 | | | 310,996 | |
| | 100,000 | | | 3.875%, 08/15/40 | | | 119,129 | |
| | 105,000 | | | 4.250%, 05/15/39 | | | 131,689 | |
| | 1,815,000 | | | 4.375%, 02/15/38 | | | 2,315,118 | |
| | 1,415,000 | | | 4.375%, 11/15/39 | | | 1,805,395 | |
| | 175,000 | | | 4.500%, 05/15/38 | | | 226,864 | |
| | 4,300,000 | | | 5.250%, 11/15/28 | | | 5,537,424 | |
| | 50,000 | | | 6.250%, 05/15/30 | | | 71,295 | |
| | 338,000 | | | 8.000%, 11/15/21 | | | 425,801 | |
| | | | U.S. Treasury Inflation Linked Bond, | | | | |
| | 100,000 | | | 2.500%, 01/15/29 | | | 136,896 | |
| | 300,000 | | | 3.625%, 04/15/28 | | | 592,338 | |
| | 170,000 | | | U.S. Treasury Inflation Linked Note, 1.375%, 07/15/18 | | | 195,821 | |
| | | | U.S. Treasury Note, | | | | |
| | 200,000 | | | 0.750%, 02/15/19 | | | 198,071 | |
| | 150,000 | | | 1.250%, 10/31/18 | | | 149,824 | |
| | 125,000 | | | 1.250%, 11/30/18 | | | 124,839 | |
| | 200,000 | | | 1.375%, 12/31/18 | | | 200,078 | |
| | 400,000 | | | 1.500%, 08/31/18 | | | 400,750 | |
| | 1,000,000 | | | 1.750%, 02/28/22 | | | 995,664 | |
| | 150,000 | | | 1.750%, 09/30/22 | | | 148,623 | |
| | 1,600,000 | | | 1.750%, 05/15/23 | | | 1,575,875 | |
| | 100,000 | | | 2.000%, 10/31/21 | | | 100,793 | |
| | | | | | | | |
PRINCIPAL
AMOUNT($) | | | SECURITY DESCRIPTION | | VALUE($) | |
| | 150,000 | | | 2.000%, 07/31/22 | | | 150,650 | |
| | 200,000 | | | 2.125%, 08/31/20 | | | 203,195 | |
| | 500,000 | | | 2.125%, 08/15/21 | | | 506,992 | |
| | 300,000 | | | 2.125%, 12/31/21 | | | 303,844 | |
| | 115,000 | | | 2.250%, 04/30/21 | | | 117,233 | |
| | 200,000 | | | 2.625%, 11/15/20 | | | 206,398 | |
| | 1,542,000 | | | 3.125%, 05/15/19 | | | 1,591,694 | |
| | 600,000 | | | 3.125%, 05/15/21 | | | 631,242 | |
| | 450,000 | | | 3.500%, 05/15/20 | | | 474,715 | |
| | 650,000 | | | 3.625%, 02/15/21 | | | 694,205 | |
| | | | U.S. Treasury STRIPS Bond, | | | | |
| | 1,000,000 | | | 1.588%, 11/15/19 (n) | | | 965,318 | |
| | 370,000 | | | 1.767%, 02/15/20 (n) | | | 355,788 | |
| | 1,790,000 | | | 1.921%, 05/15/21 (n) | | | 1,670,263 | |
| | 1,800,000 | | | 2.084%, 08/15/21 (n) | | | 1,669,984 | |
| | 12,173,000 | | | 2.105%, 05/15/20 (n) | | | 11,643,828 | |
| | 1,660,000 | | | 2.129%, 08/15/23 (n) | | | 1,458,801 | |
| | 730,000 | | | 2.216%, 05/15/19 (n) | | | 710,952 | |
| | 500,000 | | | 2.326%, 11/15/23 (n) | | | 436,227 | |
| | 710,000 | | | 2.446%, 02/15/21 (n) | | | 666,518 | |
| | 2,650,000 | | | 2.460%, 05/15/23 (n) | | | 2,343,806 | |
| | 760,000 | | | 2.532%, 05/15/22 (n) | | | 690,835 | |
| | 2,200,000 | | | 2.635%, 05/15/34 (n) | | | 1,394,230 | |
| | 970,000 | | | 2.643%, 02/15/22 (n) | | | 887,816 | |
| | 500,000 | | | 2.644%, 11/15/22 (n) | | | 448,397 | |
| | 150,000 | | | 2.677%, 02/15/18 (n) | | | 148,921 | |
| | 410,000 | | | 2.745%, 08/15/20 (n) | | | 389,900 | |
| | 140,000 | | | 2.754%, 05/15/28 (n) | | | 106,834 | |
| | 2,690,000 | | | 2.850%, 02/15/23 (n) | | | 2,395,835 | |
| | 300,000 | | | 2.921%, 08/15/32 (n) | | | 200,771 | |
| | 27,000 | | | 2.943%, 02/15/28 (n) | | | 20,762 | |
| | 200,000 | | | 2.952%, 08/15/22 (n) | | | 180,559 | |
| | 760,000 | | | 3.052%, 11/15/31 (n) | | | 520,776 | |
| | 110,000 | | | 3.053%, 11/15/24 (n) | | | 93,312 | |
| | 615,000 | | | 3.104%, 11/15/21 (n) | | | 566,799 | |
| | 50,000 | | | 3.108%, 11/15/34 (n) | | | 31,193 | |
| | 65,000 | | | 3.120%, 02/15/35 (n) | | | 40,134 | |
| | 250,000 | | | 3.132%, 08/15/27 (n) | | | 195,172 | |
| | 2,250,000 | | | 3.313%, 05/15/32 (n) | | | 1,518,287 | |
| | 250,000 | | | 3.321%, 05/15/35 (n) | | | 153,524 | |
| | 23,000 | | | 3.323%, 08/15/26 (n) | | | 18,502 | |
| | 250,000 | | | 3.361%, 11/15/26 (n) | | | 199,606 | |
| | 280,000 | | | 3.419%, 08/15/19 (n) | | | 271,607 | |
| | 50,000 | | | 3.523%, 02/15/25 (n) | | | 42,082 | |
| | 350,000 | | | 3.555%, 02/15/32 (n) | | | 237,809 | |
| | 700,000 | | | 3.556%, 02/15/27 (n) | | | 554,450 | |
| | 400,000 | | | 3.569%, 02/15/33 (n) | | | 263,388 | |
SEE NOTES TO FINANCIAL STATEMENTS.
| | | | | | | | |
| | | |
| JUNE 30, 2017 | | JPMORGAN INSURANCE TRUST | | | | | 33 | |
JPMorgan Insurance Trust Core Bond Portfolio
SCHEDULE OF PORTFOLIO INVESTMENTS
AS OF JUNE 30, 2017 (Unaudited) (continued)
| | | | | | | | |
PRINCIPAL
AMOUNT($) | | | SECURITY DESCRIPTION | | VALUE($) | |
| | U.S. Treasury Obligations — continued | |
| | 1,175,000 | | | 3.588%, 05/15/33 (n) | | | 768,415 | |
| | 200,000 | | | 3.609%, 11/15/29 (n) | | | 145,879 | |
| | 275,000 | | | 3.618%, 05/15/31 (n) | | | 191,102 | |
| | 775,000 | | | 3.651%, 02/15/34 (n) | | | 494,631 | |
| | 300,000 | | | 3.671%, 11/15/30 (n) | | | 212,023 | |
| | 710,000 | | | 3.686%, 11/15/27 (n) | | | 550,481 | |
| | 300,000 | | | 3.722%, 08/15/30 (n) | | | 213,592 | |
| | 300,000 | | | 3.743%, 08/15/29 (n) | | | 220,544 | |
| | 658,000 | | | 3.859%, 02/15/29 (n) | | | 491,057 | |
| | 800,000 | | | 3.888%, 11/15/32 (n) | | | 531,286 | |
| | 1,025,000 | | | 3.987%, 11/15/33 (n) | | | 659,857 | |
| | 550,000 | | | 4.062%, 02/15/31 (n) | | | 386,246 | |
| | 300,000 | | | 4.331%, 05/15/30 (n) | | | 215,686 | |
| | 100,000 | | | 4.614%, 05/15/26 (n) | | | 81,036 | |
| | 975,000 | | | 4.931%, 02/15/30 (n) | | | 704,656 | |
| | 100,000 | | | 5.797%, 08/15/33 (n) | | | 64,882 | |
| | 100,000 | | | 6.356%, 11/15/28 (n) | | | 75,203 | |
| | | | | | | | |
PRINCIPAL
AMOUNT($) | | | SECURITY DESCRIPTION | | VALUE($) | |
| | | | | | | | |
| | 125,000 | | | 6.401%, 05/15/27 (n) | | | 98,225 | |
| | 50,000 | | | 6.669%, 08/15/28 (n) | | | 37,917 | |
| | | | | | | | |
| | | | Total U.S. Treasury Obligations
(Cost $60,259,133) | | | 61,829,746 | |
| | | | | | | | |
| | |
| SHARES | | | | | | |
| | Short-Term Investment — 0.4% | |
| | | | Investment Company — 0.4% | |
| | 1,200,721 | | | JPMorgan Prime Money Market Fund, Institutional Class Shares,
1.150% (b) (l)
(Cost $1,201,081) | | | 1,201,081 | |
| | | | | | | | |
| | | | Total Investments — 101.4%
(Cost $265,360,629) | | | 271,537,157 | |
| | | | Liabilities in Excess of
Other Assets — (1.4)% | | | (4,074,573 | ) |
| | | | | | | | |
| | | | NET ASSETS — 100.0% | | $ | 267,462,584 | |
| | | | | | | | |
Percentages indicated are based on net assets.
SEE NOTES TO FINANCIAL STATEMENTS.
| | | | | | |
| | | |
| 34 | | | | JPMORGAN INSURANCE TRUST | | JUNE 30, 2017 |
| | |
| ACES | | — Alternative Credit Enhancement Securities |
| ARM | | — Adjustable Rate Mortgage. The interest rate shown is the rate in effect as of June 30, 2017. |
| CSMC | | — Credit Suisse Mortgage Trust |
| ESOP | | — Employee Stock Ownership Program |
| FHA | | — Federal Housing Administration |
| FHLMC | | — Federal Home Loan Mortgage Corp. |
| FNMA | | — Federal National Mortgage Association |
| GNMA | | — Government National Mortgage Association |
| HB | | — High Coupon Bonds (a.k.a. “IOettes”) represent the right to receive interest payments on an underlying pool of mortgages with similar features as those associated with IO securities. Unlike IO’s the owner also has a right to receive a very small portion of principal. The high interest rates result from taking interest payments from other classes in the Real Estate Mortgage Investment Conduit trust and allocating them to the small principal of the HB class. |
| IF | | — Inverse Floaters represent securities that pay interest at a rate that increases (decreases) with a decline (incline) in a specified index. The interest rate shown is the rate in effect as of June 30, 2017. The rate may be subject to a cap and floor. |
| IO | | — Interest Only represents the right to receive the monthly interest payments on an underlying pool of mortgage loans. The principal amount shown represents the par value on the underlying pool. The yields on these securities are subject to accelerated principal paydowns as a result of prepayment or refinancing of the underlying pool of mortgage instruments. As a result, interest income may be reduced considerably. |
| PO | | — Principal Only represents the right to receive the principal portion only on an underlying pool of mortgage loans. The market value of these securities is extremely volatile in response to changes in market interest rates. As prepayments on the underlying mortgages of these securities increase, the yield on these securities increases. |
| REMIC | | — Real Estate Mortgage Investment Conduit |
| Rev. | | — Revenue |
| STRIPS | | — Separate Trading of Registered Interest and Principal of Securities. The STRIPS Program lets investors hold and trade individual interest and principal components of eligible notes and bonds as separate securities. |
| | |
| SUB | | — Step-Up Bond. The interest rate shown is the rate in effect as of June 30, 2017. |
| VA | | — Veterans Administration |
| VAR | | — Variable Rate Security. The interest rate shown is the rate in effect as of June 30, 2017. |
| (b) | | — Investment in affiliate. Money market fund is registered under the Investment Company Act of 1940, as amended, and advised by J.P. Morgan Investment Management Inc. |
| (d) | | — Defaulted Security. Security has not paid its last interest payment and/or interest is not being accrued. |
| (e) | | — Security is exempt from registration under Rule 144A of the Securities Act of 1933, as amended. Unless otherwise indicated, this security has been determined to be liquid under procedures established by the Board of Trustees and may be resold in transactions exempt from registration, normally to qualified institutional buyers. |
| (g) | | — Amount rounds to less than 0.05%. |
| (l) | | — The rate shown is the current yield as of June 30, 2017. |
| (n) | | — The rate shown is the effective yield as of June 30, 2017. |
| (t) | | — The date shown represents the earliest of the prerefunded date, next put date or final maturity date. |
| (w) | | — All or a portion of the security is a when-issued security, delayed delivery security, or forward commitment. |
| (x) | | — Security is perpetual and thus, does not have a predetermined maturity date. The coupon rate for this security is fixed for a period of time and may be structured to adjust thereafter. The date shown, if applicable, reflects the next call date. The coupon rate shown is the rate in effect as of June 30, 2017. |
| (y) | | — Preferred Security. |
| 1 | | — Security matures in 2115. |
| 2 | | — Security matures in 2111. |
| 3 | | — Security matures in 2114. |
SEE NOTES TO FINANCIAL STATEMENTS.
| | | | | | | | |
| | | |
| JUNE 30, 2017 | | JPMORGAN INSURANCE TRUST | | | | | 35 | |
STATEMENT OF ASSETS AND LIABILITIES
AS OF JUNE 30, 2017 (Unaudited)
| | | | |
| | |
Core Bond
Portfolio | |
ASSETS: | |
Investments in non-affiliates, at value | | $ | 270,336,076 | |
Investments in affiliates, at value | | | 1,201,081 | |
| | | | |
Total investment securities, at value | | | 271,537,157 | |
Receivables: | | | | |
Investment securities sold | | | 231,434 | |
Portfolio shares sold | | | 437,646 | |
Interest from non-affiliates | | | 1,207,905 | |
Dividends from affiliates | | | 4,419 | |
| | | | |
Total Assets | | | 273,418,561 | |
| | | | |
|
LIABILITIES: | |
Payables: | | | | |
Due to custodian | | | 6 | |
Investment securities purchased | | | 155,952 | |
Investment securities purchased — delayed delivery securities | | | 5,506,966 | |
Portfolio shares redeemed | | | 88,884 | |
Accrued liabilities: | | | | |
Investment advisory fees | | | 83,680 | |
Administration fees | | | 15,497 | |
Distribution fees | | | 19,185 | |
Custodian and accounting fees | | | 16,093 | |
Trustees’ and Chief Compliance Officer’s fees | | | 177 | |
Other | | | 69,537 | |
| | | | |
Total Liabilities | | | 5,955,977 | |
| | | | |
Net Assets | | $ | 267,462,584 | |
| | | | |
|
NET ASSETS: | |
Paid-in-Capital | | $ | 258,973,740 | |
Accumulated undistributed net investment income | | | 3,022,596 | |
Accumulated net realized gains (losses) | | | (710,280 | ) |
Net unrealized appreciation (depreciation) | | | 6,176,528 | |
| | | | |
Total Net Assets | | $ | 267,462,584 | |
| | | | |
|
Net Assets: | |
Class 1 | | $ | 172,314,917 | |
Class 2 | | | 95,147,667 | |
| | | | |
Total | | $ | 267,462,584 | |
| | | | |
|
Outstanding units of beneficial interest (shares) | |
(unlimited number of shares authorized, no par value): | | | | |
Class 1 | | | 15,935,065 | |
Class 2 | | | 8,884,361 | |
| |
Net Asset Value, offering and redemption price per share (a): | | | | |
Class 1 | | $ | 10.81 | |
Class 2 | | | 10.71 | |
| | | | |
| |
Cost of investments in non-affiliates | | $ | 264,159,548 | |
Cost of investments in affiliates | | | 1,201,081 | |
| (a) | Per share amounts may not recalculate due to rounding of net assets and/or shares outstanding. |
SEE NOTES TO FINANCIAL STATEMENTS.
| | | | | | |
| | | |
| 36 | | | | JPMORGAN INSURANCE TRUST | | JUNE 30, 2017 |
STATEMENT OF OPERATIONS
FOR THE SIX MONTHS ENDED JUNE 30, 2017 (Unaudited)
| | | | |
| | |
Core Bond
Portfolio | |
INVESTMENT INCOME: | |
Interest income from non-affiliates | | $ | 4,205,544 | |
Dividend income from affiliates | | | 22,384 | |
| | | | |
Total investment income | | | 4,227,928 | |
| | | | |
|
EXPENSES: | |
Investment advisory fees | | | 514,489 | |
Administration fees | | | 105,073 | |
Distribution fees — Class 2 | | | 102,823 | |
Custodian and accounting fees | | | 86,438 | |
Professional fees | | | 49,633 | |
Trustees’ and Chief Compliance Officer’s fees | | | 13,594 | |
Printing and mailing costs | | | 25,855 | |
Transfer agency fees — Class 1 | | | 1,473 | |
Transfer agency fees — Class 2 | | | 357 | |
Other | | | 13,375 | |
| | | | |
Total expenses | | | 913,110 | |
| | | | |
Less fees waived | | | (41,717 | ) |
Less expense reimbursements | | | (715 | ) |
| | | | |
Net expenses | | | 870,678 | |
| | | | |
Net investment income (loss) | | | 3,357,250 | |
| | | | |
| |
REALIZED/UNREALIZED GAINS (LOSSES): | | | | |
Net realized gain (loss) on transactions from: | | | | |
Investments in non-affiliates | | | 80,305 | |
Investments in affiliates | | | (135 | ) |
| | | | |
Net realized gain (loss) | | | 80,170 | |
| | | | |
Change in net unrealized appreciation/depreciation on investments in non-affiliates | | | 2,590,125 | |
| | | | |
Net realized/unrealized gains (losses) | | | 2,670,295 | |
| | | | |
Change in net assets resulting from operations | | $ | 6,027,545 | |
| | | | |
SEE NOTES TO FINANCIAL STATEMENTS.
| | | | | | | | |
| | | |
| JUNE 30, 2017 | | JPMORGAN INSURANCE TRUST | | | | | 37 | |
STATEMENT OF CHANGES IN NET ASSETS
FOR THE PERIODS INDICATED
| | | | | | | | |
| | | Core Bond Portfolio | |
| | | Six Months Ended
June 30, 2017
(Unaudited) | | | Year Ended
December 31, 2016 | |
CHANGE IN NET ASSETS RESULTING FROM OPERATIONS: | | | | | | | | |
Net investment income (loss) | | $ | 3,357,250 | | | $ | 6,677,471 | |
Net realized gain (loss) | | | 80,170 | | | | 1,652,618 | |
Change in net unrealized appreciation/depreciation | | | 2,590,125 | | | | (3,742,947 | ) |
| | | | | | | | |
Change in net assets resulting from operations | | | 6,027,545 | | | | 4,587,142 | |
| | | | | | | | |
| | |
DISTRIBUTIONS TO SHAREHOLDERS: | | | | | | | | |
Class 1 | | | | | | | | |
From net investment income | | | (4,505,586 | ) | | | (4,769,944 | ) |
Class 2 | | | | | | | | |
From net investment income | | | (2,166,547 | ) | | | (1,806,180 | ) |
| | | | | | | | |
Total distributions to shareholders | | | (6,672,133 | ) | | | (6,576,124 | ) |
| | | | | | | | |
| | |
CAPITAL TRANSACTIONS: | | | | | | | | |
Change in net assets resulting from capital transactions | | | 17,601,359 | | | | 14,954,188 | |
| | | | | | | | |
| | |
NET ASSETS: | | | | | | | | |
Change in net assets | | | 16,956,771 | | | | 12,965,206 | |
Beginning of period | | | 250,505,813 | | | | 237,540,607 | |
| | | | | | | | |
End of period | | $ | 267,462,584 | | | $ | 250,505,813 | |
| | | | | | | | |
Accumulated undistributed net investment income | | $ | 3,022,596 | | | $ | 6,337,479 | |
| | | | | | | | |
| | |
CAPITAL TRANSACTIONS: | | | | | | | | |
Class 1 | | | | | | | | |
Proceeds from shares issued | | $ | 11,339,078 | | | $ | 29,557,461 | |
Distributions reinvested | | | 4,505,586 | | | | 4,769,944 | |
Cost of shares redeemed | | | (19,772,879 | ) | | | (35,252,533 | ) |
| | | | | | | | |
Change in net assets resulting from Class 1 capital transactions | | $ | (3,928,215 | ) | | $ | (925,128 | ) |
| | | | | | | | |
Class 2 | | | | | | | | |
Proceeds from shares issued | | $ | 31,319,178 | | | $ | 35,923,015 | |
Distributions reinvested | | | 2,166,547 | | | | 1,806,180 | |
Cost of shares redeemed | | | (11,956,151 | ) | | | (21,849,879 | ) |
| | | | | | | | |
Change in net assets resulting from Class 2 capital transactions | | $ | 21,529,574 | | | $ | 15,879,316 | |
| | | | | | | | |
Total change in net assets resulting from capital transactions | | $ | 17,601,359 | | | $ | 14,954,188 | |
| | | | | | | | |
| | |
SHARE TRANSACTIONS: | | | | | | | | |
Class 1 | | | | | | | | |
Issued | | | 1,037,891 | | | | 2,668,220 | |
Reinvested | | | 417,571 | | | | 436,808 | |
Redeemed | | | (1,809,351 | ) | | | (3,180,281 | ) |
| | | | | | | | |
Change in Class 1 Shares | | | (353,889 | ) | | | (75,253 | ) |
| | | | | | | | |
Class 2 | | | | | | | | |
Issued | | | 2,900,020 | | | | 3,264,283 | |
Reinvested | | | 202,670 | | | | 166,776 | |
Redeemed | | | (1,109,496 | ) | | | (1,997,931 | ) |
| | | | | | | | |
Change in Class 2 Shares | | | 1,993,194 | | | | 1,433,128 | |
| | | | | | | | |
SEE NOTES TO FINANCIAL STATEMENTS.
| | | | | | |
| | | |
| 38 | | | | JPMORGAN INSURANCE TRUST | | JUNE 30, 2017 |
THIS PAGE IS INTENTIONALLY LEFT BLANK
| | | | | | | | |
| | | |
| JUNE 30, 2017 | | JPMORGAN INSURANCE TRUST | | | | | 39 | |
FINANCIAL HIGHLIGHTS
FOR THE PERIODS INDICATED
| | | | | | | | | | | | | | | | | | | | |
| | | Per share operating performance | |
| | | | | | Investment operations | | | Distributions | |
| | | Net asset
value,
beginning
of period | | | Net
investment
income
(loss) (b) | | | Net realized
and unrealized
gains
(losses) on
investments | | | Total from
investment
operations | | | Net
investment
income | |
Core Bond Portfolio | | | | | | | | | | | | | | | | | | | | |
Class 1 | | | | | | | | | | | | | | | | | | | | |
Six Months Ended June 30, 2017 (Unaudited) | | $ | 10.84 | | | $ | 0.15 | | | $ | 0.10 | | | $ | 0.25 | | | $ | (0.28 | ) |
Year Ended December 31, 2016 | | | 10.91 | | | | 0.30 | | | | (0.07 | ) | | | 0.23 | | | | (0.30 | ) |
Year Ended December 31, 2015 | | | 11.19 | | | | 0.34 | | | | (0.21 | ) | | | 0.13 | | | | (0.41 | ) |
Year Ended December 31, 2014 | | | 11.09 | | | | 0.38 | | | | 0.16 | | | | 0.54 | | | | (0.44 | ) |
Year Ended December 31, 2013 | | | 11.78 | | | | 0.44 | | | | (0.60 | ) | | | (0.16 | ) | | | (0.53 | ) |
Year Ended December 31, 2012 | | | 11.71 | | | | 0.51 | | | | 0.10 | | | | 0.61 | | | | (0.54 | ) |
| | | | | |
Class 2 | | | | | | | | | | | | | | | | | | | | |
Six Months Ended June 30, 2017 (Unaudited) | | | 10.73 | | | | 0.13 | | | | 0.11 | | | | 0.24 | | | | (0.26 | ) |
Year Ended December 31, 2016 | | | 10.81 | | | | 0.27 | | | | (0.07 | ) | | | 0.20 | | | | (0.28 | ) |
Year Ended December 31, 2015 | | | 11.10 | | | | 0.31 | | | | (0.21 | ) | | | 0.10 | | | | (0.39 | ) |
Year Ended December 31, 2014 | | | 11.01 | | | | 0.35 | | | | 0.16 | | | | 0.51 | | | | (0.42 | ) |
Year Ended December 31, 2013 | | | 11.72 | | | | 0.40 | | | | (0.59 | ) | | | (0.19 | ) | | | (0.52 | ) |
Year Ended December 31, 2012 | | | 11.68 | | | | 0.47 | | | | 0.11 | | | | 0.58 | | | | (0.54 | ) |
| (a) | Annualized for periods less than one year, unless otherwise noted. |
| (b) | Calculated based upon average shares outstanding. |
| (c) | Not annualized for periods less than one year. |
| (d) | Includes adjustments in accordance with accounting principles generally accepted in the United States of America and as such, the net asset values for financial reporting purposes and the returns based upon those net asset values may differ from the net asset values and returns for shareholder transactions. |
| (e) | Includes earnings credits and interest expense, if applicable, each of which is less than 0.005% unless otherwise noted. |
SEE NOTES TO FINANCIAL STATEMENTS.
| | | | | | |
| | | |
| 40 | | | | JPMORGAN INSURANCE TRUST | | JUNE 30, 2017 |
| | | | | | | | | | | | | | | | | | | | | | | | | | |
| | | Ratios/Supplemental data | |
| | | | | | | | | | Ratios to average net assets (a) | | | | |
Net asset
value,
end of
period | | | Total return (c)(d) | | | Net assets,
end of
period | | | Net
expenses (e) | | | Net
investment
income
(loss) | | | Expenses
without waivers,
reimbursements and
earnings credits | | | Portfolio
turnover
rate (c) | |
| | | | | | | | | | | | | | | | | | | | | | | | | | |
| | | | | | | | | | | | | | | | | | | | | | | | | | |
| $ | 10.81 | | | | 2.34 | % | | $ | 172,314,917 | | | | 0.60 | % | | | 2.69 | % | | | 0.63 | % | | | 10 | % |
| | 10.84 | | | | 2.12 | | | | 176,565,657 | | | | 0.59 | | | | 2.73 | | | | 0.64 | | | | 29 | |
| | 10.91 | | | | 1.12 | | | | 178,547,019 | | | | 0.59 | | | | 3.08 | | | | 0.61 | | | | 20 | |
| | 11.19 | | | | 4.92 | | | | 152,618,612 | | | | 0.59 | | | | 3.40 | | | | 0.64 | | | | 18 | |
| | 11.09 | | | | (1.47 | ) | | | 176,728,891 | | | | 0.59 | | | | 3.86 | | | | 0.60 | | | | 13 | |
| | 11.78 | | | | 5.33 | | | | 208,061,368 | | | | 0.60 | | | | 4.36 | | | | 0.62 | | | | 8 | |
| | | | | | |
| | | | | | | | | | | | | | | | | | | | | | | | | | |
| | 10.71 | | | | 2.25 | | | | 95,147,667 | | | | 0.85 | | | | 2.44 | | | | 0.88 | | | | 10 | |
| | 10.73 | | | | 1.84 | | | | 73,940,156 | | | | 0.84 | | | | 2.47 | | | | 0.89 | | | | 29 | |
| | 10.81 | | | | 0.86 | | | | 58,993,588 | | | | 0.84 | | | | 2.83 | | | | 0.86 | | | | 20 | |
| | 11.10 | | | | 4.71 | | | | 46,498,141 | | | | 0.84 | | | | 3.14 | | | | 0.88 | | | | 18 | |
| | 11.01 | | | | (1.74 | ) | | | 25,187,518 | | | | 0.84 | | | | 3.58 | | | | 0.85 | | | | 13 | |
| | 11.72 | | | | 5.07 | | | | 9,330,945 | | | | 0.85 | | | | 4.00 | | | | 0.87 | | | | 8 | |
SEE NOTES TO FINANCIAL STATEMENTS.
| | | | | | | | |
| | | |
| JUNE 30, 2017 | | JPMORGAN INSURANCE TRUST | | | | | 41 | |
NOTES TO FINANCIAL STATEMENTS
AS OF JUNE 30, 2017 (Unaudited)
1. Organization
JPMorgan Insurance Trust (the “Trust”) is registered under the Investment Company Act of 1940, as amended (the “1940 Act”), as an open-end management investment company and is a Massachusetts business trust.
The following is a separate Portfolio of the Trust (the “Portfolio”) covered by this report:
| | | | |
| | | Classes Offered | | Diversified/Non-Diversified |
| Core Bond Portfolio | | Class 1 and Class 2 | | Diversified |
The investment objective of the Portfolio is to seek to maximize total return by investing primarily in a diversified portfolio of intermediate- and long-term debt securities.
Portfolio shares are offered only to separate accounts of participating insurance companies and Eligible Plans. Individuals may not purchase shares directly from the Portfolio.
All classes of shares have equal rights as to earnings, assets and voting privileges, except that each class may bear different transfer agency fees and distribution fees and each class has exclusive voting rights with respect to its distribution plan and administrative services plan.
J.P. Morgan Investment Management Inc. (“JPMIM”), an indirect, wholly-owned subsidiary of JPMorgan Chase & Co. (“JPMorgan”), acts as Adviser (the “Adviser”) and Administrator (the “Administrator”) to the Portfolio.
2. Significant Accounting Policies
The following is a summary of significant accounting policies followed by the Portfolio in the preparation of its financial statements. The Portfolio is an investment company and, accordingly, follows the investment company accounting and reporting guidance of the Financial Accounting Standards Board Accounting Standards Codification Topic 946 — Investment Companies, which is part of U.S. generally accepted accounting principles (“GAAP”). The preparation of financial statements in conformity with GAAP requires management to make estimates and assumptions that affect the reported amounts of assets and liabilities and disclosure of contingent assets and liabilities at the date of the financial statements and the reported amounts of increases and decreases in net assets from operations during the reporting period. Actual results could differ from those estimates.
A. Valuation of Investments — The valuation of investments is in accordance with GAAP and the Portfolio’s valuation policies set forth by and under the supervision and responsibility of the Board of Trustees (the “Board”), which established the following approach to valuation, as described more fully below: (i) investments for which market quotations are readily available shall be valued at such unadjusted quoted prices and (ii) all other investments for which market quotations are not readily available shall be valued at their fair value as determined in good faith by the Board.
The Administrator has established the J.P. Morgan Investment Management Americas Valuation Committee (“AVC”) to assist the Board with the oversight and monitoring of the valuation of the Portfolio’s investments. The Administrator implements the valuation policies of the Portfolio’s investments, as directed by the Board. The AVC oversees and carries out the policies for the valuation of investments held in the Portfolio. This includes monitoring the appropriateness of fair values based on results of ongoing valuation oversight, including but not limited to consideration of macro or security specific events, market events and pricing vendor and broker due diligence. The Administrator is responsible for discussing and assessing the potential impacts to the fair values on an ongoing basis, and at least on a quarterly basis with the AVC and the Board.
A market-based approach is primarily used to value the Portfolio’s investments. Investments for which market quotations are not readily available are fair valued by approved affiliated and unaffiliated pricing vendors or third party broker-dealers (collectively referred to as “Pricing Services”) or may be internally fair valued using methods set forth by the valuation policies approved by the Board. This may include related or comparable assets or liabilities, recent transactions, market multiples, book values, and other relevant information for the investment to determine the fair value of the investment. An income-based valuation approach may be used in which the anticipated future cash flows of the investment are discounted to calculate the fair value. Discounts may also be applied due to the nature or duration of any restrictions on the disposition of the investments. Valuations may be based upon current market prices of securities that are comparable in coupon, rating, maturity and industry. It is possible that the estimated values may differ significantly from the values that would have been used, had a ready market for the investments existed, and such differences could be material.
Fixed income instruments are valued based on prices received from Pricing Services. The Pricing Services use multiple valuation techniques to determine the valuation of fixed income instruments. In instances where sufficient market activity exists, the Pricing Services may utilize a market-based approach through which trades or quotes from market makers are used to determine the valuation of these instruments. In instances where sufficient market activity may not exist, the Pricing Services also utilize proprietary valuation models which may consider market transactions in comparable securities and the various relationships between securities in determining fair value and/or market characteristics in order to estimate the relevant cash flows, which are then discounted to calculate the fair values.
Investments in open-end investment companies (the “Underlying Funds”) are valued at each Underlying Fund’s net asset values (“NAV”) per share as of the report date.
See the table on “Quantitative Information about Level 3 Fair Value Measurements” for information on the valuation techniques and inputs used to value level 3 securities held by the Portfolio at June 30, 2017.
| | | | | | |
| | | |
| 42 | | | | JPMORGAN INSURANCE TRUST | | JUNE 30, 2017 |
Valuations reflected in this report are as of the report date. As a result, changes in valuation due to market events and/or issuer related events after the report date and prior to issuance of the report are not reflected herein.
The various inputs that are used in determining the valuation of the Portfolio’s investments are summarized into the three broad levels listed below.
| • | | Level 1 — Unadjusted inputs using quoted prices in active markets for identical investments. |
| • | | Level 2 — Other significant observable inputs including, but not limited to, quoted prices for similar investments, inputs other than quoted prices that are observable for investments (such as interest rates, prepayment speeds, credit risk, etc.) or other market corroborated inputs. |
| • | | Level 3 — Significant inputs based on the best information available in the circumstances, to the extent observable inputs are not available (including the Portfolio’s assumptions in determining the fair value of investments). |
A financial instrument’s level within the fair value hierarchy is based on the lowest level of any input, both individually and in the aggregate, that is significant to the fair value measurement. The inputs or methodology used for valuing instruments are not necessarily an indication of the risk associated with investing in those instruments.
The following table represents each valuation input as presented on the Schedule of Portfolio Investments:
| | | | | | | | | | | | | | | | |
| | | Level 1
Quoted prices | | | Level 2
Other significant
observable inputs | | | Level 3
Significant
unobservable inputs | | | Total | |
Investments in Securities | | | | | | | | | | | | | | | | |
Debt Securities | | | | | | | | | | | | | | | | |
Asset-Backed Securities | | $ | — | | | $ | 21,238,431 | | | $ | 9,464,696 | | | $ | 30,703,127 | |
Collateralized Mortgage Obligations | | | — | | | | 34,814,088 | | | | 2,322,389 | | | | 37,136,477 | |
Commercial Mortgage-Backed Securities | | | — | | | | 6,231,576 | | | | 250,437 | | | | 6,482,013 | |
Corporate Bonds | | | | | | | | | | | | | | | | |
Consumer Discretionary | | | — | | | | 4,646,075 | | | | — | | | | 4,646,075 | |
Consumer Staples | | | — | | | | 2,984,992 | | | | — | | | | 2,984,992 | |
Energy | | | — | | | | 7,703,524 | | | | — | | | | 7,703,524 | |
Financials | | | — | | | | 26,421,532 | | | | — | (a) | | | 26,421,532 | |
Health Care | | | — | | | | 3,602,477 | | | | — | | | | 3,602,477 | |
Industrials | | | — | | | | 4,459,223 | | | | — | | | | 4,459,223 | |
Information Technology | | | — | | | | 4,920,562 | | | | — | | | | 4,920,562 | |
Materials | | | — | | | | 1,941,987 | | | | — | | | | 1,941,987 | |
Real Estate | | | — | | | | 3,069,071 | | | | — | | | | 3,069,071 | |
Telecommunication Services | | | — | | | | 3,627,653 | | | | — | | | | 3,627,653 | |
Utilities | | | — | | | | 6,131,300 | | | | — | | | | 6,131,300 | |
| | | | | | | | | | | | | | | | |
Total Corporate Bonds | | | — | | | | 69,508,396 | | | | — | | | | 69,508,396 | |
| | | | | | | | | | | | | | | | |
Foreign Government Securities | | | — | | | | 982,253 | | | | — | | | | 982,253 | |
Mortgage-Backed Securities | | | — | | | | 38,450,680 | | | | — | | | | 38,450,680 | |
Municipal Bonds | | | — | | | | 303,007 | | | | — | | | | 303,007 | |
U.S. Government Agency Securities | | | — | | | | 24,940,377 | | | | — | | | | 24,940,377 | |
U.S. Treasury Obligations | | | — | | | | 61,829,746 | | | | — | | | | 61,829,746 | |
Short-Term Investment | | | | | | | | | | | | | | | | |
Investment Company | | | 1,201,081 | | | | — | | | | — | | | | 1,201,081 | |
| | | | | | | | | | | | | | | | |
Total Investments in Securities | | $ | 1,201,081 | | | $ | 258,298,554 | | | $ | 12,037,522 | | | $ | 271,537,157 | |
| | | | | | | | | | | | | | | | |
Transfers between fair value levels are valued utilizing values as of the beginning of the period.
There were no significant transfers between any levels during the six months ended June 30, 2017.
| | | | | | | | |
| | | |
| JUNE 30, 2017 | | JPMORGAN INSURANCE TRUST | | | | | 43 | |
NOTES TO FINANCIAL STATEMENTS
AS OF JUNE 30, 2017 (Unaudited) (continued)
The following is a summary of investments for which significant unobservable inputs (level 3) were in used in determining fair value:
| | | | | | | | | | | | | | | | | | | | | | | | | | | | | | | | | | | | |
| | | Balance as of
December 31,
2016 | | | Realized
gain (loss) | | | Change in net
unrealized
appreciation
(depreciation) | | | Net
accretion
(amortization) | | | Purchases1 | | | Sales2 | | | Transfers
into Level 3 | | | Transfers
out
of Level 3 | | | Balance as of
June 30,
2017 | |
Investments in Securities | | | | | | | | | | | | | | | | | | | | | | | | | | | | | |
Asset-Backed Securities | | $ | 7,256,581 | | | $ | 9 | | | $ | 92,929 | | | $ | (355 | ) | | $ | 2,342,133 | | | $ | (1,695,078 | ) | | $ | 1,712,938 | | | $ | (244,461 | ) | | $ | 9,464,696 | |
Collateralized Mortgage Obligations | | | 907,593 | | | | — | | | | 47,336 | | | | (10,444 | ) | | | 837,347 | | | | (51,171 | ) | | | 591,728 | | | | — | | | | 2,322,389 | |
Commercial Mortgage-Backed Securities | | | 343,425 | | | | — | | | | (963 | ) | | | (63 | ) | | | — | | | | — | | | | — | | | | (91,962 | ) | | | 250,437 | |
Corporate Bond — Financials | | | — | (a) | | | — | | | | — | | | | — | | | | — | | | | — | | | | — | | | | — | | | | — | (a) |
| | | | | | | | | | | | | | | | | | | | | | | | | | | | | | | | | | | | |
| | $ | 8,507,599 | | | $ | 9 | | | $ | 139,302 | | | $ | (10,862 | ) | | $ | 3,179,480 | | | $ | (1,746,249 | ) | | $ | 2,304,666 | | | $ | (336,423 | ) | | $ | 12,037,522 | |
| | | | | | | | | | | | | | | | | | | | | | | | | | | | | | | | | | | | |
| 1 | Purchases include all purchases of securities and securities received in corporate actions. |
| 2 | Sales include all sales of securities, maturities, paydowns and securities tendered in corporate actions. |
The changes in net unrealized appreciation (depreciation) attributable to securities owned at June 30, 2017, which were valued using significant unobservable inputs (level 3) amounted to approximately $140,319. This amount is included in Change in net unrealized appreciation/depreciation of investments in non-affiliates on the Statement of Operations.
Quantitative Information about Level 3 Fair Value Measurements #
| | | | | | | | | | | | |
| | | Fair Value at
June 30, 2017 | | | Valuation Technique(s) | | Unobservable Input | | Range (Weighted Average) | |
| | $ | 7,544,682 | | | Discounted Cash Flow | | Constant Prepayment Rate | | | 0.00% - 100.00% (6.82%) | |
| | | | | | | | Constant Default Rate | | | 0.00% - 30.00% (0.96%) | |
| | | | | | | | Yield (Discount Rate of Cash Flows) | | | 2.00% - 5.60% (3.27%) | |
| | | | | | | | | | | | |
| Asset-Backed Securities | | | 7,544,682 | | | | | | | | | |
| | | | | | | | | | | | |
| | | 2,300,743 | | | Discounted Cash Flow | | Constant Prepayment Rate | | | 0.00% - 29.30% (3.59%) | |
| | | | | | | | Constant Default Rate | | | 0.00% - 9.64% (1.64%) | |
| | | | | | | | Yield (Discount Rate of Cash Flows) | | | 0.38% - 199.00% (4.63%) | |
| | | | | | | | | | | | |
| Collateralized Mortgage Obligations | | | 2,300,743 | | | | | | | | | |
| | | | | | | | | | | | |
| | | 29 | | | Discounted Cash Flow | | Constant Prepayment Rate | | | 100.00% (100.00%) | |
| | | | | | | | Yield (Discount Rate of Cash Flows) | | | 1.47 % - 2.33% (2.17%) | |
| | | | | | | | | | | | |
| Commercial Mortgage-Backed Securities | | | 29 | | | | | | | | | |
| | | | | | | | | | | | |
| Total | | $ | 9,845,454 | | | | | | | | | |
| | | | | | | | | | | | |
| # | The table above does not include certain level 3 investments that are valued by brokers and pricing services. At June 30, 2017, the value of these investments was $2,192,068. The inputs for these investments are not readily available or cannot be reasonably estimated and are generally those inputs described in Note 2.A. |
The significant unobservable inputs used in the fair value measurement of the Portfolio’s investments are listed above. Generally, a change in the assumptions used in any input in isolation may be accompanied by a change in another input. Significant changes in any of the unobservable inputs may significantly impact the fair value measurement. The impact is based on the relationship between each unobservable input and the fair value measurement. Significant increases (decreases) in the yield and default rate may decrease (increase) the fair value measurement. A significant change in the prepayment rate (Constant Prepayment Rate or PSA Prepayment Model) may decrease or increase the fair value measurement.
B. Restricted Securities — Certain securities held by the Portfolio may be subject to legal or contractual restrictions on resale. Restricted securities generally are resold in transactions exempt from registration under the Securities Act of 1933 (the “Securities Act”). Disposal of these securities may involve time-consuming negotiations and expense. Prompt sale at the current valuation may be difficult and could adversely affect the net asset value of the Portfolio.
As of June 30, 2017, the Portfolio had no investments in restricted securities other than securities sold to the Portfolio under Rule 144A or Regulation S under the Securities Act.
| | | | | | |
| | | |
| 44 | | | | JPMORGAN INSURANCE TRUST | | JUNE 30, 2017 |
C. When Issued, Delayed Delivery Securities and Forward Commitments — The Portfolio purchased when issued securities and entered into contracts to purchase or sell securities for a fixed price that may be settled a month or more after the trade date, or purchased delayed delivery securities which generally settle seven days after the trade date. When issued securities are securities that have been authorized, but not issued in the market. A forward commitment involves entering into a contract to purchase or sell securities for a fixed price at a future date that may be settled a month or more after the trade date. A delayed delivery security is agreed upon in advance between the buyer and the seller of the security and is generally delivered beyond seven days of the agreed upon date. The purchase of securities on a when issued, delayed delivery, or forward commitment basis involves the risk that the value of the security to be purchased declines before the settlement date. The sale of securities on a forward commitment basis involves the risk that the value of the securities sold may increase before the settlement date. The Portfolio may be exposed to credit risk if the counterparty fails to perform under the terms of the transaction. Interest income for securities purchased on a when issued, delayed delivery, or forward commitment basis is not accrued until the settlement date.
The Portfolio had delayed delivery securities outstanding as of June 30, 2017, which are shown as a Payable for Investment securities purchased-delayed delivery securities on the Statement of Assets and Liabilities. The values of these securities held at June 30, 2017 are detailed on the SOI.
D. Security Transactions and Investment Income — Investment transactions are accounted for on the trade date (the date the order to buy or sell is executed). Securities gains and losses are calculated on a specifically identified cost basis. Interest income is determined on the basis of coupon interest accrued using the effective interest method which adjusts for amortization of premiums and accretion of discounts. Dividend income is recorded on the ex-dividend date or when the Portfolio first learns of the dividend.
E. Allocation of Income and Expenses — Expenses directly attributable to a portfolio are charged directly to that portfolio, while the expenses attributable to more than one portfolio of the Trust are allocated among the respective portfolios. In calculating the NAV of each class, investment income, realized and unrealized gains and losses and expenses, other than class specific expenses, are allocated daily to each class of shares based upon the proportion of net assets of each class at the beginning of each day.
F. Federal Income Taxes — The Portfolio is treated as a separate taxable entity for Federal income tax purposes. The Portfolio’s policy is to comply with the provisions of the Internal Revenue Code of 1986, as amended (the “Code”), applicable to regulated investment companies and to distribute to shareholders all of its distributable net investment income and net realized capital gains on investments. Accordingly, no provision for Federal income tax is necessary. The Portfolio is also a segregated portfolio of assets for insurance purposes and intends to comply with the diversification requirements of Subchapter L of the Code. Management has reviewed the Portfolio’s tax positions for all open tax years and has determined that as of June 30, 2017, no liability for income tax is required in the Portfolio’s financial statements for net unrecognized tax benefits. However, management’s conclusions may be subject to future review based on changes in, or the interpretation of, the accounting standards or tax laws and regulations. The Portfolio’s Federal tax returns for the prior three fiscal years remain subject to examination by the Internal Revenue Service.
G. Distributions to Shareholders — Distributions from net investment income are generally declared and paid at least annually and are declared separately for each class. No class has preferential dividend rights; differences in per share rates are due to differences in separate class expenses. Net realized capital gains, if any, are distributed at least annually. The amount of distributions from net investment income and net realized capital gains is determined in accordance with Federal income tax regulations, which may differ from GAAP. To the extent these “book/tax” differences are permanent in nature (i.e., that they result from other than timing of recognition — “temporary differences”), such amounts are reclassified within the capital accounts based on their Federal tax-basis treatment.
3. Fees and Other Transactions with Affiliates
A. Investment Advisory Fee — Pursuant to an Investment Advisory Agreement, the Adviser supervises the investments of the Portfolio and for such services is paid a fee. The fee is accrued daily and paid monthly based on the Portfolio’s average daily net assets at an annual rate of 0.40%.
The Adviser waived Investment Advisory fees and/or reimbursed expenses as outlined in Note 3.E.
B. Administration Fee — Pursuant to an Administration Agreement, the Administrator provides certain administration services to the Portfolio. In consideration of these services, the Administrator receives a fee accrued daily and paid monthly at an annual rate of 0.15% of the first $25 billion of the average daily net assets of all funds in the J.P. Morgan Funds Complex covered by the Administration Agreement (excluding certain funds of funds and money market funds) and 0.075% of the average daily net assets in excess of $25 billion of all such funds. For the six months ended June 30, 2017, the effective annualized rate was 0.08% of the Portfolio’s average daily net assets, notwithstanding any fee waivers and/or expense reimbursements.
JPMorgan Chase Bank, N.A (“JPMCB”), a wholly-owned subsidiary of JPMorgan serves as the Portfolio’s sub-administrator (the “Sub-administrator”). For its services as Sub-administrator, JPMCB receives a portion of the fees payable to the Administrator.
The Administrator waived Administration fees as outlined in Note 3.E.
C. Distribution Fees — Pursuant to a Distribution Agreement, JPMorgan Distribution Services, Inc. (“JPMDS”), a wholly-owned subsidiary of JPMorgan, serves as the Trust’s principal underwriter and promotes and arranges for the sale of the Portfolio’s shares.
The Board has adopted a Distribution Plan (the “Distribution Plan”) for Class 2 Shares of the Portfolio in accordance with Rule 12b-1 under the 1940 Act. The Class 1 Shares do not charge a distribution fee. The Distribution Plan provides that the Portfolio shall pay distribution fees, including payments to JPMDS, at an annual rate of 0.25% of the average daily net assets of Class 2 Shares.
| | | | | | | | |
| | | |
| JUNE 30, 2017 | | JPMORGAN INSURANCE TRUST | | | | | 45 | |
NOTES TO FINANCIAL STATEMENTS
AS OF JUNE 30, 2017 (Unaudited) (continued)
D. Custodian and Accounting Fees — JPMCB provides portfolio custody and accounting services to the Portfolio. For performing these services, the Portfolio pays JPMCB transaction and asset-based fees that vary according to the number of transactions and positions, plus out-of-pocket expenses. The amounts paid directly to JPMCB by the Portfolio for custody and accounting services are included in Custodian and accounting fees on the Statement of Operations. Payments to the custodian may be reduced by credits earned by the Portfolio, based on uninvested cash balances held by the custodian. Such earnings credits, if any, are presented separately on the Statement of Operations.
Interest expense paid to the custodian related to cash overdrafts, if any, is included in Interest expense to affiliates on the Statement of Operations.
E. Waivers and Reimbursements — The Adviser (for all share classes), Administrator (for all share classes) and/or JPMDS (for Class 2 Shares) have contractually agreed to waive fees and/or reimburse the Portfolio to the extent that total annual operating expenses of the Portfolio (excluding acquired fund fees and expenses other than certain money market fund fees as described below, dividend expenses related to short sales, interest, taxes, expenses related to litigation and potential litigation, extraordinary expenses and expenses related to the Board’s deferred compensation plan) exceed the percentages of the Portfolio’s respective average daily net assets as shown in the table below:
| | | | | | |
| | | Class 1 | | Class 2 | |
| | 0.60% | | | 0.85 | % |
The expense limitation agreement was in effect for the six months ended June 30, 2017 and is in place until at least April 30, 2018.
For the six months ended June 30, 2017, the Portfolio’s service providers waived/reimbursed fees for the Portfolio as follows. None of these parties expect the Portfolio to repay any such waived fees in future years.
| | | | | | | | | | | | | | | | |
| | | Contractual Waivers | | | | |
| | | Investment
Advisory Fees | | | Administration
Fees | | | Total | | | Contractual
Reimbursements | |
| | $ | 22,679 | | | $ | 15,156 | | | $ | 37,835 | | | $ | 715 | |
Additionally, the Portfolio may invest in one or more money market funds advised by the Adviser or its affiliates (affiliated money market funds). The Adviser, Administrator and/or JPMDS have contractually agreed to waive fees and/or reimburse expenses in an amount sufficient to offset the respective net fees each collects from the affiliated money market fund on the Portfolio’s investment in such affiliated money market fund.
The amount of waivers resulting from investments in these money market funds for the six months ended June 30, 2017 was $3,882.
F. Other — Certain officers of the Trust are affiliated with the Adviser, the Administrator and JPMDS. Such officers, with the exception of the Chief Compliance Officer, receive no compensation from the Portfolio for serving in their respective roles.
The Board appointed a Chief Compliance Officer to the Portfolio in accordance with Federal securities regulations. The Portfolio, along with other affiliated portfolios, makes reimbursement payments, on a pro-rata basis, to the Administrator for a portion of the fees associated with the Office of the Chief Compliance Officer. Such fees are included in Trustees’ and Chief Compliance Officer’s fees on the Statement of Operations.
The Trust adopted a Trustee Deferred Compensation Plan (the “Plan”) which allows the Independent Trustees to defer the receipt of all or a portion of compensation related to performance of their duties as Trustees. The deferred fees are invested in various J.P. Morgan Funds until distribution in accordance with the Plan.
During the six months ended June 30, 2017, the Portfolio purchased securities from an underwriting syndicate in which the principal underwriter or members of the syndicate were affiliated with the Adviser.
The Portfolio may use related party broker-dealers. For the six months ended June 30,2017, the Portfolio did not incur any brokerage commissions with broker-dealers affiliated with the Adviser.
The Securities and Exchange Commission (“SEC”) has granted an exemptive order permitting the Portfolio to engage in principal transactions with J.P. Morgan Securities, Inc., an affiliated broker, involving taxable money market instruments, subject to certain conditions.
4. Investment Transactions
During the six months ended June 30, 2017, purchases and sales of investments (excluding short-term investments) were as follows:
| | | | | | | | | | | | | | | | |
| | | Purchases
(excluding
U.S. Government) | | | Sales
(excluding
U.S. Government) | | | Purchases
of U.S.
Government | | | Sales
of U.S.
Government | |
| | $ | 39,336,830 | | | $ | 23,373,463 | | | $ | 7,328,682 | | | $ | 2,318,655 | |
5. Federal Income Tax Matters
For Federal income tax purposes, the estimated cost and unrealized appreciation (depreciation) in value of investment securities held at June 30, 2017 were as follows:
| | | | | | | | | | | | | | | | |
| | | Aggregate
Cost | | | Gross
Unrealized
Appreciation | | | Gross
Unrealized
Depreciation | | | Net Unrealized
Appreciation
(Depreciation) | |
| | $ | 265,360,629 | | | $ | 7,886,686 | | | $ | 1,710,158 | | | $ | 6,176,528 | |
| | | | | | |
| | | |
| 46 | | | | JPMORGAN INSURANCE TRUST | | JUNE 30, 2017 |
Under the Regulated Investment Company Modernization Act of 2010 (the “Act”), net capital losses recognized by the Portfolio after December 31, 2010, are carried forward indefinitely, and retain their character as short-term and/or long-term losses. Prior to the Act, net capital losses incurred by the Portfolio were carried forward for eight years and treated as short-term losses. The Act requires that post-enactment net capital losses be used before pre-enactment net capital losses.
At December 31, 2016, the Portfolio did not have any post-enactment net capital loss carryforwards.
At December 31, 2016, the Portfolio had the following pre-enactment net capital loss carryforwards, expiring during the year indicated, which are available to offset future realized gains:
| * | The entire amount is comprised of capital loss carryforwards from business combinations, which may be limited in future years under the Internal Revenue Code Sections 381-384. |
6. Borrowings
The Portfolio relies upon an exemptive order granted by the SEC (the “Order”) permitting the establishment and operation of an Interfund Lending Facility (the “Facility”). The Facility allows the Portfolio to directly lend and borrow money to or from any other fund relying upon the Order at rates beneficial to both the borrowing and lending funds. Advances under the Facility are taken primarily for temporary or emergency purposes, including the meeting of redemption requests that otherwise might require the untimely disposition of securities, and are subject to the Portfolio’s borrowing restrictions. The Interfund loan rate is determined, as specified in the Order, by averaging the current repurchase agreement rate and the current bank loan rate. The Order was granted to the Trust and may be relied upon by the Portfolio because the Portfolio and the series of the Trust are all investment companies in the same “group of investment companies” (as defined in Section 12(d)(1)(G) of the 1940 Act).
The Trust and JPMCB have entered into a financing arrangement. Under this arrangement, JPMCB provides an unsecured, uncommitted credit facility in the aggregate amount of $100 million to certain of the J.P. Morgan Funds, including the Portfolio. Advances under the arrangement are taken primarily for temporary or emergency purposes, including the meeting of redemption requests that otherwise might require the untimely disposition of securities, and are subject to the Portfolio’s borrowing restrictions. Interest on borrowings is payable at a rate determined by JPMCB at the time of borrowing. This agreement has been extended until November 6, 2017.
The Portfolio had no borrowings outstanding from the unsecured, uncommitted credit facility during the six months ended June 30, 2017.
In addition, effective August 16, 2016, the Trust along with certain other trusts (“Borrowers”) entered into a joint syndicated senior unsecured revolving credit facility totaling $1.5 billion (“Credit Facility”) with various lenders and The Bank of New York Mellon, as administrative agent for the lenders. This Credit Facility provides a source of funds to the Borrowers for temporary and emergency purposes, including the meeting of redemption requests that otherwise might require the untimely disposition of securities. Under the terms of the Credit Facility, a borrowing portfolio must have a minimum of $25,000,000 in adjusted net asset value and not exceed certain adjusted net asset coverage ratios prior to and during the time in which any borrowings are outstanding. If a portfolio does not comply with the aforementioned requirements, the Portfolio must remediate within three business days with respect to the $25,000,000 minimum adjusted net asset value or within one business day with respect to certain asset coverage ratios or the administrative agent at the request of, or with the consent of, the lenders may terminate the Credit Facility and declare any outstanding borrowings to be due and payable immediately.
Interest associated with any borrowing under the Credit Facility is charged to the borrowing portfolio at a rate of interest equal to 1.00% plus the greater of the federal funds effective rate or one month LIBOR. The annual commitment fee to maintain the Credit Facility is 0.15% and is incurred on the unused portion of the Credit Facility and is allocated to all participating portfolios pro rata based on their respective net assets. Effective August 15, 2017, this agreement has been amended and restated for a term of 364 days, unless extended. The Portfolio did not utilize the Credit Facility during the six months ended June 30, 2017.
7. Risks, Concentrations and Indemnifications
In the normal course of business, the Portfolio enters into contracts that contain a variety of representations which provide general indemnifications. The Portfolio’s maximum exposure under these arrangements is unknown. The amount of exposure would depend on future claims that may be made against the Portfolio that have not yet occurred. However, based on experience, the Portfolio expects the risk of loss to be remote.
As of June 30, 2017, the Portfolio had four omnibus accounts which collectively represented 54.9% of the Portfolio’s outstanding shares. Significant shareholder transactions by these shareholders may impact the Portfolio’s performance.
The Portfolio is subject to interest rate and credit risk. The value of debt securities may decline as interest rates increase. The Portfolio could lose money if the issuer of a fixed income security is unable to pay interest or repay principal when it is due. The Portfolio invests in floating rate loans and other floating rate debt securities. Although these investments are generally less sensitive to interest rate changes than other fixed rate instruments, the value of floating rate loans and other floating rate investments may decline if their interest rates do not rise as quickly, or as much, as general interest rates. Many factors can cause interest rates to rise. Some examples include central bank monetary policy, rising inflation rates and general economic conditions. Given that the Federal Reserve has recently raised interest rates and may continue to do so, the Portfolio may face a
| | | | | | | | |
| | | |
| JUNE 30, 2017 | | JPMORGAN INSURANCE TRUST | | | | | 47 | |
NOTES TO FINANCIAL STATEMENTS
AS OF JUNE 30, 2017 (Unaudited) (continued)
heightened level of interest rate risk. The ability of the issuers of debt to meet their obligations may be affected by the economic and political developments in a specific industry or region.
The Portfolio is subject to risks associated with securities with contractual cash flows including asset-backed and mortgage-related securities such as collateralized mortgage obligations, mortgage pass-through securities and commercial mortgage-backed securities, including securities backed by sub-prime mortgage loans. The value, liquidity and related income of these securities are sensitive to changes in economic conditions, including real estate value, prepayments, delinquencies and/or defaults, and may be adversely affected by shifts in the market’s perception of the issuers and changes in interest rates.
The Portfolio is subject to the risk that should the Portfolio decide to sell an illiquid investment when a ready buyer is not available at a price the Portfolio deems representative of its value, the value of the Portfolio’s net assets could be adversely affected.
The Portfolio invests in preferred securities. These securities are typically issued by corporations, generally in the form of interest bearing notes with preferred security characteristics and may include provisions that permit the issuer, in its discretion, to defer or omit distributions for a certain period of time.
8. Investment Company Reporting Modernization
In October 2016, the U.S. Securities and Exchange Commission adopted new rules and forms, and amendments to certain current rules and forms, to modernize the reporting and disclosure of information by registered investment companies. In part, the final rules amend Regulation S-X and will require standardized, enhanced disclosures about derivatives in investment company financial statements, as well as other amendments. The amendments to Regulation S-X will apply to Portfolios’ fiscal year ends on or after August 1, 2017. At this time, management is currently evaluating the impact of the Regulation S-X amendments on the Portfolio’s financial statements and related disclosures. The adoption will have no effect on the Portfolio’s net assets or result of operations.
| | | | | | |
| | | |
| 48 | | | | JPMORGAN INSURANCE TRUST | | JUNE 30, 2017 |
SCHEDULE OF SHAREHOLDER EXPENSES
(Unaudited)
Hypothetical $1,000 Investment
As a shareholder of the Portfolio, you incur ongoing costs, including investment advisory fees, administration fees, distribution fees (for Class 2 Shares) and other Portfolio expenses. Because the Portfolio is a funding vehicle for Policies and Eligible Plans, you may also incur sales charges and other fees relating to the Policies or Eligible Plans. The examples below are intended to help you understand your ongoing costs (in dollars) of investing in the Portfolio, but not the costs of the Policies or Eligible Plans, and to compare these ongoing costs with the ongoing costs of investing in other mutual funds. The examples assume that you had a $1,000 investment in each Class at the beginning of the reporting period, January 1, 2017 and continued to hold your shares at the end of the reporting period, June 30, 2017.
Actual Expenses
For each Class of the Portfolio in the table below, the first line provides information about actual account values and actual expenses. You may use the information in this line, together with the amount you invested, to estimate the expenses that you paid over the period. Simply divide your account value by $1,000 (for example, an $8,600 account value divided by $1,000 = 8.6), then multiply the result by the number in the first line of each Class under the heading entitled “Expenses Paid During the Period” to estimate the expenses you paid on your account during this period.
Hypothetical Example for Comparison Purposes
The second line of each Class in the table below provides information about hypothetical account values and hypothetical expenses based on the Class’ actual expense ratio and an assumed rate of return of 5% per year before expenses, which is not the Class’ actual return. The hypothetical account values and expenses may not be used to estimate the actual ending account balance or expenses you paid for the period. You may use this information to compare the ongoing costs of investing in the Class of the Portfolio and other funds. To do so, compare this 5% hypothetical example with the 5% hypothetical examples that appear in the shareholder reports of the other funds. Please note that the expenses shown in the table are meant to highlight your ongoing costs only and do not reflect any transaction costs, such as sales charges (loads) or redemption fees or the costs associated with the Policies and Eligible Plans through which the Portfolio is held. Therefore, the second line for each Class in the table is useful in comparing ongoing costs only, and will not help you determine the relative total costs of owning different funds. In addition, if these transaction costs were included, your costs would have been higher. The examples also assume all dividends and distributions have been reinvested.
| | | | | | | | | | | | | | | | |
| | | Beginning
Account Value
January 1, 2017 | | | Ending
Account Value
June 30, 2017 | | | Expenses
Paid During
the Period* | | | Annualized
Expense
Ratio | |
Core Bond Portfolio | | | | | | | | | | | | | | | | |
Class 1 | | | | | | | | | | | | | | | | |
Actual | | $ | 1,000.00 | | | $ | 1,023.40 | | | $ | 3.01 | | | | 0.60 | % |
Hypothetical | | | 1,000.00 | | | | 1,021.82 | | | | 3.01 | | | | 0.60 | |
Class 2 | | | | | | | | | | | | | | | | |
Actual | | | 1,000.00 | | | | 1,022.50 | | | | 4.26 | | | | 0.85 | |
Hypothetical | | | 1,000.00 | | | | 1,020.58 | | | | 4.26 | | | | 0.85 | |
| * | Expenses are equal to each Class' respective annualized expense ratio, multiplied by the average account value over the period, multiplied by 181/365 (to reflect the one-half year period). |
| | | | | | | | |
| | | |
| JUNE 30, 2017 | | JPMORGAN INSURANCE TRUST | | | | | 49 | |
J.P. Morgan Funds are distributed by JPMorgan Distribution Services, Inc., which is an affiliate of JPMorgan Chase & Co. Affiliates of JPMorgan Chase & Co. receive fees for providing various services to the funds.
Contact JPMorgan Distribution Services, Inc. at 1-800-480-4111 for a portfolio prospectus. You can also visit us at www.jpmorganfunds.com. Investors should carefully consider the investment objectives and risk as well as charges and expenses of the mutual fund before investing. The prospectus contains this and other information about the mutual fund. Read the prospectus carefully before investing.
The Portfolio files a complete schedule of its portfolio holdings for the first and third quarters of its fiscal year with the SEC on Form N-Q. The Portfolio’s Forms N-Q are available on the SEC’s website at http://www.sec.gov and may be reviewed and copied at the SEC’s Public Reference Room in Washington, DC. Information on the operation of the SEC’s Public Reference Room may be obtained by calling 1-800-SEC-0330. Shareholders may request the Form N-Q without charge by calling 1-800-480-4111 or by visiting the variable insurance portfolio section of the J.P. Morgan Funds’ website at www.jpmorganfunds.com.
A description of the Portfolio’s policies and procedures with respect to the disclosure of the Portfolio’s holdings is available in the prospectus and Statement of Additional Information.
A copy of proxy policies and procedures is available without charge upon request by calling 1-800-480-4111 and on the Portfolio’s website at www.jpmorganfunds.com. A description of such policies and procedures is on the SEC’s website at www.sec.gov. The Trustees have delegated the authority to vote proxies for securities owned by the Portfolio to the Adviser. A copy of the Portfolio’s voting record for the most recent 12-month period ended June 30 is available on the SEC’s website at www.sec.gov or at the Portfolio’s website at www.jpmorganfunds.com no later than August 31 of each year. The Portfolio’s proxy voting record will include, among other things, a brief description of the matter voted on for each portfolio security, and will state how each vote was cast, for example, for or against the proposal.


J.P. Morgan Asset Management is the marketing name for the asset management businesses of JPMorgan Chase & Co. Those businesses include, but are not limited to, J.P. Morgan Investment Management Inc., Security Capital Research & Management Incorporated and J.P. Morgan Alternative Asset Management, Inc.
| | | | |
| | © JPMorgan Chase & Co., 2017. All rights reserved. June 2017. | | SAN-JPMITCBP-617 |
Semi-Annual Report
JPMorgan Insurance Trust
June 30, 2017 (Unaudited)
JPMorgan Insurance Trust Mid Cap Value Portfolio
| | | | |
NOT FDIC INSURED • NO BANK GUARANTEE • MAY LOSE VALUE
| | |  | |
CONTENTS
Investments in the Portfolio are not deposits or obligations of, or guaranteed or endorsed by, any bank and are not insured or guaranteed by the FDIC, the Federal Reserve Board or any other government agency. You could lose money if you sell when the Portfolio’s share price is lower than when you invested.
Past performance is no guarantee of future performance. The general market views expressed in this report are opinions based on market and other conditions through the end of the reporting period and are subject to change without notice. These views are not intended to predict the future performance of the Portfolio or the securities markets. References to specific securities and their issuers are for illustrative purposes only and are not intended to be, and should not be interpreted as, recommendations to purchase or sell such securities. Such views are not meant as investment advice and may not be relied on as an indication of trading intent on behalf of the Portfolio.
This Portfolio is intended to be a funding vehicle for variable annuity contracts and variable life insurance policies (collectively “Policies”) offered by the separate accounts of various insurance companies. Portfolio shares may also be offered to qualified pension and retirement plans and accounts permitting accumulation of assets on a tax-deferred basis (“Eligible Plans”). Individuals may not purchase shares directly from the Portfolio.
Prospective investors should refer to the Portfolio’s prospectus for a discussion of the Portfolio’s investment objective, strategies and risks. Call J.P. Morgan Funds Service Center at 1-800-480-4111 for a prospectus containing more complete information about the Portfolio, including management fees and other expenses. Please read it carefully before investing.
CEO’S LETTER
August 4, 2017 (Unaudited)
Dear Shareholder,
As the U.S. economic expansion entered its eighth year in 2017, growth in both developed and emerging market economies became increasingly synchronized even as U.S. growth cooled in the early part of the year. Amid an environment of economic growth, low inflation and rising corporate earnings, global financial markets overall produced positive returns.
| | |
 | | “In the U.S., the continued economic expansion, muted inflation, corporate earnings growth and historically low volatility in financial markets helped to drive key equity market indexes to multiple record closing highs throughout the first half of 2017.” — George C.W. Gatch |
While U.S. gross domestic product (GDP) growth slowed to 1.2% in the first quarter of 2017, it rebounded to 2.6% growth in the second quarter of 2017 on the back of a surge in consumer spending. Meanwhile, the U.S. jobless rate continued to shrink and fell to 4.4% in June 2017 from 4.8% six months earlier. In response to these numbers, along with nascent signs of price inflation, the U.S. Federal Reserve (the “Fed”) raised interest rates in June 2017 and signaled it would raise rates once more before the end of the year. Fed Chairwoman Janet Yellen also indicated she was prepared to begin partially unwinding the central bank’s $4.5 trillion balance sheet of assets purchased through its quantitative easing program.
Despite the apparent health of the U.S. economy, by mid-2017 domestic price inflation was below the Fed’s target of 2% growth and wage growth remained below economists’ expectations, the latter despite an environment of essentially full employment for U.S. workers. These trends — and the Fed’s acknowledgment of them — provided some near-term uncertainty about the central bank’s commitment to tightening monetary policy.
Throughout the first half of 2017, global energy prices continued to fall amid an oversupply of crude oil and natural gas. Despite efforts by the Organization of Petroleum Exporting
Countries to curb global production, the price of a barrel of benchmark West Texas Intermediate crude oil dropped to $46 by the end of June 2017.
Meanwhile, the leading economies of the European Union (the “EU”) continued to strengthen. Annualized GDP for the 19 core EU nations rose 1.9% in the first quarter of 2017 and 2.1% in the second quarter. The June 2017 aggregate unemployment rate for those nations fell to 9.1%, the lowest level since March 2009. Also, in separate elections, voters in the Netherlands and France largely rejected populist campaigns espousing policies to limit free trade and immigration. The election results provided another boost to global equity prices.
In the U.S., the continued economic expansion, muted inflation, corporate earnings growth and historically low volatility in financial markets helped to drive key equity market indexes to multiple record closing highs throughout the first half of 2017. U.S. investors appeared to shrug off intermittent political and policy dramas emanating from Washington, D.C. and extended the run-up in U.S. equity prices into its eighth consecutive year — one of the longest on record. For the six months ended June 30, 2017, the Standard & Poor’s 500 Index returned 9.34%.
U.S. and foreign financial markets largely rewarded those investors who remained fully invested throughout the first half of 2017, reaffirming the fundamental virtues of patience and diversification within a prudent investment strategy.
We look forward to managing your investment needs for years to come. Should you have any questions, please visit www.jpmorganfunds.com or contact the J.P. Morgan Funds Service Center at 1-800-480-4111.
Sincerely yours,

George C.W. Gatch
CEO, Global Funds Management & Institutional,
J.P. Morgan Asset Management
| | | | | | | | |
| | | |
| JUNE 30, 2017 | | JPMORGAN INSURANCE TRUST | | | | | 1 | |
JPMorgan Insurance Trust Mid Cap Value Portfolio
PORTFOLIO COMMENTARY
SIX MONTHS ENDED JUNE 30, 2017 (Unaudited)
| | | | |
| Reporting Period Return: | |
| Portfolio (Class 1 Shares)* | | | 6.17% | |
| Russell Midcap Value Index | | | 5.18% | |
| |
| Net Assets as of 6/30/2017 | | $ | 577,954,945 | |
INVESTMENT OBJECTIVE**
The JPMorgan Insurance Trust Mid Cap Value Portfolio (the “Portfolio”) seeks capital appreciation with the secondary goal of achieving current income by investing primarily in equity securities.
HOW DID THE MARKET PERFORM?
While U.S. equity markets continued to provide positive returns for the past six months, the magnitude of those gains slowed somewhat as key stock market indexes touched multiple closing highs and largely held near record territory. Steady global economic growth, continued low inflation and strong corporate earnings all served to support equity prices, both in the U.S. and elsewhere. Globally, emerging market equities generally outperformed the U.S. and other developed market equities during the reporting period.
Amid investor expectations that the incoming Trump administration and Republican Party majorities in the U.S. Congress would move quickly on infrastructure spending and tax policy, U.S. equities began 2017 with positive returns amid low volatility. Even as those investor expectations began to fade, U.S. equity prices continued to climb.
In February 2017, the Standard & Poor’s 500 Index (the “S&P 500”) reached nine new closing highs and the Dow Jones Industrial Average (the “DJIA”) closed at new highs for 12 consecutive days, matching a record set in 1987. The following month, the S&P 500 crossed 2,400 points in intraday trading for the first time and the DJIA crossed 21,000 points for the first time. While the rally in U.S. equities stalled in April 2017, record high U.S. corporate operating earnings rekindled the rise in stock prices and the S&P 500 posted seven new closing highs in May 2017 and four new closing highs in June 2017.
Importantly, U.S. financial market volatility remained historically low throughout the reporting period, with a brief spike ahead of the November 2016 election. By the end of June 2017, the CBOE Volatility Index averaged 10.5 points, which was about half of its historical average.
Overall, large cap stocks generally outperformed mid cap and small cap stocks, while growth stocks generally outperformed value stocks. For the six months ended June 30, 2017, the S&P 500 returned 9.34% and the Russell Midcap Value Index returned 5.18%.
WHAT WERE THE MAIN DRIVERS OF THE PORTFOLIO’S PERFORMANCE?
The Portfolio’s Class 1 Shares outperformed the Russell Midcap Value Index (the “Benchmark”) for the six months ended June 30, 2017. The Portfolio’s security selection and underweight position in the energy sector and its security selection in the materials sector were leading contributors to performance relative to the Benchmark. The Portfolio’s security selection in the real estate and consumer staples sectors was a leading detractor from relative performance.
Leading individual contributors to performance included the Portfolio’s overweight positions in Expedia Inc., Mohawk Industries Inc. and Newell Brands Inc. Shares of Expedia, an online travel booking company that was not held in the Benchmark, rose amid investor expectations for growth in consumer demand for its services and in the company’s market share. Shares of Mohawk Industries, a maker of commercial and residential flooring, rose after the company reported growth in earnings and sales. Shares of Newell Brands, a maker of a broad range of consumer and commercial products, rose after the company reported better-than-expected earnings and raised both its earnings forecast and its quarterly dividend.
Leading individual detractors from relative performance included the Portfolio’s overweight positions in Kroger Co. and Energen Corp. and its underweight position in Micron Technology Inc. Shares of Kroger, a supermarket chain that was not held in the Benchmark, fell after the company reduced its earnings forecast amid intense price competition. Shares of Energen, an oil and gas producer, fell amid a general decline in global oil prices during the reporting period. Shares of Micron Technology, a semiconductor manufacturer that was not held in the Portfolio, rose on better-than-expected earnings, elevated prices for memory chips and investor expectations that the company would benefit from the introduction of new smartphone models scheduled for the second half of 2017.
HOW WAS THE PORTFOLIO POSITIONED?
The portfolio managers utilized a bottom-up approach to stock selection and sought to identify durable franchises possessing the ability to generate, in their view, sustainable levels of free cash flow. During the reporting period, the Portfolio maintained a large overweight position in the consumer discretionary sector, while maintaining underweight positions in the energy and real estate sectors. The Portfolio had no position in the telecommunication services sector during the reporting period.
| | | | | | |
| | | |
| 2 | | | | JPMORGAN INSURANCE TRUST | | JUNE 30, 2017 |
| | | | | | | | |
| TOP TEN EQUITY HOLDINGS OF THE PORTFOLIO*** | |
| | 1. | | | Mohawk Industries, Inc. | | | 2.0 | % |
| | 2. | | | EQT Corp. | | | 1.9 | |
| | 3. | | | Loews Corp. | | | 1.8 | |
| | 4. | | | Energen Corp. | | | 1.8 | |
| | 5. | | | M&T Bank Corp. | | | 1.7 | |
| | 6. | | | Expedia, Inc. | | | 1.6 | |
| | 7. | | | Ball Corp. | | | 1.5 | |
| | 8. | | | Xcel Energy, Inc. | | | 1.5 | |
| | 9. | | | Newell Brands, Inc. | | | 1.5 | |
| | 10. | | | CMS Energy Corp. | | | 1.5 | |
| | | | |
PORTFOLIO COMPOSITION BY SECTOR*** | |
| Financials | | | 21.8 | % |
| Consumer Discretionary | | | 17.3 | |
| Real Estate | | | 10.2 | |
| Information Technology | | | 9.5 | |
| Utilities | | | 8.7 | |
| Industrials | | | 7.6 | |
| Consumer Staples | | | 6.1 | |
| Energy | | | 5.9 | |
| Health Care | | | 5.2 | |
| Materials | | | 4.7 | |
| Short-Term Investment | | | 3.0 | |
| * | | The return shown is based on net asset values calculated for shareholder transactions and may differ from the return shown in the financial highlights, which reflects adjustments made to the net asset values in accordance with accounting principles generally accepted in the United States of America. |
| ** | | The adviser seeks to achieve the Portfolio’s objective. There can be no guarantee it will be achieved. |
| *** | | Percentages indicated are based on total investments as of June 30, 2017. The Portfolio’s composition is subject to change. |
| | | | | | | | |
| | | |
| JUNE 30, 2017 | | JPMORGAN INSURANCE TRUST | | | | | 3 | |
JPMorgan Insurance Trust Mid Cap Value Portfolio
PORTFOLIO COMMENTARY
SIX MONTHS ENDED JUNE 30, 2017 (Unaudited) (continued)
| | | | | | | | | | | | | | | | | | | | | | |
AVERAGE ANNUAL TOTAL RETURNS AS OF JUNE 30, 2017 | |
| | | | | | |
| | | | | INCEPTION DATE OF
CLASS | | | 6 MONTH* | | | 1 YEAR | | | 5 YEAR | | | 10 YEAR | |
CLASS 1 SHARES | | | | | September 28, 2001 | | | | 6.17 | % | | | 13.95 | % | | | 14.48 | % | | �� | 8.24 | % |
TEN YEAR PERFORMANCE 6/30/07 TO 6/30/17
The performance quoted is past performance and is not a guarantee of future results. Mutual funds are subject to certain market risks. Investment returns and principal value of an investment will fluctuate so that an investor’s shares, when redeemed, may be worth more or less than their original cost. Current performance may be higher or lower than the performance data shown. For up-to-date month-end performance information please call 1-800-480-4111.
Inception date for JPMorgan Insurance Trust Mid Cap Value Portfolio is September 28, 2001, which is the inception date of JPMorgan Mid Cap Value Portfolio (“Predecessor Portfolio”). JPMorgan Insurance Trust Mid Cap Value Portfolio acquired all of the assets and liabilities of the Predecessor Portfolio in a reorganization on April 24, 2009. The Predecessor Portfolio’s performance and financial history have been adopted by JPMorgan Insurance Trust Mid Cap Value Portfolio and have been used since the reorganization. As a result, the performance prior to April 25, 2009 is the performance of the Predecessor Portfolio.
The graph illustrates comparative performance for $10,000 invested in Class 1 Shares of the JPMorgan Insurance Trust Mid Cap Value Portfolio, the Russell Midcap Value Index and the Lipper Variable Underlying Funds Multi-Cap Core Index from June 30, 2007 to June 30, 2017. The performance of the Portfolio assumes reinvestment of all dividends and capital gain distributions, if any. The performance of the Russell Midcap Value Index does not reflect the deduction
of expenses associated with a mutual fund and has been adjusted to reflect reinvestment of all dividends and capital gain distributions of the securities included in the benchmark, if applicable. The performance of the Lipper Variable Underlying Funds Multi-Cap Core Index includes expenses associated with a mutual fund, such as investment management fees. These expenses are not identical to expenses incurred by the Portfolio. The Russell Midcap Value Index is an unmanaged index which measures the performance of those Russell Midcap companies with lower price-to-book ratios and lower forecasted growth values. The Lipper Variable Underlying Funds Multi-Cap Core Index is an index based on the total returns of certain mutual funds within the Portfolio’s designated category as determined by Lipper, Inc. Investors cannot invest directly in an index.
Portfolio performance does not reflect any charges imposed by the Policies or Eligible Plans. If these charges were included, the returns would be lower than shown. Portfolio performance may reflect the waiver of the Portfolio’s fees and reimbursement of expenses for certain periods since the inception date. Without these waivers and reimbursements, performance would have been lower.
The returns shown are based on net asset values calculated for shareholder transactions and may differ from the returns shown in the financial highlights, which reflect adjustments made to the net asset values in accordance with accounting principles generally accepted in the United States of America.
| | | | | | |
| | | |
| 4 | | | | JPMORGAN INSURANCE TRUST | | JUNE 30, 2017 |
JPMorgan Insurance Trust Mid Cap Value Portfolio
SCHEDULE OF PORTFOLIO INVESTMENTS
AS OF JUNE 30, 2017 (Unaudited)
| | | | | | | | |
| SHARES | | | SECURITY DESCRIPTION | | VALUE($) | |
| | | | | | | | |
| | Common Stocks — 97.0% | |
| | | | Consumer Discretionary — 17.3% | |
| | | | Auto Components — 0.9% | |
| | 117,890 | | | BorgWarner, Inc. | | | 4,993,820 | |
| | | | | | | | |
| | | | Distributors — 0.9% | |
| | 54,559 | | | Genuine Parts Co. | | | 5,060,893 | |
| | | | | | | | |
| | | | Hotels, Restaurants & Leisure — 1.5% | |
| | 30,021 | | | Hilton Grand Vacations, Inc. (a) | | | 1,082,557 | |
| | 87,596 | | | Hilton Worldwide Holdings, Inc. | | | 5,417,813 | |
| | 21,056 | | | Marriott International, Inc., Class A | | | 2,112,127 | |
| | | | | | | | |
| | | | | | | 8,612,497 | |
| | | | | | | | |
| | | | Household Durables — 3.5% | |
| | 48,790 | | | Mohawk Industries, Inc. (a) | | | 11,792,055 | |
| | 161,879 | | | Newell Brands, Inc. | | | 8,679,952 | |
| | | | | | | | |
| | | | | | | 20,472,007 | |
| | | | | | | | |
| | | | Internet & Direct Marketing Retail — 1.6% | |
| | 60,130 | | | Expedia, Inc. | | | 8,956,364 | |
| | | | | | | | |
| | | | Media — 1.8% | |
| | 66,662 | | | CBS Corp. (Non-Voting), Class B | | | 4,251,702 | |
| | 93,380 | | | DISH Network Corp., Class A (a) | | | 5,860,529 | |
| | | | | | | | |
| | | | | | | 10,112,231 | |
| | | | | | | | |
| | | | Multiline Retail — 1.7% | |
| | 144,930 | | | Kohl’s Corp. | | | 5,604,443 | |
| | 91,960 | | | Nordstrom, Inc. | | | 4,398,447 | |
| | | | | | | | |
| | | | | | | 10,002,890 | |
| | | | | | | | |
| | | | Specialty Retail — 3.8% | |
| | 8,278 | | | AutoZone, Inc. (a) | | | 4,722,268 | |
| | 99,455 | | | Bed Bath & Beyond, Inc. | | | 3,023,432 | |
| | 84,370 | | | Best Buy Co., Inc. | | | 4,836,932 | |
| | 182,610 | | | Gap, Inc. (The) | | | 4,015,594 | |
| | 58,910 | | | Tiffany & Co. | | | 5,529,882 | |
| | | | | | | | |
| | | | | | | 22,128,108 | |
| | | | | | | | |
| | | | Textiles, Apparel & Luxury Goods — 1.6% | |
| | 55,760 | | | PVH Corp. | | | 6,384,520 | |
| | 41,080 | | | Ralph Lauren Corp. | | | 3,031,704 | |
| | | | | | | | |
| | | | | | | 9,416,224 | |
| | | | | | | | |
| | | | Total Consumer Discretionary | | | 99,755,034 | |
| | | | | | | | |
| | | | Consumer Staples — 6.1% | |
| | | | Beverages — 2.5% | |
| | 29,470 | | | Constellation Brands, Inc., Class A | | | 5,709,223 | |
| | 74,481 | | | Dr Pepper Snapple Group, Inc. | | | 6,785,964 | |
| | 22,100 | | | Molson Coors Brewing Co., Class B | | | 1,908,114 | |
| | | | | | | | |
| | | | | | | 14,403,301 | |
| | | | | | | | |
| | | | | | | | |
| SHARES | | | SECURITY DESCRIPTION | | VALUE($) | |
| | | | | | | | |
| | | | | | | | |
| | | | Food & Staples Retailing — 0.8% | |
| | 191,484 | | | Kroger Co. (The) | | | 4,465,407 | |
| | | | | | | | |
| | | | Food Products — 0.7% | |
| | 51,679 | | | TreeHouse Foods, Inc. (a) | | | 4,221,658 | |
| | | | | | | | |
| | | | Household Products — 0.3% | |
| | 42,190 | | | Energizer Holdings, Inc. | | | 2,025,964 | |
| | | | | | | | |
| | | | Personal Products — 1.8% | |
| | 257,300 | | | Coty, Inc., Class A | | | 4,826,948 | |
| | 72,070 | | | Edgewell Personal Care Co. (a) | | | 5,478,761 | |
| | | | | | | | |
| | | | | | | 10,305,709 | |
| | | | | | | | |
| | | | Total Consumer Staples | | | 35,422,039 | |
| | | | | | | | |
| | | | Energy — 5.9% | |
| | | | Oil, Gas & Consumable Fuels — 5.9% | |
| | 215,383 | | | Energen Corp. (a) | | | 10,633,459 | |
| | 186,210 | | | EQT Corp. | | | 10,910,044 | |
| | 202,460 | | | PBF Energy, Inc., Class A | | | 4,506,759 | |
| | 262,240 | | | Williams Cos., Inc. (The) | | | 7,940,627 | |
| | | | | | | | |
| | | | Total Energy | | | 33,990,889 | |
| | | | | | | | |
| | | | Financials — 21.8% | |
| | | | Banks — 7.5% | |
| | 157,080 | | | Citizens Financial Group, Inc. | | | 5,604,614 | |
| | 293,350 | | | Fifth Third Bancorp | | | 7,615,366 | |
| | 59,410 | | | First Republic Bank | | | 5,946,941 | |
| | 324,310 | | | Huntington Bancshares, Inc. | | | 4,384,671 | |
| | 59,358 | | | M&T Bank Corp. | | | 9,613,028 | |
| | 137,750 | | | SunTrust Banks, Inc. | | | 7,813,180 | |
| | 49,660 | | | Zions Bancorp | | | 2,180,571 | |
| | | | | | | | |
| | | | | | | 43,158,371 | |
| | | | | | | | |
| | | | Capital Markets — 4.9% | |
| | 33,990 | | | Ameriprise Financial, Inc. | | | 4,326,587 | |
| | 180,880 | | | Invesco Ltd. | | | 6,365,167 | |
| | 64,110 | | | Northern Trust Corp. | | | 6,232,133 | |
| | 65,870 | | | Raymond James Financial, Inc. | | | 5,284,092 | |
| | 85,600 | | | T Rowe Price Group, Inc. | | | 6,352,376 | |
| | | | | | | | |
| | | | | | | 28,560,355 | |
| | | | | | | | |
| | | | Consumer Finance — 0.7% | |
| | 200,750 | | | Ally Financial, Inc. | | | 4,195,675 | |
| | | | | | | | |
| | | | Insurance — 8.7% | |
| | 5,418 | | | Alleghany Corp. (a) | | | 3,222,626 | |
| | 21,483 | | | Chubb Ltd. | | | 3,123,198 | |
| | 151,220 | | | Hartford Financial Services Group, Inc. (The) | | | 7,949,635 | |
| | 227,370 | | | Loews Corp. | | | 10,643,190 | |
| | 90,200 | | | Marsh & McLennan Cos., Inc. | | | 7,031,992 | |
SEE NOTES TO FINANCIAL STATEMENTS.
| | | | | | | | |
| | | |
| JUNE 30, 2017 | | JPMORGAN INSURANCE TRUST | | | | | 5 | |
JPMorgan Insurance Trust Mid Cap Value Portfolio
SCHEDULE OF PORTFOLIO INVESTMENTS
AS OF JUNE 30, 2017 (Unaudited) (continued)
| | | | | | | | |
| SHARES | | | SECURITY DESCRIPTION | | VALUE($) | |
| | | | | | | | |
| | Common Stocks — continued | |
| | | | Insurance — continued | |
| | 80,040 | | | Progressive Corp. (The) | | | 3,528,964 | |
| | 95,420 | | | Unum Group | | | 4,449,435 | |
| | 38,010 | | | WR Berkley Corp. | | | 2,629,152 | |
| | 171,700 | | | XL Group Ltd., (Bermuda) | | | 7,520,460 | |
| | | | | | | | |
| | | | | | | 50,098,652 | |
| | | | | | | | |
| | | | Total Financials | | | 126,013,053 | |
| | | | | | | | |
| | | | Health Care — 5.2% | |
| | | | Health Care Providers & Services — 5.2% | |
| | 52,450 | | | AmerisourceBergen Corp. | | | 4,958,098 | |
| | 36,040 | | | Cigna Corp. | | | 6,032,736 | |
| | 26,740 | | | Henry Schein, Inc. (a) | | | 4,893,955 | |
| | 28,090 | | | Humana, Inc. | | | 6,759,016 | |
| | 16,590 | | | Laboratory Corp. of America Holdings (a) | | | 2,557,183 | |
| | 39,931 | | | Universal Health Services, Inc., Class B | | | 4,874,776 | |
| | | | | | | | |
| | | | Total Health Care | | | 30,075,764 | |
| | | | | | | | |
| | | | Industrials — 7.6% | |
| | | | Building Products — 1.0% | |
| | 89,610 | | | Fortune Brands Home & Security, Inc. | | | 5,846,156 | |
| | | | | | | | |
| | | | Electrical Equipment — 2.3% | |
| | 89,740 | | | AMETEK, Inc. | | | 5,435,552 | |
| | 45,550 | | | Hubbell, Inc. | | | 5,154,893 | |
| | 33,160 | | | Regal Beloit Corp. | | | 2,704,198 | |
| | | | | | | | |
| | | | | | | 13,294,643 | |
| | | | | | | | |
| | | | Industrial Conglomerates — 1.1% | |
| | 66,930 | | | Carlisle Cos., Inc. | | | 6,385,122 | |
| | | | | | | | |
| | | | Machinery — 2.2% | |
| | 50,050 | | | IDEX Corp. | | | 5,656,151 | |
| | 44,540 | | | Snap-on, Inc. | | | 7,037,320 | |
| | | | | | | | |
| | | | | | | 12,693,471 | |
| | | | | | | | |
| | | | Trading Companies & Distributors — 1.0% | |
| | 66,770 | | | MSC Industrial Direct Co., Inc., Class A | | | 5,739,549 | |
| | | | | | | | |
| | | | Total Industrials | | | 43,958,941 | |
| | | | | | | | |
| | | | Information Technology — 9.5% | |
| | | | Communications Equipment — 1.0% | |
| | 154,240 | | | CommScope Holding Co., Inc. (a) | | | 5,865,747 | |
| | | | | | | | |
| | | | Electronic Equipment, Instruments & Components — 4.8% | |
| | 89,720 | | | Amphenol Corp., Class A | | | 6,623,131 | |
| | 92,080 | | | Arrow Electronics, Inc. (a) | | | 7,220,914 | |
| | 111,470 | | | CDW Corp. | | | 6,970,219 | |
| | 173,710 | | | Keysight Technologies, Inc. (a) | | | 6,762,530 | |
| | | | | | | | |
| | | | | | | 27,576,794 | |
| | | | | | | | |
| | | | | | | | |
| SHARES | | | SECURITY DESCRIPTION | | VALUE($) | |
| | | | | | | | |
| | | | | | | | |
| | | | Internet Software & Services — 0.4% | |
| | 131,340 | | | Match Group, Inc. (a) | | | 2,282,689 | |
| | | | | | | | |
| | | | IT Services — 1.3% | |
| | 70,760 | | | Jack Henry & Associates, Inc. | | | 7,349,841 | |
| | | | | | | | |
| | | | Semiconductors & Semiconductor Equipment — 0.8% | |
| | 51,040 | | | Analog Devices, Inc. | | | 3,970,912 | |
| | 8,320 | | | KLA-Tencor Corp. | | | 761,363 | |
| | | | | | | | |
| | | | | | | 4,732,275 | |
| | | | | | | | |
| | | | Software — 1.2% | |
| | 99,260 | | | Synopsys, Inc. (a) | | | 7,239,032 | |
| | | | | | | | |
| | | | Total Information Technology | | | 55,046,378 | |
| | | | | | | | |
| | | | Materials — 4.7% | |
| | | | Chemicals — 0.8% | |
| | 12,920 | | | Sherwin-Williams Co. (The) | | | 4,534,403 | |
| | | | | | | | |
| | | | Containers & Packaging — 3.9% | |
| | 212,080 | | | Ball Corp. | | | 8,951,897 | |
| | 179,880 | | | Silgan Holdings, Inc. | | | 5,716,586 | |
| | 141,500 | | | WestRock Co. | | | 8,017,390 | |
| | | | | | | | |
| | | | | | | 22,685,873 | |
| | | | | | | | |
| | | | Total Materials | | | 27,220,276 | |
| | | | | | | | |
| | | | Real Estate — 10.2% | |
| | | | Equity Real Estate Investment Trusts (REITs) — 9.6% | |
| | 56,380 | | | American Campus Communities, Inc. | | | 2,666,774 | |
| | 95,200 | | | American Homes 4 Rent, Class A | | | 2,148,664 | |
| | 27,330 | | | AvalonBay Communities, Inc. | | | 5,252,006 | |
| | 38,470 | | | Boston Properties, Inc. | | | 4,732,580 | |
| | 199,500 | | | Brixmor Property Group, Inc. | | | 3,567,060 | |
| | 11,220 | | | Essex Property Trust, Inc. | | | 2,886,569 | |
| | 23,960 | | | Federal Realty Investment Trust | | | 3,028,304 | |
| | 110,120 | | | GGP, Inc. | | | 2,594,427 | |
| | 37,200 | | | HCP, Inc. | | | 1,188,912 | |
| | 222,810 | | | Kimco Realty Corp. | | | 4,088,564 | |
| | 146,027 | | | Outfront Media, Inc. | | | 3,376,144 | |
| | 90,996 | | | Park Hotels & Resorts, Inc. | | | 2,453,252 | |
| | 129,135 | | | Rayonier, Inc. | | | 3,715,214 | |
| | 41,100 | | | Regency Centers Corp. | | | 2,574,504 | |
| | 57,184 | | | Vornado Realty Trust | | | 5,369,578 | |
| | 115,650 | | | Weyerhaeuser Co. | | | 3,874,275 | |
| | 26,870 | | | WP Carey, Inc. | | | 1,773,689 | |
| | | | | | | | |
| | | | | | | 55,290,516 | |
| | | | | | | | |
| | | | Real Estate Management & Development — 0.6% | |
| | 102,500 | | | CBRE Group, Inc., Class A (a) | | | 3,731,000 | |
| | | | | | | | |
| | | | Total Real Estate | | | 59,021,516 | |
| | | | | | | | |
SEE NOTES TO FINANCIAL STATEMENTS.
| | | | | | |
| | | |
| 6 | | | | JPMORGAN INSURANCE TRUST | | JUNE 30, 2017 |
| | | | | | | | |
| SHARES | | | SECURITY DESCRIPTION | | VALUE($) | |
| | | | | | | | |
| | Common Stocks — continued | |
| | | | Utilities — 8.7% | |
| | | | Electric Utilities — 3.2% | |
| | 105,560 | | | Edison International | | | 8,253,736 | |
| | 26,110 | | | Westar Energy, Inc. | | | 1,384,352 | |
| | 193,550 | | | Xcel Energy, Inc. | | | 8,880,074 | |
| | | | | | | | |
| | | | | | | 18,518,162 | |
| | | | | | | | |
| | | | Gas Utilities — 1.0% | |
| | 100,840 | | | National Fuel Gas Co. | | | 5,630,906 | |
| | | | | | | | |
| | | | Multi-Utilities — 4.5% | |
| | 60,260 | | | CenterPoint Energy, Inc. | | | 1,649,919 | |
| | 186,950 | | | CMS Energy Corp. | | | 8,646,437 | |
| | 64,490 | | | Sempra Energy | | | 7,271,248 | |
| | 133,380 | | | WEC Energy Group, Inc. | | | 8,186,864 | |
| | | | | | | | |
| | | | | | | 25,754,468 | |
| | | | | | | | |
| | | | Total Utilities | | | 49,903,536 | |
| | | | | | | | |
| | | | Total Common Stocks
(Cost $369,832,730) | | | 560,407,426 | |
| | | | | | | | |
| | | | | | | | |
| SHARES | | | SECURITY DESCRIPTION | | VALUE($) | |
| | | | | | | | |
| | Short-Term Investment — 3.0% | |
| | | | Investment Company — 3.0% | | | | |
| | 17,327,267 | | | JPMorgan U.S. Government Money Market Fund, Institutional Class Shares, 0.840% (b) (l)
(Cost $17,327,267) | | | 17,327,267 | |
| | | | | | | | |
| | | | Total Investments — 100.0%
(Cost $387,159,997) | | | 577,734,693 | |
| | | | Other Assets in Excess of
Liabilities — 0.0% (g) | | | 220,252 | |
| | | | | | | | |
| | | | NET ASSETS — 100.0% | | $ | 577,954,945 | |
| | | | | | | | |
Percentages indicated are based on net assets.
NOTES TO SCHEDULE OF PORTFOLIO INVESTMENTS:
| | |
| (a) | | — Non-income producing security. |
| (b) | | — Investment in affiliate. Money market fund registered under the Investment Company Act of 1940, as amended, and advised by J.P. Morgan Investment Management Inc. |
| (g) | | — Amount rounds to less than 0.05%. |
| (l) | | — The rate shown is the current yield as of June 30, 2017. |
SEE NOTES TO FINANCIAL STATEMENTS.
| | | | | | | | |
| | | |
| JUNE 30, 2017 | | JPMORGAN INSURANCE TRUST | | | | | 7 | |
STATEMENT OF ASSETS AND LIABILITIES
AS OF JUNE 30, 2017 (Unaudited)
| | | | |
| | | Mid Cap Value
Portfolio | |
ASSETS: | |
Investments in non-affiliates, at value | | $ | 560,407,426 | |
Investments in affiliates, at value | | | 17,327,267 | |
| | | | |
Total investment securities, at value | | | 577,734,693 | |
Receivables: | | | | |
Investment securities sold | | | 295,430 | |
Portfolio shares sold | | | 719,040 | |
Dividends from non-affiliates | | | 796,322 | |
Dividends from affiliates | | | 10,799 | |
| | | | |
Total Assets | | | 579,556,284 | |
| | | | |
| |
LIABILITIES: | | | | |
Payables: | | | | |
Investment securities purchased | | | 514,065 | |
Portfolio shares redeemed | | | 673,204 | |
Accrued liabilities: | | | | |
Investment advisory fees | | | 305,942 | |
Administration fees | | | 38,544 | |
Custodian and accounting fees | | | 4,351 | |
Trustees’ and Chief Compliance Officer’s fees | | | 510 | |
Other | | | 64,723 | |
| | | | |
Total Liabilities | | | 1,601,339 | |
| | | | |
Net Assets | | $ | 577,954,945 | |
| | | | |
|
NET ASSETS: | |
Paid-in-Capital | | $ | 387,282,688 | |
Accumulated undistributed net investment income | | | 2,428,861 | |
Accumulated net realized gains (losses) | | | (2,331,300 | ) |
Net unrealized appreciation (depreciation) | | | 190,574,696 | |
| | | | |
Total Net Assets | | $ | 577,954,945 | |
| | | | |
| |
Outstanding units of beneficial interest (shares) | | | | |
(unlimited number of shares authorized, no par value): | | | 52,336,587 | |
Net Asset Value, offering and redemption price per share (a): | | $ | 11.04 | |
Cost of investments in non-affiliates | | $ | 369,832,730 | |
Cost of investments in affiliates | | | 17,327,267 | |
| (a) | Per share amounts may not recalculate due to rounding of net assets and/or shares outstanding. |
SEE NOTES TO FINANCIAL STATEMENTS.
| | | | | | |
| | | |
| 8 | | | | JPMORGAN INSURANCE TRUST | | JUNE 30, 2017 |
STATEMENT OF OPERATIONS
FOR THE SIX MONTHS ENDED JUNE 30, 2017 (Unaudited)
| | | | |
| | | Mid Cap Value
Portfolio | |
INVESTMENT INCOME: | |
Dividend income from non-affiliates | | $ | 4,831,203 | |
Dividend income from affiliates | | | 60,076 | |
| | | | |
Total investment income | | | 4,891,279 | |
| | | | |
| |
EXPENSES: | | | | |
Investment advisory fees | | | 1,838,192 | |
Administration fees | | | 231,027 | |
Custodian and accounting fees | | | 17,200 | |
Professional fees | | | 34,471 | |
Trustees’ and Chief Compliance Officer’s fees | | | 14,025 | |
Printing and mailing costs | | | 39,673 | |
Transfer agency fees | | | 3,492 | |
Other | | | 27,550 | |
| | | | |
Total expenses | | | 2,205,630 | |
| | | | |
Less fees waived | | | (21,631 | ) |
| | | | |
Net expenses | | | 2,183,999 | |
| | | | |
Net investment income (loss) | | | 2,707,280 | |
| | | | |
| |
REALIZED/UNREALIZED GAINS (LOSSES): | | | | |
Net realized gain (loss) on transactions from investments in non-affiliates | | | 2,221,660 | |
Change in net unrealized appreciation/depreciation on investments in non-affiliates | | | 29,100,838 | |
| | | | |
Net realized/unrealized gains (losses) | | | 31,322,498 | |
| | | | |
Change in net assets resulting from operations | | $ | 34,029,778 | |
| | | | |
SEE NOTES TO FINANCIAL STATEMENTS.
| | | | | | | | |
| | | |
| JUNE 30, 2017 | | JPMORGAN INSURANCE TRUST | | | | | 9 | |
STATEMENTS OF CHANGES IN NET ASSETS
FOR THE PERIODS INDICATED
| | | | | | | | |
| | | Mid Cap Value Portfolio | |
| | | Six Months Ended
June 30, 2017
(Unaudited) | | | Year Ended
December 31, 2016 | |
CHANGE IN NET ASSETS RESULTING FROM OPERATIONS: | |
Net investment income (loss) | | $ | 2,707,280 | | | $ | 4,455,044 | |
Net realized gain (loss) | | | 2,221,660 | | | | 26,016,242 | |
Change in net unrealized appreciation/depreciation | | | 29,100,838 | | | | 34,088,690 | |
| | | | | | | | |
Change in net assets resulting from operations | | | 34,029,778 | | | | 64,559,976 | |
| | | | | | | | |
| | |
DISTRIBUTIONS TO SHAREHOLDERS: | | | | | | | | |
From net investment income | | | (4,602,779 | ) | | | (3,917,647 | ) |
From net realized gains | | | (25,669,250 | ) | | | (23,451,558 | ) |
| | | | | | | | |
Total distributions to shareholders | | | (30,272,029 | ) | | | (27,369,205 | ) |
| | | | | | | | |
| | |
CAPITAL TRANSACTIONS: | | | | | | | | |
Change in net assets resulting from capital transactions | | | 30,027,679 | | | | 70,789,542 | |
| | | | | | | | |
| | |
NET ASSETS: | | | | | | | | |
Change in net assets | | | 33,785,428 | | | | 107,980,313 | |
Beginning of period | | | 544,169,517 | | | | 436,189,204 | |
| | | | | | | | |
End of period | | $ | 577,954,945 | | | $ | 544,169,517 | |
| | | | | | | | |
Accumulated undistributed net investment income | | $ | 2,428,861 | | | $ | 4,324,360 | |
| | | | | | | | |
| | |
CAPITAL TRANSACTIONS: | | | | | | | | |
Proceeds from shares issued | | $ | 57,639,745 | | | $ | 136,426,089 | |
Distributions reinvested | | | 30,272,029 | | | | 27,369,205 | |
Cost of shares redeemed | | | (57,884,095 | ) | | | (93,005,752 | ) |
| | | | | | | | |
Change in net assets resulting from capital transactions | | $ | 30,027,679 | | | $ | 70,789,542 | |
| | | | | | | | |
| | |
SHARE TRANSACTIONS: | | | | | | | | |
Issued | | | 5,132,630 | | | | 13,027,148 | |
Reinvested | | | 2,792,623 | | | | 2,734,186 | |
Redeemed | | | (5,138,940 | ) | | | (9,005,971 | ) |
| | | | | | | | |
Change in Shares | | | 2,786,313 | | | | 6,755,363 | |
| | | | | | | | |
SEE NOTES TO FINANCIAL STATEMENTS.
| | | | | | |
| | | |
| 10 | | | | JPMORGAN INSURANCE TRUST | | JUNE 30, 2017 |
THIS PAGE IS INTENTIONALLY LEFT BLANK
| | | | | | | | |
| | | |
| JUNE 30, 2017 | | JPMORGAN INSURANCE TRUST | | | | | 11 | |
FINANCIAL HIGHLIGHTS
FOR THE PERIODS INDICATED
| | | | | | | | | | | | | | | | | | | | | | | | | | | | |
| | | | | | Per share operating performance | |
| | | | | | Investment operations | | | Distributions | |
| | | Net asset value, beginning of period | | | Net investment income (loss) | | | Net realized and unrealized gains (losses) on investments | | | Total from investment operations | | | Net
investment
income | | | Net realized gain | | | Total distributions | |
Mid Cap Value Portfolio | |
Six Months Ended June 30, 2017 (Unaudited) | | $ | 10.98 | | | $ | 0.05 | (e) | | $ | 0.61 | | | $ | 0.66 | | | $ | (0.09 | ) | | $ | (0.51 | ) | | $ | (0.60 | ) |
Year Ended December 31, 2016 | | | 10.19 | | | | 0.10 | (e) | | | 1.33 | | | | 1.43 | | | | (0.09 | ) | | | (0.55 | ) | | | (0.64 | ) |
Year Ended December 31, 2015 | | | 11.41 | | | | 0.09 | (e) | | | (0.34 | ) | | | (0.25 | ) | | | (0.11 | ) | | | (0.86 | ) | | | (0.97 | ) |
Year Ended December 31, 2014 | | | 10.57 | | | | 0.11 | (f) | | | 1.41 | | | | 1.52 | | | | (0.09 | ) | | | (0.59 | ) | | | (0.68 | ) |
Year Ended December 31, 2013 | | | 8.17 | | | | 0.09 | | | | 2.51 | | | | 2.60 | | | | (0.10 | ) | | | (0.10 | ) | | | (0.20 | ) |
Year Ended December 31, 2012 | | | 6.86 | | | | 0.10 | | | | 1.29 | | | | 1.39 | | | | (0.08 | ) | | | — | | | | (0.08 | ) |
| (a) | Annualized for periods less than one year, unless otherwise noted. |
| (b) | Not annualized for periods less than one year. |
| (c) | Includes adjustments in accordance with accounting principles generally accepted in the United States of America and as such, the net asset values for financial reporting purposes and the returns based upon those net asset values may differ from the net asset values and returns for shareholder transactions. |
| (d) | Includes earnings credits and interest expense, if applicable, each of which is less than 0.005% unless otherwise noted. |
| (e) | Calculated based upon average shares outstanding. |
| (f) | Reflects special dividends paid out during the period by several of the Portfolio’s holdings. Had the Portfolio not received the special dividends, the net investment income (loss) per share would have been $0.08 and the net investment income (loss) ratio would have been 0.77%. |
SEE NOTES TO FINANCIAL STATEMENTS.
| | | | | | |
| | | |
| 12 | | | | JPMORGAN INSURANCE TRUST | | JUNE 30, 2017 |
| | | | | | | | | | | | | | | | | | | | | | | | | | |
| | | Ratios/Supplemental data | |
| | | | | | | | | | Ratios to average net assets (a) | | | | |
Net asset
value,
end of
period | | | Total
return (b)(c) | | | Net assets,
end of
period | | | Net
expenses (d) | | | Net
investment
income
(loss) | | |
Expenses
without waivers,
reimbursements and
earnings credits | | | Portfolio
turnover
rate (b) | |
| | | | | | | | | | | | | | | | | | | | | | | | | | |
| $ | 11.04 | | | | 6.17 | % | | $ | 577,954,945 | | | | 0.77 | % | | | 0.96 | % | | | 0.78 | % | | | 8 | % |
| | 10.98 | | | | 14.69 | | | | 544,169,517 | | | | 0.77 | | | | 0.95 | | | | 0.78 | | | | 28 | |
| | 10.19 | | | | (2.66 | ) | | | 436,189,204 | | | | 0.77 | | | | 0.87 | | | | 0.77 | | | | 17 | |
| | 11.41 | | | | 15.11 | | | | 466,265,863 | | | | 0.79 | | | | 1.03 | (f) | | | 0.79 | | | | 25 | |
| | 10.57 | | | | 32.30 | | | | 408,782,236 | | | | 0.77 | | | | 0.95 | | | | 0.78 | | | | 26 | |
| | 8.17 | | | | 20.38 | | | | 297,394,886 | | | | 0.78 | | | | 1.30 | | | | 0.79 | | | | 30 | |
SEE NOTES TO FINANCIAL STATEMENTS.
| | | | | | | | |
| | | |
| JUNE 30, 2017 | | JPMORGAN INSURANCE TRUST | | | | | 13 | |
NOTES TO FINANCIAL STATEMENTS
AS OF JUNE 30, 2017 (Unaudited)
1. Organization
JPMorgan Insurance Trust (the “Trust”) is registered under the Investment Company Act of 1940, as amended (the “1940 Act”), as an open-end management investment company and is a Massachusetts business trust.
The following is a separate Portfolio of the Trust (the “Portfolio”) covered by this report:
| | | | |
| | | Class Offered | | Diversified/Non-Diversified |
| Mid Cap Value Portfolio | | Class 1 | | Diversified |
The investment objective of the Portfolio is to seek capital appreciation with the secondary goal of achieving current income by investing primarily in equity securities.
Portfolio shares are offered only to separate accounts of participating insurance companies and Eligible Plans. Individuals may not purchase shares directly from the Portfolio.
Effective as of the close of business on May 1, 2013, the Portfolio is offered only on a limited basis. Investors are not eligible to purchase shares of the Portfolio unless they meet certain requirements as described in its prospectus.
J.P. Morgan Investment Management Inc. (“JPMIM”), an indirect, wholly-owned subsidiary of JPMorgan Chase & Co. (“JPMorgan”), acts as Adviser (the “Adviser”) and Administrator (the “Administrator”) to the Portfolio.
2. Significant Accounting Policies
The following is a summary of significant accounting policies followed by the Portfolio in the preparation of its financial statements. The Portfolio is an investment company and, accordingly, follows the investment company accounting and reporting guidance of the Financial Accounting Standards Board Accounting Standards Codification Topic 946 — Investment Companies, which is part of U.S. generally accepted accounting principles (“GAAP”). The preparation of financial statements in conformity with GAAP requires management to make estimates and assumptions that affect the reported amounts of assets and liabilities and disclosure of contingent assets and liabilities at the date of the financial statements and the reported amounts of increases and decreases in net assets from operations during the reporting period. Actual results could differ from those estimates.
A. Valuation of Investments — The valuation of investments is in accordance with GAAP and the Portfolio’s valuation policies set forth by and under the supervision and responsibility of the Board of Trustees (the “Board”), which established the following approach to valuation, as described more fully below: (i) investments for which market quotations are readily available shall be valued at such unadjusted quoted prices and (ii) all other investments for which market quotations are not readily available shall be valued at their fair value as determined in good faith by the Board.
The Administrator has established the J.P. Morgan Investment Management Americas Valuation Committee (“AVC”) to assist the Board with the oversight and monitoring of the valuation of the Portfolio’s investments. The Administrator implements the valuation policies of the Portfolio’s investments, as directed by the Board. The AVC oversees and carries out the policies for the valuation of investments held in the Portfolio. This includes monitoring the appropriateness of fair values based on results of ongoing valuation oversight, including but not limited to consideration of macro or security specific events, market events and pricing vendor and broker due diligence. The Administrator is responsible for discussing and assessing the potential impacts to the fair values on an ongoing basis, and at least on a quarterly basis with the AVC and the Board.
Equities and other exchange-traded instruments are valued at the last sale price or official market closing price on the primary exchange on which the instrument is traded before the net asset value (“NAV”) of the Portfolio is calculated on a valuation date. Investments in open-end investment companies (the “Underlying Funds”) are valued at each Underlying Fund’s NAV per share as of the report date.
Valuations reflected in this report are as of the report date. As a result, changes in valuation due to market events and/or issuer related events after the report date and prior to issuance of the report are not reflected herein.
The various inputs that are used in determining the valuation of the Portfolio’s investments are summarized into the three broad levels listed below.
| • | | Level 1 — Unadjusted inputs using quoted prices in active markets for identical investments. |
| • | | Level 2 — Other significant observable inputs including, but not limited to, quoted prices for similar investments, inputs other than quoted prices that are observable for investments (such as interest rates, prepayment speeds, credit risk, etc.) or other market corroborated inputs. |
| • | | Level 3 — Significant inputs based on the best information available in the circumstances, to the extent observable inputs are not available (including the Portfolio’s assumptions in determining the fair value of investments). |
A financial instrument’s level within the fair value hierarchy is based on the lowest level of any input, both individually and in the aggregate, that is significant to the fair value measurement. The inputs or methodology used for valuing instruments are not necessarily an indication of the risk associated with investing in those instruments.
| | | | | | |
| | | |
| 14 | | | | JPMORGAN INSURANCE TRUST | | JUNE 30, 2017 |
The following table represents each valuation input as presented on the Schedule of Portfolio Investments (“SOI”):
| | | | | | | | | | | | | | | | |
| | | Level 1
Quoted prices | | | Level 2
Other significant
observable inputs | | | Level 3
Significant
unobservable inputs | | | Total | |
Total Investments in Securities (a) | | $ | 577,734,693 | | | $ | — | | | $ | — | | | $ | 577,734,693 | |
| | | | | | | | | | | | | | | | |
| (a) | All portfolio holdings designated as level 1 are disclosed individually on the SOI. Please refer to the SOI for industry specifics of portfolio holdings. |
There were no transfers among any levels during the six months ended June 30, 2017.
B. Security Transactions and Investment Income — Investment transactions are accounted for on the trade date (the date the order to buy or sell is executed). Securities gains and losses are calculated on a specifically identified cost basis. Dividend income is recorded on the ex-dividend date or when the Portfolio first learns of the dividend.
To the extent such information is publicly available, the Portfolio records distributions received in excess of income earned from underlying investments as a reduction of cost of investments and/or realized gain. Such amounts are based on estimates if actual amounts are not available and actual amounts of income, realized gain and return of capital may differ from the estimated amounts. The Portfolio adjusts the estimated amounts of the components of distributions (and consequently its net investment income) as necessary once the issuers provide information about the actual composition of the distributions.
C. Allocation of Expenses — Expenses directly attributable to a portfolio are charged directly to that portfolio, while the expenses attributable to more than one portfolio of the Trust are allocated among the respective portfolios.
D. Federal Income Taxes — The Portfolio is treated as a separate taxable entity for Federal income tax purposes. The Portfolio’s policy is to comply with the provisions of the Internal Revenue Code of 1986, as amended (the “Code”), applicable to regulated investment companies and to distribute to shareholders all of its distributable net investment income and net realized capital gains on investments. Accordingly, no provision for Federal income tax is necessary. The Portfolio is also a segregated portfolio of assets for insurance purposes and intends to comply with the diversification requirements of Subchapter L of the Code. Management has reviewed the Portfolio’s tax positions for all open tax years and has determined that as of June 30, 2017, no liability for income tax is required in the Portfolio’s financial statements for net unrecognized tax benefits. However, management’s conclusions may be subject to future review based on changes in, or the interpretation of, the accounting standards or tax laws and regulations. The Portfolio’s Federal tax returns for the prior three fiscal years remain subject to examination by the Internal Revenue Service.
E. Distributions to Shareholders — Distributions from net investment income and net realized capital gains, if any, are generally declared and paid at least annually. The amount of distributions from net investment income and net realized capital gains is determined in accordance with Federal income tax regulations, which may differ from GAAP. To the extent these “book/tax” differences are permanent in nature (i.e., that they result from other than timing of recognition — “temporary differences”), such amounts are reclassified within the capital accounts based on their Federal tax-basis treatment.
3. Fees and Other Transactions with Affiliates
A. Investment Advisory Fee — Pursuant to an Investment Advisory Agreement, the Adviser supervises the investments of the Portfolio and for such services is paid a fee. The fee is accrued daily and paid monthly based on the Portfolio’s average daily net assets at an annual rate of 0.65%.
B. Administration Fee — Pursuant to an Administration Agreement, the Administrator provides certain administration services to the Portfolio. In consideration of these services, the Administrator receives a fee accrued daily and paid monthly at an annual rate of 0.15% of the first $25 billion of the average daily net assets of all funds in the J.P. Morgan Funds Complex covered by the Administration Agreement (excluding certain funds of funds and money market funds) and 0.075% of the average daily net assets in excess of $25 billion of all such funds. For the six months ended June 30, 2017, the effective annualized rate was 0.08% of the Portfolio’s average daily net assets, notwithstanding any fee waivers and/or expense reimbursements.
JPMorgan Chase Bank, N.A. (“JPMCB”), a wholly-owned subsidiary of JPMorgan, serves as the Portfolio’s sub-administrator (the “Sub-administrator”). For its services as Sub-administrator, JPMCB receives a portion of the fees payable to the Administrator.
C. Distribution Fees — Pursuant to a Distribution Agreement, JPMorgan Distribution Services, Inc. (“JPMDS”), a wholly-owned subsidiary of JPMorgan, serves as the Trust’s principal underwriter and promotes and arranges for the sale of the Portfolio’s shares.
D. Custodian and Accounting Fees — JPMCB provides portfolio custody and accounting services to the Portfolio. For performing these services, the Portfolio pays JPMCB transaction and asset-based fees that vary according to the number of transactions and positions, plus out-of-pocket expenses. The amounts paid directly to JPMCB by the Portfolio for custody and accounting services are included in Custodian and accounting fees on the Statement of Operations. Payments to the custodian may be reduced by credits earned by the Portfolio, based on uninvested cash balances held by the custodian. Such earnings credits, if any, are presented separately on the Statement of Operations.
Interest expense paid to the custodian related to cash overdrafts, if any, is included in Interest expense to affiliates on the Statement of Operations.
| | | | | | | | |
| | | |
| JUNE 30, 2017 | | JPMORGAN INSURANCE TRUST | | | | | 15 | |
NOTES TO FINANCIAL STATEMENTS
AS OF JUNE 30, 2017 (Unaudited) (continued)
E. Waivers and Reimbursements — The Adviser and/or Administrator have contractually agreed to waive fees and/or reimburse the Portfolio to the extent that total annual operating expenses of the Portfolio (excluding acquired fund fees and expenses, other than certain money market fund fees as described below, dividend and interest expenses related to short sales, interest, taxes, expenses related to litigation and potential litigation and extraordinary expenses) exceed 0.90% of the Portfolio’s average daily net assets.
The expense limitation agreement was in effect for the six months ended June 30, 2017 and is in place until at least April 30, 2018.
Additionally, the Portfolio may invest in one or more money market funds advised by the Adviser or its affiliates (affiliated money market funds). The Adviser and/or the Administrator have contractually agreed to waive fees and/or reimburse expenses in an amount sufficient to offset the respective net fees each collects from the affiliated money market fund on the Portfolio’s investment in such affiliated money market fund.
The amount of waivers resulting from investments in these money market funds for the six months ended June 30, 2017 was $21,631.
F. Other — Certain officers of the Trust are affiliated with the Adviser, the Administrator and JPMDS. Such officers, with the exception of the Chief Compliance Officer, receive no compensation from the Portfolio for serving in their respective roles.
The Board appointed a Chief Compliance Officer to the Portfolio in accordance with Federal securities regulations. The Portfolio, along with other affiliated portfolios, makes reimbursement payments, on a pro-rata basis, to the Administrator for a portion of the fees associated with the Office of the Chief Compliance Officer. Such fees are included in Trustees’ and Chief Compliance Officer’s fees on the Statement of Operations.
The Trust adopted a Trustee Deferred Compensation Plan (the “Plan”) which allows the Independent Trustees to defer the receipt of all or a portion of compensation related to performance of their duties as Trustees. The deferred fees are invested in various J.P. Morgan Funds until distribution in accordance with the Plan.
The Portfolio may use related party broker-dealers. For the six months ended June 30, 2017, the Portfolio did not incur any brokerage commissions with broker-dealers affiliated with the Adviser.
The Securities and Exchange Commission (“SEC”) has granted an exemptive order permitting the Portfolio to engage in principal transactions with J.P. Morgan Securities, Inc., an affiliated broker, involving taxable money market instruments, subject to certain conditions.
4. Investment Transactions
During the six months ended June 30, 2017, purchases and sales of investments (excluding short-term investments) were as follows:
| | | | | | | | |
| | | Purchases
(excluding U.S.
Government) | | | Sales
(excluding U.S.
Government) | |
| | $ | 53,054,310 | | | $ | 45,943,999 | |
During the six months ended June 30, 2017, there were no purchases or sales of U.S. Government securities.
5. Federal Income Tax Matters
For Federal income tax purposes, the estimated cost and unrealized appreciation (depreciation) in value of investment securities held at June 30, 2017, were as follows:
| | | | | | | | | | | | | | | | |
| | | Aggregate
Cost | | | Gross
Unrealized
Appreciation | | | Gross
Unrealized
Depreciation | | | Net Unrealized
Appreciation
(Depreciation) | |
| | $ | 387,159,997 | | | $ | 198,882,328 | | | $ | 8,307,632 | | | $ | 190,574,696 | |
Under the Regulated Investment Company Modernization Act of 2010 (the “Act”), net capital losses recognized by the Portfolio after December 31, 2010 are carried forward indefinitely, and retain their character as short-term and/or long-term losses. Prior to the Act, net capital losses incurred by the Portfolio were carried forward for eight years and treated as short-term losses. The Act requires that post-enactment net capital losses be used before pre-enactment net capital losses.
At December 31, 2016, the Portfolio did not have any post-enactment net capital loss carryforwards.
At December 31, 2016, the Portfolio had the following pre-enactment net capital loss carryforwards, expiring during the year indicated, which are available to offset future realized gains:
| * | This entire amount is comprised of capital loss carryforwards from business combinations, which may be limited in future years under the Internal Revenue Code Sections 381-384. |
During the year ended December 31, 2016, the Portfolio utilized pre-enactment capital loss carryforwards in the amount of $1,353,283.
| | | | | | |
| | | |
| 16 | | | | JPMORGAN INSURANCE TRUST | | JUNE 30, 2017 |
6. Borrowings
The Portfolio relies upon an exemptive order granted by the SEC (the “Order”) permitting the establishment and operation of an Interfund Lending Facility (the “Facility”). The Facility allows the Portfolio to directly lend and borrow money to or from any other fund relying upon the Order at rates beneficial to both the borrowing and lending funds. Advances under the Facility are taken primarily for temporary or emergency purposes, including the meeting of redemption requests that otherwise might require the untimely disposition of securities, and are subject to the Portfolio’s borrowing restrictions. The Interfund loan rate is determined, as specified in the Order, by averaging the current repurchase agreement rate and the current bank loan rate. The Order was granted to the Trust and may be relied upon by the Portfolio because the Portfolio and the series of the Trust are all investment companies in the same “group of investment companies” (as defined in Section 12(d)(1)(G) of the 1940 Act).
The Trust and JPMCB have entered into a financing arrangement. Under this arrangement, JPMCB provides an unsecured, uncommitted credit facility in the aggregate amount of $100 million to certain of the J.P. Morgan Funds, including the Portfolio. Advances under the arrangement are taken primarily for temporary or emergency purposes, including the meeting of redemption requests that otherwise might require the untimely disposition of securities, and are subject to the Portfolio’s borrowing restrictions. Interest on borrowings is payable at a rate determined by JPMCB at the time of borrowing. This agreement has been extended until November 6, 2017.
The Portfolio had no borrowings outstanding from the unsecured, uncommitted credit facility during the six months ended June 30, 2017.
In addition, effective August 16, 2016, the Trust along with certain other trusts (“Borrowers”) entered into a joint syndicated senior unsecured revolving credit facility totaling $1.5 billion (“Credit Facility”) with various lenders and The Bank of New York Mellon, as administrative agent for the lenders. This Credit Facility provides a source of funds to the Borrowers for temporary and emergency purposes, including the meeting of redemption requests that otherwise might require the untimely disposition of securities. Under the terms of the Credit Facility, a borrowing portfolio must have a minimum of $25,000,000 in adjusted net asset value and not exceed certain adjusted net asset coverage ratios prior to and during the time in which any borrowings are outstanding. If a portfolio does not comply with the aforementioned requirements, the portfolio must remediate within three business days with respect to the $25,000,000 minimum adjusted net asset value or within one business day with respect to certain asset coverage ratios or the administrative agent at the request of, or with the consent of, the lenders may terminate the Credit Facility and declare any outstanding borrowings to be due and payable immediately.
Interest associated with any borrowing under the Credit Facility is charged to the borrowing portfolio at a rate of interest equal to 1.00% plus the greater of the federal funds effective rate or one month LIBOR. The annual commitment fee to maintain the Credit Facility is 0.15% and is incurred on the unused portion of the Credit Facility and is allocated to all participating portfolios pro rata based on their respective net assets. Effective August 15, 2017, this agreement has been amended and restated for a term of 364 days, unless extended. The Portfolio did not utilize the Credit Facility during the six months ended June 30, 2017.
7. Risks, Concentrations and Indemnifications
In the normal course of business, the Portfolio enters into contracts that contain a variety of representations which provide general indemnifications. The Portfolio’s maximum exposure under these arrangements is unknown. The amount of exposure would depend on future claims that may be made against the Portfolio that have not yet occurred. However, based on experience, the Portfolio expects the risk of loss to be remote.
As of June 30, 2017, the Portfolio had two omnibus accounts which collectively owned 70.1% of the Portfolio’s outstanding shares. Significant shareholder transactions by these shareholders may impact the Portfolio’s performance.
8. Investment Company Reporting Modernization
In October 2016, the U.S. Securities and Exchange Commission adopted new rules and forms, and amendments to certain current rules and forms, to modernize the reporting and disclosure of information by registered investment companies. In part, the final rules amend Regulation S-X and will require standardized, enhanced disclosures about derivatives in investment company financial statements, as well as other amendments. The amendments to Regulation S-X will apply to Portfolios’ fiscal year ends on or after August 1, 2017. At this time, management is currently evaluating the impact of the Regulation S-X amendments on the Portfolio’s financial statements and related disclosures. The adoption will have no effect on the Portfolio’s net assets or result of operations.
| | | | | | | | |
| | | |
| JUNE 30, 2017 | | JPMORGAN INSURANCE TRUST | | | | | 17 | |
SCHEDULE OF SHAREHOLDER EXPENSES
(Unaudited)
Hypothetical $1,000 Investment
As a shareholder of the Portfolio, you incur ongoing costs, including investment advisory fees, administration fees and other Portfolio expenses. Because the Portfolio is a funding vehicle for Policies and Eligible Plans, you may also incur sales charges and other fees relating to the Policies or Eligible Plans. The examples below are intended to help you understand your ongoing costs (in dollars) of investing in the Portfolio, but not the costs of the Policies or Eligible Plans, and to compare these ongoing costs with the ongoing costs of investing in other mutual funds. The example assumes that you had a $1,000 investment in the Portfolio at the beginning of the reporting period, January 1, 2017, and continued to hold your shares at the end of the reporting period, June 30, 2017.
Actual Expenses
The first line provides information about actual account values and actual expenses. You may use the information in this line, together with the amount you invested, to estimate the expenses that you paid over the period. Simply divide your account value by $1,000 (for example, an $8,600 account value divided by $1,000 = 8.6), then multiply the result by the number in the first line under the heading entitled “Expenses Paid During the Period” to estimate the expenses you paid on your account during this period.
Hypothetical Example for Comparison Purposes
The second line in the table below provides information about hypothetical account values and hypothetical expenses based on the actual expense ratio and an assumed rate of return of 5% per year before expenses, which is not the Portfolio’s actual return. The hypothetical account values and expenses may not be used to estimate the actual ending account balance or expenses you paid for the period. You may use this information to compare the ongoing costs of investing in the Portfolio and other funds. To do so, compare this 5% hypothetical example with the 5% hypothetical examples that appear in the shareholder reports of the other funds. Please note that the expenses shown in the table are meant to highlight your ongoing costs only and do not reflect any transaction costs, such as sales charges (loads) or redemption fees or the costs associated with the Policies and Eligible Plans through which the Portfolio is held. Therefore, the second line in the table is useful in comparing ongoing costs only, and will not help you determine the relative total costs of owning different funds. In addition, if these transaction costs were included, your costs would have been higher. The examples also assume all dividends and distributions have been reinvested.
| | | | | | | | | | | | | | | | |
| | | Beginning
Account Value
January 1, 2017 | | | Ending
Account Value
June 30, 2017 | | | Expenses
Paid During
the Period* | | | Annualized
Expense
Ratio | |
Mid Cap Value Portfolio | | | | | | | | | | | | | | | | |
Class 1 | | | | | | | | | | | | | | | | |
Actual | | $ | 1,000.00 | | | $ | 1,061.70 | | | $ | 3.94 | | | | 0.77 | % |
Hypothetical | | | 1,000.00 | | | | 1,020.98 | | | | 3.86 | | | | 0.77 | |
| * | Expenses are equal to the Portfolio’s annualized expense ratio, multiplied by the average account value over the period, multiplied by 181/365 (to reflect the one-half year period). |
| | | | | | |
| | | |
| 18 | | | | JPMORGAN INSURANCE TRUST | | JUNE 30, 2017 |
J.P. Morgan Funds are distributed by JPMorgan Distribution Services, Inc., which is an affiliate of JPMorgan Chase & Co. Affiliates of JPMorgan Chase & Co. receive fees for providing various services to the funds.
Contact JPMorgan Distribution Services, Inc. at 1-800-480-4111 for a portfolio prospectus. You can also visit us at www.jpmorganfunds.com. Investors should carefully consider the investment objectives and risk as well as charges and expenses of the mutual fund before investing. The prospectus contains this and other information about the mutual fund. Read the prospectus carefully before investing.
The Portfolio files a complete schedule of its portfolio holdings for the first and third quarters of its fiscal year with the SEC on Form N-Q. The Portfolio’s Forms N-Q are available on the SEC’s website at http://www.sec.gov and may be reviewed and copied at the SEC’s Public Reference Room in Washington, DC. Information on the operation of the SEC’s Public Reference Room may be obtained by calling 1-800-SEC-0330. Shareholders may request the Form N-Q without charge by calling 1-800-480-4111 or by visiting the variable insurance portfolio section of the J.P. Morgan Funds’ website at www.jpmorganfunds.com.
A description of the Portfolio’s policies and procedures with respect to the disclosure of the Portfolio’s holdings is available in the prospectus and Statement of Additional Information.
A copy of proxy policies and procedures is available without charge upon request by calling 1-800-480-4111 and on the Portfolio’s website at www.jpmorganfunds.com. A description of such policies and procedures is on the SEC’s website at www.sec.gov. The Trustees have delegated the authority to vote proxies for securities owned by the Portfolio to the Adviser. A copy of the Portfolio’s voting record for the most recent 12-month period ended June 30 is available on the SEC’s website at www.sec.gov or at the Portfolio’s website at www.jpmorganfunds.com no later than August 31 of each year. The Portfolio’s proxy voting record will include, among other things, a brief description of the matter voted on for each portfolio security, and will state how each vote was cast, for example, for or against the proposal.

J.P. Morgan Asset Management is the marketing name for the asset management businesses of JPMorgan Chase & Co. Those businesses include, but are not limited to, J.P. Morgan Investment Management Inc., Security Capital Research & Management Incorporated and J.P. Morgan Alternative Asset Management, Inc.
| | | | |
| | © JPMorgan Chase & Co., 2017. All rights reserved. June 2017. | | SAN-JPMITMCVP-617 |
Semi-Annual Report
JPMorgan Insurance Trust
June 30, 2017 (Unaudited)
JPMorgan Insurance Trust Small Cap Core Portfolio
| | | | |
NOT FDIC INSURED • NO BANK GUARANTEE • MAY LOSE VALUE
| | |  | |
CONTENTS
Investments in the Portfolio are not deposits or obligations of, or guaranteed or endorsed by, any bank and are not insured or guaranteed by the FDIC, the Federal Reserve Board or any other government agency. You could lose money if you sell when the Portfolio’s share price is lower than when you invested.
Past performance is no guarantee of future performance. The general market views expressed in this report are opinions based on market and other conditions through the end of the reporting period and are subject to change without notice. These views are not intended to predict the future performance of the Portfolio or the securities markets. References to specific securities and their issuers are for illustrative purposes only and are not intended to be, and should not be interpreted as, recommendations to purchase or sell such securities. Such views are not meant as investment advice and may not be relied on as an indication of trading intent on behalf of the Portfolio.
This Portfolio is intended to be a funding vehicle for variable annuity contracts and variable life insurance policies (collectively “Policies”) offered by the separate accounts of various insurance companies. Portfolio shares may also be offered to qualified pension and retirement plans and accounts permitting accumulation of assets on a tax-deferred basis (“Eligible Plans”). Individuals may not purchase shares directly from the Portfolio.
Prospective investors should refer to the Portfolio’s prospectus for a discussion of the Portfolio’s investment objective, strategies and risks. Call J.P. Morgan Funds Service Center at 1-800-480-4111 for a prospectus containing more complete information about the Portfolio, including management fees and other expenses. Please read it carefully before investing.
CEO’S LETTER
August 4, 2017 (Unaudited)
Dear Shareholder,
As the U.S. economic expansion entered its eighth year in 2017, growth in both developed and emerging market economies became increasingly synchronized even as U.S. growth cooled in the early part of the year. Amid an environment of economic growth, low inflation and rising corporate earnings, global financial markets overall produced positive returns.
| | |
 | | “In the U.S., the continued economic expansion, muted inflation, corporate earnings growth and historically low volatility in financial markets helped to drive key equity market indexes to multiple record closing highs throughout the first half of 2017.” — George C.W. Gatch |
While U.S. gross domestic product (GDP) growth slowed to 1.2% in the first quarter of 2017, it rebounded to 2.6% growth in the second quarter of 2017 on the back of a surge in consumer spending. Meanwhile, the U.S. jobless rate continued to shrink and fell to 4.4% in June 2017 from 4.8% six months earlier. In response to these numbers, along with nascent signs of price inflation, the U.S. Federal Reserve (the “Fed”) raised interest rates in June 2017 and signaled it would raise rates once more before the end of the year. Fed Chairwoman Janet Yellen also indicated she was prepared to begin partially unwinding the central bank’s $4.5 trillion balance sheet of assets purchased through its quantitative easing program.
Despite the apparent health of the U.S. economy, by mid-2017 domestic price inflation was below the Fed’s target of 2% growth and wage growth remained below economists’ expectations, the latter despite an environment of essentially full employment for U.S. workers. These trends — and the Fed’s acknowledgment of them — provided some near-term uncertainty about the central bank’s commitment to tightening monetary policy.
Throughout the first half of 2017, global energy prices continued to fall amid an oversupply of crude oil and natural gas. Despite efforts by the Organization of Petroleum Exporting
Countries to curb global production, the price of a barrel of benchmark West Texas Intermediate crude oil dropped to $46 by the end of June 2017.
Meanwhile, the leading economies of the European Union (the “EU”) continued to strengthen. Annualized GDP for the 19 core EU nations rose 1.9% in the first quarter of 2017 and 2.1% in the second quarter. The June 2017 aggregate unemployment rate for those nations fell to 9.1%, the lowest level since March 2009. Also, in separate elections, voters in the Netherlands and France largely rejected populist campaigns espousing policies to limit free trade and immigration. The election results provided another boost to global equity prices.
In the U.S., the continued economic expansion, muted inflation, corporate earnings growth and historically low volatility in financial markets helped to drive key equity market indexes to multiple record closing highs throughout the first half of 2017. U.S. investors appeared to shrug off intermittent political and policy dramas emanating from Washington, D.C. and extended the run-up in U.S. equity prices into its eighth consecutive year — one of the longest on record. For the six months ended June 30, 2017, the Standard & Poor’s 500 Index returned 9.34%.
U.S. and foreign financial markets largely rewarded those investors who remained fully invested throughout the first half of 2017, reaffirming the fundamental virtues of patience and diversification within a prudent investment strategy.
We look forward to managing your investment needs for years to come. Should you have any questions, please visit www.jpmorganfunds.com or contact the J.P. Morgan Funds Service Center at 1-800-480-4111.
Sincerely yours,

George C.W. Gatch
CEO, Global Funds Management & Institutional,
J.P. Morgan Asset Management
| | | | | | | | |
| | | |
| JUNE 30, 2017 | | JPMORGAN INSURANCE TRUST | | | | | 1 | |
JPMorgan Insurance Trust Small Cap Core Portfolio
PORTFOLIO COMMENTARY
SIX MONTHS ENDED JUNE 30, 2017 (Unaudited)
| | | | |
| REPORTING PERIOD RETURN: | |
| Portfolio (Class 1 Shares)* | | | 4.80% | |
| Russell 2000 Index | | | 4.99% | |
| |
| Net Assets as of 6/30/2017 | | $ | 18,524,635 | |
INVESTMENT OBJECTIVE**
The JPMorgan Insurance Trust Small Cap Core Portfolio (the “Portfolio”) seeks capital growth over the long term.
HOW DID THE MARKET PERFORM?
While U.S. equity markets continued to provide positive returns for the past six months, the magnitude of those gains slowed somewhat as key stock market indexes touched multiple closing highs and largely held near record territory. Steady global economic growth, continued low inflation and strong corporate earnings all served to support equity prices, both in the U.S. and elsewhere. Globally, emerging market equities generally outperformed the U.S. and other developed market equities during the reporting period.
Amid investor expectations that the incoming Trump administration and Republican Party majorities in the U.S. Congress would move quickly on infrastructure spending and tax policy, U.S. equities began 2017 with positive returns amid low volatility. Even as those investor expectations began to fade, U.S. equity prices continued to climb.
In February 2017, the Standard & Poor’s 500 Index (the “S&P 500”) reached nine new closing highs and the Dow Jones Industrial Average (the “DJIA”) closed at new highs for 12 consecutive days, matching a record set in 1987. The following month, the S&P 500 crossed 2,400 points in intraday trading for the first time and the DJIA crossed 21,000 points for the first time. While the rally in U.S. equities paused in April 2017, record high U.S. corporate operating earnings rekindled the rise in stock prices and the S&P 500 posted seven new closing highs in May 2017 and four new closing highs in June 2017.
Importantly, U.S. financial market volatility remained near 10-year lows throughout the reporting period. By the end of June 2017, the CBOE Volatility Index averaged 10.5 points, which was about half of its historical average. Overall, large cap stocks generally outperformed mid cap and small cap stocks, while growth stocks generally outperformed value stocks. For the six months ended June 30, 2017, the S&P 500 returned 9.34% and the Russell 2000 Index returned 4.99%.
WHAT WERE THE MAIN DRIVERS OF THE PORTFOLIO’S PERFORMANCE?
The Portfolio’s Class 1 Shares underperformed the Russell 2000 Index (the “Benchmark”) for the six months ended June 30, 2017. The Portfolio’s security selection in the consumer cyclical
and basic materials sectors was a leading detractor from performance relative to the Benchmark, while the Portfolio’s security selection in the semiconductors and systems hardware sectors was a leading contributor to relative performance.
Leading individual detractors from relative performance included the Fund’s overweight positions in ArcBest Corp., Cross Country Healthcare Inc. and SpartanNash Co. Shares of ArcBest, a trucking and logistics company, fell after the company reported a wider-than-expected loss and lower-than-expected revenue. Shares of Cross Country Healthcare, a provider of personnel services, fell on lower-than-expected earnings and revenue. Shares of SpartanNash, a distributor of groceries to military commissaries in the U.S., fell amid investor expectations of increased price competition.
Leading individual contributors to relative performance included the Portfolio’s overweight positions in Extreme Networks Inc., OraSure Technologies Inc. and Ultra Clean Holdings Inc. Shares of Extreme Networks, a provider of information network equipment and services, rose after the company offered to acquire Avaya Inc. Shares of OraSure Technologies, a maker of medical diagnostic and specimen collection products, rose after the company won a contract to supply diagnostic kits to the Bill and Melinda Gates Foundation. Shares of Ultra Clean Holdings, a maker of semiconductor manufacturing equipment, rose on better-than-expected earnings.
HOW WAS THE PORTFOLIO POSITIONED?
In accordance with its investment process, the portfolio managers take limited sector bets and construct the Portfolio so that stock selection is typically the primary driver of its relative performance versus the Benchmark. The portfolio managers employ a bottom-up approach to stock selection, using quantitative screening and proprietary analysis to construct a portfolio of companies that they believe are attractively valued and possess strong fundamentals. During the reporting period, the Portfolio was managed and positioned in accordance with this investment process.
| | | | | | |
| | | |
| 2 | | | | JPMORGAN INSURANCE TRUST | | JUNE 30, 2017 |
| | | | | | | | |
| TOP TEN EQUITY HOLDINGS OF THE PORTFOLIO*** | |
| | 1. | | | Trinseo SA | | | 1.1 | % |
| | 2. | | | Office Depot, Inc. | | | 1.1 | |
| | 3. | | | GEO Group, Inc. (The) | | | 1.1 | |
| | 4. | | | Masimo Corp. | | | 1.1 | |
| | 5. | | | Sanmina Corp. | | | 1.1 | |
| | 6. | | | Taylor Morrison Home Corp., Class A | | | 1.0 | |
| | 7. | | | Integer Holdings Corp. | | | 1.0 | |
| | 8. | | | East West Bancorp, Inc. | | | 1.0 | |
| | 9. | | | Extreme Networks, Inc. | | | 1.0 | |
| | 10. | | | Bloomin’ Brands, Inc. | | | 1.0 | |
| | | | |
PORTFOLIO COMPOSITION BY SECTOR*** | |
| Industrials | | | 18.6 | % |
| Financials | | | 17.9 | |
| Information Technology | | | 15.8 | |
| Health Care | | | 14.5 | |
| Consumer Discretionary | | | 9.5 | |
| Real Estate | | | 6.8 | |
| Materials | | | 4.4 | |
| Utilities | | | 3.2 | |
| Energy | | | 3.0 | |
| Consumer Staples | | | 2.1 | |
| Telecommunication Services | | | 0.1 | |
| Short-Term Investment | | | 4.1 | |
| * | | The return shown is based on net asset values calculated for shareholder transactions and may differ from the return shown in the financial highlights, which reflects adjustments made to the net asset values in accordance with accounting principles generally accepted in the United States of America. |
| ** | | The adviser seeks to achieve the Portfolio’s objective. There can be no guarantee it will be achieved. |
| *** | | Percentages indicated are based on total investments as of June 30, 2017. The Portfolio’s composition is subject to change. |
| | | | | | | | |
| | | |
| JUNE 30, 2017 | | JPMORGAN INSURANCE TRUST | | | | | 3 | |
JPMorgan Insurance Trust Small Cap Core Portfolio
PORTFOLIO COMMENTARY
SIX MONTHS ENDED JUNE 30, 2017 (Unaudited) (continued)
| | | | | | | | | | | | | | | | | | |
AVERAGE ANNUAL TOTAL RETURNS AS OF JUNE 30, 2017 | |
| | | | | |
| | | INCEPTION DATE OF
CLASS | | 6 MONTH* | | | 1 YEAR | | | 5 YEAR | | | 10 YEAR | |
CLASS 1 SHARES | | January 3, 1995 | | | 4.80 | % | | | 26.58 | % | | | 15.50 | % | | | 7.02 | % |
CLASS 2 SHARES | | April 24, 2009 | | | 4.71 | | | | 26.28 | | | | 15.20 | | | | 6.80 | |
TEN YEAR PERFORMANCE (6/30/07 TO 6/30/17)
The performance quoted is past performance and is not a guarantee of future results. Mutual funds are subject to certain market risks. Investment returns and principal value of an investment will fluctuate so that an investor’s shares, when redeemed, may be worth more or less than their original cost. Current performance may be higher or lower than the performance data shown. For up-to-date month-end performance information please call 1-800-480-4111.
Inception date for Class 1 Shares is January 3, 1995, which is the inception date of JPMorgan Small Company Portfolio (“Predecessor Portfolio”). The JPMorgan Insurance Trust Small Cap Core Portfolio acquired all of the assets and liabilities of the Predecessor Portfolio in a reorganization on April 24, 2009. The Predecessor Portfolio’s performance and financial history have been adopted by JPMorgan Insurance Trust Small Cap Core Portfolio and have been used since the reorganization. As a result the performance for Class 1 Shares prior to April 25, 2009, is the performance of the Predecessor Portfolio.
Returns for Class 2 Shares prior to April 25, 2009 are based on the performance of Class 1 Shares. The actual returns of Class 2 Shares would have been lower than those shown because Class 2 Shares have higher expenses than Class 1 Shares and the Predecessor Portfolio.
The graph illustrates comparative performance for $10,000 invested in Class 1 Shares of the JPMorgan Insurance Trust Small Cap Core Portfolio, the Russell 2000 Index and the Lipper Variable Underlying Funds Small-Cap Core Funds Index from June 30, 2007 to June 30, 2017. The performance of the Portfolio
assumes reinvestment of all dividends and capital gain distributions, if any. The performance of the Russell 2000 Index does not reflect the deduction of expenses associated with a mutual fund and has been adjusted to reflect reinvestment of all dividends and capital gain distributions of the securities included in the benchmark, if applicable. The performance of the Lipper Variable Underlying Funds Small-Cap Core Funds Index includes expenses associated with a mutual fund, such as investment management fees. These expenses are not identical to the expenses incurred by the Portfolio. The Russell 2000 Index is an unmanaged index which measures the performance of the 2000 smallest stocks (on the basis of capitalization) in the Russell 3000 Index. The Lipper Variable Underlying Funds Small-Cap Core Funds Index is an index based on the total returns of certain mutual funds within the Portfolio’s designated category as determined by Lipper, Inc. Investors cannot invest directly in an index.
Portfolio performance does not reflect any charges imposed by the Policies or Eligible Plans. If these charges were included, the returns would be lower than shown. Portfolio performance may reflect the waiver of the Portfolio’s fees and reimbursement of expenses for certain periods since the inception date. Without these waivers and reimbursements, performance would have been lower.
The returns shown are based on net asset values calculated for shareholder transactions and may differ from the returns shown in the financial highlights, which reflect adjustments made to the net asset values in accordance with accounting principles generally accepted in the United States of America.
| | | | | | |
| | | |
| 4 | | | | JPMORGAN INSURANCE TRUST | | JUNE 30, 2017 |
JPMorgan Insurance Trust Small Cap Core Portfolio
SCHEDULE OF PORTFOLIO INVESTMENTS
AS OF JUNE 30, 2017 (Unaudited)
| | | | | | | | |
| SHARES | | | SECURITY DESCRIPTION | | VALUE($) | |
| | Common Stocks — 95.7% | |
| | | | Consumer Discretionary — 9.5% | |
| | | | Auto Components — 1.4% | |
| | 49,900 | | | American Axle & Manufacturing Holdings, Inc. (a) | | | 778,440 | |
| | 14,700 | | | Cooper-Standard Holdings, Inc. (a) | | | 1,482,789 | |
| | 7,700 | | | Dana, Inc. | | | 171,941 | |
| | 1,700 | | | Stoneridge, Inc. (a) | | | 26,197 | |
| | 4,400 | | | Tower International, Inc. | | | 98,780 | |
| | | | | | | | |
| | | | | | | 2,558,147 | |
| | | | | | | | |
| | | | Diversified Consumer Services — 0.3% | |
| | 1,500 | | | Capella Education Co. | | | 128,400 | |
| | 1,900 | | | Grand Canyon Education, Inc. (a) | | | 148,979 | |
| | 18,200 | | | K12, Inc. (a) | | | 326,144 | |
| | | | | | | | |
| | | | | | | 603,523 | |
| | | | | | | | |
| | | | Hotels, Restaurants & Leisure — 1.7% | |
| | 82,500 | | | Bloomin’ Brands, Inc. | | | 1,751,475 | |
| | 6,300 | | | DineEquity, Inc. | | | 277,515 | |
| | 400 | | | Jack in the Box, Inc. | | | 39,400 | |
| | 28,300 | | | Pinnacle Entertainment, Inc. (a) | | | 559,208 | |
| | 17,400 | | | Ruth’s Hospitality Group, Inc. | | | 378,450 | |
| | | | | | | | |
| | | | | | | 3,006,048 | |
| | | | | | | | |
| | | | Household Durables — 2.2% | |
| | 12,000 | | | Helen of Troy Ltd. (a) | | | 1,129,200 | |
| | 7,600 | | | Hooker Furniture Corp. | | | 312,740 | |
| | 4,800 | | | KB Home | | | 115,056 | |
| | 17,300 | | | Libbey, Inc. | | | 139,438 | |
| | 15,800 | | | Lifetime Brands, Inc. | | | 286,770 | |
| | 1,600 | | | NACCO Industries, Inc., Class A | | | 113,360 | |
| | 78,300 | | | Taylor Morrison Home Corp., Class A (a) | | | 1,879,983 | |
| | | | | | | | |
| | | | | | | 3,976,547 | |
| | | | | | | | |
| | | | Internet & Direct Marketing Retail — 0.1% | |
| | 10,500 | | | Liberty TripAdvisor Holdings, Inc., Class A (a) | | | 121,800 | |
| | | | | | | | |
| | | | Media — 1.0% | |
| | 51,800 | | | Gannett Co., Inc. | | | 451,696 | |
| | 32,500 | | | Gray Television, Inc. (a) | | | 445,250 | |
| | 2,700 | | | Nexstar Media Group, Inc., Class A | | | 161,460 | |
| | 19,500 | | | Sinclair Broadcast Group, Inc., Class A | | | 641,550 | |
| | 9,900 | | | Townsquare Media, Inc., Class A (a) | | | 101,376 | |
| | | | | | | | |
| | | | | | | 1,801,332 | |
| | | | | | | | |
| | | | Specialty Retail — 2.7% | |
| | 23,600 | | | Caleres, Inc. | | | 655,608 | |
| | 13,600 | | | Children’s Place, Inc. (The) | | | 1,388,560 | |
| | 15,800 | | | Express, Inc. (a) | | | 106,650 | |
| | 3,600 | | | Floor & Decor Holdings, Inc., Class A (a) | | | 141,336 | |
| | | | | | | | |
| SHARES | | | SECURITY DESCRIPTION | | VALUE($) | |
| | | | | | | | |
| | | | Specialty Retai — continued | |
| | 3,500 | | | Group 1 Automotive, Inc. | | | 221,620 | |
| | 356,345 | | | Office Depot, Inc. | | | 2,009,786 | |
| | 67,200 | | | Pier 1 Imports, Inc. | | | 348,768 | |
| | 1,700 | | | Tailored Brands, Inc. | | | 18,972 | |
| | | | | | | | |
| | | | | | | 4,891,300 | |
| | | | | | | | |
| | | | Textiles, Apparel & Luxury Goods — 0.1% | |
| | 7,900 | | | Perry Ellis International, Inc. (a) | | | 153,734 | |
| | | | | | | | |
| | | | Total Consumer Discretionary | | | 17,112,431 | |
| | | | | | | | |
| | | | Consumer Staples — 2.1% | |
| | | | Food & Staples Retailing — 0.7% | |
| | 35,780 | | | SpartanNash Co. | | | 928,849 | |
| | 33,100 | | | SUPERVALU, Inc. (a) | | | 108,899 | |
| | 9,300 | | | US Foods Holding Corp. (a) | | | 253,146 | |
| | | | | | | | |
| | | | | | | 1,290,894 | |
| | | | | | | | |
| | | | Food Products — 1.0% | |
| | 29,700 | | | Dean Foods Co. | | | 504,900 | |
| | 23,900 | | | Pilgrim’s Pride Corp. (a) | | | 523,888 | |
| | 3,300 | | | Pinnacle Foods, Inc. | | | 196,020 | |
| | 2,800 | | | Sanderson Farms, Inc. | | | 323,820 | |
| | 2,000 | | | TreeHouse Foods, Inc. (a) | | | 163,380 | |
| | | | | | | | |
| | | | | | | 1,712,008 | |
| | | | | | | | |
| | | | Household Products — 0.3% | |
| | 20,800 | | | Central Garden & Pet Co., Class A (a) | | | 624,416 | |
| | | | | | | | |
| | | | Personal Products — 0.1% | |
| | 1,400 | | | USANA Health Sciences, Inc. (a) | | | 89,740 | |
| | | | | | | | |
| | | | Total Consumer Staples | | | 3,717,058 | |
| | | | | | | | |
| | | | Energy — 3.0% | |
| | | | Energy Equipment & Services — 1.0% | |
| | 26,800 | | | Archrock, Inc. | | | 305,520 | |
| | 21,900 | | | Exterran Corp. (a) | | | 584,730 | |
| | 64,400 | | | McDermott International, Inc. (a) | | | 461,748 | |
| | 5,600 | | | PHI, Inc. (Non-Voting) (a) | | | 54,656 | |
| | 30,700 | | | RigNet, Inc. (a) | | | 492,735 | |
| | | | | | | | |
| | | | | | | 1,899,389 | |
| | | | | | | | |
| | | | Oil, Gas & Consumable Fuels — 2.0% | |
| | 178,000 | | | Abraxas Petroleum Corp. (a) | | | 288,360 | |
| | 1,100 | | | Arch Coal, Inc., Class A | | | 75,130 | |
| | 47,600 | | | Delek US Holdings, Inc. | | | 1,258,544 | |
| | 96,200 | | | Denbury Resources, Inc. (a) | | | 147,186 | |
| | 60,900 | | | EP Energy Corp., Class A (a) | | | 222,894 | |
| | 6,900 | | | Green Plains, Inc. | | | 141,795 | |
| | 16,500 | | | Jagged Peak Energy, Inc. (a) | | | 220,275 | |
SEE NOTES TO FINANCIAL STATEMENTS.
| | | | | | | | |
| | | |
| JUNE 30, 2017 | | JPMORGAN INSURANCE TRUST | | | | | 5 | |
JPMorgan Insurance Trust Small Cap Core Portfolio
SCHEDULE OF PORTFOLIO INVESTMENTS
AS OF JUNE 30, 2017 (Unaudited) (continued)
| | | | | | | | |
| SHARES | | | SECURITY DESCRIPTION | | VALUE($) | |
| | Common Stocks — continued | |
| | | | Oil, Gas & Consumable Fuels — continued | |
| | 24,200 | | | Pacific Ethanol, Inc. (a) | | | 151,250 | |
| | 28,000 | | | Renewable Energy Group, Inc. (a) | | | 362,600 | |
| | 500 | | | REX American Resources Corp. (a) | | | 48,280 | |
| | 33,100 | | | SRC Energy, Inc. (a) | | | 222,763 | |
| | 160,100 | | | W&T Offshore, Inc. (a) | | | 313,796 | |
| | 2,300 | | | Westmoreland Coal Co. (a) | | | 11,201 | |
| | 2,500 | | | World Fuel Services Corp. | | | 96,125 | |
| | | | | | | | |
| | | | | | | 3,560,199 | |
| | | | | | | | |
| | | | Total Energy | | | 5,459,588 | |
| | | | | | | | |
| | | | Financials — 17.7% | |
| | | | Banks — 10.4% | |
| | 3,700 | | | Cadence BanCorp (a) | | | 80,956 | |
| | 6,800 | | | Cathay General Bancorp | | | 258,060 | |
| | 2,400 | | | Central Valley Community Bancorp | | | 53,184 | |
| | 1,464 | | | Community Trust Bancorp, Inc. | | | 64,050 | |
| | 2,800 | | | CU Bancorp (a) | | | 101,220 | |
| | 3,280 | | | Customers Bancorp, Inc. (a) | | | 92,758 | |
| | 30,255 | | | East West Bancorp, Inc. | | | 1,772,338 | |
| | 1,500 | | | Enterprise Financial Services Corp. | | | 61,200 | |
| | 12,144 | | | Fidelity Southern Corp. | | | 277,612 | |
| | 15,900 | | | Financial Institutions, Inc. | | | 473,820 | |
| | 139,100 | | | First BanCorp, (Puerto Rico) (a) | | | 805,389 | |
| | 4,200 | | | First Business Financial Services, Inc. | | | 96,936 | |
| | 4,900 | | | First Community Bancshares, Inc. | | | 134,015 | |
| | 4,300 | | | First Financial Bancorp | | | 119,110 | |
| | 11,000 | | | First Foundation, Inc. (a) | | | 180,730 | |
| | 6,500 | | | First Hawaiian, Inc. | | | 199,030 | |
| | 34,900 | | | First Merchants Corp. | | | 1,400,886 | |
| | 43,600 | | | Fulton Financial Corp. | | | 828,400 | |
| | 32,700 | | | Hancock Holding Co. | | | 1,602,300 | |
| | 28,725 | | | Hanmi Financial Corp. | | | 817,226 | |
| | 13,300 | | | Heritage Financial Corp. | | | 352,450 | |
| | 11,700 | | | Hilltop Holdings, Inc. | | | 306,657 | |
| | 51,592 | | | Hope Bancorp, Inc. | | | 962,191 | |
| | 1,900 | | | Howard Bancorp, Inc. (a) | | | 36,575 | |
| | 5,175 | | | IBERIABANK Corp. | | | 421,762 | |
| | 3,600 | | | MainSource Financial Group, Inc. | | | 120,636 | |
| | 2,571 | | | NBT Bancorp, Inc. | | | 94,998 | |
| | 3,400 | | | Northeast Bancorp | | | 69,190 | |
| | 2,200 | | | Pacific Mercantile Bancorp (a) | | | 19,360 | |
| | 21,200 | | | PacWest Bancorp | | | 990,040 | |
| | 40,900 | | | Popular, Inc., (Puerto Rico) | | | 1,705,939 | |
| | 9,000 | | | Preferred Bank | | | 481,230 | |
| | 1,760 | | | Premier Financial Bancorp, Inc. | | | 36,274 | |
| | 5,100 | | | Shore Bancshares, Inc. | | | 83,895 | |
| | | | | | | | |
| SHARES | | | SECURITY DESCRIPTION | | VALUE($) | |
| | | | | | | | |
| | | | Banks — continued | |
| | 2,350 | | | Sierra Bancorp | | | 57,693 | |
| | 3,500 | | | Southern National Bancorp of Virginia, Inc. | | | 61,600 | |
| | 1,700 | | | Stonegate Bank | | | 78,506 | |
| | 1,400 | | | SVB Financial Group (a) | | | 246,106 | |
| | 89,300 | | | TCF Financial Corp. | | | 1,423,442 | |
| | 1,777 | | | Towne Bank | | | 54,732 | |
| | 13,200 | | | TriCo Bancshares | | | 463,980 | |
| | 12,800 | | | TriState Capital Holdings, Inc. (a) | | | 322,560 | |
| | 5,200 | | | Triumph Bancorp, Inc. (a) | | | 127,660 | |
| | 17,900 | | | Zions Bancorp | | | 785,989 | |
| | | | | | | | |
| | | | | | | 18,722,685 | |
| | | | | | | | |
| | | | Capital Markets — 1.4% | |
| | 71,400 | | | BGC Partners, Inc., Class A | | | 902,496 | |
| | 2,600 | | | Evercore Partners, Inc., Class A | | | 183,300 | |
| | 14,300 | | | Houlihan Lokey, Inc. | | | 499,070 | |
| | 12,300 | | | INTL. FCStone, Inc. (a) | | | 464,448 | |
| | 22,700 | | | OM Asset Management plc | | | 337,322 | |
| | 2,500 | | | Piper Jaffray Cos. | | | 149,875 | |
| | 1,300 | | | Stifel Financial Corp. (a) | | | 59,774 | |
| | | | | | | | |
| | | | | | | 2,596,285 | |
| | | | | | | | |
| | | | Consumer Finance — 1.4% | |
| | 29,620 | | | FirstCash, Inc. | | | 1,726,846 | |
| | 19,900 | | | Green Dot Corp., Class A (a) | | | 766,747 | |
| | | | | | | | |
| | | | | | | 2,493,593 | |
| | | | | | | | |
| | | | Diversified Financial Services — 0.1% | |
| | 10,200 | | | FNFV Group (a) | | | 161,160 | |
| | 2,300 | | | Marlin Business Services Corp. | | | 57,845 | |
| | | | | | | | |
| | | | | | | 219,005 | |
| | | | | | | | |
| | | | Insurance — 2.8% | |
| | 42,100 | | | American Equity Investment Life Holding Co. | | | 1,106,388 | |
| | 6,425 | | | Aspen Insurance Holdings Ltd., (Bermuda) | | | 320,286 | |
| | 53,100 | | | CNO Financial Group, Inc. | | | 1,108,728 | |
| | 9,700 | | | First American Financial Corp. | | | 433,493 | |
| | 5,300 | | | HCI Group, Inc. | | | 248,994 | |
| | 12,600 | | | Kinsale Capital Group, Inc. | | | 470,106 | |
| | 4,300 | | | Maiden Holdings Ltd. | | | 47,730 | |
| | 3,000 | | | National General Holdings Corp. | | | 63,300 | |
| | 3,100 | | | Selective Insurance Group, Inc. | | | 155,155 | |
| | 13,600 | | | Stewart Information Services Corp. | | | 617,168 | |
| | 3,500 | | | United Fire Group, Inc. | | | 154,210 | |
| | 12,500 | | | Universal Insurance Holdings, Inc. | | | 315,000 | |
| | | | | | | | |
| | | | | | | 5,040,558 | |
| | | | | | | | |
SEE NOTES TO FINANCIAL STATEMENTS.
| | | | | | |
| | | |
| 6 | | | | JPMORGAN INSURANCE TRUST | | JUNE 30, 2017 |
| | | | | | | | |
| SHARES | | | SECURITY DESCRIPTION | | VALUE($) | |
| | Common Stocks — continued | |
| | | | Mortgage Real Estate Investment Trusts (REITs) — 0.6% | |
| | 7,800 | | | Capstead Mortgage Corp. | | | 81,354 | |
| | 4,300 | | | Invesco Mortgage Capital, Inc. | | | 71,853 | |
| | 51,700 | | | Redwood Trust, Inc. | | | 880,968 | |
| | | | | | | | |
| | | | | | | 1,034,175 | |
| | | | | | | | |
| | | | Thrifts & Mortgage Finance — 1.0% | |
| | 3,500 | | | BankFinancial Corp. | | | 52,220 | |
| | 6,000 | | | Dime Community Bancshares, Inc. | | | 117,600 | |
| | 8,400 | | | HomeStreet, Inc. (a) | | | 232,470 | |
| | 6,300 | | | Meta Financial Group, Inc. | | | 560,700 | |
| | 9,900 | | | OceanFirst Financial Corp. | | | 268,488 | |
| | 7,500 | | | PennyMac Financial Services, Inc., Class A (a) | | | 125,250 | |
| | 7,500 | | | Walker & Dunlop, Inc. (a) | | | 366,225 | |
| | 1,500 | | | Washington Federal, Inc. | | | 49,800 | |
| | | | | | | | |
| | | | | | | 1,772,753 | |
| | | | | | | | |
| | | | Total Financials | | | 31,879,054 | |
| | | | | | | | |
| | | | Health Care — 14.4% | |
| | | | Biotechnology — 5.2% | |
| | 8,100 | | | Acorda Therapeutics, Inc. (a) | | | 159,570 | |
| | 37,800 | | | Aduro Biotech, Inc. (a) | | | 430,920 | |
| | 3,100 | | | AMAG Pharmaceuticals, Inc. (a) | | | 57,040 | |
| | 58,600 | | | Amicus Therapeutics, Inc. (a) | | | 590,102 | |
| | 6,100 | | | AnaptysBio, Inc. (a) | | | 145,973 | |
| | 8,000 | | | Audentes Therapeutics, Inc. (a) | | | 153,040 | |
| | 19,800 | | | Axovant Sciences Ltd. (a) | | | 459,162 | |
| | 5,500 | | | Bellicum Pharmaceuticals, Inc. (a) | | | 64,240 | |
| | 5,600 | | | Bluebird Bio, Inc. (a) | | | 588,280 | |
| | 14,400 | | | Cara Therapeutics, Inc. (a) | | | 221,616 | |
| | 155,800 | | | Catalyst Pharmaceuticals, Inc. (a) | | | 430,008 | |
| | 7,000 | | | Corvus Pharmaceuticals, Inc. (a) | | | 84,700 | |
| | 51,100 | | | Dynavax Technologies Corp. (a) | | | 493,115 | |
| | 16,400 | | | Epizyme, Inc. (a) | | | 247,640 | |
| | 6,400 | | | Esperion Therapeutics, Inc. (a) | | | 296,192 | |
| | 5,600 | | | FibroGen, Inc. (a) | | | 180,880 | |
| | 5,900 | | | Global Blood Therapeutics, Inc. (a) | | | 161,365 | |
| | 3,900 | | | Immune Design Corp. (a) | | | 38,025 | |
| | 25,000 | | | Insmed, Inc. (a) | | | 429,000 | |
| | 4,600 | | | Jounce Therapeutics, Inc. (a) | | | 64,538 | |
| | 543 | | | Karyopharm Therapeutics, Inc. (a) | | | 4,914 | |
| | 800 | | | Loxo Oncology, Inc. (a) | | | 64,152 | |
| | 16,800 | | | Mersana Therapeutics, Inc. (a) | | | 234,696 | |
| | 6,200 | | | Momenta Pharmaceuticals, Inc. (a) | | | 104,780 | |
| | 20,200 | | | Ra Pharmaceuticals, Inc. (a) | | | 378,548 | |
| | 2,300 | | | Radius Health, Inc. (a) | | | 104,029 | |
| | 2,700 | | | Sage Therapeutics, Inc. (a) | | | 215,028 | |
| | | | | | | | |
| SHARES | | | SECURITY DESCRIPTION | | VALUE($) | |
| | | | | | | | |
| | | | Biotechnology — continued | |
| | 10,300 | | | Sarepta Therapeutics, Inc. (a) | | | 347,213 | |
| | 24,546 | | | Selecta Biosciences, Inc. (a) | | | 487,484 | |
| | 2,300 | | | Seres Therapeutics, Inc. (a) | | | 25,990 | |
| | 7,700 | | | Spark Therapeutics, Inc. (a) | | | 459,998 | |
| | 44,200 | | | Synergy Pharmaceuticals, Inc. (a) | | | 196,690 | |
| | 11,100 | | | Syros Pharmaceuticals, Inc. (a) | | | 178,599 | |
| | 2,900 | | | TESARO, Inc. (a) | | | 405,594 | |
| | 8,700 | | | Ultragenyx Pharmaceutical, Inc. (a) | | | 540,357 | |
| | 8,000 | | | Vanda Pharmaceuticals, Inc. (a) | | | 130,400 | |
| | 9,400 | | | Xencor, Inc. (a) | | | 198,434 | |
| | | | | | | | |
| | | | | | | 9,372,312 | |
| | | | | | | | |
| | | | Health Care Equipment & Supplies — 3.8% | |
| | 15,300 | | | Cutera, Inc. (a) | | | 396,270 | |
| | 1,300 | | | Inogen, Inc. (a) | | | 124,046 | |
| | 43,400 | | | Integer Holdings Corp. (a) | | | 1,877,050 | |
| | 50,100 | | | Invacare Corp. | | | 661,320 | |
| | 38,200 | | | Lantheus Holdings, Inc. (a) | | | 674,230 | |
| | 21,700 | | | Masimo Corp. (a) | | | 1,978,606 | |
| | 63,500 | | | OraSure Technologies, Inc. (a) | | | 1,096,010 | |
| | | | | | | | |
| | | | | | | 6,807,532 | |
| | | | | | | | |
| | | | Health Care Providers & Services — 3.4% | |
| | 19,100 | | | Addus HomeCare Corp. (a) | | | 710,520 | |
| | 15,800 | | | AMN Healthcare Services, Inc. (a) | | | 616,990 | |
| | 60,500 | | | Cross Country Healthcare, Inc. (a) | | | 781,055 | |
| | 1,913 | | | Envision Healthcare Corp. (a) | | | 119,888 | |
| | 35,500 | | | Kindred Healthcare, Inc. | | | 413,575 | |
| | 18,100 | | | Molina Healthcare, Inc. (a) | | | 1,252,158 | |
| | 21,000 | | | Owens & Minor, Inc. | | | 675,990 | |
| | 12,000 | | | PharMerica Corp. (a) | | | 315,000 | |
| | 26,000 | | | RadNet, Inc. (a) | | | 201,500 | |
| | 20,800 | | | Surgery Partners, Inc. (a) | | | 473,200 | |
| | 3,100 | | | WellCare Health Plans, Inc. (a) | | | 556,636 | |
| | | | | | | | |
| | | | | | | 6,116,512 | |
| | | | | | | | |
| | | | Health Care Technology — 0.3% | |
| | 28,700 | | | HMS Holdings Corp. (a) | | | 530,950 | |
| | | | | | | | |
| | | | Life Sciences Tools & Services — 0.3% | |
| | 8,500 | | | INC Research Holdings, Inc., Class A (a) | | | 497,250 | |
| | 2,200 | | | PRA Health Sciences, Inc. (a) | | | 165,022 | |
| | | | | | | | |
| | | | | | | 662,272 | |
| | | | | | | | |
| | | | Pharmaceuticals — 1.4% | |
| | 6,700 | | | Amphastar Pharmaceuticals, Inc. (a) | | | 119,662 | |
| | 16,400 | | | Assembly Biosciences, Inc. (a) | | | 338,660 | |
| | 8,000 | | | Horizon Pharma plc (a) | | | 94,960 | |
SEE NOTES TO FINANCIAL STATEMENTS.
| | | | | | | | |
| | | |
| JUNE 30, 2017 | | JPMORGAN INSURANCE TRUST | | | | | 7 | |
JPMorgan Insurance Trust Small Cap Core Portfolio
SCHEDULE OF PORTFOLIO INVESTMENTS
AS OF JUNE 30, 2017 (Unaudited) (continued)
| | | | | | | | |
| SHARES | | | SECURITY DESCRIPTION | | VALUE($) | |
| | Common Stocks — continued | |
| | | | Pharmaceuticals — continued | |
| | 2,300 | | | Medicines Co. (The) (a) | | | 87,423 | |
| | 12,200 | | | Nektar Therapeutics (a) | | | 238,510 | |
| | 34,300 | | | Ocular Therapeutix, Inc. (a) | | | 317,961 | |
| | 5,900 | | | Pacira Pharmaceuticals, Inc. (a) | | | 281,430 | |
| | 5,612 | | | Reata Pharmaceuticals, Inc., Class A (a) | | | 177,563 | |
| | 7,300 | | | Revance Therapeutics, Inc. (a) | | | 192,720 | |
| | 98,400 | | | TherapeuticsMD, Inc. (a) | | | 518,568 | |
| | 4,400 | | | Theravance Biopharma, Inc., (Cayman Islands) (a) | | | 175,296 | |
| | | | | | | | |
| | | | | | | 2,542,753 | |
| | | | | | | | |
| | | | Total Health Care | | | 26,032,331 | |
| | | | | | | | |
| | | | Industrials — 18.6% | |
| | | | Aerospace & Defense — 1.5% | |
| | 14,000 | | | AAR Corp. | | | 486,640 | |
| | 11,100 | | | Engility Holdings, Inc. (a) | | | 315,240 | |
| | 6,125 | | | HEICO Corp., Class A | | | 380,056 | |
| | 2,700 | | | Moog, Inc., Class A (a) | | | 193,644 | |
| | 41,000 | | | Vectrus, Inc. (a) | | | 1,325,120 | |
| | | | | | | | |
| | | | | | | 2,700,700 | |
| | | | | | | | |
| | | | Air Freight & Logistics — 0.2% | |
| | 3,900 | | | Atlas Air Worldwide Holdings, Inc. (a) | | | 203,385 | |
| | 3,200 | | | Park-Ohio Holdings Corp. | | | 121,920 | |
| | | | | | | | |
| | | | | | | 325,305 | |
| | | | | | | | |
| | | | Airlines — 0.7% | |
| | 8,600 | | | Hawaiian Holdings, Inc. (a) | | | 403,770 | |
| | 26,200 | | | SkyWest, Inc. | | | 919,620 | |
| | | | | | | | |
| | | | | | | 1,323,390 | |
| | | | | | | | |
| | | | Building Products — 0.8% | |
| | 2,200 | | | American Woodmark Corp. (a) | | | 210,210 | |
| | 6,800 | | | JELD-WEN Holding, Inc. (a) | | | 220,728 | |
| | 10,400 | | | Universal Forest Products, Inc. | | | 908,024 | |
| | | | | | | | |
| | | | | | | 1,338,962 | |
| | | | | | | | |
| | | | Commercial Services & Supplies — 3.0% | |
| | 12,000 | | | ABM Industries, Inc. | | | 498,240 | |
| | 124,200 | | | ACCO Brands Corp. (a) | | | 1,446,930 | |
| | 2,700 | | | CECO Environmental Corp. | | | 24,786 | |
| | 22,500 | | | Essendant, Inc. | | | 333,675 | |
| | 2,200 | | | Herman Miller, Inc. | | | 66,880 | |
| | 14,000 | | | Interface, Inc. | | | 275,100 | |
| | 10,300 | | | Kimball International, Inc., Class B | | | 171,907 | |
| | 4,400 | | | Knoll, Inc. | | | 88,220 | |
| | 48,300 | | | Quad/Graphics, Inc. | | | 1,107,036 | |
| | 25,700 | | | Steelcase, Inc., Class A | | | 359,800 | |
| | | | | | | | |
| SHARES | | | SECURITY DESCRIPTION | | VALUE($) | |
| | | | | | | | |
| | | | Commercial Services & Supplies — continued | |
| | 3,300 | | | Viad Corp. | | | 155,925 | |
| | 1,400 | | | VSE Corp. | | | 62,972 | |
| | 37,900 | | | West Corp. | | | 883,828 | |
| | | | | | | | |
| | | | | | | 5,475,299 | |
| | | | | | | | |
| | | | Construction & Engineering — 1.5% | |
| | 12,575 | | | EMCOR Group, Inc. | | | 822,153 | |
| | 28,400 | | | HC2 Holdings, Inc. (a) | | | 166,992 | |
| | 27,600 | | | MasTec, Inc. (a) | | | 1,246,140 | |
| | 14,800 | | | Sterling Construction Co., Inc. (a) | | | 193,436 | |
| | 11,118 | | | Tutor Perini Corp. (a) | | | 319,643 | |
| | | | | | | | |
| | | | | | | 2,748,364 | |
| | | | | | | | |
| | | | Electrical Equipment — 1.2% | |
| | 5,100 | | | EnerSys | | | 369,495 | |
| | 86,800 | | | General Cable Corp. | | | 1,419,180 | |
| | 6,600 | | | Powell Industries, Inc. | | | 211,134 | |
| | 2,900 | | | Regal Beloit Corp. | | | 236,495 | |
| | | | | | | | |
| | | | | | | 2,236,304 | |
| | | | | | | | |
| | | | Machinery — 3.8% | |
| | 4,800 | | | Barnes Group, Inc. | | | 280,944 | |
| | 16,500 | | | Columbus McKinnon Corp. | | | 419,430 | |
| | 13,500 | | | Federal Signal Corp. | | | 234,360 | |
| | 49,000 | | | Global Brass & Copper Holdings, Inc. | | | 1,496,950 | |
| | 4,500 | | | Greenbrier Cos., Inc. (The) | | | 208,125 | |
| | 1,700 | | | Hurco Cos., Inc. | | | 59,075 | |
| | 3,300 | | | Hyster-Yale Materials Handling, Inc. | | | 231,825 | |
| | 6,400 | | | Kadant, Inc. | | | 481,280 | |
| | 2,700 | | | Kennametal, Inc. | | | 101,034 | |
| | 90,200 | | | Meritor, Inc. (a) | | | 1,498,222 | |
| | 1,700 | | | NN, Inc. | | | 46,665 | |
| | 1,100 | | | Standex International Corp. | | | 99,770 | |
| | 8,200 | | | TriMas Corp. (a) | | | 170,970 | |
| | 71,400 | | | Wabash National Corp. | | | 1,569,372 | |
| | | | | | | | |
| | | | | | | 6,898,022 | |
| | | | | | | | |
| | | | Marine — 0.2% | |
| | 52,500 | | | Costamare, Inc., (Monaco) | | | 383,775 | |
| | | | | | | | |
| | | | Professional Services — 3.9% | |
| | 52,800 | | | Acacia Research Corp. (a) | | | 216,480 | |
| | 25,900 | | | Barrett Business Services, Inc. | | | 1,483,811 | |
| | 4,100 | | | CRA International, Inc. | | | 148,912 | |
| | 12,000 | | | ICF International, Inc. (a) | | | 565,200 | |
| | 15,400 | | | Insperity, Inc. | | | 1,093,400 | |
| | 1,600 | | | Kelly Services, Inc., Class A | | | 35,920 | |
| | 61,000 | | | RPX Corp. (a) | | | 850,950 | |
SEE NOTES TO FINANCIAL STATEMENTS.
| | | | | | |
| | | |
| 8 | | | | JPMORGAN INSURANCE TRUST | | JUNE 30, 2017 |
| | | | | | | | |
| SHARES | | | SECURITY DESCRIPTION | | VALUE($) | |
| | Common Stocks — continued | |
| | | | Professional Services — continued | |
| | 24,500 | | | TriNet Group, Inc. (a) | | | 802,130 | |
| | 50,400 | | | TrueBlue, Inc. (a) | | | 1,335,600 | |
| | 6,400 | | | WageWorks, Inc. (a) | | | 430,080 | |
| | | | | | | | |
| | | | | | | 6,962,483 | |
| | | | | | | | |
| | | | Road & Rail — 0.8% | |
| | 57,400 | | | ArcBest Corp. | | | 1,182,440 | |
| | 8,500 | | | Schneider National, Inc., Class B | | | 190,145 | |
| | 2,100 | | | Universal Logistics Holdings, Inc. | | | 31,500 | |
| | 2,800 | | | YRC Worldwide, Inc. (a) | | | 31,136 | |
| | | | | | | | |
| | | | | | | 1,435,221 | |
| | | | | | | | |
| | | | Trading Companies & Distributors — 1.0% | |
| | 7,200 | | | Applied Industrial Technologies, Inc. | | | 425,160 | |
| | 10,000 | | | GMS, Inc. (a) | | | 281,000 | |
| | 54,800 | | | MRC Global, Inc. (a) | | | 905,296 | |
| | 200 | | | Neff Corp., Class A (a) | | | 3,800 | |
| | 2,500 | | | Veritiv Corp. (a) | | | 112,500 | |
| | | | | | | | |
| | | | | | | 1,727,756 | |
| | | | | | | | |
| | | | Total Industrials | | | 33,555,581 | |
| | | | | | | | |
| | | | Information Technology — 15.8% | |
| | | | Communications Equipment — 1.1% | |
| | 13,000 | | | Ciena Corp. (a) | | | 325,260 | |
| | 190,100 | | | Extreme Networks, Inc. (a) | | | 1,752,722 | |
| | | | | | | | |
| | | | | | | 2,077,982 | |
| | | | | | | | |
| | | | Electronic Equipment, Instruments & Components — 3.7% | |
| | 1,200 | | | Anixter International, Inc. (a) | | | 93,840 | |
| | 37,500 | | | Benchmark Electronics, Inc. (a) | | | 1,211,250 | |
| | 17,400 | | | Fitbit, Inc., Class A (a) | | | 92,394 | |
| | 25,700 | | | Insight Enterprises, Inc. (a) | | | 1,027,743 | |
| | 300 | | | KEMET Corp. (a) | | | 3,840 | |
| | 24,525 | | | Kimball Electronics, Inc. (a) | | | 442,676 | |
| | 2,100 | | | Littelfuse, Inc. | | | 346,500 | |
| | 7,200 | | | Methode Electronics, Inc. | | | 296,640 | |
| | 7,200 | | | Plexus Corp. (a) | | | 378,504 | |
| | 49,800 | | | Sanmina Corp. (a) | | | 1,897,380 | |
| | 8,000 | | | Tech Data Corp. (a) | | | 808,000 | |
| | | | | | | | |
| | | | | | | 6,598,767 | |
| | | | | | | | |
| | | | Internet Software & Services — 1.9% | |
| | 5,700 | | | Alteryx, Inc., Class A (a) | | | 111,264 | |
| | 19,700 | | | Bankrate, Inc. (a) | | | 253,145 | |
| | 46,800 | | | Blucora, Inc. (a) | | | 992,160 | |
| | 20,800 | | | Cloudera, Inc. (a) | | | 333,216 | |
| | 7,700 | | | Cornerstone OnDemand, Inc. (a) | | | 275,275 | |
| | 5,100 | | | Coupa Software, Inc. (a) | | | 147,798 | |
| | | | | | | | |
| SHARES | | | SECURITY DESCRIPTION | | VALUE($) | |
| | | | | | | | |
| | | | Internet Software & Services — continued | |
| | 15,400 | | | Five9, Inc. (a) | | | 331,408 | |
| | 82,300 | | | Limelight Networks, Inc. (a) | | | 237,847 | |
| | 2,200 | | | MuleSoft, Inc., Class A (a) | | | 54,868 | |
| | 11,300 | | | Okta, Inc. (a) | | | 257,640 | |
| | 31,700 | | | Tintri, Inc. (a) | | | 230,459 | |
| | 15,500 | | | Yext, Inc. (a) | | | 206,615 | |
| | | | | | | | |
| | | | | | | 3,431,695 | |
| | | | | | | | |
| | | | IT Services — 2.4% | |
| | 1,500 | | | Blackhawk Network Holdings, Inc. (a) | | | 65,400 | |
| | 9,500 | | | Euronet Worldwide, Inc. (a) | | | 830,015 | |
| | 26,700 | | | Everi Holdings, Inc. (a) | | | 194,376 | |
| | 2,000 | | | EVERTEC, Inc., (Puerto Rico) | | | 34,600 | |
| | 18,000 | | | Planet Payment, Inc. (a) | | | 59,400 | |
| | 12,100 | | | Sykes Enterprises, Inc. (a) | | | 405,713 | |
| | 122,100 | | | Travelport Worldwide Ltd. | | | 1,680,096 | |
| | 85,800 | | | Unisys Corp. (a) | | | 1,098,240 | |
| | | | | | | | |
| | | | | | | 4,367,840 | |
| | | | | | | | |
| | | | Semiconductors & Semiconductor Equipment — 3.5% | |
| | 2,400 | | | Advanced Energy Industries, Inc. (a) | | | 155,256 | |
| | 25,050 | | | Alpha & Omega Semiconductor Ltd. (a) | | | 417,583 | |
| | 14,800 | | | Cirrus Logic, Inc. (a) | | | 928,256 | |
| | 25,600 | | | Cohu, Inc. | | | 402,944 | |
| | 84,415 | | | Cypress Semiconductor Corp. | | | 1,152,265 | |
| | 91,500 | | | IXYS Corp. (a) | | | 1,505,175 | |
| | 4,000 | | | Nanometrics, Inc. (a) | | | 101,160 | |
| | 5,800 | | | Rudolph Technologies, Inc. (a) | | | 132,530 | |
| | 14,800 | | | Sigma Designs, Inc. (a) | | | 86,580 | |
| | 68,800 | | | Ultra Clean Holdings, Inc. (a) | | | 1,290,000 | |
| | 14,300 | | | Xcerra Corp. (a) | | | 139,711 | |
| | | | | | | | |
| | | | | | | 6,311,460 | |
| | | | | | | | |
| | | | Software — 3.2% | |
| | 1,600 | | | Blackline, Inc. (a) | | | 57,184 | |
| | 12,900 | | | CommVault Systems, Inc. (a) | | | 728,205 | |
| | 2,100 | | | MicroStrategy, Inc., Class A (a) | | | 402,507 | |
| | 2,200 | | | QAD, Inc., Class A | | | 70,510 | |
| | 2,600 | | | Qualys, Inc. (a) | | | 106,080 | |
| | 5,200 | | | RealPage, Inc. (a) | | | 186,940 | |
| | 25,900 | | | RingCentral, Inc., Class A (a) | | | 946,645 | |
| | 21,400 | | | Take-Two Interactive Software, Inc. (a) | | | 1,570,332 | |
| | 89,700 | | | TiVo Corp. | | | 1,672,905 | |
| | | | | | | | |
| | | | | | | 5,741,308 | |
| | | | | | | | |
| | | | Total Information Technology | | | 28,529,052 | |
| | | | | | | | |
SEE NOTES TO FINANCIAL STATEMENTS.
| | | | | | | | |
| | | |
| JUNE 30, 2017 | | JPMORGAN INSURANCE TRUST | | | | | 9 | |
JPMorgan Insurance Trust Small Cap Core Portfolio
SCHEDULE OF PORTFOLIO INVESTMENTS
AS OF JUNE 30, 2017 (Unaudited) (continued)
| | | | | | | | |
| SHARES | | | SECURITY DESCRIPTION | | VALUE($) | |
| | Common Stocks — continued | |
| | | | Materials — 4.4% | |
| | | | Chemicals — 2.4% | |
| | 11,800 | | | Chemours Co. (The) | | | 447,456 | |
| | 15,500 | | | FutureFuel Corp. | | | 233,895 | |
| | 15,300 | | | Innophos Holdings, Inc. | | | 670,752 | |
| | 1,100 | | | Innospec, Inc. | | | 72,105 | |
| | 10,900 | | | Minerals Technologies, Inc. | | | 797,880 | |
| | 12,200 | | | OMNOVA Solutions, Inc. (a) | | | 118,950 | |
| | 29,600 | | | Trinseo SA | | | 2,033,520 | |
| | | | | | | | |
| | | | | | | 4,374,558 | |
| | | | | | | | |
| | | | Containers & Packaging — 0.5% | |
| | 10,259 | | | Berry Global Group, Inc. (a) | | | 584,866 | |
| | 19,000 | | | Graphic Packaging Holding Co. | | | 261,820 | |
| | | | | | | | |
| | | | | | | 846,686 | |
| | | | | | | | |
| | | | Metals & Mining — 0.7% | |
| | 56,600 | | | AK Steel Holding Corp. (a) | | | 371,862 | |
| | 45,400 | | | Cliffs Natural Resources, Inc. (a) | | | 314,168 | |
| | 4,900 | | | Commercial Metals Co. | | | 95,207 | |
| | 3,700 | | | Ryerson Holding Corp. (a) | | | 36,630 | |
| | 9,500 | | | Warrior Met Coal, Inc. | | | 162,735 | |
| | 3,700 | | | Worthington Industries, Inc. | | | 185,814 | |
| | | | | | | | |
| | | | | | | 1,166,416 | |
| | | | | | | | |
| | | | Paper & Forest Products — 0.8% | |
| | 11,500 | | | Boise Cascade Co. (a) | | | 349,600 | |
| | 20,400 | | | Louisiana-Pacific Corp. (a) | | | 491,844 | |
| | 16,800 | | | Schweitzer-Mauduit International, Inc. | | | 625,464 | |
| | | | | | | | |
| | | | | | | 1,466,908 | |
| | | | | | | | |
| | | | Total Materials | | | 7,854,568 | |
| | | | | | | | |
| | | | Real Estate — 7.0% | |
| | | | Equity Real Estate Investment Trusts (REITs) — 6.8% | |
| | 3,883 | | | American Campus Communities, Inc. | | | 183,666 | |
| | 8,200 | | | Armada Hoffler Properties, Inc. | | | 106,190 | |
| | 127,100 | | | Ashford Hospitality Trust, Inc. | | | 772,768 | |
| | 13,800 | | | Bluerock Residential Growth REIT, Inc. | | | 177,882 | |
| | 7,800 | | | Chatham Lodging Trust | | | 156,702 | |
| | 6,900 | | | Chesapeake Lodging Trust | | | 168,843 | |
| | 900 | | | CorEnergy Infrastructure Trust, Inc. | | | 30,231 | |
| | 7,500 | | | CoreSite Realty Corp. | | | 776,475 | |
| | 24,138 | | | Cousins Properties, Inc. | | | 212,173 | |
| | 2,100 | | | CyrusOne, Inc. | | | 117,075 | |
| | 7,243 | | | DCT Industrial Trust, Inc. | | | 387,066 | |
| | 14,000 | | | DiamondRock Hospitality Co. | | | 153,300 | |
| | 7,800 | | | DuPont Fabros Technology, Inc. | | | 477,048 | |
| | 4,600 | | | Easterly Government Properties, Inc. | | | 96,370 | |
| | | | | | | | |
| SHARES | | | SECURITY DESCRIPTION | | VALUE($) | |
| | | | | | | | |
| | | | Equity Real Estate Investment Trusts (REITs) — continued | |
| | 6,833 | | | Education Realty Trust, Inc. | | | 264,779 | |
| | 1,200 | | | EPR Properties | | | 86,244 | |
| | 37,100 | | | First Industrial Realty Trust, Inc. | | | 1,061,802 | |
| | 2,600 | | | Franklin Street Properties Corp. | | | 28,808 | |
| | 67,550 | | | GEO Group, Inc. (The) | | | 1,997,453 | |
| | 4,600 | | | Government Properties Income Trust | | | 84,226 | |
| | 6,300 | | | Highwoods Properties, Inc. | | | 319,473 | |
| | 4,900 | | | Hudson Pacific Properties, Inc. | | | 167,531 | |
| | 7,100 | | | InfraREIT, Inc. | | | 135,965 | |
| | 6,100 | | | New Senior Investment Group, Inc. | | | 61,305 | |
| | 18,102 | | | NexPoint Residential Trust, Inc. | | | 450,559 | |
| | 3,042 | | | Parkway, Inc. | | | 69,631 | |
| | 7,700 | | | Preferred Apartment Communities, Inc., Class A | | | 121,275 | |
| | 1,575 | | | PS Business Parks, Inc. | | | 208,514 | |
| | 2,400 | | | Ramco-Gershenson Properties Trust | | | 30,960 | |
| | 33,600 | | | Retail Opportunity Investments Corp. | | | 644,784 | |
| | 19,100 | | | Rexford Industrial Realty, Inc. | | | 524,104 | |
| | 18,200 | | | RLJ Lodging Trust | | | 361,634 | |
| | 41,700 | | | Summit Hotel Properties, Inc. | | | 777,705 | |
| | 2,200 | | | Sun Communities, Inc. | | | 192,918 | |
| | 32,525 | | | Sunstone Hotel Investors, Inc. | | | 524,303 | |
| | 19,400 | | | Xenia Hotels & Resorts, Inc. | | | 375,778 | |
| | | | | | | | |
| | | | | | | 12,305,540 | |
| | | | | | | | |
| | | | Real Estate Management & Development — 0.2% | |
| | 21,900 | | | Forestar Group, Inc. (a) | | | 375,585 | |
| | | | | | | | |
| | | | Total Real Estate | | | 12,681,125 | |
| | | | | | | | |
| | | | Telecommunication Services — 0.0% (g) | |
| | | | Diversified Telecommunication Services — 0.0% (g) | |
| | 6,300 | | | IDT Corp., Class B | | | 90,531 | |
| | | | | | | | |
| | | | Utilities — 3.2% | |
| | | | Electric Utilities — 1.9% | |
| | 1,325 | | | El Paso Electric Co. | | | 68,502 | |
| | 4,800 | | | IDACORP, Inc. | | | 409,680 | |
| | 2,850 | | | MGE Energy, Inc. | | | 183,398 | |
| | 31,875 | | | Portland General Electric Co. | | | 1,456,369 | |
| | 71,000 | | | Spark Energy, Inc., Class A | | | 1,334,800 | |
| | | | | | | | |
| | | | | | | 3,452,749 | |
| | | | | | | | |
| | | | Gas Utilities — 0.9% | |
| | 11,600 | | | New Jersey Resources Corp. | | | 460,520 | |
| | 10,800 | | | Southwest Gas Holdings, Inc. | | | 789,048 | |
| | 4,100 | | | WGL Holdings, Inc. | | | 342,063 | |
| | | | | | | | |
| | | | | | | 1,591,631 | |
| | | | | | | | |
SEE NOTES TO FINANCIAL STATEMENTS.
| | | | | | |
| | | |
| 10 | | | | JPMORGAN INSURANCE TRUST | | JUNE 30, 2017 |
| | | | | | | | |
| SHARES | | | SECURITY DESCRIPTION | | VALUE($) | |
| | Common Stocks — continued | |
| | | | Independent Power and Renewable Electricity Producers — 0.4% | |
| | 39,100 | | | Atlantic Power Corp. (a) | | | 93,840 | |
| | 12,500 | | | Dynegy, Inc. (a) | | | 103,375 | |
| | 9,400 | | | Ormat Technologies, Inc. | | | 551,592 | |
| | | | | | | | |
| | | | | | | 748,807 | |
| | | | | | | | |
| | | | Water Utilities — 0.0% (g) | |
| | 2,000 | | | Consolidated Water Co. Ltd., (Cayman Islands) | | | 24,800 | |
| | | | | | | | |
| | | | Total Utilities | | | 5,817,987 | |
| | | | | | | | |
| | | | Total Common Stocks
(Cost $133,606,218) | | | 172,729,306 | |
| | | | | | | | |
| | |
NUMBER OF
WARRANTS | | | | | | |
| | Warrant — 0.0% | |
| | | | Financials — 0.0% | |
| | | | Diversified Financial Services — 0.0% | |
| | 355 | | | Emergent Capital, Inc., expiring 10/01/19 (Strike Price $10.75) (a)
(Cost $—) | | | — | |
| | | | | | | | |
| | | | | | | | |
| SHARES | | | SECURITY DESCRIPTION | | VALUE($) | |
| | Short-Term Investment — 4.1% | |
| | | | Investment Company — 4.1% | |
| | 7,432,332 | | | JPMorgan U.S. Government Money Market Fund, Institutional Class Shares, 0.840% (b) (l)
(Cost $7,432,332) | | | 7,432,332 | |
| | | | | | | | |
| | | | Total Investments — 99.8%
(Cost $141,038,550) | | | 180,161,638 | |
| | | | Other Assets in Excess of
Liabilities — 0.2% | | | 362,997 | |
| | | | | | | | |
| | | | NET ASSETS — 100.0% | | $ | 180,524,635 | |
| | | | | | | | |
Percentages indicated are based on net assets.
| | | | | | | | | | | | | | | | | | | | |
| Futures Contracts | |
NUMBER OF
CONTRACTS | | | DESCRIPTION | | EXPIRATION
DATE | | | TRADING
CURRENCY | | | NOTIONAL
VALUE AT
JUNE 30, 2017 | | | NET
UNREALIZED
APPRECIATION
(DEPRECIATION) | |
| | | | Long Futures Outstanding | |
| | 98 | | | Mini Russell 2000 Index | | | 09/15/17 | | | | USD | | | $ | 6,930,070 | | | $ | 9,328 | |
| | | | | | | | | | | | | | | | | | | | |
NOTES TO SCHEDULE OF PORTFOLIO INVESTMENTS
| | |
| REIT | | — Real Estate Investment Trust. |
| USD | | — United States Dollar |
| |
| (a) | | — Non-income producing security. |
| (b) | | — Investment in affiliate. Money market fund is registered under the Investment Company Act of 1940, as amended, and advised by J.P. Morgan Investment Management Inc. |
| (g) | | — Amount rounds to less than 0.05%. |
| (l) | | — The rate shown is the current yield as of June 30, 2017. |
SEE NOTES TO FINANCIAL STATEMENTS.
| | | | | | | | |
| | | |
| JUNE 30, 2017 | | JPMORGAN INSURANCE TRUST | | | | | 11 | |
STATEMENT OF ASSETS AND LIABILITIES
AS OF JUNE 30, 2017 (Unaudited)
| | | | |
| | |
Small Cap Core
Portfolio | |
ASSETS: | | | | |
Investments in non-affiliates, at value | | $ | 172,729,306 | |
Investments in affiliates, at value | | | 7,432,332 | |
| | | | |
Total investment securities, at value | | | 180,161,638 | |
Cash | | | 2,785 | |
Deposits at broker for futures contracts | | | 365,000 | |
Receivables: | | | | |
Investment securities sold | | | 952,310 | |
Portfolio shares sold | | | 61,364 | |
Interest from non-affiliates | | | 165,128 | |
Dividends from affiliates | | | 2,548 | |
| | | | |
Total Assets | | | 181,710,773 | |
| | | | |
| |
LIABILITIES: | | | | |
Payables: | | | | |
Investment securities purchased | | | 872,562 | |
Portfolio shares redeemed | | | 138,974 | |
Variation margin on futures contracts | | | 18,138 | |
Accrued liabilities: | | | | |
Investment advisory fees | | | 95,357 | |
Administration fees | | | 11,963 | |
Distribution fees | | | 308 | |
Custodian and accounting fees | | | 4,575 | |
Trustees’ and Chief Compliance Officer’s fees | | | 634 | |
Other | | | 43,627 | |
| | | | |
Total Liabilities | | | 1,186,138 | |
| | | | |
Net Assets | | $ | 180,524,635 | |
| | | | |
NET ASSETS: | | | | |
Paid-in-Capital | | $ | 135,684,118 | |
Accumulated undistributed net investment income | | | 381,594 | |
Accumulated net realized gains (losses) | | | 5,326,507 | |
Net unrealized appreciation (depreciation) | | | 39,132,416 | |
| | | | |
Total Net Assets | | $ | 180,524,635 | |
| | | | |
| |
Net Assets: | | | | |
Class 1 | | $ | 179,031,582 | |
Class 2 | | | 1,493,053 | |
| | | | |
Total | | $ | 180,524,635 | |
| | | | |
| |
Outstanding units of beneficial interest (shares) | | | | |
(unlimited number of shares authorized, no par value): | | | | |
Class 1 | | | 7,675,322 | |
Class 2 | | | 64,500 | |
| |
Net Asset Value, offering and redemption price per share (a): | | | | |
Class 1 | | $ | 23.33 | |
Class 2 | | | 23.15 | |
Cost of investments in non-affiliates | | $ | 133,606,218 | |
Cost of investments in affiliates | | | 7,432,332 | |
| (a) | Per share amounts may not recalculate due to rounding of net assets and/or shares outstanding. |
SEE NOTES TO FINANCIAL STATEMENTS.
| | | | | | |
| | | |
| 12 | | | | JPMORGAN INSURANCE TRUST | | JUNE 30, 2017 |
STATEMENT OF OPERATIONS
FOR THE SIX MONTHS ENDED JUNE 30, 2017 (Unaudited)
| | | | |
| | |
Small Cap Core
Portfolio | |
INVESTMENT INCOME: | | | | |
Dividend income from non-affiliates | | $ | 1,030,210 | |
Dividend income from affiliates | | | 12,135 | |
| | | | |
Total investment income | | | 1,042,345 | |
| | | | |
| |
EXPENSES: | | | | |
Investment advisory fees | | | 552,483 | |
Administration fees | | | 69,434 | |
Distribution fees — Class 2 | | | 1,878 | |
Custodian and accounting fees | | | 19,006 | |
Professional fees | | | 27,055 | |
Trustees’ and Chief Compliance Officer’s fees | | | 13,394 | |
Printing and mailing costs | | | 13,531 | |
Transfer agency fees — Class 1 | | | 2,163 | |
Transfer agency fees — Class 2 | | | 119 | |
Other | | | 8,209 | |
| | | | |
Total expenses | | | 707,272 | |
| | | | |
Less fees waived | | | (4,192 | ) |
| | | | |
Net expenses | | | 703,080 | |
| | | | |
Net investment income (loss) | | | 339,265 | |
| | | | |
| |
REALIZED/UNREALIZED GAINS (LOSSES): | | | | |
Net realized gain (loss) on transactions from: | | | | |
Investments in non-affiliates | | | 6,323,916 | |
Futures | | | 175,228 | |
| | | | |
Net realized gain (loss) | | | 6,499,144 | |
| | | | |
Change in net unrealized appreciation/depreciation on: | | | | |
Investments in non-affiliates | | | 1,162,358 | |
Futures | | | 73,380 | |
| | | | |
Change in net unrealized appreciation/depreciation | | | 1,235,738 | |
| | | | |
Net realized/unrealized gains (losses) | | | 7,734,882 | |
| | | | |
Change in net assets resulting from operations | | $ | 8,074,147 | |
| | | | |
SEE NOTES TO FINANCIAL STATEMENTS.
| | | | | | | | |
| | | |
| JUNE 30, 2017 | | JPMORGAN INSURANCE TRUST | | | | | 13 | |
STATEMENTS OF CHANGES IN NET ASSETS
FOR THE PERIODS INDICATED
| | | | | | | | |
| | | Small Cap Core Portfolio | |
| | | Six Months Ended
June 30, 2017
(Unaudited) | | | Year Ended
December 31, 2016 | |
CHANGE IN NET ASSETS RESULTING FROM OPERATIONS: | | | | | | | | |
Net investment income (loss) | | $ | 339,265 | | | $ | 597,757 | |
Net realized gain (loss) | | | 6,499,144 | | | | 1,267,265 | |
Change in net unrealized appreciation/depreciation | | | 1,235,738 | | | | 24,980,264 | |
| | | | | | | | |
Change in net assets resulting from operations | | | 8,074,147 | | | | 26,845,286 | |
| | | | | | | | |
| | |
DISTRIBUTIONS TO SHAREHOLDERS: | | | | | | | | |
Class 1 | | | | | | | | |
From net investment income | | | (572,218 | ) | | | (678,458 | ) |
From net realized gains | | | (1,256,277 | ) | | | (10,603,179 | ) |
Class 2 | | | | | | | | |
From net investment income | | | (1,794 | ) | | | (2,093 | ) |
From net realized gains | | | (10,866 | ) | | | (98,949 | ) |
| | | | | | | | |
Total distributions to shareholders | | | (1,841,155 | ) | | | (11,382,679 | ) |
| | | | | | | | |
| | |
CAPITAL TRANSACTIONS: | | | | | | | | |
Change in net assets resulting from capital transactions | | | 11,220,638 | | | | 23,522,371 | |
| | | | | | | | |
| | |
NET ASSETS: | | | | | | | | |
Change in net assets | | | 17,453,630 | | | | 38,984,978 | |
Beginning of period | | | 163,071,005 | | | | 124,086,027 | |
| | | | | | | | |
End of period | | $ | 180,524,635 | | | $ | 163,071,005 | |
| | | | | | | | |
Accumulated undistributed net investment income | | $ | 381,594 | | | $ | 616,341 | |
| | | | | | | | |
| | |
CAPITAL TRANSACTIONS: | | | | | | | | |
Class 1 | | | | | | | | |
Proceeds from shares issued | | $ | 28,139,324 | | | $ | 46,155,750 | |
Distributions reinvested | | | 1,828,495 | | | | 11,281,637 | |
Cost of shares redeemed | | | (18,614,973 | ) | | | (34,127,527 | ) |
| | | | | | | | |
Change in net assets resulting from Class 1 capital transactions | | $ | 11,352,846 | | | $ | 23,309,860 | |
| | | | | | | | |
Class 2 | | | | | | | | |
Proceeds from shares issued | | $ | 70,249 | | | $ | 426,340 | |
Distributions reinvested | | | 12,660 | | | | 101,042 | |
Cost of shares redeemed | | | (215,117 | ) | | | (314,871 | ) |
| | | | | | | | |
Change in net assets resulting from Class 2 capital transactions | | $ | (132,208 | ) | | $ | 212,511 | |
| | | | | | | | |
Total change in net assets resulting from capital transactions | | $ | 11,220,638 | | | $ | 23,522,371 | |
| | | | | | | | |
| | |
SHARE TRANSACTIONS: | | | | | | | | |
Class 1 | | | | | | | | |
Issued | | | 1,226,901 | | | | 2,327,550 | |
Reinvested | | | 80,057 | | | | 617,157 | |
Redeemed | | | (813,619 | ) | | | (1,737,248 | ) |
| | | | | | | | |
Change in Class 1 Shares | | | 493,339 | | | | 1,207,459 | |
| | | | | | | | |
Class 2 | | | | | | | | |
Issued | | | 3,038 | | | | 21,410 | |
Reinvested | | | 558 | | | | 5,564 | |
Redeemed | | | (9,512 | ) | | | (16,438 | ) |
| | | | | | | | |
Change in Class 2 Shares | | | (5,916 | ) | | | 10,536 | |
| | | | | | | | |
SEE NOTES TO FINANCIAL STATEMENTS.
| | | | | | |
| | | |
| 14 | | | | JPMORGAN INSURANCE TRUST | | JUNE 30, 2017 |
THIS PAGE IS INTENTIONALLY LEFT BLANK
| | | | | | | | |
| | | |
| JUNE 30, 2017 | | JPMORGAN INSURANCE TRUST | | | | | 15 | |
FINANCIAL HIGHLIGHTS
FOR THE PERIODS INDICATED
| | | | | | | | | | | | | | | | | | | | | | | | | | | | |
| | | | | | Per share operating performance | |
| | | | | | Investment operations | | | Distributions | |
| | | Net asset
value,
beginning
of period | | | Net
investment
income
(loss) | | | Net realized
and unrealized
gains
(losses) on
investments | | | Total from
investment
operations | | | Net
investment
income | | | Net
realized
gain | | | Total
distributions | |
Small Cap Core Portfolio | | | | | | | | | | | | | | | | | | | | | | | | | | | | |
Class 1 | | | | | | | | | | | | | | | | | | | | | | | | | | | | |
Six Months Ended June 30, 2017 (Unaudited) | | $ | 22.49 | | �� | $ | 0.05 | (e) | | $ | 1.04 | | | $ | 1.09 | | | $ | (0.08 | ) | | $ | (0.17 | ) | | $ | (0.25 | ) |
Year Ended December 31, 2016 | | | 20.56 | | | | 0.09 | (e) | | | 3.65 | | | | 3.74 | | | | (0.11 | ) | | | (1.70 | ) | | | (1.81 | ) |
Year Ended December 31, 2015 | | | 24.06 | | | | 0.13 | (e) | | | (1.19 | ) | | | (1.06 | ) | | | (0.03 | ) | | | (2.41 | ) | | | (2.44 | ) |
Year Ended December 31, 2014 | | | 24.03 | | | | 0.04 | (e) | | | 1.98 | | | | 2.02 | | | | (0.03 | ) | | | (1.96 | ) | | | (1.99 | ) |
Year Ended December 31, 2013 | | | 16.98 | | | | 0.05 | (e)(f) | | | 7.11 | | | | 7.16 | | | | (0.11 | ) | | | — | | | | (0.11 | ) |
Year Ended December 31, 2012 | | | 14.22 | | | | 0.13 | (g) | | | 2.66 | | | | 2.79 | | | | (0.03 | ) | | | — | | | | (0.03 | ) |
| | | | | | | |
Class 2 | | | | | | | | | | | | | | | | | | | | | | | | | | | | |
Six Months Ended June 30, 2017 (Unaudited) | | | 22.30 | | | | 0.01 | (e) | | | 1.04 | | | | 1.05 | | | | (0.03 | ) | | | (0.17 | ) | | | (0.20 | ) |
Year Ended December 31, 2016 | | | 20.38 | | | | 0.04 | (e) | | | 3.62 | | | | 3.66 | | | | (0.04 | ) | | | (1.70 | ) | | | (1.74 | ) |
Year Ended December 31, 2015 | | | 23.90 | | | | 0.07 | (e) | | | (1.18 | ) | | | (1.11 | ) | | | — | | | | (2.41 | ) | | | (2.41 | ) |
Year Ended December 31, 2014 | | | 23.91 | | | | (0.02 | )(e) | | | 1.97 | | | | 1.95 | | | | — | | | | (1.96 | ) | | | (1.96 | ) |
Year Ended December 31, 2013 | | | 16.90 | | | | (0.01 | )(e)(f) | | | 7.09 | | | | 7.08 | | | | (0.07 | ) | | | — | | | | (0.07 | ) |
Year Ended December 31, 2012 | | | 14.16 | | | | 0.09 | (g) | | | 2.65 | | | | 2.74 | | | | — | | | | — | | | | — | |
| (a) | Annualized for periods less than one year, unless otherwise noted. |
| (b) | Not annualized for periods less than one year. |
| (c) | Includes adjustments in accordance with accounting principles generally accepted in the United States of America and as such, the net asset values for financial reporting purposes and the returns based upon those net asset values may differ from the net asset values and returns for shareholder transactions. |
| (d) | Includes earnings credits and interest expense, if applicable, each of which is less than 0.005% unless otherwise noted. |
| (e) | Calculated based upon average shares outstanding. |
| (f) | Reflects special dividends paid out during the period by several of the Portfolio’s holdings. Had the Portfolio not received the special dividends, the net investment income (loss) per share would have been $0.01 and $(0.05) for Class 1 and Class 2 Shares, respectively, and the net investment income (loss) ratio would have been 0.03% and (0.24)% for Class 1 and Class 2 Shares, respectively. |
| (g) | Reflects special dividends paid out during the period by several of the Portfolio’s holdings. Had the Portfolio not received the special dividends, the net investment income (loss) per share would have been $0.04 and less than $0.01 for Class 1 and Class 2 Shares, respectively, and the net investment income (loss) ratio would have been 0.28% and 0.02% for Class 1 and Class 2 Shares, respectively. |
SEE NOTES TO FINANCIAL STATEMENTS.
| | | | | | |
| | | |
| 16 | | | | JPMORGAN INSURANCE TRUST | | JUNE 30, 2017 |
| | | | | | | | | | | | | | | | | | | | | | | | | | |
| | | Ratios/Supplemental data | |
| | | | | | | | | | Ratios to average net assets (a) | | | | |
Net asset
value,
end of
period | | | Total return (b)(c) | | | Net assets,
end of
period | | | Net
expenses (d) | | | Net
investment
income
(loss) | | | Expenses
without waivers,
reimbursements and
earnings credits | | | Portfolio
turnover
rate (b) | |
| | | | | | | | | | | | | | | | | | | | | | | | | | |
| | | | | | | | | | | | | | | | | | | | | | | | | | |
| $ | 23.33 | | | | 4.85 | % | | $ | 179,031,582 | | | | 0.82 | % | | | 0.40 | % | | | 0.83 | % | | | 28 | % |
| | 22.49 | | | | 20.21 | | | | 161,500,800 | | | | 0.87 | | | | 0.46 | | | | 0.87 | | | | 55 | |
| | 20.56 | | | | (5.28 | ) | | | 122,865,455 | | | | 0.85 | | | | 0.56 | | | | 0.86 | | | | 52 | |
| | 24.06 | | | | 9.59 | | | | 111,175,638 | | | | 0.87 | | | | 0.19 | | | | 0.87 | | | | 54 | |
| | 24.03 | | | | 42.38 | | | | 105,229,638 | | | | 0.90 | | | | 0.24 | (f) | | | 0.91 | | | | 56 | |
| | 16.98 | | | | 19.66 | | | | 66,719,964 | | | | 0.94 | | | | 0.80 | (g) | | | 0.94 | | | | 44 | |
| | | | | | |
| | | | | | | | | | | | | | | | | | | | | | | | | | |
| | 23.15 | | | | 4.71 | | | | 1,493,053 | | | | 1.09 | | | | 0.13 | | | | 1.09 | | | | 28 | |
| | 22.30 | | | | 19.88 | | | | 1,570,205 | | | | 1.12 | | | | 0.20 | | | | 1.13 | | | | 55 | |
| | 20.38 | | | | (5.55 | ) | | | 1,220,572 | | | | 1.14 | | | | 0.30 | | | | 1.15 | | | | 52 | |
| | 23.90 | | | | 9.30 | | | | 1,600,865 | | | | 1.12 | | | | (0.09 | ) | | | 1.13 | | | | 54 | |
| | 23.91 | | | | 42.02 | | | | 2,154,402 | | | | 1.16 | | | | (0.03 | )(f) | | | 1.16 | | | | 56 | |
| | 16.90 | | | | 19.35 | | | | 1,989,290 | | | | 1.19 | | | | 0.54 | (g) | | | 1.19 | | | | 44 | |
SEE NOTES TO FINANCIAL STATEMENTS.
| | | | | | | | |
| | | |
| JUNE 30, 2017 | | JPMORGAN INSURANCE TRUST | | | | | 17 | |
NOTES TO FINANCIAL STATEMENTS
AS OF JUNE 30, 2017 (Unaudited)
1. Organization
JPMorgan Insurance Trust (the “Trust”) is registered under the Investment Company Act of 1940, as amended (the “1940 Act”), as an open-end management investment company and is a Massachusetts business trust.
The following is a separate Portfolio of the Trust (the “Portfolio”) covered by this report:
| | | | |
| | | Classes Offered | | Diversified/Non-Diversified |
| Small Cap Core Portfolio | | Class 1 and Class 2 | | Diversified |
The investment objective of the Portfolio is to seek capital growth over the long-term.
Portfolio shares are offered only to separate accounts of participating insurance companies and Eligible Plans. Individuals may not purchase shares directly from the Portfolio.
All classes of shares have equal rights as to earnings, assets and voting privileges, except that each class may bear different transfer agency fees and distribution fees and each class has exclusive voting rights with respect to its distribution plan and administrative services plan.
J.P. Morgan Investment Management Inc. (“JPMIM”), an indirect, wholly-owned subsidiary of JPMorgan Chase & Co. (“JPMorgan”), acts as Adviser (the “Adviser”) and Administrator (the “Administrator”) to the Portfolio.
2. Significant Accounting Policies
The following is a summary of significant accounting policies followed by the Portfolio in the preparation of its financial statements. The Portfolio is an investment company and, accordingly, follows the investment company accounting and reporting guidance of the Financial Accounting Standards Board Accounting Standards Codification Topic 946 — Investment Companies, which is part of U.S. generally accepted accounting principles (“GAAP”). The preparation of financial statements in conformity with GAAP requires management to make estimates and assumptions that affect the reported amounts of assets and liabilities and disclosure of contingent assets and liabilities at the date of the financial statements and the reported amounts of increases and decreases in net assets from operations during the reporting period. Actual results could differ from those estimates.
A. Valuation of Investments — The valuation of investments is in accordance with GAAP and the Portfolio’s valuation policies set forth by and under the supervision and responsibility of the Board of Trustees (the “Board”), which established the following approach to valuation, as described more fully below: (i) investments for which market quotations are readily available shall be valued at such unadjusted quoted prices and (ii) all other investments for which market quotations are not readily available shall be valued at their fair value as determined in good faith by the Board.
The Administrator has established the J.P. Morgan Investment Management Americas Valuation Committee (“AVC”) to assist the Board with the oversight and monitoring of the valuation of the Portfolio’s investments. The Administrator implements the valuation policies of the Portfolio’s investments, as directed by the Board. The AVC oversees and carries out the policies for the valuation of investments held in the Portfolio. This includes monitoring the appropriateness of fair values based on results of ongoing valuation oversight, including but not limited to consideration of macro or security specific events, market events and pricing vendor and broker due diligence. The Administrator is responsible for discussing and assessing the potential impacts to the fair values on an ongoing basis, and at least on a quarterly basis with the AVC and the Board.
A market-based approach is primarily used to value the Portfolio’s investments. Investments for which market quotations are not readily available are fair valued by approved affiliated and unaffiliated pricing vendors or third party broker-dealers (collectively referred to as “Pricing Services”) or may be internally fair valued using methods set forth by the valuation policies approved by the Board. This may include related or comparable assets or liabilities, recent transactions, market multiples, book values, and other relevant information for the investment to determine the fair value of the investment. An income-based valuation approach may be used in which the anticipated future cash flows of the investment are discounted to calculate the fair value. Discounts may also be applied due to the nature or duration of any restrictions on the disposition of the investments. Valuations may be based upon current market prices of securities that are comparable in coupon, rating, maturity and industry. It is possible that the estimated values may differ significantly from the values that would have been used, had a ready market for the investments existed, and such differences could be material.
Equities and other exchange-traded instruments are valued at the last sale price or official market closing price on the primary exchange on which the instrument is traded before the net asset values (“NAV”) of the Portfolio are calculated on a valuation date. Investments in open-end investment companies (the “Underlying Funds”) are valued at each Underlying Fund’s NAV per share as of the report date.
Futures are generally valued on the basis of available market quotations.
Valuations reflected in this report are as of the report date. As a result, changes in valuation due to market events and/or issuer related events after the report date and prior to issuance of the report are not reflected herein.
The various inputs that are used in determining the valuation of the Portfolio’s investments are summarized into the three broad levels listed below.
| • | | Level 1 — Unadjusted inputs using quoted prices in active markets for identical investments. |
| • | | Level 2 — Other significant observable inputs including, but not limited to, quoted prices for similar investments, inputs other than quoted prices that are observable for investments (such as interest rates, prepayment speeds, credit risk, etc.) or other market corroborated inputs. |
| • | | Level 3 — Significant inputs based on the best information available in the circumstances, to the extent observable inputs are not available (including the Portfolio’s assumptions in determining the fair value of investments). |
| | | | | | |
| | | |
| 18 | | | | JPMORGAN INSURANCE TRUST | | JUNE 30, 2017 |
A financial instrument’s level within the fair value hierarchy is based on the lowest level of any input, both individually and in the aggregate, that is significant to the fair value measurement. The inputs or methodology used for valuing instruments are not necessarily an indication of the risk associated with investing in those instruments.
The following table represents each valuation input as presented on the Schedule of Portfolio Investments (“SOI”):
| | | | | | | | | | | | | | | | |
| | | Level 1
Quoted prices | | | Level 2
Other significant
observable inputs | | | Level 3
Significant
unobservable inputs | | | Total | |
Total Investments in Securities (a) | | $ | 180,161,638 | | | $ | — | | | $ | — | (b) | | $ | 180,161,638 | |
| | | | | | | | | | | | | | | | |
Appreciation in Other Financial Instruments | | | | | | | | | | | | | | | | |
Futures Contracts | | $ | 9,328 | | | $ | — | | | $ | — | | | $ | 9,328 | |
| | | | | | | | | | | | | | | | |
| (a) | All Portfolio holdings designated in level 1 and level 3 are disclosed individually in the SOI. Level 3 consists of warrants. Please refer to the SOI for industry specifics of the portfolio holdings. |
There were no transfers among any levels during the six months ended June 30, 2017.
B. Futures Contracts — The Portfolio used index futures contracts to gain or reduce exposure to the stock market, maintain liquidity or minimize transaction costs. The Portfolio also bought futures contracts to invest incoming cash in the market or sold futures in response to cash outflows, thereby simulating an invested position in the underlying index while maintaining a cash balance for liquidity. The use of futures contracts exposes the Portfolio to equity price risk.
Futures contracts provide for the delayed delivery of the underlying instrument at a fixed price or are settled for a cash amount based on the change in the value of the underlying instrument at a specific date in the future. Upon entering into a futures contract, the Portfolio is required to deposit with the broker, cash or securities in an amount equal to a certain percentage of the contract amount, which is referred to as the initial margin deposit. Subsequent payments, referred to as variation margin, are made or received by the Portfolio periodically and are based on changes in the market value of open futures contracts. Changes in the market value of open futures contracts are recorded as Change in net unrealized appreciation/depreciation on the Statement of Operations. Realized gains or losses, representing the difference between the value of the contract at the time it was opened and the value at the time it was closed, are reported on the Statement of Operations at the closing or expiration of the futures contract. Securities deposited as initial margin are designated on the SOI and cash deposited is recorded on the Statement of Assets and Liabilities. A receivable from and/or a payable to brokers for the daily variation margin is also recorded on the Statement of Assets and Liabilities.
The Portfolio may be subject to the risk that the change in the value of the futures contract may not correlate perfectly with the underlying instrument. Use of long futures contracts subjects the Portfolio to risk of loss in excess of the amounts shown on the Statement of Assets and Liabilities, up to the notional amount of the futures contracts. Use of short futures contracts subjects the Portfolio to unlimited risk of loss. The Portfolio may enter into futures contracts only on exchanges or boards of trade. The exchange or board of trade acts as the counterparty to each futures transaction; therefore, the Portfolio’s credit risk is limited to failure of the exchange or board of trade. Under some circumstances, futures exchanges may establish daily limits on the amount that the price of a futures contract can vary from the previous day’s settlement price, which could effectively prevent liquidation of positions.
The table below discloses the volume of the Portfolio’s futures contracts activity during for the six months ended June 30, 2017:
| | | | |
Futures Contracts: | | | | |
Average Notional Balance Long | | $ | 5,064,750 | |
Ending Notional Balance Long | | | 6,930,070 | |
The Portfolio’s futures contracts are not subject to master netting arrangements (the right to close out all transactions traded with a counterparty and net amounts owed or due across transactions).
C. Security Transactions and Investment Income — Investment transactions are accounted for on the trade date (the date the order to buy or sell is executed). Securities gains and losses are calculated on a specifically identified cost basis. Interest income is determined on the basis of coupon interest accrued using the effective interest method which adjusts for amortization of premiums and accretion of discounts. Dividend income, net of foreign taxes withheld, if any, is recorded on the ex-dividend date or when the Portfolio first learns of the dividend.
To the extent such information is publicly available, the Portfolio records distributions received in excess of income earned from underlying investments as a reduction of cost of investments and/or realized gain. Such amounts are based on estimates if actual amounts are not available and actual amounts of income, realized gain and return of capital may differ from the estimated amounts. The Portfolio adjusts the estimated amounts of the components of distributions (and consequently its net investment income) as necessary once the issuers provide information about the actual composition of the distributions.
| | | | | | | | |
| | | |
| JUNE 30, 2017 | | JPMORGAN INSURANCE TRUST | | | | | 19 | |
NOTES TO FINANCIAL STATEMENTS
AS OF JUNE 30, 2017 (Unaudited) (continued)
D. Allocation of Income and Expenses — Expenses directly attributable to a portfolio are charged directly to that portfolio, while the expenses attributable to more than one portfolio of the Trust are allocated among the respective portfolios. In calculating the NAV of each class, investment income, realized and unrealized gains and losses and expenses, other than class specific expenses, are allocated daily to each class of shares based upon the proportion of net assets of each class at the beginning of each day.
E. Federal Income Taxes — The Portfolio is treated as a separate taxable entity for Federal income tax purposes. The Portfolio’s policy is to comply with the provisions of the Internal Revenue Code of 1986, as amended (the “Code”), applicable to regulated investment companies and to distribute to shareholders all of its distributable net investment income and net realized capital gains on investments. Accordingly, no provision for Federal income tax is necessary. The Portfolio is also a segregated portfolio of assets for insurance purposes and intends to comply with the diversification requirements of Subchapter L of the Code. Management has reviewed the Portfolio’s tax positions for all open tax years and has determined that as ofJune 30, 2017, no liability for income tax is required in the Portfolio’s financial statements for net unrecognized tax benefits. However, management’s conclusions may be subject to future review based on changes in, or the interpretation of, the accounting standards or tax laws and regulations. The Portfolio’s Federal tax returns for the prior three fiscal years remain subject to examination by the Internal Revenue Service.
F. Distributions to Shareholders — Distributions from net investment income are generally declared and paid at least annually and are declared separately for each class. No class has preferential dividend rights; differences in per share rates are due to differences in separate class expenses. Net realized capital gains, if any, are distributed at least annually. The amount of distributions from net investment income and net realized capital gains is determined in accordance with Federal income tax regulations, which may differ from GAAP. To the extent these “book/tax” differences are permanent in nature (i.e., that they result from other than timing of recognition — “temporary differences”), such amounts are reclassified within the capital accounts based on their Federal tax-basis treatment.
The reclassifications for the Portfolio relate primarily to non-taxable dividends.
3. Fees and Other Transactions with Affiliates
A. Investment Advisory Fee — Pursuant to an Investment Advisory Agreement, the Adviser supervises the investments of the Portfolio and for such services is paid a fee. The fee is accrued daily and paid monthly based on the Portfolio’s average daily net assets at an annual rate of 0.65%.
B. Administration Fee — Pursuant to an Administration Agreement, the Administrator provides certain administration services to the Portfolio. In consideration of these services, the Administrator receives a fee accrued daily and paid monthly at an annual rate of 0.15% of the first $25 billion of the average daily net assets of all funds in the J.P. Morgan Funds Complex covered by the Administration Agreement (excluding certain funds of funds and money market funds) and 0.075% of the average daily net assets in excess of $25 billion of all such funds. For the six months ended June 30, 2017, the effective annualized rate was 0.08% of the Portfolio’s average daily net assets, notwithstanding any fee waivers and/or expense reimbursements.
JPMorgan Chase Bank, N.A. (“JPMCB”), a wholly-owned subsidiary of JPMorgan, serves as the Portfolio’s sub-administrator (the “Sub-administrator”). For its services as Sub-administrator, JPMCB receives a portion of the fees payable to the Administrator.
C. Distribution Fees — Pursuant to a Distribution Agreement, JPMorgan Distribution Services, Inc. “JPMDS”), a wholly-owned subsidiary of JPMorgan, serves as the Trust’s principal underwriter and promotes and arranges for the sale of the Portfolio’s shares.
The Board has adopted a Distribution Plan (the “Distribution Plan”) for Class 2 Shares of the Portfolio in accordance with Rule 12b-1 under the 1940 Act. The Class 1 Shares do not charge a distribution fee. The Distribution Plan provides that the Portfolio shall pay distribution fees, including payments to JPMDS, at an annual rate of 0.25% of the average daily net assets of Class 2 Shares.
D. Custodian and Accounting Fees — JPMCB provides portfolio custody and accounting services to the Portfolio. For performing these services, the Portfolio pays JPMCB transaction and asset-based fees that vary according to the number of transactions and positions, plus out-of-pocket expenses. The amounts paid directly to JPMCB by the Portfolio for custody and accounting services are included in Custodian and accounting fees on the Statement of Operations. Payments to the custodian may be reduced by credits earned by the Portfolio, based on uninvested cash balances held by the custodian. Such earnings credits, if any, are presented separately on the Statement of Operations.
Interest expense paid to the custodian related to cash overdrafts, if any, is included in Interest expense to affiliates on the Statement of Operations.
E. Waivers and Reimbursements — The Adviser (for all share classes), Administrator (for all share classes) and/or JPMDS (for Class 2 Shares) have contractually agreed to waive fees and/or reimburse the Portfolio to the extent that total annual operating expenses of the Portfolio (excluding acquired fund fees and expenses, other than certain money market fund fees as described below, dividend and interest expenses related to short sales, interest, taxes, expenses related to litigation and potential litigation and extraordinary expenses) exceed the percentages of the Portfolio’s respective average daily net assets as shown in the table below:
| | | | | | |
| | | Class 1 | | Class 2 | |
| | 1.03% | | | 1.28 | % |
The expense limitation agreement was in effect for the six months ended June 30, 2017 and is in place until at least April 30, 2018.
| | | | | | |
| | | |
| 20 | | | | JPMORGAN INSURANCE TRUST | | JUNE 30, 2017 |
Additionally, the Portfolio may invest in one or more money market funds advised by the Adviser or its affiliates (affiliated money market funds). The Adviser, Administrator and/or JPMDS have contractually agreed to waive fees and/or reimburse expenses in an amount sufficient to offset the respective net fees each collects from the affiliated money market fund on the Portfolio’s investment in such affiliated money market fund.
The amount of waivers resulting from investments in these money market funds for the six months ended June 30, 2017 was $4,192.
F. Other — Certain officers of the Trust are affiliated with the Adviser, the Administrator and JPMDS. Such officers, with the exception of the Chief Compliance Officer, receive no compensation from the Portfolio for serving in their respective roles.
The Board appointed a Chief Compliance Officer to the Portfolio in accordance with Federal securities regulations. The Portfolio, along with other affiliated portfolios, makes reimbursement payments, on a pro-rata basis, to the Administrator for a portion of the fees associated with the Office of the Chief Compliance Officer. Such fees are included in Trustees’ and Chief Compliance Officer’s fees on the Statement of Operations.
The Trust adopted a Trustee Deferred Compensation Plan (the “Plan”) which allows the Independent Trustees to defer the receipt of all or a portion of compensation related to performance of their duties as Trustees. The deferred fees are invested in various J.P. Morgan Funds until distribution in accordance with the Plan.
During for the six months ended June 30, 2017, the Portfolio purchased securities from an underwriting syndicate in which the principal underwriter or members of the syndicate were affiliated with the Adviser.
The Portfolio may use related party broker-dealers. For the six months ended June 30, 2017, the Portfolio incurred $124 in brokerage commissions with broker-dealers affiliated with the Adviser.
The Securities and Exchange Commission (“SEC”) has granted an exemptive order permitting the Portfolio to engage in principal transactions with J.P. Morgan Securities, Inc., an affiliated broker, involving taxable money market instruments, subject to certain conditions.
4. Investment Transactions
During for the six months ended June 30, 2017, purchases and sales of investments (excluding short-term investments) were as follows:
| | | | | | | | |
| | | Purchases
(excluding U.S.
Government) | | | Sales
(excluding U.S.
Government) | |
| | $ | 53,434,019 | | | $ | 46,977,871 | |
During for the six months ended June 30, 2017, there were no purchases or sales of U.S. Government Securities.
5. Federal Income Tax Matters
For Federal income tax purposes, the estimated cost and unrealized appreciation (depreciation) in value of investment securities held at June 30, 2017 were as follows:
| | | | | | | | | | | | | | | | |
| | | Aggregate
Cost | | | Gross
Unrealized
Appreciation | | | Gross
Unrealized
Depreciation | | | Net Unrealized
Appreciation
(Depreciation) | |
| | $ | 141,038,550 | | | $ | 44,154,097 | | | $ | 5,031,009 | | | $ | 39,123,088 | |
Under the Regulated Investment Company Modernization Act of 2010 (the “Act”), net capital losses recognized by the Portfolio after December 31, 2010, are carried forward indefinitely, and retain their character as short-term and/or long-term losses. Prior to the Act, net capital losses incurred by the Portfolio were carried forward for eight years and treated as short-term losses. The Act requires that post-enactment net capital losses be used before pre-enactment net capital losses.
At December 31, 2016, the Portfolio did not have any post-enactment net capital loss carryforwards.
At December 31, 2016, the Portfolio had the following pre-enactment net capital loss carryforwards, expiring during the year indicated, which are available to offset future realized gains:
| * | The entire amount is comprised of capital loss carryforwards from business combinations, which may be limited in future years under the Internal Revenue Code Sections 381-384. |
6. Borrowings
The Portfolio relies upon an exemptive order granted by the SEC (the “Order”) permitting the establishment and operation of an Interfund Lending Facility (the “Facility”). The Facility allows the Portfolio to directly lend and borrow money to or from any other fund relying upon the Order at rates beneficial to both the borrowing and lending funds. Advances under the Facility are taken primarily for temporary or emergency purposes, including the meeting of redemption requests that otherwise might require the untimely disposition of securities, and are subject to the Portfolio’s borrowing
| | | | | | | | |
| | | |
| JUNE 30, 2017 | | JPMORGAN INSURANCE TRUST | | | | | 21 | |
NOTES TO FINANCIAL STATEMENTS
AS OF JUNE 30, 2017 (Unaudited) (continued)
restrictions. The Interfund loan rate is determined, as specified in the Order, by averaging the current repurchase agreement rate and the current bank loan rate. The Order was granted to the Trust and may be relied upon by the Portfolio because the Portfolio and the series of the Trust are all investment companies in the same “group of investment companies” (as defined in Section 12(d)(1)(G) of the 1940 Act).
The Trust and JPMCB have entered into a financing arrangement. Under this arrangement, JPMCB provides an unsecured, uncommitted credit facility in the aggregate amount of $100 million to certain of the J.P. Morgan Funds, including the Portfolio. Advances under the arrangement are taken primarily for temporary or emergency purposes, including the meeting of redemption requests that otherwise might require the untimely disposition of securities, and are subject to the Portfolio’s borrowing restrictions. Interest on borrowings is payable at a rate determined by JPMCB at the time of borrowing. This agreement has been extended until November 6, 2017.
The Portfolio had no borrowings outstanding from the unsecured, uncommitted credit facility during the year ended December 31, 2016.
In addition, effective August 16, 2016, the Trust along with certain other trusts (“Borrowers”) entered into a joint syndicated senior unsecured revolving credit facility totaling $1.5 billion (“Credit Facility”) with various lenders and The Bank of New York Mellon, as administrative agent for the lenders. This Credit Facility provides a source of funds to the Borrowers for temporary and emergency purposes, including the meeting of redemption requests that otherwise might require the untimely disposition of securities. Under the terms of the Credit Facility, a borrowing portfolio must have a minimum of $25,000,000 in adjusted net asset value and not exceed certain adjusted net asset coverage ratios prior to and during the time in which any borrowings are outstanding. If a portfolio does not comply with the aforementioned requirements, the portfolio must remediate within three business days with respect to the $25,000,000 minimum adjusted net asset value or within one business day with respect to certain asset coverage ratios or the administrative agent at the request of, or with the consent of, the lenders may terminate the Credit Facility and declare any outstanding borrowings to be due and payable immediately.
Interest associated with any borrowing under the Credit Facility is charged to the borrowing portfolio at a rate of interest equal to 1.00% plus the greater of the federal funds effective rate or one month LIBOR. The annual commitment fee to maintain the Credit Facility is 0.15% and is incurred on the unused portion of the Credit Facility and is allocated to all participating portfolios pro rata based on their respective net assets. Effective August 15, 2017, this agreement has been amended and restated for a term of 364 days, unless extended. The Portfolio did not utilize the Credit Facility during the year ended December 31, 2016.
7. Risks, Concentrations and Indemnifications
In the normal course of business, the Portfolio enters into contracts that contain a variety of representations which provide general indemnifications. The Portfolio’s maximum exposure under these arrangements is unknown. The amount of exposure would depend on future claims that may be made against the Portfolio that have not yet occurred. However, based on experience, the Portfolio expects the risk of loss to be remote.
As of June 30, 2017, the Portfolio had two omnibus accounts which collectively represented 57.2% of the Portfolio’s net assets. Significant shareholder transactions by these shareholders may impact the Portfolio’s performance.
As of June 30, 2017, the Funds had omnibus accounts which owned more than 10% of the Funds outstanding shares as follows:
| | | | | | | | |
| | | Number of
Non-Affiliated
Omnibus Account | | | % of the fund | |
| | | 2 | | | | 57.2 | % |
8. Investment Company Reporting Modernization
In October 2016, the U.S. Securities and Exchange Commission adopted new rules and forms, and amendments to certain current rules and forms, to modernize the reporting and disclosure of information by registered investment companies. In part, the final rules amend Regulation S-X and will require standardized, enhanced disclosures about derivatives in investment company financial statements, as well as other amendments. The amendments to Regulation S-X will apply to Portfolio’s fiscal year ends on or after August 1, 2017. At this time, management is currently evaluating the impact of the Regulation S-X amendments on the Portfolio’s financial statements and related disclosures. The adoption will have no effect on the Funds’ net assets or results of operations.
| | | | | | |
| | | |
| 22 | | | | JPMORGAN INSURANCE TRUST | | JUNE 30, 2017 |
SCHEDULE OF SHAREHOLDER EXPENSES
(Unaudited)
Hypothetical $1,000 Investment
As a shareholder of the Portfolio, you incur ongoing costs, including investment advisory fees, administration fees, distribution fees (for Class 2 Shares) and other Portfolio expenses. Because the Portfolio is a funding vehicle for Policies and Eligible Plans, you may also incur sales charges and other fees relating to the Policies or Eligible Plans. The examples below are intended to help you understand your ongoing costs (in dollars) of investing in the Portfolio, but not the costs of the Policies or Eligible Plans, and to compare these ongoing costs with the ongoing costs of investing in other mutual funds. The examples assume that you had a $1,000 investment in each Class at the beginning of the reporting period, January 1, 2017, and continued to hold your shares at the end of the reporting period, June 30, 2017.
Actual Expenses
For each Class of the Portfolio in the table below, the first line provides information about actual account values and actual expenses. You may use the information in this line, together with the amount you invested, to estimate the expenses that you paid over the period. Simply divide your account value by $1,000 (for example, an $8,600 account value divided by $1,000 = 8.6), then multiply the result by the number in the first line of each Class under the heading entitled “Expenses Paid During the Period” to estimate the expenses you paid on your account during this period.
Hypothetical Example for Comparison Purposes
The second line of each Class in the table below provides information about hypothetical account values and hypothetical expenses based on the Class’ actual expense ratio and an assumed rate of return of 5% per year before expenses, which is not the Class’ actual return. The hypothetical account values and expenses may not be used to estimate the actual ending account balance or expenses you paid for the period. You may use this information to compare the ongoing costs of investing in the Class of the Portfolio and other funds. To do so, compare this 5% hypothetical example with the 5% hypothetical examples that appear in the shareholder reports of the other funds. Please note that the expenses shown in the table are meant to highlight your ongoing costs only and do not reflect any transaction costs, such as sales charges (loads) or redemption fees or the costs associated with the Policies and Eligible Plans through which the Portfolio is held. Therefore, the second line for each Class in the table is useful in comparing ongoing costs only, and will not help you determine the relative total costs of owning different funds. In addition, if these transaction costs were included, your costs would have been higher. The examples also assume all dividends and distributions have been reinvested.
| | | | | | | | | | | | | | | | |
| | | Beginning
Account Value
January 1, 2017 | | | Ending
Account Value
June 30, 2017 | | | Expenses
Paid During
the Period* | | | Annualized
Expense
Ratio | |
Small Cap Core Portfolio | | | | | | | | | | | | | | | | |
Class 1 | | | | | | | | | | | | | | | | |
Actual | | $ | 1,000.00 | | | $ | 1,048.50 | | | $ | 4.16 | | | | 0.82 | % |
Hypothetical | | | 1,000.00 | | | | 1,020.73 | | | | 4.11 | | | | 0.82 | |
Class 2 | | | | | | | | | | | | | | | | |
Actual | | | 1,000.00 | | | | 1,047.10 | | | | 5.53 | | | | 1.09 | |
Hypothetical | | | 1,000.00 | | | | 1,019.39 | | | | 5.46 | | | | 1.09 | |
| * | Expenses are equal to each Class’ respective annualized expense ratio, multiplied by the average account value over the period, multiplied by 181/365 (to reflect the one-half year period). |
| | | | | | | | |
| | | |
| JUNE 30, 2017 | | JPMORGAN INSURANCE TRUST | | | | | 23 | |
J.P. Morgan Funds are distributed by JPMorgan Distribution Services, Inc., which is an affiliate of JPMorgan Chase & Co. Affiliates of JPMorgan Chase & Co. receive fees for providing various services to the funds.
Contact JPMorgan Distribution Services, Inc. at 1-800-480-4111 for a portfolio prospectus. You can also visit us at www.jpmorganfunds.com. Investors should carefully consider the investment objectives and risk as well as charges and expenses of the mutual fund before investing. The prospectus contains this and other information about the mutual fund. Read the prospectus carefully before investing.
The Portfolio files a complete schedule of its portfolio holdings for the first and third quarters of its fiscal year with the SEC on Form N-Q. The Portfolio’s Forms N-Q are available on the SEC’s website at http://www.sec.gov and may be reviewed and copied at the SEC’s Public Reference Room in Washington, DC. Information on the operation of the SEC’s Public Reference Room may be obtained by calling 1-800-SEC-0330. Shareholders may request the Form N-Q without charge by calling 1-800-480-4111 or by visiting the variable insurance portfolio section of the J.P. Morgan Funds’ website at www.jpmorganfunds.com.
A description of the Portfolio’s policies and procedures with respect to the disclosure of the Portfolio’s holdings is available in the prospectus and Statement of Additional Information.
A copy of proxy policies and procedures is available without charge upon request by calling 1-800-480-4111 and on the Portfolio’s website at www.jpmorganfunds.com. A description of such policies and procedures is on the SEC’s website at www.sec.gov. The Trustees have delegated the authority to vote proxies for securities owned by the Portfolio to the Adviser. A copy of the Portfolio’s voting record for the most recent 12-month period ended June 30 is available on the SEC’s website at www.sec.gov or at the Portfolio’s website at www.jpmorganfunds.com no later than August 31 of each year. The Portfolio’s proxy voting record will include, among other things, a brief description of the matter voted on for each portfolio security, and will state how each vote was cast, for example, for or against the proposal.

J.P. Morgan Asset Management is the marketing name for the asset management businesses of JPMorgan Chase & Co. Those businesses include, but are not limited to, J.P. Morgan Investment Management Inc., Security Capital Research & Management Incorporated and J.P. Morgan Alternative Asset Management, Inc.
| | | | |
| | © JPMorgan Chase & Co., 2017. All rights reserved June 2017. | | SAN-JPMITSCCP-617 |
Semi-Annual Report
JPMorgan Insurance Trust
June 30, 2017 (Unaudited)
JPMorgan Insurance Trust U.S. Equity Portfolio
| | | | |
NOT FDIC INSURED • NO BANK GUARANTEE • MAY LOSE VALUE
| | |  | |
CONTENTS
Investments in the Portfolio are not deposits or obligations of, or guaranteed or endorsed by, any bank and are not insured or guaranteed by the FDIC, the Federal Reserve Board or any other government agency. You could lose money if you sell when the Portfolio’s share price is lower than when you invested.
Past performance is no guarantee of future performance. The general market views expressed in this report are opinions based on market and other conditions through the end of the reporting period and are subject to change without notice. These views are not intended to predict the future performance of the Portfolio or the securities markets. References to specific securities and their issuers are for illustrative purposes only and are not intended to be, and should not be interpreted as, recommendations to purchase or sell such securities. Such views are not meant as investment advice and may not be relied on as an indication of trading intent on behalf of the Portfolio.
This Portfolio is intended to be a funding vehicle for variable annuity contracts and variable life insurance policies (collectively “Policies”) offered by the separate accounts of various insurance companies. Portfolio shares may also be offered to qualified pension and retirement plans and accounts permitting accumulation of assets on a tax-deferred basis (“Eligible Plans”). Individuals may not purchase shares directly from the Portfolio.
Prospective investors should refer to the Portfolio’s prospectus for a discussion of the Portfolio’s investment objective, strategies and risks. Call J.P. Morgan Funds Service Center at 1-800-480-4111 for a prospectus containing more complete information about the Portfolio, including management fees and other expenses. Please read it carefully before investing.
CEO’S LETTER
August 4, 2017 (Unaudited)
Dear Shareholder,
As the U.S. economic expansion entered its eighth year in 2017, growth in both developed and emerging market economies became increasingly synchronized even as U.S. growth cooled in the early part of the year. Amid an environment of economic growth, low inflation and rising corporate earnings, global financial markets overall produced positive returns.
| | |
 | | “In the U.S., the continued economic expansion, muted inflation, corporate earnings growth and historically low volatility in financial markets helped to drive key equity market indexes to multiple record closing highs throughout the first half of 2017.” —George C.W. Gatch |
While U.S. gross domestic product (GDP) growth slowed to 1.2% in the first quarter of 2017, it rebounded to 2.6% growth in the second quarter of 2017 on the back of a surge in consumer spending. Meanwhile, the U.S. jobless rate continued to shrink and fell to 4.4% in June 2017 from 4.8% six months earlier. In response to these numbers, along with nascent signs of price inflation, the U.S. Federal Reserve (the “Fed”) raised interest rates in June 2017 and signaled it would raise rates once more before the end of the year. Fed Chairwoman Janet Yellen also indicated she was prepared to begin partially unwinding the central bank’s $4.5 trillion balance sheet of assets purchased through its quantitative easing program.
Despite the apparent health of the U.S. economy, by mid-2017 domestic price inflation was below the Fed’s target of 2% growth and wage growth remained below economists’ expectations, the latter despite an environment of essentially full employment for U.S. workers. These trends — and the Fed’s acknowledgment of them — provided some near-term uncertainty about the central bank’s commitment to tightening monetary policy.
Throughout the first half of 2017, global energy prices continued to fall amid an oversupply of crude oil and natural gas. Despite efforts by the Organization of Petroleum Exporting
Countries to curb global production, the price of a barrel of benchmark West Texas Intermediate crude oil dropped to $46 by the end of June 2017.
Meanwhile, the leading economies of the European Union (the “EU”) continued to strengthen. Annualized GDP for the 19 core EU nations rose 1.9% in the first quarter of 2017 and 2.1% in the second quarter. The June 2017 aggregate unemployment rate for those nations fell to 9.1%, the lowest level since March 2009. Also, in separate elections, voters in the Netherlands and France largely rejected populist campaigns espousing policies to limit free trade and immigration. The election results provided another boost to global equity prices.
In the U.S., the continued economic expansion, muted inflation, corporate earnings growth and historically low volatility in financial markets helped to drive key equity market indexes to multiple record closing highs throughout the first half of 2017. U.S. investors appeared to shrug off intermittent political and policy dramas emanating from Washington, D.C. and extended the run-up in U.S. equity prices into its eighth consecutive year — one of the longest on record. For the six months ended June 30, 2017, the Standard & Poor’s 500 Index returned 9.34%.
U.S. and foreign financial markets largely rewarded those investors who remained fully invested throughout the first half of 2017, reaffirming the fundamental virtues of patience and diversification within a prudent investment strategy.
We look forward to managing your investment needs for years to come. Should you have any questions, please visit www.jpmorganfunds.com or contact the J.P. Morgan Funds Service Center at 1-800-480-4111.
Sincerely yours,

George C.W. Gatch
CEO, Global Funds Management & Institutional,
J.P. Morgan Asset Management
| | | | | | | | |
| | | |
| JUNE 30, 2017 | | JPMORGAN INSURANCE TRUST | | | | | 1 | |
JPMorgan Insurance Trust U.S. Equity Portfolio
PORTFOLIO COMMENTARY
SIX MONTHS ENDED JUNE 30, 2017 (Unaudited)
| | | | |
| Reporting Period Return: | |
| Portfolio (Class 1 Shares)* | | | 9.47% | |
| S&P 500 Index** | | | 9.34% | |
| |
| Net Assets as of 6/30/2017 | | $ | 104,050,375 | |
INVESTMENT OBJECTIVE***
The JPMorgan Insurance Trust U.S. Equity Portfolio (the “Portfolio”) seeks to provide high total return from a portfolio of selected equity securities.
HOW DID THE MARKET PERFORM?
While U.S. equity markets continued to provide positive returns for the past six months, the magnitude of those gains slowed somewhat as key stock market indexes touched multiple closing highs and largely held near record territory. Steady global economic growth, continued low inflation and strong corporate earnings all served to support equity prices, both in the U.S. and elsewhere. Globally, emerging market equities generally outperformed the U.S. and other developed market equities during the reporting period.
Amid investor expectations that the incoming Trump administration and Republican Party majorities in the U.S. Congress would move quickly on infrastructure spending and tax policy, U.S. equities began 2017 with positive returns amid low volatility. Even as those investor expectations began to fade, U.S. equity prices continued to climb.
In February 2017, the Standard & Poor’s 500 Index (the “S&P 500”) reached nine new closing highs and the Dow Jones Industrial Average (the “DJIA”) closed at new highs for 12 consecutive days, matching a record set in 1987. The following month, the S&P 500 crossed 2,400 points in intraday trading for the first time and the DJIA crossed 21,000 points for the first time. While the rally in U.S. equities paused in April 2017, record high U.S. corporate operating earnings rekindled the rise in stock prices and the S&P 500 posted seven new closing highs in May 2017 and four new closing highs in June 2017.
Importantly, U.S. financial market volatility remained near 10-year lows throughout the reporting period. By the end of June 2017, the CBOE Volatility Index averaged 10.5 points, which was about half of its historical average. Overall, large cap stocks generally outperformed mid cap and small cap stocks, while growth stocks generally outperformed value stocks. For the six months ended June 30, 2017, the S&P 500 returned 9.34%.
WHAT WERE THE MAIN DRIVERS OF THE PORTFOLIO’S PERFORMANCE?
The Portfolio’s Class 1 Shares outperformed the S&P 500 (the “Benchmark”) for the six months ended June 30, 2017. The Portfolio’s security selection in the semiconductors & hardware sector and the telecommunications sector was a leading contributor to performance relative to the Benchmark, while the Portfolio’s security selection in the pharmaceutical/medical technology sector and the media sector was a leading detractor from relative performance.
Leading individual contributors to relative performance included the Portfolio’s overweight positions in Broadcom Ltd. and Vertex Pharmaceuticals Inc. and its underweight position in Intel Corp. Shares of Broadcom, a semiconductor maker, rose after the company reported better than expected earnings and revenue. Shares of Vertex Pharmaceuticals, a drug maker, rose after the U.S. Food and Drug Administration approved the company’s treatment for cystic fibrosis. Shares of Intel, a semiconductor maker that was not held in the Portfolio, fell on investor expectations of increased competition from Advanced Micro Devices Inc.
Leading individual detractors from relative performance included the Fund’s overweight positions in Walt Disney Co. and Molson Coors Brewing Co. and its underweight position in McDonald’s Corp. Shares of Walt Disney, a media and entertainment company, fell after the company reported lower-than-expected revenue. Shares of Molson Coors Brewing, a beer and beverage maker, fell after the company posted lower-than-expected earnings. Shares of McDonald’s, a fast-food maker and franchiser that was not held in the Portfolio, rose on better-than-expected earnings and sales.
HOW WAS THE PORTFOLIO POSITIONED?
The portfolio managers employed a bottom-up fundamental approach to stock selection, researching companies to determine what they believed to be their underlying value and potential for future earnings growth. As a result of the Portfolio’s bottom-up fundamental approach to stock selection, the Portfolio’s largest average overweight position compared with the Benchmark was in the insurance sector and its largest average underweight position was in the real estate investment trusts sector.
| | | | | | |
| | | |
| 2 | | | | JPMORGAN INSURANCE TRUST | | JUNE 30, 2017 |
| | | | | | | | |
| TOP TEN EQUITY HOLDINGS OF THE PORTFOLIO**** | |
| | 1. | | | Apple, Inc. | | | 4.1 | % |
| | 2. | | | Microsoft Corp. | | | 3.5 | |
| | 3. | | | UnitedHealth Group, Inc. | | | 3.0 | |
| | 4. | | | Citigroup, Inc. | | | 2.7 | |
| | 5. | | | Walt Disney Co. (The) | | | 2.4 | |
| | 6. | | | PepsiCo, Inc. | | | 2.3 | |
| | 7. | | | Pfizer, Inc. | | | 2.3 | |
| | 8. | | | Bank of America Corp. | | | 2.1 | |
| | 9. | | | Alphabet, Inc., Class A | | | 2.1 | |
| | 10. | | | General Electric Co. | | | 2.1 | |
| | | | | | | | |
PORTFOLIO COMPOSITION BY SECTOR**** | |
| Information Technology | | | | | | | 24.3 | % |
| Financials | | | | | | | 14.9 | |
| Consumer Discretionary | | | | | | | 13.8 | |
| Health Care | | | | | | | 13.7 | |
| Industrials | | | | | | | 13.1 | |
| Consumer Staples | | | | | | | 6.8 | |
| Energy | | | | | | | 6.3 | |
| Utilities | | | | | | | 3.0 | |
| Materials | | | | | | | 1.7 | |
| Others (each less than 1.0%) | | | | | | | 1.5 | |
| Short-Term Investment | | | | | | | 0.9 | |
| * | | The return shown is based on net asset values calculated for shareholder transactions and may differ from the return shown in the financial highlights, which reflects adjustments made to the net asset values in accordance with accounting principles generally accepted in the United States of America. |
| ** | | “S&P 500 Index” is a registered service mark of Standard & Poor’s Corporation, which does not sponsor, and is in no way affiliated with, the Portfolio. |
| *** | | The adviser seeks to achieve the Portfolio’s objective. There can be no guarantee it will be achieved. |
| **** | | Percentages indicated are based on total investments as of June 30, 2017. The Portfolio’s composition is subject to change. |
| | | | | | | | |
| | | |
| JUNE 30, 2017 | | JPMORGAN INSURANCE TRUST | | | | | 3 | |
JPMorgan Insurance Trust U.S. Equity Portfolio
PORTFOLIO COMMENTARY
SIX MONTHS ENDED JUNE 30, 2017 (Unaudited) (continued)
| | | | | | | | | | | | | | | | | | | | |
AVERAGE ANNUAL TOTAL RETURNS AS OF JUNE 30, 2017 | |
| | | | | |
| | | INCEPTION DATE OF
CLASS | | | 6 MONTH* | | | 1 YEAR | | | 5 YEAR | | | 10 YEAR | |
CLASS 1 SHARES | | | March 30, 1995 | | | | 9.47 | % | | | 21.32 | % | | | 15.46 | % | | | 8.14 | % |
CLASS 2 SHARES | | | August 16, 2006 | | | | 9.34 | | | | 21.01 | | | | 15.17 | | | | 7.87 | |
TEN YEAR PERFORMANCE (6/30/07 TO 6/30/17)
The performance quoted is past performance and is not a guarantee of future results. Mutual funds are subject to certain market risks. Investment returns and principal value of an investment will fluctuate so that an investor’s shares, when redeemed, may be worth more or less than their original cost. Current performance may be higher or lower than the performance data shown. For up-to-date month-end performance information please call 1-800-480-4111.
The graph illustrates comparative performance for $10,000 invested in Class 1 Shares of the JPMorgan Insurance Trust U.S. Equity Portfolio, the S&P 500 Index and the Lipper Variable Underlying Funds Large-Cap Core Funds Index from June 30, 2007 to June 30, 2017. The performance of the Portfolio assumes reinvestment of all dividends and capital gain distributions, if any. The performance of the S&P 500 Index does not reflect the deduction of expenses associated with a mutual fund and has been adjusted to reflect reinvestment of all dividends and capital gain distributions of the securities included in the benchmark, if applicable. The performance of the Lipper Variable Underlying Funds Large-Cap Core Funds Index includes expenses associated with a mutual
fund, such as investment management fees. These expenses are not identical to the expenses incurred by the Portfolio. The S&P 500 Index is an unmanaged index generally representative of the performance of large companies in the U.S. stock market. The Lipper Variable Underlying Funds Large-Cap Core Funds Index is an index based on the total returns of certain mutual funds within the Portfolio’s designated category as determined by Lipper, Inc. Investors cannot invest directly in an index.
Portfolio performance does not reflect any charges imposed by the Policies or Eligible Plans. If these charges were included, the returns would be lower than shown. Portfolio performance may reflect the waiver of the Portfolio’s fees and reimbursement of expenses for certain periods since the inception date. Without these waivers and reimbursements, performance would have been lower.
The returns shown are based on net asset values calculated for shareholder transactions and may differ from the returns shown in the financial highlights, which reflect adjustments made to the net asset values in accordance with accounting principles generally accepted in the United States of America.
| | | | | | |
| | | |
| 4 | | | | JPMORGAN INSURANCE TRUST | | JUNE 30, 2017 |
JPMorgan Insurance Trust U.S. Equity Portfolio
SCHEDULE OF PORTFOLIO INVESTMENTS
AS OF JUNE 30, 2017 (Unaudited)
| | | | | | | | |
| SHARES | | | SECURITY DESCRIPTION | | VALUE($) | |
| | Common Stocks — 99.1% | | | | |
| | | | Consumer Discretionary — 13.8% | | | | |
| | | | Automobiles — 0.3% | | | | |
| | 7,981 | | | General Motors Co. | | | 278,776 | |
| | | | | | | | |
| | | | Hotels, Restaurants & Leisure — 1.5% | |
| | 1,987 | | | Hilton Worldwide Holdings, Inc. | | | 122,896 | |
| | 3,158 | | | Royal Caribbean Cruises Ltd. | | | 344,948 | |
| | 18,886 | | | Starbucks Corp. | | | 1,101,243 | |
| | | | | | | | |
| | | | | | | 1,569,087 | |
| | | | | | | | |
| | | | Household Durables — 0.5% | | | | |
| | 4,639 | | | DR Horton, Inc. | | | 160,370 | |
| | 1,486 | | | Mohawk Industries, Inc. (a) | | | 359,152 | |
| | | | | | | | |
| | | | | | | 519,522 | |
| | | | | | | | |
| | | | Internet & Direct Marketing Retail — 2.0% | |
| | 2,111 | | | Amazon.com, Inc. (a) | | | 2,043,448 | |
| | | | | | | | |
| | | | Media — 5.0% | |
| | 3,253 | | | Charter Communications, Inc., Class A (a) | | | 1,095,773 | |
| | 16,882 | | | Comcast Corp., Class A | | | 657,047 | |
| | 10,171 | | | DISH Network Corp., Class A (a) | | | 638,332 | |
| | 13,081 | | | Twenty-First Century Fox, Inc., Class A | | | 370,716 | |
| | 23,505 | | | Walt Disney Co. (The) | | | 2,497,406 | |
| | | | | | | | |
| | | | | | | 5,259,274 | |
| | | | | | | | |
| | | | Specialty Retail — 3.8% | | | | |
| | 551 | | | AutoZone, Inc. (a) | | | 314,323 | |
| | 9,308 | | | Home Depot, Inc. (The) | | | 1,427,847 | |
| | 9,999 | | | Lowe’s Cos., Inc. | | | 775,223 | |
| | 1,708 | | | O’Reilly Automotive, Inc. (a) | | | 373,608 | |
| | 14,970 | | | TJX Cos., Inc. (The) | | | 1,080,385 | |
| | | | | | | | |
| | | | | | | 3,971,386 | |
| | | | | | | | |
| | | | Textiles, Apparel & Luxury Goods — 0.7% | | | | |
| | 11,656 | | | NIKE, Inc., Class B | | | 687,704 | |
| | | | | | | | |
| | | | Total Consumer Discretionary | | | 14,329,197 | |
| | | | | | | | |
| | | | Consumer Staples — 6.8% | | | | |
| | | | Beverages — 3.8% | |
| | 3,262 | | | Constellation Brands, Inc., Class A | | | 631,947 | |
| | 10,982 | | | Molson Coors Brewing Co., Class B | | | 948,186 | |
| | 20,935 | | | PepsiCo, Inc. | | | 2,417,783 | |
| | | | | | | | |
| | | | | | | 3,997,916 | |
| | | | | | | | |
| | | | Food & Staples Retailing — 0.7% | | | | |
| | 14,689 | | | Kroger Co. (The) | | | 342,548 | |
| | 4,672 | | | Walgreens Boots Alliance, Inc. | | | 365,864 | |
| | | | | | | | |
| | | | | | | 708,412 | |
| | | | | | | | |
| | | | | | | | |
| SHARES | | | SECURITY DESCRIPTION | | VALUE($) | |
| | | | | | | | |
| | | | Food Products — 1.2% | | | | |
| | 27,872 | | | Mondelez International, Inc., Class A | | | 1,203,792 | |
| | | | | | | | |
| | | | Personal Products — 0.2% | |
| | 2,480 | | | Estee Lauder Cos., Inc. (The), Class A | | | 238,030 | |
| | | | | | | | |
| | | | Tobacco — 0.9% | |
| | 1,948 | | | Altria Group, Inc. | | | 145,068 | |
| | 6,350 | | | Philip Morris International, Inc. | | | 745,807 | |
| | | | | | | | |
| | | | | | | 890,875 | |
| | | | | | | | |
| | | | Total Consumer Staples | | | 7,039,025 | |
| | | | | | | | |
| | | | Energy — 6.3% | | | | |
| | | | Oil, Gas & Consumable Fuels — 6.3% | |
| | 4,231 | | | Anadarko Petroleum Corp. | | | 191,834 | |
| | 8,141 | | | Apache Corp. | | | 390,198 | |
| | 4,060 | | | Chevron Corp. | | | 423,580 | |
| | 6,333 | | | Concho Resources, Inc. (a) | | | 769,650 | |
| | 7,757 | | | Diamondback Energy, Inc. (a) | | | 688,899 | |
| | 18,443 | | | EOG Resources, Inc. | | | 1,669,460 | |
| | 4,645 | | | EQT Corp. | | | 272,151 | |
| | 3,867 | | | Occidental Petroleum Corp. | | | 231,517 | |
| | 4,541 | | | Parsley Energy, Inc., Class A (a) | | | 126,013 | |
| | 2,719 | | | Phillips 66 | | | 224,834 | |
| | 9,079 | | | Pioneer Natural Resources Co. | | | 1,448,827 | |
| | 5,578 | | | Plains GP Holdings LP, Class A | | | 145,920 | |
| | | | | | | | |
| | | | Total Energy | | | 6,582,883 | |
| | | | | | | | |
| | | | Financials — 14.9% | | | | |
| | | | Banks — 7.5% | |
| | 91,564 | | | Bank of America Corp. | | | 2,221,343 | |
| | 42,363 | | | Citigroup, Inc. | | | 2,833,238 | |
| | 22,720 | | | Huntington Bancshares, Inc. | | | 307,174 | |
| | 34,534 | | | KeyCorp | | | 647,167 | |
| | 9,709 | | | SunTrust Banks, Inc. | | | 550,695 | |
| | 1,732 | | | SVB Financial Group (a) | | | 304,468 | |
| | 16,852 | | | Wells Fargo & Co. | | | 933,769 | |
| | | | | | | | |
| | | | | | | 7,797,854 | |
| | | | | | | | |
| | | | Capital Markets — 2.7% | | | | |
| | 3,250 | | | Ameriprise Financial, Inc. | | | 413,693 | |
| | 9,169 | | | Charles Schwab Corp. (The) | | | 393,900 | |
| | 6,009 | | | Intercontinental Exchange, Inc. | | | 396,113 | |
| | 35,898 | | | Morgan Stanley | | | 1,599,615 | |
| | | | | | | | |
| | | | | | | 2,803,321 | |
| | | | | | | | |
| | | | Consumer Finance — 0.3% | | | | |
| | 4,269 | | | Capital One Financial Corp. | | | 352,705 | |
| | | | | | | | |
| | | | Diversified Financial Services — 0.2% | |
| | 6,733 | | | Voya Financial, Inc. | | | 248,380 | |
| | | | | | | | |
SEE NOTES TO FINANCIAL STATEMENTS.
| | | | | | | | |
| | | |
| JUNE 30, 2017 | | JPMORGAN INSURANCE TRUST | | | | | 5 | |
JPMorgan Insurance Trust U.S. Equity Portfolio
SCHEDULE OF PORTFOLIO INVESTMENTS
AS OF JUNE 30, 2017 (Unaudited) (continued)
| | | | | | | | |
| SHARES | | | SECURITY DESCRIPTION | | VALUE($) | |
| | Common Stocks — continued | | | | |
| | | | Insurance — 4.2% | | | | |
| | 16,949 | | | American International Group, Inc. | | | 1,059,652 | |
| | 7,889 | | | Arthur J Gallagher & Co. | | | 451,645 | |
| | 8,739 | | | Chubb Ltd. | | | 1,270,476 | |
| | 6,847 | | | Hartford Financial Services Group, Inc. (The) | | | 359,947 | |
| | 2,347 | | | Lincoln National Corp. | | | 158,610 | |
| | 9,876 | | | MetLife, Inc. | | | 542,587 | |
| | 3,389 | | | Prudential Financial, Inc. | | | 366,486 | |
| | 2,634 | | | Validus Holdings Ltd. | | | 136,889 | |
| | | | | | | | |
| | | | | | | 4,346,292 | |
| | | | | | | | |
| | | | Total Financials | | | 15,548,552 | |
| | | | | | | | |
| | | | Health Care — 13.7% | | | | |
| | | | Biotechnology — 1.9% | |
| | 1,300 | | | Biogen, Inc. (a) | | | 352,768 | |
| | 3,285 | | | Celgene Corp. (a) | | | 426,623 | |
| | 5,420 | | | Gilead Sciences, Inc. | | | 383,628 | |
| | 1,516 | | | Incyte Corp. (a) | | | 190,879 | |
| | 4,739 | | | Vertex Pharmaceuticals, Inc. (a) | | | 610,715 | |
| | | | | | | | |
| | | | | | | 1,964,613 | |
| | | | | | | | |
| | | | Health Care Equipment & Supplies — 1.8% | |
| | 6,736 | | | Abbott Laboratories | | | 327,437 | |
| | 47,273 | | | Boston Scientific Corp. (a) | | | 1,310,408 | |
| | 1,500 | | | Zimmer Biomet Holdings, Inc. | | | 192,600 | |
| | | | | | | | |
| | | | | | | 1,830,445 | |
| | | | | | | | |
| | | | Health Care Providers & Services — 3.5% | | | | |
| | 1,158 | | | Humana, Inc. | | | 278,638 | |
| | 1,680 | | | McKesson Corp. | | | 276,427 | |
| | 16,617 | | | UnitedHealth Group, Inc. | | | 3,081,124 | |
| | | | | | | | |
| | | | | | | 3,636,189 | |
| | | | | | | | |
| | | | Life Sciences Tools & Services — 0.8% | | | | |
| | 10,500 | | | Agilent Technologies, Inc. | | | 622,755 | |
| | 1,403 | | | Thermo Fisher Scientific, Inc. | | | 244,781 | |
| | | | | | | | |
| | | | | | | 867,536 | |
| | | | | | | | |
| | | | Pharmaceuticals — 5.7% | | | | |
| | 4,058 | | | Allergan plc | | | 986,459 | |
| | 10,714 | | | Bristol-Myers Squibb Co. | | | 596,984 | |
| | 15,014 | | | Eli Lilly & Co. | | | 1,235,652 | |
| | 11,089 | | | Merck & Co., Inc. | | | 710,694 | |
| | 70,838 | | | Pfizer, Inc. | | | 2,379,449 | |
| | | | | | | | |
| | | | | | | 5,909,238 | |
| | | | | | | | |
| | | | Total Health Care | | | 14,208,021 | |
| | | | | | | | |
| | | | | | | | |
| | | | | | | | |
| SHARES | | | SECURITY DESCRIPTION | | VALUE($) | |
| | | | | | | | |
| | | | Industrials — 13.1% | | | | |
| | | | Aerospace & Defense — 2.8% | |
| | 6,931 | | | General Dynamics Corp. | | | 1,373,031 | |
| | 3,302 | | | L3 Technologies, Inc. | | | 551,698 | |
| | 3,885 | | | Northrop Grumman Corp. | | | 997,319 | |
| | | | | | | | |
| | | | | | | 2,922,048 | |
| | | | | | | | |
| | | | Airlines — 0.7% | | | | |
| | 9,800 | | | United Continental Holdings, Inc. (a) | | | 737,450 | |
| | | | | | | | |
| | | | Building Products — 0.4% | |
| | 9,276 | | | Masco Corp. | | | 354,436 | |
| | | | | | | | |
| | | | Electrical Equipment — 0.8% | |
| | 1,436 | | | Acuity Brands, Inc. | | | 291,910 | |
| | 7,395 | | | Eaton Corp. plc | | | 575,553 | |
| | | | | | | | |
| | | | | | | 867,463 | |
| | | | | | | | |
| | | | Industrial Conglomerates — 2.8% | | | | |
| | 81,679 | | | General Electric Co. | | | 2,206,150 | |
| | 5,236 | | | Honeywell International, Inc. | | | 697,906 | |
| | | | | | | | |
| | | | | | | 2,904,056 | |
| | | | | | | | |
| | | | Machinery — 3.3% | | | | |
| | 4,751 | | | Deere & Co. | | | 587,176 | |
| | 12,736 | | | Ingersoll-Rand plc | | | 1,163,943 | |
| | 4,532 | | | PACCAR, Inc. | | | 299,293 | |
| | 1,048 | | | Snap-on, Inc. | | | 165,584 | |
| | 8,443 | | | Stanley Black & Decker, Inc. | | | 1,188,184 | |
| | | | | | | | |
| | | | | | | 3,404,180 | |
| | | | | | | | |
| | | | Road & Rail — 2.1% | | | | |
| | 7,917 | | | Norfolk Southern Corp. | | | 963,499 | |
| | 11,562 | | | Union Pacific Corp. | | | 1,259,217 | |
| | | | | | | | |
| | | | | | | 2,222,716 | |
| | | | | | | | |
| | | | Trading Companies & Distributors — 0.2% | |
| | 7,213 | | | HD Supply Holdings, Inc. (a) | | | 220,934 | |
| | | | | | | | |
| | | | Total Industrials | | | 13,633,283 | |
| | | | | | | | |
| | | | Information Technology — 24.3% | | | | |
| | | | Electronic Equipment, Instruments & Components — 0.1% | |
| | 1,478 | | | TE Connectivity Ltd. | | | 116,289 | |
| | | | | | | | |
| | | | Internet Software & Services — 6.0% | |
| | 2,388 | | | Alphabet, Inc., Class A (a) | | | 2,220,076 | |
| | 2,419 | | | Alphabet, Inc., Class C (a) | | | 2,198,218 | |
| | 12,183 | | | Facebook, Inc., Class A (a) | | | 1,839,389 | |
| | | | | | | | |
| | | | | | | 6,257,683 | |
| | | | | | | | |
SEE NOTES TO FINANCIAL STATEMENTS.
| | | | | | |
| | | |
| 6 | | | | JPMORGAN INSURANCE TRUST | | JUNE 30, 2017 |
| | | | | | | | |
| SHARES | | | SECURITY DESCRIPTION | | VALUE($) | |
| | Common Stocks — continued | | | | |
| | | | IT Services — 4.3% | | | | |
| | 14,377 | | | Accenture plc, Class A | | | 1,778,147 | |
| | 2,138 | | | International Business Machines Corp. | | | 328,889 | |
| | 22,768 | | | Visa, Inc., Class A | | | 2,135,183 | |
| | 1,663 | | | WEX, Inc. (a) | | | 173,401 | |
| | | | | | | | |
| | | | | | | 4,415,620 | |
| | | | | | | | |
| | | | Semiconductors & Semiconductor Equipment — 5.2% | |
| | 17,221 | | | Analog Devices, Inc. | | | 1,339,794 | |
| | 5,982 | | | Broadcom Ltd. | | | 1,394,105 | |
| | 9,396 | | | Microchip Technology, Inc. | | | 725,183 | |
| | 25,957 | | | Texas Instruments, Inc. | | | 1,996,872 | |
| | | | | | | | |
| | | | | | | 5,455,954 | |
| | | | | | | | |
| | | | Software — 4.6% | | | | |
| | 7,729 | | | Adobe Systems, Inc. (a) | | | 1,093,190 | |
| | 52,810 | | | Microsoft Corp. | | | 3,640,193 | |
| | | | | | | | |
| | | | | | | 4,733,383 | |
| | | | | | | | |
| | | | Technology Hardware, Storage & Peripherals — 4.1% | |
| | 29,607 | | | Apple, Inc. | | | 4,264,000 | |
| | | | | | | | |
| | | | Total Information Technology | | | 25,242,929 | |
| | | | | | | | |
| | | | Materials — 1.7% | | | | |
| | | | Chemicals — 0.8% | |
| | 1,974 | | | Eastman Chemical Co. | | | 165,796 | |
| | 5,540 | | | EI du Pont de Nemours & Co. | | | 447,133 | |
| | 8,096 | | | Mosaic Co. (The) | | | 184,832 | |
| | | | | | | | |
| | | | | | | 797,761 | |
| | | | | | | | |
| | | | Construction Materials — 0.4% | | | | |
| | 3,068 | | | Vulcan Materials Co. | | | 388,654 | |
| | | | | | | | |
| | | | Containers & Packaging — 0.5% | |
| | 3,297 | | | Crown Holdings, Inc. (a) | | | 196,699 | |
| | 6,195 | | | WestRock Co. | | | 351,009 | |
| | | | | | | | |
| | | | | | | 547,708 | |
| | | | | | | | |
| | | | Total Materials | | | 1,734,123 | |
| | | | | | | | |
| | | | | | | | |
| SHARES | | | SECURITY DESCRIPTION | | VALUE($) | |
| | | | | | | | |
| | | | Real Estate — 0.8% | | | | |
| | | | Equity Real Estate Investment Trusts (REITs) — 0.8% | |
| | 6,931 | | | Prologis, Inc. | | | 406,434 | |
| | 1,082 | | | Public Storage | | | 225,630 | |
| | 1,977 | | | Vornado Realty Trust | | | 185,640 | |
| | | | | | | | |
| | | | Total Real Estate | | | 817,704 | |
| | | | | | | | |
| | | | Telecommunication Services — 0.7% | | | | |
| | | | Diversified Telecommunication Services — 0.6% | |
| | 7,298 | | | AT&T, Inc. | | | 275,353 | |
| | 8,998 | | | Verizon Communications, Inc. | | | 401,851 | |
| | | | | | | | |
| | | | | | | 677,204 | |
| | | | | | | | |
| | | | Wireless Telecommunication Services — 0.1% | |
| | 1,704 | | | T-Mobile US, Inc. (a) | | | 103,297 | |
| | | | | | | | |
| | | | Total Telecommunication Services | | | 780,501 | |
| | | | | | | | |
| | | | Utilities — 3.0% | | | | |
| | | | Electric Utilities — 3.0% | |
| | 10,129 | | | Edison International | | | 791,987 | |
| | 8,132 | | | NextEra Energy, Inc. | | | 1,139,537 | |
| | 7,792 | | | PG&E Corp. | | | 517,155 | |
| | 14,509 | | | Xcel Energy, Inc. | | | 665,673 | |
| | | | | | | | |
| | | | Total Utilities | | | 3,114,352 | |
| | | | | | | | |
| | | | Total Common Stocks
(Cost 80,048,668) | | | 103,030,570 | |
| | | | | | | | |
| | Short-Term Investment — 0.9% | |
| | | | Investment Company — 0.9% | |
| | 974,215 | | | JPMorgan U.S. Government Money Market Fund, Institutional Class Shares, 0.840% (b) (l)
(Cost $974,215) | | | 974,215 | |
| | | | | | | | |
| | | | Total Investments — 100.0%
(Cost 81,022,883) | | | 104,004,785 | |
| | | | Other Assets in Excess of
Liabilities — 0.0% (g) | | | 45,590 | |
| | | | | | | | |
| | | | NET ASSETS — 100.0% | | $ | 104,050,375 | |
| | | | | | | | |
Percentages indicated are based on net assets.
| | | | | | | | | | | | | | | | | | | | |
| Futures Contracts | |
NUMBER OF
CONTRACTS | | | DESCRIPTION | | EXPIRATION
DATE | | | TRADING
CURRENCY | | | NOTIONAL
VALUE AT
JUNE 30, 2017 | | | NET UNREALIZED
APPRECIATION
(DEPRECIATION) | |
| | | | Long Futures Outstanding | |
| | 2 | | | E-mini S&P 500 Index | | | 09/15/17 | | | | USD | | | $ | 242,090 | | | $ | (1,764 | ) |
| | | | | | | | | | | | | | | | | | | | |
SEE NOTES TO FINANCIAL STATEMENTS.
| | | | | | | | |
| | | |
| JUNE 30, 2017 | | JPMORGAN INSURANCE TRUST | | | | | 7 | |
JPMorgan Insurance Trust U.S. Equity Portfolio
NOTES TO SCHEDULE OF PORTFOLIO INVESTMENTS:
AS OF JUNE 30, 2017 (Unaudited)
| | |
| USD | | — United States Dollar |
| |
| (a) | | — Non-income producing security. |
| (b) | | — Investment in affiliate. Money market fund is registered under the Investment Company Act of 1940, as amended, and advised by J.P. Morgan Investment Management Inc. |
| (g) | | — Amount rounds to less than 0.05%. |
| (l) | | — The rate shown is the current yield as of June 30, 2017. |
SEE NOTES TO FINANCIAL STATEMENTS.
| | | | | | |
| | | |
| 8 | | | | JPMORGAN INSURANCE TRUST | | JUNE 30, 2017 |
STATEMENT OF ASSETS AND LIABILITIES
AS OF JUNE 30, 2017 (Unaudited)
| | | | |
| | |
U.S. Equity Portfolio | |
ASSETS: | |
Investments in non-affiliates, at value | | $ | 103,030,570 | |
Investments in affiliates, at value | | | 974,215 | |
| | | | |
Total investment securities, at value | | | 104,004,785 | |
Cash | | | 809 | |
Deposits at broker for futures contracts | | | 25,000 | |
Receivables: | | | | |
Investment securities sold | | | 918,112 | |
Portfolio shares sold | | | 64,727 | |
Dividends from non-affiliates | | | 85,922 | |
Dividends from affiliates | | | 846 | |
Variation margin on futures contracts | | | 86 | |
| | | | |
Total Assets | | | 105,100,287 | |
| | | | |
| |
LIABILITIES: | | | | |
Payables: | | | | |
Investment securities purchased | | | 881,694 | |
Portfolio shares redeemed | | | 66,573 | |
Accrued liabilities: | | | | |
Investment advisory fees | | | 47,141 | |
Administration fees | | | 6,989 | |
Distribution fees | | | 2,838 | |
Custodian and accounting fees | | | 4,842 | |
Trustees’ and Chief Compliance Officer’s fees | | | 304 | |
Other | | | 39,531 | |
| | | | |
Total Liabilities | | | 1,049,912 | |
| | | | |
Net Assets | | $ | 104,050,375 | |
| | | | |
| |
NET ASSETS: | | | | |
Paid-in-Capital | | $ | 74,868,143 | |
Accumulated undistributed net investment income | | | 375,856 | |
Accumulated net realized gains (losses) | | | 5,826,238 | |
Net unrealized appreciation (depreciation) | | | 22,980,138 | |
| | | | |
Total Net Assets | | $ | 104,050,375 | |
| | | | |
| |
Net Assets: | | | | |
Class 1 | | $ | 90,223,983 | |
Class 2 | | | 13,826,392 | |
| | | | |
Total | | $ | 104,050,375 | |
| | | | |
| |
Outstanding units of beneficial interest (shares) | | | | |
(unlimited number of shares authorized, no par value): | | | | |
Class 1 | | | 3,108,871 | |
Class 2 | | | 481,098 | |
| |
Net Asset Value, offering and redemption price per share (a): | | | | |
Class 1 | | $ | 29.02 | |
Class 2 | | | 28.74 | |
| | | | |
| |
Cost of investments in non-affiliates | | $ | 80,048,668 | |
Cost of investments in affiliates | | | 974,215 | |
| (a) | Per share amounts may not recalculate due to rounding of net assets and/or shares outstanding. |
SEE NOTES TO FINANCIAL STATEMENTS.
| | | | | | | | |
| | | |
| JUNE 30, 2017 | | JPMORGAN INSURANCE TRUST | | | | | 9 | |
STATEMENT OF OPERATIONS
FOR THE SIX MONTHS ENDED JUNE 30, 2017 (Unaudited)
| | | | |
| | |
U.S. Equity
Portfolio | |
INVESTMENT INCOME: | | | | |
Dividend income from non-affiliates | | $ | 833,905 | |
Dividend income from affiliates | | | 3,247 | |
| | | | |
Total investment income | | | 837,152 | |
| | | | |
| |
EXPENSES: | | | | |
Investment advisory fees | | | 284,238 | |
Administration fees | | | 42,220 | |
Distribution fees — Class 2 | | | 16,257 | |
Custodian and accounting fees | | | 24,222 | |
Professional fees | | | 25,923 | |
Trustees’ and Chief Compliance Officer’s fees | | | 13,203 | |
Printing and mailing costs | | | 9,715 | |
Transfer agency fees — Class 1 | | | 1,009 | |
Transfer agency fees — Class 2 | | | 2 | |
Other | | | 5,191 | |
| | | | |
Total expenses | | | 421,980 | |
| | | | |
Less fees waived | | | (1,015 | ) |
| | | | |
Net expenses | | | 420,965 | |
| | | | |
Net investment income (loss) | | | 416,187 | |
| | | | |
| |
REALIZED/UNREALIZED GAINS (LOSSES): | | | | |
Net realized gain (loss) on transactions from: | | | | |
Investments in non-affiliates | | | 7,592,398 | |
Futures | | | 1,451 | |
| | | | |
Net realized gain (loss) | | | 7,593,849 | |
| | | | |
Change in net unrealized appreciation/depreciation on: | | | | |
Investments in non-affiliates | | | 1,290,997 | |
Futures | | | (1,764 | ) |
| | | | |
Change in net unrealized appreciation/depreciation | | | 1,289,233 | |
| | | | |
Net realized/unrealized gains (losses) | | | 8,883,082 | |
| | | | |
Change in net assets resulting from operations | | $ | 9,299,269 | |
| | | | |
SEE NOTES TO FINANCIAL STATEMENTS.
| | | | | | |
| | | |
| 10 | | | | JPMORGAN INSURANCE TRUST | | JUNE 30, 2017 |
STATEMENTS OF CHANGES IN NET ASSETS
FOR THE PERIODS INDICATED
| | | | | | | | |
| | | U.S. Equity Portfolio | |
| | | Six Months Ended
June 30, 2017
(Unaudited) | | | Year Ended
December 31, 2016 | |
CHANGE IN NET ASSETS RESULTING FROM OPERATIONS: | | | | | | | | |
Net investment income (loss) | | $ | 416,187 | | | $ | 912,612 | |
Net realized gain (loss) | | | 7,593,849 | | | | 1,111,122 | |
Change in net unrealized appreciation/depreciation | | | 1,289,233 | | | | 8,001,760 | |
| | | | | | | | |
Change in net assets resulting from operations | | | 9,299,269 | | | | 10,025,494 | |
| | | | | | | | |
| | |
DISTRIBUTIONS TO SHAREHOLDERS: | | | | | | | | |
Class 1 | | | | | | | | |
From net investment income | | | (798,168 | ) | | | (841,979 | ) |
From net realized gains | | | (897,055 | ) | | | (2,988,480 | ) |
Class 2 | | | | | | | | |
From net investment income | | | (94,733 | ) | | | (87,125 | ) |
From net realized gains | | | (138,618 | ) | | | (431,986 | ) |
| | | | | | | | |
Total distributions to shareholders | | | (1,928,574 | ) | | | (4,349,570 | ) |
| | | | | | | | |
| | |
CAPITAL TRANSACTIONS: | | | | | | | | |
Change in net assets resulting from capital transactions | | | (3,277,466 | ) | | | (3,628,021 | ) |
| | | | | | | | |
| | |
NET ASSETS: | | | | | | | | |
Change in net assets | | | 4,093,229 | | | | 2,047,903 | |
Beginning of period | | | 99,957,146 | | | | 97,909,243 | |
| | | | | | | | |
End of period | | $ | 104,050,375 | | | $ | 99,957,146 | |
| | | | | | | | |
Accumulated undistributed net investment income | | $ | 375,856 | | | $ | 852,570 | |
| | | | | | | | |
| | |
CAPITAL TRANSACTIONS: | | | | | | | | |
Class 1 | | | | | | | | |
Proceeds from shares issued | | $ | 6,461,441 | | | $ | 5,561,089 | |
Distributions reinvested | | | 1,695,223 | | | | 3,830,459 | |
Cost of shares redeemed | | | (12,275,607 | ) | | | (13,113,311 | ) |
| | | | | | | | |
Change in net assets resulting from Class 1 capital transactions | | $ | (4,118,943 | ) | | $ | (3,721,763 | ) |
| | | | | | | | |
Class 2 | | | | | | | | |
Proceeds from shares issued | | $ | 1,950,688 | | | $ | 5,511,441 | |
Distributions reinvested | | | 233,351 | | | | 519,111 | |
Cost of shares redeemed | | | (1,342,562 | ) | | | (5,936,810 | ) |
| | | | | | | | |
Change in net assets resulting from Class 2 capital transactions | | $ | 841,477 | | | $ | 93,742 | |
| | | | | | | | |
Total change in net assets resulting from capital transactions | | $ | (3,277,466 | ) | | $ | (3,628,021 | ) |
| | | | | | | | |
| | |
SHARE TRANSACTIONS: | | | | | | | | |
Class 1 | | | | | | | | |
Issued | | | 223,013 | | | | 221,761 | |
Reinvested | | | 58,638 | | | | 155,710 | |
Redeemed | | | (424,522 | ) | | | (519,009 | ) |
| | | | | | | | |
Change in Class 1 Shares | | | (142,871 | ) | | | (141,538 | ) |
| | | | | | | | |
Class 2 | | | | | | | | |
Issued | | | 68,390 | | | | 220,937 | |
Reinvested | | | 8,148 | | | | 21,292 | |
Redeemed | | | (47,083 | ) | | | (241,716 | ) |
| | | | | | | | |
Change in Class 2 Shares | | | 29,455 | | | | 513 | |
| | | | | | | | |
SEE NOTES TO FINANCIAL STATEMENTS.
| | | | | | | | |
| | | |
| JUNE 30, 2017 | | JPMORGAN INSURANCE TRUST | | | | | 11 | |
FINANCIAL HIGHLIGHTS
FOR THE PERIODS INDICATED
| | | | | | | | | | | | | | | | | | | | | | | | | | | | |
| | | Per share operating performance | |
| | | | | | Investment operations | | | Distributions | |
| | | Net asset
value,
beginning
of period | | | Net
investment
income
(loss) | | | Net realized
and unrealized
gains
(losses) on
investments | | | Total from
investment
operations | | | Net
investment
income | | | Net
realized
gain | | | Total
distributions | |
U.S. Equity Portfolio | | | | | | | | | | | | | | | | | | | | | | | | | | | | |
Class 1 | | | | | | | | | | | | | | | | | | | | | | | | | | | | |
Six Months Ended June 30, 2017 (Unaudited) | | $ | 27.03 | | | $ | 0.12 | (e) | | $ | 2.42 | | | $ | 2.54 | | | $ | (0.26 | ) | | $ | (0.29 | ) | | $ | (0.55 | ) |
Year Ended December 31, 2016 | | | 25.50 | | | | 0.26 | (e) | | | 2.42 | | | | 2.68 | | | | (0.25 | ) | | | (0.90 | ) | | | (1.15 | ) |
Year Ended December 31, 2015 | | | 26.75 | | | | 0.26 | (e) | | | 0.01 | | | | 0.27 | | | | (0.30 | ) | | | (1.22 | ) | | | (1.52 | ) |
Year Ended December 31, 2014 | | | 23.71 | | | | 0.31 | (f) | | | 2.96 | | | | 3.27 | | | | (0.23 | ) | | | — | | | | (0.23 | ) |
Year Ended December 31, 2013 | | | 17.63 | | | | 0.21 | (e) | | | 6.13 | | | | 6.34 | | | | (0.26 | ) | | | — | | | | (0.26 | ) |
Year Ended December 31, 2012 | | | 15.22 | | | | 0.23 | (e) | | | 2.43 | | | | 2.66 | | | | (0.25 | ) | | | — | | | | (0.25 | ) |
| | | | | | | |
Class 2 | | | | | | | | | | | | | | | | | | | | | | | | | | | | |
Six Months Ended June 30, 2017 (Unaudited) | | | 26.74 | | | | 0.08 | (e) | | | 2.41 | | | | 2.49 | | | | (0.20 | ) | | | (0.29 | ) | | | (0.49 | ) |
Year Ended December 31, 2016 | | | 25.24 | | | | 0.18 | (e) | | | 2.40 | | | | 2.58 | | | | (0.18 | ) | | | (0.90 | ) | | | (1.08 | ) |
Year Ended December 31, 2015 | | | 26.51 | | | | 0.19 | (e) | | | 0.02 | | | | 0.21 | | | | (0.26 | ) | | | (1.22 | ) | | | (1.48 | ) |
Year Ended December 31, 2014 | | | 23.53 | | | | 0.27 | (f) | | | 2.91 | | | | 3.18 | | | | (0.20 | ) | | | — | | | | (0.20 | ) |
Year Ended December 31, 2013 | | | 17.54 | | | | 0.16 | (e) | | | 6.08 | | | | 6.24 | | | | (0.25 | ) | | | — | | | | (0.25 | ) |
Year Ended December 31, 2012 | | | 15.18 | | | | 0.22 | (e) | | | 2.39 | | | | 2.61 | | | | (0.25 | ) | | | — | | | | (0.25 | ) |
| (a) | Annualized for periods less than one year, unless otherwise noted. |
| (b) | Not annualized for periods less than one year. |
| (c) | Includes adjustments in accordance with accounting principles generally accepted in the United States of America and as such, the net asset values for financial reporting purposes and the returns based upon those net asset values may differ from the net asset values and returns for shareholder transactions. |
| (d) | Includes earnings credits and interest expense, if applicable, each of which is less than 0.005% unless otherwise noted. |
| (e) | Calculated based upon average shares outstanding. |
| (f) | Reflects special dividends paid out during the period by several of the Portfolio’s holdings. Had the Portfolio not received the special dividends, the net investment income (loss) per share would have been $0.25 and $0.20 for Class 1 and Class 2 Shares, respectively, and the net investment income (loss) ratio would have been 0.88% and 0.72% for Class 1 and Class 2 Shares, respectively. |
SEE NOTES TO FINANCIAL STATEMENTS.
| | | | | | |
| | | |
| 12 | | | | JPMORGAN INSURANCE TRUST | | JUNE 30, 2017 |
| | | | | | | | | | | | | | | | | | | | | | | | | | |
| | | Ratios/Supplemental data | |
| | | | | | | | | | Ratios to average net assets (a) | | | | |
Net asset
value,
end of
period | | | Total
return (b)(c) | | | Net assets,
end of
period | | | Net
expenses (d) | | | Net
investment
income
(loss) | | | Expenses
without waivers,
reimbursements and
earnings credits | | | Portfolio
turnover
rate (b) | |
| | | | | | | | | | | | | | | | | | | | | | | | | | |
| | | | | | | | | | | | | | | | | | | | | | | | | | |
| $ | 29.02 | | | | 9.43 | % | | $ | 90,223,983 | | | | 0.79 | % | | | 0.84 | % | | | 0.79 | % | | | 51 | % |
| | 27.03 | | | | 10.98 | | | | 87,878,389 | | | | 0.80 | | | | 0.98 | | | | 0.80 | | | | 61 | |
| | 25.50 | | | | 0.86 | | | | 86,524,771 | | | | 0.76 | | | | 0.98 | | | | 0.76 | | | | 63 | |
| | 26.75 | | | | 13.90 | | | | 91,227,570 | | | | 0.78 | | | | 1.16 | (f) | | | 0.80 | | | | 78 | |
| | 23.71 | | | | 36.29 | | | | 87,386,499 | | | | 0.79 | | | | 1.02 | | | | 0.80 | | | | 80 | |
| | 17.63 | | | | 17.58 | | | | 75,900,979 | | | | 0.79 | | | | 1.40 | | | | 0.81 | | | | 71 | |
| | | | | | |
| | | | | | | | | | | | | | | | | | | | | | | | | | |
| | 28.74 | | | | 9.34 | | | | 13,826,392 | | | | 1.03 | | | | 0.59 | | | | 1.03 | | | | 51 | |
| | 26.74 | | | | 10.65 | | | | 12,078,757 | | | | 1.05 | | | | 0.73 | | | | 1.05 | | | | 61 | |
| | 25.24 | | | | 0.63 | | | | 11,384,472 | | | | 1.01 | | | | 0.73 | | | | 1.01 | | | | 63 | |
| | 26.51 | | | | 13.61 | | | | 13,930,084 | | | | 1.03 | | | | 1.01 | (f) | | | 1.04 | | | | 78 | |
| | 23.53 | | | | 35.90 | | | | 5,623,314 | | | | 1.02 | | | | 0.77 | | | | 1.04 | | | | 80 | |
| | 17.54 | | | | 17.28 | | | | 1,242,672 | | | | 1.01 | | | | 1.27 | | | | 1.05 | | | | 71 | |
SEE NOTES TO FINANCIAL STATEMENTS.
| | | | | | | | |
| | | |
| JUNE 30, 2017 | | JPMORGAN INSURANCE TRUST | | | | | 13 | |
NOTES TO FINANCIAL STATEMENTS
AS OF JUNE 30, 2017 (Unaudited)
1. Organization
JPMorgan Insurance Trust (the “Trust”) is registered under the Investment Company Act of 1940, as amended (the “1940 Act”), as an open-end management investment company and is a Massachusetts business trust.
The following is a separate Portfolio of the Trust (the “Portfolio”) covered by this report:
| | | | |
| | | Classes Offered | | Diversified/Non-Diversified |
| U.S. Equity Portfolio | | Class 1 and Class 2 | | Diversified |
The investment objective of the Portfolio is to seek to provide high total return from a portfolio of selected equity securities.
Portfolio shares are offered only to separate accounts of participating insurance companies and Eligible Plans. Individuals may not purchase shares directly from the Portfolio.
All classes of shares have equal rights as to earnings, assets and voting privileges, except that each class may bear different transfer agency fees and distribution fees and each class has exclusive voting rights with respect to its distribution plan and administrative services plan.
J.P. Morgan Investment Management Inc. (“JPMIM”), an indirect, wholly-owned subsidiary of JPMorgan Chase & Co. (“JPMorgan”), acts as Adviser (the “Adviser”) and Administrator (the “Administrator”) to the Portfolio.
2. Significant Accounting Policies
The following is a summary of significant accounting policies followed by the Portfolio in the preparation of its financial statements. The Portfolio is an investment company and, accordingly, follows the investment company accounting and reporting guidance of the Financial Accounting Standards Board Accounting Standards Codification Topic 946—Investment Companies, which is part of U.S. generally accepted accounting principles (“GAAP”). The preparation of financial statements in conformity with GAAP requires management to make estimates and assumptions that affect the reported amounts of assets and liabilities and disclosure of contingent assets and liabilities at the date of the financial statements and the reported amounts of increases and decreases in net assets from operations during the reporting period. Actual results could differ from those estimates.
A. Valuation of Investments — The valuation of investments is in accordance with GAAP and the Portfolio’s valuation policies set forth by and under the supervision and responsibility of the Board of Trustees (the “Board”), which established the following approach to valuation, as described more fully below: (i) investments for which market quotations are readily available shall be valued at such unadjusted quoted prices and (ii) all other investments for which market quotations are not readily available shall be valued at their fair value as determined in good faith by the Board.
The Administrator has established the J.P. Morgan Investment Management Americas Valuation Committee (“AVC”) to assist the Board with the oversight and monitoring of the valuation of the Portfolio’s investments. The Administrator implements the valuation policies of the Portfolio’s investments, as directed by the Board. The AVC oversees and carries out the policies for the valuation of investments held in the Portfolio. This includes monitoring the appropriateness of fair values based on results of ongoing valuation oversight, including but not limited to consideration of macro or security specific events, market events and pricing vendor and broker due diligence. The Administrator is responsible for discussing and assessing the potential impacts to the fair values on an ongoing basis, and at least on a quarterly basis with the AVC and the Board.
Equities and other exchange-traded instruments are valued at the last sale price or official market closing price on the primary exchange on which the instrument is traded before the net asset values (“NAV”) of the Portfolio are calculated on a valuation date. Investments in open-end investment companies (the “Underlying Funds”) are valued at each Underlying Fund’s NAV per share as of the report date.
Futures are generally valued on the basis of available market quotations.
Valuations reflected in this report are as of the report date. As a result, changes in valuation due to market events and/or issuer related events after the report date and prior to issuance of the report are not reflected herein.
The various inputs that are used in determining the valuation of the Portfolio’s investments are summarized into the three broad levels listed below.
| • | | Level 1 — Unadjusted inputs using quoted prices in active markets for identical investments. |
| • | | Level 2 — Other significant observable inputs including, but not limited to, quoted prices for similar investments, inputs other than quoted prices that are observable for investments (such as interest rates, prepayment speeds, credit risk, etc.) or other market corroborated inputs. |
| • | | Level 3 — Significant inputs based on the best information available in the circumstances, to the extent observable inputs are not available (including the Portfolio’s assumptions in determining the fair value of investments). |
A financial instrument’s level within the fair value hierarchy is based on the lowest level of any input, both individually and in the aggregate, that is significant to the fair value measurement. The inputs or methodology used for valuing instruments are not necessarily an indication of the risk associated with investing in those instruments.
| | | | | | |
| | | |
| 14 | | | | JPMORGAN INSURANCE TRUST | | JUNE 30, 2017 |
The following table represents each valuation input as presented on the Schedule of Portfolio Investments (“SOI”):
| | | | | | | | | | | | | | | | |
| | | Level 1
Quoted prices | | | Level 2
Other significant
observable inputs | | | Level 3
Significant
unobservable inputs | | | Total | |
Total Investments in Securities (a) | | $ | 104,004,785 | | | $ | — | | | $ | — | | | $ | 104,004,785 | |
| | | | | | | | | | | | | | | | |
Depreciation in Other Financial Instruments | | | | | | | | | | | | | | | | |
Futures Contracts | | $ | (1,764 | ) | | $ | — | | | $ | — | | | $ | (1,764 | ) |
| | | | | | | | | | | | | | | | |
| (a) | All portfolio holdings designated as level 1 are disclosed individually on the SOI. Please refer to the SOI for industry specifics of portfolio holdings. |
There were no transfers among any levels during the six months ended June 30, 2017.
B. Futures Contracts — The Portfolio used index futures contracts to gain or reduce exposure to the stock market, maintain liquidity or minimize transaction costs. The Portfolio also bought futures contracts to invest incoming cash in the market or sold futures in response to cash outflows, thereby simulating an invested position in the underlying index while maintaining a cash balance for liquidity.
Futures contracts provide for the delayed delivery of the underlying instrument at a fixed price or are settled for a cash amount based on the change in the value of the underlying instrument at a specific date in the future. Upon entering into a futures contract, the Portfolio is required to deposit with the broker, cash or securities in an amount equal to a certain percentage of the contract amount, which is referred to as the initial margin deposit. Subsequent payments, referred to as variation margin, are made or received by the Portfolio periodically and are based on changes in the market value of open futures contracts. Changes in the market value of open futures contracts are recorded as Change in net unrealized appreciation/depreciation on the Statement of Operations. Realized gains or losses, representing the difference between the value of the contract at the time it was opened and the value at the time it was closed, are reported on the Statement of Operations at the closing or expiration of the futures contract. Securities deposited as initial margin are designated on the SOI and cash deposited is recorded on the Statement of Assets and Liabilities. A receivable from and/or a payable to brokers for the daily variation margin is also recorded on the Statement of Assets and Liabilities.
The use of futures contracts exposes the Portfolio to equity price risk. The Portfolio may be subject to the risk that the change in the value of the futures contract may not correlate perfectly with the underlying instrument. Use of long futures contracts subjects the Portfolio to risk of loss in excess of the amounts shown on the Statement of Assets and Liabilities, up to the notional amount of the futures contracts. Use of short futures contracts subjects the Portfolio to unlimited risk of loss. The Portfolio may enter into futures contracts only on exchanges or boards of trade. The exchange or board of trade acts as the counterparty to each futures transaction; therefore, the Portfolio’s credit risk is limited to failure of the exchange or board of trade. Under some circumstances, futures exchanges may establish daily limits on the amount that the price of a futures contract can vary from the previous day’s settlement price, which could effectively prevent liquidation of positions.
The table below discloses the volume of the Portfolio’s futures contracts activity during the six months ended June 30, 2017:
| | | | |
Futures Contracts: | | | | |
Average Notional Balance Long | | $ | 119,954 | |
Ending Notional Balance Long | | | 242,090 | |
The Portfolio’s futures contracts are not subject to master netting arrangements (the right to close out all transactions traded with a counterparty and net amounts owed or due across transactions).
C. Security Transactions and Investment Income — Investment transactions are accounted for on the trade date (the date the order to buy or sell is executed). Securities gains and losses are calculated on a specifically identified cost basis. Dividend income is recorded on the ex-dividend date or when the Portfolio first learns of the dividend.
To the extent such information is publicly available, the Portfolio records distributions received in excess of income earned from underlying investments as a reduction of cost of investments and/or realized gain. Such amounts are based on estimates if actual amounts are not available and actual amounts of income, realized gain and return of capital may differ from the estimated amounts. The Portfolio adjusts the estimated amounts of the components of distributions (and consequently its net investment income) as necessary once the issuers provide information about the actual composition of the distributions.
D. Allocation of Income and Expenses — Expenses directly attributable to a portfolio are charged directly to that portfolio, while the expenses attributable to more than one portfolio of the Trust are allocated among the respective portfolios. In calculating the NAV of each class, investment income, realized and unrealized gains and losses and expenses, other than class-specific expenses, are allocated daily to each class of shares based upon the proportion of net assets of each class at the beginning of each day.
E. Federal Income Taxes — The Portfolio is treated as a separate taxable entity for Federal income tax purposes. The Portfolio’s policy is to comply with the provisions of the Internal Revenue Code of 1986, as amended (the “Code”), applicable to regulated investment companies and to distribute
| | | | | | | | |
| | | |
| JUNE 30, 2017 | | JPMORGAN INSURANCE TRUST | | | | | 15 | |
NOTES TO FINANCIAL STATEMENTS
AS OF JUNE 30, 2017 (Unaudited) (continued)
to shareholders all of its distributable net investment income and net realized capital gains on investments. Accordingly, no provision for Federal income tax is necessary. The Portfolio is also a segregated portfolio of assets for insurance purposes and intends to comply with the diversification requirements of Subchapter L of the Code. Management has reviewed the Portfolio’s tax positions for all open tax years and has determined that as of June 30, 2017, no liability for income tax is required in the Portfolio’s financial statements for net unrecognized tax benefits. However, management’s conclusions may be subject to future review based on changes in, or the interpretation of, the accounting standards or tax laws and regulations. The Portfolio’s Federal tax returns for the prior three fiscal years remain subject to examination by the Internal Revenue Service.
F. Distributions to Shareholders — Distributions from net investment income are generally declared and paid at least annually and are declared separately for each class. No class has preferential dividend rights; differences in per share rates are due to differences in separate class expenses. Net realized capital gains, if any, are distributed at least annually. The amount of distributions from net investment income and net realized capital gains is determined in accordance with Federal income tax regulations, which may differ from GAAP. To the extent these “book/tax” differences are permanent in nature (i.e., that they result from other than timing of recognition — “temporary differences”), such amounts are reclassified within the capital accounts based on their Federal tax-basis treatment.
3. Fees and Other Transactions with Affiliates
A. Investment Advisory Fee — Pursuant to an Investment Advisory Agreement, the Adviser supervises the investments of the Portfolio and for such services is paid a fee. The fee is accrued daily and paid monthly based on the Portfolio’s average daily net assets at an annual rate of 0.55%.
The Adviser waived Investment Advisory fees and/or reimbursed expenses as outlined in Note 3.E.
B. Administration Fee — Pursuant to an Administration Agreement, the Administrator provides certain administration services to the Portfolio. In consideration of these services, the Administrator receives a fee accrued daily and paid monthly at an annual rate of 0.15% of the first $25 billion of the average daily net assets of all funds in the J.P. Morgan Funds Complex covered by the Administration Agreement (excluding certain funds of funds and money market funds) and 0.075% of the average daily net assets in excess of $25 billion of all such funds. For the six months ended June 30, 2017, the effective annualized rate was 0.08% of the Portfolio’s average daily net assets, notwithstanding any fee waivers and/or expense reimbursements.
JPMorgan Chase Bank, N.A. (“JPMCB”), a wholly-owned subsidiary of JPMorgan, serves as the Portfolio’s sub-administrator (the “Sub-administrator”). For its services as Sub-administrator, JPMCB receives a portion of the fees payable to the Administrator.
The Administrator waived Administration fees as outlined in Note 3.E.
C. Distribution Fees — Pursuant to a Distribution Agreement, JPMorgan Distribution Services, Inc. (the “JPMDS”), a wholly-owned subsidiary of JPMorgan, serves as the Trust’s principal underwriter and promotes and arranges for the sale of the Portfolio’s shares.
The Board has adopted a Distribution Plan (the “Distribution Plan”) for Class 2 Shares of the Portfolio in accordance with Rule 12b-1 under the 1940 Act. The Class 1 Shares do not charge a distribution fee. The Distribution Plan provides that the Portfolio shall pay distribution fees, including payments to the JPMDS, at an annual rate of 0.25% of the average daily net assets of Class 2 Shares.
D. Custodian and Accounting Fees — JPMCB provides portfolio custody and accounting services to the Portfolio. For performing these services, the Portfolio pays JPMCB transaction and asset-based fees that vary according to the number of transactions and positions, plus out-of-pocket expenses. The amounts paid directly to JPMCB by the Portfolio for custody and accounting services are included in Custodian and accounting fees on the Statement of Operations. Payments to the custodian may be reduced by credits earned by the Portfolio, based on uninvested cash balances held by the custodian. Such earnings credits, if any, are presented separately on the Statement of Operations.
Interest expense paid to the custodian related to cash overdrafts, if any, is included in Interest expense to affiliates on the Statement of Operations.
E. Waivers and Reimbursements — The Adviser (for all share classes), Administrator (for all share classes) and/or JPMDS (for Class 2 Shares) have contractually agreed to waive fees and/or reimburse the Portfolio to the extent that total annual operating expenses of the portfolio (excluding acquired fund fees and expenses, other than certain money market fund fees as described below, dividend and interest expenses related to short sales, interest, taxes, expenses related to litigation and potential litigation, and extraordinary expenses) exceed the percentages of the Portfolio’s respective average daily net assets as shown in the table below:
| | | | | | |
| | | Class 1 | | Class 2 | |
| | 0.80% | | | 1.05 | % |
The expense limitation agreement was in effect for the six months ended June 30, 2017 and is in place until at least April 30, 2018.
Additionally, the Portfolio may invest in one or more money market funds advised by the Adviser or its affiliates (affiliated money market funds).The Adviser, Administrator and/or the JPMDS have contractually agreed to waive fees and/or reimburse expenses in an amount sufficient to offset the respective net fees each collects from the affiliated money market fund on the Portfolio’s investment in such affiliated money market fund.
The amount of waivers resulting from investments in these money market funds for the six months ended June 30, 2017 was $1,015.
| | | | | | |
| | | |
| 16 | | | | JPMORGAN INSURANCE TRUST | | JUNE 30, 2017 |
F. Other — Certain officers of the Trust are affiliated with the Adviser, the Administrator and the JPMDS. Such officers, with the exception of the Chief Compliance Officer, receive no compensation from the Portfolio for serving in their respective roles.
The Board appointed a Chief Compliance Officer to the Portfolio in accordance with Federal securities regulations. The Portfolio, along with other affiliated portfolios, makes reimbursement payments, on a pro-rata basis, to the Administrator for a portion of the fees associated with the Office of the Chief Compliance Officer. Such fees are included in Trustees’ and Chief Compliance Officer’s fees on the Statement of Operations.
The Trust adopted a Trustee Deferred Compensation Plan (the “Plan”) which allows the Independent Trustees to defer the receipt of all or a portion of compensation related to performance of their duties as Trustees. The deferred fees are invested in various J.P. Morgan Funds until distribution in accordance with the Plan.
During the six months ended June 30, 2017, the Portfolio purchased securities from an underwriting syndicate in which the principal underwriter or members of the syndicate were affiliated with the Adviser.
The Portfolio may use related party broker-dealers. For the six months ended June 30, 2017, the Portfolio did not incurred any brokerage commissions with broker-dealers affiliated with the Adviser.
The Securities and Exchange Commission (“SEC”) has granted an exemptive order permitting the Portfolio to engage in principal transactions with J.P. Morgan Securities, Inc., an affiliated broker, involving taxable money market instruments, subject to certain conditions.
4. Investment Transactions
During the six months ended June 30, 2017, purchases and sales of investments (excluding short-term investments) were as follows:
| | | | | | | | |
| | | Purchases
(excluding U.S.
Government) | | | Sales
(excluding U.S.
Government) | |
| | $ | 51,948,214 | | | $ | 56,542,568 | |
During the six months ended June 30, 2017, there were no purchases or sales of U.S. Government securities.
5. Federal Income Tax Matters
For Federal income tax purposes, the estimated cost and unrealized appreciation (depreciation) in value of investment securities held at June 30, 2017 were as follows:
| | | | | | | | | | | | | | | | |
| | | Aggregate
Cost | | | Gross
Unrealized
Appreciation | | | Gross
Unrealized
Depreciation | | | Net Unrealized
Appreciation
(Depreciation) | |
| | $ | 81,022,883 | | | $ | 23,696,396 | | | $ | 714,494 | | | $ | 22,981,902 | |
At December 31, 2016, the Portfolio did not have any net capital loss carryforwards.
6. Borrowings
The Portfolio relies upon an exemptive order granted by the SEC (the “Order”) permitting the establishment and operation of an Interfund Lending Facility (the “Facility”). The Facility allows the Portfolio to directly lend and borrow money to or from any other fund relying upon the Order at rates beneficial to both the borrowing and lending funds. Advances under the Facility are taken primarily for temporary or emergency purposes, including the meeting of redemption requests that otherwise might require the untimely disposition of securities, and are subject to the Portfolio’s borrowing restrictions. The Interfund loan rate is determined, as specified in the Order, by averaging the current repurchase agreement rate and the current bank loan rate. The Order was granted to the Trust and may be relied upon by the Portfolio because the Portfolio and the series of the Trust are all investment companies in the same “group of investment companies” (as defined in Section 12(d)(1)(G) of the 1940 Act).
The Trust and JPMCB have entered into a financing arrangement. Under this arrangement, JPMCB provides an unsecured, uncommitted credit facility in the aggregate amount of $100 million to certain of the J.P. Morgan Funds, including the Portfolio. Advances under the arrangement are taken primarily for temporary or emergency purposes, including the meeting of redemption requests that otherwise might require the untimely disposition of securities, and are subject to the Portfolio’s borrowing restrictions. Interest on borrowings is payable at a rate determined by JPMCB at the time of borrowing. This agreement has been extended until November 6, 2017.
The Portfolio had no borrowings outstanding from the unsecured, uncommitted credit facility during the six months ended June 30, 2017.
In addition, effective August 16, 2016, the Trust along with certain other trusts (“Borrowers”) entered into a joint syndicated senior unsecured revolving credit facility totaling $1.5 billion (“Credit Facility”) with various lenders and The Bank of New York Mellon, as administrative agent for the lenders. This Credit Facility provides a source of funds to the Borrowers for temporary and emergency purposes, including the meeting of redemption requests that otherwise might require the untimely disposition of securities. Under the terms of the Credit Facility, a borrowing portfolio must have a minimum of $25,000,000 in adjusted net asset value and not exceed certain adjusted net asset coverage ratios prior to and during the time in which any borrowings are outstanding. If a portfolio does not comply with the aforementioned requirements, the portfolio must remediate within three business days with respect to the $25,000,000 minimum adjusted net asset value or within one business day with respect to certain asset
| | | | | | | | |
| | | |
| JUNE 30, 2017 | | JPMORGAN INSURANCE TRUST | | | | | 17 | |
NOTES TO FINANCIAL STATEMENTS
AS OF JUNE 30, 2017 (Unaudited) (continued)
coverage ratios or the administrative agent at the request of, or with the consent of, the lenders may terminate the Credit Facility and declare any outstanding borrowings to be due and payable immediately.
Interest associated with any borrowing under the Credit Facility is charged to the borrowing portfolio at a rate of interest equal to 1.00% plus the greater of the federal funds effective rate or one month LIBOR. The annual commitment fee to maintain the Credit Facility is 0.15% and is incurred on the unused portion of the Credit Facility and is allocated to all participating portfolios pro rata based on their respective net assets. Effective August 15, 2017, this agreement has been amended and restated for a term of 364 days, unless extended. The Portfolio did not utilize the Credit Facility during the six months ended June 30, 2017.
7. Risks, Concentrations and Indemnifications
In the normal course of business, the Portfolio enters into contracts that contain a variety of representations which provide general indemnifications. The Portfolio’s maximum exposure under these arrangements is unknown. The amount of exposure would depend on future claims that may be made against the Portfolio that have not yet occurred. However, based on experience, the Portfolio expects the risk of loss to be remote.
As of June 30, 2017, the Portfolio had three omnibus accounts which collectively represented 67.3% of the Portfolio’s net assets. Significant shareholder transactions by these shareholders may impact the Portfolio’s performance and liquidity.
8. Investment Company Reporting Modernization
In October 2016, the U.S. Securities and Exchange Commission adopted new rules and forms, and amendments to certain current rules and forms, to modernize the reporting and disclosure of information by registered investment companies. In part, the final rules amend Regulation S-X and will require standardized, enhanced disclosures about derivatives in investment company financial statements, as well as other amendments. The amendments to Regulation S-X will apply to Portfolio’s fiscal year end on or after August 1, 2017. At this time, management is currently evaluating the impact of the Regulation S-X amendments on the Portfolio’s financial statements and related disclosures. The adoption will have no effect on the Portfolio’s net assets or result of operations.
| | | | | | |
| | | |
| 18 | | | | JPMORGAN INSURANCE TRUST | | JUNE 30, 2017 |
SCHEDULE OF SHAREHOLDER EXPENSES
(Unaudited)
Hypothetical $1,000 Investment
As a shareholder of the Portfolio, you incur ongoing costs, including investment advisory fees, administration fees, distribution fees (for Class 2 Shares) and other Portfolio expenses. Because the Portfolio is a funding vehicle for Policies and Eligible Plans, you may also incur sales charges and other fees relating to the Policies or Eligible Plans. The examples below are intended to help you understand your ongoing costs (in dollars) of investing in the Portfolio, but not the costs of the Policies or Eligible Plans, and to compare these ongoing costs with the ongoing costs of investing in other mutual funds. The examples assume that you had a $1,000 investment in each Class at the beginning of the reporting period, January 1, 2017, and continued to hold your shares at the end of the reporting period, June 30, 2017.
Actual Expenses
For each Class of the Portfolio in the table below, the first line provides information about actual account values and actual expenses. You may use the information in this line, together with the amount you invested, to estimate the expenses that you paid over the period. Simply divide your account value by $1,000 (for example, an $8,600 account value divided by $1,000 = 8.6), then multiply the result by the number in the first line of each Class under the heading entitled “Expenses Paid During the Period” to estimate the expenses you paid on your account during this period.
Hypothetical Example for Comparison Purposes
The second line of each Class in the table below provides information about hypothetical account values and hypothetical expenses based on the Class’ actual expense ratio and an assumed rate of return of 5% per year before expenses, which is not the Class’ actual return. The hypothetical account values and expenses may not be used to estimate the actual ending account balance or expenses you paid for the period. You may use this information to compare the ongoing costs of investing in the Class of the Portfolio and other funds. To do so, compare this 5% hypothetical example with the 5% hypothetical examples that appear in the shareholder reports of the other funds. Please note that the expenses shown in the table are meant to highlight your ongoing costs only and do not reflect any transaction costs, such as sales charges (loads) or redemption fees or the costs associated with the Policies and Eligible Plans through which the Portfolio is held. Therefore, the second line for each Class in the table is useful in comparing ongoing costs only, and will not help you determine the relative total costs of owning different funds. In addition, if these transaction costs were included, your costs would have been higher. The examples also assume all dividends and distributions have been reinvested.
| | | | | | | | | | | | | | | | |
| | | Beginning
Account Value
January 1, 2017 | | | Ending
Account Value
June 30, 2017 | | | Expenses
Paid During
the Period* | | | Annualized
Expense
Ratio | |
U.S. Equity Portfolio | | | | | | | | | | | | | | | | |
Class 1 | | | | | | | | | | | | | | | | |
Actual | | $ | 1,000.00 | | | $ | 1,094.30 | | | $ | 4.05 | | | | 0.78 | % |
Hypothetical | | | 1,000.00 | | | | 1,020.93 | | | | 3.91 | | | | 0.78 | |
Class 2 | | | | | | | | | | | | | | | | |
Actual | | | 1,000.00 | | | | 1,093.40 | | | | 5.35 | | | | 1.03 | |
Hypothetical | | | 1,000.00 | | | | 1,019.69 | | | | 5.16 | | | | 1.03 | |
| * | Expenses are equal to each Class’ respective annualized expense ratio, multiplied by the average account value over the period, multiplied by 181/365 (to reflect the one-half year period). |
| | | | | | | | |
| | | |
| JUNE 30, 2017 | | JPMORGAN INSURANCE TRUST | | | | | 19 | |
J.P. Morgan Funds are distributed by JPMorgan Distribution Services, Inc., which is an affiliate of JPMorgan Chase & Co. Affiliates of JPMorgan Chase & Co. receive fees for providing various services to the funds.
Contact JPMorgan Distribution Services, Inc. at 1-800-480-4111 for a portfolio prospectus. You can also visit us at www.jpmorganfunds.com. Investors should carefully consider the investment objectives and risk as well as charges and expenses of the mutual fund before investing. The prospectus contains this and other information about the mutual fund. Read the prospectus carefully before investing.
The Portfolio files a complete schedule of its portfolio holdings for the first and third quarters of its fiscal year with the SEC on Form N-Q. The Portfolio’s Forms N-Q are available on the SEC’s website at http://www.sec.gov and may be reviewed and copied at the SEC’s Public Reference Room in Washington, DC. Information on the operation of the SEC’s Public Reference Room may be obtained by calling 1-800-SEC-0330. Shareholders may request the Form N-Q without charge by calling 1-800-480-4111 or by visiting the variable insurance portfolio section of the J.P. Morgan Funds’ website at www.jpmorganfunds.com.
A description of the Portfolio’s policies and procedures with respect to the disclosure of the Portfolio’s holdings is available in the prospectus and Statement of Additional Information.
A copy of proxy policies and procedures is available without charge upon request by calling 1-800-480-4111 and on the Portfolio’s website at www.jpmorganfunds.com. A description of such policies and procedures is on the SEC’s website at www.sec.gov. The Trustees have delegated the authority to vote proxies for securities owned by the Portfolio to the Adviser. A copy of the Portfolio’s voting record for the most recent 12-month period ended June 30 is available on the SEC’s website at www.sec.gov or at the Portfolio’s website at www.jpmorganfunds.com no later than August 31 of each year. The Portfolio’s proxy voting record will include, among other things, a brief description of the matter voted on for each portfolio security, and will state how each vote was cast, for example, for or against the proposal.

J.P. Morgan Asset Management is the marketing name for the asset management businesses of JPMorgan Chase & Co. Those businesses include, but are not limited to, J.P. Morgan Investment Management Inc., Security Capital Research & Management Incorporated and J.P. Morgan Alternative Asset Management, Inc.
| | | | |
| | © JPMorgan Chase & Co., 2017. All rights reserved. June 2017. | | SAN-JPMITUSEP-617 |
Semi-Annual Report
JPMorgan Insurance Trust
June 30, 2017 (Unaudited)
JPMorgan Insurance Trust Income Builder Portfolio
| | | | |
NOT FDIC INSURED • NO BANK GUARANTEE • MAY LOSE VALUE
| | |  | |
CONTENTS
Investments in the Portfolio are not deposits or obligations of, or guaranteed or endorsed by, any bank and are not insured or guaranteed by the FDIC, the Federal Reserve Board or any other government agency. You could lose money if you sell when the Portfolio’s share price is lower than when you invested.
Past performance is no guarantee of future performance. The general market views expressed in this report are opinions based on market and other conditions through the end of the reporting period and are subject to change without notice. These views are not intended to predict the future performance of the Portfolio or the securities markets. References to specific securities and their issuers are for illustrative purposes only and are not intended to be, and should not be interpreted as, recommendations to purchase or sell such securities. Such views are not meant as investment advice and may not be relied on as an indication of trading intent on behalf of the Portfolio.
This Portfolio is intended to be a funding vehicle for variable annuity contracts and variable life insurance policies (collectively “Policies”) offered by the separate accounts of various insurance companies. Portfolio shares may also be offered to qualified pension and retirement plans and accounts permitting accumulation of assets on a tax-deferred basis (“Eligible Plans”). Individuals may not purchase shares directly from the Portfolio.
Prospective investors should refer to the Portfolio’s prospectus for a discussion of the Portfolio’s investment objective, strategies and risks. Call
J.P. Morgan Funds Service Center at 1-800-480-4111 for a prospectus containing more complete information about the Portfolio, including management fees and other expenses. Please read it carefully before investing.
CEO’S LETTER
August 4, 2017 (Unaudited)
Dear Shareholder,
As the U.S. economic expansion entered its eighth year in 2017, growth in both developed and emerging market economies became increasingly synchronized even as U.S. growth cooled in the early part of the year. Amid an environment of economic growth, low inflation and rising corporate earnings, global financial markets overall produced positive returns.
| | |
 | | “In the U.S., the continued economic expansion, muted inflation, corporate earnings growth and historically low volatility in financial markets helped to drive key equity market indexes to multiple record closing highs throughout the first half of 2017.” — George C.W. Gatch |
While U.S. gross domestic product (GDP) growth slowed to 1.2% in the first quarter of 2017, it rebounded to 2.6% growth in the second quarter of 2017 on the back of a surge in consumer spending. Meanwhile, the U.S. jobless rate continued to shrink and fell to 4.4% in June 2017 from 4.8% six months earlier. In response to these numbers, along with nascent signs of price inflation, the U.S. Federal Reserve (the “Fed”) raised interest rates in June 2017 and signaled it would raise rates once more before the end of the year. Fed Chairwoman Janet Yellen also indicated she was prepared to begin partially unwinding the central bank’s $4.5 trillion balance sheet of assets purchased through its quantitative easing program.
Despite the apparent health of the U.S. economy, by mid-2017 domestic price inflation was below the Fed’s target of 2% growth and wage growth remained below economists’ expectations, the latter despite an environment of essentially full employment for U.S. workers. These trends — and the Fed’s acknowledgment of them — provided some near-term uncertainty about the central bank’s commitment to tightening monetary policy.
Throughout the first half of 2017, global energy prices continued to fall amid an oversupply of crude oil and natural gas. Despite efforts by the Organization of Petroleum Exporting
Countries to curb global production, the price of a barrel of benchmark West Texas Intermediate crude oil dropped to $46 by the end of June 2017.
Meanwhile, the leading economies of the European Union (the “EU”) continued to strengthen. Annualized GDP for the 19 core EU nations rose 1.9% in the first quarter of 2017 and 2.1% in the second quarter. The June 2017 aggregate unemployment rate for those nations fell to 9.1%, the lowest level since March 2009. Also, in separate elections, voters in the Netherlands and France largely rejected populist campaigns espousing policies to limit free trade and immigration. The election results provided another boost to global equity prices.
In the U.S., the continued economic expansion, muted inflation, corporate earnings growth and historically low volatility in financial markets helped to drive key equity market indexes to multiple record closing highs throughout the first half of 2017. U.S. investors appeared to shrug off intermittent political and policy dramas emanating from Washington, D.C. and extended the run-up in U.S. equity prices into its eighth consecutive year — one of the longest on record. For the six months ended June 30, 2017, the Standard & Poor’s 500 Index returned 9.34%.
U.S. and foreign financial markets largely rewarded those investors who remained fully invested throughout the first half of 2017, reaffirming the fundamental virtues of patience and diversification within a prudent investment strategy.
We look forward to managing your investment needs for years to come. Should you have any questions, please visit www.jpmorganfunds.com or contact the J.P. Morgan Funds Service Center at 1-800-480-4111.
Sincerely yours,

George C.W. Gatch
CEO, Global Funds Management & Institutional,
J.P. Morgan Asset Management
| | | | | | | | |
| | | |
| JUNE 30, 2017 | | JPMORGAN INSURANCE TRUST | | | | | 1 | |
JPMorgan Insurance Trust Income Builder Portfolio
PORTFOLIO COMMENTARY
SIX MONTHS ENDED JUNE 30, 2017 (Unaudited)
| | | | |
| REPORTING PERIOD RETURN: | |
| Portfolio (Class 2 Shares)* | | | 5.85% | |
| MSCI World Index (net of foreign withholding taxes) | | | 10.66% | |
| Income Builder Composite Benchmark | | | 7.24% | |
| |
| Net Assets as of 6/30/2017 | | $ | 48,176,658 | |
INVESTMENT OBJECTIVE**
The JPMorgan Insurance Trust Income Builder Portfolio (the “Portfolio”) seeks to maximize income while maintaining prospects for capital appreciation.
HOW DID THE MARKET PERFORM?
While U.S. equity markets continued to provide positive returns for the past six months, the magnitude of those gains slowed somewhat as key stock market indexes touched multiple closing highs and largely held near record territory. Steady global economic growth, continued low inflation and strong corporate earnings all served to support equity prices, both in the U.S. and elsewhere. Globally, emerging market equities generally outperformed the U.S. and other developed market equities during the reporting period.
While emerging market bonds and high-yield U.S. bonds (also known as “junk bonds”) generally provided positive returns, investment grade corporate bonds and U.S. Treasury bonds underperformed equity securities amid investor expectations for rising interest rates in the U.S.
WHAT WERE THE MAIN DRIVERS OF THE PORTFOLIO’S PERFORMANCE?
The Portfolio’s Class 2 Shares underperformed both the MSCI World Index (net of foreign withholding taxes) (the “Benchmark”) and the Income Builder Composite Benchmark (the “Composite”), which is made up of 60% Benchmark and 40% Bloomberg Barclays Aggregate Index, for the six months ended June 30, 2017.
The Portfolio’s allocation to fixed-income securities, which broadly underperformed global equity, detracted from the Fund’s performance relative to the Benchmark.
Relative to the Composite, the Portfolio’s underweight allocation to U.S. equity was a leading detractor from performance. The Portfolio’s allocation to international equity made a positive contribution to relative performance.
HOW WAS THE PORTFOLIO POSITIONED?
During the reporting period, the Portfolio was positioned to tactically pursue income. The portfolio managers increased
their allocation to equities given their expectation for better global economic growth and relatively slow tightening by global central banks.
| | | | | | | | |
| TOP TEN HOLDINGS OF THE PORTFOLIO*** | |
| | 1. | | | JPMorgan Emerging Markets Equity Fund, Class R6 Shares | | | 6.6 | % |
| | 2. | | | JPMorgan Equity Income Fund, Class R6 Shares | | | 6.0 | |
| | 3. | | | JPMorgan Emerging Markets Debt Fund, Class R6 Shares | | | 3.1 | |
| | 4. | | | Unibail-Rodamco SE, (France) | | | 0.6 | |
| | 5. | | | GlaxoSmithKline plc, (United Kingdom) | | | 0.6 | |
| | 6. | | | Johnson & Johnson | | | 0.6 | |
| | 7. | | | Siemens AG (Registered), (Germany) | | | 0.6 | |
| | 8. | | | Goldman Sachs Group, Inc. (The), Series M, VAR, 5.375%, 05/10/20 | | | 0.6 | |
| | 9. | | | Morgan Stanley, Series H, VAR, 5.450%, 07/15/19 | | | 0.5 | |
| | 10. | | | Occidental Petroleum Corp. | | | 0.5 | |
| | | | |
PORTFOLIO COMPOSITION*** | |
| Corporate Bonds | | | 41.6 | % |
| Common Stocks | | | 31.0 | |
| Investment Companies | | | 15.7 | |
| Asset-Backed Securities | | | 4.7 | |
| Collateralized Mortgage Obligations | | | 3.3 | |
| Others (each less than 1.0%) | | | 1.3 | |
| Short-Term Investment | | | 2.4 | |
| * | | The return shown is based on net asset values calculated for shareholder transactions and may differ from the return shown in the financial highlights, which reflects adjustments made to the net asset values in accordance with accounting principles generally accepted in the United States of America. |
| ** | | The adviser seeks to achieve the Portfolio’s objective. There can be no guarantee it will be achieved. |
| *** | | Percentages indicated are based on total investments as of June 30, 2017. The Portfolio’s composition is subject to change. |
| | |
| VAR | | — Variable Rate Security. The interest rate shown is the rate in effect as of June 30, 2017. |
| | | | | | |
| | | |
| 2 | | | | JPMORGAN INSURANCE TRUST | | JUNE 30, 2017 |
| | | | | | | | | | | | | | | | |
AVERAGE ANNUAL TOTAL RETURNS AS OF JUNE 30, 2017 | |
| | | | |
| | | INCEPTION DATE OF
CLASS | | | 6 MONTH* | | | 1 YEAR | | | SINCE INCEPTION | |
CLASS 1 SHARES | | | December 9, 2014 | | | | 5.94 | % | | | 8.79 | % | | | 4.65 | % |
CLASS 2 SHARES | | | December 9, 2014 | | | | 5.85 | | | | 8.58 | | | | 4.40 | |
LIFE OF PORTFOLIO PERFORMANCE (12/09/14 TO 6/30/17)
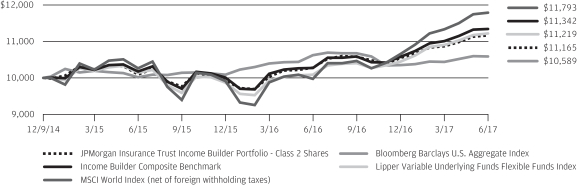
The performance quoted is past performance and is not a guarantee of future results. Mutual funds are subject to certain market risks. Investment returns and principal value of an investment will fluctuate so that an investor’s shares, when redeemed, may be worth more or less than their original cost. Current performance may be higher or lower than the performance data shown. For up-to-date month-end performance information please call 1-800-480-4111.
The Portfolio commenced operations on December 9, 2014.
The graph illustrates comparative performance for $10,000 invested in Class 2 Shares of the JPMorgan Insurance Trust Income Builder Portfolio, the MSCI World Index (net of foreign withholding taxes), the Bloomberg Barclays U.S. Aggregate Index, the Income Builder Composite Benchmark and the Lipper Variable Underlying Funds Flexible Funds Index from December 9, 2014 to June 30, 2017. The performance of the Portfolio assumes reinvestment of all dividends and capital gain distributions, if any. The performance of the indices, other than the Lipper Variable Underlying Funds Flexible Funds Index, does not reflect the deduction of expenses associated with a mutual fund and has been adjusted to reflect reinvestment of all dividends and capital gain distributions of the securities included in the benchmarks, if applicable. The performance of the Lipper Variable Underlying Funds Flexible Funds Index includes expenses associated with a mutual fund, such as investment management fees. These expenses are not identical to the expenses incurred by the Portfolio. The MSCI
World Index (net of foreign withholding taxes) is a free float-adjusted market capitalization weighted index that is designed to measure the equity market performance of developed markets. The Bloomberg Barclays U.S. Aggregate Index is an unmanaged index that represents securities that are SEC-registered, taxable, and dollar denominated. The index covers the U.S. investment grade fixed rate bond market, with index components for government and corporate securities, mortgage pass-through securities, and asset-backed securities. The Income Builder Composite Benchmark is a composite benchmark comprised of unmanaged indices that includes the MSCI World Index (net of foreign withholding taxes) (60%) and the Bloomberg Barclays U.S. Aggregate Index (40%). The Lipper Variable Underlying Funds Flexible Funds Index is an index based on the total returns of certain mutual funds within the Portfolio’s designated category as determined by Lipper, Inc. Investors cannot invest directly in an index.
Portfolio performance does not reflect any charges imposed by the Policies or Eligible Plans. If these charges were included, the returns would be lower than shown. Portfolio performance may reflect the waiver of the Portfolio’s fees and reimbursement of expenses for certain periods since the inception date. Without these waivers and reimbursements, performance would have been lower. The returns shown are based on net asset values calculated for shareholder transactions and may differ from the returns shown in the financial highlights, which reflect adjustments made to the net asset values in accordance with accounting principles generally accepted in the United States of America.
| | | | | | | | |
| | | |
| JUNE 30, 2017 | | JPMORGAN INSURANCE TRUST | | | | | 3 | |
JPMorgan Insurance Trust Income Builder Portfolio
SCHEDULE OF PORTFOLIO INVESTMENTS
AS OF JUNE 30, 2017 (Unaudited)
| | | | | | | | |
PRINCIPAL
AMOUNT($) | | | SECURITY DESCRIPTION | | VALUE($) | |
| | Asset-Backed Securities — 4.7% | |
| | | | United States — 4.7% | |
| | 64,411 | | | ABFC Trust, Series 2004-OPT5, Class A1, VAR, 1.916%, 06/25/34 | | | 63,441 | |
| | 123,329 | | | ACE Securities Corp. Home Equity Loan Trust, Series 2003-HE1, Class M1, VAR, 2.191%, 11/25/33 | | | 120,874 | |
| | | | Ameriquest Mortgage Securities, Inc. Asset-Backed Pass-Through Certificates, | | | | |
| | 66,722 | | | Series 2003-10, Class M1, VAR, 2.266%, 12/25/33 | | | 65,837 | |
| | 87,088 | | | Series 2003-10, Class M2, VAR, 3.766%, 12/25/33 | | | 84,967 | |
| | 29,628 | | | AMRESCO Residential Securities Corp. Mortgage Loan Trust, Series 1997-1, Class A7, 7.610%, 03/25/27 | | | 29,607 | |
| | 96,671 | | | Asset-Backed Securities Corp. Home Equity Loan Trust, Series 2003-HE6, Class M2, VAR, 3.691%, 11/25/33 | | | 92,010 | |
| | 41,628 | | | Bear Stearns Asset-Backed Securities Trust, Series 2004-HE5, Class M2, VAR, 3.091%, 07/25/34 | | | 41,217 | |
| | | | Countrywide Asset-Backed Certificates, | | | | |
| | 33,844 | | | Series 2004-2, Class M1, VAR, 1.966%, 05/25/34 | | | 33,716 | |
| | 113,981 | | | Series 2006-19, Class 2A2, VAR, 1.376%, 03/25/37 | | | 110,361 | |
| | | | CWABS, Inc. Asset-Backed Certificates Trust, | | | | |
| | 87,212 | | | Series 2004-5, Class M3, VAR, 2.941%, 07/25/34 | | | 86,812 | |
| | 54,507 | | | Series 2004-5, Class M5, VAR, 3.541%, 05/25/34 | | | 52,512 | |
| | | | Fremont Home Loan Trust, | | | | |
| | 86,665 | | | Series 2003-A, Class M1, VAR, 2.191%, 08/25/33 | | | 83,571 | |
| | 76,684 | | | Series 2004-1, Class M4, VAR, 2.641%, 02/25/34 | | | 76,496 | |
| | 224,940 | | | GSAMP Trust, Series 2003-SEA, Class A1, VAR, 1.616%, 02/25/33 | | | 212,784 | |
| | | | Home Equity Asset Trust, | | | | |
| | 100,000 | | | Series 2005-7, Class M1, VAR, 1.666%, 01/25/36 | | | 99,518 | |
| | 65,754 | | | Series 2007-2, Class 2A2, VAR, 1.401%, 07/25/37 | | | 65,295 | |
| | 70,057 | | | Home Equity Mortgage Loan Asset-Backed Trust, Series 2006-B, Class 2A3, VAR, 1.406%, 06/25/36 | | | 68,014 | |
| | 49,984 | | | Mastr Asset-Backed Securities Trust, Series 2004-OPT2, Class M1, VAR, 2.116%, 09/25/34 | | | 48,899 | |
| | | | | | | | |
PRINCIPAL
AMOUNT($) | | | SECURITY DESCRIPTION | | VALUE($) | |
| | | | | | | | |
| | | | United States — continued | | | | |
| | | | Morgan Stanley ABS Capital I, Inc. Trust, | | | | |
| | 39,825 | | | Series 2003-NC10, Class M1, VAR, 2.236%, 10/25/33 | | | 39,441 | |
| | 227,130 | | | Series 2003-SD1, Class M1, VAR, 3.466%, 03/25/33 | | | 221,603 | |
| | 90,988 | | | Series 2004-HE3, Class M1, VAR, 2.071%, 03/25/34 | | | 88,449 | |
| | 82,432 | | | Series 2004-NC7, Class M2, VAR, 2.146%, 07/25/34 | | | 82,627 | |
| | 41,287 | | | Renaissance Home Equity Loan Trust, Series 2003-3, Class A, VAR, 1.716%, 12/25/33 | | | 40,542 | |
| | 126,769 | | | Securitized Asset-Backed Receivables LLC Trust, Series 2004-OP2, Class M3, VAR, 3.241%, 08/25/34 | | | 115,038 | |
| | 28,446 | | | Structured Asset Investment Loan Trust, Series 2003-BC11, Class M1, VAR, 2.191%, 10/25/33 | | | 28,330 | |
| | 125,990 | | | Structured Asset Securities Corp. Mortgage Loan Trust, Series 2006-BC6, Class A4, VAR, 1.386%, 01/25/37 | | | 119,119 | |
| | 88,317 | | | Wells Fargo Home Equity Asset-Backed Securities Trust, Series 2006-3, Class A2, VAR, 1.366%, 01/25/37 | | | 87,545 | |
| | | | | | | | |
| | | | Total Asset-Backed Securities
(Cost $2,174,783) | | | 2,258,625 | |
| | | | | | | | |
| | Collateralized Mortgage Obligations — 3.2% | |
| | | | United States — 3.2% | |
| | 52,303 | | | American Home Mortgage Investment Trust, Series 2005-1, Class 6A, VAR, 3.414%, 06/25/45 | | | 52,197 | |
| | 40,221 | | | Banc of America Funding Trust, Series 2006-A, Class 1A1, VAR, 3.131%, 02/20/36 | | | 39,744 | |
| | 22,849 | | | Banc of America Mortgage Trust, Series 2005-A, Class 2A2, VAR, 3.475%, 02/25/35 | | | 22,618 | |
| | 64,315 | | | Bear Stearns ALT-A Trust, Series 2005-4, Class 23A2, VAR, 3.475%, 05/25/35 | | | 64,556 | |
| | | | Bear Stearns ARM Trust | | | | |
| | 184,634 | | | Series 2004-9, Class 22A1, VAR, 3.623%, 11/25/34 | | | 185,957 | |
| | 38,410 | | | Series 2006-1, Class A1, VAR, 2.910%, 02/25/36 | | | 38,297 | |
| | 84,437 | | | Citigroup Mortgage Loan Trust, Inc., Series 2005-6, Class A1, VAR, 2.690%, 09/25/35 | | | 86,946 | |
| | 28,811 | | | First Horizon Mortgage Pass-Through Trust, Series 2004-AR7, Class 4A1, VAR, 3.050%, 02/25/35 | | | 28,618 | |
SEE NOTES TO FINANCIAL STATEMENTS.
| | | | | | |
| | | |
| 4 | | | | JPMORGAN INSURANCE TRUST | | JUNE 30, 2017 |
| | | | | | | | |
PRINCIPAL
AMOUNT($) | | | SECURITY DESCRIPTION | | VALUE($) | |
| | Collateralized Mortgage Obligations — continued | |
| | | | United States — continued | |
| | 62,152 | | | GSR Mortgage Loan Trust, Series 2005-AR3, Class 1A1, VAR, 1.656%, 05/25/35 | | | 59,102 | |
| | | | Impac CMB Trust | | | | |
| | 84,617 | | | Series 2004-6, Class 1A2, VAR, 1.996%, 10/25/34 | | | 80,968 | |
| | 127,742 | | | Series 2004-7, Class 1A2, VAR, 2.136%, 11/25/34 | | | 119,605 | |
| | 13,485 | | | Lehman Mortgage Trust, Series 2005-3, Class 2A3, 5.500%, 01/25/36 | | | 12,079 | |
| | 38,118 | | | MASTR Adjustable Rate Mortgages Trust, Series 2004-13, Class 2A1, VAR, 3.081%, 04/21/34 | | | 39,185 | |
| | 20,301 | | | Merrill Lynch Mortgage Investors Trust, Series 2007-1, Class 4A3, VAR, 5.124%, 01/25/37 | | | 19,721 | |
| | 52,598 | | | Morgan Stanley Mortgage Loan Trust, Series 2004-5AR, Class 4A, VAR, 3.491%, 07/25/34 | | | 51,606 | |
| | 76,386 | | | Opteum Mortgage Acceptance Corp. Asset-Backed Pass-Through Certificates, Series 2005-5, Class 1APT, VAR, 1.496%, 12/25/35 | | | 70,834 | |
| | 16,779 | | | Residential Asset Securitization Trust, Series 2004-A6, Class A1, 5.000%, 08/25/19 | | | 16,767 | |
| | | | WaMu Mortgage Pass-Through Certificates Trust | | | | |
| | 32,962 | | | Series 2005-AR3, Class A1, VAR, 3.033%, 03/25/35 | | | 32,274 | |
| | 53,927 | | | Series 2005-AR5, Class A6, VAR, 2.983%, 05/25/35 | | | 54,112 | |
| | | | Wells Fargo Mortgage-Backed Securities Trust | | | | |
| | 74,487 | | | Series 2004-W, Class A1, VAR, 3.010%, 11/25/34 | | | 74,620 | |
| | 50,644 | | | Series 2004-Z, Class 2A2, VAR, 2.999%, 12/25/34 | | | 51,347 | |
| | 60,956 | | | Series 2004-EE, Class 2A2, VAR, 3.237%, 12/25/34 | | | 62,289 | |
| | 17,297 | | | Series 2005-16, Class A8, 5.750%, 01/25/36 | | | 18,453 | |
| | 36,428 | | | Series 2005-AR1, Class 1A1, VAR, 3.116%, 02/25/35 | | | 36,932 | |
| | 29,164 | | | Series 2005-AR2, Class 2A2, VAR, 3.162%, 03/25/35 | | | 29,442 | |
| | 62,151 | | | Series 2005-AR3, Class 1A1, VAR, 3.311%, 03/25/35 | | | 63,548 | |
| | 45,272 | | | Series 2005-AR3, Class 2A1, VAR, 3.117%, 03/25/35 | | | 45,696 | |
| | 55,670 | | | Series 2006-AR2, Class 2A3, VAR, 3.107%, 03/25/36 | | | 55,808 | |
| | | | | | | | |
PRINCIPAL
AMOUNT($) | | | SECURITY DESCRIPTION | | VALUE($) | |
| | | | | | | | |
| | | | United States — continued | | | | |
| | 45,852 | | | Series 2006-AR3, Class A3, VAR, 3.253%, 03/25/36 | | | 45,209 | |
| | | | | | | | |
| | | | Total Collateralized Mortgage Obligations
(Cost $1,515,727) | | | 1,558,530 | |
| | | | | | | | |
| | Commercial Mortgage-Backed Security — 0.1% | |
| | | | United States — 0.1% | |
| | 57,819 | | | LB-UBS Commercial Mortgage Trust, Series 2006-C6, Class AJ, VAR, 5.452%, 09/15/39
(Cost $56,166) | | | 50,338 | |
| | | | | | | | |
| | |
| SHARES | | | | | | |
| | Common Stocks — 30.8% | |
| | | | Australia — 0.5% | |
| | 1,937 | | | BHP Billiton plc | | | 29,676 | |
| | 9,519 | | | Goodman Group | | | 57,531 | |
| | 34,261 | | | Mirvac Group | | | 56,025 | |
| | 27,320 | | | Scentre Group | | | 84,941 | |
| | | | | | | | |
| | | | | | | 228,173 | |
| | | | | | | | |
| | | | Belgium — 0.5% | |
| | 1,643 | | | Anheuser-Busch InBev SA/NV | | | 181,467 | |
| | 330 | | | KBC Group NV | | | 25,020 | |
| | 454 | | | Proximus SADP | | | 15,890 | |
| | 263 | | | Warehouses De Pauw CVA | | | 27,638 | |
| | | | | | | | |
| | | | | | | 250,015 | |
| | | | | | | | |
| | | | Canada — 0.3% | |
| | 1,557 | | | Allied Properties REIT | | | 46,729 | |
| | 616 | | | RioCan REIT | | | 11,434 | |
| | 1,805 | | | TransCanada Corp. | | | 86,046 | |
| | | | | | | | |
| | | | | | | 144,209 | |
| | | | | | | | |
| | | | China — 0.1% | |
| | 64,000 | | | CNOOC Ltd. | | | 70,223 | |
| | | | | | | | |
| | | | Czech Republic — 0.1% | |
| | 20,198 | | | Moneta Money Bank A/S (e) | | | 67,625 | |
| | | | | | | | |
| | | | Denmark — 0.4% | |
| | 3,247 | | | Danske Bank A/S | | | 124,922 | |
| | 389 | | | ISS A/S | | | 15,280 | |
| | 1,108 | | | Novo Nordisk A/S, Class B | | | 47,608 | |
| | 181 | | | Pandora A/S | | | 16,892 | |
| | | | | | | | |
| | | | | | | 204,702 | |
| | | | | | | | |
| | | | Finland — 0.8% | |
| | 531 | | | Elisa OYJ | | | 20,599 | |
| | 1,065 | | | Fortum OYJ | | | 16,714 | |
| | 487 | | | Metso OYJ | | | 16,898 | |
SEE NOTES TO FINANCIAL STATEMENTS.
| | | | | | | | |
| | | |
| JUNE 30, 2017 | | JPMORGAN INSURANCE TRUST | | | | | 5 | |
JPMorgan Insurance Trust Income Builder Portfolio
SCHEDULE OF PORTFOLIO INVESTMENTS
AS OF JUNE 30, 2017 (Unaudited) (continued)
| | | | | | | | |
SHARES | | | SECURITY DESCRIPTION | | VALUE($) | |
| | Common Stocks — continued | |
| | | | Finland — continued | |
| | 426 | | | Neste OYJ | | | 16,810 | |
| | 5,275 | | | Nokia OYJ | | | 32,345 | |
| | 458 | | | Nokian Renkaat OYJ | | | 18,958 | |
| | 277 | | | Orion OYJ, Class B | | | 17,695 | |
| | 517 | | | Sampo OYJ, Class A | | | 26,525 | |
| | 1,737 | | | Stora Enso OYJ, Class R | | | 22,446 | |
| | 6,884 | | | UPM-Kymmene OYJ | | | 196,295 | |
| | 313 | | | Wartsila OYJ Abp | | | 18,510 | |
| | | | | | | | |
| | | | | | | 403,795 | |
| | | | | | | | |
| | | | France — 2.3% | |
| | 1,563 | | | AXA SA | | | 42,800 | |
| | 798 | | | BNP Paribas SA | | | 57,450 | |
| | 401 | | | Bouygues SA | | | 16,894 | |
| | 753 | | | Bureau Veritas SA | | | 16,668 | |
| | 519 | | | Cie de Saint-Gobain | | | 27,717 | |
| | 775 | | | Cie Generale des Etablissements Michelin | | | 103,148 | |
| | 953 | | | CNP Assurances | | | 21,391 | |
| | 1,448 | | | Credit Agricole SA | | | 23,325 | |
| | 623 | | | Edenred | | | 16,251 | |
| | 1,512 | | | Electricite de France SA | | | 16,382 | |
| | 1,824 | | | Engie SA | | | 27,531 | |
| | 695 | | | Eutelsat Communications SA | | | 17,733 | |
| | 157 | | | Fonciere Des Regions | | | 14,563 | |
| | 179 | | | Imerys SA | | | 15,581 | |
| | 1,008 | | | Klepierre | | | 41,314 | |
| | 498 | | | Mercialys SA | | | 9,743 | |
| | 2,391 | | | Natixis SA | | | 16,050 | |
| | 967 | | | Peugeot SA | | | 19,272 | |
| | 241 | | | Renault SA | | | 21,805 | |
| | 902 | | | Rexel SA | | | 14,741 | |
| | 762 | | | Sanofi | | | 73,015 | |
| | 484 | | | Schneider Electric SE (a) | | | 37,195 | |
| | 416 | | | SCOR SE | | | 16,527 | |
| | 678 | | | Societe Generale SA | | | 36,562 | |
| | 1,386 | | | TOTAL SA | | | 68,811 | |
| | 1,198 | | | Unibail-Rodamco SE | | | 301,868 | |
| | 430 | | | Vinci SA | | | 36,680 | |
| | | | | | | | |
| | | | | | | 1,111,017 | |
| | | | | | | | |
| | | | Germany — 2.1% | |
| | 786 | | | Allianz SE (Registered) | | | 155,111 | |
| | 2,790 | | | Aroundtown Property Holdings plc | | | 15,178 | |
| | 235 | | | Axel Springer SE | | | 14,135 | |
| | 637 | | | BASF SE | | | 59,119 | |
| | 349 | | | Bayerische Motoren Werke AG | | | 32,460 | |
| | | | | | | | |
SHARES | | | SECURITY DESCRIPTION | | VALUE($) | |
| | | | | | | | |
| | | | Germany — continued | | | | |
| | 1,755 | | | Daimler AG (Registered) | | | 127,288 | |
| | 914 | | | Deutsche Post AG (Registered) | | | 34,310 | |
| | 2,469 | | | Deutsche Telekom AG (Registered) | | | 44,504 | |
| | 1,550 | | | Deutsche Wohnen AG | | | 59,392 | |
| | 2,686 | | | E.ON SE | | | 25,356 | |
| | 452 | | | Evonik Industries AG | | | 14,467 | |
| | 166 | | | Hannover Rueck SE | | | 19,939 | |
| | 201 | | | HUGO BOSS AG | | | 14,091 | |
| | 419 | | | Innogy SE (e) | | | 16,490 | |
| | 481 | | | METRO AG | | | 16,249 | |
| | 127 | | | Muenchener Rueckversicherungs-Gesellschaft AG in Muenchen | | | 25,699 | |
| | 989 | | | RWE AG (a) | | | 19,756 | |
| | 1,985 | | | Siemens AG (Registered) | | | 273,045 | |
| | 3,071 | | | Telefonica Deutschland Holding AG | | | 15,358 | |
| | 1,098 | | | TUI AG | | | 16,006 | |
| | 550 | | | Vonovia SE | | | 21,882 | |
| | | | | | | | |
| | | | | | | 1,019,835 | |
| | | | | | | | |
| | | | Hong Kong — 0.2% | |
| | 4,800 | | | Hongkong Land Holdings Ltd. | | | 35,325 | |
| | 6,000 | | | Link REIT | | | 45,642 | |
| | | | | | | | |
| | | | | | | 80,967 | |
| | | | | | | | |
| | | | Ireland — 0.1% | |
| | 68,315 | | | Bank of Ireland (a) | | | 17,946 | |
| | 494 | | | Smurfit Kappa Group plc | | | 15,414 | |
| | | | | | | | |
| | | | | | | 33,360 | |
| | | | | | | | |
| | | | Italy — 0.3% | |
| | 1,489 | | | Assicurazioni Generali SpA | | | 24,578 | |
| | 683 | | | Atlantia SpA | | | 19,212 | |
| | 6,942 | | | Enel SpA | | | 37,233 | |
| | 10,259 | | | Intesa Sanpaolo SpA | | | 32,632 | |
| | 331 | | | Italgas SpA | | | 1,672 | |
| | 1,649 | | | Mediobanca SpA | | | 16,314 | |
| | 3,309 | | | Terna Rete Elettrica Nazionale SpA | | | 17,872 | |
| | | | | | | | |
| | | | | | | 149,513 | |
| | | | | | | | |
| | | | Japan — 1.0% | |
| | 9 | | | Activia Properties, Inc. | | | 38,449 | |
| | 2,000 | | | Bridgestone Corp. | | | 86,463 | |
| | 2,300 | | | Daiwa House Industry Co. Ltd. | | | 78,719 | |
| | 57 | | | Japan Hotel REIT Investment Corp. | | | 40,364 | |
| | 2,100 | | | Japan Tobacco, Inc. | | | 73,811 | |
| | 25 | | | Nippon Prologis REIT, Inc. | | | 53,213 | |
| | 1,700 | | | Nippon Telegraph & Telephone Corp. | | | 80,247 | |
SEE NOTES TO FINANCIAL STATEMENTS.
| | | | | | |
| | | |
| 6 | | | | JPMORGAN INSURANCE TRUST | | JUNE 30, 2017 |
| | | | | | | | |
SHARES | | | SECURITY DESCRIPTION | | VALUE($) | |
| | Common Stocks — continued | |
| | | | Japan — continued | |
| | 12 | | | Orix JREIT, Inc. | | | 17,706 | |
| | | | | | | | |
| | | | | | | 468,972 | |
| | | | | | | | |
| | | | Netherlands — 1.0% | |
| | 706 | | | ABN AMRO Group NV, CVA (e) | | | 18,703 | |
| | 3,832 | | | Aegon NV | | | 19,612 | |
| | 276 | | | Akzo Nobel NV | | | 24,003 | |
| | 232 | | | Eurocommercial Properties NV, CVA | | | 9,270 | |
| | 4,874 | | | ING Groep NV | | | 84,139 | |
| | 3,930 | | | Koninklijke Ahold Delhaize NV | | | 75,013 | |
| | 2,913 | | | NN Group NV | | | 103,362 | |
| | 308 | | | Randstad Holding NV | | | 17,957 | |
| | 3,623 | | | Royal Dutch Shell plc, Class B | | | 97,265 | |
| | 660 | | | Vastned Retail NV | | | 27,631 | |
| | | | | | | | |
| | | | | | | 476,955 | |
| | | | | | | | |
| | | | Norway — 0.3% | |
| | 1,360 | | | DNB ASA | | | 23,154 | |
| | 920 | | | Marine Harvest ASA (a) | | | 15,740 | |
| | 3,340 | | | Norsk Hydro ASA | | | 18,484 | |
| | 1,746 | | | Orkla ASA | | | 17,746 | |
| | 1,312 | | | Statoil ASA | | | 21,756 | |
| | 1,031 | | | Telenor ASA | | | 17,104 | |
| | 443 | | | Yara International ASA | | | 16,658 | |
| | | | | | | | |
| | | | | | | 130,642 | |
| | | | | | | | |
| | | | Portugal — 0.0% (g) | |
| | 4,702 | | | EDP — Energias de Portugal SA | | | 15,381 | |
| | | | | | | | |
| | | | Singapore — 0.1% | |
| | 3,820 | | | Ascendas REIT | | | 7,238 | |
| | 3,300 | | | CapitaLand Commercial Trust | | | 3,977 | |
| | 2,700 | | | DBS Group Holdings Ltd. | | | 40,637 | |
| | | | | | | | |
| | | | | | | 51,852 | |
| | | | | | | | |
| | | | South Africa — 0.1% | |
| | 2,472 | | | Investec plc | | | 18,471 | |
| | 727 | | | Mondi plc | | | 19,063 | |
| | | | | | | | |
| | | | | | | 37,534 | |
| | | | | | | | |
| | | | Spain — 1.1% | |
| | 1,371 | | | Abertis Infraestructuras SA | | | 25,414 | |
| | 491 | | | ACS Actividades de Construccion y Servicios SA | | | 18,984 | |
| | 102 | | | Aena SA (e) | | | 19,918 | |
| | 5,300 | | | Banco Bilbao Vizcaya Argentaria SA | | | 44,149 | |
| | 11,685 | | | Banco de Sabadell SA | | | 23,774 | |
| | 9,925 | | | Banco Santander SA | | | 65,901 | |
| | | | | | | | |
SHARES | | | SECURITY DESCRIPTION | | VALUE($) | |
| | | | | | | | |
| | | | Spain — continued | | | | |
| | 3,211 | | | Bankia SA | | | 15,531 | |
| | 1,801 | | | Bankinter SA | | | 16,614 | |
| | 4,726 | | | CaixaBank SA | | | 22,592 | |
| | 2,505 | | | Distribuidora Internacional de Alimentacion SA | | | 15,632 | |
| | 708 | | | Endesa SA | | | 16,333 | |
| | 752 | | | Gamesa Corp. Technologica SA | | | 16,089 | |
| | 727 | | | Gas Natural SDG SA | | | 17,018 | |
| | 16,547 | | | Iberdrola SA | | | 131,125 | |
| | 5,592 | | | Mapfre SA | | | 19,573 | |
| | 43 | | | Repsol SA (a) | | | 659 | |
| | 1,474 | | | Repsol SA (a) | | | 22,598 | |
| | 3,660 | | | Telefonica SA | | | 37,887 | |
| | | | | | | | |
| | | | | | | 529,791 | |
| | | | | | | | |
| | | | Sweden — 0.6% | |
| | 767 | | | Alfa Laval AB | | | 15,699 | |
| | 553 | | | Electrolux AB, Series B | | | 18,133 | |
| | 527 | | | ICA Gruppen AB | | | 19,632 | |
| | 578 | | | Kinnevik AB, Class B | | | 17,720 | |
| | 2,718 | | | Nordea Bank AB | | | 34,618 | |
| | 966 | | | Securitas AB, Class B | | | 16,293 | |
| | 1,942 | | | Skandinaviska Enskilda Banken AB, Class A | | | 23,511 | |
| | 766 | | | Skanska AB, Class B | | | 18,189 | |
| | 814 | | | SKF AB, Class B | | | 16,529 | |
| | 1,818 | | | Svenska Handelsbanken AB, Class A | | | 26,038 | |
| | 1,071 | | | Swedbank AB, Class A | | | 26,139 | |
| | 508 | | | Swedish Match AB | | | 17,897 | |
| | 1,450 | | | Tele2 AB, Class B | | | 15,195 | |
| | | | | | | | |
| | | | | | | 265,593 | |
| | | | | | | | |
| | | | Switzerland — 1.4% | |
| | 1,614 | | | ABB Ltd. (Registered) | | | 40,061 | |
| | 4 | | | Banque Cantonale Vaudoise (Registered) | | | 2,967 | |
| | 33 | | | Cembra Money Bank AG | | | 3,127 | |
| | 2,151 | | | Credit Suisse Group AG (Registered) (a) | | | 31,299 | |
| | 10,373 | | | Glencore plc (a) | | | 38,870 | |
| | 514 | | | LafargeHolcim Ltd. (a) | | | 29,541 | |
| | 1,720 | | | Novartis AG (Registered) | | | 143,666 | |
| | 348 | | | Roche Holding AG | | | 88,919 | |
| | 1,571 | | | Swiss Re AG | | | 143,971 | |
| | 2,832 | | | UBS Group AG (Registered) (a) | | | 48,161 | |
| | 1,080 | | | Wolseley plc | | | 66,288 | |
| | 128 | | | Zurich Insurance Group AG | | | 37,357 | |
| | | | | | | | |
| | | | | | | 674,227 | |
| | | | | | | | |
SEE NOTES TO FINANCIAL STATEMENTS.
| | | | | | | | |
| | | |
| JUNE 30, 2017 | | JPMORGAN INSURANCE TRUST | | | | | 7 | |
JPMorgan Insurance Trust Income Builder Portfolio
SCHEDULE OF PORTFOLIO INVESTMENTS
AS OF JUNE 30, 2017 (Unaudited) (continued)
| | | | | | | | |
SHARES | | | SECURITY DESCRIPTION | | VALUE($) | |
| | Common Stocks — continued | |
| | | | United Kingdom — 5.6% | |
| | 1,665 | | | 3i Group plc | | | 19,576 | |
| | 1,630 | | | Anglo American plc (a) | | | 21,776 | |
| | 682 | | | AstraZeneca plc | | | 45,683 | |
| | 4,240 | | | Aviva plc | | | 29,084 | |
| | 1,228 | | | Babcock International Group plc | | | 14,082 | |
| | 18,488 | | | BAE Systems plc | | | 152,624 | |
| | 2,808 | | | Barratt Developments plc | | | 20,623 | |
| | 377 | | | Berkeley Group Holdings plc | | | 15,853 | |
| | 3,388 | | | British American Tobacco plc | | | 230,868 | |
| | 7,446 | | | British Land Co. plc (The) | | | 58,783 | |
| | 7,809 | | | Centrica plc | | | 20,360 | |
| | 1,466 | | | Compass Group plc | | | 30,951 | |
| | 27,747 | | | Direct Line Insurance Group plc | | | 128,483 | |
| | 3,510 | | | Dixons Carphone plc | | | 12,975 | |
| | 897 | | | easyJet plc | | | 15,890 | |
| | 5,530 | | | G4S plc | | | 23,519 | |
| | 3,703 | | | GKN plc | | | 15,729 | |
| | 13,413 | | | GlaxoSmithKline plc | | | 285,526 | |
| | 2,298 | | | Hammerson plc | | | 17,193 | |
| | 12,180 | | | HSBC Holdings plc | | | 113,055 | |
| | 13,200 | | | HSBC Holdings plc | | | 122,633 | |
| | 1,038 | | | IMI plc | | | 16,167 | |
| | 963 | | | Imperial Brands plc | | | 43,274 | |
| | 1,820 | | | Inmarsat plc | | | 18,253 | |
| | 388 | | | InterContinental Hotels Group plc | | | 21,547 | |
| | 2,344 | | | International Consolidated Airlines Group SA | | | 18,624 | |
| | 6,006 | | | ITV plc | | | 14,217 | |
| | 5,510 | | | J Sainsbury plc | | | 18,073 | |
| | 1,445 | | | Land Securities Group plc | | | 19,078 | |
| | 7,508 | | | Legal & General Group plc | | | 25,264 | |
| | 53,924 | | | Lloyds Banking Group plc | | | 46,470 | |
| | 2,443 | | | Meggitt plc | | | 15,180 | |
| | 438 | | | Micro Focus International plc | | | 12,951 | |
| | 3,165 | | | NewRiver REIT plc | | | 14,424 | |
| | 7,805 | | | Old Mutual plc | | | 19,691 | |
| | 4,757 | | | Persimmon plc | | | 138,935 | |
| | 2,001 | | | Prudential plc | | | 45,931 | |
| | 3,843 | | | Rio Tinto plc | | | 162,758 | |
| | 2,332 | | | RSA Insurance Group plc | | | 18,707 | |
| | 6,555 | | | Safestore Holdings plc | | | 35,902 | |
| | 374 | | | Schroders plc | | | 15,123 | |
| | 6,308 | | | Segro plc | | | 40,206 | |
| | 564 | | | Severn Trent plc | | | 16,034 | |
| | 893 | | | Smiths Group plc | | | 18,567 | |
| | 1,126 | | | St James’s Place plc | | | 17,356 | |
| | | | | | | | |
SHARES | | | SECURITY DESCRIPTION | | VALUE($) | |
| | | | | | | | |
| | | | United Kingdom — continued | | | | |
| | 3,568 | | | Standard Life plc | | | 18,554 | |
| | 1,556 | | | Tate & Lyle plc | | | 13,410 | |
| | 7,298 | | | Taylor Wimpey plc | | | 16,759 | |
| | 11,245 | | | Tritax Big Box REIT plc | | | 21,413 | |
| | 1,818 | | | Unilever plc | | | 98,386 | |
| | 71,850 | | | Vodafone Group plc | | | 204,051 | |
| | 5,030 | | | WPP plc | | | 105,915 | |
| | | | | | | | |
| | | | | | | 2,686,486 | |
| | | | | | | | |
| | | | United States — 11.9% | |
| | 1,332 | | | Accenture plc, Class A | | | 164,742 | |
| | 464 | | | Alexandria Real Estate Equities, Inc. | | | 55,898 | |
| | 2,234 | | | Altria Group, Inc. | | | 166,366 | |
| | 1,363 | | | Apartment Investment & Management Co., Class A | | | 58,568 | |
| | 887 | | | Apple, Inc. | | | 127,746 | |
| | 3,652 | | | AT&T, Inc. | | | 137,790 | |
| | 715 | | | AvalonBay Communities, Inc. | | | 137,402 | |
| | 2,798 | | | Brandywine Realty Trust | | | 49,049 | |
| | 1,671 | | | Brixmor Property Group, Inc. | | | 29,878 | |
| | 1,033 | | | Camden Property Trust | | | 88,332 | |
| | 677 | | | CME Group, Inc. | | | 84,788 | |
| | 4,233 | | | Comcast Corp., Class A | | | 164,748 | |
| | 1,153 | | | Digital Realty Trust, Inc. | | | 130,231 | |
| | 963 | | | Duke Realty Corp. | | | 26,916 | |
| | 1,575 | | | EI du Pont de Nemours & Co. | | | 127,118 | |
| | 342 | | | Extra Space Storage, Inc. | | | 26,676 | |
| | 2,383 | | | General Motors Co. | | | 83,238 | |
| | 675 | | | Gramercy Property Trust | | | 20,054 | |
| | 4,623 | | | HCP, Inc. | | | 147,751 | |
| | 1,135 | | | Healthcare Trust of America, Inc., Class A | | | 35,310 | |
| | 1,105 | | | Highwoods Properties, Inc. | | | 56,035 | |
| | 1,228 | | | Home Depot, Inc. (The) | | | 188,375 | |
| | 4,598 | | | Host Hotels & Resorts, Inc. | | | 84,005 | |
| | 4,300 | | | HP, Inc. | | | 75,164 | |
| | 483 | | | International Business Machines Corp. | | | 74,300 | |
| | 2,145 | | | Johnson & Johnson | | | 283,762 | |
| | 2,770 | | | Kimco Realty Corp. | | | 50,830 | |
| | 1,185 | | | KLA-Tencor Corp. | | | 108,439 | |
| | 1,037 | | | LaSalle Hotel Properties | | | 30,903 | |
| | 1,471 | | | Liberty Property Trust | | | 59,884 | |
| | 911 | | | Macerich Co. (The) | | | 52,893 | |
| | 1,538 | | | MetLife, Inc. | | | 84,498 | |
| | 3,131 | | | Microsoft Corp. | | | 215,820 | |
| | 547 | | | Mid-America Apartment Communities, Inc. | | | 57,643 | |
SEE NOTES TO FINANCIAL STATEMENTS.
| | | | | | |
| | | |
| 8 | | | | JPMORGAN INSURANCE TRUST | | JUNE 30, 2017 |
| | | | | | | | |
SHARES | | | SECURITY DESCRIPTION | | VALUE($) | |
| | Common Stocks — continued | |
| | | | United States — continued | | | | |
| | 3,333 | | | Morgan Stanley | | | 148,519 | |
| | 943 | | | National Health Investors, Inc. | | | 74,686 | |
| | 1,486 | | | NextEra Energy, Inc. | | | 208,233 | |
| | 4,305 | | | Occidental Petroleum Corp. | | | 257,740 | |
| | 1,405 | | | PepsiCo, Inc. | | | 162,263 | |
| | 6,865 | | | Pfizer, Inc. | | | 230,595 | |
| | 1,297 | | | Philip Morris International, Inc. | | | 152,333 | |
| | 2,631 | | | Prologis, Inc. | | | 154,282 | |
| | 631 | | | Public Storage | | | 131,582 | |
| | 725 | | | Quality Care Properties, Inc. (a) | | | 13,275 | |
| | 366 | | | Realty Income Corp. | | | 20,196 | |
| | 373 | | | Regency Centers Corp. | | | 23,387 | |
| | 1,144 | | | Senior Housing Properties Trust | | | 23,383 | |
| | 641 | | | Simon Property Group, Inc. | | | 103,688 | |
| | 319 | | | SL Green Realty Corp. | | | 33,750 | |
| | 4,448 | | | Spirit Realty Capital, Inc. | | | 32,960 | |
| | 643 | | | STORE Capital Corp. | | | 14,435 | |
| | 578 | | | Sunstone Hotel Investors, Inc. | | | 9,317 | |
| | 1,424 | | | Texas Instruments, Inc. | | | 109,548 | |
| | 948 | | | UnitedHealth Group, Inc. | | | 175,778 | |
| | 1,401 | | | Valero Energy Corp. | | | 94,511 | |
| | 901 | | | Ventas, Inc. | | | 62,601 | |
| | 922 | | | Vornado Realty Trust | | | 86,576 | |
| | 2,290 | | | Wells Fargo & Co. | | | 126,889 | |
| | | | | | | | |
| | | | | | | 5,735,679 | |
| | | | | | | | |
| | | | Total Common Stocks
(Cost $13,446,859) | | | 14,836,546 | |
| | | | | | | | |
| | |
PRINCIPAL
AMOUNT($) | | | | | | |
| | Convertible Bonds — 0.0% (g) | |
| | | | United States — 0.0% (g) | |
| | | | Liberty Interactive LLC, | | | | |
| | 2,000 | | | 3.750%, 02/15/30 | | | 1,330 | |
| | 3,000 | | | 4.000%, 11/15/29 | | | 2,010 | |
| | | | | | | | |
| | | | Total Convertible Bonds
(Cost $3,167) | | | 3,340 | |
| | | | | | | | |
| | Corporate Bonds — 41.3% | | | | |
| | | | Australia — 0.6% | |
| | 200,000 | | | Australia & New Zealand Banking Group Ltd., VAR, 6.750%, 06/15/26 (e) (x) (y) | | | 221,129 | |
| | 35,000 | | | BlueScope Steel Finance Ltd., 6.500%, 05/15/21 (e) | | | 36,925 | |
| | | | FMG Resources August 2006 Pty. Ltd., | | | | |
| | 11,000 | | | 4.750%, 05/15/22 (e) | | | 11,041 | |
| | | | | | | | |
| | |
PRINCIPAL
AMOUNT($) | | | SECURITY DESCRIPTION | | VALUE($) | |
| | | | | | | | |
| | | | Australia — continued | | | | |
| | 12,000 | | | 5.125%, 05/15/24 (e) | | | 12,000 | |
| | | | | | | | |
| | | | | | | 281,095 | |
| | | | | | | | |
| | | | Belgium — 0.1% | |
| | 10,000 | | | Anheuser-Busch InBev Finance, Inc., 4.900%, 02/01/46 | | | 11,302 | |
| | 10,000 | | | Anheuser-Busch InBev Worldwide, Inc., 4.439%, 10/06/48 (e) | | | 10,656 | |
| | | | | | | | |
| | | | | | | 21,958 | |
| | | | | | | | |
| | | | Brazil — 0.2% | |
| | | | JBS USA LUX SA, | | | | |
| | 29,000 | | | 7.250%, 06/01/21 (e) | | | 28,985 | |
| | 55,000 | | | 7.250%, 06/01/21 (e) | | | 54,973 | |
| | | | | | | | |
| | | | | | | 83,958 | |
| | | | | | | | |
| | | | Canada — 2.0% | |
| | 39,000 | | | 1011778 BC ULC, 4.250%, 05/15/24 (e) | | | 38,754 | |
| | | | Bombardier, Inc., | | | | |
| | 72,000 | | | 7.500%, 03/15/25 (e) | | | 74,700 | |
| | 16,000 | | | 8.750%, 12/01/21 (e) | | | 17,760 | |
| | | | Cenovus Energy, Inc., | | | | |
| | 30,000 | | | 5.400%, 06/15/47 (e) | | | 28,037 | |
| | 20,000 | | | 6.750%, 11/15/39 | | | 21,032 | |
| | 21,000 | | | Cott Holdings, Inc., 5.500%, 04/01/25 (e) | | | 21,420 | |
| | 75,000 | | | Emera, Inc., Series 16-A, VAR, 6.750%, 06/15/76 | | | 84,750 | |
| | 15,000 | | | Gateway Casinos & Entertainment Ltd., 8.250%, 03/01/24 (e) | | | 15,600 | |
| | 90,000 | | | GW Honos Security Corp., 8.750%, 05/15/25 (e) | | | 94,162 | |
| | 70,000 | | | Kronos Acquisition Holdings, Inc., 9.000%, 08/15/23 (e) | | | 69,825 | |
| | 25,000 | | | Lundin Mining Corp., 7.500%, 11/01/20 (e) | | | 26,285 | |
| | 20,000 | | | Mattamy Group Corp., 6.875%, 12/15/23 (e) | | | 20,425 | |
| | 88,000 | | | MEG Energy Corp., 6.500%, 01/15/25 (e) | | | 80,080 | |
| | | | NOVA Chemicals Corp., | | | | |
| | 11,000 | | | 4.875%, 06/01/24 (e) | | | 10,959 | |
| | 12,000 | | | 5.000%, 05/01/25 (e) | | | 11,940 | |
| | 15,000 | | | 5.250%, 08/01/23 (e) | | | 15,412 | |
| | 6,000 | | | 5.250%, 06/01/27 (e) | | | 5,970 | |
| | 29,000 | | | Open Text Corp., 5.875%, 06/01/26 (e) | | | 31,193 | |
| | 49,029 | | | Precision Drilling Corp., 6.625%, 11/15/20 | | | 48,048 | |
| | 30,000 | | | Teck Resources Ltd., 6.125%, 10/01/35 | | | 31,275 | |
| | 25,000 | | | TransCanada PipeLines Ltd., 4.625%, 03/01/34 | | | 27,462 | |
| | 125,000 | | | Transcanada Trust, VAR, 5.300%, 03/15/77 | | | 128,500 | |
SEE NOTES TO FINANCIAL STATEMENTS.
| | | | | | | | |
| | | |
| JUNE 30, 2017 | | JPMORGAN INSURANCE TRUST | | | | | 9 | |
JPMorgan Insurance Trust Income Builder Portfolio
SCHEDULE OF PORTFOLIO INVESTMENTS
AS OF JUNE 30, 2017 (Unaudited) (continued)
| | | | | | | | |
| | |
PRINCIPAL
AMOUNT($) | | | SECURITY DESCRIPTION | | VALUE($) | |
| | Corporate Bonds — continued | | | | |
| | | | Canada — continued | | | | |
| | 8,000 | | | Trinidad Drilling Ltd., 6.625%, 02/15/25 (e) | | | 7,600 | |
| | | | Videotron Ltd., | | | | |
| | 18,000 | | | 5.000%, 07/15/22 | | | 19,035 | |
| | 7,000 | | | 5.125%, 04/15/27 (e) | | | 7,193 | |
| | | | | | | | |
| | | | | | | 937,417 | |
| | | | | | | | |
| | | | Finland — 0.1% | |
| | 47,000 | | | Nokia OYJ, 6.625%, 05/15/39 | | | 54,109 | |
| | | | | | | | |
| | | | Ireland — 0.1% | |
| | | | Park Aerospace Holdings Ltd., | | | | |
| | 16,000 | | | 5.250%, 08/15/22 (e) | | | 16,725 | |
| | 17,000 | | | 5.500%, 02/15/24 (e) | | | 17,757 | |
| | | | | | | | |
| | | | | | | 34,482 | |
| | | | | | | | |
| | | | Israel — 0.1% | |
| | 45,000 | | | Teva Pharmaceutical Finance Netherlands III BV, 4.100%, 10/01/46 | | | 41,482 | |
| | | | | | | | |
| | | | Luxembourg — 0.8% | |
| | | | ArcelorMittal, | | | | |
| | 112,000 | | | 7.000%, 02/25/22 | | | 126,000 | |
| | 70,000 | | | 7.500%, 03/01/41 | | | 77,175 | |
| | 8,000 | | | 7.750%, 10/15/39 (w) | | | 8,970 | |
| | | | Intelsat Jackson Holdings SA, | | | | |
| | 30,000 | | | 5.500%, 08/01/23 | | | 24,825 | |
| | 40,000 | | | 7.250%, 04/01/19 | | | 40,010 | |
| | 20,000 | | | 7.250%, 10/15/20 | | | 18,900 | |
| | 25,000 | | | 7.500%, 04/01/21 | | | 23,062 | |
| | 45,000 | | | 8.000%, 02/15/24 (e) | | | 48,487 | |
| | 10,000 | | | 9.750%, 07/15/25 (e) | | | 9,988 | |
| | | | | | | | |
| | | | | | | 377,417 | |
| | | | | | | | |
| | | | Mexico — 0.4% | |
| | 200,000 | | | Cemex SAB de CV, 5.700%, 01/11/25 (e) | | | 213,750 | |
| | | | | | | | |
| | | | New Zealand — 0.0% (g) | |
| | 20,000 | | | Reynolds Group Issuer, Inc., 5.750%, 10/15/20 | | | 20,467 | |
| | | | | | | | |
| | | | Switzerland — 0.4% | |
| | 200,000 | | | Credit Suisse Group AG, VAR, 6.250%, 12/18/24 (e) (x) (y) | | | 212,500 | |
| | | | | | | | |
| | | | United Arab Emirates — 0.1% | |
| | 62,000 | | | Shelf Drilling Holdings Ltd., 9.500%, 11/02/20 (e) | | | 60,444 | |
| | | | | | | | |
| | | | United Kingdom — 1.1% | |
| | 125,000 | | | Anglo American Capital plc, 4.450%, 09/27/20 (e) | | | 130,299 | |
| | | | | | | | |
| | |
PRINCIPAL
AMOUNT($) | | | SECURITY DESCRIPTION | | VALUE($) | |
| | | | | | | | |
| | | | United Kingdom — continued | | | | |
| | 200,000 | | | HSBC Holdings plc, VAR, 6.875%, 06/01/21 (x) (y) | | | 216,000 | |
| | | | Royal Bank of Scotland Group plc, | | | | |
| | 15,000 | | | 6.100%, 06/10/23 | | | 16,525 | |
| | 157,000 | | | 6.125%, 12/15/22 | | | 171,869 | |
| | | | | | | | |
| | | | | | | 534,693 | |
| | | | | | | | |
| | | | United States — 35.3% | |
| | | | 21st Century Fox America, Inc., | | | | |
| | 10,000 | | | 4.750%, 09/15/44 | | | 10,542 | |
| | 35,000 | | | 4.950%, 10/15/45 | | | 37,939 | |
| | 20,000 | | | Abbott Laboratories, 4.900%, 11/30/46 | | | 22,104 | |
| | | | AbbVie, Inc., | | | | |
| | 15,000 | | | 4.450%, 05/14/46 | | | 15,505 | |
| | 16,000 | | | 4.700%, 05/14/45 | | | 17,026 | |
| | | | Acadia Healthcare Co., Inc., | | | | |
| | 15,000 | | | 5.125%, 07/01/22 | | | 15,487 | |
| | 40,000 | | | 6.500%, 03/01/24 | | | 42,700 | |
| | 27,000 | | | ACCO Brands Corp., 5.250%, 12/15/24 (e) | | | 28,046 | |
| | 40,000 | | | ACE Cash Express, Inc., 11.000%, 02/01/19 (e) | | | 40,000 | |
| | 65,000 | | | ADT Corp. (The), 4.125%, 06/15/23 | | | 64,431 | |
| | 85,000 | | | AECOM, 5.875%, 10/15/24 | | | 92,437 | |
| | 30,000 | | | Ahern Rentals, Inc., 7.375%, 05/15/23 (e) | | | 24,600 | |
| | 39,000 | | | Aircastle Ltd., 5.125%, 03/15/21 | | | 41,647 | |
| | 23,000 | | | AK Steel Corp., 7.000%, 03/15/27 | | | 23,747 | |
| | 75,000 | | | Albertsons Cos. LLC, 6.625%, 06/15/24 (e) | | | 74,437 | |
| | 21,000 | | | Allergan Funding SCS, 4.850%, 06/15/44 | | | 22,741 | |
| | 30,000 | | | Alliance Data Systems Corp., 5.375%, 08/01/22 (e) | | | 30,300 | |
| | 75,000 | | | Allstate Corp. (The), VAR, 5.750%, 08/15/53 | | | 82,125 | |
| | | | Ally Financial, Inc., | | | | |
| | 79,000 | | | 4.125%, 03/30/20 | | | 81,172 | |
| | 83,000 | | | 4.625%, 03/30/25 | | | 85,007 | |
| | 44,000 | | | 8.000%, 11/01/31 | | | 53,900 | |
| | 8,000 | | | AMC Entertainment Holdings, Inc., 6.125%, 05/15/27 (e) | | | 8,442 | |
| | 105,000 | | | AMC Networks, Inc., 4.750%, 12/15/22 | | | 108,339 | |
| | | | American Axle & Manufacturing, Inc., | | | | |
| | 46,000 | | | 6.250%, 04/01/25 (e) | | | 44,850 | |
| | 67,000 | | | 6.500%, 04/01/27 (e) | | | 65,157 | |
| | 7,000 | | | 6.625%, 10/15/22 | | | 7,175 | |
| | 70,000 | | | American Express Co., Series C, VAR, 4.900%, 03/15/20 (x) (y) | | | 71,155 | |
| | 24,000 | | | American Greetings Corp., 7.875%, 02/15/25 (e) | | | 25,950 | |
SEE NOTES TO FINANCIAL STATEMENTS.
| | | | | | |
| | | |
| 10 | | | | JPMORGAN INSURANCE TRUST | | JUNE 30, 2017 |
| | | | | | | | |
| | |
PRINCIPAL
AMOUNT($) | | | SECURITY DESCRIPTION | | VALUE($) | |
| | Corporate Bonds — continued | | | | |
| | | | United States — continued | | | | |
| | | | American International Group, Inc., | | | | |
| | 25,000 | | | 4.500%, 07/16/44 | | | 25,457 | |
| | 18,000 | | | 4.800%, 07/10/45 | | | 19,237 | |
| | 35,000 | | | AmeriGas Partners LP, 5.750%, 05/20/27 | | | 35,525 | |
| | 15,000 | | | Amgen, Inc., 4.400%, 05/01/45 | | | 15,429 | |
| | 20,000 | | | AMN Healthcare, Inc., 5.125%, 10/01/24 (e) | | | 20,250 | |
| | | | Antero Resources Corp., | | | | |
| | 60,000 | | | 5.125%, 12/01/22 | | | 60,131 | |
| | 26,000 | | | 5.375%, 11/01/21 | | | 26,260 | |
| | 20,000 | | | Anthem, Inc., 4.650%, 08/15/44 | | | 21,693 | |
| | | | Arconic, Inc., | | | | |
| | 63,000 | | | 5.125%, 10/01/24 | | | 65,362 | |
| | 40,000 | | | 5.950%, 02/01/37 | | | 40,300 | |
| | | | AT&T, Inc., | | | | |
| | 25,000 | | | 4.350%, 06/15/45 | | | 23,235 | |
| | 19,000 | | | 4.750%, 05/15/46 | | | 18,657 | |
| | 25,000 | | | 5.650%, 02/15/47 | | | 27,565 | |
| | 15,000 | | | AvalonBay Communities, Inc., 4.150%, 07/01/47 | | | 15,183 | |
| | 80,000 | | | Avaya, Inc., 7.000%, 04/01/19 (d) (e) | | | 64,200 | |
| | 15,000 | | | B&G Foods, Inc., 5.250%, 04/01/25 | | | 15,300 | |
| | 52,000 | | | Ball Corp., 4.000%, 11/15/23 | | | 53,170 | |
| | | | Bank of America Corp., | | | | |
| | 110,000 | | | Series V, VAR, 5.125%, 06/17/19 (x) (y) | | | 112,750 | |
| | 60,000 | | | Series Z, VAR, 6.500%, 10/23/24 (x) (y) | | | 66,716 | |
| | 135,000 | | | Series AA, VAR, 6.100%, 03/17/25 (x) (y) | | | 146,657 | |
| | | | Bank of New York Mellon Corp. (The), | | | | |
| | 65,000 | | | Series D, VAR, 4.500%, 06/20/23 (x) (y) | | | 64,675 | |
| | 110,000 | | | Series E, VAR, 4.950%, 06/20/20 (x) (y) | | | 114,730 | |
| | 20,000 | | | Becton Dickinson and Co., 4.669%, 06/06/47 | | | 20,601 | |
| | 50,000 | | | Berry Plastics Corp., 5.125%, 07/15/23 | | | 52,062 | |
| | 10,000 | | | Biogen, Inc., 5.200%, 09/15/45 | | | 11,424 | |
| | 45,000 | | | Blue Cube Spinco, Inc., 10.000%, 10/15/25 | | | 55,350 | |
| | 7,000 | | | Booz Allen Hamilton, Inc., 5.125%, 05/01/25 (e) | | | 6,877 | |
| | 20,000 | | | Boyd Gaming Corp., 6.875%, 05/15/23 | | | 21,400 | |
| | 25,000 | | | Brighthouse Financial, Inc., 4.700%, 06/22/47 (e) | | | 24,578 | |
| | 18,000 | | | Bumble Bee Holdings, Inc., 9.000%, 12/15/17 (e) | | | 18,045 | |
| | 48,000 | | | Cablevision Systems Corp., 8.000%, 04/15/20 | | | 53,460 | |
| | | | CalAtlantic Group, Inc., | | | | |
| | 7,000 | | | 5.250%, 06/01/26 | | | 7,262 | |
| | 29,000 | | | 5.875%, 11/15/24 | | | 31,429 | |
| | | | | | | | |
| | |
PRINCIPAL
AMOUNT($) | | | SECURITY DESCRIPTION | | VALUE($) | |
| | | | | |
| | | | United States — continued | | | | |
| | | | Callon Petroleum Co., | | | | |
| | 23,000 | | | 6.125%, 10/01/24 | | | 23,402 | |
| | 12,000 | | | 6.125%, 10/01/24 (e) | | | 12,210 | |
| | 105,000 | | | Calpine Corp., 5.250%, 06/01/26 (e) | | | 102,900 | |
| | 8,000 | | | Camelot Finance SA, 7.875%, 10/15/24 (e) | | | 8,620 | |
| | 100,000 | | | Capital One Financial Corp., Series E, VAR, 5.550%, 06/01/20 (x) (y) | | | 105,000 | |
| | 15,000 | | | CBS Corp., 4.600%, 01/15/45 | | | 15,409 | |
| | 26,000 | | | CCM Merger, Inc., 6.000%, 03/15/22 (e) | | | 26,650 | |
| | | | CCO Holdings LLC, | | | | |
| | 10,000 | | | 5.125%, 05/01/27 (e) | | | 10,225 | |
| | 164,000 | | | 5.750%, 01/15/24 | | | 172,815 | |
| | 75,000 | | | 5.750%, 02/15/26 (e) | | | 80,250 | |
| | 45,000 | | | 5.875%, 05/01/27 (e) | | | 48,094 | |
| | 26,000 | | | CDW LLC, 5.000%, 09/01/23 | | | 27,072 | |
| | 5,000 | | | Cedar Fair LP, 5.375%, 04/15/27 (e) | | | 5,287 | |
| | 15,000 | | | Celgene Corp., 5.000%, 08/15/45 | | | 16,913 | |
| | | | Centene Corp., | | | | |
| | 124,000 | | | 4.750%, 05/15/22 | | | 129,425 | |
| | 40,000 | | | 4.750%, 01/15/25 | | | 41,100 | |
| | 30,000 | | | Cequel Communications Holdings I LLC, 5.125%, 12/15/21 (e) | | | 30,553 | |
| | | | CF Industries, Inc., | | | | |
| | 16,000 | | | 4.500%, 12/01/26 (e) | | | 16,452 | |
| | 22,000 | | | 5.150%, 03/15/34 | | | 20,350 | |
| | 39,000 | | | 5.375%, 03/15/44 | | | 34,905 | |
| | 59,000 | | | Charter Communications Operating LLC, 6.484%, 10/23/45 | | | 70,901 | |
| | | | Chemours Co. (The), | | | | |
| | 8,000 | | | 5.375%, 05/15/27 | | | 8,210 | |
| | 10,000 | | | 7.000%, 05/15/25 | | | 10,900 | |
| | 35,000 | | | Cheniere Corpus Christi Holdings LLC, 5.875%, 03/31/25 | | | 37,319 | |
| | | | Chesapeake Energy Corp., | | | | |
| | 19,000 | | | 4.875%, 04/15/22 | | | 17,670 | |
| | 9,000 | | | 6.125%, 02/15/21 | | | 8,820 | |
| | 19,000 | | | 8.000%, 01/15/25 (e) | | | 18,810 | |
| | 16,000 | | | 8.000%, 06/15/27 (e) | | | 15,720 | |
| | 20,000 | | | Cincinnati Bell, Inc., 7.000%, 07/15/24 (e) | | | 20,904 | |
| | 57,000 | | | Cinemark USA, Inc., 5.125%, 12/15/22 | | | 58,710 | |
| | 50,000 | | | CIT Group, Inc., 5.375%, 05/15/20 | | | 53,812 | |
| | 23,000 | | | CITGO Petroleum Corp., 6.250%, 08/15/22 (e) | | | 23,345 | |
| | | | Citigroup, Inc., | | | | |
| | 40,000 | | | Series D, VAR, 5.350%, 05/15/23 (x) (y) | | | 40,900 | |
| | 190,000 | | | Series M, VAR, 6.300%, 05/15/24 (x) (y) | | | 202,350 | |
SEE NOTES TO FINANCIAL STATEMENTS.
| | | | | | | | |
| | | |
| JUNE 30, 2017 | | JPMORGAN INSURANCE TRUST | | | | | 11 | |
JPMorgan Insurance Trust Income Builder Portfolio
SCHEDULE OF PORTFOLIO INVESTMENTS
AS OF JUNE 30, 2017 (Unaudited) (continued)
| | | | | | | | |
| | |
PRINCIPAL
AMOUNT($) | | | SECURITY DESCRIPTION | | VALUE($) | |
| | Corporate Bonds — continued | | | | |
| | | | United States — continued | | | | |
| | 35,000 | | | Series O, VAR, 5.875%, 03/27/20 (x) (y) | | | 36,757 | |
| | 20,000 | | | Series P, VAR, 5.950%, 05/15/25 (x) (y) | | | 21,431 | |
| | 10,000 | | | Series R, VAR, 1.289%, 11/15/20 (x) (y) | | | 10,750 | |
| | 50,000 | | | Series R, VAR, 6.125%, 11/15/20 (x) (y) | | | 53,750 | |
| | 25,000 | | | Series T, VAR, 6.250%, 08/15/26 (x) (y) | | | 27,734 | |
| | | | Clear Channel Worldwide Holdings, Inc., | | | | |
| | 60,000 | | | Series B, 6.500%, 11/15/22 | | | 61,662 | |
| | 45,000 | | | Series B, 7.625%, 03/15/20 | | | 44,775 | |
| | 44,000 | | | Clearwater Paper Corp., 4.500%, 02/01/23 | | | 43,340 | |
| | 24,000 | | | CNO Financial Group, Inc., 5.250%, 05/30/25 | | | 25,416 | |
| | 15,000 | | | Columbia Pipeline Group, Inc., 5.800%, 06/01/45 | | | 17,867 | |
| | 20,000 | | | Comcast Corp., 4.600%, 08/15/45 | | | 21,841 | |
| | | | Commercial Metals Co., | | | | |
| | 79,000 | | | 4.875%, 05/15/23 | | | 79,889 | |
| | 6,000 | | | 5.375%, 07/15/27 | | | 6,112 | |
| | | | CommScope Technologies LLC, | | | | |
| | 13,000 | | | 5.000%, 03/15/27 (e) | | | 12,967 | |
| | 60,000 | | | 6.000%, 06/15/25 (e) | | | 64,050 | |
| | | | Community Health Systems, Inc., | | | | |
| | 9,000 | | | 5.125%, 08/01/21 | | | 9,113 | |
| | 8,000 | | | 6.250%, 03/31/23 | | | 8,259 | |
| | 35,000 | | | 7.125%, 07/15/20 | | | 34,081 | |
| | | | Continental Resources, Inc., | | | | |
| | 17,000 | | | 4.500%, 04/15/23 | | | 16,235 | |
| | 93,000 | | | 5.000%, 09/15/22 | | | 91,256 | |
| | | | Covanta Holding Corp., | | | | |
| | 4,000 | | | 5.875%, 07/01/25 | | | 3,880 | |
| | 10,000 | | | 6.375%, 10/01/22 | | | 10,300 | |
| | 19,000 | | | Crestwood Midstream Partners LP, 5.750%, 04/01/25 (e) | | | 18,952 | |
| | 72,000 | | | Crown Americas LLC, 4.500%, 01/15/23 | | | 75,420 | |
| | | | CSC Holdings LLC, | | | | |
| | 35,000 | | | 5.250%, 06/01/24 | | | 35,703 | |
| | 22,000 | | | 6.750%, 11/15/21 | | | 24,365 | |
| | 38,000 | | | CST Brands, Inc., 5.000%, 05/01/23 | | | 39,908 | |
| | 20,000 | | | CSX Corp., 4.250%, 11/01/66 | | | 19,751 | |
| | 5,000 | | | Cumberland Farms, Inc., 6.750%, 05/01/25 (e) | | | 5,262 | |
| | 59,000 | | | CVR Partners LP, 9.250%, 06/15/23 (e) | | | 61,729 | |
| | | | CyrusOne LP, | | | | |
| | 12,000 | | | 5.000%, 03/15/24 (e) | | | 12,360 | |
| | 23,000 | | | 5.375%, 03/15/27 (e) | | | 23,949 | |
| | 19,000 | | | Dana Financing Luxembourg Sarl, 5.750%, 04/15/25 (e) | | | 19,665 | |
| | | | | | | | |
| | |
PRINCIPAL
AMOUNT($) | | | SECURITY DESCRIPTION | | VALUE($) | |
| | | | | |
| | | | United States — continued | | | | |
| | | | DaVita, Inc., | | | | |
| | 35,000 | | | 5.125%, 07/15/24 | | | 35,525 | |
| | 25,000 | | | 5.750%, 08/15/22 | | | 25,687 | |
| | | | DCP Midstream Operating LP, | | | | |
| | 38,000 | | | 3.875%, 03/15/23 | | | 36,670 | |
| | 20,000 | | | 6.750%, 09/15/37 (e) | | | 21,500 | |
| | 28,000 | | | Delek Logistics Partners LP, 6.750%, 05/15/25 (e) | | | 28,280 | |
| | | | Diamond 1 Finance Corp., | | | | |
| | 129,000 | | | 7.125%, 06/15/24 (e) | | | 141,807 | |
| | 25,000 | | | 8.350%, 07/15/46 (e) | | | 32,301 | |
| | 21,000 | | | Diamondback Energy, Inc., 4.750%, 11/01/24 (e) | | | 20,895 | |
| | 37,000 | | | Diebold Nixdorf, Inc., 8.500%, 04/15/24 | | | 41,397 | |
| | | | DISH DBS Corp., | | | | |
| | 13,000 | | | 5.000%, 03/15/23 | | | 13,325 | |
| | 18,000 | | | 5.875%, 11/15/24 | | | 19,205 | |
| | 147,000 | | | 6.750%, 06/01/21 | | | 163,170 | |
| | 35,000 | | | 7.750%, 07/01/26 | | | 41,475 | |
| | 24,000 | | | Dole Food Co., Inc., 7.250%, 06/15/25 (e) | | | 24,960 | |
| | 6,000 | | | Dominion Energy Gas Holdings LLC, 4.600%, 12/15/44 | | | 6,278 | |
| | 90,000 | | | Dynegy, Inc., 7.625%, 11/01/24 | | | 87,300 | |
| | 24,000 | | | Eldorado Resorts, Inc., 6.000%, 04/01/25 (e) | | | 25,440 | |
| | 169,000 | | | Embarq Corp., 7.995%, 06/01/36 | | | 170,690 | |
| | 65,000 | | | Endo Finance LLC, 5.750%, 01/15/22 (e) | | | 58,487 | |
| | 40,000 | | | Energy Transfer Equity LP, 5.875%, 01/15/24 | | | 42,400 | |
| | 5,000 | | | Energy Transfer LP, 5.150%, 02/01/43 | | | 4,751 | |
| | 24,000 | | | EnerSys, 5.000%, 04/30/23 (e) | | | 24,690 | |
| | 10,000 | | | Ensco plc, 5.200%, 03/15/25 | | | 8,125 | |
| | | | Enterprise Products Operating LLC, | | | | |
| | 15,000 | | | 4.850%, 03/15/44 | | | 15,922 | |
| | 33,000 | | | 4.900%, 05/15/46 | | | 35,535 | |
| | 100,000 | | | Envision Healthcare Corp., 5.625%, 07/15/22 | | | 103,625 | |
| | | | EP Energy LLC, | | | | |
| | 4,000 | | | 8.000%, 11/29/24 (e) | | | 3,990 | |
| | 55,000 | | | 8.000%, 02/15/25 (e) | | | 40,975 | |
| | 54,000 | | | 9.375%, 05/01/20 | | | 42,592 | |
| | 77,000 | | | Equinix, Inc., 5.750%, 01/01/25 | | | 82,871 | |
| | 30,000 | | | ERAC USA Finance LLC, 4.200%, 11/01/46 (e) | | | 28,280 | |
| | 25,000 | | | ESH Hospitality, Inc., 5.250%, 05/01/25 (e) | | | 25,906 | |
| | 6,000 | | | EW Scripps Co. (The), 5.125%, 05/15/25 (e) | | | 6,180 | |
| | 25,000 | | | Exela Intermediate LLC, 10.000%, 07/15/23 (e) (w) | | | 24,687 | |
SEE NOTES TO FINANCIAL STATEMENTS.
| | | | | | |
| | | |
| 12 | | | | JPMORGAN INSURANCE TRUST | | JUNE 30, 2017 |
| | | | | | | | |
| | |
PRINCIPAL
AMOUNT($) | | | SECURITY DESCRIPTION | | VALUE($) | |
| | Corporate Bonds — continued | | | | |
| | | | United States — continued | | | | |
| | | | Exelon Corp., | | | | |
| | 25,000 | | | 4.450%, 04/15/46 | | | 25,875 | |
| | 6,000 | | | 5.100%, 06/15/45 | | | 6,733 | |
| | | | Express Scripts Holding Co., | | | | |
| | 20,000 | | | 4.800%, 07/15/46 | | | 20,372 | |
| | 6,000 | | | 6.125%, 11/15/41 | | | 7,045 | |
| | | | FedEx Corp., | | | | |
| | 20,000 | | | 4.550%, 04/01/46 | | | 21,157 | |
| | 5,000 | | | 4.750%, 11/15/45 | | | 5,407 | |
| | 40,000 | | | Fidelity & Guaranty Life Holdings, Inc., 6.375%, 04/01/21 (e) | | | 41,200 | |
| | | | Fifth Third Bancorp, | | | | |
| | 30,000 | | | Series J, VAR, 4.900%, 09/30/19 (x) (y) | | | 30,375 | |
| | 55,000 | | | VAR, 5.100%, 06/30/23 (x) (y) | | | 55,962 | |
| | 45,000 | | | First Data Corp., 7.000%, 12/01/23 (e) | | | 48,037 | |
| | 5,000 | | | FirstCash, Inc., 5.375%, 06/01/24 (e) | | | 5,219 | |
| | 69,000 | | | Ford Motor Co., 4.750%, 01/15/43 | | | 66,689 | |
| | | | Freeport-McMoRan, Inc., | | | | |
| | 10,000 | | | 3.550%, 03/01/22 | | | 9,372 | |
| | 65,000 | | | 3.875%, 03/15/23 | | | 60,450 | |
| | 42,000 | | | 4.000%, 11/14/21 | | | 41,055 | |
| | 60,000 | | | 5.450%, 03/15/43 | | | 51,738 | |
| | 52,000 | | | Frontier Communications Corp., 8.500%, 04/15/20 | | | 54,665 | |
| | 62,000 | | | FTI Consulting, Inc., 6.000%, 11/15/22 | | | 64,325 | |
| | 16,000 | | | Gartner, Inc., 5.125%, 04/01/25 (e) | | | 16,807 | |
| | 28,000 | | | Gates Global LLC, 6.000%, 07/15/22 (e) | | | 28,070 | |
| | 227,000 | | | General Electric Co., Series D, VAR, 5.000%, 01/21/21 (x) (y) | | | 240,938 | |
| | | | General Motors Co., | | | | |
| | 29,000 | | | 6.250%, 10/02/43 | | | 32,250 | |
| | 30,000 | | | 6.750%, 04/01/46 | | | 35,624 | |
| | 43,000 | | | Genesys Telecommunications Laboratories, Inc., 10.000%, 11/30/24 (e) | | | 48,321 | |
| | 50,000 | | | GenOn Energy, Inc., 9.875%, 10/15/20 (d) | | | 30,500 | |
| | 40,000 | | | Gilead Sciences, Inc., 4.750%, 03/01/46 | | | 43,861 | |
| | 25,000 | | | Global Partners LP, 7.000%, 06/15/23 | | | 24,875 | |
| | | | GLP Capital LP, | | | | |
| | 22,000 | | | 4.875%, 11/01/20 | | | 23,457 | |
| | 25,000 | | | 5.375%, 11/01/23 | | | 27,188 | |
| | | | Goldman Sachs Group, Inc. (The), | | | | |
| | 100,000 | | | Series L, VAR, 5.700%, 05/10/19 (x) (y) | | | 104,075 | |
| | 250,000 | | | Series M, VAR, 5.375%, 05/10/20 (x) (y) | | | 262,700 | |
| | | | Goodyear Tire & Rubber Co. (The), | | | | |
| | 46,000 | | | 4.875%, 03/15/27 | | | 46,690 | |
| | 47,000 | | | 5.000%, 05/31/26 | | | 48,645 | |
| | | | | | | | |
| | |
PRINCIPAL
AMOUNT($) | | | SECURITY DESCRIPTION | | VALUE($) | |
| | | | | |
| | | | United States — continued | | | | |
| | 55,000 | | | Gray Television, Inc., 5.125%, 10/15/24 (e) | | | 55,550 | |
| | 20,000 | | | Great Plains Energy, Inc., 4.850%, 04/01/47 | | | 20,608 | |
| | 30,000 | | | Halliburton Co., 5.000%, 11/15/45 | | | 31,963 | |
| | 30,000 | | | Hardwoods Acquisition, Inc., 7.500%, 08/01/21 (e) | | | 26,775 | |
| | 13,000 | | | Harris Corp., 5.054%, 04/27/45 | | | 14,610 | |
| | 23,000 | | | HCA Healthcare, Inc., 6.250%, 02/15/21 | | | 25,127 | |
| | | | HCA, Inc., | | | | |
| | 12,000 | | | 4.250%, 10/15/19 | | | 12,450 | |
| | 40,000 | | | 5.375%, 02/01/25 | | | 42,192 | |
| | 25,000 | | | 5.500%, 06/15/47 | | | 25,875 | |
| | 22,000 | | | 5.875%, 03/15/22 | | | 24,393 | |
| | 40,000 | | | 5.875%, 05/01/23 | | | 43,550 | |
| | 44,000 | | | 6.500%, 02/15/20 | | | 48,015 | |
| | 57,000 | | | 7.500%, 02/15/22 | | | 65,621 | |
| | 16,000 | | | HD Supply, Inc., 5.750%, 04/15/24 (e) | | | 17,000 | |
| | 30,000 | | | Hess Corp., 5.800%, 04/01/47 | | | 30,287 | |
| | 75,000 | | | Hexion, Inc., 6.625%, 04/15/20 | | | 68,437 | |
| | | | Hilcorp Energy I LP, | | | | |
| | 47,000 | | | 5.000%, 12/01/24 (e) | | | 43,240 | |
| | 3,000 | | | 5.750%, 10/01/25 (e) | | | 2,827 | |
| | 10,000 | | | Hilton Domestic Operating Co., Inc., 4.250%, 09/01/24 (e) | | | 10,137 | |
| | 15,000 | | | Hilton Grand Vacations Borrower LLC, 6.125%, 12/01/24 (e) | | | 16,350 | |
| | | | Hilton Worldwide Finance LLC, | | | | |
| | 11,000 | | | 4.625%, 04/01/25 (e) | | | 11,344 | |
| | 4,000 | | | 4.875%, 04/01/27 (e) | | | 4,185 | |
| | | | Hughes Satellite Systems Corp., | | | | |
| | 25,000 | | | 5.250%, 08/01/26 | | | 26,125 | |
| | 20,000 | | | 6.625%, 08/01/26 | | | 21,500 | |
| | 45,000 | | | IASIS Healthcare LLC, 8.375%, 05/15/19 | | | 45,225 | |
| | 39,000 | | | Icahn Enterprises LP, 6.000%, 08/01/20 | | | 40,146 | |
| | 40,000 | | | iHeartCommunications, Inc., 9.000%, 12/15/19 | | | 31,400 | |
| | 35,000 | | | IHS Markit Ltd., 5.000%, 11/01/22 (e) | | | 37,778 | |
| | 30,000 | | | Infor Software Parent LLC, 7.125% (cash), 05/01/21 (e) (v) | | | 30,900 | |
| | 15,000 | | | Informatica LLC, 7.125%, 07/15/23 (e) | | | 15,267 | |
| | 57,000 | | | Iron Mountain, Inc., 5.750%, 08/15/24 | | | 58,140 | |
| | 5,000 | | | ITC Holdings Corp., 5.300%, 07/01/43 | | | 5,827 | |
| | 6,000 | | | j2 Cloud Services LLC, 6.000%, 07/15/25 (e) | | | 6,180 | |
| | 30,000 | | | Jack Ohio Finance LLC, 6.750%, 11/15/21 (e) | | | 31,350 | |
| | 39,000 | | | KFC Holding Co., 4.750%, 06/01/27 (e) | | | 39,829 | |
| | 15,000 | | | Kinder Morgan Energy Partners LP, 5.625%, 09/01/41 | | | 15,493 | |
SEE NOTES TO FINANCIAL STATEMENTS.
| | | | | | | | |
| | | |
| JUNE 30, 2017 | | JPMORGAN INSURANCE TRUST | | | | | 13 | |
JPMorgan Insurance Trust Income Builder Portfolio
SCHEDULE OF PORTFOLIO INVESTMENTS
AS OF JUNE 30, 2017 (Unaudited) (continued)
| | | | | | | | |
| | |
PRINCIPAL
AMOUNT($) | | | SECURITY DESCRIPTION | | VALUE($) | |
| | Corporate Bonds — continued | | | | |
| | | | United States — continued | | | | |
| | 5,000 | | | Kohl’s Corp., 5.550%, 07/17/45 | | | 4,585 | |
| | 8,000 | | | Koppers, Inc., 6.000%, 02/15/25 (e) | | | 8,500 | |
| | | | Kraft Heinz Foods Co., | | | | |
| | 15,000 | | | 4.375%, 06/01/46 | | | 14,619 | |
| | 54,000 | | | 5.200%, 07/15/45 | | | 58,554 | |
| | 40,000 | | | Kroger Co. (The), 3.875%, 10/15/46 | | | 35,295 | |
| | 33,000 | | | L Brands, Inc., 5.625%, 10/15/23 | | | 35,228 | |
| | 14,000 | | | Ladder Capital Finance Holdings LLLP, 5.250%, 03/15/22 (e) | | | 14,385 | |
| | 38,000 | | | Landry’s, Inc., 6.750%, 10/15/24 (e) | | | 38,902 | |
| | | | Level 3 Financing, Inc., | | | | |
| | 20,000 | | | 5.250%, 03/15/26 | | | 20,752 | |
| | 76,000 | | | 5.375%, 05/01/25 | | | 79,990 | |
| | 40,000 | | | Live Nation Entertainment, Inc., 4.875%, 11/01/24 (e) | | | 40,600 | |
| | 27,000 | | | LKQ Corp., 4.750%, 05/15/23 | | | 27,540 | |
| | 15,000 | | | LPL Holdings, Inc., 5.750%, 09/15/25 (e) | | | 15,600 | |
| | 12,000 | | | LYB International Finance BV, 4.875%, 03/15/44 | | | 12,724 | |
| | 25,000 | | | Marathon Petroleum Corp., 4.750%, 09/15/44 | | | 23,782 | |
| | 20,000 | | | Markel Corp., 5.000%, 04/05/46 | | | 21,909 | |
| | 30,000 | | | MasTec, Inc., 4.875%, 03/15/23 | | | 29,925 | |
| | 35,000 | | | Mediacom Broadband LLC, 6.375%, 04/01/23 | | | 36,571 | |
| | 95,000 | | | MetLife, Inc., Series C, VAR, 5.250%, 06/15/20 (x) (y) | | | 98,631 | |
| | | | MGM Resorts International, | | | | |
| | 30,000 | | | 6.000%, 03/15/23 | | | 33,075 | |
| | 27,000 | | | 6.625%, 12/15/21 | | | 30,308 | |
| | | | Micron Technology, Inc., | | | | |
| | 78,000 | | | 5.250%, 01/15/24 (e) | | | 80,730 | |
| | 3,000 | | | 5.875%, 02/15/22 | | | 3,139 | |
| | 9,000 | | | Molina Healthcare, Inc., 4.875%, 06/15/25 (e) | | | 9,068 | |
| | 15,000 | | | Momentive Performance Materials, Inc., 3.880%, 10/24/21 | | | 14,888 | |
| | | | Morgan Stanley, | | | | |
| | 250,000 | | | Series H, VAR, 5.450%, 07/15/19 (x) (y) | | | 258,875 | |
| | 50,000 | | | Series J, VAR, 5.550%, 07/15/20 (x) (y) | | | 52,237 | |
| | 15,000 | | | MPLX LP, 5.200%, 03/01/47 | | | 15,384 | |
| | 40,000 | | | Mylan NV, 5.250%, 06/15/46 | | | 43,815 | |
| | 13,000 | | | Nabors Industries, Inc., 5.500%, 01/15/23 (e) | | | 12,318 | |
| | 55,000 | | | Nationstar Mortgage LLC, 6.500%, 06/01/22 | | | 56,513 | |
| | 31,000 | | | Nature’s Bounty Co. (The), 7.625%, 05/15/21 (e) | | | 32,938 | |
| | | | | | | | |
| | |
PRINCIPAL
AMOUNT($) | | | SECURITY DESCRIPTION | | VALUE($) | |
| | | | | |
| | | | United States — continued | | | | |
| | 68,000 | | | Navistar International Corp., 8.250%, 11/01/21 | | | 68,680 | |
| | 15,000 | | | NCI Building Systems, Inc., 8.250%, 01/15/23 (e) | | | 16,219 | |
| | 35,000 | | | Neiman Marcus Group Ltd. LLC, 8.000%, 10/15/21 (e) | | | 19,075 | |
| | 17,000 | | | Netflix, Inc., 5.750%, 03/01/24 | | | 18,551 | |
| | 85,000 | | | New Albertsons, Inc., 8.000%, 05/01/31 | | | 84,150 | |
| | 19,000 | | | New Home Co., Inc. (The), 7.250%, 04/01/22 (e) | | | 19,665 | |
| | 19,000 | | | NGL Energy Partners LP, 6.125%, 03/01/25 (e) | | | 17,385 | |
| | 20,000 | | | Nielsen Co. Luxembourg SARL (The), 5.000%, 02/01/25 (e) | | | 20,500 | |
| | 33,000 | | | Nielsen Finance LLC, 4.500%, 10/01/20 | | | 33,504 | |
| | | | Noble Energy, Inc., | | | | |
| | 5,000 | | | 5.050%, 11/15/44 | | | 5,142 | |
| | 5,000 | | | 5.250%, 11/15/43 | | | 5,180 | |
| | 34,000 | | | Northern Trust Corp., Series D, VAR, 4.600%, 10/01/26 (x) (y) | | | 34,340 | |
| | 60,000 | | | NRG Energy, Inc., 6.625%, 03/15/23 | | | 61,650 | |
| | 40,000 | | | NRG Yield Operating LLC, 5.375%, 08/15/24 | | | 41,950 | |
| | 15,000 | | | Nuance Communications, Inc., 5.625%, 12/15/26 (e) | | | 16,013 | |
| | 12,000 | | | NuStar Logistics LP, 5.625%, 04/28/27 | | | 12,600 | |
| | 32,000 | | | Oasis Petroleum, Inc., 6.500%, 11/01/21 | | | 31,040 | |
| | 17,000 | | | Olin Corp., 5.125%, 09/15/27 | | | 17,510 | |
| | 8,000 | | | ONEOK Partners LP, 6.200%, 09/15/43 | | | 9,200 | |
| | 26,000 | | | Oshkosh Corp., 5.375%, 03/01/25 | | | 27,300 | |
| | 50,000 | | | Outfront Media Capital LLC, 5.625%, 02/15/24 | | | 52,187 | |
| | 30,000 | | | Owens Corning, 4.300%, 07/15/47 | | | 28,863 | |
| | 30,000 | | | Owens-Brockway Glass Container, Inc., 6.375%, 08/15/25 (e) | | | 33,675 | |
| | 38,000 | | | Parker Drilling Co., 6.750%, 07/15/22 | | | 29,165 | |
| | 14,000 | | | Pattern Energy Group, Inc., 5.875%, 02/01/24 (e) | | | 14,735 | |
| | | | PBF Holding Co. LLC, | | | | |
| | 13,000 | | | 7.000%, 11/15/23 | | | 12,805 | |
| | 15,000 | | | 7.250%, 06/15/25 (e) | | | 14,456 | |
| | | | Penske Automotive Group, Inc., | | | | |
| | 9,000 | | | 5.500%, 05/15/26 | | | 8,955 | |
| | 17,000 | | | 5.750%, 10/01/22 | | | 17,553 | |
| | | | PetSmart, Inc., | | | | |
| | 6,000 | | | 5.875%, 06/01/25 (e) | | | 5,783 | |
| | 10,000 | | | 8.875%, 06/01/25 (e) | | | 9,236 | |
| | 39,000 | | | Phillips 66, 4.875%, 11/15/44 | | | 41,835 | |
SEE NOTES TO FINANCIAL STATEMENTS.
| | | | | | |
| | | |
| 14 | | | | JPMORGAN INSURANCE TRUST | | JUNE 30, 2017 |
| | | | | | | | |
| | |
PRINCIPAL
AMOUNT($) | | | SECURITY DESCRIPTION | | VALUE($) | |
| | Corporate Bonds — continued | | | | |
| | | | United States — continued | | | | |
| | 15,000 | | | Phillips 66 Partners LP, 4.900%, 10/01/46 | | | 14,813 | |
| | | | Plains All American Pipeline LP, | | | | |
| | 3,000 | | | 4.700%, 06/15/44 | | | 2,738 | |
| | 3,000 | | | 4.900%, 02/15/45 | | | 2,794 | |
| | 23,000 | | | Plantronics, Inc., 5.500%, 05/31/23 (e) | | | 24,064 | |
| | 45,000 | | | PNC Financial Services Group, Inc. (The), VAR, 6.750%, 08/01/21 (x) (y) | | | 50,738 | |
| | 31,000 | | | PolyOne Corp., 5.250%, 03/15/23 | | | 32,550 | |
| | | | Post Holdings, Inc., | | | | |
| | 30,000 | | | 5.000%, 08/15/26 (e) | | | 29,925 | |
| | 40,000 | | | 5.500%, 03/01/25 (e) | | | 41,250 | |
| | 90,000 | | | Prime Security Services Borrower LLC, 9.250%, 05/15/23 (e) | | | 97,799 | |
| | | | Prudential Financial, Inc., | | | | |
| | 130,000 | | | VAR, 5.625%, 06/15/43 | | | 142,675 | |
| | 29,000 | | | VAR, 6.961%, 05/15/45 | | | 31,392 | |
| | 116,000 | | | PVH Corp., 4.500%, 12/15/22 | | | 119,770 | |
| | | | QEP Resources, Inc., | | | | |
| | 44,000 | | | 5.375%, 10/01/22 | | | 42,350 | |
| | 24,000 | | | 6.875%, 03/01/21 | | | 24,900 | |
| | 26,000 | | | Qorvo, Inc., 7.000%, 12/01/25 | | | 29,510 | |
| | 69,000 | | | Quicken Loans, Inc., 5.750%, 05/01/25 (e) | | | 71,243 | |
| | 25,000 | | | Rackspace Hosting, Inc., 8.625%, 11/15/24 (e) | | | 26,625 | |
| | 15,000 | | | Radian Group, Inc., 7.000%, 03/15/21 | | | 16,781 | |
| | | | Range Resources Corp., | | | | |
| | 17,000 | | | 4.875%, 05/15/25 | | | 16,150 | |
| | 55,000 | | | 5.000%, 03/15/23 (e) | | | 53,763 | |
| | | | Regal Entertainment Group, | | | | |
| | 5,000 | | | 5.750%, 06/15/23 | | | 5,225 | |
| | 30,000 | | | 5.750%, 02/01/25 | | | 30,975 | |
| | 33,000 | | | Revlon Consumer Products Corp., 6.250%, 08/01/24 | | | 28,710 | |
| | 26,000 | | | Reynolds American, Inc., 5.850%, 08/15/45 | | | 31,879 | |
| | 7,000 | | | Rice Energy, Inc., 7.250%, 05/01/23 | | | 7,543 | |
| | 19,000 | | | Rowan Cos., Inc., 7.375%, 06/15/25 | | | 17,718 | |
| | 25,000 | | | RSP Permian, Inc., 6.625%, 10/01/22 | | | 25,938 | |
| | 30,000 | | | Sabre GLBL, Inc., 5.250%, 11/15/23 (e) | | | 31,275 | |
| | | | Scientific Games International, Inc., | | | | |
| | 45,000 | | | 7.000%, 01/01/22 (e) | | | 47,925 | |
| | 30,000 | | | 10.000%, 12/01/22 | | | 32,888 | |
| | 10,000 | | | Scotts Miracle-Gro Co. (The), 5.250%, 12/15/26 | | | 10,475 | |
| | 50,000 | | | Sealed Air Corp., 5.125%, 12/01/24 (e) | | | 53,625 | |
| | 22,000 | | | Service Corp. International, 5.375%, 05/15/24 | | | 23,235 | |
| | | | | | | | |
| | |
PRINCIPAL
AMOUNT($) | | | SECURITY DESCRIPTION | | VALUE($) | |
| | | | | |
| | | | United States — continued | | | | |
| | 5,000 | | | SESI LLC, 7.125%, 12/15/21 | | | 4,763 | |
| | 50,000 | | | Sinclair Television Group, Inc., 5.875%, 03/15/26 (e) | | | 51,125 | |
| | | | Sirius XM Radio, Inc., | | | | |
| | 15,000 | | | 5.000%, 08/01/27 (e) | | | 15,113 | |
| | 40,000 | | | 5.375%, 04/15/25 (e) | | | 41,350 | |
| | 27,000 | | | Six Flags Entertainment Corp., 4.875%, 07/31/24 (e) | | | 27,165 | |
| | 9,000 | | | SM Energy Co., 5.000%, 01/15/24 | | | 7,965 | |
| | 30,000 | | | Solera LLC, 10.500%, 03/01/24 (e) | | | 34,463 | |
| | 6,000 | | | Sonic Automotive, Inc., 6.125%, 03/15/27 (e) | | | 5,970 | |
| | 32,000 | | | Southern Power Co., Series F, 4.950%, 12/15/46 | | | 33,090 | |
| | 15,000 | | | Spectra Energy Partners LP, 4.500%, 03/15/45 | | | 14,804 | |
| | 40,000 | | | Springleaf Finance Corp., 7.750%, 10/01/21 | | | 44,750 | |
| | | | Sprint Capital Corp., | | | | |
| | 50,000 | | | 6.875%, 11/15/28 | | | 55,579 | |
| | 50,000 | | | 8.750%, 03/15/32 | | | 63,000 | |
| | 100,000 | | | Sprint Communications, Inc., 6.000%, 11/15/22 | | | 106,000 | |
| | 131,000 | | | Sprint Corp., 7.875%, 09/15/23 | | | 150,650 | |
| | 80,000 | | | State Street Corp., Series F, VAR, 5.250%, 09/15/20 (x) (y) | | | 84,400 | |
| | | | Steel Dynamics, Inc., | | | | |
| | 10,000 | | | 5.000%, 12/15/26 | | | 10,263 | |
| | 23,000 | | | 5.250%, 04/15/23 | | | 23,891 | |
| | 21,000 | | | 6.375%, 08/15/22 | | | 21,761 | |
| | | | Summit Materials LLC, | | | | |
| | 5,000 | | | 5.125%, 06/01/25 (e) | | | 5,125 | |
| | 15,000 | | | 6.125%, 07/15/23 | | | 15,713 | |
| | | | Sunoco Logistics Partners Operations LP, | | | | |
| | 12,000 | | | 5.300%, 04/01/44 | | | 11,713 | |
| | 30,000 | | | 5.350%, 05/15/45 | | | 29,442 | |
| | | | SunTrust Banks, Inc., | | | | |
| | 40,000 | | | Series G, VAR, 5.050%, 06/15/22 (x) (y) | | | 40,600 | |
| | 50,000 | | | VAR, 5.625%, 12/15/19 (x) (y) | | | 52,188 | |
| | | | SUPERVALU, Inc., | | | | |
| | 42,000 | | | 6.750%, 06/01/21 | | | 41,160 | |
| | 90,000 | | | 7.750%, 11/15/22 | | | 87,525 | |
| | 3,000 | | | Surgery Center Holdings, Inc., 6.750%, 07/01/25 (e) | | | 3,038 | |
| | 42,000 | | | Symantec Corp., 5.000%, 04/15/25 (e) | | | 43,956 | |
| | 20,000 | | | Sysco Corp., 4.500%, 04/01/46 | | | 21,094 | |
| | 25,000 | | | Talen Energy Supply LLC, 9.500%, 07/15/22 (e) | | | 21,500 | |
SEE NOTES TO FINANCIAL STATEMENTS.
| | | | | | | | |
| | | |
| JUNE 30, 2017 | | JPMORGAN INSURANCE TRUST | | | | | 15 | |
JPMorgan Insurance Trust Income Builder Portfolio
SCHEDULE OF PORTFOLIO INVESTMENTS
AS OF JUNE 30, 2017 (Unaudited) (continued)
| | | | | | | | |
| | |
PRINCIPAL
AMOUNT($) | | | SECURITY DESCRIPTION | | VALUE($) | |
| | Corporate Bonds — continued | | | | |
| | | | United States — continued | | | | |
| | | | Targa Resources Partners LP, | | | | |
| | 35,000 | | | 4.250%, 11/15/23 | | | 34,169 | |
| | 45,000 | | | 5.125%, 02/01/25 (e) | | | 46,350 | |
| | 34,000 | | | 5.250%, 05/01/23 | | | 34,850 | |
| | 15,000 | | | 5.375%, 02/01/27 (e) | | | 15,525 | |
| | 35,000 | | | Team Health Holdings, Inc., 6.375%, 02/01/25 (e) | | | 33,950 | |
| | 60,000 | | | TEGNA, Inc., 6.375%, 10/15/23 | | | 63,300 | |
| | 88,000 | | | Teleflex, Inc., 5.250%, 06/15/24 | | | 91,080 | |
| | | | Tempur Sealy International, Inc., | | | | |
| | 25,000 | | | 5.500%, 06/15/26 | | | 25,406 | |
| | 8,000 | | | 5.625%, 10/15/23 | | | 8,300 | |
| | | | Tenet Healthcare Corp., | | | | |
| | 11,000 | | | 4.625%, 07/15/24 (e) | | | 11,014 | |
| | 85,000 | | | 6.000%, 10/01/20 | | | 91,056 | |
| | 5,000 | | | 8.000%, 08/01/20 | | | 5,062 | |
| | 31,000 | | | 8.125%, 04/01/22 | | | 32,938 | |
| | 10,000 | | | Tennant Co., 5.625%, 05/01/25 (e) | | | 10,500 | |
| | 33,000 | | | Tenneco, Inc., 5.375%, 12/15/24 | | | 34,073 | |
| | 53,000 | | | Terex Corp., 5.625%, 02/01/25 (e) | | | 54,524 | |
| | 40,000 | | | Terraform Global Operating LLC, 9.750%, 08/15/22 (e) | | | 44,800 | |
| | 50,000 | | | TerraForm Power Operating LLC, SUB, 6.625%, 06/15/25 (e) | | | 53,125 | |
| | | | Tesoro Corp., | | | | |
| | 29,000 | | | 4.750%, 12/15/23 (e) | | | 31,230 | |
| | 16,000 | | | 5.125%, 12/15/26 (e) | | | 17,402 | |
| | 26,000 | | | 5.375%, 10/01/22 | | | 26,910 | |
| | | | Tesoro Logistics LP, | | | | |
| | 20,000 | | | 5.250%, 01/15/25 | | | 21,000 | |
| | 73,000 | | | 6.125%, 10/15/21 | | | 75,920 | |
| | 35,000 | | | 6.250%, 10/15/22 | | | 37,188 | |
| | | | THC Escrow Corp. III, | | | | |
| | 14,000 | | | 4.625%, 07/15/24 (e) | | | 14,038 | |
| | 37,000 | | | 5.125%, 05/01/25 (e) | | | 37,139 | |
| | 10,000 | | | 7.000%, 08/01/25 (e) | | | 9,962 | |
| | 14,000 | | | Titan International, Inc., 6.875%, 10/01/20 | | | 14,525 | |
| | 155,000 | | | T-Mobile USA, Inc., 6.375%, 03/01/25 | | | 167,594 | |
| | 11,000 | | | Toll Brothers Finance Corp., 5.875%, 02/15/22 | | | 12,183 | |
| | 17,000 | | | Tops Holding LLC, 8.000%, 06/15/22 (e) | | | 13,961 | |
| | | | TransDigm, Inc., | | | | |
| | 74,000 | | | 6.000%, 07/15/22 | | | 76,220 | |
| | 12,000 | | | 6.500%, 07/15/24 | | | 12,390 | |
| | 13,000 | | | 6.500%, 05/15/25 | | | 13,228 | |
| | | | | | | | |
| | |
PRINCIPAL
AMOUNT($) | | | SECURITY DESCRIPTION | | VALUE($) | |
| | | | | |
| | | | United States — continued | | | | |
| | 24,700 | | | Transocean Proteus Ltd., 6.250%, 12/01/24 (e) | | | 25,194 | |
| | | | Transocean, Inc., | | | | |
| | 12,000 | | | 5.800%, 10/15/22 | | | 11,130 | |
| | 39,000 | | | 6.800%, 03/15/38 | | | 28,470 | |
| | 37,000 | | | 9.000%, 07/15/23 (e) | | | 38,388 | |
| | 8,000 | | | 9.350%, 12/15/41 | | | 7,120 | |
| | 21,000 | | | Tutor Perini Corp., 6.875%, 05/01/25 (e) | | | 22,103 | |
| | | | Ultra Resources, Inc., | | | | |
| | 47,000 | | | 6.875%, 04/15/22 (e) | | | 46,647 | |
| | 11,000 | | | 7.125%, 04/15/25 (e) | | | 10,849 | |
| | 56,000 | | | United Continental Holdings, Inc., 5.000%, 02/01/24 | | | 56,770 | |
| | | | United Rentals North America, Inc., | | | | |
| | 5,000 | | | 5.500%, 05/15/27 | | | 5,150 | |
| | 5,000 | | | 5.875%, 09/15/26 | | | 5,325 | |
| | 120,000 | | | 6.125%, 06/15/23 | | | 124,950 | |
| | | | Uniti Group, Inc., | | | | |
| | 20,000 | | | 6.000%, 04/15/23 (e) | | | 20,812 | |
| | 13,000 | | | 7.125%, 12/15/24 (e) | | | 12,886 | |
| | 2,000 | | | 7.125%, 12/15/24 (e) | | | 1,986 | |
| | 15,000 | | | Univar USA, Inc., 6.750%, 07/15/23 (e) | | | 15,638 | |
| | | | Univision Communications, Inc., | | | | |
| | 90,000 | | | 5.125%, 02/15/25 (e) | | | 89,213 | |
| | 15,000 | | | 6.750%, 09/15/22 (e) | | | 15,600 | |
| | | | US Bancorp, | | | | |
| | 65,000 | | | Series I, VAR, 5.125%, 01/15/21 (x) (y) | | | 69,163 | |
| | 45,000 | | | Series J, VAR, 5.300%, 04/15/27 (x) (y) | | | 47,925 | |
| | | | US Concrete, Inc., | | | | |
| | 5,000 | | | 6.375%, 06/01/24 (e) | | | 5,275 | |
| | 25,000 | | | 6.375%, 06/01/24 | | | 26,375 | |
| | 12,000 | | | USIS Merger Sub, Inc., 6.875%, 05/01/25 (e) | | | 12,210 | |
| | | | Valeant Pharmaceuticals International, Inc., | | | | |
| | 20,000 | | | 6.375%, 10/15/20 (e) | | | 19,375 | |
| | 51,000 | | | 6.500%, 03/15/22 (e) | | | 53,486 | |
| | 160,000 | | | 7.000%, 10/01/20 (e) | | | 157,400 | |
| | 23,000 | | | 7.000%, 03/15/24 (e) | | | 24,179 | |
| | 5,000 | | | VeriSign, Inc., 4.750%, 07/15/27 (e) | | | 5,056 | |
| | | | Verizon Communications, Inc., | | | | |
| | 35,000 | | | 4.522%, 09/15/48 | | | 33,184 | |
| | 39,000 | | | 5.012%, 04/15/49 (e) | | | 39,442 | |
| | 15,000 | | | Versum Materials, Inc., 5.500%, 09/30/24 (e) | | | 15,769 | |
| | 69,000 | | | Vertiv Group Corp., 9.250%, 10/15/24 (e) | | | 74,520 | |
SEE NOTES TO FINANCIAL STATEMENTS.
| | | | | | |
| | | |
| 16 | | | | JPMORGAN INSURANCE TRUST | | JUNE 30, 2017 |
| | | | | | | | |
| | |
PRINCIPAL
AMOUNT($) | | | SECURITY DESCRIPTION | | VALUE($) | |
| | Corporate Bonds — continued | | | | |
| | | | United States — continued | | | | |
| | | | Viacom, Inc., | | | | |
| | 27,000 | | | 4.375%, 03/15/43 | | | 24,031 | |
| | 20,000 | | | VAR, 5.875%, 02/28/57 | | | 20,800 | |
| | 20,000 | | | VAR, 6.250%, 02/28/57 | | | 20,800 | |
| | | | Voya Financial, Inc., | | | | |
| | 15,000 | | | 4.800%, 06/15/46 | | | 15,646 | |
| | 50,000 | | | VAR, 5.650%, 05/15/53 | | | 53,125 | |
| | 10,000 | | | Vulcan Materials Co., 4.500%, 06/15/47 | | | 10,090 | |
| | 10,000 | | | W&T Offshore, Inc., 8.500%, 06/15/19 | | | 6,900 | |
| | 21,000 | | | Walgreens Boots Alliance, Inc., 4.800%, 11/18/44 | | | 22,378 | |
| | | | Weatherford International Ltd., | | | | |
| | 16,000 | | | 4.500%, 04/15/22 | | | 14,120 | |
| | 9,000 | | | 5.950%, 04/15/42 | | | 7,020 | |
| | 7,000 | | | 6.500%, 08/01/36 | | | 5,950 | |
| | 2,000 | | | 6.750%, 09/15/40 | | | 1,720 | |
| | 9,000 | | | 7.000%, 03/15/38 | | | 7,695 | |
| | 3,000 | | | 7.750%, 06/15/21 | | | 3,015 | |
| | 7,000 | | | 8.250%, 06/15/23 | | | 7,000 | |
| | | | Wells Fargo & Co., | | | | |
| | 45,000 | | | Series K, VAR, 7.980%, 03/15/18 (x) (y) | | | 46,901 | |
| | 140,000 | | | Series S, VAR, 5.900%, 06/15/24 (x) (y) | | | 149,940 | |
| | 5,000 | | | Western Gas Partners LP, 5.450%, 04/01/44 | | | 5,082 | |
| | 15,000 | | | Western Refining Logistics LP, 7.500%, 02/15/23 | | | 16,163 | |
| | 106,000 | | | Whiting Petroleum Corp., 5.000%, 03/15/19 | | | 105,338 | |
| | 106,000 | | | Williams Cos., Inc. (The), 4.550%, 06/24/24 | | | 108,915 | |
| | 35,000 | | | Windstream Services LLC, 7.750%, 10/01/21 | | | 32,900 | |
| | 60,000 | | | WMG Acquisition Corp., 5.000%, 08/01/23 (e) | | | 61,500 | |
| | | | XPO Logistics, Inc., | | | | |
| | 10,000 | | | 6.125%, 09/01/23 (e) | | | 10,413 | |
| | 20,000 | | | 6.500%, 06/15/22 (e) | | | 21,025 | |
| | | | Zayo Group LLC, | | | | |
| | 34,000 | | | 5.750%, 01/15/27 (e) | | | 35,572 | |
| | 15,000 | | | 6.375%, 05/15/25 | | | 16,191 | |
| | | | | | | | |
| | | | | | | 17,008,168 | |
| | | | | | | | |
| | | | Total Corporate Bonds
(Cost $19,272,922) | | | 19,881,940 | |
| | | | | | | | |
| | |
| SHARES | | | | | | |
| | Investment Companies — 15.6% (b) | | | | |
| | 181,681 | | | JPMorgan Emerging Markets Debt Fund, Class R6 Shares | | | 1,495,233 | |
| | 121,603 | | | JPMorgan Emerging Markets Equity Fund, Class R6 Shares | | | 3,136,152 | |
| | | | | | | | |
| | |
SHARES | | | SECURITY DESCRIPTION | | VALUE($) | |
| | | | | | | | |
| | 181,153 | | | JPMorgan Equity Income Fund, Class R6 Shares | | | 2,883,955 | |
| | | | | | | | |
| | | | Total Investment Companies
(Cost $6,676,513) | | | 7,515,340 | |
| | | | | | | | |
| | |
PRINCIPAL
AMOUNT($) | | | | | | |
| | Loan Assignments — 0.4% | | | | |
| | | | United States — 0.4% | |
| | 100,000 | | | Securus Technologies Holdings, Inc., 1st Lien Term Loan, VAR, 06/20/24 ^ | | | 99,792 | |
| | 81,400 | | | Ultra Resources, Inc., Term Loan, VAR, 4.117%, 04/12/24 ^ | | | 80,790 | |
| | | | | | | | |
| | | | Total Loan Assignments
(Cost $180,682) | | | 180,582 | |
| | | | | | | | |
| | |
| SHARES | | | | | | |
| | Preferred Stocks — 0.5% | | | | |
| | | | Germany — 0.0% (g) | |
| | 867 | | | Schaeffler AG (Preference) | | | 12,438 | |
| | | | | | | | |
| | | | United States — 0.5% | |
| | 2,000 | | | BB&T Corp., Series G, 5.200%, 06/01/18 ($25 par value) @ | | | 51,360 | |
| | 5,000 | | | Dominion Energy, Inc., Series A, 5.250%, 07/30/76 ($25 par value) | | | 125,850 | |
| | 1,000 | | | Southern Co. (The), 5.250%, 10/01/76 ($25 par value) | | | 25,010 | |
| | 1,000 | | | State Street Corp., Series G, VAR, 5.350%, 03/15/26 ($25 par value) @ | | | 27,430 | |
| | | | | | | | |
| | | | | | | 229,650 | |
| | | | | | | | |
| | | | Total Preferred Stocks
(Cost $235,072) | | | 242,088 | |
| | | | | | | | |
| | |
PRINCIPAL
AMOUNT($) | | | | | | |
| | U.S. Treasury Obligation — 0.4% | |
| | 166,000 | | | U.S. Treasury Note, 0.750%, 01/31/18 (k)
(Cost $165,867) | | | 165,590 | |
| | | | | | | | |
| | |
NUMBER OF
RIGHTS | | | | | | |
| | Rights — 0.0% (g) | |
| | | | Spain — 0.0% (g) | |
| | 491 | | | ACS Actividades de Construccion y Servicios SA, expiring 07/11/17 (a)
(Cost $408) | | | 393 | |
| | | | | | | | |
SEE NOTES TO FINANCIAL STATEMENTS.
| | | | | | | | |
| | | |
| JUNE 30, 2017 | | JPMORGAN INSURANCE TRUST | | | | | 17 | |
JPMorgan Insurance Trust Income Builder Portfolio
SCHEDULE OF PORTFOLIO INVESTMENTS
AS OF JUNE 30, 2017 (Unaudited) (continued)
| | | | | | | | |
SHARES | | | SECURITY DESCRIPTION | | VALUE($) | |
| | Short-Term Investment — 2.3% | |
| | | | Investment Company — 2.3% | |
| | 1,124,435 | | | JPMorgan U.S. Government Money Market Fund, Institutional Class Shares, 0.840% (b) (l)
(Cost $1,124,435) | | | 1,124,435 | |
| | | | | | | | |
| | | | Total Investments — 99.3%
(Cost $44,852,601) | | | 47,817,747 | |
| | | | Other Assets in Excess of
Liabilities — 0.7% | | | 358,911 | |
| | | | | | | | |
| | | | NET ASSETS — 100.0% | | $ | 48,176,658 | |
| | | | | | | | |
Percentages indicated are based on net assets.
Summary of Investments by Industry, June 30, 2017
The following table represents the portfolio investments of the Portfolio by industry classifications as a percentage of total investments:
| | | | |
| INDUSTRY | | PERCENTAGE | |
Investment Companies | | | 15.7 | % |
Equity Real Estate Investment Trusts (REITs) | | | 6.9 | |
Banks | | | 6.9 | |
Oil, Gas & Consumable Fuels | | | 6.3 | |
Asset-Backed Securities | | | 4.7 | |
Media | | | 3.8 | |
Pharmaceuticals | | | 3.4 | |
Capital Markets | | | 3.3 | |
Insurance | | | 3.3 | |
Collateralized Mortgage Obligations | | | 3.3 | |
Diversified Telecommunication Services | | | 3.2 | |
Health Care Providers & Services | | | 2.6 | |
Metals & Mining | | | 2.4 | |
Tobacco | | | 1.5 | |
Wireless Telecommunication Services | | | 1.5 | |
Chemicals | | | 1.4 | |
Electric Utilities | | | 1.4 | |
Hotels, Restaurants & Leisure | | | 1.3 | |
Auto Components | | | 1.1 | |
Industrial Conglomerates | | | 1.1 | |
Food & Staples Retailing | | | 1.1 | |
Aerospace & Defense | | | 1.0 | |
Software | | | 1.0 | |
Others (each less than 1.0%) | | | 19.4 | |
Short-Term Investment | | | 2.4 | |
| | | | | | | | | | | | | | | | | | | | |
| Futures Contracts | |
NUMBER OF
CONTRACTS | | | DESCRIPTION | | EXPIRATION
DATE | | | TRADING
CURRENCY | | | NOTIONAL
VALUE AT
JUNE 30, 2017 | | | NET UNREALIZED
APPRECIATION
(DEPRECIATION) | |
| | | | Long Futures Outstanding | |
| | 2 | | | Euro STOXX 50 Index | | | 09/15/17 | | | | EUR | | | $ | 78,500 | | | $ | (2,494 | ) |
| | | | Short Futures Outstanding | |
| | (9 | ) | | Euro FX | | | 09/18/17 | | | | USD | | | | (1,290,038 | ) | | | (22,717 | ) |
| | (13 | ) | | GBP FX | | | 09/18/17 | | | | USD | | | | (1,059,906 | ) | | | (21,837 | ) |
| | (33 | ) | | 5 Year U.S. Treasury Note | | | 09/29/17 | | | | USD | | | | (3,888,586 | ) | | | 8,438 | |
| | | | | | | | | | | | | | | | | | | | |
| | | | $ | (38,610 | ) |
| | | | | | | | | | | | | | | | | | | | |
SEE NOTES TO FINANCIAL STATEMENTS.
| | | | | | |
| | | |
| 18 | | | | JPMORGAN INSURANCE TRUST | | JUNE 30, 2017 |
NOTES TO SCHEDULE OF PORTFOLIO INVESTMENTS:
AS OF JUNE 30, 2017 (Unaudited)
| | |
| ARM | | — Adjustable Rate Mortgage. The interest rate shown is the rate in effect as of June 30, 2017. |
| CVA | | — Dutch Certification |
| EUR | | — Euro |
| GBP | | — British Pound |
| REIT | | — Real Estate Investment Trust. |
| SUB | | — Step-Up Bond. The interest rate shown is the rate in effect as of June 30, 2017. |
| USD | | — United States Dollar |
| VAR | | — Variable Rate Security. The interest rate shown is the rate in effect as of June 30, 2017. |
| |
| (a) | | — Non-income producing security. |
| (b) | | — Investment in affiliate. Fund is registered under the Investment Company Act of 1940, as amended, and advised by J.P. Morgan Investment Management Inc. |
| (d) | | — Defaulted Security. Security has not paid its last interest payment and/or interest is not being accrued. |
| (e) | | — Security is exempt from registration under Rule 144A of the Securities Act of 1933, as amended. Unless otherwise indicated, this security has been determined to be liquid under procedures established by the Board of Trustees and may be resold in transactions exempt from registration, normally to qualified institutional buyers. |
| (g) | | — Amount rounds to less than 0.05%. |
| (k) | | — All or a portion of this security is deposited with the broker as initial margin for future contracts. |
| (l) | | — The rate shown is the current yield as of June 30, 2017. |
| | |
| (v) | | — Security has the ability to pay in kind (“PIK”) or pay income in cash. When applicable, separate rates of such payments are disclosed. |
| (w) | | — All or a portion of the security is a when-issued security, delayed delivery security, or forward commitment. |
| (x) | | — Security is perpetual and thus, does not have a predetermined maturity date. The coupon rate for this security is fixed for a period of time and may be structured to adjust thereafter. The date shown, if applicable, reflects the next call date. The coupon rate shown is the rate in effect as of June 30, 2017. |
| (y) | | — Preferred Security. |
| @ | | — The date shown reflects the next call date on which the issuer may redeem the security. The coupon rate for this security is currently in effect as of June 30, 2017. |
| ^ | | — All or a portion of the security is unsettled as of June 30, 2017. Unless otherwise indicated, the coupon rate is undetermined. The coupon rate shown may not be accrued for the entire position. |
Detailed information about investment portfolios of the underlying funds can be found in shareholder reports filed with the Securities and Exchange Commission (SEC) by each such underlying fund semi-annually on Form N-CSR and in certified portfolio holdings filed quarterly on Form N-Q, and are available for download from both the SEC’s as well as each respective underlying fund’s website. Detailed information about underlying J.P. Morgan Funds can also be found at www.jpmorganfunds.com or by calling 1-800-480-4111.
SEE NOTES TO FINANCIAL STATEMENTS.
| | | | | | | | |
| | | |
| JUNE 30, 2017 | | JPMORGAN INSURANCE TRUST | | | | | 19 | |
STATEMENT OF ASSETS AND LIABILITIES
AS OF JUNE 30, 2017 (Unaudited)
| | | | |
| | |
Income Builder
Portfolio | |
ASSETS: | |
Investments in non-affiliates, at value | | $ | 39,177,972 | |
Investments in affiliates, at value | | | 8,639,775 | |
| | | | |
Total investment securities, at value | | | 47,817,747 | |
Cash | | | 213,134 | |
Foreign currency, at value | | | 24,401 | |
Deposits at broker for futures contracts | | | 7,000 | |
Receivables: | | | | |
Investment securities sold | | | 19,444 | |
Investment securities sold — delayed delivery securities | | | 15,647 | |
Portfolio shares sold | | | 47,650 | |
Interest and dividends from non-affiliates | | | 314,322 | |
Dividends from affiliates | | | 708 | |
Tax reclaims | | | 22,019 | |
Variation margin on futures contracts | | | 3,201 | |
| | | | |
Total Assets | | | 48,485,273 | |
| | | | |
| |
LIABILITIES: | | | | |
Payables: | | | | |
Investment securities purchased | | | 162,208 | |
Investment securities purchased — delayed delivery securities | | | 29,500 | |
Portfolio shares redeemed | | | 33,085 | |
Accrued liabilities: | | | | |
Investment advisory fees | | | 3,031 | |
Distribution fees | | | 9,448 | |
Trustees’ and Chief Compliance Officer’s fees | | | 91 | |
Audit fees | | | 67,514 | |
Other | | | 3,738 | |
| | | | |
Total Liabilities | | | 308,615 | |
| | | | |
Total Net Assets | | $ | 48,176,658 | |
| | | | |
| |
NET ASSETS: | | | | |
Paid-in-Capital | | $ | 45,300,030 | |
Accumulated undistributed net investment income | | | 884,165 | |
Accumulated net realized gains (losses) | | | (935,254 | ) |
Net unrealized appreciation (depreciation) | | | 2,927,717 | |
| | | | |
Total Net Assets | | $ | 48,176,658 | |
| | | | |
Net Assets: | | | | |
Class 1 | | $ | 4,438,068 | |
Class 2 | | | 43,738,590 | |
| | | | |
Total | | $ | 48,176,658 | |
| | | | |
Outstanding units of beneficial interest (shares) | | | | |
(unlimited number of shares authorized, no par value): | | | | |
Class 1 | | | 422,060 | |
Class 2 | | | 4,167,707 | |
| |
Net Asset Value, offering and redemption price per share (a): | | | | |
Class 1 | | $ | 10.52 | |
Class 2 | | | 10.49 | |
| | | | |
Cost of investments in non-affiliates | | $ | 37,051,653 | |
Cost of investments in affiliates | | | 7,800,948 | |
Cost of foreign currency | | | 24,052 | |
| (a) | Per share amounts may not recalculate due to rounding of net assets and/or shares outstanding. |
SEE NOTES TO FINANCIAL STATEMENTS.
| | | | | | |
| | | |
| 20 | | | | JPMORGAN INSURANCE TRUST | | JUNE 30, 2017 |
STATEMENT OF OPERATIONS
FOR THE SIX MONTHS ENDED JUNE 30, 2017 (Unaudited)
| | | | |
| | |
Income Builder
Portfolio | |
INVESTMENT INCOME: | |
Interest income from non-affiliates | | $ | 694,986 | |
Interest income from affiliates | | | 195 | |
Dividend income from non-affiliates | | | 353,530 | |
Dividend income from affiliates | | | 59,607 | |
Foreign taxes withheld | | | (25,234 | ) |
| | | | |
Total investment income | | | 1,083,084 | |
| | | | |
| |
EXPENSES: | | | | |
Investment advisory fees | | | 110,400 | |
Administration fees | | | 20,043 | |
Distribution fees — Class 2 | | | 60,048 | |
Custodian and accounting fees | | | 53,300 | |
Interest expense to affiliates | | | 22 | |
Professional fees | | | 52,035 | |
Trustees’ and Chief Compliance Officer’s fees | | | 13,177 | |
Printing and mailing costs | | | 4,854 | |
Transfer agency fees — Class 1 | | | 38 | |
Transfer agency fees — Class 2 | | | 757 | |
Other | | | 2,554 | |
| | | | |
Total expenses | | | 317,228 | |
| | | | |
Less fees waived | | | (110,932 | ) |
Less expense reimbursements | | | (155 | ) |
| | | | |
Net expenses | | | 206,141 | |
| | | | |
Net investment income (loss) | | | 876,943 | |
| | | | |
| |
REALIZED/UNREALIZED GAINS (LOSSES): | | | | |
Net realized gain (loss) on transactions from: | | | | |
Investments in non-affiliates | | | 210,840 | |
Investments in affiliates | | | 16,789 | |
Futures | | | (88,740 | ) |
Foreign currency transactions | | | 2,431 | |
| | | | |
Net realized gain (loss) | | | 141,320 | |
| | | | |
Change in net unrealized appreciation/depreciation on: | | | | |
Investments in non-affiliates | | | 1,157,675 | |
Investments in affiliates | | | 691,771 | |
Futures | | | (99,745 | ) |
Foreign currency translations | | | 2,138 | |
| | | | |
Change in net unrealized appreciation/depreciation | | | 1,751,839 | |
| | | | |
Net realized/unrealized gains (losses) | | | 1,893,159 | |
| | | | |
Change in net assets resulting from operations | | $ | 2,770,102 | |
| | | | |
SEE NOTES TO FINANCIAL STATEMENTS.
| | | | | | | | |
| | | |
| JUNE 30, 2017 | | JPMORGAN INSURANCE TRUST | | | | | 21 | |
STATEMENTS OF CHANGES IN NET ASSETS
FOR THE PERIODS INDICATED (Unaudited)
| | | | | | | | |
| | | Income Builder Portfolio | |
| | | Six Months Ended
June 30, 2017
(Unaudited) | | | Year Ended
December 31, 2016 | |
CHANGE IN NET ASSETS RESULTING FROM OPERATIONS: | |
Net investment income (loss) | | $ | 876,943 | | | $ | 1,423,000 | |
Net realized gain (loss) | | | 141,320 | | | | (618,693 | ) |
Distributions of capital gains received from investment company affiliates | | | — | | | | 17,101 | |
Change in net unrealized appreciation/depreciation | | | 1,751,839 | | | | 1,756,629 | |
| | | | | | | | |
Change in net assets resulting from operations | | | 2,770,102 | | | | 2,578,037 | |
| | | | | | | | |
| | |
DISTRIBUTIONS TO SHAREHOLDERS: | | | | | | | | |
Class 1 | | | | |
From net investment income | | | — | | | | (3,288 | ) |
Return of capital | | | — | | | | (101 | ) |
Class 2 | | | | |
From net investment income | | | — | | | | (1,422,951 | ) |
Return of capital | | | — | | | | (40,235 | ) |
| | | | | | | | |
Total distributions to shareholders | | | — | | | | (1,466,575 | ) |
| | | | | | | | |
| | |
CAPITAL TRANSACTIONS: | | | | | | | | |
Change in net assets resulting from capital transactions | | | (3,164,902 | ) | | | 17,369,425 | |
| | | | | | | | |
| | |
NET ASSETS: | | | | | | | | |
Change in net assets | | | (394,800 | ) | | | 18,480,887 | |
Beginning of period | | | 48,571,458 | | | | 30,090,571 | |
| | | | | | | | |
End of period | | $ | 48,176,658 | | | $ | 48,571,458 | |
| | | | | | | | |
Accumulated undistributed net investment income | | $ | 884,165 | | | $ | 7,222 | |
| | | | | | | | |
| | |
CAPITAL TRANSACTIONS: | | | | | | | | |
Class 1 | | | | | | | | |
Proceeds from shares issued | | $ | 5,753,233 | | | $ | — | |
Distributions reinvested | | | — | | | | 3,389 | |
Cost of shares redeemed | | | (1,445,693 | ) | | | — | |
| | | | | | | | |
Change in net assets resulting from Class 1 capital transactions | | $ | 4,307,540 | | | $ | 3,389 | |
| | | | | | | | |
Class 2 | | | | | | | | |
Proceeds from shares issued | | $ | 9,162,314 | | | $ | 21,578,662 | |
Distributions reinvested | | | — | | | | 1,463,186 | |
Cost of shares redeemed | | | (16,634,756 | ) | | | (5,675,812 | ) |
| | | | | | | | |
Change in net assets resulting from Class 2 capital transactions | | $ | (7,472,442 | ) | | $ | 17,366,036 | |
| | | | | | | | |
Total change in net assets resulting from capital transactions | | $ | (3,164,902 | ) | | $ | 17,369,425 | |
| | | | | | | | |
| | |
SHARE TRANSACTIONS: | | | | | | | | |
Class 1 | | | | | | | | |
Issued | | | 548,808 | | | | — | |
Reinvested | | | — | | | | 342 | |
Redeemed | | | (137,424 | ) | | | — | |
| | | | | | | | |
Change in Class 1 Shares | | | 411,384 | | | | 342 | |
| | | | | | | | |
Class 2 | | | | | | | | |
Issued | | | 891,419 | | | | 2,188,720 | |
Reinvested | | | — | | | | 147,797 | |
Redeemed | | | (1,608,553 | ) | | | (567,621 | ) |
| | | | | | | | |
Change in Class 2 Shares | | | (717,134 | ) | | | 1,768,896 | |
| | | | | | | | |
SEE NOTES TO FINANCIAL STATEMENTS.
| | | | | | |
| | | |
| 22 | | | | JPMORGAN INSURANCE TRUST | | JUNE 30, 2017 |
THIS PAGE IS INTENTIONALLY LEFT BLANK
| | | | | | | | |
| | | |
| JUNE 30, 2017 | | JPMORGAN INSURANCE TRUST | | | | | 23 | |
FINANCIAL HIGHLIGHTS
FOR THE PERIODS INDICATED
| | | | | | | | | | | | | | | | | | | | | | | | | | | | | | | | |
| | | Per share operating performance | |
| | | | | | Investment operations | | | Distributions | |
| | | Net asset
value,
beginning
of period | | | Net
investment
income
(loss) (b) | | | Net realized
and unrealized
gains
(losses) on
investments | | | Total from
investment
operations | | | Net
investment
income | | | Net
realized
gain | | | Return of
capital | | | Total
distributions | |
Income Builder Portfolio | | | | | | | | | | | | | | | | | | | | | | | | | | | | | | | | |
Class 1 | | | | | | | | | | | | | | | | | | | | | | | | | | | | | | | | |
Six Months Ended June 30, 2017 (Unaudited) | | $ | 9.93 | | | $ | 0.21 | (g) | | $ | 0.38 | | | $ | 0.59 | | | $ | — | | | $ | — | | | $ | — | | | $ | — | |
Year Ended December 31, 2016 | | | 9.63 | | | | 0.37 | (g) | | | 0.26 | | | | 0.63 | | | | (0.32 | ) | | | — | | | | (0.01 | ) | | | (0.33 | ) |
Year Ended December 31, 2015 | | | 9.95 | | | | 0.36 | (g) | | | (0.40 | ) | | | (0.04 | ) | | | (0.27 | ) | | | (0.01 | ) | | | — | | | | (0.28 | ) |
December 9, 2014 (i) through December 31, 2014 | | | 10.00 | | | | 0.03 | | | | (0.05 | ) | | | (0.02 | ) | | | (0.03 | ) | | | — | | | | — | | | | (0.03 | ) |
| | | | | | | | |
Class 2 | | | | | | | | | | | | | | | | | | | | | | | | | | | | | | | | |
Six Months Ended June 30, 2017 (Unaudited) | | | 9.92 | | | | 0.18 | (g) | | | 0.39 | | | | 0.57 | | | | — | | | | — | | | | — | | | | — | |
Year Ended December 31, 2016 | | | 9.63 | | | | 0.35 | (g) | | | 0.25 | | | | 0.60 | | | | (0.30 | ) | | | — | | | | (0.01 | ) | | | (0.31 | ) |
Year Ended December 31, 2015 | | | 9.95 | | | | 0.33 | (g) | | | (0.39 | ) | | | (0.06 | ) | | | (0.25 | ) | | | (0.01 | ) | | | — | | | | (0.26 | ) |
December 9, 2014 (i) through December 31, 2014 | | | 10.00 | | | | 0.03 | | | | (0.05 | ) | | | (0.02 | ) | | | (0.03 | ) | | | — | | | | — | | | | (0.03 | ) |
| (a) | Annualized for periods less than one year, unless otherwise noted. |
| (b) | Net investment income (loss) is affected by timing of distributions from Underlying Funds. |
| (c) | Not annualized for periods less than one year. |
| (d) | Includes adjustments in accordance with accounting principles generally accepted in the United States of America and as such, the net asset values for financial reporting purposes and the returns based upon those net asset values may differ from the net asset values and returns for shareholder transactions. |
| (e) | Includes earnings credits and interest expense, if applicable, each of which is less than 0.005% unless otherwise noted. |
| (f) | Does not include expenses of Underlying Funds. |
| (g) | Calculated based upon average shares outstanding. |
| (h) | Certain non-recurring expenses incurred by the Portfolio were not annualized for the year ended December 31, 2015 and the period ended December 31, 2014. |
| (i) | Commencement of operations. |
SEE NOTES TO FINANCIAL STATEMENTS.
| | | | | | |
| | | |
| 24 | | | | JPMORGAN INSURANCE TRUST | | JUNE 30, 2017 |
| | | | | | | | | | | | | | | | | | | | | | | | | | |
| | | Ratios/Supplemental data | |
| | | | | | | | | | Ratios to average net assets (a) | | | | |
Net asset
value,
end of
period | | | Total return (c)(d) | | | Net assets,
end of
period | | | Net
expenses (e)(f) | | |
Net
investment
income
(loss) (b) | | | Expenses
without waivers,
reimbursements and
earnings credits (f) | | | Portfolio
turnover
rate (c) | |
| | | | | | | | | | | | | | | | | | | | | | | | | | |
| | | | | | | | | | | | | | | | | | | | | | | | | | |
| $ | 10.52 | | | | 5.94 | % | | $ | 4,438,068 | | | | 0.59 | % | | | 4.10 | % | | | 1.05 | % | | | 47 | % |
| | 9.93 | | | | 6.53 | | | | 106,032 | | | | 0.60 | | | | 3.72 | | | | 1.27 | | | | 46 | |
| | 9.63 | | | | (0.31 | ) | | | 99,526 | | | | 0.60 | (h) | | | 3.56 | (h) | | | 1.44 | (h) | | | 42 | |
| | 9.95 | | | | (0.17 | ) | | | 99,795 | | | | 0.60 | (h) | | | 4.67 | (h) | | | 7.83 | (h) | | | 1 | |
| | | | | | |
| | | | | | | | | | | | | | | | | | | | | | | | | | |
| | 10.49 | | | | 5.75 | | | | 43,738,590 | | | | 0.85 | | | | 3.56 | | | | 1.30 | | | | 47 | |
| | 9.92 | | | | 6.21 | | | | 48,465,426 | | | | 0.85 | | | | 3.47 | | | | 1.49 | | | | 46 | |
| | 9.63 | | | | (0.50 | ) | | | 29,991,045 | | | | 0.85 | (h) | | | 3.30 | (h) | | | 1.71 | (h) | | | 42 | |
| | 9.95 | | | | (0.18 | ) | | | 19,856,239 | | | | 0.85 | (h) | | | 4.42 | (h) | | | 8.08 | (h) | | | 1 | |
SEE NOTES TO FINANCIAL STATEMENTS.
| | | | | | | | |
| | | |
| JUNE 30, 2017 | | JPMORGAN INSURANCE TRUST | | | | | 25 | |
NOTES TO FINANCIAL STATEMENTS
AS OF JUNE 30, 2017 (Unaudited)
1. Organization
JPMorgan Insurance Trust (the “Trust”) is registered under the Investment Company Act of 1940, as amended (the “1940 Act”), as an open-end management investment company and is a Massachusetts business trust.
The following is a separate Portfolio of the Trust (the “Portfolio”) covered by this report:
| | | | |
| | | Classes Offered | | Diversified/Non-Diversified |
| Income Builder Portfolio | | Class 1 and Class 2 | | Diversified |
The investment objective of the Portfolio is to seek to maximize income while maintaining prospects for capital appreciation.
Portfolio shares are offered only to separate accounts of participating insurance companies and Eligible Plans. Individuals may not purchase shares directly from the Portfolio.
All classes of shares have equal rights as to earnings, assets and voting privileges, except that each class may bear different transfer agency fees and distribution fees and each class has exclusive voting rights with respect to its distribution plan and administrative services plan.
J.P. Morgan Investment Management Inc. (“JPMIM”), an indirect, wholly-owned subsidiary of JPMorgan Chase & Co. (“JPMorgan”), acts as Adviser (the “Adviser”) and Administrator (the “Administrator”) to the Portfolio.
2. Significant Accounting Policies
The following is a summary of significant accounting policies followed by the Portfolio in the preparation of its financial statements. The Portfolio is an investment company and, accordingly, follows the investment company accounting and reporting guidance of the Financial Accounting Standards Board Accounting Standards Codification Topic 946 — Investment Companies, which is part of U.S. generally accepted accounting principles (“GAAP”). The preparation of financial statements in conformity with GAAP requires management to make estimates and assumptions that affect the reported amounts of assets and liabilities and disclosure of contingent assets and liabilities at the date of the financial statements and the reported amounts of increases and decreases in net assets from operations during the reporting period. Actual results could differ from those estimates.
A. Valuation of Investments — The valuation of investments is in accordance with GAAP and the Portfolio’s valuation policies set forth by and under the supervision and responsibility of the Board of Trustees (the “Board”), which established the following approach to valuation, as described more fully below: (i) investments for which market quotations are readily available shall be valued at such unadjusted quoted prices and (ii) all other investments for which market quotations are not readily available shall be valued at their fair value as determined in good faith by the Board.
The Administrator has established the J.P. Morgan Investment Management Americas Valuation Committee (“AVC”) to assist the Board with the oversight and monitoring of the valuation of the Portfolio’s investments. The Administrator implements the valuation policies of the Portfolio’s investments, as directed by the Board. The AVC oversees and carries out the policies for the valuation of investments held in the Portfolio. This includes monitoring the appropriateness of fair values based on results of ongoing valuation oversight, including but not limited to consideration of macro or security specific events, market events and pricing vendor and broker due diligence. The Administrator is responsible for discussing and assessing the potential impacts to the fair values on an ongoing basis, and at least on a quarterly basis with the AVC and the Board.
A market-based approach is primarily used to value the Portfolio’s investments. Investments for which market quotations are not readily available are fair valued by approved affiliated and unaffiliated pricing vendors or third party broker-dealers (collectively referred to as “Pricing Services”) or may be internally fair valued using methods set forth by the valuation policies approved by the Board. This may include related or comparable assets or liabilities, recent transactions, market multiples, book values, and other relevant information for the investment to determine the fair value of the investment. An income-based valuation approach may be used in which the anticipated future cash flows of the investment are discounted to calculate the fair value. Discounts may also be applied due to the nature or duration of any restrictions on the disposition of the investments. Valuations may be based upon current market prices of securities that are comparable in coupon, rating, maturity and industry. It is possible that the estimated values may differ significantly from the values that would have been used, had a ready market for the investments existed, and such differences could be material.
Fixed income instruments are valued based on prices received from Pricing Services. The Pricing Services use multiple valuation techniques to determine the valuation of fixed income instruments. In instances where sufficient market activity exists, the Pricing Services may utilize a market-based approach through which trades or quotes from market makers are used to determine the valuation of these instruments. In instances where sufficient market activity may not exist, the Pricing Services also utilize proprietary valuation models which may consider market transactions in comparable securities and the various relationships between securities in determining fair value and/or market characteristics in order to estimate the relevant cash flows, which are then discounted to calculate the fair values.
Equities and other exchange-traded instruments are valued at the last sale price or official market closing price on the primary exchange on which the instrument is traded before the net asset values (“NAV”) of the Portfolio are calculated on a valuation date. Certain foreign equity instruments, as well as certain derivatives with equity reference obligations are valued by applying international fair value factors provided by an approved Pricing Service. The factors seek to adjust the local closing price for movements of local markets post closing, but prior to the time the NAVs are calculated. Investments in open-end investment companies (the “Underlying Funds”) are valued at each Underlying Fund’s NAV per share as of the report date.
| | | | | | |
| | | |
| 26 | | | | JPMORGAN INSURANCE TRUST | | JUNE 30, 2017 |
Futures are generally valued on the basis of available market quotations.
See the table on “Quantitative Information about Level 3 Fair Value Measurements” for information on the valuation techniques and inputs used to value level 3 securities held by the Portfolio at June 30, 2017.
Valuations reflected in this report are as of the report date. As a result, changes in valuation due to market events and/or issuer related events after the report date and prior to issuance of the report are not reflected herein.
The various inputs that are used in determining the valuation of the Portfolio’s investments are summarized into the three broad levels listed below.
| • | | Level 1 — Unadjusted inputs using quoted prices in active markets for identical investments. |
| • | | Level 2 — Other significant observable inputs including, but not limited to, quoted prices for similar investments, inputs other than quoted prices that are observable for investments (such as interest rates, prepayment speeds, credit risk, etc.) or other market corroborated inputs. |
| • | | Level 3 — Significant inputs based on the best information available in the circumstances, to the extent observable inputs are not available (including the Portfolio’s assumptions in determining the fair value of investments). |
A financial instrument’s level within the fair value hierarchy is based on the lowest level of any input, both individually and in the aggregate, that is significant to the fair value measurement. The inputs or methodology used for valuing instruments are not necessarily an indication of the risk associated with investing in those instruments.
The following table represents each valuation input as presented on the Schedule of Portfolio Investments (“SOI”):
| | | | | | | | | | | | | | | | |
| | | Level 1
Quoted prices | | | Level 2
Other significant
observable inputs | | | Level 3
Significant
unobservable inputs | | | Total | |
Investments in Securities | | | | | | | | | | | | | | | | |
Asset-Backed Securities | | | | | | | | | | | | | | | | |
United States | | $ | — | | | $ | 485,887 | | | $ | 1,772,738 | | | $ | 2,258,625 | |
Collateralized Mortgage Obligations | | | | | | | | | | | | | | | | |
United States | | | — | | | | 1,558,530 | | | | — | | | | 1,558,530 | |
Commercial Mortgage-Backed Securities | | | | | | | | | | | | | | | | |
United States | | | — | | | | 50,338 | | | | — | | | | 50,338 | |
Common Stocks | | | | | | | | | | | | | | | | |
Australia | | | — | | | | 228,173 | | | | — | | | | 228,173 | |
Belgium | | | — | | | | 250,015 | | | | — | | | | 250,015 | |
Canada | | | 144,209 | | | | — | | | | — | | | | 144,209 | |
China | | | — | | | | 70,223 | | | | — | | | | 70,223 | |
Czech Republic | | | — | | | | 67,625 | | | | — | | | | 67,625 | |
Denmark | | | — | | | | 204,702 | | | | — | | | | 204,702 | |
Finland | | | — | | | | 403,795 | | | | — | | | | 403,795 | |
France | | | 9,743 | | | | 1,101,274 | | | | — | | | | 1,111,017 | |
Germany | | | — | | | | 1,019,835 | | | | — | | | | 1,019,835 | |
Hong Kong | | | — | | | | 80,967 | | | | — | | | | 80,967 | |
Ireland | | | — | | | | 33,360 | | | | — | | | | 33,360 | |
Italy | | | 1,672 | | | | 147,841 | | | | — | | | | 149,513 | |
Japan | | | 38,449 | | | | 430,523 | | | | — | | | | 468,972 | |
Netherlands | | | 36,901 | | | | 440,054 | | | | — | | | | 476,955 | |
Norway | | | — | | | | 130,642 | | | | — | | | | 130,642 | |
Portugal | | | — | | | | 15,381 | | | | — | | | | 15,381 | |
Singapore | | | — | | | | 51,852 | | | | — | | | | 51,852 | |
South Africa | | | — | | | | 37,534 | | | | — | | | | 37,534 | |
Spain | | | 659 | | | | 529,132 | | | | — | | | | 529,791 | |
Sweden | | | — | | | | 265,593 | | | | — | | | | 265,593 | |
Switzerland | | | — | | | | 674,227 | | | | — | | | | 674,227 | |
United Kingdom | | | 35,837 | | | | 2,650,649 | | | | — | | | | 2,686,486 | |
United States | | | 5,735,679 | | | | — | | | | — | | | | 5,735,679 | |
| | | | | | | | | | | | | | | | |
Total Common Stocks | | | 6,003,149 | | | | 8,833,397 | | | | — | | | | 14,836,546 | |
| | | | | | | | | | | | | | | | |
| | | | | | | | |
| | | |
| JUNE 30, 2017 | | JPMORGAN INSURANCE TRUST | | | | | 27 | |
NOTES TO FINANCIAL STATEMENTS
AS OF JUNE 30, 2017 (Unaudited) (continued)
| | | | | | | | | | | | | | | | |
| | | Level 1
Quoted prices | | | Level 2
Other significant
observable inputs | | | Level 3
Significant
unobservable inputs | | | Total | |
Convertible Bonds | | | | | | | | | | | | | | | | |
United States | | $ | — | | | $ | 3,340 | | | $ | — | | | $ | 3,340 | |
Corporate Bonds | | | | | | | | | | | | | | | | |
Australia | | | — | | | | 281,095 | | | | — | | | | 281,095 | |
Belgium | | | — | | | | 21,958 | | | | — | | | | 21,958 | |
Brazil | | | — | | | | 83,958 | | | | — | | | | 83,958 | |
Canada | | | — | | | | 937,417 | | | | — | | | | 937,417 | |
Finland | | | — | | | | 54,109 | | | | — | | | | 54,109 | |
Ireland | | | — | | | | 34,482 | | | | — | | | | 34,482 | |
Israel | | | — | | | | 41,482 | | | | — | | | | 41,482 | |
Luxembourg | | | — | | | | 377,417 | | | | — | | | | 377,417 | |
Mexico | | | — | | | | 213,750 | | | | — | | | | 213,750 | |
New Zealand | | | — | | | | 20,467 | | | | — | | | | 20,467 | |
Switzerland | | | — | | | | 212,500 | | | | — | | | | 212,500 | |
United Arab Emirates | | | — | | | | 60,444 | | | | — | | | | 60,444 | |
United Kingdom | | | — | | | | 534,693 | | | | — | | | | 534,693 | |
United States | | | — | | | | 16,981,393 | | | | 26,775 | | | | 17,008,168 | |
| | | | | | | | | | | | | | | | |
Total Corporate Bonds | | | — | | | | 19,855,165 | | | | 26,775 | | | | 19,881,940 | |
| | | | | | | | | | | | | | | | |
Investment Companies | | | | | | | | | | | | | | | | |
United States | | | 7,515,340 | | | | — | | | | — | | | | 7,515,340 | |
Loan Assignments | | | | | | | | | | | | | | | | |
United States | | | — | | | | 180,582 | | | | — | | | | 180,582 | |
Preferred Stocks | | | | | | | | | | | | | | | | |
Germany | | | — | | | | 12,438 | | | | — | | | | 12,438 | |
United States | | | 229,650 | | | | — | | | | — | | | | 229,650 | |
| | | | | | | | | | | | | | | | |
Total Preferred Stocks | | | 229,650 | | | | 12,438 | | | | — | | | | 242,088 | |
| | | | | | | | | | | | | | | | |
Rights | | | | | | | | | | | | | | | | |
Spain | | | 393 | | | | — | | | | — | | | | 393 | |
U.S. Treasury Obligation | | | | | | | | | | | | | | | | |
United States | | | — | | | | 165,590 | | | | — | | | | 165,590 | |
Short-Term Investment | | | | | | | | | | | | | | | | |
Investment Company | | | 1,124,435 | | | | — | | | | — | | | | 1,124,435 | |
| | | | | | | | | | | | | | | | |
Total Investments in Securities | | $ | 14,872,967 | | | $ | 31,145,267 | | | $ | 1,799,513 | | | $ | 47,817,747 | |
| | | | | | | | | | | | | | | | |
Appreciation in Other Financial Instruments | | | | | | | | | | | | | | | | |
Futures Contracts | | $ | 8,438 | | | $ | — | | | $ | — | | | $ | 8,438 | |
| | | | | | | | | | | | | | | | |
Depreciation in Other Financial Instruments | | | | | | | | | | | | | | | | |
Futures Contracts | | $ | (44,554 | ) | | $ | (2,494 | ) | | $ | — | | | $ | (47,048 | ) |
| | | | | | | | | | | | | | | | |
Transfers between fair value levels are valued utilizing values as of the beginning of the year.
There were no significant transfers between any levels during the year ended June 30, 2017.
The following is a summary of investments for which significant unobservable inputs (level 3) were used in determining fair value:
| | | | | | | | | | | | | | | | | | | | | | | | | | | | | | | | | | | | |
| | | Balance as of
December 31,
2016 | | | Realized
gain (loss) | | | Change in net
unrealized
appreciation
(depreciation) | | | Net
accretion
(amortization) | | | Purchases1 | | | Sales2 | | | Transfers
into Level 3 | | | Transfers
out
of Level 3 | | | Balance as
of June 30,
2017 | |
Investments in Securities | | | | | | | | | | | | | | | | | | | | | | | | | | | | | | | | | | | | |
Asset-Backed Securities | | $ | 1,835,227 | | | $ | — | | | $ | 45,915 | | | $ | 2,984 | | | $ | 133,303 | | | $ | (159,872 | ) | | $ | — | | | $ | (84,819 | ) | | $ | 1,772,738 | |
Corporate Bonds — United States | | | — | | | | — | | | | (659 | ) | | | 134 | | | | 27,300 | | | | — | | | | — | | | | — | | | | 26,775 | |
| | | | | | | | | | | | | | | | | | | | | | | | | | | | | | | | | | | | |
Total | | $ | 1,835,227 | | | $ | — | | | $ | 45,256 | | | $ | 3,118 | | | $ | 160,603 | | | $ | (159,872 | ) | | $ | — | | | $ | (84,819 | ) | | $ | 1,799,513 | |
| | | | | | | | | | | | | | | | | | | | | | | | | | | | | | | | | | | | |
| 1 | Purchases include all purchases of securities and securities received in corporate actions. |
| 2 | Sales include all sales of securities, maturities, paydowns and securities tendered in corporate actions. |
| | | | | | |
| | | |
| 28 | | | | JPMORGAN INSURANCE TRUST | | JUNE 30, 2017 |
The change in net unrealized appreciation (depreciation) attributable to securities owned at June 30, 2017, which were valued using significant unobservable inputs (level 3) amounted to $45,256. This amount is included in Change in net unrealized appreciation/depreciation of investments in non-affiliates on the Statement of Operations.
Quantitative Information about Level 3 Fair Value Measurements
| | | | | | | | | | |
| | | Fair Value at
June 30, 2017 | | | Valuation Technique(s) | | Unobservable Input | | Range (Weighted Average) |
| | $ | 1,772,738 | | | Discounted Cash Flow | | Constant Prepayment Rate | | 0.00% - 12.00% (5.28%) |
| | | | | | | | Constant Default Rate | | 2.83% - 6.90% (4.24%) |
| | | | | | | | Yield (Discount Rate of Cash Flows) | | 3.46% - 6.93% (4.75%) |
| | | | | | | | | | |
| Asset-Backed Securities | | | 1,772,738 | | | | | | | |
|
| | | 26,775 | | | Discounted Cash Flow | | Yield (Discount Rate of Cash Flows) | | 7.10% - 10.83% (9.04%) |
| | | | | | | | | | |
| Corporate Bonds | | | 26,775 | | | | | | | |
|
| Total | | $ | 1,799,513 | | | | | | | |
|
The significant unobservable inputs used in the fair value measurement of the Portfolio’s investments are listed above. Generally, a change in the assumptions used in any input in isolation may be accompanied by a change in another input. Significant changes in any of the unobservable inputs may significantly impact the fair value measurement. The impact is based on the relationship between each unobservable input and the fair value measurement. Significant increases (decreases) in the yield and default rate may decrease (increase) the fair value measurement. A significant change in the prepayment rate (Constant Prepayment Rate or PSA Prepayment Model) may decrease or increase the fair value measurement.
B. Investment Transactions with Affiliates — The Portfolio invested in Underlying Funds which are advised by the Adviser or its affiliates. An issuer which is under common control with the Portfolio may be considered an affiliate. For the purposes of the financial statements, the Portfolio assumes the issuers listed in the table below to be affiliated issuers. Underlying Funds’ distributions may be reinvested into the Underlying Funds. Reinvestment amounts are included in the purchase cost amounts in the table below. Included in the Realized Gain (Loss) amounts in the table below are distributions of realized capital gains, if any, received from the Underlying Funds.
| | | | | | | | | | | | | | | | | | | | | | | | | | | | |
| | | | | | For the six months ended June 30, 2017 | | | | | | | |
| Affiliate | | Value at
December 31,
2016 | | | Purchase
Cost | | | Sales
Proceeds | | | Realized
Gain/(Loss) | | | Dividend
Income | | | Shares at
June 30,
2017 | | | Value at
June 30,
2017 | |
JPMorgan Emerging Markets Debt Fund, Class R6 Shares | | $ | 1,455,132 | | | $ | 489,742 | | | $ | 491,000 | | | $ | (10,318 | ) | | $ | 25,742 | | | | 181,681 | | | $ | 1,495,233 | |
JPMorgan Emerging Markets Equity Fund, Class R6 Shares | | | 2,179,570 | | | | 671,189 | | | | 219,997 | | | | 387 | | | | — | | | | 121,603 | | | | 3,136,152 | |
JPMorgan Equity Income Fund, Class R6 Shares | | | 2,898,895 | | | | 571,273 | | | | 748,024 | | | | 26,720 | | | | 30,617 | | | | 181,153 | | | | 2,883,955 | |
JPMorgan U.S. Government Money Market Fund, Institutional Class Shares | | | 1,417,157 | | | | 19,085,999 | | | | 19,378,721 | | | | — | | | | 3,248 | | | | 1,124,435 | | | | 1,124,435 | |
| | | | | | | | | | | | | | | | | | | | | | | | | | | | |
| | $ | 7,950,754 | | | | | | | | | | | $ | 16,789 | | | $ | 59,607 | | | | | | | $ | 8,639,775 | |
| | | | | | | | | | | | | | | | | | | | | | | | | | | | |
C. When Issued, Delayed Delivery Securities and Forward Commitments — The Portfolio purchased when issued securities and entered into contracts to purchase or sell securities for a fixed price that may be settled a month or more after the trade date, or purchased delayed delivery securities which generally settle seven days after the trade date. When issued securities are securities that have been authorized, but not issued in the market. A forward commitment involves entering into a contract to purchase or sell securities for a fixed price at a future date that may be settled a month or more after the trade date. A delayed delivery security is agreed upon in advance between the buyer and the seller of the security and is generally delivered beyond seven days of the agreed upon date. The purchase of securities on a when issued, delayed delivery, or forward commitment basis involves the risk that the value of the security to be purchased declines before the settlement date. The sale of securities on a forward commitment basis involves the risk that the value of the securities sold may increase before the settlement date. The Portfolio may be exposed to credit risk if the counterparty fails to perform under the terms of the transaction. Interest income for securities purchased on a when issued, delayed delivery, or forward commitment basis is not accrued until the settlement date.
The Portfolio had delayed delivery securities outstanding as of June 30, 2017, which are shown as a Receivable for Investment securities purchased-delayed delivery securities and Payable for Investment securities purchased-delayed delivery securities, respectively, on the Statement of Assets and Liabilities. The values of these securities held at June 30, 2017 are detailed on the SOI.
D. Futures Contracts — The Portfolio used index, currency, treasury or other financial futures contracts to manage and hedge interest rate risk associated with portfolio investments and to gain or reduce exposure to particular countries or regions. The Portfolio also used futures contracts to lengthen or shorten the duration of the overall investment portfolio.
Futures contracts provide for the delayed delivery of the underlying instrument at a fixed price or are settled for a cash amount based on the change in the value of the underlying instrument at a specific date in the future. Upon entering into a futures contract, the Portfolio is required to
| | | | | | | | |
| | | |
| JUNE 30, 2017 | | JPMORGAN INSURANCE TRUST | | | | | 29 | |
NOTES TO FINANCIAL STATEMENTS
AS OF JUNE 30, 2017 (Unaudited) (continued)
deposit with the broker, cash or securities in an amount equal to a certain percentage of the contract amount, which is referred to as the initial margin deposit. Subsequent payments, referred to as variation margin, are made or received by the Portfolio periodically and are based on changes in the market value of open futures contracts. Changes in the market value of open futures contracts are recorded as change in net unrealized appreciation/depreciation on the Statement of Operations. Realized gains or losses, representing the difference between the value of the contract at the time it was opened and the value at the time it was closed, are reported on the Statement of Operations at the closing or expiration of the futures contract. Securities deposited as initial margin are designated in the SOI and cash deposited is recorded on the Statement of Assets and Liabilities. A receivable from and/or a payable to brokers for the daily variation margin is also recorded on the Statement of Assets and Liabilities.
The use of futures contracts exposes the Portfolio to interest rate, foreign currency and equity price risks. The Portfolio may be subject to the risk that the change in the value of the futures contract may not correlate perfectly with the underlying instrument. Use of long futures contracts subjects the Portfolio to risk of loss in excess of the amounts shown on the Statement of Assets and Liabilities, up to the notional amount of the futures contracts. Use of short futures contracts subjects the Portfolio to unlimited risk of loss. The Portfolio may enter into futures contracts only on exchanges or boards of trade. The exchange or board of trade acts as the counterparty to each futures transaction; therefore, the Portfolio’s credit risk is limited to failure of the exchange or board of trade. Under some circumstances, futures exchanges may establish daily limits on the amount that the price of a futures contract can vary from the previous day’s settlement price, which could effectively prevent liquidation of positions.
The table below discloses the volume of the Portfolio’s futures contracts activity during the six months ended June 30, 2017:
| | | | |
Futures Contracts: | | | | |
Equity | | | | |
Average Notional Balance Long | | $ | 43,364 | |
Ending Notional Balance Long | | | 78,500 | |
Foreign Exchange | | | | |
Average Notional Balance Short | | | 2,206,141 | |
Ending Notional Balance Short | | | 2,349,944 | |
Interest Rate | | | | |
Average Notional Balance Short | | | 5,170,761 | |
Ending Notional Balance Short | | | 3,888,586 | |
The Portfolio’s futures contracts are not subject to master netting arrangements (the right to close out all transactions traded with a counterparty and net amounts owed or due across transactions).
E. Summary of Derivatives Information — The following tables present the value of derivatives held as of June 30, 2017, by their primary underlying risk exposure and respective location on the Statement of Assets and Liabilities:
| | | | | | |
| Derivative Contracts | | Statement of Assets and Liabilities Location | | | |
| Gross Assets: | | | | Futures Contracts (a) | |
Interest rate contracts | | Receivables, Net Assets — Unrealized Appreciation | | $ | 8,438 | |
| | | | | | |
| | |
Gross Liabilities: | | | | | |
Foreign exchange contracts | | Payables, Net Assets — Unrealized Depreciation | | $ | (44,554 | ) |
Equity contracts | | Payables, Net Assets — Unrealized Depreciation | | | (2,494 | ) |
| | | | | | |
Total | | | | $ | (47,048 | ) |
| | | | | | |
| (a) | This amount reflects the cumulative appreciation (depreciation) of futures contracts as reported on the SOI. The Statement of Assets and Liabilities only reflects the current day variation margin receivable/payable from/to brokers. |
The following table presents the effect of derivatives on the Statement of Operations for the six months ended June 30, 2017, by primary underlying risk exposure:
| | | | |
| Amount of Realized Gain (Loss) on Derivatives Recognized on the Statement of Operations | |
| Derivative Contracts | | Futures Contracts | |
Equity contracts | | $ | (5,798 | ) |
Foreign exchange contracts | | | (56,567 | ) |
Interest rate contracts | | | (26,375 | ) |
| | | | |
Total | | $ | (88,740 | ) |
| | | | |
|
| Amount of Change in Unrealized Appreciation (Depreciation) on Derivatives Recognized on the Statement of Operations | |
| Derivative Contracts | | Futures Contracts | |
Equity contracts | | $ | (2,494 | ) |
Foreign exchange contracts | | | (77,982 | ) |
Interest rate contracts | | | (19,269 | ) |
| | | | |
Total | | $ | (99,745 | ) |
| | | | |
| | | | | | |
| | | |
| 30 | | | | JPMORGAN INSURANCE TRUST | | JUNE 30, 2017 |
The Portfolio’s derivatives contracts held at June 30, 2017 are not accounted for as hedging instruments under GAAP.
F. Foreign Currency Translation — The books and records of the Portfolio are maintained in U.S. dollars. Foreign currency amounts are translated into U.S. dollars at the prevailing exchange rates of such currencies against the U.S. dollar. The market value of investment securities and other assets and liabilities are translated at the exchange rate as of the valuation date. Purchases and sales of investment securities, income and expenses are translated at the exchange rate prevailing on the respective dates of such transactions.
The Portfolio does not isolate the effect of changes in foreign exchange rates from changes in market prices on securities held. Accordingly, such changes are included within Change in net unrealized appreciation/depreciation on investments on the Statement of Operations.
Reported realized foreign currency gains and losses arise from the disposition of foreign currency, currency gains or losses realized between the trade and settlement dates on securities transactions, and the difference between the amounts of dividends, interest and foreign withholding taxes recorded on the Portfolio’s books on the transaction date and the U.S. dollar equivalent of the amounts actually received or paid. These reported realized foreign currency gains and losses are included in Net realized gain (loss) on foreign currency transactions on the Statement of Operations. Unrealized foreign currency gains and losses arise from changes (due to changes in exchange rates) in the value of foreign currency and other assets and liabilities denominated in foreign currencies, which are held at period end and are included in Change in net unrealized appreciation/depreciation on foreign currency translations on the Statement of Operations.
G. Security Transactions and Investment Income — Investment transactions are accounted for on the trade date (the date the order to buy or sell is executed). Securities gains and losses are calculated on a specifically identified cost basis. Interest income is determined on the basis of coupon interest accrued using the effective interest method which adjusts for amortization of premiums and accretion of discounts. Dividend income, net of foreign taxes withheld, if any, and distributions of net investment income and realized capital gains from the Underlying Funds, if any, are recorded on the ex-dividend date or when the Portfolio first learns of the dividend. Certain Portfolios may receive other income from investment in loan assignments and/or unfunded commitments, including amendment fees, consent fees and commitment fees. These fees are recorded as income when received by the Portfolio. These amounts are included in Interest Income on the Statement of Operations.
H. Allocation of Income and Expenses — Expenses directly attributable to a portfolio are charged directly to that portfolio, while the expenses attributable to more than one portfolio of the Trust are allocated among the respective portfolios. In calculating the NAV of each class, investment income, realized and unrealized gains and losses and expenses, other than class specific expenses, are allocated daily to each class of shares based upon the proportion of net assets of each class at the beginning of each day.
The Portfolio invests in Underlying Funds and, as a result, bears a portion of the expenses incurred by these Underlying Funds. These expenses are not reflected in the expenses shown on the Statement of Operations and are not included in the ratios to average net assets shown in the Financial Highlights. Certain expenses of affiliated Underlying Funds are waived as described in Note 3.E.
I. Federal Income Taxes — The Portfolio is treated as a separate taxable entity for Federal income tax purposes. The Portfolio’s policy is to comply with the provisions of the Internal Revenue Code of 1986, as amended (the “Code”), applicable to regulated investment companies and to distribute to shareholders all of its distributable net investment income and net realized capital gains on investments. Accordingly, no provision for Federal income tax is necessary. The Portfolio is also a segregated portfolio of assets for insurance purposes and intends to comply with the diversification requirements of Subchapter L of the Code. Management has reviewed the Portfolio’s tax positions for all open tax years and has determined that as of June 30, 2017, no liability for income tax is required in the Portfolio’s financial statements for net unrecognized tax benefits. However, management’s conclusions may be subject to future review based on changes in, or the interpretation of, the accounting standards or tax laws and regulations. The Portfolio’s Federal tax returns for the prior three fiscal years, or since inception if shorter, remain subject to examination by the Internal Revenue Service.
J. Foreign Taxes — The Portfolio may be subject to foreign taxes on income, gains on investments or currency purchases/repatriation, a portion of which may be recoverable. The Portfolio will accrue such taxes and recoveries as applicable, based upon its current interpretation of tax rules and regulations that exist in the markets in which it invests.
K. Distributions to Shareholders — Distributions from net investment income are generally declared and paid at least annually and are declared separately for each class. No class has preferential dividend rights; differences in per share rates are due to differences in separate class expenses. Net realized capital gains, if any, are distributed at least annually. The amount of distributions from net investment income and net realized capital gains is determined in accordance with Federal income tax regulations, which may differ from GAAP. To the extent these “book/tax” differences are permanent in nature (i.e., that they result from other than timing of recognition — “temporary differences”), such amounts are reclassified within the capital accounts based on their Federal tax-basis treatment.
3. Fees and Other Transactions with Affiliates
A. Investment Advisory Fee — Pursuant to an Investment Advisory Agreement, the Adviser supervises the investments of the Portfolio and for such services is paid a fee. The fee is accrued daily and paid monthly based on the Portfolio’s average daily net assets at an annual rate of 0.45%.
The Adviser waived Investment Advisory fees and/or reimbursed expenses as outlined in Note 3.E.
| | | | | | | | |
| | | |
| JUNE 30, 2017 | | JPMORGAN INSURANCE TRUST | | | | | 31 | |
NOTES TO FINANCIAL STATEMENTS
AS OF JUNE 30, 2017 (Unaudited) (continued)
B. Administration Fee — Pursuant to an Administration Agreement, the Administrator, provides certain administration services to the Portfolio. In consideration of these services, the Administrator receives a fee accrued daily and paid monthly at an annual rate of 0.15% of the first $25 billion of the average daily net assets of all funds in the J.P. Morgan Funds Complex covered by the Administration Agreement (excluding certain funds of funds and money market funds) and 0.075% of the average daily net assets in excess of $25 billion of all such funds. For the six months ended June 30, 2017, the effective annualized rate was 0.08% of the Portfolio’s average daily net assets, notwithstanding any fee waivers and/or expense reimbursements.
JPMorgan Chase Bank, N.A (“JPMCB”), a wholly-owned subsidiary of JPMorgan serves as the Portfolio’s sub-administrator (the “Sub-administrator”). For its services as Sub-administrator, JPMCB receives a portion of the fees payable to the Administrator.
The Administrator waived Administration fees as outlined in Note 3.E.
C. Distribution Fees — Pursuant to a Distribution Agreement, JPMorgan Distribution Services, Inc. (“JPMDS”), a wholly-owned subsidiary of JPMorgan, serves as the Trust’s principal underwriter and promotes and arranges for the sale of the Portfolio’s shares.
The Board has adopted a Distribution Plan (the “Distribution Plan”) for Class 2 Shares of the Portfolio in accordance with Rule 12b-1 under the 1940 Act. The Class 1 Shares do not charge a distribution fee. The Distribution Plan provides that the Portfolio shall pay distribution fees, including payments to JPMDS, at an annual rate of 0.25% of the average daily net assets of Class 2 Shares.
D. Custodian and Accounting Fees — JPMCB provides portfolio custody and accounting services to the Portfolio. For performing these services, the Portfolio pays JPMCB transaction and asset-based fees that vary according to the number of transactions and positions, plus out-of-pocket expenses. The amounts paid directly to JPMCB by the Portfolio for custody and accounting services are included in Custodian and accounting fees on the Statement of Operations. Payments to the custodian may be reduced by credits earned by the Portfolio, based on uninvested cash balances held by the custodian. Such earnings credits, if any, are presented separately on the Statement of Operations.
Interest income earned on cash balances at the custodian, if any, is included in Interest income from affiliates on the Statement of Operations.
Interest expense paid to the custodian related to cash overdrafts, if any, is included in Interest expense to affiliates on the Statement of Operations.
E. Waivers and Reimbursements — The Adviser (for all share classes), Administrator (for all share classes) and/or JPMDS (for Class 2 Shares) have contractually agreed to waive fees and/or reimburse the Portfolio to the extent that total annual operating expenses (excluding acquired fund fees and expenses other than certain money market fund fees as described below, dividend and interest expenses related to short sales, interest, taxes, expenses related to litigation and potential litigation and extraordinary expenses) exceed the percentages of the Portfolio’s respective average daily net assets as shown in the table below:
| | | | | | |
| | | Class 1 | | Class 2 | |
| | 0.60% | | | 0.85 | % |
The expense limitation agreement was in effect for the six months ended June 30, 2017 and is in place until at least April 30, 2018.
For the six months June 30, 2017, the Portfolio’s service providers waived fees and/or reimbursed expenses for the Portfolio as follows. None of these parties expect the Portfolio to repay any such waived fees in future years.
| | | | | | | | | | | | | | | | |
| | | Contractual Waivers | | | | |
| | | Investment
Advisory Fees | | | Administration
Fees | | | Total | | | Contractual
Reimbursements | |
| | $ | 89,760 | | | $ | 20,043 | | | $ | 109,803 | | | $ | 155 | |
Additionally, the Portfolio may invest in one or more money market funds advised by the Adviser or its affiliates (affiliated money market funds). The Adviser, Administrator and/or JPMDS have contractually agreed to waive fees and/or reimburse expenses in an amount sufficient to offset the respective net fees each collects from the affiliated money market fund on the Portfolio’s investment in such affiliated money market fund.
The amount of waivers resulting from investments in these money market funds for the six months ended June 30, 2017 was $1,129.
The Underlying Funds may impose a separate advisory fee. The Portfolio’s Adviser has agreed to waive the Portfolio’s advisory fee in the weighted average pro-rata amount of the advisory fee charged by the affiliated Underlying Funds. These waivers may be in addition to any waivers required to meet the Portfolio’s contractual expense limitations, but will not exceed the Portfolio’s advisory fee.
F. Other — Certain officers of the Trust are affiliated with the Adviser, the Administrator and JPMDS. Such officers, with the exception of the Chief Compliance Officer, receive no compensation from the Portfolio for serving in their respective roles.
The Board appointed a Chief Compliance Officer to the Portfolio in accordance with Federal securities regulations. The Portfolio, along with other affiliated portfolios, makes reimbursement payments, on a pro-rata basis, to the Administrator for a portion of the fees associated with the Office of the Chief Compliance Officer. Such fees are included in Trustees’ and Chief Compliance Officer’s fees on the Statement of Operations.
The Trust adopted a Trustee Deferred Compensation Plan (the “Plan”) which allows the Independent Trustees to defer the receipt of all or a portion of compensation related to performance of their duties as Trustees. The deferred fees are invested in various J.P. Morgan Funds until distribution in accordance with the Plan.
| | | | | | |
| | | |
| 32 | | | | JPMORGAN INSURANCE TRUST | | JUNE 30, 2017 |
During the six months ended June 30, 2017, the Portfolio purchased securities from an underwriting syndicate in which the principal underwriter or members of the syndicate were affiliated with the Adviser.
The Portfolio may use related party broker-dealers. For the six months ended June 30, 2017, the Portfolio incurred $7 in brokerage commissions with broker-dealers affiliated with the Adviser.
The Securities and Exchange Commission (“SEC”) has granted an exemptive order permitting the Portfolio to engage in principal transactions with J.P. Morgan Securities, Inc., an affiliated broker, involving taxable money market instruments, subject to certain conditions.
4. Investment Transactions
During the six months ended June 30, 2017, purchases and sales of investments (excluding short-term investments) were as follows:
| | | | | | | | | | | | | | | | |
| | | Purchases
(excluding
U.S. Government) | | | Sales
(excluding
U.S. Government) | | | Purchases
of U.S.
Government | | | Sales
of U.S.
Government | |
| | $ | 22,331,988 | | | $ | 24,256,398 | | | $ | 165,763 | | | $ | 114,999 | |
5. Federal Income Tax Matters
For Federal income tax purposes, the estimated cost and unrealized appreciation (depreciation) in value of investment securities held at June 30, 2017 were as follows:
| | | | | | | | | | | | | | | | |
| | | Aggregate
Cost | | | Gross
Unrealized
Appreciation | | | Gross
Unrealized
Depreciation | | | Net Unrealized
Appreciation
(Depreciation) | |
| | $ | 44,852,601 | | | $ | 3,347,230 | | | $ | 382,084 | | | $ | 2,965,146 | |
At December 31, 2016, the Portfolio had net capital loss carryforwards as follows:
| | | | | | | | |
| | | Net Capital Loss: | |
| | | Short-Term | | | Long-Term | |
| | $ | 610,227 | | | $ | 250,130 | |
6. Borrowings
The Portfolio relies upon an exemptive order granted by the SEC (the “Order”) permitting the establishment and operation of an Interfund Lending Facility (the “Facility”). The Facility allows the Portfolio to directly lend and borrow money to or from any other fund relying upon the Order at rates beneficial to both the borrowing and lending funds. Advances under the Facility are taken primarily for temporary or emergency purposes, including the meeting of redemption requests that otherwise might require the untimely disposition of securities, and are subject to the Portfolio’s borrowing restrictions. The Interfund loan rate is determined, as specified in the Order, by averaging the current repurchase agreement rate and the current bank loan rate. The Order was granted to the Trust and may be relied upon by the Portfolio because the Portfolio and the series of the Trust are all investment companies in the same “group of investment companies” (as defined in Section 12(d)(1)(G) of the 1940 Act).
The Trust and JPMCB have entered into a financing arrangement. Under this arrangement, JPMCB provides an unsecured, uncommitted credit facility in the aggregate amount of $100 million to certain of the J.P. Morgan Funds, including the Portfolio. Advances under the arrangement are taken primarily for temporary or emergency purposes, including the meeting of redemption requests that otherwise might require the untimely disposition of securities, and are subject to the Portfolio’s borrowing restrictions. Interest on borrowings is payable at a rate determined by JPMCB at the time of borrowing. This agreement has been extended until November 6, 2017.
The Portfolio had no borrowings outstanding from the unsecured, uncommitted credit facility during the six months ended June 30, 2017.
In addition, effective August 16, 2016, the Trust along with certain other trusts (“Borrowers”) entered into a joint syndicated senior unsecured revolving credit facility totaling $1.5 billion (“Credit Facility”) with various lenders and The Bank of New York Mellon, as administrative agent for the lenders. This Credit Facility provides a source of funds to the Borrowers for temporary and emergency purposes, including the meeting of redemption requests that otherwise might require the untimely disposition of securities. Under the terms of the Credit Facility, a borrowing portfolio must have a minimum of $25,000,000 in adjusted net asset value and not exceed certain adjusted net asset coverage ratios prior to and during the time in which any borrowings are outstanding. If a portfolio does not comply with the aforementioned requirements, the portfolio must remediate within three business days with respect to the $25,000,000 minimum adjusted net asset value or within one business day with respect to certain asset coverage ratios or the administrative agent at the request of, or with the consent of, the lenders may terminate the Credit Facility and declare any outstanding borrowings to be due and payable immediately.
Interest associated with any borrowing under the Credit Facility is charged to the borrowing portfolio at a rate of interest equal to 1.00% plus the greater of the federal funds effective rate or one month LIBOR. The annual commitment fee to maintain the Credit Facility is 0.15% and is incurred on the unused portion of the Credit Facility and is allocated to all participating portfolios pro rata based on their respective net assets. Effective August 15, 2017, this agreement has been amended and restated for a term of 364 days, unless extended. The Portfolio did not utilize the Credit Facility during the six months ended June 30, 2017.
| | | | | | | | |
| | | |
| JUNE 30, 2017 | | JPMORGAN INSURANCE TRUST | | | | | 33 | |
NOTES TO FINANCIAL STATEMENTS
AS OF JUNE 30, 2017 (Unaudited) (continued)
7. Risks, Concentrations and Indemnifications
In the normal course of business, the Portfolio enters into contracts that contain a variety of representations which provide general indemnifications. The Portfolio’s maximum exposure under these arrangements is unknown. The amount of exposure would depend on future claims that may be made against the Portfolio that have not yet occurred. However, based on experience, the Portfolio expects the risk of loss to be remote.
As of June 30, 2017, the Adviser owned shares representing 14.2% of the Portfolio’s outstanding shares. As of June 30, 2017, the Portfolio had three omnibus accounts which represented 58.0% of the Portfolio’s outstanding shares. Significant shareholder transactions by these shareholders may impact the Portfolio’s performance.
The Portfolio is subject to risks associated with securities with contractual cash flows including asset-backed and mortgage-related securities such as collateralized mortgage obligations. The value, liquidity and related income of these securities are sensitive to changes in economic conditions, including real estate value, prepayments, delinquencies and/or defaults, and may be adversely affected by shifts in the market’s perception of the issuers and changes in interest rates.
The Portfolio is subject to interest rate and credit risk. The value of debt securities may decline as interest rates increase. The Portfolio could lose money if the issuer of a fixed income security is unable to pay interest or repay principal when it is due. The Portfolio invests in floating rate debt securities. Although these investments are generally less sensitive to interest rate changes than other fixed rate instruments, the value of floating rate investments may decline if their interest rates do not rise as quickly, or as much, as general interest rates. Many factors can cause interest rates to rise. Some examples include central bank monetary policy, rising inflation rates and general economic conditions. Given that the Federal Reserve has recently raised interest rates and may continue to do so, the Portfolio may face a heightened level of interest rate risk. The ability of the issuers of debt to meet their obligations may be affected by the economic and political developments in a specific industry or region.
Investing in securities of foreign countries may include certain risks and considerations not typically associated with investing in U.S. securities. These risks include revaluation of currencies, high rates of inflation, repatriation restrictions on income and currencies, and future and adverse political, social and economic developments.
Because of the Portfolio’s investments in the Underlying Funds, the Portfolio indirectly pays a portion of the expenses incurred by the Underlying Funds. As a result, the cost of investing in the Portfolio may be higher than the cost of investing in a mutual fund that invests directly in individual securities and financial instruments. The Portfolio is also subject to certain risks related to the Underlying Funds’ investments in securities and financial instruments such as fixed income securities, including high yield, asset-backed and mortgage-related securities, equity securities, foreign and emerging markets securities, commodities and real estate securities. These securities are subject to risks specific to their structure, sector or market.
In addition, the Underlying Funds may use derivative instruments in connection with their individual investment strategies including futures, forward foreign currency exchange contracts, options, swaps and other derivatives, which are also subject to specific risks related to their structure, sector or market and may be riskier than investments in other types of securities.
Specific risks and concentrations present in the Underlying Funds are disclosed within their individual financial statements and registration statements, as appropriate.
The Portfolio invests in preferred securities. These securities are typically issued by corporations, generally in the form of interest bearing notes with preferred security characteristics and may include provisions that permit the issuer, in its discretion, to defer or omit distributions for a certain period of time.
8. Investment Company Reporting Modernization
In October 2016, the U.S. Securities and Exchange Commission adopted new rules and forms, and amendments to certain current rules and forms, to modernize the reporting and disclosure of information by registered investment companies. In part, the final rules amend Regulation S-X and will require standardized, enhanced disclosures about derivatives in investment company financial statements, as well as other amendments. The amendments to Regulation S-X will apply to Portfolios’ fiscal year ends on or after August 1, 2017. At this time, management is currently evaluating the impact of the Regulation S-X amendments on the Portfolio’s financial statements and related disclosures. The adoption will have no effect on the Portfolio’s net assets or result of operations.
| | | | | | |
| | | |
| 34 | | | | JPMORGAN INSURANCE TRUST | | JUNE 30, 2017 |
SCHEDULE OF SHAREHOLDER EXPENSES
(Unaudited)
Hypothetical $1,000 Investment
As a shareholder of the Portfolio, you incur ongoing costs, including investment advisory fees, administration fees, distribution fees (for Class 2 Shares) and other Portfolio expenses. Because the Portfolio is a funding vehicle for Policies and Eligible Plans, you may also incur sales charges and other fees relating to the Policies or Eligible Plans. The examples below are intended to help you understand your ongoing costs (in dollars) of investing in the Portfolio, but not the costs of the Policies or Eligible Plans, and to compare these ongoing costs with the ongoing costs of investing in other mutual funds. The examples assume that you had a $1,000 investment in each Class at the beginning of the reporting period, January 1, 2017, and continued to hold your shares at the end of the reporting period, June 30, 2017.
Actual Expenses
For each Class of the Portfolio in the table below, the first line provides information about actual account values and actual expenses. You may use the information in this line, together with the amount you invested, to estimate the expenses that you paid over the period. Simply divide your account value by $1,000 (for example, an $8,600 account value divided by $1,000 = 8.6), then multiply the result by the number in the first line of each Class under the heading entitled “Expenses Paid During the Period” to estimate the expenses you paid on your account during this period.
Hypothetical Example for Comparison Purposes
The second line of each Class in the table below provides information about hypothetical account values and hypothetical expenses based on the Class’ actual expense ratio and an assumed rate of return of 5% per year before expenses, which is not the Class’ actual return. The hypothetical account values and expenses may not be used to estimate the actual ending account balance or expenses you paid for the period. You may use this information to compare the ongoing costs of investing in the Class of the Portfolio and other funds. To do so, compare this 5% hypothetical example with the 5% hypothetical examples that appear in the shareholder reports of the other funds. Please note that the expenses shown in the table are meant to highlight your ongoing costs only and do not reflect any transaction costs, such as sales charges (loads) or redemption fees or the costs associated with the Policies and Eligible Plans through which the Portfolio is held. Therefore, the second line for each Class in the table is useful in comparing ongoing costs only, and will not help you determine the relative total costs of owning different funds. In addition, if these transaction costs were included, your costs would have been higher. The examples also assume all dividends and distributions have been reinvested.
| | | | | | | | | | | | | | | | |
| | | Beginning
Account Value
January 1, 2017 | | | Ending
Account Value
June 30, 2017 | | | Expenses
Paid During
the Period* | | | Annualized
Expense
Ratio | |
Income Builder Portfolio | | | | | | | | | | | | | | | | |
Class 1 | | | | | | | | | | | | | | | | |
Actual | | $ | 1,000.00 | | | $ | 1,059.40 | | | $ | 3.01 | | | | 0.59 | % |
Hypothetical | | | 1,000.00 | | | | 1,021.87 | | | | 2.96 | | | | 0.59 | |
Class 2 | | | | | | | | | | | | | | | | |
Actual | | | 1,000.00 | | | | 1,057.50 | | | | 4.34 | | | | 0.85 | |
Hypothetical | | | 1,000.00 | | | | 1,020.58 | | | | 4.26 | | | | 0.85 | |
| * | Expenses are equal to each Class’ respective annualized expense ratio, multiplied by the average account value over the period, multiplied by 181/365 (to reflect the one-half year period). |
| | | | | | | | |
| | | |
| JUNE 30, 2017 | | JPMORGAN INSURANCE TRUST | | | | | 35 | |
J.P. Morgan Funds are distributed by JPMorgan Distribution Services, Inc., which is an affiliate of JPMorgan Chase & Co. Affiliates of JPMorgan Chase & Co. receive fees for providing various services to the funds.
Contact JPMorgan Distribution Services, Inc. at 1-800-480-4111 for a portfolio prospectus. You can also visit us at www.jpmorganfunds.com. Investors should carefully consider the investment objectives and risk as well as charges and expenses of the mutual fund before investing. The prospectus contains this and other information about the mutual fund. Read the prospectus carefully before investing.
The Portfolio files a complete schedule of its portfolio holdings for the first and third quarters of its fiscal year with the SEC on Form N-Q. The Portfolio’s Forms N-Q are available on the SEC’s website at http://www.sec.gov and may be reviewed and copied at the SEC’s Public Reference Room in Washington, DC. Information on the operation of the SEC’s Public Reference Room may be obtained by calling 1-800-SEC-0330. Shareholders may request the Form N-Q without charge by calling 1-800-480-4111 or by visiting the variable insurance portfolio section of the J.P. Morgan Funds’ website at www.jpmorganfunds.com.
A description of the Portfolio’s policies and procedures with respect to the disclosure of the Portfolio’s holdings is available in the prospectus and Statement of Additional Information.
A copy of proxy policies and procedures is available without charge upon request by calling 1-800-480-4111 and on the Portfolio’s website at www.jpmorganfunds.com. A description of such policies and procedures is on the SEC’s website at www.sec.gov. The Trustees have delegated the authority to vote proxies for securities owned by the Portfolio to the Adviser. A copy of the Portfolio’s voting record for the most recent 12-month period ended June 30 is available on the SEC’s website at www.sec.gov or at the Portfolio’s website at www.jpmorganfunds.com no later than August 31 of each year. The Portfolio’s proxy voting record will include, among other things, a brief description of the matter voted on for each portfolio security, and will state how each vote was cast, for example, for or against the proposal.

J.P. Morgan Asset Management is the marketing name for the asset management businesses of JPMorgan Chase & Co. Those businesses include, but are not limited to, J.P. Morgan Investment Management Inc., Security Capital Research & Management Incorporated and J.P. Morgan Alternative Asset Management, Inc.
| | | | |
| | © JPMorgan Chase & Co., 2017. All rights reserved. June 2017. | | SAN-JPMITIBP-617 |
Semi-Annual Report
JPMorgan Insurance Trust
June 30, 2017 (Unaudited)
JPMorgan Insurance Trust Global Allocation Portfolio
| | | | |
NOT FDIC INSURED • NO BANK GUARANTEE • MAY LOSE VALUE
| | |  | |
CONTENTS
Investments in the Portfolio are not deposits or obligations of, or guaranteed or endorsed by, any bank and are not insured or guaranteed by the FDIC, the Federal Reserve Board or any other government agency. You could lose money if you sell when the Portfolio’s share price is lower than when you invested.
Past performance is no guarantee of future performance. The general market views expressed in this report are opinions based on market and other conditions through the end of the reporting period and are subject to change without notice. These views are not intended to predict the future performance of the Portfolio or the securities markets. References to specific securities and their issuers are for illustrative purposes only and are not intended to be, and should not be interpreted as, recommendations to purchase or sell such securities. Such views are not meant as investment advice and may not be relied on as an indication of trading intent on behalf of the Portfolio.
This Portfolio is intended to be a funding vehicle for variable annuity contracts and variable life insurance policies (collectively “Policies”) offered by the separate accounts of various insurance companies. Portfolio shares may also be offered to qualified pension and retirement plans and accounts permitting accumulation of assets on a tax-deferred basis (“Eligible Plans”). Individuals may not purchase shares directly from the Portfolio.
Prospective investors should refer to the Portfolio’s prospectus for a discussion of the Portfolio’s investment objective, strategies and risks. Call J.P. Morgan Funds Service Center at 1-800-480-4111 for a prospectus containing more complete information about the Portfolio, including management fees and other expenses. Please read it carefully before investing.
CEO’S LETTER
August 4, 2017 (Unaudited)
Dear Shareholder,
As the U.S. economic expansion entered its eighth year in 2017, growth in both developed and emerging market economies became increasingly synchronized even as U.S. growth cooled in the early part of the year. Amid an environment of economic growth, low inflation and rising corporate earnings, global financial markets overall produced positive returns.
| | |
 | | “In the U.S., the continued economic expansion, muted inflation, corporate earnings growth and historically low volatility in financial markets helped to drive key equity market indexes to multiple record closing highs throughout the first half of 2017.” — George C.W. Gatch |
While U.S. gross domestic product (GDP) growth slowed to 1.2% in the first quarter of 2017, it rebounded to 2.6% growth in the second quarter of 2017 on the back of a surge in consumer spending. Meanwhile, the U.S. jobless rate continued to shrink and fell to 4.4% in June 2017 from 4.8% six months earlier. In response to these numbers, along with nascent signs of price inflation, the U.S. Federal Reserve (the “Fed”) raised interest rates in June 2017 and signaled it would raise rates once more before the end of the year. Fed Chairwoman Janet Yellen also indicated she was prepared to begin partially unwinding the central bank’s $4.5 trillion balance sheet of assets purchased through its quantitative easing program.
Despite the apparent health of the U.S. economy, by mid-2017 domestic price inflation was below the Fed’s target of 2% growth and wage growth remained below economists’ expectations, the latter despite an environment of essentially full employment for U.S. workers. These trends — and the Fed’s acknowledgment of them — provided some near-term uncertainty about the central bank’s commitment to tightening monetary policy.
Throughout the first half of 2017, global energy prices continued to fall amid an oversupply of crude oil and natural gas. Despite efforts by the Organization of Petroleum Exporting
Countries to curb global production, the price of a barrel of benchmark West Texas Intermediate crude oil dropped to $46 by the end of June 2017.
Meanwhile, the leading economies of the European Union (the “EU”) continued to strengthen. Annualized GDP for the 19 core EU nations rose 1.9% in the first quarter of 2017 and 2.1% in the second quarter. The June 2017 aggregate unemployment rate for those nations fell to 9.1%, the lowest level since March 2009. Also, in separate elections, voters in the Netherlands and France largely rejected populist campaigns espousing policies to limit free trade and immigration. The election results provided another boost to global equity prices.
In the U.S., the continued economic expansion, muted inflation, corporate earnings growth and historically low volatility in financial markets helped to drive key equity market indexes to multiple record closing highs throughout the first half of 2017. U.S. investors appeared to shrug off intermittent political and policy dramas emanating from Washington, D.C. and extended the run-up in U.S. equity prices into its eighth consecutive year — one of the longest on record. For the six months ended June 30, 2017, the Standard & Poor’s 500 Index returned 9.34%.
U.S. and foreign financial markets largely rewarded those investors who remained fully invested throughout the first half of 2017, reaffirming the fundamental virtues of patience and diversification within a prudent investment strategy.
We look forward to managing your investment needs for years to come. Should you have any questions, please visit www.jpmorganfunds.com or contact the J.P. Morgan Funds Service Center at 1-800-480-4111.
Sincerely yours,

George C.W. Gatch
CEO, Global Funds Management & Institutional,
J.P. Morgan Asset Management
| | | | | | | | |
| | | |
| JUNE 30, 2017 | | JPMORGAN INSURANCE TRUST | | | | | 1 | |
JPMorgan Insurance Trust Global Allocation Portfolio
PORTFOLIO COMMENTARY
SIX MONTHS ENDED JUNE 30, 2017 (Unaudited)
| | | | |
| Reporting Period Return: | |
| Portfolio (Class 2 Shares)* | | | 9.01% | |
| MSCI World Index (net of foreign withholding taxes) | | | 10.66% | |
| Global Allocation Composite Benchmark | | | 7.24% | |
| |
| Net Assets as of 6/30/2017 | | $ | 58,221,867 | |
INVESTMENT OBJECTIVE**
The JPMorgan Insurance Trust Global Allocation Portfolio (the “Portfolio”) seeks to maximize long-term total return.
HOW DID THE MARKET PERFORM?
While U.S. equity markets continued to provide positive returns for the past six months, the magnitude of those gains slowed somewhat as key stock market indexes touched multiple closing highs and largely held near record territory. Steady global economic growth, continued low inflation and strong corporate earnings all served to support equity prices, both in the U.S. and elsewhere. Globally, emerging market equities generally outperformed the U.S. and other developed market equities during the reporting period.
While emerging market bonds and high-yield U.S. bonds (also known as “junk bonds”) generally provided positive returns, investment grade corporate bonds and U.S. Treasury bonds underperformed equity securities amid investor expectations for rising interest rates in the U.S.
WHAT WERE THE MAIN DRIVERS OF THE PORTFOLIO’S PERFORMANCE?
The Portfolio’s Class 2 Shares underperformed the MSCI World Index (net of foreign withholding taxes) (the “Benchmark”) and outperformed the Global Allocation Composite Benchmark (the “Composite”) for the six months ended June 30, 2017.
The Portfolio’s allocation to core fixed-income securities, which underperformed global equities during the reporting period, detracted from performance relative to the Benchmark.
The Portfolio’s performance relative to the Composite, which consists of 60% MSCI World Index and 40% Bloomberg
Barclays Global Aggregate Index, was helped by the Portfolio’s overweight allocation to international developed market and emerging market equities. The Fund’s overweight allocation to U.S. high-yield bonds (also known as “junk bonds”) and emerging market debt also contributed to performance relative to the Composite.
HOW WAS THE PORTFOLIO POSITIONED?
During the reporting period, the Portfolio’s managers maintained a constructive view on developed market equities and extended credit. While the Portfolio’s allocation to U.S. equities remained the Portfolio’s largest allocation during the reporting period, the managers decreased this exposure in favor of international developed and emerging market equities. The managers’ views on synchronized global growth and a tepid increase in U.S. interest rates also led to an increase in the Portfolio’s exposure to foreign currencies. The euro and emerging market currencies were the Portfolio’s largest non-U.S. currency allocations.
Within fixed income, the managers added to the Portfolio’s allocation to emerging market debt early in the reporting period given their expectations of stabilization in emerging markets, driven by improving fundamentals and attractive valuations. Additionally, the managers maintained a positive view on credit as expressed through high-yield bonds in the U.S., as well as non-agency mortgages.
Within core fixed income, the managers increased the Portfolio’s allocation to global government bonds. Given expectations for rising U.S. interest rates, the managers decreased the Portfolio’s exposure to longer duration debt. Generally when interest rates rise, bonds with longer duration will experience a larger decrease in price relative to shorter duration bonds.
| | | | | | |
| | | |
| 2 | | | | JPMORGAN INSURANCE TRUST | | JUNE 30, 2017 |
| | | | | | | | |
| TOP TEN LONG POSITIONS OF THE PORTFOLIO*** | |
| | 1. | | | JPMorgan High Yield Fund, Class R6 Shares | | | 17.4 | % |
| 2.
|
| | JPMorgan Emerging Markets Equity Fund, Class R6 Shares | | | 3.5 | |
| | 3. | | | JPMorgan Emerging Markets Debt Fund, Class R6 Shares | | | 3.0 | |
| 4.
|
| | Japan Government Bond, (Japan), 0.100%, 06/20/26 | | | 2.5 | |
| 5.
|
| | Australia Government Bond, (Australia), Reg. S, 5.250%, 03/15/19 | | | 2.4 | |
| | 6. | | | U.S. Treasury Note, 0.750%, 01/31/18 | | | 2.0 | |
| 7.
|
| | U.K. Treasury Gilt, (United Kingdom), Reg. S, 1.500%, 07/22/26 | | | 1.1 | |
| | 8. | | | Italy Government Bond, (Italy), 0.450%, 06/01/21 | | | 1.0 | |
| 9.
|
| | Spain Government Bond, (Spain), Reg. S, 4.000%, 04/30/20 | | | 0.9 | |
| | 10. | | | U.S. Treasury Bond, 3.750%, 08/15/41 | | | 0.8 | |
| | | | | | | | |
| TOP TEN SHORT POSITIONS OF THE PORTFOLIO**** | |
| | 1. | | | NIKE, Inc., Class B | | | 11.2 | % |
| | 2. | | | General Electric Co. | | | 8.9 | |
| | 3. | | | General Mills, Inc. | | | 7.2 | |
| | 4. | | | Harley-Davidson, Inc. | | | 6.5 | |
| | 5. | | | Anheuser-Busch InBev SA/NV, (Belgium) ADR, | | | 5.5 | |
| | 6. | | | TJX Cos., Inc. (The) | | | 4.1 | |
| | 7. | | | Kellogg Co. | | | 4.0 | |
| | 8. | | | Dean Foods Co. | | | 3.4 | |
| | 9. | | | Ross Stores, Inc. | | | 3.3 | |
| | 10. | | | Papa John’s International, Inc. | | | 3.1 | |
| | | | |
LONG POSITION PORTFOLIO COMPOSITION*** | |
| Common Stocks | | | 44.0 | % |
| Investment Companies | | | 23.8 | |
| Foreign Government Securities | | | 9.6 | |
| U.S. Treasury Obligations | | | 4.2 | |
| Asset-Backed Securities | | | 2.7 | |
| Collateralized Mortgage Obligations | | | 2.5 | |
| Corporate Bonds | | | 2.5 | |
| Others (each less than 1.0%) | | | 0.6 | |
| Short-Term Investments | | | 10.1 | |
| | | | |
SHORT POSITION PORTFOLIO COMPOSITION**** | |
| Common Stocks | | | 100.0 | % |
| * | | The return shown is based on net asset values calculated for shareholder transactions and may differ from the return shown in the financial highlights, which reflects adjustments made to the net asset values in accordance with accounting principles generally accepted in the United States of America. |
| ** | | The adviser seeks to achieve the Portfolio’s objective. There can be no guarantee it will be achieved. |
| *** | | Percentages indicated are based on total investments as of June 30, 2017. The Portfolio’s composition is subject to change. |
| **** | | Percentages indicated are based on total short investments as of June 30, 2017. The Portfolio’s composition is subject to change. |
| | | | | | | | |
| | | |
| JUNE 30, 2017 | | JPMORGAN INSURANCE TRUST | | | | | 3 | |
JPMorgan Insurance Trust Global Allocation Portfolio
PORTFOLIO COMMENTARY
SIX MONTHS ENDED JUNE 30, 2017 (Unaudited) (continued)
| | | | | | | | | | | | | | | | |
AVERAGE ANNUAL TOTAL RETURNS AS OF JUNE 30, 2017 | |
| | | | |
| | | INCEPTION DATE OF
CLASS | | | 6 MONTH* | | | 1 YEAR | | | SINCE
INCEPTION | |
CLASS 1 SHARES | | | December 9, 2014 | | | | 9.13 | % | | | 13.70 | % | | | 5.38 | % |
CLASS 2 SHARES | | | December 9, 2014 | | | | 9.01 | | | | 13.41 | | | | 5.11 | |
LIFE OF PORTFOLIO PERFORMANCE (12/9/14 TO 6/30/17)
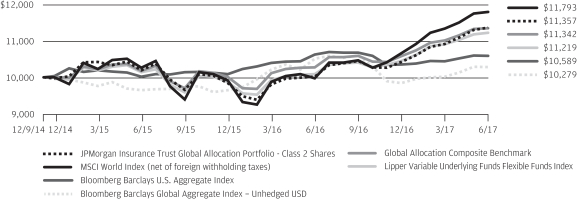
The performance quoted is past performance and is not a guarantee of future results. Mutual funds are subject to certain market risks. Investment returns and principal value of an investment will fluctuate so that an investor’s shares, when redeemed, may be worth more or less than their original cost. Current performance may be higher or lower than the performance data shown. For up-to-date month-end performance information please call 1-800-480-4111.
The Portfolio commenced operations on December 9, 2014.
The graph illustrates comparative performance for $10,000 invested in Class 2 Shares of the JPMorgan Insurance Trust Global Allocation Portfolio, the MSCI World Index (net of foreign withholding taxes), the Bloomberg Barclays U.S. Aggregate Index, the Bloomberg Barclays Global Aggregate Index, the Global Allocation Composite Benchmark and the Lipper Variable Underlying Funds Flexible Funds Index from December 9, 2014 to June 30, 2017. The performance of the Portfolio assumes reinvestment of all dividends and capital gain distributions, if any. The performance of the Indices does not reflect the deduction of expenses associated with a mutual fund and has been adjusted to reflect reinvestment of all dividends and capital gain distributions of the securities included in the benchmarks, if applicable. The performance of the Lipper Variable Underlying Funds Flexible Funds Index includes expenses associated with a mutual fund, such as investment management fees. These expenses are not identical to the expenses incurred by the Portfolio. The MSCI World Index (net of foreign withholding taxes) is a free float-adjusted market capitalization weighted index that is designed to measure the equity market performance of developed markets. The Bloomberg Barclays U.S. Aggregate Index is an
unmanaged index that represents securities that are SEC-registered, taxable, and dollar denominated. The Bloomberg Barclays Global Aggregate Index provides a broad-based measure of the global investment-grade fixed income markets. The Global Allocation Composite Benchmark is a composite benchmark comprised of unmanaged indices that includes the MSCI World Index (net of foreign withholding taxes) (60%) and the Bloomberg Barclays U.S. Aggregate Index (40%). The Lipper Variable Underlying Funds Flexible Funds Index is an index based on the total returns of certain mutual funds within the Portfolio’s designated category as determined by Lipper, Inc. Investors cannot invest directly in an index.
Portfolio performance does not reflect any charges imposed by the Policies or Eligible Plans. If these charges were included, the returns would be lower than shown. Portfolio performance may reflect the waiver of the Portfolio’s fees and reimbursement of expenses for certain periods since the inception date. Without these waivers and reimbursements, performance would have been lower.
International investing involves a greater degree of risk and increased volatility. Changes in currency exchange rates and differences in accounting and taxation policies outside the U.S. can raise or lower returns. Also, some overseas markets may not be as politically and economically stable as the United States and other nations.
The returns shown are based on net asset values calculated for shareholder transactions and may differ from the returns shown in the financial highlights, which reflect adjustments made to the net asset values in accordance with accounting principles generally accepted in the United States of America.
| | | | | | |
| | | |
| 4 | | | | JPMORGAN INSURANCE TRUST | | JUNE 30, 2017 |
JPMorgan Insurance Trust Global Allocation Portfolio
SCHEDULE OF PORTFOLIO INVESTMENTS
AS OF JUNE 30, 2017 (Unaudited)
(Amounts in U.S. Dollars, unless otherwise noted)
| | | | | | | | |
PRINCIPAL
AMOUNT | | | SECURITY DESCRIPTION | | VALUE | |
| | Long Positions — 92.9% | |
| | Asset-Backed Securities — 2.6% | |
| | | | United States — 2.6% | |
| | 49,379 | | | AMRESCO Residential Securities Corp. Mortgage Loan Trust, Series 1997-1, Class A7, 7.610%, 03/25/27 | | | 49,345 | |
| | 69,874 | | | Argent Securities, Inc. Asset-Backed Pass-Through Certificates, Series 2004-W5, Class M1, VAR, 2.116%, 04/25/34 | | | 68,816 | |
| | | | Asset-Backed Securities Corp. Home Equity Loan Trust, | | | | |
| | 91,838 | | | Series 2003-HE6, Class M2, VAR, 3.691%, 11/25/33 | | | 87,410 | |
| | 88,187 | | | Series 2004-HE3, Class M2, VAR, 2.896%, 06/25/34 | | | 83,557 | |
| | | | Bear Stearns Asset-Backed Securities Trust, | | | | |
| | 53,459 | | | Series 2003-2, Class M1, VAR, 3.016%, 03/25/43 | | | 53,229 | |
| | 41,628 | | | Series 2004-HE5, Class M2, VAR, 3.091%, 07/25/34 | | | 41,217 | |
| | | | Countrywide Asset-Backed Certificates, | | | | |
| | 56,406 | | | Series 2004-2, Class M1, VAR, 1.966%, 05/25/34 | | | 56,194 | |
| | 113,981 | | | Series 2006-19, Class 2A2, VAR, 1.376%, 03/25/37 | | | 110,361 | |
| | 59,150 | | | CWABS, Inc. Asset-Backed Certificates, Series 2004-1, Class M2, VAR, 2.041%, 03/25/34 | | | 57,560 | |
| | | | CWABS, Inc. Asset-Backed Certificates Trust, | | | | |
| | 87,212 | | | Series 2004-5, Class M3, VAR, 2.941%, 07/25/34 | | | 86,812 | |
| | 54,507 | | | Series 2004-5, Class M5, VAR, 3.541%, 05/25/34 | | | 52,512 | |
| | 65,754 | | | Home Equity Asset Trust, Series 2007-2, Class 2A2, VAR, 1.401%, 07/25/37 | | | 65,295 | |
| | 110,971 | | | Home Equity Mortgage Loan Asset-Backed Trust, Series 2006-B, Class 2A3, VAR, 1.406%, 06/25/36 | | | 107,734 | |
| | 121,391 | | | Long Beach Mortgage Loan Trust, Series 2004-4, Class M1, VAR, 2.116%, 10/25/34 | | | 116,201 | |
| | 66,375 | | | Morgan Stanley ABS Capital I, Inc. Trust, Series 2003-NC10, Class M1, VAR, 2.236%, 10/25/33 | | | 65,734 | |
| | 53,514 | | | Saxon Asset Securities Trust, Series 2003-3, Class M1, VAR, 2.191%, 12/25/33 | | | 51,479 | |
| | 39,825 | | | Structured Asset Investment Loan Trust, Series 2003-BC11, Class M1, VAR, 2.191%, 10/25/33 | | | 39,662 | |
| | | | | | | | |
PRINCIPAL
AMOUNT | | | SECURITY DESCRIPTION | | VALUE | |
| | | | | | | | |
| | | | United States — continued | | | | |
| | | | Structured Asset Securities Corp. Mortgage Loan Trust, | | | | |
| | 125,990 | | | Series 2006-BC6, Class A4, VAR, 1.386%, 01/25/37 | | | 119,119 | |
| | 69,522 | | | Series 2007-WF2, Class A1, VAR, 2.216%, 08/25/37 | | | 67,283 | |
| | 102,694 | | | Wells Fargo Home Equity Asset-Backed Securities Trust, Series 2006-3, Class A2, VAR, 1.366%, 01/25/37 | | | 101,796 | |
| | | | | | | | |
| | | | Total Asset-Backed Securities (Cost $1,415,805) | | | 1,481,316 | |
| | | | | | | | |
| | Collateralized Mortgage Obligations — 2.3% | |
| | | | United States — 2.3% | |
| | 52,303 | | | American Home Mortgage Investment Trust, Series 2005-1, Class 6A, VAR, 3.413%, 06/25/45 | | | 52,196 | |
| | 40,221 | | | Banc of America Funding Trust, Series 2006-A, Class 1A1, VAR, 3.131%, 02/20/36 | | | 39,744 | |
| | 38,259 | | | Banc of America Mortgage Trust, Series 2005-A, Class 2A2, VAR, 3.475%, 02/25/35 | | | 37,873 | |
| | 64,315 | | | Bear Stearns ALT-A Trust, Series 2005-4, Class 23A2, VAR, 3.475%, 05/25/35 | | | 64,556 | |
| | 60,824 | | | First Horizon Mortgage Pass-Through Trust, Series 2004-AR7, Class 4A1, VAR, 3.050%, 02/25/35 | | | 60,415 | |
| | 103,611 | | | GSR Mortgage Loan Trust, Series 2005-AR3, Class 1A1, VAR, 1.656%, 05/25/35 | | | 98,526 | |
| | 127,742 | | | Impac CMB Trust, Series 2004-7, Class 1A2, VAR, 2.136%, 11/25/34 | | | 119,605 | |
| | 44,806 | | | JP Morgan Mortgage Trust, Series 2005-A3, Class 4A1, VAR, 3.087%, 06/25/35 | | | 45,181 | |
| | 13,670 | | | Lehman Mortgage Trust, Series 2005-3, Class 2A3, 5.500%, 01/25/36 | | | 12,245 | |
| | 33,835 | | | Merrill Lynch Mortgage Investors Trust, Series 2007-1, Class 4A3, VAR, 5.124%, 01/25/37 | | | 32,868 | |
| | 38,877 | | | Morgan Stanley Mortgage Loan Trust, Series 2004-5AR, Class 4A, VAR, 3.491%, 07/25/34 | | | 38,144 | |
| | 76,386 | | | Opteum Mortgage Acceptance Corp. Asset-Backed Pass-Through Certificates, Series 2005-5, Class 1APT, VAR, 1.496%, 12/25/35 | | | 70,834 | |
| | 27,965 | | | Residential Asset Securitization Trust, Series 2004-A6, Class A1, 5.000%, 08/25/19 | | | 27,944 | |
| | | | WaMu Mortgage Pass-Through Certificates Trust | | | | |
| | 32,962 | | | Series 2005-AR3, Class A1, VAR, 3.033%, 03/25/35 | | | 32,273 | |
SEE NOTES TO FINANCIAL STATEMENTS.
| | | | | | | | |
| | | |
| JUNE 30, 2017 | | JPMORGAN INSURANCE TRUST | | | | | 5 | |
JPMorgan Insurance Trust Global Allocation Portfolio
SCHEDULE OF PORTFOLIO INVESTMENTS
AS OF JUNE 30, 2017 (Unaudited) (continued)
(Amounts in U.S. Dollars, unless otherwise noted)
| | | | | | | | |
PRINCIPAL
AMOUNT | | | SECURITY DESCRIPTION | | VALUE | |
| | Long Positions — continued | |
| | Collateralized Mortgage Obligations — continued | |
| | | | United States — continued | |
| | 53,927 | | | Series 2005-AR5, Class A6, VAR, 2.983%, 05/25/35 | | | 54,112 | |
| | 51,290 | | | Series 2005-AR10, Class 1A3, VAR, 2.808%, 09/25/35 | | | 52,288 | |
| | | | Wells Fargo Mortgage Backed Securities Trust | | | | |
| | 60,956 | | | Series 2004-EE, Class 2A2, VAR, 3.237%, 12/25/34 | | | 62,289 | |
| | 124,145 | | | Series 2004-W, Class A1, VAR, 3.010%, 11/25/34 | | | 124,367 | |
| | 50,644 | | | Series 2004-Z, Class 2A2, VAR, 2.999%, 12/25/34 | | | 51,347 | |
| | 28,828 | | | Series 2005-16, Class A8, 5.750%, 01/25/36 | | | 30,755 | |
| | 21,665 | | | Series 2005-AR2, Class 2A1, VAR, 3.162%, 03/25/35 | | | 21,620 | |
| | 41,662 | | | Series 2005-AR2, Class 2A2, VAR, 3.162%, 03/25/35 | | | 42,061 | |
| | 62,151 | | | Series 2005-AR3, Class 1A1, VAR, 3.311%, 03/25/35 | | | 63,548 | |
| | 38,738 | | | Series 2005-AR4, Class 2A2, VAR, 3.315%, 04/25/35 | | | 38,856 | |
| | 76,191 | | | Series 2006-AR3, Class A3, VAR, 3.253%, 03/25/36 | | | 75,123 | |
| | | | | | | | |
| | | | Total Collateralized Mortgage Obligations
(Cost $1,307,278) | | | 1,348,770 | |
| | | | | | | | |
|
| SHARES | |
| | Common Stocks — 40.9% | |
| | | | Australia — 1.3% | |
| | 9,232 | | | AMP Ltd. | | | 36,838 | |
| | 5,159 | | | Australia & New Zealand Banking Group Ltd. | | | 113,868 | |
| | 5,691 | | | BHP Billiton Ltd. | | | 101,436 | |
| | 2,007 | | | Commonwealth Bank of Australia | | | 127,678 | |
| | 330 | | | CSL Ltd. | | | 35,023 | |
| | 6,921 | | | Dexus | | | 50,389 | |
| | 12,668 | | | Goodman Group | | | 76,563 | |
| | 959 | | | Macquarie Group Ltd. | | | 65,215 | |
| | 921 | | | National Australia Bank Ltd. | | | 20,951 | |
| | 3,192 | | | Wesfarmers Ltd. | | | 98,425 | |
| | 1,138 | | | Westpac Banking Corp. | | | 26,645 | |
| | | | | | | | |
| | | | | | | 753,031 | |
| | | | | | | | |
| | | | Austria — 0.1% | |
| | 1,550 | | | Erste Group Bank AG (a) | | | 59,372 | |
| | | | | | | | |
| | | | Belgium — 0.2% | |
| | 1,218 | | | Anheuser-Busch InBev SA/NV | | | 134,526 | |
| | | | | | | | |
| | | | | | | | |
| | |
SHARES | | | SECURITY DESCRIPTION | | VALUE | |
| | | | | | | | |
| | | | Canada — 0.8% | |
| | 2,134 | | | Brookfield Asset Management, Inc., Class A | | | 83,674 | |
| | 1,532 | | | Canadian Pacific Railway Ltd. | | | 246,361 | |
| | 2,058 | | | Waste Connections, Inc. | | | 132,576 | |
| | | | | | | | |
| | | | | | | 462,611 | |
| | | | | | | | |
| | | | Denmark — 0.2% | |
| | 2,263 | | | Novo Nordisk A/S, Class B | | | 97,235 | |
| | | | | | | | |
| | | | Finland — 0.4% | |
| | 586 | | | Cargotec OYJ, Class B | | | 37,173 | |
| | 15,281 | | | Nokia OYJ | | | 93,699 | |
| | 5,132 | | | Outokumpu OYJ | | | 40,952 | |
| | 1,265 | | | Wartsila OYJ Abp | | | 74,809 | |
| | | | | | | | |
| | | | | | | 246,633 | |
| | | | | | | | |
| | | | France — 2.0% | |
| | 1,009 | | | Air Liquide SA | | | 124,708 | |
| | 1,621 | | | Airbus SE | | | 133,774 | |
| | 4,259 | | | AXA SA | | | 116,626 | |
| | 1,539 | | | BNP Paribas SA | | | 110,797 | |
| | 6,016 | | | Natixis SA | | | 40,384 | |
| | 562 | | | Pernod Ricard SA | | | 75,256 | |
| | 832 | | | Renault SA | | | 75,275 | |
| | 1,281 | | | Sanofi | | | 122,745 | |
| | 1,342 | | | Schneider Electric SE (a) | | | 103,132 | |
| | 452 | | | Sodexo SA | | | 58,417 | |
| | 2,162 | | | TOTAL SA | | | 107,337 | |
| | 3,345 | | | Vivendi SA | | | 74,485 | |
| | | | | | | | |
| | | | | | | 1,142,936 | |
| | | | | | | | |
| | | | Germany — 2.0% | |
| | 366 | | | adidas AG | | | 70,180 | |
| | 112 | | | Allianz SE (Registered) | | | 22,102 | |
| | 410 | | | BASF SE | | | 38,052 | |
| | 1,118 | | | Bayer AG (Registered) | | | 144,904 | |
| | 1,467 | | | Brenntag AG | | | 85,077 | |
| | 1,536 | | | Daimler AG (Registered) | | | 111,404 | |
| | 796 | | | Deutsche Boerse AG | | | 84,082 | |
| | 2,376 | | | Deutsche Post AG (Registered) | | | 89,191 | |
| | 4,322 | | | Deutsche Telekom AG (Registered) | | | 77,904 | |
| | 273 | | | HeidelbergCement AG | | | 26,464 | |
| | 3,101 | | | Infineon Technologies AG | | | 65,867 | |
| | 342 | | | Linde AG | | | 65,101 | |
| | 1,444 | | | SAP SE | | | 151,146 | |
| | 1,146 | | | Siemens AG (Registered) | | | 157,637 | |
| | | | | | | | |
| | | | | | | 1,189,111 | |
| | | | | | | | |
SEE NOTES TO FINANCIAL STATEMENTS.
| | | | | | |
| | | |
| 6 | | | | JPMORGAN INSURANCE TRUST | | JUNE 30, 2017 |
| | | | | | | | |
| | |
SHARES | | | SECURITY DESCRIPTION | | VALUE | |
| | Long Positions — continued | |
| | Common Stocks — continued | |
| | | | Hong Kong — 0.7% | |
| | 5,000 | | | AIA Group Ltd. | | | 36,582 | |
| | 8,052 | | | Cheung Kong Property Holdings Ltd. | | | 63,009 | |
| | 7,552 | | | CK Hutchison Holdings Ltd. | | | 94,774 | |
| | 2,400 | | | Hang Seng Bank Ltd. | | | 50,209 | |
| | 5,500 | | | Power Assets Holdings Ltd. | | | 48,549 | |
| | 7,200 | | | Sands China Ltd. | | | 32,958 | |
| | 6,000 | | | Wharf Holdings Ltd. (The) | | | 49,648 | |
| | | | | | | | |
| | | | | | | 375,729 | |
| | | | | | | | |
| | | | Ireland — 0.1% | |
| | 735 | | | Ryanair Holdings plc, ADR (a) | | | 79,093 | |
| | | | | | | | |
| | | | Israel — 0.1% | |
| | 2,276 | | | Teva Pharmaceutical Industries Ltd., ADR | | | 75,609 | |
| | | | | | | | |
| | | | Italy — 0.7% | |
| | 3,258 | | | Assicurazioni Generali SpA | | | 53,777 | |
| | 2,641 | | | Atlantia SpA | | | 74,290 | |
| | 18,189 | | | Enel SpA | | | 97,557 | |
| | 9,043 | | | Intesa Sanpaolo SpA | | | 28,764 | |
| | 69,595 | | | Telecom Italia SpA (a) | | | 64,387 | |
| | 5,667 | | | UniCredit SpA (a) | | | 106,150 | |
| | | | | | | | |
| | | | | | | 424,925 | |
| | | | | | | | |
| | | | Japan — 4.9% | |
| | 2,500 | | | Bridgestone Corp. | | | 108,079 | |
| | 100 | | | Central Japan Railway Co. | | | 16,332 | |
| | 800 | | | Daikin Industries Ltd. | | | 82,074 | |
| | 1,500 | | | Dentsu, Inc. | | | 71,960 | |
| | 2,700 | | | DMG Mori Co. Ltd. | | | 44,694 | |
| | 800 | | | East Japan Railway Co. | | | 76,637 | |
| | 16,000 | | | Fujitsu Ltd. | | | 118,340 | |
| | 15,000 | | | Hitachi Ltd. | | | 92,485 | |
| | 2,500 | | | Honda Motor Co. Ltd. | | | 68,495 | |
| | 3,700 | | | J Front Retailing Co. Ltd. | | | 57,019 | |
| | 1,700 | | | Japan Airlines Co. Ltd. | | | 52,659 | |
| | 17,600 | | | JXTG Holdings, Inc. | | | 77,009 | |
| | 8,000 | | | Kajima Corp. | | | 67,613 | |
| | 1,700 | | | KDDI Corp. | | | 44,961 | |
| | 4,100 | | | Kirin Holdings Co. Ltd. | | | 83,634 | |
| | 2,800 | | | Kyowa Hakko Kirin Co. Ltd. | | | 52,077 | |
| | 2,500 | | | Kyushu Electric Power Co., Inc. | | | 30,384 | |
| | 800 | | | Mabuchi Motor Co. Ltd. | | | 39,986 | |
| | 3,400 | | | Mazda Motor Corp. | | | 47,766 | |
| | 16,700 | | | Mitsubishi UFJ Financial Group, Inc. | | | 112,642 | |
| | 5,000 | | | Mitsui & Co. Ltd. | | | 71,579 | |
| | | | | | | | |
| | |
SHARES | | | SECURITY DESCRIPTION | | VALUE | |
| | | | | | | | |
| | | | Japan — continued | |
| | 2,000 | | | Mitsui Fudosan Co. Ltd. | | | 47,917 | |
| | 2,400 | | | MS&AD Insurance Group Holdings, Inc. | | | 80,949 | |
| | 2,800 | | | NGK Spark Plug Co. Ltd. | | | 59,977 | |
| | 400 | | | Nidec Corp. | | | 41,096 | |
| | 3,900 | | | Nippon Steel & Sumitomo Metal Corp. | | | 88,377 | |
| | 2,200 | | | Nippon Telegraph & Telephone Corp. | | | 103,849 | |
| | 3,600 | | | ORIX Corp. | | | 56,016 | |
| | 1,100 | | | Otsuka Corp. | | | 68,425 | |
| | 1,500 | | | Otsuka Holdings Co. Ltd. | | | 64,043 | |
| | 2,300 | | | Seiko Epson Corp. | | | 51,319 | |
| | 2,400 | | | Seven & i Holdings Co. Ltd. | | | 99,035 | |
| | 2,500 | | | Sony Corp. | | | 95,359 | |
| | 2,800 | | | Sumitomo Mitsui Financial Group, Inc. | | | 109,325 | |
| | 1,500 | | | Suntory Beverage & Food Ltd. | | | 69,721 | |
| | 4,000 | | | Takashimaya Co. Ltd. | | | 38,160 | |
| | 12,000 | | | Tokyo Gas Co. Ltd. | | | 62,504 | |
| | 2,800 | | | Toyota Motor Corp. | | | 147,178 | |
| | 1,300 | | | West Japan Railway Co. | | | 91,982 | |
| | 2,700 | | | Yamato Holdings Co. Ltd. | | | 54,852 | |
| | | | | | | | |
| | | | | | | 2,846,509 | |
| | | | | | | | |
| | | | Luxembourg — 0.1% | |
| | 2,713 | | | ArcelorMittal (a) | | | 61,539 | |
| | | | | | | | |
| | | | Netherlands — 1.2% | |
| | 5,439 | | | Aegon NV | | | 27,836 | |
| | 405 | | | ASML Holding NV | | | 52,793 | |
| | 953 | | | Heineken NV | | | 92,665 | |
| | 7,169 | | | ING Groep NV | | | 123,757 | |
| | 16,977 | | | Koninklijke KPN NV | | | 54,336 | |
| | 1,738 | | | Koninklijke Philips NV | | | 61,870 | |
| | 1,373 | | | NN Group NV | | | 48,718 | |
| | 4,630 | | | Royal Dutch Shell plc, Class A | | | 123,013 | |
| | 4,428 | | | Royal Dutch Shell plc, Class B | | | 118,876 | |
| | | | | | | | |
| | | | | | | 703,864 | |
| | | | | | | | |
| | | | New Zealand — 0.1% | |
| | 21,114 | | | Spark New Zealand Ltd. | | | 58,504 | |
| | | | | | | | |
| | | | Norway — 0.1% | |
| | 7,793 | | | Norsk Hydro ASA | | | 43,127 | |
| | | | | | | | |
| | | | Portugal — 0.1% | |
| | 1,955 | | | Galp Energia SGPS SA | | | 29,626 | |
| | | | | | | | |
| | | | Singapore — 0.2% | |
| | 6,400 | | | DBS Group Holdings Ltd. | | | 96,325 | |
| | | | | | | | |
SEE NOTES TO FINANCIAL STATEMENTS.
| | | | | | | | |
| | | |
| JUNE 30, 2017 | | JPMORGAN INSURANCE TRUST | | | | | 7 | |
JPMorgan Insurance Trust Global Allocation Portfolio
SCHEDULE OF PORTFOLIO INVESTMENTS
AS OF JUNE 30, 2017 (Unaudited) (continued)
(Amounts in U.S. Dollars, unless otherwise noted)
| | | | | | | | |
| | |
SHARES | | | SECURITY DESCRIPTION | | VALUE | |
| | Long Positions — continued | |
| | Common Stocks — continued | |
| | | | Spain — 0.6% | |
| | 13,173 | | | Banco Santander SA | | | 87,467 | |
| | 13,670 | | | Bankia SA | | | 66,118 | |
| | 9,926 | | | Iberdrola SA | | | 78,658 | |
| | 2,215 | | | Repsol SA | | | 33,958 | |
| | 8,866 | | | Telefonica SA | | | 91,778 | |
| | | | | | | | |
| | | | | | | 357,979 | |
| | | | | | | | |
| | | | Sweden — 0.2% | |
| | 6,929 | | | Nordea Bank AB | | | 88,251 | |
| | | | | | | | |
| | | | Switzerland — 2.0% | |
| | 1,030 | | | Cie Financiere Richemont SA (Registered) | | | 85,231 | |
| | 1,534 | | | Credit Suisse Group AG (Registered) (a) | | | 22,321 | |
| | 1,476 | | | LafargeHolcim Ltd. (a) | | | 84,773 | |
| | 3,935 | | | Nestle SA (Registered) | | | 343,201 | |
| | 2,168 | | | Novartis AG (Registered) | | | 181,086 | |
| | 893 | | | Roche Holding AG | | | 228,175 | |
| | 5,402 | | | UBS Group AG (Registered) (a) | | | 91,866 | |
| | 1,220 | | | Wolseley plc | | | 74,881 | |
| | 85 | | | Zurich Insurance Group AG | | | 24,807 | |
| | | | | | | | |
| | | | | | | 1,136,341 | |
| | | | | | | | |
| | | | United Kingdom — 3.3% | |
| | 6,576 | | | 3i Group plc | | | 77,318 | |
| | 1,278 | | | Associated British Foods plc | | | 48,906 | |
| | 1,879 | | | AstraZeneca plc | | | 125,862 | |
| | 9,548 | | | Aviva plc | | | 65,493 | |
| | 10,327 | | | Barclays plc | | | 27,313 | |
| | 5,744 | | | Barratt Developments plc | | | 42,185 | |
| | 13,380 | | | BP plc | | | 77,232 | |
| | 2,802 | | | British American Tobacco plc | | | 190,936 | |
| | 848 | | | Burberry Group plc | | | 18,350 | |
| | 26,090 | | | Centrica plc | | | 68,023 | |
| | 7,062 | | | Dixons Carphone plc | | | 26,106 | |
| | 4,808 | | | GlaxoSmithKline plc | | | 102,349 | |
| | 16,983 | | | HSBC Holdings plc | | | 157,656 | |
| | 1,424 | | | InterContinental Hotels Group plc | | | 79,080 | |
| | 21,753 | | | ITV plc | | | 51,491 | |
| | 80,160 | | | Lloyds Banking Group plc | | | 69,080 | |
| | 4,967 | | | Prudential plc | | | 114,011 | |
| | 804 | | | Reckitt Benckiser Group plc | | | 81,504 | |
| | 1,538 | | | Rio Tinto Ltd. | | | 74,745 | |
| | 1,394 | | | Rio Tinto plc | | | 59,038 | |
| | 7,251 | | | Standard Chartered plc (a) | | | 73,440 | |
| | 21,219 | | | Taylor Wimpey plc | | | 48,728 | |
| | 1,298 | | | TechnipFMC plc (a) | | | 35,106 | |
| | | | | | | | |
| | |
SHARES | | | SECURITY DESCRIPTION | | VALUE | |
| | | | | | | | |
| | | | United Kingdom — continued | |
| | 999 | | | Unilever NV, CVA | | | 55,147 | |
| | 47,742 | | | Vodafone Group plc | | | 135,585 | |
| | 1,961 | | | WPP plc | | | 41,292 | |
| | | | | | | | |
| | | | | | | 1,945,976 | |
| | | | | | | | |
| | | | United States — 19.5% | |
| | 362 | | | 3M Co. | | | 75,365 | |
| | 990 | | | Acadia Healthcare Co., Inc. (a) | | | 48,886 | |
| | 207 | | | Acuity Brands, Inc. | | | 42,079 | |
| | 397 | | | Adobe Systems, Inc. (a) | | | 56,152 | |
| | 216 | | | AdvanSix, Inc. (a) | | | 6,748 | |
| | 656 | | | Aetna, Inc. (j) | | | 99,600 | |
| | 25 | | | Alleghany Corp. (a) | | | 14,870 | |
| | 142 | | | Allergan plc | | | 34,519 | |
| | 228 | | | Alliance Data Systems Corp. | | | 58,525 | |
| | 683 | | | Allied World Assurance Co. Holdings AG | | | 36,131 | |
| | 53 | | | Alphabet, Inc., Class A (a) | | | 49,273 | |
| | 332 | | | Alphabet, Inc., Class C (a) (j) | | | 301,698 | |
| | 579 | | | Altice USA, Inc., Class A (a) | | | 18,702 | |
| | 211 | | | Amazon.com, Inc. (a) (j) | | | 204,248 | |
| | 552 | | | American Electric Power Co., Inc. | | | 38,347 | |
| | 2,267 | | | American Express Co. | | | 190,972 | |
| | 1,133 | | | American Homes 4 Rent, Class A | | | 25,572 | |
| | 1,210 | | | American International Group, Inc. | | | 75,649 | |
| | 764 | | | Amphenol Corp., Class A | | | 56,398 | |
| | 808 | | | Apache Corp. | | | 38,727 | |
| | 1,626 | | | Apple, Inc. (j) | | | 234,177 | |
| | 956 | | | Applied Materials, Inc. | | | 39,492 | |
| | 262 | | | Arista Networks, Inc. (a) | | | 39,245 | |
| | 450 | | | Arrow Electronics, Inc. (a) | | | 35,289 | |
| | 427 | | | Athene Holding Ltd., Class A (a) | | | 21,183 | |
| | 70 | | | AutoZone, Inc. (a) | | | 39,932 | |
| | 1,436 | | | Ball Corp. | | | 60,614 | |
| | 5,303 | | | Bank of America Corp. | | | 128,651 | |
| | 725 | | | Bed Bath & Beyond, Inc. | | | 22,040 | |
| | 885 | | | Berry Global Group, Inc. (a) | | | 50,454 | |
| | 476 | | | Best Buy Co., Inc. | | | 27,289 | |
| | 101 | | | BlackRock, Inc. | | | 42,663 | |
| | 691 | | | Brinker International, Inc. | | | 26,327 | |
| | 1,764 | | | Brixmor Property Group, Inc. | | | 31,540 | |
| | 256 | | | Broadcom Ltd. | | | 59,661 | |
| | 1,277 | | | Capital One Financial Corp. | | | 105,506 | |
| | 467 | | | Carlisle Cos., Inc. (j) | | | 44,552 | |
| | 580 | | | Cavium, Inc. (a) | | | 36,035 | |
| | 2,231 | | | CBRE Group, Inc., Class A (a) | | | 81,208 | |
SEE NOTES TO FINANCIAL STATEMENTS.
| | | | | | |
| | | |
| 8 | | | | JPMORGAN INSURANCE TRUST | | JUNE 30, 2017 |
| | | | | | | | |
| | |
SHARES | | | SECURITY DESCRIPTION | | VALUE | |
| | Long Positions — continued | |
| | Common Stocks — continued | |
| | | | United States — continued | |
| | 718 | | | CBS Corp. (Non-Voting), Class B | | | 45,794 | |
| | 2,988 | | | Charles Schwab Corp. (The) | | | 128,364 | |
| | 129 | | | Charter Communications, Inc., Class A (a) | | | 43,454 | |
| | 320 | | | Chubb Ltd. | | | 46,522 | |
| | 131 | | | Cigna Corp. | | | 21,928 | |
| | 1,716 | | | Cisco Systems, Inc. | | | 53,711 | |
| | 977 | | | Citigroup, Inc. | | | 65,342 | |
| | 1,533 | | | Citizens Financial Group, Inc. | | | 54,697 | |
| | 1,379 | | | Clear Channel Outdoor Holdings, Inc., Class A | | | 6,688 | |
| | 1,005 | | | CNO Financial Group, Inc. | | | 20,984 | |
| | 1,334 | | | Coca-Cola Co. (The) | | | 59,830 | |
| | 549 | | | Columbia Sportswear Co. | | | 31,875 | |
| | 466 | | | Comerica, Inc. | | | 34,130 | |
| | 536 | | | CommScope Holding Co., Inc. (a) | | | 20,384 | |
| | 283 | | | Concho Resources, Inc. (a) | | | 34,393 | |
| | 862 | | | ConocoPhillips | | | 37,894 | |
| | 641 | | | Copart, Inc. (a) | | | 20,377 | |
| | 1,908 | | | Corning, Inc. | | | 57,335 | |
| | 1,442 | | | Coty, Inc., Class A | | | 27,052 | |
| | 1,062 | | | CSX Corp. | | | 57,943 | |
| | 374 | | | CVS Health Corp. | | | 30,092 | |
| | 2,394 | | | Delta Air Lines, Inc. | | | 128,654 | |
| | 491 | | | DENTSPLY SIRONA, Inc. | | | 31,836 | |
| | 1,808 | | | DISH Network Corp., Class A (a) | | | 113,470 | |
| | 478 | | | Dover Corp. | | | 38,345 | |
| | 372 | | | Dr Pepper Snapple Group, Inc. | | | 33,893 | |
| | 233 | | | Duke Energy Corp. | | | 19,476 | |
| | 475 | | | Eagle Materials, Inc. | | | 43,899 | |
| | 803 | | | East West Bancorp, Inc. | | | 47,040 | |
| | 324 | | | EastGroup Properties, Inc. | | | 27,151 | |
| | 1,211 | | | Eaton Corp. plc | | | 94,252 | |
| | 450 | | | Ecolab, Inc. | | | 59,738 | |
| | 356 | | | Edison International | | | 27,836 | |
| | 894 | | | Electronic Arts, Inc. (a) | | | 94,514 | |
| | 168 | | | Energizer Holdings, Inc. | | | 8,067 | |
| | 953 | | | Entercom Communications Corp., Class A (j) | | | 9,864 | |
| | 327 | | | EOG Resources, Inc. | | | 29,600 | |
| | 685 | | | EQT Corp. | | | 40,134 | |
| | 266 | | | Equifax, Inc. | | | 36,554 | |
| | 355 | | | Eversource Energy | | | 21,552 | |
| | 1,159 | | | Evolent Health, Inc., Class A (a) | | | 29,381 | |
| | 923 | | | Exact Sciences Corp. (a) | | | 32,647 | |
| | 313 | | | Expedia, Inc. | | | 46,621 | |
| | 1,153 | | | Exxon Mobil Corp. (j) | | | 93,082 | |
| | | | | | | | |
| | |
SHARES | | | SECURITY DESCRIPTION | | VALUE | |
| | | | | | | | |
| | | | United States — continued | |
| | 1,232 | | | Facebook, Inc., Class A (a) | | | 186,007 | |
| | 478 | | | Fidelity National Information Services, Inc. | | | 40,821 | |
| | 1,267 | | | Fifth Third Bancorp | | | 32,891 | |
| | 493 | | | First Republic Bank | | | 49,349 | |
| | 518 | | | Fiserv, Inc. (a) | | | 63,372 | |
| | 756 | | | Fortune Brands Home & Security, Inc. | | | 49,321 | |
| | 879 | | | Gap, Inc. (The) | | | 19,329 | |
| | 407 | | | Genuine Parts Co. | | | 37,753 | |
| | 584 | | | Gilead Sciences, Inc. | | | 41,336 | |
| | 647 | | | Global Payments, Inc. | | | 58,437 | |
| | 1,322 | | | GoDaddy, Inc., Class A (a) | | | 56,079 | |
| | 2,012 | | | Graphic Packaging Holding Co. | | | 27,725 | |
| | 391 | | | Guidewire Software, Inc. (a) | | | 26,866 | |
| | 492 | | | Hanesbrands, Inc. | | | 11,395 | |
| | 679 | | | Hartford Financial Services Group, Inc. (The) | | | 35,695 | |
| | 474 | | | HCA Healthcare, Inc. (a) | | | 41,333 | |
| | 1,881 | | | Hewlett Packard Enterprise Co. | | | 31,206 | |
| | 765 | | | Hilton Grand Vacations, Inc. (a) | | | 27,586 | |
| | 1,398 | | | Hilton Worldwide Holdings, Inc. | | | 86,466 | |
| | 180 | | | Home Depot, Inc. (The) | | | 27,612 | |
| | 427 | | | Honeywell International, Inc. | | | 56,915 | |
| | 543 | | | Humana, Inc. | | | 130,657 | |
| | 234 | | | Illinois Tool Works, Inc. | | | 33,521 | |
| | 232 | | | Illumina, Inc. (a) | | | 40,257 | |
| | 27 | | | Intuitive Surgical, Inc. (a) | | | 25,255 | |
| | 805 | | | Invesco Ltd. | | | 28,328 | |
| | 289 | | | Jazz Pharmaceuticals plc (a) | | | 44,940 | |
| | 255 | | | John Bean Technologies Corp. | | | 24,990 | |
| | 641 | | | Johnson & Johnson | | | 84,798 | |
| | 612 | | | KapStone Paper and Packaging Corp. | | | 12,626 | |
| | 1,760 | | | Kimco Realty Corp. | | | 32,296 | |
| | 2,086 | | | Kinder Morgan, Inc. | | | 39,968 | |
| | 470 | | | Kite Pharma, Inc. (a) | | | 48,725 | |
| | 144 | | | KLA-Tencor Corp. | | | 13,177 | |
| | 1,040 | | | Kohl’s Corp. | | | 40,217 | |
| | 1,211 | | | Kroger Co. (The) | | | 28,241 | |
| | 1,912 | | | La Quinta Holdings, Inc. (a) | | | 28,240 | |
| | 206 | | | Lam Research Corp. | | | 29,135 | |
| | 467 | | | Lazard Ltd., Class A | | | 21,636 | |
| | 337 | | | Lennox International, Inc. | | | 61,887 | |
| | 1,171 | | | LKQ Corp. (a) | | | 38,584 | |
| | 1,497 | | | Loews Corp. (j) | | | 70,075 | |
| | 300 | | | M&T Bank Corp. | | | 48,585 | |
| | 791 | | | Marathon Petroleum Corp. | | | 41,393 | |
| | 149 | | | Marsh & McLennan Cos., Inc. | | | 11,616 | |
SEE NOTES TO FINANCIAL STATEMENTS.
| | | | | | | | |
| | | |
| JUNE 30, 2017 | | JPMORGAN INSURANCE TRUST | | | | | 9 | |
JPMorgan Insurance Trust Global Allocation Portfolio
SCHEDULE OF PORTFOLIO INVESTMENTS
AS OF JUNE 30, 2017 (Unaudited) (continued)
(Amounts in U.S. Dollars, unless otherwise noted)
| | | | | | | | |
| | |
SHARES | | | SECURITY DESCRIPTION | | VALUE | |
| | Long Positions — continued | |
| | Common Stocks — continued | |
| | | | United States — continued | |
| | 180 | | | Martin Marietta Materials, Inc. | | | 40,064 | |
| | 970 | | | Mastercard, Inc., Class A | | | 117,807 | |
| | 1,143 | | | Merck & Co., Inc. | | | 73,255 | |
| | 2,457 | | | Microsoft Corp. (j) | | | 169,361 | |
| | 297 | | | Mid-America Apartment Communities, Inc. | | | 31,298 | |
| | 199 | | | Middleby Corp. (The) (a) | | | 24,180 | |
| | 979 | | | Mohawk Industries, Inc. (a) (j) | | | 236,615 | |
| | 418 | | | Molson Coors Brewing Co., Class B | | | 36,090 | |
| | 565 | | | Monster Beverage Corp. (a) | | | 28,069 | |
| | 1,803 | | | Morgan Stanley | | | 80,342 | |
| | 340 | | | Murphy USA, Inc. (a) | | | 25,197 | |
| | 428 | | | Nasdaq, Inc. | | | 30,598 | |
| | 290 | | | Netflix, Inc. (a) | | | 43,329 | |
| | 2,770 | | | Newell Brands, Inc. | | | 148,527 | |
| | 340 | | | Nexstar Media Group, Inc., Class A | | | 20,332 | |
| | 471 | | | NextEra Energy, Inc. | | | 66,001 | |
| | 226 | | | Nordstrom, Inc. | | | 10,810 | |
| | 257 | | | Northern Trust Corp. | | | 24,983 | |
| | 98 | | | Northrop Grumman Corp. | | | 25,158 | |
| | 693 | | | Norwegian Cruise Line Holdings Ltd. (a) | | | 37,623 | |
| | 425 | | | NVIDIA Corp. | | | 61,438 | |
| | 358 | | | Occidental Petroleum Corp. | | | 21,433 | |
| | 785 | | | Old Dominion Freight Line, Inc. | | | 74,763 | |
| | 372 | | | Oshkosh Corp. | | | 25,623 | |
| | 1,287 | | | Outfront Media, Inc. | | | 29,755 | |
| | 197 | | | Palo Alto Networks, Inc. (a) | | | 26,361 | |
| | 446 | | | Park Hotels & Resorts, Inc. | | | 12,024 | |
| | 217 | | | Parker-Hannifin Corp. | | | 34,681 | |
| | 1,715 | | | PayPal Holdings, Inc. (a) | | | 92,044 | |
| | 1,183 | | | PBF Energy, Inc., Class A | | | 26,334 | |
| | 219 | | | PepsiCo, Inc. | | | 25,292 | |
| | 3,417 | | | Pfizer, Inc. | | | 114,777 | |
| | 368 | | | Philip Morris International, Inc. | | | 43,222 | |
| | 526 | | | Phillips 66 | | | 43,495 | |
| | 605 | | | PNC Financial Services Group, Inc. (The) | | | 75,546 | |
| | 445 | | | Post Holdings, Inc. (a) | | | 34,554 | |
| | 45 | | | Priceline Group, Inc. (The) (a) | | | 84,173 | |
| | 581 | | | Procter & Gamble Co. (The) | | | 50,634 | |
| | 229 | | | Prudential Financial, Inc. | | | 24,764 | |
| | 555 | | | QUALCOMM, Inc. | | | 30,647 | |
| | 1,069 | | | Rayonier, Inc. | | | 30,755 | |
| | 154 | | | Raytheon Co. | | | 24,868 | |
| | 299 | | | Red Rock Resorts, Inc., Class A | | | 7,041 | |
| | 509 | | | Revance Therapeutics, Inc. (a) | | | 13,438 | |
| | | | | | | | |
| | |
SHARES | | | SECURITY DESCRIPTION | | VALUE | |
| | | | | | | | |
| | | | United States — continued | |
| | 926 | | | Robert Half International, Inc. | | | 44,383 | |
| | 360 | | | Royal Caribbean Cruises Ltd. | | | 39,323 | |
| | 444 | | | S&P Global, Inc. | | | 64,820 | |
| | 134 | | | Sage Therapeutics, Inc. (a) | | | 10,672 | |
| | 646 | | | salesforce.com, Inc. (a) | | | 55,944 | |
| | 201 | | | Sempra Energy | | | 22,663 | |
| | 591 | | | ServiceNow, Inc. (a) | | | 62,646 | |
| | 2,162 | | | Shire plc | | | 119,210 | |
| | 446 | | | Sinclair Broadcast Group, Inc., Class A | | | 14,673 | |
| | 1,149 | | | Snap, Inc., Class A (a) | | | 20,418 | |
| | 1,092 | | | Southwest Airlines Co. | | | 67,857 | |
| | 364 | | | Spark Therapeutics, Inc. (a) | | | 21,745 | |
| | 675 | | | Splunk, Inc. (a) | | | 38,401 | |
| | 426 | | | Stanley Black & Decker, Inc. | | | 59,951 | |
| | 777 | | | Starbucks Corp. | | | 45,307 | |
| | 1,033 | | | SunTrust Banks, Inc. | | | 58,592 | |
| | 838 | | | T Rowe Price Group, Inc. | | | 62,188 | |
| | 374 | | | Take-Two Interactive Software, Inc. (a) | | | 27,444 | |
| | 453 | | | Teladoc, Inc. (a) | | | 15,719 | |
| | 97 | | | Tesla, Inc. (a) | | | 35,076 | |
| | 535 | | | Texas Instruments, Inc. | | | 41,158 | |
| | 2,086 | | | TherapeuticsMD, Inc. (a) | | | 10,993 | |
| | 439 | | | Thermo Fisher Scientific, Inc. | | | 76,592 | |
| | 260 | | | Tiffany & Co. | | | 24,406 | |
| | 1,064 | | | Time Warner, Inc. | | | 106,836 | |
| | 396 | | | Travelers Cos., Inc. (The) | | | 50,106 | |
| | 435 | | | TreeHouse Foods, Inc. (a) | | | 35,535 | |
| | 98 | | | Ulta Beauty, Inc. (a) | | | 28,159 | |
| | 505 | | | Union Pacific Corp. | | | 55,000 | |
| | 491 | | | United Technologies Corp. | | | 59,956 | |
| | 1,730 | | | UnitedHealth Group, Inc. (j) | | | 320,777 | |
| | 643 | | | Unum Group | | | 29,983 | |
| | 1,026 | | | US Bancorp | | | 53,270 | |
| | 917 | | | Vantiv, Inc., Class A (a) | | | 58,083 | |
| | 480 | | | Veeva Systems, Inc., Class A (a) | | | 29,429 | |
| | 824 | | | Verizon Communications, Inc. | | | 36,800 | |
| | 394 | | | Vertex Pharmaceuticals, Inc. (a) | | | 50,775 | |
| | 1,316 | | | Visa, Inc., Class A | | | 123,414 | |
| | 294 | | | Vulcan Materials Co. | | | 37,244 | |
| | 457 | | | VWR Corp. (a) | | | 15,086 | |
| | 362 | | | WABCO Holdings, Inc. (a) | | | 46,159 | |
| | 356 | | | Walgreens Boots Alliance, Inc. | | | 27,878 | |
| | 421 | | | Wayfair, Inc., Class A (a) | | | 32,366 | |
| | 3,120 | | | Wells Fargo & Co. | | | 172,879 | |
| | 814 | | | WestRock Co. | | | 46,121 | |
SEE NOTES TO FINANCIAL STATEMENTS.
| | | | | | |
| | | |
| 10 | | | | JPMORGAN INSURANCE TRUST | | JUNE 30, 2017 |
| | | | | | | | |
| | |
SHARES | | | SECURITY DESCRIPTION | | VALUE | |
| | Long Positions — continued | |
| | Common Stocks — continued | |
| | | | United States — continued | |
| | 468 | | | Weyerhaeuser Co. | | | 15,678 | |
| | 828 | | | Xcel Energy, Inc. | | | 37,989 | |
| | | | | | | | |
| | | | | | | 11,378,360 | |
| | | | | | | | |
| | | | Total Common Stocks
(Cost $20,553,025) | | | 23,787,212 | |
| | | | | | | | |
PRINCIPAL
AMOUNT | | | | | | |
| | Corporate Bonds — 2.3% | |
| | | | Belgium — 0.0% (g) | |
| | 20,000 | | | Anheuser-Busch InBev Finance, Inc., 3.650%, 02/01/26 | | | 20,607 | |
| | | | | | | | |
| | | | Canada — 0.1% | |
| | 25,000 | | | Cenovus Energy, Inc., 5.400%, 06/15/47 (e) | | | 23,364 | |
| | 10,000 | | | Emera US Finance LP, 4.750%, 06/15/46 | | | 10,568 | |
| | 25,000 | | | TransCanada PipeLines Ltd., 4.625%, 03/01/34 | | | 27,462 | |
| | | | | | | | |
| | | | | | | 61,394 | |
| | | | | | | | |
| | | | Israel — 0.1% | |
| | 25,000 | | | Teva Pharmaceutical Finance Netherlands III BV, 4.100%, 10/01/46 | | | 23,046 | |
| | | | | | | | |
| | | | United States — 2.1% | |
| | 30,000 | | | 21st Century Fox America, Inc., 4.950%, 10/15/45 | | | 32,519 | |
| | 10,000 | | | Abbott Laboratories, 4.750%, 11/30/36 | | | 10,897 | |
| | 30,000 | | | AbbVie, Inc., 4.450%, 05/14/46 | | | 31,010 | |
| | | | Allergan Funding SCS, | | | | |
| | 15,000 | | | 4.550%, 03/15/35 | | | 16,023 | |
| | 4,000 | | | 4.750%, 03/15/45 | | | 4,324 | |
| | 25,000 | | | Altria Group, Inc., 3.875%, 09/16/46 | | | 24,321 | |
| | | | American International Group, Inc., | | | | |
| | 20,000 | | | 3.875%, 01/15/35 | | | 19,409 | |
| | 15,000 | | | 4.800%, 07/10/45 | | | 16,031 | |
| | 20,000 | | | Amgen, Inc., 4.400%, 05/01/45 | | | 20,572 | |
| | | | AT&T, Inc., | | | | |
| | 20,000 | | | 4.350%, 06/15/45 | | | 18,588 | |
| | 10,000 | | | 4.500%, 03/09/48 | | | 9,427 | |
| | 10,000 | | | 5.250%, 03/01/37 | | | 10,665 | |
| | 10,000 | | | AvalonBay Communities, Inc., 4.150%, 07/01/47 | | | 10,122 | |
| | | | Bank of America Corp., | | | | |
| | 10,000 | | | 4.875%, 04/01/44 | | | 11,211 | |
| | 25,000 | | | VAR, 3.824%, 01/20/28 | | | 25,437 | |
| | 15,000 | | | Becton Dickinson and Co., 4.669%, 06/06/47 | | | 15,451 | |
| | | | | | | | |
PRINCIPAL
AMOUNT | | | SECURITY DESCRIPTION | | VALUE | |
| | | | | | | | |
| | | | United States — continued | |
| | 15,000 | | | Brighthouse Financial, Inc., 4.700%, 06/22/47 (e) | | | 14,747 | |
| | 10,000 | | | CBS Corp., 4.600%, 01/15/45 | | | 10,273 | |
| | | | Charter Communications Operating LLC, | | | | |
| | 20,000 | | | 6.384%, 10/23/35 | | | 23,730 | |
| | 15,000 | | | 6.484%, 10/23/45 | | | 18,026 | |
| | | | Citigroup, Inc., | | | | |
| | 6,000 | | | 4.650%, 07/30/45 | | | 6,534 | |
| | 25,000 | | | VAR, 3.887%, 01/10/28 | | | 25,409 | |
| | 10,000 | | | Columbia Pipeline Group, Inc., 5.800%, 06/01/45 | | | 11,912 | |
| | | | Comcast Corp., | | | | |
| | 10,000 | | | 3.400%, 07/15/46 | | | 9,120 | |
| | 5,000 | | | 4.600%, 08/15/45 | | | 5,460 | |
| | 5,000 | | | 4.750%, 03/01/44 | | | 5,572 | |
| | 15,000 | | | Diamond 1 Finance Corp., 8.350%,
07/15/46 (e) | | | 19,380 | |
| | 15,000 | | | Dominion Energy Gas Holdings LLC, 4.600%, 12/15/44 | | | 15,695 | |
| | 10,000 | | | Energy Transfer LP, 5.150%, 02/01/43 | | | 9,503 | |
| | 35,000 | | | Enterprise Products Operating LLC, 4.900%, 05/15/46 | | | 37,689 | |
| | 20,000 | | | Exelon Corp., 4.450%, 04/15/46 | | | 20,700 | |
| | 20,000 | | | Express Scripts Holding Co., 4.800%, 07/15/46 | | | 20,371 | |
| | | | Ford Motor Co., | | | | |
| | 35,000 | | | 4.750%, 01/15/43 | | | 33,827 | |
| | 10,000 | | | 5.291%, 12/08/46 | | | 10,277 | |
| | | | General Motors Co., | | | | |
| | 15,000 | | | 5.000%, 04/01/35 | | | 15,052 | |
| | 30,000 | | | 5.200%, 04/01/45 | | | 29,470 | |
| | | | Gilead Sciences, Inc., | | | | |
| | 20,000 | | | 4.150%, 03/01/47 | | | 20,141 | |
| | 15,000 | | | 4.600%, 09/01/35 | | | 16,101 | |
| | | | Goldman Sachs Group, Inc. (The), | | | | |
| | 10,000 | | | 3.500%, 11/16/26 | | | 9,948 | |
| | 15,000 | | | 3.850%, 01/26/27 | | | 15,261 | |
| | 10,000 | | | 4.750%, 10/21/45 | | | 11,080 | |
| | 15,000 | | | Great Plains Energy, Inc., 4.850%, 04/01/47 | | | 15,456 | |
| | 20,000 | | | Halliburton Co., 5.000%, 11/15/45 | | | 21,308 | |
| | 15,000 | | | Harris Corp., 5.054%, 04/27/45 | | | 16,858 | |
| | 20,000 | | | Hess Corp., 5.800%, 04/01/47 | | | 20,191 | |
| | 5,000 | | | Intel Corp., 4.100%, 05/19/46 | | | 5,190 | |
| | | | Kraft Heinz Foods Co., | | | | |
| | 40,000 | | | 4.375%, 06/01/46 | | | 38,984 | |
| �� | 10,000 | | | 5.000%, 06/04/42 | | | 10,570 | |
SEE NOTES TO FINANCIAL STATEMENTS.
| | | | | | | | |
| | | |
| JUNE 30, 2017 | | JPMORGAN INSURANCE TRUST | | | | | 11 | |
JPMorgan Insurance Trust Global Allocation Portfolio
SCHEDULE OF PORTFOLIO INVESTMENTS
AS OF JUNE 30, 2017 (Unaudited) (continued)
(Amounts in U.S. Dollars, unless otherwise noted)
| | | | | | | | |
PRINCIPAL
AMOUNT | | | SECURITY DESCRIPTION | | VALUE | |
| | Long Positions — continued | |
| | Corporate Bonds — continued | |
| | | | United States — continued | |
| | 25,000 | | | Kroger Co. (The), 3.875%, 10/15/46 | | | 22,060 | |
| | 10,000 | | | Marathon Petroleum Corp., 4.750%, 09/15/44 | | | 9,513 | |
| | 20,000 | | | MetLife, Inc., 4.600%, 05/13/46 | | | 22,038 | |
| | 10,000 | | | Microsoft Corp., 4.100%, 02/06/37 | | | 10,784 | |
| | | | Morgan Stanley, | | | | |
| | 10,000 | | | 3.625%, 01/20/27 | | | 10,064 | |
| | 25,000 | | | 4.300%, 01/27/45 | | | 25,890 | |
| | 10,000 | | | MPLX LP, 5.200%, 03/01/47 | | | 10,256 | |
| | 20,000 | | | Mylan NV, 5.250%, 06/15/46 | | | 21,908 | |
| | 17,000 | | | Noble Energy, Inc., 5.050%, 11/15/44 | | | 17,482 | |
| | 20,000 | | | ONEOK Partners LP, 6.200%, 09/15/43 | | | 23,001 | |
| | 15,000 | | | Oracle Corp., 4.000%, 07/15/46 | | | 15,171 | |
| | 20,000 | | | Owens Corning, 4.300%, 07/15/47 | | | 19,242 | |
| | 10,000 | | | Philip Morris International, Inc., 4.875%, 11/15/43 | | | 11,188 | |
| | 25,000 | | | Phillips 66, 4.875%, 11/15/44 | | | 26,817 | |
| | 5,000 | | | Phillips 66 Partners LP, 4.900%, 10/01/46 | | | 4,938 | |
| | 20,000 | | | Prudential Financial, Inc., 4.600%, 05/15/44 | | | 21,881 | |
| | 20,000 | | | Reynolds American, Inc., 4.450%, 06/12/25 | | | 21,471 | |
| | 15,000 | | | Southern Power Co., Series F, 4.950%, 12/15/46 | | | 15,511 | |
| | 15,000 | | | Spectra Energy Partners LP, 4.500%, 03/15/45 | | | 14,804 | |
| | 20,000 | | | Sunoco Logistics Partners Operations LP, 5.350%, 05/15/45 | | | 19,628 | |
| | | | Verizon Communications, Inc., | | | | |
| | 30,000 | | | 4.125%, 08/15/46 | | | 26,738 | |
| | 10,000 | | | 4.272%, 01/15/36 | | | 9,662 | |
| | 15,000 | | | 5.012%, 04/15/49 (e) | | | 15,170 | |
| | 10,000 | | | Viacom, Inc., 4.375%, 03/15/43 | | | 8,901 | |
| | 10,000 | | | Vulcan Materials Co., 4.500%, 06/15/47 | | | 10,090 | |
| | | | | | | | |
| | | | | | | 1,234,050 | |
| | | | | | | | |
| | | | Total Corporate Bonds
(Cost $1,342,059) | | | 1,339,097 | |
| | | | | | | | |
| | Foreign Government Securities — 8.9% | |
| | | | Australia — 2.2% | |
| | AUD 1,589,000 | | | Australia Government Bond, Reg. S, 5.250%, 03/15/19 | | | 1,292,741 | |
| | | | | | | | |
| | | | Canada — 0.7% | |
| | CAD 478,000 | | | Canada Government Bond, 1.750%, 03/01/19 | | | 372,687 | |
| | | | | | | | |
| | | | | | | | |
PRINCIPAL
AMOUNT | | | SECURITY DESCRIPTION | | VALUE | |
| | | | | | | | |
| | | | France — 0.6% | |
| | EUR 221,000 | | | France Government Bond, Reg. S, 3.250%, 05/25/45 | | | 335,223 | |
| | | | | | | | |
| | | | Italy — 1.3% | |
| | | | Italy Government Bond, | | | | |
| | EUR 470,000 | | | 0.450%, 06/01/21 | | | 535,923 | |
| | EUR 109,000 | | | Reg. S, 3.500%, 03/01/30 (e) | | | 138,059 | |
| | EUR 66,000 | | | Reg. S, 4.750%, 09/01/44 (e) | | | 95,270 | |
| | | | | | | | |
| | | | | | | 769,252 | |
| | | | | | | | |
| | | | Japan — 2.3% | |
| | JPY 150,400,000 | | | Japan Government Bond, 0.100%, 06/20/26 | | | 1,342,669 | |
| | | | | | | | |
| | | | Spain — 0.8% | |
| | EUR 376,000 | | | Spain Government Bond, Reg. S, 4.000%, 04/30/20 (e) | | | 479,673 | |
| | | | | | | | |
| | | | United Kingdom — 1.0% | |
| | GBP 435,000 | | | U.K. Treasury Gilt, Reg. S, 1.500%, 07/22/26 | | | 581,670 | |
| | | | | | | | |
| | | | Total Foreign Government Securities
(Cost $5,156,028) | | | 5,173,915 | |
| | | | | | | | |
| | |
| SHARES | | | | | | |
| | Investment Companies — 22.1% (b) | |
| | 196,077 | | | JPMorgan Emerging Markets Debt Fund, Class R6 Shares | | | 1,613,716 | |
| | 72,396 | | | JPMorgan Emerging Markets Equity Fund, Class R6 Shares | | | 1,867,097 | |
| | 1,261,635 | | | JPMorgan High Yield Fund, Class R6 Shares | | | 9,386,565 | |
| | | | | | | | |
| | | | Total Investment Companies
(Cost $11,790,622) | | | 12,867,378 | |
| | | | | | | | |
| | |
NUMBER OF
CONTRACTS | | | | | | |
| | Options Purchased — 0.3% | |
| | | | Call Options Purchased — 0.3% | |
| | EUR 117 | | | Euro STOXX 50 Index, expiring 09/15/17 at EUR 3,650.00, European Style (a) | | | 22,022 | |
| | 846 | | | iShares MSCI Emerging Markets Fund, expiring 09/15/17 at $42.00, American Style (a) | | | 72,756 | |
| | 9 | | | Newell Brands Inc., expiring 01/19/18 at $50.00, American Style (a) | | | 5,355 | |
| | 26 | | | S&P 500 Index, expiring 09/15/17 at $2,450.00, European Style (a) | | | 68,900 | |
| | | | | | | | |
| | | | Total Options Purchased
(Cost $341,137) | | | 169,033 | |
| | | | | | | | |
SEE NOTES TO FINANCIAL STATEMENTS.
| | | | | | |
| | | |
| 12 | | | | JPMORGAN INSURANCE TRUST | | JUNE 30, 2017 |
| | | | | | | | |
| | |
| SHARES | | | SECURITY DESCRIPTION | | VALUE | |
| | Long Positions — continued | |
| | Preferred Stocks — 0.2% | |
| | | | Germany — 0.2% | |
| | 770 | | | Henkel AG & Co. KGaA (Preference) | | | 106,178 | |
| | 188 | | | Volkswagen AG (Preference) | | | 28,718 | |
| | | | | | | | |
| | | | Total Preferred Stocks
(Cost $118,496) | | | 134,896 | |
| | | | | | | | |
| | |
NUMBER OF
RIGHTS | | | | | | |
| | Rights — 0.0% | | | | | | | |
| | | | United States — 0.0% | |
| | 902 | | | Media General, Inc. CVR (a)
(Cost $—) | | | — | |
| | | | | | | | |
| | |
PRINCIPAL
AMOUNT | | | | | | |
| | U.S. Treasury Obligations — 3.9% | |
| | | | U.S. Treasury Bond, | | | | |
| | 307,400 | | | 3.625%, 08/15/43 | | | 354,074 | |
| | 369,300 | | | 3.750%, 08/15/41 | | | 432,831 | |
| | 66,500 | | | 5.375%, 02/15/31 | | | 89,435 | |
| | 75,300 | | | 6.125%, 08/15/29 | | | 104,952 | |
| | | | U.S. Treasury Note, | | | | |
| | 1,100,000 | | | 0.750%, 01/31/18 (k) | | | 1,097,285 | |
| | 200,500 | | | 2.125%, 05/15/25 | | | 199,216 | |
| | | | | | | | |
| | | | Total U.S. Treasury Obligations
(Cost $2,316,468) | | | 2,277,793 | |
| | | | | | | | |
| | Short-Term Investments — 9.4% | |
| | | | Foreign Government Treasury Bills — 5.3% | |
| | | | Canadian Treasury Bill, | | | | |
| | CAD 801,000 | | | 0.588%, 10/19/17 (n) | | | 616,377 | |
| | CAD 801,000 | | | 0.599%, 11/16/17 (n) | | | 615,982 | |
| | CAD 801,000 | | | 0.609%, 12/14/17 (n) | | | 615,556 | |
| | CAD 1,588,000 | | | 0.786%, 08/24/17 (n) | | | 1,223,328 | |
| | | | | | | | |
| | | | Total Foreign Government Treasury Bills (Cost $3,013,143) | | | 3,071,243 | |
| | | | | | | | |
| SHARES | | | | | | |
| | | | Investment Company — 4.1% | |
| | 2,406,506 | | | JPMorgan U.S. Government Money Market Fund, Institutional Class Shares, 0.840% (b) (l)
(Cost $2,406,506) | | | 2,406,506 | |
| | | | | | | | |
| | | | Total Short-Term Investments (Cost $5,419,649) | | | 5,477,749 | |
| | | | | | | | |
| | | | Total Investments, Before Short Positions — 92.9%
(Cost $49,760,567) | | | 54,057,159 | |
| | | | Other Assets in Excess of
Liabilities — 7.1% | | | 4,164,708 | |
| | | | | | | | |
| | | | NET ASSETS — 100.0% | | | 58,221,867 | |
| | | | | | | | |
| | | | | | | | |
| SHARES | | | SECURITY DESCRIPTION | | VALUE | |
| | Short Positions — 1.4% | |
| | Common Stocks — 1.4% | |
| | | | Belgium — 0.1% | |
| | 394 | | | Anheuser-Busch InBev SA/NV, ADR | | | 43,482 | |
| | | | | | | | |
| | | | Canada — 0.0% (g) | |
| | 366 | | | Enbridge, Inc. | | | 14,570 | |
| | | | | | | | |
| | | | Sweden — 0.0% (g) | |
| | 33 | | | Autoliv, Inc. | | | 3,623 | |
| | | | | | | | |
| | | | United States — 1.3% | |
| | 45 | | | Aflac, Inc. | | | 3,496 | |
| | 84 | | | Air Lease Corp. | | | 3,138 | |
| | 26 | | | Air Products & Chemicals, Inc. | | | 3,720 | |
| | 21 | | | Amgen, Inc. | | | 3,617 | |
| | 107 | | | Aqua America, Inc. | | | 3,563 | |
| | 71 | | | Bed Bath & Beyond, Inc. | | | 2,158 | |
| | 43 | | | Cardinal Health, Inc. | | | 3,351 | |
| | 38 | | | Carter’s, Inc. | | | 3,380 | |
| | 41 | | | CH Robinson Worldwide, Inc. | | | 2,816 | |
| | 71 | | | Church & Dwight Co., Inc. | | | 3,683 | |
| | 111 | | | Cisco Systems, Inc. | | | 3,474 | |
| | 28 | | | CME Group, Inc. | | | 3,507 | |
| | 73 | | | ConocoPhillips | | | 3,209 | |
| | 48 | | | Consolidated Edison, Inc. | | | 3,879 | |
| | 215 | | | Coty, Inc., Class A | | | 4,033 | |
| | 37 | | | Crown Castle International Corp. | | | 3,707 | |
| | 160 | | | CVS Health Corp. | | | 12,874 | |
| | 1,585 | | | Dean Foods Co. | | | 26,945 | |
| | 326 | | | Discovery Communications, Inc., Class A (a) | | | 8,421 | |
| | 51 | | | Dominion Energy, Inc. | | | 3,908 | |
| | 88 | | | Domtar Corp. | | | 3,381 | |
| | 86 | | | Donaldson Co., Inc. | | | 3,916 | |
| | 44 | | | Duke Energy Corp. | | | 3,678 | |
| | 62 | | | Emerson Electric Co. | | | 3,696 | |
| | 26 | | | Equifax, Inc. | | | 3,573 | |
| | 2,592 | | | General Electric Co. | | | 70,010 | |
| | 1,030 | | | General Mills, Inc. | | | 57,062 | |
| | 64 | | | Greif, Inc., Class A | | | 3,570 | |
| | 958 | | | Harley-Davidson, Inc. | | | 51,751 | |
| | 274 | | | Intel Corp. | | | 9,245 | |
| | 73 | | | International Paper Co. | | | 4,133 | |
| | 136 | | | Interpublic Group of Cos., Inc. (The) | | | 3,346 | |
| | 34 | | | JB Hunt Transport Services, Inc. | | | 3,107 | |
| | 129 | | | Juniper Networks, Inc. | | | 3,596 | |
| | 450 | | | Kellogg Co. | | | 31,257 | |
| | 146 | | | Kimberly-Clark Corp. | | | 18,850 | |
| | 181 | | | Kohl’s Corp. | | | 6,999 | |
SEE NOTES TO FINANCIAL STATEMENTS.
| | | | | | | | |
| | | |
| JUNE 30, 2017 | | JPMORGAN INSURANCE TRUST | | | | | 13 | |
JPMorgan Insurance Trust Global Allocation Portfolio
SCHEDULE OF PORTFOLIO INVESTMENTS
AS OF JUNE 30, 2017 (Unaudited) (continued)
(Amounts in U.S. Dollars, unless otherwise noted)
| | | | | | | | |
| SHARES | | | SECURITY DESCRIPTION | | VALUE | |
| | Short Positions — continued | |
| | Common Stocks — continued | |
| | | | United States — continued | |
| | 158 | | | Macy’s, Inc. | | | 3,672 | |
| | 41 | | | Medtronic plc | | | 3,639 | |
| | 130 | | | Molson Coors Brewing Co., Class B | | | 11,224 | |
| | 120 | | | Murphy Oil Corp. | | | 3,076 | |
| | 46 | | | Nasdaq, Inc. | | | 3,289 | |
| | 62 | | | National Fuel Gas Co. | | | 3,462 | |
| | 82 | | | National Oilwell Varco, Inc. | | | 2,701 | |
| | 81 | | | NetApp, Inc. | | | 3,244 | |
| | 1,498 | | | NIKE, Inc., Class B | | | 88,382 | |
| | 72 | | | Nordstrom, Inc. | | | 3,444 | |
| | 130 | | | Omnicom Group, Inc. | | | 10,777 | |
| | 61 | | | ONEOK, Inc. | | | 3,182 | |
| | 36 | | | Packaging Corp. of America | | | 4,010 | |
| | 338 | | | Papa John’s International, Inc. | | | 24,255 | |
| | 30 | | | Praxair, Inc. | | | 3,976 | |
| | 97 | | | Ralph Lauren Corp. | | | 7,159 | |
| | 55 | | | Republic Services, Inc. | | | 3,505 | |
| | 446 | | | Ross Stores, Inc. | | | 25,748 | |
| | 52 | | | SCANA Corp. | | | 3,484 | |
| | 47 | | | Schlumberger Ltd. | | | 3,094 | |
| | 222 | | | Scripps Networks Interactive, Inc., Class A | | | 15,165 | |
| | 342 | | | Seagate Technology plc | | | 13,252 | |
| | 366 | | | Sealed Air Corp. | | | 16,382 | |
| | 64 | | | Sonoco Products Co. | | | 3,291 | |
| | 79 | | | Southern Co. (The) | | | 3,783 | |
| | 64 | | | Sysco Corp. | | | 3,221 | |
| | 444 | | | TJX Cos., Inc. (The) | | | 32,043 | |
| | 42 | | | Torchmark Corp. | | | 3,213 | |
| | 60 | | | Ventas, Inc. | | | 4,169 | |
| | 458 | | | Viacom, Inc., Class B | | | 15,375 | |
| | 48 | | | Waste Management, Inc. | | | 3,521 | |
| | 55 | | | Welltower, Inc. | | | 4,117 | |
| | 55 | | | WR Berkley Corp. | | | 3,804 | |
| | 63 | | | Xilinx, Inc. | | | 4,053 | |
| | | | | | | | |
| | | | | | | 728,761 | |
| | | | | | | | |
| | | | Total Securities Sold Short
(Proceeds $799,636) | | $ | 790,436 | |
| | | | | | | | |
Percentages indicated are based on net assets.
Summary of Investments by Industry, June 30, 2017
The following table represents the portfolio investments of the Portfolio by industry classifications as a percentage of total investments:
| | | | |
| LONG PORTFOLIO COMPOSITION BY INDUSTRY | | PERCENTAGE | |
Investment Companies | | | 23.8 | % |
Foreign Government Securities | | | 9.6 | |
Foreign Government Treasury Bill | | | 5.7 | |
Banks | | | 4.8 | |
Pharmaceuticals | | | 3.0 | |
Asset-Backed Securities | | | 2.7 | |
Collateralized Mortgage Obligations | | | 2.5 | |
U.S. Treasury Notes | | | 2.4 | |
Oil, Gas & Consumable Fuels | | | 2.3 | |
Insurance | | | 2.1 | |
U.S. Treasury Bonds | | | 1.8 | |
Capital Markets | | | 1.8 | |
IT Services | | | 1.5 | |
Software | | | 1.3 | |
Health Care Providers & Services | | | 1.3 | |
Beverages | | | 1.2 | |
Diversified Telecommunication Services | | | 1.2 | |
Media | | | 1.2 | |
Automobiles | | | 1.1 | |
Household Durables | | | 1.1 | |
Internet Software & Services | | | 1.1 | |
Road & Rail | | | 1.1 | |
Others (each less than 1.0%) | | | 20.9 | |
Short-Term Investment | | | 4.5 | |
SEE NOTES TO FINANCIAL STATEMENTS.
| | | | | | |
| | | |
| 14 | | | | JPMORGAN INSURANCE TRUST | | JUNE 30, 2017 |
| | | | |
| SHORT PORTFOLIO COMPOSITION BY INDUSTRY | | PERCENTAGE | |
Food Products | | | 14.6 | % |
Textiles, Apparel & Luxury Goods | | | 12.5 | |
Industrial Conglomerates | | | 8.9 | |
Specialty Retail | | | 7.6 | |
Beverages | | | 6.9 | |
Media | | | 6.7 | |
Automobiles | | | 6.5 | |
Containers & Packaging | | | 4.0 | |
Hotels, Restaurants & Leisure | | | 3.1 | |
Oil, Gas & Consumable Fuels | | | 3.0 | |
Household Products | | | 2.9 | |
Technology Hardware, Storage & Peripherals | | | 2.1 | |
Food & Staples Retailing | | | 2.0 | |
Multiline Retail | | | 1.8 | |
Semiconductors & Semiconductor Equipment | | | 1.7 | |
Equity Real Estate Investment Trusts (REITs) | | | 1.5 | |
Multi-Utilities | | | 1.4 | |
Insurance | | | 1.3 | |
Chemicals | | | 1.0 | |
Others (each less than 1.0%) | | | 10.5 | |
| | | | | | | | | | | | | | | | | | | | |
| Futures Contracts | |
NUMBER OF
CONTRACTS | | | DESCRIPTION | | EXPIRATION
DATE | | | TRADING
CURRENCY | | | NOTIONAL
VALUE AT
JUNE 30, 2017 | | | NET
UNREALIZED
APPRECIATION
(DEPRECIATION) | |
| | | | Long Futures Outstanding | | | | | | | | | | | | | | | | |
| | 7 | | | TOPIX Index | | | 09/07/17 | | | | JPY | | | | 1,006,869 | | | | 9,099 | |
| | 4 | | | 10 Year Australian Government Bond | | | 09/15/17 | | | | AUD | | | | 397,396 | | | | (5,708 | ) |
| | 4 | | | Euro STOXX 50 Index | | | 09/15/17 | | | | EUR | | | | 157,000 | | | | (3,867 | ) |
| | 35 | | | Mini MSCI Emerging Markets Index | | | 09/15/17 | | | | USD | | | | 1,764,525 | | | | 15,993 | |
| | 11 | | | Mini Russell 2000 | | | 09/15/17 | | | | USD | | | | 777,865 | | | | (2,857 | ) |
| | 24 | | | EUR FX | | | 09/18/17 | | | | USD | | | | 3,440,100 | | | | 64,154 | |
| | | | Short Futures Outstanding | | | | | | | | | | | | | | | | |
| | (3 | ) | | Euro-Buxl 30-Year Bond | | | 09/07/17 | | | | EUR | | | | (560,293 | ) | | | 12,254 | |
| | (6 | ) | | 10 Year Mini Japanese Government Bond | | | 09/11/17 | | | | JPY | | | | (801,405 | ) | | | 2,068 | |
| | (5 | ) | | FTSE 100 Index | | | 09/15/17 | | | | GBP | | | | (471,936 | ) | | | 12,546 | |
| | (9 | ) | | 10 Year U.S. Treasury Note | | | 09/20/17 | | | | USD | | | | (1,129,781 | ) | | | 4,113 | |
| | (1 | ) | | U.S. Treasury Long Bond | | | 09/20/17 | | | | USD | | | | (153,688 | ) | | | (1,377 | ) |
| | (2 | ) | | Long Gilt | | | 09/27/17 | | | | GBP | | | | (327,097 | ) | | | 5,783 | |
| | | | | | | | | | | | | | | | | | | | |
| | | | | 112,201 | |
| | | | | | | | | | | | | | | | | | | | |
SEE NOTES TO FINANCIAL STATEMENTS.
| | | | | | | | |
| | | |
| JUNE 30, 2017 | | JPMORGAN INSURANCE TRUST | | | | | 15 | |
JPMorgan Insurance Trust Global Allocation Portfolio
SCHEDULE OF PORTFOLIO INVESTMENTS
AS OF JUNE 30, 2017 (Unaudited) (continued)
(Amounts in U.S. Dollars, unless otherwise noted)
| | | | | | | | | | | | | | | | | | | | | | | | |
| Forward Foreign Currency Exchange Contracts | | | | | | | |
CONTRACTS
TO BUY | | | CURRENCY | | | COUNTERPARTY | | SETTLEMENT
DATE | | | SETTLEMENT
VALUE | | | VALUE AT
JUNE 30, 2017 | | | NET
UNREALIZED
APPRECIATION
(DEPRECIATION) | |
| | 739,375 | | | | CAD | | | Australia and New Zealand Banking Group Ltd. | | | 09/27/17 | | | | 558,770 | | | | 570,921 | | | | 12,151 | |
| | | | | | | | | | | | | | | | | | | |
CONTRACTS
TO SELL | | | | | | COUNTERPARTY | | SETTLEMENT
DATE | | | SETTLEMENT
VALUE | | | VALUE AT
JUNE 30, 2017 | | | NET
UNREALIZED
APPRECIATION
(DEPRECIATION) | |
| | 1,713,982 | | | | AUD | | | Australia and New Zealand Banking Group Ltd. | | | 09/27/17 | | | | 1,303,284 | | | | 1,315,943 | | | | (12,659 | ) |
| | 43,314 | | | | AUD | | | National Australia Bank | | | 09/27/17 | | | | 33,230 | | | | 33,256 | | | | (26 | ) |
| | 4,556,961 | | | | CAD | | | State Street Corp. | | | 07/28/17 | | | | 3,445,897 | | | | 3,515,678 | | | | (69,781 | ) |
| | 1,228,498 | | | | CAD | | | National Australia Bank | | | 09/27/17 | | | | 929,908 | | | | 948,604 | | | | (18,696 | ) |
| | 1,517,256 | | | | EUR | | | Goldman Sachs International | | | 09/27/17 | | | | 1,716,297 | | | | 1,740,781 | | | | (24,484 | ) |
| | 1,324,464 | | | | GBP | | | State Street Corp. | | | 07/28/17 | | | | 1,691,151 | | | | 1,726,416 | | | | (35,265 | ) |
| | 454,410 | | | | GBP | | | Australia and New Zealand Banking Group Ltd. | | | 09/27/17 | | | | 581,234 | | | | 593,411 | | | | (12,177 | ) |
| | 152,024,803 | | | | JPY | | | HSBC Bank, NA | | | 09/27/17 | | | | 1,367,834 | | | | 1,356,726 | | | | 11,108 | |
| | | | | | | | | | | | | | | 11,068,835 | | | | 11,230,815 | | | | (161,980 | ) |
| | |
NOTES TO SCHEDULE OF PORTFOLIO INVESTMENTS
| | |
| ADR | | — American Depositary Receipt |
| AUD | | — Australian Dollar |
| CAD | | — Canadian Dollar |
| CVA | | — Dutch Certification |
| CVR | | — Contingent Value Rights |
| EUR | | — Euro |
| GBP | | — British Pound |
| JPY | | — Japanese Yen |
| MSCI | | — Morgan Stanley Capital International |
| Reg. S | | — Security was purchased pursuant to Regulation S under the Securities Act of 1933, which exempts from registration securities offered and sold outside of the United States. Such a security cannot be sold in the United States without either an effective registration statement filed pursuant to the Securities Act of 1933, or pursuant to an exemption from registration. |
| TOPIX | | — Tokyo Stock Price Index |
| USD | | — United States Dollar |
| VAR | | — Variable Rate Security. The interest rate shown is the rate in effect as of June 30, 2017. |
| |
| (a) | | — Non-income producing security. |
| (b) | | — Investment in affiliate. Fund is registered under the Investment Company Act of 1940, as amended, and advised by J.P. Morgan Investment Management Inc. |
| | |
| (e) | | — Security is exempt from registration under Rule 144A of the Securities Act of 1933, as amended. Unless otherwise indicated, this security has been determined to be liquid under procedures established by the Board of Trustees and may be resold in transactions exempt from registration, normally to qualified institutional buyers. |
| (g) | | — Amount rounds to less than 0.05%. |
| (j) | | — All or a portion of this security is segregated as collateral for short sales. The total value of securities segregated as collateral is $1,032,180. |
| (k) | | — All or a portion of this security is deposited with the broker as initial margin for future contracts. |
| (l) | | — The rate shown is the current yield as of June 30, 2017. |
| (n) | | — The rate shown is the effective yield as of June 30, 2017. |
Detailed information about investment portfolios of the underlying funds can be found in shareholder reports filed with the Securities and Exchange Commission (SEC) by each such underlying fund semi-annually on Form N-CSR and in certified portfolio holdings filed quarterly on Form N-Q, and are available for download from both the SEC’s as well as each respective underlying fund’s website. Detailed information about underlying J.P. Morgan Funds can also be found at www.jpmorganfunds.com or by calling 1-800-480-4111.
SEE NOTES TO FINANCIAL STATEMENTS.
| | | | | | |
| | | |
| 16 | | | | JPMORGAN INSURANCE TRUST | | JUNE 30, 2017 |
STATEMENT OF ASSETS AND LIABILITIES
AS OF JUNE 30, 2017 (Unaudited)
| | | | |
| | | Global Allocation
Portfolio | |
ASSETS: | |
Investments in non-affiliates, at value | | $ | 38,783,275 | |
Investments in affiliates, at value | | | 15,273,884 | |
| | | | |
Total investment securities, at value | | | 54,057,159 | |
Cash | | | 686,176 | |
Foreign currency, at value | | | 92,987 | |
Deposits at broker for futures contracts | | | 66,000 | |
Deposits at broker for securities sold short | | | 1,039,277 | |
Receivables: | | | | |
Investment securities sold | | | 2,504,907 | |
Portfolio shares sold | | | 3,072,201 | |
Interest and dividends from non-affiliates | | | 99,994 | |
Dividends from affiliates | | | 1,580 | |
Tax reclaims | | | 19,605 | |
Variation margin on futures contracts | | | 231,972 | |
Unrealized appreciation on forward foreign currency exchange contracts | | | 23,259 | |
| | | | |
Total Assets | | | 61,895,117 | |
| | | | |
| |
LIABILITIES: | | | | |
Payables: | | | | |
Securities sold short, at value | | | 790,436 | |
Dividend expense to non-affiliates on securities sold short | | | 1,453 | |
Investment securities purchased | | | 2,578,404 | |
Portfolio shares redeemed | | | 35,366 | |
Unrealized depreciation on forward foreign currency exchange contracts | | | 173,088 | |
Accrued liabilities: | | | | |
Investment advisory fees | | | 17,566 | |
Distribution fees | | | 10,011 | |
Custodian and accounting fees | | | 4,278 | |
Trustees’ and Chief Compliance Officer’s fees | | | 51 | |
Other | | | 62,597 | |
| | | | |
Total Liabilities | | | 3,673,250 | |
| | | | |
Net Assets | | $ | 58,221,867 | |
| | | | |
|
NET ASSETS: | |
Paid-in-Capital | | $ | 53,242,586 | |
Accumulated undistributed net investment income | | | 592,680 | |
Accumulated net realized gains (losses) | | | 110,677 | |
Net unrealized appreciation (depreciation) | | | 4,275,924 | |
| | | | |
Total Net Assets | | $ | 58,221,867 | |
| | | | |
Net Assets: | | | | |
Class 1 | | $ | 6,833,184 | |
Class 2 | | | 51,388,683 | |
| | | | |
Total | | $ | 58,221,867 | |
| | | | |
Outstanding units of beneficial interest (shares) | | | | |
($0.0001 par value; unlimited number of shares authorized): | | | | |
Class 1 | | | 420,588 | |
Class 2 | | | 3,170,491 | |
Net Asset Value, offering and redemption price per share (a): | | | | |
Class 1 | | $ | 16.25 | |
Class 2 | | | 16.21 | |
| | | | |
Cost of investments in non-affiliates | | $ | 35,563,439 | |
Cost of investments in affiliates | | | 14,197,128 | |
Cost of foreign currency | | | 92,082 | |
Proceeds from securities sold short | | | 799,636 | |
| (a) | Per share amounts may not recalculate due to rounding of net assets and/or shares outstanding. |
SEE NOTES TO FINANCIAL STATEMENTS.
| | | | | | | | |
| | | |
| JUNE 30, 2017 | | JPMORGAN INSURANCE TRUST | | | | | 17 | |
STATEMENT OF OPERATIONS
FOR THE SIX MONTHS ENDED JUNE 30, 2017 (Unaudited)
| | | | |
| | | Global Allocation
Portfolio | |
INVESTMENT INCOME: | |
Dividend income from non-affiliates | | $ | 325,066 | |
Dividend income from affiliates | | | 395,135 | |
Interest income from non-affiliates | | | 125,866 | |
Interest income from affiliates | | | 39 | |
Interest income from non-affiliates on securities sold short | | | 2,054 | |
Foreign taxes withheld | | | (24,716 | ) |
| | | | |
Total investment income | | | 823,444 | |
| | | | |
| |
EXPENSES: | | | | |
Investment advisory fees | | | 164,371 | |
Administration fees | | | 22,382 | |
Distribution fees — Class 2 | | | 61,625 | |
Custodian and accounting fees | | | 24,307 | |
Interest expense to non-affiliates | | | 42 | |
Interest expense to affiliates | | | 156 | |
Professional fees | | | 40,361 | |
Trustees’ and Chief Compliance Officer’s fees | | | 13,075 | |
Printing and mailing costs | | | 5,357 | |
Transfer agency fees — Class 1 | | | 56 | |
Transfer agency fees — Class 2 | | | 514 | |
Other | | | 2,888 | |
Dividend expense to non-affiliates on securities sold short | | | 7,379 | |
| | | | |
Total expenses | | | 342,513 | |
| | | | |
Less fees waived | | | (62,724 | ) |
Less expense reimbursements | | | (22 | ) |
| | | | |
Net expenses | | | 279,767 | |
| | | | |
Net investment income (loss) | | | 543,677 | |
| | | | |
| |
REALIZED/UNREALIZED GAINS (LOSSES): | | | | |
Net realized gain (loss) on transactions from: | | | | |
Investments in non-affiliates | | | 419,702 | |
Investments in affiliates | | | 9,626 | |
Futures | | | 608,565 | |
Securities sold short | | | (12,186 | ) |
Foreign currency transactions | | | (260,204 | ) |
| | | | |
Net realized gain (loss) | | | 765,503 | |
| | | | |
Change in net unrealized appreciation/depreciation on: | | | | |
Investments in non-affiliates | | | 2,609,559 | |
Investments in affiliates | | | 658,061 | |
Futures | | | 262,531 | |
Foreign currency translations | | | (108,235 | ) |
Securities sold short | | | 7,307 | |
| | | | |
Change in net unrealized appreciation/depreciation | | | 3,429,223 | |
| | | | |
Net realized/unrealized gains (losses) | | | 4,194,726 | |
| | | | |
Change in net assets resulting from operations | | $ | 4,738,403 | |
| | | | |
SEE NOTES TO FINANCIAL STATEMENTS.
| | | | | | |
| | | |
| 18 | | | | JPMORGAN INSURANCE TRUST | | JUNE 30, 2017 |
STATEMENT OF CHANGES IN NET ASSETS
FOR THE PERIODS INDICATED
| | | | | | | | |
| | | Global Allocation Portfolio | |
| | | Six Months Ended June 30, 2017 (Unaudited) | | | Year Ended December 31, 2016 | |
CHANGE IN NET ASSETS RESULTING FROM OPERATIONS: | |
Net investment income (loss) | | $ | 543,677 | | | $ | 939,433 | |
Net realized gain (loss) | | | 765,503 | | | | (83,640 | ) |
Change in net unrealized appreciation/depreciation | | | 3,429,223 | | | | 2,112,683 | |
| | | | | | | | |
Change in net assets resulting from operations | | | 4,738,403 | | | | 2,968,476 | |
| | | | | | | | |
| | |
DISTRIBUTIONS TO SHAREHOLDERS: | | | | | | | | |
Class 1 | | | | | | | | |
From net investment income | | | — | | | | (138,691 | ) |
From net realized gains | | | — | | | | (51 | ) |
Class 2 | | | | | | | | |
From net investment income | | | — | | | | (1,379,799 | ) |
From net realized gains | | | — | | | | (555 | ) |
| | | | | | | | |
Total distributions to shareholders | | | — | | | | (1,519,096 | ) |
| | | | | | | | |
| | |
CAPITAL TRANSACTIONS: | | | | | | | | |
Change in net assets resulting from capital transactions | | | (1,049,991 | ) | | | 20,529,111 | |
| | | | | | | | |
| | |
NET ASSETS: | | | | | | | | |
Change in net assets | | | 3,688,412 | | | | 21,978,491 | |
Beginning of period | | | 54,533,455 | | | | 32,554,964 | |
| | | | | | | | |
End of period | | $ | 58,221,867 | | | $ | 54,533,455 | |
| | | | | | | | |
Accumulated undistributed net investment income | | $ | 592,680 | | | $ | 49,003 | |
| | | | | | | | |
| | |
CAPITAL TRANSACTIONS: | | | | | | | | |
Class 1 | | | | | | | | |
Proceeds from shares issued | | $ | 1,768,701 | | | $ | 4,816,386 | |
Distributions reinvested | | | — | | | | 138,742 | |
Cost of shares redeemed | | | (69,278 | ) | | | (828,102 | ) |
| | | | | | | | |
Change in net assets resulting from Class 1 capital transactions | | $ | 1,699,423 | | | $ | 4,127,026 | |
| | | | | | | | |
Class 2 | | | | | | | | |
Proceeds from shares issued | | $ | 10,080,327 | | | $ | 18,819,300 | |
Distributions reinvested | | | — | | | | 1,380,354 | |
Cost of shares redeemed | | | (12,829,741 | ) | | | (3,797,569 | ) |
| | | | | | | | |
Change in net assets resulting from Class 2 capital transactions | | $ | (2,749,414 | ) | | $ | 16,402,085 | |
| | | | | | | | |
Total change in net assets resulting from capital transactions | | $ | (1,049,991 | ) | | $ | 20,529,111 | |
| | | | | | | | |
| | |
SHARE TRANSACTIONS: | | | | | | | | |
Class 1 | | | | | | | | |
Issued | | | 111,677 | | | | 326,903 | |
Reinvested | | | — | | | | 9,318 | |
Redeemed | | | (4,410 | ) | | | (56,772 | ) |
| | | | | | | | |
Change in Class 1 Shares | | | 107,267 | | | | 279,449 | |
| | | | | | | | |
Class 2 | | | | | | | | |
Issued | | | 630,583 | | | | 1,298,330 | |
Reinvested | | | — | | | | 92,827 | |
Redeemed | | | (814,121 | ) | | | (255,997 | ) |
| | | | | | | | |
Change in Class 2 Shares | | | (183,538 | ) | | | 1,135,160 | |
| | | | | | | | |
SEE NOTES TO FINANCIAL STATEMENTS.
| | | | | | | | |
| | | |
| JUNE 30, 2017 | | JPMORGAN INSURANCE TRUST | | | | | 19 | |
FINANCIAL HIGHLIGHTS
FOR THE PERIODS INDICATED
| | | | | | | | | | | | | | | | | | | | | | | | | | | | |
| | | Per share operating performance | |
| | | | | | Investment operations | | | Distributions | |
| | | Net asset
value,
beginning
of period | | | Net
investment
income
(loss) (b) | | |
Net realized
and unrealized
gains
(losses) on
investments | | | Total from
investment
operations | | | Net
investment
income | | | Net
realized
gain | | | Total
distributions | |
Global Allocation Portfolio | |
Class 1 | |
Six Months Ended June 30, 2017 (Unaudited) | | $ | 14.89 | | | | 0.18 | (h) | | $ | 1.18 | | | $ | 1.36 | | | $ | — | | | $ | — | | | $ | — | |
Year Ended December 31, 2016 | | | 14.46 | | | | 0.35 | (h) | | | 0.54 | | | | 0.89 | | | | (0.46 | ) | | | — | (j) | | | (0.46 | ) |
Year Ended December 31, 2015 | | | 14.93 | | | | 0.30 | (h) | | | (0.46 | ) | | | (0.16 | ) | | | (0.23 | ) | | | (0.08 | ) | | | (0.31 | ) |
December 9, 2014 (m) through December 31, 2014 | | | 15.00 | | | | 0.03 | | | | (0.06 | ) | | | (0.03 | ) | | | (0.04 | ) | | | — | | | | (0.04 | ) |
| | | | | | | |
Class 2 | | | | | | | | | | | | | | | | | | | | | | | | | | | | |
Six Months Ended June 30, 2017 (Unaudited) | | | 14.87 | | | | 0.15 | (h) | | | 1.19 | | | | 1.34 | | | | — | | | | — | | | | — | |
Year Ended December 31, 2016 | | | 14.45 | | | | 0.30 | (h) | | | 0.54 | | | | 0.84 | | | | (0.42 | ) | | | — | (j) | | | (0.42 | ) |
Year Ended December 31, 2015 | | | 14.93 | | | | 0.22 | (h) | | | (0.42 | ) | | | (0.20 | ) | | | (0.20 | ) | | | (0.08 | ) | | | (0.28 | ) |
December 9, 2014 (m) through December 31, 2014 | | | 15.00 | | | | 0.03 | | | | (0.07 | ) | | | (0.04 | ) | | | (0.03 | ) | | | — | | | | (0.03 | ) |
| (a) | Annualized for periods less than one year, unless otherwise noted. |
| (b) | Net investment income (loss) is affected by the timing of distributions from Underlying Funds. |
| (c) | Not annualized for periods less than one year. |
| (d) | Includes adjustments in accordance with accounting principles generally accepted in the United States of America and as such, the net asset values for financial reporting purposes and the returns based upon those net asset values may differ from the net asset values and returns for shareholder transactions. |
| (e) | Includes earnings credits and interest expense, if applicable, each of which is less than 0.005% unless otherwise noted. |
| (f) | Does not include expenses of Underlying Funds. |
| (g) | Commencing on December 31, 2016, the Portfolio presents portfolio turnover in two ways, one including securities sold short and the other excluding securities sold short. For periods prior to December 31, 2016, the Portfolio did not transact in securities sold short. |
| (h) | Calculated based upon average shares outstanding. |
| (i) | The net expenses and expenses without waivers, reimbursements and earnings credits (excluding dividend and interest expense for securities sold short) for Class 1 are 0.77% and 1.00% for the six months ended June 30, 2017 and for Class 2 are 1.02% and 1.24% for the six months ended June 30, 2017, respectively. |
| (j) | Amount rounds to less than $0.005. |
| (k) | Dividend expense on securities sold short is less than 0.005%. |
| (l) | Certain non-recurring expenses incurred by the Portfolio were not annualized for the year ended December 31, 2015 and the period ended December 31, 2014. |
| (m) | Commencement of operations. |
| (n) | Amount rounds to less than 0.005%. |
SEE NOTES TO FINANCIAL STATEMENTS.
| | | | | | |
| | | |
| 20 | | | | JPMORGAN INSURANCE TRUST | | JUNE 30, 2017 |
| | | | | | | | | | | | | | | | | | | | | | | | | | | | | | |
| | | Ratios/Supplemental data | |
| | | | | | | | | | Ratios to average net assets (a) | | | | | | | |
Net asset
value,
end of
period | | | Total
return (c)(d) | | | Net assets,
end of
period | | | Net expenses
(including
dividend expense
for securities sold
short) (e)(f) | | | Net
investment
income
(loss) (b) | | | Expenses
without waivers,
reimbursements and
earnings credits
(including dividend
expense for securities
sold short) (f) | | | Portfolio
turnover rate
(excluding
securities sold
short) (c)(g) | | | Portfolio
turnover rate
(including
securities sold
short) (c)(g) | |
| | | | | | | | | | | | | | | | | | | | | | | | | | | | | | |
| | | | | | | | | | | | | | | | | | | | | | | | | | | | | | |
| $ | 16.25 | | | | 9.13 | % | | $ | 6,833,184 | | | | 0.80 | %(i) | | | 2.25 | % | | | 1.03 | %(i) | | | 37 | % | | | 43 | % |
| | 14.89 | | | | 6.13 | | | | 4,664,040 | | | | 0.77 | (k) | | | 2.34 | | | | 1.20 | (k) | | | 60 | | | | 61 | |
| | 14.46 | | | | (1.06 | ) | | | 489,826 | | | | 0.77 | (l) | | | 2.00 | (l) | | | 1.18 | (l) | | | 50 | | | | — | |
| | 14.93 | | | | (0.23 | ) | | | 99,781 | | | | 0.78 | (l) | | | 3.08 | (l) | | | 6.70 | (l) | | | 0.00 | (n) | | | — | |
| | | | | | | |
| | | | | | | | | | | | | | | | | | | | | | | | | | | | | | |
| | 16.21 | | | | 9.01 | | | | 51,388,683 | | | | 1.05 | (i) | | | 1.95 | | | | 1.27 | %(i) | | | 37 | | | | 43 | |
| | 14.87 | | | | 5.84 | | | | 49,869,415 | | | | 1.02 | (k) | | | 2.04 | | | | 1.45 | (k) | | | 60 | | | | 61 | |
| | 14.45 | | | | (1.32 | ) | | | 32,065,138 | | | | 1.03 | (l) | | | 1.48 | (l) | | | 1.58 | (l) | | | 50 | | | | — | |
| | 14.93 | | | | (0.25 | ) | | | 19,853,425 | | | | 1.03 | (l) | | | 2.83 | (l) | | | 6.95 | (l) | | | 0.00 | (n) | | | — | |
SEE NOTES TO FINANCIAL STATEMENTS.
| | | | | | | | |
| | | |
| JUNE 30, 2017 | | JPMORGAN INSURANCE TRUST | | | | | 21 | |
NOTES TO FINANCIAL STATEMENTS
AS OF JUNE 30, 2017 (Unaudited)
1. Organization
JPMorgan Insurance Trust (the “Trust”) is registered under the Investment Company Act of 1940, as amended (the “1940 Act”), as an open-end management investment company and is a Massachusetts business trust.
The following is a separate Portfolio of the Trust (the “Portfolio”) covered by this report:
| | | | |
| | | Classes Offered | | Diversified/Non-Diversified |
| Global Allocation Portfolio | | Class 1 and Class 2 | | Diversified |
The investment objective of the Portfolio is to seek to maximize long-term total return.
Portfolio shares are offered only to separate accounts of participating insurance companies and Eligible Plans. Individuals may not purchase shares directly from the Portfolio.
All classes of shares have equal rights as to earnings, assets and voting privileges, except that each class may bear different transfer agency fees and distribution fees and each class has exclusive voting rights with respect to its distribution plan and administrative services plan.
J.P. Morgan Investment Management Inc. (“JPMIM”), an indirect, wholly-owned subsidiary of JPMorgan Chase & Co. (“JPMorgan”), acts as Adviser (the “Adviser”) and Administrator (the “Administrator”) to the Portfolio.
2. Significant Accounting Policies
The following is a summary of significant accounting policies followed by the Portfolio in the preparation of its financial statements. The Portfolio is an investment company and, accordingly, follows the investment company accounting and reporting guidance of the Financial Accounting Standards Board Accounting Standards Codification Topic 946 — Investment Companies, which is part of U.S. generally accepted accounting principles (“GAAP”). The preparation of financial statements in conformity with GAAP requires management to make estimates and assumptions that affect the reported amounts of assets and liabilities and disclosure of contingent assets and liabilities at the date of the financial statements and the reported amounts of increases and decreases in net assets from operations during the reporting period. Actual results could differ from those estimates.
A. Valuation of Investments — The valuation of investments is in accordance with GAAP and the Portfolio’s valuation policies set forth by and under the supervision and responsibility of the Board of Trustees (the “Board”), which established the following approach to valuation, as described more fully below: (i) investments for which market quotations are readily available shall be valued at such unadjusted quoted prices and (ii) all other investments for which market quotations are not readily available shall be valued at their fair value as determined in good faith by the Board.
The Administrator has established the J.P. Morgan Investment Management Americas Valuation Committee (“AVC”) to assist the Board with the oversight and monitoring of the valuation of the Portfolio’s investments. The Administrator implements the valuation policies of the Portfolio’s investments, as directed by the Board. The AVC oversees and carries out the policies for the valuation of investments held in the Portfolio. This includes monitoring the appropriateness of fair values based on results of ongoing valuation oversight, including but not limited to consideration of macro or security specific events, market events and pricing vendor and broker due diligence. The Administrator is responsible for discussing and assessing the potential impacts to the fair values on an ongoing basis, and at least on a quarterly basis with the AVC and the Board.
A market-based approach is primarily used to value the Portfolio’s investments. Investments for which market quotations are not readily available are fair valued by approved affiliated and unaffiliated pricing vendors or third party broker-dealers (collectively referred to as “Pricing Services”) or may be internally fair valued using methods set forth by the valuation policies approved by the Board. This may include related or comparable assets or liabilities, recent transactions, market multiples, book values, and other relevant information for the investment to determine the fair value of the investment. An income-based valuation approach may be used in which the anticipated future cash flows of the investment are discounted to calculate the fair value. Discounts may also be applied due to the nature or duration of any restrictions on the disposition of the investments. Valuations may be based upon current market prices of securities that are comparable in coupon, rating, maturity and industry. It is possible that the estimated values may differ significantly from the values that would have been used, had a ready market for the investments existed, and such differences could be material.
Fixed income instruments are valued based on prices received from Pricing Services. The Pricing Services use multiple valuation techniques to determine the valuation of fixed income instruments. In instances where sufficient market activity exists, the Pricing Services may utilize a market-based approach through which trades or quotes from market makers are used to determine the valuation of these instruments. In instances where sufficient market activity may not exist, the Pricing Services also utilize proprietary valuation models which may consider market transactions in comparable securities and the various relationships between securities in determining fair value and/or market characteristics in order to estimate the relevant cash flows, which are then discounted to calculate the fair values.
Equities and other exchange-traded instruments are valued at the last sale price or official market closing price on the primary exchange on which the instrument is traded before the net asset values (“NAV”) of the Portfolio are calculated on a valuation date. Certain foreign equity instruments, as well as certain derivatives with equity reference obligations, are valued by applying international fair value factors provided by an approved Pricing Service. The factors seek to adjust the local closing price for movements of local markets post closing, but prior to the time the NAVs are calculated. Investments in open-end investment companies (the “Underlying Funds”) are valued at each Underlying Fund’s NAV per share as of the report date.
| | | | | | |
| | | |
| 22 | | | | JPMORGAN INSURANCE TRUST | | JUNE 30, 2017 |
Futures and options are generally valued on the basis of available market quotations. Forward foreign currency exchange contracts are valued utilizing market quotations from approved Pricing Services.
See the table on “Quantitative Information about Level 3 Fair Value Measurements” for information on the valuation techniques and inputs used to value level 3 securities held by the Portfolio at June 30, 2017.
Valuations reflected in this report are as of the report date. As a result, changes in valuation due to market events and/or issuer related events after the report date and prior to issuance of the report are not reflected herein.
The various inputs that are used in determining the valuation of the Portfolio’s investments are summarized into the three broad levels listed below.
| • | | Level 1 — Unadjusted inputs using quoted prices in active markets for identical investments. |
| • | | Level 2 — Other significant observable inputs including, but not limited to, quoted prices for similar investments, inputs other than quoted prices that are observable for investments (such as interest rates, prepayment speeds, credit risk, etc.) or other market corroborated inputs. |
| • | | Level 3 — Significant inputs based on the best information available in the circumstances, to the extent observable inputs are not available (including the Portfolio’s assumptions in determining the fair value of investments). |
A financial instrument’s level within the fair value hierarchy is based on the lowest level of any input, both individually and in the aggregate, that is significant to the fair value measurement. The inputs or methodology used for valuing instruments are not necessarily an indication of the risk associated with investing in those instruments.
The following table represents each valuation input as presented on the Schedule of Portfolio Investments (“SOI”):
| | | | | | | | | | | | | | | | |
| | | Level 1
Quoted prices | | | Level 2
Other significant
observable inputs | | | Level 3
Significant
unobservable inputs | | | Total | |
Investments in Securities | |
Asset-Backed Securities | | | | | | | | | | | | | | | | |
United States | | $ | — | | | $ | 538,480 | | | $ | 942,836 | | | $ | 1,481,316 | |
Collateralized Mortgage Obligations | | | | | | | | | | | | | | | | |
United States | | | — | | | | 1,348,770 | | | | — | | | | 1,348,770 | |
Common Stocks | | | | | | | | | | | | | | | | |
Australia | | | — | | | | 753,031 | | | | — | | | | 753,031 | |
Austria | | | — | | | | 59,372 | | | | — | | | | 59,372 | |
Belgium | | | — | | | | 134,526 | | | | — | | | | 134,526 | |
Canada | | | 462,611 | | | | — | | | | — | | | | 462,611 | |
Denmark | | | — | | | | 97,235 | | | | — | | | | 97,235 | |
Finland | | | — | | | | 246,633 | | | | — | | | | 246,633 | |
France | | | — | | | | 1,142,936 | | | | — | | | | 1,142,936 | |
Germany | | | — | | | | 1,189,111 | | | | — | | | | 1,189,111 | |
Hong Kong | | | — | | | | 375,729 | | | | — | | | | 375,729 | |
Ireland | | | 79,093 | | | | — | | | | — | | | | 79,093 | |
Israel | | | 75,609 | | | | — | | | | — | | | | 75,609 | |
Italy | | | — | | | | 424,925 | | | | — | | | | 424,925 | |
Japan | | | — | | | | 2,846,509 | | | | — | | | | 2,846,509 | |
Luxembourg | | | 61,539 | | | | — | | | | — | | | | 61,539 | |
Netherlands | | | — | | | | 703,864 | | | | — | | | | 703,864 | |
New Zealand | | | — | | | | 58,504 | | | | — | | | | 58,504 | |
Norway | | | — | | | | 43,127 | | | | — | | | | 43,127 | |
Portugal | | | — | | | | 29,626 | | | | — | | | | 29,626 | |
Singapore | | | — | | | | 96,325 | | | | — | | | | 96,325 | |
Spain | | | — | | | | 357,979 | | | | — | | | | 357,979 | |
Sweden | | | — | | | | 88,251 | | | | — | | | | 88,251 | |
Switzerland | | | — | | | | 1,136,341 | | | | — | | | | 1,136,341 | |
United Kingdom | | | — | | | | 1,945,976 | | | | — | | | | 1,945,976 | |
United States | | | 11,259,150 | | | | 119,210 | | | | — | | | | 11,378,360 | |
| | | | | | | | | | | | | | | | |
Total Common Stocks | | | 11,938,002 | | | | 11,849,210 | | | | — | | | | 23,787,212 | |
| | | | | | | | | | | | | | | | |
| | | | | | | | |
| | | |
| JUNE 30, 2017 | | JPMORGAN INSURANCE TRUST | | | | | 23 | |
NOTES TO FINANCIAL STATEMENTS
AS OF JUNE 30, 2017 (Unaudited) (continued)
| | | | | | | | | | | | | | | | |
| | | Level 1
Quoted prices | | | Level 2
Other significant
observable inputs | | | Level 3
Significant
unobservable inputs | | | Total | |
Corporate Bonds | | | | | | | | | | | | | | | | |
Belgium | | $ | — | | | $ | 20,607 | | | $ | — | | | $ | 20,607 | |
Canada | | | — | | | | 61,394 | | | | — | | | | 61,394 | |
Israel | | | — | | | | 23,046 | | | | — | | | | 23,046 | |
United States | | | — | | | | 1,234,050 | | | | — | | | | 1,234,050 | |
| | | | | | | | | | | | | | | | |
Total Corporate Bonds | | | — | | | | 1,339,097 | | | | — | | | | 1,339,097 | |
| | | | | | | | | | | | | | | | |
Foreign Government Securities | | | — | | | | 5,173,915 | | | | — | | | | 5,173,915 | |
Investment Companies | | | 12,867,378 | | | | — | | | | — | | | | 12,867,378 | |
Options Purchased | | | | | | | | | | | | | | | | |
Call Options Purchased | | | 147,011 | | | | 22,022 | | | | — | | | | 169,033 | |
Preferred Stocks | | | | | | | | | | | | | | | | |
Germany | | | — | | | | 134,896 | | | | — | | | | 134,896 | |
Rights | | | | | | | | | | | | | | | | |
United States | | | — | | | | — | | | | — | (a) | | | — | (a) |
U.S. Treasury Obligations | | | | | | | | | | | | | | | | |
United States | | | — | | | | 2,277,793 | | | | — | | | | 2,277,793 | |
Short-Term Investments | | | | | | | | | | | | | | | | |
Foreign Government Treasury Bills | | | — | | | | 3,071,243 | | | | — | | | | 3,071,243 | |
Investment Company | | | 2,406,506 | | | | — | | | | — | | | | 2,406,506 | |
| | | | | | | | | | | | | | | | |
Total Investments in Securities | | $ | 27,358,897 | | | $ | 25,755,426 | | | $ | 942,836 | | | $ | 54,057,159 | |
| | | | | | | | | | | | | | | | |
Liabilities | |
Common Stocks | | | | | | | | | | | | | | | | |
Belgium | | $ | (43,482 | ) | | $ | — | | | $ | — | | | $ | (43,482 | ) |
Canada | | | (14,570 | ) | | | — | | | | — | | | | (14,570 | ) |
Sweden | | | (3,623 | ) | | | — | | | | — | | | | (3,623 | ) |
United States | | | (728,761 | ) | | | — | | | | — | | | | (728,761 | ) |
| | | | | | | | | | | | | | | | |
Total Common Stocks | | | (790,436 | ) | | | — | | | | — | | | | (790,436 | ) |
| | | | | | | | | | | | | | | | |
Total Liabilities in Securities Sold Short | | $ | (790,436 | ) | | $ | — | | | $ | — | | | $ | (790,436 | ) |
| | | | | | | | | | | | | | | | |
Appreciation in Other Financial Instruments | | | | | | | | | | | | | | | | |
Forward Foreign Currency Exchange Contracts | | $ | — | | | $ | 23,259 | | | $ | — | | | $ | 23,259 | |
Futures Contracts | | | 104,365 | | | | 21,645 | | | �� | — | | | | 126,010 | |
| | | | | | | | | | | | | | | | |
Total Appreciation in Other Financial Instruments | | $ | 104,365 | | | $ | 44,904 | | | $ | — | | | $ | 149,269 | |
| | | | | | | | | | | | | | | | |
Depreciation in Other Financial Instruments | | | | | | | | | | | | | | | | |
Forward Foreign Currency Exchange Contracts | | $ | — | | | $ | (173,088 | ) | | $ | — | | | $ | (173,088 | ) |
Futures Contracts | | | (9,942 | ) | | | (3,867 | ) | | | — | | | | (13,809 | ) |
| | | | | | | | | | | | | | | | |
Total Depreciation in Other Financial Instruments | | $ | (9,942 | ) | | $ | (176,955 | ) | | $ | — | | | $ | (186,897 | ) |
| | | | | | | | | | | | | | | | |
Transfers between fair values are valued utilizing values as of the beginning of the year.
There were no significant transfers among any levels during six months ended June 30, 2017.
The following is a summary of investments for which significant unobservable inputs (level 3) were used in determining fair value:
| | | | | | | | | | | | | | | | | | | | | | | | | | | | | | | | | | | | |
| | | Balance as of
December 31, 2016 | | | Realized
gain (loss) | | | Change in
unrealized
appreciation
(depreciation) | | | Net
accretion
(amortization) | | | Purchases1 | | | Sales2 | | | Transfers
into Level 3 | | | Transfers
out
of Level 3 | | | Balance as of
June 30, 2017 | |
Investments in Securities | | | | | | | | | | | | | | | | | | | | | | | | | | | | | | | | | | | | |
Asset-Backed Securities | | $ | 1,667,376 | | | $ | 13,768 | | | $ | 20,395 | | | $ | 1,973 | | | $ | 126,956 | | | $ | (721,405 | ) | | $ | — | | | $ | (166,227 | ) | | $ | 942,836 | |
Rights — United States | | | — | | | | — | | | | — | (a) | | | — | | | | — | (a) | | | — | | | | — | | | | — | | | | — | (a) |
| | | | | | | | | | | | | | | | | | | | | | | | | | | | | | | | | | | | |
| | $ | 1,667,376 | | | $ | 13,768 | | | $ | 20,395 | | | $ | 1,973 | | | $ | 126,956 | | | $ | (721,405 | ) | | $ | — | | | $ | (166,227 | ) | | $ | 942,836 | |
| | | | | | | | | | | | | | | | | | | | | | | | | | | | | | | | | | | | |
| | | | | | |
| | | |
| 24 | | | | JPMORGAN INSURANCE TRUST | | JUNE 30, 2017 |
| 1 | Purchases include all purchases of securities and securities received in corporate actions. |
| 2 | Sales include all sales of securities, maturities, paydowns and securities tendered in corporate actions. |
The change in net unrealized appreciation (depreciation) attributable to securities owned at June 30, 2017, which were valued using significant unobservable inputs (level 3) amounted to $21,749. This amount is included in Change in net unrealized appreciation/depreciation of investments in non-affiliates on the Statement of Operations.
Quantitative Information about Level 3 Fair Value Measurements
| | | | | | | | | | | | |
| | | Fair Value at
June 30, 2017 | | | Valuation Technique(s) | | Unobservable Input | | Range (Weighted Average) | |
| | $ | 942,836 | | | Discounted Cash Flow | | Constant Prepayment Rate | | | 0.00% - 10.00% (5.43%) | |
| | | | | | | | Constant Default Rate | | | 2.75% - 6.90% (4.58%) | |
| | | | | | | | Yield (Discount Rate of Cash Flows) | | | 2.71% - 6.93% (3.82%) | |
| | | | | | | | | | | | |
| Asset-Backed Securities | | | 942,836 | | | | | | | | | |
| |
| | | — | (a) | | Pending Distribution Amount | | Expected Recovery | | | 0.00% (0.00%) | |
| |
| Rights | | | — | | | | | | | | | |
| |
| Total | | $ | 942,836 | | | | | | | | | |
| |
The significant unobservable inputs used in the fair value measurement of the Portfolio’s investments are listed above. Generally, a change in the assumptions used in any input in isolation may be accompanied by a change in another input. Significant changes in any of the unobservable inputs may significantly impact the fair value measurement. The impact is based on the relationship between each unobservable input and the fair value measurement. Significant increases (decreases) in the yield and default rate may decrease (increase) the fair value measurement. A significant change in the prepayment rate (Constant Prepayment Rate or PSA Prepayment Model) may decrease or increase the fair value measurement.
B. Investment Transactions with Affiliates — The Portfolio invested in Underlying Funds which are advised by the Adviser or its affiliates. An issuer which is under common control with the Portfolio may be considered an affiliate. For the purposes of the financial statements, the Portfolio assumes the issuers listed in the table below to be affiliated issuers. Underlying Funds’ distributions may be reinvested into the Underlying Funds. Reinvestment amounts are included in the purchase cost amounts in the table below. Included in the realized gain (loss) amounts in the table below are distributions of realized capital gains, if any, received from the Underlying Funds.
| | | | | | | | | | | | | | | | | | | | | | | | | | | | |
| | | | | | For the six months ended June 30, 2017 | | | | | | | |
| Affiliate | | Value at
December 31,
2016 | | | Purchase
Cost | | | Sales
Proceeds | | | Realized
Gain/(Loss) | | | Dividend
Income | | | Shares at
June 30,
2017 | | | Value at
June 30, 2017 | |
JPMorgan Emerging Markets Debt Fund, Class R6 Shares | | $ | 1,642,285 | | | $ | 38,190 | | | $ | 126,559 | | | $ | (1,850 | ) | | $ | 38,191 | | | | 196,077 | | | $ | 1,613,716 | |
JPMorgan Emerging Markets Equity Fund, Class R6 Shares | | | 1,898,492 | | | | — | | | | 419,889 | | | | 59,116 | | | | — | | | | 72,396 | | | | 1,867,097 | |
JPMorgan High Yield Fund, Class R6 Shares | | | 16,774,896 | | | | 347,780 | | | | 7,955,504 | | | | (47,640 | ) | | | 347,780 | | | | 1,261,635 | | | | 9,386,565 | |
JPMorgan U.S. Government Money Market Fund, Institutional Class Shares | | | 1,660,681 | | | | 19,729,897 | | | | 18,984,072 | | | | — | | | | 9,164 | | | | 2,406,506 | | | | 2,406,506 | |
| | | | | | | | | | | | | | | | | | | | | | | | | | | | |
| | $ | 21,976,354 | | | | | | | | | | | $ | 9,626 | | | $ | 395,135 | | | | | | | $ | 15,273,884 | |
| | | | | | | | | | | | | | | | | | | | | | | | | | | | |
C. Derivatives — The Portfolio used derivative instruments including futures, forward foreign currency exchange contracts and options, in connection with its investment strategy. Derivative instruments may be used as substitutes for securities in which the Portfolio can invest, to hedge portfolio investments or to generate income or gain to the Portfolio. Derivatives may also be used for risk management purposes and to seek to enhance portfolio performance.
The Portfolio may be subject to various risks from the use of derivatives including the risk that changes in the value of a derivative may not correlate perfectly with the underlying asset, rate or index; counterparty credit risk related to derivatives counterparties’ failure to perform under contract terms; liquidity risk related to the lack of a liquid market for these contracts allowing the Portfolio to close out its position(s); and, documentation risk relating to disagreement over contract terms. Investing in certain derivatives also results in a form of leverage and as such, the Portfolio’s risk of loss associated with these instruments may exceed their value, as recorded on the Statement of Assets and Liabilities.
| | | | | | | | |
| | | |
| JUNE 30, 2017 | | JPMORGAN INSURANCE TRUST | | | | | 25 | |
NOTES TO FINANCIAL STATEMENTS
AS OF JUNE 30, 2017 (Unaudited) (continued)
The Portfolio is party to various derivative contracts governed by International Swaps and Derivatives Association master agreements (“ISDA agreements”). The Portfolio’s ISDA agreements, which are separately negotiated with each dealer counterparty, may contain provisions allowing, absent other considerations, a counterparty to exercise rights, to the extent not otherwise waived, against the Portfolio in the event the Portfolio’s net assets decline over time by a pre-determined percentage or fall below a pre-determined floor. The ISDA agreements may also contain provisions allowing, absent other conditions, the Portfolio to exercise rights, to the extent not otherwise waived, against the counterparty (i.e., decline in a counterparty’s credit rating below a specified level). Such rights for both the counterparty and Portfolio often include the ability to terminate (i.e., close out) open contracts at prices which may favor the counterparty, which could have an adverse effect on the Portfolio. The ISDA agreements give the Portfolio and counterparty the right, upon an event of default, to close out all transactions traded under such agreements and to net amounts owed or due across all transactions and offset such net payable or receivable with collateral posted to a segregated account by one party to the other.
Counterparty credit risk may be mitigated to the extent a counterparty posts collateral for mark to market gains to the Portfolio.
Notes C(1) — C(3) below describe the various derivatives used by the Portfolio.
(1). Options — The Portfolio may purchase and/or sell (“write”) put and call options on various instruments including futures, securities, currencies and swaps (“swaptions”) to manage and hedge interest rate risks within the Portfolio and also to gain long or short exposure to the underlying instrument, index, currency or rate. A purchaser of a put option has the right, but not the obligation, to sell the underlying instrument at an agreed upon price (“strike price”) to the option seller. A purchaser of a call option has the right, but not the obligation, to purchase the underlying instrument at the strike price from the option seller. Swaptions and Eurodollar options are settled for cash.
Options Purchased — Premiums paid by the Portfolio for options purchased are included in the Statement of Assets and Liabilities as an investment. The option is adjusted daily to reflect the current market value of the option and the change is recorded as Change in unrealized appreciation/ depreciation of investments in non-affiliates on the Statement of Operations. If the option is allowed to expire, the Portfolio will lose the entire premium they paid and record a realized loss for the premium amount. Premiums paid for options purchased which are exercised or closed are added to the amounts paid or offset against the proceeds on the underlying investment transaction to determine the realized gain (loss) or cost basis of the underlying investment.
The Portfolio’s exchange traded options contracts are not subject to master netting agreements (the right to close out all transactions traded with a counterparty and net amounts owed or due across transactions).
The Portfolio may be required to post or receive collateral for over the counter options.
(2). Futures Contracts — The Portfolio used treasury, index or other financial futures contracts to manage and hedge interest rate risk associated with portfolio investments and to gain or reduce exposure to the stock and bond markets.
Futures contracts provide for the delayed delivery of the underlying instrument at a fixed price or are settled for a cash amount based on the change in the value of the underlying instrument at a specific date in the future. Upon entering into a futures contract, the Portfolio is required to deposit with the broker, cash or securities in an amount equal to a certain percentage of the contract amount, which is referred to as the initial margin deposit. Subsequent payments, referred to as variation margin, are made or received by the Portfolio periodically and are based on changes in the market value of open futures contracts. Changes in the market value of open futures contracts are recorded as Change in net unrealized appreciation/depreciation on the Statement of Operations. Realized gains or losses, representing the difference between the value of the contract at the time it was opened and the value at the time it was closed, are reported on the Statement of Operations at the closing or expiration of the futures contract. Securities deposited as initial margin are designated on the SOI and cash deposited is recorded on the Statement of Assets and Liabilities. A receivable from and/or a payable to brokers for the daily variation margin is also recorded on the Statement of Assets and Liabilities.
The use of futures contracts exposes the Portfolio to interest rate and equity price risks. The Portfolio may be subject to the risk that the change in the value of the futures contract may not correlate perfectly with the underlying instrument. Use of long futures contracts subjects the Portfolio to risk of loss in excess of the amounts shown on the Statement of Assets and Liabilities, up to the notional amount of the futures contracts. Use of short futures contracts subjects the Portfolio to unlimited risk of loss. The Portfolio may enter into futures contracts only on exchanges or boards of trade. The exchange or board of trade acts as the counterparty to each futures transaction; therefore, the Portfolio’s credit risk is limited to failure of the exchange or board of trade. Under some circumstances, futures exchanges may establish daily limits on the amount that the price of a futures contract can vary from the previous day’s settlement price, which could effectively prevent liquidation of positions.
The Portfolio’s futures contracts are not subject to master netting arrangements (the right to close out all transactions with a counterparty and net amounts owed or due across transactions).
(3). Forward Foreign Currency Exchange Contracts — The Portfolio may be exposed to foreign currency risks associated with some or all of the portfolio investments and used forward foreign currency exchange contracts to hedge or manage certain of these exposures as part of an investment strategy. The Portfolio also bought forward foreign currency exchange contracts to gain exposure to currencies. Forward foreign currency exchange contracts represent obligations to purchase or sell foreign currency on a specified future date at a price fixed at the time the contracts are entered into. Non-deliverable forward foreign currency exchange contracts are settled with the counterparty in U.S. dollar without the delivery of foreign currency.
| | | | | | |
| | | |
| 26 | | | | JPMORGAN INSURANCE TRUST | | JUNE 30, 2017 |
The values of the forward foreign currency exchange contracts are adjusted daily based on the applicable exchange rate of the underlying currency. Changes in the value of these contracts are recorded as unrealized appreciation or depreciation until the contract settlement date. When the forward foreign currency exchange contract is closed, the Portfolio records a realized gain or loss equal to the difference between the value at the time the contract was opened and the value at the time it was closed. The Portfolio also records a realized gain or loss when a forward foreign currency exchange contract offsets another forward foreign currency exchange contract with the same counterparty upon settlement.
The Portfolio’s forward foreign currency exchange contracts are subject to master netting arrangements (the right to close out all transactions with a counterparty and net amounts owed or due across transactions). The Portfolio may be required to post or receive collateral for non-deliverable forward foreign currency exchange contracts.
(4). Summary of Derivatives Information — The following table presents the value of derivatives held as of June 30, 2017, by their primary underlying risk exposure and respective location on the Statement of Assets and Liabilities:
| | | | | | | | | | | | | | | | | | |
| Derivative Contracts | | Statements of Assets and Liabilities Location | |
| Gross Assets: | | | | Options (a) | | | Futures
Contracts (b) | | | Forward Foreign
Currency Exchange
Contracts | | | Total | |
Interest rate contracts | | Receivables, Net Assets — Unrealized Appreciation | | $ | — | | | $ | 24,218 | | | $ | — | | | $ | 24,218 | |
Foreign exchange contracts | | Receivables | | | — | | | | 64,154 | | | | 23,259 | | | | 87,413 | |
Equity contracts | | Receivables, Net Assets — Unrealized Appreciation | | | 169,033 | | | | 37,638 | | | | — | | | | 206,671 | |
| | | | | | | | | | | | | | | | | | |
Total | | | | $ | 169,033 | | | $ | 126,010 | | | $ | 23,259 | | | $ | 318,302 | |
| | | | | | | | | | | | | | | | | | |
| | | | | |
Gross Liabilities: | | | | | | | | | | | | | | |
Interest rate contracts | | Payables, Net Assets — Unrealized Depreciation | | $ | — | | | $ | (7,085 | ) | | | — | | | $ | (7,085 | ) |
Foreign exchange contracts | | Payables | | | — | | | | — | | | | (173,088 | ) | | | (173,088 | ) |
Equity contracts | | Payables, Net Assets — Unrealized Depreciation | | | — | | | | (6,724 | ) | | | — | | | | (6,724 | ) |
| | | | | | | | | | | | | | | | | | |
Total | | | | $ | — | | | $ | (13,809 | ) | | $ | (173,088 | ) | | $ | (186,897 | ) |
| | | | | | | | | | | | | | | | | | |
| (a) | The market value of options purchased is reported as Investments in non-affiliates, at value on the Statement of Assets and Liabilities. |
| (b) | This amount represents the cumulative appreciation (depreciation) of futures contracts as reported on the SOI. The Statement of Assets and Liabilities only reflect the current day variation margin receivable/payable from/to brokers. |
The following tables present the effect of derivatives on the Statement of Operations for the six months ended June 30, 2017, by primary underlying risk exposure:
| | | | | | | | | | | | | | | | |
| Amount of Realized Gain (Loss) on Derivatives Recognized on the Statement of Operations | |
| Derivative Contracts | | Options | | | Futures Contracts | | | Forward Foreign
Currency Exchange
Contracts | | | Total | |
Interest rate contracts | | $ | — | | | $ | (9,618 | ) | | $ | — | | | $ | (9,618 | ) |
Foreign exchange contracts | | | — | | | | 30,224 | | | | (284,075 | ) | | | (253,851 | ) |
Equity contracts | | | 523,047 | | | | 587,959 | | | | — | | | | 1,111,006 | |
| | | | | | | | | | | | | | | | |
Total | | $ | 523,047 | | | $ | 608,565 | | | $ | (284,075 | ) | | $ | 847,537 | |
| | | | | | | | | | | | | | | | |
| | | | | | | | | | | | | | | | |
| Amount of Change in Unrealized Appreciation (Depreciation) on Derivatives Recognized on the Statement of Operations | |
| Derivative Contracts | | Options | | | Futures Contracts | | | Forward Foreign
Currency Exchange
Contracts | | | Total | |
Interest rate contracts | | $ | — | | | $ | 6,754 | | | $ | — | | | $ | 6,754 | |
Foreign exchange contracts | | | — | | | | 28,626 | | | | (118,658 | ) | | | (90,032 | ) |
Equity contracts | | | (190,340 | ) | | | 227,151 | | | | — | | | | 36,811 | |
| | | | | | | | | | | | | | | | |
Total | | $ | (190,340 | ) | | $ | 262,531 | | | $ | (118,658 | ) | | $ | (46,467 | ) |
| | | | | | | | | | | | | | | | |
The Portfolio’s derivatives contracts held at June 30, 2017 are not accounted for as hedging instruments under GAAP.
| | | | | | | | |
| | | |
| JUNE 30, 2017 | | JPMORGAN INSURANCE TRUST | | | | | 27 | |
NOTES TO FINANCIAL STATEMENTS
AS OF JUNE 30, 2017 (Unaudited) (continued)
Derivatives Volume
The tables below disclose the volume of the Portfolio’s futures contracts, forward foreign currency exchange contracts and options activity during the six months ended June 30, 2017. Please refer to the tables in the Summary of Derivatives Information for derivative-related gains and losses associated with volume activity.
| | | | |
Futures Contracts: | | | | |
Equity | | | | |
Average Notional Balance Long | | $ | 8,365,646 | |
Average Notional Balance Short | | | 788,259 | |
Ending Notional Balance Long | | | 3,706,259 | |
Ending Notional Balance Short | | | 471,936 | |
Foreign Exchange | | | | |
Average Notional Balance Long | | | 2,583,472 | |
Average Notional Balance Short | | | 2,403,500 | (a) |
Ending Notional Balance Long | | | 3,440,100 | |
Interest Rate | | | | |
Average Notional Balance Long | | | 515,044 | |
Average Notional Balance Short | | | 4,216,513 | |
Ending Notional Balance Long | | | 397,396 | |
Ending Notional Balance Short | | | 2,972,264 | |
| |
Forward Foreign Currency Exchange Contracts: | | | | |
Average Settlement Value Purchased | | | 367,914 | |
Average Settlement Value Sold | | | 8,767,664 | |
Ending Settlement Value Purchased | | | 558,770 | |
Ending Settlement Value Sold | | | 11,068,835 | |
| |
Exchange-Traded Options: | | | | |
Average Number of Contracts Purchased | | | 784 | |
Ending Number of Contracts Purchased | | | 998 | |
| (a) | For the period December 1, 2016 through January 31, 2017. |
D. Short Sales — The Portfolio engaged in short sales as part of its normal investment activities. In a short sale, the Portfolio sells securities it does not own in anticipation of a decline in the market value of those securities. In order to deliver securities to the purchaser, the Portfolio borrows securities from a broker. To close out a short position, the Portfolio delivers the same securities to the broker.
The Portfolio is required to pledge cash or securities to the broker as collateral for the securities sold short. Collateral requirements are calculated daily based on the current market value of the short positions. Cash collateral deposited with the broker is recorded as an asset on the Statements of Assets and Liabilities. Securities segregated as collateral are denoted on the SOIs. The Portfolio may receive or pay the net of the following amounts:(i) a portion of the income from the investment of cash collateral; (ii) the broker’s fee on the borrowed securities (calculated daily based upon the market value of each borrowed security and a variable rate that is dependent on availability of the security); and (iii) a financing charge for the difference between the market value of the short position and cash collateral deposited with the broker. The net amounts of income or fees are included as interest income or interest expense on securities sold short on the Statement of Operations.
The Portfolio is obligated to pay the broker dividends declared on short positions when a position is open on the record date. Dividends on short positions are reported on ex-dividend date on the Statement of Operations as dividend expense on securities sold short. Liabilities for securities sold short are reported at market value on the Statement of Assets and Liabilities and the change in market value is recorded as Change in net unrealized appreciation/depreciation on the Statement of Operations. Short sale transactions may result in unlimited losses as the security’s price increases and the short position loses value. There is no upward limit on the price a borrowed security could attain. The Portfolio is also subject to risk of loss if the broker were to fail to perform its obligations under the contractual terms.
The Portfolio will record a realized loss if the price of the borrowed security increases between the date of the short sale and the date on which the Portfolio replaces the borrowed security. The Portfolio will record a realized gain if the price of the borrowed security declines between those dates.
As of June 30, 2017, the Portfolio had outstanding short sales as listed on the SOI.
E. Foreign Currency Translation — The books and records of the Portfolio are maintained in U.S. dollars. Foreign currency amounts are translated into U.S. dollars at the prevailing exchange rates of such currencies against the U.S. dollar. The market value of investment securities and other assets and liabilities are translated at the exchange rate as of the valuation date. Purchases and sales of investment securities, income and expenses are translated at the exchange rate prevailing on the respective dates of such transactions.
| | | | | | |
| | | |
| 28 | | | | JPMORGAN INSURANCE TRUST | | JUNE 30, 2017 |
The Portfolio does not isolate the effect of changes in foreign exchange rates from changes in market prices on securities held. Accordingly, such changes are included within Change in net unrealized appreciation/depreciation on investments on the Statement of Operations.
Reported realized foreign currency gains and losses arise from the disposition of foreign currency, currency gains or losses realized between the trade and settlement dates on securities transactions, and the difference between the amounts of dividends, interest and foreign withholding taxes recorded on the Portfolio’s books on the transaction date and the U.S. dollar equivalent of the amounts actually received or paid. These reported realized foreign currency gains and losses are included in Net realized gain (loss) on foreign currency transactions on the Statement of Operations. Unrealized foreign currency gains and losses arise from changes (due to changes in exchange rates) in the value of foreign currency and other assets and liabilities denominated in foreign currencies, which are held at period end and are included in Change in net unrealized appreciation/depreciation on foreign currency translations on the Statement of Operations.
F. Security Transactions and Investment Income — Investment transactions are accounted for on the trade date (the date the order to buy or sell is executed). Securities gains and losses are calculated on a specifically identified cost basis. Interest income is determined on the basis of coupon interest accrued using the effective interest method which adjusts for amortization of premiums and accretion of discounts. Dividend income, net of foreign taxes withheld, if any, and distributions of net investment income and realized capital gains from the Underlying Funds, if any, are recorded on the ex-dividend date or when the Portfolio first learns of the dividend.
G. Allocation of Income and Expenses — Expenses directly attributable to a portfolio are charged directly to that portfolio, while the expenses attributable to more than one portfolio of the Trust are allocated among the respective portfolios. In calculating the NAV of each class, investment income, realized and unrealized gains and losses and expenses, other than class-specific expenses, are allocated daily to each class of shares based upon the proportion of net assets of each class at the beginning of each day.
The Portfolio invests in Underlying Funds and, as a result, bears a portion of the expenses incurred by these Underlying Funds. These expenses are not reflected in the expenses shown on the Statement of Operations and are not included in the ratios to average net assets shown in the Financial Highlights. Certain expenses of affiliated Underlying Funds are waived as described in Note 3.E.
H. Federal Income Taxes — The Portfolio is treated as a separate taxable entity for Federal income tax purposes. The Portfolio’s policy is to comply with the provisions of the Internal Revenue Code of 1986, as amended (the “Code”), applicable to regulated investment companies and to distribute to shareholders all of its distributable net investment income and net realized capital gains on investments. Accordingly, no provision for Federal income tax is necessary. The Portfolio is also a segregated portfolio of assets for insurance purposes and intends to comply with the diversification requirements of Subchapter L of the Code. Management has reviewed the Portfolio’s tax positions for all open tax years and has determined that as of June 30, 2017, no liability for income tax is required in the Portfolio’s financial statements for net unrecognized tax benefits. However, management’s conclusions may be subject to future review based on changes in, or the interpretation of, the accounting standards or tax laws and regulations. The Portfolio’s Federal tax returns for the prior three fiscal years, or since inception if shorter, remain subject to examination by the Internal Revenue Service.
I. Foreign Taxes — The Portfolio may be subject to foreign taxes on income, gains on investments or currency purchases/repatriation, a portion of which may be recoverable. The Portfolio will accrue such taxes and recoveries as applicable, based upon its current interpretation of tax rules and regulations that exist in the markets in which it invests.
J. Distributions to Shareholders — Distributions from net investment income are generally declared and paid at least annually and are declared separately for each class. No class has preferential dividend rights; differences in per share rates are due to differences in separate class expenses. Net realized capital gains, if any, are distributed at least annually. The amount of distributions from net investment income and net realized capital gains is determined in accordance with Federal income tax regulations, which may differ from GAAP. To the extent these “book/tax” differences are permanent in nature (i.e., that they result from other than timing of recognition — “temporary differences”), such amounts are reclassified within the capital accounts based on their Federal tax-basis treatment.
3. Fees and Other Transactions with Affiliates
A. Investment Advisory Fee — Pursuant to an Investment Advisory Agreement, the Adviser supervises the investments of the Portfolio and for such services is paid a fee. The fee is accrued daily and paid monthly based on the Portfolio’s average daily net assets at an annual rate of 0.60%.
The Adviser waived Investment Advisory fees and/or reimbursed expenses as outlined in Note 3.E.
B. Administration Fee — Pursuant to an Administration Agreement, the Administrator provides certain administration services to the Portfolio. In consideration of these services, the Administrator receives a fee accrued daily and paid monthly at an annual rate of 0.15% of the first $25 billion of the average daily net assets of all funds in the J.P. Morgan Funds Complex covered by the Administration Agreement (excluding certain funds of funds and money market funds) and 0.075% of the average daily net assets in excess of $25 billion of all such funds. For the six months ended June 30, 2017, the effective annualized rate was 0.08% of the Portfolio’s average daily net assets, notwithstanding any fee waivers and/or expense reimbursements.
JPMorgan Chase Bank, N.A (“JPMCB”), a wholly-owned subsidiary of JPMorgan serves as the Portfolio’s sub-administrator (the “Sub-administrator”). For its services as Sub-administrator, JPMCB receives a portion of the fees payable to the Administrator.
The Administrator waived Administration fees as outlined in Note 3.E.
| | | | | | | | |
| | | |
| JUNE 30, 2017 | | JPMORGAN INSURANCE TRUST | | | | | 29 | |
NOTES TO FINANCIAL STATEMENTS
AS OF JUNE 30, 2017 (Unaudited) (continued)
C. Distribution Fees — Pursuant to a Distribution Agreement, JPMorgan Distribution Services, Inc. (“JPMDS”), a wholly-owned subsidiary of JPMorgan, serves as the Trust’s principal underwriter and promotes and arranges for the sale of the Portfolio’s shares.
The Board has adopted a Distribution Plan (the “Distribution Plan”) for Class 2 Shares of the Portfolio in accordance with Rule 12b-1 under the 1940 Act. The Class 1 Shares do not charge a distribution fee. The Distribution Plan provides that the Portfolio shall pay distribution fees, including payments to JPMDS, at an annual rate of 0.25% of the average daily net assets of Class 2 Shares.
D. Custodian and Accounting Fees — JPMCB provides portfolio custody and accounting services to the Portfolio. For performing these services, the Portfolio pays JPMCB transaction and asset-based fees that vary according to the number of transactions and positions, plus out-of-pocket expenses. The amounts paid directly to JPMCB by the Portfolio for custody and accounting services are included in Custodian and accounting fees on the Statement of Operations. Payments to the custodian may be reduced by credits earned by the Portfolio, based on uninvested cash balances held by the custodian. Such earnings credits, if any, are presented separately on the Statement of Operations.
Interest income earned on cash balances at the custodian, if any, is included in Interest income from affiliates on the Statement of Operations
Interest expense paid to the custodian related to cash overdrafts, if any, is included in Interest expense to affiliates on the Statement of Operations.
E. Waivers and Reimbursements — The Adviser (for all share classes), Administrator (for all share classes) and/or JPMDS (for Class 2 Shares) have contractually agreed to waive fees and/or reimburse the Portfolio to the extent that total annual operating expenses of the Portfolio (excluding acquired fund fees and expenses, other than certain money market fund fees as described below, dividend and interest expenses related to short sales, interest, taxes, expenses related to litigation and potential litigation and extraordinary expenses) exceed the percentages of the Portfolio’s respective average daily net assets as shown in the table below:
| | | | | | | | |
| | | Class 1 | | | Class 2 | |
| | | 0.78 | % | | | 1.03 | % |
The expense limitation agreement was in effect for the six months ended June 30, 2017 and is in place until at least April 30, 2018.
For the six months ended June 30, 2017, the Portfolio’s service providers waived fees for the Portfolio as follows. None of these parties expect the Portfolio to repay any such waived fees in future years.
| | | | | | | | | | | | | | | | |
| | | Contractual Waivers | | | | |
| | | Investment
Advisory Fees | | | Administration Fees | | | Total | | | Contractual
Reimbursements | |
| | $ | 38,111 | | | $ | 21,494 | | | $ | 59,605 | | | $ | 22 | |
Additionally, the Portfolio may invest in one or more money market funds advised by the Adviser or its affiliates (affiliated money market funds). The Adviser, Administrator and/or JPMDS have contractually agreed to waive fees and/or reimburse expenses in an amount sufficient to offset the respective net fees each collects from the affiliated money market fund on the Portfolio’s investment in such affiliated money market fund.
The amount of waivers resulting from investments in these money market funds for the six months ended June 30, 2017 was $3,119.
The Underlying Funds may impose separate advisory fees. The Portfolio’s Adviser has agreed to waive the Portfolio’s advisory fees in the weighted average pro-rata amount of the advisory fees charged by the affiliated Underlying Funds. These waivers may be in addition to any waivers required to meet the Portfolio’s contractual expense limitations, but will not exceed the Portfolio’s advisory fee.
F. Other — Certain officers of the Trust are affiliated with the Adviser, the Administrator and JPMDS. Such officers, with the exception of the Chief Compliance Officer, receive no compensation from the Portfolio for serving in their respective roles.
The Board appointed a Chief Compliance Officer to the Portfolio in accordance with Federal securities regulations. The Portfolio, along with other affiliated portfolios, makes reimbursement payments, on a pro-rata basis, to the Administrator for a portion of the fees associated with the Office of the Chief Compliance Officer. Such fees are included in Trustees’ and Chief Compliance Officer’s fees on the Statement of Operations.
The Trust adopted a Trustee Deferred Compensation Plan (the “Plan”) which allows the Independent Trustees to defer the receipt of all or a portion of compensation related to performance of their duties as Trustees. The deferred fees are invested in various J.P. Morgan Funds until distribution in accordance with the Plan.
The Portfolio may use related party broker-dealers. For the six months ended June 30, 2017, the Portfolio did not incurred any brokerage commissions with broker-dealers affiliated with the Adviser.
The Securities and Exchange Commission (“SEC”) has granted an exemptive order permitting the Portfolio to engage in principal transactions with J.P. Morgan Securities, Inc., an affiliated broker, involving taxable money market instruments, subject to certain conditions.
| | | | | | |
| | | |
| 30 | | | | JPMORGAN INSURANCE TRUST | | JUNE 30, 2017 |
4. Investment Transactions
During the six months ended June 30, 2017, purchases and sales of investments (excluding short-term investments) were as follows:
| | | | | | | | | | | | | | | | | | | | | | | | |
| | | Purchases
(excluding
U.S. Government) | | | Sales
(excluding
U.S. Government) | | | Purchases
of U.S.
Government | | | Sales
of U.S.
Government | | | Securities
Sold Short | | | Covers on
Securities
Sold Short | |
| | $ | 15,465,724 | | | $ | 17,972,005 | | | $ | 1,833,399 | | | $ | 683,762 | | | $ | 3,011,773 | | | $ | 2,629,944 | |
5. Federal Income Tax Matters
For Federal income tax purposes, the estimated cost and unrealized appreciation (depreciation) in value of investment securities held at June 30, 2017 were as follows:
| | | | | | | | | | | | | | | | |
| | | Aggregate
Cost | | | Gross
Unrealized
Appreciation | | | Gross
Unrealized
Depreciation | | | Net Unrealized
Appreciation
(Depreciation) | |
| | $ | 49,760,567 | | | $ | 4,862,210 | | | $ | 565,618 | | | $ | 4,296,592 | |
During the year ended December 31, 2016, the Portfolio had long-term capital loss carryforwards in the amount of $90,845.
6. Borrowings
The Portfolio relies upon an exemptive order granted by the SEC (the “Order”) permitting the establishment and operation of an Interfund Lending Facility (the “Facility”). The Facility allows the Portfolio to directly lend and borrow money to or from any other fund relying upon the Order at rates beneficial to both the borrowing and lending funds. Advances under the Facility are taken primarily for temporary or emergency purposes, including the meeting of redemption requests that otherwise might require the untimely disposition of securities, and are subject to the Portfolio’s borrowing restrictions. The Interfund loan rate is determined, as specified in the Order, by averaging the current repurchase agreement rate and the current bank loan rate. The Order was granted to the Trust and may be relied upon by the Portfolio because the Portfolio and the series of the Trust are all investment companies in the same “group of investment companies” (as defined in Section 12(d)(1)(G) of the 1940 Act).
The Trust and JPMCB have entered into a financing arrangement. Under this arrangement, JPMCB provides an unsecured, uncommitted credit facility in the aggregate amount of $100 million to certain of the J.P. Morgan Funds, including the Portfolio. Advances under the arrangement are taken primarily for temporary or emergency purposes, including the meeting of redemption requests that otherwise might require the untimely disposition of securities, and are subject to the Portfolio’s borrowing restrictions. Interest on borrowings is payable at a rate determined by JPMCB at the time of borrowing. This agreement has been extended until November 6, 2017.
The Portfolio had no borrowings outstanding from the unsecured, uncommitted credit facility during the six months ended June 30, 2017.
In addition, effective August 16, 2016, the Trust along with certain other trusts (“Borrowers”) entered into a joint syndicated senior unsecured revolving credit facility totaling $1.5 billion (“Credit Facility”) with various lenders and The Bank of New York Mellon, as administrative agent for the lenders. This Credit Facility provides a source of funds to the Borrowers for temporary and emergency purposes, including the meeting of redemption requests that otherwise might require the untimely disposition of securities. Under the terms of the Credit Facility, a borrowing portfolio must have a minimum of $25,000,000 in adjusted net asset value and not exceed certain adjusted net asset coverage ratios prior to and during the time in which any borrowings are outstanding. If a portfolio does not comply with the aforementioned requirements, the portfolio must remediate within three business days with respect to the $25,000,000 minimum adjusted net asset value or within one business day with respect to certain asset coverage ratios or the administrative agent at the request of, or with the consent of, the lenders may terminate the Credit Facility and declare any outstanding borrowings to be due and payable immediately.
Interest associated with any borrowing under the Credit Facility is charged to the borrowing portfolio at a rate of interest equal to 1.00% plus the greater of the federal funds effective rate or one month LIBOR. The annual commitment fee to maintain the Credit Facility is 0.15% and is incurred on the unused portion of the Credit Facility and is allocated to all participating portfolios pro rata based on their respective net assets. Effective August 15, 2017, this agreement has been amended and restated for a term of 364 days, unless extended. The Portfolio did not utilize the Credit Facility during the six months ended June 30, 2017.
7. Risks, Concentrations and Indemnifications
In the normal course of business, the Portfolio enters into contracts that contain a variety of representations which provide general indemnifications. The Portfolio’s maximum exposure under these arrangements is unknown. The amount of exposure would depend on future claims that may be made against the Portfolio that have not yet occurred. However, based on experience, the Portfolio expects the risk of loss to be remote.
As of June 30, 2017, the Adviser owned shares representing 25.0% of the Portfolio’s net assets. As of June 30, 2017, the Portfolio had four omnibus accounts which owned 69.8% of the Portfolio’s outstanding shares. Significant shareholder transactions by these shareholders may impact the Portfolio’s performance and liquidity.
The Portfolio is subject to risks associated with securities with contractual cash flows including asset-backed and mortgage-related securities such as collateralized mortgage obligations. The value, liquidity and related income of these securities are sensitive to changes in economic conditions,
| | | | | | | | |
| | | |
| JUNE 30, 2017 | | JPMORGAN INSURANCE TRUST | | | | | 31 | |
NOTES TO FINANCIAL STATEMENTS
AS OF JUNE 30, 2017 (Unaudited) (continued)
including real estate value, prepayments, delinquencies and/or defaults, and may be adversely affected by shifts in the market’s perception of the issuers and changes in interest rates.
The Portfolio is subject to interest rate and credit risk. The value of debt securities may decline as interest rates increase. The Portfolio could lose money if the issuer of a fixed income security is unable to pay interest or repay principal when it is due. The Portfolio invests in floating rate debt securities. Although these investments are generally less sensitive to interest rate changes than other fixed rate instruments, the value of floating rate investments may decline if their interest rates do not rise as quickly, or as much, as general interest rates. Many factors can cause interest rates to rise. Some examples include central bank monetary policy, rising inflation rates and general economic conditions. Given the historically low interest rate environment, risks associated with rising rates are heightened. The ability of the issuers of debt to meet their obligations may be affected by the economic and political developments in a specific industry or region.
The Portfolio is also subject to counterparty credit risk, which is the risk that a counterparty fails to perform on agreements with the Portfolio such as option contracts and forward foreign currency exchange contracts.
Investing in securities of foreign countries may include certain risks and considerations not typically associated with investing in U.S. securities. These risks include revaluation of currencies, high rates of inflation, repatriation restrictions on income and currencies, and future and adverse political, social and economic developments.
As of June 30, 2017, a portion of the Portfolio’s investments consist of securities that are denominated in foreign currencies. Changes in currency exchange rates will affect the value of, and investment income from such securities.
Derivatives, including futures, options, swaps, and forwards, may be riskier than other types of investments and may increase the volatility of the Portfolio. Derivatives may be sensitive to changes in economic and market conditions and may create leverage, which could result in losses that significantly exceed the Portfolio’s original investment. Derivatives expose the Portfolio to counterparty risk, which is the risk that the derivative counterparty will not fulfill its contractual obligations (and includes credit risk associated with the counterparty). Certain derivatives are synthetic instruments that attempt to replicate the performance of certain reference assets. With regard to such derivatives, the Portfolio does not have a claim on the reference assets and is subject to enhanced counterparty risk. Derivatives may not perform as expected, so the Portfolio may not realize the intended benefits. When used for hedging, the change in value of a derivative may not correlate as expected with the security or other risk being hedged. In addition, given their complexity, derivatives expose the Portfolio to risks of mispricing or improper valuation. Because of the Portfolio’s investments in the Underlying Funds, the Portfolio indirectly pays a portion of the expenses incurred by the Underlying Funds. As a result, the cost of investing in the Portfolio may be higher than the cost of investing in a mutual fund that invests directly in individual securities and financial instruments. The Portfolio is also subject to certain risks related to the Underlying Funds’ investments in securities and financial instruments such as fixed income securities, including high yield, asset-backed and mortgage-related securities, equity securities, foreign and emerging markets securities, commodities and real estate securities. These securities are subject to risks specific to their structure, sector or market.
In addition, the Underlying Funds may use derivative instruments in connection with their individual investment strategies including futures, forward foreign currency exchange contracts, options, swaps and other derivatives, which are also subject to specific risks related to their structure, sector or market and may be riskier than investments in other types of securities.
Specific risks and concentrations present in the Underlying Funds are disclosed within their individual financial statements and registration statements, as appropriate.
As of June 30, 2017, the Portfolio pledged a significant portion of its assets for securities sold short to Citigroup Global Markets, Inc. and Deposits at broker for securities sold short, as noted on the Statement of Assets and Liabilities.
8. Investment Company Reporting Modernization
In October 2016, the U.S. Securities and Exchange Commission adopted new rules and forms, and amendments to certain current rules and forms, to modernize the reporting and disclosure of information by registered investment companies. In part, the final rules amend Regulation S-X and will require standardized, enhanced disclosures about derivatives in investment company financial statements, as well as other amendments. The amendments to Regulation S-X will apply to Portfolio’s fiscal year end on or after August 1, 2017. At this time, management is currently evaluating the impact of the Regulation S-X amendments on the Portfolio’s financial statements and related disclosures. The adoption will have no effect on the Portfolio’s net assets or result of operations.
| | | | | | |
| | | |
| 32 | | | | JPMORGAN INSURANCE TRUST | | JUNE 30, 2017 |
SCHEDULE OF SHAREHOLDER EXPENSES
(Unaudited)
Hypothetical $1,000 Investment
As a shareholder of the Portfolio, you incur ongoing costs, including investment advisory fees, administration fees, distribution fees (for Class 2 Shares) and other Portfolio expenses. Because the Portfolio is a funding vehicle for Policies and Eligible Plans, you may also incur sales charges and other fees relating to the Policies or Eligible Plans. The examples below are intended to help you understand your ongoing costs (in dollars) of investing in the Portfolio, but not the costs of the Policies or Eligible Plans, and to compare these ongoing costs with the ongoing costs of investing in other mutual funds. The examples assume that you had a $1,000 investment in each Class at the beginning of the reporting period, January 1, 2017, and continued to hold your shares at the end of the reporting period, June 30, 2017.
Actual Expenses
For each Class of the Portfolio in the table below, the first line provides information about actual account values and actual expenses. You may use the information in this line, together with the amount you invested, to estimate the expenses that you paid over the period. Simply divide your account value by $1,000 (for example, an $8,600 account value divided by $1,000 = 8.6), then multiply the result by the number in the first line of each Class under the heading entitled “Expenses Paid During the Period” to estimate the expenses you paid on your account during this period.
Hypothetical Example for Comparison Purposes
The second line of each Class in the table below provides information about hypothetical account values and hypothetical expenses based on the Class’ actual expense ratio and an assumed rate of return of 5% per year before expenses, which is not the Class’ actual return. The hypothetical account values and expenses may not be used to estimate the actual ending account balance or expenses you paid for the period. You may use this information to compare the ongoing costs of investing in the Class of the Portfolio and other funds. To do so, compare this 5% hypothetical example with the 5% hypothetical examples that appear in the shareholder reports of the other funds. Please note that the expenses shown in the table are meant to highlight your ongoing costs only and do not reflect any transaction costs, such as sales charges (loads) or redemption fees or the costs associated with the Policies and Eligible Plans through which the Portfolio is held. Therefore, the second line for each Class in the table is useful in comparing ongoing costs only, and will not help you determine the relative total costs of owning different funds. In addition, if these transaction costs were included, your costs would have been higher. The examples also assume all dividends and distributions have been reinvested.
| | | | | | | | | | | | | | | | |
| | | Beginning
Account Value
January 1, 2017 | | | Ending
Account Value
June 30, 2017 | | | Expenses
Paid During
the Period* | | | Annualized
Expense
Ratio | |
Global Allocation Portfolio | | | | | | | | | | | | | | | | |
Class 1 | | | | | | | | | | | | | | | | |
Actual | | $ | 1,000.00 | | | $ | 1,091.30 | | | $ | 4.15 | | | | 0.80 | % |
Hypothetical | | | 1,000.00 | | | | 1,020.83 | | | | 4.01 | | | | 0.80 | |
Class 2 | | | | | | | | | | | | | | | | |
Actual | | | 1,000.00 | | | | 1,090.10 | | | | 5.44 | | | | 1.05 | |
Hypothetical | | | 1,000.00 | | | | 1,019.59 | | | | 5.26 | | | | 1.05 | |
| * | Expenses are equal to each Class' respective annualized expense ratio, multiplied by the average account value over the period, multiplied by 181/365 ( to reflect the one-half year period). |
| | | | | | | | |
| | | |
| JUNE 30, 2017 | | JPMORGAN INSURANCE TRUST | | | | | 33 | |
J.P. Morgan Funds are distributed by JPMorgan Distribution Services, Inc., which is an affiliate of JPMorgan Chase & Co. Affiliates of JPMorgan Chase & Co. receive fees for providing various services to the funds.
Contact JPMorgan Distribution Services, Inc. at 1-800-480-4111 for a portfolio prospectus. You can also visit us at www.jpmorganfunds.com. Investors should carefully consider the investment objectives and risk as well as charges and expenses of the mutual fund before investing. The prospectus contains this and other information about the mutual fund. Read the prospectus carefully before investing.
The Portfolio files a complete schedule of its portfolio holdings for the first and third quarters of its fiscal year with the SEC on Form N-Q. The Portfolio’s Forms N-Q are available on the SEC’s website at http://www.sec.gov and may be reviewed and copied at the SEC’s Public Reference Room in Washington, DC. Information on the operation of the SEC’s Public Reference Room may be obtained by calling 1-800-SEC-0330. Shareholders may request the Form N-Q without charge by calling 1-800-480-4111 or by visiting the variable insurance portfolio section of the J.P. Morgan Funds’ website at www.jpmorganfunds.com.
A description of the Portfolio’s policies and procedures with respect to the disclosure of the Portfolio’s holdings is available in the prospectus and Statement of Additional Information.
A copy of proxy policies and procedures is available without charge upon request by calling 1-800-480-4111 and on the Portfolio’s website at www.jpmorganfunds.com. A description of such policies and procedures is on the SEC’s website at www.sec.gov. The Trustees have delegated the authority to vote proxies for securities owned by the Portfolio to the Adviser. A copy of the Portfolio’s voting record for the most recent 12-month period ended June 30 is available on the SEC’s website at www.sec.gov or at the Portfolio’s website at www.jpmorganfunds.com no later than August 31 of each year. The Portfolio’s proxy voting record will include, among other things, a brief description of the matter voted on for each portfolio security, and will state how each vote was cast, for example, for or against the proposal.

J.P. Morgan Asset Management is the marketing name for the asset management businesses of JPMorgan Chase & Co. Those businesses include, but are not limited to, J.P. Morgan Investment Management Inc., Security Capital Research & Management Incorporated and J.P. Morgan Alternative Asset Management, Inc.
| | | | |
| | © JPMorgan Chase & Co., 2017. All rights reserved. June 2017. | | SAN-JPMITGAP-617 |
ITEM 2. CODE OF ETHICS.
Disclose whether, as of the end of the period covered by the report, the registrant has adopted a code of ethics that applies to the registrant’s principal executive officer, principal financial officer, principal accounting officer or controller, or persons performing similar functions, regardless of whether these individuals are employed by the registrant or a third party. If the registrant has not adopted such a code of ethics, explain why it has not done so.
The registrant must briefly describe the nature of any amendment, during the period covered by the report, to a provision of its code of ethics that applies to the registrant’s principal executive officer, principal financial officer, principal accounting officer or controller, or persons performing similar functions, regardless of whether these individuals are employed by the registrant or a third party, and that relates to any element of the code of ethics definition enumerated in paragraph (b) of this Item. The registrant must file a copy of any such amendment as an exhibit pursuant to Item 12(a)(1), unless the registrant has elected to satisfy paragraph (f) of this Item by positing its code of ethics on its website pursuant to paragraph (f)(2) of this Item, or by undertaking to provide its code of ethics to any person without charge, upon request, pursuant to paragraph (f)(3) of this Item.
If the registrant has, during the period covered by the report, granted a waiver, including an implicit waiver, from a provision of the code of ethics that applies to the registrant’s principal executive officer, principal financial officer, principal accounting officer or controller, or persons performing similar functions, regardless of whether these individuals are employed by the registrant or third party, that relates to one or more items set forth in paragraph (b) of this Item, the registrant must briefly describe the nature of the waiver, the name of the person to whom the waiver was granted, and the date of the waiver.
Not applicable to a semi-annual report.
ITEM 3. AUDIT COMMITTEE FINANCIAL EXPERT.
(a) (1) Disclose that the registrant’s board of directors has determined that the registrant either:
(i) Has at least one audit committee financial expert serving on its audit committee; or
(ii) Does not have an audit committee financial expert serving on its audit committee.
(2) If the registrant provides the disclosure required by paragraph (a)(1)(i) of this Item, it must disclose the name of the audit committee financial expert and whether that person is “independent.” In order to be considered “independent” for purposes of this Item, a member of an audit committee may not, other than in his or her capacity as a member of the audit committee, the board of directors, or any other board committee:
(i) Accept directly or indirectly any consulting, advisory, or other compensatory fee from the issuer; or
(ii) Be an “interested person” of the investment company as defined in Section 2(a)(19) of the Act (15 U.S.C. 80a-2(a)(19)).
(3) If the registrant provides the disclosure required by paragraph (a)(1)(ii) of this Item, it must explain why it does not have an audit committee financial expert.
Not applicable to a semi-annual report.
ITEM 4. PRINCIPAL ACCOUNTANT FEES AND SERVICES.
(a) Disclose, under the caption Audit Fees, the aggregate fees billed for each of the last two fiscal years for professional services rendered by the principal accountant for the audit of the registrant’s annual financial statements or services that are normally provided by the accountant in connection with statutory and regulatory filings or engagements for those fiscal years.
(b) Disclose, under the caption Audit-Related Fees, the aggregate fees billed in each of the last two fiscal years for assurance and related services by the principal accountant that are reasonably related to the performance of the audit of the registrant’s financial statements and are not reported under paragraph (a) of this Item. Registrants shall describe the nature of the services comprising the fees disclosed under this category.
(c) Disclose, under the caption Tax Fees, the aggregate fees billed in each of the last two fiscal years for professional services rendered by the principal accountant for tax compliance, tax advice, and tax planning. Registrants shall describe the nature of the services comprising the fees disclosed under this category.
(d) Disclose, under the caption All Other Fees, the aggregate fees billed in each of the last two fiscal years for products and services provided by the principal accountant, other than the services reported in paragraphs (a) through (c) of this Item. Registrants shall describe the nature of the services comprising the fees disclosed under this category.
(e) (1) Disclose the audit committee’s pre-approval policies and procedures described in paragraph (c)(7) of Rule 2-01 of Regulation S-X.
(2) Disclose the percentage of services described in each of paragraphs (b) through (d) of this Item that were approved by the audit committee pursuant to paragraph (c)(7)(i)(C) of Rule 2-01 of Regulation S-X.
(f) If greater than 50 percent, disclose the percentage of hours expended on the principal accountant’s engagement to audit the registrant’s financial statements for the most recent fiscal year that were attributed to work performed by persons other than the principal accountant’s full-time, permanent employees.
Not applicable to a semi-annual report.
(g) Disclose the aggregate non-audit fees billed by the registrant’s accountant for services rendered to the registrant, and rendered to the registrant’s investment adviser (not including any sub-adviser whose role is primarily portfolio management and is subcontracted with or overseen by another investment adviser), and any entity controlling, controlled by, or under common control with the adviser that provides ongoing services to the registrant for each of the last two fiscal years of the registrant.
(h) Disclose whether the registrant’s audit committee of the board of directors has considered whether the provision of non-audit services that were rendered to the registrant’s investment adviser (not including any subadviser whose role is primarily portfolio management and is subcontracted with or overseen by another investment adviser), and any entity controlling, controlled by, or under common control with the investment adviser that provides ongoing services to the registrant that were not pre-approved pursuant to paragraph (c)(7)(ii) of Rule 2-01 of Regulation S-X is compatible with maintaining the principal accountant’s independence.
Not applicable to a semi-annual report.
ITEM 5. AUDIT COMMITTEE OF LISTED REGISTRANTS.
(a) If the registrant is a listed issuer as defined in Rule 10A-3 under the Exchange Act (17CFR 240.10A-3), state whether or not the registrant has a separately-designated standing audit committee established in accordance with Section 3(a)(58)(A) of the Exchange Act (15 U.S.C. 78c(a)(58)(A)). If the registrant has such a committee, however designated, identify each committee member. If the entire board of directors is acting as the registrant’s audit committee as specified in Section 3(a)(58)(B) of the Exchange Act (15 U.S.C. 78c(a)(58)(B)), so state.
(b) If applicable, provide the disclosure required by Rule 10A-3(d) under the Exchange Act (17CFR 240.10A-3(d)) regarding an exemption from the listing standards for all audit committees.
Not applicable to a semi-annual report.
ITEM 6. SCHEDULE OF INVESTMENTS.
File Schedule I – Investments in securities of unaffiliated issuers as of the close of the reporting period as set forth in Section 210.12-12 of Regulation S-X, unless the schedule is included as part of the report to shareholders filed under Item 1 of this Form.
Included in Item 1.
ITEM 7. DISCLOSURE OF PROXY VOTING POLICIES AND PROCEDURES FOR CLOSED-END MANAGEMENT INVESTMENT COMPANIES.
A closed-end management investment company that is filing an annual report on this Form N-CSR must, unless it invests exclusively in non-voting securities, describe the policies and procedures that it uses to determine how to vote proxies relating to portfolio securities, including the procedures that the company uses when a vote presents a conflict between the interests of its shareholders, on the one hand, and those of the company’s investment adviser; principal underwriter; or any affiliated person (as defined in Section 2(a)(3) of the Investment Company Act of 1940 (15 U.S.C. 80a-2(a)(3)) and the rules thereunder) of the company, its investment adviser, or its principal underwriter, on the other. Include any policies and procedures of the company’s investment adviser, or any other third party, that the company uses, or that are used on the company’s behalf, to determine how to vote proxies relating to portfolio securities.
Not applicable.
ITEM 8. PORTFOLIO MANAGERS OF CLOSED-END MANAGEMENT INVESTMENT COMPANIES.
Not applicable.
ITEM 9. PURCHASE OF EQUITY SECURITIES BY CLOSED-END MANAGEMENT INVESTMENT COMPANY AND AFFILIATED PURCHASERS.
(a) If the registrant is a closed-end management investment company, provide the information specified in paragraph (b) of this Item with respect to any purchase made by or on behalf of the registrant or any “affiliated purchaser,” as defined in Rule 10b-18(a)(3) under the Exchange Act (17 CFR 240.10b-18(a)(3)), of shares or other units of any class of the registrant’s equity securities that is registered by the registrant pursuant to Section 12 of the Exchange Act (15 U.S.C. 781).
Not applicable.
ITEM 10. SUBMISSION OF MATTERS TO A VOTE OF SECURITY HOLDERS.
Describe any material changes to the procedures by which shareholders may recommend nominees to the registrant’s board of directors, where those changes were implemented after the registrant last provided disclosure in response to the requirements of Item 7(d)(2)(ii)(G) of Schedule 14A (17 CFR 240.14a-101), or this Item.
No material changes to report.
ITEM 11. CONTROLS AND PROCEDURES.
(a) Disclose the conclusions of the registrant’s principal executive and principal financial officers, or persons performing similar functions, regarding the effectiveness of the registrant’s disclosure controls and procedures (as defined in Rule 30a-3(c) under the Act (17 CFR 270.30a-3(c))) as of a date within 90 days of the filing date of the report that includes the disclosure required by this paragraph, based on the evaluation of these controls and procedures required by Rule 30a-3(b) under the Act (17 CFR 270.30a-3(b)) and Rules 13a-15(b) or 15d-15(b) under the Exchange Act (17 CFR 240.13a-15(b) or 240.15d-15(b)).
The Registrant’s principal executive and principal financial officers have concluded, based on their evaluation of the Registrant’s disclosure controls and procedures as of a date within 90 days of the filing date of this report, that the Registrant’s disclosure controls and procedures are reasonably designed to ensure that information required to be disclosed by the Registrant on Form N-CSR is recorded, processed, summarized and reported within the required time periods and that information required to be disclosed by the Registrant in the reports that it files or submits on Form N-CSR is accumulated and communicated to the Registrant’s management, including its principal executive and principal financial officers, as appropriate to allow timely decisions regarding required disclosure.
(b) Disclose any change in the registrant’s internal control over financial reporting (as defined in Rule 30a-3(d) under the Act (17 CFR 270.30a-3(d)) that occurred during the registrant’s second fiscal quarter of the period covered by this report that has materially affected, or is reasonably likely to materially affect, the registrant’s internal control over financial reporting.
There were no changes in the Registrant’s internal control over financial reporting that occurred during the last fiscal quarter covered by this report that have materially affected, or are reasonably likely to materially affect, the Registrant’s internal control over financial reporting.
ITEM 12. EXHIBITS.
(a) File the exhibits listed below as part of this Form. Letter or number the exhibits in the sequence indicated.
(a)(1) Any code of ethics, or amendment thereto, that is the subject of the disclosure required by Item 2, to the extent that the registrant intends to satisfy the Item 2 requirements through filing of an exhibit.
Not applicable.
(a)(2) A separate certification for each principal executive officer and principal financial officer of the registrant as required by Rule 30a-2(a) under the Act (17 CFR 270.30a-2).
Certifications pursuant to Rule 30a-2(a) under the Investment Company Act of 1940 are attached hereto.
(a)(3) Any written solicitation to purchase securities under Rule 23c-1 under the Act (17 CFR 270.23c-1) sent or given during the period covered by the report by or on behalf of the registrant to 10 or more persons.
Not applicable.
(b) A separate or combined certification for each principal executive officer and principal officer of the registrant as required by Rule 30a-2(b) under the Act of 1940.
Certifications pursuant to Rule 30a-2(b) under the Investment Company Act of 1940 are attached hereto.
SIGNATURES
Pursuant to the requirements of the Securities Exchange Act of 1934 and the Investment Company Act of 1940, the registrant has duly caused this report to be signed on its behalf by the undersigned, thereunto duly authorized.
JPMorgan Insurance Trust
| | |
| By: | | /s/ Brian S. Shlissel |
| | Brian S. Shlissel |
| | President and Principal Executive Officer |
| | August 24, 2017 |
Pursuant to the requirements of the Securities Exchange Act of 1934 and the Investment Company Act of 1940, this report has been signed below by the following persons on behalf of the registrant and in the capacities and on the dates indicated.
| | |
| By: | | /s/ Brian S. Shlissel |
| | Brian S. Shlissel |
| | President and Principal Executive Officer |
| | August 24, 2017 |
| | |
| By: | | /s/ Laura M. Del Prato |
| | Laura M. Del Prato |
| | Treasurer and Principal Financial Officer |
| | August 24, 2017 |