UNITED STATES
SECURITIES AND EXCHANGE COMMISSION
Washington, D.C. 20549
FORM N-CSR
Certified Shareholder Report of
Registered Management Investment Companies
Investment Company Act File Number: 811-07888
Limited Term Tax-Exempt Bond Fund of America
(Exact Name of Registrant as Specified in Charter)
333 South Hope Street
Los Angeles, California 90071
(Address of Principal Executive Offices)
Registrant's telephone number, including area code: (213) 486-9200
Date of fiscal year end: July 31
Date of reporting period: January 31, 2016
Steven I. Koszalka
Limited Term Tax-Exempt Bond Fund of America
333 South Hope Street
Los Angeles, California 90071
(Name and Address of Agent for Service)
ITEM 1 – Reports to Stockholders

| |  | | American Funds Short-Term Tax-Exempt Bond Fund®
Limited Term Tax-Exempt Bond Fund of America®
The Tax-Exempt Bond Fund of America®
American High-Income Municipal Bond Fund®
The Tax-Exempt Fund of California®
American Funds Tax-Exempt Fund of New York®
Semi-annual reports for the six months
ended January 31, 2016 | |
| | | | |
American Funds Short-Term Tax-Exempt Bond Fund seeks to provide you with current income exempt from regular federal income tax, consistent with the maturity and quality standards described in the prospectus, and to preserve capital.
Limited Term Tax-Exempt Bond Fund of America seeks to provide you with current income exempt from regular federal income tax, consistent with the maturity and quality standards described in the prospectus, and to preserve capital.
The Tax-Exempt Bond Fund of America seeks to provide you with a high level of current income exempt from federal income tax, consistent with the preservation of capital.
American High-Income Municipal Bond Fund seeks to provide you with a high level of current income exempt from regular federal income tax.
The Tax-Exempt Fund of California seeks to provide you with a high level of current income exempt from regular federal and California state income taxes. Its secondary objective is preservation of capital.
American Funds Tax-Exempt Fund of New York seeks to provide you with a high level of current income exempt from regular federal, New York state and New York City income taxes. Its secondary objective is preservation of capital.
Each fund is one of more than 40 offered by one of the nation’s largest mutual fund families, American Funds, from Capital Group. For more than 80 years, Capital has invested with a long-term focus based on thorough research and attention to risk.
Fund results shown in this report, unless otherwise indicated, are for Class A shares at net asset value. If a sales charge had been deducted (maximum 2.50% for American Funds Short-Term Tax-Exempt Bond Fund and Limited Term Tax-Exempt Bond Fund of America; 3.75% for The Tax-Exempt Bond Fund of America, American High-Income Municipal Bond Fund, The Tax-Exempt Fund of California and American Funds Tax-Exempt Fund of New York), the results would have been lower. Results are for past periods and are not predictive of results for future periods. Current and future results may be lower or higher than those shown. Share prices and returns will vary, so investors may lose money. Investing for short periods makes losses more likely. Investments are not FDIC-insured, nor are they deposits of or guaranteed by a bank or any other entity, so they may lose value. For current information and month-end results, visit americanfunds.com.
Here are the total returns on a $1,000 investment with all distributions reinvested for periods ended December 31, 2015 (the most recent calendar quarter-end) and the total annual fund operating expense ratios as of the prospectus dated October 1, 2015:
| | | Cumulative total returns | | Average annual total returns | | Gross |
| Class A shares | | 1 year | | 5 years | | 10 years/Lifetime* | | expense ratios |
| | | | | | | | | |
| Reflecting 2.50% maximum sales charge | | | | | | | | | | | | | | | | |
| American Funds Short-Term Tax-Exempt Bond Fund | | | –2.05 | % | | | 0.70 | % | | | 1.34 | % | | | 0.58 | % |
| Limited Term Tax-Exempt Bond Fund of America | | | –1.12 | | | | 2.62 | | | | 3.15 | | | | 0.57 | |
| | | | | | | | | | | | | | | | | |
| Reflecting 3.75% maximum sales charge | | | | | | | | | | | | | | | | |
| The Tax-Exempt Bond Fund of America | | | –0.75 | | | | 4.91 | | | | 4.00 | | | | 0.54 | |
| American High-Income Municipal Bond Fund | | | 0.46 | | | | 6.79 | | | | 4.34 | | | | 0.68 | |
| The Tax-Exempt Fund of California | | | –0.47 | | | | 5.73 | | | | 4.27 | | | | 0.62 | |
| American Funds Tax-Exempt Fund of New York | | | –0.90 | | | | 4.54 | | | | 3.71 | | | | 0.72 | |
| * | Applicable only to American Funds Tax-Exempt Fund of New York, which began operations on 11/1/10. All other funds reflect 10-year results. |
For other share class results, visit americanfunds.com.
The 10-year investment result for American Funds Short-Term Tax-Exempt Bond Fund includes the fund’s results as a money market fund through the date of its conversion (August 7, 2009) to a short-term tax-exempt bond fund, and therefore is not representative of the fund’s results had it operated as a short-term tax-exempt bond fund for the full term of that period. Investment results assume all distributions are reinvested and reflect applicable fees and expenses. When applicable, investment results reflect fee waivers and/or expense reimbursements, without which results would have been lower. The investment adviser is currently reimbursing a portion of other expenses for American Funds Tax-Exempt Fund of New York. Investment results reflect the reimbursement, without which the results would have been lower. This reimbursement will be in effect through at least September 30, 2016, unless modified or terminated by the fund’s board. The adviser may elect at its discretion to extend, modify or terminate the reimbursement at that time. Visit americanfunds.com for more information.
A summary of each fund’s 30-day yield can be found on page 3.

Fellow investors:
We are pleased to present you with this semi-annual report for American Funds Short-Term Tax-Exempt Bond Fund, Limited Term Tax-Exempt Bond Fund of America, The Tax-Exempt Bond Fund of America, American High-Income Municipal Bond Fund, The Tax-Exempt Fund of California and American Funds Tax-Exempt Fund of New York. This report covers the period from August 1, 2015, through January 31, 2016.
Municipal bond prices advanced steadily throughout the first half of the funds’ fiscal year, as investors began to shift their focus from an impending increase in U.S. interest rates to geopolitical conflicts, slowing global growth and falling energy prices. Against this backdrop, all six funds delivered solid gains. Total returns ranged from 0.69% for American Funds Short-Term Tax-Exempt Bond Fund to 4.23% for American High-Income Municipal Bond Fund. (See pages 4 through 9 for fund specific results and information.)
Economic and market overview
Municipal bond market returns were broadly positive over the reporting period. In fact, January marked the seventh consecutive month of gains for the Barclays Municipal Bond Index, a broad measure of the investment-grade (bonds rated BBB/Baa and above) municipal market.
This strength could be attributed to a number of factors. Equity markets were volatile. The unmanaged Standard & Poor’s 500 Composite Index, a market capitalization-weighted index based on the results of 500 widely held common stocks, slid 6.77% for the six months ended January 31, 2016. Uneasy investors turned to higher quality fixed-income securities for their potential to provide relative stability. The yield on 10-year U.S. Treasury bonds fell from 2.20% on July 31, 2015, to 1.94% at the close of the period. Tax-exempt bonds also benefitted from the flight to quality, as the broader municipal market delivered stronger returns than Treasuries. The Barclays Municipal Bond Index was up 3.66%, compared to a 2.11% gain for the Barclays U.S. Treasury Index.
China’s economic woes and record-low oil prices did have an adverse impact on some areas of the taxable bond market, particularly among high-yield taxable bonds. However, this was not the case in the tax-exempt bond market. In fact, the current low cost of oil can be helpful to some areas of the tax-exempt market. Consider, for example, revenue bonds supporting toll roads and bridges, which benefit as greater numbers of drivers take advantage of lower gas prices.
Strong inflows into municipal bond mutual funds and relatively low issuance also facilitated an increase in bond prices. Broadly speaking, the fiscal health of municipal issuers continues to improve with a few exceptions, most notably Puerto Rico. Recently, government officials indicated that principal and interest payments on some bonds may be suspended so that essential services will not be jeopardized. We remind investors that Puerto Rico’s unique
| American Funds Tax-Exempt Funds | 1 |

challenges have little bearing on the health of the thousands of other issuers in the diverse municipal bond market.
After maintaining the federal funds rate near 0% since 2006, the Federal Reserve in December increased it to a target range of .25% to .50%. Investors had been anticipating this move for several months. As such, there was little immediate impact on the bond markets.
In general, municipal bonds of lower credit quality outgained those of higher rated issuers, and longer term bonds tended to outpace those with shorter maturities. Given the moderate growth of the U.S. economy and the Fed’s anticipated rate hike last December, most of the funds covered in this report took a conservative stance, maintaining relatively short duration positions over the six months. While we are pleased with the funds’ overall results and how the funds are positioned going into the second half of the year, this conservative approach proved to be a drag on returns in relative terms.
Looking ahead
The factors that have triggered greater volatility in equity markets and some areas of the taxable bond market play a much smaller role in the municipal bond market. Slowing global growth has primarily affected issuers in the energy sector or those that generate revenues in non-U.S. currencies. These largely have been issuers in the taxable bond market.
Although recently there have been some mixed signals about the pace of growth, the U.S. economy remains among the strongest in the world. The Fed has indicated that there will be further rate hikes, but faced with ongoing economic challenges, there seems to be little certainty as to when that might happen.
In this environment we are paying close attention to risk as we seek out investments that can add value for our investors. While valuations are richer today than they were at the start of the fiscal year, we believe we are finding solid investment opportunities at reasonable prices.
We look forward to reporting back to you at the close of the fiscal year.
Sincerely,

Brenda S. Ellerin
President, American Funds Short-Term Tax-Exempt Bond Fund and Limited Term Tax-Exempt Bond Fund of America

Neil L. Langberg
President, The Tax-Exempt Bond Fund of America and The Tax-Exempt Fund of California

Karl J. Zeile
President, American High-Income Municipal Bond Fund and American Funds Tax-Exempt Fund of New York
March 14, 2016
For current information about the funds, visit americanfunds.com.
| 2 | American Funds Tax-Exempt Funds |
Funds’ 30-day yields
Below is a summary of each fund’s 30-day yield and 12-month distribution rate for Class A shares as of February 29, 2016. Both measures reflect the 2.50%/3.75% maximum sales charge. Each fund’s 30-day yield is calculated in accordance with the U.S. Securities and Exchange Commission (SEC) formula. The SEC yield reflects the rate at which each fund is earning income on its current portfolio of securities while the distribution rate reflects the funds’ past dividends paid to shareholders. Accordingly, the funds’ SEC yields and distribution rates may differ. The equivalent taxable yield assumes a 43.4% tax rate.1
| Class A shares | | SEC
30-day yield | | Equivalent
taxable yield | | 12-month
distribution rate |
| Reflecting 2.50% maximum sales charge | | | | | | | | | | | | |
| American Funds Short-Term Tax-Exempt Bond Fund | | | 0.48 | % | | | 0.85 | % | | | 0.99 | % |
| Limited Term Tax-Exempt Bond Fund of America | | | 0.62 | | | | 1.10 | | | | 2.23 | |
| | | | | | | | | | | | | |
| Reflecting 3.75% maximum sales charge | | | | | | | | | | | | |
| The Tax-Exempt Bond Fund of America | | | 1.46 | | | | 2.58 | | | | 3.07 | |
| American High-Income Municipal Bond Fund | | | 2.64 | | | | 4.66 | | | | 3.84 | |
| The Tax-Exempt Fund of California | | | 1.06 | | | | 2.16 | 2 | | | 3.15 | |
| American Funds Tax-Exempt Fund of New York | | | 1.37 | 3 | | | 2.65 | 4 | | | 2.53 | |
| 1 | Based on 2015 federal tax rates. For the year 2015, there will be an Unearned Income Medicare Contribution Tax of 3.8% that applies to net investment income for taxpayers whose modified adjusted gross income exceeds $200,000 (for single filers) and $250,000 (for married filing jointly). Thus taxpayers in the highest tax bracket will face a combined 43.4% marginal tax rate on their investment income. The federal rates do not include an adjustment for the loss of personal exemptions and the phaseout of itemized deductions that are applicable to certain taxable income levels. |
| 2 | For investors in the 50.93% federal and California state tax bracket. |
| 3 | The SEC 30-day yield for American Funds Tax-Exempt Fund of New York is 1.43% with the fund’s reimbursement. |
| 4 | For investors in the 48.39% federal and New York state tax bracket. |
The return of principal for bond funds and for funds with significant underlying bond holdings is not guaranteed. Fund shares are subject to the same interest rate, inflation and credit risks associated with the underlying bond holdings. Income may be subject to state or local income taxes and/or federal alternative minimum taxes. Also, certain other income (such as distributions from gains on the sale of certain bonds purchased at less than par value for The Tax-Exempt Bond Fund of America), as well as capital gain distributions, may be taxable. High-yield/lower rated bonds are subject to greater fluctuations in value and risk of loss of income and principal than investment-grade/higher rated bonds. The Tax-Exempt Fund of California and American Funds Tax-Exempt Fund of New York are more susceptible to factors adversely affecting issuers of each state’s tax-exempt securities than a more widely diversified municipal bond fund. Refer to the funds’ prospectus and the Risk Factors section of this report for more information on these and other risks associated with investing in the funds.
| American Funds Tax-Exempt Funds | 3 |
American Funds Short-Term Tax-Exempt Bond Fund
The fund generated a 0.69% total return for the first half of the fiscal year, slightly exceeding the 0.63% gain of the Lipper Short Municipal Debt Funds Average, a peer group measure. However, the fund trailed the 1.13% gain of the unmanaged Barclays Municipal Short 1–5 Years Index, which has no expenses. Investors cannot invest directly in an index.
The fund paid monthly dividends totaling about 5 cents a share for the six months. This amounts to a federally tax-exempt income return of 0.49% for investors who reinvested dividends. This is equivalent to a taxable income return of 0.87% for investors in the 43.4%1 maximum federal tax bracket. A portion of the fund’s return also may be exempt from some state and local taxes.
As we have indicated in previous reports, the fund’s managers continued to focus on providing relative stability. With yields near multiyear lows, the fund maintained its focus on high-quality issues of shorter duration. Some of the fund’s strongest contributions came from revenue bonds supporting single family housing, hospital facilities and airports.
Tax-exempt yields vs. taxable yields
Find your estimated taxable income below to determine your federal tax rate,2 then look in the far right column to see what you would have had to earn from a taxable investment to equal the fund’s 1.00% tax-exempt distribution rate3 as of January 31, 2016.
| If your taxable income is ... | | ... then your federal | | The fund’s tax-exempt
distribution rate of 1.00% is |
| Single | | Joint | | tax rate is ... | | equivalent to a taxable rate of ... |
| $ | 0 – | 9,225 | | | $ | 0 – | 18,450 | | | | 10.0 | % | | | 1.11 | % |
| | 9,226 – | 37,450 | | | | 18,451 – | 74,900 | | | | 15.0 | | | | 1.18 | |
| | 37,451 – | 90,750 | | | | 74,901 – | 151,200 | | | | 25.0 | | | | 1.33 | |
| | 90,751 – | 189,300 | | | | 151,201 – | 230,450 | | | | 28.0 | | | | 1.39 | |
| | 189,301 – | 411,500 | | | | 230,451 – | 411,500 | | | | 36.8 | 1 | | | 1.58 | |
| | 411,501 – | 413,200 | | | | 411,501 – | 464,850 | | | | 38.8 | 1 | | | 1.63 | |
| | Over 413,200 | | | | Over 464,850 | | | | 43.4 | 1 | | | 1.77 | |
| 1 | For the year 2015, there will be an Unearned Income Medicare Contribution Tax of 3.8% that applies to net investment income for taxpayers whose modified adjusted gross income exceeds $200,000 (for single filers) and $250,000 (for married filing jointly). Thus taxpayers in the highest tax bracket will face a combined 43.4% marginal tax rate on their investment income. |
| 2 | Based on 2015 federal tax rates. The federal rates do not include an adjustment for the loss of personal exemptions and the phaseout of itemized deductions that are applicable to certain taxable income levels. |
| 3 | The distribution rate is based on dividends paid over the last 12 months divided by the maximum offering price as of January 31, 2016. Capital gain distributions, if any, are added back at the maximum offering price to determine the rate. |
Fund results shown are for Class A shares at net asset value. If a sales charge (maximum 2.50%) had been deducted, the results would have been lower. Results are for past periods and are not predictive of results for future periods. Current and future results may be lower or higher than those shown. Share prices and returns will vary, so investors may lose money. For current information and month-end results, visit americanfunds.com.
| 4 | American Funds Tax-Exempt Funds |
Limited Term Tax-Exempt Bond Fund of America
The fund produced a 1.73% total return for the six months ended January 31, which lagged the 2.36% total return of the unmanaged Barclays Municipal Short-Intermediate 1–10 Years Index, which has no expenses. Investors cannot invest directly in an index. By way of comparison, the fund’s result was in line with the 1.74% total return of the Lipper Short-Intermediate Municipal Debt Funds Average, a peer group measure.
The fund paid monthly dividends totaling about 18.3 cents a share for the period. Those individuals who reinvested dividends received a federally tax-exempt income return of 1.16%. This is equivalent to a taxable income return of 2.05% for investors in the 43.4%1 maximum federal tax bracket.
The fund focuses primarily on investment-grade bonds (those rated BBB/Baa and above) with maturities ranging from a few years to 10 years. In recent months, the fund’s managers have maintained a relatively conservative approach, seeking to maintain a relatively short duration. This helped dampen returns in a strong market. However, the fund’s managers take a long-term view of the market and believe their approach will serve investors well as interest rates begin to normalize.
Tax-exempt yields vs. taxable yields
Find your estimated taxable income below to determine your federal tax rate,2 then look in the far right column to see what you would have had to earn from a taxable investment to equal the fund’s 2.25% tax-exempt distribution rate3 as of January 31, 2016.
| If your taxable income is ... | | ... then your federal | | The fund’s tax-exempt
distribution rate of 2.25% is |
| Single | | Joint | | tax rate is ... | | equivalent to a taxable rate of ... |
| $ | 0 – | 9,225 | | | $ | 0 – | 18,450 | | | | 10.0 | % | | | 2.50 | % |
| | 9,226 – | 37,450 | | | | 18,451 – | 74,900 | | | | 15.0 | | | | 2.65 | |
| | 37,451 – | 90,750 | | | | 74,901 – | 151,200 | | | | 25.0 | | | | 3.00 | |
| | 90,751 – | 189,300 | | | | 151,201 – | 230,450 | | | | 28.0 | | | | 3.13 | |
| | 189,301 – | 411,500 | | | | 230,451 – | 411,500 | | | | 36.8 | 1 | | | 3.56 | |
| | 411,501 – | 413,200 | | | | 411,501 – | 464,850 | | | | 38.8 | 1 | | | 3.68 | |
| | Over 413,200 | | | | Over 464,850 | | | | 43.4 | 1 | | | 3.98 | |
| 1 | For the year 2015, there will be an Unearned Income Medicare Contribution Tax of 3.8% that applies to net investment income for taxpayers whose modified adjusted gross income exceeds $200,000 (for single filers) and $250,000 (for married filing jointly). Thus taxpayers in the highest tax bracket will face a combined 43.4% marginal tax rate on their investment income. |
| 2 | Based on 2015 federal tax rates. The federal rates do not include an adjustment for the loss of personal exemptions and the phaseout of itemized deductions that are applicable to certain taxable income levels. |
| 3 | The distribution rate is based on dividends paid over the last 12 months divided by the maximum offering price as of January 31, 2016. Capital gain distributions, if any, are added back at the maximum offering price to determine the rate. |
Fund results shown are for Class A shares at net asset value. If a sales charge (maximum 2.50%) had been deducted, the results would have been lower. Results are for past periods and are not predictive of results for future periods. Current and future results may be lower or higher than those shown. Share prices and returns will vary, so investors may lose money. For current information and month-end results, visit americanfunds.com.
| American Funds Tax-Exempt Funds | 5 |
The Tax-Exempt Bond Fund of America
The fund generated a 3.35% total return during the six-month period, which slightly trailed both the 3.66% gain of the unmanaged Barclays Municipal Bond Index, which has no expenses, and the 3.51% total return of the Lipper General & Insured Municipal Debt Funds Average, a peer group measure. Investors cannot invest directly in an index.
During the period, the fund paid monthly dividends totaling about 21.1 cents a share, amounting to a federally tax-exempt income return of 1.64% for investors who reinvested dividends. This is equivalent to a taxable income return of 2.90% for investors in the 43.4%1 maximum federal tax bracket. The fund does not invest in bonds subject to the Alternative Minimum Tax (AMT).
The fund’s managers continued on a relatively conservative path during the first half of the fiscal year, focusing on shorter duration securities. While the fund delivered positive results, this approach held the fund back slightly in relative terms. The fund’s managers continue to seek out opportunities for incremental yield while paying close attention to risk. At the close of the period about 91% of the portfolio’s holdings were in revenue bonds. The largest concentrations were in holdings backing hospital facilities, toll roads and airports.
Tax-exempt yields vs. taxable yields
Find your estimated taxable income below to determine your federal tax rate,2 then look in the far right column to see what you would have had to earn from a taxable investment to equal the fund’s 3.06% tax-exempt distribution rate3 as of January 31, 2016.
| If your taxable income is ... | | ... then your federal | | The fund’s tax-exempt
distribution rate of 3.06% is |
| Single | | Joint | | tax rate is ... | | equivalent to a taxable rate of ... |
| $ | 0 – | 9,225 | | | $ | 0 – | 18,450 | | | | 10.0 | % | | | 3.40 | % |
| | 9,226 – | 37,450 | | | | 18,451 – | 74,900 | | | | 15.0 | | | | 3.60 | |
| | 37,451 – | 90,750 | | | | 74,901 – | 151,200 | | | | 25.0 | | | | 4.08 | |
| | 90,751 – | 189,300 | | | | 151,201 – | 230,450 | | | | 28.0 | | | | 4.25 | |
| | 189,301 – | 411,500 | | | | 230,451 – | 411,500 | | | | 36.8 | 1 | | | 4.84 | |
| | 411,501 – | 413,200 | | | | 411,501 – | 464,850 | | | | 38.8 | 1 | | | 5.00 | |
| | Over 413,200 | | | | Over 464,850 | | | | 43.4 | 1 | | | 5.41 | |
| 1 | For the year 2015, there will be an Unearned Income Medicare Contribution Tax of 3.8% that applies to net investment income for taxpayers whose modified adjusted gross income exceeds $200,000 (for single filers) and $250,000 (for married filing jointly). Thus taxpayers in the highest tax bracket will face a combined 43.4% marginal tax rate on their investment income. |
| 2 | Based on 2015 federal tax rates. The federal rates do not include an adjustment for the loss of personal exemptions and the phaseout of itemized deductions that are applicable to certain taxable income levels. |
| 3 | The distribution rate is based on dividends paid over the last 12 months divided by the maximum offering price as of January 31, 2016. Capital gain distributions, if any, are added back at the maximum offering price to determine the rate. |
Fund results shown are for Class A shares at net asset value. If a sales charge (maximum 3.75%) had been deducted, the results would have been lower. Results are for past periods and are not predictive of results for future periods. Current and future results may be lower or higher than those shown. Share prices and returns will vary, so investors may lose money. For current information and month-end results, visit americanfunds.com.
| 6 | American Funds Tax-Exempt Funds |
American High-Income Municipal Bond Fund
The fund produced a 4.23% gain for the period. This result lagged both the 4.96% total return of the unmanaged Barclays High Yield Municipal Bond Index, which has no expenses, and the 4.25% total return of the Lipper High Yield Municipal Debt Funds Average, a measure of the fund’s peer group. Investors cannot invest directly in an index.
For the period, the fund paid monthly dividends totaling 31.6 cents a share, amounting to a federally tax-exempt income return of 2.07% for investors who reinvested dividends. This is equivalent to a taxable income return of 3.66% for investors in the 43.4%1 maximum federal tax bracket. A portion of the fund’s return also may be exempt from some state and local taxes.
In a broadly constructive market environment, the fund’s return was supported by positive contributions from a number of sectors, with bonds backing hospitals, senior living facilities and airports producing some of the strongest gains.
Tax-exempt yields vs. taxable yields
Find your estimated taxable income below to determine your federal tax rate,2 then look in the far right column to see what you would have had to earn from a taxable investment to equal the fund’s 3.83% tax-exempt distribution rate3 as of January 31, 2016.
| If your taxable income is ... | | ... then your federal | | The fund’s tax-exempt
distribution rate of 3.83% is |
| Single | | Joint | | tax rate is ... | | equivalent to a taxable rate of ... |
| $ | 0 – | 9,225 | | | $ | 0 – | 18,450 | | | | 10.0 | % | | | 4.26 | % |
| | 9,226 – | 37,450 | | | | 18,451 – | 74,900 | | | | 15.0 | | | | 4.51 | |
| | 37,451 – | 90,750 | | | | 74,901 – | 151,200 | | | | 25.0 | | | | 5.11 | |
| | 90,751 – | 189,300 | | | | 151,201 – | 230,450 | | | | 28.0 | | | | 5.32 | |
| | 189,301 – | 411,500 | | | | 230,451 – | 411,500 | | | | 36.8 | 1 | | | 6.06 | |
| | 411,501 – | 413,200 | | | | 411,501 – | 464,850 | | | | 38.8 | 1 | | | 6.26 | |
| | Over 413,200 | | | | Over 464,850 | | | | 43.4 | 1 | | | 6.77 | |
| 1 | For the year 2015, there will be an Unearned Income Medicare Contribution Tax of 3.8% that applies to net investment income for taxpayers whose modified adjusted gross income exceeds $200,000 (for single filers) and $250,000 (for married filing jointly). Thus taxpayers in the highest tax bracket will face a combined 43.4% marginal tax rate on their investment income. |
| 2 | Based on 2015 federal tax rates. The federal rates do not include an adjustment for the loss of personal exemptions and the phaseout of itemized deductions that are applicable to certain taxable income levels. |
| 3 | The distribution rate is based on dividends paid over the last 12 months divided by the maximum offering price as of January 31, 2016. Capital gain distributions, if any, are added back at the maximum offering price to determine the rate. |
Fund results shown are for Class A shares at net asset value. If a sales charge (maximum 3.75%) had been deducted, the results would have been lower. Results are for past periods and are not predictive of results for future periods. Current and future results may be lower or higher than those shown. Share prices and returns will vary, so investors may lose money. For current information and month-end results, visit americanfunds.com.
| American Funds Tax-Exempt Funds | 7 |
The Tax-Exempt Fund of California
The fund produced a 3.52% total return for the six-month period. This result trailed the 3.63% advance of the unmanaged Barclays California Municipal Index, which has no expenses. Investors cannot invest directly in an index. The fund also lagged the 4.06% total return of the Lipper California Municipal Debt Funds Average, a peer group measure.
For the period, the fund paid monthly dividends totaling about 29.5 cents a share. Those investors who reinvested dividends received an income return of 1.69%. This is equivalent to a taxable income return of 3.44% for investors in the 50.93% effective combined federal and California tax bracket.
California’s economy and fiscal condition have returned to health, providing a constructive backdrop for the state municipal bond market. The state enjoyed solid job growth in 2015, as nonfarm payrolls rose 3%. The state’s unemployment rate has fallen from 7.0% in 2015 to about 5.8%.
The fund’s return was supported by positive contributions from holdings in every sector in the state market. Tax assessment and education bonds, as well as issues backing hospitals and higher education facilities, produced some of the strongest gains.
Tax-exempt yields vs. taxable yields
Find your estimated 2015 taxable income below to determine your combined federal and California tax rate,* then look in the right-hand column to see what you would have had to earn from a taxable investment to equal the fund’s 3.16% tax-exempt distribution rate† at January 31, 2016.
| If your taxable income is ... | | ... then your combined
federal and California | | The fund’s tax-exempt
distribution rate of 3.16% is |
| Single | | Joint | | state tax rate is ... | | equivalent to a taxable rate of ... |
| $ | 0 – | 7,749 | | | $ | 0 – | 15,498 | | | | 10.90 | % | | | 3.55 | % |
| | 7,750 – | 9,225 | | | | 15,499 – | 18,450 | | | | 11.80 | | | | 3.58 | |
| | 9,226 – | 18,371 | | | | 18,451 – | 36,742 | | | | 16.70 | | | | 3.79 | |
| | 18,372 – | 28,995 | | | | 36,743 – | 57,990 | | | | 18.40 | | | | 3.87 | |
| | 28,996 – | 37,450 | | | | 57,991 – | 74,900 | | | | 20.10 | | | | 3.95 | |
| | 37,451 – | 40,250 | | | | 74,901 – | 80,500 | | | | 29.50 | | | | 4.48 | |
| | 40,251 – | 50,689 | | | | 80,501 – | 101,738 | | | | 31.00 | | | | 4.58 | |
| | 50,690 – | 90,750 | | | | 101,739 – | 151,200 | | | | 31.98 | | | | 4.65 | |
| | 90,751 – | 189,300 | | | | 151,201 – | 230,450 | | | | 34.70 | | | | 4.84 | |
| | 189,301 – | 259,844 | | | | 230,451 – | 411,500 | | | | 42.68 | | | | 5.51 | |
| | 259,845 – | 311,812 | | | | – | | | | | 43.31 | | | | 5.57 | |
| | 311,813 – | 411,500 | | | | – | | | | | 43.94 | | | | 5.64 | |
| | – | | | | | 411,501 – | 464,850 | | | | 44.49 | | | | 5.69 | |
| | 411,501 – | 413,200 | | | | – | | | | | 45.72 | | | | 5.82 | |
| | – | | | | | 464,851 – | 519,688 | | | | 48.66 | | | | 6.16 | |
| | – | | | | | 519,689 – | 623,624 | | | | 49.23 | | | | 6.22 | |
| | 413,201 – | 519,867 | | | | 623,625 – | 1,000,000 | | | | 49.80 | | | | 6.29 | |
| | 519,868 – | 1,000,000 | | | 1,000,001 – | 1,039,374 | | | | 50.36 | | | | 6.37 | |
| | Over 1,000,000 | | | | Over 1,039,374 | | | | 50.93 | | | | 6.44 | |
| * | Based on 2015 federal and 2015 California tax rates. (State rates from 1.0% to 13.3% are individually calculated for each bracket. The federal brackets are expanded to include additional state brackets.) The effective combined tax rates paid by California residents may be lower than those shown due to the availability of income tax deductions. |
| † | The distribution rate is based on dividends paid over the last 12 months divided by the maximum offering price as of January 31, 2016. Capital gains distributions, if any, are added back at the maximum offering price to determine the rate. |
Fund results shown are for Class A shares at net asset value. If a sales charge (maximum 3.75%) had been deducted, the results would have been lower. Results are for past periods and are not predictive of results for future periods. Current and future results may be lower or higher than those shown. Share prices and returns will vary, so investors may lose money. For current information and month-end results, visit americanfunds.com.
| 8 | American Funds Tax-Exempt Funds |
American Funds Tax-Exempt Fund of New York
The fund generated a 3.40% total return for the period, trailing the 3.56% gain of the unmanaged Barclays New York Municipal Index, which has no expenses. Investors cannot invest directly in an index. The Lipper New York Municipal Debt Funds Average, a peer group measure, posted a 3.55% total return.
The fund paid monthly dividends totaling about 14 cents a share for the six months. This represents an income return of 1.32% for those who reinvested dividends. For investors in the 48.39% combined effective federal and New York state tax bracket, this is equivalent to a taxable income return of 2.56%. Investors subject to New York City taxes are eligible for additional tax advantages.
Holdings representing a broad spectrum of sectors, duration and credit quality bolstered the fund’s overall return. Revenue bonds supporting higher education and hospitals provided some of the strongest returns.
Tax-exempt yields vs. taxable yields
Find your estimated 2015 taxable income below to determine your combined federal and New York state tax rate,1,2 then look in the far right column to see what you would have had to earn from a taxable investment to equal the fund’s 2.56% tax-exempt distribution rate3 at January 31, 2016.
| If your taxable income is ... | | ... then your combined
federal and New York | | The fund’s tax-exempt
distribution rate of 2.56% is |
| Single | | Joint | | state tax rate is ... | | equivalent to a taxable rate of ... |
| $ | 0 – | 8,400 | | | $ | 0 – | 16,950 | | | | 13.60 | % | | | 2.96 | % |
| | 8,401 – | 9,225 | | | | 16,951 – | 18,450 | | | | 14.05 | | | | 2.98 | |
| | 9,226 – | 11,600 | | | | 18,451 – | 23,300 | | | | 18.83 | | | | 3.15 | |
| | 11,601 – | 13,750 | | | | 23,301 – | 27,550 | | | | 19.46 | | | | 3.18 | |
| | 13,751 – | 21,150 | | | | 27,551 – | 42,450 | | | | 20.02 | | | | 3.20 | |
| | 21,151 – | 37,450 | | | | 42,451 – | 74,900 | | | | 20.48 | | | | 3.22 | |
| | 37,451 – | 79,600 | | | | 74,901 – | 151,200 | | | | 29.84 | | | | 3.65 | |
| | 79,601 – | 90,750 | | | | – | | | | | 29.99 | | | | 3.66 | |
| | – | | | | | 151,201 – | 159,350 | | | | 32.64 | | | | 3.80 | |
| | 90,751 – | 189,300 | | | | 159,351 – | 230,450 | | | | 32.79 | | | | 3.81 | |
| | 189,301 – | 212,500 | | | | 230,451 – | 318,750 | | | | 41.00 | | | | 4.34 | |
| | 212,501 – | 411,500 | | | | 318,751 – | 411,500 | | | | 41.13 | | | | 4.35 | |
| | 411,501 – | 413,200 | | | | 411,501 – | 464,850 | | | | 42.99 | | | | 4.49 | |
| | 413,201 – | 1,062,650 | | | | 464,851 – | 2,125,450 | | | | 47.28 | | | | 4.86 | |
| | Over 1,062,650 | | | | Over 2,125,450 | | | | 48.39 | | | | 4.96 | |
| 1 | Income generated by the fund’s investments is also generally exempt from New York City taxes, offering additional tax advantages to New York City residents. |
| 2 | Based on 2015 federal and New York state tax rates. (State rates from 4.00% to 8.82% are individually calculated for each bracket. The federal brackets are expanded to include additional state brackets.) The effective combined tax rates assume full deductibility of state taxes. |
| 3 | The distribution rate is based on dividends paid over the last 12 months divided by the maximum offering price as of January 31, 2016. Capital gain distributions, if any, are added back at the maximum offering price to determine the rate. |
Fund results shown are for Class A shares at net asset value. If a sales charge (maximum 3.75%) had been deducted, the results would have been lower. Results are for past periods and are not predictive of results for future periods. Current and future results may be lower or higher than those shown. Share prices and returns will vary, so investors may lose money. For current information and month-end results, visit americanfunds.com.
| American Funds Tax-Exempt Funds | 9 |
Results at a glance
For periods ended January 31, 2016, with distributions reinvested
| | | Cumulative total returns | | Average annual total returns |
| | | 1 year | | 5 years | | 10 years | | Lifetime1 |
American Funds Short-Term Tax-Exempt Bond Fund
(Class A shares) | | | 0.34 | % | | | 1.35 | % | | | — | % | | | 1.43 | % |
| Barclays Municipal Short 1–5 Years Index2 | | | 1.15 | | | | 1.89 | | | | — | | | | 1.99 | |
| Lipper Short Municipal Debt Funds Average | | | 0.35 | | | | 1.27 | | | | — | | | | 1.32 | |
| | | | | | | | | | | | | | | | | |
| Limited Term Tax-Exempt Bond Fund of America (Class A shares) | | | 1.14 | | | | 3.44 | | | | 3.47 | | | | 4.16 | |
| Barclays Municipal Short-Intermediate 1–10 Years Index3 | | | 1.89 | | | | 3.40 | | | | 3.94 | | | | 4.41 | |
| Lipper Short-Intermediate Municipal Debt Funds Average | | | 0.71 | | | | 2.55 | | | | 2.89 | | | | 3.62 | |
| | | | | | | | | | | | | | | | | |
The Tax-Exempt Bond Fund of America
(Class A shares) | | | 2.49 | | | | 6.13 | | | | 4.47 | | | | 6.68 | |
| Barclays Municipal Bond Index | | | 2.71 | | | | 5.75 | | | | 4.81 | | | | — | 4 |
| Lipper General & Insured Municipal Debt Funds Average | | | 2.14 | | | | 6.01 | | | | 4.15 | | | | 6.42 | |
| | | | | | | | | | | | | | | | | |
American High-Income Municipal Bond Fund
(Class A shares) | | | 3.65 | | | | 8.13 | | | | 4.81 | | | | 5.71 | |
| Barclays Municipal Bond Index | | | 2.71 | | | | 5.75 | | | | 4.81 | | | | 5.66 | |
| Barclays High Yield Municipal Bond Index | | | 0.59 | | | | 7.52 | | | | 4.79 | | | | — | 4 |
| Lipper High Yield Municipal Debt Funds Average | | | 3.24 | | | | 7.60 | | | | 4.06 | | | | 5.18 | |
| | | | | | | | | | | | | | | | | |
The Tax-Exempt Fund of California
(Class A shares) | | | 2.85 | | | | 7.08 | | | | 4.75 | | | | 5.75 | |
| Barclays California Municipal Index | | | 2.88 | | | | 6.77 | | | | 5.06 | | | | — | 4 |
| Lipper California Municipal Debt Funds Average | | | 2.79 | | | | 7.16 | | | | 4.43 | | | | 5.75 | |
| | | | | | | | | | | | | | | | | |
American Funds Tax-Exempt Fund of New York
(Class A shares) | | | 2.07 | | | | 5.73 | | | | — | | | | 4.59 | |
| Barclays New York Municipal Index | | | 2.90 | | | | 5.50 | | | | — | | | | 4.37 | |
| Lipper New York Municipal Debt Funds Average | | | 2.31 | | | | 5.55 | | | | — | | | | 4.00 | |
| 1 | Since 8/7/09 (American Funds Short-Term Tax-Exempt Bond Fund), 10/6/93 (Limited Term Tax-Exempt Bond Fund of America), 10/3/79 (The Tax-Exempt Bond Fund of America), 9/26/94 (American High-Income Municipal Bond Fund), 10/28/86 (The Tax-Exempt Fund of California) and 11/1/10 (American Funds Tax-Exempt Fund of New York). |
| 2 | Barclays Municipal Short 1–5 Years Index is a market value-weighted index that includes investment-grade tax-exempt bonds with maturities of one to five years. |
| 3 | Barclays Municipal Short-Intermediate 1–10 Years Index is a market value-weighted index that includes investment-grade tax-exempt bonds with maturities of one to 10 years. |
| 4 | This index did not exist at the fund’s inception. |
The market indexes are unmanaged and, therefore, have no expenses. Investors cannot invest directly in an index. Lipper averages reflect the current composition of all eligible mutual funds (all share classes) within a given category.
| 10 | American Funds Tax-Exempt Funds |
| American Funds Short-Term Tax-Exempt Bond Fund | unaudited |
| Summary investment portfolio January 31, 2016 | |
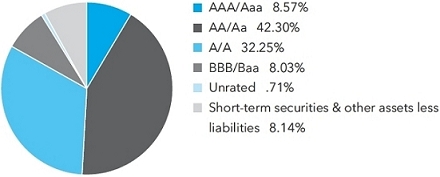
| Portfolio quality summary* | Percent of net assets |
| | |

| * | Bond ratings, which typically range from AAA/Aaa (highest) to D (lowest), are assigned by credit rating agencies such as Standard & Poor’s, Moody’s and/or Fitch as an indication of an issuer’s creditworthiness. In assigning a credit rating to a security, the fund looks specifically to the ratings assigned to the issuer of the security by Standard & Poor’s, Moody’s and/or Fitch. If agency ratings differ, the security will be considered to have received the highest of those ratings, consistent with the fund’s investment policies. Securities in the “unrated” category (above) have not been rated by a rating agency; however, the investment adviser performs its own credit analysis and assigns comparable ratings that are used for compliance with the fund’s investment policies. |
| Bonds, notes & other debt instruments 90.30% | | Principal amount
(000) | | | Value
(000) | |
| California 9.41% | | | | | | | | |
| Bay Area Toll Auth., San Francisco Bay Area Toll Bridge Rev. Ref. Bonds, Series 2006-C-1, 0.91% 2045 (put 2023)1 | | $ | 6,600 | | | $ | 6,563 | |
| Bay Area Toll Auth., San Francisco Bay Area Toll Bridge Rev. Ref. Bonds, Series 2007-E-3, 0.71% 2047 (put 2019)1 | | | 3,000 | | | | 2,996 | |
| Bay Area Toll Auth., San Francisco Bay Area Toll Bridge Rev. Ref. Bonds, Series 2014-G, 0.61% 2034 (put 2020)1 | | | 2,000 | | | | 1,985 | |
| G.O. Bonds, Series 2012-A, 0.46% 2033 (put 2018)1 | | | 1,500 | | | | 1,494 | |
| Various Purpose G.O. Bonds, 3.00% 2016 | | | 10,500 | | | | 10,646 | |
| Various Purpose G.O. Ref. Bonds, 5.00% 2018 | | | 3,000 | | | | 3,280 | |
| Los Angeles County Metropolitan Transportation Auth., Proposition A, Sales Tax Rev. Ref. Bonds, Series 2013-A, 5.00% 2018 | | | 3,000 | | | | 3,316 | |
| Oakland Redev. Successor Agcy., Tax Allocation Ref. Bonds (Central Dist. Redev. Project), Series 2013, 4.00% 2018 | | | 2,500 | | | | 2,689 | |
| Oakland Redev. Successor Agcy., Tax Allocation Ref. Bonds (Central Dist. Redev. Project), Series 2013, 5.00% 2017 | | | 2,510 | | | | 2,677 | |
| Oakland Redev. Successor Agcy., Tax Allocation Ref. Bonds (Central Dist. Redev. Project), Series 2013, 5.00% 2018 | | | 1,085 | | | | 1,194 | |
| Oakland Redev. Successor Agcy., Tax Allocation Ref. Bonds (Central Dist. Redev. Project), Series 2013, 5.00% 2019 | | | 1,000 | | | | 1,135 | |
| Other securities | | | | | | | 33,395 | |
| | | | | | | | 71,370 | |
| | | | | | | | | |
| Connecticut 1.36% | | | | | | | | |
| Housing Fin. Auth., Housing Mortgage Fin. Program Bonds, Series 2014-C-1, 4.00% 2044 | | | 915 | | | | 995 | |
| Housing Fin. Auth., Housing Mortgage Fin. Program Rev. Ref. Bonds, 4.00% 2044 | | | 1,600 | | | | 1,701 | |
| Housing Fin. Auth., Housing Mortgage Fin. Program Rev. Ref. Bonds, Series 2012-F-2, AMT, 2.75% 2035 | | | 725 | | | | 737 | |
| Housing Fin. Auth., Housing Mortgage Fin. Program Rev. Ref. Bonds, Series 2015-A, 3.50% 2044 | | | 3,495 | | | | 3,733 | |
| Housing Fin. Auth., Housing Mortgage Fin. Program Rev. Ref. Bonds, Series 2015-C-1, 3.50% 2045 | | | 2,000 | | | | 2,146 | |
| Other securities | | | | | | | 996 | |
| | | | | | | | 10,308 | |
| American Funds Tax-Exempt Funds | 11 |
American Funds Short-Term Tax-Exempt Bond Fund
| Bonds, notes & other debt instruments (continued) | | Principal amount
(000) | | | Value
(000) | |
| Florida 5.62% | | | | | | | | |
| Citizens Property Insurance Corp., Personal Lines Account/Commercial Lines Account Secured Bonds, Series 2012-A-1, 5.00% 2017 | | $ | 1,000 | | | $ | 1,058 | |
| Citizens Property Insurance Corp., Personal Lines Account/Commercial Lines Account Secured Bonds, Series 2012-A-1, 5.00% 2019 | | | 7,450 | | | | 8,384 | |
| Hurricane Catastrophe Fund Fin. Corp., Rev. Bonds, Series 2010-A, 5.00% 2016 (escrowed to maturity) | | | 5,295 | | | | 5,400 | |
| City of Lakeland, Energy System Rev. Ref. Bonds, Series 2012, 0.76% 20171 | | | 3,800 | | | | 3,809 | |
| Other securities | | | | | | | 23,988 | |
| | | | | | | | 42,639 | |
| | | | | | | | | |
| Georgia 3.21% | | | | | | | | |
| Dev. Auth. Of Floyd County, Pollution Control Rev. Bonds (Georgia Power Company Plant Hammond Project), 2.35% 2022 (put 2020) | | | 4,000 | | | | 4,095 | |
| Metropolitan Atlanta Rapid Transit Auth., Sales Tax Rev. Ref. Bonds (Third Indenture Series), Series 2014-A, 0.31% 2025 (put 2017)1 | | | 5,250 | | | | 5,251 | |
| Metropolitan Atlanta Rapid Transit Auth., Sales Tax Rev. Ref. Bonds, Series 2014-B, 0.29% 2025 (put 2017)1 | | | 3,500 | | | | 3,499 | |
| Other securities | | | | | | | 11,478 | |
| | | | | | | | 24,323 | |
| | | | | | | | | |
| Illinois 6.73% | | | | | | | | |
| Build Bonds (Sales Tax Rev. Bonds), Series June 2013, 5.00% 2020 | | | 3,500 | | | | 4,040 | |
| Education Facs. Auth. Rev. Bonds (University of Chicago), Series 1998-B, 1.65% 2025 (put 2019) | | | 10,390 | | | | 10,501 | |
| Educational Facs. Auth., Rev. Bonds (University of Chicago), Series 2001-B-1, 1.10% 2036 (put 2018) | | | 1,250 | | | | 1,254 | |
| Housing Dev. Auth., Multifamily Housing Rev. Notes (Marshall Field Garden Apartment Homes), 1.01% 2050 (put 2025)1 | | | 3,400 | | | | 3,382 | |
| Unemployment Insurance Fund Building Receipts Rev. Bonds (Illinois Dept. of Employment Security), Series 2012-A, 5.00% 2016 | | | 4,000 | | | | 4,162 | |
| Other securities | | | | | | | 27,706 | |
| | | | | | | | 51,045 | |
| | | | | | | | | |
| Indiana 1.78% | | | | | | | | |
| Dev. Fin. Auth., Solid Waste Disposal Rev. Bonds (Waste Management, Inc. Project), Series 2001, AMT, 1.75% 2031 (put 2015) | | | 500 | | | | 504 | |
| Other securities | | | | | | | 12,976 | |
| | | | | | | | 13,480 | |
| | | | | | | | | |
| Maryland 0.90% | | | | | | | | |
| Community Dev. Administration, Dept. of Housing and Community Dev., Residential Rev. Bonds, Series 2014-B, AMT, 3.25% 2044 | | | 3,045 | | | | 3,228 | |
| Other securities | | | | | | | 3,565 | |
| | | | | | | | 6,793 | |
| | | | | | | | | |
| Massachusetts 4.10% | | | | | | | | |
| Dev. Fin. Agcy., Rev. Bonds (Partners HealthCare System), Series 2014-M-3, 0.56% 2038 (put 2018)1 | | | 6,040 | | | | 6,028 | |
| Educational Fncg. Auth., Education Loan Rev. Bonds, Series 2014-I, AMT, 5.00% 2021 | | | 3,000 | | | | 3,391 | |
| Housing Fin. Agcy., Single-family Housing Rev. Bonds, Series 167, 4.00% 2043 | | | 920 | | | | 979 | |
| Housing Fin. Agcy., Single-family Housing Rev. Bonds, Series 169, 4.00% 2044 | | | 935 | | | | 1,015 | |
| Housing Fin. Agcy., Single-family Housing Rev. Bonds, Series 172, 4.00% 2045 | | | 1,515 | | | | 1,636 | |
| Housing Fin. Agcy., Single-family Housing Rev. Ref. Bonds, Series 160, AMT, 3.75% 2034 | | | 530 | | | | 534 | |
| Housing Fin. Agcy., Single-family Housing Rev. Ref. Bonds, Series 162, 2.75% 2041 | | | 575 | | | | 590 | |
| Housing Fin. Agcy., Single-family Housing Rev. Ref. Bonds, Series 165, 2.65% 2041 | | | 1,840 | | | | 1,878 | |
| Housing Fin. Agcy., Single-family Housing Rev. Ref. Bonds, Series 171, 4.00% 2044 | | | 960 | | | | 1,044 | |
| Housing Fin. Agcy., Single-family Housing Rev. Ref. Bonds, Series 177, AMT, 4.00% 2039 | | | 3,585 | | | | 3,862 | |
| Other securities | | | | | | | 10,125 | |
| | | | | | | | 31,082 | |
| 12 | American Funds Tax-Exempt Funds |
American Funds Short-Term Tax-Exempt Bond Fund
| | | Principal amount
(000) | | | Value
(000) | |
| Minnesota 1.80% | | | | | | | | |
| Housing Fin. Agcy., Homeownership Fin. Bonds (Mortgage-Backed Securities Program), Series 2011-G, 4.25% 2035 | | $ | 725 | | | $ | 759 | |
| Housing Fin. Agcy., Residential Housing Fin. Bonds, Series 2015-E, AMT, 3.50% 2046 | | | 1,000 | | | | 1,065 | |
| Housing Fin. Agcy., Residential Housing Fin. Bonds, Series 2012-D, 4.00% 2040 | | | 990 | | | | 1,032 | |
| Housing Fin. Agcy., Residential Housing Fin. Bonds, Series 2013-A, AMT, 3.00% 2031 | | | 790 | | | | 809 | |
| Housing Fin. Agcy., Residential Housing Fin. Bonds, Series 2014-A, 4.00% 2038 | | | 1,330 | | | | 1,423 | |
| Housing Fin. Agcy., Residential Housing Fin. Bonds, Series 2014-C, AMT, 4.00% 2045 | | | 5,005 | | | | 5,387 | |
| Housing Fin. Agcy., Residential Housing Fin. Bonds, Series 2015-A, AMT, 4.00% 2041 | | | 970 | | | | 1,052 | |
| Other securities | | | | | | | 2,099 | |
| | | | | | | | 13,626 | |
| | | | | | | | | |
| Missouri 1.54% | | | | | | | | |
| City of St. Louis, Airport Rev. Ref. Bonds (Lambert-St. Louis International Airport), Series 2007-B, AMT, Assured Guaranty Municipal insured, 5.00% 2016 | | | 5,000 | | | | 5,096 | |
| Other securities | | | | | | | 6,617 | |
| | | | | | | | 11,713 | |
| | | | | | | | | |
| Nebraska 2.08% | | | | | | | | |
| Central Plains Energy Project, Gas Supply Rev. Ref. Bonds, Series 2014, 5.00% 2016 | | | 2,000 | | | | 2,029 | |
| Central Plains Energy Project, Gas Supply Rev. Ref. Bonds, Series 2014, 5.00% 2017 | | | 1,045 | | | | 1,100 | |
| Central Plains Energy Project, Gas Supply Rev. Ref. Bonds, Series 2014, 5.00% 2039 (put 2019) | | | 4,200 | | | | 4,781 | |
| Investment Fin. Auth., Single-family Housing Rev. Bonds, Series 2013-A, 2.50% 2034 | | | 775 | | | | 784 | |
| Investment Fin. Auth., Single-family Housing Rev. Bonds, Series 2013-E, 3.00% 2043 | | | 1,570 | | | | 1,615 | |
| Investment Fin. Auth., Single-family Housing Rev. Bonds, Series 2014-A, 3.00% 2044 | | | 2,315 | | | | 2,373 | |
| Investment Fin. Auth., Single-family Housing Rev. Bonds, Series 2014-A, 4.00% 2044 | | | 920 | | | | 991 | |
| Investment Fin. Auth., Single-family Housing Rev. Bonds, Series 2015-C, 3.50% 2045 | | | 2,000 | | | | 2,136 | |
| | | | | | | | 15,809 | |
| | | | | | | | | |
| New Jersey 3.76% | | | | | | | | |
| Econ. Dev. Auth., School Facs. Construction Rev. Ref. Bonds, Series 2014-PP, 5.00% 2019 | | | 4,000 | | | | 4,316 | |
| Higher Education Student Assistance Auth., Student Loan Rev. Bonds, Series 2012-1A, AMT, 4.00% 2017 | | | 3,500 | | | | 3,658 | |
| Higher Education Student Assistance Auth., Student Loan Rev. Bonds, Series 2012-1A, AMT, 5.00% 2018 | | | 2,000 | | | | 2,179 | |
| Higher Education Student Assistance Auth., Student Loan Rev. Ref. Bonds, Series 2014-1A1, AMT, 4.00% 2017 | | | 1,750 | | | | 1,831 | |
| Higher Education Student Assistance Auth., Student Loan Rev. Ref. Bonds, Series 2014-1A1, AMT, 5.00% 2016 | | | 1,000 | | | | 1,035 | |
| Higher Education Student Assistance Auth., Student Loan Rev. Ref. Bonds, Series 2014-1A1, AMT, 5.00% 2018 | | | 2,250 | | | | 2,458 | |
| Turnpike Auth., Turnpike Rev. Ref. Bonds, Series 2013-D, 0.63% 2023 (put 2017)1 | | | 4,000 | | | | 3,998 | |
| Other securities | | | | | | | 9,050 | |
| | | | | | | | 28,525 | |
| | | | | | | | | |
| New York 9.72% | | | | | | | | |
| Dormitory Auth., State Personal Income Tax Rev. Bonds (Education), Series 2015-B-A, 5.00% 2017 | | | 3,000 | | | | 3,143 | |
| Metropolitan Transportation Auth., Transportation Rev. Bonds, Series 2011-D, 5.00% 2016 | | | 1,000 | | | | 1,037 | |
| Metropolitan Transportation Auth., Transportation Rev. Bonds, Series 2014-A-1, 4.00% 2019 | | | 750 | | | | 833 | |
| Metropolitan Transportation Auth., Transportation Rev. Bonds, Series 2014-C, 5.00% 2020 | | | 2,000 | | | | 2,355 | |
| Metropolitan Transportation Auth., Transportation Rev. Bonds, Series 2015-A-2, 0.59% 2039 (put 2020)1 | | | 6,250 | | | | 6,172 | |
| Mortgage Agcy., Homeowner Mortgage Rev. Bonds, Series 191, 3.50% 2034 | | | 3,480 | | | | 3,657 | |
| City of New York, G.O. Bonds, Fiscal 2008 Series J-4, 0.56% 20251 | | | 6,000 | | | | 6,000 | |
| City of New York, G.O. Bonds, Fiscal 2011 Series I-1, 5.00% 2017 | | | 1,000 | | | | 1,067 | |
| City of New York, G.O. Bonds, Fiscal 2012 Series I, 5.00% 2018 | | | 1,000 | | | | 1,104 | |
| City of New York, G.O. Bonds, Fiscal 2014 Series A-6, 0.51% 20311 | | | 2,500 | | | | 2,491 | |
| City of New York, G.O. Bonds, Series 2014-A, 5.00% 2020 | | | 1,500 | | | | 1,757 | |
| American Funds Tax-Exempt Funds | 13 |
American Funds Short-Term Tax-Exempt Bond Fund
| Bonds, notes & other debt instruments (continued) | | Principal amount
(000) | | | Value
(000) | |
| New York (continued) | | | | | | | | |
| New York City, Health and Hospitals Corp., Health System Rev. Ref. Bonds, Series 2010-A, 5.00% 2017 | | $ | 3,000 | | | $ | 3,136 | |
| Thruway Auth., General Rev. Junior Indebtedness Obligations, Series 2013-A, 5.00% 2019 | | | 4,700 | | | | 5,306 | |
| Other securities | | | | | | | 35,664 | |
| | | | | | | | 73,722 | |
| | | | | | | | | |
| Ohio 1.48% | | | | | | | | |
| Solid Waste Disposal Rev. Bonds (Waste Management Inc. Project), Series 2002, AMT, 1.70% 2022 (put 2018) | | | 2,500 | | | | 2,511 | |
| Other securities | | | | | | | 8,751 | |
| | | | | | | | 11,262 | |
| | | | | | | | | |
| Oregon 1.38% | | | | | | | | |
| G.O. Bonds (Veterans’ Welfare Bonds Series 94), Series 2014-H, 4.00% 2044 | | | 3,270 | | | | 3,567 | |
| Other securities | | | | | | | 6,923 | |
| | | | | | | | 10,490 | |
| | | | | | | | | |
| Pennsylvania 2.07% | | | | | | | | |
| Econ. Dev. Fncg. Auth., Unemployment Compensation Rev. Bonds, Series 2012-B, 5.00% 2021 | | | 4,000 | | | | 4,316 | |
| Other securities | | | | | | | 11,386 | |
| | | | | | | | 15,702 | |
| | | | | | | | | |
| Rhode Island 1.07% | | | | | | | | |
| Housing and Mortgage Fin. Corp., Homeownership Opportunity Bonds, Series 66-A-1, 4.00% 2033 | | | 3,620 | | | | 3,891 | |
| Other securities | | | | | | | 4,249 | |
| | | | | | | | 8,140 | |
| | | | | | | | | |
| South Carolina 0.68% | | | | | | | | |
| Public Service Auth., Rev. Obligations (Santee Cooper), Series 2012-A, 4.00% 2020 | | | 2,945 | | | | 3,335 | |
| Other securities | | | | | | | 1,808 | |
| | | | | | | | 5,143 | |
| | | | | | | | | |
| Tennessee 2.06% | | | | | | | | |
| Housing Dev. Agcy., Homeownership Program Bonds, Issue 2012-1-C, 4.50% 2037 | | | 965 | | | | 1,028 | |
| Housing Dev. Agcy., Homeownership Program Bonds, Issue 2012-2-C, 4.00% 2038 | | | 705 | | | | 748 | |
| Housing Dev. Agcy., Homeownership Program Rev. Ref. Bonds, Issue 2011-1-A, AMT, 4.50% 2031 | | | 1,700 | | | | 1,815 | |
| Housing Dev. Agcy., Homeownership Program Rev. Ref. Bonds, Issue 2012-1-A, AMT, 4.50% 2038 | | | 810 | | | | 861 | |
| Housing Dev. Agcy., Residential Fin. Program Bonds, 4.00% 2046 | | | 500 | | | | 548 | |
| Housing Dev. Agcy., Residential Fin. Program Bonds, Issue 2013-1-C, 3.00% 2038 | | | 1,500 | | | | 1,559 | |
| Housing Dev. Agcy., Residential Fin. Program Bonds, Series 2013-2-A, AMT, 4.00% 2043 | | | 815 | | | | 875 | |
| Housing Dev. Agcy., Residential Fin. Program Bonds, Series 2014-1-A, AMT, 4.00% 2039 | | | 1,875 | | | | 1,991 | |
| Housing Dev. Agcy., Residential Fin. Program Bonds, Series 2014-2-A, AMT, 4.00% 2045 | | | 1,545 | | | | 1,659 | |
| Housing Dev. Agcy., Residential Fin. Program Bonds, Series 2014-2-C, 4.00% 2045 | | | 1,175 | | | | 1,270 | |
| Other securities | | | | | | | 3,245 | |
| | | | | | | | 15,599 | |
| | | | | | | | | |
| Texas 8.72% | | | | | | | | |
| Grand Parkway Transportation Corp., Grand Parkway System Toll Rev. Ref. Bond Anticipation Notes, Series 2014-A, 3.00% 2016 | | | 8,150 | | | | 8,318 | |
| City of Houston, Public Improvement Ref. Bonds, Series 2011-A, 5.00% 2016 | | | 7,700 | | | | 7,734 | |
| Houston Independent School Dist. (Harris County), Limited Tax Schoolhouse Bonds, Series 2013-B, 2.00% 2037 (put 2016) | | | 3,400 | | | | 3,418 | |
| Mission Econ. Dev. Corp., Solid Waste Disposal Rev. Bonds (Waste Management, Inc. Project), Series 2008, AMT, 2.50% 2020 (put 2013) | | | 2,000 | | | | 2,050 | |
| City of San Antonio, Electric and Gas Systems Rev. Ref. Bonds, 5.00% 2018 | | | 2,000 | | | | 2,172 | |
| City of San Antonio, Electric and Gas Systems Rev. Ref. Bonds, Series 2012-C, 2.00% 2027 (put 2016) | | | 1,160 | | | | 1,174 | |
| 14 | American Funds Tax-Exempt Funds |
American Funds Short-Term Tax-Exempt Bond Fund
| | | Principal amount
(000) | | | | Value
(000) | |
| City of San Antonio, Electric and Gas Systems Rev. Ref. Bonds, Series 2015-B, 0.40% 2033 (put 2018)1 | | $ | 4,500 | | | $ | 4,480 | |
| Transportation Commission, G.O. Mobility Fund Bonds, Series 2014-B, 0.39% 2041 (put 2018)1 | | | 6,500 | | | | 6,447 | |
| Other securities | | | | | | | 30,403 | |
| | | | | | | | 66,196 | |
| | | | | | | | | |
| Virginia 0.59% | | | | | | | | |
| Commonwealth Transportation Board, Federal Transportation Grant Anticipation Rev. Notes, Series 2013-A, 5.00% 2020 | | | 3,000 | | | | 3,484 | |
| Other securities | | | | | | | 1,028 | |
| | | | | | | | 4,512 | |
| | | | | | | | | |
| Washington 3.41% | | | | | | | | |
| Econ. Dev. Fin. Auth., Solid Waste Disposal Rev. Bonds (Waste Management, Inc. Project), Series 2008, 2.125% 20202 | | | 2,500 | | | | 2,543 | |
| Energy Northwest, Electric Rev. Ref. Bonds (Project No. 1), Series 2012-A, 5.00% 2017 | | | 5,000 | | | | 5,319 | |
| Other securities | | | | | | | 18,045 | |
| | | | | | | | 25,907 | |
| | | | | | | | | |
| Other states & U.S. territories 16.83% | | | | | | | | |
| Other securities | | | | | | | 127,661 | |
| | | | | | | | | |
| Total bonds, notes & other debt instruments (cost: $678,537,000) | | | | | | | 685,047 | |
| | | | | | | | | |
| Short-term securities 9.84% | | | | | | | | |
| | | | | | | | | |
| State of California, Various Purpose G.O. Bonds, 0.04% 4/7/2016 | | | 3,000 | | | | 3,000 | |
| State of Colorado, General Fund Tax and Rev. Anticipation Notes, Series 2015-A, 1.75% 6/28/2016 | | | 15,000 | | | | 15,096 | |
| District of Columbia, Tax and Rev. Anticipation Notes, Series 2015, 1.50% 9/30/2016 | | | 5,000 | | | | 5,038 | |
| State of Kentucky, Louisville and Jefferson County Metropolitan Sewer District, Sewer and Drainage System Bonds, Series 2015, 5.00% 11/22/2016 | | | 5,000 | | | | 5,177 | |
| State of Maryland, Baltimore County, G.O. Bonds, 1.25% 4/1/2016 | | | 2,800 | | | | 2,805 | |
| State of Maryland, Baltimore County, G.O. Bonds, 1.25% 4/1/2016 | | | 2,200 | | | | 2,204 | |
| State of Maryland, Montgomery County, Consolidated Public Improvement Bond Anticipation Notes, Series 2006-A, 0.01% 20261 | | | 2,200 | | | | 2,200 | |
| State of Maryland, Montgomery County, Consolidated Public Improvement Bond Anticipation Notes, Series 2010-B, 0.03% 3/10/2016 | | | 1,000 | | | | 1,000 | |
| State of Massachusetts, School Building Auth., Dedicated Sales Tax Rev. Ref. Bonds, Series 2015-C, 5.00% 8/15/2016 | | | 4,000 | | | | 4,104 | |
| State of Mississippi, Business Fin. Corp., Gulf Opportunity Zone Industrial Dev. Rev. Bonds (Chevron U.S.A. Inc. Project), Series 2010-G, 0.01% 20351 | | | 2,500 | | | | 2,500 | |
| State of Mississippi, Business Fin. Corp., Gulf Opportunity Zone Industrial Dev. Rev. Bonds (Chevron U.S.A. Inc. Project), Series 2010-I, 0.01% 20351 | | | 800 | | | | 800 | |
| State of Mississippi, Business Fin. Corp., Gulf Opportunity Zone Industrial Dev. Rev. Bonds (Chevron U.S.A. Inc. Project), Series 2010-L, 0.01% 20351 | | | 3,300 | | | | 3,300 | |
| State of Mississippi, Business Fin. Corp., Gulf Opportunity Zone Industrial Dev. Rev. Bonds (Chevron U.S.A. Inc. Project), Series 2011-A, 0.01% 20351 | | | 2,000 | | | | 2,000 | |
| State of New York, Metropolitan Transportation Auth., Transportation Rev. Bond Anticipation Notes, Series 2015-B1, 1.00% 8/1/2016 | | | 3,000 | | | | 3,010 | |
| State of New York, Metropolitan Transportation Auth., Transportation Rev. Bond Anticipation Notes, Series 2015-B1-G, 1.00% 8/1/2016 | | | 12,000 | | | | 12,037 | |
| Other securities | | | | | | | 10,385 | |
| | | | | | | | | |
| Total short-term securities (cost: $74,647,000) | | | | | | | 74,656 | |
| Total investment securities 100.14% (cost: $753,184,000) | | | | | | | 759,703 | |
| Other assets less liabilities (0.14)% | | | | | | | (1,042 | ) |
| | | | | | | | | |
| Net assets 100.00% | | | | | | $ | 758,661 | |
| American Funds Tax-Exempt Funds | 15 |
American Funds Short-Term Tax-Exempt Bond Fund
This summary investment portfolio is designed to streamline the report and help investors better focus on the fund’s principal holdings. See the inside back cover for details on how to obtain a complete schedule of portfolio holdings.
“Other securities” includes all issues that are not disclosed separately in the summary investment portfolio.
| 1 | Coupon rate may change periodically. For short-term securities, the date of the next scheduled coupon rate change is considered to be the maturity date. |
| 2 | Acquired in a transaction exempt from registration under Rule 144A of the Securities Act of 1933. May be resold in the U.S. in transactions exempt from registration, normally to qualified institutional buyers. The total value of all such securities was $2,543,000, which represented .34% of the net assets of the fund. |
Key to abbreviations
Agcy. = Agency
AMT = Alternative Minimum Tax
Auth. = Authority
Certs. of Part. = Certificates of Participation
Dept. = Department
Dev. = Development
Dist. = District
Econ. = Economic
Fac. = Facility
Facs. = Facilities
Fin. = Finance
Fncg. = Financing
G.O. = General Obligation
LOC = Letter of Credit
Preref. = Prerefunded
Redev. = Redevelopment
Ref. = Refunding
Rev. = Revenue
TECP = Tax-Exempt Commercial Paper
See Notes to Financial Statements
| 16 | American Funds Tax-Exempt Funds |
| Limited Term Tax-Exempt Bond Fund of America | unaudited |
| Summary investment portfolio January 31, 2016 | |
| Portfolio quality summary* | Percent of net assets |
| * | Bond ratings, which typically range from AAA/Aaa (highest) to D (lowest), are assigned by credit rating agencies such as Standard & Poor’s, Moody’s and/or Fitch as an indication of an issuer’s creditworthiness. In assigning a credit rating to a security, the fund looks specifically to the ratings assigned to the issuer of the security by Standard & Poor’s, Moody’s and/or Fitch. If agency ratings differ, the security will be considered to have received the highest of those ratings, consistent with the fund’s investment policies. Securities in the “unrated” category (above) have not been rated by a rating agency; however, the investment adviser performs its own credit analysis and assigns comparable ratings that are used for compliance with the fund’s investment policies. |
| Bonds, notes & other debt instruments 91.86% | | Principal amount
(000) | | | Value
(000) | |
| California 12.54% | | | | | | | | |
| Bay Area Toll Auth., San Francisco Bay Area Toll Bridge Rev. Ref. Bonds, Series 2006-C-1, 0.91% 2045 (put 2023)1 | | $ | 20,500 | | | $ | 20,386 | |
| Bay Area Toll Auth., San Francisco Bay Area Toll Bridge Rev. Ref. Bonds, Series 2007-C-1, 0.91% 2047 (put 2023)1 | | | 3,500 | | | | 3,480 | |
| Bay Area Toll Auth., San Francisco Bay Area Toll Bridge Rev. Ref. Bonds, Series 2007-E-3, 0.71% 2047 (put 2019)1 | | | 1,000 | | | | 999 | |
| Bay Area Toll Auth., San Francisco Bay Area Toll Bridge Rev. Ref. Bonds, Series 2014-G, 0.61% 2034 (put 2020)1 | | | 2,500 | | | | 2,481 | |
| Bay Area Toll Auth., San Francisco Bay Area Toll Bridge Rev. Ref. Bonds, Series 2014-H, 0.71% 2034 (put 2021)1 | | | 10,480 | | | | 10,405 | |
| Econ. Recovery Bonds, Ref. Series 2009-A, 5.00% 2020 | | | 9,000 | | | | 10,269 | |
| Various Purpose G.O. Bonds, 5.00% 2026 | | | 3,000 | | | | 3,798 | |
| G.O. Bonds, Series 2012-A, 0.46% 2033 (put 2018)1 | | | 5,000 | | | | 4,979 | |
| G.O. Bonds, Series 2013-C, 0.56% 2028 (put 2016)1 | | | 5,000 | | | | 5,001 | |
| Various Purpose G.O. Bonds, 3.00% 2016 | | | 18,000 | | | | 18,250 | |
| Various Purpose G.O. Ref. Bonds, 5.00% 2021 | | | 5,000 | | | | 6,038 | |
| Various Purpose G.O. Ref. Bonds, 5.00% 2023 | | | 6,500 | | | | 8,116 | |
| Port of Oakland, Rev. Ref. Bonds, Series 2012-P, AMT, 5.00% 2021 | | | 7,750 | | | | 9,170 | |
| Public Facs. Fncg. Auth. of the City of San Diego, Sewer Rev. Bonds, Series 2009-A, 5.00% 2017 | | | 8,500 | | | | 9,008 | |
| Other securities | | | | | | | 311,294 | |
| | | | | | | | 423,674 | |
| | | | | | | | | |
| Connecticut 0.95% | | | | | | | | |
| Special Tax Obligation Ref. Bonds, Transportation Infrastructure Purposes, Series 2009-1, 5.00% 2019 | | | 8,550 | | | | 9,589 | |
| Other securities | | | | | | | 22,448 | |
| | | | | | | | 32,037 | |
| | | | | | | | | |
| District of Columbia 0.98% | | | | | | | | |
| University Rev. Bonds (Georgetown University Issue), Series 2001-B, 4.70% 2031 (put 2018) | | | 8,500 | | | | 9,135 | |
| Other securities | | | | | | | 24,017 | |
| | | | | | | | 33,152 | |
| American Funds Tax-Exempt Funds | 17 |
Limited Term Tax-Exempt Bond Fund of America
| Bonds, notes & other debt instruments (continued) | | Principal amount
(000) | | | Value
(000) | |
| Florida 8.71% | | | | | | | | |
| Citizens Property Insurance Corp., High-Risk Account Secured Bonds, Series 2009-A-1, 5.50% 2017 | | $ | 10,035 | | | $ | 10,683 | |
| Citizens Property Insurance Corp., Personal Lines Account/Commercial Lines Account Secured Bonds, Series 2012-A-1, 5.00% 2022 | | | 10,200 | | | | 12,255 | |
| Miami-Dade County, Aviation Rev. Ref. Bonds, Series 2012-A, AMT, 5.00% 2021 | | | 11,600 | | | | 13,766 | |
| Putnam County Dev. Auth., Pollution Control Rev. Ref. Bonds (Seminole Electric Cooperative, Inc. Project), Series 2007-B, AMBAC insured, 5.35% 2042 (put 2018) | | | 10,370 | | | | 11,307 | |
| Other securities | | | | | | | 246,231 | |
| | | | | | | | 294,242 | |
| | | | | | | | | |
| Georgia 2.75% | | | | | | | | |
| DeKalb County Hospital Auth., Rev. Ref. Anticipation Certificates (DeKalb Medical Center, Inc. Project), Series 2010, 5.25% 2020 | | | 8,750 | | | | 9,920 | |
| Metropolitan Atlanta Rapid Transit Auth., Sales Tax Rev. Ref. Bonds, Series 2014-B, 0.29% 2025 (put 2017)1 | | | 9,000 | | | | 8,999 | |
| Municipal Electric Auth., Project One Rev. Ref. Bonds, Series 2008-D, 5.75% 2019 | | | 16,000 | | | | 17,919 | |
| Public Gas Partners, Inc., Gas Project Rev. Ref. Bonds (Gas Supply Pool No. 1), Series A, 5.00% 2018 | | | 10,930 | | | | 12,089 | |
| Other securities | | | | | | | 44,023 | |
| | | | | | | | 92,950 | |
| | | | | | | | | |
| Hawaii 0.75% | | | | | | | | |
| Airports System Rev. Bonds, Series 2010-B, AMT, 5.00% 2018 | | | 9,900 | | | | 10,840 | |
| Other securities | | | | | | | 14,551 | |
| | | | | | | | 25,391 | |
| | | | | | | | | |
| Illinois 6.99% | | | | | | | | |
| City of Chicago, O’Hare International Airport, General Airport Rev. Bonds, Series 2011-B, 5.00% 2017 | | | 1,500 | | | | 1,561 | |
| City of Chicago, O’Hare International Airport, General Airport Rev. Bonds, Series 2011-B, 5.00% 2019 | | | 2,785 | | | | 3,093 | |
| City of Chicago, O’Hare International Airport, General Airport Rev. Bonds, Series 2012-B, AMT, 5.00% 2024 | | | 2,000 | | | | 2,314 | |
| City of Chicago, O’Hare International Airport, General Airport Rev. Bonds, Series 2013-A, AMT, 5.00% 2022 | | | 3,055 | | | | 3,591 | |
| City of Chicago, O’Hare International Airport, General Airport Rev. Ref. Bonds, Series 2008-A, Assured Guaranty Municipal insured, 5.00% 2019 | | | 2,000 | | | | 2,155 | |
| City of Chicago, O’Hare International Airport, General Airport Rev. Ref. Bonds, Series 2012-A, AMT, 5.00% 2025 | | | 6,170 | | | | 7,065 | |
| City of Chicago, O’Hare International Airport, General Airport Rev. Ref. Bonds, Series 2013-A, AMT, 5.00% 2021 | | | 10,000 | | | | 11,567 | |
| City of Chicago, O’Hare International Airport, General Airport Rev. Ref. Bonds, Series 2013-A, AMT, 5.00% 2023 | | | 5,000 | | | | 5,933 | |
| City of Chicago, O’Hare International Airport, General Airport Rev. Ref. Bonds, Series 2015-B, 5.00% 2023 | | | 1,500 | | | | 1,813 | |
| City of Chicago, O’Hare International Airport, Passenger Fac. Charge Rev. Ref. Bonds, Series 2012-B, AMT, 5.00% 2018 | | | 2,000 | | | | 2,146 | |
| City of Chicago, O’Hare International Airport, Passenger Fac. Charge Rev. Ref. Bonds, Series 2012-B, AMT, 5.00% 2019 | | | 2,000 | | | | 2,211 | |
| City of Chicago, O’Hare International Airport, Passenger Fac. Charge Rev. Ref. Bonds, Series 2013-B, AMT, 5.00% 2022 | | | 3,000 | | | | 3,526 | |
| Housing Dev. Auth., Multifamily Housing Rev. Notes (Marshall Field Garden Apartment Homes), 1.01% 2050 (put 2025)1 | | | 10,500 | | | | 10,446 | |
| Railsplitter Tobacco Settlement Auth., Tobacco Settlement Rev. Bonds, Series 2010, 5.50% 2023 | | | 12,425 | | | | 14,717 | |
| Other securities | | | | | | | 164,157 | |
| | | | | | | | 236,295 | |
| 18 | American Funds Tax-Exempt Funds |
Limited Term Tax-Exempt Bond Fund of America
| | | Principal amount
(000) | | | Value
(000) | |
| Indiana 3.38% | | | | | | | | |
| Fin. Auth., Private Activity Bonds (Ohio River Bridges East End Crossing Project), Series 2013-B, AMT, 5.00% 2019 | | $ | 10,440 | | | $ | 10,829 | |
| Indianapolis Airport Auth., Special Fac. Rev. Ref. Bonds (Federal Express Corp. Project), Series 2004, AMT, 5.10% 2017 | | | 20,545 | | | | 21,380 | |
| Other securities | | | | | | | 81,930 | |
| | | | | | | | 114,139 | |
| | | | | | | | | |
| Kentucky 1.12% | | | | | | | | |
| Public Transportation Infrastructure Auth., Toll Rev. Bond Anticipation Notes (Downtown Crossing Project), Series 2013-A, 5.00% 2017 | | | 8,625 | | | | 9,067 | |
| Other securities | | | | | | | 28,694 | |
| | | | | | | | 37,761 | |
| | | | | | | | | |
| Maryland 0.77% | | | | | | | | |
| Transportation Auth., Airport Parking Rev. Ref. Bonds (Baltimore/Washington International Thurgood Marshall Airport Projects), Series 2012-B, AMT, 5.00% 2020 | | | 8,150 | | | | 9,312 | |
| Other securities | | | | | | | 16,725 | |
| | | | | | | | 26,037 | |
| | | | | | | | | |
| Michigan 4.69% | | | | | | | | |
| Wayne County Airport Auth., Airport Rev. Bonds (Detroit Metropolitan Wayne County Airport), Series 2007, AMT, FGIC-National insured, 5.00% 2018 | | | 1,000 | | | | 1,071 | |
| Wayne County Airport Auth., Airport Rev. Ref. Bonds (Detroit Metropolitan Wayne County Airport), Series 2008-A, AMT, Assured Guaranty insured, 5.25% 2018 | | | 890 | | | | 945 | |
| Wayne County Airport Auth., Airport Rev. Ref. Bonds (Detroit Metropolitan Wayne County Airport), Series 2010-A, AMT, 5.00% 2017 | | | 1,615 | | | | 1,717 | |
| Wayne County Airport Auth., Airport Rev. Ref. Bonds (Detroit Metropolitan Wayne County Airport), Series 2010-A, AMT, 5.00% 2018 | | | 3,590 | | | | 3,922 | |
| Wayne County Airport Auth., Airport Rev. Ref. Bonds (Detroit Metropolitan Wayne County Airport), Series 2011-A, AMT, 5.00% 2019 | | | 1,000 | | | | 1,119 | |
| Wayne County Airport Auth., Airport Rev. Ref. Bonds (Detroit Metropolitan Wayne County Airport), Series 2011-A, AMT, 5.00% 2020 | | | 10,000 | | | | 11,387 | |
| Wayne County Airport Auth., Airport Rev. Ref. Bonds (Detroit Metropolitan Wayne County Airport), Series 2011-A, AMT, 5.00% 2021 | | | 8,240 | | | | 9,522 | |
| Wayne County Airport Auth., Airport Rev. Ref. Bonds (Detroit Metropolitan Wayne County Airport), Series 2011-B, 5.00% 2019 | | | 1,000 | | | | 1,138 | |
| Wayne County Airport Auth., Airport Rev. Ref. Bonds (Detroit Metropolitan Wayne County Airport), Series 2012-D, AMT, 5.00% 2019 | | | 3,560 | | | | 3,982 | |
| Wayne County Airport Auth., Rev. Bonds (Detroit Metropolitan Wayne County Airport), Series 2015-F, AMT, 5.00% 2025 | | | 1,500 | | | | 1,773 | |
| Wayne County Airport Auth., Rev. Bonds (Detroit Metropolitan Wayne County Airport), Series 2015-F, AMT, 5.00% 2026 | | | 1,000 | | | | 1,170 | |
| Other securities | | | | | | | 120,705 | |
| | | | | | | | 158,451 | |
| | | | | | | | | |
| Nebraska 0.98% | | | | | | | | |
| Central Plains Energy Project, Gas Supply Rev. Ref. Bonds, Series 2014, 5.00% 2039 (put 2019) | | | 8,800 | | | | 10,018 | |
| Investment Fin. Auth., Single-family Housing Rev. Bonds, Series 2015-C, 3.50% 2045 | | | 9,000 | | | | 9,612 | |
| Other securities | | | | | | | 13,345 | |
| | | | | | | | 32,975 | |
| | | | | | | | | |
| Nevada 2.05% | | | | | | | | |
| Clark County, Highway Rev. (Motor Vehicle Fuel Tax) Ref. Bonds, Series 2011, 5.00% 2020 | | | 12,320 | | | | 14,385 | |
| Las Vegas Valley Water Dist., G.O. (Limited Tax) Ref. Bonds, Series 2011-C, 5.00% 2019 | | | 7,760 | | | | 8,796 | |
| Other securities | | | | | | | 45,950 | |
| | | | | | | | 69,131 | |
| | | | | | | | | |
| New Jersey 2.58% | | | | | | | | |
| Turnpike Auth., Turnpike Rev. Ref. Bonds, Series 2013-D, 0.69% 2024 (put 2018)1 | | | 11,500 | | | | 11,469 | |
| Other securities | | | | | | | 75,569 | |
| | | | | | | | 87,038 | |
| American Funds Tax-Exempt Funds | 19 |
Limited Term Tax-Exempt Bond Fund of America
| Bonds, notes & other debt instruments (continued) | | Principal amount
(000) | | | Value
(000) | |
| New York 9.37% | | | | | | | | |
| Metropolitan Transportation Auth., Transportation Rev. Bonds, Series 2003-B, FGIC-National insured, 5.25% 2020 | | $ | 5,500 | | | $ | 6,541 | |
| Metropolitan Transportation Auth., Transportation Rev. Bonds, Series 2008-B-2, 5.00% 2016 | | | 1,000 | | | | 1,037 | |
| Metropolitan Transportation Auth., Transportation Rev. Bonds, Series 2008-C, 5.50% 2018 | | | 5,370 | | | | 5,741 | |
| Metropolitan Transportation Auth., Transportation Rev. Bonds, Series 2012-A2, 0.28% 2041 (put 2016)1 | | | 1,000 | | | | 998 | |
| Metropolitan Transportation Auth., Transportation Rev. Bonds, Series 2012-E, 5.00% 2020 | | | 3,250 | | | | 3,828 | |
| Metropolitan Transportation Auth., Transportation Rev. Bonds, Series 2014-A-1, 4.00% 2021 | | | 3,470 | | | | 3,990 | |
| Metropolitan Transportation Auth., Transportation Rev. Bonds, Series 2014-C, 5.00% 2024 | | | 5,000 | | | | 6,270 | |
| Metropolitan Transportation Auth., Transportation Rev. Bonds, Series 2015-A-1, 5.00% 2016 | | | 2,000 | | | | 2,073 | |
| Metropolitan Transportation Auth., Transportation Rev. Bonds, Series 2015-A-1, 5.00% 2027 | | | 3,150 | | | | 3,869 | |
| Metropolitan Transportation Auth., Transportation Rev. Bonds, Series 2015-A-2, 0.59% 2039 (put 2020)1 | | | 11,250 | | | | 11,109 | |
| Metropolitan Transportation Auth., Transportation Rev. Ref. Bonds, Series 2002-G-1H, 1.136% 2026 (put 2016)1 | | | 2,650 | | | | 2,653 | |
| Metropolitan Transportation Auth., Transportation Rev. Ref. Bonds, Series 2011-C, 5.00% 2018 | | | 1,105 | | | | 1,231 | |
| Metropolitan Transportation Auth., Transportation Rev. Ref. Bonds, Series 2012-D, 5.00% 2020 | | | 7,000 | | | | 8,244 | |
| Metropolitan Transportation Auth., Transportation Rev. Ref. Bonds, Series 2012-F, 5.00% 2021 | | | 1,000 | | | | 1,205 | |
| Metropolitan Transportation Auth., Transportation Rev. Ref. Bonds, Series 2014-A-2, 5.00% 2028 | | | 3,000 | | | | 3,598 | |
| City of New York, G.O. Bonds, Fiscal 2008 Series J-4, 0.56% 20251 | | | 8,825 | | | | 8,825 | |
| City of New York, G.O. Bonds, Fiscal 2009 Series H-1, 5.00% 2016 | | | 2,000 | | | | 2,009 | |
| City of New York, G.O. Bonds, Fiscal 2011 Series I-1, 5.00% 2017 | | | 5,000 | | | | 5,335 | |
| City of New York, G.O. Bonds, Fiscal 2012 Series I, 5.00% 2020 | | | 5,000 | | | | 5,858 | |
| City of New York, G.O. Bonds, Series 2013-E, 5.25% 2022 | | | 5,000 | | | | 6,201 | |
| City of New York, G.O. Bonds, Series 2014-A, 5.00% 2025 | | | 3,000 | | | | 3,780 | |
| City of New York, G.O. Bonds, Series 2014-G, 5.00% 2023 | | | 1,500 | | | | 1,866 | |
| City of New York, G.O. Bonds, Series 2015-C, 5.00% 2028 | | | 1,000 | | | | 1,225 | |
| Thruway Auth., Local Highway and Bridge Service Contract Rev. Ref. Bonds, Series 2009, 5.00% 2017 | | | 10,000 | | | | 10,531 | |
| Other securities | | | | | | | 208,524 | |
| | | | | | | | 316,541 | |
| | | | | | | | | |
| South Carolina 0.87% | | | | | | | | |
| Transportation Infrastructure Bank, Rev. Ref. Bonds, Series 2005-A, AMBAC insured, 5.25% 2018 | | | 8,000 | | | | 8,922 | |
| Other securities | | | | | | | 20,445 | |
| | | | | | | | 29,367 | |
| | | | | | | | | |
| Texas 7.54% | | | | | | | | |
| Harris County, Toll Road Rev. Bonds, Series 2012-B, 0.71% 2021 (put 2018)1 | | | 13,500 | | | | 13,500 | |
| City of Houston, Airport System Rev. Ref. Bonds, Series 2011-A, AMT, 5.00% 2019 | | | 10,000 | | | | 11,263 | |
| Other securities | | | | | | | 230,149 | |
| | | | | | | | 254,912 | |
| | | | | | | | | |
| Washington 2.85% | | | | | | | | |
| Central Puget Sound Regional Transit Auth., Sales Tax Bonds, Series 2015-S-2A, 0.71% 2045 (put 2018)1 | | | 10,500 | | | | 10,512 | |
| Other securities | | | | | | | 85,851 | |
| | | | | | | | 96,363 | |
| 20 | American Funds Tax-Exempt Funds |
Limited Term Tax-Exempt Bond Fund of America
| | | Principal amount
(000) | | | Value
(000) | |
| Wisconsin 1.45% | | | | | | | | |
| Health and Educational Facs. Auth., Rev. Ref. Bonds (Aurora Health Care, Inc.), Series 2012-A, 5.00% 2021 | | $ | 7,765 | | | $ | 9,141 | |
| Other securities | | | | | | | 39,903 | |
| | | | | | | | 49,044 | |
| | | | | | | | | |
| Other states & U.S. territories 20.54% | | | | | | | | |
| Other securities | | | | | | | 694,070 | |
| | | | | | | | | |
| Total bonds, notes & other debt instruments (cost: $2,967,088,000) | | | | | | | 3,103,570 | |
| | | | | | | | | |
| Short-term securities 7.58% | | | | | | | | |
| State of California, Various Purpose G.O. Bonds, 0.04% 4/7/2016 | | | 3,000 | | | | 3,000 | |
| State of California, County of Ventura, Tax and Rev. Anticipation Notes 2.00% 7/1/2016 | | | 24,585 | | | | 24,762 | |
| State of Colorado, General Fund Tax and Rev. Anticipation Notes, Series 2015-A, 1.75% 6/28/2016 | | | 25,000 | | | | 25,159 | |
| District of Columbia, Tax and Rev. Anticipation Notes, Series 2015, 1.50% 9/30/2016 | | | 15,000 | | | | 15,113 | |
| State of Idaho, Tax Anticipation Notes, Series 2015, 2.00% 6/30/2016 | | | 15,000 | | | | 15,111 | |
| State of Maryland, Baltimore County, G.O. Bonds, 1.25% 4/1/2016 | | | 5,600 | | | | 5,611 | |
| State of Maryland, Baltimore County, G.O. Bonds, 1.25% 4/1/2016 | | | 4,400 | | | | 4,409 | |
| State of Maryland, Health and Higher Educational Facs. Auth., Rev. Ref. Bonds (University of Maryland Medical System Issue), Series 2008-D, TD Bank LOC, 0.01% 20411 | | | 11,970 | | | | 11,970 | |
| State of Maryland, Health and Higher Educational Facs. Auth., Rev. Bonds (University of Maryland Medical System Issue), Series 2007-A, Wachovia LOC, 0.01% 20341 | | | 2,000 | | | | 2,000 | |
| State of Maryland, Montgomery County, Consolidated Public Improvement Bond Anticipation Notes, Series 2006-A, 0.01% 20261 | | | 10,250 | | | | 10,250 | |
| State of Maryland, Montgomery County, Consolidated Public Improvement Bond Anticipation Notes, Series 2006-B, 0.01% 20261 | | | 2,505 | | | | 2,505 | |
| State of Maryland, Montgomery County, Consolidated Public Improvement Bond Anticipation Notes, Series 2010-B, 0.03% 3/10/2016 | | | 1,100 | | | | 1,100 | |
| State of Massachusetts, School Building Auth., Dedicated Sales Tax Rev. Ref. Bonds, Series 2015-C, 5.00% 8/15/2016 | | | 20,000 | | | | 20,522 | |
| State of New York, Metropolitan Transportation Auth., Transportation Rev. Bond Anticipation Notes, Series 2015-A-4, 0.50% 3/1/2016 | | | 10,000 | | | | 10,003 | |
| State of New York, Metropolitan Transportation Auth., Transportation Rev. Bond Anticipation Notes, Series 2015-B1, 1.00% 8/1/2016 | | | 5,000 | | | | 5,016 | |
| State of New York, Metropolitan Transportation Auth., Transportation Rev. Bond Anticipation Notes, Series 2015-B1-G, 1.00% 8/1/2016 | | | 20,000 | | | | 20,061 | |
| State of New York, City of New York, G.O. Bonds, Fiscal 1994 Series E-2, 0.01% 20201 | | | 3,100 | | | | 3,100 | |
| State of Oregon, Full Faith and Credit Tax Anticipation Notes, Series 2015-A, 2.00% 9/15/2016 | | | 22,000 | | | | 22,226 | |
| State of Texas, City of Houston, Tax and Rev. Anticipation Notes, 2.00% 6/30/2016 | | | 10,000 | | | | 10,074 | |
| Other securities | | | | | | | 44,281 | |
| | | | | | | | | |
| Total short-term securities (cost: $256,250,000) | | | | | | | 256,273 | |
| Total investment securities 99.44% (cost: $3,223,338,000) | | | | | | | 3,359,843 | |
| Other assets less liabilities 0.56% | | | | | | | 18,817 | |
| | | | | | | | | |
| Net assets 100.00% | | | | | | $ | 3,378,660 | |
| American Funds Tax-Exempt Funds | 21 |
Limited Term Tax-Exempt Bond Fund of America
This summary investment portfolio is designed to streamline the report and help investors better focus on the fund’s principal holdings. See the inside back cover for details on how to obtain a complete schedule of portfolio holdings.
“Other securities” includes all issues that are not disclosed separately in the summary investment portfolio. Some of these securities (with an aggregate value of $13,578,000, which represented .40% of the net assets of the fund) were acquired in transactions exempt from registration under Rule 144A of the Securities Act of 1933 and may be resold in the U.S. in transactions exempt from registration, normally to qualified institutional buyers.
| 1 | Coupon rate may change periodically. For short-term securities, the date of the next scheduled coupon rate change is considered to be the maturity date. |
| Key to abbreviations |
| Agcy. = Agency |
| AMT = Alternative Minimum Tax |
| Auth. = Authority |
| Certs. of Part. = Certificates of Participation |
| Dept. = Department |
| Dev. = Development |
| Dist. = District |
| Econ. = Economic |
| Fac. = Facility |
| Facs. = Facilities |
| Fin. = Finance |
| Fncg. = Financing |
| G.O. = General Obligation |
| LOC = Letter of Credit |
| Preref. = Prerefunded |
| Redev. = Redevelopment |
| Ref. = Refunding |
| Rev. = Revenue |
| TECP = Tax-Exempt Commercial Paper |
See Notes to Financial Statements
| 22 | American Funds Tax-Exempt Funds |
| The Tax-Exempt Bond Fund of America | unaudited |
| Summary investment portfolio January 31, 2016 | |
| Portfolio quality summary* | Percent of net assets |

| * | Bond ratings, which typically range from AAA/Aaa (highest) to D (lowest), are assigned by credit rating agencies such as Standard & Poor’s, Moody’s and/or Fitch as an indication of an issuer’s creditworthiness. In assigning a credit rating to a security, the fund looks specifically to the ratings assigned to the issuer of the security by Standard & Poor’s, Moody’s and/or Fitch. If agency ratings differ, the security will be considered to have received the highest of those ratings, consistent with the fund’s investment policies. Securities in the “unrated” category (above) have not been rated by a rating agency; however, the investment adviser performs its own credit analysis and assigns comparable ratings that are used for compliance with the fund’s investment policies. |
| Bonds, notes & other debt instruments 90.90% | | Principal amount
(000) | | | Value
(000) | |
| Alabama 0.89% | | | | | | | | |
| Jefferson County, Sewer Rev. Warrants, Series 2013-A, Assured Guaranty Municipal insured, 5.00% 2044 | | $ | 19,840 | | | $ | 21,876 | |
| Other securities | | | | | | | 81,262 | |
| | | | | | | | 103,138 | |
| | | | | | | | | |
| Arizona 2.39% | | | | | | | | |
| Health Facs. Auth., Rev. Bonds (Banner Health), Series 2007-B, 1.00% 20371 | | | 22,200 | | | | 20,266 | |
| Other securities | | | | | | | 255,571 | |
| | | | | | | | 275,837 | |
| | | | | | | | | |
| California 11.44% | | | | | | | | |
| Bay Area Toll Auth., San Francisco Bay Area Toll Bridge Rev. Ref. Bonds, Series 2008-B-1, 1.12% 2045 (put 2024)1 | | | 25,850 | | | | 25,858 | |
| Foothill/Eastern Transportation Corridor Agcy., Toll Road Rev. Ref. Bonds, Series 2013-A, 6.00% 2053 | | | 24,000 | | | | 28,302 | |
| G.O. Bonds, Series 2012-A, 0.46% 2033 (put 2018)1 | | | 6,000 | | | | 5,975 | |
| Various Purpose G.O. Bonds, 3.00% 2016 | | | 33,000 | | | | 33,458 | |
| Various Purpose G.O. Bonds, 3.00% 2016 | | | 375 | | | | 383 | |
| Various Purpose G.O. Bonds, 5.00% 2029 | | | 2,500 | | | | 3,086 | |
| Various Purpose G.O. Bonds, 5.25% 2018 | | | 5,000 | | | | 5,458 | |
| Various Purpose G.O. Bonds, 5.25% 2028 | | | 10,185 | | | | 12,213 | |
| Various Purpose G.O. Bonds, 5.25% 2028 | | | 3,000 | | | | 3,606 | |
| Various Purpose G.O. Bonds, 5.25% 2031 | | | 4,000 | | | | 4,998 | |
| Various Purpose G.O. Bonds, 5.25% 2032 | | | 10,000 | | | | 12,419 | |
| Various Purpose G.O. Bonds, 6.00% 2038 | | | 8,000 | | | | 9,240 | |
| Various Purpose G.O. Bonds, 6.00% 2039 | | | 10,000 | | | | 11,814 | |
| Various Purpose G.O. Bonds, 6.50% 2033 | | | 7,000 | | | | 8,223 | |
| Various Purpose G.O. Bonds, Series 2015-C, 5.00% 2030 | | | 2,500 | | | | 3,067 | |
| Various Purpose G.O. Ref. Bonds, 5.00% 2016 | | | 4,000 | | | | 4,126 | |
| Various Purpose G.O. Ref. Bonds, 5.00% 2032 | | | 4,000 | | | | 4,706 | |
| City of San Buenaventura, Rev. Bonds (Community Memorial Health System), Series 2011, 7.50% 2041 | | | 19,850 | | | | 24,439 | |
| Turlock Irrigation Dist., Rev. Ref. Bonds, Series 2011, 5.50% 2041 | | | 17,990 | | | | 20,790 | |
| Other securities | | | | | | | 1,100,039 | |
| | | | | | | | 1,322,200 | |
| American Funds Tax-Exempt Funds | 23 |
The Tax-Exempt Bond Fund of America
| Bonds, notes & other debt instruments (continued) | | Principal amount
(000) | | | Value
(000) | |
| Colorado 2.45% | | | | | | | | |
| Health Facs. Auth., Health Facs. Rev. Ref. Bonds (Evangelical Lutheran Good Samaritan Society Project), Series 2012, 5.00% 2042 | | $ | 26,265 | | | $ | 28,339 | |
| Regional Transportation Dist., Private Activity Bonds (Denver Transit Partners Eagle P3 Project), Series 2010, 6.00% 2041 | | | 23,765 | | | | 26,829 | |
| Other securities | | | | | | | 228,500 | |
| | | | | | | | 283,668 | |
| | | | | | | | | |
| Florida 7.88% | | | | | | | | |
| Citizens Property Insurance Corp., High-Risk Account Secured Bonds, Series 2009-A-1, 6.00% 2017 | | | 20,000 | | | | 21,420 | |
| Miami Beach Redev. Agcy., Tax Increment Rev. Ref. Bonds (City Center/Historic Convention Village), Series 2015-A, Assured Guaranty Municipal insured, 5.00% 2040 | | | 18,000 | | | | 20,354 | |
| Orlando-Orange County Expressway Auth., Rev. Ref. Bonds, Series 2013-A, 5.00% 2035 | | | 27,350 | | | | 31,814 | |
| Other securities | | | | | | | 836,709 | |
| | | | | | | | 910,297 | |
| | | | | | | | | |
| Georgia 3.31% | | | | | | | | |
| City of Atlanta, Water and Wastewater Rev. Ref. Bonds, Series 1999-A, FGIC-National insured, 5.50% 2022 | | | 20,500 | | | | 25,170 | |
| Dev. Auth. of Burke County, Pollution Control Rev. Bonds (Oglethorpe Power Corp. Vogtle Project), Series 2008-E, 7.00% 2023 | | | 19,670 | | | | 21,815 | |
| Municipal Electric Auth., Project One Rev. Ref. Bonds, Series 2008-D, 5.75% 2019 | | | 23,000 | | | | 25,759 | |
| Other securities | | | | | | | 309,286 | |
| | | | | | | | 382,030 | |
| | | | | | | | | |
| Illinois 8.76% | | | | | | | | |
| Fin. Auth., Rev. Ref. Bonds (OSF Healthcare System), Series 2015-A, 5.00% 2045 | | | 21,890 | | | | 24,621 | |
| Fin. Auth., Rev. Ref. Bonds (Provena Health), Series 2009-A, 7.75% 2034 | | | 19,000 | | | | 23,014 | |
| Fin. Auth., Student Housing Rev. Ref. Bonds (CHF-DeKalb II, LLC - Northern Illinois University Project), Series 2011, 6.875% 2043 | | | 27,500 | | | | 31,948 | |
| Housing Dev. Auth., Multifamily Housing Rev. Notes (Marshall Field Garden Apartment Homes), 1.01% 2050 (put 2025)1 | | | 25,800 | | | | 25,667 | |
| State Toll Highway Auth., Toll Highway Priority Rev. Bonds, Series 2006-A-1, Assured Guaranty Municipal insured, 5.00% 2024 (preref. 2016) | | | 5,000 | | | | 5,100 | |
| State Toll Highway Auth., Toll Highway Rev. Bonds, Series 2008-B, 5.50% 2033 | | | 18,210 | | | | 19,874 | |
| State Toll Highway Auth., Toll Highway Rev. Bonds, Series 2013-A, 5.00% 2027 | | | 1,305 | | | | 1,530 | |
| State Toll Highway Auth., Toll Highway Rev. Bonds, Series 2013-A, 5.00% 2028 | | | 1,000 | | | | 1,167 | |
| State Toll Highway Auth., Toll Highway Rev. Bonds, Series 2013-A, 5.00% 2029 | | | 3,000 | | | | 3,486 | |
| State Toll Highway Auth., Toll Highway Rev. Bonds, Series 2013-A, 5.00% 2030 | | | 7,100 | | | | 8,188 | |
| State Toll Highway Auth., Toll Highway Rev. Bonds, Series 2013-A, 5.00% 2032 | | | 1,000 | | | | 1,143 | |
| State Toll Highway Auth., Toll Highway Rev. Bonds, Series 2013-A, 5.00% 2033 | | | 2,200 | | | | 2,510 | |
| State Toll Highway Auth., Toll Highway Rev. Bonds, Series 2013-A, 5.00% 2038 | | | 34,430 | | | | 38,705 | |
| State Toll Highway Auth., Toll Highway Rev. Bonds, Series 2014-B, 5.00% 2038 | | | 2,500 | | | | 2,846 | |
| State Toll Highway Auth., Toll Highway Rev. Bonds, Series 2014-B, 5.00% 2039 | | | 3,000 | | | | 3,404 | |
| State Toll Highway Auth., Toll Highway Rev. Bonds, Series 2015-B, 5.00% 2036 | | | 2,000 | | | | 2,350 | |
| State Toll Highway Auth., Toll Highway Rev. Bonds, Series 2015-B, 5.00% 2037 | | | 1,500 | | | | 1,756 | |
| State Toll Highway Auth., Toll Highway Rev. Bonds, Series 2015-B, 5.00% 2040 | | | 6,500 | | | | 7,512 | |
| State Toll Highway Auth., Toll Highway Rev. Ref. Bonds, Series 2010-A-1, 4.50% 2027 | | | 6,000 | | | | 6,596 | |
| State Toll Highway Auth., Toll Highway Rev. Ref. Bonds, Series 2010-A-1, 5.00% 2025 | | | 10,000 | | | | 11,353 | |
| State Toll Highway Auth., Toll Highway Rev. Ref. Bonds, Series 2010-A-1, 5.00% 2028 | | | 10,000 | | | | 11,292 | |
| State Toll Highway Auth., Toll Highway Rev. Ref. Bonds, Series 2010-A-1, 5.00% 2031 | | | 4,000 | | | | 4,478 | |
| Other securities | | | | | | | 774,016 | |
| | | | | | | | 1,012,556 | |
| | | | | | | | | |
| Indiana 2.11% | | | | | | | | |
| Fin. Auth., Health System Rev. Bonds (Franciscan Alliance, Inc.), Series 2016-A, 5.00% 2051 | | | 18,600 | | | | 20,944 | |
| Other securities | | | | | | | 222,886 | |
| | | | | | | | 243,830 | |
| 24 | American Funds Tax-Exempt Funds |
The Tax-Exempt Bond Fund of America
| | | Principal amount | | | Value | |
| | | | (000) | | | | (000) | |
| Kentucky 0.54% | | | | | | | | |
| Public Transportation Infrastructure Auth., Toll Rev. Bonds (Downtown Crossing Project), Series 2013-A, 6.00% 2053 | | $ | 18,020 | | | $ | 20,863 | |
| Other securities | | | | | | | 41,129 | |
| | | | | | | | 61,992 | |
| | | | | | | | | |
| Louisiana 2.12% | | | | | | | | |
| Local Government Environmental Facs. and Community Dev. Auth., Rev. Bonds (Westlake Chemical Corp. Projects), Series 2007, 6.75% 2032 | | | 24,560 | | | | 26,579 | |
| Other securities | | | | | | | 218,219 | |
| | | | | | | | 244,798 | |
| | | | | | | | | |
| Massachusetts 2.33% | | | | | | | | |
| G.O. Bonds, Consolidated Loan of 2008, Series A, 5.00% 2033 | | | 8,070 | | | | 8,826 | |
| G.O. Ref. Bonds, Series 2013-B, 5.00% 2023 | | | 1,000 | | | | 1,246 | |
| Other securities | | | | | | | 258,592 | |
| | | | | | | | 268,664 | |
| | | | | | | | | |
| Michigan 4.00% | | | | | | | | |
| School Dist. of the City of Detroit (Wayne County), School Building and Site Improvement Ref. Bonds (Unlimited Tax G.O.), Series 2005-A, Assured Guaranty Municipal insured, 5.25% 2032 | | | 20,000 | | | | 24,421 | |
| Tobacco Settlement Fin. Auth., Tobacco Settlement Asset-backed Bonds, Current Interest Bonds, Series 2007-A, 6.00% 2048 | | | 48,005 | | | | 43,808 | |
| Other securities | | | | | | | 394,116 | |
| | | | | | | | 462,345 | |
| | | | | | | | | |
| Nevada 1.66% | | | | | | | | |
| Clark County, Airport System Rev. Bonds, Series 2010-B, 5.125% 2036 | | | 18,000 | | | | 20,162 | |
| Other securities | | | | | | | 171,287 | |
| | | | | | | | 191,449 | |
| | | | | | | | | |
| New Hampshire 0.38% | | | | | | | | |
| Business Fin. Auth., Rev. Bonds (Elliot Hospital Obligated Group Issue), Series 2009-A, 6.125% 2039 | | | 18,115 | | | | 20,172 | |
| Other securities | | | | | | | 23,447 | |
| | | | | | | | 43,619 | |
| | | | | | | | | |
| New Jersey 2.28% | | | | | | | | |
| Tobacco Settlement Fncg. Corp., Tobacco Settlement Asset-backed Rev. Ref. Bonds, Series 2007-1-A, 5.00% 2041 | | | 54,850 | | | | 46,115 | |
| Other securities | | | | | | | 216,835 | |
| | | | | | | | 262,950 | |
| | | | | | | | | |
| New York 6.53% | | | | | | | | |
| Liberty Dev. Corp., Liberty Rev. Ref. Bonds (Bank of America Tower at One Bryant Park Project), Series 2010, 6.375% 2049 | | | 21,000 | | | | 23,754 | |
| Metropolitan Transportation Auth., Transportation Rev. Bonds, Series 2003-B, FGIC-National insured, 5.25% 2021 | | | 5,000 | | | | 6,097 | |
| Metropolitan Transportation Auth., Transportation Rev. Bonds, Series 2005-C, 5.00% 2016 | | | 1,000 | | | | 1,037 | |
| Metropolitan Transportation Auth., Transportation Rev. Bonds, Series 2008-B-2, 5.00% 2016 | | | 3,000 | | | | 3,110 | |
| Metropolitan Transportation Auth., Transportation Rev. Bonds, Series 2008-C, 5.50% 2018 | | | 4,100 | | | | 4,383 | |
| Metropolitan Transportation Auth., Transportation Rev. Bonds, Series 2011-D, 5.00% 2036 | | | 6,000 | | | | 7,028 | |
| Metropolitan Transportation Auth., Transportation Rev. Bonds, Series 2014-B, 5.00% 2044 | | | 13,000 | | | | 14,775 | |
| Metropolitan Transportation Auth., Transportation Rev. Bonds, Series 2015-A-1, 5.00% 2040 | | | 8,000 | | | | 9,268 | |
| Metropolitan Transportation Auth., Transportation Rev. Bonds, Series 2015-A-1, 5.00% 2045 | | | 20,000 | | | | 23,012 | |
| American Funds Tax-Exempt Funds | 25 |
The Tax-Exempt Bond Fund of America
| Bonds, notes & other debt instruments (continued) | | Principal amount
(000) | | | Value
(000) | |
| New York (continued) | | | | | | | | |
| Metropolitan Transportation Auth., Transportation Rev. Bonds, Series 2015-A-2, 0.59% 2039 (put 2020)1 | | $ | 13,000 | | | $ | 12,838 | |
| Metropolitan Transportation Auth., Transportation Rev. Bonds, Series 2015-C-1, 5.00% 2035 | | | 6,000 | | | | 7,118 | |
| Metropolitan Transportation Auth., Transportation Rev. Ref. Bonds, Series 2011-C, 5.00% 2023 | | | 5,000 | | | | 5,968 | |
| Metropolitan Transportation Auth., Transportation Rev. Ref. Bonds, Series 2012-D, 5.00% 2024 | | | 8,000 | | | | 9,814 | |
| Metropolitan Transportation Auth., Transportation Rev. Ref. Bonds, Series 2012-D, 5.00% 2029 | | | 7,000 | | | | 8,407 | |
| Metropolitan Transportation Auth., Transportation Rev. Ref. Bonds, Series 2012-D, 5.00% 2032 | | | 3,105 | | | | 3,701 | |
| Metropolitan Transportation Auth., Transportation Rev. Ref. Bonds, Series 2012-F, 5.00% 2030 | | | 10,000 | | | | 11,949 | |
| Metropolitan Transportation Auth., Transportation Rev. Ref. Bonds, Series 2014-A-2, 5.00% 2028 | | | 3,000 | | | | 3,598 | |
| Other securities | | | | | | | 599,231 | |
| | | | | | | | 755,088 | |
| | | | | | | | | |
| Ohio 3.62% | | | | | | | | |
| Buckeye Tobacco Settlement Fncg. Auth., Tobacco Settlement Asset-backed Bonds, Convertible Capital Appreciation Bonds, Series 2007-A-3, 6.25% 2037 | | | 5,000 | | | | 4,652 | |
| Buckeye Tobacco Settlement Fncg. Auth., Tobacco Settlement Asset-backed Bonds, Current Interest Bonds, Series 2007-A-2, 5.875% 2030 | | | 19,990 | | | | 18,030 | |
| Buckeye Tobacco Settlement Fncg. Auth., Tobacco Settlement Asset-backed Bonds, Current Interest Bonds, Series 2007-A-2, 5.875% 2047 | | | 65,260 | | | | 57,811 | |
| Buckeye Tobacco Settlement Fncg. Auth., Tobacco Settlement Asset-backed Bonds, Current Interest Bonds, Series 2007-A-2, 6.50% 2047 | | | 48,625 | | | | 46,370 | |
| Other securities | | | | | | | 291,176 | |
| | | | | | | | 418,039 | |
| | | | | | | | | |
| South Carolina 1.35% | | | | | | | | |
| Building Equity Sooner for Tomorrow (BEST), Installment Purchase Rev. Ref. Bonds (School Dist. of Greenville County, South Carolina Project), Series 2006, 5.00% 2023 | | | 19,845 | | | | 20,597 | |
| Public Service Auth., Rev. Obligations (Santee Cooper), Series 2008-A, 5.50% 2038 | | | 18,410 | | | | 20,884 | |
| Other securities | | | | | | | 114,973 | |
| | | | | | | | 156,454 | |
| | | | | | | | | |
| Texas 8.84% | | | | | | | | |
| Bexar County Hospital Dist., Combination Tax and Rev. Certificates of Obligation, Series 2008, 5.00% 2032 | | | 20,500 | | | | 22,055 | |
| Grand Parkway Transportation Corp., Grand Parkway System Toll Rev. Bonds, Series 2013-B, 5.00% 2053 | | | 32,800 | | | | 36,548 | |
| North Texas Tollway Auth., System Rev. Ref. Bonds, Current Interest Bonds, Series 2008-A, 5.50% 2018 | | | 1,000 | | | | 1,089 | |
| North Texas Tollway Auth., System Rev. Ref. Bonds, Current Interest Bonds, Series 2008-A, 5.625% 2033 | | | 8,210 | | | | 8,856 | |
| North Texas Tollway Auth., System Rev. Ref. Bonds, Current Interest Bonds, Series 2008-A, 5.625% 2033 (preref 2018) | | | 6,890 | | | | 7,535 | |
| North Texas Tollway Auth., System Rev. Ref. Bonds, Current Interest Bonds, Series 2008-A, 6.00% 2021 | | | 465 | | | | 507 | |
| North Texas Tollway Auth., System Rev. Ref. Bonds, Current Interest Bonds, Series 2008-A, 6.00% 2021 (preref. 2018) | | | 3,295 | | | | 3,627 | |
| North Texas Tollway Auth., System Rev. Ref. Bonds, Current Interest Bonds, Series 2008-A, 6.00% 2023 | | | 1,545 | | | | 1,685 | |
| North Texas Tollway Auth., System Rev. Ref. Bonds, Current Interest Bonds, Series 2008-A, 6.00% 2023 (preref. 2018) | | | 11,025 | | | | 12,135 | |
| North Texas Tollway Auth., System Rev. Ref. Bonds, Current Interest Bonds, Series 2008-A, 6.00% 2025 | | | 615 | | | | 675 | |
| North Texas Tollway Auth., System Rev. Ref. Bonds, Current Interest Bonds, Series 2008-A, 6.00% 2025 (preref. 2018) | | | 4,385 | | | | 4,827 | |
| North Texas Tollway Auth., System Rev. Ref. Bonds, Current Interest Bonds, Series 2012-B, 5.25% 2052 | | | 8,435 | | | | 9,526 | |
| 26 | American Funds Tax-Exempt Funds |
The Tax-Exempt Bond Fund of America
| | | Principal amount | | | Value | |
| | | (000) | | | (000) | |
| North Texas Tollway Auth., System Rev. Ref. Bonds, Current Interest Bonds, Series 2014-C, 0.68% 2038 (put 2020)1 | | $ | 7,500 | | | $ | 7,378 | |
| North Texas Tollway Auth., System Rev. Ref. Bonds, Current Interest Bonds, Series 2015-B, 5.00% 2040 | | | 7,200 | | | | 8,185 | |
| North Texas Tollway Auth., System Rev. Ref. Bonds, Series 2008-F, 5.75% 2033 | | | 11,000 | | | | 12,055 | |
| North Texas Tollway Auth., System Rev. Ref. Bonds, Series 2008-F, 5.75% 2038 | | | 8,500 | | | | 9,315 | |
| North Texas Tollway Auth., System Rev. Ref. Bonds, Series 2009-A, 6.00% 2028 | | | 16,000 | | | | 18,278 | |
| North Texas Tollway Auth., System Rev. Ref. Bonds, Series 2009-A, 6.10% 2028 | | | 5,000 | | | | 5,733 | |
| North Texas Tollway Auth., System Rev. Ref. Bonds, Series 2009-A, 6.25% 2039 | | | 5,000 | | | | 5,669 | |
| North Texas Tollway Auth., System Rev. Ref. Bonds, Series 2010, 6.00% 2034 | | | 1,500 | | | | 1,792 | |
| North Texas Tollway Auth., System Rev. Ref. Bonds, Series 2010, 6.00% 2038 | | | 5,000 | | | | 5,938 | |
| North Texas Tollway Auth., System Rev. Ref. Bonds, Series 2011-A, 0.82% 2050 (put 2019)1 | | | 3,600 | | | | 3,572 | |
| North Texas Tollway Auth., System Rev. Ref. Bonds, Series 2011-B, 5.00% 2038 | | | 8,000 | | | | 8,850 | |
| North Texas Tollway Auth., System Rev. Ref. Bonds, Series 2012-C, 1.95% 2038 (put 2019) | | | 8,600 | | | | 8,740 | |
| North Texas Tollway Auth., System Rev. Ref. Bonds, Series 2014-A, 5.00% 2022 | | | 1,000 | | | | 1,199 | |
| North Texas Tollway Auth., System Rev. Ref. Bonds, Series 2015-A, 5.00% 2032 | | | 7,500 | | | | 8,814 | |
| North Texas Tollway Auth., System Rev. Ref. Bonds, Series 2015-A, 5.00% 2034 | | | 4,500 | | | | 5,250 | |
| North Texas Tollway Auth., System Rev. Ref. Bonds, Series 2015-A, 5.00% 2035 | | | 4,000 | | | | 4,646 | |
| North Texas Tollway Auth., System Rev. Ref. Bonds, Series 2015-A, 5.00% 2038 | | | 1,500 | | | | 1,719 | |
| Other securities | | | | | | | 795,689 | |
| | | | | | | | 1,021,887 | |
| | | | | | | | | |
| Virginia 0.41% | | | | | | | | |
| Various Purpose G.O. Bonds, Series 2014-A, 4.00% 2016 | | | 1,000 | | | | 1,013 | |
| Other securities | | | | | | | 45,801 | |
| | | | | | | | 46,814 | |
| | | | | | | | | |
| Washington 3.39% | | | | | | | | |
| Health Care Facs. Auth. Rev. Bonds (Catholic Health Initiatives), Series 2013-B-1, 1.01% 2035 (put 2021)1 | | | 59,750 | | | | 59,380 | |
| Health Care Facs. Auth., Rev. Ref. Bonds (Virginia Mason Medical Center), Series 2007-A, 6.125% 2037 | | | 22,000 | | | | 23,504 | |
| Other securities | | | | | | | 309,006 | |
| | | | | | | | 391,890 | |
| | | | | | | | | |
| Wisconsin 1.64% | | | | | | | | |
| General Fund Annual Appropriation Rev. Ref. Bonds, Series 2009-A, 6.00% 2036 | | | 52,960 | | | | 61,274 | |
| Other securities | | | | | | | 128,151 | |
| | | | | | | | 189,425 | |
| | | | | | | | | |
| Other states & U.S. territories 12.58% | | | | | | | | |
| Other securities | | | | | | | 1,454,258 | |
| | | | | | | | | |
| Total bonds, notes & other debt instruments (cost: $9,791,660,000) | | | | | | | 10,503,228 | |
| | | | | | | | | |
| Short-term securities 8.16% | | | | | | | | |
| State of California, Various Purpose G.O. Bonds, 0.04% 4/7/2016 | | | 4,000 | | | | 4,000 | |
| State of California, County of Los Angeles, Tax and Rev. Anticipation Notes, 5.00% 6/30/2016 | | | 25,000 | | | | 25,490 | |
| State of Colorado, General Fund Tax and Rev. Anticipation Notes, Series 2015-A, 1.50% 6/28/2016 | | | 13,000 | | | | 13,066 | |
| State of Colorado, General Fund Tax and Rev. Anticipation Notes, Series 2015-A, 1.75% 6/28/2016 | | | 60,000 | | | | 60,382 | |
| State of Colorado, General Fund Tax and Rev. Anticipation Notes, Series 2015-A, 2.00% 6/28/2016 | | | 10,000 | | | | 10,073 | |
| District of Columbia, Tax and Rev. Anticipation Notes, Series 2015, 1.50% 9/30/2016 | | | 25,000 | | | | 25,189 | |
| State of Georgia, Dev. Auth. Pollution Control Rev. Bonds (Oglethorpe Power Corp. Project) Series 2009-B, 0.01% 20361 | | | 27,030 | | | | 27,030 | |
| American Funds Tax-Exempt Funds | 27 |
The Tax-Exempt Bond Fund of America
| Short-term securities (continued) | | Principal amount
(000) | | | Value
(000) | |
| State of Idaho, Tax Anticipation Notes, Series 2015, 2.00% 6/30/2016 | | $ | 42,250 | | | $ | 42,563 | |
| State of Massachusetts, G. O. Rev. Anticipation Notes, Series 2015-B, 2.00% 5/25/2016 | | | 80,000 | | | | 80,453 | |
| State of Massachusetts, G. O. Rev. Anticipation Notes, Series 2015-C, 2.00% 6/22/2016 | | | 54,000 | | | | 54,373 | |
| State of Massachusetts, School Building Auth., Dedicated Sales Tax Rev. Ref. Bonds, Series 2015-C, 5.00% 8/15/2016 | | | 21,705 | | | | 22,271 | |
| State of New York, Metropolitan Transportation Auth., Dedicated Tax Fund Bond Anticipation Notes, Series 2015-A-4, 0.75% 6/1/2016 | | | 25,000 | | | | 25,044 | |
| State of New York, Metropolitan Transportation Auth., Dedicated Tax Fund Bond Anticipation Notes, Series 2015-A-7, 0.75% 6/1/2016 | | | 20,000 | | | | 20,036 | |
| State of New York, Metropolitan Transportation Auth., Dedicated Tax Fund Bond Anticipation Notes, Series 2015-A-8, 0.75% 6/1/2016 | | | 15,000 | | | | 15,026 | |
| State of New York, Metropolitan Transportation Auth., Transportation Rev. Bond Anticipation Notes, Series 2015-A-4, 0.50% 3/1/2016 | | | 50,000 | | | | 50,015 | |
| State of New York, Metropolitan Transportation Auth., Transportation Rev. Bond Anticipation Notes, Series 2015-B1, 1.00% 8/1/2016 | | | 10,000 | | | | 10,033 | |
| State of New York, Metropolitan Transportation Auth., Transportation Rev. Bond Anticipation Notes, Series 2015-B1-G, 1.00% 8/1/2016 | | | 48,000 | | | | 48,146 | |
| State of Oregon, Full Faith and Credit Tax Anticipation Notes, Series 2015-A, 2.00% 9/15/2016 | | | 98,000 | | | | 99,008 | |
| State of Texas, Harris County, Tax Anticipation Notes, 1.50% 2/29/2016 | | | 25,000 | | | | 25,029 | |
| Other securities | | | | | | | 285,673 | |
| Total short-term securities (cost: $942,899,000) | | | | | | | 942,900 | |
| | | | | | | | | |
| Total investment securities 99.06% (cost: $10,734,559,000) | | | | | | | 11,446,128 | |
| Other assets less liabilities 0.94% | | | | | | | 109,081 | |
| | | | | | | | | |
| Net assets 100.00% | | | | | | $ | 11,555,209 | |
This summary investment portfolio is designed to streamline the report and help investors better focus on the fund’s principal holdings. See the inside back cover for details on how to obtain a complete schedule of portfolio holdings.
“Other securities” includes all issues that are not disclosed separately in the summary investment portfolio. A security within “Other securities” (with a value of $206,090,000, which represented 1.78% of the net assets of the fund) was acquired in transactions exempt from registration under Rule 144A of the Securities Act of 1933 and may be resold in the U.S. in transactions exempt from registration, normally to qualified institutional buyers.
| 1 | Coupon rate may change periodically. For short-term securities, the date of the next scheduled coupon rate change is considered to be the maturity date. |
Key to abbreviations
Agcy. = Agency
Auth. = Authority
Certs. of Part. = Certificates of Participation
Dept. = Department
Dev. = Development
Dist. = District
Econ. = Economic
Fac. = Facility
Facs. = Facilities
Fin. = Finance
Fncg. = Financing
G.O. = General Obligation
LOC = Letter of Credit
Preref. = Prerefunded
Redev. = Redevelopment
Ref. = Refunding
Rev. = Revenue
TECP = Tax-Exempt Commercial Paper
See Notes to Financial Statements
| 28 | American Funds Tax-Exempt Funds |
| American High-Income Municipal Bond Fund | unaudited |
| Summary investment portfolio January 31, 2016 | |
| Portfolio quality summary* | Percent of net assets |
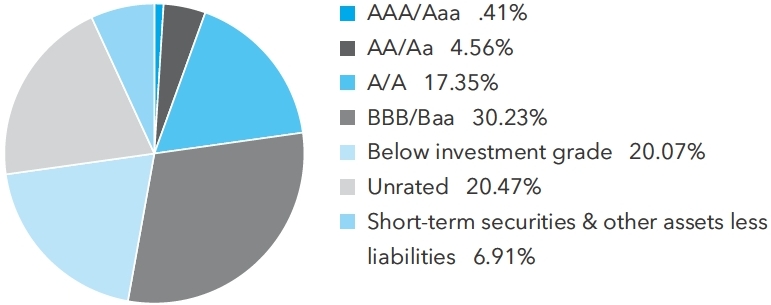
| * | Bond ratings, which typically range from AAA/Aaa (highest) to D (lowest), are assigned by credit rating agencies such as Standard & Poor’s, Moody’s and/or Fitch as an indication of an issuer’s creditworthiness. In assigning a credit rating to a security, the fund looks specifically to the ratings assigned to the issuer of the security by Standard & Poor’s, Moody’s and/or Fitch. If agency ratings differ, the security will be considered to have received the highest of those ratings, consistent with the fund’s investment policies. Securities in the “unrated” category (above) have not been rated by a rating agency; however, the investment adviser performs its own credit analysis and assigns comparable ratings that are used for compliance with the fund’s investment policies. |
| Bonds, notes & other debt instruments 93.09% | | Principal amount
(000) | | | Value
(000) | |
| Arizona 2.11% | | | | | | | | |
| Industrial Dev. Auth. of the County of Pima, Water and Wastewater Rev. Bonds (Global Water Resources, LLC Project), Series 2007, AMT, 6.55% 2037 | | $ | 16,590 | | | $ | 16,893 | |
| Other securities | | | | | | | 71,088 | |
| | | | | | | | 87,981 | |
| | | | | | | | | |
| California 10.52% | | | | | | | | |
| Morongo Band of Mission Indians, Enterprise Rev. Ref. Bonds, Series 2008-B, 6.50% 2028 | | | 9,750 | | | | 10,699 | |
| City of San Buenaventura, Rev. Bonds (Community Memorial Health System), Series 2011, 7.50% 2041 | | | 13,040 | | | | 16,055 | |
| Other securities | | | | | | | 410,830 | |
| | | | | | | | 437,584 | |
| | | | | | | | | |
| Colorado 4.27% | | | | | | | | |
| Promenade at Castle Rock Metropolitan District No. 1, G.O. Bonds (In the Town of Castle Rock), Series 2015-A, 5.75% 2039 | | | 10,300 | | | | 10,691 | |
| City and County of Denver, Dept. of Aviation, Special Facs. Airport Rev. Ref. Bonds (United Air Lines Project), Series 2007-A, AMT, 5.25% 2032 | | | 18,000 | | | | 18,712 | |
| City and County of Denver, Dept. of Aviation, Special Facs. Airport Rev. Ref. Bonds (United Air Lines Project), Series 2007-A, AMT, 5.75% 2032 | | | 2,905 | | | | 3,047 | |
| Health Facs. Auth., Health Care Facs. Rev. Bonds (American Baptist Homes of the Midwest Obligated Group), Series 2013, 8.00% 2043 | | | 11,100 | | | | 13,372 | |
| Regional Transportation Dist., Private Activity Bonds (Denver Transit Partners Eagle P3 Project), Series 2010, 6.00% 2041 | | | 14,800 | | | | 16,708 | |
| Other securities | | | | | | | 115,336 | |
| | | | | | | | 177,866 | |
| | | | | | | | | |
| Florida 6.57% | | | | | | | | |
| Dev. Fin. Corp., Healthcare Facs. Rev. Bonds (UF Health - Jacksonville Project), Series 2013-A, 6.00% 2033 | | | 11,930 | | | | 13,739 | |
| Lee County Industrial Dev. Auth., Healthcare Facs. Rev. Ref. Bonds (Shell Point/Alliance Obligated Group, Shell Point Village/Alliance Community Project), Series 2007, 5.00% 2029 | | | 13,425 | | | | 13,950 | |
| Lee County, Airport Rev. Ref. Bonds, Series 2011-A, AMT, 5.375% 2032 | | | 9,935 | | | | 11,251 | |
| City of Tallahassee, Health Facs. Rev. Ref. Bonds (Tallahassee Memorial HealthCare, Inc. Project), Series 2016-A, 5.00% 2055 | | | 11,200 | | | | 12,240 | |
| Other securities | | | | | | | 222,137 | |
| | | | | | | | 273,317 | |
| American Funds Tax-Exempt Funds | 29 |
American High-Income Municipal Bond Fund
| Bonds, notes & other debt instruments (continued) | | Principal amount
(000) | | | Value
(000) | |
| Illinois 7.68% | | | | | | | | |
| City of Chicago, Chicago Midway Airport, Rev. Ref. Bonds, Series 2014-A, AMT, 5.00% 2031 | | $ | 9,500 | | | $ | 10,809 | |
| City of Chicago, Chicago Midway Airport, Rev. Ref. Bonds, Series 2014-A, AMT, 5.00% 2041 | | | 13,000 | | | | 14,245 | |
| Fin. Auth., Rev. Ref. Bonds (Provena Health), Series 2009-A, 7.75% 2034 | | | 12,800 | | | | 15,504 | |
| Fin. Auth., Student Housing Rev. Ref. Bonds (CHF-DeKalb II, LLC - Northern Illinois University Project), Series 2011, 6.875% 2043 | | | 11,500 | | | | 13,360 | |
| Fin. Auth., Student Hosuing Rev. Bonds (CHF-Cook, LLC - Northeastern Illinois University Project), Series 2015-A, 5.00% 2047 | | | 11,000 | | | | 11,402 | |
| Southwestern Illinois Dev. Auth., Health Fac. Rev. Bonds (Memorial Group, Inc.), Series 2013, 7.625% 2048 | | | 11,020 | | | | 15,249 | |
| Other securities | | | | | | | 238,946 | |
| | | | | | | | 319,515 | |
| | | | | | | | | |
| Iowa 1.42% | | | | | | | | |
| Fin. Auth., Midwestern Disaster Area Rev. Ref. Bonds (Iowa Fertilizer Co. Project), Series 2013, 5.25% 2025 | | | 28,900 | | | | 31,643 | |
| Other securities | | | | | | | 27,541 | |
| | | | | | | | 59,184 | |
| | | | | | | | | |
| Louisiana 1.81% | | | | | | | | |
| Aviation Board, General Airport Rev. Bonds (North Terminal Project), Series 2015-B, AMT, 5.00% 2040 | | | 10,000 | | | | 11,116 | |
| Other securities | | | | | | | 64,061 | |
| | | | | | | | 75,177 | |
| | | | | | | | | |
| Massachusetts 1.85% | | | | | | | | |
| Dev. Fin. Agcy., Rev. Bonds (Linden Ponds, Inc. Fac.), Series 2011-A-1, 6.25% 2046 | | | 12,212 | | | | 11,838 | |
| Dev. Fin. Agcy., Rev. Ref. Bonds (Tufts Medical Center Issue), Series 2011-I, 6.75% 2036 | | | 11,175 | | | | 13,239 | |
| Other securities | | | | | | | 51,788 | |
| | | | | | | | 76,865 | |
| | | | | | | | | |
| Michigan 4.75% | | | | | | | | |
| Tobacco Settlement Fin. Auth., Tobacco Settlement Asset-backed Bonds, Current Interest Bonds, Series 2007-A, 6.00% 2048 | | | 47,070 | | | | 42,955 | |
| Tobacco Settlement Fin. Auth., Tobacco Settlement Asset-backed Rev. Ref. Bonds, Current Interest Bonds, Series 2008-A, 6.875% 2042 | | | 5,440 | | | | 5,574 | |
| Wayne County Airport Auth., Airport Rev. Ref. Bonds (Detroit Metropolitan Wayne County Airport), Series 2012-D, AMT, 5.00% 2028 | | | 12,000 | | | | 13,543 | |
| Other securities | | | | | | | 135,714 | |
| | | | | | | | 197,786 | |
| | | | | | | | | |
| New Jersey 4.86% | | | | | | | | |
| Econ. Dev. Auth., Special Fac. Rev. Bonds (Continental Airlines, Inc. Project), Series 1999, AMT, 5.125% 2023 | | | 4,500 | | | | 5,006 | |
| Econ. Dev. Auth., Special Fac. Rev. Bonds (Continental Airlines, Inc. Project), Series 1999, AMT, 5.25% 2029 | | | 18,500 | | | | 20,369 | |
| Econ. Dev. Auth., Special Fac. Rev. Bonds (Continental Airlines, Inc. Project), Series 2000-B, AMT, 5.625% 2030 | | | 1,750 | | | | 1,990 | |
| Econ. Dev. Auth., Special Fac. Rev. Bonds (Continental Airlines, Inc. Project), Series 2003, AMT, 5.50% 2033 | | | 3,500 | | | | 3,919 | |
| Econ. Dev. Auth., Special Fac. Rev. Ref. Bonds (Continental Airlines, Inc. Project), Series 2012, AMT, 5.75% 2027 | | | 4,500 | | | | 5,015 | |
| South Jersey Transportation Auth., Transportation System Rev. Bonds, Series 2014-A, 5.00% 2039 | | | 12,650 | | | | 13,889 | |
| Tobacco Settlement Fncg. Corp., Tobacco Settlement Asset-backed Rev. Ref. Bonds, Series 2007-1-A, 5.00% 2041 | | | 63,620 | | | | 53,488 | |
| Other securities | | | | | | | 98,720 | |
| | | | | | | | 202,396 | |
| 30 | American Funds Tax-Exempt Funds |
American High-Income Municipal Bond Fund
| | | Principal amount
(000) | | | Value
(000) | |
| New York 4.25% | | | | | | | | |
| Liberty Dev. Corp., Liberty Rev. Ref. Bonds (Bank of America Tower at One Bryant Park Project), Series 2010, 6.375% 2049 | | $ | 13,360 | | | $ | 15,112 | |
| New York City Industrial Dev. Agcy., Special Fac. Rev. Bonds (American Airlines, Inc. John F. Kennedy International Airport Project), AMT, 2.00% 2028 | | | 4,600 | | | | 4,610 | |
| New York City Industrial Dev. Agcy., Special Fac. Rev. Bonds (American Airlines, Inc. John F. Kennedy International Airport Project), Series 2005, AMT, 7.625% 2025 | | | 15,200 | | | | 15,843 | |
| New York City Industrial Dev. Agcy., Special Fac. Rev. Bonds (American Airlines, Inc. John F. Kennedy International Airport Project), Series 2005, AMT, 7.75% 2031 | | | 3,130 | | | | 3,264 | |
| New York City Industrial Dev. Agcy., Special Fac. Rev. Bonds (American Airlines, Inc. John F. Kennedy International Airport Project), Series 2005, AMT, 8.00% 2028 | | | 2,000 | | | | 2,088 | |
| New York City, Housing Dev. Corp. Multi-Family Rev. Bonds (8 Spruce Street), Series 2014-F, 4.50% 2048 | | | 10,250 | | | | 11,031 | |
| Other securities | | | | | | | 124,875 | |
| | | | | | | | 176,823 | |
| | | | | | | | | |
| Ohio 5.49% | | | | | | | | |
| Air Quality Dev. Auth., Air Quality Dev. Rev. Bonds (FirstEnergy Generation Corp. Project), Series 2009-A, 5.70% 2020 | | | 1,500 | | | | 1,686 | |
| Air Quality Dev. Auth., Pollution Control Rev. Ref. Bonds (FirstEnergy Generation Corp. Project), Series 2009-C, 5.625% 2018 | | | 8,580 | | | | 9,216 | |
| Air Quality Dev. Auth., Pollution Control Rev. Ref. Bonds (FirstEnergy Nuclear Generation Corp. Project), Series 2008-B, 3.95% 2032 (put 2020) | | | 2,500 | | | | 2,594 | |
| Air Quality Dev. Auth., Pollution Control Rev. Ref. Bonds (FirstEnergy Nuclear Generation Corp. Project), Series 2014-A, 3.75% 2023 (put 2018) | | | 1,275 | | | | 1,312 | |
| Buckeye Tobacco Settlement Fncg. Auth., Tobacco Settlement Asset-backed Bonds, Current Interest Bonds, Series 2007-A-2, 5.875% 2030 | | | 2,350 | | | | 2,120 | |
| Buckeye Tobacco Settlement Fncg. Auth., Tobacco Settlement Asset-backed Bonds, Current Interest Bonds, Series 2007-A-2, 5.875% 2047 | | | 82,155 | | | | 72,778 | |
| Buckeye Tobacco Settlement Fncg. Auth., Tobacco Settlement Asset-backed Bonds, Current Interest Bonds, Series 2007-A-2, 6.50% 2047 | | | 22,075 | | | | 21,051 | |
| County of Gallia, Hospital Facs. Rev. Ref. and Improvement Bonds (Holzer Health System Obligated Group Project), Series 2012-A, 8.00% 2042 | | | 10,870 | | | | 12,652 | |
| Water Dev. Auth., Pollution Control Rev. Ref. Bonds (FirstEnergy Nuclear Generation Corp. Project), Series 2005-B, 4.00% 2034 (put 2021) | | | 8,000 | | | | 8,316 | |
| Water Dev. Auth., Pollution Control Rev. Ref. Bonds (FirstEnergy Nuclear Generation Corp. Project), Series 2014-B, 3.625% 2033 (put 2020) | | | 2,250 | | | | 2,318 | |
| Water Dev. Auth., Pollution Control Rev. Ref. Bonds (FirstEnergy Nuclear Generation Corp. Project), Series 2014-C, AMT, 3.95% 2032 (put 2020) | | | 3,000 | | | | 3,113 | |
| Water Quality Dev. Auth., Pollution Control Rev. Ref. Bonds (FirstEnergy Nuclear Generation Corp. Project), Series 2014-B, 4.00% 2033 (put 2019) | | | 2,000 | | | | 2,080 | |
| Other securities | | | | | | | 89,353 | |
| | | | | | | | 228,589 | |
| | | | | | | | | |
| Oklahoma 0.90% | | | | | | | | |
| Trustees of the Tulsa Municipal Airport Trust, American Airlines Inc. Rev. Ref. Bonds, Series 2001-B, AMT, 5.50% 2035 | | | 15,875 | | | | 17,397 | |
| Trustees of the Tulsa Municipal Airport Trust, American Airlines Inc. Rev. Ref. Bonds, Series 2013-B, AMT, 5.50% 2035 | | | 120 | | | | 131 | |
| Trustees of the Tulsa Municipal Airport Trust, Series 2015, AMT, 5.00% 2035 (put 2025) | | | 5,000 | | | | 5,608 | |
| Other securities | | | | | | | 14,198 | |
| | | | | | | | 37,334 | |
| American Funds Tax-Exempt Funds | 31 |
American High-Income Municipal Bond Fund
| Bonds, notes & other debt instruments (continued) | | Principal amount
(000) | | | Value
(000) | |
| Pennsylvania 5.05% | | | | | | | | |
| Beaver County Industrial Dev. Auth., Pollution Control Rev. Ref. Bonds (FirstEnergy Nuclear Generation Project), Series 2005-A, 4.00% 2035 (put 2021) | | $ | 8,700 | | | $ | 9,039 | |
| Econ. Dev. Fncg. Auth., Private Activity Rev. Bonds (The Pennsylvania Rapid Bridge Replacement Project), Series 2015, AMT, 5.00% 2034 | | | 16,200 | | | | 18,156 | |
| Higher Educational Facs. Auth., Rev. Bonds (Edinboro University Foundation Student Housing Project), Series 2008, 5.875% 2038 | | | 11,400 | | | | 11,945 | |
| Hospitals and Higher Education Facs. Auth. of Philadelphia, Hospital Rev. Bonds (Temple University Health System Obligated Group), Series 2012-A, 5.625% 2042 | | | 11,545 | | | | 12,516 | |
| Susquehanna Area Regional Airport Auth., Airport System Rev. Bonds, Series 2012-A, AMT, 5.00% 2027 | | | 10,210 | | | | 11,234 | |
| Other securities | | | | | | | 147,062 | |
| | | | | | | | 209,952 | |
| | | | | | | | | |
| Puerto Rico 3.26% | | | | | | | | |
| Aqueduct and Sewer Auth., Rev. Ref. Bonds, Series 2012-A, 5.25% 2042 | | | 24,275 | | | | 16,250 | |
| Highways and Transportation Auth., Transportation Rev. Ref. Bonds, Series 2007-N, Assured Guaranty insured, 5.25% 2036 | | | 11,085 | | | | 11,386 | |
| Other securities | | | | | | | 108,018 | |
| | | | | | | | 135,654 | |
| | | | | | | | | |
| Texas 6.84% | | | | | | | | |
| Brazos River Harbor Navigation Dist. of Brazoria County, Environmental Facs. Rev. Ref. Bonds (Dow Chemical Co. Project), Series 2002-A-4, AMT, 5.95% 2033 | | | 13,545 | | | | 14,877 | |
| City of Houston, Airport System Special Facs. Rev. Bonds (Continental Airlines, Inc. Terminal Improvement Projects), Series 2011, AMT, 6.50% 2030 | | | 9,300 | | | | 10,867 | |
| City of Houston, Airport System Special Facs. Rev. Bonds (Continental Airlines, Inc. Terminal Improvement Projects), Series 2011, AMT, 6.625% 2038 | | | 3,000 | | | | 3,483 | |
| City of Houston, Airport System Special Facs. Rev. Ref. Bonds (United Airlines, Inc. Airport Improvement Projects), Series 2015-B-1, AMT, 5.00% 2030 | | | 3,000 | | | | 3,252 | |
| City of Houston, Airport System Special Facs. Rev. Ref. Bonds (United Airlines, Inc. Airport Improvement Projects), Series 2015-C, AMT, 5.00% 2020 | | | 11,000 | | | | 12,066 | |
| City of Houston, Airport System Special Facs. Rev. Ref. Bonds (United Airlines, Inc. Terminal E Project), Series 2014, AMT, 4.75% 2024 | | | 5,500 | | | | 6,177 | |
| City of Houston, Airport System Special Facs. Rev. Ref. Bonds (United Airlines, Inc. Terminal E Project), Series 2014, AMT, 5.00% 2029 | | | 5,850 | | | | 6,387 | |
| Other securities | | | | | | | 227,675 | |
| | | | | | | | 284,784 | |
| | | | | | | | | |
| West Virginia 0.13% | | | | | | | | |
| County Commission of Harrison County, Solid Waste Disposal Rev. Ref. Bonds (Allegheny Energy Supply Co., LLC Harrison Station Project), Series 2007-D, AMT, 5.50% 2037 | | | 5,000 | | | | 5,236 | |
| | | | | | | | | |
| Other states & U.S. territories 21.33% | | | | | | | | |
| Other securities | | | | | | | 887,958 | |
| | | | | | | | | |
| Total bonds, notes & other debt instruments (cost: $3,643,368,000) | | | | | | | 3,874,001 | |
| | | | | | | | | |
| Short-term securities 6.08% | | | | | | | | |
| State of California, County of Ventura, Tax and Rev. Anticipation Notes 2.00% 7/1/2016 | | | 15,000 | | | | 15,108 | |
| State of Colorado, General Fund Tax and Rev. Anticipation Notes, Series 2015-A, 1.75% 6/28/2016 | | | 20,000 | | | | 20,127 | |
| District of Columbia, Tax and Rev. Anticipation Notes, Series 2015, 1.50% 9/30/2016 | | | 15,000 | | | | 15,113 | |
| State of Idaho, Tax Anticipation Notes, Series 2015, 2.00% 6/30/2016 | | | 13,000 | | | | 13,096 | |
| State of Massachusetts, G. O. Rev. Anticipation Notes, Series 2015-B, 2.00% 5/25/2016 | | | 13,000 | | | | 13,074 | |
| State of Massachusetts, G. O. Rev. Anticipation Notes, Series 2015-C, 2.00% 6/22/2016 | | | 7,000 | | | | 7,048 | |
| State of Massachusetts, School Building Auth., Dedicated Sales Tax Rev. Ref. Bonds, Series 2015-C, 5.00% 8/15/2016 | | | 15,000 | | | | 15,391 | |
| 32 | American Funds Tax-Exempt Funds |
American High-Income Municipal Bond Fund
| | | Principal amount
(000) | | | Value
(000) | |
| State of New York, Metropolitan Transportation Auth., Transportation Rev. Bond Anticipation Notes, Series 2015-B1, 1.00% 8/1/2016 | | $ | 5,000 | | | $ | 5,017 | |
| State of New York, Metropolitan Transportation Auth., Transportation Rev. Bond Anticipation Notes, Series 2015-B1-G, 1.00% 8/1/2016 | | | 20,000 | | | | 20,061 | |
| State of Ohio, Ohio Water Dev. Auth., Pollution Control Rev. Ref. Bonds (FirstEnergy Nuclear Generation Corp. Project), Series 2008-B, 0.01% 20181 | | | 200 | | | | 200 | |
| State of Oregon, Full Faith and Credit Tax Anticipation Notes, Series 2015-A, 2.00% 9/15/2016 | | | 23,000 | | | | 23,236 | |
| Other securities | | | | | | | 105,479 | |
| Total short-term securities (cost: $252,945,000) | | | | | | | 252,950 | |
| Total investment securities 99.17% (cost: $3,896,313,000) | | | | | | | 4,126,951 | |
| Other assets less liabilities 0.83% | | | | | | | 34,378 | |
| Net assets 100.00% | | | | | | $ | 4,161,329 | |
This summary investment portfolio is designed to streamline the report and help investors better focus on the fund’s principal holdings. See the inside back cover for details on how to obtain a complete schedule of portfolio holdings.
“Other securities” includes all issues that are not disclosed separately in the summary investment portfolio. Some of these securities (with an aggregate value of $285,155,000, which represented 6.85% of the net assets of the fund) were acquired in transactions exempt from registration under Rule 144A of the Securities Act of 1933 and may be resold in the U.S. in transactions exempt from registration, normally to qualified institutional buyers.
| 1 | Coupon rate may change periodically. For short-term securities, the date of the next scheduled coupon rate change is considered to be the maturity date. |
| Key to abbreviations |
| Agcy. = Agency |
| AMT = Alternative Minimum Tax |
| Auth. = Authority |
| Certs. of Part. = Certificates of Participation |
| Dept. = Department |
| Dev. = Development |
| Dist. = District |
| Econ. = Economic |
| Fac. = Facility |
| Facs. = Facilities |
| Fin. = Finance |
| Fncg. = Financing |
| G.O. = General Obligation |
| LOC = Letter of Credit |
| Preref. = Prerefunded |
| Redev. = Redevelopment |
| Ref. = Refunding |
| Rev. = Revenue |
| TECP = Tax-Exempt Commercial Paper |
See Notes to Financial Statements
| American Funds Tax-Exempt Funds | 33 |
| The Tax-Exempt Fund of California | unaudited |
| Summary investment portfolio January 31, 2016 | |
| Portfolio quality summary* | Percent of net assets |
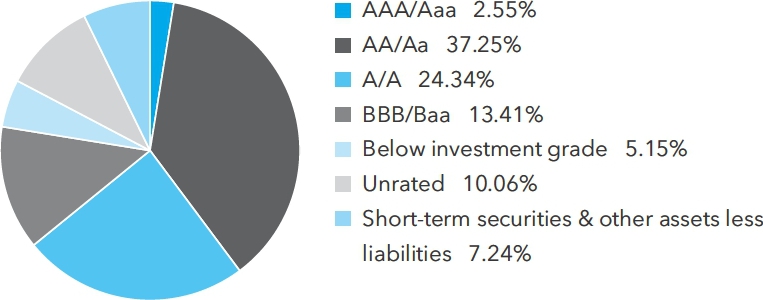
| * | Bond ratings, which typically range from AAA/Aaa (highest) to D (lowest), are assigned by credit rating agencies such as Standard & Poor’s, Moody’s and/or Fitch as an indication of an issuer’s creditworthiness. In assigning a credit rating to a security, the fund looks specifically to the ratings assigned to the issuer of the security by Standard & Poor’s, Moody’s and/or Fitch. If agency ratings differ, the security will be considered to have received the highest of those ratings, consistent with the fund’s investment policies. Securities in the “unrated” category (above) have not been rated by a rating agency; however, the investment adviser performs its own credit analysis and assigns comparable ratings that are used for compliance with the fund’s investment policies. |
| Bonds, notes & other debt instruments 92.76% | | Principal amount
(000) | | | Value
(000) | |
| California 90.02% | | | | | | | | |
| State issuers 38.00% | | | | | | | | |
| Educational Facs. Auth., Rev. Ref. Bonds (California Lutheran University), Series 2008, 5.75% 2038 | | $ | 6,000 | | | $ | 6,629 | |
| Educational Facs. Auth., Rev. Ref. Bonds (Chapman University), Series 2011, 5.00% 2031 | | | 8,615 | | | | 9,738 | |
| G.O. Bonds, Series 2012-A, 0.46% 2033 (put 2018)1 | | | 6,500 | | | | 6,473 | |
| G.O. Bonds, Series 2013-E, 1.131% 20291 | | | 1,500 | | | | 1,502 | |
| Various Purpose G.O. Bonds, 5.00% 2016 | | | 890 | | | | 918 | |
| Various Purpose G.O. Bonds, 5.00% 2016 | | | 700 | | | | 722 | |
| Various Purpose G.O. Bonds, 3.00% 2016 | | | 39,000 | | | | 39,541 | |
| Various Purpose G.O. Bonds, 5.00% 2016 | | | 3,715 | | | | 3,731 | |
| Various Purpose G.O. Bonds, 5.00% 2033 | | | 4,000 | | | | 4,810 | |
| Various Purpose G.O. Bonds, 5.25% 2028 | | | 5,000 | | | | 6,010 | |
| Various Purpose G.O. Bonds, 5.25% 2028 | | | 2,000 | | | | 2,398 | |
| Various Purpose G.O. Bonds, 5.25% 2032 | | | 5,000 | | | | 6,209 | |
| Various Purpose G.O. Bonds, 6.00% 2038 | | | 7,000 | | | | 8,085 | |
| Various Purpose G.O. Bonds, 6.00% 2039 | | | 2,000 | | | | 2,363 | |
| Various Purpose G.O. Bonds, 6.50% 2033 | | | 5,000 | | | | 5,874 | |
| Various Purpose G.O. Ref. Bonds, 5.00% 2016 | | | 5,000 | | | | 5,158 | |
| Golden State Tobacco Securitization Corp., Enhanced Tobacco Settlement Asset-backed Bonds, Series 2007-A-1, 5.125% 2047 | | | 5,000 | | | | 4,471 | |
| Golden State Tobacco Securitization Corp., Enhanced Tobacco Settlement Asset-backed Bonds, Series 2015-A, 5.00% 2032 | | | 3,250 | | | | 3,875 | |
| Golden State Tobacco Securitization Corp., Enhanced Tobacco Settlement Asset-backed Bonds, Series 2015-A, 5.00% 2033 | | | 4,000 | | | | 4,755 | |
| Golden State Tobacco Securitization Corp., Enhanced Tobacco Settlement Asset-backed Bonds, Series 2015-A, 5.00% 2045 | | | 6,000 | | | | 6,855 | |
| Golden State Tobacco Securitization Corp., Tobacco Settlement Asset-backed Rev. Ref. Bonds, Series 2007-A-1, 5.75% 2047 | | | 26,225 | | | | 25,223 | |
| Health Facs. Fncg. Auth., Rev. Ref. Bonds (Stanford Hospital and Clinics), Series 2010-B, 5.25% 2031 | | | 8,000 | | | | 9,407 | |
| Imperial Irrigation Dist., Electric System Rev. Ref. Bonds, Series 2008-A, 5.00% 2033 | | | 9,390 | | | | 10,462 | |
| Municipal Fin. Auth., Rev. Ref. Bonds (Azusa Pacific University Project), Series 2011-B, 8.00% 20412 | | | 8,550 | | | | 11,457 | |
| Municipal Fin. Auth., Rev. Ref. Bonds (Inland Regional Center Project), 5.00% 2032 | | | 3,000 | | | | 3,457 | |
| Municipal Fin. Auth., Rev. Ref. Bonds (Inland Regional Center Project), 5.00% 2037 | | | 2,000 | | | | 2,263 | |
| Municipal Fin. Auth., Rev. Ref. Bonds (Inland Regional Center Project), 5.00% 2045 | | | 4,000 | | | | 4,447 | |
| Northern California Power Agcy., Lodi Energy Center Rev. Bonds, Issue One, Series 2010-A, 5.00% 2025 | | | 6,000 | | | | 6,804 | |
| Pollution Control Fncg. Auth., Water Furnishing Rev. Bonds (Poseidon Resources (Channelside) LP Desalination Project), Series 2012 Plant Bonds, AMT, 5.00% 20452 | | | 7,000 | | | | 7,667 | |
| Public Works Board, Lease Rev. Bonds (Regents of the University of California, Various University of California Projects), Series 2009-E, 5.00% 2024 (preref. 2019) | | | 2,500 | | | | 2,828 | |
| 34 | American Funds Tax-Exempt Funds |
The Tax-Exempt Fund of California
| | | Principal amount | | | Value | |
| | | | (000) | | | | (000) | |
| Public Works Board, Lease Rev. Bonds (Regents of the University of California, Various University of California Projects), Series 2009-E, 5.00% 2034 (preref. 2019) | | $ | 1,500 | | | $ | 1,697 | |
| Statewide Communities Dev. Auth., Rev. Bonds (Buck Institute for Research on Aging), Series 2014, Assured Guaranty Municipal insured, 5.00% 2049 | | | 5,250 | | | | 5,961 | |
| Statewide Communities Dev. Auth., Rev. Bonds (Front Porch Communities and Services Project), Series 2007-A, 5.125% 20372 | | | 9,500 | | | | 9,748 | |
| Statewide Communities Dev. Auth., Rev. Bonds (Inland Regional Center Project), Series 2007, 5.00% 2017 | | | 1,425 | | | | 1,509 | |
| Statewide Communities Dev. Auth., Rev. Bonds (Inland Regional Center Project), Series 2007, 5.25% 2027 | | | 2,000 | | | | 2,169 | |
| Statewide Communities Dev. Auth., Rev. Bonds (Inland Regional Center Project), Series 2007, 5.375% 2037 | | | 6,500 | | | | 7,068 | |
| Statewide Communities Dev. Auth., Rev. Bonds (Kaiser Permanente), Series 2012-A, 5.00% 2042 | | | 6,500 | | | | 7,372 | |
| Statewide Communities Dev. Auth., Rev. Ref. Bonds (American Baptist Homes of the West), Series 2010, 6.25% 2039 | | | 5,300 | | | | 5,890 | |
| Statewide Communities Dev. Auth., Rev. Ref. Bonds (Catholic Healthcare West), Series 2008-D, 5.50% 2031 | | | 6,090 | | | | 6,476 | |
| Statewide Communities Dev. Auth., Rev. Ref. Bonds (Enloe Medical Center), 5.00% 2035 | | | 5,050 | | | | 6,051 | |
| Statewide Communities Dev. Auth., Senior Living Rev. Ref. Bonds (Southern California Presbyterian Homes), Series 2006-A, 4.875% 20362 | | | 6,500 | | | | 6,727 | |
| Statewide Communities Dev. Auth., Student Housing Rev. Bonds (CHF-Irvine, LLC - UCI East Campus Apartments, Phase II), Series 2008, 5.50% 2026 | | | 3,500 | | | | 3,791 | |
| Statewide Communities Dev. Auth., Student Housing Rev. Bonds (CHF-Irvine, LLC- UCI East Campus Apartments, Phase II), Series 2008, 6.00% 2040 | | | 4,750 | | | | 5,158 | |
| Statewide Communities Dev. Auth., Student Housing Rev. Ref. Bonds (CHF-Irvine, LLC - UCI East Campus Apartments, Phase I), Series 2011, 5.375% 2038 | | | 1,260 | | | | 1,435 | |
| Statewide Communities Dev. Auth., Student Housing Rev. Ref. Bonds (CHF-Irvine, LLC - UCI East Campus Apartments, Phase II), Series 2006, 5.00% 2017 | | | 2,565 | | | | 2,598 | |
| Statewide Communities Dev. Auth., Student Housing Rev. Ref. Bonds (CHF-Irvine, LLC - UCI East Campus Apartments, Phase II), Series 2006, 5.00% 2020 | | | 1,000 | | | | 1,012 | |
| Statewide Communities Dev. Auth., Student Housing Rev. Ref. Bonds (CHF-Irvine, LLC - UCI East Campus Apartments, Phase II), Series 2006, 5.00% 2026 | | | 2,980 | | | | 3,017 | |
| Statewide Communities Dev. Auth., Student Housing Rev. Ref. Bonds (CHF-Irvine, LLC - UCI East Campus Apartments, Phase II), Series 2006, 5.00% 2038 | | | 2,000 | | | | 2,025 | |
| Regents of the University of California, Limited Project Rev. Bonds, Series 2007-D, FGIC-National insured, 5.00% 2037 | | | 5,000 | | | | 5,121 | |
| Regents of the University of California, Limited Project Rev. Bonds, Series 2015-A-O, 3.00% 2016 | | | 3,200 | | | | 3,227 | |
| Regents of the University of California, Medical Center Pooled Rev. Ref. Bonds, Series 2007-C-2, National insured, 0.912% 20371 | | | 5,000 | | | | 4,613 | |
| Regents of the University of California, Medical Center Pooled Rev. Ref. Bonds, Series 2007-C-2, National insured, 0.982% 20431 | | | 8,000 | | | | 7,043 | |
| Other securities | | | | | | | 372,142 | |
| | | | | | | | 685,982 | |
| | | | | | | | | |
| City & county issuers 52.02% | | | | | | | | |
| Alameda Corridor Transportation Auth., Rev. Ref. Bonds, Series 2013-A, 5.00% 2026 | | | 6,375 | | | | 7,733 | |
| Assn. of Bay Area Governments, Fin. Auth. for Nonprofit Corps., Insured Rev. Ref. Bonds (Casa de las Campanas, Inc.), Series 2010, 6.00% 2037 | | | 6,000 | | | | 7,073 | |
| Assn. of Bay Area Governments, Fin. Auth. for Nonprofit Corps., Insured Senior Living Rev. Ref. Bonds (Odd Fellows Home of California), Series 2012-A, 5.00% 2032 | | | 5,000 | | | | 5,862 | |
| Bay Area Toll Auth., San Francisco Bay Area Toll Bridge Rev. Ref. Bonds, Series 2006-C-1, 0.91% 2045 (put 2023)1 | | | 2,000 | | | | 1,989 | |
| Bay Area Toll Auth., San Francisco Bay Area Toll Bridge Rev. Ref. Bonds, Series 2008-F-1, 5.00% 2039 (preref. 2018) | | | 2,000 | | | | 2,186 | |
| Bay Area Toll Auth., San Francisco Bay Area Toll Bridge Rev. Ref. Bonds, Series 2008-F-1, 5.125% 2047 (preref. 2018) | | | 6,000 | | | | 6,575 | |
| Bay Area Toll Auth., San Francisco Bay Area Toll Bridge Rev. Ref. Bonds, Series 2009-F-1, 5.625% 2044 (preref. 2019) | | | 1,670 | | | | 1,921 | |
| Bay Area Toll Auth., San Francisco Bay Area Toll Bridge Rev. Ref. Bonds, Series 2009-F-1, 5.125% 2039 (preref. 2019) | | | 2,000 | | | | 2,269 | |
| American Funds Tax-Exempt Funds | 35 |
The Tax-Exempt Fund of California
| Bonds, notes & other debt instruments (continued) | | Principal amount
(000) | | | Value
(000) | |
| California (continued) | | | | | | | | |
| City & county issuers (continued) | | | | | | | | |
| Bay Area Toll Auth., San Francisco Bay Area Toll Bridge Rev. Ref. Bonds, Series 2014-B, 1.50% 2047 | | $ | 3,950 | | | $ | 3,987 | |
| Bay Area Toll Auth., San Francisco Bay Area Toll Bridge Rev. Ref. Bonds, Series 2014-F1, 5.00% 2054 | | | 5,000 | | | | 5,716 | |
| Bay Area Toll Auth., San Francisco Bay Area Toll Bridge Rev. Ref. Bonds, Series 2014-G, 0.61% 2034 (put 2020)1 | | | 2,750 | | | | 2,730 | |
| Bay Area Toll Auth., San Francisco Bay Area Toll Bridge Rev. Ref. Bonds, Series 2014-H, 0.71% 2034 (put 2021)1 | | | 4,000 | | | | 3,971 | |
| Foothill/Eastern Transportation Corridor Agcy., Toll Road Rev. Ref. Bonds, Series 2013-A, 6.00% 2053 | | | 7,500 | | | | 8,844 | |
| Foothill/Eastern Transportation Corridor Agcy., Toll Road Rev. Ref. Bonds, Series 2014-A, 6.00% 2049 | | | 5,800 | | | | 6,884 | |
| City of Los Angeles Harbor Dept., Rev. Ref. Bonds, Series 2006-A, AMT, National insured, 5.00% 2020 | | | 6,000 | | | | 6,262 | |
| Oakland Unified School Dist., (County of Alameda), G.O. Bonds, Series 2015-A, 5.00% 2040 | | | 5,550 | | | | 6,271 | |
| Roseville Natural Gas Fncg. Auth., Gas Rev. Bonds, Series 2007, 5.00% 2022 | | | 4,920 | | | | 5,708 | |
| Sacramento County Sanitation Districts Fncg. Auth., Rev. Ref. Bonds (Sacramento Regional County Sanitation Dist.), Series 2007-B, FGIC-National insured, 0.808% 20351 | | | 13,500 | | | | 12,459 | |
| Sacramento Municipal Utility Dist. Fncg. Auth., Cosumnes Project Rev. Bonds, Series 2006, National insured, 5.125% 2029 | | | 10,000 | | | | 10,207 | |
| City of San Buenaventura, Rev. Bonds (Community Memorial Health System), Series 2011, 7.50% 2041 | | | 10,825 | | | | 13,328 | |
| Public Facs. Fncg. Auth. of the City of San Diego, Water Rev. Ref. Bonds, Series 2012-A, 5.00% 2028 | | | 5,000 | | | | 6,052 | |
| San Diego Unified School Dist., G.O. Bonds, Series 2015-R-4, 5.00% 2027 | | | 5,000 | | | | 6,302 | |
| Airport Commission, City and County of San Francisco, San Francisco International Airport, Second Series Rev. Bonds, Series 2009-E, 6.00% 2039 | | | 3,000 | | | | 3,473 | |
| Airport Commission, City and County of San Francisco, San Francisco International Airport, Second Series Rev. Ref. Bonds, Series 2016-A, 5.00% 2029 | | | 1,225 | | | | 1,531 | |
| Airport Commission, City and County of San Francisco, San Francisco International Airport, Second Series Rev. Ref. Bonds, Issue 34-E, AMT, 5.75% 2019 | | | 3,500 | | | | 3,892 | |
| Airport Commission, City and County of San Francisco, San Francisco International Airport, Second Series Rev. Ref. Bonds, Series 2009-A, 4.90% 2029 | | | 5,000 | | | | 5,675 | |
| Airport Commission, City and County of San Francisco, San Francisco International Airport, Second Series Rev. Ref. Bonds, Series 2010-F, 5.00% 2040 | | | 3,000 | | | | 3,372 | |
| Airport Commission, City and County of San Francisco, San Francisco International Airport, Second Series Rev. Ref. Bonds, Series 2011-F, AMT, 5.00% 2028 | | | 2,630 | | | | 3,048 | |
| Airport Commission, City and County of San Francisco, San Francisco International Airport, Second Series Rev. Ref. Bonds, Series 2012-A, AMT, 5.00% 2028 | | | 1,000 | | | | 1,174 | |
| Airport Commission, City and County of San Francisco, San Francisco International Airport, Second Series Rev. Ref. Bonds, Series 2012-A, AMT, 5.00% 2030 | | | 1,000 | | | | 1,149 | |
| San Francisco Municipal Transportation Agcy., Rev. Bonds, Series 2012-B, 5.00% 2042 | | | 5,000 | | | | 5,811 | |
| City of San Jose, Airport Rev. Ref. Bonds, Series 2011-A-1, AMT, 5.50% 2030 | | | 8,000 | | | | 9,350 | |
| Tobacco Securitization Auth. of Southern California, Tobacco Settlement Asset-backed Rev. Ref. Bonds (San Diego County Tobacco Asset Securitization Corp.), Series 2006-A, 5.125% 2046 | | | 7,800 | | | | 7,190 | |
| City of Whittier, Health Fac. Rev. Bonds (PIH Health), Series 2014, 5.00% 2044 | | | 9,000 | | | | 10,153 | |
| Other securities | | | | | | | 749,122 | |
| | | | | | | | 939,269 | |
| | | | | | | | | |
| Guam 0.49% | | | | | | | | |
| Other securities | | | | | | | 8,833 | |
| 36 | American Funds Tax-Exempt Funds |
The Tax-Exempt Fund of California
| | | Principal amount | | | Value | |
| | | (000) | | | (000) | |
| Puerto Rico 1.40% | | | | | | | | |
| Highways and Transportation Auth., Transportation Rev. Ref. Bonds, Series 2007-N, Assured Guaranty insured, 5.25% 2036 | | $ | 6,590 | | | $ | 6,769 | |
| Industrial, Tourist, Educational, Medical and Environmental Control Facs. Fncg. Auth., Hospital Rev. and Rev. Ref. Bonds (Hospital Auxilio Mutuo Obligated Group Project), Series 2011-A, 6.00% 2033 | | | 7,150 | | | | 7,505 | |
| Other securities | | | | | | | 10,929 | |
| | | | | | | | 25,203 | |
| | | | | | | | | |
| Virgin Islands 0.85% | | | | | | | | |
| Other securities | | | | | | | 15,402 | |
| Total bonds, notes & other debt instruments (cost: $1,552,957,000) | | | | | | | 1,674,689 | |
| | | | | | | | | |
| Short-term securities 5.43% | | | | | | | | |
| General Obligation Bonds, 2.00%, 8/1/2016 | | | 13,000 | | | | 13,115 | |
| G.O. Bonds, Series 2004-A-4, 0.01% 20341 | | | 9,100 | | | | 9,100 | |
| G.O. Bonds, Series 2004-B-3, 0.01% 20341 | | | 200 | | | | 200 | |
| Various Purpose G.O. Bonds, 0.04% 4/7/2016 | | | 4,000 | | | | 4,000 | |
| Various Purpose G.O. Bonds, 0.05% 3/9/2016 | | | 3,000 | | | | 3,000 | |
| Various Purpose G.O. Bonds, Series 2003-B-1, 0.01% 20331 | | | 12,300 | | | | 12,300 | |
| Health Facs. Fncg. Auth., Rev. Bonds (St. Joseph Health System), Series 2011-B, 0.01% 20411 | | | 6,000 | | | | 6,000 | |
| City of Irvine, Assessment Dist. No. 03-19, Limited Obligation Improvement Bonds, Series 2004-A, U.S. Bank LOC, 0.01% 20291 | | | 3,600 | | | | 3,600 | |
| City of Irvine, California, Assessment Dist. No. 03-19, Limited Obligation Improvement Bonds, Series B, U.S. Bank LOC, 0.01% 20291 | | | 2,500 | | | | 2,500 | |
| County of Los Angeles, Tax and Rev. Anticipation Notes, 5.00% 6/30/2016 | | | 11,485 | | | | 11,710 | |
| County of Ventura, Tax and Rev. Anticipation Notes 2.00% 7/1/2016 | | | 15,000 | | | | 15,108 | |
| Other securities | | | | | | | 17,350 | |
| | | | | | | | | |
| Total short-term securities (cost: $97,978,000) | | | | | | | 97,983 | |
| Total investment securities 98.19% (cost: $1,650,935,000) | | | | | | | 1,772,672 | |
| Other assets less liabilities 1.81% | | | | | | | 32,721 | |
| Net assets 100.00% | | | | | | $ | 1,805,393 | |
| American Funds Tax-Exempt Funds | 37 |
The Tax-Exempt Fund of California
This summary investment portfolio is designed to streamline the report and help investors better focus on the fund’s principal holdings. See the inside back cover for details on how to obtain a complete schedule of portfolio holdings.
“Other securities” includes all issues that are not disclosed separately in the summary investment portfolio.
| 1 | Coupon rate may change periodically. For short-term securities, the date of the next scheduled coupon rate change is considered to be the maturity date. |
| 2 | Acquired in a transaction exempt from registration under Rule 144A of the Securities Act of 1933. May be resold in the U.S. in transactions exempt from registration, normally to qualified institutional buyers. The total value of all such securities, including those in “Other securities,” was $57,956,000, which represented 3.21% of the net assets of the fund. |
Key to abbreviations
Agcy. = Agency
AMT = Alternative Minimum Tax
Auth. = Authority
Certs. of Part. = Certificates of Participation
Dept. = Department
Dev. = Development
Dist. = District
Econ. = Economic
Fac. = Facility
Facs. = Facilities
Fin. = Finance
Fncg. = Financing
G.O. = General Obligation
LOC = Letter of Credit
Preref. = Prerefunded
Redev. = Redevelopment
Ref. = Refunding
Rev. = Revenue
TECP = Tax-Exempt Commercial Paper
See Notes to Financial Statements
| 38 | American Funds Tax-Exempt Funds |
| American Funds Tax-Exempt Fund of New York | unaudited |
| Investment portfolio January 31, 2016 | |
| Portfolio quality summary* | Percent of net assets |
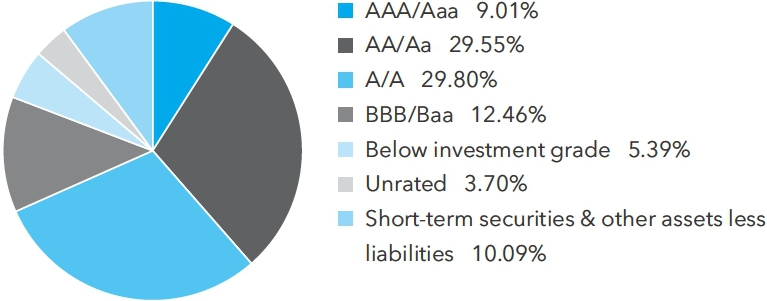
| * | Bond ratings, which typically range from AAA/Aaa (highest) to D (lowest), are assigned by credit rating agencies such as Standard & Poor’s, Moody’s and/or Fitch as an indication of an issuer’s creditworthiness. In assigning a credit rating to a security, the fund looks specifically to the ratings assigned to the issuer of the security by Standard & Poor’s, Moody’s and/or Fitch. If agency ratings differ, the security will be considered to have received the highest of those ratings, consistent with the fund’s investment policies. Securities in the “unrated” category (above) have not been rated by a rating agency; however, the investment adviser performs its own credit analysis and assigns comparable ratings that are used for compliance with the fund’s investment policies. |
| Bonds, notes & other debt instruments 89.91% | | Principal amount
(000) | | | Value
(000) | |
| New York 84.49% | | | | | | | | |
| State issuers 45.73% | | | | | | | | |
| Build NYC Resource Corp., Solid Waste Disposal Rev. Bonds (Pratt Paper (NY), Inc. Project), Series 2014, AMT, 4.50% 20251 | | $ | 450 | | | $ | 491 | |
| Convention Center Dev. Corp., Rev. Ref. Bonds (Hotel Unit Fee Secured), 5.00% 2035 | | | 840 | | | | 1,000 | |
| Convention Center Dev. Corp., Rev. Ref. Bonds (Hotel Unit Fee Secured), 5.00% 2030 | | | 300 | | | | 368 | |
| Dobbs Ferry Local Dev. Corp., Rev. Bonds, Series 2014, 5.00% 2039 | | | 1,625 | | | | 1,836 | |
| Dobbs Ferry Local Dev. Corp., Rev. Bonds, Series 2014, 5.00% 2044 | | | 500 | | | | 560 | |
| Dormitory Auth. of the State of New York, School Districts Rev. Bond Fncg. Program Rev. Bonds, Series 2013-E, Assured Guaranty Municipal insured, 5.00% 2022 | | | 1,000 | | | | 1,225 | |
| Dormitory Auth., Consolidated Service Contract Rev. Ref. Bonds, Series 2010, 5.00% 2020 | | | 500 | | | | 583 | |
| Dormitory Auth., Culinary Institute of America Rev. Bonds, Series 2013, 5.50% 2033 | | | 500 | | | | 578 | |
| Dormitory Auth., Fordham University Rev. Bonds, Series 2011-A, 5.50% 2036 | | | 1,000 | | | | 1,198 | |
| Dormitory Auth., Icahn School of Medicine at Mount Sinai, Rev. Bonds, Series 2015-A, 5.00% 2031 | | | 500 | | | | 588 | |
| Dormitory Auth., Icahn School of Medicine at Mount Sinai, Rev. Bonds, Series 2015-A, 5.00% 2035 | | | 1,000 | | | | 1,162 | |
| Dormitory Auth., Icahn School of Medicine at Mount Sinai, Rev. Bonds, Series 2015-A, 5.00% 2040 | | | 250 | | | | 287 | |
| Dormitory Auth., Lease Rev. Bonds (State University Dormitory Facs. Issue), Series 2010-A, 5.00% 2035 | | | 1,000 | | | | 1,140 | |
| Dormitory Auth., Miriam Osborn Memorial Home Association Rev. Ref. Bonds, Series 2012, 5.00% 2042 | | | 970 | | | | 1,027 | |
| Dormitory Auth., Mount Sinai School of Medicine of New York University, Rev. Ref. Bonds, Series 2010-A, 5.00% 2021 | | | 1,000 | | | | 1,155 | |
| Dormitory Auth., New School Rev. Bonds, Series 2010, 5.25% 2021 | | | 500 | | | | 584 | |
| Dormitory Auth., New School Rev. Bonds, Series 2010, 5.50% 2040 | | | 500 | | | | 572 | |
| Dormitory Auth., North Shore-Long Island Jewish Obligated Group, Rev. Ref. Bonds, Series 2011-A, 5.00% 2032 | | | 1,500 | | | | 1,677 | |
| Dormitory Auth., NYU Hospitals Center Rev. Bonds, 5.00% 2022 | | | 200 | | | | 241 | |
| Dormitory Auth., NYU Hospitals Center Rev. Bonds, 5.00% 2034 | | | 1,000 | | | | 1,173 | |
| Dormitory Auth., NYU Hospitals Center Rev. Bonds, Series 2011-A, 6.00% 2040 | | | 1,000 | | | | 1,152 | |
| Dormitory Auth., Orange Regional Medical Center Obligated Group Rev. Bonds, Series 2008, 6.25% 2037 | | | 1,000 | | | | 1,091 | |
| Dormitory Auth., Orange Regional Medical Center Obligated Group Rev. Bonds, Series 2015, 5.00% 20321 | | | 600 | | | | 644 | |
| Dormitory Auth., School Districts Rev. Bond Fncg. Program Rev. Ref. Bonds, Series 2011-A, 5.00% 2024 | | | 500 | | | | 592 | |
| Dormitory Auth., Skidmore College Rev. Bonds, Series 2011-A, 5.50% 2041 | | | 1,420 | | | | 1,671 | |
| Dormitory Auth., State Personal Income Tax Rev. Bonds (Education), Series 2014-E, 5.00% 2032 | | | 750 | | | | 905 | |
| Dormitory Auth., State Sales Tax Rev. Bonds, Series 2013-A, 3.00% 2016 | | | 4,250 | | | | 4,266 | |
| American Funds Tax-Exempt Funds | 39 |
American Funds Tax-Exempt Fund of New York
| Bonds, notes & other debt instruments (continued) | | Principal amount
(000) | | | Value
(000) | |
| New York (continued) | | | | | | | | |
| State issuers (continued) | | | | | | | | |
| Dormitory Auth., The New School Rev. Bonds, Series 2015-A, 5.00% 2032 | | $ | 1,000 | | | $ | 1,182 | |
| Dormitory Auth., Touro College and University System Obligated Group Rev. Bonds, Series 2014-A, 5.50% 2039 | | | 500 | | | | 552 | |
| Environmental Facs. Corp., Solid Waste Disposal Rev. Ref. Bonds (Waste Management, Inc. Project), AMT, 0.55% 2030 (put 2016)2 | | | 3,000 | | | | 3,000 | |
| Environmental Facs. Corp., Solid Waste Disposal Rev. Ref. Bonds (Waste Management, Inc. Project), Series 2013-A, 2.75% 2017 | | | 1,000 | | | | 1,023 | |
| Housing Dev. Corp., Multi-Family Housing Rev. Bonds (Sustainable Neighborhood), Series 2015-H, 2.95% 2045 (put 2026) | | | 750 | | | | 773 | |
| Hudson Yards Infrastructure Corp., Rev. Bonds, Fiscal 2012 Series A, 5.25% 2047 | | | 1,000 | | | | 1,144 | |
| Hudson Yards Infrastructure Corp., Rev. Bonds, Fiscal 2012 Series A, 5.75% 2047 | | | 1,000 | | | | 1,165 | |
| Liberty Dev. Corp., Liberty Rev. Ref. Bonds (3 World Trade Center Project), Series 2014, Class 2, 5.15% 20341 | | | 750 | | | | 797 | |
| Liberty Dev. Corp., Liberty Rev. Ref. Bonds (3 World Trade Center Project), Series 2014, Class 2, 5.375% 20401 | | | 350 | | | | 375 | |
| Liberty Dev. Corp., Liberty Rev. Ref. Bonds (3 World Trade Center Project), Series 2014, Class 3, 7.25% 20441 | | | 375 | | | | 456 | |
| Liberty Dev. Corp., Liberty Rev. Ref. Bonds (4 World Trade Center Project), Series 2011, 5.00% 2031 | | | 1,500 | | | | 1,740 | |
| Liberty Dev. Corp., Liberty Rev. Ref. Bonds (Bank of America Tower at One Bryant Park Project), Series 2010, 6.375% 2049 | | | 1,500 | | | | 1,697 | |
| Liberty Dev. Corp., Rev. Bonds (Goldman Sachs Headquarters Issue), Series 2005, 5.25% 2035 | | | 1,000 | | | | 1,237 | |
| Metropolitan Transportation Auth., Dedicated Tax Fund Bonds, Series 2004-C, AMBAC insured, 5.50% 2017 | | | 1,000 | | | | 1,087 | |
| Metropolitan Transportation Auth., Dedicated Tax Fund Rev. Ref. Bonds, Series 2002-B-3D, 1.01% 20202 | | | 2,000 | | | | 2,008 | |
| Metropolitan Transportation Auth., Dedicated Tax Fund Rev. Ref. Bonds, Series 2008-A-2A, 0.40% 2026 (put 2017)2 | | | 490 | | | | 488 | |
| Metropolitan Transportation Auth., Transportation Rev. Bonds, Series 2015-C-1, 5.25% 2030 | | | 280 | | | | 349 | |
| Metropolitan Transportation Auth., Transportation Rev. Bonds, Series 2012-A2, 0.28% 2041 (put 2016)2 | | | 905 | | | | 903 | |
| Metropolitan Transportation Auth., Transportation Rev. Bonds, Series 2012-E, 5.00% 2031 | | | 1,000 | | | | 1,195 | |
| Metropolitan Transportation Auth., Transportation Rev. Bonds, Series 2012-F, 5.00% 2016 | | | 1,000 | | | | 1,037 | |
| Metropolitan Transportation Auth., Transportation Rev. Bonds, Series 2014-B, 5.00% 2044 | | | 500 | | | | 568 | |
| Metropolitan Transportation Auth., Transportation Rev. Bonds, Series 2014-D-1, 5.00% 2039 | | | 250 | | | | 289 | |
| Metropolitan Transportation Auth., Transportation Rev. Bonds, Series 2015-A-2, 0.59% 2039 (put 2020)2 | | | 500 | | | | 494 | |
| Metropolitan Transportation Auth., Transportation Rev. Bonds, Series 2015-C-1, 5.00% 2035 | | | 1,750 | | | | 2,076 | |
| Metropolitan Transportation Auth., Transportation Rev. Ref. Bonds, Series 2002-G-1H, 1.136% 2026 (put 2016)2 | | | 715 | | | | 716 | |
| Mortgage Agcy., Homeowner Mortgage Rev. Bonds, Series 178, 3.50% 2043 | | | 440 | | | | 454 | |
| Mortgage Agcy., Homeowner Mortgage Rev. Bonds, Series 191, 3.50% 2034 | | | 705 | | | | 741 | |
| Mortgage Agcy., Homeowner Mortgage Rev. Bonds, Series 194, AMT, 3.50% 2035 | | | 750 | | | | 795 | |
| Mortgage Agcy., Homeowner Mortgage Rev. Bonds, Series 52, 3.50% 2030 | | | 1,100 | | | | 1,174 | |
| Mortgage Agcy., Mortgage Rev. Bonds, Series 46, 5.00% 2029 | | | 135 | | | | 142 | |
| Mortgage Agcy., Mortgage Rev. Ref. Bonds, Series 45, 4.50% 2029 | | | 335 | | | | 342 | |
| Mortgage Agcy., Mortgage Rev. Ref. Bonds, Series 48, 2.625% 2041 | | | 625 | | | | 640 | |
| Port Auth., Consolidated Bonds, Series 147, AMT, FGIC-National insured, 5.00% 2021 | | | 500 | | | | 525 | |
| Port Auth., Consolidated Bonds, Series 166, 5.00% 2031 | | | 1,000 | | | | 1,149 | |
| Port Auth., Consolidated Rev. Ref. Bonds, Series 167, AMT, 5.00% 2025 | | | 1,000 | | | | 1,167 | |
| Port Auth., Consolidated Rev. Ref. Bonds, Series 172, AMT, 5.00% 2034 | | | 500 | | | | 567 | |
| Port Auth., Consolidated Rev. Ref. Bonds, Series 186, AMT, 5.00% 2044 | | | 1,250 | | | | 1,413 | |
| Port Auth., Special Project Bonds (JFK International Air Terminal LLC Project), Series 8, 5.00% 2020 | | | 1,000 | | | | 1,141 | |
| Power Auth. of the State of New York, Rev. Ref. Bonds, Series 2011-A, 5.00% 2038 | | | 1,500 | | | | 1,760 | |
| Southold Local Dev. Corporation, Rev. Bonds (Peconic Landing at Southold, Inc. Project), Series 2015, 5.00% 2045 | | | 1,500 | | | | 1,630 | |
| 40 | American Funds Tax-Exempt Funds |
American Funds Tax-Exempt Fund of New York
| | | Principal amount | | | Value | |
| | | (000) | | | (000) | |
| State Energy Research and Dev. Auth., Pollution Control Rev. Ref. Bonds (New York State Electric & Gas Corp. Project), Series 2005-B, 2.375% 2026 (put 2020) | | $ | 300 | | | $ | 306 | |
| Thruway Auth., General Rev. Bonds, Series 2014-J, 5.00% 2027 | | | 1,000 | | | | 1,222 | |
| Thruway Auth., General Rev. Bonds, Series 2014-K, 5.00% 2028 | | | 500 | | | | 618 | |
| Thruway Auth., General Rev. Junior Indebtedness Obligations, Series 2013-A, 5.00% 2019 | | | 250 | | | | 282 | |
| Thruway Auth., Local Highway and Bridge Service Contract Rev. Ref. Bonds, Series 2009, 5.00% 2020 | | | 1,000 | | | | 1,157 | |
| Tobacco Settlement Fncg. Corp., Asset-Backed Rev. Bonds, Series 2013-B, 5.00% 2020 | | | 400 | | | | 406 | |
| Tobacco Settlement Fncg. Corp., Asset-Backed Rev. Bonds, Series 2013-B, 5.00% 2021 | | | 200 | | | | 203 | |
| Tobacco Settlement Fncg. Corp., Rev. Ref. Bonds (State Contingency Contract Secured), Series 2011-B, 5.00% 2018 | | | 1,000 | | | | 1,096 | |
| Transportation Dev. Corp., Special Fac. Rev. Ref. Bonds (Terminal One Group Association, L.P. Project), 5.00% 2022 | | | 1,000 | | | | 1,184 | |
| Transportation Dev. Corp., Special Fac. Rev. Ref. Bonds (Terminal One Group Association, L.P. Project), 5.00% 2023 | | | 500 | | | | 599 | |
| Triborough Bridge and Tunnel Auth. (MTA Bridges and Tunnels), General Rev. Bonds, Series 2010-A-1, 5.00% 2019 | | | 1,000 | | | | 1,152 | |
| Triborough Bridge and Tunnel Auth. (MTA Bridges and Tunnels), General Rev. Ref. Bonds, Series 2015-B-4A, 0.586% 2028 (put 2016)2 | | | 1,040 | | | | 1,039 | |
| Triborough Bridge and Tunnel Auth. (MTA Bridges and Tunnels), General Rev. Ref. Bonds, Series 2000-ABCD-5, Assured Guaranty Municipal insured, 0.45% 20192 | | | 500 | | | | 498 | |
| Urban Dev. Corp., Rev. Bonds (General Purpose), Series 2014-A, 5.00% 2027 | | | 1,500 | | | | 1,848 | |
| Urban Dev. Corp., Rev. Bonds (General Purpose), Series 2014-A, 5.00% 2034 | | | 500 | | | | 592 | |
| Urban Dev. Corp., Service Contract Rev. Ref. Bonds, Series 2010-A-2, 5.00% 2020 | | | 1,000 | | | | 1,153 | |
| Urban Dev. Corp., State Personal Income Tax Rev. Bonds (State Facs. and Equipment), Series 2009-B-1, 5.25% 2038 | | | 1,000 | | | | 1,117 | |
| | | | | | | | 82,229 | |
| | | | | | | | | |
| City & county issuers 38.76% | | | | | | | | |
| City of Albany Capital Resource Corp., Rev. Bonds (St. Peter’s Hospital of the City of Albany Project), Series 2011, 6.25% 2038 | | | 1,000 | | | | 1,245 | |
| City of Albany Industrial Dev. Agcy., Civic Fac. Rev. Ref. Bonds (St. Peter’s Hospital of the City of Albany Project), Series 2008-A, 5.25% 2027 | | | 500 | | | | 541 | |
| Buffalo and Erie County Industrial Land Dev. Corp., Rev. Bonds (Buffalo State College Foundation Housing Corp. Project), Series 2011-A, 5.375% 2041 | | | 1,400 | | | | 1,564 | |
| Buffalo and Erie County, Industrial Land Dev. Corp., Obligated Group Rev. Bonds (Catholic Health System, Inc. Project), Series 2015, 5.00% 2040 | | | 1,050 | | | | 1,189 | |
| Buffalo and Erie County, Industrial Land Dev. Corp., Obligated Group Rev. Bonds (Catholic Health System, Inc. Project), Series 2015, 5.25% 2035 | | | 500 | | | | 585 | |
| Build NYC Resource Corp., Rev. Bonds (Bronx Charter School for Excellence Project), Series 2013-A, 5.50% 2043 | | | 1,000 | | | | 1,096 | |
| Build NYC Resource Corp., Rev. Bonds (YMCA of Greater New York Project), 5.00% 2040 | | | 500 | | | | 566 | |
| Build NYC Resource Corp., Solid Waste Disposal Rev. Bonds (Pratt Paper (NY), Inc. Project), Series 2014, AMT, 5.00% 20351 | | | 250 | | | | 271 | |
| Build NYC Resources Corp Rev. Ref. Bonds (New York Law School), 5.00% 2041 | | | 750 | | | | 840 | |
| County of Chautauqua Industrial Dev. Agcy., Exempt Fac. Rev. Bonds (NRG Dunkirk Power Project), Series 2009, 5.875% 2042 | | | 1,000 | | | | 1,062 | |
| Dutchess County Local Dev. Corp., Rev. Ref. Bonds (Health Quest Systems, Inc. Project), Series 2010, 5.75% 2030 | | | 500 | | | | 579 | |
| Dutchess County Local Dev. Corp., Rev. Ref. Bonds (Health Quest Systems, Inc. Project), Series 2010, 5.75% 2040 | | | 1,000 | | | | 1,137 | |
| Erie County Industrial Dev. Agcy., School Fac. Rev. Bonds (City School Dist. of the City of Buffalo Project), Series 2011-A, 5.25% 2025 | | | 500 | | | | 599 | |
| Erie County Industrial Dev. Agcy., School Fac. Rev. Ref. Bonds (City School Dist. of the City of Buffalo Project), Series 2012-A, 5.00% 2021 | | | 500 | | | | 596 | |
| Erie County Industrial Dev. Agcy., School Fac. Rev. Ref. Bonds (City School Dist. of the City of Buffalo Project), Series 2013-A, 5.00% 2027 | | | 790 | | | | 960 | |
| Various Purpose G.O. Bonds, Series 2014-A, 5.00% 2028 | | | 1,250 | | | | 1,498 | |
| Various Purpose G.O. Bonds, Series 2016-A, 5.00% 2027 | | | 850 | | | | 1,048 | |
| Town of Hempstead Local Dev. Corp., Rev. Bonds (Hofstra University Project), Series 2011, 5.00% 2027 | | | 1,300 | | | | 1,480 | |
| American Funds Tax-Exempt Funds | 41 |
American Funds Tax-Exempt Fund of New York
| Bonds, notes & other debt instruments (continued) | | Principal amount
(000) | | | Value
(000) | |
| New York (continued) | | | | | | | | |
| City & county issuers (continued) | | | | | | | | |
| Town of Hempstead Local Dev. Corp., Rev. Bonds (Hofstra University Project), Series 2011, 5.00% 2041 | | $ | 800 | | | $ | 879 | |
| Town of Hempstead Local Dev. Corp., Rev. Ref. Bonds (Adelphi University Project), Series 2014, 5.00% 2027 | | | 400 | | | | 480 | |
| Long Island Power Auth., Electric System General Rev. Bonds, Series 2015-B, 5.00% 2038 | | | 750 | | | | 868 | |
| Long Island Power Auth., Electric System General Rev. Bonds, Series 2015-C, 1.179% 2033 (put 2018)2 | | | 300 | | | | 300 | |
| Long Island Power Auth., Electric System General Rev. Bonds, Series 2011-A, 5.00% 2038 | | | 500 | | | | 554 | |
| Long Island Power Auth., Electric System General Rev. Bonds, Series 2014-A, 5.00% 2044 | | | 1,240 | | | | 1,409 | |
| Long Island Power Auth., Electric System General Rev. Bonds, Series 2014-C, 0.949% 2033 (put 2018)2 | | | 1,000 | | | | 993 | |
| Long Island Power Auth., Electric System General Rev. Bonds, Series 2015-B, 5.00% 2035 | | | 1,215 | | | | 1,423 | |
| County of Monroe Industrial Dev. Agcy., School Fac. Rev. Bonds (Rochester Schools Modernization Project), Series 2012-A, 5.00% 2021 | | | 1,000 | | | | 1,191 | |
| Monroe County Industrial Dev. Corp., Rev. Bonds (Highland Hospital of Rochester Project), Series 2015, 5.00% 2033 | | | 430 | | | | 496 | |
| Monroe County Industrial Dev. Corp., Rev. Bonds (Highland Hospital of Rochester Project), Series 2015, 5.00% 2034 | | | 380 | | | | 437 | |
| Nassau County Local Econ. Assistance Corp., Rev. Ref. Bonds (Winthrop-University Hospital Association Project), Series 2012, 5.00% 2037 | | | 500 | | | | 548 | |
| City of New Rochelle, Corp. for Local Dev. Rev Bonds, (Iona College Project), Series 2015-A, 5.00% 2045 | | | 750 | | | | 829 | |
| City of New York, G.O. Bonds, Fiscal 2008 Series J-4, 0.56% 20252 | | | 1,500 | | | | 1,500 | |
| City of New York, G.O. Bonds, Fiscal 2008 Series L-1, 5.00% 2023 | | | 1,000 | | | | 1,089 | |
| City of New York, G.O. Bonds, Fiscal 2011 Series I-1, 5.00% 2016 | | | 750 | | | | 768 | |
| City of New York, G.O. Bonds, Series 2015-A, 5.00% 2026 | | | 1,000 | | | | 1,259 | |
| City of New York, G.O. Bonds, Series 2015-C, 5.00% 2028 | | | 500 | | | | 613 | |
| City of New York, G.O. Bonds, Series 2015-C, 5.00% 2033 | | | 1,000 | | | | 1,189 | |
| New York City Industrial Dev. Agcy., Airport Facs. Rev. Ref. Bonds (Transportation Infrastructure Properties, LLC Obligated Group), Series 2012-A, AMT, 5.00% 2022 | | | 15 | | | | 17 | |
| New York City Industrial Dev. Agcy., Airport Facs. Rev. Ref. Bonds (Transportation Infrastructure Properties, LLC Obligated Group), Series 2012-A, AMT, 5.00% 2028 | | | 250 | | | | 272 | |
| New York City Industrial Dev. Agcy., Special Fac. Rev. Bonds (American Airlines, Inc. John F. Kennedy International Airport Project), AMT, 2.00% 2028 | | | 200 | | | | 200 | |
| New York City Industrial Dev. Agcy., Special Fac. Rev. Bonds (American Airlines, Inc. John F. Kennedy International Airport Project), Series 2005, AMT, 7.625% 2025 | | | 1,500 | | | | 1,563 | |
| New York City Municipal Water Fin. Auth., Water and Sewer System Second General Resolution Rev. Ref. Bonds, Fiscal 2011 Series EE, 5.375% 2043 | | | 1,000 | | | | 1,174 | |
| New York City Municipal Water Fin. Auth., Water and Sewer System Second General Resolution Rev. Ref. Bonds, Series 2015-HH, 5.00% 2039 | | | 500 | | | | 589 | |
| New York City Transitional Fin. Auth., Building Aid Rev. Bonds, Fiscal 2007 Series S-2, Assured Guaranty Municipal insured, 5.00% 2017 | | | 570 | | | | 595 | |
| New York City Transitional Fin. Auth., Future Tax Secured Bonds, Fiscal 2011 Series C, 5.25% 2025 | | | 1,000 | | | | 1,196 | |
| New York City Transitional Fin. Auth., Future Tax Secured Bonds, Series 2015-C, 5.00% 2027 | | | 750 | | | | 936 | |
| New York City Transitional Fin. Auth., Future Tax Secured Rev. Ref. Bonds, Series 2015-C, 5.00% 2026 | | | 1,000 | | | | 1,274 | |
| New York City Transitional Fin. Auth., Future Tax Secured Rev. Ref. Bonds, Fiscal 2010 Series D, 5.00% 2023 | | | 1,000 | | | | 1,169 | |
| New York City Transitional Fin. Auth., Future Tax Secured Rev. Ref. Bonds, Series 2015-A-1, 5.00% 2037 | | | 500 | | | | 595 | |
| New York City, Health and Hospitals Corp., Health System Rev. Ref. Bonds, Series 2010-A, 5.00% 2021 | | | 540 | | | | 621 | |
| New York City, Health and Hospitals Corp., Health System Rev. Ref. Bonds, Series 2010-A, 5.00% 2025 | | | 500 | | | | 566 | |
| New York City, Housing Dev. Corp. Multi-Family Rev. Bonds (8 Spruce Street), Series 2014-E, 3.50% 2048 | | | 1,670 | | | | 1,735 | |
| New York City, Housing Dev. Corp. Multi-Family Rev. Bonds (8 Spruce Street), Series 2014-F, 4.50% 2048 | | | 500 | | | | 538 | |
| New York City, Municipal Water Fin. Auth., Water and Sewer System Second General Resolution Rev. Bonds, Series 2014-EE, 5.00% 2045 | | | 500 | | | | 577 | |
| 42 | American Funds Tax-Exempt Funds |
American Funds Tax-Exempt Fund of New York
| | | Principal amount | | | Value | |
| | | | (000) | | | | (000) | |
| Trust for Cultural Resources of the City of New York, Rev. Bonds (Juilliard School), Series 2009-B, 1.35% 2036 (put 2017) | | $ | 1,500 | | | $ | 1,513 | |
| Niagara Area Dev. Corp. (New York), Solid Waste Disposal Fac. Rev. Ref. Bonds (Covanta Energy Project), Series 2012-A, AMT, 5.25% 20421 | | | 375 | | | | 379 | |
| Niagara Frontier Transportation Auth., Airport Rev. Ref. Bonds (Buffalo Niagara International Airport), Series 2014-A, AMT, 5.00% 2027 | | | 600 | | | | 685 | |
| Niagara Frontier Transportation Auth., Airport Rev. Ref. Bonds (Buffalo Niagara International Airport), Series 2014-A, AMT, 5.00% 2028 | | | 500 | | | | 568 | |
| Niagara Frontier Transportation Auth., Airport Rev. Ref. Bonds (Buffalo Niagara International Airport), Series 2014-A, AMT, 5.00% 2029 | | | 700 | | | | 792 | |
| Onondaga Civic Dev. Corp., Rev. Bonds (St. Joseph’s Hospital Health Center Project), Series 2014-A, 5.125% 2031 | | | 750 | | | | 859 | |
| Onondaga County Resource Recovery Agcy., Rev. Ref. Bonds, Series 2015-A, AMT, Assured Guaranty Municipal insured, 5.00% 2030 | | | 1,750 | | | | 2,009 | |
| County of Rockland G.O. Bonds, Series 2014-A, Assured Guaranty Municipal insured, 5.00% 2024 | | | 1,000 | | | | 1,211 | |
| Suffolk County Econ. Dev. Corp., Rev. Ref. Bonds (Catholic Health Services of Long Island Obligated Group Project), 5.00% 2028 | | | 850 | | | | 957 | |
| Suffolk County Econ. Dev. Corp., Rev. Ref. Bonds (Catholic Health Services of Long Island Obligated Group Project), 5.00% 2028 (preref. 2021) | | | 150 | | | | 180 | |
| Suffolk County Econ. Dev. Corp., Rev. Ref. Bonds (Peconic Landing at Southold, Inc. Project), Series 2010, 5.875% 2030 | | | 1,000 | | | | 1,110 | |
| Suffolk County Industrial Dev. Agcy., Continuing Care Retirement Community Rev. Ref. Bonds (Jefferson’s Ferry Project), Series 2006, 5.00% 2028 | | | 1,000 | | | | 1,018 | |
| Suffolk Tobacco Asset Securitization Corp., Tobacco Settlement Asset-Backed Rev. Ref. Bonds, Series 2012-B, 5.00% 2032 | | | 750 | | | | 834 | |
| Tompkins County, New York, Dev. Corp., Continuing Care Retirement Community Rev. Bonds (Kendal at Ithaca Inc.), Series 2014-A, 5.00% 2044 | | | 1,000 | | | | 1,094 | |
| TSASC, Inc., Tobacco Settlement Asset-Backed Rev. Ref. Bonds, Series 2006-1, 5.00% 2034 | | | 1,380 | | | | 1,336 | |
| TSASC, Inc., Tobacco Settlement Asset-Backed Rev. Ref. Bonds, Series 2006-1, 5.125% 2042 | | | 4,790 | | | | 4,443 | |
| Westchester County Health Care Corp., Rev. Bonds, Series 2010-B, 6.00% 2030 | | | 1,000 | | | | 1,157 | |
| Westchester County Local Dev. Corp., Rev. Ref. Bonds (Pace University), Series 2014-A, 5.50% 2042 | | | 450 | | | | 512 | |
| City of Yonkers, G.O. Bonds, Series 2011-A, 5.00% 2019 | | | 1,000 | | | | 1,135 | |
| City of Yonkers, G.O. Bonds, Series 2015-B, Assured Guaranty Municipal insured, 5.00% 2024 | | | 490 | | | | 600 | |
| | | | | | | | 69,690 | |
| | | | | | | | | |
| Guam 1.88% | | | | | | | | |
| A.B. Won Pat International Airport Auth., General Rev. Bonds, Series 2013-C, AMT, 6.375% 2043 | | | 500 | | | | 591 | |
| Government of Guam, Business Privilege Tax Bonds, Series 2011-A, 5.00% 2031 | | | 1,200 | | | | 1,345 | |
| Government of Guam, Hotel Occupancy Tax Rev. Ref. Bonds, Series 2011-A, 6.125% 2031 | | | 500 | | | | 595 | |
| Waterworks Auth., Water and Wastewater System Rev. Bonds, Series 2013, 5.00% 2028 | | | 500 | | | | 571 | |
| Waterworks Auth., Water and Wastewater System Rev. Bonds, Series 2014-A, 5.00% 2029 | | | 250 | | | | 286 | |
| | | | | | | | 3,388 | |
| | | | | | | | | |
| Puerto Rico 2.65% | | | | | | | | |
| Highways and Transportation Auth., Transportation Rev. Ref. Bonds, Series 2002-D, Assured Guaranty Municipal insured, 5.00% 2032 | | | 660 | | | | 660 | |
| Highways and Transportation Auth., Transportation Rev. Ref. Bonds, Series 2007-N, Assured Guaranty insured, 5.25% 2036 | | | 500 | | | | 513 | |
| Highways and Transportation Auth., Highway Rev. Ref. Bonds, Series 2003-AA1, 4.95% 2026 | | | 265 | | | | 267 | |
| Industrial, Tourist, Educational, Medical and Environmental Control Facs. Fncg. Auth., Higher Education Rev. and Rev. Ref. Bonds (Inter American University of Puerto Rico Project), Series 2012, 5.00% 2021 | | | 400 | | | | 393 | |
| American Funds Tax-Exempt Funds | 43 |
American Funds Tax-Exempt Fund of New York
| Bonds, notes & other debt instruments (continued) | | Principal amount
(000) | | | Value
(000) | |
| Puerto Rico (continued) | | | | | | | | |
| Industrial, Tourist, Educational, Medical and Environmental Control Facs. Fncg. Auth., Higher Education Rev. and Rev. Ref. Bonds (Inter American University of Puerto Rico Project), Series 2012, 5.00% 2031 | | $ | 750 | | | $ | 688 | |
| Industrial, Tourist, Educational, Medical and Environmental Control Facs. Fncg. Auth., Higher Education Rev. and Rev. Ref. Bonds (University of the Sacred Heart Project), Series 2012, 5.00% 2020 | | | 500 | | | | 404 | |
| Industrial, Tourist, Educational, Medical and Environmental Control Facs. Fncg. Auth., Higher Education Rev. and Rev. Ref. Bonds (University of the Sacred Heart Project), Series 2012, 5.00% 2042 | | | 500 | | | | 357 | |
| Industrial, Tourist, Educational, Medical and Environmental Control Facs. Fncg. Auth., Hospital Rev. and Rev. Ref. Bonds (Hospital Auxilio Mutuo Obligated Group Project), Series 2011-A, 6.00% 2033 | | | 1,000 | | | | 1,050 | |
| University of Puerto Rico, University System Rev. Ref. Bonds, Series 2006-P, 5.00% 2017 | | | 570 | | | | 287 | |
| University of Puerto Rico, University System Rev. Ref. Bonds, Series 2006-Q, 5.00% 2020 | | | 350 | | | | 146 | |
| | | | | | | | 4,765 | |
| | | | | | | | | |
| Virgin Islands 0.89% | | | | | | | | |
| Public Fin. Auth., Rev. Bonds (Matching Fund Loan Notes - Diageo Project), Series 2009-A, 6.625% 2029 | | | 500 | | | | 561 | |
| Public Fin. Auth., Rev. Ref. Bonds (Matching Fund Loan Notes), Series 2012-A, 5.00% 2032 | | | 250 | | | | 270 | |
| Public Fin. Auth., Rev. Ref. Bonds (Matching Fund Loan Notes), Series 2013-B, 5.00% 2024 | | | 500 | | | | 586 | |
| Public Fin. Auth., Rev. Ref. Bonds (Matching Fund Loan Notes), Series 2014-A, 5.00% 2024 | | | 150 | | | | 176 | |
| | | | | | | | 1,593 | |
| | | | | | | | | |
| Total bonds, notes & other debt instruments (cost: $152,081,000) | | | | | | | 161,665 | |
| | | | | | | | | |
| | | | | | | | | |
| Short-term securities 9.40% | | | | | | | | |
| Dormitory Auth., University of Rochester Rev. Bonds, Series 2003-A, JPMorgan Chase LOC, 0.01% 20312 | | | 3,655 | | | | 3,655 | |
| City of Syracuse, New York, Industrial Dev. Agcy., Civic Fac. Rev. Bonds (Syracuse University Project), Series 2008-A-1, 0.01% 20372 | | | 700 | | | | 700 | |
| New York City Industrial Dev. Agcy., Civic Fac. Ref. and Improvement Rev. Bonds (2005 American Civil Liberties Union Foundation, Inc. Project), Series 2005, JPMorgan Chase LOC, 0.01% 20352 | | | 800 | | | | 800 | |
| City of New York, G.O. Bonds, Fiscal 1994 Series E-2, 0.01% 20202 | | | 1,000 | | | | 1,000 | |
| City of New York, G.O. Bonds, Fiscal 2008 Series L, Subseries L-4, 0.01% 20382 | | | 5,000 | | | | 5,000 | |
| City of New York, G.O. Bonds, Series 2006-H-1, 0.01% 20362 | | | 100 | | | | 100 | |
| New York City, Transitional Fin. Auth., New York City Recovery Bonds, Fiscal Series 2003-1, Subseries 1-C, 0.01% 20222 | | | 1,200 | | | | 1,200 | |
| Triborough Bridge and Tunnel Auth. (MTA Bridges and Tunnels), General Rev. Bonds, Series 2003-B-3, U.S. Bank LOC, 0.01% 20332 | | | 4,325 | | | | 4,325 | |
| Triborough Bridge and Tunnel Auth. (MTA Bridges and Tunnels), General Rev. Ref. Bonds, Series 2001-B, 0.01% 20322 | | | 120 | | | | 120 | |
| | | | | | | | | |
| Total short-term securities (cost: $16,900,000) | | | | | | | 16,900 | |
| Total investment securities 99.31% (cost: $168,981,000) | | | | | | | 178,565 | |
| Other assets less liabilities 0.69% | | | | | | | 1,245 | |
| Net assets 100.00% | | | | | | $ | 179,810 | |
| 1 | Acquired in a transaction exempt from registration under Rule 144A of the Securities Act of 1933. May be resold in the U.S. in transactions exempt from registration, normally to qualified institutional buyers. The total value of all such securities was $3,413,000, which represented 1.90% of the net assets of the fund. |
| 2 | Coupon rate may change periodically. For short-term securities, the date of the next scheduled coupon rate change is considered to be the maturity date. |
| 44 | American Funds Tax-Exempt Funds |
American Funds Tax-Exempt Fund of New York
Key to abbreviations
Agcy. = Agency
AMT = Alternative Minimum Tax
Auth. = Authority
Certs. of Part. = Certificates of Participation
Dept. = Department
Dev. = Development
Dist. = District
Econ. = Economic
Fac. = Facility
Facs. = Facilities
Fin. = Finance
Fncg. = Financing
G.O. = General Obligation
LOC = Letter of Credit
Preref. = Prerefunded
Redev. = Redevelopment
Ref. = Refunding
Rev. = Revenue
TECP = Tax-Exempt Commercial Paper
See Notes to Financial Statements
| American Funds Tax-Exempt Funds | 45 |
Financial statements
Statements of assets and liabilities
at January 31, 2016
| | | American Funds
Short-Term
Tax-Exempt Bond Fund | | | Limited Term
Tax-Exempt Bond
Fund of America | |
| | | | | | | | | | |
| Assets: | | | | | | | | |
| Investment securities, at value | | $ | 759,703 | | | $ | 3,359,843 | |
| Cash | | | 4,089 | | | | 22,349 | |
| Receivables for: | | | | | | | | |
| Sales of investments | | | — | | | | 1,150 | |
| Sales of fund’s shares | | | 3,018 | | | | 9,047 | |
| Interest | | | 5,374 | | | | 30,157 | |
| Other | | | 59 | | | | 314 | |
| | | | 772,243 | | | | 3,422,860 | |
| | | | | | | | | |
| Liabilities: | | | | | | | | |
| Payables for: | | | | | | | | |
| Purchases of investments | | | 11,451 | | | | 38,928 | |
| Repurchases of fund’s shares | | | 1,701 | | | | 3,446 | |
| Dividends on fund’s shares | | | 58 | | | | 620 | |
| Investment advisory services | | | 235 | | | | 667 | |
| Services provided by related parties | | | 107 | | | | 411 | |
| Trustees’ deferred compensation | | | 30 | | | | 127 | |
| Other | | | — | * | | | 1 | |
| | | | 13,582 | | | | 44,200 | |
| Net assets at January 31, 2016 | | $ | 758,661 | | | $ | 3,378,660 | |
| | | | | | | | | |
| Net assets consist of: | | | | | | | | |
| Capital paid in on shares of beneficial interest | | $ | 753,206 | | | $ | 3,242,011 | |
| Undistributed net investment income | | | 28 | | | | 518 | |
| Accumulated net realized loss | | | (1,092 | ) | | | (374 | ) |
| Net unrealized appreciation | | | 6,519 | | | | 136,505 | |
| Net assets at January 31, 2016 | | $ | 758,661 | | | $ | 3,378,660 | |
| | | | | | | | | |
| Investment securities, at cost | | | 753,184 | | | | 3,223,338 | |
| | | | | | | | | |
| Shares of beneficial interest issued and outstanding | | | | | | | | |
| (no stated par value) — unlimited shares authorized | | | | | | | | |
| Class A: | Net assets | | $ | 675,925 | | | $ | 2,810,109 | |
| | Shares outstanding | | | 66,327 | | | | 175,472 | |
| | Net asset value per share | | $ | 10.19 | | | $ | 16.01 | |
| Class B: | Net assets | | | | | | $ | 517 | |
| | Shares outstanding | | | | | | | 32 | |
| | Net asset value per share | | | | | | $ | 16.01 | |
| Class C: | Net assets | | | | | | $ | 29,934 | |
| | Shares outstanding | | | | | | | 1,869 | |
| | Net asset value per share | | | | | | $ | 16.01 | |
| Class F-1: | Net assets | | $ | 10,683 | | | $ | 85,271 | |
| | Shares outstanding | | | 1,048 | | | | 5,325 | |
| | Net asset value per share | | $ | 10.19 | | | $ | 16.01 | |
| Class F-2: | Net assets | | $ | 72,053 | | | $ | 220,070 | |
| | Shares outstanding | | | 7,071 | | | | 13,742 | |
| | Net asset value per share | | $ | 10.19 | | | $ | 16.01 | |
| Class R-6: | Net assets | | | | | | $ | 232,759 | |
| | Shares outstanding | | | | | | | 14,534 | |
| | Net asset value per share | | | | | | $ | 16.01 | |
| * | Amount less than one thousand. |
See Notes to Financial Statements
| 46 | American Funds Tax-Exempt Funds |
unaudited
(dollars and shares in thousands, except per-share amounts)
The Tax-Exempt
Bond Fund
of America | | | American
High-Income
Municipal Bond Fund | | | The Tax-Exempt
Fund of
California | | | American Funds
Tax-Exempt Fund
of New York | |
| | | | | | | | | | | | | | | |
| | | | | | | | | | | | | | | |
| $ | 11,446,128 | | | $ | 4,126,951 | | | $ | 1,772,672 | | | $ | 178,565 | |
| | 103,885 | | | | 28,728 | | | | 30,113 | | | | 1,533 | |
| | | | | | | | | | | | | | | |
| | 6,473 | | | | 10,474 | | | | — | | | | 888 | |
| | 38,237 | | | | 15,600 | | | | 4,403 | | | | 152 | |
| | 114,380 | | | | 44,466 | | | | 22,050 | | | | 1,480 | |
| | 1,126 | | | | 471 | | | | 179 | | | | 16 | |
| | 11,710,229 | | | | 4,226,690 | | | | 1,829,417 | | | | 182,634 | |
| | | | | | | | | | | | | | | |
| | | | | | | | | | | | | | | |
| | | | | | | | | | | | | | | |
| | 128,064 | | | | 54,505 | | | | 20,213 | | | | 2,539 | |
| | 19,206 | | | | 7,595 | | | | 2,065 | | | | 78 | |
| | 2,566 | | | | 1,242 | | | | 711 | | | | 112 | |
| | 2,225 | | | | 1,051 | | | | 461 | | | | 50 | |
| | 2,687 | | | | 868 | | | | 448 | | | | 44 | |
| | 270 | | | | 99 | | | | 126 | | | | 1 | |
| | 2 | | | | 1 | | | | — | * | | | — | * |
| | 155,020 | | | | 65,361 | | | | 24,024 | | | | 2,824 | |
| $ | 11,555,209 | | | $ | 4,161,329 | | | $ | 1,805,393 | | | $ | 179,810 | |
| | | | | | | | | | | | | | | |
| | | | | | | | | | | | | | | |
| $ | 10,853,493 | | | $ | 4,040,300 | | | $ | 1,717,204 | | | $ | 170,152 | |
| | 9,164 | | | | 7,740 | | | | 1,727 | | | | 171 | |
| | (19,017 | ) | | | (117,349 | ) | | | (35,275 | ) | | | (97 | ) |
| | 711,569 | | | | 230,638 | | | | 121,737 | | | | 9,584 | |
| $ | 11,555,209 | | | $ | 4,161,329 | | | $ | 1,805,393 | | | $ | 179,810 | |
| | | | | | | | | | | | | | | |
| | 10,734,559 | | | | 3,896,313 | | | | 1,650,935 | | | | 168,981 | |
| | | | | | | | | | | | | | | |
| | | | | | | | | | | | | | | |
| | | | | | | | | | | | | | | |
| $ | 7,947,753 | | | $ | 3,032,815 | | | $ | 1,497,848 | | | $ | 142,164 | |
| | 603,050 | | | | 192,755 | | | | 83,475 | | | | 13,064 | |
| $ | 13.18 | | | $ | 15.73 | | | $ | 17.94 | | | $ | 10.88 | |
| $ | 5,229 | | | $ | 2,367 | | | $ | 784 | | | $ | 35 | |
| | 397 | | | | 151 | | | | 44 | | | | 3 | |
| $ | 13.18 | | | $ | 15.73 | | | $ | 17.94 | | | $ | 10.88 | |
| $ | 378,547 | | | $ | 205,809 | | | $ | 80,972 | | | $ | 12,651 | |
| | 28,723 | | | | 13,081 | | | | 4,513 | | | | 1,163 | |
| $ | 13.18 | | | $ | 15.73 | | | $ | 17.94 | | | $ | 10.88 | |
| $ | 1,684,138 | | | $ | 236,143 | | | $ | 68,644 | | | $ | 1,679 | |
| | 127,787 | | | | 15,008 | | | | 3,825 | | | | 154 | |
| $ | 13.18 | | | $ | 15.73 | | | $ | 17.94 | | | $ | 10.88 | |
| $ | 1,222,084 | | | $ | 466,120 | | | $ | 157,145 | | | $ | 23,281 | |
| | 92,728 | | | | 29,625 | | | | 8,758 | | | | 2,139 | |
| $ | 13.18 | | | $ | 15.73 | | | $ | 17.94 | | | $ | 10.88 | |
| $ | 317,458 | | | $ | 218,075 | | | | | | | | | |
| | 24,088 | | | | 13,860 | | | | | | | | | |
| $ | 13.18 | | | $ | 15.73 | | | | | | | | | |
| American Funds Tax-Exempt Funds | 47 |
Statements of operations
for the six months ended January 31, 2016
| | | American Funds
Short-Term
Tax-Exempt Bond Fund | | | Limited Term
Tax-Exempt Bond
Fund of America | |
| | | | | | | | | |
| Investment income: | | | | | | | | |
| Income: | | | | | | | | |
| Interest | | $ | 5,866 | | | $ | 46,274 | |
| | | | | | | | | |
| Fees and expenses*: | | | | | | | | |
| Investment advisory services | | | 1,365 | | | | 3,891 | |
| Distribution services | | | 508 | | | | 3,921 | |
| Transfer agent services | | | 147 | | | | 588 | |
| Administrative services | | | 53 | | | | 271 | |
| Reports to shareholders | | | 9 | | | | 35 | |
| Registration statement and prospectus | | | 83 | | | | 146 | |
| Trustees’ compensation | | | 4 | | | | 16 | |
| Auditing and legal | | | 7 | | | | 9 | |
| Custodian | | | 1 | | | | 4 | |
| State and local taxes | | | — | | | | — | |
| Other | | | 1 | | | | 2 | |
| Total fees and expenses before reimbursement | | | 2,178 | | | | 8,883 | |
| Less reimbursement of fees and expenses | | | — | | | | — | |
| Total fees and expenses after reimbursement | | | 2,178 | | | | 8,883 | |
| Net investment income | | | 3,688 | | | | 37,391 | |
| | | | | | | | | |
| Net realized (loss) gain and unrealized appreciation: | | | | | | | | |
| Net realized (loss) gain on investments | | | (316 | ) | | | 274 | |
| Net unrealized appreciation on investments | | | 1,814 | | | | 20,749 | |
| Net realized (loss) gain and unrealized appreciation | | | 1,498 | | | | 21,023 | |
| | | | | | | | | |
| Net increase in net assets resulting from operations | | $ | 5,186 | | | $ | 58,414 | |
| * | Additional information related to class-specific fees and expenses is included in the Notes to Financial Statements. |
| † | Amount less than one thousand. |
See Notes to Financial Statements
| 48 | American Funds Tax-Exempt Funds |
unaudited
(dollars in thousands)
The Tax-Exempt
Bond Fund
of America | | | American
High-Income
Municipal Bond Fund | | | The Tax-Exempt
Fund of
California | | | American Funds
Tax-Exempt Fund
of New York | |
| | | | | | | | | | | | | | | |
| | | | | | | | | | | | | | | |
| $ | 206,437 | | | $ | 92,477 | | | $ | 33,850 | | | $ | 2,767 | |
| | | | | | | | | | | | | | | |
| | | | | | | | | | | | | | | |
| | 12,801 | | | | 5,931 | | | | 2,671 | | | | 285 | |
| | 13,368 | | | | 5,036 | | | | 2,266 | | | | 220 | |
| | 2,819 | | | | 1,080 | | | | 279 | | | | 36 | |
| | 1,219 | | | | 395 | | | | 144 | | | | 16 | |
| | 114 | | | | 40 | | | | 19 | | | | 3 | |
| | 369 | | | | 210 | | | | 69 | | | | 64 | |
| | 53 | | | | 17 | | | | 7 | | | | 1 | |
| | 12 | | | | 9 | | | | 8 | | | | 7 | |
| | 12 | | | | 5 | | | | 2 | | | | — | † |
| | 141 | | | | 351 | | | | 18 | | | | — | † |
| | 9 | | | | 5 | | | | 2 | | | | — | † |
| | 30,917 | | | | 13,079 | | | | 5,485 | | | | 632 | |
| | — | | | | — | | | | — | | | | 26 | |
| | 30,917 | | | | 13,079 | | | | 5,485 | | | | 606 | |
| | 175,520 | | | | 79,398 | | | | 28,365 | | | | 2,161 | |
| | | | | | | | | | | | | | | |
| | | | | | | | | | | | | | | |
| | 1,730 | | | | 5,503 | | | | (1,377 | ) | | | 179 | |
| | 181,899 | | | | 77,837 | | | | 33,085 | | | | 3,272 | |
| | 183,629 | | | | 83,340 | | | | 31,708 | | | | 3,451 | |
| | | | | | | | | | | | | | | |
| $ | 359,149 | | | $ | 162,738 | | | $ | 60,073 | | | $ | 5,612 | |
| American Funds Tax-Exempt Funds | 49 |
Statements of changes in net assets
| | | American Funds
Short-Term
Tax-Exempt Bond Fund | | Limited Term
Tax-Exempt Bond
Fund of America | | The Tax-Exempt
Bond Fund
of America |
| | | Six months
ended
January 31
2016* | | Year ended
July 31
2015 | | Six months
ended
January 31
2016* | | Year ended
July 31
2015 | | Six months
ended
January 31
2016* | | Year ended
July 31
2015 |
| Operations: | | | | | | | | | | | | | | | | | | | | | | | | |
| Net investment income | | $ | 3,688 | | | $ | 8,091 | | | $ | 37,391 | | | $ | 75,181 | | | $ | 175,520 | | | $ | 324,926 | |
| Net realized (loss) gain | | | (316 | ) | | | (380 | ) | | | 274 | | | | 84 | | | | 1,730 | | | | 3,709 | |
| Net unrealized appreciation (depreciation) | | | 1,814 | | | | (5,652 | ) | | | 20,749 | | | | (36,958 | ) | | | 181,899 | | | | 17,674 | |
| Net increase in net assets resulting from operations | | | 5,186 | | | | 2,059 | | | | 58,414 | | | | 38,307 | | | | 359,149 | | | | 346,309 | |
| | | | | | | | | | | | | | | | | | | | | | | | | |
| Dividends paid or accrued to shareholders from net investment income | | | (3,636 | ) | | | (8,084 | ) | | | (37,581 | ) | | | (74,782 | ) | | | (175,370 | ) | | | (321,189 | ) |
| | | | | | | | | | | | | | | | | | | | | | | | | |
| Net capital share transactions | | | 30,899 | | | | (65,037 | ) | | | 174,730 | | | | 143,346 | | | | 896,339 | | | | 1,124,196 | |
| | | | | | | | | | | | | | | | | | | | | | | | | |
| Total increase (decrease) in net assets | | | 32,449 | | | | (71,062 | ) | | | 195,563 | | | | 106,871 | | | | 1,080,118 | | | | 1,149,316 | |
| | | | | | | | | | | | | | | | | | | | | | | | | |
| Net assets: | | | | | | | | | | | | | | | | | | | | | | | | |
| Beginning of period | | | 726,212 | | | | 797,274 | | | | 3,183,097 | | | | 3,076,226 | | | | 10,475,091 | | | | 9,325,775 | |
| End of period | | $ | 758,661 | | | $ | 726,212 | | | $ | 3,378,660 | | | $ | 3,183,097 | | | $ | 11,555,209 | | | $ | 10,475,091 | |
| | | | | | | | | | | | | | | | | | | | | | | | | |
| Undistributed (distributions in excess of) net investment income | | $ | 28 | | | $ | (24 | ) | | $ | 518 | | | $ | 708 | | | $ | 9,164 | | | $ | 9,014 | |
See Notes to Financial Statements
| 50 | American Funds Tax-Exempt Funds |
(dollars in thousands)
American
High-Income
Municipal Bond Fund | | The Tax-Exempt
Fund of
California | | American Funds
Tax-Exempt Fund
of New York |
Six months
ended
January 31
2016* | | Year ended
July 31
2015 | | Six months
ended
January 31
2016* | | Year ended
July 31
2015 | | Six months
ended
January 31
2016* | | Year ended
July 31
2015 |
| | | | | | | | | | | | | | | | | | | | | | | |
| $ | 79,398 | | | $ | 138,904 | | | $ | 28,365 | | | $ | 54,073 | | | $ | 2,161 | | | $ | 4,043 | |
| | 5,503 | | | | (3,961 | ) | | | (1,377 | ) | | | 957 | | | | 179 | | | | 351 | |
| | 77,837 | | | | 30,465 | | | | 33,085 | | | | 5,572 | | | | 3,272 | | | | 250 | |
| | | | | | | | | | | | | | | | | | | | | | | |
| | 162,738 | | | | 165,408 | | | | 60,073 | | | | 60,602 | | | | 5,612 | | | | 4,644 | |
| | | | | | | | | | | | | | | | | | | | | | | |
| | (77,676 | ) | | | (135,657 | ) | | | (28,195 | ) | | | (53,343 | ) | | | (2,117 | ) | | | (3,949 | ) |
| | | | | | | | | | | | | | | | | | | | | | | |
| | 474,626 | | | | 539,260 | | | | 111,655 | | | | 136,929 | | | | 20,619 | | | | 28,236 | |
| | | | | | | | | | | | | | | | | | | | | | | |
| | 559,688 | | | | 569,011 | | | | 143,533 | | | | 144,188 | | | | 24,114 | | | | 28,931 | |
| | | | | | | | | | | | | | | | | | | | | | | |
| | 3,601,641 | | | | 3,032,630 | | | | 1,661,860 | | | | 1,517,672 | | | | 155,696 | | | | 126,765 | |
| $ | 4,161,329 | | | $ | 3,601,641 | | | $ | 1,805,393 | | | $ | 1,661,860 | | | $ | 179,810 | | | $ | 155,696 | |
| | | | | | | | | | | | | | | | | | | | | | | |
| $ | 7,740 | | | $ | 6,018 | | | $ | 1,727 | | | $ | 1,557 | | | $ | 171 | | | $ | 127 | |
| American Funds Tax-Exempt Funds | 51 |
| Notes to financial statements | unaudited |
1. Organization
American Funds Short-Term Tax-Exempt Bond Fund, Limited Term Tax-Exempt Bond Fund of America, The Tax-Exempt Bond Fund of America, American High-Income Municipal Bond Fund, The Tax-Exempt Fund of California, which is presently the only series of The American Funds Tax-Exempt Series II, and American Funds Tax-Exempt Fund of New York (each a “fund” or collectively, the “funds”), are registered under the Investment Company Act of 1940 as open-end, diversified management investment companies.
Each fund’s investment objectives are as follows:
American Funds Short-Term Tax-Exempt Bond Fund — Seeks to provide current income exempt from regular federal income tax, consistent with the maturity and quality standards described in the prospectus, and to preserve capital.
Limited Term Tax-Exempt Bond Fund of America — Seeks to provide current income exempt from regular federal income tax, consistent with the maturity and quality standards described in the prospectus, and to preserve capital.
The Tax-Exempt Bond Fund of America — Seeks to provide a high level of current income exempt from federal income tax, consistent with the preservation of capital.
American High-Income Municipal Bond Fund — Seeks to provide a high level of current income exempt from regular federal income tax.
The Tax-Exempt Fund of California — Seeks to provide a high level of current income exempt from regular federal and California state income taxes. Its secondary objective is preservation of capital.
American Funds Tax-Exempt Fund of New York — Seeks to provide a high level of current income exempt from regular federal, New York state and New York City income taxes. Its secondary objective is preservation of capital.
American Funds Short-Term Tax-Exempt Bond Fund has three share classes (Class A, as well as two F share classes, F-1 and F-2). Limited Term Tax-Exempt Bond Fund of America, The Tax-Exempt Bond Fund of America and American High-Income Municipal Bond Fund each have six share classes consisting of five retail share classes (Classes A, B and C, as well as two F share classes, F-1 and F-2) and one share class that is only available to the American Funds Portfolio Series (Class R-6). The Tax-Exempt Fund of California and American Funds Tax-Exempt Fund of New York each have five retail share classes (Classes A, B and C, as well as two F share classes, F-1 and F-2). Some share classes are only available to limited categories of investors. The funds’ share classes are described further in the following table:
| Share class | | Initial sales charge | | Contingent deferred sales
charge upon redemption | | Conversion feature |
| Class A | | Up to 2.50% for American Funds Short-Term Tax-Exempt Bond Fund and Limited Term Tax-Exempt Bond Fund of America; up to 3.75% for all other funds | | None (except 1% for certain redemptions within one year of purchase without an initial sales charge) | | None |
| Class B* | | None | | Declines from 5% to 0% for redemptions within six years of purchase | | Class B converts to Class A after eight years |
| Class C† | | None | | 1% for redemptions within one year of purchase | | Class C converts to Class F-1 after 10 years |
| Classes F-1 and F-2 | | None | | None | | None |
| Class R-6 | | None | | None | | None |
| * | Class B shares are not available for purchase in Limited Term Tax-Exempt Bond Fund of America, The Tax-Exempt Bond Fund of America, American High-Income Municipal Bond Fund, The Tax-Exempt Fund of California and American Funds Tax-Exempt Fund of New York. |
| † | Class C shares are not available for purchase in Limited Term Tax-Exempt Bond Fund of America. |
Holders of all share classes of each fund have equal pro rata rights to the assets, dividends and liquidation proceeds of each fund held. Each share class of each fund has identical voting rights, except for the exclusive right to vote on matters affecting only its class. Share classes have different fees and expenses (“class-specific fees and expenses”), primarily due to different arrangements for distribution, transfer agent and administrative services. Differences in class-specific fees and expenses will result in differences in net investment income and, therefore, the payment of different per-share dividends by each share class of each fund.
| 52 | American Funds Tax-Exempt Funds |
2. Significant accounting policies
Each fund is an investment company that applies the accounting and reporting guidance issued in Topic 946 by the U.S. Financial Accounting Standards Board. Each fund’s financial statements have been prepared to comply with U.S. generally accepted accounting principles (“U.S. GAAP”). These principles require the funds’ investment adviser to make estimates and assumptions that affect reported amounts and disclosures. Actual results could differ from those estimates. Subsequent events, if any, have been evaluated through the date of issuance in the preparation of the financial statements. The funds follow the significant accounting policies described in this section, as well as the valuation policies described in the next section on valuation.
Security transactions and related investment income — Security transactions are recorded by the funds as of the date the trades are executed with brokers. Realized gains and losses from security transactions are determined based on the specific identified cost of the securities. In the event a security is purchased with a delayed payment date, the funds will segregate liquid assets sufficient to meet their payment obligations. Interest income is recognized on an accrual basis. Market discounts, premiums and original issue discounts on fixed-income securities are amortized daily over the expected life of the security.
Class allocations — Income, fees and expenses (other than class-specific fees and expenses) are allocated daily among the various share classes of each fund based on the relative value of their settled shares. Realized and unrealized gains and losses are allocated daily among the various share classes of each fund based on their relative net assets. Class-specific fees and expenses, such as distribution, transfer agent and administrative services, are charged directly to the respective share class of each fund.
Dividends and distributions to shareholders — Dividends to shareholders are declared daily after the determination of each fund’s net investment income and are paid to shareholders monthly. Distributions to shareholders are recorded on each fund’s ex-dividend date.
3. Valuation
Capital Research and Management Company (“CRMC”), the funds’ investment adviser, values each fund’s investments at fair value as defined by U.S. GAAP. The net asset value of each share class of each fund is generally determined as of approximately 4:00 p.m. New York time each day the New York Stock Exchange is open.
Methods and inputs — The funds’ investment adviser uses the following methods and inputs to establish the fair value of each fund’s assets and liabilities. Use of particular methods and inputs may vary over time based on availability and relevance as market and economic conditions evolve.
Fixed-income securities, including short-term securities, are generally valued at prices obtained from one or more pricing vendors. Vendors value such securities based on one or more of the following inputs: benchmark yields, transactions, bids, offers, quotations from dealers and trading systems, new issues, spreads and other relationships observed in the markets among comparable securities; and proprietary pricing models such as yield measures calculated using factors such as cash flows, financial or collateral performance and other reference data. For certain distressed securities, valuations may include cash flows or liquidation values using a net present value calculation based on inputs that include, but are not limited to, financial statements and debt contracts.
When the funds’ investment adviser deems it appropriate to do so (such as when vendor prices are unavailable or not deemed to be representative), fixed-income securities will be valued in good faith at the mean quoted bid and ask prices that are reasonably and timely available (or bid prices, if ask prices are not available) or at prices for securities of comparable maturity, quality and type. Some securities may be valued based on their effective maturity or average life, which may be shorter than the stated maturity.
Securities and other assets for which representative market quotations are not readily available or are considered unreliable by the funds’ investment adviser are fair valued as determined in good faith under fair valuation guidelines adopted by authority of each fund’s board of trustees as further described. The investment adviser follows fair valuation guidelines, consistent with U.S. Securities and Exchange Commission rules and guidance, to consider relevant principles and factors when making fair value determinations. The investment adviser considers relevant indications of value that are reasonably and timely available to it in determining the fair value to be assigned to a particular security, such as the type and cost of the security; contractual or legal restrictions on resale of the security; relevant financial or business developments of the issuer; actively traded similar or related securities; conversion or exchange rights on the security; related corporate actions; significant events occurring after the close of trading in the security; and changes in overall market conditions. In addition, the closing prices of equity securities that trade in markets outside U.S. time zones may be adjusted to reflect significant events that occur after the close of local trading but before the net asset value of each share class of the fund is
| American Funds Tax-Exempt Funds | 53 |
determined. Fair valuations and valuations of investments that are not actively trading involve judgment and may differ materially from valuations that would have been used had greater market activity occurred.
Processes and structure — Each fund’s board of trustees has delegated authority to the funds’ investment adviser to make fair value determinations, subject to board oversight. The investment adviser has established a Joint Fair Valuation Committee (the “Fair Valuation Committee”) to administer, implement and oversee the fair valuation process, and to make fair value decisions. The Fair Valuation Committee regularly reviews its own fair value decisions, as well as decisions made under its standing instructions to the investment adviser’s valuation teams. The Fair Valuation Committee reviews changes in fair value measurements from period to period and may, as deemed appropriate, update the fair valuation guidelines to better reflect the results of back testing and address new or evolving issues. The Fair Valuation Committee reports any changes to the fair valuation guidelines to the boards of trustees with supplemental information to support the changes. Each fund’s board and audit committee also regularly review reports that describe fair value determinations and methods.
The funds’ investment adviser has also established a Fixed-Income Pricing Review Group to administer and oversee the fixed-income valuation process, including the use of fixed-income pricing vendors. This group regularly reviews pricing vendor information and market data. Pricing decisions, processes and controls over security valuation are also subject to additional internal reviews, including an annual control self-evaluation program facilitated by the investment adviser’s compliance group.
Classifications — The funds’ investment adviser classifies each fund’s assets and liabilities into three levels based on the inputs used to value the assets or liabilities. Level 1 values are based on quoted prices in active markets for identical securities. Level 2 values are based on significant observable market inputs, such as quoted prices for similar securities and quoted prices in inactive markets. Certain securities trading outside the U.S. may transfer between Level 1 and Level 2 due to valuation adjustments resulting from significant market movements following the close of local trading. Level 3 values are based on significant unobservable inputs that reflect the investment adviser’s determination of assumptions that market participants might reasonably use in valuing the securities. The valuation levels are not necessarily an indication of the risk or liquidity associated with the underlying investment. For example, U.S. government securities are reflected as Level 2 because the inputs used to determine fair value may not always be quoted prices in an active market. At January 31, 2016, all of the investment securities held by each fund were classified as Level 2.
4. Risk factors
Investing in each fund may involve certain risks including, but not limited to, those described below.
Market conditions — The prices of, and the income generated by, the securities held by the funds may decline — sometimes rapidly or unpredictably — due to various factors, including events or conditions affecting the general economy or particular industries; overall market changes; local, regional or global political, social or economic instability; governmental or governmental agency responses to economic conditions; and currency exchange rate, interest rate and commodity price fluctuations.
Issuer risks —The prices of, and the income generated by, securities held by the funds may decline in response to various factors directly related to the issuers of such securities, including reduced demand for an issuer’s goods or services, poor management performance and strategic initiatives such as mergers, acquisitions or dispositions and the market response to any such initiatives.
Investing in municipal securities — The yield and/or value of the fund’s investments in municipal securities may be adversely affected by events tied to the municipal securities markets, which can be very volatile and significantly impacted by unfavorable legislative or political developments and negative changes in the financial conditions of municipal securities issuers and the economy. To the extent the fund invests in obligations of a municipal issuer, the volatility, credit quality and performance of the fund may be adversely impacted by local political and economic conditions of the issuer. For example, a credit rating downgrade, bond default or bankruptcy involving an issuer within a particular state or territory could affect the market values and marketability of many or all municipal obligations of that state or territory. Income from municipal securities held by the fund could also be declared taxable because of changes in tax laws or interpretations by taxing authorities or as a result of noncompliant conduct of a municipal issuer. Additionally, the relative amount of publicly available information about municipal securities is generally less than that for corporate securities.
Investing in debt instruments — The prices of, and the income generated by, bonds and other debt securities held by the funds may be affected by changing interest rates and by changes in the effective maturities and credit ratings of these securities.
Rising interest rates will generally cause the prices of bonds and other debt securities to fall. Falling interest rates may cause an issuer to redeem, call or refinance a debt security before its stated maturity, which may result in the fund having to reinvest the proceeds in lower
| 54 | American Funds Tax-Exempt Funds |
yielding securities. Longer maturity debt securities generally have greater sensitivity to changes in interest rates and may be subject to greater price fluctuations than shorter maturity debt securities.
Bonds and other debt securities are also subject to credit risk, which is the possibility that the credit strength of an issuer will weaken and/or an issuer of a debt security will fail to make timely payments of principal or interest and the security will go into default. Lower quality debt securities generally have higher rates of interest and may be subject to greater price fluctuations than higher quality debt securities. Credit risk is gauged, in part, by the credit ratings of the debt securities in which the fund invests. However, ratings are only the opinions of the rating agencies issuing them and are not guarantees as to credit quality or an evaluation of market risk. The funds’ investment adviser relies on its own credit analysts to research issuers and issues in seeking to mitigate various credit and default risks.
Thinly traded securities — There may be little trading in the secondary market for particular bonds or other debt securities, which may make them more difficult to value, acquire or sell.
Credit and liquidity support — Changes in the credit quality of banks and financial institutions providing credit and liquidity support features with respect to securities held by the funds could cause the values of these securities to decline.
Investing in lower rated debt instruments — Lower rated bonds and other lower rated debt securities generally have higher rates of interest and involve greater risk of default or price declines due to changes in the issuer’s creditworthiness than those of higher quality debt securities. The market prices of these securities may fluctuate more than the prices of higher quality debt securities and may decline significantly in periods of general economic difficulty. These risks may be increased with respect to investments in junk bonds.
Investing in similar municipal bonds — Investing significantly in municipal obligations of issuers in the same state or backed by revenues of similar types of projects or industries may make the fund more susceptible to certain economic, political or regulatory occurrences. As a result, the potential for fluctuations in the funds’ share price may increase.
Risks of investing in municipal bonds of issuers within the state of California — Because The Tax-Exempt Fund of California invests primarily in securities of issuers within the state of California, the fund is more susceptible to factors adversely affecting issuers of California securities than a comparable municipal bond mutual fund that does not concentrate its investments in a single state. For example, in the past, California voters have passed amendments to the state’s constitution and other measures that limit the taxing and spending authority of California governmental entities, and future voter initiatives may adversely affect California municipal bonds.
Risks of investing in municipal bonds of issuers within the state of New York — Because American Funds Tax-Exempt Fund of New York invests primarily in securities of issuers within the state of New York, the fund is more susceptible to factors adversely affecting issuers of New York securities than a comparable municipal bond mutual fund that does not concentrate its investments in a single state. For example, such factors may include political policy changes, tax base erosion, state constitutional limits on tax increases, budget deficits and other financial or economic difficulties, and changes in the credit ratings assigned to New York’s municipal issuers. New York’s economy and finances may be especially vulnerable to changes in the performance of the financial services sector, which historically has been volatile.
Management — The investment adviser to the funds actively manages the funds’ investments. Consequently, the funds are subject to the risk that the methods and analyses employed by the investment adviser in this process may not produce the desired results. This could cause the funds to lose value or its investment results to lag relevant benchmarks or other funds with similar objectives.
5. Taxation and distributions
Federal income taxation — Each fund complies with the requirements under Subchapter M of the Internal Revenue Code applicable to mutual funds and intends to distribute substantially all of its net income and net capital gains each year. The funds are not subject to income taxes to the extent taxable income and net capital gains are distributed. Generally, income earned by each fund is exempt from federal income taxes; however, each fund may earn taxable income from certain investments.
As of and during the period ended January 31, 2016, none of the funds had a liability for any unrecognized tax benefits. The funds recognize interest and penalties, if any, related to unrecognized tax benefits as income tax expense in their respective statement of operations. During the period, none of the funds incurred any significant interest or penalties.
| American Funds Tax-Exempt Funds | 55 |
The funds are not subject to examination by U.S. federal tax authorities or state tax authorities for tax years before the dates shown in the following table:
| Fund | | U.S. federal
tax authority | | State
tax authority |
| American Funds Short-Term Tax-Exempt Bond Fund | | | 2011 | | | | 2010 | |
| Limited Term Tax-Exempt Bond Fund of America | | | 2011 | | | | 2010 | |
| The Tax-Exempt Bond Fund of America | | | 2011 | | | | 2010 | |
| American High-Income Municipal Bond Fund | | | 2011 | | | | 2010 | |
| The Tax-Exempt Fund of California | | | 2011 | | | | 2010 | |
| American Funds Tax-Exempt Fund of New York | | | 2011 | | | | 2010 | * |
| | | | | | | | | |
| * The year the fund commenced operations. |
Distributions — Distributions paid to shareholders are based on each fund’s net investment income and net realized gains determined on a tax basis, which may differ from net investment income and net realized gains for financial reporting purposes. These differences are due primarily to different treatment for items such as short-term capital gains and losses; capital losses related to sales of certain securities within 30 days of purchase; deferred expenses; cost of investments sold; net capital losses; amortization of premium and discounts; and income on certain investments. The fiscal year in which amounts are distributed may differ from the year in which the net investment income and net realized gains are recorded by the funds for financial reporting purposes.
As indicated in the following tables, all of the funds had capital loss carryforwards available at July 31, 2015. These will be used to offset any capital gains realized by these funds in future years through the expiration dates. Funds with a capital loss carryforward will not make distributions from capital gains while a capital loss carryforward remains.
Under the Regulated Investment Company Modernization Act of 2010 (the “Act”), net capital losses recognized after July 31, 2011, (August 31, 2011, for The Tax-Exempt Bond Fund of America and The Tax-Exempt Fund of California) may be carried forward indefinitely, and their character is retained as short-term and/or long-term losses. Previously, net capital losses were carried forward for eight years and treated as short-term losses. As a transition rule, the Act requires that post-enactment net capital losses be used before pre-enactment net capital losses.
The components of distributable earnings on a tax basis are reported as of each fund’s most recent year-end. As of July 31, 2015, the components of distributable earnings on a tax basis for each fund were as follows (dollars in thousands):
| | | American
Funds
Short-Term
Tax-Exempt
Bond Fund | | | Limited Term
Tax-Exempt
Bond Fund
of America | | | The
Tax-Exempt
Bond Fund
of America | | | American
High-Income
Municipal
Bond Fund | | | The
Tax-Exempt
Fund of
California | | | American
Funds
Tax-Exempt
Fund of
New York | |
| Undistributed tax-exempt income | | $ | 67 | | | $ | 913 | | | $ | 3,620 | | | $ | 1,770 | | | $ | 910 | | | $ | 133 | |
| Post-October capital loss deferral* | | | — | | | | — | | | | (2,670 | ) | | | — | | | | (107 | ) | | | — | |
| Capital loss carryforward: | | | | | | | | | | | | | | | | | | | | | | | | |
| No expiration | | | (777 | ) | | | (647 | ) | | | — | | | | (11,258 | ) | | | — | | | | (277 | ) |
| Expiring 2017 | | | — | | | | — | | | | — | | | | (14,384 | ) | | | (3,446 | ) | | | — | |
| Expiring 2018 | | | — | | | | — | | | | (15,678 | ) | | | (69,970 | ) | | | (30,345 | ) | | | — | |
| Expiring 2019 | | | — | | | | — | | | | — | | | | (24,408 | ) | | | — | | | | — | |
| | | $ | (777 | ) | | $ | (647 | ) | | $ | (15,678 | ) | | $ | (120,020 | ) | | $ | (33,791 | ) | | $ | (277 | ) |
| * | This deferral is considered incurred in the subsequent year. |
| 56 | American Funds Tax-Exempt Funds |
As of January 31, 2016, the tax basis unrealized appreciation (depreciation) and cost of investment securities were as follows (dollars in thousands):
| | | American
Funds
Short-Term
Tax-Exempt
Bond Fund | | | Limited Term
Tax-Exempt
Bond Fund
of America | | | The
Tax-Exempt
Bond Fund
of America | | | American
High-Income
Municipal
Bond Fund | | | The
Tax-Exempt
Fund of
California | | | American
Funds
Tax-Exempt
Fund of
New York | |
| Gross unrealized appreciation on investment securities | | $ | 7,417 | | | $ | 138,105 | | | $ | 747,378 | | | $ | 287,308 | | | $ | 129,089 | | | $ | 10,289 | |
| Gross unrealized depreciation on investment securities | | | (881 | ) | | | (970 | ) | | | (28,010 | ) | | | (49,286 | ) | | | (5,509 | ) | | | (570 | ) |
| Net unrealized appreciation on investment securities | | | 6,536 | | | | 137,135 | | | | 719,368 | | | | 238,022 | | | | 123,580 | | | | 9,719 | |
| Cost of investment securities | | | 753,167 | | | | 3,222,708 | | | | 10,726,760 | | | | 3,888,929 | | | | 1,649,092 | | | | 168,846 | |
Tax-exempt income distributions paid or accrued to shareholders of each fund were as follows (dollars in thousands):
American Funds Short-Term Tax-Exempt Bond Fund
| Share class | | Six months ended
January 31, 2016 | | | Year ended
July 31, 2015 | |
| Class A | | $ | 3,242 | | | $ | 7,392 | |
| Class F-1 | | | 36 | | | | 92 | |
| Class F-2 | | | 358 | | | | 600 | |
| Total | | $ | 3,636 | | | $ | 8,084 | |
Limited Term Tax-Exempt Bond Fund of America
| Share class | | Six months ended
January 31, 2016 | | | Year ended
July 31, 2015 | |
| Class A | | $ | 31,120 | | | $ | 62,578 | |
| Class B | | | 5 | | | | 22 | |
| Class C | | | 223 | | | | 532 | |
| Class F-1 | | | 920 | | | | 1,992 | |
| Class F-2 | | | 2,627 | | | | 5,317 | |
| Class R-6 | | | 2,686 | | | | 4,341 | |
| Total | | $ | 37,581 | | | $ | 74,782 | |
The Tax-Exempt Bond Fund of America
| Share class | | Six months ended
January 31, 2016 | | | Year ended
July 31, 2015 | |
| Class A | | $ | 122,678 | | | $ | 231,655 | |
| Class B | | | 78 | | | | 256 | |
| Class C | | | 4,361 | | | | 8,319 | |
| Class F-1 | | | 24,991 | | | | 44,346 | |
| Class F-2 | | | 18,195 | | | | 28,978 | |
| Class R-6 | | | 5,067 | | | | 7,635 | |
| Total | | $ | 175,370 | | | $ | 321,189 | |
| American Funds Tax-Exempt Funds | 57 |
American High-Income Municipal Bond Fund
| Share class | | Six months ended
January 31, 2016 | | | Year ended
July 31, 2015 | |
| Class A | | $ | 57,324 | | | $ | 104,118 | |
| Class B | | | 48 | | | | 163 | |
| Class C | | | 3,113 | | | | 5,732 | |
| Class F-1 | | | 4,384 | | | | 7,566 | |
| Class F-2 | | | 8,439 | | | | 11,686 | |
| Class R-6 | | | 4,368 | | | | 6,392 | |
| Total | | $ | 77,676 | | | $ | 135,657 | |
The Tax-Exempt Fund of California
| Share class | | Six months ended
January 31, 2016 | | | Year ended
July 31, 2015 | |
| Class A | | $ | 23,670 | | | $ | 44,830 | |
| Class B | | | 14 | | | | 47 | |
| Class C | | | 988 | | | | 1,990 | |
| Class F-1 | | | 1,050 | | | | 1,921 | |
| Class F-2 | | | 2,473 | | | | 4,555 | |
| Total | | $ | 28,195 | | | $ | 53,343 | |
American Funds Tax-Exempt Fund of New York
| Share class | | Six months ended
January 31, 2016 | | | Year ended
July 31, 2015 | |
| Class A | | $ | 1,690 | | | $ | 3,198 | |
| Class B | | | — | * | | | 1 | |
| Class C | | | 100 | | | | 176 | |
| Class F-1 | | | 22 | | | | 41 | |
| Class F-2 | | | 305 | | | | 533 | |
| Total | | $ | 2,117 | | | $ | 3,949 | |
*Amount less than one thousand.
| 58 | American Funds Tax-Exempt Funds |
6. Fees and transactions with related parties
CRMC, the funds’ investment adviser, is the parent company of American Funds Distributors,® Inc. (“AFD”), the principal underwriter of the funds’ shares, and American Funds Service Company® (“AFS”), the funds’ transfer agent. CRMC, AFD and AFS are considered related parties to each fund.
Investment advisory services — Each fund has an investment advisory and service agreement with CRMC that provides for monthly fees accrued daily. These fees are based on annual rates that generally decrease as average net asset levels increase. The agreement for each fund, except American Funds Short-Term Tax-Exempt Bond Fund, also provides for monthly fees accrued daily based on a series of decreasing rates on each fund’s monthly gross income.
The range of rates, net asset levels, gross income levels and annualized rates of average net assets for each fund are as follows:
| | | | | | | | | | | | | | | | | | | | | | | | | | | | | | | | | Annualized | |
| | | | | | | | | | | | | | | | | | | | | | | | | | | | | | | | | rates for the | |
| | | | | | | | | Net asset level | | | | | | | | | | | | | | | | | | | six months | |
| | | Rates | | (in billions) | | | Rates | | Monthly gross income | | ended | |
| Fund | | Beginning
with | | Ending
with | | Up to | | | In excess
of | | | Beginning
with | | Ending
with | | Up to | | In excess
of | | January 31,
2016 | |
| American Funds Short-Term Tax-Exempt Bond Fund | | .390 | % | | .290 | % | | $ | .20 | | | $ | 1.2 | | | | None | | | | None | | | | None | | | | None | | | | .368 | % |
| Limited Term Tax-Exempt Bond Fund of America | | .300 | | | .150 | | | | .06 | | | | 1.0 | | | | 3.00 | % | | | 2.50 | % | | $ | 3,333,333 | | | $ | 3,333,333 | | | | .238 | |
| The Tax-Exempt Bond Fund of America | | .300 | | | .120 | | | | .06 | | | | 10.0 | | | | 3.00 | | | | 2.00 | | | | 3,333,333 | | | | 8,333,333 | | | | .233 | |
| American High-Income Municipal Bond Fund | | .300 | | | .150 | | | | .06 | | | | 3.0 | | | | 3.00 | | | | 2.50 | | | | 3,333,333 | | | | 3,333,333 | | | | .308 | |
| The Tax-Exempt Fund of California | | .300 | | | .180 | | | | .06 | | | | 1.0 | | | | 3.00 | | | | 2.50 | | | | 3,333,333 | | | | 3,333,333 | | | | .311 | |
| American Funds Tax-Exempt Fund of New York | | .300 | | | .180 | | | | .06 | | | | 1.0 | | | | 3.00 | | | | 2.50 | | | | 3,333,333 | | | | 3,333,333 | | | | .343 | |
CRMC has agreed to reimburse a portion of the fees and expenses of American Funds Tax-Exempt Fund of New York during its startup period. This reimbursement may be adjusted or discontinued by CRMC, subject to any restrictions in the fund’s prospectus. For the six months ended January 31, 2016, total fees and expenses reimbursed by CRMC were $26,000. Fees and expenses in the statement of operations are presented gross of any reimbursements from CRMC.
| American Funds Tax-Exempt Funds | 59 |
Class-specific fees and expenses — Expenses that are specific to individual share classes are accrued directly to the respective share class of each fund. The principal class-specific fees and expenses are described below:
Distribution services — Each fund has plans of distribution for all share classes, except Class F-2 and Class R-6 shares, if applicable. Under the plans, each fund’s board of trustees approves certain categories of expenses that are used to finance activities primarily intended to sell fund shares and service existing accounts. The plans provide for payments based on an annualized percentage of average daily net assets. In some cases, the boards of trustees have limited the amounts that may be paid to less than the maximum allowed by the plans. All share classes with a plan may use the allotted percentage of average daily net assets to pay service fees, or to compensate AFD for paying service fees, to firms that have entered into agreements with AFD to provide certain shareholder services. The remaining amounts available to be paid under each plan are paid to dealers to compensate them for their sales activities.
| | | American Funds Short-Term | | Limited Term Tax-Exempt | | The Tax-Exempt Bond Fund | |
| | | Tax-Exempt Bond Fund | | Bond Fund of America | | of America | |
| | | Currently | | | | Currently | | | | Currently | | | |
| Share class | | approved limits | | Plan limits | | approved limits | | Plan limits | | approved limits | | Plan limits | |
| Class A | | 0.15% | | 0.15% | | | 0.30 | % | | | 0.30 | % | | | 0.25 | % | | | 0.25 | % | |
| Class B | | Not applicable | | Not applicable | | | 1.00 | | | | 1.00 | | | | 1.00 | | | | 1.00 | | |
| Class C | | Not applicable | | Not applicable | | | 1.00 | | | | 1.00 | | | | 1.00 | | | | 1.00 | | |
| Class F-1 | | 0.25 | | 0.50 | | | 0.25 | | | | 0.50 | | | | 0.25 | | | | 0.50 | | |
| | | American High-Income | | The Tax-Exempt Fund | | American Funds Tax-Exempt | |
| | | Municipal Bond Fund | | of California | | Fund of New York | |
| | | Currently | | | | Currently | | | | | | Currently | | | |
| Share class | | approved limits | | Plan limits | | approved limits | | Plan limits | | approved limits | | Plan limits | |
| Class A | | | 0.30 | % | | | 0.30 | % | | | 0.25 | % | | | 0.25 | % | | | 0.25 | % | | | 0.30 | % | |
| Class B | | | 1.00 | | | | 1.00 | | | | 1.00 | | | | 1.00 | | | | 1.00 | | | | 1.00 | | |
| Class C | | | 1.00 | | | | 1.00 | | | | 1.00 | | | | 1.00 | | | | 1.00 | | | | 1.00 | | |
| Class F-1 | | | 0.25 | | | | 0.50 | | | | 0.25 | | | | 0.50 | | | | 0.25 | | | | 0.50 | | |
For Class A shares, distribution-related expenses include the reimbursement of dealer and wholesaler commissions paid by AFD for certain shares sold without a sales charge. This share class of each fund reimburses AFD for amounts billed within the prior 15 months but only to the extent that the overall annual expense limit is not exceeded. As of January 31, 2016, unreimbursed expenses subject to reimbursement for Class A shares of each fund were as follows (dollars in thousands):
| Fund | | Class A | |
| American Funds Short-Term Tax-Exempt Bond Fund | | $ | 1,044 | |
| Limited-Term Tax-Exempt Bond Fund of America | | | — | |
| The Tax-Exempt Bond Fund of America | | | 5,357 | |
| American High-Income Municipal Bond Fund | | | — | |
| The Tax-Exempt Fund of California | | | 855 | |
| American Funds Tax-Exempt Fund of New York | | | 23 | |
Transfer agent services — Each fund has a shareholder services agreement with AFS under which each fund compensates AFS for providing transfer agent services to each of the funds’ share classes. These services include recordkeeping, shareholder communications and transaction processing. In addition, each fund reimburses AFS for amounts paid to third parties for performing transfer agent services on behalf of its respective fund shareholders.
Administrative services — Each fund has an administrative services agreement with CRMC under which each fund compensates CRMC for providing administrative services to each of the funds’ Class A, C, F and R shares, if applicable. These services include, but are not limited to, coordinating, monitoring, assisting and overseeing third parties that provide services to each fund’s shareholders. Under the agreements, Class A shares of each fund pay an annual fee of 0.01% and Class C, F and R shares of each fund, if applicable, pay an annual fee of 0.05% of their respective average daily net assets.
| 60 | American Funds Tax-Exempt Funds |
For the six months ended January 31, 2016, class-specific expenses under the agreements for each fund were as follows (dollars in thousands):
American Funds Short-Term Tax-Exempt Bond Fund
| | | Distribution | | | Transfer agent | | | Administrative | |
| Share class | | services | | | services | | | services | |
| Class A | | $496 | | | $104 | | | $33 | |
| Class F-1 | | 12 | | | 5 | | | 2 | |
| Class F-2 | | Not applicable | | | 38 | | | 18 | |
| Total class-specific expenses | | $508 | | | $147 | | | $53 | |
Limited Term Tax-Exempt Bond Fund of America
| | | Distribution | | | Transfer agent | | | Administrative | |
| Share class | | services | | | services | | | services | |
| Class A | | $3,666 | | | $417 | | | $136 | |
| Class B | | 3 | | | — | * | | Not applicable | |
| Class C | | 147 | | | 5 | | | 7 | |
| Class F-1 | | 105 | | | 48 | | | 21 | |
| Class F-2 | | Not applicable | | | 118 | | | 54 | |
| Class R-6 | | Not applicable | | | — | * | | 53 | |
| Total class-specific expenses | | $3,921 | | | $588 | | | $271 | |
The Tax-Exempt Bond Fund of America
| | | Distribution | | | Transfer agent | | | Administrative | |
| Share class | | services | | | services | | | services | |
| Class A | | $9,521 | | | $1,227 | | | $381 | |
| Class B | | 31 | | | 1 | | | Not applicable | |
| Class C | | 1,793 | | | 59 | | | 90 | |
| Class F-1 | | 2,023 | | | 954 | | | 404 | |
| Class F-2 | | Not applicable | | | 578 | | | 271 | |
| Class R-6 | | Not applicable | | | — | * | | 73 | |
| Total class-specific expenses | | $13,368 | | | $2,819 | | | $1,219 | |
American High-Income Municipal Bond Fund
| | | Distribution | | | Transfer agent | | | Administrative | |
| Share class | | services | | | services | | | services | |
| Class A | | $3,795 | | | $697 | | | $142 | |
| Class B | | 14 | | | 1 | | | Not applicable | |
| Class C | | 951 | | | 48 | | | 48 | |
| Class F-1 | | 276 | | | 126 | | | 55 | |
| Class F-2 | | Not applicable | | | 208 | | | 100 | |
| Class R-6 | | Not applicable | | | — | * | | 50 | |
| Total class-specific expenses | | $5,036 | | | $1,080 | | | $395 | |
The Tax-Exempt Fund of California
| | | Distribution | | | Transfer agent | | | Administrative | |
| Share class | | services | | | services | | | services | |
| Class A | | $1,787 | | | $157 | | | $72 | |
| Class B | | 5 | | | — | * | | Not applicable | |
| Class C | | 392 | | | 9 | | | 20 | |
| Class F-1 | | 82 | | | 35 | | | 16 | |
| Class F-2 | | Not applicable | | | 78 | | | 36 | |
| Total class-specific expenses | | $2,266 | | | $279 | | | $144 | |
American Funds Tax-Exempt Fund of New York
| | | Distribution | | | Transfer agent | | | Administrative | |
| Share class | | services | | | services | | | services | |
| Class A | | $164 | | | $22 | | | $7 | |
| Class B | | — | * | | — | * | | Not applicable | |
| Class C | | 56 | | | 2 | | | 3 | |
| Class F-1 | | — | * | | 1 | | | — | * |
| Class F-2 | | Not applicable | | | 11 | | | 6 | |
| Total class-specific expenses | | $220 | | | $36 | | | $16 | |
*Amount less than one thousand.
Trustees’ deferred compensation — Trustees who are unaffiliated with CRMC may elect to defer the cash payment of part or all of their compensation. These deferred amounts, which remain as liabilities of each fund, are treated as if invested in shares of the funds or other American Funds. These amounts represent general, unsecured liabilities of each fund and vary according to the total returns of the selected funds. Trustees’ compensation in the funds’ statement of operations reflects the current fees (either paid in cash or deferred) and a net decrease in the value of the following deferred amounts (dollars in thousands):
| | | | | | Decrease in value of | | Total trustees’ |
| Fund | | Current fees | | deferred amounts | | compensation |
| American Funds Short-Term Tax-Exempt Bond Fund | | | $ 5 | | | | $(1 | ) | | | $ 4 | |
| Limited Term Tax-Exempt Bond Fund of America | | | 18 | | | | (2 | ) | | | 16 | |
| The Tax-Exempt Bond Fund of America | | | 57 | | | | (4 | ) | | | 53 | |
| American High-Income Municipal Bond Fund | | | 19 | | | | (2 | ) | | | 17 | |
| The Tax-Exempt Fund of California | | | 9 | | | | (2 | ) | | | 7 | |
| American Funds Tax-Exempt Fund of New York | | | 1 | | | | — | * | | | 1 | |
*Amount less than one thousand.
Affiliated officers and trustees — Officers and certain trustees of the funds are or may be considered to be affiliated with CRMC, AFD and AFS. No affiliated officers or trustees received any compensation directly from the funds.
| American Funds Tax-Exempt Funds | 61 |
7. Capital share transactions
Capital share transactions in the funds were as follows (dollars and shares in thousands):
American Funds Short-Term Tax-Exempt Bond Fund
| | | Sales* | | | Reinvestments of
dividends | | | Repurchases* | | | Net increase
(decrease) | |
| Share class | | Amount | | | Shares | | | Amount | | | Shares | | | Amount | | | Shares | | | Amount | | | Shares | |
| | | | | | | | | | | | | | | | | | | | | | | | | |
| Six months ended January 31, 2016 | | | | | | | | | | | | | | | | | | | | | | | | | |
| Class A | | $ | 163,585 | | | | 16,094 | | | $ | 3,030 | | | | 298 | | | $ | (145,409 | ) | | | (14,308 | ) | | $ | 21,206 | | | | 2,084 | |
| Class F-1 | | | 3,903 | | | | 384 | | | | 36 | | | | 4 | | | | (2,517 | ) | | | (248 | ) | | | 1,422 | | | | 140 | |
| Class F-2 | | | 38,230 | | | | 3,761 | | | | 280 | | | | 28 | | | | (30,239 | ) | | | (2,977 | ) | | | 8,271 | | | | 812 | |
| Total net increase (decrease) | | $ | 205,718 | | | | 20,239 | | | $ | 3,346 | | | | 330 | | | $ | (178,165 | ) | | | (17,533 | ) | | $ | 30,899 | | | | 3,036 | |
| | | | | | | | | | | | | | | | | | | | | | | | | | | | | | | | | |
| Year ended July 31, 2015 | | | | | | | | | | | | | | | | | | | | | | | | | |
| Class A | | $ | 226,415 | | | | 22,149 | | | $ | 6,692 | | | | 655 | | | $ | (311,118 | ) | | | (30,452 | ) | | $ | (78,011 | ) | | | (7,648 | ) |
| Class F-1 | | | 3,788 | | | | 370 | | | | 92 | | | | 9 | | | | (8,533 | ) | | | (834 | ) | | | (4,653 | ) | | | (455 | ) |
| Class F-2 | | | 71,689 | | | | 7,024 | | | | 489 | | | | 48 | | | | (54,551 | ) | | | (5,348 | ) | | | 17,627 | | | | 1,724 | |
| Total net increase (decrease) | | $ | 301,892 | | | | 29,543 | | | $ | 7,273 | | | | 712 | | | $ | (374,202 | ) | | | (36,634 | ) | | $ | (65,037 | ) | | | (6,379 | ) |
Limited Term Tax-Exempt Bond Fund of America
| | | Sales* | | | Reinvestments of
dividends | | | Repurchases* | | | Net increase
(decrease) | |
| Share class | | Amount | | | Shares | | | Amount | | | Shares | | | Amount | | | Shares | | | Amount | | | Shares | |
| | | | | | | | | | | | | | | | | | | | | | | | | | | | | | | | | |
| Six months ended January 31, 2016 | | | | | | | | | | | | | | | | | |
| Class A | | $ | 355,707 | | | | 22,338 | | | $ | 29,026 | | | | 1,822 | | | $ | (262,207 | ) | | | (16,466 | ) | | $ | 122,526 | | | | 7,694 | |
| Class B | | | 105 | | | | 7 | | | | 5 | | | | — | † | | | (314 | ) | | | (20 | ) | | | (204 | ) | | | (13 | ) |
| Class C | | | 5,510 | | | | 346 | | | | 215 | | | | 13 | | | | (5,968 | ) | | | (375 | ) | | | (243 | ) | | | (16 | ) |
| Class F-1 | | | 9,430 | | | | 592 | | | | 884 | | | | 56 | | | | (9,251 | ) | | | (581 | ) | | | 1,063 | | | | 67 | |
| Class F-2 | | | 41,395 | | | | 2,600 | | | | 2,183 | | | | 137 | | | | (32,731 | ) | | | (2,055 | ) | | | 10,847 | | | | 682 | |
| Class R-6 | | | 46,863 | | | | 2,943 | | | | 2,687 | | | | 168 | | | | (8,809 | ) | | | (553 | ) | | | 40,741 | | | | 2,558 | |
| Total net increase (decrease) | | $ | 459,010 | | | | 28,826 | | | $ | 35,000 | | | | 2,196 | | | $ | (319,280 | ) | | | (20,050 | ) | | $ | 174,730 | | | | 10,972 | |
| | | | | | | | | | | | | | | | | | | | | | | | | | | | | | | | | |
| Year ended July 31, 2015 | | | | | | | | | | | | | | | | | | | | | | | | | | | | |
| Class A | | $ | 511,796 | | | | 31,861 | | | $ | 58,014 | | | | 3,614 | | | $ | (484,127 | ) | | | (30,151 | ) | | $ | 85,683 | | | | 5,324 | |
| Class B | | | 67 | | | | 4 | | | | 21 | | | | 1 | | | | (1,299 | ) | | | (81 | ) | | | (1,211 | ) | | | (76 | ) |
| Class C | | | 5,323 | | | | 331 | | | | 513 | | | | 32 | | | | (13,432 | ) | | | (836 | ) | | | (7,596 | ) | | | (473 | ) |
| Class F-1 | | | 14,553 | | | | 906 | | | | 1,901 | | | | 118 | | | | (36,973 | ) | | | (2,298 | ) | | | (20,519 | ) | | | (1,274 | ) |
| Class F-2 | | | 98,669 | | | | 6,135 | | | | 4,491 | | | | 280 | | | | (75,895 | ) | | | (4,727 | ) | | | 27,265 | | | | 1,688 | |
| Class R-6 | | | 67,930 | | | | 4,228 | | | | 4,341 | | | | 271 | | | | (12,547 | ) | | | (782 | ) | | | 59,724 | | | | 3,717 | |
| Total net increase (decrease) | | $ | 698,338 | | | | 43,465 | | | $ | 69,281 | | | | 4,316 | | | $ | (624,273 | ) | | | (38,875 | ) | | $ | 143,346 | | | | 8,906 | |
| 62 | American Funds Tax-Exempt Funds |
The Tax-Exempt Bond Fund of America
| | | Sales* | | | Reinvestments of
dividends | | | Repurchases* | | | Net increase
(decrease) | |
| Share class | | Amount | | | Shares | | | Amount | | | Shares | | | Amount | | | Shares | | | Amount | | | Shares | |
| | | | | | | | | | | | | | | | | | | | | | | | | | | | | | | | | |
| Six months ended January 31, 2016 | | | | | | | | | | | | | | | | | | | | | | | | | |
| Class A | | $ | 754,794 | | | | 57,866 | | | $ | 112,379 | | | | 8,614 | | | $ | (430,813 | ) | | | (33,066 | ) | | $ | 436,360 | | | | 33,414 | |
| Class B | | | 69 | | | | 5 | | | | 76 | | | | 6 | | | | (2,207 | ) | | | (169 | ) | | | (2,062 | ) | | | (158 | ) |
| Class C | | | 55,942 | | | | 4,288 | | | | 4,130 | | | | 317 | | | | (36,527 | ) | | | (2,805 | ) | | | 23,545 | | | | 1,800 | |
| Class F-1 | | | 326,775 | | | | 25,173 | | | | 24,734 | | | | 1,895 | | | | (169,077 | ) | | | (12,975 | ) | | | 182,432 | | | | 14,093 | |
| Class F-2 | | | 309,915 | | | | 23,765 | | | | 16,541 | | | | 1,268 | | | | (112,760 | ) | | | (8,653 | ) | | | 213,696 | | | | 16,380 | |
| Class R-6 | | | 43,920 | | | | 3,373 | | | | 5,066 | | | | 388 | | | | (6,618 | ) | | | (509 | ) | | | 42,368 | | | | 3,252 | |
| Total net increase (decrease) | | $ | 1,491,415 | | | | 114,470 | | | $ | 162,926 | | | | 12,488 | | | $ | (758,002 | ) | | | (58,177 | ) | | $ | 896,339 | | | | 68,781 | |
| | | | | | | | | | | | | | | | | | | | | | | | | | | | | | | | | |
| Year ended July 31, 2015 | | | | | | | | | | | | | | | | | | | | | | | | | |
| Class A | | $ | 1,166,527 | | | | 89,279 | | | $ | 210,997 | | | | 16,150 | | | $ | (783,919 | ) | | | (60,074 | ) | | $ | 593,605 | | | | 45,355 | |
| Class B | | | 366 | | | | 28 | | | | 248 | | | | 19 | | | | (6,082 | ) | | | (466 | ) | | | (5,468 | ) | | | (419 | ) |
| Class C | | | 83,656 | | | | 6,403 | | | | 7,868 | | | | 602 | | | | (68,383 | ) | | | (5,240 | ) | | | 23,141 | | | | 1,765 | |
| Class F-1 | | | 324,142 | | | | 24,816 | | | | 43,866 | | | | 3,358 | | | | (287,808 | ) | | | (22,060 | ) | | | 80,200 | | | | 6,114 | |
| Class F-2 | | | 446,591 | | | | 34,216 | | | | 26,012 | | | | 1,991 | | | | (145,323 | ) | | | (11,130 | ) | | | 327,280 | | | | 25,077 | |
| Class R-6 | | | 103,919 | | | | 7,954 | | | | 7,634 | | | | 584 | | | | (6,115 | ) | | | (468 | ) | | | 105,438 | | | | 8,070 | |
| Total net increase (decrease) | | $ | 2,125,201 | | | | 162,696 | | | $ | 296,625 | | | | 22,704 | | | $ | (1,297,630 | ) | | | (99,438 | ) | | $ | 1,124,196 | | | | 85,962 | |
American High-Income Municipal Bond Fund
| | | Sales* | | | Reinvestments of
dividends | | | Repurchases* | | | Net increase
(decrease) | |
| Share class | | Amount | | | Shares | | | Amount | | | Shares | | | Amount | | | Shares | | | Amount | | | Shares | |
| | | | | | | | | | | | | | | | | | | | | | | | | | | | | | | | | |
| Six months ended January 31, 2016 | | | | | | | | | | | | | | | | | |
| Class A | | $ | 401,857 | | | | 25,867 | | | $ | 52,818 | | | | 3,399 | | | $ | (183,635 | ) | | | (11,844 | ) | | $ | 271,040 | | | | 17,422 | |
| Class B | | | 215 | | | | 14 | | | | 45 | | | | 3 | | | | (1,327 | ) | | | (86 | ) | | | (1,067 | ) | | | (69 | ) |
| Class C | | | 36,458 | | | | 2,346 | | | | 2,894 | | | | 187 | | | | (19,576 | ) | | | (1,264 | ) | | | 19,776 | | | | 1,269 | |
| Class F-1 | | | 43,686 | | | | 2,816 | | | | 4,272 | | | | 275 | | | | (24,020 | ) | | | (1,549 | ) | | | 23,938 | | | | 1,542 | |
| Class F-2 | | | 192,530 | | | | 12,412 | | | | 7,391 | | | | 475 | | | | (64,291 | ) | | | (4,128 | ) | | | 135,630 | | | | 8,759 | |
| Class R-6 | | | 23,618 | | | | 1,524 | | | | 4,368 | | | | 281 | | | | (2,677 | ) | | | (174 | ) | | | 25,309 | | | | 1,631 | |
| Total net increase (decrease) | | $ | 698,364 | | | | 44,979 | | | $ | 71,788 | | | | 4,620 | | | $ | (295,526 | ) | | | (19,045 | ) | | $ | 474,626 | | | | 30,554 | |
| | | | | | | | | | | | | | | | | | | | | | | | | | | | | | | | | |
| Year ended July 31, 2015 | | | | | | | | | | | | | | | | | | | | | | | | | | | | | | | | |
| Class A | | $ | 582,004 | | | | 37,495 | | | $ | 96,061 | | | | 6,188 | | | $ | (360,143 | ) | | | (23,213 | ) | | $ | 317,922 | | | | 20,470 | |
| Class B | | | 334 | | | | 22 | | | | 154 | | | | 10 | | | | (3,271 | ) | | | (211 | ) | | | (2,783 | ) | | | (179 | ) |
| Class C | | | 55,686 | | | | 3,585 | | | | 5,320 | | | | 343 | | | | (41,042 | ) | | | (2,648 | ) | | | 19,964 | | | | 1,280 | |
| Class F-1 | | | 78,498 | | | | 5,049 | | | | 7,372 | | | | 475 | | | | (57,976 | ) | | | (3,746 | ) | | | 27,894 | | | | 1,778 | |
| Class F-2 | | | 145,866 | | | | 9,397 | | | | 9,910 | | | | 639 | | | | (59,263 | ) | | | (3,823 | ) | | | 96,513 | | | | 6,213 | |
| Class R-6 | | | 73,819 | | | | 4,754 | | | | 6,392 | | | | 412 | | | | (461 | ) | | | (30 | ) | | | 79,750 | | | | 5,136 | |
| Total net increase (decrease) | | $ | 936,207 | | | | 60,302 | | | $ | 125,209 | | | | 8,067 | | | $ | (522,156 | ) | | | (33,671 | ) | | $ | 539,260 | | | | 34,698 | |
See page 64 for footnotes.
| American Funds Tax-Exempt Funds | 63 |
The Tax-Exempt Fund of California
| | | Sales* | | | Reinvestments of
dividends | | | Repurchases* | | | Net increase
(decrease) | |
| Share class | | Amount | | | Shares | | | Amount | | | Shares | | | Amount | | | Shares | | | Amount | | | Shares | |
| | | | | | | | | | | | | | | | | | | | | | | | | | | | | | | | | |
| Six months ended January 31, 2016 | | | | | | | | | | | | | | | | | |
| Class A | | $ | 151,958 | | | | 8,561 | | | $ | 20,632 | | | | 1,162 | | | $ | (87,348 | ) | | | (4,930 | ) | | $ | 85,242 | | | | 4,793 | |
| Class B | | | 1 | | | | — | † | | | 14 | | | | 1 | | | | (589 | ) | | | (33 | ) | | | (574 | ) | | | (32 | ) |
| Class C | | | 10,714 | | | | 604 | | | | 930 | | | | 52 | | | | (9,652 | ) | | | (545 | ) | | | 1,992 | | | | 111 | |
| Class F-1 | | | 9,342 | | | | 527 | | | | 973 | | | | 55 | | | | (5,433 | ) | | | (307 | ) | | | 4,882 | | | | 275 | |
| Class F-2 | | | 25,946 | | | | 1,463 | | | | 2,093 | | | | 118 | | | | (7,926 | ) | | | (447 | ) | | | 20,113 | | | | 1,134 | |
| Total net increase (decrease) | | $ | 197,961 | | | | 11,155 | | | $ | 24,642 | | | | 1,388 | | | $ | (110,948 | ) | | | (6,262 | ) | | $ | 111,655 | | | | 6,281 | |
| | | | | | | | | | | | | | | | | | | | | | | | | | | | | | | | | |
| Year ended July 31, 2015 | | | | | | | | | | | | | | | | | | | | | | | | | | |
| Class A | | $ | 212,686 | | | | 11,982 | | | $ | 38,804 | | | | 2,186 | | | $ | (136,473 | ) | | | (7,697 | ) | | $ | 115,017 | | | | 6,471 | |
| Class B | | | 62 | | | | 3 | | | | 45 | | | | 3 | | | | (1,048 | ) | | | (59 | ) | | | (941 | ) | | | (53 | ) |
| Class C | | | 15,438 | | | | 870 | | | | 1,845 | | | | 104 | | | | (15,711 | ) | | | (888 | ) | | | 1,572 | | | | 86 | |
| Class F-1 | | | 16,450 | | | | 928 | | | | 1,796 | | | | 101 | | | | (20,701 | ) | | | (1,172 | ) | | | (2,455 | ) | | | (143 | ) |
| Class F-2 | | | 46,534 | | | | 2,624 | | | | 3,856 | | | | 217 | | | | (26,654 | ) | | | (1,501 | ) | | | 23,736 | | | | 1,340 | |
| Total net increase (decrease) | | $ | 291,170 | | | | 16,407 | | | $ | 46,346 | | | | 2,611 | | | $ | (200,587 | ) | | | (11,317 | ) | | $ | 136,929 | | | | 7,701 | |
American Funds Tax-Exempt Fund of New York
| | | Sales* | | | Reinvestments of
dividends | | | Repurchases* | | | Net increase
(decrease) | |
| Share class | | Amount | | | Shares | | | Amount | | | Shares | | | Amount | | | Shares | | | Amount | | | Shares | |
| | | | | | | | | | | | | | | | | | | | | | | | | | | | | | | | | |
| Six months ended January 31, 2016 | | | | | | | | | | | | | | | | | | | | | | | | | | | |
| Class A | | $ | 21,050 | | | | 1,960 | | | $ | 1,114 | | | | 104 | | | $ | (6,676 | ) | | | (623 | ) | | $ | 15,488 | | | | 1,441 | |
| Class B | | | — | | | | — | | | | — | † | | | — | † | | | (11 | ) | | | (1 | ) | | | (11 | ) | | | (1 | ) |
| Class C | | | 3,700 | | | | 345 | | | | 94 | | | | 9 | | | | (1,089 | ) | | | (101 | ) | | | 2,705 | | | | 253 | |
| Class F-1 | | | 191 | | | | 18 | | | | 12 | | | | 1 | | | | (182 | ) | | | (17 | ) | | | 21 | | | | 2 | |
| Class F-2 | | | 3,624 | | | | 339 | | | | 246 | | | | 22 | | | | (1,454 | ) | | | (135 | ) | | | 2,416 | | | | 226 | |
| Total net increase (decrease) | | $ | 28,565 | | | | 2,662 | | | $ | 1,466 | | | | 136 | | | $ | (9,412 | ) | | | (877 | ) | | $ | 20,619 | | | | 1,921 | |
| | | | | | | | | | | | | | | | | | | | | | | | | | | | | | | | | |
| Year ended July 31, 2015 | | | | | | | | | | | | | | | | | | | | | | | | | | | |
| Class A | | $ | 28,352 | | | | 2,636 | | | $ | 1,969 | | | | 183 | | | $ | (8,840 | ) | | | (824 | ) | | $ | 21,481 | | | | 1,995 | |
| Class B | | | 15 | | | | 1 | | | | 1 | | | | — | † | | | (23 | ) | | | (2 | ) | | | (7 | ) | | | (1 | ) |
| Class C | | | 3,231 | | | | 300 | | | | 165 | | | | 15 | | | | (1,537 | ) | | | (143 | ) | | | 1,859 | | | | 172 | |
| Class F-1 | | | 699 | | | | 65 | | | | 22 | | | | 2 | | | | (174 | ) | | | (16 | ) | | | 547 | | | | 51 | |
| Class F-2 | | | 7,365 | | | | 684 | | | | 404 | | | | 38 | | | | (3,413 | ) | | | (317 | ) | | | 4,356 | | | | 405 | |
| Total net increase (decrease) | | $ | 39,662 | | | | 3,686 | | | $ | 2,561 | | | | 238 | | | $ | (13,987 | ) | | | (1,302 | ) | | $ | 28,236 | | | | 2,622 | |
| * | Includes exchanges between share classes of the fund. |
| † | Amount less than one thousand. |
| 64 | American Funds Tax-Exempt Funds |
8. Investment transactions
Each fund made purchases and sales of investment securities, excluding short-term securities and U.S. government obligations, if any, during the six months ended January 31, 2016, as follows (dollars in thousands):
| Fund | | Purchases | | | Sales | |
| American Funds Short-Term Tax-Exempt Bond Fund | | $ | 106,694 | | | $ | 116,668 | |
| Limited Term Tax-Exempt Bond Fund of America | | | 349,759 | | | | 280,695 | |
| The Tax-Exempt Bond Fund of America | | | 1,317,328 | | | | 915,036 | |
| American High-Income Municipal Bond Fund | | | 732,134 | | | | 415,199 | |
| The Tax-Exempt Fund of California | | | 179,697 | | | | 151,820 | |
| American Funds Tax-Exempt Fund of New York | | | 45,098 | | | | 26,800 | |
9. Ownership concentration
At January 31, 2016, CRMC held aggregate ownership of 22% of the outstanding shares of American Funds Tax-Exempt Fund of New York. The ownership represents the seed money invested in the fund when it began operations on November 1, 2010.
| American Funds Tax-Exempt Funds | 65 |
Financial highlights
American Funds Short-Term Tax-Exempt Bond Fund
| | | | | | | Income (loss) from
investment operations1 | | | Dividends and distributions | | | | | | | | | | | | | | | | | | | | | |
| Period ended | | Net asset
value,
beginning
of period | | | Net
investment
income | | | Net gains
(losses) on
securities (both
realized and
unrealized) | | | Total from
investment
operations | | | Dividends
(from net
investment
income) | | | Distributions
(from capital
gains) | | | Total
dividends
and
distributions | | | Net asset
value,
end
of period | | | Total
return2 | | | Net assets,
end of period
(in millions) | | | Ratio of
expenses to
average
net assets | | | Ratio of
net income
to average
net assets | |
| Class A: | | | | | | | | | | | | | | | | | | | | | | | | | | | | | | | | | | | | | | | | | | | | | | | | |
| 1/31/20163,4 | | $ | 10.17 | | | $ | .05 | | | $ | .02 | | | $ | .07 | | | $ | (.05 | ) | | $ | — | | | $ | (.05 | ) | | $ | 10.19 | | | | .69 | %5 | | $ | 676 | | | | .59 | %6 | | | .99 | %6 |
| 7/31/2015 | | | 10.25 | | | | .11 | | | | (.08 | ) | | | .03 | | | | (.11 | ) | | | — | | | | (.11 | ) | | | 10.17 | | | | .26 | | | | 653 | | | | .58 | | | | 1.04 | |
| 7/31/2014 | | | 10.21 | | | | .11 | | | | .04 | | | | .15 | | | | (.11 | ) | | | — | | | | (.11 | ) | | | 10.25 | | | | 1.43 | | | | 737 | | | | .58 | | | | 1.04 | |
| 7/31/2013 | | | 10.32 | | | | .13 | | | | (.11 | ) | | | .02 | | | | (.13 | ) | | | — | 7 | | | (.13 | ) | | | 10.21 | | | | .16 | | | | 701 | | | | .59 | | | | 1.21 | |
| 7/31/2012 | | | 10.23 | | | | .13 | | | | .09 | | | | .22 | | | | (.13 | ) | | | — | | | | (.13 | ) | | | 10.32 | | | | 2.17 | | | | 606 | | | | .59 | | | | 1.27 | |
| 7/31/2011 | | | 10.20 | | | | .12 | | | | .03 | | | | .15 | | | | (.12 | ) | | | — | | | | (.12 | ) | | | 10.23 | | | | 1.53 | | | | 520 | | | | .60 | | | | 1.24 | |
| Class F-1: | | | | | | | | | | | | | | | | | | | | | | | | | | | | | | | | | | | | | | | | | | | | | | | | |
| 1/31/20163,4 | | | 10.17 | | | | .04 | | | | .02 | | | | .06 | | | | (.04 | ) | | | — | | | | (.04 | ) | | | 10.19 | | | | .58 | 5 | | | 11 | | | | .81 | 6 | | | .77 | 6 |
| 7/31/2015 | | | 10.25 | | | | .08 | | | | (.08 | ) | | | — | | | | (.08 | ) | | | — | | | | (.08 | ) | | | 10.17 | | | | .05 | | | | 9 | | | | .80 | | | | .83 | |
| 7/31/2014 | | | 10.21 | | | | .08 | | | | .04 | | | | .12 | | | | (.08 | ) | | | — | | | | (.08 | ) | | | 10.25 | | | | 1.19 | | | | 14 | | | | .82 | | | | .80 | |
| 7/31/2013 | | | 10.32 | | | | .10 | | | | (.11 | ) | | | (.01 | ) | | | (.10 | ) | | | — | 7 | | | (.10 | ) | | | 10.21 | | | | (.08 | ) | | | 30 | | | | .84 | | | | .96 | |
| 7/31/2012 | | | 10.23 | | | | .11 | | | | .09 | | | | .20 | | | | (.11 | ) | | | — | | | | (.11 | ) | | | 10.32 | | | | 1.98 | | | | 18 | | | | .78 | | | | 1.09 | |
| 7/31/2011 | | | 10.20 | | | | .11 | | | | .03 | | | | .14 | | | | (.11 | ) | | | — | | | | (.11 | ) | | | 10.23 | | | | 1.34 | | | | 14 | | | | .79 | | | | 1.04 | |
| Class F-2: | | | | | | | | | | | | | | | | | | | | | | | | | | | | | | | | | | | | | | | | | | | | | | | | |
| 1/31/20163,4 | | | 10.17 | | | | .05 | | | | .02 | | | | .07 | | | | (.05 | ) | | | — | | | | (.05 | ) | | | 10.19 | | | | .71 | 5 | | | 72 | | | | .55 | 6 | | | 1.03 | 6 |
| 7/31/2015 | | | 10.25 | | | | .11 | | | | (.08 | ) | | | .03 | | | | (.11 | ) | | | — | | | | (.11 | ) | | | 10.17 | | | | .29 | | | | 64 | | | | .55 | | | | 1.08 | |
| 7/31/2014 | | | 10.21 | | | | .11 | | | | .04 | | | | .15 | | | | (.11 | ) | | | — | | | | (.11 | ) | | | 10.25 | | | | 1.47 | | | | 46 | | | | .54 | | | | 1.07 | |
| 7/31/2013 | | | 10.32 | | | | .13 | | | | (.11 | ) | | | .02 | | | | (.13 | ) | | | — | 7 | | | (.13 | ) | | | 10.21 | | | | .19 | | | | 37 | | | | .56 | | | | 1.23 | |
| 7/31/2012 | | | 10.23 | | | | .14 | | | | .09 | | | | .23 | | | | (.14 | ) | | | — | | | | (.14 | ) | | | 10.32 | | | | 2.24 | | | | 15 | | | | .52 | | | | 1.33 | |
| 7/31/2011 | | | 10.20 | | | | .13 | | | | .03 | | | | .16 | | | | (.13 | ) | | | — | | | | (.13 | ) | | | 10.23 | | | | 1.58 | | | | 17 | | | | .55 | | | | 1.28 | |
| | | Six months ended
January 31, | | Year ended July 31 |
| | | 20163,4,5 | | 2015 | | 2014 | | 2013 | | 2012 | | 2011 |
| Portfolio turnover rate for all share classes | | 16% | | 38% | | 20% | | 22% | | 14% | | 12% |
| 1 | Based on average shares outstanding. |
| 2 | Total returns exclude any applicable sales charges, including contingent deferred sales charges. |
| 3 | Unaudited. |
| 4 | Based on operations for the period shown and, accordingly, is not representative of a full year. |
| 5 | Not annualized. |
| 6 | Annualized. |
| 7 | Amount less than $.01. |
See Notes to Financial Statements
| 66 | American Funds Tax-Exempt Funds |
Limited Term Tax-Exempt Bond Fund of America
| | | | | | | Income (loss) from investment operations1 | | | Dividends and distributions | | | | | | | | | | | | | | | | | | | | | |
| Period ended | | Net asset
value,
beginning
of period | | | Net
investment
income | | | Net gains
(losses) on
securities (both
realized and
unrealized) | | | Total from
investment
operations | | | Dividends
(from net
investment
income) | | | Distributions
(from capital
gains) | | | Total
dividends
and
distributions | | | Net asset
value, end
of period | | | Total
return2 | | | Net assets,
end of
period
(in millions) | | | Ratio of
expenses
to average
net assets | | | Ratio of
net income
to average
net assets | |
| Class A: | | | | | | | | | | | | | | | | | | | | | | | | | | | | | | | | | | | | | | | | | | | | | | | | |
| 1/31/20163,4 | | $ | 15.92 | | | $ | .18 | | | $ | .09 | | | $ | .27 | | | $ | (.18 | ) | | $ | — | | | $ | (.18 | ) | | $ | 16.01 | | | | 1.73 | %5 | | $ | 2,810 | | | | .56 | %6 | | | 2.27 | %6 |
| 7/31/2015 | | | 16.10 | | | | .38 | | | | (.18 | ) | | | .20 | | | | (.38 | ) | | | — | | | | (.38 | ) | | | 15.92 | | | | 1.23 | | | | 2,670 | | | | .57 | | | | 2.36 | |
| 7/31/2014 | | | 15.94 | | | | .40 | | | | .16 | | | | .56 | | | | (.40 | ) | | | — | | | | (.40 | ) | | | 16.10 | | | | 3.56 | | | | 2,615 | | | | .60 | | | | 2.51 | |
| 7/31/2013 | | | 16.36 | | | | .40 | | | | (.42 | ) | | | (.02 | ) | | | (.40 | ) | | | — | 7 | | | (.40 | ) | | | 15.94 | | | | (.13 | ) | | | 2,625 | | | | .60 | | | | 2.45 | |
| 7/31/2012 | | | 15.85 | | | | .44 | | | | .51 | | | | .95 | | | | (.44 | ) | | | — | | | | (.44 | ) | | | 16.36 | | | | 6.06 | | | | 2,549 | | | | .60 | | | | 2.72 | |
| 7/31/2011 | | | 15.78 | | | | .46 | | | | .07 | | | | .53 | | | | (.46 | ) | | | — | | | | (.46 | ) | | | 15.85 | | | | 3.41 | | | | 2,232 | | | | .60 | | | | 2.93 | |
| Class B: | | | | | | | | | | | | | | | | | | | | | | | | | | | | | | | | | | | | | | | | | | | | | | | | |
| 1/31/20163,4 | | | 15.92 | | | | .13 | | | | .09 | | | | .22 | | | | (.13 | ) | | | — | | | | (.13 | ) | | | 16.01 | | | | 1.36 | 5 | | | 1 | | | | 1.29 | 6 | | | 1.56 | 6 |
| 7/31/2015 | | | 16.10 | | | | .26 | | | | (.18 | ) | | | .08 | | | | (.26 | ) | | | — | | | | (.26 | ) | | | 15.92 | | | | .52 | | | | 1 | | | | 1.28 | | | | 1.66 | |
| 7/31/2014 | | | 15.94 | | | | .29 | | | | .16 | | | | .45 | | | | (.29 | ) | | | — | | | | (.29 | ) | | | 16.10 | | | | 2.85 | | | | 2 | | | | 1.29 | | | | 1.83 | |
| 7/31/2013 | | | 16.36 | | | | .29 | | | | (.42 | ) | | | (.13 | ) | | | (.29 | ) | | | — | 7 | | | (.29 | ) | | | 15.94 | | | | (.82 | ) | | | 3 | | | | 1.29 | | | | 1.78 | |
| 7/31/2012 | | | 15.85 | | | | .33 | | | | .51 | | | | .84 | | | | (.33 | ) | | | — | | | | (.33 | ) | | | 16.36 | | | | 5.33 | | | | 6 | | | | 1.30 | | | | 2.04 | |
| 7/31/2011 | | | 15.78 | | | | .35 | | | | .07 | | | | .42 | | | | (.35 | ) | | | — | | | | (.35 | ) | | | 15.85 | | | | 2.69 | | | | 10 | | | | 1.31 | | | | 2.24 | |
| Class C: | | | | | | | | | | | | | | | | | | | | | | | | | | | | | | | | | | | | | | | | | | | | | | | | |
| 1/31/20163,4 | | | 15.92 | | | | .12 | | | | .09 | | | | .21 | | | | (.12 | ) | | | — | | | | (.12 | ) | | | 16.01 | | | | 1.33 | 5 | | | 30 | | | | 1.33 | 6 | | | 1.51 | 6 |
| 7/31/2015 | | | 16.10 | | | | .26 | | | | (.18 | ) | | | .08 | | | | (.26 | ) | | | — | | | | (.26 | ) | | | 15.92 | | | | .47 | | | | 30 | | | | 1.33 | | | | 1.60 | |
| 7/31/2014 | | | 15.94 | | | | .28 | | | | .16 | | | | .44 | | | | (.28 | ) | | | — | | | | (.28 | ) | | | 16.10 | | | | 2.80 | | | | 38 | | | | 1.34 | | | | 1.78 | |
| 7/31/2013 | | | 16.36 | | | | .28 | | | | (.42 | ) | | | (.14 | ) | | | (.28 | ) | | | — | 7 | | | (.28 | ) | | | 15.94 | | | | (.87 | ) | | | 49 | | | | 1.34 | | | | 1.72 | |
| 7/31/2012 | | | 15.85 | | | | .32 | | | | .51 | | | | .83 | | | | (.32 | ) | | | — | | | | (.32 | ) | | | 16.36 | | | | 5.27 | | | | 75 | | | | 1.34 | | | | 1.99 | |
| 7/31/2011 | | | 15.78 | | | | .34 | | | | .07 | | | | .41 | | | | (.34 | ) | | | — | | | | (.34 | ) | | | 15.85 | | | | 2.64 | | | | 69 | | | | 1.36 | | | | 2.19 | |
| Class F-1: | | | | | | | | | | | | | | | | | | | | | | | | | | | | | | | | | | | | | | | | | | | | | | | | |
| 1/31/20163,4 | | | 15.92 | | | | .17 | | | | .09 | | | | .26 | | | | (.17 | ) | | | — | | | | (.17 | ) | | | 16.01 | | | | 1.67 | 5 | | | 85 | | | | .67 | 6 | | | 2.17 | 6 |
| 7/31/2015 | | | 16.10 | | | | .36 | | | | (.18 | ) | | | .18 | | | | (.36 | ) | | | — | | | | (.36 | ) | | | 15.92 | | | | 1.13 | | | | 84 | | | | .67 | | | | 2.27 | |
| 7/31/2014 | | | 15.94 | | | | .39 | | | | .16 | | | | .55 | | | | (.39 | ) | | | — | | | | (.39 | ) | | | 16.10 | | | | 3.49 | | | | 105 | | | | .67 | | | | 2.45 | |
| 7/31/2013 | | | 16.36 | | | | .39 | | | | (.42 | ) | | | (.03 | ) | | | (.39 | ) | | | — | 7 | | | (.39 | ) | | | 15.94 | | | | (.22 | ) | | | 122 | | | | .69 | | | | 2.37 | |
| 7/31/2012 | | | 15.85 | | | | .43 | | | | .51 | | | | .94 | | | | (.43 | ) | | | — | | | | (.43 | ) | | | 16.36 | | | | 6.00 | | | | 132 | | | | .65 | | | | 2.67 | |
| 7/31/2011 | | | 15.78 | | | | .45 | | | | .07 | | | | .52 | | | | (.45 | ) | | | — | | | | (.45 | ) | | | 15.85 | | | | 3.37 | | | | 104 | | | | .65 | | | | 2.89 | |
| Class F-2: | | | | | | | | | | | | | | | | | | | | | | | | | | | | | | | | | | | | | | | | | | | | | | | | |
| 1/31/20163,4 | | | 15.92 | | | | .20 | | | | .09 | | | | .29 | | | | (.20 | ) | | | — | | | | (.20 | ) | | | 16.01 | | | | 1.80 | 5 | | | 220 | | | | .41 | 6 | | | 2.43 | 6 |
| 7/31/2015 | | | 16.10 | | | | .40 | | | | (.18 | ) | | | .22 | | | | (.40 | ) | | | — | | | | (.40 | ) | | | 15.92 | | | | 1.39 | | | | 208 | | | | .41 | | | | 2.52 | |
| 7/31/2014 | | | 15.94 | | | | .43 | | | | .16 | | | | .59 | | | | (.43 | ) | | | — | | | | (.43 | ) | | | 16.10 | | | | 3.75 | | | | 183 | | | | .42 | | | | 2.69 | |
| 7/31/2013 | | | 16.36 | | | | .43 | | | | (.42 | ) | | | .01 | | | | (.43 | ) | | | — | 7 | | | (.43 | ) | | | 15.94 | | | | .05 | | | | 148 | | | | .42 | | | | 2.64 | |
| 7/31/2012 | | | 15.85 | | | | .47 | | | | .51 | | | | .98 | | | | (.47 | ) | | | — | | | | (.47 | ) | | | 16.36 | | | | 6.28 | | | | 162 | | | | .38 | | | | 2.94 | |
| 7/31/2011 | | | 15.78 | | | | .49 | | | | .07 | | | | .56 | | | | (.49 | ) | | | — | | | | (.49 | ) | | | 15.85 | | | | 3.65 | | | | 132 | | | | .38 | | | | 3.15 | |
| Class R-6: | | | | | | | | | | | | | | | | | | | | | | | | | | | | | | | | | | | | | | | | | | | | | | | | |
| 1/31/20163,4 | | | 15.92 | | | | .20 | | | | .09 | | | | .29 | | | | (.20 | ) | | | — | | | | (.20 | ) | | | 16.01 | | | | 1.86 | 5 | | | 233 | | | | .30 | 6 | | | 2.53 | 6 |
| 7/31/2015 | | | 16.10 | | | | .42 | | | | (.18 | ) | | | .24 | | | | (.42 | ) | | | — | | | | (.42 | ) | | | 15.92 | | | | 1.50 | | | | 190 | | | | .31 | | | | 2.62 | |
| 7/31/2014 | | | 15.94 | | | | .45 | | | | .16 | | | | .61 | | | | (.45 | ) | | | — | | | | (.45 | ) | | | 16.10 | | | | 3.86 | | | | 133 | | | | .31 | | | | 2.80 | |
| 7/31/2013 | | | 16.36 | | | | .45 | | | | (.42 | ) | | | .03 | | | | (.45 | ) | | | — | 7 | | | (.45 | ) | | | 15.94 | | | | .16 | | | | 132 | | | | .31 | | | | 2.72 | |
| 7/31/20124,8 | | | 16.32 | | | | .10 | | | | .05 | | | | .15 | | | | (.11 | ) | | | — | | | | (.11 | ) | | | 16.36 | | | | .90 | 5 | | | 43 | | | | .07 | 5 | | | .64 | 5 |
| | | Six months ended
January 31, | | Year ended July 31 |
| | | 20163,4,5 | | 2015 | | 2014 | | 2013 | | 2012 | | 2011 |
| Portfolio turnover rate for all share classes | | 9% | | 19% | | 9% | | 13% | | 9% | | 14% |
| 1 | Based on average shares outstanding. |
| 2 | Total returns exclude any applicable sales charges, including contingent deferred sales charges. |
| 3 | Unaudited. |
| 4 | Based on operations for the period shown and, accordingly, is not representative of a full year. |
| 5 | Not annualized. |
| 6 | Annualized. |
| 7 | Amount less than $.01. |
| 8 | Class R-6 shares were offered beginning May 11, 2012. |
See Notes to Financial Statements
| American Funds Tax-Exempt Funds | 67 |
Financial highlights (continued)
The Tax-Exempt Bond Fund of America
| | | | | | Income (loss) from investment operations1 | | | | | | | | | | | | | | | | | | | |
| Period ended | | Net asset
value,
beginning
of period | | | Net
investment
income | | | Net gains
(losses) on
securities (both
realized and
unrealized) | | | Total from
investment
operations | | | Dividends
(from net
investment
income) | | | Net asset
value,
end
of period | | | Total
return2 | | | Net assets,
end of period
(in millions) | | | Ratio of
expenses
to average
net assets | | | Ratio of
net income
to average
net assets | |
| Class A: | | | | | | | | | | | | | | | | | | | | | | | | | | | | | | | | | | | | | | | | |
| 1/31/20163,4 | | $ | 12.96 | | | $ | .21 | | | $ | .22 | | | $ | .43 | | | $ | (.21 | ) | | $ | 13.18 | | | | 3.35 | %5 | | $ | 7,948 | | | | .54 | %6 | | | 3.22 | %6 |
| 7/31/2015 | | | 12.92 | | | | .42 | | | | .04 | | | | .46 | | | | (.42 | ) | | | 12.96 | | | | 3.62 | | | | 7,385 | | | | .54 | | | | 3.28 | |
| 7/31/2014 | | | 12.44 | | | | .45 | | | | .48 | | | | .93 | | | | (.45 | ) | | | 12.92 | | | | 7.60 | | | | 6,772 | | | | .56 | | | | 3.57 | |
| 7/31/20134,7 | | | 13.08 | | | | .40 | | | | (.64 | ) | | | (.24 | ) | | | (.40 | ) | | | 12.44 | | | | (1.93 | )5 | | | 6,984 | | | | .55 | 6 | | | 3.35 | 6 |
| 8/31/2012 | | | 12.26 | | | | .47 | | | | .82 | | | | 1.29 | | | | (.47 | ) | | | 13.08 | | | | 10.71 | | | | 7,445 | | | | .55 | | | | 3.73 | |
| 8/31/2011 | | | 12.53 | | | | .48 | | | | (.27 | ) | | | .21 | | | | (.48 | ) | | | 12.26 | | | | 1.85 | | | | 6,557 | | | | .55 | | | | 4.01 | |
| Class B: | | | | | | | | | | | | | | | | | | | | | | | | | | | | | | | | | | | | | | | | |
| 1/31/20163,4 | | | 12.96 | | | | .16 | | | | .22 | | | | .38 | | | | (.16 | ) | | | 13.18 | | | | 2.97 | 5 | | | 5 | | | | 1.28 | 6 | | | 2.49 | 6 |
| 7/31/2015 | | | 12.92 | | | | .33 | | | | .04 | | | | .37 | | | | (.33 | ) | | | 12.96 | | | | 2.85 | | | | 7 | | | | 1.28 | | | | 2.55 | |
| 7/31/2014 | | | 12.44 | | | | .35 | | | | .48 | | | | .83 | | | | (.35 | ) | | | 12.92 | | | | 6.81 | | | | 13 | | | | 1.30 | | | | 2.84 | |
| 7/31/20134,7 | | | 13.08 | | | | .31 | | | | (.64 | ) | | | (.33 | ) | | | (.31 | ) | | | 12.44 | | | | (2.59 | )5 | | | 20 | | | | 1.30 | 6 | | | 2.61 | 6 |
| 8/31/2012 | | | 12.26 | | | | .38 | | | | .82 | | | | 1.20 | | | | (.38 | ) | | | 13.08 | | | | 9.90 | | | | 30 | | | | 1.29 | | | | 3.01 | |
| 8/31/2011 | | | 12.53 | | | | .39 | | | | (.27 | ) | | | .12 | | | | (.39 | ) | | | 12.26 | | | | 1.08 | | | | 40 | | | | 1.30 | | | | 3.26 | |
| Class C: | | | | | | | | | | | | | | | | | | | | | | | | | | | | | | | | | | | | | | | | |
| 1/31/20163,4 | | | 12.96 | | | | .16 | | | | .22 | | | | .38 | | | | (.16 | ) | | | 13.18 | | | | 2.95 | 5 | | | 379 | | | | 1.33 | 6 | | | 2.43 | 6 |
| 7/31/2015 | | | 12.92 | | | | .32 | | | | .04 | | | | .36 | | | | (.32 | ) | | | 12.96 | | | | 2.80 | | | | 349 | | | | 1.33 | | | | 2.50 | |
| 7/31/2014 | | | 12.44 | | | | .35 | | | | .48 | | | | .83 | | | | (.35 | ) | | | 12.92 | | | | 6.75 | | | | 325 | | | | 1.35 | | | | 2.79 | |
| 7/31/20134,7 | | | 13.08 | | | | .31 | | | | (.64 | ) | | | (.33 | ) | | | (.31 | ) | | | 12.44 | | | | (2.64 | )5 | | | 375 | | | | 1.34 | 6 | | | 2.56 | 6 |
| 8/31/2012 | | | 12.26 | | | | .37 | | | | .82 | | | | 1.19 | | | | (.37 | ) | | | 13.08 | | | | 9.85 | | | | 420 | | | | 1.34 | | | | 2.94 | |
| 8/31/2011 | | | 12.53 | | | | .39 | | | | (.27 | ) | | | .12 | | | | (.39 | ) | | | 12.26 | | | | 1.03 | | | | 370 | | | | 1.35 | | | | 3.21 | |
| Class F-1: | | | | | | | | | | | | | | | | | | | | | | | | | | | | | | | | | | | | | | | | |
| 1/31/20163,4 | | | 12.96 | | | | .20 | | | | .22 | | | | .42 | | | | (.20 | ) | | | 13.18 | | | | 3.29 | 5 | | | 1,684 | | | | .66 | 6 | | | 3.09 | 6 |
| 7/31/2015 | | | 12.92 | | | | .41 | | | | .04 | | | | .45 | | | | (.41 | ) | | | 12.96 | | | | 3.49 | | | | 1,474 | | | | .67 | | | | 3.16 | |
| 7/31/2014 | | | 12.44 | | | | .43 | | | | .48 | | | | .91 | | | | (.43 | ) | | | 12.92 | | | | 7.46 | | | | 1,389 | | | | .68 | | | | 3.46 | |
| 7/31/20134,7 | | | 13.08 | | | | .39 | | | | (.64 | ) | | | (.25 | ) | | | (.39 | ) | | | 12.44 | | | | (2.05 | )5 | | | 1,659 | | | | .68 | 6 | | | 3.21 | 6 |
| 8/31/2012 | | | 12.26 | | | | .46 | | | | .82 | | | | 1.28 | | | | (.46 | ) | | | 13.08 | | | | 10.59 | | | | 1,526 | | | | .66 | | | | 3.62 | |
| 8/31/2011 | | | 12.53 | | | | .47 | | | | (.27 | ) | | | .20 | | | | (.47 | ) | | | 12.26 | | | | 1.73 | | | | 1,356 | | | | .66 | | | | 3.90 | |
| Class F-2: | | | | | | | | | | | | | | | | | | | | | | | | | | | | | | | | | | | | | | | | |
| 1/31/20163,4 | | | 12.96 | | | | .22 | | | | .22 | | | | .44 | | | | (.22 | ) | | | 13.18 | | | | 3.42 | 5 | | | 1,222 | | | | .40 | 6 | | | 3.36 | 6 |
| 7/31/2015 | | | 12.92 | | | | .44 | | | | .04 | | | | .48 | | | | (.44 | ) | | | 12.96 | | | | 3.76 | | | | 990 | | | | .41 | | | | 3.42 | |
| 7/31/2014 | | | 12.44 | | | | .46 | | | | .48 | | | | .94 | | | | (.46 | ) | | | 12.92 | | | | 7.74 | | | | 662 | | | | .42 | | | | 3.70 | |
| 7/31/20134,7 | | | 13.08 | | | | .42 | | | | (.64 | ) | | | (.22 | ) | | | (.42 | ) | | | 12.44 | | | | (1.81 | )5 | | | 327 | | | | .42 | 6 | | | 3.49 | 6 |
| 8/31/2012 | | | 12.26 | | | | .49 | | | | .82 | | | | 1.31 | | | | (.49 | ) | | | 13.08 | | | | 10.88 | | | | 239 | | | | .40 | | | | 3.87 | |
| 8/31/2011 | | | 12.53 | | | | .50 | | | | (.27 | ) | | | .23 | | | | (.50 | ) | | | 12.26 | | | | 1.99 | | | | 196 | | | | .41 | | | | 4.15 | |
| Class R-6: | | | | | | | | | | | | | | | | | | | | | | | | | | | | | | | | | | | | | | | | |
| 1/31/20163,4 | | | 12.96 | | | | .23 | | | | .22 | | | | .45 | | | | (.23 | ) | | | 13.18 | | | | 3.48 | 5 | | | 317 | | | | .30 | 6 | | | 3.47 | 6 |
| 7/31/2015 | | | 12.92 | | | | .46 | | | | .04 | | | | .50 | | | | (.46 | ) | | | 12.96 | | | | 3.86 | | | | 270 | | | | .30 | | | | 3.52 | |
| 7/31/2014 | | | 12.44 | | | | .48 | | | | .48 | | | | .96 | | | | (.48 | ) | | | 12.92 | | | | 7.86 | | | | 165 | | | | .31 | | | | 3.81 | |
| 7/31/20134,7 | | | 13.08 | | | | .43 | | | | (.64 | ) | | | (.21 | ) | | | (.43 | ) | | | 12.44 | | | | (1.71 | )5 | | | 115 | | | | .31 | 6 | | | 3.58 | 6 |
| 8/31/20124,8 | | | 12.94 | | | | .14 | | | | .15 | | | | .29 | | | | (.15 | ) | | | 13.08 | | | | 2.25 | 5 | | | 42 | | | | .09 | 5 | | | 1.15 | 5 |
| | | Six months ended
January 31, | | Year ended
July 31 | | For the period
9/1/2012 to | | Year ended
August 31 |
| | | 20163,4,5 | | 2015 | | 2014 | | 7/31/20134,5,7 | | 2012 | | 2011 |
| Portfolio turnover rate for all share classes | | 9% | | 14% | | 10% | | 16% | | 14% | | 12% |
| 1 | Based on average shares outstanding. |
| 2 | Total returns exclude any applicable sales charges, including contingent deferred sales charges. |
| 3 | Unaudited. |
| 4 | Based on operations for the period shown and, accordingly, is not representative of a full year. |
| 5 | Not annualized. |
| 6 | Annualized. |
| 7 | In 2013, the fund changed its fiscal year-end from August to July. |
| 8 | Class R-6 shares were offered beginning May 11, 2012. |
See Notes to Financial Statements
| 68 | American Funds Tax-Exempt Funds |
American High-Income Municipal Bond Fund
| | | | | | Income (loss) from investment operations1 | | | | | | | | | | | | | | | | | | | |
| Period ended | | Net asset
value,
beginning
of period | | | Net
investment
income | | | Net gains
(losses) on
securities (both
realized and
unrealized) | | | Total from
investment
operations | | | Dividends
(from net
investment
income) | | | Net asset
value,
end
of period | | | Total
return2 | | | Net assets,
end of period
(in millions) | | | Ratio of
expenses
to average
net assets | | | Ratio of
net income
to average
net assets | |
| Class A: | | | | | | | | | | | | | | | | | | | | | | | | | | | | | | | | | | | | | | | | |
| 1/31/20163,4 | | $ | 15.40 | | | $ | .33 | | | $ | .32 | | | $ | .65 | | | $ | (.32 | ) | | $ | 15.73 | | | | 4.23 | %5 | | $ | 3,033 | | | | .67 | %6 | | | 4.13 | %6 |
| 7/31/2015 | | | 15.22 | | | | .64 | | | | .17 | | | | .81 | | | | (.63 | ) | | | 15.40 | | | | 5.34 | | | | 2,700 | | | | .68 | | | | 4.13 | |
| 7/31/2014 | | | 14.48 | | | | .68 | | | | .73 | | | | 1.41 | | | | (.67 | ) | | | 15.22 | | | | 9.99 | | | | 2,357 | | | | .68 | | | | 4.59 | |
| 7/31/2013 | | | 15.13 | | | | .63 | | | | (.65 | ) | | | (.02 | ) | | | (.63 | ) | | | 14.48 | | | | (.25 | ) | | | 2,246 | | | | .69 | | | | 4.14 | |
| 7/31/2012 | | | 13.78 | | | | .66 | | | | 1.35 | | | | 2.01 | | | | (.66 | ) | | | 15.13 | | | | 14.98 | | | | 2,286 | | | | .68 | | | | 4.64 | |
| 7/31/2011 | | | 13.97 | | | | .67 | | | | (.19 | ) | | | .48 | | | | (.67 | ) | | | 13.78 | | | | 3.57 | | | | 1,849 | | | | .64 | | | | 4.86 | |
| Class B: | | | | | | | | | | | | | | | | | | | | | | | | | | | | | | | | | | | | | | | | |
| 1/31/20163,4 | | | 15.40 | | | | .27 | | | | .32 | | | | .59 | | | | (.26 | ) | | | 15.73 | | | | 3.86 | 5 | | | 2 | | | | 1.39 | 6 | | | 3.43 | 6 |
| 7/31/2015 | | | 15.22 | | | | .53 | | | | .17 | | | | .70 | | | | (.52 | ) | | | 15.40 | | | | 4.60 | | | | 4 | | | | 1.39 | | | | 3.43 | |
| 7/31/2014 | | | 14.48 | | | | .57 | | | | .73 | | | | 1.30 | | | | (.56 | ) | | | 15.22 | | | | 9.17 | | | | 6 | | | | 1.44 | | | | 3.87 | |
| 7/31/2013 | | | 15.13 | | | | .52 | | | | (.65 | ) | | | (.13 | ) | | | (.52 | ) | | | 14.48 | | | | (.97 | ) | | | 10 | | | | 1.42 | | | | 3.42 | |
| 7/31/2012 | | | 13.78 | | | | .56 | | | | 1.35 | | | | 1.91 | | | | (.56 | ) | | | 15.13 | | | | 14.14 | | | | 16 | | | | 1.42 | | | | 3.96 | |
| 7/31/2011 | | | 13.97 | | | | .56 | | | | (.19 | ) | | | .37 | | | | (.56 | ) | | | 13.78 | | | | 2.78 | | | | 21 | | | | 1.41 | | | | 4.07 | |
| Class C: | | | | | | | | | | | | | | | | | | | | | | | | | | | | | | | | | | | | | | | | |
| 1/31/20163,4 | | | 15.40 | | | | .27 | | | | .32 | | | | .59 | | | | (.26 | ) | | | 15.73 | | | | 3.84 | 5 | | | 206 | | | | 1.44 | 6 | | | 3.36 | 6 |
| 7/31/2015 | | | 15.22 | | | | .52 | | | | .17 | | | | .69 | | | | (.51 | ) | | | 15.40 | | | | 4.55 | | | | 182 | | | | 1.44 | | | | 3.37 | |
| 7/31/2014 | | | 14.48 | | | | .56 | | | | .73 | | | | 1.29 | | | | (.55 | ) | | | 15.22 | | | | 9.12 | | | | 161 | | | | 1.48 | | | | 3.80 | |
| 7/31/2013 | | | 15.13 | | | | .52 | | | | (.65 | ) | | | (.13 | ) | | | (.52 | ) | | | 14.48 | | | | (1.02 | ) | | | 161 | | | | 1.46 | | | | 3.37 | |
| 7/31/2012 | | | 13.78 | | | | .55 | | | | 1.35 | | | | 1.90 | | | | (.55 | ) | | | 15.13 | | | | 14.09 | | | | 170 | | | | 1.46 | | | | 3.86 | |
| 7/31/2011 | | | 13.97 | | | | .56 | | | | (.19 | ) | | | .37 | | | | (.56 | ) | | | 13.78 | | | | 2.73 | | | | 137 | | | | 1.46 | | | | 4.03 | |
| Class F-1: | | | | | | | | | | | | | | | | | | | | | | | | | | | | | | | | | | | | | | | | |
| 1/31/20163,4 | | | 15.40 | | | | .32 | | | | .32 | | | | .64 | | | | (.31 | ) | | | 15.73 | | | | 4.19 | 5 | | | 236 | | | | .75 | 6 | | | 4.05 | 6 |
| 7/31/2015 | | | 15.22 | | | | .62 | | | | .17 | | | | .79 | | | | (.61 | ) | | | 15.40 | | | | 5.27 | | | | 207 | | | | .75 | | | | 4.06 | |
| 7/31/2014 | | | 14.48 | | | | .66 | | | | .73 | | | | 1.39 | | | | (.65 | ) | | | 15.22 | | | | 9.87 | | | | 178 | | | | .79 | | | | 4.49 | |
| 7/31/2013 | | | 15.13 | | | | .62 | | | | (.65 | ) | | | (.03 | ) | | | (.62 | ) | | | 14.48 | | | | (.35 | ) | | | 172 | | | | .79 | | | | 4.04 | |
| 7/31/2012 | | | 13.78 | | | | .65 | | | | 1.35 | | | | 2.00 | | | | (.65 | ) | | | 15.13 | | | | 14.89 | | | | 191 | | | | .76 | | | | 4.56 | |
| 7/31/2011 | | | 13.97 | | | | .65 | | | | (.19 | ) | | | .46 | | | | (.65 | ) | | | 13.78 | | | | 3.45 | | | | 146 | | | | .76 | | | | 4.73 | |
| Class F-2: | | | | | | | | | | | | | | | | | | | | | | | | | | | | | | | | | | | | | | | | |
| 1/31/20163,4 | | | 15.40 | | | | .34 | | | | .32 | | | | .66 | | | | (.33 | ) | | | 15.73 | | | | 4.33 | 5 | | | 466 | | | | .50 | 6 | | | 4.30 | 6 |
| 7/31/2015 | | | 15.22 | | | | .66 | | | | .17 | | | | .83 | | | | (.65 | ) | | | 15.40 | | | | 5.53 | | | | 321 | | | | .49 | | | | 4.32 | |
| 7/31/2014 | | | 14.48 | | | | .70 | | | | .73 | | | | 1.43 | | | | (.69 | ) | | | 15.22 | | | | 10.15 | | | | 223 | | | | .53 | | | | 4.71 | |
| 7/31/2013 | | | 15.13 | | | | .66 | | | | (.65 | ) | | | .01 | | | | (.66 | ) | | | 14.48 | | | | (.09 | ) | | | 126 | | | | .52 | | | | 4.31 | |
| 7/31/2012 | | | 13.78 | | | | .69 | | | | 1.35 | | | | 2.04 | | | | (.69 | ) | | | 15.13 | | | | 15.20 | | | | 87 | | | | .49 | | | | 4.81 | |
| 7/31/2011 | | | 13.97 | | | | .69 | | | | (.19 | ) | | | .50 | | | | (.69 | ) | | | 13.78 | | | | 3.74 | | | | 58 | | | | .48 | | | | 5.03 | |
| Class R-6: | | | | | | | | | | | | | | | | | | | | | | | | | | | | | | | | | | | | | | | | |
| 1/31/20163,4 | | | 15.40 | | | | .35 | | | | .32 | | | | .67 | | | | (.34 | ) | | | 15.73 | | | | 4.38 | 5 | | | 218 | | | | .39 | 6 | | | 4.41 | 6 |
| 7/31/2015 | | | 15.22 | | | | .68 | | | | .17 | | | | .85 | | | | (.67 | ) | | | 15.40 | | | | 5.64 | | | | 188 | | | | .39 | | | | 4.42 | |
| 7/31/2014 | | | 14.48 | | | | .72 | | | | .73 | | | | 1.45 | | | | (.71 | ) | | | 15.22 | | | | 10.27 | | | | 108 | | | | .42 | | | | 4.82 | |
| 7/31/2013 | | | 15.13 | | | | .68 | | | | (.65 | ) | | | .03 | | | | (.68 | ) | | | 14.48 | | | | .02 | | | | 58 | | | | .40 | | | | 4.44 | |
| 7/31/20124,7 | | | 14.86 | | | | .14 | | | | .28 | | | | .42 | | | | (.15 | ) | | | 15.13 | | | | 2.85 | 5 | | | 13 | | | | .08 | 5 | | | 1.00 | 5 |
| | | Six months ended
January 31, | | Year ended July 31 |
| | | 20163,4,5 | | 2015 | | 2014 | | 2013 | | 2012 | | 2011 |
| Portfolio turnover rate for all share classes | | 11% | | 23% | | 24% | | 25% | | 20% | | 18% |
| 1 | Based on average shares outstanding. |
| 2 | Total returns exclude any applicable sales charges, including contingent deferred sales charges. |
| 3 | Unaudited. |
| 4 | Based on operations for the period shown and, accordingly, is not representative of a full year. |
| 5 | Not annualized. |
| 6 | Annualized. |
| 7 | Class R-6 shares were offered beginning May 11, 2012. |
See Notes to Financial Statements
| American Funds Tax-Exempt Funds | 69 |
Financial highlights (continued)
The Tax-Exempt Fund of California
| | | | | | Income (loss) from investment operations1 | | | | | | | | | | | | | | | | | | | |
| Period ended | | Net asset
value,
beginning
of period | | | Net
investment
income | | | Net gains
(losses) on
securities (both
realized and
unrealized) | | | Total from
investment
operations | | | Dividends
(from net
investment
income) | | | Net asset
value,
end
of period | | | Total
return2 | | | Net assets,
end of period
(in millions) | | | Ratio of
expenses
to average
net assets | | | Ratio of
net income
to average
net assets | |
| Class A: | | | | | | | | | | | | | | | | | | | | | | | | | | | | | | | | | | | | | | | | |
| 1/31/20163,4 | | $ | 17.62 | | | $ | .30 | | | $ | .32 | | | $ | .62 | | | $ | (.30 | ) | | $ | 17.94 | | | | 3.52 | %5 | | $ | 1,498 | | | | .61 | %6 | | | 3.33 | %6 |
| 7/31/2015 | | | 17.52 | | | | .60 | | | | .09 | | | | .69 | | | | (.59 | ) | | | 17.62 | | | | 3.98 | | | | 1,386 | | | | .62 | | | | 3.38 | |
| 7/31/2014 | | | 16.72 | | | | .63 | | | | .80 | | | | 1.43 | | | | (.63 | ) | | | 17.52 | | | | 8.72 | | | | 1,265 | | | | .63 | | | | 3.72 | |
| 7/31/20134,7 | | | 17.54 | | | | .59 | | | | (.82 | ) | | | (.23 | ) | | | (.59 | ) | | | 16.72 | | | | (1.45 | )5 | | | 1,250 | | | | .63 | 6 | | | 3.64 | 6 |
| 8/31/2012 | | | 16.32 | | | | .66 | | | | 1.22 | | | | 1.88 | | | | (.66 | ) | | | 17.54 | | | | 11.70 | | | | 1,334 | | | | .63 | | | | 3.89 | |
| 8/31/2011 | | | 16.63 | | | | .65 | | | | (.31 | ) | | | .34 | | | | (.65 | ) | | | 16.32 | | | | 2.24 | | | | 1,218 | | | | .64 | | | | 4.08 | |
| Class B: | | | | | | | | | | | | | | | | | | | | | | | | | | | | | | | | | | | | | | | | |
| 1/31/20163,4 | | | 17.62 | | | | .23 | | | | .32 | | | | .55 | | | | (.23 | ) | | | 17.94 | | | | 3.14 | 5 | | | 1 | | | | 1.35 | 6 | | | 2.61 | 6 |
| 7/31/2015 | | | 17.52 | | | | .47 | | | | .09 | | | | .56 | | | | (.46 | ) | | | 17.62 | | | | 3.22 | | | | 1 | | | | 1.35 | | | | 2.65 | |
| 7/31/2014 | | | 16.72 | | | | .51 | | | | .79 | | | | 1.30 | | | | (.50 | ) | | | 17.52 | | | | 7.93 | | | | 2 | | | | 1.38 | | | | 3.00 | |
| 7/31/20134,7 | | | 17.54 | | | | .47 | | | | (.82 | ) | | | (.35 | ) | | | (.47 | ) | | | 16.72 | | | | (2.12 | )5 | | | 3 | | | | 1.37 | 6 | | | 2.90 | 6 |
| 8/31/2012 | | | 16.32 | | | | .53 | | | | 1.22 | | | | 1.75 | | | | (.53 | ) | | | 17.54 | | | | 10.89 | | | | 5 | | | | 1.37 | | | | 3.17 | |
| 8/31/2011 | | | 16.63 | | | | .53 | | | | (.31 | ) | | | .22 | | | | (.53 | ) | | | 16.32 | | | | 1.48 | | | | 7 | | | | 1.39 | | | | 3.33 | |
| Class C: | | | | | | | | | | | | | | | | | | | | | | | | | | | | | | | | | | | | | | | | |
| 1/31/20163,4 | | | 17.62 | | | | .22 | | | | .32 | | | | .54 | | | | (.22 | ) | | | 17.94 | | | | 3.11 | 5 | | | 81 | | | | 1.40 | 6 | | | 2.54 | 6 |
| 7/31/2015 | | | 17.52 | | | | .46 | | | | .09 | | | | .55 | | | | (.45 | ) | | | 17.62 | | | | 3.16 | | | | 78 | | | | 1.40 | | | | 2.59 | |
| 7/31/2014 | | | 16.72 | | | | .50 | | | | .80 | | | | 1.30 | | | | (.50 | ) | | | 17.52 | | | | 7.87 | | | | 76 | | | | 1.42 | | | | 2.94 | |
| 7/31/20134,7 | | | 17.54 | | | | .46 | | | | (.82 | ) | | | (.36 | ) | | | (.46 | ) | | | 16.72 | | | | (2.16 | )5 | | | 87 | | | | 1.42 | 6 | | | 2.85 | 6 |
| 8/31/2012 | | | 16.32 | | | | .52 | | | | 1.22 | | | | 1.74 | | | | (.52 | ) | | | 17.54 | | | | 10.83 | | | | 101 | | | | 1.42 | | | | 3.10 | |
| 8/31/2011 | | | 16.63 | | | | .52 | | | | (.31 | ) | | | .21 | | | | (.52 | ) | | | 16.32 | | | | 1.42 | | | | 91 | | | | 1.44 | | | | 3.28 | |
| Class F-1: | | | | | | | | | | | | | | | | | | | | | | | | | | | | | | | | | | | | | | | | |
| 1/31/20163,4 | | | 17.62 | | | | .28 | | | | .32 | | | | .60 | | | | (.28 | ) | | | 17.94 | | | | 3.46 | 5 | | | 68 | | | | .73 | 6 | | | 3.21 | 6 |
| 7/31/2015 | | | 17.52 | | | | .58 | | | | .09 | | | | .67 | | | | (.57 | ) | | | 17.62 | | | | 3.85 | | | | 63 | | | | .74 | | | | 3.26 | |
| 7/31/2014 | | | 16.72 | | | | .61 | | | | .80 | | | | 1.41 | | | | (.61 | ) | | | 17.52 | | | | 8.59 | | | | 65 | | | | .76 | | | | 3.60 | |
| 7/31/20134,7 | | | 17.54 | | | | .56 | | | | (.82 | ) | | | (.26 | ) | | | (.56 | ) | | | 16.72 | | | | (1.58 | )5 | | | 74 | | | | .77 | 6 | | | 3.50 | 6 |
| 8/31/2012 | | | 16.32 | | | | .64 | | | | 1.22 | | | | 1.86 | | | | (.64 | ) | | | 17.54 | | | | 11.59 | | | | 82 | | | | .73 | | | | 3.79 | |
| 8/31/2011 | | | 16.63 | | | | .64 | | | | (.31 | ) | | | .33 | | | | (.64 | ) | | | 16.32 | | | | 2.13 | | | | 82 | | | | .74 | | | | 3.98 | |
| Class F-2: | | | | | | | | | | | | | | | | | | | | | | | | | | | | | | | | | | | | | | | | |
| 1/31/20163,4 | | | 17.62 | | | | .31 | | | | .32 | | | | .63 | | | | (.31 | ) | | | 17.94 | | | | 3.59 | 5 | | | 157 | | | | .48 | 6 | | | 3.45 | 6 |
| 7/31/2015 | | | 17.52 | | | | .62 | | | | .09 | | | | .71 | | | | (.61 | ) | | | 17.62 | | | | 4.10 | | | | 134 | | | | .49 | | | | 3.51 | |
| 7/31/2014 | | | 16.72 | | | | .65 | | | | .80 | | | | 1.45 | | | | (.65 | ) | | | 17.52 | | | | 8.85 | | | | 110 | | | | .51 | | | | 3.84 | |
| 7/31/20134,7 | | | 17.54 | | | | .60 | | | | (.82 | ) | | | (.22 | ) | | | (.60 | ) | | | 16.72 | | | | (1.35 | )5 | | | 91 | | | | .51 | 6 | | | 3.77 | 6 |
| 8/31/2012 | | | 16.32 | | | | .68 | | | | 1.22 | | | | 1.90 | | | | (.68 | ) | | | 17.54 | | | | 11.87 | | | | 74 | | | | .48 | | | | 4.02 | |
| 8/31/2011 | | | 16.63 | | | | .67 | | | | (.31 | ) | | | .36 | | | | (.67 | ) | | | 16.32 | | | | 2.38 | | | | 41 | | | | .50 | | | | 4.22 | |
| | | Six months ended
January 31, | | Year ended
July 31 | | For the period
9/1/2012 to | | Year ended
August 31 |
| | | 20163,4,5 | | 2015 | | 2014 | | 7/31/20134,5,7 | | 2012 | | 2011 |
| Portfolio turnover rate for all share classes | | 9% | | 17% | | 8% | | 12% | | 15% | | 10% |
| 1 | Based on average shares outstanding. |
| 2 | Total returns exclude any applicable sales charges, including contingent deferred sales charges. |
| 3 | Unaudited. |
| 4 | Based on operations for the period shown and, accordingly, is not representative of a full year. |
| 5 | Not annualized. |
| 6 | Annualized. |
| 7 | In 2013, the fund changed its fiscal year-end from August to July. |
See Notes to Financial Statements
| 70 | American Funds Tax-Exempt Funds |
American Funds Tax-Exempt Fund of New York
| | | | | | Income (loss) from investment operations1 | | | | | | | | | | | | | | | | | | | | | | |
| Period ended | | Net asset
value,
beginning
of period | | | Net
investment
income | | | Net gains
(losses) on
securities (both
realized and
unrealized) | | | Total from
investment
operations | | | Dividends
(from net
investment
income) | | | Net asset
value, end
of period | | | Total
return2,3 | | | Net assets,
end of
period
(in thousands) | | | Ratio of
expenses to
average net
assets before
reimbursements | | | Ratio of
expenses to
average net
assets after
reimbursements | 2 | | Ratio of
net income
to average
net assets2 | |
| Class A: | | | | | | | | | | | | | | | | | | | | | | | | | | | | | | | | | | | | | | | | | | | | |
| 1/31/20164,5 | | $ | 10.66 | | | $ | .14 | | | $ | .22 | | | $ | .36 | | | $ | (.14 | ) | | $ | 10.88 | | | | 3.40 | %6,7 | | $ | 142,164 | | | | .73 | %6,8 | | | .70 | %6,8 | | | 2.63 | %6,8 |
| 7/31/2015 | | | 10.58 | | | | .32 | | | | .07 | | | | .39 | | | | (.31 | ) | | | 10.66 | | | | 3.65 | 6 | | | 123,924 | | | | .72 | 6 | | | .67 | 6 | | | 2.91 | 6 |
| 7/31/2014 | | | 10.21 | | | | .31 | | | | .37 | | | | .68 | | | | (.31 | ) | | | 10.58 | | | | 6.83 | 6 | | | 101,874 | | | | .73 | 6 | | | .63 | 6 | | | 3.07 | 6 |
| 7/31/2013 | | | 10.85 | | | | .31 | | | | (.64 | ) | | | (.33 | ) | | | (.31 | ) | | | 10.21 | | | | (3.16 | )6 | | | 99,811 | | | | .66 | 6 | | | .59 | 6 | | | 2.88 | 6 |
| 7/31/2012 | | | 9.98 | | | | .32 | | | | .87 | | | | 1.19 | | | | (.32 | ) | | | 10.85 | | | | 12.11 | 6 | | | 106,145 | | | | .76 | 6 | | | .63 | 6 | | | 3.06 | 6 |
| 7/31/20115,9 | | | 10.00 | | | | .21 | | | | (.03 | ) | | | .18 | | | | (.20 | ) | | | 9.98 | | | | 1.83 | 6,7 | | | 62,229 | | | | .97 | 6,8 | | | .67 | 6,8 | | | 2.82 | 6,8 |
| Class B: | | | | | | | | | | | | | | | | | | | | | | | | | | | | | | | | | | | | | | | | | | | | |
| 1/31/20164,5 | | | 10.66 | | | | .12 | | | | .22 | | | | .34 | | | | (.12 | ) | | | 10.88 | | | | 3.21 | 6,7 | | | 35 | | | | 1.13 | 6,8 | | | 1.11 | 6,8 | | | 2.24 | 6,8 |
| 7/31/2015 | | | 10.58 | | | | .23 | | | | .07 | | | | .30 | | | | (.22 | ) | | | 10.66 | | | | 2.87 | 6 | | | 45 | | | | 1.49 | 6 | | | 1.43 | 6 | | | 2.15 | 6 |
| 7/31/2014 | | | 10.21 | | | | .23 | | | | .37 | | | | .60 | | | | (.23 | ) | | | 10.58 | | | | 5.98 | 6 | | | 51 | | | | 1.51 | 6 | | | 1.44 | 6 | | | 2.29 | 6 |
| 7/31/2013 | | | 10.85 | | | | .22 | | | | (.64 | ) | | | (.42 | ) | | | (.22 | ) | | | 10.21 | | | | (4.00 | )6 | | | 174 | | | | 1.53 | 6 | | | 1.46 | 6 | | | 1.99 | 6 |
| 7/31/2012 | | | 9.98 | | | | .23 | | | | .87 | | | | 1.10 | | | | (.23 | ) | | | 10.85 | | | | 11.18 | 6 | | | 271 | | | | 1.59 | 6 | | | 1.45 | 6 | | | 2.24 | 6 |
| 7/31/20115,9 | | | 10.00 | | | | .15 | | | | (.03 | ) | | | .12 | | | | (.14 | ) | | | 9.98 | | | | 1.24 | 6,7 | | | 120 | | | | 1.76 | 6,8 | | | 1.48 | 6,8 | | | 2.21 | 6,8 |
| Class C: | | | | | | | | | | | | | | | | | | | | | | | | | | | | | | | | | | | | | | | | | | | | |
| 1/31/20164,5 | | | 10.66 | | | | .10 | | | | .22 | | | | .32 | | | | (.10 | ) | | | 10.88 | | | | 2.99 | 7 | | | 12,651 | | | | 1.52 | 8 | | | 1.49 | 8 | | | 1.84 | 8 |
| 7/31/2015 | | | 10.58 | | | | .23 | | | | .07 | | | | .30 | | | | (.22 | ) | | | 10.66 | | | | 2.79 | | | | 9,706 | | | | 1.56 | | | | 1.50 | | | | 2.07 | |
| 7/31/2014 | | | 10.21 | | | | .22 | | | | .37 | | | | .59 | | | | (.22 | ) | | | 10.58 | | | | 5.89 | | | | 7,809 | | | | 1.60 | | | | 1.51 | | | | 2.19 | |
| 7/31/2013 | | | 10.85 | | | | .21 | | | | (.64 | ) | | | (.43 | ) | | | (.21 | ) | | | 10.21 | | | | (4.04 | ) | | | 7,763 | | | | 1.58 | | | | 1.50 | | | | 1.96 | |
| 7/31/2012 | | | 9.98 | | | | .23 | | | | .87 | | | | 1.10 | | | | (.23 | ) | | | 10.85 | | | | 11.12 | | | | 6,875 | | | | 1.62 | | | | 1.50 | | | | 2.17 | |
| 7/31/20115,9 | | | 10.00 | | | | .15 | | | | (.03 | ) | | | .12 | | | | (.14 | ) | | | 9.98 | | | | 1.26 | 7 | | | 2,103 | | | | 1.75 | 8 | | | 1.55 | 8 | | | 2.27 | 8 |
| Class F-1: | | | | | | | | | | | | | | | | | | | | | | | | | | | | | | | | | | | | | | | | | | | | |
| 1/31/20164,5 | | | 10.66 | | | | .14 | | | | .22 | | | | .36 | | | | (.14 | ) | | | 10.88 | | | | 3.44 | 6,7 | | | 1,679 | | | | .65 | 6,8 | | | .62 | 6,8 | | | 2.72 | 6,8 |
| 7/31/2015 | | | 10.58 | | | | .31 | | | | .07 | | | | .38 | | | | (.30 | ) | | | 10.66 | | | | 3.58 | 6 | | | 1,624 | | | | .80 | 6 | | | .74 | 6 | | | 2.83 | 6 |
| 7/31/2014 | | | 10.21 | | | | .31 | | | | .37 | | | | .68 | | | | (.31 | ) | | | 10.58 | | | | 6.77 | 6 | | | 1,072 | | | | .77 | 6 | | | .68 | 6 | | | 3.03 | 6 |
| 7/31/2013 | | | 10.85 | | | | .29 | | | | (.64 | ) | | | (.35 | ) | | | (.29 | ) | | | 10.21 | | | | (3.36 | )6 | | | 1,372 | | | | .86 | 6 | | | .79 | 6 | | | 2.67 | 6 |
| 7/31/2012 | | | 9.98 | | | | .31 | | | | .87 | | | | 1.18 | | | | (.31 | ) | | | 10.85 | | | | 11.95 | 6 | | | 2,392 | | | | .86 | 6 | | | .74 | 6 | | | 2.94 | 6 |
| 7/31/20115,9 | | | 10.00 | | | | .20 | | | | (.03 | ) | | | .17 | | | | (.19 | ) | | | 9.98 | | | | 1.76 | 6,7 | | | 872 | | | | 1.03 | 6,8 | | | .78 | 6,8 | | | 2.71 | 6,8 |
| Class F-2: | | | | | | | | | | | | | | | | | | | | | | | | | | | | | | | | | | | | | | | | | | | | |
| 1/31/20164,5 | | | 10.66 | | | | .15 | | | | .22 | | | | .37 | | | | (.15 | ) | | | 10.88 | | | | 3.47 | 7 | | | 23,281 | | | | .58 | 8 | | | .55 | 8 | | | 2.78 | 8 |
| 7/31/2015 | | | 10.58 | | | | .33 | | | | .07 | | | | .40 | | | | (.32 | ) | | | 10.66 | | | | 3.77 | | | | 20,397 | | | | .61 | | | | .56 | | | | 3.02 | |
| 7/31/2014 | | | 10.21 | | | | .32 | | | | .37 | | | | .69 | | | | (.32 | ) | | | 10.58 | | | | 6.89 | | | | 15,959 | | | | .66 | | | | .57 | | | | 3.13 | |
| 7/31/2013 | | | 10.85 | | | | .31 | | | | (.64 | ) | | | (.33 | ) | | | (.31 | ) | | | 10.21 | | | | (3.14 | ) | | | 14,378 | | | | .64 | | | | .57 | | | | 2.90 | |
| 7/31/2012 | | | 9.98 | | | | .33 | | | | .87 | | | | 1.20 | | | | (.33 | ) | | | 10.85 | | | | 12.21 | | | | 12,983 | | | | .63 | | | | .53 | | | | 3.13 | |
| 7/31/20115,9 | | | 10.00 | | | | .22 | | | | (.03 | ) | | | .19 | | | | (.21 | ) | | | 9.98 | | | | 1.92 | 7 | | | 3,162 | | | | .70 | 8 | | | .55 | 8 | | | 3.08 | 8 |
| | | Six months ended
January 31, | | Year ended July 31 | | For the period
11/1/2010 to |
| | | 20164,5,7 | | 2015 | | 2014 | | 2013 | | 2012 | | 7/31/20115,7,9 |
| Portfolio turnover rate for all share classes | | 19% | | 42% | | 25% | | 23% | | 15% | | 16% |
| 1 | Based on average shares outstanding. |
| 2 | This column reflects the impact of certain reimbursements from CRMC. During the periods shown, CRMC reduced fees for other fees and expenses. |
| 3 | Total returns exclude any applicable sales charges, including contingent deferred sales charges. |
| 4 | Unaudited. |
| 5 | Based on operations for the period shown and, accordingly, is not representative of a full year. |
| 6 | All or a significant portion of assets in this class consisted of seed capital invested by Capital Research and Management Company and/or its affiliates. Fees for distribution services are not charged or accrued on these seed capital assets. If such fees were paid by the fund on seed capital assets, fund expenses would have been higher and net income and total return would have been lower. |
| 7 | Not annualized. |
| 8 | Annualized. |
| 9 | For the period November 1, 2010, commencement of operations, through July 31, 2011. |
See Notes to Financial Statements
| American Funds Tax-Exempt Funds | 71 |
As a fund shareholder, you incur two types of costs: (1) transaction costs, such as initial sales charges on purchase payments and contingent deferred sales charges on redemptions (loads), and (2) ongoing costs, including management fees, distribution and service (12b-1) fees, and other expenses. This example is intended to help you understand your ongoing costs (in dollars) of investing in the fund so you can compare these costs with the ongoing costs of investing in other mutual funds. The example is based on an investment of $1,000 invested at the beginning of the period and held for the entire six-month period (August 1, 2015, through January 31, 2016).
Actual expenses:
The first line of each share class in the table on the following pages provides information about actual account values and actual expenses. You may use the information in this line, together with the amount you invested, to estimate the expenses that you paid over the period. Simply divide your account value by $1,000 (for example, an $8,600 account value divided by $1,000 = 8.6), then multiply the result by the number in the first line under the heading entitled “Expenses paid during period” to estimate the expenses you paid on your account during this period.
Hypothetical example for comparison purposes:
The second line of each share class in the table on the following pages provides information about hypothetical account values and hypothetical expenses based on the actual expense ratio for the share class and an assumed rate of return of 5.00% per year before expenses, which is not the actual return of the share class. The hypothetical account values and expenses may not be used to estimate the actual ending account balance or expenses you paid for the period. You may use this information to compare the ongoing costs of investing in the fund and other funds. To do so, compare this 5.00% hypothetical example with the 5.00% hypothetical examples that appear in the shareholder reports of the other funds.
Notes:
Class F-1 and F-2 shareholders may be subject to fees charged by financial intermediaries, typically ranging from 0.75% to 1.50% of assets annually depending on services offered. You can estimate the impact of these fees by adding the amount of the fees to the total estimated expenses you paid on your account during the period as calculated above. In addition, your ending account value would be lower by the amount of these fees.
Note that the expenses shown in the table on the following pages are meant to highlight your ongoing costs only and do not reflect any transactional costs, such as sales charges (loads). Therefore, the second line of each share class in the table is useful in comparing ongoing costs only and will not help you determine the relative total costs of owning different funds. In addition, if these transactional costs were included, your costs would have been higher.
| 72 | American Funds Tax-Exempt Funds |
American Funds Short-Term Tax-Exempt Bond Fund
| | | Beginning | | | Ending | | | | | | | |
| | | account value | | | account value | | | Expenses paid | | | Annualized | |
| | | 8/1/2015 | | | 1/31/2016 | | | during period* | | | expense ratio | |
| Class A – actual return | | $ | 1,000.00 | | | $ | 1,006.91 | | | $ | 2.98 | | | | .59 | % |
| Class A – assumed 5% return | | | 1,000.00 | | | | 1,022.17 | | | | 3.00 | | | | .59 | |
| Class F-1 – actual return | | | 1,000.00 | | | | 1,005.78 | | | | 4.08 | | | | .81 | |
| Class F-1 – assumed 5% return | | | 1,000.00 | | | | 1,021.06 | | | | 4.12 | | | | .81 | |
| Class F-2 – actual return | | | 1,000.00 | | | | 1,007.09 | | | | 2.77 | | | | .55 | |
| Class F-2 – assumed 5% return | | | 1,000.00 | | | | 1,022.37 | | | | 2.80 | | | | .55 | |
Limited Term Tax-Exempt Bond Fund of America
| | | Beginning | | | Ending | | | | | | | |
| | | account value | | | account value | | | Expenses paid | | | Annualized | |
| | | 8/1/2015 | | | 1/31/2016 | | | during period* | | | expense ratio | |
| Class A – actual return | | $ | 1,000.00 | | | $ | 1,017.26 | | | $ | 2.84 | | | | .56 | % |
| Class A – assumed 5% return | | | 1,000.00 | | | | 1,022.32 | | | | 2.85 | | | | .56 | |
| Class B – actual return | | | 1,000.00 | | | | 1,013.61 | | | | 6.53 | | | | 1.29 | |
| Class B – assumed 5% return | | | 1,000.00 | | | | 1,018.65 | | | | 6.55 | | | | 1.29 | |
| Class C – actual return | | | 1,000.00 | | | | 1,013.34 | | | | 6.73 | | | | 1.33 | |
| Class C – assumed 5% return | | | 1,000.00 | | | | 1,018.45 | | | | 6.75 | | | | 1.33 | |
| Class F-1 – actual return | | | 1,000.00 | | | | 1,016.73 | | | | 3.40 | | | | .67 | |
| Class F-1 – assumed 5% return | | | 1,000.00 | | | | 1,021.77 | | | | 3.40 | | | | .67 | |
| Class F-2 – actual return | | | 1,000.00 | | | | 1,018.04 | | | | 2.08 | | | | .41 | |
| Class F-2 – assumed 5% return | | | 1,000.00 | | | | 1,023.08 | | | | 2.08 | | | | .41 | |
| Class R-6 – actual return | | | 1,000.00 | | | | 1,018.57 | | | | 1.52 | | | | .30 | |
| Class R-6 – assumed 5% return | | | 1,000.00 | | | | 1,023.63 | | | | 1.53 | | | | .30 | |
The Tax-Exempt Bond Fund of America
| | | Beginning | | | Ending | | | | | | | |
| | | account value | | | account value | | | Expenses paid | | | Annualized | |
| | | 8/1/2015 | | | 1/31/2016 | | | during period* | | | expense ratio | |
| Class A – actual return | | $ | 1,000.00 | | | $ | 1,033.54 | | | $ | 2.76 | | | | .54 | % |
| Class A – assumed 5% return | | | 1,000.00 | | | | 1,022.42 | | | | 2.75 | | | | .54 | |
| Class B – actual return | | | 1,000.00 | | | | 1,029.70 | | | | 6.53 | | | | 1.28 | |
| Class B – assumed 5% return | | | 1,000.00 | | | | 1,018.70 | | | | 6.50 | | | | 1.28 | |
| Class C – actual return | | | 1,000.00 | | | | 1,029.46 | | | | 6.78 | | | | 1.33 | |
| Class C – assumed 5% return | | | 1,000.00 | | | | 1,018.45 | | | | 6.75 | | | | 1.33 | |
| Class F-1 – actual return | | | 1,000.00 | | | | 1,032.89 | | | | 3.37 | | | | .66 | |
| Class F-1 – assumed 5% return | | | 1,000.00 | | | | 1,021.82 | | | | 3.35 | | | | .66 | |
| Class F-2 – actual return | | | 1,000.00 | | | | 1,034.25 | | | | 2.05 | | | | .40 | |
| Class F-2 – assumed 5% return | | | 1,000.00 | | | | 1,023.13 | | | | 2.03 | | | | .40 | |
| Class R-6 – actual return | | | 1,000.00 | | | | 1,034.77 | | | | 1.53 | | | | .30 | |
| Class R-6 – assumed 5% return | | | 1,000.00 | | | | 1,023.63 | | | | 1.53 | | | | .30 | |
| American Funds Tax-Exempt Funds | 73 |
American High-Income Municipal Bond Fund
| | | Beginning | | | Ending | | | | | | | |
| | | account value | | | account value | | | Expenses paid | | | Annualized | |
| | | 8/1/2015 | | | 1/31/2016 | | | during period* | | | expense ratio | |
| Class A – actual return | | $ | 1,000.00 | | | $ | 1,042.35 | | | $ | 3.44 | | | | .67 | % |
| Class A – assumed 5% return | | | 1,000.00 | | | | 1,021.77 | | | | 3.40 | | | | .67 | |
| Class B – actual return | | | 1,000.00 | | | | 1,038.59 | | | | 7.12 | | | | 1.39 | |
| Class B – assumed 5% return | | | 1,000.00 | | | | 1,018.15 | | | | 7.05 | | | | 1.39 | |
| Class C – actual return | | | 1,000.00 | | | | 1,038.35 | | | | 7.38 | | | | 1.44 | |
| Class C – assumed 5% return | | | 1,000.00 | | | | 1,017.90 | | | | 7.30 | | | | 1.44 | |
| Class F-1 – actual return | | | 1,000.00 | | | | 1,041.91 | | | | 3.85 | | | | .75 | |
| Class F-1 – assumed 5% return | | | 1,000.00 | | | | 1,021.37 | | | | 3.81 | | | | .75 | |
| Class F-2 – actual return | | | 1,000.00 | | | | 1,043.26 | | | | 2.57 | | | | .50 | |
| Class F-2 – assumed 5% return | | | 1,000.00 | | | | 1,022.62 | | | | 2.54 | | | | .50 | |
| Class R-6 – actual return | | | 1,000.00 | | | | 1,043.80 | | | | 2.00 | | | | .39 | |
| Class R-6 – assumed 5% return | | | 1,000.00 | | | | 1,023.18 | | | | 1.98 | | | | .39 | |
The Tax-Exempt Fund of California
| | | Beginning | | | Ending | | | | | | | |
| | | account value | | | account value | | | Expenses paid | | | Annualized | |
| | | 8/1/2015 | | | 1/31/2016 | | | during period* | | | expense ratio | |
| Class A – actual return | | $ | 1,000.00 | | | $ | 1,035.23 | | | $ | 3.12 | | | | .61 | % |
| Class A – assumed 5% return | | | 1,000.00 | | | | 1,022.07 | | | | 3.10 | | | | .61 | |
| Class B – actual return | | | 1,000.00 | | | | 1,031.41 | | | | 6.89 | | | | 1.35 | |
| Class B – assumed 5% return | | | 1,000.00 | | | | 1,018.35 | | | | 6.85 | | | | 1.35 | |
| Class C – actual return | | | 1,000.00 | | | | 1,031.14 | | | | 7.15 | | | | 1.40 | |
| Class C – assumed 5% return | | | 1,000.00 | | | | 1,018.10 | | | | 7.10 | | | | 1.40 | |
| Class F-1 – actual return | | | 1,000.00 | | | | 1,034.58 | | | | 3.73 | | | | .73 | |
| Class F-1 – assumed 5% return | | | 1,000.00 | | | | 1,021.47 | | | | 3.71 | | | | .73 | |
| Class F-2 – actual return | | | 1,000.00 | | | | 1,035.87 | | | | 2.46 | | | | .48 | |
| Class F-2 – assumed 5% return | | | 1,000.00 | | | | 1,022.72 | | | | 2.44 | | | | .48 | |
American Funds Tax-Exempt Fund of New York
| | | Beginning | | | Ending | | | | | | | |
| | | account value | | | account value | | | Expenses paid | | | Annualized | |
| | | 8/1/2015 | | | 1/31/2016 | | | during period* | | | expense ratio | |
| Class A – actual return | | $ | 1,000.00 | | | $ | 1,033.98 | | | $ | 3.58 | | | | .70 | % |
| Class A – assumed 5% return | | | 1,000.00 | | | | 1,021.62 | | | | 3.56 | | | | .70 | |
| Class B – actual return | | | 1,000.00 | | | | 1,032.09 | | | | 5.67 | | | | 1.11 | |
| Class B – assumed 5% return | | | 1,000.00 | | | | 1,019.56 | | | | 5.63 | | | | 1.11 | |
| Class C – actual return | | | 1,000.00 | | | | 1,029.89 | | | | 7.60 | | | | 1.49 | |
| Class C – assumed 5% return | | | 1,000.00 | | | | 1,017.65 | | | | 7.56 | | | | 1.49 | |
| Class F-1 – actual return | | | 1,000.00 | | | | 1,034.37 | | | | 3.17 | | | | .62 | |
| Class F-1 – assumed 5% return | | | 1,000.00 | | | | 1,022.02 | | | | 3.15 | | | | .62 | |
| Class F-2 – actual return | | | 1,000.00 | | | | 1,034.74 | | | | 2.81 | | | | .55 | |
| Class F-2 – assumed 5% return | | | 1,000.00 | | | | 1,022.37 | | | | 2.80 | | | | .55 | |
| * | The “expenses paid during period” are equal to the “annualized expense ratio,” multiplied by the average account value over the period, multiplied by the number of days in the period, and divided by 366 (to reflect the one-half year period). |
| 74 | American Funds Tax-Exempt Funds |
This page was intentionally left blank.
| American Funds Tax-Exempt Funds | 75 |
Offices of the funds and of the investment adviser
Capital Research and Management Company
333 South Hope Street
Los Angeles, CA 90071-1406
6455 Irvine Center Drive
Irvine, CA 92618-4518
Transfer agent for shareholder accounts
American Funds Service Company
(Write to the address near you.)
P.O. Box 6007
Indianapolis, IN 46206-6007
P.O. Box 2280
Norfolk, VA 23501-2280
Counsel
Morgan, Lewis & Bockius LLP
300 South Grand Avenue, 22nd Floor
Los Angeles, CA 90071-3132
Custodians of assets
Bank of New York Mellon
One Wall Street
New York, NY 10286
JPMorgan Chase Bank
270 Park Avenue
New York, NY 10017-2070
Independent registered public accounting firm
PricewaterhouseCoopers LLP
601 South Figueroa Street
Los Angeles, CA 90017-3874
Principal underwriter
American Funds Distributors, Inc.
333 South Hope Street
Los Angeles, CA 90071-1406
| 76 | American Funds Tax-Exempt Funds |
Investors should carefully consider investment objectives, risks, charges and expenses. This and other important information is contained in the funds’ prospectus and summary prospectus, which can be obtained from your financial professional and should be read carefully before investing. You may also call American Funds Service Company (AFS) at (800) 421-4225 or visit the American Funds website at americanfunds.com.
“American Funds Proxy Voting Procedures and Principles” — which describes how we vote proxies relating to portfolio securities — is available on the American Funds website or upon request by calling AFS. Each fund files its proxy voting record with the U.S. Securities and Exchange Commission (SEC) for the 12 months ended June 30 by August 31. The proxy voting record is available free of charge on the SEC website at sec.gov and on the American Funds website.
Complete January 31, 2016, portfolios of American Funds Short-Term Tax-Exempt Bond Fund, Limited Term Tax-Exempt Bond Fund of America, The Tax-Exempt Bond Fund of America, American High-Income Municipal Bond Fund and The Tax-Exempt Fund of California’s investments are available free of charge by calling AFS or visiting the SEC website (where they are part of Form N-CSR).
American Funds Short-Term Tax-Exempt Bond Fund, Limited Term Tax-Exempt Bond Fund of America, The Tax-Exempt Bond Fund of America, American High-Income Municipal Bond Fund, The Tax-Exempt Fund of California and American Funds Tax-Exempt Fund of New York file a complete list of their portfolio holdings with the SEC for the first and third quarters of each fiscal year on Form N-Q. This filing is available free of charge on the SEC website. You may also review or, for a fee, copy this filing at the SEC’s Public Reference Room in Washington, D.C. Additional information regarding the operation of the Public Reference Room may be obtained by calling the SEC’s Office of Investor Education and Advocacy at (800) SEC-0330. Additionally, the list of portfolio holdings is available by calling AFS.
This report is for the information of shareholders of American Funds Short-Term Tax-Exempt Bond Fund, Limited Term Tax-Exempt Bond Fund of America, The Tax-Exempt Bond Fund of America, American High-Income Municipal Bond Fund, The Tax-Exempt Fund of California and American Funds Tax-Exempt Fund of New York, but it also may be used as sales literature when preceded or accompanied by the current prospectus or summary prospectus, which gives details about charges, expenses, investment objectives and operating policies of the funds. If used as sales material after March 31, 2016, this report must be accompanied by an American Funds statistical update for the most recently completed calendar quarter.
The American Funds AdvantageSM
Since 1931, American Funds, part of Capital Group, has helped investors pursue long-term investment success. Our consistent approach — in combination with The Capital SystemSM — has resulted in a superior long-term track record.
| | Aligned with investor success |
| | We base our decisions on a long-term perspective, which we believe aligns our goals with the interests of our clients. Our portfolio managers average 27 years of investment experience, including 22 years at our company, reflecting a career commitment to our long-term approach.1 |
| | |
| | The Capital SystemSM |
| | The Capital System combines individual accountability with teamwork. Funds using The Capital System are divided into portions that are managed independently by investment professionals with diverse backgrounds, ages and investment approaches. An extensive global research effort is the backbone of our system. |
| | |
| | Superior long-term track record |
| | Our equity funds have beaten their Lipper peer indexes in 91% of 10-year periods and 95% of 20-year periods. Our fixed-income funds have beaten their Lipper indexes in 58% of 10-year periods and 58% of 20-year periods.2 Our fund management fees have been among the lowest in the industry.3 |
| | |
| | 1 | Portfolio manager experience as of December 31, 2015. |
| | 2 | Based on Class A share results for rolling periods through December 31, 2015. Periods covered are the shorter of the fund’s lifetime or since the comparable Lipper index inception date (except Capital Income Builder and SMALLCAP World Fund, for which the Lipper average was used). |
| | 3 | On average, our management fees were in the lowest quintile 68% of the time, based on the 20-year period ended December 31, 2015, versus comparable Lipper categories, excluding funds of funds. |

ITEM 2 – Code of Ethics
Not applicable for filing of semi-annual reports to shareholders.
ITEM 3 – Audit Committee Financial Expert
Not applicable for filing of semi-annual reports to shareholders.
ITEM 4 – Principal Accountant Fees and Services
Not applicable for filing of semi-annual reports to shareholders.
ITEM 5 – Audit Committee of Listed Registrants
Not applicable to this Registrant, insofar as the Registrant is not a listed issuer as defined in Rule 10A-3 under the Securities Exchange Act of 1934.
ITEM 6 – Schedule of Investments
Limited Term Tax-Exempt Bond Fund of America®
Investment portfolio
January 31, 2016
Bonds, notes & other debt instruments 91.86%
Alabama 0.82% | Principal amount
(000) | Value
(000) |
| 21st Century Auth., Tobacco Settlement Rev. Ref. Bonds, Series 2012-A, 5.00% 2020 | $4,000 | $4,594 |
| 21st Century Auth., Tobacco Settlement Rev. Ref. Bonds, Series 2012-A, 5.00% 2021 | 3,305 | 3,877 |
| Federal Aid Highway Fin. Auth., Federal Highway Grant Anticipation Bonds, Series 2012, 5.00% 2018 | 1,000 | 1,106 |
| Federal Aid Highway Fin. Auth., Federal Highway Grant Anticipation Bonds, Series 2012, 5.00% 2022 | 5,385 | 6,547 |
| Federal Aid Highway Fin. Auth., Federal Highway Grant Anticipation Bonds, Series 2012, 5.00% 2023 | 2,500 | 3,006 |
| The Medical Clinic Board of the City of Montgomery, Health Care Fac. Rev. Bonds (Jackson Hospital & Clinic), 5.00% 2021 | 1,500 | 1,713 |
| The Medical Clinic Board of the City of Montgomery, Health Care Fac. Rev. Bonds (Jackson Hospital & Clinic), 5.00% 2023 | 1,125 | 1,314 |
Special Care Facs. Fncg. Auth. of the City of Pell City, Rev. Ref. Bonds (Noland Health Services, Inc.),
Series 2012-A, 5.00% 2020 | 1,140 | 1,311 |
Board of Trustees of the University of Alabama, Birmingham Hospital Rev. Ref. Bonds,
Series 2008-A, 5.25% 2017 | 1,160 | 1,239 |
| Board of Trustees of the University of Alabama, General Rev. Ref. Bonds, Series 2012-A, 5.00% 2020 | 2,500 | 2,928 |
| | | 27,635 |
| Alaska 0.09% | | |
| International Airport System, Rev. Ref. Bonds, Series 2016-D, 5.00% 2017 | 2,010 | 2,097 |
| Student Loan Corp., Education Loan Rev. Bonds, Series 2006-A-2, AMT, 5.00% 2016 | 1,000 | 1,016 |
| | | 3,113 |
| Arizona 1.53% | | |
| Health Facs. Auth., Rev. Ref. Bonds (Phoenix Children’s Hospital), Series 2013-A-1, 1.86% 2048 (put 2020)1 | 4,000 | 4,086 |
| City of Glendale, Water and Sewer Rev. Ref. Obligations, Series 2012, 5.00% 2020 | 1,550 | 1,815 |
| City of Glendale, Water and Sewer Rev. Ref. Obligations, Series 2012, 5.00% 2021 | 1,000 | 1,199 |
Industrial Dev. Auth. of the City of Glendale, Rev. Ref. Bonds (Midwestern University),
Series 2007, 5.25% 2018 | 1,135 | 1,234 |
| Health Facs. Auth. Rev. Bonds (Scottsdale Lincoln Hospitals Project), Series 2014-A, 5.00% 2024 | 1,000 | 1,241 |
| Health Facs. Auth., Rev. Bonds (Banner Health), Series 2007-A, 5.00% 2017 | 3,000 | 3,123 |
| Health Facs. Auth., Rev. Ref. Bonds (Banner Health), Series 2007-A, 5.00% 2018 | 500 | 540 |
Industrial Dev. Auth. of the County of Maricopa, Health Fac. Rev. Ref. Bonds (Catholic Healthcare West),
Series 2007-A, 5.00% 2016 | 2,000 | 2,037 |
Industrial Dev. Auth. of the County of Maricopa, Health Fac. Rev. Ref. Bonds (Catholic Healthcare West),
Series 2009-A, 5.00% 2016 | 2,400 | 2,445 |
| Maricopa County Community College Dist., G.O. Bonds (Project of 2004), Series 2009-C, 5.00% 2018 | 3,500 | 3,858 |
| City of Phoenix Civic Improvement Corp., Airport Rev. Bonds, Series 2010-A, 5.00% 2019 | 1,000 | 1,133 |
| City of Phoenix Civic Improvement Corp., Airport Rev. Ref. Bonds, Series 2008-D, AMT, 5.25% 2017 | 2,000 | 2,130 |
| City of Phoenix Civic Improvement Corp., Airport Rev. Ref. Bonds, Series 2008-D, AMT, 5.25% 2018 | 1,000 | 1,101 |
| City of Phoenix Civic Improvement Corp., Wastewater System Rev. Ref. Bonds, Series 2008, 5.50% 2018 | 1,000 | 1,114 |
| City of Phoenix Civic Improvement Corp., Water System Rev. Bonds, Series 2009-A, 5.00% 2018 | 2,300 | 2,535 |
| Industrial Dev. Auth. of the City of Phoenix and the County of Pima, Single-family Mortgage Rev. Bonds, Series 2006-3A, AMT, 5.25% 2038 | 25 | 26 |
| Industrial Dev. Authorities of the City of Phoenix and the County of Maricopa, Single-family Mortgage Rev. Bonds, Series 2007-A-2, AMT, 5.80% 2040 | 60 | 63 |
| Pima County, Sewer System Rev. Obligations, Series 2012-A, 5.00% 2021 | 400 | 479 |
| Pima County, Sewer System Rev. Obligations, Series 2012-A, 5.00% 2022 | 800 | 973 |
| School Facs. Board, Certs. of Part., Series 2008, 5.50% 2016 | 1,500 | 1,545 |
Limited Term Tax-Exempt Bond Fund of America — Page 1 of 34
Bonds, notes & other debt instruments
Arizona (continued) | Principal amount
(000) | Value
(000) |
| School Facs. Board, Certs. of Part., Series 2008, 5.50% 2017 | $3,000 | $3,229 |
| School Facs. Board, Certs. of Part., Series 2015-A, 5.00% 2021 | 1,500 | 1,791 |
| School Facs. Board, State School Trust Rev. Ref. Bonds, Series 2007, AMBAC insured, 5.00% 2017 | 2,000 | 2,115 |
| State Lottery Rev. Bonds, Series 2010-A, Assured Guaranty Municipal insured, 5.00% 2019 | 3,770 | 4,264 |
| Transportation Board Highway Rev. Ref. Bonds, Series 2011-A, 5.00% 2020 | 3,270 | 3,830 |
| Board of Regents, Ref. Certs. of Part. (University of Arizona Projects), Series 2012-C, 5.00% 2020 | 3,180 | 3,687 |
| | | 51,593 |
| Arkansas 0.03% | | |
Dev. Fin. Auth., Health Care Rev. Bonds (Baptist Memorial Health Care), Series 2015-B-3,
1.56% 2044 (put 2022)1 | 1,000 | 990 |
| California 12.54% | | |
| Alameda Corridor Transportation Auth., Rev. Ref. Bonds, Series 2013-A, 5.00% 2021 | 1,750 | 2,114 |
| Alameda Corridor Transportation Auth., Rev. Ref. Bonds, Series 2013-A, 5.00% 2025 | 1,300 | 1,589 |
Assn. of Bay Area Governments, Fin. Auth. for Nonprofit Corps., Insured Rev. Ref. Bonds
(Channing House), Series 2010, 4.00% 2016 | 1,500 | 1,504 |
Assn. of Bay Area Governments, Fin. Auth. for Nonprofit Corps., Rev. Ref. Bonds (Sharp HealthCare),
Series 2012-A, 4.00% 2021 | 935 | 1,073 |
Assn. of Bay Area Governments, Fin. Auth. for Nonprofit Corps., Rev. Ref. Bonds (Sharp HealthCare),
Series 2012-A, 5.00% 2019 | 980 | 1,117 |
Bay Area Toll Auth., San Francisco Bay Area Toll Bridge Rev. Ref. Bonds, Series 2006-C-1,
0.91% 2045 (put 2023)1 | 20,500 | 20,386 |
Bay Area Toll Auth., San Francisco Bay Area Toll Bridge Rev. Ref. Bonds, Series 2007-C-1,
0.91% 2047 (put 2023)1 | 3,500 | 3,480 |
Bay Area Toll Auth., San Francisco Bay Area Toll Bridge Rev. Ref. Bonds, Series 2007-E-3,
0.71% 2047 (put 2019)1 | 1,000 | 999 |
Bay Area Toll Auth., San Francisco Bay Area Toll Bridge Rev. Ref. Bonds, Series 2014-G,
0.61% 2034 (put 2020)1 | 2,500 | 2,481 |
Bay Area Toll Auth., San Francisco Bay Area Toll Bridge Rev. Ref. Bonds, Series 2014-H,
0.71% 2034 (put 2021)1 | 10,480 | 10,405 |
| Successor Agcy. to the Brea Redev. Agcy. (Redev. Project AB), 2013 Tax Allocation Ref. Bonds, 5.00% 2021 | 725 | 867 |
Central Valley Fncg. Auth., Cogeneration Project Rev. Ref. Bonds (Carson Ice-Gen Project),
Series 2009, 5.00% 2016 | 800 | 816 |
Central Valley Fncg. Auth., Cogeneration Project Rev. Ref. Bonds (Carson Ice-Gen Project),
Series 2009, 5.00% 2017 | 1,130 | 1,199 |
Cerritos Public Fin. Auth., Tax Allocation Rev. Bonds (Cerritos Redev. Projects), Series 2002-A,
AMBAC insured, 5.00% 2021 | 1,000 | 1,085 |
Cerritos Public Fncg. Auth., 2002 Tax Allocation Rev. Bonds (Cerritos Redev. Projects), Series A,
AMBAC insured, 5.00% 2019 | 1,570 | 1,711 |
| Chino Public Fncg. Auth., Local Agcy. Rev. Ref. Bonds, Series 2015-A, Assured Guaranty Municipal insured, 5.00% 2024 | 500 | 612 |
| Chino Public Fncg. Auth., Local Agcy. Rev. Ref. Bonds, Series 2015-A, Assured Guaranty Municipal insured, 5.00% 2026 | 500 | 610 |
| Chino Public Fncg. Auth., Local Agcy. Rev. Ref. Bonds, Series 2015-A, Assured Guaranty Municipal insured, 5.00% 2028 | 1,000 | 1,190 |
| Chula Vista Municipal Fncg. Auth., Special Tax Rev. Ref. Bonds, Series 2015-A, 5.00% 2021 | 975 | 1,136 |
| Econ. Recovery Bonds, Ref. Series 2009-A, 5.00% 2019 | 3,000 | 3,423 |
| Econ. Recovery Bonds, Ref. Series 2009-A, 5.00% 2020 | 9,000 | 10,269 |
| Educational Facs. Auth., Rev. Ref. Bonds (Chapman University), 5.00% 2022 | 640 | 771 |
| Educational Facs. Auth., Rev. Ref. Bonds (Chapman University), Series 2011, 5.00% 2020 | 1,640 | 1,889 |
| Educational Facs. Auth., Rev. Ref. Bonds (University of Redlands), Series 2015-A, 5.00% 2025 | 1,270 | 1,536 |
| El Centro Fncg. Auth., Wastewater Rev. Ref. Bonds, Series 2014-A, Assured Guaranty Municipal insured, 5.00% 2028 | 1,000 | 1,200 |
Limited Term Tax-Exempt Bond Fund of America — Page 2 of 34
Bonds, notes & other debt instruments
California (continued) | Principal amount
(000) | Value
(000) |
| Elk Grove Fin. Auth., Special Tax Rev. Bonds, Series 2015, 2.00% 2016 | $565 | $570 |
| Elk Grove Fin. Auth., Special Tax Rev. Bonds, Series 2015, 3.00% 2017 | 750 | 775 |
| Elk Grove Fin. Auth., Special Tax Rev. Bonds, Series 2015, 3.00% 2018 | 450 | 471 |
| City of Fontana, Community Facs. Dist. No. 22 (Sierra Hills South), Special Tax Bonds, Series 2014, 5.00% 2022 | 525 | 617 |
| Various Purpose G.O. Bonds, 5.00% 2026 | 3,000 | 3,798 |
| G.O. Bonds, Series 2012-A, 0.46% 2033 (put 2018)1 | 5,000 | 4,979 |
| G.O. Bonds, Series 2013-C, 0.56% 2028 (put 2016)1 | 5,000 | 5,001 |
| Various Purpose G.O. Bonds, 3.00% 2016 | 18,000 | 18,250 |
| Various Purpose G.O. Ref. Bonds, 5.00% 2021 | 5,000 | 6,038 |
| Various Purpose G.O. Ref. Bonds, 5.00% 2023 | 6,500 | 8,116 |
| Veterans G.O. Ref. Bonds, Series 2015-CM, AMT, 2.45% 2031 | 1,500 | 1,505 |
Golden State Tobacco Securitization Corp., Enhanced Tobacco Settlement Asset-backed Bonds,
Series 2013-A, 5.00% 2020 | 6,100 | 7,115 |
| Successor Agcy. to the Community Redev. Agcy. Of the City of Hawthorne, Tax Allocation Rev. Ref. Bonds, Assured Guaranty Municipal insured, 5.00% 2022 | 500 | 611 |
| Successor Agcy. to the Community Redev. Agcy. Of the City of Hawthorne, Tax Allocation Rev. Ref. Bonds, Assured Guaranty Municipal insured, 5.00% 2027 | 1,070 | 1,322 |
Health Facs. Fncg. Auth., Insured Rev. Ref. Bonds (NCROC - Paradise Valley Estates Project),
Series 2013, 5.00% 2023 | 550 | 674 |
| Health Facs. Fncg. Auth., Rev. Bonds (Sutter Health), Series 2011-D, 5.00% 2019 | 750 | 858 |
| Health Facs. Fncg. Auth., Rev. Ref. Bonds (Providence Health & Services), Series 2008-C, 5.25% 2016 | 500 | 517 |
| Health Facs. Fncg. Auth., Rev. Ref. Bonds (Providence Health & Services), Series 2008-C, 5.50% 2017 | 500 | 540 |
| Health Facs. Fncg. Auth., Rev. Ref. Bonds (Providence Health & Services), Series 2008-C, 6.00% 2018 | 600 | 682 |
| Health Facs. Fncg. Auth., Rev. Ref. Bonds (St. Joseph Health System), Series 2009-C, 5.00% 2034 (put 2022) | 5,500 | 6,736 |
| Health Facs. Fncg. Auth., Rev. Ref. Bonds (St. Joseph Health System), Series 2009-D, 5.00% 2034 (put 2016) | 7,500 | 7,745 |
| Health Facs. Fncg. Auth., Rev. Ref. Bonds (St. Joseph Health System), Series 2013-D, 5.00% 2043 (put 2020) | 1,200 | 1,408 |
Independent Cities Lease Fin. Auth., Mobile Home Park Rev. Bonds (San Juan Mobile Estates),
Series 2006-A, 5.00% 2016 | 520 | 527 |
Infrastructure and Econ. Dev. Bank, Rev. Ref. Bonds (J. Paul Getty Trust), Series 2015-B-1,
0.29% 2047 (put 2018)1 | 5,000 | 4,956 |
Infrastructure and Econ. Dev. Bank, Rev. Ref. Bonds (J. Paul Getty Trust), Series 2013-A-2, 0.29% 2047
(put 2016)1 | 3,500 | 3,500 |
Infrastructure and Economic Dev. Bank Rev. Bonds (The Colburn School), Series 2015-A,
1.01% 2037 (put 2020)1 | 3,000 | 3,005 |
Infrastructure and Economic Dev. Bank Rev. Bonds (The Colburn School), Series 2015-B,
1.21% 2037 (put 2022)1 | 3,500 | 3,511 |
| City of Irvine, Limited Obligation Improvement Bonds, Reassessment Dist. No. 15-1, 5.00% 2026 | 1,260 | 1,558 |
| City of Irvine, Limited Obligation Improvement Bonds, Reassessment Dist. No. 15-1, 5.00% 2022 | 1,000 | 1,196 |
| City of Irvine, Limited Obligation Improvement Bonds, Reassessment Dist. No. 15-1, 5.00% 2021 | 500 | 593 |
| Jurupa Public Fncg. Auth., Special Tax Rev. Bonds, Series 2013-A, 5.00% 2021 | 750 | 889 |
| Jurupa Public Fncg. Auth., Special Tax Rev. Bonds, Series 2013-A, 5.00% 2022 | 1,000 | 1,207 |
Successor Agcy. to the La Quinta Redev. Agcy., Tax Allocation Ref. Bonds (La Quinta Redev. Project
Areas No. 1 and 2), Series 2013-A, 5.00% 2023 | 590 | 714 |
Successor Agcy. to the La Quinta Redev. Agcy., Tax Allocation Ref. Bonds (La Quinta Redev. Project
Areas No. 1 and 2), Series 2014-A, 5.00% 2022 | 615 | 750 |
Successor Agcy. to the La Quinta Redev. Agcy., Tax Allocation Ref. Bonds (La Quinta Redev. Project
Areas No. 1 and 2), Series 2014-A, 5.00% 2023 | 1,205 | 1,482 |
| LakeElsinore, Public Fncg. Auth. Rev. Ref. Bonds, 5.00% 2026 | 3,895 | 4,530 |
| Lee Lake Public Fncg. Auth., Special Tax Rev. Ref. Bonds, Series 2013-A, 5.00% 2019 | 1,805 | 2,028 |
| Lee Lake Public Fncg. Auth., Special Tax Rev. Ref. Bonds, Series 2013-A, 5.00% 2020 | 890 | 1,023 |
| Lee Lake Public Fncg. Auth., Special Tax Rev. Ref. Bonds, Series 2013-A, 5.00% 2022 | 1,090 | 1,295 |
| City of Long Beach, Harbor Rev. Ref. Bonds, Series 1998-A, AMT, FGIC-National insured, 6.00% 2019 | 3,500 | 4,054 |
| City of Los Angeles Community Facs. District No. 4, Special Tax Ref. Bond (Playa Vista Phase 1), Series 2014, 5.00% 2025 | 1,250 | 1,506 |
| City of Los Angeles Harbor Dept., Rev. Ref. Bonds, Series 2011-A, AMT, 5.00% 2019 | 1,500 | 1,702 |
Limited Term Tax-Exempt Bond Fund of America — Page 3 of 34
Bonds, notes & other debt instruments
California (continued) | Principal amount
(000) | Value
(000) |
| City of Los Angeles, Dept. of Water and Power, Power System Rev. Ref. Bonds, Series 2011-A, 5.00% 2018 | $770 | $850 |
| City of Los Angeles, Wastewater System Rev. Ref. Bonds, Series 2002-A, FGIC-National insured, 6.00% 2021 | 3,000 | 3,776 |
| City of Los Angeles, Wastewater System Rev. Ref. Bonds, Series 2009-A, 5.00% 2018 | 2,500 | 2,748 |
| Los Angeles Convention and Exhibition Center Auth., Lease Rev. Ref. Bonds, Series 2008-A, 5.00% 2016 | 1,570 | 1,611 |
Los Angeles County Metropolitan Transportation Auth., Proposition C, Sales Tax Rev. Ref. Bonds,
Series 2009-B, 5.00% 2017 | 2,500 | 2,664 |
Los Angeles County Metropolitan Transportation Auth., Proposition C, Sales Tax Rev. Ref. Bonds,
Series 2012-B, 5.00% 2021 | 6,230 | 7,546 |
Los Angeles Unified School Dist. (County of Los Angeles), Election of 2004 G.O. Bonds,
Series 2009-I, 5.00% 2020 | 3,500 | 3,999 |
| Los Angeles Unified School Dist. (County of Los Angeles), G.O. Ref. Bonds, Series 2011-A-1, 5.00% 2018 | 7,010 | 7,729 |
| Municipal Improvement Corp. of Los Angeles, Lease Rev. Ref. Bonds, Series 2012-C, 5.00% 2020 | 2,000 | 2,311 |
| Municipal Improvement Corp. of Los Angeles, Lease Rev. Ref. Bonds, Series 2012-C, 5.00% 2022 | 3,250 | 3,935 |
Menifee Union School District Public Fncg. Auth., Special Tax Rev. Bonds, Series 2016-A, BAM insured,
5.00% 2029 | 400 | 474 |
Menifee Union School District Public Fncg. Auth., Special Tax Rev. Bonds, Series 2016-A, BAM insured,
5.00% 2030 | 625 | 736 |
Metropolitan Water District of Southern California, Water Rev. Ref. Bonds (SIFMA Index Model),
Series 2012-B1, 0.39% 2027 (put 2018)1 | 1,000 | 997 |
Morongo Band of Mission Indians, Enterprise Rev. Ref. Bonds,
Series 2008-B, 5.50% 2018 | 775 | 826 |
| Murrieta Public Fncg. Auth., Special Tax Rev. Ref. Bonds, Series 2012, 5.00% 2020 | 1,000 | 1,153 |
Northern California Power Agcy., Hydroelectric Project Number One Rev. Ref. Bonds,
Series 2010-A, 5.00% 2019 | 1,000 | 1,139 |
Northern California Power Agcy., Hydroelectric Project Number One Rev. Ref. Bonds,
Series 2010-A, 5.00% 2020 | 2,000 | 2,271 |
Northern California Power Agcy., Hydroelectric Project Number One Rev. Ref. Bonds,
Series 2010-A, 5.00% 2021 | 1,000 | 1,130 |
Oakland Redev. Successor Agcy., Tax Allocation Ref. Bonds (Central Dist. Redev. Project),
Series 2013, 5.00% 2019 | 2,000 | 2,269 |
Oakland Redev. Successor Agcy., Tax Allocation Ref. Bonds (Central Dist. Redev. Project),
Series 2013, 5.00% 2020 | 2,500 | 2,910 |
Oakland Redev. Successor Agcy., Tax Allocation Ref. Bonds (Central Dist. Redev. Project),
Series 2013, 5.00% 2021 | 2,000 | 2,375 |
| Port of Oakland, Rev. Ref. Bonds, Series 2007-C, National insured, 5.00% 2016 | 1,000 | 1,036 |
| Port of Oakland, Rev. Ref. Bonds, Series 2007-C, National insured, 5.00% 2017 | 1,000 | 1,077 |
| Port of Oakland, Rev. Ref. Bonds, Series 2011-O, AMT, 5.00% 2020 | 2,020 | 2,336 |
| Port of Oakland, Rev. Ref. Bonds, Series 2012-P, AMT, 5.00% 2021 | 7,750 | 9,170 |
| Port of Oakland, Rev. Ref. Bonds, Series 2012-P, AMT, 5.00% 2022 | 4,000 | 4,818 |
| Port of Oakland, Rev. Ref. Bonds, Series 2012-P, AMT, 5.00% 2023 | 2,750 | 3,300 |
| City of Orange, Community Facs. Dist. No. 91-2, Special Tax Ref. Bonds (Serrano Heights Public Improvements), Series 2013, 4.00% 2022 | 1,000 | 1,135 |
| City of Orange, Community Facs. Dist. No. 91-2, Special Tax Ref. Bonds (Serrano Heights Public Improvements), Series 2013, 5.00% 2023 | 750 | 891 |
Pollution Control Fncg. Auth., Solid Waste Disposal Rev. Ref. Bonds (Republic
Services, Inc. Project), Series 2002-C, AMT, 5.25% 2023 (put 2017)2 | 8,250 | 8,733 |
Public Works Board, Lease Rev. Bonds (Judicial Council of California, Various Judicial Council Projects),
Series 2011-D, 5.00% 2019 | 2,000 | 2,306 |
| Public Works Board, Lease Rev. Bonds (Trustees of the California State University), Series 2013-H, 5.00% 2021 | 3,250 | 3,921 |
| Public Works Board, Lease Rev. Bonds (Various Capital Projects), Series 2011-A, 5.00% 2019 | 2,000 | 2,295 |
| Public Works Board, Lease Rev. Bonds (Various Capital Projects), Series 2013-I, 5.00% 2021 | 1,000 | 1,209 |
Successor Agcy. to the Rancho Mirage Redev. Agcy., Tax Allocation Housing Ref. Bonds,
Series 2013-A, 5.00% 2022 | 1,495 | 1,784 |
| Regional Airports Improvement Corp., Facs. Lease Rev. Ref. Bonds (LAXFUEL Corp., Los Angeles International Airport), Issue of 2012, AMT, 5.00% 2020 | 545 | 625 |
Limited Term Tax-Exempt Bond Fund of America — Page 4 of 34
Bonds, notes & other debt instruments
California (continued) | Principal amount
(000) | Value
(000) |
| Regional Airports Improvement Corp., Facs. Lease Rev. Ref. Bonds (LAXFUEL Corp., Los Angeles International Airport), Issue of 2012, AMT, 5.00% 2021 | $1,700 | $1,994 |
| Community Facs. of Riverside Unified School Dist., Special Tax Bonds, BAM insured, 5.00% 2029 | 2,250 | 2,681 |
| Community Facs. of Riverside Unified School Dist., Special Tax Bonds, BAM insured, 5.00% 2031 | 1,035 | 1,219 |
| Riverside County Public Fncg. Auth., Tax Allocation Rev. Bonds (Project Area No. 1, Desert Communities and Interstate 215 Corridor Projects), Series 2015-A, Assured Guaranty Municipal insured, 5.00% 2025 | 1,000 | 1,235 |
| Riverside County Public Fncg. Auth., Tax Allocation Rev. Bonds (Project Area No. 1, Desert Communities and Interstate 215 Corridor Projects), Series 2015-A, Assured Guaranty Municipal insured, 5.00% 2026 | 1,000 | 1,225 |
City of Sacramento, North Natomas Drainage Community Facs. Dist. No. 97-1, Special Tax Bonds,
Series 2015, 5.00% 2027 | 1,500 | 1,778 |
Sacramento Cogeneration Auth., Cogeneration Project Rev. Ref. Bonds (Procter & Gamble Project),
Series 2009, 5.00% 2016 | 1,000 | 1,020 |
Sacramento Cogeneration Auth., Cogeneration Project Rev. Ref. Bonds (Procter & Gamble Project),
Series 2009, 5.00% 2017 | 1,000 | 1,063 |
| Sacramento Municipal Utility Dist., Electric Rev. Bonds, Series 1997-K, AMBAC insured, 5.75% 2018 | 5,170 | 5,793 |
| Sacramento Municipal Utility Dist., Electric Rev. Bonds, Series 1997-K, AMBAC insured, 5.80% 2019 | 3,000 | 3,507 |
| City of San Bernardino, Unified School Dist. G.O. Ref. Bonds, Series 2013-A, 5.00% 2017 | 400 | 426 |
City of San Bernardino, Unified School Dist. G.O. Ref. Bonds, Series 2013-A,
Assured Guaranty Municipal insured, 5.00% 2023 | 1,100 | 1,362 |
| County of San Bernardino, Certs. of Part. (Arrowhead Ref. Project), Series 2009-A, 5.00% 2017 | 6,000 | 6,369 |
Public Facs. Fncg. Auth. of the City of San Diego, Sewer Rev. Bonds, Series 2009-A,
5.00% 2017 | 8,500 | 9,008 |
Public Facs. Fncg. Auth. of the City of San Diego, Sewer Rev. Ref. Bonds, Series 2009-B,
5.00% 2017 | 2,500 | 2,649 |
| Redev. Agcy. of the City and County of San Francisco, Community Facs. Dist. No. 6, Special Tax Ref. Bonds (Mission Bay South Public Improvements), Series 2013-A, 5.00% 2022 | 1,000 | 1,188 |
| City of San Jose, Airport Rev. Bonds, Series 2007-A, AMT, AMBAC insured, 5.50% 2020 | 7,820 | 8,243 |
| City of San Jose, Airport Rev. Bonds, Series 2007-A, AMT, AMBAC insured, 5.50% 2022 | 2,500 | 2,630 |
| City of San Jose, Airport Rev. Ref. Bonds, Series 2011-A-1, AMT, 5.00% 2018 | 3,750 | 4,055 |
| City of San Jose, Airport Rev. Ref. Bonds, Series 2011-A-1, AMT, 5.00% 2019 | 3,000 | 3,347 |
| City of San Jose, Airport Rev. Ref. Bonds, Series 2011-A-1, AMT, 5.25% 2020 | 3,070 | 3,549 |
| City of San Jose, Airport Rev. Ref. Bonds, Series 2011-A-1, AMT, 5.25% 2022 | 3,650 | 4,312 |
| Santa Cruz County Redev. Successor Agcy., Tax Allocation Ref. Bonds, Series 2014, 5.00% 2020 | 985 | 1,151 |
| Sonoma-Marin Area Rail Transit Dist., Measure Q Sales Tax Rev. Bonds, Series 2011-A, 5.00% 2022 | 2,795 | 3,420 |
South Orange County Public Fncg. Auth., Special Tax Rev. Bonds (Ladera Ranch), Series 2005-A,
AMBAC insured, 5.00% 2016 | 2,420 | 2,430 |
| Southern California Public Power Auth., Gas Project Rev. Bonds (Project No. 1), Series 2007-A, 5.00% 2016 | 1,000 | 1,033 |
| Southern California Public Power Auth., Transmission Project Rev. Ref. Bonds (Southern Transmission Project), Series 2009-A, 5.00% 2019 | 2,500 | 2,854 |
Statewide Water System Rev. Ref. Bonds (Water Resource Center Project), Series 2015-AU.,
0.63% 2035 (put 2017)1 | 4,500 | 4,507 |
| Statewide Communities Dev. Auth., Rev. Ref. Bonds (Enloe Medical Center), 5.00% 2026 | 700 | 882 |
| Statewide Communities Dev. Auth., Rev. Ref. Bonds (Enloe Medical Center), 5.00% 2027 | 700 | 876 |
Statewide Communities Dev. Auth., Rev Bonds (American Baptist Homes of the West), Series 2015,
5.00% 2025 | 2,585 | 3,069 |
| Statewide Communities Dev. Auth., Rev. Bonds (Kaiser Permanente), Series 2002-C, 5.00% 2029 (put 2017) | 5,700 | 6,010 |
| Statewide Communities Dev. Auth., Rev. Bonds (Kaiser Permanente), Series 2009-A, 5.00% 2019 | 2,000 | 2,260 |
| Statewide Communities Dev. Auth., Rev. Bonds (Sutter Health), Series 2011-A, 5.00% 2019 | 1,100 | 1,259 |
Statewide Communities Dev. Auth., Rev. Ref. Bonds (American Baptist Homes of the West),
Series 2010, 5.375% 2020 | 2,730 | 3,095 |
| Statewide Communities Dev. Auth., Student Housing Rev. Bonds (CHF-Irvine, LLC-UCI East Campus Apartments, Phase II), Series 2008, 5.00% 2018 | 2,500 | 2,704 |
| Statewide Communities Dev. Auth., Student Housing Rev. Ref. Bonds (CHF-Irvine, LLC-UCI East Campus Apartments, Phase I), Series 2011, 5.00% 2020 | 750 | 850 |
Limited Term Tax-Exempt Bond Fund of America — Page 5 of 34
Bonds, notes & other debt instruments
California (continued) | Principal amount
(000) | Value
(000) |
| Stockton Public Fncg. Auth., Wastewater Rev. Ref. Bonds (1998 Wastewater Project and 2003 Wastewater Project), Series 2014, Build America Mutual insured, 5.00% 2019 | $950 | $1,081 |
| Stockton Unified School Dist., G.O. Bonds, Series 2014-A, Assured Guaranty Municipal insured, 5.00% 2026 | 850 | 1,038 |
| Temecula Valley Unified School District, Fncg. Auth. Rev. Bonds, BAM insured, 5.00% 2023 | 300 | 368 |
| Temecula Valley Unified School District, Fncg. Auth. Rev. Bonds, BAM insured, 5.00% 2024 | 535 | 662 |
| Temecula Valley Unified School District, Fncg. Auth. Rev. Bonds, BAM insured, 5.00% 2025 | 300 | 369 |
| Temecula Valley Unified School District, Fncg. Auth. Rev. Bonds, BAM insured, 5.00% 2028 | 1,000 | 1,198 |
| Temecula Valley Unified School District, Fncg. Auth. Rev. Bonds, BAM insured, 5.00% 2029 | 500 | 594 |
Tobacco Securitization Auth. of Southern California, Tobacco Settlement Asset-backed Rev. Ref. Bonds
(San Diego County Tobacco Asset Securitization Corp.), Series 2006-A, 4.75% 2025 | 5,360 | 5,361 |
| Successor Agcy. To The Tracy Community Dev. Agcy., Tax Allocation Rev. Ref. Bonds, Series 2016, Assured Guaranty Municipal insured, 5.00% 2025 | 950 | 1,188 |
| Successor Agcy. To The Tracy Community Dev. Agcy., Tax Allocation Rev. Ref. Bonds, Series 2016, Assured Guaranty Municipal insured, 5.00% 2026 | 375 | 469 |
| Successor Agcy. To The Tracy Community Dev. Agcy., Tax Allocation Rev. Ref. Bonds, Series 2016, Assured Guaranty Municipal insured, 5.00% 2027 | 500 | 617 |
| Tuolumne Wind Project Auth., Rev. Bonds (Tuolumne Co. Project), Series 2009-A, 5.00% 2017 | 2,000 | 2,081 |
| City of Tustin, Community Facs. Dist. No. 06-1, Special Tax Bonds (Tustin Legacy/Retail Center), Series 2015-A, 5.00% 2028 | 485 | 576 |
| Regents of the University of California, General Rev. Bonds, Series 2015-I, 3.00% 2016 | 1,000 | 1,008 |
| Dept. of Water Resources, Power Supply Rev. Ref. Bonds, Series 2005-F-3, 5.00% 2021 | 1,500 | 1,643 |
| Dept. of Water Resources, Power Supply Rev. Ref. Bonds, Series 2010-L, 5.00% 2017 | 2,250 | 2,379 |
| Dept. of Water Resources, Power Supply Rev. Ref. Bonds, Series 2011-N, 5.00% 2019 | 2,500 | 2,840 |
| Dept. of Water Resources, Power Supply Rev. Ref. Bonds, Series 2011-N, 5.00% 2020 | 2,500 | 2,930 |
| Dept. of Water Resources, Water System Rev. Ref. Bonds (Central Valley Project), Series AM, 5.00% 2019 | 2,000 | 2,318 |
| | | 423,674 |
| Colorado 1.46% | | |
| City and County of Denver, Airport System Rev. Bonds, Series 2013-A, AMT, 5.00% 2021 | 1,000 | 1,185 |
| City and County of Denver, Airport System Rev. Bonds, Series 2013-A, AMT, 5.00% 2022 | 1,300 | 1,563 |
| City and County of Denver, Airport System Rev. Ref. Bonds, Series 2010-A, 5.00% 2021 | 3,000 | 3,508 |
| City and County of Denver, Airport System Rev. Ref. Bonds, Series 2011-A, AMT, 5.00% 2021 | 3,445 | 4,098 |
| City and County of Denver, Airport System Rev. Ref. Bonds, Series 2011-A, AMT, 5.25% 2018 | 2,500 | 2,783 |
| City and County of Denver, Airport System Rev. Ref. Bonds, Series 2011-A, AMT, 5.75% 2020 | 2,700 | 3,241 |
| Denver Urban Renewal Auth., Stapleton Tax Increment Rev. Bonds, Series 2013-A-1, 5.00% 2021 | 3,800 | 4,487 |
| Denver Urban Renewal Auth., Stapleton Tax Increment Rev. Bonds, Series 2013-A-1, 5.00% 2022 | 4,000 | 4,784 |
| Health Facs. Auth. Rev. Bonds (Catholic Health Initiatives), Series 2014-B-3, 1.875% 2039 (put 2019) | 1,000 | 1,013 |
Health Facs. Auth., Health Facs. Rev. Ref. Bonds (Evangelical Lutheran Good Samaritan Society Project),
Series 2015-A, 5.00% 2021 | 1,200 | 1,377 |
Health Facs. Auth., Health Facs. Rev. Ref. Bonds (Evangelical Lutheran Good Samaritan Society Project),
Series 2015-A, 5.00% 2022 | 1,500 | 1,739 |
Health Facs. Auth., Health Facs. Rev. Ref. Bonds (Evangelical Lutheran Good Samaritan Society Project),
Series 2015-A, 5.00% 2024 | 1,500 | 1,762 |
Health Facs. Auth., Health Facs. Rev. Ref. Bonds (Evangelical Lutheran Good Samaritan Society Project),
Series 2015-A, 5.00% 2025 | 3,000 | 3,535 |
| Health Facs. Auth., Rev. Ref. Bonds (Covenant Retirement Communities, Inc.), Series 2015-A, 2.00% 2016 | 550 | 555 |
| Health Facs. Auth., Rev. Ref. Bonds (Covenant Retirement Communities, Inc.), Series 2015-A, 5.00% 2021 | 1,750 | 2,012 |
| Park Creek Metropolitan District, Limited Property Tax Supported Rev. Ref. Bonds, Series 2015-A, 5.00% 2023 | 1,400 | 1,683 |
| Park Creek Metropolitan District, Limited Property Tax Supported Rev. Ref. Bonds, Series 2015-A, 5.00% 2024 | 1,080 | 1,304 |
| Park Creek Metropolitan District, Limited Property Tax Supported Rev. Ref. Bonds, Series 2015-A, 5.00% 2025 | 3,835 | 4,663 |
| Public Auth. for Colorado Energy, Natural Gas Purchase Rev. Bonds, Series 2008, 5.75% 2018 | 235 | 254 |
| Regional Transportation Dist., Certs. of Part., Series 2010-A, 5.00% 2018 | 1,640 | 1,795 |
| Regents of the University of Colorado, University Enterprise Rev. Bonds, Series 2009-A, 5.00% 2018 | 1,750 | 1,926 |
| | | 49,267 |
Limited Term Tax-Exempt Bond Fund of America — Page 6 of 34
Bonds, notes & other debt instruments
Connecticut 0.95% | Principal amount
(000) | Value
(000) |
| Various Purpose G.O. Bonds, Series 2015-C, 0.91% 20211 | $7,500 | $7,468 |
| Various Purpose G.O. Bonds, Series 2015-D, 0.76% 20181 | 2,000 | 1,992 |
| Housing Fin. Auth., Housing Mortgage Fin. Program Bonds, Series 2014-C-1, 4.00% 2044 | 915 | 995 |
Housing Fin. Auth., Housing Mortgage Fin. Program Rev. Ref. Bonds,
Series 2012-F-2, AMT, 2.75% 2035 | 720 | 732 |
Housing Fin. Auth., Housing Mortgage Fin. Program Rev. Ref. Bonds,
Series 2015-A, 3.50% 2044 | 5,995 | 6,402 |
| Housing Fin. Auth., Housing Mortgage Fin. Program Rev. Ref. Bonds, Series 2015-C-1, 3.50% 2045 | 2,000 | 2,146 |
| Special Tax Obligation Ref. Bonds, Transportation Infrastructure Purposes, Series 2009-1, 5.00% 2018 | 2,500 | 2,713 |
| Special Tax Obligation Ref. Bonds, Transportation Infrastructure Purposes, Series 2009-1, 5.00% 2019 | 8,550 | 9,589 |
| | | 32,037 |
| Delaware 0.02% | | |
| Housing Auth., Single-family Mortgage Rev. Ref. Bonds, Series 2009-A-1, 5.45% 2040 | 610 | 630 |
| District of Columbia 0.98% | | |
| Convention Center Auth., Dedicated Tax Rev. Ref. Bonds, Series 2007-A, AMBAC insured, 5.00% 2016 | 2,500 | 2,576 |
| Convention Center Auth., Dedicated Tax Rev. Ref. Bonds, Series 2007-A, AMBAC insured, 5.00% 2018 | 5,000 | 5,153 |
| G.O. Ref. Bonds, Series 2007-B, AMBAC insured, 5.00% 2017 | 3,000 | 3,182 |
| G.O. Ref. Bonds, Series B, XLCA-Assured Guaranty Municipal insured, 5.25% 2020 | 2,000 | 2,362 |
University Rev. Bonds (Georgetown University Issue), Series 2001-B,
4.70% 2031 (put 2018) | 8,500 | 9,135 |
| Hospital Rev. Ref. Bonds (Children’s Hospital Obligated Group Issue), 5.00% 2027 | 1,500 | 1,855 |
| Dist. of Columbia, Income Tax Secured Rev. Ref. Bonds, Series 2009-B, 5.00% 2017 | 4,000 | 4,323 |
| Metropolitan Washington Airports Auth., Airport System Rev. Bonds, Series 2008-A, AMT, 5.50% 2017 | 1,000 | 1,078 |
| Metropolitan Washington Airports Auth., Airport System Rev. Ref. Bonds, Series 2012-A, AMT, 5.00% 2020 | 3,000 | 3,488 |
| | | 33,152 |
| Florida 8.71% | | |
Brevard County Educational Facs. Auth., Demand Rev. Bonds (Florida Institute of Technology Project),
Series 2014, 5.00% 2023 | 1,100 | 1,315 |
| Broward County, Airport System Rev. Ref. Bonds, Series 2009-O, 5.00% 2016 | 1,000 | 1,031 |
| Broward County, Airport System Rev. Ref. Bonds, Series 2012-P-1, AMT, 5.00% 2024 | 5,000 | 5,876 |
| Dept. of Children and Family Services, Certs. of Part. (Florida Civil Commitment Center Project), Series 2006, National insured, 5.00% 2016 | 1,000 | 1,031 |
| Citizens Property Insurance Corp., Coastal Account Secured Bonds, Series 2011-A-1, 5.00% 2018 | 2,000 | 2,184 |
| Citizens Property Insurance Corp., Coastal Account Secured Bonds, Series 2011-A-1, 5.00% 2019 | 5,000 | 5,627 |
| Citizens Property Insurance Corp., High-Risk Account Secured Bonds, Series 2009-A-1, 5.50% 2017 | 10,035 | 10,683 |
| Citizens Property Insurance Corp., High-Risk Account Secured Bonds, Series 2010-A-1, 5.25% 2017 | 5,850 | 6,209 |
| Citizens Property Insurance Corp., High-Risk Account Secured Rev. Ref. Bonds, Series 2015-A-1, 5.00% 2020 | 3,500 | 3,988 |
Citizens Property Insurance Corp., Personal Lines Account/Commercial Lines Account Secured Bonds,
Series 2012-A-1, 5.00% 2019 | 3,600 | 4,051 |
Citizens Property Insurance Corp., Personal Lines Account/Commercial Lines Account Secured Bonds,
Series 2012-A-1, 5.00% 2020 | 4,500 | 5,207 |
Citizens Property Insurance Corp., Personal Lines Account/Commercial Lines Account Secured Bonds,
Series 2012-A-1, 5.00% 2021 | 1,000 | 1,179 |
Citizens Property Insurance Corp., Personal Lines Account/Commercial Lines Account Secured Bonds,
Series 2012-A-1, 5.00% 2022 | 10,200 | 12,255 |
Collier County Health Facs. Auth., Residential Care Fac. Rev. Bonds (Moorings Inc.), Series 2015-A,
5.00% 2023 | 400 | 479 |
Collier County Health Facs. Auth., Residential Care Fac. Rev. Bonds (Moorings Inc.), Series 2015-A,
5.00% 2024 | 500 | 602 |
Collier County Health Facs. Auth., Residential Care Fac. Rev. Bonds (Moorings Inc.), Series 2015-A,
5.00% 2025 | 330 | 400 |
Limited Term Tax-Exempt Bond Fund of America — Page 7 of 34
Bonds, notes & other debt instruments
Florida (continued) | Principal amount
(000) | Value
(000) |
Collier County Health Facs. Auth., Residential Care Fac. Rev. Bonds (Moorings Inc.), Series 2015-A,
5.00% 2026 | $350 | $419 |
Collier County Health Facs. Auth., Residential Care Fac. Rev. Bonds (Moorings Inc.), Series 2015-A,
5.00% 2027 | 240 | 284 |
Collier County Health Facs. Auth., Residential Care Fac. Rev. Bonds (Moorings Inc.), Series 2015-A,
5.00% 2028 | 445 | 524 |
Community Redev. Agcy., Tax Increment Rev. Bonds (Southeast Overtown/Park West), Series 2014-A-1,
5.00% 20222 | 1,000 | 1,154 |
| Dept. of Environmental Protection, Forever Rev. Bonds, Series 2007-B, National insured, 5.00% 2018 | 3,000 | 3,221 |
Escambia County Health Facs. Auth., Health Care Facs. Rev. Bonds (Baptist Hospital, Inc. Project),
Series 2010-A, 5.00% 2017 | 2,510 | 2,651 |
Escambia County Health Facs. Auth., Health Care Facs. Rev. Bonds (Baptist Hospital, Inc. Project),
Series 2010-A, 5.125% 2020 | 1,270 | 1,455 |
Escambia County Housing Fin. Auth., Single-family Mortgage Rev. Bonds (Multi-County Program),
Series 2007-B, AMT, 4.70% 2039 | 690 | 691 |
Greater Orlando Aviation Auth., Airport Facs. Rev. Ref. Bonds, Series 2007-A, AMT,
Assured Guaranty Municipal insured, 5.00% 2016 | 2,000 | 2,062 |
Greater Orlando Aviation Auth., Airport Facs. Rev. Ref. Bonds, Series 2008-A, AMT,
Assured Guaranty Municipal insured, 5.25% 2018 | 1,200 | 1,333 |
| Greater Orlando Aviation Auth., Airport Facs. Rev. Ref. Bonds, Series 2009-A, AMT, 6.00% 2016 | 2,500 | 2,593 |
| Greater Orlando Aviation Auth., Airport Facs. Rev. Ref. Bonds, Series 2012-A, AMT, 5.00% 2021 | 5,915 | 7,035 |
| Hillsborough County Industrial Dev. Auth., Pollution Control Rev. Ref. Bonds (Tampa Electric Co. Project), Series 2007-A, 5.65% 2018 | 4,000 | 4,399 |
| Housing Fin. Corp., Homeowner Mortgage Rev. Bonds (Special Program), Series 1, 4.00% 2047 | 1,250 | 1,374 |
| Housing Fin. Corp., Homeowner Mortgage Rev. Bonds (Special Program), Series 2009-A-1, 5.00% 2028 | 1,400 | 1,493 |
| Housing Fin. Corp., Homeowner Mortgage Rev. Bonds (Special Program), Series 2015-A, 3.50% 2046 | 580 | 619 |
| Housing Fin. Corp., Homeowner Mortgage Rev. Bonds, Series 2007-6, AMT, 4.35% 2016 | 300 | 300 |
| Housing Fin. Corp., Homeowner Mortgage Rev. Bonds, Series 2007-6, AMT, 4.45% 2017 | 285 | 285 |
| Housing Fin. Corp., Homeowner Mortgage Rev. Bonds, Series 2009-2, 5.50% 2041 | 275 | 287 |
| Hurricane Catastrophe Fund Fin. Corp., Rev. Bonds, Series 2010-A, 5.00% 2016 (escrowed to maturity) | 5,000 | 5,099 |
| City of Jacksonville, Better Jacksonville Sales Tax Rev. Ref. Bonds, Series 2011, 5.00% 2017 | 4,000 | 4,285 |
| City of Jacksonville, Better Jacksonville Sales Tax Rev. Ref. Bonds, Series 2011, 5.00% 2019 | 5,000 | 5,709 |
| Jacksonville Aviation Auth., Rev. Bonds, Series 2006, AMT, AMBAC insured, 5.00% 2018 | 7,585 | 7,828 |
| Jacksonville Aviation Auth., Rev. Bonds, Series 2006, AMT, AMBAC insured, 5.00% 2021 | 1,830 | 1,888 |
| Jacksonville Aviation Auth., Rev. Bonds, Series 2006, AMT, AMBAC insured, 5.00% 2023 | 1,935 | 1,995 |
| City of Lakeland, Energy System Rev. Ref. Bonds, 5.00% 2017 | 500 | 536 |
| City of Lakeland, Energy System Rev. Ref. Bonds, 5.00% 2019 | 400 | 458 |
| City of Lakeland, Energy System Rev. Ref. Bonds, 5.00% 2024 | 1,000 | 1,257 |
| City of Lakeland, Energy System Rev. Ref. Bonds, 5.00% 2025 | 1,000 | 1,271 |
| City of Lakeland, Retirement Community First Mortgage Rev. Ref. Bonds (Carpenter’s Home Estates, Inc. Project), Series 2008, 5.875% 2019 | 615 | 667 |
| Lee County, Airport Rev. Ref. Bonds, Series 2010-A, AMT, Assured Guaranty insured, 5.00% 2016 | 2,535 | 2,612 |
| Dept. of Management Services, Certs. of Part., Series 2009-A, 5.00% 2017 | 4,990 | 5,324 |
| Dept. of Management Services, Certs. of Part., Series 2009-A, 5.00% 2019 | 2,500 | 2,784 |
| City of Miami Beach Health Facs. Auth., Hospital Rev. Ref. Bonds (Mount Sinai Medical Center of Florida), Series 2012, 5.00% 2019 | 1,650 | 1,867 |
| City of Miami Beach Health Facs. Auth., Hospital Rev. Ref. Bonds (Mount Sinai Medical Center of Florida), Series 2012, 5.00% 2021 | 1,000 | 1,178 |
Miami-Dade County Educational Facs. Auth., Rev. Bonds (University of Miami Issue),
Series 2008-A, 5.25% 2020 | 2,270 | 2,290 |
| Miami-Dade County Educational Facs. Auth., Rev. Ref. Bonds (University of Miami Issue), Series 2007-B, AMBAC insured, 5.25% 2018 | 3,760 | 4,084 |
| Miami-Dade County Expressway Auth., Toll System Rev. Ref. Bonds, Series 2013-A, 5.00% 2020 | 1,225 | 1,427 |
| Miami-Dade County, Aviation Rev. Bonds, Series 2010-A, 5.00% 2021 | 2,250 | 2,606 |
| Miami-Dade County, Aviation Rev. Ref. Bonds, AMT, 5.00% 2023 | 945 | 1,151 |
Limited Term Tax-Exempt Bond Fund of America — Page 8 of 34
Bonds, notes & other debt instruments
Florida (continued) | Principal amount
(000) | Value
(000) |
| Miami-Dade County, Aviation Rev. Ref. Bonds, Series 2012-A, AMT, 5.00% 2020 | $2,000 | $2,324 |
| Miami-Dade County, Aviation Rev. Ref. Bonds, Series 2012-A, AMT, 5.00% 2021 | 11,600 | 13,766 |
| Miami-Dade County, Aviation Rev. Ref. Bonds, Series 2014-A, AMT, 5.00% 2027 | 1,325 | 1,577 |
| Miami-Dade County, Expressway Auth. Toll System Rev. Ref. Bonds, Series 2014-B, 5.00% 2022 | 1,750 | 2,107 |
| Miami-Dade County, G.O. Bonds (Building Better Communities Program), Series 2008-B, 5.00% 2017 | 2,500 | 2,652 |
Miami-Dade County, Miami International Airport (Hub of the Americas), Aviation Rev. Ref. Bonds,
Series 2003-E, AMT, National insured, 5.375% 2017 | 2,000 | 2,153 |
Miami-Dade County, Miami International Airport (Hub of the Americas), Aviation Rev. Ref. Bonds,
Series 2009-A, 5.75% 2022 | 1,500 | 1,756 |
Miami-Dade County, Miami International Airport (Hub of the Americas), Aviation Rev. Ref. Bonds,
Series 2009-B, 5.50% 2018 | 3,580 | 4,003 |
Miami-Dade County, Miami International Airport (Hub of the Americas), Aviation Rev. Ref. Bonds,
Series 2009-B, 5.75% 2021 | 2,000 | 2,344 |
| Miami-Dade County, Transit System Sales Surtax Rev. Bonds, Series 2012, 5.00% 2019 | 1,250 | 1,416 |
| Miami-Dade County, Transit System Sales Surtax Rev. Bonds, Series 2012, 5.00% 2020 | 550 | 640 |
| Miami-Dade County, Transit System Sales Surtax Rev. Bonds, Series 2012, 5.00% 2021 | 1,500 | 1,789 |
| Miami-Dade County, Water and Sewer System Rev. Ref. Bonds, Series 2008-C, 5.25% 2017 | 3,000 | 3,228 |
| School Board of Miami-Dade County, Certs. of Part., Series 2006-C, AMBAC insured, 5.00% 2017 | 1,140 | 1,222 |
| School Board of Miami-Dade County, Certs. of Part., Series 2008-A, AMBAC insured, 5.00% 2017 | 5,000 | 5,327 |
| School Board of Miami-Dade County, Certs. of Part., Series 2011-B, 5.00% 2032 (put 2016) | 3,000 | 3,037 |
| Miami-Dade County Expressway Auth., Toll System Rev. Ref. Bonds, Series 2013-A, 5.00% 2021 | 1,500 | 1,790 |
| Municipal Power Agcy., All-Requirements Power Supply Project Rev. Bonds, Series 2008-A, 5.00% 2017 | 2,500 | 2,672 |
| Municipal Power Agcy., All-Requirements Power Supply Project Rev. Bonds, Series 2008-A, 5.00% 2018 | 4,650 | 5,132 |
| Municipal Power Agcy., All-Requirements Power Supply Project Rev. Bonds, Series 2009, 5.25% 2020 | 2,430 | 2,813 |
| Municipal Power Agcy., All-Requirements Power Supply Project Rev. Bonds, Series 2015-B, 5.00% 2026 | 850 | 1,054 |
| Municipal Power Agcy., Rev. Bonds (St. Lucie Project), Series 2009-A, 5.00% 2017 | 3,455 | 3,693 |
| Municipal Power Agcy., Stanton Project Rev. Ref. Bonds, Series 2008, 5.125% 2017 | 5,000 | 5,363 |
| Orlando Utilities Commission, Utility System Rev. Ref. Bonds, Series 2006, 5.00% 2018 | 1,000 | 1,033 |
| Orlando-Orange County Expressway Auth., Rev. Ref. Bonds, Series 2012, 5.00% 2019 | 1,250 | 1,416 |
| Orlando-Orange County Expressway Auth., Rev. Ref. Bonds, Series 2012, 5.00% 2020 | 1,500 | 1,747 |
| Orlando-Orange County Expressway Auth., Rev. Ref. Bonds, Series 2012-B, 5.00% 2020 | 1,000 | 1,164 |
| Orlando-Orange County Expressway Auth., Rev. Ref. Bonds, Series 2012-B, 5.00% 2022 | 1,250 | 1,518 |
| Orlando-Orange County Expressway Auth., Rev. Ref. Bonds, Series 2012-B, 5.00% 2023 | 1,500 | 1,840 |
| Palm Beach County Health Facs. Auth., Rev. Bonds (Lifespaces Communities, Inc.), Series 2015-C, 5.00% 2022 | 1,690 | 1,984 |
| Solid Waste Auth. of Palm Beach County, Improvement Rev. Ref. Bonds, Series 2011, 5.00% 2019 | 5,000 | 5,714 |
| Ports Fncg. Commission, Rev. Ref. Bonds (State Transportation Trust Fund), Series 2011-B, AMT, 5.00% 2017 | 1,500 | 1,588 |
| Ports Fncg. Commission, Rev. Ref. Bonds (State Transportation Trust Fund), Series 2011-B, AMT, 5.00% 2021 | 2,500 | 2,951 |
| Putnam County Dev. Auth., Pollution Control Rev. Ref. Bonds (Seminole Electric Cooperative, Inc. Project), Series 2007-B, AMBAC insured, 5.35% 2042 (put 2018) | 10,370 | 11,307 |
| South Florida Water Management District, Certificates of Participation, 5.00% 2026 | 2,000 | 2,500 |
| State Board of Education, Public Education Capital Outlay Bonds, Series 2007-D, 5.00% 2020 | 3,500 | 3,879 |
Sumter County Industrial Dev. Auth., Hospital Rev. Bonds (Central Florida Health Alliance Projects),
Series 2014-A, 5.00% 2021 | 500 | 581 |
Sumter County Industrial Dev. Auth., Hospital Rev. Bonds (Central Florida Health Alliance Projects),
Series 2014-A, 5.00% 2026 | 500 | 586 |
Sumter County Industrial Dev. Auth., Hospital Rev. Bonds (Central Florida Health Alliance Projects),
Series 2014-A, 5.00% 2027 | 330 | 383 |
| City of Tallahassee, Energy System Rev. Ref. Bonds, Series 2010, 5.00% 2016 | 1,410 | 1,454 |
City of Tallahassee, Health Facs. Rev. Ref. Bonds (Tallahassee Memorial HealthCare, Inc. Project),
Series 2016-A, 5.00% 2021 | 530 | 623 |
| City of Tampa, Health System Rev. Ref. Bonds (Baycare Health System Issue), Series 2010, 5.00% 2017 | 1,500 | 1,613 |
| City of Tampa, Health System Rev. Ref. Bonds (Baycare Health System Issue), Series 2010, 5.00% 2018 | 5,000 | 5,556 |
| City of Tampa, Rev. Ref. and Capital Improvement Cigarette Tax Allocation Bonds (H. Lee Moffitt Cancer Center Project), Series 2012-A, 5.00% 2018 | 885 | 972 |
| Tampa Bay Water, Utility System Rev. Ref. Bonds, Series 2011-A, 5.00% 2017 | 5 | 5 |
Limited Term Tax-Exempt Bond Fund of America — Page 9 of 34
Bonds, notes & other debt instruments
Florida (continued) | Principal amount
(000) | Value
(000) |
| Tampa Bay Water, Utility System Rev. Ref. Bonds, Series 2011-A, 5.00% 2017 (escrowed to maturity) | $1,170 | $1,255 |
| Tampa Bay Water, Utility System Rev. Ref. Bonds, Series 2011-A, 5.00% 2017 (escrowed to maturity) | 1,075 | 1,153 |
| Dept. of Transportation, Right-of-Way Acquisition and Bridge Construction Bonds, Series 2008-A, 5.00% 2017 | 3,435 | 3,656 |
Dept. of Transportation, Right-of-Way Acquisition and Bridge Construction Ref. Bonds,
Series 2012-B, 5.00% 2023 | 3,000 | 3,682 |
| Dept. of Transportation, Turnpike Rev. Bonds, Series 2007-A, National insured, 5.00% 2016 | 5,000 | 5,101 |
| Dept. of Transportation, Turnpike Rev. Ref. Bonds, Series 2016-A, 5.00% 2018 | 2,000 | 2,197 |
| Water Pollution Control Fncg. Corp., Water Pollution Control Rev. Bonds, Series 2008-A, 4.00% 2017 | 2,000 | 2,069 |
| Water Pollution Control Fncg. Corp., Water Pollution Control Rev. Bonds, Series 2008-A, 5.00% 2020 | 2,000 | 2,245 |
| | | 294,242 |
| Georgia 2.75% | | |
| Atlanta Dev. Auth., Student Housing Facs. Rev. Ref. Bonds (Piedmont/Ellis, LLC University Commons Project), Series 2013, 5.00% 2022 | 1,210 | 1,479 |
| Atlanta Dev. Auth., Student Housing Facs. Rev. Ref. Bonds (Piedmont/Ellis, LLC University Commons Project), Series 2013, 5.00% 2023 | 1,825 | 2,262 |
| City of Atlanta, Water and Wastewater Rev. Ref. Bonds, Series 2013-B, 5.00% 2020 | 2,000 | 2,359 |
DeKalb County Hospital Auth., Rev. Ref. Anticipation Certificates (DeKalb Medical
Center, Inc. Project), Series 2010, 5.25% 2020 | 8,750 | 9,920 |
| DeKalb County, Water and Sewerage Rev. Bonds (Second Resolution), Series 2011-A, 5.00% 2022 | 1,000 | 1,211 |
| Housing and Fin. Auth., Single-family Mortgage Bonds, Series 2015-A-1, 3.50% 2045 | 1,000 | 1,070 |
| Main Street Natural Gas, Inc., Gas Project Rev. Bonds, Series 2006-B, 5.00% 2016 | 4,470 | 4,495 |
| Main Street Natural Gas, Inc., Gas Project Rev. Bonds, Series 2006-B, 5.00% 2017 | 1,500 | 1,563 |
| Main Street Natural Gas, Inc., Gas Project Rev. Bonds, Series 2006-B, 5.00% 2020 | 5,000 | 5,604 |
| Metropolitan Atlanta Rapid Transit Auth., Sales Tax Rev. Ref. Bonds (Third Indenture Series), Series 2005-A, FGIC-National insured, 5.00% 2020 | 4,000 | 4,690 |
Metropolitan Atlanta Rapid Transit Auth., Sales Tax Rev. Ref. Bonds, Series 2014-B,
0.29% 2025 (put 2017)1 | 9,000 | 8,999 |
| Municipal Electric Auth., Project One Bonds, Series 2011-A, 5.00% 2021 | 4,900 | 5,782 |
| Municipal Electric Auth., Project One Rev. Ref. Bonds, Series 2008-D, 5.75% 2019 | 16,000 | 17,919 |
| Public Gas Partners, Inc., Gas Project Rev. Ref. Bonds (Gas Supply Pool No. 1), Series A, 5.00% 2017 | 5,000 | 5,360 |
| Public Gas Partners, Inc., Gas Project Rev. Ref. Bonds (Gas Supply Pool No. 1), Series A, 5.00% 2018 | 10,930 | 12,089 |
Private Colleges and Universities Auth., Rev. Bonds (The Savannah College of Art and Design Projects),
Series 2014, 5.00% 2022 | 1,050 | 1,232 |
Private Colleges and Universities Auth., Rev. Bonds (The Savannah College of Art and Design Projects),
Series 2014, 5.00% 2024 | 2,500 | 2,962 |
| State Road and Tollway Auth., Federal Highway Grant Anticipation Rev. Bonds, Series 2009-A, 5.00% 2019 | 3,500 | 3,954 |
| | | 92,950 |
| Guam 0.18% | | |
| A.B. Won Pat International Airport Auth., General Rev. Bonds, Series 2013-C, AMT, 5.00% 2018 | 750 | 817 |
| A.B. Won Pat International Airport Auth., General Rev. Bonds, Series 2013-C, AMT, 5.00% 2021 | 3,320 | 3,798 |
| Education Fncg. Foundation, Certs. of Part. (Public School Facs. Project), Series 2006-A, 5.00% 2016 | 1,000 | 1,024 |
| Power Auth., Rev. Ref. Bonds, Series 2012-A, Assured Guaranty Municipal insured, 5.00% 2021 | 500 | 597 |
| | | 6,236 |
| Hawaii 0.75% | | |
| Airports System Rev. Bonds, Series 2010-B, AMT, 5.00% 2018 | 9,900 | 10,840 |
| G.O. Bonds of 2011, Series DZ, 5.00% 2020 | 1,885 | 2,235 |
| G.O. Bonds, Series CM, FGIC-Assured Guaranty Municipal insured, 6.50% 2016 | 3,000 | 3,154 |
| G.O. Bonds, Series DQ, 5.00% 2016 (escrowed to maturity) | 455 | 462 |
| G.O. Ref. Bonds of 2011, Series EA, 5.00% 2019 | 1,000 | 1,152 |
| Harbor System Rev. Ref. Bonds, Series 2007-A, AMT, Assured Guaranty Municipal insured, 5.25% 2016 | 1,000 | 1,021 |
| City and County of Honolulu, G.O. Bonds, Series 2007-A, Assured Guaranty Municipal insured, 5.00% 2019 | 1,000 | 1,063 |
| City and County of Honolulu, G.O. Bonds, Series 2012-B, 5.00% 2021 | 1,250 | 1,517 |
Limited Term Tax-Exempt Bond Fund of America — Page 10 of 34
Bonds, notes & other debt instruments
Hawaii (continued) | Principal amount
(000) | Value
(000) |
City and County of Honolulu, Wastewater System Rev. Bonds (First Bond Resolution), Series 2015-B,
5.00% 2026 | $1,000 | $1,263 |
Pacific Health Obligated Group, Special Purpose Rev. Bonds (Dept. of Budget and Fin.),
Series 2010-B, 5.00% 2016 | 450 | 458 |
Pacific Health Obligated Group, Special Purpose Rev. Bonds (Dept. of Budget and Fin.),
Series 2010-B, 5.00% 2017 | 450 | 476 |
Pacific Health Obligated Group, Special Purpose Rev. Bonds (Dept. of Budget and Fin.),
Series 2010-B, 5.00% 2018 | 500 | 546 |
| Dept. of Transportation, Airports Division Lease Rev. Certs. of Part., Series 2013, AMT, 5.00% 2023 | 1,000 | 1,204 |
| | | 25,391 |
| Idaho 0.36% | | |
| Housing and Fin. Assn., Grant and Rev. Anticipation Bonds (Federal Highway Trust Fund), Series 2009-A, 5.00% 2017 | 4,500 | 4,772 |
| Housing and Fin. Assn., Grant and Rev. Anticipation Bonds (Federal Highway Trust Fund), Series 2009-A, 5.00% 2020 | 3,000 | 3,383 |
| Housing and Fin. Assn., Grant and Rev. Anticipation Bonds (Federal Highway Trust Fund), Series 2015-A, 5.00% 2025 | 1,500 | 1,841 |
| Housing and Fin. Assn., Grant and Rev. Anticipation Bonds (Federal Highway Trust Fund), Series 2015-A, 5.00% 2026 | 1,515 | 1,874 |
| Housing and Fin. Assn., Single-family Mortgage Bonds, Series 2003-E, Class III, AMT, 5.15% 2023 | 335 | 335 |
| | | 12,205 |
| Illinois 6.99% | | |
| Build Bonds (Sales Tax Rev. Bonds), Series June 2013, 5.00% 2020 | 1,000 | 1,154 |
| Build Bonds (Sales Tax Rev. Ref. Bonds), Second Series May 2002, FGIC-National insured, 5.75% 2019 | 2,390 | 2,749 |
| Build Bonds (Sales Tax Rev. Ref. Bonds), Series June 2010, 5.00% 2016 | 1,000 | 1,018 |
| Build Bonds (Sales Tax Rev. Ref. Bonds), Series June 2010, 5.00% 2020 | 1,000 | 1,154 |
| Village of Cary, McHenry County, Special Service Area Number One, Special Tax Ref. Bonds, Series 2006, RADIAN insured, 4.40% 2016 | 100 | 100 |
| Village of Cary, McHenry County, Special Service Area Number Two, Special Tax Ref. Bonds, Series 2006, RADIAN insured, 4.40% 2016 | 132 | 133 |
| Chicago Transit Auth., Capital Grant Receipts Rev. Bonds (Federal Transit Administration Section 5307 Guideway Modernization Formula Funds), Assured Guaranty insured, 5.00% 2022 | 1,400 | 1,604 |
| Chicago Transit Auth., Capital Grant Receipts Rev. Bonds, Assured Guaranty insured, 5.00% 2019 | 4,595 | 4,770 |
Chicago Transit Auth., Capital Grant Receipts Rev. Bonds, Assured Guaranty insured,
5.00% 2019 (preref. 2016) | 905 | 940 |
| Chicago Transit Auth., Sales Tax Receipts Rev. Bonds, Series 2011, 5.00% 2021 | 2,000 | 2,299 |
| City of Chicago, Chicago Midway Airport, Rev. Ref. Bonds, Series 2014-A, AMT, 5.00% 2023 | 1,000 | 1,183 |
| City of Chicago, Chicago Midway Airport, Rev. Ref. Bonds, Series 2014-A, AMT, 5.00% 2024 | 7,000 | 8,323 |
City of Chicago, O’Hare International Airport, General Airport Rev. Bonds,
Series 2011-B, 5.00% 2017 | 1,500 | 1,561 |
City of Chicago, O’Hare International Airport, General Airport Rev. Bonds,
Series 2011-B, 5.00% 2019 | 2,785 | 3,093 |
City of Chicago, O’Hare International Airport, General Airport Rev. Bonds,
Series 2012-B, AMT, 5.00% 2024 | 2,000 | 2,314 |
City of Chicago, O’Hare International Airport, General Airport Rev. Bonds,
Series 2013-A, AMT, 5.00% 2022 | 3,055 | 3,591 |
City of Chicago, O’Hare International Airport, General Airport Rev. Ref. Bonds,
Series 2008-A, Assured Guaranty Municipal insured, 5.00% 2019 | 2,000 | 2,155 |
City of Chicago, O’Hare International Airport, General Airport Rev. Ref. Bonds,
Series 2012-A, AMT, 5.00% 2025 | 6,170 | 7,065 |
City of Chicago, O’Hare International Airport, General Airport Rev. Ref. Bonds,
Series 2013-A, AMT, 5.00% 2021 | 10,000 | 11,567 |
Limited Term Tax-Exempt Bond Fund of America — Page 11 of 34
Bonds, notes & other debt instruments
Illinois (continued) | Principal amount
(000) | Value
(000) |
City of Chicago, O’Hare International Airport, General Airport Rev. Ref. Bonds,
Series 2013-A, AMT, 5.00% 2023 | $5,000 | $5,933 |
| City of Chicago, O’Hare International Airport, General Airport Rev. Ref. Bonds, Series 2015-B, 5.00% 2023 | 1,500 | 1,813 |
City of Chicago, O’Hare International Airport, Passenger Fac. Charge Rev. Ref. Bonds,
Series 2012-B, AMT, 5.00% 2018 | 2,000 | 2,146 |
City of Chicago, O’Hare International Airport, Passenger Fac. Charge Rev. Ref. Bonds,
Series 2012-B, AMT, 5.00% 2019 | 2,000 | 2,211 |
City of Chicago, O’Hare International Airport, Passenger Fac. Charge Rev. Ref. Bonds,
Series 2013-B, AMT, 5.00% 2022 | 3,000 | 3,526 |
| City of Chicago, Wastewater Transmission Rev. Project Bonds, Series 2012, 5.00% 2021 | 850 | 959 |
| City of Chicago, Wastewater Transmission Rev. Ref. Bonds, Series 2014, 5.00% 2022 | 400 | 456 |
| City of Chicago, Wastewater Transmission Rev. Ref. Bonds, Series 2014, 5.00% 2023 | 500 | 574 |
| City of Chicago, Water Rev. Ref. Bonds, Series 2014, 5.00% 2023 | 700 | 812 |
| County of Cook, G.O. Ref. Bonds, Series 2009-A, 5.00% 2016 | 2,500 | 2,578 |
| County of Cook, G.O. Ref. Bonds, Series 2011-A, 5.00% 2019 | 2,500 | 2,777 |
Regional Transportation Auth. of Cook, DuPage, Kane, Lake, McHenry and Will Counties, G.O. Bonds,
Series 2001-A, FGIC-National insured, 5.50% 2020 | 2,000 | 2,372 |
| Regional Transportation Auth. of Cook, DuPage, Kane, Lake, McHenry and Will Counties, G.O. Rev. Ref. Bonds, Series 1997, FGIC-National insured, 6.00% 2020 | 4,000 | 4,640 |
| Regional Transportation Auth. of Cook, DuPage, Kane, Lake, McHenry and Will Counties, G.O. Rev. Ref. Bonds, Series 1999, Assured Guaranty Municipal insured, 5.75% 2017 | 5,000 | 5,341 |
| Regional Transportation Auth. of Cook, DuPage, Kane, Lake, McHenry and Will Counties, G.O. Rev. Ref. Bonds, Series 1999, Assured Guaranty Municipal insured, 5.75% 2023 | 1,000 | 1,233 |
| Regional Transportation Auth. of Cook, DuPage, Kane, Lake, McHenry and Will Counties, G.O. Rev. Ref. Bonds, Series 2003-A, FGIC-National insured, 5.50% 2018 | 7,720 | 8,567 |
| Educational Facs. Auth., Rev. Bonds (University of Chicago), Series 2001-B-1, 1.10% 2036 (put 2018) | 1,250 | 1,254 |
| Fin. Auth., Rev. Bonds (Advocate Health Care Network), Series 2008-D, 5.25% 2016 | 1,000 | 1,035 |
| Fin. Auth., Rev. Bonds (Advocate Health Care Network), Series 2008-D, 5.50% 2018 | 1,000 | 1,092 |
| Fin. Auth., Rev. Bonds (Advocate Health Care Network), Series 2010-D, 5.00% 2019 | 1,000 | 1,121 |
| Fin. Auth., Rev. Bonds (Advocate Health Care Network), Series 2014, 5.00% 2021 | 375 | 447 |
| Fin. Auth., Rev. Bonds (Art Institute of Chicago), Series 2009-A, 5.25% 2019 | 1,400 | 1,576 |
| Fin. Auth., Rev. Bonds (Ascension Health Alliance Credit Group), Series 2012-E, 5.00% 2042 (put 2017) | 1,000 | 1,053 |
| Fin. Auth., Rev. Bonds (Central DuPage Health), Series 2009, 5.00% 2017 | 2,180 | 2,328 |
| Fin. Auth., Rev. Bonds (Central DuPage Health), Series 2009, 5.00% 2018 | 2,230 | 2,456 |
| Fin. Auth., Rev. Bonds (Central DuPage Health), Series 2009, 5.00% 2019 | 2,185 | 2,472 |
| Fin. Auth., Rev. Bonds (Lifespace Communitys), Series 2015-A, 5.00% 2022 | 200 | 235 |
| Fin. Auth., Rev. Bonds (Lifespace Communitys), Series 2015-A, 5.00% 2026 | 540 | 642 |
| Fin. Auth., Rev. Bonds (Lifespace Communitys), Series 2015-A, 5.00% 2028 | 1,060 | 1,245 |
| Fin. Auth., Rev. Bonds (Rehab Institute of Chicago), Series 2013-A, 5.00% 2022 | 1,665 | 1,909 |
| Fin. Auth., Rev. Bonds (University of Chicago), Series 2008-B, 5.50% 2019 | 2,500 | 2,784 |
| Fin. Auth., Rev. Bonds (University of Chicago), Series 2009-B, 5.00% 2017 | 2,325 | 2,471 |
| Fin. Auth., Rev. Bonds (University of Chicago), Series 2009-B, 5.00% 2017 (escrowed to maturity) | 175 | 186 |
| Fin. Auth., Rev. Ref. Bonds (Advocate Health Care Network), Series 2008-A-3, 5.00% 2030 (put 2019) | 6,000 | 6,737 |
| Fin. Auth., Rev. Ref. Bonds (Loyola University of Chicago), Series 2012-B, 5.00% 2023 | 1,970 | 2,306 |
| Fin. Auth., Rev. Ref. Bonds (Lutheran Hillside Village), Series 2006, 5.00% 2016 | 930 | 930 |
| Fin. Auth., Rev. Ref. Bonds (Northwestern Memorial Hospital), Series 2009-A, 5.00% 2018 | 3,000 | 3,299 |
| Fin. Auth., Rev. Ref. Bonds (OSF Healthcare System), Series 2015-A, 5.00% 2026 | 1,165 | 1,403 |
| Fin. Auth., Rev. Ref. Bonds (OSF Healthcare System), Series 2015-A, 5.00% 2029 | 1,500 | 1,769 |
| Fin. Auth., Rev. Ref. Bonds (Provena Health), Series 2009-A, 7.75% 2034 | 1,000 | 1,211 |
| Fin. Auth., Rev. Ref. Bonds (Provena Health), Series 2010-A, 5.50% 2017 | 2,500 | 2,613 |
| Fin. Auth., Rev. Ref. Bonds (University of Chicago Medical Center), Series 2009-A, 5.00% 2017 | 2,500 | 2,662 |
| Fin. Auth., Rev. Ref. Bonds (University of Chicago Medical Center), Series 2009-A, 5.00% 2018 | 7,500 | 8,266 |
Fin. Auth., Student Housing Rev. Ref. Bonds, Educational Advancement Fund, Inc. (University Center),
5.125% 2020 | 5,955 | 6,395 |
Limited Term Tax-Exempt Bond Fund of America — Page 12 of 34
Bonds, notes & other debt instruments
Illinois (continued) | Principal amount
(000) | Value
(000) |
Fin. Auth., Student Housing Rev. Ref. Bonds, Educational Advancement Fund, Inc. (University Center),
Series 2006-B, 5.00% 2016 | $4,295 | $4,318 |
| Fin. Auth., Rev. Ref. Bonds (OSF Healthcare System), Series 2015-A, 5.00% 2023 | 750 | 902 |
| Fin. Auth., Rev. Bonds (Rush University Medical Center Obligated Group), Series 2015-A, 5.00% 2026 | 1,000 | 1,219 |
| Fin. Auth., Rev. Bonds (Rush University Medical Center Obligated Group), Series 2015-A, 5.00% 2027 | 1,000 | 1,207 |
| Fin. Auth., Rev. Bonds (Rush University Medical Center Obligated Group), Series 2015-B, 5.00% 2028 | 1,050 | 1,261 |
| G.O. Bonds, Illinois FIRST, Series of August 2001, National insured, 5.50% 2017 | 1,575 | 1,661 |
| G.O. Bonds, Series of March 2013, 5.00% 2022 | 1,250 | 1,426 |
Housing Dev. Auth., Multifamily Housing Rev. Notes (Marshall Field Garden Apartment Homes),
1.01% 2050 (put 2025)1 | 10,500 | 10,446 |
Metropolitan Pier and Exposition Auth., McCormick Place Expansion Project Rev. Ref. Bonds,
Series 2012-B, 5.00% 2020 | 1,000 | 1,136 |
| Municipal Electric Agcy., Power Supply System Rev. Ref. Bonds, Series 2015-A, 5.00% 2027 | 3,000 | 3,644 |
| Railsplitter Tobacco Settlement Auth., Tobacco Settlement Rev. Bonds, Series 2010, 5.125% 2019 | 6,500 | 7,283 |
| Railsplitter Tobacco Settlement Auth., Tobacco Settlement Rev. Bonds, Series 2010, 5.25% 2020 | 6,500 | 7,507 |
| Railsplitter Tobacco Settlement Auth., Tobacco Settlement Rev. Bonds, Series 2010, 5.375% 2021 | 1,000 | 1,187 |
| Railsplitter Tobacco Settlement Auth., Tobacco Settlement Rev. Bonds, Series 2010, 5.50% 2023 | 12,425 | 14,717 |
| City of Springfield, Electric Rev. Bonds, Series 2008, 5.00% 2017 | 3,000 | 3,140 |
| State Toll Highway Auth., Toll Highway Rev. Bonds, Series 2014-D, 5.00% 2024 | 3,375 | 4,147 |
| State Toll Highway Auth., Toll Highway Rev. Bonds, Series 2006-A-1, Assured Guaranty Municipal insured, 5.00% 2018 | 2,000 | 2,040 |
| State Toll Highway Auth., Toll Highway Rev. Bonds, Series 2014-A, 5.00% 2021 | 1,250 | 1,502 |
Unemployment Insurance Fund Building Receipts Rev. Bonds (Illinois Dept. of Employment Security),
Series 2012-B, 5.00% 2017 | 2,000 | 2,082 |
Board of Trustees of The University of Illinois, University of Illinois Auxiliary Facs. System Rev. Bonds,
Series 2011-A, 5.00% 2019 | 770 | 862 |
| | | 236,295 |
| Indiana 3.38% | | |
| Fin. Auth., Health System Rev. Bonds (Franciscan Alliance, Inc.), Series 2016-B, 5.00% 2022 | 700 | 849 |
| Fin. Auth., Health System Rev. Bonds (Franciscan Alliance, Inc.), Series 2016-B, 5.00% 2023 | 500 | 611 |
| Fin. Auth., Health System Rev. Bonds (Franciscan Alliance, Inc.), Series 2016-B, 5.00% 2024 | 1,000 | 1,231 |
| Fin. Auth., Health System Rev. Bonds (Franciscan Alliance, Inc.), Series 2016-B, 5.00% 2025 | 600 | 742 |
| Fin. Auth., Health System Rev. Bonds (Franciscan Alliance, Inc.), Series 2016-B, 5.00% 2026 | 350 | 429 |
| Fin. Auth., Health System Rev. Bonds (Franciscan Alliance, Inc.), Series 2016-B, 5.00% 2027 | 220 | 268 |
| Fin. Auth., Hospital Rev. Ref. Bonds (Beacon Health Obligated Group), Series 2013-A, 5.00% 2021 | 1,000 | 1,190 |
| Fin. Auth., Hospital Rev. Ref. Bonds (Community Health Network Project), Series 2012-A, 5.00% 2020 | 1,460 | 1,674 |
| Fin. Auth., Hospital Rev. Ref. Bonds (Indiana University Health Obligated Group), Series 2011-N, 5.00% 2020 | 5,000 | 5,772 |
| Fin. Auth., Hospital Rev. Ref. Bonds (Indiana University Health Obligated Group), Series 2014-A, 5.00% 2023 | 1,000 | 1,235 |
| Fin. Auth., Hospital Rev. Ref. Bonds (Indiana University Health Obligated Group), Series 2016-A, 5.00% 2023 | 1,500 | 1,850 |
| Fin. Auth., Hospital Rev. Ref. Bonds (Indiana University Health Obligated Group), Series 2016-A, 5.00% 2024 | 1,000 | 1,242 |
| Fin. Auth., Hospital Rev. Ref. Bonds (Indiana University Health Obligated Group), Series 2016-A, 5.00% 2025 | 2,000 | 2,502 |
| Fin. Auth., Hospital Rev. Ref. Bonds (Parkview Health System Obligated Group), Series 2009-A, 5.00% 2017 | 1,640 | 1,722 |
| Fin. Auth., Hospital Rev. Ref. Bonds (Parkview Health System Obligated Group), Series 2012-A, 5.00% 2021 | 2,000 | 2,366 |
| Fin. Auth., Hospital Rev. Ref. Bonds (Parkview Health System Obligated Group), Series 2012-A, 5.00% 2022 | 2,000 | 2,409 |
Fin. Auth., Private Activity Bonds (Ohio River Bridges East End Crossing Project),
Series 2013-B, AMT, 5.00% 2019 | 10,440 | 10,829 |
| Fin. Auth., Rev. Ref. Bonds (Community Foundation of Northwest Indiana Obligated Group), 5.00% 2026 | 500 | 598 |
| Fin. Auth., Rev. Ref. Bonds (Community Foundation of Northwest Indiana Obligated Group), 5.00% 2027 | 500 | 589 |
| Fin. Auth., Rev. Ref. Bonds (Community Foundation of Northwest Indiana Obligated Group), 5.00% 2028 | 500 | 584 |
| Fin. Auth., State Revolving Fund Program Bonds, Series 2007-B, 5.00% 2018 | 3,545 | 3,852 |
| Fin. Auth., State Revolving Fund Program Rev. Ref. Bonds, Series 2005-A, 5.25% 2018 | 3,000 | 3,272 |
| Fin. Auth., Wastewater Utility Rev. Bonds (CWA Auth. Project), Series 2011-B, 5.00% 2019 | 1,000 | 1,137 |
| Gary/Chicago International Airport Auth., Airport Dev. Zone Rev. Bonds, AMT, 5.50% 2025 | 3,630 | 3,909 |
Limited Term Tax-Exempt Bond Fund of America — Page 13 of 34
Bonds, notes & other debt instruments
Indiana (continued) | Principal amount
(000) | Value
(000) |
Health and Educational Fac. Fncg. Auth., Hospital Rev. Ref. Bonds (Clarian Health Obligated Group),
Series 2006-B, 5.00% 2016 | $1,090 | $1,092 |
Health and Educational Fac. Fncg. Auth., Rev. Bonds (Ascension Health Credit Group),
Series 2005-A-1, 2.80% 2027 (put 2019) | 1,850 | 1,939 |
Health and Educational Fac. Fncg. Auth., Rev. Bonds (Ascension Health Credit Group),
Series 2005-A-5, 2.00% 2027 (put 2017) | 935 | 951 |
Health and Educational Fac. Fncg. Auth., Rev. Bonds (Ascension Health Credit Group),
Series 2006-B-7, 4.10% 2046 (put 2016) | 2,000 | 2,055 |
| Trustees of Indiana University, Consolidated Rev. Bonds, Series 2009-A, 5.00% 2017 | 1,000 | 1,061 |
| Trustees of Indiana University, Consolidated Rev. Bonds, Series 2009-A, 5.00% 2018 | 1,000 | 1,099 |
| Trustees of Indiana University, Consolidated Rev. Bonds, Series 2009-A, 5.00% 2019 | 1,000 | 1,136 |
| Trustees of Indiana University, Consolidated Rev. Ref. Bonds, Series 2015-W-2, 5.00% 2021 | 1,300 | 1,570 |
Indianapolis Airport Auth., Special Fac. Rev. Ref. Bonds (Federal Express Corp. Project),
Series 2004, AMT, 5.10% 2017 | 20,545 | 21,380 |
| Indianapolis Local Public Improvement Bond Bank Bonds (Indianapolis Airport Auth. Project), Series 2006-F, AMT, AMBAC insured, 5.00% 2022 | 7,500 | 7,642 |
| Indianapolis Local Public Improvement Bond Bank Bonds (Indianapolis Airport Auth. Project), Series 2006-F, AMT, AMBAC insured, 5.00% 2023 | 2,500 | 2,545 |
| Indianapolis Local Public Improvement Bond Bank Bonds (Indianapolis Airport Auth. Project), Series 2014-D, AMT, 5.00% 2022 | 2,000 | 2,369 |
| Indianapolis Local Public Improvement Bond Bank Rev. Ref. Bonds, Series 2009-B, 5.00% 2017 | 3,000 | 3,134 |
| Jasper County, Pollution Control Rev. Ref. Bonds (Northern Indiana Public Service Co. Project), Series 1988-A, National insured, 5.60% 2016 | 4,000 | 4,134 |
| Jasper County, Pollution Control Rev. Ref. Bonds (Northern Indiana Public Service Co. Project), Series 1988-C, National insured, 5.85% 2019 | 2,000 | 2,249 |
| Jasper County, Pollution Control Rev. Ref. Bonds (Northern Indiana Public Service Co. Project), Series 2003, AMBAC insured, 5.70% 2017 | 2,000 | 2,108 |
| Posey County Econ. Dev. Rev. Ref. Bonds, (Midwest Fertilizer Company LLC Project), 0.35% 2046 | 2,000 | 1,999 |
Trustees of Purdue University, Purdue University Student Facs. System, Rev. Ref. Bonds.,
Series 2011-A, 5.00% 2022 | 1,200 | 1,436 |
City of Whiting, Environmental Facs. Rev. Bonds (BP Products North America Inc. Project), AMT,
5.00% 2045 (put 2022) | 2,000 | 2,365 |
City of Whiting, Environmental Facs. Rev. Bonds (BP Products North America Inc. Project),
Series 2008, 1.85% 2044 (put 2019) | 1,000 | 1,013 |
| | | 114,139 |
| Iowa 0.03% | | |
| Fin. Auth., Single Family Mortgage Bonds, Series 2015-A, AMT, 3.50% 2040 | 975 | 1,033 |
Fin. Auth., Single-family Mortgage Bonds (Mortgage-backed Securities Program),
Series 2009-A, 5.00% 2038 | 35 | 36 |
| | | 1,069 |
| Kansas 0.09% | | |
Dev. Fin. Auth., Hospital Rev. Ref. Bonds (Adventist Health System/Sunbelt Obligated Group),
Series 2009-D, 5.00% 2020 | 1,150 | 1,322 |
Dev. Fin. Auth., Hospital Rev. Ref. Bonds (Adventist Health System/Sunbelt Obligated Group),
Series 2009-D, 5.00% 2022 | 1,750 | 1,880 |
| | | 3,202 |
| Kentucky 1.12% | | |
| Asset/Liability Commission, Project Notes, Federal Highway Trust Fund, Series 2014-A, 5.00% 2024 | 3,000 | 3,666 |
| Health Facs. Auth. Rev. Bonds (Catholic Health Initiatives), Series 2014-B, 2.70% 2039 (put 2021) | 1,500 | 1,568 |
Econ. Dev. Fin. Auth., Hospital Rev. Ref. Bonds (Baptist Healthcare System Obligated Group), Series 2009-A,
5.00% 2017 | 2,000 | 2,113 |
Limited Term Tax-Exempt Bond Fund of America — Page 14 of 34
Bonds, notes & other debt instruments
Kentucky (continued) | Principal amount
(000) | Value
(000) |
Econ. Dev. Fin. Auth., Hospital Rev. Ref. Bonds (Baptist Healthcare System Obligated Group),
Series 2009-A, 5.00% 2018 | $2,250 | $2,445 |
Econ. Dev. Fin. Auth. Rev. Bonds (Next Generation Kentucky Information Highway Project), Series 2015-A,
5.00% 2027 | 1,500 | 1,722 |
| Public Transportation Infrastructure Auth., Toll Rev. Bond Anticipation Notes (Downtown Crossing Project), Series 2013-A, 5.00% 2017 | 8,625 | 9,067 |
| State Property and Buildings Commission, Rev. Bonds (Project No. 89), Assured Guaranty Municipal insured, 5.00% 2018 | 2,500 | 2,778 |
State Property and Buildings Commission, Rev. Ref. Bonds (Project No. 87), FGIC-National insured,
5.00% 2018 | 3,000 | 3,148 |
| State Property and Buildings Commission, Rev. Ref. Bonds (Project No. 90), 5.00% 2018 | 2,500 | 2,765 |
| State Property and Buildings Commission, Road Fund Rev. Bonds (Project No. 94), 5.00% 2018 | 3,630 | 3,948 |
| Turnpike Auth., Econ. Dev. Road Rev. Bonds (Revitalization Projects), Series 2012-A, 5.00% 2019 | 4,000 | 4,541 |
| | | 37,761 |
| Louisiana 1.68% | | |
| Aviation Board, General Airport Rev. Bonds (North Terminal Project), Series 2015-B, AMT, 5.00% 2025 | 1,600 | 1,920 |
| Citizens Property Insurance Corp., Assessment Rev. Bonds, Series 2006-B, AMBAC insured, 5.00% 2017 | 2,500 | 2,540 |
| Citizens Property Insurance Corp., Assessment Rev. Bonds, Series 2006-B, AMBAC insured, 5.00% 2018 | 5,000 | 5,080 |
| Citizens Property Insurance Corp., Assessment Rev. Ref. Bonds, 5.00% 2017 | 1,750 | 1,848 |
Citizens Property Insurance Corp., Assessment Rev. Ref. Bonds, Assured Guaranty Municipal insured,
5.00% 2022 | 1,250 | 1,506 |
| Citizens Property Insurance Corp., Assessment Rev. Ref. Bonds, Series 2012, 5.00% 2024 | 1,000 | 1,177 |
| G.O. Bonds, Series 2011-A, 5.00% 2020 | 6,000 | 7,044 |
| Gasoline and Fuels Tax Rev. Ref. Bonds, Series 2012-A-1, 5.00% 2020 | 2,000 | 2,331 |
| City of New Orleans, Water Rev. and Ref. Bonds, Series 2014, 5.00% 2017 | 200 | 215 |
| City of New Orleans, Water Rev. and Ref. Bonds, Series 2014, 5.00% 2018 | 560 | 619 |
| City of New Orleans, Water Rev. and Ref. Bonds, Series 2014, 5.00% 2027 | 1,000 | 1,203 |
| City of New Orleans, Water Rev. and Ref. Bonds, Series 2014, 5.00% 2028 | 900 | 1,071 |
| Office Facs. Corp., Lease Rev. Ref. Bonds (Capitol Complex Program), Series 2009, 5.00% 2016 | 1,000 | 1,004 |
| Office Facs. Corp., Lease Rev. Ref. Bonds (Capitol Complex Program), Series 2009, 5.00% 2017 | 1,125 | 1,178 |
| Public Facs. Auth., Rev. Bonds (Ochsner Clinic Foundation Project), 5.00% 2021 | 445 | 514 |
| Public Facs. Auth., Rev. Bonds (Ochsner Clinic Foundation Project), 5.00% 2022 | 350 | 410 |
| Public Facs. Auth., Rev. Ref. Bonds (CHRISTUS Health), Series 2009-A, 5.00% 2016 | 2,000 | 2,035 |
| Regional Transit Auth. (New Orleans), Sales Tax Rev. Bonds, Series 2010, Assured Guaranty Municipal insured, 5.00% 2020 | 1,250 | 1,459 |
| Tobacco Settlement Fncg. Corp., Tobacco Settlement Asset-Backed Ref. Bonds, Series 2013-A, 5.00% 2020 | 5,000 | 5,666 |
| Tobacco Settlement Fncg. Corp., Tobacco Settlement Asset-Backed Ref. Bonds, Series 2013-A, 5.00% 2022 | 7,235 | 8,482 |
| Tobacco Settlement Fncg. Corp., Tobacco Settlement Asset-Backed Ref. Bonds, Series 2013-A, 5.00% 2024 | 3,000 | 3,007 |
| Tobacco Settlement Fncg. Corp., Tobacco Settlement Asset-Backed Ref. Bonds, Series 2013-A, 5.50% 2028 | 3,525 | 3,782 |
| Tobacco Settlement Fncg. Corp., Tobacco Settlement Asset-Backed Ref. Bonds, Series 2013-A, 5.50% 2029 | 2,500 | 2,757 |
| | | 56,848 |
| Maine 0.13% | | |
| Housing Auth., Mortgage Purchase Rev. Ref. Bonds, Series 2013-B, 4.00% 2043 | 835 | 891 |
| Housing Auth., Mortgage Purchase Rev. Ref. Bonds, Series 2015-B, 3.50% 2040 | 1,230 | 1,314 |
| Housing Auth., Mortgage Purchase Rev. Ref. Bonds, Series 2015-E-1, AMT, 3.50% 2035 | 2,000 | 2,124 |
| | | 4,329 |
| Maryland 0.77% | | |
Econ. Dev. Corp., Student Housing Rev. Ref. Bonds (Frostburg State University Project), Series 2013,
5.00% 2023 | 1,000 | 1,144 |
| G.O. Capital Improvement Bonds, State and Local Facs. Loan of 2003, First Series A, 5.25% 2016 | 750 | 753 |
Health and Higher Educational Facs. Auth., Rev. Bonds (University of Maryland Medical System Issue),
Series 2010, 5.00% 2020 | 1,000 | 1,122 |
Limited Term Tax-Exempt Bond Fund of America — Page 15 of 34
Bonds, notes & other debt instruments
Maryland (continued) | Principal amount
(000) | Value
(000) |
| Health and Higher Educational Facs. Auth., Rev. Ref. Bonds (MedStar Health Issue), Series 2015, 5.00% 2027 | $5,000 | $6,062 |
| Transportation Auth., Airport Parking Rev. Ref. Bonds (Baltimore/Washington International Thurgood Marshall Airport Projects), Series 2012-B, AMT, 5.00% 2020 | 8,150 | 9,312 |
| Transportation Auth., Airport Parking Rev. Ref. Bonds (Baltimore/Washington International Thurgood Marshall Airport Projects), Series 2012-B, AMT, 5.00% 2021 | 6,565 | 7,644 |
| | | 26,037 |
| Massachusetts 1.45% | | |
| Dev. Fin. Agcy., Boston Medical Center Rev. Bonds (Green Bonds), Series 2012-C, 5.25% 2025 | 2,390 | 2,773 |
| Dev. Fin. Agcy., Rev. Bonds (Berkshire Health Systems Issue), Series 2012-G, 5.00% 2020 | 1,205 | 1,366 |
| Dev. Fin. Agcy., Rev. Bonds (Berkshire Health Systems Issue), Series 2012-G, 5.00% 2021 | 1,500 | 1,741 |
| Dev. Fin. Agcy., Rev. Bonds (Partners HealthCare System), Series 2015-O-3, 0.49% 2050 (put 2020)1 | 3,000 | 2,931 |
| Dev. Fin. Agcy., Rev. Bonds (Umass Memorial Health Care Obligated Group Issue), Series 2016-I, 5.00% 2024 | 1,000 | 1,207 |
| Dev. Fin. Agcy., Rev. Bonds (Umass Memorial Health Care Obligated Group Issue), Series 2016-I, 5.00% 2025 | 1,275 | 1,543 |
| Dev. Fin. Agcy., Rev. Bonds (Umass Memorial Health Care Obligated Group Issue), Series 2016-I, 5.00% 2026 | 1,150 | 1,401 |
| Dev. Fin. Agcy., Rev. Ref. Bonds (Tufts Medical Center Issue), Series 2011-I, 6.875% 2041 | 2,415 | 2,865 |
| Educational Fncg. Auth., Education Loan Rev. Bonds, Issue J, Series 2012, AMT, 5.00% 2020 | 3,635 | 4,045 |
| Educational Fncg. Auth., Education Loan Rev. Bonds, Series 2014-I, AMT, 5.00% 2022 | 3,000 | 3,444 |
| Educational Fncg. Auth., Education Loan Rev. Bonds, Series 2014-I, AMT, 5.00% 2023 | 3,000 | 3,472 |
| Educational Fncg. Auth., Education Loan Rev. Bonds, Series 2014-I, AMT, 5.00% 2025 | 3,000 | 3,502 |
| Health and Educational Facs. Auth., Rev. Ref. Bonds (CareGroup Issue), Series 2008-E-2, 5.00% 2017 | 5,000 | 5,303 |
| Housing Fin. Agcy., Single-family Housing Rev. Bonds, Series 167, 4.00% 2043 | 850 | 905 |
| Housing Fin. Agcy., Single-family Housing Rev. Ref. Bonds, Series 171, 4.00% 2044 | 960 | 1,044 |
| Housing Fin. Agcy., Single-family Housing Rev. Ref. Bonds, Series 177, AMT, 4.00% 2039 | 3,535 | 3,809 |
| Massachusetts Bay Transportation Auth., Sales Tax Rev. Ref. Bonds, Series 2004-C, 5.50% 2018 | 3,000 | 3,345 |
| Port Auth., Rev. Bonds, Series 2012-A, AMT, 4.00% 2020 | 525 | 579 |
| Port Auth., Rev. Bonds, Series 2012-A, AMT, 5.00% 2019 | 465 | 523 |
| Port Auth., Rev. Bonds, Series 2012-A, AMT, 5.00% 2021 | 305 | 359 |
| Special Obligation Dedicated Tax Rev. Ref. Bonds, Series 2005, FGIC-National insured, 5.00% 2020 | 2,580 | 2,960 |
| | | 49,117 |
| Michigan 4.69% | | |
City of Detroit, Water and Sewerage Dept., Sewage Disposal System Rev. Ref. Bonds, Series 2012-A,
Assured Guaranty Municipal insured, 5.00% 2018 | 1,500 | 1,639 |
City of Detroit, Water and Sewerage Dept., Sewage Disposal System Rev. Ref. Bonds, Series 2004-A,
Assured Guaranty Municipal Insured, 5.25% 2020 | 150 | 175 |
| School Dist. of the City of Detroit (Wayne County), School Building and Site Improvement Ref. Bonds (Unlimited Tax G.O.), Series 2012-A, 5.00% 2019 | 1,200 | 1,334 |
| Fin. Auth. Local Government Loan Program Rev. Bonds (Water and Sewerage Dept. Sewage Disposal System Rev. Ref. Local Project), Series 2014-C-3, Assured Guaranty Municipal insured, 5.00% 2022 | 5,000 | 5,953 |
| Fin. Auth. Local Government Loan Program Rev. Bonds (Water and Sewerage Dept. Sewage Disposal System Rev. Ref. Local Project), Series 2014-C-3, Assured Guaranty Municipal insured, 5.00% 2023 | 1,215 | 1,458 |
| Fin. Auth. Local Government Loan Program Rev. Bonds (Water and Sewerage Dept. Sewage Disposal System Rev. Ref. Local Project), Series 2014-C-3, Assured Guaranty Municipal insured, 5.00% 2024 | 4,000 | 4,843 |
| Fin. Auth., Hospital Rev. Ref. Bonds (Mclaren Health Care), Series 2015-D-2, 1.043% 2038 (put 2020)1 | 8,420 | 8,391 |
| Fin. Auth., Hospital Rev. Ref. Bonds (Oakwood Obligated Group), Series 2012, 5.00% 2022 | 5,000 | 5,993 |
| Fin. Auth., Rev. Bonds (School Dist. of the City of Detroit), Series 2011, 5.50% 2021 | 3,500 | 3,786 |
| Fin. Auth., Student Loan Rev. Ref. Bonds, Series 25-A, AMT, 5.00% 2020 | 1,750 | 1,977 |
| Fin. Auth., Student Loan Rev. Ref. Bonds, Series 25-A, AMT, 5.00% 2021 | 1,650 | 1,893 |
| Fin. Auth. Sewage Disposal System Rev. Ref. Bonds (Detroit Water and Sewerage Department Local Project), Series 2015-C, 5.00% 2027 | 1,000 | 1,185 |
| Fin. Auth., Hospital Rev. Ref. Bonds (Beaumont Health Credit Group), Series 2015, 5.00% 2025 | 4,000 | 4,838 |
| Fin. Auth., Unemployment Obligation Assessment Rev. Ref. Bonds, Series 2012-A, 5.00% 2018 | 5,000 | 5,512 |
| G.O. Bonds (Environmental Program and Ref.), Series 2008-A, 5.00% 2018 | 5,000 | 5,474 |
| G.O. Bonds (Environmental Program and Ref.), Series 2008-A, 5.00% 2019 | 4,500 | 4,938 |
Limited Term Tax-Exempt Bond Fund of America — Page 16 of 34
Bonds, notes & other debt instruments
Michigan (continued) | Principal amount
(000) | Value
(000) |
County of Genesee, Water Supply System Rev. Ref. Bonds (Limited Tax G.O.), Series 2014,
Build America Mutual insured, 5.00% 2022 | $515 | $623 |
County of Genesee, Water Supply System Rev. Ref. Bonds (Limited Tax G.O.), Series 2014,
Build America Mutual insured, 5.00% 2023 | 500 | 612 |
County of Genesee, Water Supply System Rev. Ref. Bonds (Limited Tax G.O.), Series 2014,
Build America Mutual insured, 5.00% 2024 | 850 | 1,037 |
| Fin. Auth., Hospital Rev. Ref. Bonds (MidMichigan Health Credit Group), Series 2014, 5.00% 2023 | 810 | 981 |
| Hospital Fin. Auth., Hospital Rev. Ref. Bonds (Henry Ford Health System), Series 2009, 5.50% 2017 | 1,000 | 1,065 |
| Hospital Fin. Auth., Hospital Rev. Ref. Bonds (McLaren Health Care), Series 2012-A, 5.00% 2021 | 2,000 | 2,364 |
| Hospital Fin. Auth., Rev. Ref. Bonds (McLaren Health Care), Series 2008-A, 5.25% 2016 | 3,000 | 3,044 |
| Hospital Fin. Auth., Rev. Ref. Bonds (Trinity Health Credit Group), Series 2008-A, 6.00% 2034 (put 2017) | 4,000 | 4,374 |
| Kent Hospital Fin. Auth., Rev. Ref. Bonds (Spectrum Health System), Series 2011-A, 5.00% 2017 | 1,500 | 1,611 |
| Public Power Agcy., Rev. Ref. Bonds (Belle River Project), Series 2002-A, National insured, 5.25% 2018 | 6,000 | 6,470 |
City of Saginaw, Hospital Fin. Auth., Hospital Rev. Ref. Bonds (Covenant Medical Center, Inc.),
Series 2010-H, 5.00% 2020 | 2,400 | 2,688 |
| State Building Auth., Rev. Ref. Bonds (Facs. Program), Series 2015-I, 5.00% 2023 | 3,000 | 3,672 |
| State Building Auth., Rev. Ref. Bonds (Facs. Program), Series 2008-I, 5.50% 2017 | 5,675 | 6,134 |
| State Building Auth., Rev. Ref. Bonds (Facs. Program), Series 2008-I, 5.50% 2017 (escrowed to maturity) | 825 | 893 |
| State Building Auth., Rev. Ref. Bonds (Facs. Program), Series 2015-I, 5.00% 2026 | 800 | 1,002 |
| State Grant Anticipation Bonds, Series 2007, Assured Guaranty Municipal insured, 5.25% 2020 | 2,860 | 3,073 |
| State Hospital Fin. Auth., Project Rev. Ref. Bonds (Ascension Health Credit Group), Series 2010-B, 5.00% 2019 | 2,000 | 2,292 |
| State Housing Dev. Auth., Single-Family Mortgage Rev. Bonds, Series 2014, 4.00% 2044 | 1,625 | 1,758 |
Strategic Fund, Limited Obligation Rev. Ref. Bonds (Detroit Edison Co. Exempt Facs. Project),
Series 2008-ET-2, 5.50% 2029 (put 2016) | 7,000 | 7,149 |
| Regents of the University of Michigan, General Rev. Ref. Bonds, Series 2012-E, 0.44% 2033 (put 2018)1 | 7,175 | 7,125 |
| Wayne County Airport Auth., Airport Rev. Bonds (Detroit Metropolitan Wayne County Airport), Series 2007, AMT, FGIC-National insured, 5.00% 2018 | 1,000 | 1,071 |
Wayne County Airport Auth., Airport Rev. Ref. Bonds (Detroit Metropolitan Wayne County Airport),
Series 2008-A, AMT, Assured Guaranty insured, 5.25% 2018 | 890 | 945 |
Wayne County Airport Auth., Airport Rev. Ref. Bonds (Detroit Metropolitan Wayne County Airport),
Series 2010-A, AMT, 5.00% 2017 | 1,615 | 1,717 |
Wayne County Airport Auth., Airport Rev. Ref. Bonds (Detroit Metropolitan Wayne County Airport),
Series 2010-A, AMT, 5.00% 2018 | 3,590 | 3,922 |
Wayne County Airport Auth., Airport Rev. Ref. Bonds (Detroit Metropolitan Wayne County Airport),
Series 2011-A, AMT, 5.00% 2019 | 1,000 | 1,119 |
Wayne County Airport Auth., Airport Rev. Ref. Bonds (Detroit Metropolitan Wayne County Airport),
Series 2011-A, AMT, 5.00% 2020 | 10,000 | 11,387 |
Wayne County Airport Auth., Airport Rev. Ref. Bonds (Detroit Metropolitan Wayne County Airport),
Series 2011-A, AMT, 5.00% 2021 | 8,240 | 9,522 |
Wayne County Airport Auth., Airport Rev. Ref. Bonds (Detroit Metropolitan Wayne County Airport),
Series 2011-B, 5.00% 2019 | 1,000 | 1,138 |
Wayne County Airport Auth., Airport Rev. Ref. Bonds (Detroit Metropolitan Wayne County Airport),
Series 2012-D, AMT, 5.00% 2019 | 3,560 | 3,982 |
| Wayne County Airport Auth., Rev. Bonds (Detroit Metropolitan Wayne County Airport), Series 2015-F, AMT, 5.00% 2025 | 1,500 | 1,773 |
| Wayne County Airport Auth., Rev. Bonds (Detroit Metropolitan Wayne County Airport), Series 2015-F, AMT, 5.00% 2026 | 1,000 | 1,170 |
| Board of Governors of Wayne State University, General Rev. Ref. Bonds, Series 2009-A, 5.00% 2016 | 3,235 | 3,349 |
| | | 158,451 |
| Minnesota 0.63% | | |
| Housing Fin. Agcy., Residential Housing Fin. Bonds, Series 2015-E, AMT, 3.50% 2046 | 1,000 | 1,065 |
| Housing Fin. Agcy., Residential Housing Fin. Bonds, Series 2007-L, AMT, 5.50% 2048 | 85 | 86 |
| Housing Fin. Agcy., Residential Housing Fin. Bonds, Series 2012-D, 4.00% 2040 | 545 | 568 |
| Housing Fin. Agcy., Residential Housing Fin. Bonds, Series 2014-C, AMT, 4.00% 2045 | 2,820 | 3,036 |
Limited Term Tax-Exempt Bond Fund of America — Page 17 of 34
Bonds, notes & other debt instruments
Minnesota (continued) | Principal amount
(000) | Value
(000) |
| Housing Fin. Agcy., Residential Housing Fin. Bonds, Series 2015-A, AMT, 4.00% 2041 | $5,820 | $6,311 |
Minneapolis-St. Paul Metropolitan Airports Commission, Airport Rev. Ref. Bonds,
Series 2010-D, AMT, 5.00% 2018 | 4,460 | 4,795 |
| Housing and Redev. Auth. of the City of Saint Paul, Hospital Fac. Rev. Bonds (HealthEast Care System Project), Series 2015, 5.00% 2023 | 3,500 | 4,200 |
| Regents of the University of Minnesota, G.O. Bonds, Series 2009-C, 5.00% 2018 | 1,000 | 1,118 |
| | | 21,179 |
| Mississippi 0.20% | | |
Dev. Bank, Special Obligation Bonds (Municipal Energy Agcy. of Mississippi Power Supply Project),
Series 2015-A, Assured Guaranty Municipal insured, 5.00% 2025 | 1,245 | 1,507 |
Dev. Bank, Special Obligation Bonds (Municipal Energy Agcy. of Mississippi Power Supply Project),
Series 2015-A, Assured Guaranty Municipal insured, 5.00% 2026 | 1,045 | 1,278 |
Dev. Bank, Special Obligation Rev. Ref. Bonds (Madison County, Mississippi Highway Ref. Project),
Series 2013-C, 5.00% 2020 | 1,750 | 2,007 |
| State Gaming Tax Rev. Ref. Bonds, Series 2015-E, 5.00% 2026 | 1,750 | 2,164 |
| | | 6,956 |
| Missouri 0.61% | | |
Health and Educational Facs. Auth., Senior Living Facs. Rev. Ref. Bonds (Lutheran Senior Services),
Series 2007-A, 5.00% 2016 | 1,440 | 1,440 |
Health and Educational Facs. Auth., Senior Living Facs. Rev. Ref. Bonds (Lutheran Senior Services),
Series 2007-A, 5.00% 2017 | 1,510 | 1,567 |
Health and Educational Facs. Auth., Senior Living Facs. Rev. Ref. Bonds (Lutheran Senior Services),
Series 2016-A, 1.50% 2018 | 225 | 226 |
| Highways and Transportation Commission, Rev. Ref. State Road Bonds, Series 2006, 5.00% 2018 | 2,700 | 2,934 |
| Housing Dev. Commission, Single-family Mortgage Rev. Bonds (Special Homeownership Loan Program), Series 2014-B, 4.00% 2040 | 1,440 | 1,556 |
| Housing Dev. Commission, Single-family Mortgage Rev. Bonds (Special Homeownership Loan Program), Series 2015-B-2, 4.00% 2045 | 4,000 | 4,383 |
| Industrial Dev. Auth. of the City of Lee’s Summit, Senior Living Facs. Rev. Ref. Bonds (John Knox Village Obligated Group), Series 2007-A, 5.00% 2016 | 2,300 | 2,351 |
| Industrial Dev. Auth. of the City of Lee’s Summit, Senior Living Facs. Rev. Ref. Bonds (John Knox Village Obligated Group), Series 2007-A, 5.00% 2017 | 2,420 | 2,557 |
City of St. Louis, Airport Rev. Ref. Bonds (Lambert-St. Louis International Airport), Series 2005,
National insured, 5.50% 2028 | 1,080 | 1,368 |
| City of St. Louis, Airport Rev. Ref. Bonds (Lambert-St. Louis International Airport), Series 2007-A, Assured Guaranty Municipal insured, 5.00% 2021 | 2,000 | 2,119 |
| | | 20,501 |
| Montana 0.03% | | |
| Board of Housing, Single-family Homeownership Rev. Ref. Bonds, Series 2015-B-2, AMT, 3.50% 2042 | 1,000 | 1,065 |
| Nebraska 0.98% | | |
| Central Plains Energy Project, Gas Supply Rev. Ref. Bonds, Series 2014, 5.00% 2039 (put 2019) | 8,800 | 10,018 |
| Hospital Auth. No. 2 of Douglas County, Health Facs. Rev. Ref. Bonds (Methodist Health System), Series 2015, 5.00% 2026 | 1,155 | 1,369 |
Hospital Auth. No. 3 of Douglas County, Health Facs. Rev. Ref. Bonds (Methodist Health System), Series 2008,
5.50% 2018 | 2,965 | 3,227 |
| Investment Fin. Auth., Single-family Housing Rev. Bonds, Series 2013-A, 3.00% 2043 | 995 | 1,023 |
| Investment Fin. Auth., Single-family Housing Rev. Bonds, Series 2014-A, 4.00% 2044 | 1,820 | 1,961 |
| Investment Fin. Auth., Single-family Housing Rev. Bonds, Series 2015, 3.50% 2045 | 4,350 | 4,655 |
Limited Term Tax-Exempt Bond Fund of America — Page 18 of 34
Bonds, notes & other debt instruments
Nebraska (continued) | Principal amount
(000) | Value
(000) |
| Investment Fin. Auth., Single-family Housing Rev. Bonds, Series 2015-C, 3.50% 2045 | $9,000 | $9,612 |
| Public Power Dist., General Rev. Ref. Bonds, Series 2012-A, 4.00% 2020 | 1,000 | 1,110 |
| | | 32,975 |
| Nevada 2.05% | | |
| Clark County School Dist., G.O. (Limited Tax) Building Bonds, Series 2007-C, 5.00% 2017 | 2,500 | 2,650 |
| Clark County School Dist., G.O. (Limited Tax) Building Bonds, Series 2008-A, 5.00% 2021 | 1,000 | 1,100 |
Clark County Water Reclamation Dist., G.O. (Limited Tax) Water Reclamation Bonds, Series 2009-B,
5.00% 2016 | 2,660 | 2,713 |
| Clark County, Airport System Rev. Bonds, Series 2010-D, 5.00% 2021 | 1,500 | 1,728 |
Clark County, Highway Rev. (Motor Vehicle Fuel Tax) Improvement and Ref. Bonds, Series 2007,
AMBAC insured, 5.00% 2020 | 4,500 | 4,787 |
| Clark County, Highway Rev. (Motor Vehicle Fuel Tax) Ref. Bonds, Series 2011, 5.00% 2020 | 12,320 | 14,385 |
| Clark County, Jet Aviation Fuel Tax Rev. Ref. Bonds, Series 2013-A, AMT, 5.00% 2021 | 1,035 | 1,213 |
| Clark County, Jet Aviation Fuel Tax Rev. Ref. Bonds, Series 2013-A, AMT, 5.00% 2022 | 2,810 | 3,336 |
| Clark County, Jet Aviation Fuel Tax Rev. Ref. Bonds, Series 2013-A, AMT, 5.00% 2023 | 1,000 | 1,196 |
| Clark County, Jet Aviation Fuel Tax Rev. Ref. Bonds, Series 2013-A, AMT, 5.00% 2027 | 2,500 | 2,878 |
| Clark County, Las Vegas-McCarran International Airport, Passenger Fac. Charge Rev. Bonds, Series 2007-A-1, AMT, AMBAC insured, 5.00% 2022 | 1,550 | 1,637 |
| Clark County, Las Vegas-McCarran International Airport, Passenger Fac. Charge Rev. Bonds, Series 2007-A-1, AMT, AMBAC insured, 5.00% 2024 | 2,000 | 2,110 |
Clark County, Pollution Control Rev. Ref. Bonds (Southern California Edison Company),
Series 2010, 1.875% 2031 (put 2020) | 8,500 | 8,675 |
Clark County, Sales and Excise Tax Rev. (Streets and Highway Projects) Improvement and Ref. Bonds,
Series 2010-B, 5.00% 2019 | 3,000 | 3,389 |
| City of Henderson, Local Improvement Dist. No. T-14 (Anthem Master Planned Community), Limited Obligation Ref. Bonds, Series 2007-A, Assured Guaranty Municipal insured, 5.00% 2016 | 1,685 | 1,691 |
| Highway Improvement Rev. Bonds (Motor Vehicle Fuel Tax), Series 2008, 5.00% 2017 | 4,000 | 4,323 |
| Las Vegas Valley Water Dist., G.O. (Limited Tax) Ref. Bonds, Series 2011-C, 5.00% 2019 | 7,760 | 8,796 |
| Las Vegas Valley Water Dist., G.O. (Limited Tax) Water and Ref. Bonds, Series 2009-D, 5.00% 2018 | 1,000 | 1,098 |
| Las Vegas Valley Water Dist., G.O. (Limited Tax) Water Bonds, Series 2012-B, 5.00% 2020 | 1,080 | 1,261 |
Rural Housing Auth., Single-family Mortgage Rev. Bonds (Mortgage-backed Securities Program),
Series 2007-B, AMT, 5.70% 2041 | 160 | 165 |
| | | 69,131 |
| New Jersey 2.58% | | |
| Camden County Improvement Auth., Health Care Redev. Project, Rev. Ref. Bonds (The Cooper Health System Obligated Group Issue), Series 2014, 5.00% 2025 | 2,000 | 2,346 |
| Camden County Improvement Auth., Health Care Redev. Project, Rev. Ref. Bonds (The Cooper Health System Obligated Group Issue), Series 2014, 5.00% 2026 | 2,715 | 3,161 |
| Certs. of Part., Series 2008-A, 5.00% 2018 | 1,000 | 1,062 |
| Economic Dev. Auth., School Facs. Construction Rev. Ref. Notes, 5.00% 2017 | 195 | 206 |
| Economic Dev. Auth., School Facs. Construction Rev. Ref. Notes, 5.00% 2017 (escrow to maturity) | 4,805 | 5,189 |
| Health Care Facs. Fncg. Auth., Rev. Ref. Bonds (University Hospital), Series 2015-A, Assured Guaranty Municipal insured, 5.00% 2025 | 1,000 | 1,206 |
| Health Care Facs. Fncg. Auth., Rev. Ref. Bonds (University Hospital), Series 2015-A, Assured Guaranty Municipal insured, 5.00% 2026 | 800 | 953 |
| Higher Education Student Assistance Auth., Student Loan Rev. Bonds, Series 2009-A, 5.00% 2017 | 3,500 | 3,675 |
| Higher Education Student Assistance Auth., Student Loan Rev. Bonds, Series 2010-2, 5.00% 2017 | 2,000 | 2,131 |
| Higher Education Student Assistance Auth., Student Loan Rev. Bonds, Series 2012-1A, AMT, 5.00% 2021 | 4,000 | 4,561 |
| Higher Education Student Assistance Auth., Student Loan Rev. Bonds, Series 2013-1-A, AMT, 5.00% 2019 | 2,000 | 2,228 |
| Higher Education Student Assistance Auth., Student Loan Rev. Bonds, Series 2013-1-A, AMT, 5.00% 2022 | 1,000 | 1,153 |
| Higher Education Student Assistance Auth., Student Loan Rev. Ref. Bonds, Series 2010-1A, 5.25% 2019 | 1,000 | 1,129 |
| Higher Education Student Assistance Auth., Student Loan Rev. Ref. Bonds, Series 2011-1, AMT, 5.00% 2017 | 2,500 | 2,661 |
| Higher Education Student Assistance Auth., Student Loan Rev. Ref. Bonds, Series 2011-1, AMT, 5.00% 2019 | 2,500 | 2,785 |
Limited Term Tax-Exempt Bond Fund of America — Page 19 of 34
Bonds, notes & other debt instruments
New Jersey (continued) | Principal amount
(000) | Value
(000) |
| Higher Education Student Assistance Auth., Student Loan Rev. Ref. Bonds, Series 2014-1A1, AMT, 5.00% 2021 | $2,000 | $2,280 |
| Higher Education Student Assistance Auth., Student Loan Rev. Ref. Bonds, Series 2014-1A1, AMT, 5.00% 2022 | 1,500 | 1,730 |
| Rutgers State University, G.O. Bonds (State University of New Jersey), Series 2009-F, 5.00% 2019 | 1,000 | 1,130 |
| The Pollution Control Fncg. Auth. Of Salem County, Pollution Control Rev. Bonds (Philadelphia Electric Company Project), Series 1993-A, AMT, 2.50% 2025 (put 2019) | 1,000 | 1,009 |
| South Jersey Transportation Auth.,Transportation System Rev. Bonds, 5.00% 2022 | 5,200 | 6,052 |
| South Jersey Transportation Auth.,Transportation System Rev. Bonds, Series 2012-A, 5.00% 2023 | 1,500 | 1,740 |
| South Jersey Transportation Auth.,Transportation System Rev. Bonds, Series 2012-A, 5.00% 2024 | 2,500 | 2,868 |
Tobacco Settlement Fncg. Corp., Tobacco Settlement Asset-backed Rev. Ref. Bonds, Series 2007-1-B,
0% 2041 | 4,000 | 1,018 |
| Transit Corp., Grant Anticipation Notes (Federal Transit Administration Section 5307 Urbanized Area Formula Funds), Series 2014-A, 5.00% 2019 | 1,000 | 1,107 |
| Transit Corp., Grant Anticipation Notes (Federal Transit Administration Section 5307 Urbanized Area Formula Funds) Series 2014-A, 5.00% 2020 | 4,000 | 4,517 |
| Transit Corp., Grant Anticipation Notes (Federal Transit Administration Section 5307 Urbanized Area Formula Funds) Series 2014-A, 5.00% 2021 | 2,000 | 2,298 |
| Transportation Trust Fund Auth., Transportation System Bonds, Series 1999-A, 5.75% 2017 | 2,500 | 2,640 |
Transportation Trust Fund Auth., Transportation System Rev. Ref. Bonds, Current Interest Bonds,
Series 2015-AA, 5.25% 2023 | 1,000 | 1,122 |
Transportation Trust Fund Auth., Transportation System Rev. Ref. Bonds, Current Interest Bonds,
Series 2006-A, 5.50% 2021 | 4,070 | 4,652 |
| Transportation Trust Fund Auth., Transportation System Rev. Ref. Bonds, Series 2003-B-2, 5.00% 2016 | 2,500 | 2,593 |
| Turnpike Auth., Turnpike Rev. Ref. Bonds, Series 2013-D, 0.69% 2024 (put 2018)1 | 11,500 | 11,469 |
| Turnpike Auth., Turnpike Rev. Ref. Bonds, Series 2013-E, 0.64% 2023 (put 2017)1 | 2,000 | 1,999 |
| Turnpike Auth., Turnpike Rev. Ref. Bonds, Series 2013-E, 0.69% 2024 (put 2018)1 | 2,375 | 2,368 |
| | | 87,038 |
| New Mexico 0.06% | | |
| Fin. Auth., State Transportation Rev. Ref. Bonds, Series 2010-B, 5.00% 2020 | 1,000 | 1,172 |
| Mortgage Fin. Auth., Single-family Mortgage Program Bonds, Series 2009-C-2, Class I, 5.70% 2040 | 370 | 391 |
| Mortgage Fin. Auth., Single-family Mortgage Program Rev. Ref. Bonds, Series 2009-B-2, Class I, 5.65% 2039 | 340 | 358 |
| | | 1,921 |
| New York 9.37% | | |
| City of Albany Industrial Dev. Agcy., Civic Fac. Rev. Ref. Bonds (St. Peter’s Hospital of the City of Albany Project), Series 2008-A, 5.25% 2017 | 1,500 | 1,626 |
| Buffalo and Erie County, Industrial Land Dev. Corp., Obligated Group Rev. Bonds (Catholic Health System, Inc. Projct), Series 2015, 5.00% 2023 | 800 | 953 |
| Dormitory Auth., Bernard College Rev. Bonds, Series 2015-A, 5.00% 2026 | 500 | 623 |
Dormitory Auth., City University System, Consolidated Fifth General Resolution Rev. Ref. Bonds,
Series 2008-B, 5.00% 2017 | 4,550 | 4,843 |
| Dormitory Auth., Mental Health Services Facs. Improvement Rev. Ref. Bonds, Series 2009-A-1, 5.50% 2018 | 2,500 | 2,739 |
| Dormitory Auth., Mental Health Services Facs. Improvement Rev. Ref. Bonds, Series 2010-A, 5.00% 2019 | 2,995 | 3,413 |
Dormitory Auth., Mental Health Services Facs. Improvement Rev. Ref. Bonds,
Series 2010-A, 5.00% 2019 (escrowed to maturity) | 5 | 6 |
| Dormitory Auth., Mount Sinai Hospital Obligated Group Rev. Ref. Bonds, Series 2010-A, 5.00% 2018 | 2,000 | 2,191 |
| Dormitory Auth., State Personal Income Tax Rev. Bonds (Education), Series 2009-A, 5.00% 2020 | 2,000 | 2,265 |
| Dormitory Auth., State Personal Income Tax Rev. Bonds (Education), Series 2015-B-A, 5.00% 2017 | 4,630 | 4,851 |
| Dormitory Auth., State Personal Income Tax Rev. Bonds (General Purpose), Series 2011-A, 5.00% 2017 | 2,500 | 2,629 |
| Dormitory Auth., State Personal Income Tax Rev. Bonds (General Purpose), Series 2011-A, 5.00% 2019 | 5,000 | 5,646 |
| Dormitory Auth., State Personal Income Tax Rev. Ref. Bonds (General Purpose), Series 2012-A, 5.00% 2022 | 2,000 | 2,469 |
Dormitory Auth., State University Educational Facs. Rev. Ref. Bonds. Series 2000-C,
Assured Guaranty Municipal insured, 5.75% 2017 | 1,475 | 1,573 |
Dormitory Auth., Third General Resolution Rev. Ref. Bonds (State University Educational Facs. Issue),
Series 2012-A, 5.00% 2018 | 3,000 | 3,287 |
Limited Term Tax-Exempt Bond Fund of America — Page 20 of 34
Bonds, notes & other debt instruments
New York (continued) | Principal amount
(000) | Value
(000) |
Environmental Facs. Corp., State Clean Water and Drinking Water Rev. Second Resolution Bonds
(New York City Municipal Water Fin. Auth. Projects), Series 2009-A, 5.00% 2017 | $2,500 | $2,656 |
| Erie County Industrial Dev. Agcy., School Fac. Rev. Bonds (City School Dist. of the City of Buffalo Project), Series 2011-A, 5.00% 2020 | 4,780 | 5,558 |
| Erie County Industrial Dev. Agcy., School Fac. Rev. Ref. Bonds (City School Dist. of the City of Buffalo Project), Series 2012-A, 5.00% 2020 | 2,770 | 3,221 |
| Town of Hempstead Local Dev. Corp., Rev. Bonds (Hofstra University Project), Series 2011, 5.00% 2025 | 1,670 | 1,926 |
Long Island Power Auth., Electric System General Rev. Bonds, Series 2015-C,
1.179% 2033 (put 2018)1 | 1,025 | 1,025 |
| Long Island Power Auth., Electric System General Rev. Ref. Bonds, Series 2006-E, 5.00% 2017 | 2,500 | 2,597 |
| Long Island Power Auth., Electric System General Rev. Ref. Bonds, Series 2009-A, 5.25% 2020 | 2,005 | 2,236 |
| Long Island Power Auth., Electric System General Rev. Ref. Bonds, Series 2009-A, 5.25% 2021 | 2,000 | 2,225 |
| Metropolitan Transportation Auth., Dedicated Tax Fund Bonds, Series 2009-B, 5.00% 2018 | 500 | 557 |
| Metropolitan Transportation Auth., Dedicated Tax Fund Rev. Ref. Bonds, Series 2002-B-3A, 0.76% 20171 | 4,000 | 4,003 |
Metropolitan Transportation Auth., Dedicated Tax Fund Rev. Ref. Bonds,
Series 2008-A-2B, 0.59% 2031 (put 2019)1 | 1,500 | 1,488 |
| Metropolitan Transportation Auth., State Service Contract Rev. Ref. Bonds, Series 2002-A, 5.50% 2017 | 5,000 | 5,350 |
Metropolitan Transportation Auth., State Service Contract Rev. Ref. Bonds, Series 2002-A,
National insured, 5.75% 2017 | 1,500 | 1,574 |
Metropolitan Transportation Auth., Transportation Rev. Bonds, Series 2003-B,
FGIC-National insured, 5.25% 2020 | 5,500 | 6,541 |
Metropolitan Transportation Auth., Transportation Rev. Bonds, Series 2008-B-2,
5.00% 2016 | 1,000 | 1,037 |
Metropolitan Transportation Auth., Transportation Rev. Bonds, Series 2008-C,
5.50% 2018 | 5,370 | 5,741 |
Metropolitan Transportation Auth., Transportation Rev. Bonds, Series 2012-A2,
0.28% 2041 (put 2016)1 | 1,000 | 998 |
Metropolitan Transportation Auth., Transportation Rev. Bonds, Series 2012-E,
5.00% 2020 | 3,250 | 3,828 |
Metropolitan Transportation Auth., Transportation Rev. Bonds, Series 2014-A-1,
4.00% 2021 | 3,470 | 3,990 |
Metropolitan Transportation Auth., Transportation Rev. Bonds, Series 2014-C,
5.00% 2024 | 5,000 | 6,270 |
Metropolitan Transportation Auth., Transportation Rev. Bonds, Series 2015-A-1,
5.00% 2016 | 2,000 | 2,073 |
Metropolitan Transportation Auth., Transportation Rev. Bonds, Series 2015-A-1,
5.00% 2027 | 3,150 | 3,869 |
Metropolitan Transportation Auth., Transportation Rev. Bonds, Series 2015-A-2,
0.59% 2039 (put 2020)1 | 11,250 | 11,109 |
Metropolitan Transportation Auth., Transportation Rev. Ref. Bonds, Series 2002-G-1H,
1.136% 2026 (put 2016)1 | 2,650 | 2,653 |
Metropolitan Transportation Auth., Transportation Rev. Ref. Bonds, Series 2011-C,
5.00% 2018 | 1,105 | 1,231 |
Metropolitan Transportation Auth., Transportation Rev. Ref. Bonds, Series 2012-D,
5.00% 2020 | 7,000 | 8,244 |
Metropolitan Transportation Auth., Transportation Rev. Ref. Bonds, Series 2012-F,
5.00% 2021 | 1,000 | 1,205 |
Metropolitan Transportation Auth., Transportation Rev. Ref. Bonds, Series 2014-A-2,
5.00% 2028 | 3,000 | 3,598 |
| Mortgage Agcy., Homeowner Mortgage Rev. Bonds, Series 191, 3.50% 2034 | 520 | 546 |
| Mortgage Agcy., Homeowner Mortgage Rev. Bonds, Series 52, 3.50% 2030 | 2,250 | 2,401 |
| Mortgage Agcy., Mortgage Rev. Ref. Bonds, Series 48, 2.625% 2041 | 315 | 322 |
| City of New York, G.O. Bonds, Fiscal 2008 Series J-4, 0.56% 20251 | 8,825 | 8,825 |
| City of New York, G.O. Bonds, Fiscal 2009 Series H-1, 5.00% 2016 | 2,000 | 2,009 |
| City of New York, G.O. Bonds, Fiscal 2011 Series I-1, 5.00% 2017 | 5,000 | 5,335 |
Limited Term Tax-Exempt Bond Fund of America — Page 21 of 34
Bonds, notes & other debt instruments
New York (continued) | Principal amount
(000) | Value
(000) |
| City of New York, G.O. Bonds, Fiscal 2012 Series I, 5.00% 2020 | $5,000 | $5,858 |
| City of New York, G.O. Bonds, Series 2013-E, 5.25% 2022 | 5,000 | 6,201 |
| City of New York, G.O. Bonds, Series 2014-A, 5.00% 2025 | 3,000 | 3,780 |
| City of New York, G.O. Bonds, Series 2014-G, 5.00% 2023 | 1,500 | 1,866 |
| City of New York, G.O. Bonds, Series 2015-C, 5.00% 2028 | 1,000 | 1,225 |
| New York City Housing Dev. Corp., Multi-family Housing Rev. Bonds, Series 2007-B-1, AMT, 4.75% 2016 | 635 | 652 |
| New York City Municipal Water Fin. Auth., Water and Sewer System Second General Resolution Rev. Bonds, Fiscal 2009 Series EE, 5.00% 2018 (escrowed to maturity) | 2,500 | 2,757 |
| New York City Municipal Water Fin. Auth., Water and Sewer System Second General Resolution Rev. Ref. Bonds, Fiscal 2009 Series FF-1, 5.00% 2018 | 2,000 | 2,201 |
| New York City Transitional Fin. Auth., Building Aid Rev. Bonds, Fiscal 2009 Series S-4, 5.00% 2018 | 2,545 | 2,756 |
| New York City Transitional Fin. Auth., Building Aid Rev. Bonds, Fiscal 2009 Series S-5, 5.00% 2017 | 2,500 | 2,608 |
| New York City Transitional Fin. Auth., Building Aid Rev. Bonds, Fiscal 2013 Series S-1, 5.00% 2021 | 650 | 780 |
| New York City Transitional Fin. Auth., Future Tax Secured Bonds, Series 2015-C, 5.00% 2025 | 2,420 | 3,075 |
New York City Transitional Fin. Auth., Future Tax Secured Bonds, Series 2015-C,
5.00% 2027 | 5,000 | 6,240 |
| New York City Transitional Fin. Auth., Future Tax Secured Rev. Ref. Bonds, Fiscal 2003 Series A-1, 5.00% 2022 | 1,305 | 1,588 |
| New York City Transitional Fin. Auth., Future Tax Secured Rev. Ref. Bonds, Series 2011-E, 5.00% 2016 | 2,000 | 2,071 |
| New York City Transitional Fin. Auth., Multi-Modal Rev. Ref. Bonds, Series 2011-B, 5.00% 2022 | 1,750 | 2,087 |
| New York City, Health and Hospitals Corp., Health System Rev. Ref. Bonds, Series 2008-A, 5.00% 2017 | 2,000 | 2,090 |
| New York City, Health and Hospitals Corp., Health System Rev. Ref. Bonds, Series 2008-A, 5.50% 2019 | 4,000 | 4,383 |
| New York City, Health and Hospitals Corp., Health System Rev. Ref. Bonds, Series 2010-A, 5.00% 2017 | 6,180 | 6,461 |
| New York City, Health and Hospitals Corp., Health System Rev. Ref. Bonds, Series 2010-A, 5.00% 2021 | 1,500 | 1,725 |
Niagara Frontier Transportation Auth., Airport Rev. Ref. Bonds (Buffalo Niagara International Airport),
Series 2014-A, AMT, 4.00% 2022 | 5,185 | 5,731 |
Niagara Frontier Transportation Auth., Airport Rev. Ref. Bonds (Buffalo Niagara International Airport),
Series 2014-A, AMT, 5.00% 2023 | 2,195 | 2,586 |
| Port Auth., Consolidated Rev. Ref. Bonds, Series 167, AMT, 5.00% 2020 | 4,790 | 5,573 |
| Port Auth., Consolidated Rev. Ref. Bonds, Series 167, AMT, 5.00% 2021 | 3,420 | 4,011 |
| Port Auth., Consolidated Rev. Ref. Bonds, Series 169, AMT, 5.00% 2020 | 5,000 | 5,829 |
| Port Auth., Consolidated Rev. Ref. Bonds, Series 172, AMT, 5.00% 2022 | 2,210 | 2,639 |
| Port Auth., Consolidated Rev. Ref. Bonds, Series 186, AMT, 5.00% 2023 | 5,000 | 6,115 |
| Public Housing Capital Fund Rev. Trust I, Trust Certificates, 4.50% 20222,3 | 2,545 | 2,678 |
| County of Rockland G.O. Bonds, Series 2014-A, Assured Guaranty Municipal insured, 5.00% 2022 | 1,250 | 1,484 |
| State Energy Research and Dev. Auth., Pollution Control Rev. Ref. Bonds (New York State Electric & Gas Corp. Project), Series 2004-A, 2.375% 2027 (put 2020) | 3,000 | 3,058 |
| Suffolk County Econ. Dev. Corp., Rev. Ref. Bonds (Catholic Health Services of Long Island Obligated Group Project), Series 2011, 5.00% 2019 | 3,000 | 3,377 |
| Thruway Auth., General Rev. Bonds, Series I, 5.00% 2020 | 2,000 | 2,302 |
| Thruway Auth., General Rev. Bonds, Series I, 5.00% 2021 | 4,000 | 4,736 |
Thruway Auth., General Rev. Junior Indebtedness Obligations, Series 2013-A,
5.00% 2019 | 1,000 | 1,129 |
| Thruway Auth., Local Highway and Bridge Service Contract Rev. Ref. Bonds, Series 2009, 5.00% 2017 | 10,000 | 10,531 |
Thruway Auth., Second General Highway and Bridge Trust Fund Rev. Ref. Bonds,
Series 2009-A-1, 5.00% 2018 | 4,000 | 4,370 |
| Thruway Auth., State Personal Income Tax Rev. Bonds (Transportation), Series 2009-A, 5.00% 2016 | 1,250 | 1,258 |
| Tobacco Settlement Fncg. Corp., Asset-Backed Rev. Bonds, Series 2013-B, 5.00% 2021 | 1,000 | 1,016 |
Tobacco Settlement Fncg. Corp., Rev. Ref. Bonds (State Contingency Contract Secured), Series 2011-B,
5.00% 2017 | 2,000 | 2,118 |
Tobacco Settlement Fncg. Corp., Rev. Ref. Bonds (State Contingency Contract Secured), Series 2011-B,
5.00% 2018 | 2,500 | 2,740 |
Transportation Dev. Corp., Special Fac. Rev. Ref. Bonds (Terminal One Group Association, L.P. Project),
5.00% 2020 | 2,500 | 2,841 |
Transportation Dev. Corp., Special Fac. Rev. Ref. Bonds (Terminal One Group Association, L.P. Project),
5.00% 2021 | 1,250 | 1,453 |
Limited Term Tax-Exempt Bond Fund of America — Page 22 of 34
Bonds, notes & other debt instruments
New York (continued) | Principal amount
(000) | Value
(000) |
Transportation Dev. Corp., Special Fac. Rev. Ref. Bonds (Terminal One Group Association, L.P. Project),
5.00% 2023 | $500 | $599 |
| Triborough Bridge and Tunnel Auth. (MTA Bridges and Tunnels), General Rev. Ref. Bonds, Series 2005-B-4D, 0.86% 2031 (put 2018)1 | 2,000 | 1,999 |
Triborough Bridge and Tunnel Auth., General Rev. Ref. Bonds (MTA Bridges and Tunnels),
Series 2000-ABCD-4, Assured Guaranty Municipal insured, 0.36% 20181 | 500 | 499 |
| Urban Dev. Corp., Rev. Bonds (General Purpose), Series 2014-A, 5.00% 2029 | 1,500 | 1,826 |
| Urban Dev. Corp., Service Contract Rev. Ref. Bonds, Series 2008-B, 5.00% 2017 | 2,500 | 2,604 |
Urban Dev. Corp., State Personal Income Tax Rev. Bonds (Econ. Dev. and Housing),
Series 2009-A-1, 5.00% 2017 | 1,000 | 1,082 |
| Urban Dev. Corp., State Personal Income Tax Rev. Bonds (General Purpose), Series 2013-C, 5.00% 2021 | 5,000 | 5,968 |
| Urban Dev. Corp., State Personal Income Tax Rev. Bonds (General Purpose), Series 2013-D, 5.00% 2021 | 5,000 | 5,968 |
| Westchester County Health Care Corp., Rev. Bonds, Series 2010-B, 5.00% 2017 | 2,500 | 2,662 |
| | | 316,541 |
| North Carolina 0.40% | | |
| Eastern Municipal Power Agcy., Power System Rev. Ref. Bonds, Series 2009-B, 5.00% 2017 | 1,500 | 1,563 |
| Municipal Power Agcy. No. 1, Catawba Electric Rev. Ref. Bonds, Series 2008-A, 5.25% 2017 | 1,925 | 2,009 |
Municipal Power Agcy. No. 1, Catawba Electric Rev. Ref. Bonds, Series 2008-A, 5.25% 2017
(escrow to maturity) | 1,075 | 1,123 |
| Municipal Power Agcy. No. 1, Catawba Electric Rev. Ref. Bonds, Series 2010-A, 5.00% 2021 | 2,500 | 2,867 |
| Dept. of State Treasurer, Grant Anticipation Rev. Vehicle Bonds, Series 2009, 5.00% 2018 | 1,590 | 1,727 |
| Dept. of State Treasurer, Grant Anticipation Rev. Vehicle Bonds, Series 2011, 4.00% 2023 (put 2018) | 4,000 | 4,193 |
| | | 13,482 |
| North Dakota 0.36% | | |
| Burleigh County, Health Care Rev. Bonds (St. Alexius Medical Center Project), Series 2014-A, 5.00% 2023 | 1,435 | 1,722 |
| Housing Fin. Agcy., Housing Fin. Program Bonds (Home Mortgage Fin. Program), Series 2012-A, 3.75% 2042 | 905 | 953 |
| Housing Fin. Agcy., Housing Fin. Program Bonds (Home Mortgage Fin. Program), Series 2014-A, 4.00% 2034 | 855 | 919 |
| Housing Fin. Agcy., Housing Fin. Program Bonds (Home Mortgage Fin. Program), Series 2015-A, 4.00% 2038 | 980 | 1,060 |
| Housing Fin. Agcy., Housing Fin. Program Bonds (Home Mortgage Fin. Program), Series 2015-D, 4.00% 2046 | 7,000 | 7,683 |
| | | 12,337 |
| Ohio 2.14% | | |
Air Quality Dev. Auth., Pollution Control Rev. Ref. Bonds (FirstEnergy Generation Corp. Project),
Series 2009-C, 5.625% 2018 | 4,875 | 5,236 |
| Air Quality Dev. Auth., Pollution Control Rev. Ref. Bonds (FirstEnergy Nuclear Generation Corp. Project), Series 2009-A, 5.75% 2033 (put 2016) | 2,500 | 2,535 |
| Air Quality Dev. Auth., Pollution Control Rev. Ref. Bonds (FirstEnergy Nuclear Generation Corp. Project), Series 2014-A, 3.75% 2023 (put 2018) | 4,000 | 4,115 |
| County of Allen, Hospital Facs. Rev. Ref. and Improvement Bonds (Catholic Health Partners), Series 2012-A, 5.00% 2021 | 2,250 | 2,661 |
| County of Allen, Hospital Facs. Rev. Ref. and Improvement Bonds (Catholic Health Partners), Series 2012-A, 5.00% 2022 | 3,300 | 3,981 |
| County of Allen, Hospital Facs. Rev. Ref. Bonds (Catholic Healthcare Partners), Series 2010-B, 5.00% 2019 | 2,500 | 2,832 |
| American Municipal Power - Ohio, Inc., Rev. Ref. Bonds (Prairie State Energy Campus Project), Series 2008-A, 5.00% 2017 (escrowed to maturity) | 860 | 901 |
| American Municipal Power - Ohio, Inc., Rev. Ref. Bonds (Prairie State Energy Campus Project), Series 2008-A, 5.00% 2017 | 640 | 669 |
City of Cleveland, Airport System Rev. Bonds, Series 2000-C,
Assured Guaranty Municipal insured, 5.00% 2017 | 2,200 | 2,288 |
| City of Cleveland, Airport System Rev. Ref. Bonds, Series 2006-A, AMBAC insured, 5.25% 2017 | 450 | 468 |
| City of Cleveland, Airport System Rev. Ref. Bonds, Series 2011-A, 5.00% 2020 | 3,540 | 4,007 |
City of Cleveland, Airport System Rev. Ref. Bonds, Series 2011-A, Assured Guaranty Municipal insured,
5.00% 2021 | 2,345 | 2,726 |
Limited Term Tax-Exempt Bond Fund of America — Page 23 of 34
Bonds, notes & other debt instruments
Ohio (continued) | Principal amount
(000) | Value
(000) |
| City of Cleveland, Airport System Rev. Ref. Bonds, Series A, Assured Guaranty insured, 5.25% 2019 | $5,000 | $5,569 |
| City of Cleveland, Water Rev. Ref. Bonds, Series 2009-T, 5.00% 2018 | 3,620 | 3,919 |
| County of Hamilton, Healthcare Facs. Rev. Bonds (Christ Hospital Project), Series 2012, 5.00% 2020 | 2,360 | 2,711 |
| County of Hamilton, Healthcare Facs. Rev. Bonds (Christ Hospital Project), Series 2012, 5.00% 2021 | 1,000 | 1,174 |
| Higher Education G.O. Ref. Bonds, Series 2009-A, 5.00% 2017 | 5,000 | 5,361 |
| Housing Fin. Agcy., Residential Mortgage Rev. Bonds, Series 2006-E, AMT, 5.375% 2037 | 350 | 351 |
| Housing Fin. Agcy., Residential Mortgage Rev. Ref. Bonds, Series 2009-C, 4.50% 2039 | 230 | 237 |
| Housing Fin. Agcy., Single-family Mortgage Rev. Bonds, Series 2010-1, 5.00% 2028 | 935 | 986 |
| Infrastructure Improvement G.O. Bonds, Series 2012-A, 5.00% 2019 | 4,560 | 5,126 |
| Infrastructure Improvement G.O. Ref. Bonds, Series 2011-B, 5.00% 2018 | 2,000 | 2,211 |
| County of Lake, Hospital Facs. Rev. Ref. Bonds (Lake Hospital System, Inc.), Series 2008-C, 5.00% 2017 | 1,375 | 1,455 |
| County of Lake, Hospital Facs. Rev. Ref. Bonds (Lake Hospital System, Inc.), Series 2008-C, 5.00% 2018 | 1,195 | 1,302 |
| Major New State Infrastructure Project Rev. Bonds, Series 2008-1, 5.75% 2019 | 1,000 | 1,118 |
| Major New State Infrastructure Project Rev. Bonds, Series 2012-1, 4.00% 2019 | 1,250 | 1,389 |
County of Miami, Hospital Facs. Rev. Ref. and Improvement Bonds (Upper Valley Medical Center),
Series 2006, 5.25% 2016 | 1,815 | 1,840 |
| Treasurer of State, Tax-Exempt Private Activity Bonds (Portsmouth Bypass Project), Series 2015, AMT, Assured Guaranty Municipal insured, 5.00% 2026 | 850 | 1,015 |
| Treasurer of State, Tax-Exempt Private Activity Bonds (Portsmouth Bypass Project), Series 2015, AMT, Assured Guaranty Municipal insured, 5.00% 2027 | 500 | 592 |
| Turnpike Rev. Ref. Bonds, Series 2009-A, 5.00% 2020 | 1,000 | 1,121 |
| Warren County, Health Care Facs., Rev. Ref. Bonds (Otterbein Homes Obligated Group), Series 2013-A, 5.00% 2021 | 1,215 | 1,404 |
| Water Dev. Auth., Solid Waste Rev. Bonds (Waste Management Project), Series 2004, 2.25% 2021 (put 2016) | 1,000 | 1,008 |
| | | 72,308 |
| Oklahoma 0.14% | | |
Dev. Fin. Auth., Health System Rev. Ref. Bonds (Obligated Group Consisting of INTEGRIS Baptist Medical Center, Inc., INTEGRIS South Oklahoma City Hospital Corp. and INTEGRIS Rural Health, Inc.),
Series 2008-C, 5.00% 2018 | 1,000 | 1,106 |
| Housing Fin. Agcy., Single-family Mortgage Rev. Bonds (Homeownership Loan Program), Series 2009-B, 4.90% 2036 | 450 | 462 |
| Municipal Power Auth., Power Supply System Rev. Ref. Bonds, Series 2005-A, 0.81% 2023 (put 2018)1 | 1,510 | 1,507 |
Trustees of the Tulsa Airports Improvement Trust General Airports Rev. Bonds, Series 2015-A, AMT,
BAM insured, 5.00% 2021 | 1,355 | 1,558 |
| | | 4,633 |
| Oregon 0.42% | | |
| Dept. of Administrative Services, Certs. of Part., Series 2009-A, 5.00% 2020 | 2,500 | 2,828 |
| Dept. of Administrative Services, Lottery Rev. Bonds, Series 2009-A, 5.00% 2017 | 2,000 | 2,107 |
| Facs. Auth., Rev. Ref. Bonds (Legacy Health System), Series 2010-A, 5.00% 2016 | 1,500 | 1,509 |
| Facs. Auth., Rev. Ref. Bonds (Providence Health & Services), Series 2013-C, 0.89% 2020 (put 2017)1 | 1,500 | 1,500 |
| G.O. Bonds (Veterans’ Welfare Bonds Series 94), Series 2014-H, 4.00% 2044 | 1,815 | 1,980 |
| Port of Portland, Portland International Airport Rev. Bonds, Subseries 20-C, AMT, 5.00% 2017 | 1,000 | 1,061 |
| Port of Portland, Portland International Airport Rev. Bonds, Subseries 20-C, AMT, 5.00% 2021 | 1,000 | 1,158 |
| Port of Portland, Portland International Airport Rev. Ref. Bonds, Subseries 21-B, AMT, 5.00% 2018 | 2,000 | 2,190 |
| | | 14,333 |
| Pennsylvania 4.73% | | |
| Allegheny County Airport Auth., Airport Rev. Bonds, Series 2012-A-1, AMT, 5.00% 2024 | 1,025 | 1,184 |
Allegheny County Hospital Dev. Auth., University of Pittsburgh Medical Center Rev. Bonds,
Series 2008-A, 5.00% 2017 | 4,500 | 4,798 |
Allegheny County Hospital Dev. Auth., University of Pittsburgh Medical Center Rev. Bonds,
Series 2008-A, 5.00% 2018 | 4,000 | 4,415 |
Limited Term Tax-Exempt Bond Fund of America — Page 24 of 34
Bonds, notes & other debt instruments
Pennsylvania (continued) | Principal amount
(000) | Value
(000) |
Allegheny County Hospital Dev. Auth., University of Pittsburgh Medical Center Rev. Bonds,
Series 2008-B, 5.00% 2018 | $3,250 | $3,562 |
Allegheny County Hospital Dev. Auth., University of Pittsburgh Medical Center Rev. Ref. Bonds,
Series 2010-A, 5.00% 2017 | 2,000 | 2,110 |
Redev. Auth. of Allegheny County, Tax Increment Fncg. Ref. Bonds (Waterfront Project),
Series 2007-A, 4.25% 2016 | 1,540 | 1,583 |
| Beaver County Industrial Dev. Auth., Pollution Control Rev. Ref. Bonds (FirstEnergy Nuclear Generation Project), Series 2006-A, 3.50% 2041 (put 2020) | 3,500 | 3,581 |
| Beaver County Industrial Dev. Auth., Pollution Control Rev. Ref. Bonds (FirstEnergy Nuclear Generation Project), Series 2008-A, 2.70% 2035 (put 2018) | 2,000 | 2,008 |
Dauphin County General Auth., Health System Rev. Ref. Bonds (Pinnacle Health System Project),
Series 2009-A, 5.25% 2017 | 1,710 | 1,768 |
| Delaware River Joint Toll Bridge Commission Bridge System Rev. Ref. Bonds, Series 2015, 5.00% 2026 | 410 | 507 |
| Delaware River Port Auth., Port Dist. Project Rev. Ref. Bonds, Series 2012, 5.00% 2019 | 1,740 | 1,920 |
| Delaware River Port Auth., Port Dist. Project Rev. Ref. Bonds, Series 2012, 5.00% 2022 | 1,300 | 1,484 |
| East Hempfield Township Industrial Dev. Auth., Rev. and Ref. Bonds (Willow Valley Communities Project), 3.00% 2017 | 690 | 714 |
| East Hempfield Township Industrial Dev. Auth., Rev. and Ref. Bonds (Willow Valley Communities Project), 5.00% 2021 | 650 | 766 |
| East Hempfield Township Industrial Dev. Auth., Rev. and Ref. Bonds (Willow Valley Communities Project), 5.00% 2022 | 500 | 596 |
| East Hempfield Township Industrial Dev. Auth., Rev. and Ref. Bonds (Willow Valley Communities Project), 5.00% 2024 | 400 | 483 |
| East Hempfield Township Industrial Dev. Auth., Rev. and Ref. Bonds (Willow Valley Communities Project), 5.00% 2025 | 500 | 605 |
| East Hempfield Township Industrial Dev. Auth., Rev. and Ref. Bonds (Willow Valley Communities Project), 5.00% 2026 | 500 | 597 |
| Econ. Dev. Fncg. Auth., Private Activity Rev. Bonds (The Pennsylvania Rapid Bridge Replacement Project), Series 2015, AMT, 5.00% 2024 | 4,900 | 5,762 |
| Econ. Dev. Fncg. Auth., Private Activity Rev. Bonds (The Pennsylvania Rapid Bridge Replacement Project), Series 2015, AMT, 5.00% 2024 | 4,500 | 5,279 |
| Econ. Dev. Fncg. Auth., Solid Waste Disposal Rev. Bonds (Waste Management, Inc. Project), Series 2004-A, 2.625% 2021 | 1,000 | 1,023 |
| Econ. Dev. Fncg. Auth., Unemployment Compensation Rev. Bonds, Series 2012-A, 5.00% 2019 | 5,000 | 5,695 |
| Econ. Dev. Fncg. Auth., Unemployment Compensation Rev. Bonds, Series 2012-B, 5.00% 2020 | 5,000 | 5,708 |
Econ. Dev. Fncg. Auth., Solid Waste Disposal Rev. Bonds (Waste Management, Inc. Project), AMT,
0.55% 2045 (put 2016)1 | 4,500 | 4,500 |
| G.O. Bonds, Second Ref. Series 2009, 5.00% 2020 | 2,000 | 2,320 |
Higher Educational Facs. Auth., Rev. Bonds (Edinboro University Foundation Student Housing Project),
Series 2008, 5.00% 2018 | 920 | 957 |
| Higher Educational Facs. Auth., Rev. Bonds (State System of Higher Education), Series AJ, 5.00% 2017 | 5,000 | 5,300 |
| Higher Educational Facs. Auth., Student Housing Rev. Bonds (University Properties, Inc. Student Housing Project at East Stroudsburg University of Pennsylvania), Series 2010, 5.25% 2019 | 1,300 | 1,410 |
| Housing Fin. Agcy., Single-family Mortgage Rev. Bonds, Series 2015-118-A, AMT, 3.50% 2040 | 8,205 | 8,695 |
| Housing Fin. Agcy., Single-family Mortgage Rev. Bonds, Series 2015-117-A, AMT, 3.50% 2040 | 630 | 669 |
| Intergovernmental Cooperation Auth., Special Tax Rev. Ref. Bonds (City of Philadelphia Funding Program), Series 2009, 5.00% 2016 | 2,500 | 2,545 |
| Intergovernmental Cooperation Auth., Special Tax Rev. Ref. Bonds (City of Philadelphia Funding Program), Series 2010, 5.00% 2017 | 1,500 | 1,593 |
| Intergovernmental Cooperation Auth., Special Tax Rev. Ref. Bonds (City of Philadelphia Funding Program), Series 2010, 5.00% 2019 | 2,000 | 2,270 |
| Mifflin County, Hospital Auth. Rev. Ref. Bonds (Lewistown Hospital Project), 5.125% 2022 | 6,645 | 7,058 |
| Monroeville Fin. Auth. (Allegheny County), UPMC Rev. Bonds, 5.00% 2029 | 1,000 | 1,146 |
| Montgomery County Industrial Dev. Auth., Pollution Control Rev. Ref. Bonds (PECO Energy Company Project), Series 1999-A, 2.50% 2030 (put 2020) | 3,000 | 3,024 |
Limited Term Tax-Exempt Bond Fund of America — Page 25 of 34
Bonds, notes & other debt instruments
Pennsylvania (continued) | Principal amount
(000) | Value
(000) |
| Montgomery County Industrial Dev. Auth., Retirement Communities Rev. Bonds (ACTS Retirement-Life Communities, Inc. Obligated Group), Series 2009-A-1, 5.25% 2017 | $1,110 | $1,180 |
| Montgomery County Industrial Dev. Auth., Retirement Communities Rev. Bonds (ACTS Retirement-Life Communities, Inc. Obligated Group), Series 2009-A-1, 5.50% 2018 | 935 | 1,027 |
| Montgomery County Industrial Dev. Auth., Retirement Communities Rev. Bonds (ACTS Retirement-Life Communities, Inc. Obligated Group), Series 2009-A-1, 5.50% 2019 | 975 | 1,099 |
| Montgomery County Industrial Dev. Auth., Retirement Communities Rev. Ref. Bonds (ACTS Retirement-Life Communities, Inc. Obligated Group), Series 2006-B, 5.00% 2016 | 2,570 | 2,643 |
| Montgomery County Industrial Dev. Auth., Retirement Communities Rev. Ref. Bonds (ACTS Retirement-Life Communities, Inc. Obligated Group), Series 2012, 5.00% 2023 | 2,400 | 2,727 |
| Montgomery County Industrial Dev. Auth., Retirement Communities Rev. Ref. Bonds (ACTS Retirement-Life Communities, Inc. Obligated Group), Series 2012, 5.00% 2024 | 1,000 | 1,125 |
| Montgomery County Industrial Dev. Auth., Health Systems Rev. Bonds (Albert Einstein Healthcare Network Issue), Series 2015-A, 5.00% 2021 | 2,000 | 2,252 |
| Montgomery County Industrial Dev. Auth., Health Systems Rev. Bonds (Albert Einstein Healthcare Network Issue), Series 2015-A, 5.25% 2026 | 1,000 | 1,155 |
City of Philadelphia, Airport Rev. Bonds, Series 2007-A, AMT, Assured Guaranty Municipal insured,
5.00% 2016 | 1,000 | 1,017 |
| City of Philadelphia, Water and Wastewater Rev. Bonds, Series 2009-A, 5.75% 2018 | 2,500 | 2,734 |
| City of Philadelphia, Water and Wastewater Rev. Bonds, Series 2009-A, 5.75% 2019 | 3,000 | 3,409 |
| Hospitals and Higher Education Facs. Auth. of Philadelphia, Hospital Rev. Bonds (Children’s Hospital of Philadelphia Project), Series 2007-A, 4.25% 2016 | 700 | 711 |
State Public School Building Auth., School Lease Rev. Bonds (School Dist. of Philadelphia Project),
Series 2012, 5.00% 2019 | 1,000 | 1,102 |
State Public School Building Auth., School Lease Rev. Bonds (School Dist. of Philadelphia Project),
Series 2012, 5.00% 2021 | 2,000 | 2,271 |
| Health Care Facs. Auth. of Sayre, Rev. Ref. Bonds (Guthrie Health Issue), Series 2007, 0.867% 20171 | 2,160 | 2,159 |
| Susquehanna Area Regional Airport Auth., Airport System Rev. Bonds, Series 2012-A, AMT, 5.00% 2021 | 2,840 | 3,165 |
| Susquehanna Area Regional Airport Auth., Airport System Rev. Bonds, Series 2012-A, AMT, 5.00% 2022 | 5,355 | 6,006 |
| Auth. for Industrial Dev., Temple University Rev. Bonds, 1st Series 5.00% 2028 | 1,000 | 1,207 |
| Turnpike Commission, Turnpike Rev. Bonds, Series 2005-A, Assured Guaranty Municipal insured, 5.25% 2025 | 1,500 | 1,883 |
| Turnpike Commission, Turnpike Rev. Bonds, Series 2014-B-1, 0.71% 20191 | 2,000 | 1,993 |
| Turnpike Commission, Turnpike Rev. Bonds, Series 2014-B-1, 0.99% 20211 | 8,775 | 8,739 |
| Turnpike Commission, Turnpike Rev. Bonds, Series 2015-A-2, 0.81% 2045 (put 2018)1 | 8,500 | 8,488 |
York County Industrial Dev. Auth., Pollution Control Rev. Ref. Bonds (Philadelphia Electric Co. Project),
Series 1993-A, 2.55% 2036 (put 2020) | 4,000 | 4,043 |
| | | 159,770 |
| Puerto Rico 0.10% | | |
| Industrial, Tourist, Educational, Medical and Environmental Control Facs. Fncg. Auth., Hospital Rev. and Rev. Ref. Bonds (Hospital Auxilio Mutuo Obligated Group Project), Series 2011-A, 5.00% 2020 | 3,345 | 3,469 |
| Rhode Island 0.43% | | |
| Health and Educational Building Corp., Providence Public Schools Rev. Bond Fncg. Program, Rev. Ref. Bonds (Providence Public Buildings Auth. Issue), Series 2015, Assured Guaranty Municipal insured, 5.00% 2026 | 2,000 | 2,429 |
| Housing and Mortgage Fin. Corp., Homeownership Opportunity Bonds, Series 66-A-1, 4.00% 2033 | 1,500 | 1,612 |
| Housing and Mortgage Fin. Corp., Homeownership Opportunity Bonds, Series 66-A-2, 4.00% 2032 | 1,500 | 1,586 |
| Student Loan Auth., Student Loan Program Rev. Bonds, Series 2014-A, AMT, 5.00% 2018 | 800 | 879 |
| Student Loan Auth., Student Loan Program Rev. Bonds, Series 2014-A, AMT, 5.00% 2019 | 900 | 1,008 |
| Student Loan Auth., Student Loan Program Rev. Bonds, Series 2014-A, AMT, 5.00% 2020 | 1,250 | 1,422 |
| Student Loan Auth., Student Loan Program Rev. Bonds, Series 2014-A, AMT, 5.00% 2021 | 1,400 | 1,610 |
Limited Term Tax-Exempt Bond Fund of America — Page 26 of 34
Bonds, notes & other debt instruments
Rhode Island (continued) | Principal amount
(000) | Value
(000) |
| Student Loan Auth., Student Loan Program Rev. Bonds, Series 2015-A, AMT, 3.50% 2025 | $3,000 | $3,016 |
| Student Loan Auth., Student Loan Program Rev. Bonds, Series 2015-A, AMT, 3.625% 2026 | 1,000 | 1,007 |
| | | 14,569 |
| South Carolina 0.87% | | |
| Housing Fin. Auth., Mortgage Rev. Ref. Bonds, 4.00% 2036 | 1,875 | 2,060 |
| Jobs-Econ. Dev. Auth., Hospital Rev. Ref. and Improvement Bonds (Palmetto Health), Series 2009, 5.00% 2017 | 1,085 | 1,145 |
Lexington County Health Services Dist., Inc., Hospital Rev. Ref. Bonds (Lexington Medical Center),
Series 2007, 5.00% 2016 | 2,000 | 2,068 |
| Public Service Auth., Rev. Obligations (Santee Cooper), Series 2009-B, 5.00% 2017 | 2,000 | 2,084 |
| Public Service Auth., Rev. Obligations (Santee Cooper), Series 2009-B, 5.00% 2018 | 1,275 | 1,380 |
| Public Service Auth., Rev. Obligations (Santee Cooper), Series 2014-C, 5.0% 2021 | 1,000 | 1,205 |
| Public Service Auth., Rev. Obligations (Santee Cooper), Series 2014-C, 5.0% 2022 | 1,000 | 1,227 |
| Public Service Auth., Rev. Obligations (Santee Cooper), Series 2015-C, 5.00% 2021 | 3,095 | 3,731 |
| Public Service Auth., Rev. Obligations (Santee Cooper), Series 2015-C, 5.00% 2022 | 1,000 | 1,227 |
| Richland County, Environmental Improvement Rev. Ref. Bonds, Series 2014-A, AMT, 3.875% 2023 | 4,000 | 4,318 |
| Transportation Infrastructure Bank, Rev. Ref. Bonds, Series 2005-A, AMBAC insured, 5.25% 2018 | 8,000 | 8,922 |
| | | 29,367 |
| South Dakota 0.15% | | |
| Educational Enhancement Funding Corp, Tobacco Settlement Rev. Bonds, Series 2013-B, 5.00% 2023 | 1,000 | 1,187 |
| Health and Educational Facs. Auth., Rev. Bonds (Sanford), Series 2014-B, 5.00% 2022 | 375 | 452 |
| Housing Dev. Auth., Homeownership Mortgage Bonds, Series 2013-A, AMT, 3.00% 2030 | 700 | 720 |
| Housing Dev. Auth., Homeownership Mortgage Bonds, Series 2015-D, 4.00% 2045 | 1,250 | 1,376 |
| Housing Dev. Auth., Homeownership Mortgage Rev. Ref. Bonds, Series 2012-D, AMT, 4.00% 2029 | 1,140 | 1,195 |
| | | 4,930 |
| Tennessee 1.24% | | |
| Housing Dev. Agcy., Homeownership Program Rev. Ref. Bonds, Issue 2011-1-A, AMT, 4.50% 2031 | 1,735 | 1,852 |
| Housing Dev. Agcy., Homeownership Program Rev. Ref. Bonds, Issue 2012-1-A, AMT, 4.50% 2038 | 640 | 681 |
| Housing Dev. Agcy., Homeownership Program Rev. Ref. Bonds, Issue 2015-A, 3.50% 2045 | 1,000 | 1,067 |
| Housing Dev. Agcy., Housing Fin. Program Bonds, Issue 2010-A-1, 5.00% 2027 | 370 | 384 |
| Housing Dev. Agcy., Residential Fin. Program Bonds, AMT, 4.00% 2046 | 1,000 | 1,089 |
| Housing Dev. Agcy., Residential Fin. Program Bonds, Issue 2013-1-C, 3.00% 2038 | 2,555 | 2,656 |
| Housing Dev. Agcy., Residential Fin. Program Bonds, Series 2013-2-A, AMT, 4.00% 2043 | 1,350 | 1,449 |
Health, Educational and Housing Fac. Board of the County of Knox, Hospital Rev. Ref. Bonds
(Covenant Health), Series 2012-A, 5.00% 2019 | 1,000 | 1,112 |
Health, Educational and Housing Fac. Board of the County of Knox, Hospital Rev. Ref. Bonds
(Covenant Health), Series 2012-A, 5.00% 2020 | 1,220 | 1,395 |
Health, Educational and Housing Fac. Board of the County of Knox, Hospital Rev. Ref. Bonds
(Covenant Health), Series 2012-A, 5.00% 2022 | 3,320 | 3,958 |
Health, Educational and Housing Fac. Board of the County of Knox, Hospital Rev. Ref. Bonds
(Covenant Health), Series 2012-A, 5.00% 2023 | 1,000 | 1,206 |
Memphis-Shelby County Airport Auth., Airport Rev. Ref. Bonds, Series 2008-A, AMT,
Assured Guaranty Municipal insured, 5.00% 2016 | 3,000 | 3,013 |
| Memphis-Shelby County Airport Auth., Airport Rev. Ref. Bonds, Series 2010-B, AMT, 5.00% 2017 | 5,375 | 5,685 |
| Memphis-Shelby County Airport Auth., Airport Rev. Ref. Bonds, Series 2010-B, AMT, 5.375% 2018 | 6,590 | 7,230 |
| Memphis-Shelby County Airport Auth., Airport Rev. Ref. Bonds, Series 2010-B, AMT, 5.50% 2019 | 2,500 | 2,841 |
| Memphis-Shelby County Airport Auth., Airport Rev. Ref. Bonds, Series 2011-C, AMT, 5.00% 2018 | 2,500 | 2,720 |
| Memphis-Shelby County Airport Auth., Airport Rev. Ref. Bonds, Series 2011-C, AMT, 5.00% 2019 | 1,500 | 1,680 |
| Tennessee Energy Acquisition Corp., Gas Project Rev. Bonds, Series 2006-C, 5.00% 2021 | 1,580 | 1,820 |
| | | 41,838 |
Limited Term Tax-Exempt Bond Fund of America — Page 27 of 34
Bonds, notes & other debt instruments
Texas 7.54% | Principal amount
(000) | Value
(000) |
| Austin Community College Dist. Public Fac. Corp., Lease Rev. Bonds (Educational Fac. Project - Round Rock Campus), Series 2008, 5.25% 2017 | $1,500 | $1,605 |
| City of Austin (Travis and Williamson Counties), Water and Wastewater System Rev. Ref. Bonds, Series 2009, 5.00% 2018 | 1,500 | 1,672 |
| Bexar County Hospital Dist., Combination Tax and Rev. Certificates of Obligation, Series 2008, 5.00% 2017 | 2,665 | 2,786 |
| Bexar County Hospital Dist., Combination Tax and Rev. Certificates of Obligation, Series 2008, 5.00% 2018 | 3,015 | 3,265 |
| City of Brownsville, Utilities System Rev. Ref. Bonds, 5.00% 2021 | 1,500 | 1,779 |
| Central Texas Regional Mobility Auth., Rev. Ref. Bonds, Series 2015-B, 5.00% 2045 (put 2021) | 1,900 | 2,162 |
| Central Texas Regional Mobility Auth., Rev. Ref. Bonds, Series 2010, 5.75% 2020 | 1,000 | 1,151 |
| Central Texas Regional Mobility Auth., Rev. Ref. Bonds, Series 2013-A, 5.00% 2023 | 1,000 | 1,176 |
Clint Independent School Dist. (El Paso County), Unlimited Tax School Building Bonds,
Series 2006, 5.00% 2016 | 1,080 | 1,108 |
Corpus Christi Independent School Dist., Unlimited Tax School Building Bonds (Nueces County),
Series 2009, 5.00% 2019 | 2,070 | 2,367 |
Cypress-Fairbanks Independent School Dist. (Harris County), Unlimited Tax Schoolhouse Bonds,
Series 2009-A, 5.00% 2016 | 1,315 | 1,318 |
| City of Dallas (Dallas, Denton, Collin and Rockwall Counties), G.O. Bonds, Series 2007, 5.00% 2018 | 1,080 | 1,129 |
| City of Dallas, G.O. Limited Bonds, 5.00% 2018 (preref. 2017) | 4,420 | 4,623 |
| Dallas Area Rapid Transit, Sales Tax Rev. Bonds, Series 2008, 5.00% 2018 | 1,000 | 1,117 |
| Dallas Area Rapid Transit, Sales Tax Rev. Ref. Bonds, Series 2007, AMBAC insured, 5.00% 2016 | 2,000 | 2,078 |
Dallas County Community College Dist. (Dallas County), G.O. Ref. and Improvement Bonds,
Series 2008, 5.00% 2018 | 5,690 | 6,185 |
Cities of Dallas and Fort Worth, Dallas/Fort Worth International Airport, Joint Rev. Improvement Bonds,
Series 2013-A, AMT, 5.00% 2026 | 1,000 | 1,175 |
Cities of Dallas and Fort Worth, Dallas/Fort Worth International Airport, Joint Rev. Improvement Bonds,
Series 2013-E, AMT, 5.00% 2020 | 5,000 | 5,825 |
Cities of Dallas and Fort Worth, Dallas/Fort Worth International Airport, Joint Rev. Improvement Bonds,
Series 2013-F, 5.00% 2021 | 2,000 | 2,398 |
Cities of Dallas and Fort Worth, Dallas/Fort Worth International Airport, Joint Rev. Ref. Bonds,
Series 2009-A, 5.00% 2017 | 5,000 | 5,371 |
Cities of Dallas and Fort Worth, Dallas/Fort Worth International Airport, Joint Rev. Ref. Bonds,
Series 2009-A, 5.00% 2018 | 1,000 | 1,109 |
Cities of Dallas and Fort Worth, Dallas/Fort Worth International Airport, Joint Rev. Ref. Bonds,
Series 2011-C, 5.00% 2022 | 1,430 | 1,679 |
Cities of Dallas and Fort Worth, Dallas/Fort Worth International Airport, Joint Rev. Ref. Bonds,
Series 2012-B, 5.00% 2021 | 2,500 | 2,943 |
Cities of Dallas and Fort Worth, Dallas/Fort Worth International Airport, Joint Rev. Ref. Bonds,
Series 2013-D, 5.00% 2021 | 1,000 | 1,199 |
Cities of Dallas and Fort Worth, Dallas/Fort Worth International Airport, Joint Rev. Ref. Bonds,
Series 2014-A, AMT, 5.25% 2026 | 2,000 | 2,424 |
| Downtown Redev. Auth., Tax Increment Contract Rev. Ref. Bonds, Series 2015, BAM insured, 5.00% 2027 | 2,010 | 2,404 |
| Fort Bend County, Fort Bend Independent School Dist., Unlimited Tax Ref. Bonds, Series 2009, 5.00% 2018 | 1,000 | 1,085 |
| G.O. Bonds, College Student Loan Bonds, Series 2011-A, AMT, 5.00% 2019 | 1,700 | 1,930 |
G.O. Bonds, Water Financial Assistance Bonds (Water Infrastructure Fund),
Series 2009-A, 5.00% 2019 | 1,000 | 1,108 |
Harris County Cultural Education Facs. Fin. Corp., Rev. Ref. Bonds (Methodist Hospital System), Series 2008-B,
5.25% 2017 | 3,500 | 3,777 |
| Harris County Health Facs. Dev. Corp., Hospital Rev. Ref. Bonds (Memorial Hermann Healthcare System), Series 2014-A, 5.00% 2025 | 2,850 | 3,503 |
| Harris County Industrial Dev. Corp., Solid Waste Disposal Rev. Bonds (Deer Park Refining Limited Partnership Project), Series 2006, 4.70% 2018 | 2,000 | 2,124 |
| Harris County Sports Auth., Rev. Ref. Bonds, Series 2014-A, 5.00% 2021 | 750 | 895 |
| Harris County Sports Auth., Rev. Ref. Bonds, Series 2014-A, Assured Guaranty Municipal insured, 5.00% 2024 | 4,000 | 4,956 |
| Harris County, Metropolitan Transit Auth., Sales and Use Tax Bonds, Series 2009-A, 5.00% 2017 | 3,990 | 4,297 |
| Harris County, Toll Road Rev. Bonds, Series 2009-A, 5.00% 2017 | 1,100 | 1,173 |
Limited Term Tax-Exempt Bond Fund of America — Page 28 of 34
Bonds, notes & other debt instruments
Texas (continued) | Principal amount
(000) | Value
(000) |
| Harris County, Toll Road Rev. Bonds, Series 2009-A, 5.00% 2020 | $1,255 | $1,437 |
| Harris County, Toll Road Rev. Bonds, Series 2012-B, 0.71% 2021 (put 2018)1 | 13,500 | 13,500 |
| Harris County, Toll Road Rev. Ref. Bonds, Series 2007-A, National insured, 4.50% 2020 | 2,000 | 2,120 |
| City of Houston, Higher Education Fin. Corp., Higher Education Rev. Ref. Bonds (Rice University Project), Series 2013-B, 0.54% 2048 (put 2017)1 | 1,000 | 1,001 |
| Dept. of Housing and Community Affairs, Residential Mortgage Rev. Bonds, Series 2009-A, 5.375% 2039 | 380 | 394 |
| City of Houston Combined Utility System, Rev. Ref. Bonds, Series 2012-A, 0.91% 2034 (put 2020)1 | 7,500 | 7,467 |
| City of Houston, Airport System Rev. Ref. Bonds, Series 2007-B, FGIC-National insured, 5.00% 2017 | 1,000 | 1,061 |
| City of Houston, Airport System Rev. Ref. Bonds, Series 2009-A, 5.00% 2016 | 2,100 | 2,140 |
| City of Houston, Airport System Rev. Ref. Bonds, Series 2009-A, 5.00% 2017 | 1,600 | 1,696 |
| City of Houston, Airport System Rev. Ref. Bonds, Series 2009-A, 5.00% 2019 | 1,500 | 1,653 |
| City of Houston, Airport System Rev. Ref. Bonds, Series 2011-A, AMT, 5.00% 2019 | 10,000 | 11,263 |
| City of Houston, Airport System Rev. Ref. Bonds, Series 2011-B, 5.00% 2025 | 1,000 | 1,179 |
| City of Houston, Airport System Rev. Ref. Bonds, Series 2012-A, AMT, 5.00% 2021 | 3,785 | 4,471 |
| City of Houston, Public Improvement Ref. Bonds, Series 2009-A, 5.00% 2020 | 2,500 | 2,818 |
| City of Houston, Public Improvement Ref. Bonds, Series 2011-A, 5.00% 2016 | 5,770 | 5,795 |
| Houston Independent School Dist. (Harris County), Limited Tax Schoolhouse Bonds, Series 2008, 5.00% 2018 | 1,500 | 1,573 |
| City of Kerrville, Health Facs. Dev. Corp., Hospital Rev. Bonds (Peterson Regional Medical Center Project), 5.00% 2022 | 1,000 | 1,165 |
| City of Kerrville, Health Facs. Dev. Corp., Hospital Rev. Bonds (Peterson Regional Medical Center Project), 5.00% 2021 | 800 | 923 |
Lone Star College System (Harris and Montgomery Counties), Limited Tax G.O. Bonds,
Series 2009, 5.00% 2018 | 1,000 | 1,104 |
| Lower Colorado River Auth., Transmission Contract Rev. Ref. Bonds (LCRA Transmission Services Corp. Project), Series 2011-B, 5.00% 2019 | 5,000 | 5,637 |
Mansfield Independent School Dist. (Tarrant and Johnson Counties), Unlimited Tax Ref. Bonds,
Series 2010, 5.00% 2020 | 5,890 | 6,846 |
| Municipal Gas Acquisition and Supply Corp. I, Gas Supply Rev. Bonds, Series 2006-A, 5.25% 2017 | 1,500 | 1,613 |
| Municipal Gas Acquisition and Supply Corp. III, Gas Supply Rev. Bonds, Series 2012, 5.00% 2021 | 3,500 | 4,101 |
| Municipal Gas Acquisition and Supply Corp. III, Gas Supply Rev. Bonds, Series 2012, 5.00% 2022 | 2,800 | 3,337 |
| Municipal Gas Acquisition and Supply Corp. III, Gas Supply Rev. Bonds, Series 2012, 5.00% 2023 | 2,000 | 2,370 |
| New Hope Cultural Education Facs. Fin. Corp., Student Housing Rev. Bonds (CHF - Collegiate Housing Stephenville III, L.L.C. - Tarleton State University Project), Series 2015-A, 5.00% 2030 | 800 | 882 |
| North Texas Health Facs. Dev. Corp., Hospital Rev. Ref. Bonds (United Regional Health Care System, Inc. Project), Series 2007, Assured Guaranty Municipal insured, 5.00% 2022 | 1,400 | 1,490 |
| North Texas Tollway Auth., Dallas North Tollway System Rev. Ref. Bonds, Series 2005-C, 5.00% 2019 | 2,000 | 2,233 |
| North Texas Tollway Auth., System Rev. Ref. Bonds Bonds, Series 2014-A, 5.00% 2023 | 2,000 | 2,441 |
North Texas Tollway Auth., System Rev. Ref. Bonds, Current Interest Bonds,
Series 2008-A, 6.00% 2019 | 5,000 | 5,480 |
North Texas Tollway Auth., System Rev. Ref. Bonds, Current Interest Bonds,
Series 2008-A, 5.50% 2018 | 3,000 | 3,268 |
North Texas Tollway Auth., System Rev. Ref. Bonds, Current Interest Bonds,
Series 2014-C, 0.68% 2038 (put 2020)1 | 3,900 | 3,836 |
North Texas Tollway Auth., System Rev. Ref. Bonds, Series 2011-B,
5.00% 2019 | 1,250 | 1,396 |
| North Texas Tollway Auth., System Rev. Ref. Bonds, Series 2012-C, 1.95% 2038 (put 2019) | 5,400 | 5,488 |
| North Texas Tollway Auth., System Rev. Ref. Bonds, Series 2014-A, 5.00% 2022 | 1,000 | 1,199 |
| City of Olmos Park, Higher Education Facs. Corp., Higher Education Rev. Improvement and Ref. Bonds (University of the Incarnate Word Project), Series 2012, 5.00% 2022 | 2,000 | 2,398 |
| City of Olmos Park, Higher Education Facs. Corp., Higher Education Rev. Improvement and Ref. Bonds (University of the Incarnate Word Project), Series 2012, 5.00% 2023 | 1,500 | 1,786 |
Plano Independent School Dist. (Collin County), School Building Unlimited Tax Bonds,
Series 2008-A, 5.00% 2017 | 1,000 | 1,048 |
| SA Energy Acquisition Public Fac. Corp., Gas Supply Rev. Bonds, Series 2007, 5.25% 2017 | 1,000 | 1,063 |
| Sam Rayburn Municipal Power Agcy., Power Supply System Rev. Ref. Bonds, Series 2012, 5.00% 2018 | 2,000 | 2,201 |
Limited Term Tax-Exempt Bond Fund of America — Page 29 of 34
Bonds, notes & other debt instruments
Texas (continued) | Principal amount
(000) | Value
(000) |
City of San Antonio, Airport System Rev. Improvement Bonds, Series 2007, AMT,
Assured Guaranty Municipal insured, 5.00% 2016 | $1,000 | $1,020 |
| City of San Antonio, Airport System Rev. Ref. Bonds, Series 2012, AMT, 4.00% 2021 | 1,000 | 1,125 |
| City of San Antonio, Electric and Gas Systems Rev. Ref. Bonds, Series 2015-D, 3.00% 2045 (put 2020) | 3,000 | 3,233 |
| City of San Antonio, Electric and Gas Systems Rev. Ref. Bonds, Series 2015-C, 3.00% 2045 (put 2019) | 2,000 | 2,134 |
City of San Antonio, Passenger Fac. Charge and Airport System Rev. Improvement Bonds, Series 2007, AMT,
Assured Guaranty Municipal insured, 5.00% 2016 | 2,015 | 2,055 |
City of San Antonio, Passenger Fac. Charge and Airport System Rev. Ref. Bonds,
Series 2012, AMT, 5.00% 2020 | 1,680 | 1,936 |
City of San Antonio, Passenger Fac. Charge and Airport System Rev. Ref. Bonds,
Series 2012, AMT, 5.00% 2021 | 1,770 | 2,083 |
Tarrant County Cultural Education Facs. Fin. Corp., Health Resources System Rev. Ref. Bonds,
Series 2007-A, 5.00% 2016 | 1,000 | 1,002 |
Tarrant County Cultural Education Facs. Fin. Corp., Health Resources System Rev. Ref. Bonds,
Series 2007-A, 5.00% 2017 | 1,000 | 1,045 |
| Tarrant County Cultural Education Facs. Fin. Corp., Hospital Rev. Ref. Bonds (Scott and White Memorial Hospital and Scott, Sherwood and Brindley Foundation Project), Series 2008-A, 5.00% 2017 | 1,500 | 1,602 |
| Tarrant County Cultural Education Facs. Fin. Corp., Retirement Fac. Rev. Ref. Bonds (Buckner Retirement Services, Inc. Project), Series 2007, 5.00% 2016 | 1,280 | 1,312 |
Tarrant County Health Facs. Dev. Corp., Hospital Rev. Bonds (Cook Children’s Medical Center Project),
Series 2010-A, 4.50% 2022 | 500 | 556 |
| Tarrant Regional Water Dist., Water Control and Improvement Dist., Water Rev. Ref. and Improvement Bonds, Series 2009, 5.00% 2020 | 1,710 | 1,924 |
| Board of Regents of the Texas A&M University System, Series 2015-B, 5.00% 2025 | 1,585 | 1,953 |
| Board of Regents of the Texas A&M University System, Series 2015-B, 5.00% 2026 | 850 | 1,042 |
Board of Regents of Texas Tech University System, Rev. Fncg. System Ref. and Improvement Bonds,
Series 2012-A, 5.00% 2023 | 1,000 | 1,200 |
Board of Regents of Texas Tech University System, Rev. Fncg. System Ref. and Improvement Bonds,
Series 2012-A, 5.00% 2024 | 1,735 | 2,077 |
Transportation Commission, Central Texas Turnpike System Rev. Ref. Bonds, Series 2015-A,
5.00% 2042 (put 2020) | 500 | 572 |
| Transportation Commission, Central Texas Turnpike System Rev. Ref. Bonds, Series 2015-C, 5.00% 2025 | 1,000 | 1,204 |
Transportation Commission, G.O. Mobility Fund Bonds, Series 2008,
5.00% 2020 | 3,640 | 3,976 |
Transportation Commission, G.O. Mobility Fund Bonds, Series 2008,
5.00% 2020 (preref. 2018) | 360 | 393 |
| Transportation Commission, G.O. Mobility Fund Bonds, Series 2014-B, 0.39% 2041 (put 2018)1 | 6,000 | 5,951 |
Board of Regents of the University of Houston System, Consolidated Rev. Ref. Bonds,
Series 2009, 5.00% 2017 | 1,060 | 1,110 |
Board of Regents of the University of Houston System, Consolidated Rev. Ref. Bonds,
Series 2009, 5.00% 2018 | 1,000 | 1,086 |
Board of Regents of the University of Houston System, Consolidated Rev. Ref. Bonds,
Series 2009, 5.00% 2020 | 2,200 | 2,461 |
Board of Regents of the University of North Texas System, Rev. Fncg. System Bonds,
Series 2009-A, 5.00% 2018 | 1,000 | 1,091 |
| | | 254,912 |
| Utah 0.41% | | |
| Utah Housing Corp., Single-family Mortgage Bonds, Class III, Series 2015-D-2, 4.00% 2045 | 6,000 | 6,556 |
| Transit Auth., Sales Tax Rev. Bonds, Series 2008-A, Assured Guaranty Municipal insured, 5.25% 2019 | 1,525 | 1,750 |
| Transit Auth., Sales Tax Rev. Bonds, Series 2008-A, Assured Guaranty Municipal insured, 5.25% 2019 (escrowed to maturity) | 3,725 | 4,269 |
| Transit Auth., Sales Tax Rev. Bonds, Series 2015-A, 5.00% 2025 | 1,000 | 1,247 |
| | | 13,822 |
Limited Term Tax-Exempt Bond Fund of America — Page 30 of 34
Bonds, notes & other debt instruments
Vermont 0.09% | Principal amount
(000) | Value
(000) |
| Student Assistance Corp., Education Loan Rev. Notes, Series 2012-B, AMT, 2.112% 20221 | $462 | $463 |
| Educational and Health Buildings Fncg. Agcy., Rev. Bonds (The University of Vermont Medical Center Project), Series 2016-A, 5.00% 2025 | 2,000 | 2,472 |
| | | 2,935 |
| Virgin Islands 0.27% | | |
| Public Fin. Auth., Rev. Bonds (Matching Fund Loan Notes), Series 2013-A, 5.00% 2018 | 900 | 952 |
| Public Fin. Auth., Rev. Ref. Bonds (Matching Fund Loan Notes), Series 2009-B, 5.00% 2018 | 3,000 | 3,262 |
| Public Fin. Auth., Rev. Ref. Bonds (Matching Fund Loan Notes), Series 2012-A, 2.25% 2017 | 205 | 208 |
| Public Fin. Auth., Rev. Ref. Bonds, Series 2014-C, 5.00% 2024 | 4,000 | 4,687 |
| | | 9,109 |
| Virginia 0.06% | | |
| Industrial Dev. Auth. of Wise County, Solid Waste and Sewage Disposal Rev. Bonds (Virginia Electric and Power Co. Project), Series 2009-A, 2.15% 2040 (put 2020) | 1,000 | 1,028 |
| Industrial Dev. Auth. of Wise County, Solid Waste and Sewage Disposal Rev. Bonds (Virginia Electric and Power Co. Project), Series 2010-A, 1.875% 2040 (put 2020) | 1,000 | 1,017 |
| | | 2,045 |
| Washington 2.85% | | |
| Central Puget Sound Regional Transit Auth., Sales Tax Bonds, Series 2015-S-2A, 0.71% 2045 (put 2018)1 | 10,500 | 10,512 |
Public Utility Dist. No. 1 of Clark County, Electric System Rev. Ref. Bonds, Series 2007,
FGIC-National insured, 5.00% 2017 | 2,000 | 2,082 |
| Energy Northwest, Electric Rev. Ref. Bonds (Project No. 1), Series 2007-C, 5.00% 2017 | 3,000 | 3,192 |
| Energy Northwest, Electric Rev. Ref. Bonds (Project No. 1), Series 2009-A, 5.25% 2018 | 1,250 | 1,384 |
| Energy Northwest, Electric Rev. Ref. Bonds (Project No. 1), Series 2012-A, 5.00% 2017 | 5,000 | 5,319 |
| Energy Northwest, Electric Rev. Ref. Bonds (Project No. 1), Series 2015-C, National insured, 5.00% 2026 | 500 | 630 |
Energy Northwest, Electric Rev. Ref. Bonds (Project No. 1), Series 2015-C, National insured,
5.00% 2025 | 875 | 1,113 |
| Federal Highway Grant Anticipation Rev. Bonds (SR 520 Corridor Program), Series 2012-F, 5.00% 2020 | 5,000 | 5,845 |
| Federal Highway Grant Anticipation Rev. Bonds (SR 520 Corridor Program), Series 2014-C, 5.00% 2019 | 1,000 | 1,138 |
| Federal Highway Grant Anticipation Rev. Bonds (SR 520 Corridor Program), Series 2014-C, 5.00% 2021 | 2,500 | 2,994 |
| Various Purpose G.O. Bonds, Series 1992-B, 6.40% 2017 | 4,995 | 5,210 |
Public Utility Dist. No. 2 of Grant County, Electric System Rev. Ref. Bonds,
Series 2011-I, 5.00% 2017 (escrowed to maturity) | 5,000 | 5,208 |
Health Care Facs. Auth. Rev. Bonds (Catholic Health Initiatives), Series 2013-B-1,
1.01% 2035 (put 2021)1 | 8,000 | 7,950 |
| Health Care Facs. Auth., Rev. Bonds (Group Health Cooperative), Series 2006, RADIAN insured, 5.00% 2023 | 1,600 | 1,656 |
| Health Care Facs. Auth., Rev. Ref. Bonds (Central Washington Health Services Association), Series 2015, 5.00% 2027 | 1,250 | 1,452 |
| Health Care Facs. Auth., Rev. Ref. Bonds (PeaceHealth), Series 2014-A, 5.00% 2026 | 1,000 | 1,193 |
Health Care Facs. Auth., Rev. Ref. Bonds (Providence Health & Services), Series 2012-B,
5.00% 2042 (put 2021) | 1,000 | 1,192 |
| Health Care Facs. Auth., Rev. Ref. Bonds (Seattle Children’s Hospital), Series 2010-B, 5.00% 2021 | 1,235 | 1,437 |
| Higher Education Facs. Auth., Rev. Ref. Bonds (Gonzaga University Project), Series 2009-B, 5.00% 2016 | 1,015 | 1,022 |
| Higher Education Facs. Auth., Rev. Ref. Bonds (Gonzaga University Project), Series 2009-B, 5.00% 2018 | 2,235 | 2,402 |
| Higher Education Facs. Auth., Rev. Ref. Bonds (Gonzaga University Project), Series 2009-B, 5.00% 2019 | 2,350 | 2,595 |
| Higher Education Facs. Auth., Rev. Ref. Bonds (Gonzaga University Project), Series 2010-A, 5.00% 2018 | 1,000 | 1,074 |
| Housing Fin. Commission, Homeownership Program Bonds, Series 2011-A, 4.50% 2029 | 600 | 634 |
| Housing Fin. Commission, Single-family Program Rev. Ref. Bonds, Series 2015-A-R, AMT, 3.50% 2038 | 1,500 | 1,592 |
King County, Public Hospital Dist. No. 1, Limited Tax G.O. and Ref. Bonds, Series 2008-A,
Assured Guaranty insured, 5.00% 2016 | 2,595 | 2,689 |
| Port of Seattle, Special Fac. Rev. Ref. Bonds (Seatac Fuel Facs. LLC), AMT, 5.00% 2022 | 1,000 | 1,191 |
| Port of Seattle, Special Fac. Rev. Ref. Bonds (Seatac Fuel Facs. LLC), AMT, 5.00% 2023 | 1,100 | 1,321 |
Limited Term Tax-Exempt Bond Fund of America — Page 31 of 34
Bonds, notes & other debt instruments
Washington (continued) | Principal amount
(000) | Value
(000) |
City of Seattle, Municipal Light and Power Improvement and Rev. Ref. Bonds, Series 2015-B-1,
0.69% 2045 (put 2018)1 | $6,800 | $6,800 |
Housing Auth. of the City of Seattle, Capital Fund Program Rev. Bonds (High Rise Rehabilitation
Program - Phase III), Series 2007, AMT, Assured Guaranty Municipal insured, 4.55% 2017 | 675 | 688 |
| Port of Seattle, Passenger Fac. Charge Rev. Ref. Bonds, Series 2010-B, AMT, 5.00% 2016 | 2,000 | 2,075 |
| Port of Seattle, Rev. Ref. Bonds, Series 2010-C, AMT, 5.00% 2016 | 2,000 | 2,001 |
| Port of Seattle, Rev. Ref. Bonds, Series 2015-B, 5.00% 2022 | 500 | 603 |
| Port of Seattle, Rev. Ref. Bonds, Series 2015-C, AMT, 5.00% 2029 | 1,000 | 1,177 |
| Tobacco Settlement Auth., Tobacco Settlement Rev. Ref. Bonds, Series 2013, 5.00% 2026 | 6,300 | 6,381 |
| Tobacco Settlement Auth., Tobacco Settlement Rev. Ref. Bonds, Series 2013, 5.00% 2027 | 2,500 | 2,611 |
| | | 96,363 |
| Wisconsin 1.45% | | |
City of Franklin, Regional Solid Waste Fin. Commission, Solid Waste Disposal Rev. Bonds
(Waste Management of Wisconsin, Inc. Project), Series 2003-A, AMT, 4.95% 2016 | 3,500 | 3,525 |
| General Fund Annual Appropriation Rev. Ref. Bonds, Series 2009-A, 5.00% 2018 | 2,000 | 2,190 |
| Health and Educational Facs. Auth., Rev. Bonds (UnityPoint Health), Series 2014-A, 5.00% 2022 | 1,000 | 1,220 |
Health and Educational Facs. Auth., Rev. Bonds (Ascension Health Alliance Senior Credit Group),
Series 2013-B-1, 4.00% 2043 (put 2018) | 1,500 | 1,596 |
Health and Educational Facs. Auth., Rev. Bonds (Ascension Health Alliance Senior Credit Group),
Series 2013-B-3, 5.00% 2043 (put 2020) | 6,000 | 6,934 |
| Health and Educational Facs. Auth., Rev. Bonds (Thedacare, Inc.), Series 2009-A, 5.25% 2017 | 2,000 | 2,160 |
Health and Educational Facs. Auth., Rev. Ref. Bonds (Aurora Health Care, Inc.),
Series 2012-A, 5.00% 2021 | 7,765 | 9,141 |
| Health and Educational Facs. Auth., Rev. Ref. Bonds (Ministry Health Care), Series 2012-C, 5.00% 2021 | 1,200 | 1,425 |
| Health and Educational Facs. Auth., Rev. Ref. Bonds (ProHealth Care, Inc. Obligated Group), Series 2015, 5.00% 2030 | 1,820 | 2,101 |
| Health and Educational Facs. Auth., Rev. Ref. Bonds (ProHealth Care, Inc. Obligated Group), Series 2015, 5.00% 2031 | 1,650 | 1,896 |
| Health and Educational Facs. Auth., Rev. Ref. Bonds (ProHealth Care, Inc. Obligated Group), Series 2015, 5.00% 2032 | 940 | 1,075 |
| Health and Educational Facs. Auth., Rev. Ref. Bonds (Thedacare, Inc.), Series 2009-B, 5.00% 2017 | 2,000 | 2,151 |
| Health and Educational Facs. Auth., Rev. Ref. Bonds (Thedacare, Inc.), Series 2015, 5.00% 2026 | 1,170 | 1,409 |
Housing and Econ. Dev. Auth., Home Ownership Rev. Bonds, Series 2015-A,
AMT, 4.00% 2045 | 7,000 | 7,523 |
| Milwaukee County, Airport Rev. Ref. Bonds, Series 2010-B, AMT, 5.00% 2017 | 1,250 | 1,341 |
| Milwaukee County, Airport Rev. Ref. Bonds, Series 2010-B, AMT, 5.00% 2018 | 1,500 | 1,656 |
| Milwaukee County, Airport Rev. Ref. Bonds, Series 2010-B, AMT, 5.00% 2020 | 1,500 | 1,701 |
| | | 49,044 |
| Wyoming 0.20% | | |
| Community Dev. Auth., Housing Rev. Bonds, Series 2015-3, 3.00% 2044 | 1,660 | 1,738 |
| Community Dev. Auth., Housing Rev. Bonds, Series 2015-6, 4.00% 2045 | 4,500 | 4,896 |
| | | 6,634 |
| Total bonds, notes & other debt instruments (cost: $2,967,088,000) | | 3,103,570 |
| Short-term securities 7.58% | | |
| State of Alabama, Industrial Dev. Auth. of Mobile County, Alabama, Pollution Control Rev. Ref. Bonds (ExxonMobil Project), Series 2002, 0.01% 20321 | 2,600 | 2,600 |
| State of Alaska, International Airport System, Rev. Ref. Bonds, Series 2009-A, AMT, 0.02% 20301 | 200 | 200 |
| State of California, Various Purpose G.O. Bonds, 0.04% 4/7/2016 | 3,000 | 3,000 |
State of California, City of Irvine, Assessment Dist. No. 03-19, Limited Obligation Improvement Bonds,
Series 2004-A, U.S. Bank LOC, 0.01% 20291 | 1,428 | 1,428 |
Limited Term Tax-Exempt Bond Fund of America — Page 32 of 34
| Short-term securities | Principal amount
(000) | Value
(000) |
State of California, Irvine Unified School Dist., Community Facs. Dist. No. 09-1, Special Tax Bonds,
Series 2012-A, U.S. Bank LOC, 0.01% 20511 | $2,800 | $2,800 |
State of California, Pollution Control Fncg. Auth., Pollution Control Rev. Ref. Bonds (Pacific
Gas and Electric Co.), Series 1996-C, JPMorgan Chase LOC, 0.01% 20261 | 100 | 100 |
| State of California, County of Ventura, Tax and Rev. Anticipation Notes 2.00% 7/1/2016 | 24,585 | 24,762 |
| State of Colorado, General Fund Tax and Rev. Anticipation Notes, Series 2015-A, 1.75% 6/28/2016 | 25,000 | 25,159 |
| District of Columbia, Tax and Rev. Anticipation Notes, Series 2015, 1.50% 9/30/2016 | 15,000 | 15,113 |
| State of Idaho, Tax Anticipation Notes, Series 2015, 2.00% 6/30/2016 | 15,000 | 15,111 |
| State of Indiana, Fin. Auth., Health System Rev. Bonds (Franciscan Alliance, Inc.), Series 2008-A, 0.01% 20411 | 1,000 | 1,000 |
| State of Kentucky, Louisville and Jefferson County Metropolitan Sewer District, Sewer and Drainage System Bonds, Series 2015, 5.00% 11/22/2016 | 5,000 | 5,177 |
State of Louisiana, Industrial Dev. Board of the Parish of East Baton Rouge, Inc.,
Gulf Opportunity Zone Rev. Bonds (ExxonMobil Project), Series 2010-B, 0.01% 20401 | 3,500 | 3,500 |
| State of Maryland, Baltimore County, G.O. Bonds, 1.25% 4/1/2016 | 4,400 | 4,409 |
| State of Maryland, Baltimore County, G.O. Bonds, 1.25% 4/1/2016 | 5,600 | 5,611 |
| State of Maryland, Health and Higher Educational Facs. Auth., Rev. Ref. Bonds (University of Maryland Medical System Issue), Series 2008-D, TD Bank LOC, 0.01% 20411 | 11,970 | 11,970 |
| State of Maryland, Health and Higher Educational Facs. Auth., Rev. Bonds (University of Maryland Medical System Issue), Series 2007-A, Wachovia LOC, 0.01% 20341 | 2,000 | 2,000 |
State of Maryland, Montgomery County, Consolidated Public Improvement Bond Anticipation Notes,
Series 2006-A, 0.01% 20261 | 10,250 | 10,250 |
State of Maryland, Montgomery County, Consolidated Public Improvement Bond Anticipation Notes,
Series 2006-B, 0.01% 20261 | 2,505 | 2,505 |
State of Maryland, Montgomery County, Consolidated Public Improvement Bond Anticipation Notes,
Series 2010-B, 0.03% 3/10/2016 | 1,100 | 1,100 |
| State of Massachusetts, Housing Fin. Agcy., Housing Bonds, Series 2009-A, 0.01% 20431 | 1,250 | 1,250 |
| State of Massachusetts, G. O. Rev. Anticipation Notes, Series 2015-B, 2.00% 5/25/2016 | 4,400 | 4,425 |
| State of Massachusetts, G. O. Rev. Anticipation Notes, Series 2015-C, 2.00% 6/22/2016 | 2,600 | 2,618 |
State of Massachusetts, School Building Auth., Dedicated Sales Tax Rev. Ref. Bonds,
Series 2015-C, 5.00% 8/15/2016 | 20,000 | 20,522 |
| State of Mississippi, Business Fin. Corp., Gulf Opportunity Zone Industrial Dev. Rev. Bonds (Chevron U.S.A. Inc. Project), Series 2010-L, 0.01% 20351 | 1,400 | 1,400 |
| State of Mississippi, Business Fin. Corp., Gulf Opportunity Zone Industrial Dev. Rev. Bonds (Chevron U.S.A. Inc. Project), Series 2011-A, 0.01% 20351 | 3,300 | 3,300 |
State of New York, Dormitory Auth. of the State of New York, Rev. Bonds (Cornell University), Series 2004-B,
0.01% 20331 | 1,000 | 1,000 |
| State of New York, New York City Industrial Dev. Agcy., Civic Fac. Ref. and Improvement Rev. Bonds (2005 American Civil Liberties Union Foundation, Inc. Project), Series 2005, JPMorgan Chase LOC, 0.01% 20351 | 1,800 | 1,800 |
State of New York, Metropolitan Transportation Auth., Transportation Rev. Bond Anticipation Notes,
Series 2015-A-4, 0.50% 3/1/2016 | 10,000 | 10,003 |
State of New York, Metropolitan Transportation Auth., Transportation Rev. Bond Anticipation Notes,
Series 2015-B1, 1.00% 8/1/2016 | 5,000 | 5,016 |
State of New York, Metropolitan Transportation Auth., Transportation Rev. Bond Anticipation Notes,
Series 2015-B1-G, 1.00% 8/1/2016 | 20,000 | 20,061 |
| State of New York, City of New York, G.O. Bonds, Fiscal 1994 Series E-2, 0.01% 20201 | 3,100 | 3,100 |
| State of North Carolina, Charlotte-Mecklenburg Hospital Auth., Carolinas HealthCare System, Health Care Rev. Ref. Bonds, Series 2007-B, Wells Fargo Bank LOC, 0.01% 20451 | 1,200 | 1,200 |
| State of Ohio, Ohio Water Dev. Auth., Pollution Control Rev. Ref. Bonds (FirstEnergy Nuclear Generation Corp. Project), Series 2008-B, 0.01% 20181 | 500 | 500 |
State of Oregon, Full Faith and Credit Tax Anticipation Notes, Series 2015-A,
2.00% 9/15/2016 | 22,000 | 22,226 |
State of Oregon, City of Salem, Oregon, Hospital Fac. Auth. Rev. Bonds (Salem Hospital Project),
Series 2008-B, 0.01% 20341 | 2,000 | 2,000 |
Limited Term Tax-Exempt Bond Fund of America — Page 33 of 34
| Short-term securities | Principal amount
(000) | Value
(000) |
| State of Tennessee, Public Building Auth. of the City of Clarksville, Tennessee, Fncg. Rev. Bonds (City of Morristown Loans), Series 2008, 0.01% 20351 | $755 | $755 |
| State of Texas, City of Houston, Tax and Rev. Anticipation Notes, 2.00% 6/30/2016 | 10,000 | 10,074 |
| Virgin Islands, Public Fin. Auth., Grant Anticipation Rev. Bonds (Federal Highway Grant Anticipation Rev. Loan Notes), Series 2015, 3.00% 20162 | 1,000 | 1,013 |
| State of Virginia, Virginia College Building Auth., Educational Facs. Rev. Bonds (21st Century College and Equipment Programs), Series 2006-B, 0.01% 20261 | 500 | 500 |
| State of Virginia, Econ. Dev. Auth. of Albemarle County, Virginia, Health Services Rev. Bonds (University of Virginia Health Services Foundation), Series 2009, Bank of America LOC, 0.02% 20391 | 315 | 315 |
| State of Virginia, Peninsula Ports Auth., Coal Terminal Rev. Ref. Bonds (Dominion Terminal Associates Project), Series 1987-D, 0.01% 20161 | 400 | 400 |
| State of Wisconsin, Wisconsin Health and Educational Facs. Auth., Demand Rev. Bonds (Benevolent Corp. Cedar Community), Series 2007, 0.01% 20371 | 5,000 | 5,000 |
| Total short-term securities (cost: $256,250,000) | | 256,273 |
| Total investment securities 99.44% (cost: $3,223,338,000) | | 3,359,843 |
| Other assets less liabilities 0.56% | | 18,817 |
| Net assets 100.00% | | $3,378,660 |
| 1 | Coupon rate may change periodically. For short-term securities, the date of the next scheduled coupon rate change is considered to be the maturity date. |
| 2 | Acquired in a transaction exempt from registration under Rule 144A of the Securities Act of 1933. May be resold in the U.S. in transactions exempt from registration, normally to qualified institutional buyers. The total value of all such securities was $13,578,000, which represented .40% of the net assets of the fund. |
| 3 | Principal payments may be made periodically. Therefore, the effective maturity date may be earlier than the stated maturity date. |
| Key to abbreviations | |
| Agcy. = Agency | Fin. = Finance |
| AMT = Alternative Minimum Tax | Fncg. = Financing |
| Auth. = Authority | G.O. = General Obligation |
| Certs. of Part. = Certificates of Participation | LOC = Letter of Credit |
| Dept. = Department | Preref. = Prerefunded |
| Dev. = Development | Redev. = Redevelopment |
| Dist. = District | Ref. = Refunding |
| Econ. = Economic | Rev. = Revenue |
| Fac. = Facility | TECP = Tax-Exempt Commercial Paper |
| Facs. = Facilities | |
Investments are not FDIC-insured, nor are they deposits of or guaranteed by a bank or any other entity, so they may lose value.
Investors should carefully consider investment objectives, risks, charges and expenses. This and other important information is contained in the fund prospectus and summary prospectus, which can be obtained from your financial professional and should be read carefully before investing. You may also call American Funds Service Company (AFS) at (800) 421-4225 or visit the American Funds website at americanfunds.com.
| MFGEFPX-043-0316O-S49196 | Limited Term Tax-Exempt Bond Fund of America — Page 34 of 34 |
ITEM 7 – Disclosure of Proxy Voting Policies and Procedures for Closed-End Management Investment Companies
Not applicable to this Registrant, insofar as the Registrant is not a closed-end management investment company.
ITEM 8 – Portfolio Managers of Closed-End Management Investment Companies
Not applicable to this Registrant, insofar as the Registrant is not a closed-end management investment company.
ITEM 9 – Purchases of Equity Securities by Closed-End Management Investment Company and Affiliated Purchasers
Not applicable to this Registrant, insofar as the Registrant is not a closed-end management investment company.
ITEM 10 – Submission of Matters to a Vote of Security Holders
There have been no material changes to the procedures by which shareholders may recommend nominees to the Registrant’s board of trustees since the Registrant last submitted a proxy statement to its shareholders. The procedures are as follows. The Registrant has a nominating and governance committee comprised solely of persons who are not considered ‘‘interested persons’’ of the Registrant within the meaning of the Investment Company Act of 1940, as amended. The committee periodically reviews such issues as the board’s composition, responsibilities, committees, compensation and other relevant issues, and recommends any appropriate changes to the full board of trustees. While the committee normally is able to identify from its own resources an ample number of qualified candidates, it will consider shareholder suggestions of persons to be considered as nominees to fill future vacancies on the board. Such suggestions must be sent in writing to the nominating and governance committee of the Registrant, c/o the Registrant’s Secretary, and must be accompanied by complete biographical and occupational data on the prospective nominee, along with a written consent of the prospective nominee for consideration of his or her name by the nominating and governance committee.
ITEM 11 – Controls and Procedures
| (a) | The Registrant’s Principal Executive Officer and Principal Financial Officer have concluded, based on their evaluation of the Registrant’s disclosure controls and procedures (as such term is defined in Rule 30a-3 under the Investment Company Act of 1940), that such controls and procedures are adequate and reasonably designed to achieve the purposes described in paragraph (c) of such rule. |
| | |
| (b) | There were no changes in the Registrant’s internal controls over financial reporting (as defined in Rule 30a-3(d) under the Investment Company Act of 1940) that occurred during the Registrant’s second fiscal quarter of the period covered by this report that has materially affected, or is reasonably likely to materially affect, the Registrant’s internal control over financial reporting. |
ITEM 12 – Exhibits
| (a)(1) | Not applicable for filing of semi-annual reports to shareholders. |
| | |
| (a)(2) | The certifications required by Rule 30a-2 of the Investment Company Act of 1940 and Sections 302 and 906 of the Sarbanes-Oxley Act of 2002 are attached as exhibits hereto. |
SIGNATURES
Pursuant to the requirements of the Securities Exchange Act of 1934 and the Investment Company Act of 1940, the Registrant has duly caused this report to be signed on its behalf by the undersigned, thereunto duly authorized.
| | LIMITED TERM TAX-EXEMPT BOND FUND OF AMERICA |
| | |
| | By /s/ Brenda S. Ellerin |
| | Brenda S. Ellerin, President and Principal Executive Officer |
| | |
| | Date: March 31, 2016 |
Pursuant to the requirements of the Securities Exchange Act of 1934 and the Investment Company Act of 1940, this report has been signed below by the following persons on behalf of the Registrant and in the capacities and on the dates indicated.
| By /s/ Brenda S. Ellerin |
Brenda S. Ellerin, President and Principal Executive Officer |
| |
| Date: March 31, 2016 |
| By /s/ Brian C. Janssen |
Brian C. Janssen, Treasurer and Principal Financial Officer |
| |
| Date: March 31, 2016 |