UNITED STATES
SECURITIES AND EXCHANGE COMMISSION
Washington, D.C. 20549
FORM N-CSR
Certified Shareholder Report of
Registered Management Investment Companies
Investment Company Act File Number: 811-07888
Limited Term Tax-Exempt Bond Fund of America
(Exact Name of Registrant as Specified in Charter)
333 South Hope Street
Los Angeles, California 90071
(Address of Principal Executive Offices)
Registrant's telephone number, including area code: (213) 486-9200
Date of fiscal year end: July 31
Date of reporting period: January 31, 2019
Brian C. Janssen
Limited Term Tax-Exempt Bond Fund of America
333 South Hope Street
Los Angeles, California 90071
(Name and Address of Agent for Service)
I
ITEM 1 – Reports to Stockholders
American Funds Short-Term Tax-Exempt Bond Fund®
Limited Term Tax-Exempt Bond Fund of America®
The Tax-Exempt Bond Fund of America®
American High-Income Municipal Bond Fund®
The Tax-Exempt Fund of California®
American Funds Tax-Exempt Fund of New York® |  |
| | |
| Semi-annual reports for the six months ended January 31, 2019 | |

Invest in
municipal bonds
for tax-advantaged
income.
Beginning January 1, 2021, as permitted by regulations adopted by the U.S. Securities and Exchange Commission, we intend to no longer mail paper copies of the fund’s shareholder reports, unless specifically requested from American Funds or your financial intermediary, such as a broker-dealer or bank. Instead, the reports will be made available on the American Funds website (americanfunds.com); you will be notified by mail and provided with a website link to access the report each time a report is posted. If you have already elected to receive shareholder reports electronically, you will not be affected by this change and do not need to take any action. If you prefer to receive shareholder reports and other communications electronically, you may update your mailing preferences with your financial intermediary, or enroll in e-delivery at americanfunds.com (for accounts held directly with the fund).
You may elect to receive paper copies of all future reports free of charge. If you invest through a financial intermediary, you may contact your financial intermediary to request that you continue to receive paper copies of your shareholder reports. If you invest directly with the fund, you may inform American Funds that you wish to continue receiving paper copies of your shareholder reports by contacting us at (800) 421-4225. Your election to receive paper reports will apply to all funds held with American Funds or through your financial intermediary.
American Funds Short-Term Tax-Exempt Bond Fund seeks to provide current income exempt from regular federal income tax, consistent with the maturity and quality standards described in the prospectus, and to preserve capital.
Limited Term Tax-Exempt Bond Fund of America seeks to provide current income exempt from regular federal income tax, consistent with the maturity and quality standards described in the prospectus, and to preserve capital.
The Tax-Exempt Bond Fund of America seeks to provide a high level of current income exempt from federal income tax, consistent with the preservation of capital.
American High-Income Municipal Bond Fund seeks to provide a high level of current income exempt from regular federal income tax.
The Tax-Exempt Fund of California seeks to provide a high level of current income exempt from regular federal and California state income taxes. Its secondary objective is preservation of capital.
American Funds Tax-Exempt Fund of New York seeks to provide a high level of current income exempt from regular federal, New York state and New York City income taxes. Its secondary objective is preservation of capital.
Each fund is one of more than 40 offered by Capital Group, home of American Funds, one of the nation’s largest mutual fund families. For more than 85 years, Capital Group has invested with a long-term focus based on thorough research and attention to risk.
Fund results shown in this report, unless otherwise indicated, are for Class A shares at net asset value. If a sales charge had been deducted (maximum 2.50% for American Funds Short-Term Tax-Exempt Bond Fund and Limited Term Tax-Exempt Bond Fund of America; 3.75% for The Tax-Exempt Bond Fund of America, American High-Income Municipal Bond Fund, The Tax-Exempt Fund of California and American Funds Tax-Exempt Fund of New York), the results would have been lower. Results are for past periods and are not predictive of results for future periods. Current and future results may be lower or higher than those shown. Share prices and returns will vary, so investors may lose money. Investing for short periods makes losses more likely. For current information and month-end results, visit americanfunds.com.
Here are the total returns on a $1,000 investment with all distributions reinvested for periods ended December 31, 2018 (the most recent calendar quarter-end), and the total annual fund operating expense ratios as of the prospectus dated October 1, 2018 (as supplemented to date).
| | | Cumulative total returns | | Average annual total returns | | Gross |
| Class A shares | | 1 year | | 5 years | | 10 years/Lifetime* | | expense ratios |
| | | | | | | | | |
| Reflecting 2.50% maximum sales charge | | | | | | | | | | | | | | | | |
| American Funds Short-Term Tax-Exempt Bond Fund | | | –1.59 | % | | | 0.26 | % | | | 0.83 | % | | | 0.58 | % |
| Limited Term Tax-Exempt Bond Fund of America | | | –1.44 | | | | 1.15 | | | | 2.96 | | | | 0.59 | |
| | | | | | | | | | | | | | | | | |
| Reflecting 3.75% maximum sales charge | | | | | | | | | | | | | | | | |
| The Tax-Exempt Bond Fund of America | | | –3.02 | | | | 3.05 | | | | 4.79 | | | | 0.52 | |
| American High-Income Municipal Bond Fund | | | –2.22 | | | | 5.10 | | | | 7.25 | | | | 0.68 | |
| The Tax-Exempt Fund of California | | | –3.07 | | | | 3.26 | | | | 5.74 | | | | 0.60 | |
| American Funds Tax-Exempt Fund of New York | | | –3.39 | | | | 2.83 | | | | 3.02 | | | | 0.72 | † |
| * | Applicable only to American Funds Tax-Exempt Fund of New York, which began operations on 11/1/10. All other funds reflect 10-year results. |
| † | The net expense ratio for American Funds Tax-Exempt Fund of New York was 0.68% as of the prospectus dated October 1, 2018. |
For other share class results, visit americanfunds.com.
The 10-year investment result for American Funds Short-Term Tax-Exempt Bond Fund includes the fund’s results as a money market fund through the date of its conversion (August 7, 2009) to a short-term tax-exempt bond fund, and therefore is not representative of the fund’s results had it operated as a short-term tax-exempt bond fund for the full term of that period. Investment results assume all distributions are reinvested and reflect applicable fees and expenses. When applicable, investment results reflect fee waivers and/or expense reimbursements, without which results would have been lower. The investment adviser is currently reimbursing a portion of other expenses for American Funds Tax-Exempt Fund of New York. Investment results and the net expense ratio reflect the reimbursement, without which the results would have been lower and the expense ratio would have been higher. This reimbursement will be in effect through at least October 1, 2019, unless modified or terminated by the fund’s board. The adviser may elect at its discretion to extend, modify or terminate the reimbursement at that time. Visit americanfunds.com for more information.
A summary of each fund’s 30-day yield can be found on page 3.
Investments are not FDIC-insured, nor are they deposits of or guaranteed by a bank or any other entity, so they may lose value.
Fellow investors:
This report covers the results of American Funds Short-Term Tax-Exempt Bond Fund, Limited Term Tax-Exempt Bond Fund of America, The Tax-Exempt Bond Fund of America, American High-Income Municipal Bond Fund, The Tax-Exempt Fund of California and American Funds Tax-Exempt Fund of New York for the six months ended January 31, 2019. The municipal bond market faced pressure during the first quarter of the funds’ fiscal year, as macro-economic issues and the upward direction of Treasury yields led to some concern among investors in fixed income. But those worries gave way to a more bullish tone later in the period due to stronger U.S. Treasury market conditions, relatively attractive municipal yields compared with Treasuries and a low level of issuance of tax-exempt securities. Against this backdrop, total returns ranged from 1.63% for The Tax-Exempt Bond Fund of America to 0.97% for American Funds Short-Term Tax-Exempt Bond Fund. (See pages 4 through 10 for fund specific results and information.)
Economic and market overview
The tax-exempt bond market turned out to be a spot of stability during a challenging period for both equity and fixed income markets due in part to attractive after-tax yields, access to high quality issues and tax-advantaged income. The municipal bond market index ended the calendar year up more than 1% while broader measures of the total bond market ended essentially flat. Equity volatility was also pronounced. The Standard & Poor’s 500 Composite Index, a market capitalization-weighted index based on the results of approximately 500 widely held common stocks, declined 4.40% in 2018. Much of the strength in the municipal bond market occurred late in 2018 and early 2019 as bond market sentiment shifted. During the first six months of the funds’ fiscal year, the Bloomberg Barclays Municipal Bond Index, a market value-weighted index designed to represent the long-term investment-grade (bonds rated BBB/Baa and above) tax-exempt bond market, returned 2.05%.
At the start of the funds’ fiscal period last August, the municipal bond market weakened slightly as investors worried that stronger-than-expected economic data would keep the Federal Reserve on track to steadily increase interest rates. The U.S. economy grew at 3.4% during the third quarter, which was faster than the 2.2% recorded in the first quarter. Unemployment stood at 3.7% in September, below the 4.1% rate it finished in 2017, which was already a 17-year low. Inflation remained muted, ending the third quarter at 2.3%. The Federal Open Market Committee raised its target federal funds rate twice over the six months, ending with a target rate of between 2.25% and 2.50% as of December 20, 2018. That was considerably higher than the 1.25% to 1.50% rate at the close of the prior year. The yield on the benchmark 10-year U.S. Treasury note was peaking at 3.05% as of September 30.
Tensions over global trade coupled with uncertainty around the midterm elections pressured fixed income markets through early November. But following the election, which put Democrats in control of the House, municipal bonds began to gain — following the lead of the U.S. Treasury market — with the 10-year note rallying. As of December 2018, the yield on the 10-year note, which moves opposite of price, had fallen to 2.69%. Meanwhile, the low supply of new issues created a favorable environment. Municipal issuance totaled $338 billion during 2018, which was down 25% from the previous year. Issuance had been unusually high in 2017 as many issuers came to market ahead of proposed tax
| American Funds Tax-Exempt Funds | 1 |
reforms that threatened to impact the municipal bond market. Changes in the tax code ultimately led to the elimination of most advance refundings of tax-exempt bonds.
Additionally, price changes in the municipal market continued to be relatively less correlated with equity markets and offered some stability in contrast to the volatility in other markets. Credit and curve positioning when fund managers believed they had identified value unrecognized by the market also helped the funds remain competitive with their primary benchmarks. Our long-term focus in sectors such as transportation, public power, housing and education results in higher exposure to revenue bonds than bonds issued by state and local governments. Not-for-profit hospitals are another theme in our tax-exempt security selection. Even in an uncertain health care sector, we have found favorable return potential amid a wave of hospital mergers and acquisitions.
Looking ahead
We maintain a relatively cautious approach to credit and duration risk across municipal portfolios. Market confidence is delicate as some investors remain unconvinced the Federal Reserve will completely back away from tightening. We are maintaining a comparatively neutral duration positioning.
The market’s longer term prospects look healthy, however. Going into 2019, the credit quality of municipal bonds continues to be generally sound. Even if the economy were to soften, the credit fundamentals of many municipal bonds are unlikely to be materially impaired. Given signals the Fed is looking to temper its rate-hiking plan, increases to the short end of the yield curve could moderate, creating a constructive environment for bond investors. For those seeking diversity from equities and preservation in their portfolios, tax-exempt bonds remain a solid option.
We believe that in the current low-yield environment we may continue to uncover potentially compelling investment opportunities. That being said, quality matters. Our focus on revenue bond issuers — which are not directly affected by the long-term liability issues facing state and local governments — present opportunity for long-term investors.
We thank you for the confidence you have placed in us and endeavor to be responsible stewards of your capital.
Sincerely,

Aaron Applebaum
President, American Funds Short-Term
Tax-Exempt Bond Fund

Mark A. Marinella
President, Limited Term Tax-Exempt
Bond Fund of America

Chad M. Rach
President, American High-Income
Municipal Bond Fund

Jerome H. Solomon
President, American Funds Tax-Exempt
Fund of New York

Karl J. Zeile
President, The Tax-Exempt Bond Fund
of America and The Tax-Exempt
Fund of California
March 15, 2019
For current information about the funds, visit americanfunds.com.
| 2 | American Funds Tax-Exempt Funds |
Funds’ 30-day yields
Below is a summary of each fund’s 30-day yield and 12-month distribution rate for Class A shares as of February 28, 2019. Both measures reflect the 2.50%/3.75% maximum sales charge. Each fund’s 30-day yield is calculated in accordance with the U.S. Securities and Exchange Commission (SEC) formula. The SEC yield reflects the rate at which each fund is earning income on its current portfolio of securities while the distribution rate reflects the funds’ past dividends paid to shareholders. Accordingly, the funds’ SEC yields and distribution rates may differ. The equivalent taxable yield assumes a 40.8% tax rate.1
| Class A shares | | SEC
30-day yield | | Equivalent
taxable yield | | 12-month
distribution rate |
| | | | | | | |
| Reflecting 2.50% maximum sales charge | | | | | | | | | | | | |
| American Funds Short-Term Tax-Exempt Bond Fund | | | 1.45 | % | | | 2.45 | % | | | 1.43 | % |
| Limited Term Tax-Exempt Bond Fund of America | | | 1.63 | | | | 2.75 | | | | 1.96 | |
| | | | | | | | | | | | | |
| Reflecting 3.75% maximum sales charge | | | | | | | | | | | | |
| The Tax-Exempt Bond Fund of America | | | 2.27 | | | | 3.83 | | | | 2.74 | |
| American High-Income Municipal Bond Fund | | | 3.09 | | | | 5.22 | | | | 3.50 | |
| The Tax-Exempt Fund of California | | | 1.84 | | | | 4.01 | 2 | | | 2.79 | |
| American Funds Tax-Exempt Fund of New York | | | 1.98 | | | | 3.93 | 3 | | | 2.47 | |
| 1 | Based on 2019 federal tax rates. For the year 2019, there will be an Unearned Income Medicare Contribution Tax of 3.8% that applies to net investment income for taxpayers whose modified adjusted gross income exceeds $200,000 (for single filers) and $250,000 (for married filing jointly). Thus taxpayers in the highest tax bracket will face a combined 40.8% marginal tax rate on their investment income. The federal rates do not include an adjustment for the loss of personal exemptions and the phaseout of itemized deductions that are applicable to certain taxable income levels. |
| 2 | For investors in the 54.10% federal and California state tax bracket. |
| 3 | For investors in the 49.62% federal and New York state tax bracket. |
The return of principal for bond funds and for funds with significant underlying bond holdings is not guaranteed. Fund shares are subject to the same interest rate, inflation and credit risks associated with the underlying bond holdings. Income may be subject to state or local income taxes and/or federal alternative minimum taxes. Also, certain other income (such as distributions from gains on the sale of certain bonds purchased at less than par value, for The Tax-Exempt Bond Fund of America), as well as capital gain distributions, may be taxable. High-yield/lower rated bonds are subject to greater fluctuations in value and risk of loss of income and principal than investment-grade/higher rated bonds. The Tax-Exempt Fund of California and American Funds Tax-Exempt Fund of New York are more susceptible to factors adversely affecting issuers of each state’s tax-exempt securities than a more widely diversified municipal bond fund. The use of derivatives involves a variety of risks, which may be different from, or greater than, the risks associated with investing in traditional cash securities, such as stocks and bonds. Refer to the funds’ prospectus and the Risk Factors section of this report for more information on these and other risks associated with investing in the funds.
| American Funds Tax-Exempt Funds | 3 |
American Funds Short-Term Tax-Exempt Bond Fund
The fund registered a total return of 0.97% for the first half of its fiscal year. This trailed the 1.25% return posted by the Bloomberg Barclays Municipal Short 1–5 Years Index, a market value-weighted index that includes investment-grade (rated BBB/Baa and above) tax-exempt bonds with maturities of one to five years. The fund outpaced the 0.88% return of the Lipper Short Municipal Debt Funds Average, a peer group measure.
For the six months the fund paid monthly dividends totaling 8 cents a share. This amounts to a federally tax-exempt income return of 0.77% for investors who reinvested dividends. This is equivalent to a taxable income return of 1.30% for investors in the 40.8%1maximum federal tax bracket. A portion of the fund’s return also may be exempt from some state and local taxes.
In a volatile environment, the fund’s managers continued to seek relative stability. They maintained a focus on issues of slightly shorter duration and higher quality, but sought to participate in what they believed were attractive investment opportunities when market volatility rose. Returns for municipals were on the whole positive, with local government general obligation bonds and revenue bonds backing housing offsetting detractors.
At the close of the period more than 80% of the fund’s assets were invested in revenue bonds.
The market index is unmanaged and, therefore, has no expenses. Investors cannot invest directly in an index. Bloomberg Barclays source: Bloomberg Index Services Ltd. Lipper averages reflect the current composition of all eligible mutual funds (all share classes) within a given category. Lipper source: Thomson Reuters Lipper. Lipper categories are dynamic and averages may have few funds, especially over longer periods. To see the number of funds included in the Lipper category for each fund’s lifetime, please view the Quarterly Statistical Update, available at americanfunds.com.
Tax-exempt yields vs. taxable yields
Find your estimated taxable income below to determine your federal tax rate,2then look in the far right column to see what you would have had to earn from a taxable investment to equal the fund’s 1.42% tax-exempt distribution rate3as of January 31, 2019.
| If your taxable income is … | | | … then your marginal | | The fund’s tax-exempt
distribution rate of 1.42% is |
| Single | | | Joint | | | federal tax rate is … | | equivalent to a taxable rate of … |
| | | | | | | | | |
| $ | 0 – | | 9,525 | | | $ | 0 – | | 19,050 | | | | 10.0 | % | | | 1.58 | % |
| | 9,526 – | | 38,700 | | | | 19,051 – | | 77,400 | | | | 12.0 | | | | 1.61 | |
| | 38,701 – | | 82,500 | | | | 77,401 – | | 165,000 | | | | 22.0 | | | | 1.82 | |
| | 82,501 – | | 157,500 | | | | 165,001 – | | 250,000 | | | | 24.0 | | | | 1.87 | |
| | – | | | | | | 250,001 – | | 315,000 | | | | 27.8 | 1 | | | 1.97 | |
| | 157,501 – | | 200,000 | | | | – | | | | | | 32.0 | | | | 2.09 | |
| | – | | | | | | 315,001 – | | 400,000 | | | | 35.8 | 1 | | | 2.21 | |
| | 200,001 – | | 500,000 | | | | 400,001 – | | 600,000 | | | | 38.8 | 1 | | | 2.32 | |
| | Over 500,000 | | | | Over 600,000 | | | | 40.8 | 1 | | | 2.40 | |
| | | | | | | | | | | | | | | |
| 1 | For the year 2019, there will be an Unearned Income Medicare Contribution Tax of 3.8% that applies to net investment income for taxpayers whose modified adjusted gross income exceeds $200,000 (for single filers) and $250,000 (for married filing jointly). Thus taxpayers in the highest tax bracket will face a combined 40.8% marginal tax rate on their investment income. |
| 2 | Based on 2019 federal tax rates. The federal rates do not include an adjustment for the loss of personal exemptions and the phaseout of itemized deductions that are applicable to certain taxable income levels. |
| 3 | The distribution rate is based on dividends paid over the last 12 months divided by the maximum offering price as of January 31, 2019. Capital gain distributions, if any, are added back at the maximum offering price to determine the rate. |
Fund results shown are for Class A shares at net asset value. If a sales charge (maximum 2.50%) had been deducted, the results would have been lower. Results are for past periods and are not predictive of results for future periods. Current and future results may be lower or higher than those shown. Share prices and returns will vary, so investors may lose money. For current information and month-end results, visit americanfunds.com.
| 4 | American Funds Tax-Exempt Funds |
Limited Term Tax-Exempt Bond Fund of America
The fund registered a total return of 1.49% for the six months ended January 31, a result that fell short of the 1.94% total return of the Bloomberg Barclays Municipal Short-Intermediate 1–10 Years Index, a market value-weighted index that includes investment-grade (rated BBB/Baa and above) tax-exempt bonds with maturities of one to 10 years. By way of comparison, the fund narrowly outpaced the 1.48% total return of the Lipper Short-Intermediate Municipal Debt Funds Average, a peer group measure.
The fund paid monthly dividends totaling about 16 cents a share. Those individuals who reinvested dividends received a federally tax-exempt income return of 1.03%. This is equivalent to a taxable income return of 1.74% for investors in the 40.8%1 maximum federal tax bracket. The fund’s managers focus primarily on investment-grade bonds. Given the expectation that rates would rise modestly going forward, the portfolio had been positioned fairly conservatively at the start of the fiscal year, which helped mitigate the impact of rising volatility during the six months.
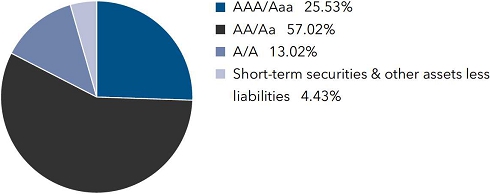
As of the close of the period, nearly 88% of the portfolio was invested in bonds rated AAA/Aaa, AA/Aa or A.
The market index is unmanaged and, therefore, has no expenses. Investors cannot invest directly in an index. Bloomberg Barclays source: Bloomberg Index Services Ltd. Lipper averages reflect the current composition of all eligible mutual funds (all share classes) within a given category. Lipper source: Thomson Reuters Lipper. Lipper categories are dynamic and averages may have few funds, especially over longer periods. To see the number of funds included in the Lipper category for each fund’s lifetime, please view the Quarterly Statistical Update, available at americanfunds.com.
Tax-exempt yields vs. taxable yields
Find your estimated taxable income below to determine your federal tax rate,2then look in the far right column to see what you would have had to earn from a taxable investment to equal the fund’s 1.96% tax-exempt distribution rate3as of January 31, 2019.
| If your taxable income is … | | | … then your marginal | | The fund’s tax-exempt
distribution rate of 1.96% is |
| Single | | | Joint | | | federal tax rate is … | | equivalent to a taxable rate of … |
| | | | | | | | | |
| $ | 0 – | | 9,525 | | | $ | 0 – | | 19,050 | | | | 10.0 | % | | | 2.18 | % |
| | 9,526 – | | 38,700 | | | | 19,051 – | | 77,400 | | | | 12.0 | | | | 2.23 | |
| | 38,701 – | | 82,500 | | | | 77,401 – | | 165,000 | | | | 22.0 | | | | 2.51 | |
| | 82,501 – | | 157,500 | | | | 165,001 – | | 250,000 | | | | 24.0 | | | | 2.58 | |
| | – | | | | | | 250,001 – | | 315,000 | | | | 27.8 | 1 | | | 2.71 | |
| | 157,501 – | | 200,000 | | | | – | | | | | | 32.0 | | | | 2.88 | |
| | – | | | | | | 315,001 – | | 400,000 | | | | 35.8 | 1 | | | 3.05 | |
| | 200,001 – | | 500,000 | | | | 400,001 – | | 600,000 | | | | 38.8 | 1 | | | 3.20 | |
| | Over 500,000 | | | | Over 600,000 | | | | 40.8 | 1 | | | 3.31 | |
| | | | | | | | | | | | | | | |
| 1 | For the year 2019, there will be an Unearned Income Medicare Contribution Tax of 3.8% that applies to net investment income for taxpayers whose modified adjusted gross income exceeds $200,000 (for single filers) and $250,000 (for married filing jointly). Thus taxpayers in the highest tax bracket will face a combined 40.8% marginal tax rate on their investment income. |
| 2 | Based on 2019 federal tax rates. The federal rates do not include an adjustment for the loss of personal exemptions and the phaseout of itemized deductions that are applicable to certain taxable income levels. |
| 3 | The distribution rate is based on dividends paid over the last 12 months divided by the maximum offering price as of January 31, 2019. Capital gain distributions, if any, are added back at the maximum offering price to determine the rate. |
Fund results shown are for Class A shares at net asset value. If a sales charge (maximum 2.50%) had been deducted, the results would have been lower. Results are for past periods and are not predictive of results for future periods. Current and future results may be lower or higher than those shown. Share prices and returns will vary, so investors may lose money. For current information and month-end results, visit americanfunds.com.
| American Funds Tax-Exempt Funds | 5 |
The Tax-Exempt Bond Fund of America
The fund generated a 1.63% total return during the six-month period ended January 31, trailing the 2.05% return of the Bloomberg Barclays Municipal Bond Index, a market value-weighted index designed to represent the long-term investment-grade (rated BBB/Baa and above) tax-exempt bond market. The fund’s result bested the 1.24% total return of the Lipper General & Insured Municipal Debt Funds Average, a peer group measure.
During the first half of its fiscal year, the fund paid monthly dividends totaling over 18 cents a share, amounting to a federally tax-exempt income return of 1.46% for investors who reinvested dividends. This is equivalent to a taxable income return of 2.47% for investors in the 40.8%1maximum federal tax bracket.
The fund was positioned relatively conservatively at the start of the fiscal year, as the fund’s managers were focused on upgrading the portfolio in an uncertain environment. This approach offered stability as the fund generated a positive return, albeit below the benchmark. At the close of the period more than 85% of the portfolio consisted of revenue bonds. Among the largest concentrations were holdings backing hospital facilities and water and sewer authorities. The fund does not invest in bonds subject to the Alternative Minimum Tax (AMT).
The Tax-Exempt Bond Fund of America uses derivatives to manage its exposure to interest rates and credit. Instruments such as futures are used when cash bonds are unavailable or not attractively priced. On a stand-alone basis, the fund’s derivative positions had a positive value, as of this reporting period. However, derivatives are used for the efficient management of the portfolio and so the mark-to-market value of these instruments in isolation can give an incomplete view.
The market index is unmanaged and, therefore, has no expenses. Investors cannot invest directly in an index. Bloomberg Barclays source: Bloomberg Index Services Ltd. Lipper averages reflect the current composition of all eligible mutual funds (all share classes) within a given category. Lipper source: Thomson Reuters Lipper. Lipper categories are dynamic and averages may have few funds, especially over longer periods. To see the number of funds included in the Lipper category for each fund’s lifetime, please view the Quarterly Statistical Update, available at americanfunds.com.
Tax-exempt yields vs. taxable yields
Find your estimated taxable income below to determine your federal tax rate,2then look in the far right column to see what you would have had to earn from a taxable investment to equal the fund’s 2.74% tax-exempt distribution rate3as of January 31, 2019.
| If your taxable income is … | | … then your marginal | | The fund’s tax-exempt
distribution rate of 2.74% is |
| Single | | Joint | | federal tax rate is … | | equivalent to a taxable rate of … |
| | | | | | | | | | | |
| $ | 0 – | | 9,525 | | | $ | 0 – | | 19,050 | | | | 10.0 | % | | | 3.04 | % |
| | 9,526 – | | 38,700 | | | | 19,051 – | | 77,400 | | | | 12.0 | | | | 3.11 | |
| | 38,701 – | | 82,500 | | | | 77,401 – | | 165,000 | | | | 22.0 | | | | 3.51 | |
| | 82,501 – | | 157,500 | | | | 165,001 – | | 250,000 | | | | 24.0 | | | | 3.61 | |
| | – | | | | | | 250,001 – | | 315,000 | | | | 27.8 | 1 | | | 3.80 | |
| | 157,501 – | | 200,000 | | | | – | | | | | | 32.0 | | | | 4.03 | |
| | – | | | | | | 315,001 – | | 400,000 | | | | 35.8 | 1 | | | 4.27 | |
| | 200,001 – | | 500,000 | | | | 400,001 – | | 600,000 | | | | 38.8 | 1 | | | 4.48 | |
| | Over 500,000 | | | | Over 600,000 | | | | 40.8 | 1 | | | 4.63 | |
| | | | | | | | | | | | | | | |
| 1 | For the year 2019, there will be an Unearned Income Medicare Contribution Tax of 3.8% that applies to net investment income for taxpayers whose modified adjusted gross income exceeds $200,000 (for single filers) and $250,000 (for married filing jointly). Thus taxpayers in the highest tax bracket will face a combined 40.8% marginal tax rate on their investment income. |
| 2 | Based on 2019 federal tax rates. The federal rates do not include an adjustment for the loss of personal exemptions and the phaseout of itemized deductions that are applicable to certain taxable income levels. |
| 3 | The distribution rate is based on dividends paid over the last 12 months divided by the maximum offering price as of January 31, 2019. Capital gain distributions, if any, are added back at the maximum offering price to determine the rate. |
Fund results shown are for Class A shares at net asset value. If a sales charge (maximum 3.75%) had been deducted, the results would have been lower. Results are for past periods and are not predictive of results for future periods. Current and future results may be lower or higher than those shown. Share prices and returns will vary, so investors may lose money. For current information and month-end results, visit americanfunds.com.
| 6 | American Funds Tax-Exempt Funds |
American High-Income Municipal Bond Fund
The fund produced a total return of 1.21% for the first half of its fiscal year, lagging the Bloomberg Barclays High Yield Municipal Bond Index (a market value-weighted index composed of municipal bonds rated below BBB/Baa), which returned 1.38%. By comparison, the Bloomberg Barclays Municipal Bond Index, a measure of the investment-grade municipal market, recorded a return of 2.05%. Meanwhile the fund’s return doubled that of the Lipper High Yield Municipal Debt Funds Average (a peer group measure), which rose 0.60%.
For the six months, the fund paid monthly dividends totaling about 29 cents a share, amounting to a federally tax-exempt income return of 1.84% for investors who reinvested dividends. This is equivalent to a taxable income return of 3.11% for investors in the 40.8%1maximum federal tax bracket. A portion of the fund’s return also may be exempt from some state and local taxes.
Over a period that saw high-yield municipal bonds trail the broader tax-exempt market, the fund’s returns were muted. Holdings of bonds backing schools and utilities posted some of the strongest returns.
The market indexes are unmanaged and, therefore, have no expenses. Investors cannot invest directly in an index. Bloomberg Barclays source: Bloomberg Index Services Ltd. Lipper averages reflect the current composition of all eligible mutual funds (all share classes) within a given category. Lipper source: Thomson Reuters Lipper. Lipper categories are dynamic and averages may have few funds, especially over longer periods. To see the number of funds included in the Lipper category for each fund’s lifetime, please view the Quarterly Statistical Update, available at americanfunds.com.
Tax-exempt yields vs. taxable yields
Find your estimated taxable income below to determine your federal tax rate,2then look in the far right column to see what you would have had to earn from a taxable investment to equal the fund’s 3.51% tax-exempt distribution rate3as of January 31, 2019.
| If your taxable income is … | | … then your marginal | | The fund’s tax-exempt
distribution rate of 3.51% is |
| Single | | Joint | | federal tax rate is … | | equivalent to a taxable rate of … |
| | | | | | | | | | | |
| $ | 0 – | | 9,525 | | | $ | 0 – | | 19,050 | | | | 10.0 | % | | | 3.90 | % |
| | 9,526 – | | 38,700 | | | | 19,051 – | | 77,400 | | | | 12.0 | | | | 3.99 | |
| | 38,701 – | | 82,500 | | | | 77,401 – | | 165,000 | | | | 22.0 | | | | 4.50 | |
| | 82,501 – | | 157,500 | | | | 165,001 – | | 250,000 | | | | 24.0 | | | | 4.62 | |
| | – | | | | | | 250,001 – | | 315,000 | | | | 27.8 | 1 | | | 4.86 | |
| | 157,501 – | | 200,000 | | | | – | | | | | | 32.0 | | | | 5.16 | |
| | – | | | | | | 315,001 – | | 400,000 | | | | 35.8 | 1 | | | 5.47 | |
| | 200,001 – | | 500,000 | | | | 400,001 – | | 600,000 | | | | 38.8 | 1 | | | 5.74 | |
| | Over 500,000 | | | | Over 600,000 | | | | 40.8 | 1 | | | 5.93 | |
| | | | | | | | | | | | | | | |
| 1 | For the year 2019, there will be an Unearned Income Medicare Contribution Tax of 3.8% that applies to net investment income for taxpayers whose modified adjusted gross income exceeds $200,000 (for single filers) and $250,000 (for married filing jointly). Thus taxpayers in the highest tax bracket will face a combined 40.8% marginal tax rate on their investment income. |
| 2 | Based on 2019 federal tax rates. The federal rates do not include an adjustment for the loss of personal exemptions and the phaseout of itemized deductions that are applicable to certain taxable income levels. |
| 3 | The distribution rate is based on dividends paid over the last 12 months divided by the maximum offering price as of January 31, 2019. Capital gain distributions, if any, are added back at the maximum offering price to determine the rate. |
Fund results shown are for Class A shares at net asset value. If a sales charge (maximum 3.75%) had been deducted, the results would have been lower. Results are for past periods and are not predictive of results for future periods. Current and future results may be lower or higher than those shown. Share prices and returns will vary, so investors may lose money. For current information and month-end results, visit americanfunds.com.
| American Funds Tax-Exempt Funds | 7 |
The Tax-Exempt Fund of California
The fund posted a total return of 1.43% for the six months ended January 31. This result bested the 0.93% total return of the Lipper California Municipal Debt Funds Average, a peer group measure. The fund trailed the 1.65% return of the Bloomberg Barclays California Municipal Index, a market value-weighted index that includes only investment-grade (rated BBB/Baa and above) tax-exempt bonds of issuers within the state of California.
For the period, the fund paid monthly dividends totaling almost 26 cents a share. Those investors who reinvested dividends received an income return of 1.48%. This is equivalent to a taxable income return of 3.22% for investors in the 54.10%1effective combined federal and California tax bracket. The California economy remains strong, growing at a 3.7% annual rate as of mid-2018, outpacing the national growth rate in 2018 of roughly 3.0%. With tax reform reducing the state and local tax deduction for some California taxpayers, municipal bonds may have increased appeal for residents in higher income tax brackets.
The market index is unmanaged and, therefore, has no expenses. Investors cannot invest directly in an index. Bloomberg Barclays source: Bloomberg Index Services Ltd. Lipper averages reflect the current composition of all eligible mutual funds (all share classes) within a given category. Lipper source: Thomson Reuters Lipper. Lipper categories are dynamic and averages may have few funds, especially over longer periods. To see the number of funds included in the Lipper category for each fund’s lifetime, please view the Quarterly Statistical Update, available at americanfunds.com.
Tax-exempt yields vs. taxable yields
Find your estimated 2019 taxable income below to determine your combined federal and California tax rate,2then look in the far right column to see what you would have had to earn from a taxable investment to equal the fund’s 2.79% tax-exempt distribution rate3as of January 31, 2019.
| If your taxable income is … | … then your marginal combined
federal and California | | The fund’s tax-exempt
distribution rate of 2.79% is |
| Single | | Joint | state tax rate is … | | equivalent to a taxable rate of … |
| | | | | | | | | |
| $ | 0 – | | 8,544 | | | $ | 0 – | | 17,088 | | | | 11.00 | % | | | 3.13 | % |
| | 8,545 – | | 9,525 | | | | 17,089 – | | 19,050 | | | | 12.00 | | | | 3.17 | |
| | 9,526 – | | 20,255 | | | | 19,051 – | | 40,510 | | | | 14.00 | | | | 3.24 | |
| | 20,256 – | | 31,969 | | | | 40,511 – | | 63,938 | | | | 16.00 | | | | 3.32 | |
| | 31,970 – | | 38,700 | | | | 63,939 – | | 77,400 | | | | 18.00 | | | | 3.40 | |
| | 38,701 – | | 44,377 | | | | 77,401 – | | 88,754 | | | | 28.00 | | | | 3.88 | |
| | 44,378 – | | 56,085 | | | | 88,755 – | | 112,170 | | | | 30.00 | | | | 3.99 | |
| | 56,086 – | | 82,500 | | | | 112,171 – | | 165,000 | | | | 31.30 | | | | 4.06 | |
| | 82,501 – | | 157,500 | | | | 165,001 – | | 250,000 | | | | 33.30 | | | | 4.18 | |
| | – | | | | | | 250,001 – | | 315,000 | | | | 37.10 | 1 | | | 4.44 | |
| | 157,501 – | | 200,000 | | | | – | | | | | | 41.30 | | | | 4.75 | |
| | – | | | | | | 315,001 – | | 400,000 | | | | 45.10 | 1 | | | 5.08 | |
| | 200,001 – | | 286,492 | | | | 400,001 – | | 572,984 | | | | 48.10 | 1 | | | 5.38 | |
| | 286,493 – | | 343,788 | | | | 572,985 – | | 600,000 | | | | 49.10 | 1 | | | 5.48 | |
| | 343,789 – | | 500,000 | | | | – | | | | | | 50.10 | 1 | | | 5.59 | |
| | – | | | | | | 600,001 – | | 687,576 | | | | 51.10 | 1 | | | 5.71 | |
| | 500,001 – | | 572,980 | | | | 687,577 – | | 1,000,000 | | | | 52.10 | 1 | | | 5.82 | |
| | 572,981 – | | 1,000,000 | | | | 1,000,001 – | | 1,145,960 | | | | 53.10 | 1 | | | 5.95 | |
| | Over 1,000,000 | | | | Over 1,145,960 | | | | 54.10 | 1 | | | 6.08 | |
| | |
| 1 | For the year 2019, there will be an Unearned Income Medicare Contribution Tax of 3.8% that applies to net investment income for taxpayers whose modified adjusted gross income exceeds $200,000 (for single filers) and $250,000 (for married filing jointly). Thus taxpayers in the highest tax bracket will face a combined 54.10% marginal tax rate on their investment income. |
| 2 | Based on 2019 federal and 2018 California state tax rates. (State rates from 1.0% to 13.3% are individually calculated for each bracket. The federal brackets are expanded to include additional state brackets.) The effective combined tax rates paid by California residents may be lower than those shown due to the availability of income tax deductions. |
| 3 | The distribution rate is based on dividends paid over the last 12 months divided by the maximum offering price as of January 31, 2019. Capital gains distributions, if any, are added back at the maximum offering price to determine the rate. |
Fund results shown are for Class A shares at net asset value. If a sales charge (maximum 3.75%) had been deducted, the results would have been lower. Results are for past periods and are not predictive of results for future periods. Current and future results may be lower or higher than those shown. Share prices and returns will vary, so investors may lose money. For current information and month-end results, visit americanfunds.com.
| 8 | American Funds Tax-Exempt Funds |
American Funds Tax-Exempt Fund of New York
The fund recorded a total return of 1.40% for the first half of its fiscal year, trailing the Bloomberg Barclays New York Municipal Index, a market value-weighted index that includes only investment-grade (rated BBB/Baa and above) tax-exempt bonds of issuers within the state of New York, which returned 2.05%. The fund’s result topped the Lipper New York Municipal Debt Funds average, a peer group measure, which posted a 1.17% total return.
The fund paid monthly dividends totaling about 14 cents a share for the six months. This represents an income return of 1.30% for those who reinvested dividends. For investors in the 49.62%1combined effective federal, New York state and New York City tax bracket, this is equivalent to a taxable income return of 2.58%. General obligation and revenue bonds supporting K-12 schools and higher education were beneficial to the fund’s return. Utility-related credits were also positive contributors.
The market index is unmanaged and, therefore, has no expenses. Investors cannot invest directly in an index. Bloomberg Barclays source: Bloomberg Index Services Ltd. Lipper averages reflect the current composition of all eligible mutual funds (all share classes) within a given category. Lipper source: Thomson Reuters Lipper. Lipper categories are dynamic and averages may have few funds, especially over longer periods. To see the number of funds included in the Lipper category for each fund’s lifetime, please view the Quarterly Statistical Update, available at americanfunds.com.
Tax-exempt yields vs. taxable yields
Find your estimated 2019 taxable income below to determine your combined federal and New York state tax rate,2,3then look in the far right column to see what you would have had to earn from a taxable investment to equal the fund’s 2.48% tax-exempt distribution rate4as of January 31, 2019.
| If your taxable income is … | | … then your marginal combined
federal and New York | | The fund’s tax-exempt
distribution rate of 2.48% is |
| Single | | Joint | | state tax rate is … | | equivalent to a taxable rate of … |
| | | | | | | | | | | | | | | |
| $ | 0 – | | 8,500 | | | $ | 0 – | | 17,150 | | | | 14.00 | % | | | 2.88 | % |
| | 8,501 – | | 9,525 | | | | 17,151 – | | 19,050 | | | | 14.50 | | | | 2.90 | |
| | 9,526 – | | 11,700 | | | | 19,051 – | | 23,600 | | | | 16.50 | | | | 2.97 | |
| | 11,701 – | | 13,900 | | | | 23,601 – | | 27,900 | | | | 17.25 | | | | 3.00 | |
| | 13,901 – | | 21,400 | | | | 27,901 – | | 43,000 | | | | 17.90 | | | | 3.02 | |
| | 21,401 – | | 38,700 | | | | 43,001 – | | 77,400 | | | | 18.33 | | | | 3.04 | |
| | 38,701 – | | 80,650 | | | | 77,401 – | | 161,550 | | | | 28.33 | | | | 3.46 | |
| | 80,651 – | | 82,500 | | | | 161,551 – | | 165,000 | | | | 28.57 | | | | 3.47 | |
| | 82,501 – | | 157,500 | | | | 165,001 – | | 250,000 | | | | 30.57 | | | | 3.57 | |
| | – | | | | | | 250,001 – | | 315,000 | | | | 34.37 | 1 | | | 3.78 | |
| | 157,501 – | | 200,000 | | | | – | | | | | | 38.57 | | | | 4.04 | |
| | – | | | | | | 315,001 – | | 323,200 | | | | 42.37 | 1 | | | 4.30 | |
| | – | | | | | | 323,201 – | | 400,000 | | | | 42.65 | 1 | | | 4.32 | |
| | 200,001 – | | 215,400 | | | | – | | | | | | 45.37 | 1 | | | 4.54 | |
| | 215,401 – | | 500,000 | | | | 400,001 – | | 600,000 | | | | 45.65 | 1 | | | 4.56 | |
| | 500,001 – | | 1,077,550 | | | | 600,001 – | | 2,155,350 | | | | 47.65 | 1 | | | 4.74 | |
| | Over 1,077,550 | | | | Over 2,155,350 | | | | 49.62 | 1 | | | 4.92 | |
| | |
| 1 | For the year 2019, there will be an Unearned Income Medicare Contribution Tax of 3.8% that applies to net investment income for taxpayers whose modified adjusted gross income exceeds $200,000 (for single filers) and $250,000 (for married filing jointly). Thus taxpayers in the highest tax bracket will face a combined 49.62% marginal tax rate on their investment income. |
| 2 | Income generated by the fund’s investments is also generally exempt from New York City taxes, offering additional tax advantages to New York City residents. |
| 3 | Based on 2019 federal and 2018 New York state tax rates. (State rates from 4.00% to 8.82% are individually calculated for each bracket. The federal brackets are expanded to include additional state brackets.) The effective combined tax rates paid by New York residents may be lower than those shown due to the availability of income tax deductions. |
| 4 | The distribution rate is based on dividends paid over the last 12 months divided by the maximum offering price as of January 31, 2019. Capital gain distributions, if any, are added back at the maximum offering price to determine the rate. |
Fund results shown are for Class A shares at net asset value. If a sales charge (maximum 3.75%) had been deducted, the results would have been lower. Results are for past periods and are not predictive of results for future periods. Current and future results may be lower or higher than those shown. Share prices and returns will vary, so investors may lose money. For current information and month-end results, visit americanfunds.com.
| American Funds Tax-Exempt Funds | 9 |
Results at a glance
For periods ended January 31, 2019, with distributions reinvested
| | | Cumulative total returns | | Average annual total returns |
| | | 1 year | | 5 years | | 10 years | | Lifetime* |
| | | | | | | | | |
American Funds Short-Term Tax-Exempt Bond Fund
(Class A shares) | | | 1.47 | % | | | 0.80 | % | | | — | | | | 1.24 | % |
| Bloomberg Barclays Municipal Short 1–5 Years Index | | | 2.19 | | | | 1.23 | | | | — | | | | 1.72 | |
| Lipper Short Municipal Debt Funds Average | | | 1.55 | | | | 0.84 | | | | — | | | | 1.15 | |
| | | | | | | | | | | | | | | | | |
Limited Term Tax-Exempt Bond Fund of America
(Class A shares) | | | 2.11 | | | | 1.60 | | | | 2.91 | | | | 3.80 | |
| Bloomberg Barclays Municipal Short-Intermediate 1–10 Years Index | | | 2.94 | | | | 2.08 | | | | 2.79 | | | | 4.05 | |
| Lipper Short-Intermediate Municipal Debt Funds Average | | | 2.56 | | | | 1.48 | | | | 2.31 | | | | 3.36 | |
| | | | | | | | | | | | | | | | | |
The Tax-Exempt Bond Fund of America
(Class A shares) | | | 2.58 | | | | 3.56 | | | | 4.83 | | | | 6.32 | |
| Bloomberg Barclays Municipal Bond Index | | | 3.26 | | | | 3.57 | | | | 4.55 | | | | — | † |
| Lipper General & Insured Municipal Debt Funds Average | | | 2.37 | | | | 3.52 | | | | 4.88 | | | | 6.11 | |
| | | | | | | | | | | | | | | | | |
American High-Income Municipal Bond Fund
(Class A shares) | | | 3.05 | | | | 5.45 | | | | 7.21 | | | | 5.46 | |
| Bloomberg Barclays Municipal Bond Index | | | 3.26 | | | | 3.57 | | | | 4.55 | | | | 5.22 | |
| Bloomberg Barclays High Yield Municipal Bond Index | | | 6.46 | | | | 5.98 | | | | 8.57 | | | | — | † |
| Lipper High Yield Municipal Debt Funds Average | | | 2.98 | | | | 5.21 | | | | 7.13 | | | | 4.95 | |
| | | | | | | | | | | | | | | | | |
The Tax-Exempt Fund of California
(Class A shares) | | | 2.42 | | | | 3.67 | | | | 5.62 | | | | 5.40 | |
| Bloomberg Barclays California Municipal Index | | | 3.00 | | | | 3.63 | | | | 4.98 | | | | — | † |
| Lipper California Municipal Debt Funds Average | | | 2.19 | | | | 3.93 | | | | 5.32 | | | | 5.40 | |
| | | | | | | | | | | | | | | | | |
American Funds Tax-Exempt Fund of New York
(Class A shares) | | | 2.04 | | | | 3.34 | | | | — | | | | 3.54 | |
| Bloomberg Barclays New York Municipal Index | | | 3.00 | | | | 3.45 | | | | — | | | | 3.49 | |
| Lipper New York Municipal Debt Funds Average | | | 2.42 | | | | 3.50 | | | | — | | | | 3.15 | |
| | | | | | | | | | | | | | | | | |
| * | Since 8/7/09 (American Funds Short-Term Tax-Exempt Bond Fund), 10/6/93 (Limited Term Tax-Exempt Bond Fund of America), 10/3/79 (The Tax-Exempt Bond Fund of America), 9/26/94 (American High-Income Municipal Bond Fund), 10/28/86 (The Tax-Exempt Fund of California) and 11/1/10 (American Funds Tax-Exempt Fund of New York). |
| † | This index did not exist at the fund’s inception. |
The market indexes are unmanaged and, therefore, have no expenses. Investors cannot invest directly in an index. Bloomberg Barclays source: Bloomberg Index Services Ltd. Lipper averages reflect the current composition of all eligible mutual funds (all share classes) within a given category. Lipper source: Thomson Reuters Lipper. Lipper categories are dynamic and averages may have few funds, especially over longer periods. To see the number of funds included in the Lipper category for each fund’s lifetime, please view the Quarterly Statistical Update, available at americanfunds.com.
| 10 | American Funds Tax-Exempt Funds |
| American Funds Short-Term Tax-Exempt Bond Fund | unaudited |
Summary investment portfolioJanuary 31, 2019
| Portfolio quality summary* | Percent of net assets |
| * | Bond ratings, which typically range from AAA/Aaa (highest) to D (lowest), are assigned by credit rating agencies such as Standard & Poor’s, Moody’s and/or Fitch as an indication of an issuer’s creditworthiness. In assigning a credit rating to a security, the fund looks specifically to the ratings assigned to the issuer of the security by Standard & Poor’s, Moody’s and/or Fitch. If agency ratings differ, the security will be considered to have received the highest of those ratings, consistent with the fund’s investment policies. |
| Bonds, notes & other debt instruments 95.57% | Principal amount
(000) | | | Value
(000) | |
| Alabama 1.42% | | | | | | |
| Black Belt Energy Gas Dist., Gas Supply Rev. Bonds, Series 2017-A, 4.00% 2047 (put 2022) | | $ | 5,500 | | | $ | 5,753 | |
| Other securities | | | | | | | 10,407 | |
| | | | | | | | 16,160 | |
| | | | | | | | | |
| California 4.39% | | | | | | | | |
| Bay Area Toll Auth., San Francisco Bay Area Toll Bridge Rev. Bonds, Series 2006-C-1, (SIFMA Municipal Swap Index + 0.90%) 2.33% 2045 (put 2023)1 | | | 6,600 | | | | 6,654 | |
| Bay Area Toll Auth., San Francisco Bay Area Toll Bridge Rev. Bonds, Series 2007-E-3, (SIFMA Municipal Swap Index + 0.70%) 2.13% 2047 (put 2019)1 | | | 3,000 | | | | 3,002 | |
| Bay Area Toll Auth., San Francisco Bay Area Toll Bridge Rev. Bonds, Series 2008-A-1, (SIFMA Municipal Swap Index + 0.90%) 2.33% 2045 (put 2023)1 | | | 1,250 | | | | 1,260 | |
| Bay Area Toll Auth., San Francisco Bay Area Toll Bridge Rev. Bonds, Series 2014-G, (SIFMA Municipal Swap Index + 0.60%) 2.03% 2034 (put 2020)1 | | | 2,000 | | | | 2,002 | |
| Bay Area Toll Auth., San Francisco Bay Area Toll Bridge Rev. Bonds, Series 2017-D, (3-month USD-LIBOR x 0.70 + 0.55%) 2.51% 2045 (put 2021)1 | | | 500 | | | | 501 | |
| Other securities | | | | | | | 36,614 | |
| | | | | | | | 50,033 | |
| | | | | | | | | |
| Colorado 1.82% | | | | | | | | |
| Housing and Fin. Auth., Single Family Mortgage Bonds, Series 2019-C, Class I, 4.25% 2049 | | | 6,500 | | | | 6,993 | |
| Other securities | | | | | | | 13,804 | |
| | | | | | | | 20,797 | |
| | | | | | | | | |
| District of Columbia 0.58% | | | | | | | | |
| G.O. Bonds, Series 2015-A, 5.00% 2024 | | | 5,255 | | | | 6,108 | |
| Other securities | | | | | | | 511 | |
| | | | | | | | 6,619 | |
| | | | | | | | | |
| Florida 4.22% | | | | | | | | |
| Board of Education, Public Education Capital Outlay Rev. Ref. Bonds, Series 2015-A, 5.00% 2024 | | | 5,525 | | | | 6,422 | |
| Citizens Property Insurance Corp., Personal Lines Account/Commercial Lines Account Senior Secured Bonds, Series 2012-A-1, 5.00% 2019 | | | 7,450 | | | | 7,530 | |
| Housing Fin. Corp., Homeowner Mortgage Rev. Bonds, Series 2018-2, 4.25% 2050 | | | 5,265 | | | | 5,675 | |
| JEA, Electric System Rev. Bonds, Series 2012-B, 5.00% 2026 (preref. 2021) | | | 4,650 | | | | 5,040 | |
| Other securities | | | | | | | 23,418 | |
| | | | | | | | 48,085 | |
| | | | | | | | | |
| Hawaii 0.97% | | | | | | | | |
| Airports System Rev. Ref. Bonds, Series 2011, AMT, 5.00% 2019 | | | 5,000 | | | | 5,064 | |
| Other securities | | | | | | | 6,010 | |
| | | | | | | | 11,074 | |
| American Funds Tax-Exempt Funds | 11 |
American Funds Short-Term Tax-Exempt Bond Fund
| Bonds, notes & other debt instruments(continued) | Principal amount
(000) | | | Value
(000) | |
| Illinois 10.08% | | | | | | |
| Build Illinois Bonds, Sales Tax Rev. Bonds, Series 2013, 5.00% 2020 | | $ | 6,300 | | | $ | 6,508 | |
| Educational Facs. Auth., Rev. Bonds (University of Chicago), Series 1998-B, 1.875% 2025 (put 2019) | | | 10,390 | | | | 10,390 | |
| Housing Dev. Auth., Multi Family Housing Rev. Notes (Marshall Field Garden Apartment Homes), Series 2015, (SIFMA Municipal Swap Index + 1.00%) 2.43% 2050 (put 2025)1 | | | 5,525 | | | | 5,482 | |
| Metropolitan Water Reclamation Dist. of Greater Chicago, Limited Tax G.O.Rev. Ref. Bonds, Series 2016-B, 5.00% 2025 | | | 4,370 | | | | 5,117 | |
| Regional Transportation Auth., G.O. Rev. Ref. Bonds, Series 2017-A, 5.00% 2023 | | | 5,000 | | | | 5,585 | |
| Other securities | | | | | | | 81,765 | |
| | | | | | | | 114,847 | |
| | | | | | | | | |
| Indiana 1.87% | | | | | | | | |
| Hobart Building Corp., First Mortgage Bonds, Series 2006, National insured, 6.50% 2029 (preref. 2020) | | | 6,000 | | | | 6,271 | |
| Other securities | | | | | | | 15,011 | |
| | | | | | | | 21,282 | |
| | | | | | | | | |
| Iowa 0.58% | | | | | | | | |
| Fin. Auth., State Revolving Fund Rev. Bonds, Series 2011, 5.00% 2026 (preref. 2021) | | | 4,945 | | | | 5,340 | |
| Other securities | | | | | | | 1,236 | |
| | | | | | | | 6,576 | |
| | | | | | | | | |
| Michigan 2.53% | | | | | | | | |
| Housing Dev. Auth., Single Family Mortgage Rev. Bonds, Series 2018-C, 4.25% 2049 | | | 5,500 | | | | 5,910 | |
| Other securities | | | | | | | 22,899 | |
| | | | | | | | 28,809 | |
| | | | | | | | | |
| Minnesota 3.37% | | | | | | | | |
| G.O. Bonds, Series 2015-D, 5.00% 2025 | | | 4,775 | | | | 5,694 | |
| Housing Fin. Agcy., Residential Housing Fin. Bonds, Series 2014-C, AMT, 4.00% 2045 | | | 5,790 | | | | 6,039 | |
| Housing Fin. Agcy., Residential Housing Fin. Bonds, Series 2018-E, 4.25% 2049 | | | 4,685 | | | | 5,046 | |
| Other securities | | | | | | | 21,670 | |
| | | | | | | | 38,449 | |
| | | | | | | | | |
| Montana 0.74% | | | | | | | | |
| Fin. Auth., Rev. Bonds (Billings Clinic Obligated Group), Series 2018-C, (SIFMA Municipal Swap Index + 0.55%) 1.98% 2037 (put 2023)1 | | | 5,125 | | | | 5,100 | |
| Other securities | | | | | | | 3,378 | |
| | | | | | | | 8,478 | |
| | | | | | | | | |
| Nebraska 1.25% | | | | | | | | |
| Central Plains Energy Project, Gas Supply Rev. Ref. Bonds, Series 2014, 5.00% 2039 (put 2019) | | | 6,700 | | | | 6,856 | |
| Other securities | | | | | | | 7,344 | |
| | | | | | | | 14,200 | |
| | | | | | | | | |
| New Jersey 2.29% | | | | | | | | |
| Housing and Mortgage Fin. Agcy., Single Family Housing Rev. Bonds, Series 2018-A, 4.50% 2048 | | | 6,150 | | | | 6,660 | |
| Other securities | | | | | | | 19,423 | |
| | | | | | | | 26,083 | |
| | | | | | | | | |
| New York 8.97% | | | | | | | | |
| Dormitory Auth., State Personal Income Tax Rev. Bonds (General Purpose), Series 2017-B, 5.00% 2023 | | | 5,000 | | | | 5,630 | |
| Metropolitan Transportation Auth., Transportation Rev. Bonds, Series 2015-A-2, (SIFMA Municipal Swap Index + 0.58%) 2.01% 2039 (put 2020)1 | | | 6,250 | | | | 6,244 | |
| Metropolitan Transportation Auth., Transportation Rev. Bonds, Series 2017-C-2A, 4.00% 2019 | | | 7,300 | | | | 7,348 | |
| New York City Housing Dev. Corp., Multi Family Housing Rev. Bonds (Sustainable Neighborhood Bonds), Series 2017-C-2, 1.70% 2021 | | | 5,250 | | | | 5,196 | |
| Other securities | | | | | | | 77,779 | |
| | | | | | | | 102,197 | |
| 12 | American Funds Tax-Exempt Funds |
American Funds Short-Term Tax-Exempt Bond Fund
| | Principal amount
(000) | | | Value
(000) | |
| North Carolina 1.95% | | | | | | | | |
| City of Charlotte, Water and Sewer System Rev. Ref. Bonds, Series 2018, 5.00% 2025 | | $ | 5,000 | | | $ | 5,954 | |
| Housing Fin. Agcy., Home Ownership Rev. Ref. Bonds, Series 38-B, 4.00% 2047 | | | 5,615 | | | | 5,915 | |
| Other securities | | | | | | | 10,304 | |
| | | | | | | | 22,173 | |
| | | | | | | | | |
| Oregon 1.68% | | | | | | | | |
| Housing and Community Services Dept., Housing Dev. Rev. Bonds (The Henry Apartments Project), Series 2018-J, 2.20% 2021 (put 2020) | | | 7,075 | | | | 7,092 | |
| Housing and Community Services Dept., Mortgage Rev. Bonds (Single Family Mortgage Program), Series 2018-D, 4.75% 2050 | | | 4,300 | | | | 4,723 | |
| Other securities | | | | | | | 7,354 | |
| | | | | | | | 19,169 | |
| | | | | | | | | |
| Pennsylvania 3.22% | | | | | | | | |
| Housing Fin. Agcy., Special Limited Obligation, Multi Family Housing Dev. Bonds (Central Pennsylvania Dev.), Series 2018, 2.45% 2022 (put 2021) | | | 5,000 | | | | 5,026 | |
| Other securities | | | | | | | 31,692 | |
| | | | | | | | 36,718 | |
| | | | | | | | | |
| Texas 13.24% | | | | | | | | |
| Clear Creek Independent School Dist., Unlimited Tax School Building Bonds, Series 2013-B, 3.00% 2032 (put 2019) | | | 6,000 | | | | 6,040 | |
| G.O. Bonds, College Student Loan Bonds, Series 2013-B, AMT, 5.25% 2022 | | | 3,155 | | | | 3,500 | |
| City of Houston, Combined Utility System Rev. Ref. Bonds, Series 2018-C, (1-month USD-LIBOR x 0.70 + 0.36%) 2.109% 2034 (put 2021)1 | | | 5,650 | | | | 5,627 | |
| City of Houston, Higher Education Fin. Corp., Higher Education Rev. Bonds (Rice University Project), Series 2010-A, 5.00% 2040 (preref. 2020) | | | 5,410 | | | | 5,635 | |
| City of Houston, Public Improvement Rev. Ref. Bonds, Series 2017-A, 5.00% 2020 | | | 2,850 | | | | 2,950 | |
| North Texas Tollway Auth., Special Projects System Rev. Bonds, Series 2011-D, 5.00% 2029 (preref. 2021) | | | 5,000 | | | | 5,406 | |
| Public Fin. Auth., G.O. Rev. Ref. Bonds, Series 2018-A, 5.00% 2021 | | | 5,000 | | | | 5,424 | |
| City of San Antonio, Electric and Gas Systems Rev. Ref. Bonds, Series 2009-A, 5.25% 2024 (preref. 2019) | | | 1,100 | | | | 1,100 | |
| City of San Antonio, Electric and Gas Systems Rev. Ref. Bonds, Series 2015-A, 2.25% 2033 (put 2019) | | | 9,000 | | | | 9,030 | |
| City of San Antonio, Electric and Gas Systems Rev. Ref. Bonds, Series 2015-B, 2.00% 2033 (put 2021) | | | 3,040 | | | | 3,031 | |
| Other securities | | | | | | | 103,055 | |
| | | | | | | | 150,798 | |
| | | | | | | | | |
| Utah 0.49% | | | | | | | | |
| G.O. Bonds, Series 2018, 5.00% 2021 | | | 5,200 | | | | 5,612 | |
| | | | | | | | | |
| Washington 2.73% | | | | | | | | |
| Central Puget Sound Regional Transit Auth., Sales Tax Improvement Green Bonds, Series 2015-S-2B, (SIFMA Municipal Swap Index + 0.45%) 1.88% 2045 (put 2023)1 | | | 6,150 | | | | 6,132 | |
| G.O. Rev. Ref. Bonds, Series 2018-R-C, 5.00% 2021 | | | 5,000 | | | | 5,406 | |
| Other securities | | | | | | | 19,549 | |
| | | | | | | | 31,087 | |
| | | | | | | | | |
| Wisconsin 3.87% | | | | | | | | |
| G.O. Bonds, Series 2013-A, 5.00% 2025 (preref. 2022) | | | 5,000 | | | | 5,513 | |
| G.O. Bonds, Series 2015-A, 5.00% 2031 (preref. 2023) | | | 5,000 | | | | 5,655 | |
| Health and Educational Facs. Auth., Rev. Bonds (Ascension Health Senior Credit Group), Series 2013-B-1, 1.375% 2038 (put 2019) | | | 2,070 | | | | 2,058 | |
| Health and Educational Facs. Auth., Rev. Bonds (Ascension Health Senior Credit Group), Series 2013-B-2, 4.00% 2043 (put 2019) | | | 6,000 | | | | 6,041 | |
| American Funds Tax-Exempt Funds | 13 |
American Funds Short-Term Tax-Exempt Bond Fund
| Bonds, notes & other debt instruments(continued) | | Principal amount
(000) | | | Value
(000) | |
| Wisconsin (continued) | | | | | | | | |
| Health and Educational Facs. Auth., Rev. Bonds (Ascension Health Senior Credit Group), Series 2013-B-3, 5.00% 2043 (put 2020) | | $ | 4,500 | | | $ | 4,668 | |
| Housing and Econ. Dev. Auth., Home Ownership Rev. Bonds, Series 2016-A, AMT, 3.50% 2046 | | | 4,910 | | | | 5,035 | |
| Other securities | | | | | | | 15,133 | |
| | | | | | | | 44,103 | |
| | | | | | | | | |
| Other states & U.S. territories 23.31% | | | | | | | | |
| Other securities | | | | | | | 265,452 | |
| | | | | | | | | |
| Total bonds, notes & other debt instruments (cost: $1,088,959,000) | | | | | | | 1,088,801 | |
| | | | | | | | | |
| Short-term securities 7.63% | | | | | | | | |
| State of Connecticut, Health and Educational Facs. Auth., IAM Commercial Paper (Yale University Issue), Series 2019-S-1, 1.77% 2/1/2019 | | | 3,200 | | | | 3,200 | |
| State of Connecticut, Health and Educational Facs. Auth., IAM Commercial Paper (Yale University Issue), Series 2019-S-2, 1.76% 2/1/2019 | | | 2,000 | | | | 2,000 | |
| State of Louisiana, Parish of East Baton Rouge, Pollution Control Rev. Ref. Bonds (ExxonMobil Project), Series 1993, 1.60% 20221 | | | 5,000 | | | | 5,000 | |
| State of Massachusetts, G.O. Rev. Anticipation Notes, Series 2018-A, 4.00% 4/25/2019 | | | 6,000 | | | | 6,032 | |
| State of Massachusetts, G.O. Rev. Anticipation Notes, Series 2018-C, 4.00% 6/20/2019 | | | 3,750 | | | | 3,784 | |
| State of Michigan, Strategic Fund, Demand Limited Obligation Rev. Bonds (Air Products and Chemicals, Inc. Project), Series 2007, 1.58% 20421 | | | 5,000 | | | | 5,000 | |
| State of New York, New York City Transitional Fin. Auth., Future Tax Secured Bonds, Fiscal 2003, Series 2003-C-5, 1.60% 20311 | | | 3,585 | | | | 3,585 | |
| State of New York, New York City Transitional Fin. Auth., Future Tax Secured Bonds, Fiscal 2010, Series 2010-G-5, 1.67% 20341 | | | 1,500 | | | | 1,500 | |
| State of Texas, City of Houston, Anticipation Rev. and Tax Notes, Series 2018, 4.00% 6/28/2019 | | | 4,000 | | | | 4,037 | |
| State of Texas, Port Arthur Navigation Dist. Industrial Dev. Corp., Rev. Bonds (Air Products Project), Series 2005, 1.58% 20401 | | | 9,000 | | | | 9,000 | |
| State of Texas, Tax and Rev. Anticipation Notes, Series 2018, 4.00% 8/29/2019 | | | 4,225 | | | | 4,281 | |
| State of Virginia, Rector and Visitors of the University of Virginia, IAM Commercial Paper, Series 2019-A, 1.55% 3/6/2019 | | | 1,570 | | | | 1,570 | |
| State of Virginia, Rector and Visitors of the University of Virginia, IAM Commerical Paper, Series 2019-A, 1.76% 2/5/2019 | | | 5,600 | | | | 5,600 | |
| State of Wyoming, County of Lincoln, Pollution Control Rev. Ref. Bonds (ExxonMobil Project), Series 2014, 1.60% 20441 | | | 1,500 | | | | 1,500 | |
| Other securities | | | | | | | 30,883 | |
| | | | | | | | | |
| Total short-term securities (cost: $86,962,000) | | | | | | | 86,972 | |
| Total investment securities 103.20% (cost: $1,175,921,000) | | | | | | | 1,175,773 | |
| Other assets less liabilities (3.20)% | | | | | | | (36,464 | ) |
| | | | | | | | | |
| Net assets 100.00% | | | | | | $ | 1,139,309 | |
This summary investment portfolio is designed to streamline the report and help investors better focus on the fund’s principal holdings. See the inside back cover for details on how to obtain a complete schedule of portfolio holdings.
“Other securities” includes all issues that are not disclosed separately in the summary investment portfolio. “Other securities” also includes securities (with an aggregate value of $4,991,000, which represented .44% of the net assets of the fund) which were acquired in transactions exempt from registration under Rule 144A of the Securities Act of 1933 and may be resold in the U.S. in transactions exempt from registration, normally to qualified institutional buyers.
| 14 | American Funds Tax-Exempt Funds |
American Funds Short-Term Tax-Exempt Bond Fund
Futures contracts
| Contracts | | Type | | Number of
contracts | | | Expiration | | Notional
amount
(000) | 2
| | Value at
1/31/2019
(000) | 3
| | Unrealized
appreciation
(depreciation)
at 1/31/2019
(000) | |
| 2 Year U.S. Treasury Note Futures | | Long | | | 389 | | | April 2019 | | | $ 77,800 | | | | $ 82,596 | | | | $ | 406 | |
| 5 Year U.S. Treasury Note Futures | | Long | | | 300 | | | April 2019 | | | 30,000 | | | | 34,458 | | | | | 104 | |
| 10 Year Ultra U.S. Treasury Note Futures | | Short | | | 90 | | | March 2019 | | | (9,000 | ) | | | (11,762 | ) | | | | (68 | ) |
| | | | | | | | | | | | | | | | | | | | $ | 442 | |
| 1 | Coupon rate may change periodically. For short-term securities, the date of the next scheduled coupon rate change is considered to be the maturity date. |
| 2 | Notional amount is calculated based on the number of contracts and notional contract size. |
| 3 | Value is calculated based on the notional amount and current market price. |
Key to abbreviations and symbol
Agcy. = Agency
AMT = Alternative Minimum Tax
Auth. = Authority
Certs. of Part. = Certificates of Participation
Dept. = Department
Dev. = Development
Dist. = District
Econ. = Economic
Fac. = Facility
Facs. = Facilities
Fin. = Finance
Fncg. = Financing
G.O. = General Obligation
LIBOR = London Interbank Offered Rate
LOC = Letter of Credit
Preref. = Prerefunded
Redev. = Redevelopment
Ref. = Refunding
Rev. = Revenue
SIFMA = Securities Industry and Financial Markets Association
USD/$ = U.S. dollars
See notes to financial statements
| American Funds Tax-Exempt Funds | 15 |
| Limited Term Tax-Exempt Bond Fund of America | unaudited |
| Summary investment portfolioJanuary 31, 2019 | |
| | |
| Portfolio quality summary* | Percent of net assets |
| * | Bond ratings, which typically range from AAA/Aaa (highest) to D (lowest), are assigned by credit rating agencies such as Standard & Poor’s, Moody’s and/or Fitch as an indication of an issuer’s creditworthiness. In assigning a credit rating to a security, the fund looks specifically to the ratings assigned to the issuer of the security by Standard & Poor’s, Moody’s and/or Fitch. If agency ratings differ, the security will be considered to have received the highest of those ratings, consistent with the fund’s investment policies. |
| Bonds, notes & other debt instruments 95.05% | Principal amount
(000) | | | Value
(000) | |
| Alabama 1.16% | | | | | | | | |
| Black Belt Energy Gas Dist., Gas Supply Rev. Bonds, Series 2017-A, 4.00% 2047 (put 2022) | | $ | 12,620 | | | $ | 13,201 | |
| Other securities | | | | | | | 33,432 | |
| | | | | | | | 46,633 | |
| | | | | | | | | |
| California 6.30% | | | | | | | | |
| Bay Area Toll Auth., San Francisco Bay Area Toll Bridge Rev. Bonds, Series 2006-C-1, (SIFMA Municipal Swap Index + 0.90%) 2.33% 2045 (put 2023)1 | | | 11,500 | | | | 11,594 | |
| Other securities | | | | | | | 241,348 | |
| | | | | | | | 252,942 | |
| | | | | | | | | |
| Colorado 2.54% | | | | | | | | |
| City and County of Denver, Airport System Rev. Bonds, Series 2018-A, AMT, 5.00% 2026 | | | 10,000 | | | | 11,805 | |
| Other securities | | | | | | | 90,033 | |
| | | | | | | | 101,838 | |
| | | | | | | | | |
| Florida 5.61% | | | | | | | | |
| Board of Education, Public Education Capital Outlay Rev. Ref. Bonds, Series 2014-B, 5.00% 2024 | | | 9,275 | | | | 10,781 | |
| Citizens Property Insurance Corp., Personal Lines Account/Commercial Lines Account Secured Bonds, Series 2012-A-1, 5.00% 2022 | | | 10,200 | | | | 11,249 | |
| Housing Fin. Corp., Homeowner Mortgage Rev. Bonds, Series 2017-1, 4.00% 2048 | | | 11,475 | | | | 12,126 | |
| Housing Fin. Corp., Homeowner Mortgage Rev. Bonds, Series 2018-2, 4.25% 2050 | | | 15,350 | | | | 16,547 | |
| County of Miami-Dade, Aviation Rev. Ref. Bonds, Series 2012-A, AMT, 5.00% 2021 | | | 11,600 | | | | 12,462 | |
| Dept. of Transportation, Right-of-Way Acquisition and Bridge Construction Rev. Ref. Bonds, Series 2012-A, 4.00% 2028 | | | 10,800 | | | | 11,295 | |
| Dept. of Transportation, Turnpike Rev. Ref. Bonds, Series 2019-A, 5.00% 2026 | | | 9,365 | | | | 11,293 | |
| Other securities | | | | | | | 139,206 | |
| | | | | | | | 224,959 | |
| | | | | | | | | |
| Georgia 1.83% | | | | | | | | |
| Main Street Natural Gas, Inc., Gas Supply Rev. Bonds, Series 2018-A, 4.00% 2048 (put 2023) | | | 15,000 | | | | 15,860 | |
| Municipal Electric Auth., Project One Bonds, Series 2011-A, 5.00% 2021 | | | 11,490 | | | | 12,079 | |
| Other securities | | | | | | | 45,596 | |
| | | | | | | | 73,535 | |
| | | | | | | | | |
| Illinois 12.56% | | | | | | | | |
| Build Illinois Bonds, Sales Tax Rev. Ref. Bonds, Series 2016-C, 4.00% 2026 | | | 11,805 | | | | 12,092 | |
| City of Chicago, Water Rev. Bonds, Series 2000, 5.00% 2022 | | | 10,500 | | | | 11,530 | |
| Fin. Auth., Rev. Bonds (Clean Water Initiative Revolving Fund), Series 2016, 5.00% 2028 | | | 10,590 | | | | 12,436 | |
| City of Granite, Solid Waste Disposal Rev. Bonds (Waste Management, Inc. Project), Series 2002-A, AMT, 2.25% 2027 (put 2019) | | | 20,000 | | | | 20,000 | |
| 16 | American Funds Tax-Exempt Funds |
Limited Term Tax-Exempt Bond Fund of America
| | Principal amount
(000) | | | Value
(000) | |
| Housing Dev. Auth., Multi Family Housing Rev. Notes (Marshall Field Garden Apartment Homes), Series 2015, (SIFMA Municipal Swap Index + 1.00%) 2.43% 2050 (put 2025)1 | | $ | 11,625 | | | $ | 11,534 | |
| Railsplitter Tobacco Settlement Auth., Tobacco Settlement Rev. Bonds, Series 2010, 5.50% 2023 (preref. 2021) | | | 12,925 | | | | 14,021 | |
| Regional Transportation Auth., G.O. Rev. Ref. Bonds, Series 2017-A, 5.00% 2027 | | | 10,000 | | | | 11,835 | |
| Regional Transportation Auth., G.O. Rev. Ref. Bonds, Series 2017-A, 5.00% 2028 | | | 10,000 | | | | 11,827 | |
| Other securities | | | | | | | 398,492 | |
| | | | | | | | 503,767 | |
| | | | | | | | | |
| Maryland 1.23% | | | | | | | | |
| Washington Suburban Sanitary Dist., Consolidated Public Improvement Bonds, Series 2018, 5.00% 2031 | | | 11,000 | | | | 13,335 | |
| Other securities | | | | | | | 35,959 | |
| | | | | | | | 49,294 | |
| | | | | | | | | |
| Michigan 3.73% | | | | | | | | |
| Housing Dev. Auth., Single Family Mortgage Rev. Bonds, Series 2016-B, 3.50% 2047 | | | 16,910 | | | | 17,489 | |
| Housing Dev. Auth., Single Family Mortgage Rev. Bonds, Series 2018-C, 4.25% 2049 | | | 16,820 | | | | 18,076 | |
| Other securities | | | | | | | 113,977 | |
| | | | | | | | 149,542 | |
| | | | | | | | | |
| Minnesota 1.60% | | | | | | | | |
| Housing Fin. Agcy., Residential Housing Fin. Bonds, Series 2018-E, 4.25% 2049 | | | 13,240 | | | | 14,261 | |
| Other securities | | | | | | | 49,805 | |
| | | | | | | | 64,066 | |
| | | | | | | | | |
| Nebraska 1.06% | | | | | | | | |
| Central Plains Energy Project, Gas Supply Rev. Ref. Bonds, Series 2014, 5.00% 2039 (put 2019) | | | 11,850 | | | | 12,125 | |
| Other securities | | | | | | | 30,417 | |
| | | | | | | | 42,542 | |
| | | | | | | | | |
| Nevada 2.03% | | | | | | | | |
| County of Clark, Highway Rev. Ref. Bonds (Motor Vehicle Fuel Tax), Series 2011, 5.00% 2020 | | | 12,320 | | | | 12,881 | |
| County of Clark, Pollution Control Rev. Ref. Bonds (Southern California Edison Company), Series 2010, 1.875% 2031 (put 2020) | | | 14,035 | | | | 13,918 | |
| Other securities | | | | | | | 54,496 | |
| | | | | | | | 81,295 | |
| | | | | | | | | |
| New York 8.29% | | | | | | | | |
| Dormitory Auth., State Personal Income Tax Rev. Bonds (General Purpose), Series 2017-B, 5.00% 2030 | | | 9,040 | | | | 10,797 | |
| Dormitory Auth., State Personal Income Tax Rev. Bonds (General Purpose), Series 2018-A, 5.00% 2030 | | | 12,000 | | | | 14,549 | |
| Metropolitan Transportation Auth., Transportation Rev. Bonds, Series 2017-C-2A, 4.00% 2019 | | | 18,000 | | | | 18,118 | |
| New York City G.O. Bonds, Fiscal 2012, Series 2012-I, 5.00% 2020 | | | 5,000 | | | | 5,249 | |
| New York City G.O. Bonds, Fiscal 2014, Series 2014-G, 5.00% 2023 | | | 1,500 | | | | 1,709 | |
| New York City G.O. Bonds, Fiscal 2015, Series 2015-A, 5.00% 2025 | | | 3,000 | | | | 3,479 | |
| New York City G.O. Bonds, Fiscal 2015, Series 2015-C, 5.00% 2028 | | | 1,000 | | | | 1,159 | |
| New York City G.O. Bonds, Fiscal 2017, Series 2017-C, 5.00% 2026 | | | 3,500 | | | | 4,219 | |
| New York City G.O. Bonds, Fiscal 2017, Series 2017-C, 5.00% 2027 | | | 5,000 | | | | 6,041 | |
| New York City G.O. Bonds, Fiscal 2017, Series 2017-C, 5.00% 2028 | | | 4,300 | | | | 5,157 | |
| New York City G.O. Bonds, Fiscal 2018, Series 2018-A, 5.00% 2026 | | | 5,000 | | | | 6,027 | |
| Transportation Dev. Corp., Special Facs. Rev. Bonds (Delta Air Lines, Inc. LaGuardia Airport Terminals C & D Redev. Project), Series 2018, AMT, 5.00% 2025 | | | 10,000 | | | | 11,283 | |
| Other securities | | | | | | | 244,962 | |
| | | | | | | | 332,749 | |
| American Funds Tax-Exempt Funds | 17 |
Limited Term Tax-Exempt Bond Fund of America
| Bonds, notes & other debt instruments(continued) | Principal amount
(000) | | | Value
(000) | |
| Texas 9.66% | | | | | | | | |
| Houston Independent School Dist., Limited Tax Schoolhouse Bonds, Series 2017, 3.00% 2021 | | $ | 10,580 | | | $ | 10,851 | |
| City of San Antonio, Electric and Gas Systems Rev. Ref. Bonds, Series 2015-A, 2.25% 2033 (put 2019) | | | 16,000 | | | | 16,053 | |
| Other securities | | | | | | | 360,580 | |
| | | | | | | | 387,484 | |
| | | | | | | | | |
| Virginia 1.14% | | | | | | | | |
| G.O. Bonds, Series 2015-A, 5.00% 2026 | | | 11,795 | | | | 14,018 | |
| County of Wise, Industrial Dev. Auth., Solid Waste and Sewage Disposal Rev. Bonds (Virginia Electric and Power Co. Project), Series 2009-A, 2.15% 2040 (put 2020) | | | 11,500 | | | | 11,489 | |
| Other securities | | | | | | | 20,352 | |
| | | | | | | | 45,859 | |
| | | | | | | | | |
| Washington 3.49% | | | | | | | | |
| G.O. Bonds, Series 2012-D, 5.00% 2023 | | | 5,015 | | | | 5,488 | |
| G.O. Bonds, Series 2016-A-1, 5.00% 2026 | | | 10,950 | | | | 12,963 | |
| G.O. Bonds, Series 2018-C, 5.00% 2027 | | | 7,500 | | | | 9,099 | |
| G.O. Rev. Ref. Bonds, Series 2016-R-B, 5.00% 2029 | | | 10,000 | | | | 11,722 | |
| G.O. Rev. Ref. Bonds, Series 2018-R-D, 5.00% 2027 | | | 10,000 | | | | 12,219 | |
| Health Care Facs. Auth., Rev. Bonds (Catholic Health Initiatives), Series 2013-B-1, (SIFMA Municipal Swap Index + 1.00%) 2.43% 2035 (put 2021)1 | | | 15,100 | | | | 15,144 | |
| Other securities | | | | | | | 73,210 | |
| | | | | | | | 139,845 | |
| | | | | | | | | |
| Wisconsin 3.33% | | | | | | | | |
| G.O. Bonds, Series 2015-A, 5.00% 2031 (preref. 2023) | | | 12,385 | | | | 14,007 | |
| Health and Educational Facs. Auth., Health Facs. Rev. Bonds (SSM Health Care), Series 2018-B, 5.00% 2038 (put 2023) | | | 11,000 | | | | 12,069 | |
| Transportation Rev. Ref. Bonds, Series 2017-2, 5.00% 2022 | | | 10,450 | | | | 11,598 | |
| Other securities | | | | | | | 96,012 | |
| | | | | | | | 133,686 | |
| | | | | | | | | |
| Other states & U.S. territories 29.49% | | | | | | | | |
| Other securities | | | | | | | 1,183,428 | |
| | | | | | | | | |
| Total bonds, notes & other debt instruments(cost: $3,782,084,000) | | | | | | | 3,813,464 | |
| | | | | | | | | |
| Short-term securities 6.66% | | | | | | | | |
| State of Illinois, Fin. Auth., Demand Rev. Bonds (University of Chicago Medical Center), Series 2010-A, 1.57% 20441 | | | 14,150 | | | | 14,150 | |
| State of Louisiana, Parish of East Baton Rouge, Pollution Control Rev. Ref. Bonds (ExxonMobil Project), Series 1993, 1.60% 20221 | | | 5,000 | | | | 5,000 | |
| State of Louisiana, Public Facs. Auth., Rev. Bonds (Air Products and Chemicals Project), Series 2008-A, 1.58% 20431 | | | 100 | | | | 100 | |
| State of Massachusetts, G.O. Rev. Anticipation Notes, Series 2018-A, 4.00% 4/25/2019 | | | 21,000 | | | | 21,114 | |
| State of Massachusetts, G.O. Rev. Anticipation Notes, Series 2018-C, 4.00% 6/20/2019 | | | 8,000 | | | | 8,073 | |
| State of Michigan, Strategic Fund, Demand Limited Obligation Rev. Bonds (Air Products and Chemicals, Inc. Project), Series 2007, 1.58% 20421 | | | 20,520 | | | | 20,520 | |
| State of Mississippi, Business Fin. Corp., Gulf Opportunity Zone Industrial Dev. Rev. Bonds (Chevron U.S.A. Inc. Project), Series 2009-D, 1.60% 20301 | | | 2,300 | | | | 2,300 | |
| State of Mississippi, Business Fin. Corp., Gulf Opportunity Zone Industrial Dev. Rev. Bonds (Chevron U.S.A. Inc. Project), Series 2010-J, 1.60% 20351 | | | 2,500 | | | | 2,500 | |
| State of Mississippi, Business Fin. Corp., Gulf Opportunity Zone Industrial Dev. Rev. Bonds (Chevron U.S.A. Inc. Project), Series 2011-F, 1.60% 20351 | | | 3,000 | | | | 3,000 | |
| State of New York, New York City G.O. Bonds, Fiscal 2006, Series 2006-H-1, 1.63% 20361 | | | 8,850 | | | | 8,850 | |
| State of New York, New York City G.O. Bonds, Fiscal 2008, Series 2008-J-5, 1.60% 20281 | | | 300 | | | | 300 | |
| State of New York, New York City G.O. Bonds, Fiscal 2013, Series 2013-F-3, 1.60% 20421 | | | 18,700 | | | | 18,700 | |
| State of New York, New York City G.O. Bonds, Fiscal 2014, Series 2014-D-3, 1.63% 20381 | | | 5,870 | | | | 5,870 | |
| State of New York, New York City Municipal Water Fin. Auth., Water and Sewer System Second General Resolution Rev. Bonds, Fiscal 2008, Series 2008-B-3, 1.60% 20251 | | | 8,400 | | | | 8,400 | |
| 18 | American Funds Tax-Exempt Funds |
Limited Term Tax-Exempt Bond Fund of America
| | Principal amount
(000) | | | Value
(000) | |
| State of New York, New York City Municipal Water Fin. Auth., Water and Sewer System Second General Resolution Rev. Bonds, Fiscal 2011, Series 2011-FF-1, 1.60% 20441 | | $ | 5,000 | | | $ | 5,000 | |
| State of New York, New York City Transitional Fin. Auth., Future Tax Secured Bonds, Fiscal 2003, Series 2003-C-5, 1.60% 20311 | | | 5,000 | | | | 5,000 | |
| State of New York, New York City Transitional Fin. Auth., Future Tax Secured Bonds, Fiscal 2010, Series 2010-G-5, 1.67% 20341 | | | 1,000 | | | | 1,000 | |
| State of New York, New York City Transitional Fin. Auth., Future Tax Secured Rev. Ref. Bonds, Fiscal 2015, Series 2015-E-4, 1.60% 20451 | | | 1,300 | | | | 1,300 | |
| State of New York, New York City Transitional Fin. Auth., Future Tax Secured Rev. Ref. Bonds, Fiscal 2016, Series 2016-E-4, 1.63% 20451 | | | 6,130 | | | | 6,130 | |
| State of New York, New York City Transitional Fin. Auth., Recovery Bonds, Fiscal 2003, Series 2003-1-C, 1.63% 20221 | | | 7,610 | | | | 7,610 | |
| State of Texas, County of Jefferson, Port Arthur Navigation Dist., Pollution Control Rev. Ref. Bonds (Texaco Inc. Project), Series 1994, 1.60% 20241 | | | 15,100 | | | | 15,100 | |
| State of Texas, Lower Neches Valley Auth. Industrial Dev. Corp., Rev. Bonds (ExxonMobil Project), Series 2011, 1.60% 20381 | | | 300 | | | | 300 | |
| State of Texas, Port Arthur Navigation Dist. Industrial Dev. Corp., Rev. Bonds (Air Products Project), Series 2005, 1.58% 20401 | | | 4,000 | | | | 4,000 | |
| State of Wyoming, County of Lincoln, Pollution Control Rev. Ref. Bonds (ExxonMobil Project), Series 2014, 1.60% 20441 | | | 11,000 | | | | 11,000 | |
| Other securities | | | | | | | 91,631 | |
| | | | | | | | | |
| Total short-term securities (cost: $266,934,000) | | | | | | | 266,948 | |
| Total investment securities 101.71% (cost: $4,049,018,000) | | | | | | | 4,080,412 | |
| Other assets less liabilities (1.71)% | | | | | | | (68,426 | ) |
| | | | | | | | | |
| Net assets 100.00% | | | | | | $ | 4,011,986 | |
This summary investment portfolio is designed to streamline the report and help investors better focus on the fund’s principal holdings. See the inside back cover for details on how to obtain a complete schedule of portfolio holdings.
“Other securities” includes all issues that are not disclosed separately in the summary investment portfolio. “Other securities” also includes securities (with an aggregate value of $28,636,000, which represented .71% of the net assets of the fund) which were acquired in transactions exempt from registration under Rule 144A of the Securities Act of 1933 and may be resold in the U.S. in transactions exempt from registration, normally to qualified institutional buyers.
| American Funds Tax-Exempt Funds | 19 |
Limited Term Tax-Exempt Bond Fund of America
Futures contracts
| Contracts | | Type | | Number of
contracts | | Expiration | | Notional
amount
(000) | 2
| | Value at
1/31/2019
(000) | 3
| | Unrealized
appreciation
(depreciation)
at 1/31/2019
(000) | |
| 2 Year U.S. Treasury Note Futures | | Long | | | 364 | | | April 2019 | | | $ 72,800 | | | | $ 77,288 | | | | $ | 373 | |
| 5 Year U.S. Treasury Note Futures | | Long | | | 1,622 | | | April 2019 | | | 162,200 | | | | 186,302 | | | | | 1,414 | |
| 10 Year Ultra U.S. Treasury Note Futures | | Short | | | 475 | | | March 2019 | | | (47,500 | ) | | | (62,077 | ) | | | | (347 | ) |
| | | | | | | | | | | | | | | | | | | | $ | 1,440 | |
| 1 | Coupon rate may change periodically. For short-term securities, the date of the next scheduled coupon rate change is considered to be the maturity date. |
| 2 | Notional amount is calculated based on the number of contracts and notional contract size. |
| 3 | Value is calculated based on the notional amount and current market price. |
Key to abbreviations and symbol
Agcy. = Agency
AMT = Alternative Minimum Tax
Auth. = Authority
Certs. of Part. = Certificates of Participation
Dept. = Department
Dev. = Development
Dist. = District
Econ. = Economic
Fac. = Facility
Facs. = Facilities
Fin. = Finance
Fncg. = Financing
G.O. = General Obligation
LIBOR = London Interbank Offered Rate
LOC = Letter of Credit
Preref. = Prerefunded
Redev. = Redevelopment
Ref. = Refunding
Rev. = Revenue
SIFMA = Securities Industry and Financial Markets Association
USD/$ = U.S. dollars
See notes to financial statements
| 20 | American Funds Tax-Exempt Funds |
The Tax-Exempt Bond Fund of America
| Portfolio quality summary* | Percent of net assets |
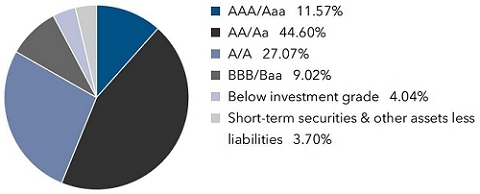
| * | Bond ratings, which typically range from AAA/Aaa (highest) to D (lowest), are assigned by credit rating agencies such as Standard & Poor’s, Moody’s and/or Fitch as an indication of an issuer’s creditworthiness. In assigning a credit rating to a security, the fund looks specifically to the ratings assigned to the issuer of the security by Standard & Poor’s, Moody’s and/or Fitch. If agency ratings differ, the security will be considered to have received the highest of those ratings, consistent with the fund’s investment policies. |
| Bonds, notes & other debt instruments 96.30% | Principal amount
(000) | | | Value
(000) | |
| Alabama 1.32% | | | | | | | | |
| Black Belt Energy Gas Dist., Gas Supply Rev. Bonds, Series 2017-A, 4.00% 2047 (put 2022) | | $ | 40,000 | | | $ | 41,841 | |
| Other securities | | | | | | | 208,566 | |
| | | | | | | | 250,407 | |
| | | | | | | | | |
| California 7.27% | | | | | | | | |
| Bay Area Toll Auth., San Francisco Bay Area Toll Bridge Rev. Bonds, Series 2008-B-1, (SIFMA Municipal Swap Index + 1.10%) 2.53% 2045 (put 2024)1 | | | 30,850 | | | | 31,418 | |
| Health Facs. Fncg. Auth., Rev. Bonds (Kaiser Permanente), Series 2017-A-2, 5.00% 2047 | | | 28,205 | | | | 36,440 | |
| Other securities | | | | | | | 1,316,193 | |
| | | | | | | | 1,384,051 | |
| | | | | | | | | |
| Colorado 2.10% | | | | | | | | |
| Health Facs. Auth., Health Facs. Rev. Bonds (Evangelical Lutheran Good Samaritan Society Project), Series 2012, 5.00% 2042 | | | 29,815 | | | | 30,893 | |
| Other securities | | | | | | | 367,805 | |
| | | | | | | | 398,698 | |
| | | | | | | | | |
| Florida 6.42% | | | | | | | | |
| Orlando-Orange County Expressway Auth., Rev. Ref. Bonds, Series 2013-A, 5.00% 2035 | | | 27,350 | | | | 30,477 | |
| Tampa-Hillsborough County Expressway Auth., Rev. Ref. Bonds, Series 2017-B, 4.00% 2042 | | | 39,670 | | | | 40,818 | |
| Other securities | | | | | | | 1,150,140 | |
| | | | | | | | 1,221,435 | |
| | | | | | | | | |
| Georgia 2.07% | | | | | | | | |
| County of Burke, Dev. Auth., Pollution Control Rev. Bonds (Oglethorpe Power Corp. - Vogtle Project), Series 2013-A, 2.40% 2040 (put 2020) | | | 31,610 | | | | 31,566 | |
| Other securities | | | | | | | 361,569 | |
| | | | | | | | 393,135 | |
| | | | | | | | | |
| Illinois 14.29% | | | | | | | | |
| Build Illinois Bonds, Sales Tax Rev. Bonds, Series 2010, 5.00% 2021 | | | 5,750 | | | | 6,040 | |
| Build Illinois Bonds, Sales Tax Rev. Bonds, Series 2011, 4.50% 2019 | | | 3,880 | | | | 3,912 | |
| Build Illinois Bonds, Sales Tax Rev. Bonds, Series 2018-B, 5.00% 2033 | | | 3,500 | | | | 3,777 | |
| Build Illinois Bonds, Sales Tax Rev. Ref. Bonds, Series 2010, 5.00% 2019 | | | 2,250 | | | | 2,272 | |
| Build Illinois Bonds, Sales Tax Rev. Ref. Bonds, Series 2016-D, 5.00% 2025 | | | 2,135 | | | | 2,331 | |
| Build Illinois Bonds, Sales Tax Rev. Ref. Bonds, Series 2016-D, 5.00% 2026 | | | 1,010 | | | | 1,106 | |
| City of Chicago, O’Hare International Airport, General Airport Rev. Bonds, Series 2018-B, 5.00% 2053 | | | 40,000 | | | | 43,966 | |
| City of Chicago, Transit Auth., Sales Tax Receipts Rev. Bonds, Series 2014, Assured Guaranty Municipal insured, 5.25% 2049 | | | 27,500 | | | | 30,060 | |
| City of Chicago, Transit Auth., Sales Tax Receipts Rev. Bonds, Series 2017, Assured Guaranty Municipal insured, 5.00% 2051 | | | 33,585 | | | | 35,705 | |
| Fin. Auth., Rev. Bonds (Mercy Health Corp.), Series 2016, 5.00% 2046 | | | 34,260 | | | | 36,482 | |
| American Funds Tax-Exempt Funds | 21 |
The Tax-Exempt Bond Fund of America
| Bonds, notes & other debt instruments(continued) | | Principal amount
(000) | | | Value
(000) | |
| Illinois (continued) | | | | | | | | |
| Fin. Auth., Rev. Bonds (The Cable Foundation), Series 2016-A, 5.00% 2045 | | $ | 26,575 | | | $ | 28,833 | |
| Fin. Auth., Rev. Ref. Bonds (OSF Healthcare System), Series 2015-A, 5.00% 2045 | | | 26,890 | | | | 28,752 | |
| Fin. Auth., Student Housing Rev. Bonds (CHF-DeKalb II, LLC - Northern Illinois University Project), Series 2011, 6.875% 2043 | | | 40,015 | | | | 42,409 | |
| G.O. Bonds, Series 2010, Assured Guaranty Municipal insured, 5.00% 2020 | | | 660 | | | | 675 | |
| G.O. Bonds, Series 2010, Assured Guaranty Municipal insured, 5.00% 2022 | | | 230 | | | | 234 | |
| G.O. Bonds, Series 2013, Assured Guaranty Municipal insured, 5.00% 2019 | | | 1,000 | | | | 1,011 | |
| G.O. Bonds, Series 2013-A, Assured Guaranty Municipal insured, 5.00% 2022 | | | 980 | | | | 1,034 | |
| G.O. Bonds, Series 2014, 5.00% 2020 | | | 5,290 | | | | 5,420 | |
| G.O. Bonds, Series 2014, 5.00% 2021 | | | 1,000 | | | | 1,040 | |
| G.O. Bonds, Series 2014, 5.00% 2024 | | | 2,000 | | | | 2,131 | |
| G.O. Bonds, Series 2014, Assured Guaranty Municipal insured, 5.00% 2024 | | | 2,795 | | | | 2,991 | |
| G.O. Bonds, Series 2016, 5.00% 2028 | | | 4,840 | | | | 5,179 | |
| G.O. Bonds, Series 2016, 5.00% 2033 | | | 7,200 | | | | 7,528 | |
| G.O. Bonds, Series 2016, 5.00% 2034 | | | 1,925 | | | | 2,005 | |
| G.O. Bonds, Series 2016, 5.00% 2037 | | | 7,500 | | | | 7,757 | |
| G.O. Bonds, Series 2016, 5.00% 2038 | | | 14,000 | | | | 14,452 | |
| G.O. Bonds, Series 2016, Assured Guaranty Municipal insured, 5.00% 2041 | | | 2,000 | | | | 2,048 | |
| G.O. Bonds, Series 2017-A, 5.00% 2036 | | | 11,500 | | | | 11,974 | |
| G.O. Bonds, Series 2017-B, 5.00% 2019 | | | 6,000 | | | | 6,117 | |
| G.O. Bonds, Series 2017-C, 5.00% 2029 | | | 18,250 | | | | 19,570 | |
| G.O. Bonds, Series 2017-D, BAM insured, 5.00% 2020 | | | 4,150 | | | | 4,313 | |
| G.O. Bonds, Series 2017-D, BAM insured, 5.00% 2021 | | | 7,000 | | | | 7,371 | |
| G.O. Bonds, Series 2017-D, BAM insured, 5.00% 2024 | | | 8,000 | | | | 8,610 | |
| G.O. Bonds, Series 2017-D, BAM insured, 5.00% 2026 | | | 25,355 | | | | 27,466 | |
| G.O. Bonds, Series 2017-D, BAM insured, 5.00% 2028 | | | 8,000 | | | | 8,652 | |
| G.O. Rev. Ref. Bonds, Series 2007, 5.25% 2021 | | | 2,275 | | | | 2,372 | |
| G.O. Rev. Ref. Bonds, Series 2012, 4.00% 2025 | | | 1,360 | | | | 1,371 | |
| G.O. Rev. Ref. Bonds, Series 2012, 5.00% 2019 | | | 2,660 | | | | 2,695 | |
| G.O. Rev. Ref. Bonds, Series 2016, 5.00% 2027 | | | 10,000 | | | | 10,842 | |
| G.O. Rev. Ref. Bonds, Series 2016, 5.00% 2028 | | | 3,000 | | | | 3,227 | |
| G.O. Rev. Ref. Bonds, Series 2018-A, 5.00% 2024 | | | 2,000 | | | | 2,151 | |
| G.O. Rev. Ref. Bonds, Series 2018-A, 5.00% 2025 | | | 1,320 | | | | 1,426 | |
| G.O. Rev. Ref. Bonds, Series 2018-A, 5.00% 2026 | | | 3,500 | | | | 3,789 | |
| G.O. Rev. Ref. Bonds, Series 2018-A, 5.00% 2027 | | | 3,000 | | | | 3,259 | |
| G.O. Rev. Ref. Bonds, Series 2018-A, 5.00% 2028 | | | 6,000 | | | | 6,497 | |
| G.O. Rev. Ref. Bonds, Series 2018-B, 5.00% 2033 | | | 2,565 | | | | 2,706 | |
| Housing Dev. Auth., Homeowner Mortgage Rev. Bonds, Series 2018-A-1, 4.00% 2048 | | | 27,015 | | | | 28,710 | |
| Toll Highway Auth., Toll Highway Rev. Bonds, Series 2013-A, 5.00% 2038 | | | 34,430 | | | | 37,388 | |
| Toll Highway Auth., Toll Highway Rev. Bonds, Series 2016-B, 5.00% 2041 | | | 25,980 | | | | 28,746 | |
| Other securities | | | | | | | 2,171,487 | |
| | | | | | | | 2,719,889 | |
| | | | | | | | | |
| Kansas 0.88% | | | | | | | | |
| Dept. of Transportation, Highway Rev. Bonds, Series 2004-C-4, (1-month USD-LIBOR x 0.70 + 0.50%) 2.263% 20241 | | | 28,000 | | | | 27,995 | |
| University of Kansas Hospital Auth., Health Facs. and Improvement Rev. Bonds (University of Kansas Health System), Series 2017-A, 5.00% 2047 | | | 44,740 | | | | 49,160 | |
| City of Wichita, Sales Tax Special Obligation Rev. Bonds (K-96 Greenwich Star Bond Project), Series 2013, 7.55% 2033 (preref. 2020)2 | | | 29,385 | | | | 32,157 | |
| Other securities | | | | | | | 57,507 | |
| | | | | | | | 166,819 | |
| | | | | | | | | |
| Louisiana 1.72% | | | | | | | | |
| Public Facs. Auth., Rev. and Rev. Ref. Bonds (Ochsner Clinic Foundation Project), Series 2017, 5.00% 2046 | | | 25,895 | | | | 27,931 | |
| Other securities | | | | | | | 299,796 | |
| | | | | | | | 327,727 | |
| 22 | American Funds Tax-Exempt Funds |
The Tax-Exempt Bond Fund of America
| | | Principal amount
(000) | | | Value
(000) | |
| Michigan 3.88% | | | | | | | | |
| Hospital Fin. Auth., Hospital Rev. and Rev. Ref. Bonds (Trinity Health Credit Group), Series 2017-A, 4.00% 2036 | | $ | 31,480 | | | $ | 32,376 | |
| Housing Dev. Auth., Single Family Mortgage Rev. Bonds, Series 2018-A, 4.00% 2048 | | | 36,360 | | | | 38,559 | |
| Other securities | | | | | | | 667,742 | |
| | | | | | | | 738,677 | |
| | | | | | | | | |
| Minnesota 0.65% | | | | | | | | |
| City of Duluth, Econ. Dev. Auth., Health Care Facs. Rev. Bonds (Essentia Health Obligated Group), Series 2018-A, 5.00% 2058 | | | 30,000 | | | | 32,491 | |
| Other securities | | | | | | | 91,716 | |
| | | | | | | | 124,207 | |
| | | | | | | | | |
| New Jersey 2.27% | | | | | | | | |
| Housing and Mortgage Fin. Agcy., Single Family Housing Rev. Bonds, Series 2018-A, 4.50% 2048 | | | 41,810 | | | | 45,276 | |
| Other securities | | | | | | | 385,892 | |
| | | | | | | | 431,168 | |
| | | | | | | | | |
| New York 7.54% | | | | | | | | |
| Long Island Power Auth., Electric System General Rev. Bonds, Series 2015-C, (1-month USD-LIBOR x 0.70 + 0.75%) 2.513% 2033 (put 2023)1 | | | 62,600 | | | | 62,731 | |
| Metropolitan Transportation Auth., Transportation Rev. Bonds, Series 2017-C-2A, 4.00% 2019 | | | 66,000 | | | | 66,434 | |
| Mortgage Agcy., Homeowner Mortgage Rev. Bonds, Series 208, 4.00% 2048 | | | 29,845 | | | | 31,441 | |
| Utility Debt Securitization Auth., Restructuring Bonds, Series 2017, 5.00% 2041 | | | 31,500 | | | | 36,212 | |
| Other securities | | | | | | | 1,237,164 | |
| | | | | | | | 1,433,982 | |
| | | | | | | | | |
| North Carolina 0.74% | | | | | | | | |
| University of North Carolina at Chapel Hill, General Rev. Bonds, Series 2012-B, (1-month USD-LIBOR x 0.67 + 0.40%) 2.088% 2041 (put 2022)1 | | | 52,050 | | | | 51,869 | |
| Other securities | | | | | | | 88,752 | |
| | | | | | | | 140,621 | |
| | | | | | | | | |
| Pennsylvania 4.70% | | | | | | | | |
| University of Pittsburgh - Of the Commonwealth System of Higher Education, PANTHERS, Series 2018, (SIFMA Municipal Swap Index + 0.24%) 1.67% 20211 | | | 42,235 | | | | 42,172 | |
| Other securities | | | | | | | 852,826 | |
| | | | | | | | 894,998 | |
| | | | | | | | | |
| South Carolina 1.29% | | | | | | | | |
| Jobs-Econ. Dev. Auth., Hospital Rev. Bonds (Prisma Health Obligated Group), Series 2018-A, 5.00% 2048 | | | 32,000 | | | | 34,785 | |
| Other securities | | | | | | | 211,249 | |
| | | | | | | | 246,034 | |
| | | | | | | | | |
| Tennessee 1.12% | | | | | | | | |
| Metropolitan Government of Nashville and Davidson County, G.O. Improvement Bonds, Series 2013-A, 5.00% 2029 (preref. 2023) | | | 31,610 | | | | 35,512 | |
| Other securities | | | | | | | 176,787 | |
| | | | | | | | 212,299 | |
| | | | | | | | | |
| Texas 9.75% | | | | | | | | |
| City of Austin, Water and Wastewater System Rev. Ref. Bonds, Series 2016, 5.00% 2041 | | | 26,405 | | | | 29,829 | |
| Grand Parkway Transportation Corp., Grand Parkway System Toll Rev. Bonds, Series 2013-B, 5.00% 2053 | | | 32,800 | | | | 35,261 | |
| North Texas Tollway Auth., System Rev. Ref. Bonds, Series 2017-A, 5.00% 2043 | | | 31,970 | | | | 36,003 | |
| Turnpike Auth., Central Texas Turnpike System, Rev. Bonds, Series 2002-A, AMBAC insured, 0% 2028 | | | 40,795 | | | | 30,976 | |
| Other securities | | | | | | | 1,723,295 | |
| | | | | | | | 1,855,364 | |
| American Funds Tax-Exempt Funds | 23 |
The Tax-Exempt Bond Fund of America
| Bonds, notes & other debt instruments(continued) | | Principal amount
(000) | | | Value
(000) | |
| Virginia 2.64% | | | | | | | | |
| City of Newport News, Industrial Dev. Auth., Health Systems Rev. Ref. Bonds (Custodial Receipts), Series 2015, 5.33% 20452 | | $ | 41,100 | | | $ | 43,119 | |
| Other securities | | | | | | | 458,553 | |
| | | | | | | | 501,672 | |
| | | | | | | | | |
| Washington 3.06% | | | | | | | | |
| Convention Center Public Facs. Dist., Lodging Tax Bonds, Series 2010-B, 5.00% 2043 | | | 35,000 | | | | 39,356 | |
| Health Care Facs. Auth., Rev. Bonds (Catholic Health Initiatives), Series 2013-B-1, (SIFMA Municipal Swap Index + 1.00%) 2.43% 2035 (put 2021)1 | | | 49,750 | | | | 49,894 | |
| Other securities | | | | | | | 493,927 | |
| | | | | | | | 583,177 | |
| | | | | | | | | |
| Wisconsin 2.45% | | | | | | | | |
| General Fund Annual Appropriation Rev. Ref. Bonds, Series 2009-A, 6.00% 2036 (preref. 2019) | | | 54,460 | | | | 55,042 | |
| Health and Educational Facs. Auth., Rev. Bonds (Advocate Aurora Health Care Credit Group), Series 2018-C-2, (SIFMA Municipal Swap Index + 0.45%) 1.88% 2054 (put 2022)1 | | | 31,145 | | | | 31,031 | |
| Other securities | | | | | | | 380,046 | |
| | | | | | | | 466,119 | |
| | | | | | | | | |
| Other states & U.S. territories 20.14% | | | | | | | | |
| Other securities | | | | | | | 3,832,248 | |
| | | | | | | | | |
| Total bonds, notes & other debt instruments (cost: $18,048,983,000) | | | | | | | 18,322,727 | |
| | | | | | | | | |
| Short-term securities 3.42% | | | | | | | | |
| Freddie Mac Multi Family Certificates, Class A, Series 2018-M-042, (SIFMA Municipal Swap Index + 0.30%) 1.68% 20331 | | | 37,245 | | | | 37,245 | |
| State of Alaska, City of Valdez, Marine Terminal Rev. Ref. Bonds (Exxon Pipeline Co. Project), Series 1985, 1.60% 20251 | | | 10,825 | | | | 10,825 | |
| State of Alaska, City of Valdez, Marine Terminal Rev. Ref. Bonds (ExxonMobil Project), Series 2001, 1.60% 20291 | | | 20,255 | | | | 20,255 | |
| State of Louisiana, Parish of East Baton Rouge, Industrial Dev. Board, Gulf Opportunity Zone Rev. Bonds (ExxonMobil Project), Series 2010-B, 1.60% 20401 | | | 17,560 | | | | 17,560 | |
| State of Louisiana, Parish of East Baton Rouge, Industrial Dev. Board, Gulf Opportunity Zone Rev. Bonds (ExxonMobil Project), Series 2011, 1.60% 20511 | | | 10,470 | | | | 10,470 | |
| State of Louisiana, Parish of East Baton Rouge, Pollution Control Rev. Ref. Bonds (ExxonMobil Project), Series 1993, 1.60% 20221 | | | 15,945 | | | | 15,945 | |
| State of Louisiana, Parish of East Baton Rouge, Pollution Control Rev. Ref. Bonds (ExxonMobil Project), Series 2010-A, 1.60% 20351 | | | 19,450 | | | | 19,450 | |
| State of Massachusetts, G.O. Rev. Anticipation Notes, Series 2018-A, 4.00% 4/25/2019 | | | 32,500 | | | | 32,675 | |
| State of Massachusetts, G.O. Rev. Anticipation Notes, Series 2018-C, 4.00% 6/20/2019 | | | 57,000 | | | | 57,517 | |
| State of Mississippi, Business Fin. Corp., Gulf Opportunity Zone Industrial Dev. Rev. Bonds (Chevron U.S.A. Inc. Project), Series 2007-A, 1.60% 20301 | | | 22,500 | | | | 22,500 | |
| State of Mississippi, Business Fin. Corp., Gulf Opportunity Zone Industrial Dev. Rev. Bonds (Chevron U.S.A. Inc. Project), Series 2009-D, 1.60% 20301 | | | 7,000 | | | | 7,000 | |
| State of Mississippi, Business Fin. Corp., Gulf Opportunity Zone Industrial Dev. Rev. Bonds (Chevron U.S.A. Inc. Project), Series 2010-J, 1.60% 20351 | | | 16,800 | | | | 16,800 | |
| State of Mississippi, Business Fin. Corp., Gulf Opportunity Zone Industrial Dev. Rev. Bonds (Chevron U.S.A. Inc. Project), Series 2011-E, 1.60% 20351 | | | 7,000 | | | | 7,000 | |
| State of Mississippi, Business Fin. Corp., Gulf Opportunity Zone Industrial Dev. Rev. Bonds (Chevron U.S.A. Inc. Project), Series 2011-F, 1.60% 20351 | | | 6,000 | | | | 6,000 | |
| State of New York, Metropolitan Transportation Auth., Transportation Rev. Bond Anticipation Notes, Series 2017-C-1A, 4.00% 2/15/2019 | | | 15,000 | | | | 15,014 | |
| State of New York, Metropolitan Transportation Auth., Transportation Rev. Bond Anticipation Notes, Series 2017-C-1D, 4.00% 2/15/2019 | | | 20,000 | | | | 20,018 | |
| State of New York, Metropolitan Transportation Auth., Transportation Rev. Bond Anticipation Notes, Series 2018-A-1, 4.00% 8/15/2019 | | | 35,000 | | | | 35,402 | |
| State of New York, Metropolitan Transportation Auth., Transportation Rev. Bond Anticipation Notes, Series 2018-B-2, 5.00% 2021 | | | 5,000 | | | | 5,327 | |
| 24 | American Funds Tax-Exempt Funds |
The Tax-Exempt Bond Fund of America
| | | Principal amount
(000) | | | Value
(000) | |
| State of New York, New York City G.O. Bonds, Fiscal 2006, Series 2006-H-1, 1.63% 20361 | | $ | 1,680 | | | $ | 1,680 | |
| State of New York, New York City G.O. Bonds, Fiscal 2008, Series 2008-J-5, 1.60% 20281 | | | 5,530 | | | | 5,530 | |
| State of New York, New York City G.O. Bonds, Fiscal 2008, Series 2008-L-3, 1.60% 20361 | | | 16,715 | | | | 16,715 | |
| State of New York, New York City G.O. Bonds, Fiscal 2013, Series 2013-F-3, 1.60% 20421 | | | 7,855 | | | | 7,855 | |
| State of New York, New York City Municipal Water Fin. Auth., Water and Sewer System Second General Resolution Rev. Bonds, Fiscal 2008, Series 2008-B-3, 1.60% 20251 | | | 5,000 | | | | 5,000 | |
| State of New York, New York City Municipal Water Fin. Auth., Water and Sewer System Second General Resolution Rev. Bonds, Fiscal 2011, Series 2011-FF-1, 1.60% 20441 | | | 20,310 | | | | 20,310 | |
| State of New York, New York City Municipal Water Fin. Auth., Water and Sewer System Second General Resolution Rev. Bonds, Fiscal 2012, Series 2012-A, 1.63% 20441 | | | 5,305 | | | | 5,305 | |
| State of New York, New York City Municipal Water Fin. Auth., Water and Sewer System Second General Resolution Rev. Bonds, Fiscal 2015, Series 2015-BB-1, 1.60% 20491 | | | 1,045 | | | | 1,045 | |
| State of Texas, Gulf Coast Waste Disposal Auth., Pollution Control Rev. Ref. Bonds (Exxon Project), Series 1995, 1.60% 20201 | | | 16,600 | | | | 16,600 | |
| State of Texas, County of Harris, Industrial Dev. Corp., Pollution Control Rev. Bonds (Exxon Project), Series 1984-A, 1.60% 20241 | | | 1,200 | | | | 1,200 | |
| State of Wyoming, County of Lincoln, Pollution Control Rev. Ref. Bonds (ExxonMobil Project), Series 2014, 1.60% 20441 | | | 12,800 | | | | 12,800 | |
| State of Wyoming, County of Sublette, Pollution Control Rev. Ref. Bonds (ExxonMobil Project), Series 2014, 1.60% 20441 | | | 4,000 | | | | 4,000 | |
| Other securities | | | | | | | 196,648 | |
| | | | | | | | | |
| Total short-term securities (cost: $651,660,000) | | | | | | | 651,691 | |
| Total investment securities 99.72%(cost: $18,700,643,000) | | | | | | | 18,974,418 | |
| Other assets less liabilities 0.28% | | | | | | | 53,250 | |
| | | | | | | | | |
| Net assets 100.00% | | | | | | $ | 19,027,668 | |
This summary investment portfolio is designed to streamline the report and help investors better focus on the fund’s principal holdings. See the inside back cover for details on how to obtain a complete schedule of portfolio holdings.
“Other securities” includes all issues that are not disclosed separately in the summary investment portfolio. “Other securities” includes a security which was valued under fair value procedures adopted by authority of the board of trustees. The total value of the security which was valued under fair value procedures was $6,547,000, which represented .03% of the net assets of the fund.
| American Funds Tax-Exempt Funds | 25 |
The Tax-Exempt Bond Fund of America
Futures contracts
| Contracts | | Type | | Number of
contracts | | Expiration | | | Notional
amount
(000) | 3
| | Value at
1/31/2019
(000) | 4
| | Unrealized
appreciation
(depreciation)
at 1/31/2019
(000) | |
| 2 Year U.S. Treasury Note Futures | | Long | | 3,645 | | | April 2019 | | | $ | 729,000 | | | $ | 773,936 | | | | $ | 4,712 | |
| 5 Year U.S. Treasury Note Futures | | Long | | 3,000 | | | April 2019 | | | | 300,000 | | | | 344,578 | | | | | 1,850 | |
| 30 Year Ultra U.S. Treasury Bond Futures | | Short | | 1,200 | | | March 2019 | | | | (120,000 | ) | | | (193,350 | ) | | | | (7,004 | ) |
| | | | | | | | | | | | | | | | | | | | $ | (442 | ) |
| 1 | Coupon rate may change periodically. For short-term securities, the date of the next scheduled coupon rate change is considered to be the maturity date. |
| 2 | Acquired in a transaction exempt from registration under Rule 144A of the Securities Act of 1933. May be resold in the U.S. in transactions exempt from registration, normally to qualified institutional buyers. The total value of all such securities, including those in “Other securities,” was $363,442,000, which represented 1.91% of the net assets of the fund. |
| 3 | Notional amount is calculated based on the number of contracts and notional contract size. |
| 4 | Value is calculated based on the notional amount and current market price. |
Key to abbreviations and symbol
Agcy. = Agency
Auth. = Authority
Certs. of Part. = Certificates of Participation
Dept. = Department
Dev. = Development
Dist. = District
Econ. = Economic
Fac. = Facility
Facs. = Facilities
Fin. = Finance
Fncg. = Financing
G.O. = General Obligation
LIBOR = London Interbank Offered Rate
LOC = Letter of Credit
Preref. = Prerefunded
Redev. = Redevelopment
Ref. = Refunding
Rev. = Revenue
SIFMA = Securities Industry and Financial Markets Association
USD/$ = U.S. dollars
See notes to financial statements
| 26 | American Funds Tax-Exempt Funds |
| American High-Income Municipal Bond Fund | unaudited |
| Summary investment portfolioJanuary 31, 2019 | |
| Portfolio quality summary* | Percent of net assets |
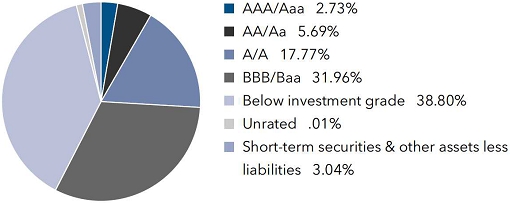
| * | Bond ratings, which typically range from AAA/Aaa (highest) to D (lowest), are assigned by credit rating agencies such as Standard & Poor’s, Moody’s and/or Fitch as an indication of an issuer’s creditworthiness. In assigning a credit rating to a security, the fund looks specifically to the ratings assigned to the issuer of the security by Standard & Poor’s, Moody’s and/or Fitch. If agency ratings differ, the security will be considered to have received the highest of those ratings, consistent with the fund’s investment policies. Securities in the “unrated” category (above) have not been rated by a rating agency; however, the investment adviser performs its own credit analysis and assigns comparable ratings that are used for compliance with the fund’s investment policies. |
| Bonds, notes & other debt instruments 96.96% | | Principal amount
(000) | | | Value
(000) | |
| Arizona 2.73% | | | | | | |
| City of Phoenix, Industrial Dev. Auth., Education Fac. Rev. Bonds (Legacy Traditional Schools East Mesa and Cadence Campuses), Series 2017-A, 4.00% 20221 | | $ | 18,900 | | | $ | 18,599 | |
| Other securities | | | | | | | 166,326 | |
| | | | | | | | 184,925 | |
| | | | | | | | | |
| California 6.13% | | | | | | | | |
| Infrastructure and Econ. Dev. Bank, Rev. Ref. Bonds (Pacific Gas and Electric Company), Series 2008-F, 1.75% 2026 (put 2022) | | | 25,575 | | | | 21,867 | |
| Other securities | | | | | | | 393,489 | |
| | | | | | | | 415,356 | |
| | | | | | | | | |
| Colorado 5.51% | | | | | | | | |
| City and County of Denver, Dept. of Aviation, Special Facs. Airport Rev. Ref. Bonds (United Air Lines Project), Series 2017, AMT, 5.00% 2032 | | | 8,905 | | | | 9,384 | |
| Health Facs. Auth., Rev. Ref. Bonds (Frasier Meadows), Series 2017-A, 5.25% 2047 | | | 12,230 | | | | 13,023 | |
| Regional Transportation Dist., Private Activity Bonds (Denver Transit Partners Eagle P3 Project), Series 2010, 6.00% 2041 | | | 13,800 | | | | 14,040 | |
| Other securities | | | | | | | 336,809 | |
| | | | | | | | 373,256 | |
| | | | | | | | | |
| District of Columbia 0.86% | | | | | | | | |
| Tobacco Settlement Fncg. Corp., Tobacco Settlement Asset-Backed Bonds, Series 2006-A, 0% 2046 | | | 173,025 | | | | 26,774 | |
| Other securities | | | | | | | 31,763 | |
| | | | | | | | 58,537 | |
| | | | | | | | | |
| Florida 5.33% | | | | | | | | |
| North Broward Hospital Dist., Rev. Bonds (Broward Health), Series 2017-B, 5.00% 2042 | | | 17,500 | | | | 18,598 | |
| Other securities | | | | | | | 342,498 | |
| | | | | | | | 361,096 | |
| | | | | | | | | |
| Georgia 1.80% | | | | | | | | |
| County of Burke, Dev. Auth., Pollution Control Rev. Bonds (Oglethorpe Power Corp. - Vogtle Project), Series 2017-C, 4.125% 2045 | | | 13,525 | | | | 13,192 | |
| Municipal Electric Auth., Plant Vogtle Units 3 and 4 Project J Bonds, Series 2015-A, 5.50% 2060 | | | 19,100 | | | | 19,969 | |
| Other securities | | | | | | | 89,030 | |
| | | | | | | | 122,191 | |
| American Funds Tax-Exempt Funds | 27 |
American High-Income Municipal Bond Fund
| Bonds, notes & other debt instruments (continued) | | Principal amount
(000) | | | Value
(000) | |
| Hawaii 0.46% | | | | | | | | |
| Dept. of Budget and Fin., Special Purpose Rev. Ref. Bonds (Hawaiian Electric Co., Inc.), Series 2017-B, AMT, 4.00% 2037 | | $ | 13,800 | | | $ | 13,942 | |
| Other securities | | | | | | | 16,962 | |
| | | | | | | | 30,904 | |
| | | | | | | | | |
| Illinois 15.16% | | | | | | | | |
| City of Chicago, Board of Education, Unlimited Tax G.O. Bonds (Dedicated Alternate Rev.), Series 2015-C, 5.25% 2039 | | | 8,890 | | | | 9,104 | |
| City of Chicago, Board of Education, Unlimited Tax G.O. Bonds (Dedicated Rev.), Series 2011-A, 5.50% 2039 | | | 1,625 | | | | 1,652 | |
| City of Chicago, Board of Education, Unlimited Tax G.O. Bonds (Dedicated Rev.), Series 2016-B, 6.50% 2046 | | | 6,910 | | | | 7,759 | |
| City of Chicago, Board of Education, Unlimited Tax G.O. Bonds (Dedicated Rev.), Series 2017-A, 7.00% 20461 | | | 26,060 | | | | 30,718 | |
| City of Chicago, Board of Education, Unlimited Tax G.O. Bonds (Dedicated Rev.), Series 2017-C, 5.00% 2030 | | | 3,000 | | | | 3,159 | |
| City of Chicago, Board of Education, Unlimited Tax G.O. Rev. Ref. Bonds (Dedicated Rev.), Series 2017-B, 6.75% 20301 | | | 3,500 | | | | 4,204 | |
| City of Chicago, Board of Education, Unlimited Tax G.O. Rev. Ref. Bonds (Dedicated Rev.), Series 2017-B, 7.00% 20421 | | | 28,185 | | | | 33,358 | |
| City of Chicago, Board of Education, Unlimited Tax G.O. Rev. Ref. Bonds (Dedicated Rev.), Series 2017-C, 5.00% 2021 | | | 2,000 | | | | 2,079 | |
| City of Chicago, Board of Education, Unlimited Tax G.O. Rev. Ref. Bonds (Dedicated Rev.), Series 2017-C, 5.00% 2024 | | | 2,000 | | | | 2,111 | |
| City of Chicago, Board of Education, Unlimited Tax G.O. Rev. Ref. Bonds (Dedicated Rev.), Series 2017-C, 5.00% 2025 | | | 4,000 | | | | 4,234 | |
| City of Chicago, Board of Education, Unlimited Tax G.O. Rev. Ref. Bonds (Dedicated Rev.), Series 2017-D, 5.00% 2021 | | | 1,500 | | | | 1,560 | |
| City of Chicago, Board of Education, Unlimited Tax G.O. Rev. Ref. Bonds (Dedicated Rev.), Series 2017-F, 5.00% 2024 | | | 2,000 | | | | 2,111 | |
| City of Chicago, Board of Education, Unlimited Tax G.O. Rev. Ref. Bonds (Dedicated Rev.), Series 2017-G, 5.00% 2044 | | | 5,000 | | | | 5,042 | |
| City of Chicago, Board of Education, Unlimited Tax G.O. Rev. Ref. Bonds (Dedicated Rev.), Series 2017-H, 5.00% 2036 | | | 12,000 | | | | 12,344 | |
| City of Chicago, Board of Education, Unlimited Tax G.O. Rev. Ref. Bonds (Dedicated Rev.), Series 2017-H, 5.00% 2046 | | | 7,800 | | | | 7,849 | |
| City of Chicago, School Reform Board of Trustees of the Board of Education, Unlimited Tax G.O. Bonds (Dedicated Tax Rev.), Capital Appreciation Bonds, Series 1999-A, National insured, 0% 2025 | | | 1,015 | | | | 792 | |
| City of Chicago, School Reform Board of Trustees of the Board of Education, Unlimited Tax G.O. Bonds (Dedicated Tax Rev.), Capital Appreciation Bonds, Series 1999-A, National insured, 0% 2031 | | | 2,170 | | | | 1,270 | |
| City of Chicago, School Reform Board of Trustees of the Board of Education, Unlimited Tax G.O. Bonds (Dedicated Tax Rev.), Series 1998-B-1, National insured, 0% 2031 | | | 5,210 | | | | 3,050 | |
| City of Chicago, School Reform Board of Trustees of the Board of Education, Unlimited Tax G.O. Bonds (Dedicated Tax Rev.), Series 1999-A, National insured, 0% 2024 | | | 2,070 | | | | 1,684 | |
| City of Chicago, School Reform Board of Trustees of the Board of Education, Unlimited Tax G.O. Bonds (Dedicated Tax Rev.), Series 2011-A, 5.00% 2041 | | | 12,405 | | | | 12,423 | |
| City of Chicago, School Reform Board of Trustees of the Board of Education, Unlimited Tax G.O. Bonds (Dedicated Tax Rev.), Series 2012-A, 5.00% 2042 | | | 8,635 | | | | 8,664 | |
| City of Chicago, School Reform Board of Trustees of the Board of Education, Unlimited Tax G.O. Bonds (Dedicated Tax Rev.), Series 2016-A, 7.00% 2044 | | | 14,830 | | | | 16,987 | |
| City of Chicago, Transit Auth., Sales Tax Receipts Rev. Bonds, Series 2017, Assured Guaranty Municipal insured, 5.00% 2051 | | | 21,750 | | | | 23,123 | |
| Fin. Auth., Rev. Bonds (Friendship Village Schaumburg), Series 2017, 5.125% 2045 | | | 19,500 | | | | 17,694 | |
| Fin. Auth., Rev. Bonds (Mercy Health Corp.), Series 2016, 5.00% 2046 | | | 17,165 | | | | 18,278 | |
| Fin. Auth., Student Housing Rev. Bonds (CHF-DeKalb II, LLC - Northern Illinois University Project), Series 2011, 6.875% 2043 | | | 19,125 | | | | 20,269 | |
| G.O. Bonds, Series 2013, 5.00% 2021 | | | 860 | | | | 900 | |
| G.O. Bonds, Series 2013, 5.00% 2023 | | | 685 | | | | 730 | |
| G.O. Bonds, Series 2014, 5.00% 2022 | | | 885 | | | | 932 | |
| G.O. Bonds, Series 2014, 5.00% 2024 | | | 3,000 | | | | 3,197 | |
| G.O. Bonds, Series 2014, 5.00% 2026 | | | 2,025 | | | | 2,140 | |
| G.O. Bonds, Series 2014, 5.00% 2027 | | | 2,000 | | | | 2,137 | |
| 28 | American Funds Tax-Exempt Funds |
American High-Income Municipal Bond Fund
| | | Principal amount | | | Value | |
| | | (000) | | | (000) | |
| G.O. Bonds, Series 2014, 5.00% 2039 | | $ | 13,550 | | | $ | 13,783 | |
| G.O. Bonds, Series 2016, 5.00% 2025 | | | 1,000 | | | | 1,074 | |
| G.O. Bonds, Series 2016, 5.00% 2028 | | | 1,500 | | | | 1,605 | |
| G.O. Bonds, Series 2016, 5.00% 2033 | | | 4,000 | | | | 4,182 | |
| G.O. Bonds, Series 2016, 5.00% 2038 | | | 1,000 | | | | 1,032 | |
| G.O. Bonds, Series 2016, Assured Guaranty Municipal insured, 5.00% 2041 | | | 2,125 | | | | 2,176 | |
| G.O. Bonds, Series 2017-A, 5.00% 2035 | | | 1,000 | | | | 1,043 | |
| G.O. Bonds, Series 2017-A, 5.00% 2036 | | | 3,000 | | | | 3,124 | |
| G.O. Bonds, Series 2017-B, 5.00% 2019 | | | 3,550 | | | | 3,619 | |
| G.O. Bonds, Series 2017-C, 5.00% 2029 | | | 7,500 | | | | 8,043 | |
| G.O. Bonds, Series 2017-D, 5.00% 2027 | | | 13,770 | | | | 14,956 | |
| G.O. Bonds, Series 2017-D, BAM insured, 5.00% 2026 | | | 10,000 | | | | 10,833 | |
| G.O. Bonds, Series 2017-D, BAM insured, 5.00% 2028 | | | 10,500 | | | | 11,356 | |
| G.O. Rev. Ref. Bonds, Series 2012, 4.00% 2025 | | | 405 | | | | 408 | |
| G.O. Rev. Ref. Bonds, Series 2016, 5.00% 2026 | | | 3,000 | | | | 3,242 | |
| G.O. Rev. Ref. Bonds, Series 2016, 5.00% 2028 | | | 3,000 | | | | 3,227 | |
| G.O. Rev. Ref. Bonds, Series 2016, Assured Guaranty Municipal insured, 4.00% 2030 | | | 750 | | | | 787 | |
| G.O. Rev. Ref. Bonds, Series 2018-A, 5.00% 2023 | | | 2,500 | | | | 2,668 | |
| G.O. Rev. Ref. Bonds, Series 2018-A, 5.00% 2025 | | | 3,750 | | | | 4,051 | |
| G.O. Rev. Ref. Bonds, Series 2018-A, 5.00% 2026 | | | 5,500 | | | | 5,954 | |
| G.O. Rev. Ref. Bonds, Series 2018-A, 5.00% 2027 | | | 2,000 | | | | 2,173 | |
| G.O. Rev. Ref. Bonds, Series 2018-A, 5.00% 2028 | | | 4,000 | | | | 4,331 | |
| G.O. Rev. Ref. Bonds, Series 2018-A, 5.00% 2029 | | | 2,000 | | | | 2,160 | |
| G.O. Rev. Ref. Bonds, Series 2018-B, 5.00% 2033 | | | 3,000 | | | | 3,164 | |
| Other securities | | | | | | | 655,693 | |
| | | | | | | | 1,026,238 | |
| | | | | | | | | |
| Indiana 1.74% | | | | | | | | |
| Fin. Auth., Midwestern Disaster Relief Rev. Bonds (Ohio Valley Electric Corp. Project), Series 2012-A, 5.00% 2032 | | | 17,560 | | | | 17,596 | |
| Other securities | | | | | | | 99,890 | |
| | | | | | | | 117,486 | |
| | | | | | | | | |
| Iowa 0.89% | | | | | | | | |
| Fin. Auth., Midwestern Disaster Area Rev. Ref. Bonds (Iowa Fertilizer Co. Project), Series 2013, 5.25% 2025 | | | 12,450 | | | | 13,210 | |
| Other securities | | | | | | | 47,229 | |
| | | | | | | | 60,439 | |
| | | | | | | | | |
| Massachusetts 1.57% | | | | | | | | |
| Educational Fncg. Auth., Education Loan Rev. Bonds, Series 2016-J, AMT, 3.50% 2033 | | | 15,000 | | | | 15,044 | |
| Other securities | | | | | | | 91,555 | |
| | | | | | | | 106,599 | |
| | | | | | | | | |
| Michigan 3.02% | | | | | | | | |
| County of Wayne, Airport Auth., Airport Rev. Ref. Bonds (Detroit Metropolitan Wayne County Airport), Series 2012-D, AMT, 5.00% 2028 | | | 12,000 | | | | 13,161 | |
| Other securities | | | | | | | 191,088 | |
| | | | | | | | 204,249 | |
| | | | | | | | | |
| New Jersey 4.00% | | | | | | | | |
| Econ. Dev. Auth., School Facs. Construction Rev. Ref. Bonds, Series 2013-I, (SIFMA Municipal Swap Index + 1.60%) 3.03% 20282 | | | 13,500 | | | | 13,430 | |
| Econ. Dev. Auth., Special Fac. Rev. Bonds (Continental Airlines, Inc. Project), Series 1999, AMT, 4.875% 2019 | | | 6,960 | | | | 7,057 | |
| Econ. Dev. Auth., Special Fac. Rev. Bonds (Continental Airlines, Inc. Project), Series 1999, AMT, 5.125% 2023 | | | 3,500 | | | | 3,777 | |
| Econ. Dev. Auth., Special Fac. Rev. Bonds (Continental Airlines, Inc. Project), Series 1999, AMT, 5.25% 2029 | | | 16,300 | | | | 17,694 | |
| Econ. Dev. Auth., Special Fac. Rev. Bonds (Continental Airlines, Inc. Project), Series 2000-B, AMT, 5.625% 2030 | | | 3,750 | | | | 4,232 | |
| Econ. Dev. Auth., Special Fac. Rev. Bonds (Continental Airlines, Inc. Project), Series 2003, AMT, 5.50% 2033 | | | 3,500 | | | | 3,843 | |
| American Funds Tax-Exempt Funds | 29 |
American High-Income Municipal Bond Fund
| Bonds, notes & other debt instruments (continued) | | Principal amount
(000) | | | Value
(000) | |
| New Jersey (continued) | | | | | | | | |
| Econ. Dev. Auth., Special Fac. Rev. Ref. Bonds (Continental Airlines, Inc. Project), Series 2012, AMT, 5.75% 2027 | | $ | 4,500 | | | $ | 4,953 | |
| South Jersey Transportation Auth., Transportation System Rev. Bonds, Series 2014-A, 5.00% 2039 | | | 12,650 | | | | 13,513 | |
| Other securities | | | | | | | 202,025 | |
| | | | | | | | 270,524 | |
| | | | | | | | | |
| New York 4.14% | | | | | | | | |
| City of Glen Cove, Local Econ. Assistance Corp., Convertible Capital Appreciation Rev. Bonds (Garvies Point Public Improvement Project), Series 2016-C, 0% 2055 (5.62% on 1/1/2024)3 | | | 16,320 | | | | 13,265 | |
| Liberty Dev. Corp., Liberty Rev. Ref. Bonds (Bank of America Tower at One Bryant Park Project), Series 2010, 6.375% 2049 | | | 13,360 | | | | 13,875 | |
| Metropolitan Transportation Auth., Transportation Rev. Bonds, Series 2017-C-2A, 4.00% 2019 | | | 32,000 | | | | 32,210 | |
| Transportation Dev. Corp., Special Fac. Rev. Ref. Bonds (American Airlines, Inc. John F. Kennedy International Airport Project), Series 2016, AMT, 5.00% 2020 | | | 15,850 | | | | 16,396 | |
| Transportation Dev. Corp., Special Facs. Bonds (LaGuardia Airport Terminal B Redev. Project), Series 2016-A, AMT, 5.25% 2050 | | | 16,950 | | | | 18,039 | |
| Other securities | | | | | | | 186,714 | |
| | | | | | | | 280,499 | |
| | | | | | | | | |
| Ohio 4.51% | | | | | | | | |
| Buckeye Tobacco Settlement Fncg. Auth., Tobacco Settlement Asset-Backed Bonds, Convertible Capital Appreciation Bonds, Series 2007-A-3, 6.25% 20373 | | | 9,060 | | | | 8,914 | |
| Buckeye Tobacco Settlement Fncg. Auth., Tobacco Settlement Asset-Backed Bonds, Series 2007-A-2, 5.875% 2047 | | | 15,670 | | | | 14,591 | |
| Buckeye Tobacco Settlement Fncg. Auth., Tobacco Settlement Asset-Backed Bonds, Series 2007-A-2, 6.50% 2047 | | | 61,020 | | | | 60,489 | |
| County of Lucas, Hospital Rev. Bonds (Promedica Healthcare Obligated Group), Series 2018-A, 5.25% 2048 | | | 18,250 | | | | 19,773 | |
| Private Activity Bonds (Portsmouth Bypass Project), Series 2015, AMT, 5.00% 2053 | | | 20,455 | | | | 21,482 | |
| Other securities | | | | | | | 179,982 | |
| | | | | | | | 305,231 | |
| | | | | | | | | |
| Oklahoma 0.66% | | | | | | | | |
| Trustees of the Tulsa Municipal Airport Trust, American Airlines Inc. Rev. Ref. Bonds, Series 2001-B, AMT, 5.50% 2035 | | | 15,875 | | | | 16,981 | |
| Other securities | | | | | | | 27,454 | |
| | | | | | | | 44,435 | |
| | | | | | | | | |
| Pennsylvania 5.63% | | | | | | | | |
| Econ. Dev. Fncg. Auth., Private Activity Rev. Bonds (The Pennsylvania Rapid Bridge Replacement Project), Series 2015, AMT, 5.00% 2034 | | | 16,300 | | | | 17,849 | |
| County of Montgomery, Industrial Dev. Auth., Health Systems Rev. Bonds (Albert Einstein Healthcare Network Issue), Series 2015-A, 5.25% 2045 | | | 14,440 | | | | 15,497 | |
| City of Philadelphia, Hospitals and Higher Education Facs. Auth., Hospital Rev. Bonds (Temple University Health System Obligated Group), Series 2012-A, 5.625% 2042 | | | 12,320 | | | | 13,068 | |
| Other securities | | | | | | | 335,069 | |
| | | | | | | | 381,483 | |
| | | | | | | | | |
| Puerto Rico 3.26% | | | | | | | | |
| Aqueduct and Sewer Auth., Rev. Bonds, Series 2012-A, 5.25% 2042 | | | 23,055 | | | | 21,326 | |
| Industrial, Tourist, Educational, Medical and Environmental Control Facs. Fncg. Auth., Hospital Rev. and Rev. Ref. Bonds (Hospital Auxilio Mutuo Obligated Group Project), Series 2011-A, 6.00% 2033 | | | 15,180 | | | | 15,771 | |
| Other securities | | | | | | | 183,560 | |
| | | | | | | | 220,657 | |
| 30 | American Funds Tax-Exempt Funds |
American High-Income Municipal Bond Fund
| | | Principal amount | | | Value | |
| | | (000) | | | (000) | |
| Texas 6.29% | | | | | | | | |
| County of Harris, Cultural Education Facs. Fin. Corp., First Mortgage Rev. Bonds (Brazos Presbyterian Homes, Inc. Project), Series 2016, 5.00% 2048 | | $ | 21,330 | | | $ | 21,790 | |
| City of Houston, Airport System Special Facs. Rev. Bonds (Continental Airlines, Inc. Terminal Improvement Projects), Series 2011, AMT, 6.50% 2030 | | | 9,300 | | | | 10,065 | |
| City of Houston, Airport System Special Facs. Rev. Bonds (Continental Airlines, Inc. Terminal Improvement Projects), Series 2011, AMT, 6.625% 2038 | | | 3,000 | | | | 3,218 | |
| City of Houston, Airport System Special Facs. Rev. Bonds (United Airlines, Inc. Terminal Improvement Projects), Series 2018-C, AMT, 5.00% 2028 | | | 15,000 | | | | 17,199 | |
| City of Houston, Airport System Special Facs. Rev. Ref. Bonds (United Airlines, Inc. Terminal E Project), Series 2014, AMT, 4.75% 2024 | | | 5,500 | | | | 5,923 | |
| City of Houston, Airport System Special Facs. Rev. Ref. Bonds (United Airlines, Inc. Terminal E Project), Series 2014, AMT, 5.00% 2029 | | | 6,745 | | | | 7,364 | |
| City of Houston, Airport System Special Facs. Rev. Ref. Bonds (United Airlines, Inc. Terminal Improvement Projects), Series 2015-B-1, AMT, 5.00% 2030 | | | 3,000 | | | | 3,261 | |
| City of Houston, Airport System Special Facs. Rev. Ref. Bonds (United Airlines, Inc. Terminal Improvement Projects), Series 2015-C, AMT, 5.00% 2020 | | | 8,485 | | | | 8,760 | |
| Turnpike Auth., Central Texas Turnpike System, Rev. Bonds, Series 2002-A, AMBAC insured, 0% 2028 | | | 17,800 | | | | 13,516 | |
| Other securities | | | | | | | 334,799 | |
| | | | | | | | 425,895 | |
| | | | | | | | | |
| Utah 0.50% | | | | | | | | |
| Hideout Local Dist. No. 1, Special Assessment Bonds, Series 2017, 6.75% 20371 | | | 27,800 | | | | 27,320 | |
| Other securities | | | | | | | 6,883 | |
| | | | | | | | 34,203 | |
| | | | | | | | | |
| Virginia 1.92% | | | | | | | | |
| City of Newport News, Industrial Dev. Auth., Health Systems Rev. Ref. Bonds (Custodial Receipts), Series 2015, 5.33% 20451 | | | 27,900 | | | | 29,270 | |
| Other securities | | | | | | | 100,495 | |
| | | | | | | | 129,765 | |
| | | | | | | | | |
| Wisconsin 2.59% | | | | | | | | |
| Housing and Econ. Dev. Auth., Home Ownership Rev. Bonds, Series 2016-A, AMT, 3.50% 2046 | | | 14,905 | | | | 15,285 | |
| Public Fin. Auth., Solid Waste Disposal Rev. Ref. Bonds (Waste Management, Inc. Project), Series 2017-A-3, AMT, 2.15% 2027 (put 2019) | | | 17,000 | | | | 17,000 | |
| Other securities | | | | | | | 143,125 | |
| | | | | | | | 175,410 | |
| | | | | | | | | |
| Other states & U.S. territories 18.26% | | | | | | | | |
| Other securities | | | | | | | 1,235,162 | |
| | | | | | | | | |
| Total bonds, notes & other debt instruments(cost: $6,465,728,000) | | | | | | | 6,564,540 | |
| | | | | | | | | |
| Short-term securities 2.86% | | | | | | | | |
| State of Massachusetts, G.O. Rev. Anticipation Notes, Series 2018-A, 4.00% 4/25/2019 | | | 19,000 | | | | 19,102 | |
| State of Massachusetts, G.O. Rev. Anticipation Notes, Series 2018-C, 4.00% 6/20/2019 | | | 15,000 | | | | 15,136 | |
| State of Mississippi, Business Fin. Corp., Gulf Opportunity Zone Industrial Dev. Rev. Bonds (Chevron U.S.A. Inc. Project), Series 2007-A, 1.60% 20302 | | | 10,125 | | | | 10,125 | |
| State of Mississippi, Business Fin. Corp., Gulf Opportunity Zone Industrial Dev. Rev. Bonds (Chevron U.S.A. Inc. Project), Series 2007-B, 1.60% 20302 | | | 600 | | | | 600 | |
| State of Mississippi, Business Fin. Corp., Gulf Opportunity Zone Industrial Dev. Rev. Bonds (Chevron U.S.A. Inc. Project), Series 2011-F, 1.60% 20352 | | | 2,000 | | | | 2,000 | |
| State of New York, Metropolitan Transportation Auth., Transportation Rev. Bond Anticipation Notes, Series 2017-C-1A, 4.00% 2/15/2019 | | | 1,500 | | | | 1,501 | |
| State of New York, Metropolitan Transportation Auth., Transportation Rev. Bond Anticipation Notes, Series 2017-C-1D, 4.00% 2/15/2019 | | | 16,900 | | | | 16,915 | |
| American Funds Tax-Exempt Funds | 31 |
American High-Income Municipal Bond Fund
| Short-term securities(continued) | | Principal amount
(000) | | | Value
(000) | |
| State of New York, Metropolitan Transportation Auth., Transportation Rev. Bonds, Series 2015-E-3, (SIFMA Municipal Swap Index + 1.70%) 1.59% 20502 | | $ | 1,000 | | | $ | 1,000 | |
| State of Texas, County of Jefferson, Port Arthur Navigation Dist., Pollution Control Rev. Ref. Bonds (Texaco Inc. Project), Series 1994, 1.60% 20242 | | | 700 | | | | 700 | |
| Other securities | | | | | | | 126,724 | |
| | | | | | | | | |
| Total short-term securities (cost: $193,782,000) | | | | | | | 193,803 | |
| Total investment securities 99.82% (cost: $6,659,510,000) | | | | | | | 6,758,343 | |
| Other assets less liabilities 0.18% | | | | | | | 12,231 | |
| | | | | | | | | |
| Net assets 100.00% | | | | | | $ | 6,770,574 | |
This summary investment portfolio is designed to streamline the report and help investors better focus on the fund’s principal holdings. See the inside back cover for details on how to obtain a complete schedule of portfolio holdings.
“Other securities” includes all issues that are not disclosed separately in the summary investment portfolio. “Other securities” includes securities which were valued under fair value procedures adopted by authority of the board of trustees. The total value of securities which were valued under fair value procedures was $6,632,000, which represented .10% of the net assets of the fund.
| 32 | American Funds Tax-Exempt Funds |
American High-Income Municipal Bond Fund
Futures contracts
| | | | | | | | | | | | | | | | Unrealized | |
| | | | | | | | | | | | | | | | appreciation | |
| | | | | | | | | | Notional | | | Value at | | | (depreciation) | |
| | | | | Number of | | | | | amount | 4 | | 1/31/2019 | 5 | | at 1/31/2019 | |
| Contracts | | Type | | contracts | | | Expiration | | (000) | | | (000) | | | (000) | |
| 2 Year U.S. Treasury Note Futures | | Long | | | 660 | | | April 2019 | | $ | 132,000 | | | $ | 140,136 | | | | $ | 935 | |
| 30 Year Ultra U.S. Treasury Bond Futures | | Short | | | 475 | | | March 2019 | | | (47,500 | ) | | | (76,534 | ) | | | | (3,931 | ) |
| | | | | | | | | | | | | | | | | | | | $ | (2,996 | ) |
| 1 | Acquired in a transaction exempt from registration under Rule 144A of the Securities Act of 1933. May be resold in the U.S. in transactions exempt from registration, normally to qualified institutional buyers. The total value of all such securities, including those in “Other securities,” was $860,351,000, which represented 12.71% of the net assets of the fund. |
| 2 | Coupon rate may change periodically. For short-term securities, the date of the next scheduled coupon rate change is considered to be the maturity date. |
| 3 | Step bond; coupon rate may change at a later date. |
| 4 | Notional amount is calculated based on the number of contracts and notional contract size. |
| 5 | Value is calculated based on the notional amount and current market price. |
Key to abbreviations and symbol
Agcy. = Agency
AMT = Alternative Minimum Tax
Auth. = Authority
Certs. of Part. = Certificates of Participation
Dept. = Department
Dev. = Development
Dist. = District
Econ. = Economic
Fac. = Facility
Facs. = Facilities
Fin. = Finance
Fncg. = Financing
G.O. = General Obligation
LIBOR = London Interbank Offered Rate
LOC = Letter of Credit
Preref. = Prerefunded
Redev. = Redevelopment
Ref. = Refunding
Rev. = Revenue
SIFMA = Securities Industry and Financial Markets Association
USD/$ = U.S. dollars
See notes to financial statements
| American Funds Tax-Exempt Funds | 33 |
| The Tax-Exempt Fund of California | unaudited |
| Summary investment portfolioJanuary 31, 2019 | |
| Portfolio quality summary* | Percent of net assets |
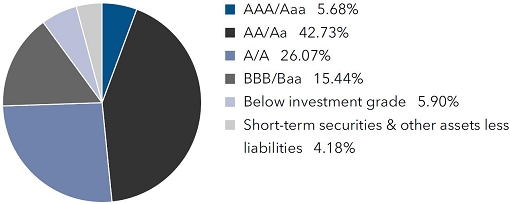
| * | Bond ratings, which typically range from AAA/Aaa (highest) to D (lowest), are assigned by credit rating agencies such as Standard & Poor’s, Moody’s and/or Fitch as an indication of an issuer’s creditworthiness. In assigning a credit rating to a security, the fund looks specifically to the ratings assigned to the issuer of the security by Standard & Poor’s, Moody’s and/or Fitch. If agency ratings differ, the security will be considered to have received the highest of those ratings, consistent with the fund’s investment policies. |
| Bonds, notes & other debt instruments 95.82% | Principal amount
(000) | | | | Value
(000) | |
| California 94.86% | | | | | | | | |
| State issuers 36.20% | | | | | | | | |
| Educational Facs. Auth., Rev. Bonds (Chapman University), Series 2017-B, 4.00% 2047 | | $ | 10,575 | | | $ | 10,663 | |
| Educational Facs. Auth., Rev. Ref. Bonds (Chapman University), Series 2011, 5.00% 2031 | | | 8,615 | | | | 9,198 | |
| G.O. Bonds, Series 2009, 6.00% 2039 | | | 2,000 | | | | 2,060 | |
| G.O. Bonds, Series 2011, 5.25% 2028 | | | 5,000 | | | | 5,439 | |
| G.O. Bonds, Series 2011, 5.25% 2028 | | | 2,000 | | | | 2,171 | |
| G.O. Bonds, Series 2013-E, (1-month USD-LIBOR + 0.43%) 1.86% 2029 (put 2023)1 | | | 1,500 | | | | 1,496 | |
| G.O. Bonds, Series 2015, 5.25% 2032 | | | 5,000 | | | | 5,849 | |
| Golden State Tobacco Securitization Corp., Enhanced Tobacco Settlement Asset-Backed Bonds, Series 2005-A, Assured Guaranty Municipal insured, 0% 2026 | | | 11,000 | | | | 9,297 | |
| Health Facs. Fncg. Auth., Rev. Bonds (Kaiser Permanente), Series 2017-A-2, 4.00% 2044 | | | 12,940 | | | | 13,217 | |
| Health Facs. Fncg. Auth., Rev. Ref. Bonds (El Camino Hospital), Series 2015-A, 5.00% 2040 | | | 8,700 | | | | 9,548 | |
| Health Facs. Fncg. Auth., Rev. Ref. Bonds (Stanford Health Care), Series 2017-A, 5.00% 2034 | | | 11,000 | | | | 12,994 | |
| Health Facs. Fncg. Auth., Rev. Ref. Bonds (Stanford Hospital and Clinics), Series 2010-B, 5.25% 2031 (preref. 2020) | | | 8,000 | | | | 8,525 | |
| Infrastructure and Econ. Dev. Bank, Rev. Bonds (The Colburn School), Series 2015-B,(SIFMA Municipal Swap Index + 1.20%) 2.63% 2037 (put 2022)1 | | | 8,500 | | | | 8,684 | |
| Infrastructure and Econ. Dev. Bank, Rev. Ref. Bonds (J. Paul Getty Trust), Series 2013-A-2,(1-month USD-LIBOR x 0.70 + 0.50%) 2.249% 2047 (put 2019)1 | | | 10,000 | | | | 10,006 | |
| Municipal Fin. Auth., Certs. of Part. (Community Hospitals of Central California Obligated Group), Series 2009, 5.50% 2039 (preref. 2019) | | | 1,500 | | | | 1,500 | |
| Municipal Fin. Auth., Charter School Rev. Bonds (Bella Mente Montessori Academy),Series 2018-A, 5.00% 20482 | | | 1,150 | | | | 1,188 | |
| Municipal Fin. Auth., Rev. Bonds (California Lutheran University), Series 2018, 5.00% 2027 | | | 300 | | | | 355 | |
| Municipal Fin. Auth., Rev. Bonds (California Lutheran University), Series 2018, 5.00% 2028 | | | 150 | | | | 179 | |
| Municipal Fin. Auth., Rev. Bonds (California Lutheran University), Series 2018, 5.00% 2029 | | | 225 | | | | 266 | |
| Municipal Fin. Auth., Rev. Bonds (California Lutheran University), Series 2018, 5.00% 2030 | | | 225 | | | | 264 | |
| Municipal Fin. Auth., Rev. Bonds (California Lutheran University), Series 2018, 5.00% 2031 | | | 200 | | | | 233 | |
| Municipal Fin. Auth., Rev. Bonds (California Lutheran University), Series 2018, 5.00% 2032 | | | 225 | | | | 261 | |
| Municipal Fin. Auth., Rev. Bonds (California Lutheran University), Series 2018, 5.00% 2033 | | | 225 | | | | 259 | |
| Municipal Fin. Auth., Rev. Bonds (LINXS APM Project), Series 2018-A, AMT, 4.00% 2047 | | | 3,900 | | | | 3,847 | |
| Municipal Fin. Auth., Rev. Bonds (LINXS APM Project), Series 2018-A, AMT, 5.00% 2025 | | | 585 | | | | 669 | |
| Municipal Fin. Auth., Rev. Bonds (LINXS APM Project), Series 2018-A, AMT, 5.00% 2031 | | | 2,695 | | | | 3,074 | |
| Municipal Fin. Auth., Rev. Bonds (LINXS APM Project), Series 2018-A, AMT, 5.00% 2034 | | | 1,320 | | | | 1,488 | |
| Municipal Fin. Auth., Rev. Bonds (LINXS APM Project), Series 2018-A, AMT, 5.00% 2035 | | | 1,000 | | | | 1,122 | |
| Municipal Fin. Auth., Rev. Bonds (LINXS APM Project), Series 2018-A, AMT, 5.00% 2043 | | | 3,000 | | | | 3,277 | |
| Municipal Fin. Auth., Rev. Bonds (LINXS APM Project), Series 2018-A, AMT, 5.00% 2047 | | | 8,705 | | | | 9,474 | |
Municipal Fin. Auth., Student Housing Rev. Bonds
(CHF-Davis I, LLC - West Village Student Housing Project), Series 2018, 5.00% 2040 | | | 4,610 | | | | 5,070 | |
Municipal Fin. Auth., Student Housing Rev. Bonds
(CHF-Davis I, LLC - West Village Student Housing Project), Series 2018, 5.00% 2043 | | | 6,525 | | | | 7,126 | |
Municipal Fin. Auth., Student Housing Rev. Bonds
(CHF-Riverside I, LLC - UCR Student Housing Project), Series 2018, 5.00% 2043 | | | 2,000 | | | | 2,191 | |
| 34 | American Funds Tax-Exempt Funds |
The Tax-Exempt Fund of California
| | Principal amount
(000) | | | Value
(000) | |
Municipal Fin. Auth., Student Housing Rev. Bonds
(CHF-Riverside I, LLC - UCR Student Housing Project), Series 2018, 5.00% 2052 | | $ | 7,500 | | | $ | 8,121 | |
| Pollution Control Fncg. Auth., Rev. Bonds (San Jose Water Company Project), Series 2016, AMT, 4.75% 2046 | | | 11,475 | | | | 12,303 | |
| Statewide Communities Dev. Auth., Hospital Rev. Ref. Bonds (Methodist Hospital of Southern California), Series 2018, 5.00% 2030 | | | 2,585 | | | | 2,980 | |
| Statewide Communities Dev. Auth., Hospital Rev. Ref. Bonds (Methodist Hospital of Southern California), Series 2018, 5.00% 2032 | | | 1,165 | | | | 1,323 | |
| Statewide Communities Dev. Auth., Hospital Rev. Ref. Bonds (Methodist Hospital of Southern California), Series 2018, 5.00% 2038 | | | 1,000 | | | | 1,102 | |
| Statewide Communities Dev. Auth., Hospital Rev. Ref. Bonds (Methodist Hospital of Southern California), Series 2018, 5.00% 2048 | | | 2,000 | | | | 2,181 | |
| Statewide Communities Dev. Auth., Hospital Rev. Ref. Bonds (Methodist Hospital of Southern California), Series 2018, 5.00% 2048 | | | 1,500 | | | | 1,618 | |
| Statewide Communities Dev. Auth., Insured Rev. Bonds (Viamonte Senior Living 1 Project), Series 2018-B, 3.00% 2025 | | | 1,500 | | | | 1,524 | |
| Statewide Communities Dev. Auth., Insured Rev. Bonds (Viamonte Senior Living 1 Project), Series 2018-B, 3.00% 2026 | | | 4,000 | | | | 4,056 | |
| Statewide Communities Dev. Auth., Pollution Control Rev. Ref. Bonds (Southern California Edison Company), Series 2010-A, 4.50% 2029 | | | 2,705 | | | | 2,744 | |
| Statewide Communities Dev. Auth., Rev. Bonds (Adventist Health System/West), Series 2018-A, 4.00% 2042 | | | 1,240 | | | | 1,263 | |
| Statewide Communities Dev. Auth., Rev. Bonds (Adventist Health System/West), Series 2018-A, 5.00% 2032 | | | 1,000 | | | | 1,174 | |
| Statewide Communities Dev. Auth., Rev. Bonds (Adventist Health System/West), Series 2018-A, 5.00% 2033 | | | 1,150 | | | | 1,340 | |
| Statewide Communities Dev. Auth., Rev. Bonds (Adventist Health System/West), Series 2018-A, 5.00% 2035 | | | 1,465 | | | | 1,686 | |
| Statewide Communities Dev. Auth., Rev. Bonds (Huntington Memorial Hospital), Series 2014, 5.00% 2044 | | | 8,500 | | | | 9,241 | |
| Statewide Communities Dev. Auth., Rev. Bonds (Kaiser Permanente), Series 2012-A, 5.00% 2042 | | | 6,500 | | | | 6,966 | |
| Statewide Communities Dev. Auth., Rev. Bonds (Loma Linda University Medical Center),Series 2018-A, 5.50% 20582 | | | 1,000 | | | | 1,089 | |
| Statewide Communities Dev. Auth., Rev. Ref. Bonds (California Baptist University),Series 2017-A, 5.00% 20412 | | | 10,920 | | | | 11,785 | |
| Statewide Communities Dev. Auth., Student Housing Rev. Custodial Bonds, Series 2017, 4.305% 2032 | | | 8,300 | | | | 8,646 | |
| Regents of the University of California, Limited Project Rev. Bonds, Series 2016-K, 5.00% 2034 | | | 750 | | | | 864 | |
| Regents of the University of California, Limited Project Rev. Bonds, Series 2016-K, 5.00% 2035 | | | 3,750 | | | | 4,306 | |
| Regents of the University of California, Limited Project Rev. Ref. Bonds, Series 2018-O, 5.00% 2048 | | | 2,695 | | | | 3,063 | |
| Regents of the University of California, Medical Center Pooled Rev. Bonds, Series 2016-L, 4.00% 2037 | | | 1,585 | | | | 1,654 | |
| Regents of the University of California, Medical Center Pooled Rev. Bonds, Series 2016-L, 4.00% 2038 | | | 1,000 | | | | 1,038 | |
| Regents of the University of California, Medical Center Pooled Rev. Ref. Bonds,Series 2007-C-2, National insured, (3-month USD-LIBOR + 0.67%) 2.422% 20371 | | | 5,100 | | | | 4,707 | |
| Regents of the University of California, Medical Center Pooled Rev. Ref. Bonds,Series 2007-C-2, National insured, (3-month USD-LIBOR + 0.74%) 2.492% 20431 | | | 8,000 | | | | 7,024 | |
| Dept. of Veterans Affairs, Veterans G.O. Bonds, Series 2018-CR, 4.00% 2048 | | | 17,915 | | | | 19,124 | |
| Dept. of Veterans Affairs, Veterans G.O. Rev. Ref. Bonds, Series 2016-CN, 3.50% 2045 | | | 8,155 | | | | 8,391 | |
| Dept. of Water Resources, Water System Rev. Bonds (Central Valley Project), Series AW, 4.00% 2035 | | | 20,840 | | | | 22,479 | |
| Other securities | | | | | | | 526,021 | |
| | | | | | | | 830,803 | |
| | | | | | | | | |
| City, county & other issuers 58.66% | | | | | | | | |
| Alameda Corridor Transportation Auth., Rev. Ref. Bonds, Series 2013-A, 5.00% 2025 | | | 1,700 | | | | 1,939 | |
| Alameda Corridor Transportation Auth., Rev. Ref. Bonds, Series 2013-A, 5.00% 2026 | | | 6,375 | | | | 7,261 | |
| Alameda Corridor Transportation Auth., Rev. Ref. Bonds, Series 2016-B, 5.00% 2034 | | | 2,000 | | | | 2,232 | |
| Alameda Corridor Transportation Auth., Rev. Ref. Bonds, Series 2016-B, 5.00% 2036 | | | 1,000 | | | | 1,108 | |
| American Funds Tax-Exempt Funds | 35 |
The Tax-Exempt Fund of California
| Bonds, notes & other debt instruments(continued) | Principal amount
(000) | | | Value
(000) | |
| California (continued) | | | | | | |
| City, county & other issuers (continued) | | | | | | | | |
| Alameda Corridor Transportation Auth., Rev. Ref. Bonds, Series 2016-B, 5.00% 2037 | | $ | 3,790 | | | $ | 4,187 | |
| Alameda Corridor Transportation Auth., Rev. Ref. Bonds, Series 2016-B, Assured Guaranty Municipal insured, 4.00% 2035 | | | 2,500 | | | | 2,632 | |
| Alameda Corridor Transportation Auth., Rev. Ref. Bonds, Series 2016-B, Assured Guaranty Municipal insured, 4.00% 2037 | | | 2,000 | | | | 2,080 | |
| Alameda Corridor Transportation Auth., Rev. Ref. Bonds, Series 2016-B, Assured Guaranty Municipal insured, 5.00% 2036 | | | 1,500 | | | | 1,693 | |
| Baldwin Park Unified School Dist., G.O. Rev. Ref. Bonds, Series 2016, Assured Guaranty Municipal insured, 4.00% 2031 | | | 6,420 | | | | 6,987 | |
| Assn. of Bay Area Governments, Fin. Auth. for Nonprofit Corps., Rev. Ref. Bonds (Eskaton Properties Inc. Obligated Group), Series 2013, 5.00% 2035 | | | 7,350 | | | | 7,811 | |
| Bay Area Toll Auth., San Francisco Bay Area Toll Bridge Rev. Bonds, Series 2006-C-1,(SIFMA Municipal Swap Index + 0.90%) 2.33% 2045 (put 2023)1 | | | 2,000 | | | | 2,016 | |
| Bay Area Toll Auth., San Francisco Bay Area Toll Bridge Rev. Bonds, Series 2008-B-1,(SIFMA Municipal Swap Index + 1.10%) 2.53% 2045 (put 2024)1 | | | 7,900 | | | | 8,045 | |
| Bay Area Toll Auth., San Francisco Bay Area Toll Bridge Rev. Bonds, Series 2014-G,(SIFMA Municipal Swap Index + 0.60%) 2.03% 2034 (put 2020)1 | | | 825 | | | | 826 | |
| Bay Area Toll Auth., San Francisco Bay Area Toll Bridge Rev. Bonds, Series 2014-H,(SIFMA Municipal Swap Index + 0.70%) 2.13% 2034 (put 2021)1 | | | 4,000 | | | | 4,011 | |
| Bay Area Toll Auth., San Francisco Bay Area Toll Bridge Rev. Bonds, Series 2017-B, 2.85% 2047 (put 2025) | | | 1,000 | | | | 1,043 | |
| Bay Area Toll Auth., San Francisco Bay Area Toll Bridge Rev. Bonds, Series 2017-D,(3-month USD-LIBOR x 0.70 + 0.55%) 2.51% 2045 (put 2021)1 | | | 2,100 | | | | 2,104 | |
| Bay Area Toll Auth., San Francisco Bay Area Toll Bridge Rev. Bonds, Series 2017-F-1, 5.00% 2056 | | | 5,000 | | | | 5,596 | |
| Bay Area Toll Auth., San Francisco Bay Area Toll Bridge Rev. Ref. Bonds, Series 2009-F-1, 5.125% 2039 (preref. 2019) | | | 2,000 | | | | 2,012 | |
| Bay Area Toll Auth., San Francisco Bay Area Toll Bridge Rev. Ref. Bonds, Series 2009-F-1, 5.625% 2044 (preref. 2019) | | | 1,670 | | | | 1,681 | |
| Bay Area Toll Auth., San Francisco Bay Area Toll Bridge Rev. Ref. Bonds, Series 2014-F-1, 5.00% 2054 | | | 1,475 | | | | 1,615 | |
| Bay Area Toll Auth., San Francisco Bay Area Toll Bridge Rev. Ref. Bonds, Series 2017-S-7, 5.00% 2028 | | | 4,500 | | | | 5,676 | |
| Coachella Valley Unified School Dist., G.O. Bonds, 2005 Election, Series 2016-E, Assured Guaranty Municipal insured, 4.00% 2045 | | | 6,555 | | | | 6,740 | |
| County of Contra Costa, Transportation Auth., Sales Tax Rev. Ref. Bonds, Series 2018-A,(1-month USD-LIBOR x 0.70 + 0.25%) 2.014% 2034 (put 2021)1 | | | 11,675 | | | | 11,678 | |
| City of Elk Grove, Fin. Auth., Special Tax Rev. Bonds, Series 2016, 5.00% 2046 | | | 8,065 | | | | 8,631 | |
| Foothill/Eastern Transportation Corridor Agcy., Toll Road Rev. Ref. Bonds, Series 2013-A, 6.00% 2053 | | | 7,500 | | | | 8,583 | |
| Foothill/Eastern Transportation Corridor Agcy., Toll Road Rev. Ref. Bonds, Series 2014-A, 6.00% 2049 | | | 5,800 | | | | 6,646 | |
| Imperial Irrigation Dist., Electric System Rev. Ref. Bonds, Series 2017, 4.00% 2036 | | | 6,915 | | | | 7,280 | |
| City of Los Angeles, Dept. of Airports, Los Angeles International Airport, Rev. Bonds, Series 2016-B, AMT, 5.00% 2029 | | | 1,450 | | | | 1,681 | |
| City of Los Angeles, Dept. of Airports, Los Angeles International Airport, Rev. Bonds, Series 2016-B, AMT, 5.00% 2031 | | | 2,395 | | | | 2,743 | |
| City of Los Angeles, Dept. of Airports, Los Angeles International Airport, Rev. Bonds, Series 2016-B, AMT, 5.00% 2033 | | | 500 | | | | 568 | |
| City of Los Angeles, Dept. of Airports, Los Angeles International Airport, Rev. Bonds, Series 2016-B, AMT, 5.00% 2036 | | | 1,000 | | | | 1,124 | |
| City of Los Angeles, Dept. of Airports, Los Angeles International Airport, Rev. Bonds, Series 2017-A, AMT, 5.00% 2030 | | | 1,000 | | | | 1,170 | |
| City of Los Angeles, Dept. of Airports, Los Angeles International Airport, Rev. Bonds, Series 2017-A, AMT, 5.00% 2032 | | | 1,000 | | | | 1,156 | |
| City of Los Angeles, Dept. of Airports, Los Angeles International Airport, Rev. Bonds, Series 2017-A, AMT, 5.00% 2033 | | | 1,000 | | | | 1,151 | |
| City of Los Angeles, Dept. of Airports, Los Angeles International Airport, Rev. Bonds, Series 2017-A, AMT, 5.00% 2034 | | | 1,250 | | | | 1,432 | |
| City of Los Angeles, Dept. of Airports, Los Angeles International Airport, Rev. Bonds, Series 2017-A, AMT, 5.00% 2035 | | | 1,000 | | | | 1,142 | |
| City of Los Angeles, Dept. of Airports, Los Angeles International Airport, Rev. Bonds, Series 2017-A, AMT, 5.00% 2036 | | | 1,400 | | | | 1,593 | |
| 36 | American Funds Tax-Exempt Funds |
The Tax-Exempt Fund of California
| | Principal amount
(000) | | | Value
(000) | |
| City of Los Angeles, Dept. of Airports, Los Angeles International Airport, Rev. Bonds, Series 2017-A, AMT, 5.00% 2037 | | $ | 1,260 | | | $ | 1,428 | |
| City of Los Angeles, Dept. of Airports, Los Angeles International Airport, Rev. Bonds, Series 2018-A, AMT, 5.00% 2033 | | | 1,255 | | | | 1,462 | |
| City of Los Angeles, Dept. of Airports, Los Angeles International Airport, Rev. Bonds, Series 2018-A, AMT, 5.00% 2036 | | | 1,345 | | | | 1,547 | |
| City of Los Angeles, Dept. of Airports, Los Angeles International Airport, Rev. Bonds, Series 2018-A, AMT, 5.00% 2037 | | | 1,450 | | | | 1,661 | |
| City of Los Angeles, Dept. of Airports, Los Angeles International Airport, Rev. Bonds, Series 2018-A, AMT, 5.00% 2044 | | | 2,880 | | | | 3,242 | |
| City of Los Angeles, Dept. of Airports, Los Angeles International Airport, Rev. Bonds, Series 2018-B, AMT, 5.00% 2032 | | | 5,000 | | | | 5,858 | |
| City of Los Angeles, Dept. of Airports, Los Angeles International Airport, Rev. Bonds, Series 2018-D, AMT, 5.00% 2033 | | | 5,880 | | | | 6,942 | |
| City of Los Angeles, Dept. of Water and Power, Power System Rev. Bonds, Series 2019-A, 5.00% 2049 | | | 10,000 | | | | 11,489 | |
| Oakland Unified School Dist., G.O. Bonds, Series 2015-A, 5.00% 2040 | | | 5,550 | | | | 6,344 | |
| Oxnard Unified School Dist., G.O. Rev. Ref. Bonds, Series 2017-A, BAM insured, 5.00% 2045 | | | 6,770 | | | | 7,692 | |
| Palomar Pomerado Health, G.O. Bonds, 2004 Election, Series 2009-A, Assured Guaranty insured, 0% 2029 | | | 9,350 | | | | 6,771 | |
| County of Sacramento, Sanitation Dist. Fncg. Auth., Rev. Ref. Bonds (Sacramento Regional County Sanitation Dist.), Series 2007-B, FGIC-National insured,(3-month USD-LIBOR + 0.53%) 2.364% 20351 | | | 13,500 | | | | 13,163 | |
| City of San Buenaventura, Rev. Bonds (Community Memorial Health System), Series 2011, 7.50% 2041 | | | 10,825 | | | | 11,821 | |
| City and County of San Francisco, Airport Commission, San Francisco International Airport, Second Series Rev. Bonds, Series 2019-A, AMT, 5.00% 2049 | | | 11,000 | | | | 12,368 | |
| City and County of San Francisco, Public Utilities Commission, Wastewater Rev. Green Bonds, Series 2016-A, 4.00% 2037 | | | 6,575 | | | | 6,860 | |
| City of San Jose, Airport Rev. Ref. Bonds, Series 2011-A-1, AMT, 5.50% 2030 | | | 8,000 | | | | 8,531 | |
| City of San Jose, Airport Rev. Ref. Bonds, Series 2011-A-2, 5.25% 2034 | | | 4,900 | | | | 5,206 | |
| City of San Jose, Airport Rev. Ref. Bonds, Series 2017-A, AMT, 5.00% 2020 | | | 2,080 | | | | 2,150 | |
| City of San Jose, Airport Rev. Ref. Bonds, Series 2017-A, AMT, 5.00% 2035 | | | 2,000 | | | | 2,263 | |
| City of San Jose, Airport Rev. Ref. Bonds, Series 2017-A, AMT, 5.00% 2037 | | | 1,000 | | | | 1,123 | |
| City of San Jose, Airport Rev. Ref. Bonds, Series 2017-A, AMT, 5.00% 2041 | | | 1,500 | | | | 1,666 | |
| City of San Jose, Airport Rev. Ref. Bonds, Series 2017-A, AMT, 5.00% 2047 | | | 5,000 | | | | 5,520 | |
| Stockton Unified School Dist., G.O. Rev. Ref. Bonds, Series 2016, 5.00% 2031 | | | 7,800 | | | | 8,997 | |
| Tobacco Securitization Auth. of Southern California, Tobacco Settlement Asset-Backed Rev. Ref. Bonds (San Diego County Tobacco Asset Securitization Corp.), Series 2006-A, 5.125% 2046 | | | 7,800 | | | | 7,800 | |
| Twin Rivers Unified School Dist., G.O. Bonds, 2006 Election, Series 2016, Assured Guaranty Municipal insured, 0% 2041 | | | 15,700 | | | | 6,210 | |
| City of Whittier, Health Fac. Rev. Bonds (PIH Health), Series 2014, 5.00% 2044 | | | 10,000 | | | | 10,763 | |
| Other securities | | | | | | | 1,051,803 | |
| | | | | | | | 1,346,553 | |
| | | | | | | | | |
| Guam 0.37% | | | | | | | | |
| Other securities | | | | | | | 8,496 | |
| | | | | | | | | |
| Puerto Rico 0.59% | | | | | | | | |
| Industrial, Tourist, Educational, Medical and Environmental Control Facs. Fncg. Auth., Hospital Rev. and Rev. Ref. Bonds (Hospital Auxilio Mutuo Obligated Group Project), Series 2011-A, 6.00% 2033 | | | 7,900 | | | | 8,207 | |
| Other securities | | | | | | | 5,422 | |
| | | | | | | | 13,629 | |
| | | | | | | | | |
| Total bonds, notes & other debt instruments(cost: $2,151,674,000) | | | | | | | 2,199,481 | |
| American Funds Tax-Exempt Funds | 37 |
The Tax-Exempt Fund of California
| Short-term securities 4.10% | Principal amount
(000) | | | Value
(000) | |
| Fin. Auth., Recovery Zone Fac. Bonds (Chevron U.S.A. Inc. Project), Series 2010-A,1.34% 20351 | | $ | 18,725 | | | $ | 18,725 | |
| Kindergarten-University Public Education Facs. Bonds, Series 2004-B-3, 1.35% 20341 | | | 6,000 | | | | 6,000 | |
| County of Los Angeles, Lease Rev. IAM Commercial Paper, Series 2019-B, 1.47% 2/6/2019 | | | 5,000 | | | | 5,000 | |
| County of Los Angeles, Tax and Rev. Anticipation Notes, Series 2018, 4.00% 6/28/2019 | | | 1,750 | | | | 1,767 | |
| Municipal Fin. Auth., Pollution Control Rev. Ref. Bonds (Chevron U.S.A. Inc. Project),Series 2005, 1.34% 20251 | | | 2,500 | | | | 2,500 | |
| Pollution Control Fncg. Auth., Environmental Impact Rev. Bonds (Air Products andChemicals, Inc. Project), Series 1997-B, 1.41% 20421 | | | 6,700 | | | | 6,700 | |
| Statewide Communities Dev. Auth., Pollution Control Rev. Ref. Bonds (Chevron U.S.A. Inc.Project), Series 2002, 1.34% 20241 | | | 14,410 | | | | 14,410 | |
| Regents of the University of California, General Rev. Bonds, Series 2013-AL-1,1.33% 20481 | | | 4,600 | | | | 4,600 | |
| Regents of the University of California, IAM Commercial Paper, Series 2019-A, 1.43% 2/21/2019 | | | 13,000 | | | | 13,000 | |
| Regents of the University of California, IAM Commercial Paper, Series 2019-A, 1.48% 3/5/2019 | | | 11,000 | | | | 11,000 | |
| Regents of the University of California, IAM Commercial Paper, Series 2019-A, 1.56% 3/7/2019 | | | 4,000 | | | | 4,000 | |
| Dept. of Water Resources, Water System Rev. IAM Commercial Paper, Series 2019-1, 1.45% 3/7/2019 | | | 1,900 | | | | 1,900 | |
| Other securities | | | | | | | 4,510 | |
| | | | | | | | | |
| Total short-term securities (cost: $94,111,000) | | | | | | | 94,112 | |
| Total investment securities 99.92% (cost: $2,245,785,000) | | | | | | | 2,293,593 | |
| Other assets less liabilities 0.08% | | | | | | | 1,798 | |
| | | | | | | | | |
| Net assets 100.00% | | | | | | $ | 2,295,391 | |
This summary investment portfolio is designed to streamline the report and help investors better focus on the fund’s principal holdings. See the inside back cover for details on how to obtain a complete schedule of portfolio holdings.
“Other securities” includes all issues that are not disclosed separately in the summary investment portfolio.
| 1 | Coupon rate may change periodically. For short-term securities, the date of the next scheduled coupon rate change is considered to be the maturity date. |
| 2 | Acquired in a transaction exempt from registration under Rule 144A of the Securities Act of 1933. May be resold in the U.S. in transactions exempt from registration, normally to qualified institutional buyers. The total value of all such securities, including those in “Other securities,” was $75,210,000, which represented 3.28% of the net assets of the fund. |
Key to abbreviations and symbol
Agcy. = Agency
AMT = Alternative Minimum Tax
Auth. = Authority
Certs. of Part. = Certificates of Participation
Dept. = Department
Dev. = Development
Dist. = District
Econ. = Economic
Fac. = Facility
Facs. = Facilities
Fin. = Finance
Fncg. = Financing
G.O. = General Obligation
LIBOR = London Interbank Offered Rate
LOC = Letter of Credit
Preref. = Prerefunded
Redev. = Redevelopment
Ref. = Refunding
Rev. = Revenue
SIFMA = Securities Industry and Financial Markets Association
USD/$ = U.S. dollars
See notes to financial statements
| 38 | American Funds Tax-Exempt Funds |
| American Funds Tax-Exempt Fund of New York | unaudited |
| Summary investment portfolioJanuary 31, 2019 | |
| | |
| Portfolio quality summary* | Percent of net assets |
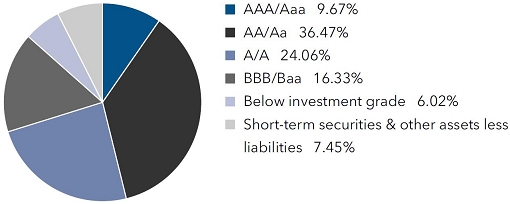
| * | Bond ratings, which typically range from AAA/Aaa (highest) to D (lowest), are assigned by credit rating agencies such as Standard & Poor’s, Moody’s and/or Fitch as an indication of an issuer’s creditworthiness. In assigning a credit rating to a security, the fund looks specifically to the ratings assigned to the issuer of the security by Standard & Poor’s, Moody’s and/or Fitch. If agency ratings differ, the security will be considered to have received the highest of those ratings, consistent with the fund’s investment policies. |
| Bonds, notes & other debt instruments 92.55% | Principal amount
(000) | | | Value
(000) | |
| New York 90.32% | | | | | | | | |
| State issuers 46.01% | | | | | | | | |
| Brooklyn Arena Local Dev. Corp., Pilot Rev. Ref. Bonds (Brooklyn Events Center LLC), Series 2016-A, 5.00% 2026 | | $ | 500 | | | $ | 573 | |
| Brooklyn Arena Local Dev. Corp., Pilot Rev. Ref. Bonds (Brooklyn Events Center LLC), Series 2016-A, Assured Guaranty Municipal insured, 4.00% 2034 | | | 240 | | | | 252 | |
| Brooklyn Arena Local Dev. Corp., Pilot Rev. Ref. Bonds (Brooklyn Events Center LLC), Series 2016-A, Assured Guaranty Municipal insured, 5.00% 2030 | | | 500 | | | | 562 | |
| Brooklyn Arena Local Dev. Corp., Pilot Rev. Ref. Bonds (Brooklyn Events Center LLC), Series 2016-A, Assured Guaranty Municipal insured, 5.00% 2042 | | | 1,500 | | | | 1,612 | |
| Dormitory Auth., Income Tax Rev. Bonds, Series 2009-A, 5.25% 2025 (preref. 2019) | | | 1,160 | | | | 1,161 | |
| Dormitory Auth., Income Tax Rev. Bonds, Series 2017-B, 5.00% 2042 | | | 1,130 | | | | 1,281 | |
| Dormitory Auth., Montefiore Obligated Group Bonds, Series 2018-A, 5.00% 2031 | | | 1,000 | | | | 1,155 | |
| Dormitory Auth., New York University Rev. Bonds, Series 2018-A, 5.00% 2032 | | | 500 | | | | 598 | |
| Dormitory Auth., North Shore-Long Island Jewish Obligated Group Rev. Bonds, Series 2011-A, 5.00% 2032 (preref. 2021) | | | 1,500 | | | | 1,611 | |
| Dormitory Auth., Orange Regional Medical Center Obligated Group Rev. Bonds, Series 2015, 5.00% 20401 | | | 1,000 | | | | 1,074 | |
| Dormitory Auth., Orange Regional Medical Center Obligated Group Rev. Bonds, Series 2017, 5.00% 20351 | | | 1,000 | | | | 1,104 | |
| Dormitory Auth., School Dist. Rev. Bond Fncg. Program Rev. Bonds, Series 2018-A, 5.00% 2032 | | | 1,000 | | | | 1,158 | |
| Dormitory Auth., Skidmore College Rev. Bonds, Series 2011-A, 5.50% 2041 | | | 1,110 | | | | 1,198 | |
| Dormitory Auth., State Personal Income Tax Rev. Bonds (General Purpose), Series 2018-A, 5.25% 2037 | | | 1,000 | | | | 1,191 | |
| Environmental Facs. Corp., Rev. Green Bonds (Revolving Funds), Series 2016-B, 4.00% 2036 | | | 1,950 | | | | 2,062 | |
| Liberty Dev. Corp., Liberty Rev. Ref. Bonds (3 World Trade Center Project), Series 2014, Class 2, 5.15% 20341 | | | 1,250 | | | | 1,337 | |
| Liberty Dev. Corp., Liberty Rev. Ref. Bonds (4 World Trade Center Project), Series 2011, 5.00% 2031 | | | 1,500 | | | | 1,611 | |
| Liberty Dev. Corp., Liberty Rev. Ref. Bonds (Bank of America Tower at One Bryant Park Project), Series 2010, 6.375% 2049 | | | 1,500 | | | | 1,558 | |
| Long Island Power Auth., Electric System General Rev. Bonds, Series 2008-A, 6.00% 2033 (preref. 2019) | | | 1,595 | | | | 1,612 | |
| Long Island Power Auth., Electric System General Rev. Bonds, Series 2011-A, 5.00% 2038 (preref. 2021) | | | 500 | | | | 537 | |
| Long Island Power Auth., Electric System General Rev. Bonds, Series 2015-B, 5.00% 2035 | | | 1,215 | | | | 1,385 | |
| Long Island Power Auth., Electric System General Rev. Bonds, Series 2015-B, 5.00% 2038 | | | 750 | | | | 844 | |
| Long Island Power Auth., Electric System General Rev. Bonds, Series 2015-C, (1-month USD-LIBOR x 0.70 + 0.75%) 2.513% 2033 (put 2023)2 | | | 1,500 | | | | 1,503 | |
| Long Island Power Auth., Electric System General Rev. Bonds, Series 2017, 5.00% 2035 | | | 1,000 | | | | 1,153 | |
| Long Island Power Auth., Electric System General Rev. Bonds, Series 2017, 5.00% 2047 | | | 3,000 | | | | 3,361 | |
| American Funds Tax-Exempt Funds | 39 |
American Funds Tax-Exempt Fund of New York
| Bonds, notes & other debt instruments(continued) | Principal amount
(000) | | | Value
(000) | |
| New York (continued) | | | | | | |
| State issuers (continued) | | | | | | | | |
| Metropolitan Transportation Auth., Dedicated Tax Fund Rev. Ref. Bonds, Series 2002-B-3D, (SIFMA Municipal Swap Index + 1.00%) 2.43% 20202 | | $ | 2,000 | | | $ | 2,012 | |
| Metropolitan Transportation Auth., Transportation Rev. Bonds, Series 2014-D-1, 5.00% 2039 | | | 250 | | | | 273 | |
| Metropolitan Transportation Auth., Transportation Rev. Bonds, Series 2015-A-2, (SIFMA Municipal Swap Index + 0.58%) 2.01% 2039 (put 2020)2 | | | 500 | | | | 499 | |
| Metropolitan Transportation Auth., Transportation Rev. Bonds, Series 2015-C-1, 5.00% 2035 | | | 1,750 | | | | 1,951 | |
| Metropolitan Transportation Auth., Transportation Rev. Bonds, Series 2015-C-1, 5.25% 2030 | | | 280 | | | | 323 | |
| Metropolitan Transportation Auth., Transportation Rev. Green Bonds, Series 2017-A-1, 5.25% 2057 | | | 750 | | | | 836 | |
Metropolitan Transportation Auth., Transportation Rev. Ref. Bonds, Series 2002-D-2A, Assured Guaranty Municipal insured,
(1-month USD-LIBOR x 0.69 + 0.68%) 2.418% 2032 (put 2021)2 | | | 600 | | | | 604 | |
| Metropolitan Transportation Auth., Transportation Rev. Ref. Green Bonds, Series 2017-C-1, 4.00% 2034 | | | 1,000 | | | | 1,044 | |
| Metropolitan Transportation Auth., Transportation Rev. Ref. Green Bonds, Series 2017-C-1, 5.00% 2028 | | | 750 | | | | 887 | |
| Mortgage Agcy., Homeowner Mortgage Rev. Bonds, Series 178, 3.50% 2043 | | | 265 | | | | 272 | |
| Mortgage Agcy., Homeowner Mortgage Rev. Bonds, Series 191, AMT, 3.50% 2034 | | | 320 | | | | 326 | |
| Mortgage Agcy., Homeowner Mortgage Rev. Bonds, Series 194, AMT, 3.50% 2035 | | | 450 | | | | 460 | |
| Mortgage Agcy., Homeowner Mortgage Rev. Bonds, Series 195, 4.00% 2046 | | | 1,525 | | | | 1,590 | |
| Mortgage Agcy., Homeowner Mortgage Rev. Bonds, Series 197, 3.50% 2044 | | | 715 | | | | 738 | |
| Mortgage Agcy., Homeowner Mortgage Rev. Bonds, Series 200, 3.50% 2045 | | | 255 | | | | 262 | |
| Mortgage Agcy., Homeowner Mortgage Rev. Bonds, Series 203, 3.50% 2047 | | | 965 | | | | 999 | |
| Mortgage Agcy., Homeowner Mortgage Rev. Bonds, Series 206, AMT, 4.00% 2037 | | | 610 | | | | 639 | |
| Mortgage Agcy., Homeowner Mortgage Rev. Bonds, Series 208, 4.00% 2048 | | | 580 | | | | 611 | |
| Mortgage Agcy., Homeowner Mortgage Rev. Bonds, Series 213, 4.25% 2047 | | | 500 | | | | 538 | |
| Mortgage Agcy., Homeowner Mortgage Rev. Bonds, Series 46, 5.00% 2029 | | | 20 | | | | 20 | |
| Mortgage Agcy., Homeowner Mortgage Rev. Bonds, Series 48, 2.625% 2041 | | | 995 | | | | 998 | |
| Mortgage Agcy., Homeowner Mortgage Rev. Bonds, Series 52, AMT, 3.50% 2030 | | | 715 | | | | 732 | |
| Mortgage Agcy., Homeowner Mortgage Rev. Bonds, Series 54, 4.00% 2047 | | | 1,545 | | | | 1,622 | |
| Mortgage Agcy., Homeowner Mortgage Rev. Ref. Bonds, Series 45, 4.50% 2029 | | | 55 | | | | 56 | |
| Port Auth., Consolidated Bonds, Series 166, 5.00% 2031 | | | 1,000 | | | | 1,056 | |
| Port Auth., Consolidated Bonds, Series 205, 5.00% 2047 | | | 1,000 | | | | 1,135 | |
| Port Auth., Consolidated Rev. Ref. Bonds, Series 167, AMT, 5.00% 2025 | | | 1,000 | | | | 1,058 | |
| Port Auth., Consolidated Rev. Ref. Bonds, Series 172, AMT, 5.00% 2034 | | | 500 | | | | 533 | |
| Port Auth., Consolidated Rev. Ref. Bonds, Series 186, AMT, 5.00% 2044 | | | 500 | | | | 548 | |
| Power Auth., Rev. Ref. Bonds, Series 2011-A, 5.00% 2038 | | | 1,500 | | | | 1,621 | |
| Transportation Dev. Corp., Special Fac. Rev. Ref. Bonds (American Airlines, Inc. John F. Kennedy International Airport Project), Series 2016, AMT, 5.00% 2020 | | | 1,125 | | | | 1,164 | |
| Transportation Dev. Corp., Special Fac. Rev. Ref. Bonds (American Airlines, Inc. John F. Kennedy International Airport Project), Series 2016, AMT, 5.00% 2026 | | | 500 | | | | 524 | |
| Transportation Dev. Corp., Special Fac. Rev. Ref. Bonds (American Airlines, Inc. John F. Kennedy International Airport Project), Series 2016, AMT, 5.00% 2031 | | | 2,500 | | | | 2,592 | |
| Transportation Dev. Corp., Special Facs. Rev. Bonds (Delta Air Lines, Inc. LaGuardia Airport Terminals C & D Redev. Project), Series 2018, AMT, 5.00% 2030 | | | 1,500 | | | | 1,725 | |
| Urban Dev. Corp., State Personal Income Tax Rev. Bonds (General Purpose), Series 2014-A, 5.00% 2027 | | | 750 | | | | 858 | |
| Urban Dev. Corp., State Personal Income Tax Rev. Bonds (General Purpose), Series 2016-A, 5.00% 2026 | | | 1,500 | | | | 1,798 | |
| Urban Dev. Corp., State Personal Income Tax Rev. Bonds (General Purpose), Series 2016-A, 5.00% 2032 | | | 1,000 | | | | 1,150 | |
| Urban Dev. Corp., State Personal Income Tax Rev. Bonds (State Facs. and Equipment), Series 2009-B-1, 5.25% 2038 (preref. 2019) | | | 1,000 | | | | 1,004 | |
| Utility Debt Securitization Auth., Restructuring Bonds, Series 2016-A, 5.00% 2035 | | | 1,170 | | | | 1,349 | |
| Other securities | | | | | | | 45,550 | |
| | | | | | | | 113,450 | |
| 40 | American Funds Tax-Exempt Funds |
American Funds Tax-Exempt Fund of New York
| | Principal amount
(000) | | | Value
(000) | |
| City, county & other issuers 44.31% | | | | | | | | |
| Buffalo and Erie County Industrial Land Dev. Corp., Obligated Group Rev. Bonds (Catholic Health System, Inc. Project), Series 2015, 5.00% 2023 | | $ | 1,600 | | | $ | 1,783 | |
| Buffalo and Erie County Industrial Land Dev. Corp., Obligated Group Rev. Bonds (Catholic Health System, Inc. Project), Series 2015, 5.00% 2040 | | | 1,050 | | | | 1,122 | |
| Buffalo and Erie County Industrial Land Dev. Corp., Obligated Group Rev. Bonds (Catholic Health System, Inc. Project), Series 2015, 5.25% 2035 | | | 500 | | | | 549 | |
| Buffalo and Erie County Industrial Land Dev. Corp., Rev. Bonds (Buffalo State College Foundation Housing Corp. Project), Series 2011-A, 5.375% 2041 | | | 1,400 | | | | 1,497 | |
| Build NYC Resource Corp., Rev. Bonds (Bronx Charter School for Excellence Project), Series 2013-A, 4.00% 2019 | | | 485 | | | | 486 | |
| Build NYC Resource Corp., Rev. Bonds (Bronx Charter School for Excellence Project), Series 2013-A, 4.00% 2021 | | | 525 | | | | 536 | |
| Build NYC Resource Corp., Rev. Bonds (Bronx Charter School for Excellence Project), Series 2013-A, 4.00% 2022 | | | 545 | | | | 560 | |
| Build NYC Resource Corp., Rev. Bonds (Bronx Charter School for Excellence Project), Series 2013-A, 5.50% 2043 | | | 1,000 | | | | 1,045 | |
| Village of Dobbs Ferry, Local Dev. Corp., Rev. Bonds (Mercy College Project), Series 2014, 5.00% 2039 | | | 1,625 | | | | 1,794 | |
| County of Dutchess, Local Dev. Corp., Rev. Bonds (Health Quest Systems, Inc. Project), Series 2016-B, 4.00% 2041 | | | 750 | | | | 753 | |
| County of Dutchess, Local Dev. Corp., Rev. Ref. Bonds (Health Quest Systems, Inc. Project), Series 2010, 5.75% 2030 | | | 500 | | | | 531 | |
| County of Dutchess, Local Dev. Corp., Rev. Ref. Bonds (Health Quest Systems, Inc. Project), Series 2010, 5.75% 2040 | | | 1,000 | | | | 1,059 | |
| County of Dutchess, Local Dev. Corp., Rev. Ref. Bonds (Health Quest Systems, Inc. Project), Series 2014-A, 5.00% 2028 | | | 430 | | | | 486 | |
| Hudson Yards Infrastructure Corp., Rev. Bonds, Fiscal 2012, Series 2012-A, 5.25% 2047 | | | 955 | | | | 1,012 | |
| Hudson Yards Infrastructure Corp., Rev. Bonds, Fiscal 2012, Series 2012-A, 5.25% 2047 (preref. 2021) | | | 45 | | | | 48 | |
| Hudson Yards Infrastructure Corp., Rev. Bonds, Fiscal 2012, Series 2012-A, 5.75% 2047 | | | 435 | | | | 467 | |
| Hudson Yards Infrastructure Corp., Rev. Bonds, Fiscal 2012, Series 2012-A, 5.75% 2047 (preref. 2021) | | | 565 | | | | 612 | |
| Hudson Yards Infrastructure Corp., Rev. Bonds, Fiscal 2017, Series 2017-A, 5.00% 2033 | | | 2,700 | | | | 3,133 | |
| Hudson Yards Infrastructure Corp., Rev. Bonds, Fiscal 2017, Series 2017-A, 5.00% 2035 | | | 1,000 | | | | 1,147 | |
| County of Nassau, G.O. Bonds, Series 2014-A, 5.00% 2028 | | | 1,250 | | | | 1,405 | |
| County of Nassau, G.O. Bonds, Series 2016-B, 5.00% 2025 | | | 1,000 | | | | 1,178 | |
| County of Nassau, G.O. General Improvement Rev. Ref. Bonds, Series 2016-A, 5.00% 2027 | | | 500 | | | | 584 | |
| County of Nassau, G.O. General Improvement Rev. Ref. Bonds, Series 2016-A, 5.00% 2030 | | | 1,795 | | | | 2,061 | |
| New York City G.O. Bonds, Fiscal 2015, Series 2015-C, 5.00% 2033 | | | 1,000 | | | | 1,139 | |
| New York City G.O. Bonds, Fiscal 2016, Series 2016-A, 5.00% 2026 | | | 1,000 | | | | 1,182 | |
| New York City G.O. Bonds, Fiscal 2016, Series 2016-C, 5.00% 2031 | | | 1,000 | | | | 1,154 | |
| New York City G.O. Bonds, Fiscal 2017, Series 2017-A-1, 5.00% 2034 | | | 1,000 | | | | 1,148 | |
| New York City G.O. Bonds, Fiscal 2018, Series 2018-A, 5.00% 2027 | | | 1,500 | | | | 1,830 | |
| New York City G.O. Bonds, Fiscal 2018, Series 2018-C, 5.00% 2031 | | | 1,000 | | | | 1,190 | |
| New York City G.O. Bonds, Fiscal 2018, Series 2018-C, 5.00% 2032 | | | 1,720 | | | | 2,034 | |
| New York City G.O. Bonds, Fiscal 2018, Series 2018-E-1, 5.00% 2037 | | | 1,150 | | | | 1,332 | |
| New York City Housing Dev. Corp., Multi Family Housing Rev. Bonds (Sustainable Neighborhood Bonds), Series 2015-H, 2.95% 2045 (put 2026) | | | 750 | | | | 756 | |
| New York City Housing Dev. Corp., Multi Family Housing Rev. Bonds (Sustainable Neighborhood Bonds), Series 2017-A-1-A, 3.80% 2037 | | | 885 | | | | 892 | |
| New York City Housing Dev. Corp., Multi Family Housing Rev. Bonds (Sustainable Neighborhood Bonds), Series 2017-C-2, 1.70% 2021 | | | 400 | | | | 396 | |
| New York City Housing Dev. Corp., Multi Family Housing Rev. Bonds (Sustainable Neighborhood Bonds), Series 2017-G-2-A, 2.00% 2057 (put 2021) | | | 750 | | | | 748 | |
| New York City Housing Dev. Corp., Multi Family Rev. Bonds (8 Spruce Street), Series 2014-E, 3.50% 2048 | | | 1,670 | | | | 1,679 | |
| New York City Municipal Water Fin. Auth., Water and Sewer System Second General Resolution Rev. Bonds, Fiscal 2011, Series 2011-EE, 5.375% 2043 | | | 1,000 | | | | 1,063 | |
| New York City Municipal Water Fin. Auth., Water and Sewer System Second General Resolution Rev. Bonds, Fiscal 2015, Series 2015-EE, 5.00% 2045 | | | 500 | | | | 553 | |
| New York City Municipal Water Fin. Auth., Water and Sewer System Second General Resolution Rev. Bonds, Fiscal 2015, Series 2015-HH, 5.00% 2039 | | | 500 | | | | 562 | |
| New York City Municipal Water Fin. Auth., Water and Sewer System Second General Resolution Rev. Bonds, Fiscal 2017, Series 2017-DD, 5.00% 2047 | | | 1,055 | | | | 1,189 | |
| American Funds Tax-Exempt Funds | 41 |
American Funds Tax-Exempt Fund of New York
| Bonds, notes & other debt instruments (continued) | Principal amount
(000) | | | Value
(000) | |
| New York (continued) | | | | | | |
| City, county & other issuers (continued) | | | | | | | | |
| New York City Municipal Water Fin. Auth., Water and Sewer System Second General Resolution Rev. Bonds, Fiscal 2017, Series 2017-EE, 5.00% 2033 | | $ | 750 | | | $ | 880 | |
| New York City Municipal Water Fin. Auth., Water and Sewer System Second General Resolution Rev. Bonds, Fiscal 2018, Series 2018-BB-1, 5.00% 2046 | | | 1,250 | | | | 1,413 | |
| New York City Municipal Water Fin. Auth., Water and Sewer System Second General Resolution Rev. Bonds, Fiscal 2018, Series 2018-EE, 5.00% 2040 | | | 2,000 | | | | 2,292 | |
| New York City Municipal Water Fin. Auth., Water and Sewer System Second General Resolution Rev. Bonds, Fiscal 2019, Series 2019-DD-1, 5.25% 2049 | | | 1,500 | | | | 1,743 | |
| New York City Municipal Water Fin. Auth., Water and Sewer System Second General Resolution Rev. Ref. Bonds, Fiscal 2017, Series 2017-EE, 5.00% 2036 | | | 750 | | | | 867 | |
| New York City Transitional Fin. Auth., Building Aid Rev. Bonds, Fiscal 2019, Series 2019-S-1, 5.00% 2043 | | | 1,000 | | | | 1,135 | |
| New York City Transitional Fin. Auth., Building Aid Rev. Bonds, Fiscal 2019, Series 2019-S-3, 5.00% 2036 | | | 1,000 | | | | 1,161 | |
| New York City Transitional Fin. Auth., Future Tax Secured Bonds, Fiscal 2011, Series 2011-C, 5.25% 2025 | | | 700 | | | | 742 | |
| New York City Transitional Fin. Auth., Future Tax Secured Bonds, Fiscal 2011, Series 2011-C, 5.25% 2025 (preref. 2020) | | | 300 | | | | 319 | |
| New York City Transitional Fin. Auth., Future Tax Secured Bonds, Fiscal 2017, Series 2017-C, 5.00% 2032 | | | 1,000 | | | | 1,169 | |
| New York City Transitional Fin. Auth., Future Tax Secured Bonds, Fiscal 2017, Series 2017-E-1, 5.00% 2043 | | | 1,000 | | | | 1,125 | |
| New York City Transitional Fin. Auth., Future Tax Secured Bonds, Fiscal 2017, Series 2017-F-1, 5.00% 2039 | | | 750 | | | | 853 | |
| New York City Transitional Fin. Auth., Future Tax Secured Bonds, Fiscal 2017, Series 2017-F-1, 5.00% 2042 | | | 1,000 | | | | 1,129 | |
| New York City Transitional Fin. Auth., Future Tax Secured Bonds, Fiscal 2018, Series 2018-A-3, 4.00% 2042 | | | 1,080 | | | | 1,115 | |
| New York City Transitional Fin. Auth., Future Tax Secured Bonds, Fiscal 2019, Series 2019-A-1, 5.00% 2036 | | | 2,380 | | | | 2,781 | |
| New York City Transitional Fin. Auth., Future Tax Secured Rev. Ref. Bonds, Fiscal 2016, Series 2016-C, 5.00% 2026 | | | 1,000 | | | | 1,189 | |
| County of Onondaga, Resource Recovery Agcy., Rev. Ref. Bonds, Series 2015-A, AMT, Assured Guaranty Municipal insured, 5.00% 2030 | | | 1,750 | | | | 1,951 | |
| Town of Southold, Local Dev. Corporation, Rev. Bonds (Peconic Landing at Southold, Inc. Project), Series 2015, 5.00% 2045 | | | 1,500 | | | | 1,536 | |
| County of Suffolk, Econ. Dev. Corp., Rev. Ref. Bonds (Peconic Landing at Southold, Inc. Project), Series 2010, 5.875% 2030 | | | 1,000 | | | | 1,053 | |
| County of Westchester, Health Care Corp., Rev. Bonds, Series 2010-B, 6.00% 2030 | | | 130 | | | | 138 | |
| County of Westchester, Health Care Corp., Rev. Bonds, Series 2010-B, 6.00% 2030 (preref. 2020) | | | 870 | | | | 934 | |
| County of Westchester, Health Care Corp., Rev. Bonds, Series 2011-A, 5.00% 2021 | | | 100 | | | | 107 | |
| County of Westchester, Local Dev. Corp., Rev. Bonds (Westchester Medical Center Obligated Group Project), Series 2016, 5.00% 2034 | | | 1,150 | | | | 1,256 | |
| County of Westchester, Local Dev. Corp., Rev. Bonds (Westchester Medical Center Obligated Group Project), Series 2016, 5.00% 2046 | | | 1,000 | | | | 1,062 | |
| Other securities | | | | | | | 38,635 | |
| | | | | | | | 109,280 | |
| | | | | | | | | |
| Other U.S. Territories 2.23% | | | | | | | | |
| Other securities | | | | | | | 5,491 | |
| | | | | | | | | |
| Total bonds, notes & other debt instruments(cost: $224,683,000) | | | | | | | 228,221 | |
| 42 | American Funds Tax-Exempt Funds |
American Funds Tax-Exempt Fund of New York
| Short-term securities 7.01% | Principal amount
(000) | | | Value
(000) | |
| Dormitory Auth., IAM Commercial Paper, Series 2002-C, 1.72% 2/5/2019 | | $ | 2,000 | | | $ | 2,000 | |
| Dormitory Auth., IAM Commercial Paper, Series 2002-C, 1.77% 3/4/2019 | | | 2,000 | | | | 2,000 | |
| Environmental Facs. Corp., Solid Waste Disposal Rev. Ref. Bonds (Waste Management, Inc. Project), Series 2012, AMT, 2.15% 2030 (put 2019)3 | | | 3,000 | | | | 3,000 | |
| Metropolitan Transportation Auth., Transportation Rev. Bond Anticipation Notes, Series 2018-A-1, 4.00% 8/15/2019 | | | 1,500 | | | | 1,517 | |
| New York City G.O. Bonds, Fiscal 2006, Series 2006-H-1, 1.63% 20362 | | | 1,000 | | | | 1,000 | |
| New York City Transitional Fin. Auth., Future Tax Secured Subordinate Bonds, Fiscal 2019, Series 2019-A-4, 1.63% 20452 | | | 4,000 | | | | 4,000 | |
| City of Syracuse, Industrial Dev. Agcy., Civic Fac. Rev. Bonds (Syracuse University Project), Series 2008-A-1, 1.58% 20372 | | | 1,055 | | | | 1,055 | |
| City of Syracuse, Industrial Dev. Agcy., Civic Fac. Rev. Bonds (Syracuse University Project), Series 2008-A-2, JPMorgan Chase LOC, 1.58% 20372 | | | 2,400 | | | | 2,400 | |
| Other securities | | | | | | | 300 | |
| | | | | | | | | |
| Total short-term securities (cost: $17,274,000) | | | | | | | 17,272 | |
| Total investment securities 99.56% (cost: $241,957,000) | | | | | | | 245,493 | |
| Other assets less liabilities 0.44% | | | | | | | 1,094 | |
| | | | | | | | | |
| Net assets 100.00% | | | | | | $ | 246,587 | |
This summary investment portfolio is designed to streamline the report and help investors better focus on the fund’s principal holdings. See the inside back cover for details on how to obtain a complete schedule of portfolio holdings.
“Other securities” includes all issues that are not disclosed separately in the summary investment portfolio.
| 1 | Acquired in a transaction exempt from registration under Rule 144A of the Securities Act of 1933. May be resold in the U.S. in transactions exempt from registration, normally to qualified institutional buyers. The total value of all such securities, including those in “Other securities,” was $10,170,000, which represented 4.12% of the net assets of the fund. |
| 2 | Coupon rate may change periodically. For short-term securities, the date of the next scheduled coupon rate change is considered to be the maturity date. |
| 3 | For short-term securities, the mandatory put date is considered to be the maturity date. |
Key to abbreviations and symbol
Agcy. = Agency
AMT = Alternative Minimum Tax
Auth. = Authority
Certs. of Part. = Certificates of Participation
Dept. = Department
Dev. = Development
Dist. = District
Econ. = Economic
Fac. = Facility
Facs. = Facilities
Fin. = Finance
Fncg. = Financing
G.O. = General Obligation
LIBOR = London Interbank Offered Rate
LOC = Letter of Credit
Preref. = Prerefunded
Redev. = Redevelopment
Ref. = Refunding
Rev. = Revenue
SIFMA = Securities Industry and Financial Markets Association
USD/$ = U.S. dollars
| American Funds Tax-Exempt Funds | 43 |
Financial statements
Statements of assets and liabilities
atJanuary 31, 2019
| | | American Funds
Short-Term
Tax-Exempt Bond Fund | | | Limited Term
Tax-Exempt Bond
Fund of America |
| Assets: | | | | | | | | |
| Investment securities in unaffiliated issuers, at value | | $ | 1,175,773 | | | $ | 4,080,412 | |
| Cash | | | 256 | | | | 668 | |
| Cash pledged for futures contracts | | | 292 | | | | 778 | |
| Receivables for: | | | | | | | | |
| Sales of investments | | | — | | | | 10,703 | |
| Sales of fund’s shares | | | 2,021 | | | | 12,334 | |
| Interest | | | 9,006 | | | | 35,487 | |
| Variation margin on futures contracts | | | 154 | | | | 443 | |
| Other | | | 128 | | | | 492 | |
| | | | 1,187,630 | | | | 4,141,317 | |
| | | | | | | | | |
| Liabilities: | | | | | | | | |
| Payables for: | | | | | | | | |
| Purchases of investments | | | 44,137 | | | | 120,892 | |
| Repurchases of fund’s shares | | | 3,672 | | | | 6,006 | |
| Dividends on fund’s shares | | | 41 | | | | 519 | |
| Investment advisory services | | | 349 | | | | 782 | |
| Services provided by related parties | | | 49 | | | | 784 | |
| Trustees’ deferred compensation | | | 31 | | | | 133 | |
| Variation margin on futures contracts | | | 42 | | | | 214 | |
| Other | | | — | * | | | 1 | |
| | | | 48,321 | | | | 129,331 | |
| Net assets at January 31, 2019 | | $ | 1,139,309 | | | $ | 4,011,986 | |
| | | | | | | | | |
| Net assets consist of: | | | | | | | | |
| Capital paid in on shares of beneficial interest | | $ | 1,144,320 | | | $ | 3,982,882 | |
| Total (accumulated loss) distributable earnings | | | (5,011 | ) | | | 29,104 | |
| Net assets at January 31, 2019 | | $ | 1,139,309 | | | $ | 4,011,986 | |
| | | | | | | | | |
| Investment securities in unaffiliated issuers, at cost | | $ | 1,175,921 | | | $ | 4,049,018 | |
| * | Amount less than one thousand. |
See notes to financial statements
| 44 | American Funds Tax-Exempt Funds |
unaudited
(dollars in thousands)
The Tax-Exempt
Bond Fund
of America | | | American
High-Income
Municipal Bond Fund | | | The Tax-Exempt
Fund of
California | | | American Funds
Tax-Exempt Fund
of New York | |
| | | | | | | | | | | |
| $ | 18,974,418 | | | $ | 6,758,343 | | | $ | 2,293,593 | | | $ | 245,493 | |
| | 1,867 | | | | 1,082 | | | | 171 | | | | 77 | |
| | 2,451 | | | | 1,693 | | | | — | | | | — | |
| | | | | | | | | | | | | | | |
| | 28,012 | | | | 9,992 | | | | 14,898 | | | | — | |
| | 95,300 | | | | 13,781 | | | | 4,190 | | | | 914 | |
| | 179,254 | | | | 65,351 | | | | 27,648 | | | | 2,451 | |
| | 1,703 | | | | 160 | | | | — | | | | — | |
| | 2,531 | | | | 1,072 | | | | 328 | | | | 33 | |
| | 19,285,536 | | | | 6,851,474 | | | | 2,340,828 | | | | 248,968 | |
| | | | | | | | | | | | | | | |
| | 210,926 | | | | 64,829 | | | | 39,029 | | | | 2,000 | |
| | 36,528 | | | | 10,719 | | | | 4,636 | | | | 131 | |
| | 2,480 | | | | 1,695 | | | | 700 | | | | 112 | |
| | 3,351 | | | | 1,612 | | | | 565 | | | | 69 | |
| | 2,385 | | | | 1,294 | | | | 377 | | | | 50 | |
| | 615 | | | | 125 | | | | 129 | | | | 1 | |
| | 1,575 | | | | 624 | | | | — | | | | — | |
| | 8 | | | | 2 | | | | 1 | | | | 18 | |
| | 257,868 | | | | 80,900 | | | | 45,437 | | | | 2,381 | |
| $ | 19,027,668 | | | $ | 6,770,574 | | | $ | 2,295,391 | | | $ | 246,587 | |
| | | | | | | | | | | | | | | |
| $ | 18,752,162 | | | $ | 6,692,941 | | | $ | 2,250,366 | | | $ | 243,006 | |
| | 275,506 | | | | 77,633 | | | | 45,025 | | | | 3,581 | |
| $ | 19,027,668 | | | $ | 6,770,574 | | | $ | 2,295,391 | | | $ | 246,587 | |
| | | | | | | | | | | | | | | |
| $ | 18,700,643 | | | $ | 6,659,510 | | | $ | 2,245,785 | | | $ | 241,957 | |
| American Funds Tax-Exempt Funds | 45 |
Statements of assets and liabilities
at January 31, 2019
| | | | | American Funds
Short-Term
Tax-Exempt Bond Fund | | | Limited Term
Tax-Exempt Bond
Fund of America | |
| | | | | | | |
Shares of beneficial interest issued and outstanding
(no stated par value) — unlimited shares authorized | | | | | | |
| | | | | | | |
| Class A: | | Net assets | | $ | 784,202 | | | $ | 2,945,319 | |
| | | Shares outstanding | | | 77,980 | | | | 188,970 | |
| | | Net asset value per share | | $ | 10.06 | | | $ | 15.59 | |
| Class C: | | Net assets | | | | | | $ | 20,243 | |
| | | Shares outstanding | | | Not applicable | | | | 1,299 | |
| | | Net asset value per share | | | | | | $ | 15.59 | |
| Class T: | | Net assets | | $ | 10 | | | $ | 10 | |
| | | Shares outstanding | | | 1 | | | | 1 | |
| | | Net asset value per share | | $ | 10.06 | | | $ | 15.59 | |
| Class F-1: | | Net assets | | $ | 7,238 | | | $ | 56,546 | |
| | | Shares outstanding | | | 720 | | | | 3,628 | |
| | | Net asset value per share | | $ | 10.06 | | | $ | 15.59 | |
| Class F-2: | | Net assets | | $ | 179,945 | | | $ | 450,950 | |
| | | Shares outstanding | | | 17,893 | | | | 28,933 | |
| | | Net asset value per share | | $ | 10.06 | | | $ | 15.59 | |
| Class F-3: | | Net assets | | $ | 42,388 | | | $ | 245,868 | |
| | | Shares outstanding | | | 4,215 | | | | 15,774 | |
| | | Net asset value per share | | $ | 10.06 | | | $ | 15.59 | |
| Class R-6: | | Net assets | | $ | 125,526 | | | $ | 293,050 | |
| | | Shares outstanding | | | 12,482 | | | | 18,802 | |
| | | Net asset value per share | | $ | 10.06 | | | $ | 15.59 | |
See notes to financial statements
| 46 | American Funds Tax-Exempt Funds |
unaudited
(dollars and shares in thousands, except per-share amounts)
The Tax-Exempt
Bond Fund
of America | | | American
High-Income
Municipal Bond Fund | | | The Tax-Exempt
Fund of
California | | | American Funds
Tax-Exempt Fund
of New York | |
| | | | | | | | | | | |
| $ | 9,924,960 | | | $ | 4,124,866 | | | $ | 1,626,350 | | | $ | 177,453 | |
| | 773,853 | | | | 263,039 | | | | 93,377 | | | | 16,706 | |
| $ | 12.83 | | | $ | 15.68 | | | $ | 17.42 | | | $ | 10.62 | |
| $ | 397,593 | | | $ | 226,896 | | | $ | 65,765 | | | $ | 11,148 | |
| | 31,000 | | | | 14,469 | | | | 3,776 | | | | 1,050 | |
| $ | 12.83 | | | $ | 15.68 | | | $ | 17.42 | | | $ | 10.62 | |
| $ | 10 | | | $ | 10 | | | $ | 10 | | | $ | 10 | |
| | 1 | | | | 1 | | | | 1 | | | | 1 | |
| $ | 12.83 | | | $ | 15.68 | | | $ | 17.42 | | | $ | 10.62 | |
| $ | 329,985 | | | $ | 171,663 | | | $ | 68,987 | | | $ | 1,831 | |
| | 25,729 | | | | 10,947 | | | | 3,961 | | | | 172 | |
| $ | 12.83 | | | $ | 15.68 | | | $ | 17.42 | | | $ | 10.62 | |
| $ | 2,305,622 | | | $ | 951,911 | | | $ | 355,931 | | | $ | 26,943 | |
| | 179,770 | | | | 60,703 | | | | 20,436 | | | | 2,537 | |
| $ | 12.83 | | | $ | 15.68 | | | $ | 17.42 | | | $ | 10.62 | |
| $ | 5,488,191 | | | $ | 713,735 | | | $ | 178,348 | | | $ | 29,202 | |
| | 427,915 | | | | 45,514 | | | | 10,239 | | | | 2,749 | |
| $ | 12.83 | | | $ | 15.68 | | | $ | 17.42 | | | $ | 10.62 | |
| $ | 581,307 | | | $ | 581,493 | | | | | | | | | |
| | 45,325 | | | | 37,081 | | | | Not applicable | | | | Not applicable | |
| $ | 12.83 | | | $ | 15.68 | | | | | | | | | |
| American Funds Tax-Exempt Funds | 47 |
Statements of operations
for the six months ended January 31, 2019
| | | American Funds
Short-Term
Tax-Exempt Bond Fund | | | Limited Term
Tax-Exempt Bond
Fund of America | |
| | | | | | | |
| Investment income: | | | | | | | | |
| Income: | | | | | | | | |
| Interest | | $ | 11,106 | | | $ | 51,968 | |
| | | | | | | | | |
| Fees and expenses*: | | | | | | | | |
| Investment advisory services | | | 1,873 | | | | 4,541 | |
| Distribution services | | | 565 | | | | 4,545 | |
| Transfer agent services | | | 183 | | | | 825 | |
| Administrative services | | | 114 | | | | 398 | |
| Reports to shareholders | | | 12 | | | | 53 | |
| Registration statement and prospectus | | | 161 | | | | 252 | |
| Trustees’ compensation | | | 2 | | | | 7 | |
| Auditing and legal | | | 1 | | | | 2 | |
| Custodian | | | 1 | | | | 5 | |
| Federal, state and local taxes | | | 1 | | | | 7 | |
| Other | | | 2 | | | | 7 | |
| Total fees and expenses | | | 2,915 | | | | 10,642 | |
| Net investment income | | | 8,191 | | | | 41,326 | |
| | | | | | | | | |
| Net realized (loss) gain and unrealized appreciation (depreciation): | | | | | | | | |
| Net realized (loss) gain on: | | | | | | | | |
| Investments in unaffiliated issuers | | | (1,819 | ) | | | (3,707 | ) |
| Futures contracts | | | (211 | ) | | | (113 | ) |
| | | | (2,030 | ) | | | (3,820 | ) |
| | | | | | | | | |
| Net unrealized appreciation (depreciation) on: | | | | | | | | |
| Investments in unaffiliated issuers | | | 4,530 | | | | 19,251 | |
| Futures contracts | | | 543 | | | | 1,351 | |
| | | | 5,073 | | | | 20,602 | |
| Net realized (loss) gain and unrealized appreciation (depreciation) | | | 3,043 | | | | 16,782 | |
| Net increase in net assets resulting from operations | | $ | 11,234 | | | $ | 58,108 | |
| * | Additional information related to class-specific fees and expenses is included in the notes to financial statements. |
| † | Amount less than one thousand. |
See notes to financial statements
| 48 | American Funds Tax-Exempt Funds |
unaudited
(dollars in thousands)
The Tax-Exempt
Bond Fund
of America | | | American
High-Income
Municipal Bond Fund | | | The Tax-Exempt
Fund of
California | | | American Funds
Tax-Exempt Fund
of New York | |
| | | | | | | | | | | | | | | |
| $ | 327,180 | | | $ | 147,074 | | | $ | 40,293 | | | $ | 4,000 | |
| | | | | | | | | | | | | | | |
| | 19,957 | | | | 9,368 | | | | 3,327 | | | | 402 | |
| | 14,963 | | | | 7,493 | | | | 2,478 | | | | 283 | |
| | 3,415 | | | | 1,698 | | | | 389 | | | | 42 | |
| | 2,763 | | | | 845 | | | | 239 | | | | 25 | |
| | 280 | | | | 116 | | | | 19 | | | | 3 | |
| | 1,264 | | | | 490 | | | | 105 | | | | 67 | |
| | 10 | | | | 26 | | | | — | † | | | 1 | |
| | 9 | | | | 5 | | | | 2 | | | | 1 | |
| | 26 | | | | 11 | | | | 3 | | | | — | † |
| | 801 | | | | 1,705 | | | | 162 | | | | 1 | |
| | 26 | | | | 65 | | | | 4 | | | | 19 | |
| | 43,514 | | | | 21,822 | | | | 6,728 | | | | 844 | |
| | 283,666 | | | | 125,252 | | | | 33,565 | | | | 3,156 | |
| | | | | | | | | | | | | | | |
| | (8,255 | ) | | | (6,805 | ) | | | (4,362 | ) | | | 32 | |
| | 9,499 | | | | 1,514 | | | | — | | | | — | |
| | 1,244 | | | | (5,291 | ) | | | (4,362 | ) | | | 32 | |
| | | | | | | | | | | | | | | |
| | 18,210 | | | | (36,267 | ) | | | 2,129 | | | | 246 | |
| | (2,311 | ) | | | (2,893 | ) | | | — | | | | — | |
| | 15,899 | | | | (39,160 | ) | | | 2,129 | | | | 246 | |
| | 17,143 | | | | (44,451 | ) | | | (2,233 | ) | | | 278 | |
| $ | 300,809 | | | $ | 80,801 | | | $ | 31,332 | | | $ | 3,434 | |
| American Funds Tax-Exempt Funds | 49 |
Statements of changes in net assets
| | | American Funds
Short-Term
Tax-Exempt Bond Fund | | | Limited Term
Tax-Exempt Bond
Fund of America | | | The Tax-Exempt
Bond Fund
of America | |
| | | Six months
ended
January 31
2019* | | | Year ended
July 31
2018 | | | Six months
ended
January 31
2019* | | | Year ended
July 31
2018 | | | Six months
ended
January 31
2019* | | | Year ended
July 31
2018 | |
| Operations: | | | | | | | | | | | | | | | | | | | | | | | | |
| Net investment income | | $ | 8,191 | | | $ | 13,449 | | | $ | 41,326 | | | $ | 81,421 | | | $ | 283,666 | | | $ | 497,672 | |
| Net realized (loss) gain | | | (2,030 | ) | | | (1,290 | ) | | | (3,820 | ) | | | 127 | | | | 1,244 | | | | 21,037 | |
| Net unrealized appreciation (depreciation) | | | 5,073 | | | | (10,029 | ) | | | 20,602 | | | | (65,002 | ) | | | 15,899 | | | | (262,868 | ) |
| Net increase in net assets resulting from operations | | | 11,234 | | | | 2,130 | | | | 58,108 | | | | 16,546 | | | | 300,809 | | | | 255,841 | |
| | | | | | | | | | | | | | | | | | | | | | | | | |
| Distributions paid or accrued to shareholders | | | (8,172 | ) | | | (13,421 | ) | | | (41,200 | ) | | | (81,415 | ) | | | (282,153 | ) | | | (496,829 | ) |
| | | | | | | | | | | | | | | | | | | | | | | | | |
| Net capital share transactions | | | 158,060 | | | | (9,712 | ) | | | 29,767 | | | | 167,187 | | | | (19,050 | ) | | | 4,798,328 | |
| | | | | | | | | | | | | | | | | | | | | | | | | |
| Total increase (decrease) in net assets | | | 161,122 | | | | (21,003 | ) | | | 46,675 | | | | 102,318 | | | | (394 | ) | | | 4,557,340 | |
| | | | | | | | | | | | | | | | | | | | | | | | | |
| Net assets: | | | | | | | | | | | | | | | | | | | | | | | | |
| Beginning of period | | | 978,187 | | | | 999,190 | | | | 3,965,311 | | | | 3,862,993 | | | | 19,028,062 | | | | 14,470,722 | |
| End of period | | $ | 1,139,309 | | | $ | 978,187 | | | $ | 4,011,986 | | | $ | 3,965,311 | | | $ | 19,027,668 | | | $ | 19,028,062 | |
See notes to financial statements
| 50 | American Funds Tax-Exempt Funds |
(dollars and shares in thousands)
American
High-Income
Municipal Bond Fund | | | The Tax-Exempt
Fund of
California | | | American Funds
Tax-Exempt Fund
of New York | |
| Six months | | | | | | Six months | | | | | | Six months | | | | |
| ended | | | Year ended | | | ended | | | Year ended | | | ended | | | Year ended | |
| January 31 | | | July 31 | | | January 31 | | | July 31 | | | January 31 | | | July 31 | |
| 2019* | | | 2018 | | | 2019* | | | 2018 | | | 2019* | | | 2018 | |
| | | | | | | | | | | | | | | | | | | | | | | |
| $ | 125,252 | | | $ | 227,543 | | | $ | 33,565 | | | $ | 63,832 | | | $ | 3,156 | | | $ | 5,760 | |
| | (5,291 | ) | | | 48,562 | | | | (4,362 | ) | | | 7,138 | | | | 32 | | | | 132 | |
| | (39,160 | ) | | | (37,622 | ) | | | 2,129 | | | | (32,836 | ) | | | 246 | | | | (4,196 | ) |
| | 80,801 | | | | 238,483 | | | | 31,332 | | | | 38,134 | | | | 3,434 | | | | 1,696 | |
| | | | | | | | | | | | | | | | | | | | | | | |
| | (123,470 | ) | | | (224,199 | ) | | | (33,357 | ) | | | (63,679 | ) | | | (3,135 | ) | | | (5,766 | ) |
| | | | | | | | | | | | | | | | | | | | | | | |
| | 321,827 | | | | 963,626 | | | | 42,054 | | | | 157,339 | | | | 7,787 | | | | 31,122 | |
| | | | | | | | | | | | | | | | | | | | | | | |
| | 279,158 | | | | 977,910 | | | | 40,029 | | | | 131,794 | | | | 8,086 | | | | 27,052 | |
| | | | | | | | | | | | | | | | | | | | | | | |
| | 6,491,416 | | | | 5,513,506 | | | | 2,255,362 | | | | 2,123,568 | | | | 238,501 | | | | 211,449 | |
| $ | 6,770,574 | | | $ | 6,491,416 | | | $ | 2,295,391 | | | $ | 2,255,362 | | | $ | 246,587 | | | $ | 238,501 | |
| American Funds Tax-Exempt Funds | 51 |
| Notes to financial statements | unaudited |
1. Organization
American Funds Short-Term Tax-Exempt Bond Fund, Limited Term Tax-Exempt Bond Fund of America, The Tax-Exempt Bond Fund of America, American High-Income Municipal Bond Fund, The Tax-Exempt Fund of California, which is presently the only series of The American Funds Tax-Exempt Series II, and American Funds Tax-Exempt Fund of New York (each a “fund” or collectively, the “funds”), are registered under the Investment Company Act of 1940 as open-end, diversified management investment companies.
Each fund’s investment objectives are as follows:
American Funds Short-Term Tax-Exempt Bond Fund— Seeks to provide current income exempt from regular federal income tax, consistent with the maturity and quality standards described in the prospectus, and to preserve capital.
Limited Term Tax-Exempt Bond Fund of America— Seeks to provide current income exempt from regular federal income tax, consistent with the maturity and quality standards described in the prospectus, and to preserve capital.
The Tax-Exempt Bond Fund of America— Seeks to provide a high level of current income exempt from federal income tax, consistent with the preservation of capital.
American High-Income Municipal Bond Fund— Seeks to provide a high level of current income exempt from regular federal income tax.
The Tax-Exempt Fund of California— Seeks to provide a high level of current income exempt from regular federal and California state income taxes. Its secondary objective is preservation of capital.
American Funds Tax-Exempt Fund of New York— Seeks to provide a high level of current income exempt from regular federal, New York state and New York City income taxes. Its secondary objective is preservation of capital.
American Funds Short-Term Tax-Exempt Bond Fund has six share classes consisting of five retail share classes (Classes A and T, as well as three F share classes, F-1, F-2 and F-3) and one share class that is only available to the American Funds Portfolio Series (Class R-6). Limited Term Tax-Exempt Bond Fund of America, The Tax-Exempt Bond Fund of America and American High-Income Municipal Bond Fund each have seven share classes consisting of six retail share classes (Classes A, C and T, as well as three F share classes, F-1, F-2 and F-3) and one share class that is only available to the American Funds Portfolio Series (Class R-6). The Tax-Exempt Fund of California and American Funds Tax-Exempt Fund of New York each have six retail share classes (Classes A, C and T, as well as three F share classes, F-1, F-2 and F-3). Some share classes are only available to limited categories of investors. The funds’ share classes are described further in the following table:
| Share class | | Initial sales charge | | Contingent deferred sales
charge upon redemption | | Conversion feature |
| Class A | | Up to 2.50% for American Funds Short-Term Tax-Exempt Bond Fund and Limited Term Tax-Exempt Bond Fund of America; up to 3.75% for all other funds | | None (except 1% for certain redemptions within 18 months of purchase without an initial sales charge) | | None |
| Class C* | | None | | 1% for redemptions within one year of purchase | | Class C converts to Class F-1 after 10 years |
| Class T† | | Up to 2.50% | | None | | None |
| Classes F-1, F-2 and F-3 | | None | | None | | None |
| Class R-6 | | None | | None | | None |
| * | Class C shares are not available for purchase in Limited Term Tax-Exempt Bond Fund of America. |
| † | Class T shares are not available for purchase. |
Holders of all share classes of each fund have equal pro rata rights to the assets, dividends and liquidation proceeds of each fund held. Each share class of each fund has identical voting rights, except for the exclusive right to vote on matters affecting only its class. Share classes have different fees and expenses (“class-specific fees and expenses”), primarily due to different arrangements for distribution, transfer agent and administrative services. Differences in class-specific fees and expenses will result in differences in net investment income and, therefore, the payment of different per-share dividends by each share class of each fund.
| 52 | American Funds Tax-Exempt Funds |
2. Significant accounting policies
Each fund is an investment company that applies the accounting and reporting guidance issued in Topic 946 by the U.S. Financial Accounting Standards Board. Each fund’s financial statements have been prepared to comply with U.S. generally accepted accounting principles (“U.S. GAAP”). These principles require the funds’ investment adviser to make estimates and assumptions that affect reported amounts and disclosures. Actual results could differ from those estimates. Subsequent events, if any, have been evaluated through the date of issuance in the preparation of the financial statements. The funds follow the significant accounting policies described in this section, as well as the valuation policies described in the next section on valuation.
Security transactions and related investment income— Security transactions are recorded by the funds as of the date the trades are executed with brokers. Realized gains and losses from security transactions are determined based on the specific identified cost of the securities. In the event a security is purchased with a delayed payment date, the funds will segregate liquid assets sufficient to meet their payment obligations. Interest income is recognized on an accrual basis. Market discounts, premiums and original issue discounts on fixed-income securities are amortized daily over the expected life of the security.
Class allocations— Income, fees and expenses (other than class-specific fees and expenses) are allocated daily among the various share classes of each fund based on the relative value of their settled shares. Realized and unrealized gains and losses are allocated daily among the various share classes of each fund based on their relative net assets. Class-specific fees and expenses, such as distribution, transfer agent and administrative services, are charged directly to the respective share class of each fund.
Distributions paid or accrued to shareholders— Income dividends are declared daily after the determination of each fund’s net investment income and are paid to shareholders monthly. Capital gain distributions are recorded on each fund’s ex-dividend date.
3. Valuation
Capital Research and Management Company (“CRMC”), the funds’ investment adviser, values each fund’s investments at fair value as defined by U.S. GAAP. The net asset value of each share class of each fund is generally determined as of approximately 4:00 p.m. New York time each day the New York Stock Exchange is open.
Methods and inputs— The funds’ investment adviser uses the following methods and inputs to establish the fair value of each fund’s assets and liabilities. Use of particular methods and inputs may vary over time based on availability and relevance as market and economic conditions evolve.
Fixed-income securities, including short-term securities, are generally valued at prices obtained from one or more pricing vendors. Vendors value such securities based on one or more of the following inputs: benchmark yields, transactions, bids, offers, quotations from dealers and trading systems, new issues, spreads and other relationships observed in the markets among comparable securities; and proprietary pricing models such as yield measures calculated using factors such as cash flows, financial or collateral performance and other reference data. For certain distressed securities, valuations may include cash flows or liquidation values using a net present value calculation based on inputs that include, but are not limited to, financial statements and debt contracts.
When the funds’ investment adviser deems it appropriate to do so (such as when vendor prices are unavailable or not deemed to be representative), fixed-income securities will be valued in good faith at the mean quoted bid and ask prices that are reasonably and timely available (or bid prices, if ask prices are not available) or at prices for securities of comparable maturity, quality and type. Some securities may be valued based on their effective maturity or average life, which may be shorter than the stated maturity.
Exchange-traded futures are generally valued at the official settlement price of the exchange or market on which such instruments are traded, as of the close of business on the day the futures are being valued.
Securities and other assets for which representative market quotations are not readily available or are considered unreliable by the funds’ investment adviser are fair valued as determined in good faith under fair valuation guidelines adopted by authority of each fund’s board of trustees as further described. The investment adviser follows fair valuation guidelines, consistent with U.S. Securities and Exchange Commission rules and guidance, to consider relevant principles and factors when making fair value determinations. The investment adviser considers relevant indications of value that are reasonably and timely available to it in determining the fair value to be assigned to a particular security, such as the type and cost of the security; contractual or legal restrictions on resale of the security; relevant financial or business developments of the issuer; actively traded similar or related securities; conversion or exchange rights on the security; related corporate actions; significant events occurring after the close of trading in the security; and changes in overall market conditions. In addition, the closing prices of equity securities that trade in markets outside U.S. time zones may be adjusted to reflect significant events
| American Funds Tax-Exempt Funds | 53 |
that occur after the close of local trading but before the net asset value of each share class of the fund is determined. Fair valuations and valuations of investments that are not actively trading involve judgment and may differ materially from valuations that would have been used had greater market activity occurred.
Processes and structure— Each fund’s board of trustees has delegated authority to the funds’ investment adviser to make fair value determinations, subject to board oversight. The investment adviser has established a Joint Fair Valuation Committee (the “Fair Valuation Committee”) to administer, implement and oversee the fair valuation process, and to make fair value decisions. The Fair Valuation Committee regularly reviews its own fair value decisions, as well as decisions made under its standing instructions to the investment adviser’s valuation teams. The Fair Valuation Committee reviews changes in fair value measurements from period to period and may, as deemed appropriate, update the fair valuation guidelines to better reflect the results of back testing and address new or evolving issues. The Fair Valuation Committee reports any changes to the fair valuation guidelines to the boards of trustees. Each fund’s board and audit committee also regularly review reports that describe fair value determinations and methods.
The funds’ investment adviser has also established a Fixed-Income Pricing Review Group to administer and oversee the fixed-income valuation process, including the use of fixed-income pricing vendors. This group regularly reviews pricing vendor information and market data. Pricing decisions, processes and controls over security valuation are also subject to additional internal reviews, including an annual control self-evaluation program facilitated by the investment adviser’s compliance group.
Classifications— The funds’ investment adviser classifies each fund’s assets and liabilities into three levels based on the inputs used to value the assets or liabilities. Level 1 values are based on quoted prices in active markets for identical securities. Level 2 values are based on significant observable market inputs, such as quoted prices for similar securities and quoted prices in inactive markets. Certain securities trading outside the U.S. may transfer between Level 1 and Level 2 due to valuation adjustments resulting from significant market movements following the close of local trading. Level 3 values are based on significant unobservable inputs that reflect the investment adviser’s determination of assumptions that market participants might reasonably use in valuing the securities. The valuation levels are not necessarily an indication of the risk or liquidity associated with the underlying investment. For example, U.S. government securities are reflected as Level 2 because the inputs used to determine fair value may not always be quoted prices in an active market. The following tables present the funds’ valuation levels as of January 31, 2019 (dollars in thousands):
American Funds Short-Term Tax-Exempt Bond Fund
| | | Investment securities | |
| | | Level 1 | | | Level 2 | | | Level 3 | | | Total | |
| Assets: | | | | | | | | | | | | |
| Bonds, notes & other debt instruments: | | | | | | | | | | | | |
| Texas | | $ | — | | | $ | 150,798 | | | $ | — | | | $ | 150,798 | |
| Illinois | | | — | | | | 114,847 | | | | — | | | | 114,847 | |
| New York | | | — | | | | 102,197 | | | | — | | | | 102,197 | |
| California | | | — | | | | 50,033 | | | | — | | | | 50,033 | |
| Florida | | | — | | | | 48,085 | | | | — | | | | 48,085 | |
| Wisconsin | | | — | | | | 44,103 | | | | — | | | | 44,103 | |
| Minnesota | | | — | | | | 38,449 | | | | — | | | | 38,449 | |
| Pennsylvania | | | — | | | | 36,718 | | | | — | | | | 36,718 | |
| Washington | | | — | | | | 31,087 | | | | — | | | | 31,087 | |
| Massachusetts | | | — | | | | 29,374 | | | | — | | | | 29,374 | |
| Other | | | — | | | | 443,110 | | | | — | | | | 443,110 | |
| Short-term securities | | | — | | | | 86,972 | | | | — | | | | 86,972 | |
| Total | | $ | — | | | $ | 1,175,773 | | | $ | — | | | $ | 1,175,773 | |
| | | | | | | | | | | | | | | | | |
| | | Other investments* | |
| | | Level 1 | | | Level 2 | | | Level 3 | | | Total | |
| Assets: | | | | | | | | | | | | |
| Unrealized appreciation on futures contracts | | $ | 510 | | | $ | — | | | $ | — | | | $ | 510 | |
| Liabilities: | | | | | | | | | | | | | | | | |
| Unrealized depreciation on futures contracts | | | (68 | ) | | | — | | | | — | | | | (68 | ) |
| Total | | $ | 442 | | | $ | — | | | $ | — | | | $ | 442 | |
| 54 | American Funds Tax-Exempt Funds |
Limited Term Tax-Exempt Bond Fund of America
| | | Investment securities | |
| | | Level 1 | | | Level 2 | | | Level 3 | | | Total | |
| Assets: | | | | | | | | | | | | | | | | |
| Bonds, notes & other debt instruments: | | | | | | | | | | | | | | | | |
| Illinois | | $ | — | | | $ | 503,767 | | | $ | — | | | $ | 503,767 | |
| Texas | | | — | | | | 387,484 | | | | — | | | | 387,484 | |
| New York | | | — | | | | 332,749 | | | | — | | | | 332,749 | |
| California | | | — | | | | 252,942 | | | | — | | | | 252,942 | |
| Pennsylvania | | | — | | | | 227,869 | | | | — | | | | 227,869 | |
| Florida | | | — | | | | 224,959 | | | | — | | | | 224,959 | |
| Michigan | | | — | | | | 149,542 | | | | — | | | | 149,542 | |
| Washington | | | — | | | | 139,845 | | | | — | | | | 139,845 | |
| Wisconsin | | | — | | | | 133,686 | | | | — | | | | 133,686 | |
| New Jersey | | | — | | | | 131,629 | | | | — | | | | 131,629 | |
| Other | | | — | | | | 1,328,992 | | | | — | | | | 1,328,992 | |
| Short-term securities | | | — | | | | 266,948 | | | | — | | | | 266,948 | |
| Total | | $ | — | | | $ | 4,080,412 | | | $ | — | | | $ | 4,080,412 | |
| | | | Other investments* | |
| | | | Level 1 | | | | Level 2 | | | | Level 3 | | | | Total | |
| Assets: | | | | | | | | | | | | | | | | |
| Unrealized appreciation on futures contracts | | $ | 1,787 | | | $ | — | | | $ | — | | | $ | 1,787 | |
| Liabilities: | | | | | | | | | | | | | | | | |
| Unrealized depreciation on futures contracts | | | (347 | ) | | | — | | | | — | | | | (347 | ) |
| Total | | $ | 1,440 | | | $ | — | | | $ | — | | | $ | 1,440 | |
The Tax-Exempt Bond Fund of America
| | | Investment securities | |
| | | | Level 1 | | | | Level 2 | | | | Level 3 | | | | Total | |
| Assets: | | | | | | | | | | | | | | | | |
| Bonds, notes & other debt instruments: | | | | | | | | | | | | | | | | |
| Illinois | | $ | — | | | $ | 2,719,889 | | | $ | — | | | $ | 2,719,889 | |
| Texas | | | — | | | | 1,855,364 | | | | — | | | | 1,855,364 | |
| New York | | | — | | | | 1,433,982 | | | | — | | | | 1,433,982 | |
| California | | | — | | | | 1,384,051 | | | | — | | | | 1,384,051 | |
| Florida | | | — | | | | 1,214,888 | | | | 6,547 | | | | 1,221,435 | |
| Pennsylvania | | | — | | | | 894,998 | | | | — | | | | 894,998 | |
| Michigan | | | — | | | | 738,677 | | | | — | | | | 738,677 | |
| Washington | | | — | | | | 583,177 | | | | — | | | | 583,177 | |
| Virginia | | | — | | | | 501,672 | | | | — | | | | 501,672 | |
| Ohio | | | — | | | | 475,806 | | | | — | | | | 475,806 | |
| Other | | | — | | | | 6,513,676 | | | | — | | | | 6,513,676 | |
| Short-term securities | | | — | | | | 651,691 | | | | — | | | | 651,691 | |
| Total | | $ | — | | | $ | 18,967,871 | | | $ | 6,547 | | | $ | 18,974,418 | |
| | | Other investments* | |
| | | Level 1 | | | Level 2 | | | Level 3 | | | Total | |
| Assets: | | | | | | | | | | | | |
| Unrealized appreciation on futures contracts | | $ | 6,562 | | | $ | — | | | $ | — | | | $ | 6,562 | |
| Liabilities: | | | | | | | | | | | | | | | | |
| Unrealized depreciation on futures contracts | | | (7,004 | ) | | | — | | | | — | | | | (7,004 | ) |
| Total | | $ | (442 | ) | | $ | — | | | $ | — | | | $ | (442 | ) |
See end of tables for footnote.
| American Funds Tax-Exempt Funds | 55 |
American High-Income Municipal Bond Fund
| | | Investment securities | |
| | | Level 1 | | | Level 2 | | | Level 3 | | | Total | |
| Assets: | | | | | | | | | | | | | | | | |
| Bonds, notes & other debt instruments: | | | | | | | | | | | | | | | | |
| Illinois | | $ | — | | | $ | 1,026,238 | | | $ | — | | | $ | 1,026,238 | |
| Texas | | | — | | | | 425,895 | | | | — | | | | 425,895 | |
| California | | | — | | | | 415,356 | | | | — | | | | 415,356 | |
| Pennsylvania | | | — | | | | 381,483 | | | | — | | | | 381,483 | |
| Colorado | | | — | | | | 373,256 | | | | — | | | | 373,256 | |
| Florida | | | — | | | | 354,464 | | | | 6,632 | | | | 361,096 | |
| Ohio | | | — | | | | 305,231 | | | | — | | | | 305,231 | |
| New York | | | — | | | | 280,499 | | | | — | | | | 280,499 | |
| New Jersey | | | — | | | | 270,524 | | | | — | | | | 270,524 | |
| Puerto Rico | | | — | | | | 220,657 | | | | — | | | | 220,657 | |
| Other | | | — | | | | 2,504,305 | | | | — | | | | 2,504,305 | |
| Short-term securities | | | — | | | | 193,803 | | | | — | | | | 193,803 | |
| Total | | $ | — | | | $ | 6,751,711 | | | $ | 6,632 | | | $ | 6,758,343 | |
| | | Other investments* | |
| | | Level 1 | | | Level 2 | | | Level 3 | | | Total | |
| Assets: | | | | | | | | | | | | | | | | |
| Unrealized appreciation on futures contracts | | $ | 935 | | | $ | — | | | $ | — | | | $ | 935 | |
| Liabilities: | | | | | | | | | | | | | | | | |
| Unrealized depreciation on futures contracts | | | (3,931 | ) | | | — | | | | — | | | | (3,931 | ) |
| Total | | $ | (2,996 | ) | | $ | — | | | $ | — | | | $ | (2,996 | ) |
| * | Futures contracts are not included in the investment portfolio. |
The Tax-Exempt Fund of California
At January 31, 2019, all of the fund’s investment securities were classified as Level 2.
American Funds Tax-Exempt Fund of New York
At January 31, 2019, all of the fund’s investment securities were classified as Level 2.
4. Risk factors
Investing in each fund may involve certain risks including, but not limited to, those described below.
Market conditions— The prices of, and the income generated by, the securities held by the funds may decline — sometimes rapidly or unpredictably — due to various factors, including events or conditions affecting the general economy or particular industries; overall market changes; local, regional or global political, social or economic instability; governmental or governmental agency responses to economic conditions; and currency exchange rate, interest rate and commodity price fluctuations.
Issuer risks— The prices of, and the income generated by, securities held by the funds may decline in response to various factors directly related to the issuers of such securities, including reduced demand for an issuer’s goods or services, poor management performance and strategic initiatives such as mergers, acquisitions or dispositions and the market response to any such initiatives.
Investing in municipal securities— The yield and/or value of the funds’ investments in municipal securities may be adversely affected by events tied to the municipal securities markets, which can be very volatile and significantly impacted by unfavorable legislative or political developments and negative changes in the financial conditions of municipal securities issuers and the economy. To the extent the funds invest in obligations of a municipal issuer, the volatility, credit quality and performance of the funds may be adversely impacted by local political and economic conditions of the issuer. For example, a credit rating downgrade, bond default or bankruptcy involving an issuer within a particular state or territory could affect the market values and marketability of many or all municipal obligations of that state or territory. Income from municipal securities held by the funds could also be declared taxable because of changes in tax laws or interpretations by taxing authorities or as a result of noncompliant conduct of a municipal issuer. Additionally, the relative amount of publicly available information about municipal securities is generally less than that for corporate securities.
| 56 | American Funds Tax-Exempt Funds |
Investing in debt instruments— The prices of, and the income generated by, bonds and other debt securities held by the funds may be affected by changing interest rates and by changes in the effective maturities and credit ratings of these securities.
Rising interest rates will generally cause the prices of bonds and other debt securities to fall. Falling interest rates may cause an issuer to redeem, call or refinance a debt security before its stated maturity, which may result in the funds having to reinvest the proceeds in lower yielding securities. Longer maturity debt securities generally have greater sensitivity to changes in interest rates and may be subject to greater price fluctuations than shorter maturity debt securities.
Bonds and other debt securities are also subject to credit risk, which is the possibility that the credit strength of an issuer will weaken and/or an issuer of a debt security will fail to make timely payments of principal or interest and the security will go into default. Lower quality debt securities generally have higher rates of interest and may be subject to greater price fluctuations than higher quality debt securities. Credit risk is gauged, in part, by the credit ratings of the debt securities in which the funds invest. However, ratings are only the opinions of the rating agencies issuing them and are not guarantees as to credit quality or an evaluation of market risk. The funds’ investment adviser relies on its own credit analysts to research issuers and issues in seeking to mitigate various credit and default risks.
Liquidity risk— Certain fund holdings may be deemed to be less liquid or illiquid because they cannot be readily sold or converted to cash without significantly impacting the value of the holdings. Liquidity risk may result from the lack of an active market for a holding, legal or contractual restrictions on resale, or the reduced number and capacity of market participants to make a market in such holding. Market prices for less liquid or illiquid holdings may be volatile, and reduced liquidity may have an adverse impact on the market price of such holdings. Additionally, the sale of less liquid or illiquid holdings may involve substantial delays (including delays in settlement) and additional costs and the fund may be unable to sell such holdings when necessary to meet its liquidity needs.
Credit and liquidity support— Changes in the credit quality of banks and financial institutions providing credit and liquidity support features with respect to securities held by the funds could cause the values of these securities to decline.
Investing in lower rated debt instruments— Lower rated bonds and other lower rated debt securities generally have higher rates of interest and involve greater risk of default or price declines due to changes in the issuer’s creditworthiness than those of higher quality debt securities. The market prices of these securities may fluctuate more than the prices of higher quality debt securities and may decline significantly in periods of general economic difficulty. These risks may be increased with respect to investments in junk bonds.
Investing in similar municipal bonds— Investing significantly in municipal obligations of multiple issuers in the same state or backed by revenues of similar types of projects or industries may make the funds more susceptible to certain economic, political or regulatory occurrences. As a result, the potential for fluctuations in the funds’ share price may increase.
Risks of investing in municipal bonds of issuers within the state of California— Because The Tax-Exempt Fund of California invests primarily in securities of issuers within the state of California, the fund is more susceptible to factors adversely affecting issuers of California securities than a comparable municipal bond mutual fund that does not concentrate its investments in a single state. For example, in the past, California voters have passed amendments to the state’s constitution and other measures that limit the taxing and spending authority of California governmental entities, and future voter initiatives may adversely affect California municipal bonds.
Risks of investing in municipal bonds of issuers within the state of New York— Because American Funds Tax-Exempt Fund of New York invests primarily in securities of issuers within the state of New York, the fund is more susceptible to factors adversely affecting issuers of New York securities than a comparable municipal bond mutual fund that does not concentrate its investments in a single state. For example, such factors may include political policy changes, tax base erosion, state constitutional limits on tax increases, budget deficits and other financial or economic difficulties, and changes in the credit ratings assigned to New York’s municipal issuers. New York’s economy and finances may be especially vulnerable to changes in the performance of the financial services sector, which historically has been volatile.
Management— The investment adviser to the funds actively manages the funds’ investments. Consequently, the funds are subject to the risk that the methods and analyses employed by the investment adviser in this process may not produce the desired results. This could cause the funds to lose value or its investment results to lag relevant benchmarks or other funds with similar objectives.
| American Funds Tax-Exempt Funds | 57 |
5. Certain investment techniques
Futures contracts— American Funds Short-Term Tax Exempt Bond Fund, Limited Term Tax-Exempt Bond Fund of America, The Tax-Exempt Bond Fund of America and American High-Income Municipal Bond Fund have entered into futures contracts, which provide for the future sale by one party and purchase by another party of a specified amount of a specific financial instrument for a specified price, date, time and place designated at the time the contract is made. Futures contracts are used to strategically manage the fund’s interest rate sensitivity by increasing or decreasing the duration of the fund or a portion of the fund’s portfolio.
Upon entering into futures contracts, and to maintain the fund’s open positions in futures contracts, each fund is required to deposit with a futures broker, known as a futures commission merchant (“FCM”), in a segregated account in the name of the FCM an amount of cash, U.S. government securities or other liquid securities, known as initial margin. The margin required for a particular futures contract is set by the exchange on which the contract is traded to serve as collateral, and may be significantly modified from time to time by the exchange during the term of the contract. Securities deposited as initial margin, if any, are disclosed in the investment portfolio and cash deposited as initial margin, if any, is reflected as restricted cash pledged for futures contracts in the fund’s statement of assets and liabilities.
On a daily basis, each fund pays or receives variation margin based on the increase or decrease in the value of the futures contracts and records variation margin on futures contracts in the statement of assets and liabilities. In addition, each fund segregates liquid assets equivalent to each fund’s outstanding obligations under the contract in excess of the initial margin and variation margin, if any. Futures contracts may involve a risk of loss in excess of the variation margin shown on each fund’s statement of assets and liabilities. Each fund records realized gains or losses at the time the futures contract is closed or expires. Net realized gains or losses and net unrealized appreciation or depreciation from futures contracts are recorded in each fund’s statement of operations. The average month-end notional amount of futures contracts while held by American Funds Short-Term Tax Exempt Bond Fund, Limited Term Tax-Exempt Bond Fund of America, The Tax-Exempt Bond Fund of America and American High-Income Municipal Bond Fund was $61,050,000, $108,922,000, $734,758,000 and $146,142,000, respectively.
The following tables identify the location of and fair value amounts on the funds’ statements of assets and liabilities and the effect on the funds’ statements of operations resulting from the funds’ use of futures contracts as of, or for the six months ended, January 31, 2019 (dollars in thousands):
American Funds Short-Term Tax-Exempt Bond Fund
| | | | | Assets | | | Liabilities | |
| | | | | Location on statement of | | | | | Location on statement of | | | |
| Contracts | | Risk type | | assets and liabilities | | Value | | | assets and liabilities | | Value | |
| Futures | | Interest | | Unrealized appreciation* | | $ | 510 | | | Unrealized depreciation* | | $ | 68 | |
| | | | | | | | | | | | | | | |
| | | | | Net realized loss | | | Net unrealized appreciation | |
| | | | | Location on statement of | | | | | | Location on statement of | | | | |
| Contracts | | Risk type | | operations | | Value | | | operations | | Value | |
| Futures | | Interest | | Net realized loss on futures contracts | | $ | (211 | ) | | Net unrealized appreciation on futures contracts | | $ | 543 | |
| | | | | | | | | | | | | | | |
| Limited Term Tax-Exempt Bond Fund of America | |
| | |
| | | | | Assets | | | Liabilities | |
| | | | | Location on statement of | | | | | | Location on statement of | | | | |
| Contracts | | Risk type | | assets and liabilities | | Value | | | assets and liabilities | | Value | |
| Futures | | Interest | | Unrealized appreciation* | | $ | 1,787 | | | Unrealized depreciation* | | $ | 347 | |
| | | | | | | | | | | | | | | |
| | | | | Net realized loss | | | Net unrealized appreciation | |
| | | | | Location on statement of | | | | | | Location on statement of | | | | |
| Contracts | | Risk type | | operations | | Value | | | operations | | Value | |
| Futures | | Interest | | Net realized loss on futures contracts | | $ | (113 | ) | | Net unrealized appreciation on futures contracts | | $ | 1,351 | |
| 58 | American Funds Tax-Exempt Funds |
| The Tax-Exempt Bond Fund of America | | | | | | | | |
| | | | | | | | | |
| | | | | Assets | | | Liabilities | |
| | | | | Location on statement of | | | | | Location on statement of | | | |
| Contracts | | Risk type | | assets and liabilities | | Value | | | assets and liabilities | | Value | |
| Futures | | Interest | | Unrealized appreciation* | | $ | 6,562 | | | Unrealized depreciation* | | $ | 7,004 | |
| | | | | | | | | | | | | | | |
| | | | | Net realized gain | | | Net unrealized depreciation | |
| | | | | Location on statement of | | | | | | Location on statement of | | | | |
| Contracts | | Risk type | | operations | | Value | | | operations | | Value | |
| Futures | | Interest | | Net realized gain on futures contracts | | $ | 9,499 | | | Net unrealized depreciation on futures contracts | | $ | (2,311 | ) |
| | | | | | | | | | | | | | | |
| American High-Income Municipal Bond Fund | |
| | | | | | | | | | | | | | | |
| | | | | Assets | | | Liabilities | |
| | | | | Location on statement of | | | | | | Location on statement of | | | | |
| Contracts | | Risk type | | assets and liabilities | | Value | | | assets and liabilities | | Value | |
| Futures | | Interest | | Unrealized appreciation* | | $ | 935 | | | Unrealized depreciation* | | $ | 3,931 | |
| | | | | | | | | | | | | | | |
| | | | | Net realized gain | | | Net unrealized depreciation | |
| | | | | Location on statement of | | | | | | Location on statement of | | | | |
| Contracts | | Risk type | | operations | | Value | | | operations | | Value | |
| Futures | | Interest | | Net realized gain on futures contracts | | $ | 1,514 | | | Net unrealized depreciation on futures contracts | | $ | (2,893 | ) |
| * | Includes cumulative appreciation/depreciation on futures contracts as reported in the applicable table following the fund’s investment portfolio. Only current day’s variation margin is reported within the statement of assets and liabilities. |
Collateral— American Funds Short-Term Tax Exempt Bond Fund, Limited Term Tax-Exempt Bond Fund of America, The Tax-Exempt Bond Fund of America and American High-Income Municipal Bond Fund participate in a collateral program due to each fund’s use of futures contracts that calls for each fund to either receive or pledge highly liquid assets, such as cash or U.S. government securities, as collateral for initial and variation margin by contract. The purpose of the collateral is to cover potential losses that could occur in the event that either party cannot meet its contractual obligation. Non-cash collateral pledged by each fund, if any, is disclosed in each fund’s investment portfolio, and cash collateral pledged by each fund, if any, is held in a segregated account with each fund’s custodian, which is reflected as pledged cash in each fund’s statement of assets and liabilities.
| American Funds Tax-Exempt Funds | 59 |
6. Taxation and distributions
Federal income taxation— Each fund complies with the requirements under Subchapter M of the Internal Revenue Code applicable to mutual funds and intends to distribute substantially all of its net tax-exempt income and net capital gains each year. Generally, income earned by each fund is exempt from federal income taxes; however, each fund may earn taxable income from certain investments. The funds are not subject to income taxes to the extent such taxable income and net capital gains are distributed. To the extent the funds recognize taxable income, the funds may pay tax on such income in lieu of making distributions; amounts paid are included within federal, state and local taxes on the funds’ statements of operations.
As of and during the period ended January 31, 2019, none of the funds had a liability for any unrecognized tax benefits. Each fund recognizes interest and penalties, if any, related to unrecognized tax benefits as income tax expense in their respective statements of operations. During the period, none of the funds incurred any significant interest or penalties.
Each fund’s tax returns are not subject to examination by federal, state and, if applicable, non-U.S. tax authorities after the expiration of each jurisdiction’s statute of limitations, which is generally three years after the date of filing but can be extended in certain jurisdictions.
Distributions— Distributions paid to shareholders are based on each fund’s net investment income and net realized gains determined on a tax basis, which may differ from net investment income and net realized gains for financial reporting purposes. These differences are due primarily to different treatment for items such as short-term capital gains and losses; capital losses related to sales of certain securities within 30 days of purchase; deferred expenses; cost of investments sold; net capital losses; amortization of premiums and discounts and income on certain investments. The fiscal year in which amounts are distributed may differ from the year in which the net investment income and net realized gains are recorded by the funds for financial reporting purposes.
Under the Regulated Investment Company Modernization Act of 2010 (the “Act”), net capital losses recognized after July 31, 2011, (August 31, 2011, for The Tax-Exempt Bond Fund of America and The Tax-Exempt Fund of California) may be carried forward indefinitely, and their character is retained as short-term and/or long-term losses. Previously, net capital losses were carried forward for eight years and treated as short-term losses. As a transition rule, the Act requires that post-enactment net capital losses be used before pre-enactment net capital losses.
Additional tax basis disclosures for each fund are as follows (dollars in thousands):
| | | American
Funds
Short-Term
Tax-Exempt
Bond Fund | | | Limited Term
Tax-Exempt
Bond Fund
of America | | | The
Tax-Exempt
Bond Fund
of America | | | American
High-Income
Municipal
Bond Fund | | | The
Tax-Exempt
Fund of
California | | | American
Funds
Tax-Exempt
Fund of
New York | |
| As of July 31, 2018 | | | | | | | | | | | | | | | | | | | | | | | | |
| Undistributed tax-exempt income | | $ | 66 | | | $ | 571 | | | $ | 3,310 | | | $ | 3,556 | | | $ | 868 | | | $ | 127 | |
| Post-October capital loss deferral* | | | — | | | | — | | | | (6,970 | ) | | | — | | | | (408 | ) | | | — | |
| Capital loss carryforward†: | | | | | | | | | | | | | | | | | | | | | | | | |
| No expiration | | | (3,334 | ) | | | (249 | ) | | | — | | | | — | | | | — | | | | (79 | ) |
| Expiring 2019 | | | — | | | | — | | | | — | | | | (24,408 | ) | | | — | | | | — | |
| | | | (3,334 | ) | | | (249 | ) | | | — | | | | (24,408 | ) | | | — | | | | (79 | ) |
| As of January 31, 2019 | | | | | | | | | | | | | | | | | | | | | | | | |
| Gross unrealized appreciation on investments | | | 4,639 | | | | 47,680 | | | | 395,958 | | | | 185,707 | | | | 62,571 | | | | 4,815 | |
| Gross unrealized depreciation on investments | | | (4,328 | ) | | | (14,553 | ) | | | (111,199 | ) | | | (74,104 | ) | | | (13,585 | ) | | | (1,205 | ) |
| Net unrealized appreciation on investments | | | 311 | | | | 33,127 | | | | 284,759 | | | | 111,603 | | | | 48,986 | | | | 3,610 | |
| Cost of investments | | | 1,175,904 | | | | 4,048,725 | | | | 18,689,217 | | | | 6,643,744 | | | | 2,244,607 | | | | 241,883 | |
| * | This deferral is considered incurred in the subsequent year. |
| † | The capital loss carryforward will be used to offset any capital gains realized by the funds in the current year or in subsequent years through the expiration date. The funds will not make distributions from capital gains while a capital loss carryforward remains. |
| 60 | American Funds Tax-Exempt Funds |
Distributions paid or accrued from each fund were characterized as tax-exempt income for tax purposes as follows (dollars in thousands):
American Funds Short-Term Tax-Exempt Bond Fund
| | | Six months ended | | | Year ended | |
| Share class | | January 31, 2019 | | | July 31, 2018 | |
| Class A | | $ | 5,645 | | | $ | 10,014 | |
| Class T | | | — | * | | | — | * |
| Class F-1 | | | 43 | | | | 93 | |
| Class F-2 | | | 1,029 | | | | 711 | |
| Class F-3 | | | 422 | | | | 716 | |
| Class R-6 | | | 1,033 | | | | 1,887 | |
| Total | | $ | 8,172 | | | $ | 13,421 | |
| | | | | | | | | |
| Limited Term Tax-Exempt Bond Fund of America | | | | | | |
| | | | | | | |
| | | Six months ended | | | Year ended | |
| Share class | | January 31, 2019 | | | July 31, 2018 | |
| Class A | | $ | 29,928 | | | $ | 61,392 | |
| Class C | | | 131 | | | | 288 | |
| Class T | | | — | * | | | — | * |
| Class F-1 | | | 582 | | | | 1,510 | |
| Class F-2 | | | 4,526 | | | | 7,833 | |
| Class F-3 | | | 2,660 | | | | 3,549 | |
| Class R-6 | | | 3,373 | | | | 6,843 | |
| Total | | $ | 41,200 | | | $ | 81,415 | |
| | | | | | | | | |
| The Tax-Exempt Bond Fund of America | | | | | | |
| | | | | | | |
| | | Six months ended | | | Year ended | |
| Share class | | January 31, 2019 | | | July 31, 2018 | |
| Class A | | $ | 144,228 | | | $ | 290,885 | |
| Class C | | | 4,333 | | | | 9,684 | |
| Class T | | | — | * | | | — | * |
| Class F-1 | | | 4,771 | | | | 12,057 | |
| Class F-2 | | | 33,767 | | | | 61,316 | |
| Class F-3 | | | 86,055 | | | | 108,231 | |
| Class R-6 | | | 8,999 | | | | 14,656 | |
| Total | | $ | 282,153 | | | $ | 496,829 | |
| | | | | | | | | |
| American High-Income Municipal Bond Fund | | | | | | |
| | | | | | | |
| | | Six months ended | | | Year ended | |
| Share class | | January 31, 2019 | | | July 31, 2018 | |
| Class A | | $ | 74,714 | | | $ | 141,994 | |
| Class C | | | 3,302 | | | | 6,687 | |
| Class T | | | — | * | | | — | * |
| Class F-1 | | | 3,340 | | | | 7,964 | |
| Class F-2 | | | 17,153 | | | | 26,981 | |
| Class F-3 | | | 13,599 | | | | 22,072 | |
| Class R-6 | | | 11,362 | | | | 18,501 | |
| Total | | $ | 123,470 | | | $ | 224,199 | |
See end of tables for footnote.
| American Funds Tax-Exempt Funds | 61 |
| The Tax-Exempt Fund of California | | | | | | |
| | | | | | | |
| | | Six months ended | | | Year ended | |
| Share class | | January 31, 2019 | | | July 31, 2018 | |
| Class A | | $ | 24,017 | | | $ | 48,366 | |
| Class C | | | 729 | | | | 1,638 | |
| Class T | | | — | * | | | — | * |
| Class F-1 | | | 1,027 | | | | 2,065 | |
| Class F-2 | | | 4,774 | | | | 6,945 | |
| Class F-3 | | | 2,810 | | | | 4,665 | |
| Total | | $ | 33,357 | | | $ | 63,679 | |
| | | | | | | | | |
| American Funds Tax-Exempt Fund of New York | |
| | | | | | | |
| | | Six months ended | | | Year ended | |
| Share class | | January 31, 2019 | | | July 31, 2018 | |
| Class A | | $ | 2,320 | | | $ | 4,525 | |
| Class C | | | 101 | | | | 209 | |
| Class T | | | — | * | | | — | * |
| Class F-1 | | | 25 | | | | 68 | |
| Class F-2 | | | 297 | | | | 374 | |
| Class F-3 | | | 392 | | | | 590 | |
| Total | | $ | 3,135 | | | $ | 5,766 | |
| * | Amount less than one thousand. |
7. Fees and transactions with related parties
CRMC, the funds’ investment adviser, is the parent company of American Funds Distributors,® Inc. (“AFD”), the principal underwriter of the funds’ shares, and American Funds Service Company® (“AFS”), the funds’ transfer agent. CRMC, AFD and AFS are considered related parties to each fund.
Investment advisory services— Each fund has an investment advisory and service agreement with CRMC that provides for monthly fees accrued daily. These fees are based on annual rates that generally decrease as net asset levels increase. The agreement for each fund, except American Funds Short-Term Tax-Exempt Bond Fund, also provides for monthly fees accrued daily based on a series of decreasing rates on each fund’s monthly gross income.
The range of rates, net asset levels, gross income levels and annualized rates of average net assets for each fund are as follows:
| | | Rates | | | Net asset level
(in billions) | | | Rates | | | Monthly gross income | | | Annualized
rates for the
six months
ended | |
| Fund | | Beginning
with | | | Ending
with | | | Up to | | | In excess
of | | | Beginning
with | | | Ending
with | | | Up to | | | In excess
of | | | January 31,
2019 | |
| American Funds Short-Term Tax-Exempt Bond Fund | | | .390 | % | | | .290 | % | | $ | .20 | | | $ | 1.2 | | | | | | | | | | | | | | | | | | | | .357 | % |
| Limited Term Tax-Exempt Bond Fund of America | | | .300 | | | | .150 | | | | .06 | | | | 1.0 | | | | 3.00 | % | | | 2.50 | % | | $ | 3,333,333 | | | $ | 3,333,333 | | | | .231 | |
| The Tax-Exempt Bond Fund of America | | | .300 | | | | .110 | | | | .06 | | | | 21.0 | | | | 3.00 | | | | 2.00 | | | | 3,333,333 | | | | 8,333,333 | | | | .210 | |
| American High-Income Municipal Bond Fund | | | .300 | | | | .140 | | | | .06 | | | | 6.0 | | | | 3.00 | | | | 2.50 | | | | 3,333,333 | | | | 3,333,333 | | | | .282 | |
| The Tax-Exempt Fund of California | | | .300 | | | | .180 | | | | .06 | | | | 1.0 | | | | 3.00 | | | | 2.50 | | | | 3,333,333 | | | | 3,333,333 | | | | .293 | |
| American Funds Tax-Exempt Fund of New York | | | .300 | | | | .180 | | | | .06 | | | | 1.0 | | | | 3.00 | | | | 2.50 | | | | 3,333,333 | | | | 3,333,333 | | | | .331 | |
| 62 | American Funds Tax-Exempt Funds |
Class-specific fees and expenses— Expenses that are specific to individual share classes are accrued directly to the respective share class of each fund. The principal class-specific fees and expenses are described below:
Distribution services— Each fund has plans of distribution for all share classes, except Class F-2, F-3 and R-6 shares, if applicable. Under the plans, each fund’s board of trustees approves certain categories of expenses that are used to finance activities primarily intended to sell fund shares and service existing accounts. The plans provide for payments based on an annualized percentage of average daily net assets. In some cases, the boards of trustees have limited the amounts that may be paid to less than the maximum allowed by the plans. All share classes with a plan may use the allotted percentage of average daily net assets to pay service fees, or to compensate AFD for paying service fees, to firms that have entered into agreements with AFD to provide certain shareholder services. The remaining amounts available to be paid under each plan are paid to dealers to compensate them for their sales activities.
| | | American Funds Short-Term
Tax-Exempt Bond Fund | | | Limited Term Tax-Exempt
Bond Fund of America | | | The Tax-Exempt Bond Fund
of America | |
| Share class | | Currently
approved limits | | Plan limits | | | Currently
approved limits | | | Plan limits | | | Currently
approved limits | | | Plan limits | |
| Class A | | 0.15 | % | | 0.15 | % | | | 0.30 | % | | | 0.30 | % | | | 0.25 | % | | | 0.25 | % |
| Class C | | Not applicable | | Not applicable | | | | 1.00 | | | | 1.00 | | | | 1.00 | | | | 1.00 | |
| Classes T and F-1 | | 0.25 | | | 0.50 | | | | 0.25 | | | | 0.50 | | | | 0.25 | | | | 0.50 | |
| | | | | | | | | |
| | | American High-Income
Municipal Bond Fund | | | The Tax-Exempt Fund
of California | | | American Funds Tax-Exempt
Fund of New York | |
| Share class | | Currently
approved limits | | Plan limits | | | Currently
approved limits | | | Plan limits | | | Currently
approved limits | | | Plan limits | |
| Class A | | 0.30 | % | | 0.30 | % | | | 0.25 | % | | | 0.25 | % | | | 0.25 | % | | | 0.30 | % |
| Class C | | 1.00 | | | 1.00 | | | | 1.00 | | | | 1.00 | | | | 1.00 | | | | 1.00 | |
| Classes T and F-1 | | 0.25 | | | 0.50 | | | | 0.25 | | | | 0.50 | | | | 0.25 | | | | 0.50 | |
For Class A shares, distribution-related expenses include the reimbursement of dealer and wholesaler commissions paid by AFD for certain shares sold without a sales charge. This share class of each fund reimburses AFD for amounts billed within the prior 15 months but only to the extent that the overall annual expense limit is not exceeded. As of January 31, 2019, unreimbursed expenses subject to reimbursement for Class A shares of each fund were as follows (dollars in thousands):
| Fund | | Class A | |
| American Funds Short-Term Tax-Exempt Bond Fund | | $ | 1,188 | |
| Limited-Term Tax-Exempt Bond Fund of America | | | 62 | |
| The Tax-Exempt Bond Fund of America | | | 7,307 | |
| American High-Income Municipal Bond Fund | | | 47 | |
| The Tax-Exempt Fund of California | | | 1,579 | |
| American Funds Tax-Exempt Fund of New York | | | 55 | |
Transfer agent services— Each fund has a shareholder services agreement with AFS under which each fund compensates AFS for providing transfer agent services to each of the funds’ share classes. These services include recordkeeping, shareholder communications and transaction processing. In addition, each fund reimburses AFS for amounts paid to third parties for performing transfer agent services on behalf of its respective fund shareholders.
| American Funds Tax-Exempt Funds | 63 |
Administrative services— Each fund has an administrative services agreement with CRMC under which each fund compensates CRMC for providing administrative services to each of the funds’ Class A, C, T, F and R shares. Administrative services are provided by CRMC to help assist third parties providing non-distribution services to fund shareholders. These services include providing in depth information on each fund and market developments that impact each fund’s investments. Administrative services also include, but are not limited to, coordinating, monitoring and overseeing third parties that provide services to each fund’s shareholders. The agreement between each fund and the investment adviser provides each fund the ability to charge an administrative services fee of 0.05% of average daily net assets for all share classes. Currently Class A shares of each fund pay an annual fee of 0.01% of average daily net assets (which could be increased as noted above) and Class C, T, F and R shares of each fund pay an annual fee of 0.05% of their respective average daily net assets.
For the six months ended January 31, 2019, class-specific expenses under the agreements for each fund were as follows (dollars in thousands):
American Funds Short-Term Tax-Exempt Bond Fund
| | | Distribution | | | Transfer agent | | | Administrative | |
| Share class | | services | | | services | | | services | |
| Class A | | | $556 | | | | $138 | | | | $37 | |
| Class T | | | — | | | | — | * | | | — | * |
| Class F-1 | | | 9 | | | | 4 | | | | 2 | |
| Class F-2 | | | Not applicable | | | | 40 | | | | 31 | |
| Class F-3 | | | Not applicable | | | | 1 | | | | 13 | |
| Class R-6 | | | Not applicable | | | | — | * | | | 31 | |
| Total class-specific expenses | | | $565 | | | | $183 | | | | $114 | |
Limited Term Tax-Exempt Bond Fund of America
| | | Distribution | | | Transfer agent | | | Administrative | |
| Share class | | services | | | services | | | services | |
| Class A | | | $4,371 | | | | $563 | | | | $147 | |
| Class C | | | 100 | | | | 4 | | | | 5 | |
| Class T | | | — | | | | — | * | | | — | * |
| Class F-1 | | | 74 | | | | 40 | | | | 15 | |
| Class F-2 | | | Not applicable | | | | 215 | | | | 102 | |
| Class F-3 | | | Not applicable | | | | 3 | | | | 57 | |
| Class R-6 | | | Not applicable | | | | — | * | | | 72 | |
| Total class-specific expenses | | | $4,545 | | | | $825 | | | | $398 | |
The Tax-Exempt Bond Fund of America
| | | Distribution | | | Transfer agent | | | Administrative | |
| Share class | | services | | | services | | | services | |
| Class A | | | $12,471 | | | | $1,778 | | | | $499 | |
| Class C | | | 2,063 | | | | 74 | | | | 103 | |
| Class T | | | — | | | | — | * | | | — | * |
| Class F-1 | | | 429 | | | | 228 | | | | 87 | |
| Class F-2 | | | Not applicable | | | | 1,263 | | | | 558 | |
| Class F-3 | | | Not applicable | | | | 72 | | | | 1,373 | |
| Class R-6 | | | Not applicable | | | | — | * | | | 143 | |
| Total class-specific expenses | | | $14,963 | | | | $3,415 | | | | $2,763 | |
American High-Income Municipal Bond Fund
| | | Distribution | | | Transfer agent | | | Administrative | |
| Share class | | services | | | services | | | services | |
| Class A | | | $6,134 | | | | $1,002 | | | | $204 | |
| Class C | | | 1,127 | | | | 56 | | | | 57 | |
| Class T | | | — | | | | — | * | | | — | * |
| Class F-1 | | | 232 | | | | 125 | | | | 47 | |
| Class F-2 | | | Not applicable | | | | 501 | | | | 222 | |
| Class F-3 | | | Not applicable | | | | 14 | | | | 172 | |
| Class R-6 | | | Not applicable | | | | — | * | | | 143 | |
| Total class-specific expenses | | | $7,493 | | | | $1,698 | | | | $845 | |
The Tax-Exempt Fund of California
| | | Distribution | | | Transfer agent | | | Administrative | |
| Share class | | services | | | services | | | services | |
| Class A | | | $2,048 | | | | $182 | | | | $82 | |
| Class C | | | 339 | | | | 8 | | | | 17 | |
| Class T | | | — | | | | — | * | | | — | * |
| Class F-1 | | | 91 | | | | 43 | | | | 18 | |
| Class F-2 | | | Not applicable | | | | 156 | | | | 78 | |
| Class F-3 | | | Not applicable | | | | — | * | | | 44 | |
| Total class-specific expenses | | | $2,478 | | | | $389 | | | | $239 | |
American Funds Tax-Exempt Fund of New York
| | | Distribution | | | Transfer agent | | | Administrative | |
| Share class | | services | | | services | | | services | |
| Class A | | | $225 | | | | $28 | | | | $9 | |
| Class C | | | 56 | | | | 2 | | | | 3 | |
| Class T | | | — | | | | — | * | | | — | * |
| Class F-1 | | | 2 | | | | 1 | | | | 1 | |
| Class F-2 | | | Not applicable | | | | 11 | | | | 5 | |
| Class F-3 | | | Not applicable | | | | — | * | | | 7 | |
| Total class-specific expenses | | | $283 | | | | $42 | | | | $25 | |
| * | Amount less than one thousand. |
| 64 | American Funds Tax-Exempt Funds |
Trustees’ deferred compensation— Trustees who are unaffiliated with CRMC may elect to defer the cash payment of part or all of their compensation. These deferred amounts, which remain as liabilities of each fund, are treated as if invested in shares of the funds or other American Funds. These amounts represent general, unsecured liabilities of each fund and vary according to the total returns of the selected funds. Trustees’ compensation in the funds’ statements of operations reflects the current fees (either paid in cash or deferred) and a net increase in the value of the following deferred amounts (dollars in thousands):
| | | | | | Decrease in value of | | | Total trustees’ | |
| Fund | | Current fees | | | deferred amounts | | | compensation | |
| American Funds Short-Term Tax-Exempt Bond Fund | | $ | 4 | | | $ | (2 | ) | | $ | 2 | |
| Limited Term Tax-Exempt Bond Fund of America | | | 15 | | | | (8 | ) | | | 7 | |
| The Tax-Exempt Bond Fund of America | | | 58 | | | | (48 | ) | | | 10 | |
| American High-Income Municipal Bond Fund | | | 33 | | | | (7 | ) | | | 26 | |
| The Tax-Exempt Fund of California | | | 8 | | | | (8 | ) | | | — | * |
| American Funds Tax-Exempt Fund of New York | | | 1 | | | | — | * | | | 1 | |
| * | Amount less than one thousand. |
Affiliated officers and trustees— Officers and certain trustees of the funds are or may be considered to be affiliated with CRMC, AFD and AFS. No affiliated officers or trustees received any compensation directly from the funds.
Security transactions with related funds— Each fund may purchase from, or sell securities to, other CRMC-managed funds (or funds managed by certain affiliates of CRMC) under procedures adopted by each fund’s board of trustees. The funds involved in such transactions are considered related by virtue of having a common investment adviser (or affiliated investment advisers), common trustees and/or common officers. When such transactions occur, each transaction is executed at the current market price of the security and no brokerage commissions or fees are paid in accordance with Rule 17a-7 of the 1940 Act.
Interfund lending— Pursuant to an exemptive order issued by the SEC, the funds, along with other CRMC-managed funds (or funds managed by certain affiliates of CRMC), may participate in an interfund lending program. The program provides an alternate credit facility that permits the funds to lend or borrow cash for temporary purposes directly to or from one another, subject to the conditions of the exemptive order. The funds did not lend or borrow cash through the interfund lending program at any time during the six months ended January 31, 2019.
8. Committed line of credit
American High-Income Municipal Bond Fund participates with other funds managed by CRMC (or funds managed by certain affiliates of CRMC) in a $1.5 billion credit facility (the “line of credit”) to be utilized for temporary purposes to support shareholder redemptions. The fund has agreed to pay commitment fees on its pro-rata portion of the line of credit, which are reflected in other expenses in the fund’s statement of operations. The fund did not borrow on this line of credit at any time during the six months ended January 31, 2019.
| American Funds Tax-Exempt Funds | 65 |
9. Capital share transactions
Capital share transactions in the funds were as follows (dollars and shares in thousands):
American Funds Short-Term Tax-Exempt Bond Fund
| | | Sales* | | | Reinvestments of
distributions | | | Repurchases* | | | Net increase
(decrease) | |
| Share class | | Amount | | | Shares | | | Amount | | | Shares | | | Amount | | | Shares | | | Amount | | | Shares | |
| | | | | | | | | | | | | | | | | | | |
| Six months ended January 31, 2019 | | | | | | | | | | | | | | | | | | |
| Class A | | $ | 353,710 | | | | 35,364 | | | $ | 5,421 | | | | 542 | | | $ | (328,461 | ) | | | (32,835 | ) | | $ | 30,670 | | | | 3,071 | |
| Class T | | | — | | | | — | | | | — | | | | — | | | | — | | | | — | | | | — | | | | — | |
| Class F-1 | | | 1,654 | | | | 165 | | | | 43 | | | | 4 | | | | (1,418 | ) | | | (141 | ) | | | 279 | | | | 28 | |
| Class F-2 | | | 156,049 | | | | 15,638 | | | | 993 | | | | 99 | | | | (30,872 | ) | | | (3,084 | ) | | | 126,170 | | | | 12,653 | |
| Class F-3 | | | 31,715 | | | | 3,167 | | | | 390 | | | | 39 | | | | (34,791 | ) | | | (3,482 | ) | | | (2,686 | ) | | | (276 | ) |
| Class R-6 | | | 14,061 | | | | 1,407 | | | | 1,033 | | | | 103 | | | | (11,467 | ) | | | (1,146 | ) | | | 3,627 | | | | 364 | |
| Total net increase (decrease) | | $ | 557,189 | | | | 55,741 | | | $ | 7,880 | | | | 787 | | | $ | (407,009 | ) | | | (40,688 | ) | | $ | 158,060 | | | | 15,840 | |
| |
| Year ended July 31, 2018 |
| Class A | | $ | 278,215 | | | | 27,610 | | | $ | 9,626 | | | | 957 | | | $ | (266,056 | ) | | | (26,429 | ) | | $ | 21,785 | | | | 2,138 | |
| Class T | | | — | | | | — | | | | — | | | | — | | | | — | | | | — | | | | — | | | | — | |
| Class F-1 | | | 2,640 | | | | 262 | | | | 92 | | | | 9 | | | | (5,104 | ) | | | (507 | ) | | | (2,372 | ) | | | (236 | ) |
| Class F-2 | | | 32,700 | | | | 3,244 | | | | 702 | | | | 70 | | | | (26,794 | ) | | | (2,661 | ) | | | 6,608 | | | | 653 | |
| Class F-3 | | | 47,782 | | | | 4,729 | | | | 533 | | | | 53 | | | | (80,218 | ) | | | (7,922 | ) | | | (31,903 | ) | | | (3,140 | ) |
| Class R-6 | | | 16,157 | | | | 1,599 | | | | 1,887 | | | | 187 | | | | (21,874 | ) | | | (2,174 | ) | | | (3,830 | ) | | | (388 | ) |
| Total net increase (decrease) | | $ | 377,494 | | | | 37,444 | | | $ | 12,840 | | | | 1,276 | | | $ | (400,046 | ) | | | (39,693 | ) | | $ | (9,712 | ) | | | (973 | ) |
Limited Term Tax-Exempt Bond Fund of America
| | | Sales* | | | Reinvestments of
distributions | | | Repurchases* | | | Net (decrease)
increase | |
| Share class | | Amount | | | Shares | | | Amount | | | Shares | | | Amount | | | Shares | | | Amount | | | Shares | |
| | | | | | | | | | | | | | | | | | | | | | | | | | | | | | | | | |
| Six months ended January 31, 2019 |
| Class A | | $ | 540,214 | | | | 34,938 | | | $ | 28,661 | | | | 1,853 | | | $ | (691,507 | ) | | | (44,746 | ) | | $ | (122,632 | ) | | | (7,955 | ) |
| Class C | | | 4,472 | | | | 290 | | | | 128 | | | | 8 | | | | (4,810 | ) | | | (311 | ) | | | (210 | ) | | | (13 | ) |
| Class T | | | — | | | | — | | | | — | | | | — | | | | — | | | | — | | | | — | | | | — | |
| Class F-1 | | | 4,645 | | | | 300 | | | | 557 | | | | 36 | | | | (12,479 | ) | | | (807 | ) | | | (7,277 | ) | | | (471 | ) |
| Class F-2 | | | 226,903 | | | | 14,712 | | | | 4,086 | | | | 264 | | | | (135,667 | ) | | | (8,773 | ) | | | 95,322 | | | | 6,203 | |
| Class F-3 | | | 140,087 | | | | 9,072 | | | | 2,278 | | | | 147 | | | | (85,677 | ) | | | (5,532 | ) | | | 56,688 | | | | 3,687 | |
| Class R-6 | | | 31,363 | | | | 2,032 | | | | 3,373 | | | | 218 | | | | (26,860 | ) | | | (1,738 | ) | | | 7,876 | | | | 512 | |
| Total net increase (decrease) | | $ | 947,684 | | | | 61,344 | | | $ | 39,083 | | | | 2,526 | | | $ | (957,000 | ) | | | (61,907 | ) | | $ | 29,767 | | | | 1,963 | |
| | | | | | | | | | | | | | | | | | | | | | | | | | | | | | | | | |
| Year ended July 31, 2018 |
| Class A | | $ | 707,137 | | | | 45,220 | | | $ | 58,703 | | | | 3,763 | | | $ | (696,821 | ) | | | (44,622 | ) | | $ | 69,019 | | | | 4,361 | |
| Class C | | | 4,357 | | | | 279 | | | | 280 | | | | 18 | | | | (9,044 | ) | | | (579 | ) | | | (4,407 | ) | | | (282 | ) |
| Class T | | | — | | | | — | | | | — | | | | — | | | | — | | | | — | | | | — | | | | — | |
| Class F-1 | | | 28,021 | | | | 1,791 | | | | 1,451 | | | | 92 | | | | (47,647 | ) | | | (3,055 | ) | | | (18,175 | ) | | | (1,172 | ) |
| Class F-2 | | | 247,425 | | | | 15,810 | | | | 6,716 | | | | 431 | | | | (203,930 | ) | | | (13,081 | ) | | | 50,211 | | | | 3,160 | |
| Class F-3 | | | 121,425 | | | | 7,770 | | | | 2,877 | | | | 185 | | | | (46,337 | ) | | | (2,972 | ) | | | 77,965 | | | | 4,983 | |
| Class R-6 | | | 38,084 | | | | 2,428 | | | | 6,843 | | | | 439 | | | | (52,353 | ) | | | (3,359 | ) | | | (7,426 | ) | | | (492 | ) |
| Total net increase (decrease) | | $ | 1,146,449 | | | | 73,298 | | | $ | 76,870 | | | | 4,928 | | | $ | (1,056,132 | ) | | | (67,668 | ) | | $ | 167,187 | | | | 10,558 | |
| 66 | American Funds Tax-Exempt Funds |
The Tax-Exempt Bond Fund of America
| | | Sales* | | | Reinvestments of
distributions | | | Repurchases* | | | Net (decrease)
increase | |
| Share class | | Amount | | | Shares | | | Amount | | | Shares | | | Amount | | | Shares | | | Amount | | | Shares | |
| | | | | | | | | | | | | | | | | | | | | | |
| Six months ended January 31, 2019 | | | | | | | | | | | | | | | | | |
| Class A | | $ | 891,987 | | | | 70,078 | | | $ | 136,122 | | | | 10,696 | | | $ | (1,213,995 | ) | | | (95,608 | ) | | $ | (185,886 | ) | | | (14,834 | ) |
| Class C | | | 27,768 | | | | 2,183 | | | | 4,161 | | | | 327 | | | | (65,939 | ) | | | (5,188 | ) | | | (34,010 | ) | | | (2,678 | ) |
| Class T | | | — | | | | — | | | | — | | | | — | | | | — | | | | — | | | | — | | | | — | |
| Class F-1 | | | 31,435 | | | | 2,471 | | | | 4,563 | | | | 358 | | | | (75,657 | ) | | | (5,954 | ) | | | (39,659 | ) | | | (3,125 | ) |
| Class F-2 | | | 675,382 | | | | 53,145 | | | | 31,788 | | | | 2,498 | | | | (581,691 | ) | | | (45,847 | ) | | | 125,479 | | | | 9,796 | |
| Class F-3 | | | 836,739 | | | | 65,740 | | | | 84,562 | | | | 6,645 | | | | (836,471 | ) | | | (65,844 | ) | | | 84,830 | | | | 6,541 | |
| Class R-6 | | | 36,085 | | | | 2,827 | | | | 8,997 | | | | 707 | | | | (14,886 | ) | | | (1,168 | ) | | | 30,196 | | | | 2,366 | |
| Total net increase (decrease) | | $ | 2,499,396 | | | | 196,444 | | | $ | 270,193 | | | | 21,231 | | | $ | (2,788,639 | ) | | | (219,609 | ) | | $ | (19,050 | ) | | | (1,934 | ) |
| |
| Year ended July 31, 2018 | | | | | | | | | | | | | | | | | | | | | | | | | | |
| Class A | | $ | 1,681,309 | | | | 130,015 | | | $ | 272,626 | | | | 21,145 | | | $ | (1,405,277 | ) | | | (108,925 | ) | | $ | 548,658 | | | | 42,235 | |
| Class C | | | 80,078 | | | | 6,193 | | | | 9,249 | | | | 717 | | | | (125,594 | ) | | | (9,732 | ) | | | (36,267 | ) | | | (2,822 | ) |
| Class T | | | — | | | | — | | | | — | | | | — | | | | — | | | | — | | | | — | | | | — | |
| Class F-1 | | | 104,060 | | | | 8,060 | | | | 11,599 | | | | 899 | | | | (201,331 | ) | | | (15,621 | ) | | | (85,672 | ) | | | (6,662 | ) |
| Class F-2 | | | 993,761 | | | | 77,009 | | | | 58,043 | | | | 4,502 | | | | (756,576 | ) | | | (58,582 | ) | | | 295,228 | | | | 22,929 | |
| Class F-3 | | | 4,363,042 | | | | 337,721 | | | | 106,056 | | | | 8,255 | | | | (569,494 | ) | | | (44,325 | ) | | | 3,899,604 | | | | 301,651 | |
| Class R-6 | | | 183,540 | | | | 14,204 | | | | 14,656 | | | | 1,138 | | | | (21,419 | ) | | | (1,668 | ) | | | 176,777 | | | | 13,674 | |
| Total net increase (decrease) | | $ | 7,405,790 | | | | 573,202 | | | $ | 472,229 | | | | 36,656 | | | $ | (3,079,691 | ) | | | (238,853 | ) | | $ | 4,798,328 | | | | 371,005 | |
American High-Income Municipal Bond Fund
| | | Sales* | | | Reinvestments of
distributions | | | Repurchases* | | | Net increase
(decrease) | |
| Share class | | Amount | | | Shares | | | Amount | | | Shares | | | Amount | | | Shares | | | Amount | | | Shares | |
| | | | | | | | | | | | | | | | | | | | | | |
| Six months ended January 31, 2019 | | | | | | | | | | | | | | | | |
| Class A | | $ | 453,031 | | | | 28,986 | | | $ | 70,693 | | | | 4,521 | | | $ | (434,026 | ) | | | (27,823 | ) | | $ | 89,698 | | | | 5,684 | |
| Class C | | | 23,792 | | | | 1,522 | | | | 3,137 | | | | 201 | | | | (25,089 | ) | | | (1,606 | ) | | | 1,840 | | | | 117 | |
| Class T | | | — | | | | — | | | | — | | | | — | | | | — | | | | — | | | | — | | | | — | |
| Class F-1 | | | 21,056 | | | | 1,345 | | | | 3,250 | | | | 208 | | | | (58,727 | ) | | | (3,754 | ) | | | (34,421 | ) | | | (2,201 | ) |
| Class F-2 | | | 333,627 | | | | 21,366 | | | | 15,347 | | | | 982 | | | | (190,868 | ) | | | (12,232 | ) | | | 158,106 | | | | 10,116 | |
| Class F-3 | | | 133,287 | | | | 8,521 | | | | 11,764 | | | | 752 | | | | (73,112 | ) | | | (4,686 | ) | | | 71,939 | | | | 4,587 | |
| Class R-6 | | | 35,246 | | | | 2,243 | | | | 11,361 | | | | 726 | | | | (11,942 | ) | | | (764 | ) | | | 34,665 | | | | 2,205 | |
| Total net increase (decrease) | | $ | 1,000,039 | | | | 63,983 | | | $ | 115,552 | | | | 7,390 | | | $ | (793,764 | ) | | | (50,865 | ) | | $ | 321,827 | | | | 20,508 | |
| |
| Year ended July 31, 2018 | | | | | | | | | | | | | | | | | | | | | | | | | | |
| Class A | | $ | 782,611 | | | | 49,463 | | | $ | 133,367 | | | | 8,440 | | | $ | (508,503 | ) | | | (32,164 | ) | | $ | 407,475 | | | | 25,739 | |
| Class C | | | 47,927 | | | | 3,029 | | | | 6,316 | | | | 400 | | | | (57,636 | ) | | | (3,644 | ) | | | (3,393 | ) | | | (215 | ) |
| Class T | | | — | | | | — | | | | — | | | | — | | | | — | | | | — | | | | — | | | | — | |
| Class F-1 | | | 78,860 | | | | 4,990 | | | | 7,756 | | | | 490 | | | | (113,570 | ) | | | (7,178 | ) | | | (26,954 | ) | | | (1,698 | ) |
| Class F-2 | | | 441,075 | | | | 27,866 | | | | 24,137 | | | | 1,528 | | | | (272,343 | ) | | | (17,228 | ) | | | 192,869 | | | | 12,166 | |
| Class F-3 | | | 288,409 | | | | 18,214 | | | | 19,098 | | | | 1,209 | | | | (83,527 | ) | | | (5,278 | ) | | | 223,980 | | | | 14,145 | |
| Class R-6 | | | 172,242 | | | | 10,880 | | | | 18,502 | | | | 1,171 | | | | (21,095 | ) | | | (1,341 | ) | | | 169,649 | | | | 10,710 | |
| Total net increase (decrease) | | $ | 1,811,124 | | | | 114,442 | | | $ | 209,176 | | | | 13,238 | | | $ | (1,056,674 | ) | | | (66,833 | ) | | $ | 963,626 | | | | 60,847 | |
See end of tables for footnote.
| American Funds Tax-Exempt Funds | 67 |
The Tax-Exempt Fund of California
| | | Sales* | | | Reinvestments of
distributions | | | Repurchases* | | | Net (decrease)
increase | |
| Share class | | Amount | | | Shares | | | Amount | | | Shares | | | Amount | | | Shares | | | Amount | | | Shares | |
| | | | | | | | | | | | | | | | |
| Six months ended January 31, 2019 | | | | | | | | | | | | | | | |
| Class A | | $ | 181,256 | | | | 10,460 | | | $ | 21,804 | | | | 1,260 | | | $ | (251,791 | ) | | | (14,605 | ) | | $ | (48,731 | ) | | | (2,885 | ) |
| Class C | | | 4,071 | | | | 235 | | | | 698 | | | | 40 | | | | (10,249 | ) | | | (592 | ) | | | (5,480 | ) | | | (317 | ) |
| Class T | | | — | | | | — | | | | — | | | | — | | | | — | | | | — | | | | — | | | | — | |
| Class F-1 | | | 5,232 | | | | 303 | | | | 955 | | | | 56 | | | | (12,025 | ) | | | (694 | ) | | | (5,838 | ) | | | (335 | ) |
| Class F-2 | | | 157,552 | | | | 9,146 | | | | 4,144 | | | | 239 | | | | (64,191 | ) | | | (3,718 | ) | | | 97,505 | | | | 5,667 | |
| Class F-3 | | | 35,873 | | | | 2,075 | | | | 2,418 | | | | 139 | | | | (33,693 | ) | | | (1,953 | ) | | | 4,598 | | | | 261 | |
| Total net increase (decrease) | | $ | 383,984 | | | | 22,219 | | | $ | 30,019 | | | | 1,734 | | | $ | (371,949 | ) | | | (21,562 | ) | | $ | 42,054 | | | | 2,391 | |
| |
| Year ended July 31, 2018 | | | | | | | | | | | | | | | | | | | | | | | | | | |
| Class A | | $ | 259,065 | | | | 14,726 | | | $ | 43,350 | | | | 2,472 | | | $ | (246,151 | ) | | | (14,019 | ) | | $ | 56,264 | | | | 3,179 | |
| Class C | | | 14,343 | | | | 815 | | | | 1,554 | | | | 89 | | | | (26,591 | ) | | | (1,515 | ) | | | (10,694 | ) | | | (611 | ) |
| Class T | | | — | | | | — | | | | — | | | | — | | | | — | | | | — | | | | — | | | | — | |
| Class F-1 | | | 27,505 | | | | 1,567 | | | | 1,914 | | | | 109 | | | | (29,310 | ) | | | (1,670 | ) | | | 109 | | | | 6 | |
| Class F-2 | | | 112,357 | | | | 6,393 | | | | 6,168 | | | | 352 | | | | (58,335 | ) | | | (3,326 | ) | | | 60,190 | | | | 3,419 | |
| Class F-3 | | | 67,902 | | | | 3,867 | | | | 3,891 | | | | 222 | | | | (20,323 | ) | | | (1,158 | ) | | | 51,470 | | | | 2,931 | |
| Total net increase (decrease) | | $ | 481,172 | | | | 27,368 | | | $ | 56,877 | | | | 3,244 | | | $ | (380,710 | ) | | | (21,688 | ) | | $ | 157,339 | | | | 8,924 | |
American Funds Tax-Exempt Fund of New York
| | | Sales* | | | Reinvestments of
distributions | | | Repurchases* | | | Net (decrease)
increase | |
| Share class | | Amount | | | Shares | | | Amount | | | Shares | | | Amount | | | Shares | | | Amount | | | Shares | |
| | | | | | | | | | | | | | | | | | | | | | |
| Six months ended January 31, 2019 | | | | | | | | | | | | |
| Class A | | $ | 20,949 | | | | 1,987 | | | $ | 1,833 | | | | 174 | | | $ | (28,170 | ) | | | (2,684 | ) | | $ | (5,388 | ) | | | (523 | ) |
| Class C | | | 772 | | | | 73 | | | | 96 | | | | 9 | | | | (1,437 | ) | | | (136 | ) | | | (569 | ) | | | (54 | ) |
| Class T | | | — | | | | — | | | | — | | | | — | | | | — | | | | — | | | | — | | | | — | |
| Class F-1 | | | 212 | | | | 20 | | | | 19 | | | | 2 | | | | (419 | ) | | | (40 | ) | | | (188 | ) | | | (18 | ) |
| Class F-2 | | | 16,867 | | | | 1,609 | | | | 295 | | | | 28 | | | | (6,231 | ) | | | (592 | ) | | | 10,931 | | | | 1,045 | |
| Class F-3 | | | 13,520 | | | | 1,283 | | | | 271 | | | | 26 | | | | (10,790 | ) | | | (1,023 | ) | | | 3,001 | | | | 286 | |
| Total net increase (decrease) | | $ | 52,320 | | | | 4,972 | | | $ | 2,514 | | | | 239 | | | $ | (47,047 | ) | | | (4,475 | ) | | $ | 7,787 | | | | 736 | |
| |
| Year ended July 31, 2018 | | | | | | | | | | | | | | | | | | | | | | | | | | |
| Class A | | $ | 38,634 | | | | 3,605 | | | $ | 3,569 | | | | 334 | | | $ | (25,328 | ) | | | (2,369 | ) | | $ | 16,875 | | | | 1,570 | |
| Class C | | | 2,347 | | | | 219 | | | | 196 | | | | 19 | | | | (3,139 | ) | | | (293 | ) | | | (596 | ) | | | (55 | ) |
| Class T | | | — | | | | — | | | | — | | | | — | | | | — | | | | — | | | | — | | | | — | |
| Class F-1 | | | 1,142 | | | | 106 | | | | 57 | | | | 5 | | | | (1,670 | ) | | | (157 | ) | | | (471 | ) | | | (46 | ) |
| Class F-2 | | | 9,234 | | | | 861 | | | | 358 | | | | 33 | | | | (4,652 | ) | | | (435 | ) | | | 4,940 | | | | 459 | |
| Class F-3 | | | 12,329 | | | | 1,152 | | | | 433 | | | | 40 | | | | (2,388 | ) | | | (225 | ) | | | 10,374 | | | | 967 | |
| Total net increase (decrease) | | $ | 63,686 | | | | 5,943 | | | $ | 4,613 | | | | 431 | | | $ | (37,177 | ) | | | (3,479 | ) | | $ | 31,122 | | | | 2,895 | |
| * | Includes exchanges between share classes of the fund. |
| 68 | American Funds Tax-Exempt Funds |
10. Investment transactions
Each fund made purchases and sales of investment securities, excluding short-term securities and U.S. government obligations, if any, during the six months ended January 31, 2019, as follows (dollars in thousands):
| Fund | | Purchases | | | Sales | |
| American Funds Short-Term Tax-Exempt Bond Fund | | $ | 389,503 | | | $ | 201,258 | |
| Limited Term Tax-Exempt Bond Fund of America | | | 735,497 | | | | 652,329 | |
| The Tax-Exempt Bond Fund of America | | | 2,480,187 | | | | 2,231,522 | |
| American High-Income Municipal Bond Fund | | | 1,151,245 | | | | 740,669 | |
| The Tax-Exempt Fund of California | | | 367,076 | | | | 303,291 | |
| American Funds Tax-Exempt Fund of New York | | | 32,238 | | | | 21,597 | |
11. Ownership concentration
At January 31, 2019, CRMC held aggregate ownership of 14% of the outstanding shares of American Funds Tax-Exempt Fund of New York. The ownership represents the seed money invested in the fund when it began operations on November 1, 2010. In addition, American Funds Tax-Exempt Preservation Portfolio held 11% of the outstanding shares of American Funds Short-Term Tax-Exempt Bond Fund. CRMC is the investment adviser to all of the funds.
| American Funds Tax-Exempt Funds | 69 |
Financial highlights
American Funds Short-Term Tax-Exempt Bond Fund
| | | | | | Income from investment operations1 | | | | | | | | | | | | | | | | | | | |
| Period ended | | Net asset
value,
beginning
of period | | | Net
investment
income | | | Net gains
(losses) on
securities
(both
realized and
unrealized) | | | Total from
investment
operations | | | Dividends
(from net
investment
income) | | | Net asset
value,
end
of period | | | Total
return2 | | | Net assets,
end of period
(in millions) | | | Ratio of
expenses
to average
net assets | | | Ratio of
net income
to average
net assets | |
| Class A: | | | | | | | | | | | | | | | | | | | | | | | | | | | | | | | | | | | | | | | | |
| 1/31/20193,4 | | $ | 10.04 | | | $ | .08 | | | $ | .02 | | | $ | .10 | | | $ | (.08 | ) | | $ | 10.06 | | | | .97 | %5 | | $ | 784 | | | | .59 | %6 | | | 1.53 | %6 |
| 7/31/2018 | | | 10.15 | | | | .13 | | | | (.11 | ) | | | .02 | | | | (.13 | ) | | | 10.04 | | | | .24 | | | | 752 | | | | .58 | | | | 1.33 | |
| 7/31/2017 | | | 10.22 | | | | .12 | | | | (.07 | ) | | | .05 | | | | (.12 | ) | | | 10.15 | | | | .46 | | | | 739 | | | | .59 | | | | 1.15 | |
| 7/31/2016 | | | 10.17 | | | | .10 | | | | .05 | | | | .15 | | | | (.10 | ) | | | 10.22 | | | | 1.51 | | | | 688 | | | | .59 | | | | 1.02 | |
| 7/31/2015 | | | 10.25 | | | | .11 | | | | (.08 | ) | | | .03 | | | | (.11 | ) | | | 10.17 | | | | .26 | | | | 653 | | | | .58 | | | | 1.04 | |
| 7/31/2014 | | | 10.21 | | | | .11 | | | | .04 | | | | .15 | | | | (.11 | ) | | | 10.25 | | | | 1.43 | | | | 737 | | | | .58 | | | | 1.04 | |
| Class T: | | | | | | | | | | | | | | | | | | | | | | | | | | | | | | | | | | | | | | | | |
| 1/31/20193,4 | | | 10.04 | | | | .08 | | | | .02 | | | | .10 | | | | (.08 | ) | | | 10.06 | | | | 1.02 | 5,7 | | | — | 8 | | | .48 | 6,7 | | | 1.62 | 6,7 |
| 7/31/2018 | | | 10.15 | | | | .15 | | | | (.11 | ) | | | .04 | | | | (.15 | ) | | | 10.04 | | | | .36 | 7 | | | — | 8 | | | .47 | 7 | | | 1.44 | 7 |
| 7/31/20173,9 | | | 10.11 | | | | .04 | | | | .04 | | | | .08 | | | | (.04 | ) | | | 10.15 | | | | .82 | 5,7 | | | — | 8 | | | .15 | 5,7 | | | .42 | 5,7 |
| Class F-1: | | | | | | | | | | | | | | | | | | | | | | | | | | | | | | | | | | | | | | | | |
| 1/31/20193,4 | | | 10.04 | | | | .06 | | | | .02 | | | | .08 | | | | (.06 | ) | | | 10.06 | | | | .85 | 5 | | | 7 | | | | .83 | 6 | | | 1.29 | 6 |
| 7/31/2018 | | | 10.15 | | | | .11 | | | | (.11 | ) | | | — | 10 | | | (.11 | ) | | | 10.04 | | | | .02 | | | | 7 | | | | .80 | | | | 1.10 | |
| 7/31/2017 | | | 10.22 | | | | .09 | | | | (.07 | ) | | | .02 | | | | (.09 | ) | | | 10.15 | | | | .23 | | | | 9 | | | | .82 | | | | .92 | |
| 7/31/2016 | | | 10.17 | | | | .08 | | | | .05 | | | | .13 | | | | (.08 | ) | | | 10.22 | | | | 1.29 | | | | 13 | | | | .81 | | | �� | .80 | |
| 7/31/2015 | | | 10.25 | | | | .08 | | | | (.08 | ) | | | — | 10 | | | (.08 | ) | | | 10.17 | | | | .05 | | | | 9 | | | | .80 | | | | .83 | |
| 7/31/2014 | | | 10.21 | | | | .08 | | | | .04 | | | | .12 | | | | (.08 | ) | | | 10.25 | | | | 1.19 | | | | 14 | | | | .82 | | | | .80 | |
| Class F-2: | | | | | | | | | | | | | | | | | | | | | | | | | | | | | | | | | | | | | | | | |
| 1/31/20193,4 | | | 10.04 | | | | .08 | | | | .02 | | | | .10 | | | | (.08 | ) | | | 10.06 | | | | 1.01 | 5 | | | 180 | | | | .51 | 6 | | | 1.63 | 6 |
| 7/31/2018 | | | 10.15 | | | | .14 | | | | (.11 | ) | | | .03 | | | | (.14 | ) | | | 10.04 | | | | .28 | | | | 52 | | | | .54 | | | | 1.37 | |
| 7/31/2017 | | | 10.22 | | | | .12 | | | | (.07 | ) | | | .05 | | | | (.12 | ) | | | 10.15 | | | | .49 | | | | 47 | | | | .57 | | | | 1.17 | |
| 7/31/2016 | | | 10.17 | | | | .11 | | | | .05 | | | | .16 | | | | (.11 | ) | | | 10.22 | | | | 1.55 | | | | 80 | | | | .56 | | | | 1.06 | |
| 7/31/2015 | | | 10.25 | | | | .11 | | | | (.08 | ) | | | .03 | | | | (.11 | ) | | | 10.17 | | | | .29 | | | | 64 | | | | .55 | | | | 1.08 | |
| 7/31/2014 | | | 10.21 | | | | .11 | | | | .04 | | | | .15 | | | | (.11 | ) | | | 10.25 | | | | 1.47 | | | | 46 | | | | .54 | | | | 1.07 | |
| 70 | American Funds Tax-Exempt Funds |
American Funds Short-Term Tax-Exempt Bond Fund
| | | | | | Income from investment operations1 | | | | | | | | | | | | | | | | | | | |
| Period ended | | Net asset
value,
beginning
of period | | | Net
investment
income | | | Net gains
(losses) on
securities
(both
realized and
unrealized) | | | Total from
investment
operations | | | Dividends
(from net
investment
income) | | | Net asset
value,
end
of period | | | Total
return2 | | | Net assets,
end of period
(in millions) | | | Ratio of
expenses
to average
net assets | | | Ratio of
net income
to average
net assets | |
| Class F-3: | | | | | | | | | | | | | | | | | | | | | | | | | | | | | | | | | | | | | | | | |
| 1/31/20193,4 | | $ | 10.04 | | | $ | .08 | | | $ | .02 | | | $ | .10 | | | $ | (.08 | ) | | $ | 10.06 | | | | 1.04 | %5 | | $ | 42 | | | | .45 | %6 | | | 1.66 | %6 |
| 7/31/2018 | | | 10.15 | | | | .15 | | | | (.11 | ) | | | .04 | | | | (.15 | ) | | | 10.04 | | | | .38 | | | | 45 | | | | .44 | | | | 1.45 | |
| 7/31/20173,11 | | | 10.07 | | | | .07 | | | | .08 | | | | .15 | | | | (.07 | ) | | | 10.15 | | | | 1.49 | 5 | | | 77 | | | | .47 | 6 | | | 1.35 | 6 |
| Class R-6: | | | | | | | | | | | | | | | | | | | | | | | | | | | | | | | | | | | | | | | | |
| 1/31/20193,4 | | | 10.04 | | | | .08 | | | | .02 | | | | .10 | | | | (.08 | ) | | | 10.06 | | | | 1.05 | 5 | | | 126 | | | | .44 | 6 | | | 1.67 | 6 |
| 7/31/2018 | | | 10.15 | | | | .15 | | | | (.11 | ) | | | .04 | | | | (.15 | ) | | | 10.04 | | | | .38 | | | | 122 | | | | .44 | | | | 1.48 | |
| 7/31/20173,12 | | | 10.09 | | | | .05 | | | | .06 | | | | .11 | | | | (.05 | ) | | | 10.15 | | | | 1.20 | 5 | | | 127 | | | | .17 | 5 | | | .51 | 5 |
| | | Six months ended
January 31, | | Year ended July 31 | |
| | | 20193,4,5 | | 2018 | | 2017 | | 2016 | | 2015 | | 2014 |
| Portfolio turnover rate for all share classes | | | 22% | | | | 34 | % | | | 26 | % | | | 21 | % | | | 38 | % | | | 20 | % |
| 1 | Based on average shares outstanding. |
| 2 | Total returns exclude any applicable sales charges, including contingent deferred sales charges. |
| 3 | Based on operations for a period that is less than a full year. |
| 4 | Unaudited. |
| 5 | Not annualized. |
| 6 | Annualized. |
| 7 | All or a significant portion of assets in this class consisted of seed capital invested by CRMC and/or its affiliates. Fees for distribution services are not charged or accrued on these seed capital assets. If such fees were paid by the fund on seed capital assets, fund expenses would have been higher and net income and total return would have been lower. |
| 8 | Amount less than $1 million. |
| 9 | Class T shares began investment operations on April 7, 2017. |
| 10 | Amount less than $.01. |
| 11 | Class F-3 shares began investment operations on January 27, 2017. |
| 12 | Class R-6 shares began investment operations on March 17, 2017. |
See notes to financial statements
| American Funds Tax-Exempt Funds | 71 |
Financial highlights (continued)
Limited Term Tax-Exempt Bond Fund of America
| | | | | | Income (loss) from investment operations1 | | | | | | | | | | | | | | | | | | | |
| Period ended | | Net asset
value,
beginning
of period | | | Net
investment
income | | | Net gains
(losses) on
securities
(both
realized and
unrealized) | | | Total from
investment
operations | | | Dividends
(from net
investment
income) | | | Net asset
value,
end
of period | | | Total
return2 | | | Net assets,
end of period
(in millions) | | | Ratio of
expenses
to average
net assets | | | Ratio of
net income
to average
net assets | |
| Class A: | | | | | | | | | | | | | | | | | | | | | | | | | | | | | | | | | | | | | | | | |
| 1/31/20193,4 | | $ | 15.52 | | | $ | .16 | | | $ | .07 | | | $ | .23 | | | $ | (.16 | ) | | $ | 15.59 | | | | 1.49 | %5 | | $ | 2,945 | | | | .59 | %6 | | | 2.05 | %6 |
| 7/31/2018 | | | 15.77 | | | | .31 | | | | (.25 | ) | | | .06 | | | | (.31 | ) | | | 15.52 | | | | .40 | | | | 3,057 | | | | .59 | | | | 2.00 | |
| 7/31/2017 | | | 16.04 | | | | .32 | | | | (.27 | ) | | | .05 | | | | (.32 | ) | | | 15.77 | | | | .34 | | | | 3,038 | | | | .59 | | | | 2.04 | |
| 7/31/2016 | | | 15.92 | | | | .35 | | | | .12 | | | | .47 | | | | (.35 | ) | | | 16.04 | | | | 2.97 | | | | 3,055 | | | | .59 | | | | 2.17 | |
| 7/31/2015 | | | 16.10 | | | | .38 | | | | (.18 | ) | | | .20 | | | | (.38 | ) | | | 15.92 | | | | 1.23 | | | | 2,670 | | | | .57 | | | | 2.36 | |
| 7/31/2014 | | | 15.94 | | | | .40 | | | | .16 | | | | .56 | | | | (.40 | ) | | | 16.10 | | | | 3.56 | | | | 2,615 | | | | .60 | | | | 2.51 | |
| Class C: | | | | | | | | | | | | | | | | | | | | | | | | | | | | | | | | | | | | | | | | |
| 1/31/20193,4 | | | 15.52 | | | | .10 | | | | .07 | | | | .17 | | | | (.10 | ) | | | 15.59 | | | | 1.11 | 5 | | | 20 | | | | 1.33 | 6 | | | 1.31 | 6 |
| 7/31/2018 | | | 15.77 | | | | .20 | | | | (.25 | ) | | | (.05 | ) | | | (.20 | ) | | | 15.52 | | | | (.34 | ) | | | 20 | | | | 1.34 | | | | 1.26 | |
| 7/31/2017 | | | 16.04 | | | | .20 | | | | (.27 | ) | | | (.07 | ) | | | (.20 | ) | | | 15.77 | | | | (.40 | ) | | | 25 | | | | 1.33 | | | | 1.30 | |
| 7/31/2016 | | | 15.92 | | | | .23 | | | | .12 | | | | .35 | | | | (.23 | ) | | | 16.04 | | | | 2.20 | | | | 30 | | | | 1.33 | | | | 1.43 | |
| 7/31/2015 | | | 16.10 | | | | .26 | | | | (.18 | ) | | | .08 | | | | (.26 | ) | | | 15.92 | | | | .47 | | | | 30 | | | | 1.33 | | | | 1.60 | |
| 7/31/2014 | | | 15.94 | | | | .28 | | | | .16 | | | | .44 | | | | (.28 | ) | | | 16.10 | | | | 2.80 | | | | 38 | | | | 1.34 | | | | 1.78 | |
| Class T: | | | | | | | | | | | | | | | | | | | | | | | | | | | | | | | | | | | | | | | | |
| 1/31/20193,4 | | | 15.52 | | | | .18 | | | | .07 | | | | .25 | | | | (.18 | ) | | | 15.59 | | | | 1.62 | 5,7 | | | — | 8 | | | .33 | 6,7 | | | 2.31 | 6,7 |
| 7/31/2018 | | | 15.77 | | | | .36 | | | | (.25 | ) | | | .11 | | | | (.36 | ) | | | 15.52 | | | | .68 | 7 | | | — | 8 | | | .33 | 7 | | | 2.26 | 7 |
| 7/31/20173,9 | | | 15.68 | | | | .12 | | | | .09 | | | | .21 | | | | (.12 | ) | | | 15.77 | | | | 1.32 | 5,7 | | | — | 8 | | | .10 | 5,7 | | | .74 | 5,7 |
| Class F-1: | | | | | | | | | | | | | | | | | | | | | | | | | | | | | | | | | | | | | | | | |
| 1/31/20193,4 | | | 15.52 | | | | .15 | | | | .07 | | | | .22 | | | | (.15 | ) | | | 15.59 | | | | 1.44 | 5 | | | 57 | | | | .68 | 6 | | | 1.96 | 6 |
| 7/31/2018 | | | 15.77 | | | | .30 | | | | (.25 | ) | | | .05 | | | | (.30 | ) | | | 15.52 | | | | .33 | | | | 64 | | | | .66 | | | | 1.93 | |
| 7/31/2017 | | | 16.04 | | | | .31 | | | | (.27 | ) | | | .04 | | | | (.31 | ) | | | 15.77 | | | | .26 | | | | 83 | | | | .67 | | | | 1.96 | |
| 7/31/2016 | | | 15.92 | | | | .33 | | | | .12 | | | | .45 | | | | (.33 | ) | | | 16.04 | | | | 2.88 | | | | 90 | | | | .67 | | | | 2.09 | |
| 7/31/2015 | | | 16.10 | | | | .36 | | | | (.18 | ) | | | .18 | | | | (.36 | ) | | | 15.92 | | | | 1.13 | | | | 84 | | | | .67 | | | | 2.27 | |
| 7/31/2014 | | | 15.94 | | | | .39 | | | | .16 | | | | .55 | | | | (.39 | ) | | | 16.10 | | | | 3.49 | | | | 105 | | | | .67 | | | | 2.45 | |
| 72 | American Funds Tax-Exempt Funds |
Limited Term Tax-Exempt Bond Fund of America
| | | | | | Income (loss) from investment operations1 | | | | | | | | | | | | | | | | | | | |
| Period ended | | Net asset
value,
beginning
of period | | | Net
investment
income | | | Net gains
(losses) on
securities
(both
realized and
unrealized) | | | Total from
investment
operations | | | Dividends
(from net
investment
income) | | | Net asset
value,
end
of period | | | Total
return2 | | | Net assets,
end of period
(in millions) | | | Ratio of
expenses
to average
net assets | | | Ratio of
net income
to average
net assets | |
| Class F-2: | | | | | | | | | | | | | | | | | | | | | | | | | | | | | | | | | | | | | | | | |
| 1/31/20193,4 | | $ | 15.52 | | | $ | .17 | | | $ | .07 | | | $ | .24 | | | $ | (.17 | ) | | $ | 15.59 | | | | 1.58 | %5 | | $ | 451 | | | | .40 | %6 | | | 2.24 | %6 |
| 7/31/2018 | | | 15.77 | | | | .34 | | | | (.25 | ) | | | .09 | | | | (.34 | ) | | | 15.52 | | | | .58 | | | | 353 | | | | .41 | | | | 2.18 | |
| 7/31/2017 | | | 16.04 | | | | .35 | | | | (.27 | ) | | | .08 | | | | (.35 | ) | | | 15.77 | | | | .51 | | | | 309 | | | | .42 | | | | 2.22 | |
| 7/31/2016 | | | 15.92 | | | | .38 | | | | .12 | | | | .50 | | | | (.38 | ) | | | 16.04 | | | | 3.15 | | | | 291 | | | | .41 | | | | 2.34 | |
| 7/31/2015 | | | 16.10 | | | | .40 | | | | (.18 | ) | | | .22 | | | | (.40 | ) | | | 15.92 | | | | 1.39 | | | | 208 | | | | .41 | | | | 2.52 | |
| 7/31/2014 | | | 15.94 | | | | .43 | | | | .16 | | | | .59 | | | | (.43 | ) | | | 16.10 | | | | 3.75 | | | | 183 | | | | .42 | | | | 2.69 | |
| Class F-3: | | | | | | | | | | | | | | | | | | | | | | | | | | | | | | | | | | | | | | | | |
| 1/31/20193,4 | | | 15.52 | | | | .18 | | | | .07 | | | | .25 | | | | (.18 | ) | | | 15.59 | | | | 1.64 | 5 | | | 246 | | | | .30 | 6 | | | 2.34 | 6 |
| 7/31/2018 | | | 15.77 | | | | .36 | | | | (.25 | ) | | | .11 | | | | (.36 | ) | | | 15.52 | | | | .70 | | | | 187 | | | | .30 | | | | 2.29 | |
| 7/31/20173,10 | | | 15.59 | | | | .19 | | | | .18 | | | | .37 | | | | (.19 | ) | | | 15.77 | | | | 2.37 | 5 | | | 112 | | | | .30 | 6 | | | 2.36 | 6 |
| Class R-6: | | | | | | | | | | | | | | | | | | | | | | | | | | | | | | | | | | | | | | | | |
| 1/31/20193,4 | | | 15.52 | | | | .18 | | | | .07 | | | | .25 | | | | (.18 | ) | | | 15.59 | | | | 1.64 | 5 | | | 293 | | | | .30 | 6 | | | 2.34 | 6 |
| 7/31/2018 | | | 15.77 | | | | .36 | | | | (.25 | ) | | | .11 | | | | (.36 | ) | | | 15.52 | | | | .70 | | | | 284 | | | | .30 | | | | 2.29 | |
| 7/31/2017 | | | 16.04 | | | | .37 | | | | (.27 | ) | | | .10 | | | | (.37 | ) | | | 15.77 | | | | .63 | | | | 296 | | | | .30 | | | | 2.33 | |
| 7/31/2016 | | | 15.92 | | | | .39 | | | | .12 | | | | .51 | | | | (.39 | ) | | | 16.04 | | | | 3.26 | | | | 284 | | | | .30 | | | | 2.45 | |
| 7/31/2015 | | | 16.10 | | | | .42 | | | | (.18 | ) | | | .24 | | | | (.42 | ) | | | 15.92 | | | | 1.50 | | | | 190 | | | | .31 | | | | 2.62 | |
| 7/31/2014 | | | 15.94 | | | | .45 | | | | .16 | | | | .61 | | | | (.45 | ) | | | 16.10 | | | | 3.86 | | | | 133 | | | | .31 | | | | 2.80 | |
| | | Six months ended | | | | | | | | | | | | | | | |
| | | January 31, | | Year ended July 31 |
| | | 20193,4,5 | | 2018 | | 2017 | | 2016 | | 2015 | | 2014 |
| Portfolio turnover rate for all share classes | | | 18 | % | | | 28 | % | | | 27 | % | | | 16 | % | | | 19 | % | | | 9 | % |
| 1 | Based on average shares outstanding. |
| 2 | Total returns exclude any applicable sales charges, including contingent deferred sales charges. |
| 3 | Based on operations for a period that is less than a full year. |
| 4 | Unaudited. |
| 5 | Not annualized. |
| 6 | Annualized. |
| 7 | All or a significant portion of assets in this class consisted of seed capital invested by CRMC and/or its affiliates. Fees for distribution services are not charged or accrued on these seed capital assets. If such fees were paid by the fund on seed capital assets, fund expenses would have been higher and net income and total return would have been lower. |
| 8 | Amount less than $1 million. |
| 9 | Class T shares began investment operations on April 7, 2017. |
| 10 | Class F-3 shares began investment operations on January 27, 2017. |
See notes to financial statements
| American Funds Tax-Exempt Funds | 73 |
Financial highlights (continued)
The Tax-Exempt Bond Fund of America
| | | | | | Income (loss) from investment operations1 | | | | | | | | | | | | | | | | | | | |
| Period ended | | Net asset
value,
beginning
of period | | | Net
investment
income | | | Net gains
(losses) on
securities
(both
realized and
unrealized) | | | Total from
investment
operations | | | Dividends
(from net
investment
income) | | | Net asset
value,
end
of period | | | Total
return2 | | | Net assets,
end of period
(in millions) | | | Ratio of
expenses
to average
net assets | | | Ratio of
net income
to average
net assets | |
| Class A: | | | | | | | | | | | | | | | | | | | | | | | | | | | | | | | | | | | | | | | | |
| 1/31/20193,4 | | $ | 12.81 | | | $ | .19 | | | $ | .02 | | | $ | .21 | | | $ | (.19 | ) | | $ | 12.83 | | | | 1.63 | %5 | | $ | 9,925 | | | | .53 | %6 | | | 2.91 | %6 |
| 7/31/2018 | | | 12.98 | | | | .38 | | | | (.17 | ) | | | .21 | | | | (.38 | ) | | | 12.81 | | | | 1.60 | | | | 10,102 | | | | .53 | | | | 2.91 | |
| 7/31/2017 | | | 13.40 | | | | .40 | | | | (.42 | ) | | | (.02 | ) | | | (.40 | ) | | | 12.98 | | | | (.09 | ) | | | 9,692 | | | | .53 | | | | 3.12 | |
| 7/31/2016 | | | 12.96 | | | | .41 | | | | .44 | | | | .85 | | | | (.41 | ) | | | 13.40 | | | | 6.69 | | | | 9,510 | | | | .54 | | | | 3.15 | |
| 7/31/2015 | | | 12.92 | | | | .42 | | | | .04 | | | | .46 | | | | (.42 | ) | | | 12.96 | | | | 3.62 | | | | 7,385 | | | | .54 | | | | 3.28 | |
| 7/31/2014 | | | 12.44 | | | | .45 | | | | .48 | | | | .93 | | | | (.45 | ) | | | 12.92 | | | | 7.60 | | | | 6,772 | | | | .56 | | | | 3.57 | |
| Class C: | | | | | | | | | | | | | | | | | | | | | | | | | | | | | | | | | | | | | | | | |
| 1/31/20193,4 | | | 12.81 | | | | .13 | | | | .02 | | | | .15 | | | | (.13 | ) | | | 12.83 | | | | 1.22 | 5 | | | 398 | | | | 1.32 | 6 | | | 2.12 | 6 |
| 7/31/2018 | | | 12.98 | | | | .27 | | | | (.17 | ) | | | .10 | | | | (.27 | ) | | | 12.81 | | | | .80 | | | | 432 | | | | 1.32 | | | | 2.12 | |
| 7/31/2017 | | | 13.40 | | | | .30 | | | | (.42 | ) | | | (.12 | ) | | | (.30 | ) | | | 12.98 | | | | (.88 | ) | | | 474 | | | | 1.32 | | | | 2.33 | |
| 7/31/2016 | | | 12.96 | | | | .31 | | | | .44 | | | | .75 | | | | (.31 | ) | | | 13.40 | | | | 5.85 | | | | 517 | | | | 1.33 | | | | 2.35 | |
| 7/31/2015 | | | 12.92 | | | | .32 | | | | .04 | | | | .36 | | | | (.32 | ) | | | 12.96 | | | | 2.80 | | | | 349 | | | | 1.33 | | | | 2.50 | |
| 7/31/2014 | | | 12.44 | | | | .35 | | | | .48 | | | | .83 | | | | (.35 | ) | | | 12.92 | | | | 6.75 | | | | 325 | | | | 1.35 | | | | 2.79 | |
| Class T: | | | | | | | | | | | | | | | | | | | | | | | | | | | | | | | | | | | | | | | | |
| 1/31/20193,4 | | | 12.81 | | | | .20 | | | | .02 | | | | .22 | | | | (.20 | ) | | | 12.83 | | | | 1.73 | 5,7 | | | — | 8 | | | .33 | 6,7 | | | 3.11 | 6,7 |
| 7/31/2018 | | | 12.98 | | | | .40 | | | | (.17 | ) | | | .23 | | | | (.40 | ) | | | 12.81 | | | | 1.83 | 7 | | | — | 8 | | | .32 | 7 | | | 3.12 | 7 |
| 7/31/20173,9 | | | 12.85 | | | | .14 | | | | .13 | | | | .27 | | | | (.14 | ) | | | 12.98 | | | | 2.07 | 5,7 | | | — | 8 | | | .10 | 5,7 | | | 1.06 | 5,7 |
| Class F-1: | | | | | | | | | | | | | | | | | | | | | | | | | | | | | | | | | | | | | | | | |
| 1/31/20193,4 | | | 12.81 | | | | .18 | | | | .02 | | | | .20 | | | | (.18 | ) | | | 12.83 | | | | 1.55 | 5 | | | 330 | | | | .66 | 6 | | | 2.77 | 6 |
| 7/31/2018 | | | 12.98 | | | | .36 | | | | (.17 | ) | | | .19 | | | | (.36 | ) | | | 12.81 | | | | 1.48 | | | | 370 | | | | .65 | | | | 2.80 | |
| 7/31/2017 | | | 13.40 | | | | .39 | | | | (.43 | ) | | | (.04 | ) | | | (.38 | ) | | | 12.98 | | | | (.22 | ) | | | 461 | | | | .66 | | | | 2.99 | |
| 7/31/2016 | | | 12.96 | | | | .39 | | | | .44 | | | | .83 | | | | (.39 | ) | | | 13.40 | | | | 6.53 | | | | 518 | | | | .67 | | | | 3.04 | |
| 7/31/2015 | | | 12.92 | | | | .41 | | | | .04 | | | | .45 | | | | (.41 | ) | | | 12.96 | | | | 3.49 | | | | 1,474 | | | | .67 | | | | 3.16 | |
| 7/31/2014 | | | 12.44 | | | | .43 | | | | .48 | | | | .91 | | | | (.43 | ) | | | 12.92 | | | | 7.46 | | | | 1,389 | | | | .68 | | | | 3.46 | |
| 74 | American Funds Tax-Exempt Funds |
The Tax-Exempt Bond Fund of America
| | | | | | Income (loss) from investment operations1 | | | | | | | | | | | | | | | | | | | |
| Period ended | | Net asset
value,
beginning
of period | | | Net
investment
income | | | Net gains
(losses) on
securities
(both
realized and
unrealized) | | | Total from
investment
operations | | | Dividends
(from net
investment
income) | | | Net asset
value,
end
of period | | | Total
return2 | | | Net assets,
end of period
(in millions) | | | Ratio of
expenses
to average
net assets | | | Ratio of
net income
to average
net assets | |
| Class F-2: | | | | | | | | | | | | | | | | | | | | | | | | | | | | | | | | | | | | | | | | |
| 1/31/20193,4 | | $ | 12.81 | | | $ | .19 | | | $ | .02 | | | $ | .21 | | | $ | (.19 | ) | | $ | 12.83 | | | | 1.69 | %5 | | $ | 2,306 | | | | .40 | %6 | | | 3.04 | %6 |
| 7/31/2018 | | | 12.98 | | | | .39 | | | | (.17 | ) | | | .22 | | | | (.39 | ) | | | 12.81 | | | | 1.74 | | | | 2,177 | | | | .39 | | | | 3.05 | |
| 7/31/2017 | | | 13.40 | | | | .42 | | | | (.42 | ) | | | — | 10 | | | (.42 | ) | | | 12.98 | | | | .03 | | | | 1,909 | | | | .41 | | | | 3.24 | |
| 7/31/2016 | | | 12.96 | | | | .43 | | | | .44 | | | | .87 | | | | (.43 | ) | | | 13.40 | | | | 6.84 | | | | 2,879 | | | | .40 | | | | 3.26 | |
| 7/31/2015 | | | 12.92 | | | | .44 | | | | .04 | | | | .48 | | | | (.44 | ) | | | 12.96 | | | | 3.76 | | | | 990 | | | | .41 | | | | 3.42 | |
| 7/31/2014 | | | 12.44 | | | | .46 | | | | .48 | | | | .94 | | | | (.46 | ) | | | 12.92 | | | | 7.74 | | | | 662 | | | | .42 | | | | 3.70 | |
| Class F-3: | | | | | | | | | | | | | | | | | | | | | | | | | | | | | | | | | | | | | | | | |
| 1/31/20193,4 | | | 12.81 | | | | .20 | | | | .02 | | | | .22 | | | | (.20 | ) | | | 12.83 | | | | 1.75 | 5 | | | 5,488 | | | | .29 | 6 | | | 3.15 | 6 |
| 7/31/2018 | | | 12.98 | | | | .41 | | | | (.17 | ) | | | .24 | | | | (.41 | ) | | | 12.81 | | | | 1.84 | | | | 5,397 | | | | .28 | | | | 3.11 | |
| 7/31/20173,11 | | | 12.75 | | | | .22 | | | | .23 | | | | .45 | | | | (.22 | ) | | | 12.98 | | | | 3.54 | 5 | | | 1,555 | | | | .29 | 6 | | | 3.34 | 6 |
| Class R-6: | | | | | | | | | | | | | | | | | | | | | | | | | | | | | | | | | | | | | | | | |
| 1/31/20193,4 | | | 12.81 | | | | .20 | | | | .02 | | | | .22 | | | | (.20 | ) | | | 12.83 | | | | 1.75 | 5 | | | 581 | | | | .29 | 6 | | | 3.15 | 6 |
| 7/31/2018 | | | 12.98 | | | | .41 | | | | (.17 | ) | | | .24 | | | | (.41 | ) | | | 12.81 | | | | 1.85 | | | | 550 | | | | .28 | | | | 3.15 | |
| 7/31/2017 | | | 13.40 | | | | .44 | | | | (.43 | ) | | | .01 | | | | (.43 | ) | | | 12.98 | | | | .15 | | | | 380 | | | | .29 | | | | 3.36 | |
| 7/31/2016 | | | 12.96 | | | | .44 | | | | .44 | | | | .88 | | | | (.44 | ) | | | 13.40 | | | | 6.95 | | | | 391 | | | | .29 | | | | 3.39 | |
| 7/31/2015 | | | 12.92 | | | | .46 | | | | .04 | | | | .50 | | | | (.46 | ) | | | 12.96 | | | | 3.86 | | | | 270 | | | | .30 | | | | 3.52 | |
| 7/31/2014 | | | 12.44 | | | | .48 | | | | .48 | | | | .96 | | | | (.48 | ) | | | 12.92 | | | | 7.86 | | | | 165 | | | | .31 | | | | 3.81 | |
| | | Six months ended | | | | | | | | | | | | | | | |
| | | January 31, | | Year ended July 31 |
| | | 20193,4,5 | | 2018 | | 2017 | | 2016 | | 2015 | | 2014 |
| Portfolio turnover rate for all share classes | | | 12% | | | | 17 | % | | | 20 | % | | | 13 | % | | | 14 | % | | | 10 | % |
| 1 | Based on average shares outstanding. |
| 2 | Total returns exclude any applicable sales charges, including contingent deferred sales charges. |
| 3 | Based on operations for a period that is less than a full year. |
| 4 | Unaudited. |
| 5 | Not annualized. |
| 6 | Annualized. |
| 7 | All or a significant portion of assets in this class consisted of seed capital invested by CRMC and/or its affiliates. Fees for distribution services are not charged or accrued on these seed capital assets. If such fees were paid by the fund on seed capital assets, fund expenses would have been higher and net income and total return would have been lower. |
| 8 | Amount less than $1 million. |
| 9 | Class T shares began investment operations on April 7, 2017. |
| 10 | Amount less than $.01. |
| 11 | Class F-3 shares began investment operations on January 27, 2017. |
See notes to financial statements
| American Funds Tax-Exempt Funds | 75 |
Financial highlights (continued)
American High-Income Municipal Bond Fund
| | | | | | Income (loss) from investment operations1 | | | | | | | | | | | | | | | | | | | |
| Period ended | | Net asset
value,
beginning
of period | | | Net
investment
income | | | Net (losses)
gains on
securities
(both
realized and
unrealized) | | | Total from
investment
operations | | | Dividends
(from net
investment
income) | | | Net asset
value,
end
of period | | | Total
return2 | | | Net assets,
end of period
(in millions) | | | Ratio of
expenses
to average
net assets | | | Ratio of
net income
to average
net assets | |
| Class A: | | | | | | | | | | | | | | | | | | | | | | | | | | | | | | |
| 1/31/20193,4 | | $ | 15.78 | | | $ | .29 | | | $ | (.10 | ) | | $ | .19 | | | $ | (.29 | ) | | $ | 15.68 | | | | 1.21 | %5 | | $ | 4,125 | | | | .71 | %6 | | | 3.71 | %6 |
| 7/31/2018 | | | 15.73 | | | | .59 | | | | .04 | | | | .63 | | | | (.58 | ) | | | 15.78 | | | | 4.05 | | | | 4,062 | | | | .68 | | | | 3.72 | |
| 7/31/2017 | | | 16.21 | | | | .60 | | | | (.49 | ) | | | .11 | | | | (.59 | ) | | | 15.73 | | | | .76 | | | | 3,645 | | | | .67 | | | | 3.86 | |
| 7/31/2016 | | | 15.40 | | | | .63 | | | | .79 | | | | 1.42 | | | | (.61 | ) | | | 16.21 | | | | 9.45 | | | | 3,519 | | | | .67 | | | | 4.02 | |
| 7/31/2015 | | | 15.22 | | | | .64 | | | | .17 | | | | .81 | | | | (.63 | ) | | | 15.40 | | | | 5.34 | | | | 2,700 | | | | .68 | | | | 4.13 | |
| 7/31/2014 | | | 14.48 | | | | .68 | | | | .73 | | | | 1.41 | | | | (.67 | ) | | | 15.22 | | | | 9.99 | | | | 2,357 | | | | .68 | | | | 4.59 | |
| Class C: | | | | | | | | | | | | | | | | | | | | | | | | | | | | | | | | | | | | | | | | |
| 1/31/20193,4 | | | 15.78 | | | | .23 | | | | (.10 | ) | | | .13 | | | | (.23 | ) | | | 15.68 | | | | .83 | 5 | | | 227 | | | | 1.45 | 6 | | | 2.97 | 6 |
| 7/31/2018 | | | 15.73 | | | | .47 | | | | .04 | | | | .51 | | | | (.46 | ) | | | 15.78 | | | | 3.29 | | | | 227 | | | | 1.43 | | | | 2.97 | |
| 7/31/2017 | | | 16.21 | | | | .48 | | | | (.49 | ) | | | (.01 | ) | | | (.47 | ) | | | 15.73 | | | | .00 | | | | 229 | | | | 1.43 | | | | 3.10 | |
| 7/31/2016 | | | 15.40 | | | | .52 | | | | .79 | | | | 1.31 | | | | (.50 | ) | | | 16.21 | | | | 8.62 | | | | 247 | | | | 1.43 | | | | 3.26 | |
| 7/31/2015 | | | 15.22 | | | | .52 | | | | .17 | | | | .69 | | | | (.51 | ) | | | 15.40 | | | | 4.55 | | | | 182 | | | | 1.44 | | | | 3.37 | |
| 7/31/2014 | | | 14.48 | | | | .56 | | | | .73 | | | | 1.29 | | | | (.55 | ) | | | 15.22 | | | | 9.12 | | | | 161 | | | | 1.48 | | | | 3.80 | |
| Class T: | | | | | | | | | | | | | | | | | | | | | | | | | | | | | | | | | | | | | | | | |
| 1/31/20193,4 | | | 15.78 | | | | .31 | | | | (.10 | ) | | | .21 | | | | (.31 | ) | | | 15.68 | | | | 1.34 | 5,7 | | | — | 8 | | | .45 | 6,7 | | | 3.97 | 6,7 |
| 7/31/2018 | | | 15.73 | | | | .63 | | | | .04 | | | | .67 | | | | (.62 | ) | | | 15.78 | | | | 4.34 | 7 | | | — | 8 | | | .43 | 7 | | | 3.98 | 7 |
| 7/31/20173,9 | | | 15.50 | | | | .20 | | | | .23 | | | | .43 | | | | (.20 | ) | | | 15.73 | | | | 2.77 | 5,7 | | | — | 8 | | | .12 | 5,7 | | | 1.28 | 5,7 |
| Class F-1: | | | | | | | | | | | | | | | | | | | | | | | | | | | | | | | | | | | | | | | | |
| 1/31/20193,4 | | | 15.78 | | | | .28 | | | | (.10 | ) | | | .18 | | | | (.28 | ) | | | 15.68 | | | | 1.18 | 5 | | | 172 | | | | .78 | 6 | | | 3.63 | 6 |
| 7/31/2018 | | | 15.73 | | | | .58 | | | | .04 | | | | .62 | | | | (.57 | ) | | | 15.78 | | | | 3.99 | | | | 208 | | | | .75 | | | | 3.65 | |
| 7/31/2017 | | | 16.21 | | | | .59 | | | | (.49 | ) | | | .10 | | | | (.58 | ) | | | 15.73 | | | | .68 | | | | 234 | | | | .75 | | | | 3.77 | |
| 7/31/2016 | | | 15.40 | | | | .62 | | | | .79 | | | | 1.41 | | | | (.60 | ) | | | 16.21 | | | | 9.37 | | | | 282 | | | | .74 | | | | 3.95 | |
| 7/31/2015 | | | 15.22 | | | | .62 | | | | .17 | | | | .79 | | | | (.61 | ) | | | 15.40 | | | | 5.27 | | | | 207 | | | | .75 | | | | 4.06 | |
| 7/31/2014 | | | 14.48 | | | | .66 | | | | .73 | | | | 1.39 | | | | (.65 | ) | | | 15.22 | | | | 9.87 | | | | 178 | | | | .79 | | | | 4.49 | |
| 76 | American Funds Tax-Exempt Funds |
American High-Income Municipal Bond Fund
| | | | | | Income (loss) from investment operations1 | | | | | | | | | | | | | | | | | | | |
| Period ended | | Net asset
value,
beginning
of period | | | Net
investment
income | | | Net (losses)
gains on
securities
(both
realized and
unrealized) | | | Total from
investment
operations | | | Dividends
(from net
investment
income) | | | Net asset
value,
end
of period | | | Total
return2 | | | Net assets,
end of period
(in millions) | | | Ratio of
expenses
to average
net assets | | | Ratio of
net income
to average
net assets | |
| Class F-2: | | | | | | | | | | | | | | | | | | | | | | | | | | | | | | |
| 1/31/20193,4 | | $ | 15.78 | | | $ | .30 | | | $ | (.10 | ) | | $ | .20 | | | $ | (.30 | ) | | $ | 15.68 | | | | 1.31 | %5 | | $ | 952 | | | | .52 | %6 | | | 3.91 | %6 |
| 7/31/2018 | | | 15.73 | | | | .62 | | | | .04 | | | | .66 | | | | (.61 | ) | | | 15.78 | | | | 4.26 | | | | 798 | | | | .49 | | | | 3.91 | |
| 7/31/2017 | | | 16.21 | | | | .63 | | | | (.49 | ) | | | .14 | | | | (.62 | ) | | | 15.73 | | | | .93 | | | | 605 | | | | .50 | | | | 4.05 | |
| 7/31/2016 | | | 15.40 | | | | .66 | | | | .79 | | | | 1.45 | | | | (.64 | ) | | | 16.21 | | | | 9.65 | | | | 775 | | | | .48 | | | | 4.18 | |
| 7/31/2015 | | | 15.22 | | | | .66 | | | | .17 | | | | .83 | | | | (.65 | ) | | | 15.40 | | | | 5.53 | | | | 321 | | | | .49 | | | | 4.32 | |
| 7/31/2014 | | | 14.48 | | | | .70 | | | | .73 | | | | 1.43 | | | | (.69 | ) | | | 15.22 | | | | 10.15 | | | | 223 | | | | .53 | | | | 4.71 | |
| Class F-3: | | | | | | | | | | | | | | | | | | | | | | | | | | | | | | | | | | | | | | | | |
| 1/31/20193,4 | | | 15.78 | | | | .31 | | | | (.10 | ) | | | .21 | | | | (.31 | ) | | | 15.68 | | | | 1.36 | 5 | | | 714 | | | | .41 | 6 | | | 4.01 | 6 |
| 7/31/2018 | | | 15.73 | | | | .64 | | | | .04 | | | | .68 | | | | (.63 | ) | | | 15.78 | | | | 4.37 | | | | 646 | | | | .38 | | | | 4.02 | |
| 7/31/20173,10 | | | 15.30 | | | | .32 | | | | .43 | | | | .75 | | | | (.32 | ) | | | 15.73 | | | | 4.96 | 5 | | | 421 | | | | .37 | 6 | | | 4.04 | 6 |
| Class R-6: | | | | | | | | | | | | | | | | | | | | | | | | | | | | | | | | | | | | | | | | |
| 1/31/20193,4 | | | 15.78 | | | | .31 | | | | (.10 | ) | | | .21 | | | | (.31 | ) | | | 15.68 | | | | 1.37 | 5 | | | 581 | | | | .41 | 6 | | | 4.02 | 6 |
| 7/31/2018 | | | 15.73 | | | | .64 | | | | .04 | | | | .68 | | | | (.63 | ) | | | 15.78 | | | | 4.37 | | | | 550 | | | | .38 | | | | 4.02 | |
| 7/31/2017 | | | 16.21 | | | | .64 | | | | (.49 | ) | | | .15 | | | | (.63 | ) | | | 15.73 | | | | 1.05 | | | | 380 | | | | .38 | | | | 4.16 | |
| 7/31/2016 | | | 15.40 | | | | .68 | | | | .79 | | | | 1.47 | | | | (.66 | ) | | | 16.21 | | | | 9.76 | | | | 269 | | | | .38 | | | | 4.31 | |
| 7/31/2015 | | | 15.22 | | | | .68 | | | | .17 | | | | .85 | | | | (.67 | ) | | | 15.40 | | | | 5.64 | | | | 188 | | | | .39 | | | | 4.42 | |
| 7/31/2014 | | | 14.48 | | | | .72 | | | | .73 | | | | 1.45 | | | | (.71 | ) | | | 15.22 | | | | 10.27 | | | | 108 | | | | .42 | | | | 4.82 | |
| | | Six months ended
January 31, | | Year ended July 31 |
| | | 20193,4,5 | | 2018 | | 2017 | | 2016 | | 2015 | | | 2014 |
| Portfolio turnover rate for all share classes | | | 12% | | | | 24 | % | | | 30 | % | | | 21 | % | | | 23 | % | | | 24 | % |
| 1 | Based on average shares outstanding. |
| 2 | Total returns exclude any applicable sales charges, including contingent deferred sales charges. |
| 3 | Based on operations for a period that is less than a full year. |
| 4 | Unaudited. |
| 5 | Not annualized. |
| 6 | Annualized. |
| 7 | All or a significant portion of assets in this class consisted of seed capital invested by CRMC and/or its affiliates. Fees for distribution services are not charged or accrued on these seed capital assets. If such fees were paid by the fund on seed capital assets, fund expenses would have been higher and net income and total return would have been lower. |
| 8 | Amount less than $1 million. |
| 9 | Class T shares began investment operations on April 7, 2017. |
| 10 | Class F-3 shares began investment operations on January 27, 2017. |
See notes to financial statements
| American Funds Tax-Exempt Funds | 77 |
Financial highlights(continued)
The Tax-Exempt Fund of California
| | | | | | Income (loss) from investment operations1 | | | | | | | | | | | | | | | | | | | |
| Period ended | | Net asset
value,
beginning
of period | | | Net
investment
income | | | Net (losses)
gains on
securities
(both
realized and
unrealized) | | | Total from
investment
operations | | | Dividends
(from net
investment
income) | | | Net asset
value,
end
of period | | | Total
return2 | | | Net assets,
end of period
(in millions) | | | Ratio of
expenses
to average
net assets | | | Ratio of
net income
to average
net assets | |
| Class A: | | | | | | | | | | | | | | | | | | | | | | | | | | | | | | |
| 1/31/20193,4 | | $ | 17.43 | | | $ | .26 | | | $ | (.01 | ) | | $ | .25 | | | $ | (.26 | ) | | $ | 17.42 | | | | 1.43 | %5 | | $ | 1,626 | | | | .60 | %6 | | | 2.95 | %6 |
| 7/31/2018 | | | 17.63 | | | | .51 | | | | (.20 | ) | | | .31 | | | | (.51 | ) | | | 17.43 | | | | 1.77 | | | | 1,678 | | | | .61 | | | | 2.90 | |
| 7/31/2017 | | | 18.21 | | | | .54 | | | | (.59 | ) | | | (.05 | ) | | | (.53 | ) | | | 17.63 | | | | (.22 | ) | | | 1,641 | | | | .60 | | | | 3.05 | |
| 7/31/2016 | | | 17.62 | | | | .57 | | | | .58 | | | | 1.15 | | | | (.56 | ) | | | 18.21 | | | | 6.65 | | | | 1,678 | | | | .60 | | | | 3.17 | |
| 7/31/2015 | | | 17.52 | | | | .60 | | | | .09 | | | | .69 | | | | (.59 | ) | | | 17.62 | | | | 3.98 | | | | 1,386 | | | | .62 | | | | 3.38 | |
| 7/31/2014 | | | 16.72 | | | | .63 | | | | .80 | | | | 1.43 | | | | (.63 | ) | | | 17.52 | | | | 8.72 | | | | 1,265 | | | | .63 | | | | 3.72 | |
| Class C: | | | | | | | | | | | | | | | | | | | | | | | | | | | | | | | | | | | | | | | | |
| 1/31/20193,4 | | | 17.43 | | | | .19 | | | | (.01 | ) | | | .18 | | | | (.19 | ) | | | 17.42 | | | | 1.03 | 5 | | | 66 | | | | 1.39 | 6 | | | 2.16 | 6 |
| 7/31/2018 | | | 17.63 | | | | .37 | | | | (.20 | ) | | | .17 | | | | (.37 | ) | | | 17.43 | | | | .97 | | | | 71 | | | | 1.40 | | | | 2.11 | |
| 7/31/2017 | | | 18.21 | | | | .40 | | | | (.59 | ) | | | (.19 | ) | | | (.39 | ) | | | 17.63 | | | | (1.00 | ) | | | 83 | | | | 1.39 | | | | 2.26 | |
| 7/31/2016 | | | 17.62 | | | | .43 | | | | .58 | | | | 1.01 | | | | (.42 | ) | | | 18.21 | | | | 5.82 | | | | 97 | | | | 1.39 | | | | 2.38 | |
| 7/31/2015 | | | 17.52 | | | | .46 | | | | .09 | | | | .55 | | | | (.45 | ) | | | 17.62 | | | | 3.16 | | | | 78 | | | | 1.40 | | | | 2.59 | |
| 7/31/2014 | | | 16.72 | | | | .50 | | | | .80 | | | | 1.30 | | | | (.50 | ) | | | 17.52 | | | | 7.87 | | | | 76 | | | | 1.42 | | | | 2.94 | |
| Class T: | | | | | | | | | | | | | | | | | | | | | | | | | | | | | | | | | | | | | | | | |
| 1/31/20193,4 | | | 17.43 | | | | .27 | | | | (.01 | ) | | | .26 | | | | (.27 | ) | | | 17.42 | | | | 1.53 | 5,7 | | | — | 8 | | | .39 | 6,7 | | | 3.16 | 6,7 |
| 7/31/2018 | | | 17.63 | | | | .54 | | | | (.20 | ) | | | .34 | | | | (.54 | ) | | | 17.43 | | | | 1.98 | 7 | | | — | 8 | | | .40 | 7 | | | 3.10 | 7 |
| 7/31/20173,9 | | | 17.42 | | | | .18 | | | | .21 | | | | .39 | | | | (.18 | ) | | | 17.63 | | | | 2.24 | 5,7 | | | — | 8 | | | .12 | 5,7 | | | 1.02 | 5,7 |
| Class F-1: | | | | | | | | | | | | | | | | | | | | | | | | | | | | | | | | | | | | | | | | |
| 1/31/20193,4 | | | 17.43 | | | | .24 | | | | (.01 | ) | | | .23 | | | | (.24 | ) | | | 17.42 | | | | 1.36 | 5 | | | 69 | | | | .74 | 6 | | | 2.82 | 6 |
| 7/31/2018 | | | 17.63 | | | | .49 | | | | (.20 | ) | | | .29 | | | | (.49 | ) | | | 17.43 | | | | 1.64 | | | | 75 | | | | .73 | | | | 2.77 | |
| 7/31/2017 | | | 18.21 | | | | .51 | | | | (.58 | ) | | | (.07 | ) | | | (.51 | ) | | | 17.63 | | | | (.35 | ) | | | 76 | | | | .73 | | | | 2.93 | |
| 7/31/2016 | | | 17.62 | | | | .55 | | | | .58 | | | | 1.13 | | | | (.54 | ) | | | 18.21 | | | | 6.52 | | | | 83 | | | | .73 | | | | 3.04 | |
| 7/31/2015 | | | 17.52 | | | | .58 | | | | .09 | | | | .67 | | | | (.57 | ) | | | 17.62 | | | | 3.85 | | | | 63 | | | | .74 | | | | 3.26 | |
| 7/31/2014 | | | 16.72 | | | | .61 | | | | .80 | | | | 1.41 | | | | (.61 | ) | | | 17.52 | | | | 8.59 | | | | 65 | | | | .76 | | | | 3.60 | |
| 78 | American Funds Tax-Exempt Funds |
The Tax-Exempt Fund of California
| | | | | | Income (loss) from investment operations1 | | | | | | | | | | | | | | | | | | | |
| Period ended | | Net asset
value,
beginning
of period | | | Net
investment
income | | | Net (losses)
gains on
securities
(both
realized and
unrealized) | | | Total from
investment
operations | | | Dividends
(from net
investment
income) | | | Net asset
value,
end
of period | | | Total
return2 | | | Net assets,
end of period
(in millions) | | | Ratio of
expenses
to average
net assets | | | Ratio of
net income
to average
net assets | |
| Class F-2: | | | | | | | | | | | | | | | | | | | | | | | | | | | | | | |
| 1/31/20193,4 | | $ | 17.43 | | | $ | .27 | | | $ | (.01 | ) | | $ | .26 | | | $ | (.27 | ) | | $ | 17.42 | | | | 1.49 | %5 | | $ | 356 | | | | .47 | %6 | | | 3.09 | %6 |
| 7/31/2018 | | | 17.63 | | | | .53 | | | | (.20 | ) | | | .33 | | | | (.53 | ) | | | 17.43 | | | | 1.89 | | | | 257 | | | | .48 | | | | 3.03 | |
| 7/31/2017 | | | 18.21 | | | | .56 | | | | (.59 | ) | | | (.03 | ) | | | (.55 | ) | | | 17.63 | | | | (.09 | ) | | | 200 | | | | .48 | | | | 3.18 | |
| 7/31/2016 | | | 17.62 | | | | .60 | | | | .58 | | | | 1.18 | | | | (.59 | ) | | | 18.21 | | | | 6.79 | | | | 213 | | | | .48 | | | | 3.29 | |
| 7/31/2015 | | | 17.52 | | | | .62 | | | | .09 | | | | .71 | | | | (.61 | ) | | | 17.62 | | | | 4.10 | | | | 134 | | | | .49 | | | | 3.51 | |
| 7/31/2014 | | | 16.72 | | | | .65 | | | | .80 | | | | 1.45 | | | | (.65 | ) | | | 17.52 | | | | 8.85 | | | | 110 | | | | .51 | | | | 3.84 | |
| Class F-3: | | | | | | | | | | | | | | | | | | | | | | | | | | | | | | | | | | | | | | | | |
| 1/31/20193,4 | | | 17.43 | | | | .28 | | | | (.01 | ) | | | .27 | | | | (.28 | ) | | | 17.42 | | | | 1.55 | 5 | | | 178 | | | | .37 | 6 | | | 3.18 | 6 |
| 7/31/2018 | | | 17.63 | | | | .55 | | | | (.20 | ) | | | .35 | | | | (.55 | ) | | | 17.43 | | | | 2.01 | | | | 174 | | | | .37 | | | | 3.13 | |
| 7/31/20173,10 | | | 17.27 | | | | .29 | | | | .36 | | | | .65 | | | | (.29 | ) | | | 17.63 | | | | 3.79 | 5 | | | 124 | | | | .38 | 6 | | | 3.25 | 6 |
| | | Six months ended
January 31, | | Year ended July 31 |
| | | 20193,4,5 | | 2018 | | 2017 | | 2016 | | 2015 | | | 2014 |
| Portfolio turnover rate for all share classes | | | 14% | | | | 14 | % | | | 21 | % | | | 11 | % | | | 17 | % | | | 8 | % |
| 1 | Based on average shares outstanding. |
| 2 | Total returns exclude any applicable sales charges, including contingent deferred sales charges. |
| 3 | Based on operations for a period that is less than a full year. |
| 4 | Unaudited. |
| 5 | Not annualized. |
| 6 | Annualized. |
| 7 | All or a significant portion of assets in this class consisted of seed capital invested by CRMC and/or its affiliates. Fees for distribution services are not charged or accrued on these seed capital assets. If such fees were paid by the fund on seed capital assets, fund expenses would have been higher and net income and total return would have been lower. |
| 8 | Amount less than $1 million. |
| 9 | Class T shares began investment operations on April 7, 2017. |
| 10 | Class F-3 shares began investment operations on January 27, 2017. |
See notes to financial statements
| American Funds Tax-Exempt Funds | 79 |
Financial highlights(continued)
American Funds Tax-Exempt Fund of New York
| | | | | | Income (loss) from investment operations1 | | | | | | | | | | | | | | | | | | | | | | |
| Period ended | | Net asset
value,
beginning
of year | | | Net
investment
income | | | Net gains
(losses) on
securities
(both
realized and
unrealized) | | | Total from
investment
operations | | | Dividends
(from net
investment
income) | | | Net asset
value,
end
of period | | | Total
return2,3 | | | Net assets,
end of period
(in millions) | | | Ratio of
expenses to
average net
assets before
reimbursements | | | Ratio of
expenses to
average net
assets after
reimbursements3 | | | Ratio of
net income
to average
net assets3 | |
| Class A: | | | | | | | | | | | | | | | | | | | | | | | | | | | | | | | | | | | | | | | | | | | | |
| 1/31/20194,5 | | $ | 10.61 | | | $ | .14 | | | $ | .01 | | | $ | .15 | | | $ | (.14 | ) | | $ | 10.62 | | | | 1.40 | %6,7 | | $ | 178 | | | | .70 | %7,8 | | | .70 | %7,8 | | | 2.60 | %7,8 |
| 7/31/2018 | | | 10.80 | | | | .27 | | | | (.19 | ) | | | .08 | | | | (.27 | ) | | | 10.61 | | | | .75 | 7 | | | 183 | | | | .72 | 7 | | | .69 | 7 | | | 2.52 | 7 |
| 7/31/2017 | | | 11.12 | | | | .27 | | | | (.32 | ) | | | (.05 | ) | | | (.27 | ) | | | 10.80 | | | | (.39 | )7 | | | 169 | | | | .74 | 7 | | | .69 | 7 | | | 2.55 | 7 |
| 7/31/2016 | | | 10.66 | | | | .28 | | | | .45 | | | | .73 | | | | (.27 | ) | | | 11.12 | | | | 6.95 | 7 | | | 161 | | | | .72 | 7 | | | .69 | 7 | | | 2.54 | 7 |
| 7/31/2015 | | | 10.58 | | | | .32 | | | | .07 | | | | .39 | | | | (.31 | ) | | | 10.66 | | | | 3.65 | 7 | | | 124 | | | | .72 | 7 | | | .67 | 7 | | | 2.91 | 7 |
| 7/31/2014 | | | 10.21 | | | | .31 | | | | .37 | | | | .68 | | | | (.31 | ) | | | 10.58 | | | | 6.83 | 7 | | | 102 | | | | .73 | 7 | | | .63 | 7 | | | 3.07 | 7 |
| Class C: | | | | | | | | | | | | | | | | | | | | | | | | | | | | | | | | | | | | | | | | | | | | |
| 1/31/20194,5 | | | 10.61 | | | | .10 | | | | .01 | | | | .11 | | | | (.10 | ) | | | 10.62 | | | | 1.00 | 6 | | | 11 | | | | 1.49 | 8 | | | 1.49 | 8 | | | 1.81 | 8 |
| 7/31/2018 | | | 10.80 | | | | .19 | | | | (.19 | ) | | | — | 9 | | | (.19 | ) | | | 10.61 | | | | (.04 | ) | | | 12 | | | | 1.52 | | | | 1.48 | | | | 1.73 | |
| 7/31/2017 | | | 11.12 | | | | .19 | | | | (.32 | ) | | | (.13 | ) | | | (.19 | ) | | | 10.80 | | | | (1.17 | ) | | | 12 | | | | 1.52 | | | | 1.48 | | | | 1.76 | |
| 7/31/2016 | | | 10.66 | | | | .20 | | | | .45 | | | | .65 | | | | (.19 | ) | | | 11.12 | | | | 6.11 | | | | 14 | | | | 1.51 | | | | 1.48 | | | | 1.75 | |
| 7/31/2015 | | | 10.58 | | | | .23 | | | | .07 | | | | .30 | | | | (.22 | ) | | | 10.66 | | | | 2.79 | | | | 10 | | | | 1.56 | | | | 1.50 | | | | 2.07 | |
| 7/31/2014 | | | 10.21 | | | | .22 | | | | .37 | | | | .59 | | | | (.22 | ) | | | 10.58 | | | | 5.89 | | | | 8 | | | | 1.60 | | | | 1.51 | | | | 2.19 | |
| Class T: | | | | | | | | | | | | | | | | | | | | | | | | | | | | | | | | | | | | | | | | | | | | |
| 1/31/20194,5 | | | 10.61 | | | | .15 | | | | .01 | | | | .16 | | | | (.15 | ) | | | 10.62 | | | | 1.50 | 6,7 | | | — | 10 | | | .50 | 7,8 | | | .50 | 7,8 | | | 2.78 | 7,8 |
| 7/31/2018 | | | 10.80 | | | | .29 | | | | (.19 | ) | | | .10 | | | | (.29 | ) | | | 10.61 | | | | .98 | 7 | | | — | 10 | | | .52 | 7 | | | .48 | 7 | | | 2.73 | 7 |
| 7/31/20174,11 | | | 10.68 | | | | .09 | | | | .13 | | | | .22 | | | | (.10 | ) | | | 10.80 | | | | 2.02 | 6,7 | | | — | 10 | | | .19 | 6,7 | | | .15 | 6,7 | | | .87 | 6,7 |
| Class F-1: | | | | | | | | | | | | | | | | | | | | | | | | | | | | | | | | | | | | | | | | | | | | |
| 1/31/20194,5 | | | 10.61 | | | | .13 | | | | .01 | | | | .14 | | | | (.13 | ) | | | 10.62 | | | | 1.37 | 6,7 | | | 2 | | | | .76 | 7,8 | | | .76 | 7,8 | | | 2.54 | 7,8 |
| 7/31/2018 | | | 10.80 | | | | .26 | | | | (.19 | ) | | | .07 | | | | (.26 | ) | | | 10.61 | | | | .69 | 7 | | | 2 | | | | .79 | 7 | | | .75 | 7 | | | 2.45 | 7 |
| 7/31/2017 | | | 11.12 | | | | .27 | | | | (.32 | ) | | | (.05 | ) | | | (.27 | ) | | | 10.80 | | | | (.38 | )7 | | | 3 | | | | .73 | 7 | | | .68 | 7 | | | 2.56 | 7 |
| 7/31/2016 | | | 10.66 | | | | .29 | | | | .45 | | | | .74 | | | | (.28 | ) | | | 11.12 | | | | 7.02 | 7 | | | 2 | | | | .65 | 7 | | | .62 | 7 | | | 2.61 | 7 |
| 7/31/2015 | | | 10.58 | | | | .31 | | | | .07 | | | | .38 | | | | (.30 | ) | | | 10.66 | | | | 3.58 | 7 | | | 2 | | | | .80 | 7 | | | .74 | 7 | | | 2.83 | 7 |
| 7/31/2014 | | | 10.21 | | | | .31 | | | | .37 | | | | .68 | | | | (.31 | ) | | | 10.58 | | | | 6.77 | 7 | | | 1 | | | | .77 | 7 | | | .68 | 7 | | | 3.03 | 7 |
| | |
| 80 | American Funds Tax-Exempt Funds |
American Funds Tax-Exempt Fund of New York
| | | | | | Income (loss) from investment operations1 | | | | | | | | | | | | | | | | | | | | | | |
| Period ended | | Net asset
value,
beginning
of year | | | Net
investment
income | | | Net gains
(losses) on
securities
(both
realized and
unrealized) | | | Total from
investment
operations | | | Dividends
(from net
investment
income) | | | Net asset
value,
end
of period | | | Total
return2,3 | | | Net assets,
end of period
(in millions) | | | Ratio of
expenses to
average net
assets before
reimbursements | | | Ratio of
expenses to
average net
assets after
reimbursements3 | | | Ratio of
net income
to average
net assets3 | |
| Class F-2: | | | | | | | | | | | | | | | | | | | | | | | | | | | | | | | | | | | | | | | | | | | | |
| 1/31/20194,5 | | $ | 10.61 | | | $ | .14 | | | $ | .01 | | | $ | .15 | | | $ | (.14 | ) | | $ | 10.62 | | | | 1.48 | %6 | | $ | 27 | | | | .56 | %8 | | | .56 | %8 | | | 2.74 | %8 |
| 7/31/2018 | | | 10.80 | | | | .29 | | | | (.19 | ) | | | .10 | | | | (.29 | ) | | | 10.61 | | | | .89 | | | | 16 | | | | .59 | | | | .54 | | | | 2.67 | |
| 7/31/2017 | | | 11.12 | | | | .29 | | | | (.32 | ) | | | (.03 | ) | | | (.29 | ) | | | 10.80 | | | | (.26 | ) | | | 11 | | | | .58 | | | | .56 | | | | 2.68 | |
| 7/31/2016 | | | 10.66 | | | | .30 | | | | .45 | | | | .75 | | | | (.29 | ) | | | 11.12 | | | | 7.10 | | | | 31 | | | | .58 | | | | .55 | | | | 2.68 | |
| 7/31/2015 | | | 10.58 | | | | .33 | | | | .07 | | | | .40 | | | | (.32 | ) | | | 10.66 | | | | 3.77 | | | | 20 | | | | .61 | | | | .56 | | | | 3.02 | |
| 7/31/2014 | | | 10.21 | | | | .32 | | | | .37 | | | | .69 | | | | (.32 | ) | | | 10.58 | | | | 6.89 | | | | 16 | | | | .66 | | | | .57 | | | | 3.13 | |
| Class F-3: | | | | | | | | | | | | | | | | | | | | | | | | | | | | | | | | | | | | | | | | | | | | |
| 1/31/20194,5 | | | 10.61 | | | | .15 | | | | .01 | | | | .16 | | | | (.15 | ) | | | 10.62 | | | | 1.52 | 6 | | | 29 | | | | .46 | 8 | | | .46 | 8 | | | 2.84 | 8 |
| 7/31/2018 | | | 10.80 | | | | .30 | | | | (.19 | ) | | | .11 | | | | (.30 | ) | | | 10.61 | | | | 1.00 | | | | 26 | | | | .48 | | | | .44 | | | | 2.78 | |
| 7/31/20174,12 | | | 10.58 | | | | .15 | | | | .22 | | | | .37 | | | | (.15 | ) | | | 10.80 | | | | 3.54 | 6 | | | 16 | | | | .58 | 8 | | | .45 | 8 | | | 2.79 | 8 |
| | | | | | | | | |
| | | Six months ended
January 31, | | Year ended July 31 |
| | | 20194,5,6 | | | 2018 | | | 2017 | | | 2016 | | | 2015 | | | 2014 |
| Portfolio turnover rate for all share classes | | | 10% | | | | 21 | % | | | 27 | % | | | 14 | % | | | 42 | % | | | 25 | % |
| | |
| 1 | Based on average shares outstanding. |
| 2 | Total returns exclude any applicable sales charges, including contingent deferred sales charges. |
| 3 | This column reflects the impact, if any, of certain reimbursements from CRMC. During the periods shown, CRMC reimbursed a portion of miscellaneous fees and expenses. |
| 4 | Based on operations for a period that is less than a full year. |
| 5 | Unaudited. |
| 6 | Not annualized. |
| 7 | All or a significant portion of assets in this class consisted of seed capital invested by CRMC and/or its affiliates. Fees for distribution services are not charged or accrued on these seed capital assets. If such fees were paid by the fund on seed capital assets, fund expenses would have been higher and net income and total return would have been lower. |
| 8 | Annualized. |
| 9 | Amount less than $.01. |
| 10 | Amount less than $1 million. |
| 11 | Class T shares began investment operations on April 7, 2017. |
| 12 | Class F-3 shares began investment operations on January 27, 2017. |
See notes to financial statements
| American Funds Tax-Exempt Funds | 81 |
As a fund shareholder, you incur two types of costs: (1) transaction costs, such as initial sales charges on purchase payments and contingent deferred sales charges on redemptions (loads), and (2) ongoing costs, including management fees, distribution and service (12b-1) fees, and other expenses. This example is intended to help you understand your ongoing costs (in dollars) of investing in the fund so you can compare these costs with the ongoing costs of investing in other mutual funds. The example is based on an investment of $1,000 invested at the beginning of the period and held for the entire six-month period (August 1, 2018, through January 31, 2019).
Actual expenses:
The first line of each share class in the table on the following pages provides information about actual account values and actual expenses. You may use the information in this line, together with the amount you invested, to estimate the expenses that you paid over the period. Simply divide your account value by $1,000 (for example, an $8,600 account value divided by $1,000 = 8.6), then multiply the result by the number in the first line under the heading titled “Expenses paid during period” to estimate the expenses you paid on your account during this period.
Hypothetical example for comparison purposes:
The second line of each share class in the table on the following pages provides information about hypothetical account values and hypothetical expenses based on the actual expense ratio for the share class and an assumed rate of return of 5.00% per year before expenses, which is not the actual return of the share class. The hypothetical account values and expenses may not be used to estimate the actual ending account balance or expenses you paid for the period. You may use this information to compare the ongoing costs of investing in the fund and other funds. To do so, compare this 5.00% hypothetical example with the 5.00% hypothetical examples that appear in the shareholder reports of the other funds.
Notes:
Class F-1, F-2 and F-3 shareholders may be subject to fees charged by financial intermediaries, typically ranging from 0.75% to 1.50% of assets annually depending on services offered. You can estimate the impact of these fees by adding the amount of the fees to the total estimated expenses you paid on your account during the period as calculated above. In addition, your ending account value would be lower by the amount of these fees.
Note that the expenses shown in the table on the following pages are meant to highlight your ongoing costs only and do not reflect any transactional costs, such as sales charges (loads). Therefore, the second line of each share class in the table is useful in comparing ongoing costs only and will not help you determine the relative total costs of owning different funds. In addition, if these transactional costs were included, your costs would have been higher.
| 82 | American Funds Tax-Exempt Funds |
American Funds Short-Term Tax-Exempt Bond Fund
| | | Beginning | | | Ending | | | | | | | |
| | | account value | | | account value | | | Expenses paid | | | Annualized | |
| | | 8/1/2018 | | | 1/31/2019 | | | during period* | | | expense ratio | |
| Class A – actual return | | $ | 1,000.00 | | | $ | 1,009.72 | | | $ | 2.99 | | | | .59 | % |
| Class A – assumed 5% return | | | 1,000.00 | | | | 1,022.23 | | | | 3.01 | | | | .59 | |
| Class T – actual return | | | 1,000.00 | | | | 1,010.23 | | | | 2.43 | | | | .48 | |
| Class T – assumed 5% return | | | 1,000.00 | | | | 1,022.79 | | | | 2.45 | | | | .48 | |
| Class F-1 – actual return | | | 1,000.00 | | | | 1,008.48 | | | | 4.20 | | | | .83 | |
| Class F-1 – assumed 5% return | | | 1,000.00 | | | | 1,021.02 | | | | 4.23 | | | | .83 | |
| Class F-2 – actual return | | | 1,000.00 | | | | 1,010.06 | | | | 2.58 | | | | .51 | |
| Class F-2 – assumed 5% return | | | 1,000.00 | | | | 1,022.63 | | | | 2.60 | | | | .51 | |
| Class F-3 – actual return | | | 1,000.00 | | | | 1,010.44 | | | | 2.28 | | | | .45 | |
| Class F-3 – assumed 5% return | | | 1,000.00 | | | | 1,022.94 | | | | 2.29 | | | | .45 | |
| Class R-6 – actual return | | | 1,000.00 | | | | 1,010.46 | | | | 2.23 | | | | .44 | |
| Class R-6 – assumed 5% return | | | 1,000.00 | | | | 1,022.99 | | | | 2.24 | | | | .44 | |
Limited Term Tax-Exempt Bond Fund of America
| | | Beginning | | | Ending | | | | | | | |
| | | account value | | | account value | | | Expenses paid | | | Annualized | |
| | | 8/1/2018 | | | 1/31/2019 | | | during period* | | | expense ratio | |
| Class A – actual return | | $ | 1,000.00 | | | $ | 1,014.86 | | | $ | 3.00 | | | | .59 | % |
| Class A – assumed 5% return | | | 1,000.00 | | | | 1,022.23 | | | | 3.01 | | | | .59 | |
| Class C – actual return | | | 1,000.00 | | | | 1,011.12 | | | | 6.74 | | | | 1.33 | |
| Class C – assumed 5% return | | | 1,000.00 | | | | 1,018.50 | | | | 6.77 | | | | 1.33 | |
| Class T – actual return | | | 1,000.00 | | | | 1,016.22 | | | | 1.68 | | | | .33 | |
| Class T – assumed 5% return | | | 1,000.00 | | | | 1,023.54 | | | | 1.68 | | | | .33 | |
| Class F-1 – actual return | | | 1,000.00 | | | | 1,014.43 | | | | 3.45 | | | | .68 | |
| Class F-1 – assumed 5% return | | | 1,000.00 | | | | 1,021.78 | | | | 3.47 | | | | .68 | |
| Class F-2 – actual return | | | 1,000.00 | | | | 1,015.83 | | | | 2.03 | | | | .40 | |
| Class F-2 – assumed 5% return | | | 1,000.00 | | | | 1,023.19 | | | | 2.04 | | | | .40 | |
| Class F-3 – actual return | | | 1,000.00 | | | | 1,016.36 | | | | 1.52 | | | | .30 | |
| Class F-3 – assumed 5% return | | | 1,000.00 | | | | 1,023.69 | | | | 1.53 | | | | .30 | |
| Class R-6 – actual return | | | 1,000.00 | | | | 1,016.41 | | | | 1.52 | | | | .30 | |
| Class R-6 – assumed 5% return | | | 1,000.00 | | | | 1,023.69 | | | | 1.53 | | | | .30 | |
See end of tables for footnote.
| American Funds Tax-Exempt Funds | 83 |
The Tax-Exempt Bond Fund of America
| | | Beginning | | | Ending | | | | | | | |
| | | account value | | | account value | | | Expenses paid | | | Annualized | |
| | | 8/1/2018 | | | 1/31/2019 | | | during period* | | | expense ratio | |
| Class A – actual return | | $ | 1,000.00 | | | $ | 1,016.25 | | | $ | 2.69 | | | | .53 | % |
| Class A – assumed 5% return | | | 1,000.00 | | | | 1,022.53 | | | | 2.70 | | | | .53 | |
| Class C – actual return | | | 1,000.00 | | | | 1,012.20 | | | | 6.69 | | | | 1.32 | |
| Class C – assumed 5% return | | | 1,000.00 | | | | 1,018.55 | | | | 6.72 | | | | 1.32 | |
| Class T – actual return | | | 1,000.00 | | | | 1,017.25 | | | | 1.68 | | | | .33 | |
| Class T – assumed 5% return | | | 1,000.00 | | | | 1,023.54 | | | | 1.68 | | | | .33 | |
| Class F-1 – actual return | | | 1,000.00 | | | | 1,015.53 | | | | 3.35 | | | | .66 | |
| Class F-1 – assumed 5% return | | | 1,000.00 | | | | 1,021.88 | | | | 3.36 | | | | .66 | |
| Class F-2 – actual return | | | 1,000.00 | | | | 1,016.92 | | | | 2.03 | | | | .40 | |
| Class F-2 – assumed 5% return | | | 1,000.00 | | | | 1,023.19 | | | | 2.04 | | | | .40 | |
| Class F-3 – actual return | | | 1,000.00 | | | | 1,017.50 | | | | 1.47 | | | | .29 | |
| Class F-3 – assumed 5% return | | | 1,000.00 | | | | 1,023.74 | | | | 1.48 | | | | .29 | |
| Class R-6 – actual return | | | 1,000.00 | | | | 1,017.50 | | | | 1.47 | | | | .29 | |
| Class R-6 – assumed 5% return | | | 1,000.00 | | | | 1,023.74 | | | | 1.48 | | | | .29 | |
American High-Income Municipal Bond Fund
| | | Beginning | | | Ending | | | | | | | |
| | | account value | | | account value | | | Expenses paid | | | Annualized | |
| | | 8/1/2018 | | | 1/31/2019 | | | during period* | | | expense ratio | |
| Class A – actual return | | $ | 1,000.00 | | | $ | 1,012.11 | | | $ | 3.60 | | | | .71 | % |
| Class A – assumed 5% return | | | 1,000.00 | | | | 1,021.63 | | | | 3.62 | | | | .71 | |
| Class C – actual return | | | 1,000.00 | | | | 1,008.35 | | | | 7.34 | | | | 1.45 | |
| Class C – assumed 5% return | | | 1,000.00 | | | | 1,017.90 | | | | 7.37 | | | | 1.45 | |
| Class T – actual return | | | 1,000.00 | | | | 1,013.43 | | | | 2.28 | | | | .45 | |
| Class T – assumed 5% return | | | 1,000.00 | | | | 1,022.94 | | | | 2.29 | | | | .45 | |
| Class F-1 – actual return | | | 1,000.00 | | | | 1,011.75 | | | | 3.96 | | | | .78 | |
| Class F-1 – assumed 5% return | | | 1,000.00 | | | | 1,021.27 | | | | 3.97 | | | | .78 | |
| Class F-2 – actual return | | | 1,000.00 | | | | 1,013.10 | | | | 2.64 | | | | .52 | |
| Class F-2 – assumed 5% return | | | 1,000.00 | | | | 1,022.58 | | | | 2.65 | | | | .52 | |
| Class F-3 – actual return | | | 1,000.00 | | | | 1,013.65 | | | | 2.08 | | | | .41 | |
| Class F-3 – assumed 5% return | | | 1,000.00 | | | | 1,023.14 | | | | 2.09 | | | | .41 | |
| Class R-6 – actual return | | | 1,000.00 | | | | 1,013.66 | | | | 2.08 | | | | .41 | |
| Class R-6 – assumed 5% return | | | 1,000.00 | | | | 1,023.14 | | | | 2.09 | | | | .41 | |
| 84 | American Funds Tax-Exempt Funds |
The Tax-Exempt Fund of California
| | | Beginning | | | Ending | | | | | | | |
| | | account value | | | account value | | | Expenses paid | | | Annualized | |
| | | 8/1/2018 | | | 1/31/2019 | | | during period* | | | expense ratio | |
| Class A – actual return | | $ | 1,000.00 | | | $ | 1,014.26 | | | $ | 3.05 | | | | .60 | % |
| Class A – assumed 5% return | | | 1,000.00 | | | | 1,022.18 | | | | 3.06 | | | | .60 | |
| Class C – actual return | | | 1,000.00 | | | | 1,010.29 | | | | 7.04 | | | | 1.39 | |
| Class C – assumed 5% return | | | 1,000.00 | | | | 1,018.20 | | | | 7.07 | | | | 1.39 | |
| Class T – actual return | | | 1,000.00 | | | | 1,015.34 | | | | 1.98 | | | | .39 | |
| Class T – assumed 5% return | | | 1,000.00 | | | | 1,023.24 | | | | 1.99 | | | | .39 | |
| Class F-1 – actual return | | | 1,000.00 | | | | 1,013.60 | | | | 3.76 | | | | .74 | |
| Class F-1 – assumed 5% return | | | 1,000.00 | | | | 1,021.48 | | | | 3.77 | | | | .74 | |
| Class F-2 – actual return | | | 1,000.00 | | | | 1,014.94 | | | | 2.39 | | | | .47 | |
| Class F-2 – assumed 5% return | | | 1,000.00 | | | | 1,022.84 | | | | 2.40 | | | | .47 | |
| Class F-3 – actual return | | | 1,000.00 | | | | 1,015.48 | | | | 1.88 | | | | .37 | |
| Class F-3 – assumed 5% return | | | 1,000.00 | | | | 1,023.34 | | | | 1.89 | | | | .37 | |
American Funds Tax-Exempt Fund of New York
| | | Beginning | | | Ending | | | | | | | |
| | | account value | | | account value | | | Expenses paid | | | Annualized | |
| | | 8/1/2018 | | | 1/31/2019 | | | during period* | | | expense ratio | |
| Class A – actual return | | $ | 1,000.00 | | | $ | 1,014.03 | | | $ | 3.55 | | | | .70 | % |
| Class A – assumed 5% return | | | 1,000.00 | | | | 1,021.68 | | | | 3.57 | | | | .70 | |
| Class C – actual return | | | 1,000.00 | | | | 1,010.03 | | | | 7.55 | | | | 1.49 | |
| Class C – assumed 5% return | | | 1,000.00 | | | | 1,017.69 | | | | 7.58 | | | | 1.49 | |
| Class T – actual return | | | 1,000.00 | | | | 1,015.02 | | | | 2.54 | | | | .50 | |
| Class T – assumed 5% return | | | 1,000.00 | | | | 1,022.68 | | | | 2.55 | | | | .50 | |
| Class F-1 – actual return | | | 1,000.00 | | | | 1,013.73 | | | | 3.86 | | | | .76 | |
| Class F-1 – assumed 5% return | | | 1,000.00 | | | | 1,021.37 | | | | 3.87 | | | | .76 | |
| Class F-2 – actual return | | | 1,000.00 | | | | 1,014.75 | | | | 2.84 | | | | .56 | |
| Class F-2 – assumed 5% return | | | 1,000.00 | | | | 1,022.38 | | | | 2.85 | | | | .56 | |
| Class F-3 – actual return | | | 1,000.00 | | | | 1,015.24 | | | | 2.34 | | | | .46 | |
| Class F-3 – assumed 5% return | | | 1,000.00 | | | | 1,022.89 | | | | 2.35 | | | | .46 | |
| * | The “expenses paid during period” are equal to the “annualized expense ratio,” multiplied by the average account value over the period, multiplied by the number of days in the period, and divided by 365 (to reflect the one-half year period). |
| American Funds Tax-Exempt Funds | 85 |
Results of special meeting of shareholders
American Funds Short-Term Tax-Exempt Bond Fund
Held November 28, 2018
Shares outstanding (all classes) on August 31, 2018 (record date)
96,716,931
Total shares voting on November 28, 2018
81,585,324 (84.4% of shares outstanding)
The proposal: to elect board members
| | | | | | Percent | | | | | Percent |
| | | | | | of shares | | Votes | | | of shares |
| | | Votes for | | | voting for | | withheld | | | withheld |
| William H. Baribault | | | 80,418,130 | | | | 98.6 | % | | | 1,167,194 | | | | 1.4 | % |
| James G. Ellis | | | 80,071,450 | | | | 98.1 | | | | 1,513,874 | | | | 1.9 | |
| Nariman Farvardin | | | 79,838,650 | | | | 97.9 | | | | 1,746,674 | | | | 2.1 | |
| Michael C. Gitlin | | | 80,355,811 | | | | 98.5 | | | | 1,229,513 | | | | 1.5 | |
| Mary Davis Holt | | | 80,530,275 | | | | 98.7 | | | | 1,055,049 | | | | 1.3 | |
| R. Clark Hooper | | | 79,695,716 | | | | 97.7 | | | | 1,889,608 | | | | 2.3 | |
| Merit E. Janow | | | 79,247,410 | | | | 97.1 | | | | 2,337,914 | | | | 2.9 | |
| Laurel B. Mitchell | | | 80,430,986 | | | | 98.6 | | | | 1,154,338 | | | | 1.4 | |
| Margaret Spellings | | | 79,961,760 | | | | 98.0 | | | | 1,623,564 | | | | 2.0 | |
| Alexandra Trower | | | 80,486,713 | | | | 98.7 | | | | 1,098,611 | | | | 1.3 | |
| Karl J. Zeile | | | 80,420,982 | | | | 98.6 | | | | 1,164,342 | | | | 1.4 | |
| 86 | American Funds Tax-Exempt Funds |
Results of special meeting of shareholders
Limited Term Tax-Exempt Bond Fund of America
Held November 28, 2018
Shares outstanding (all classes) on August 31, 2018 (record date)
249,483,455
Total shares voting on November 28, 2018
225,836,342 (90.5% of shares outstanding)
The proposal: to elect board members
| | | | | | Percent | | | | | Percent |
| | | | | | of shares | | Votes | | | of shares |
| | | Votes for | | | voting for | | withheld | | | withheld |
| William H. Baribault | | | 222,187,368 | | | | 98.4 | % | | | 3,648,974 | | | | 1.6 | % |
| James G. Ellis | | | 222,072,696 | | | | 98.3 | | | | 3,763,646 | | | | 1.7 | |
| Nariman Farvardin | | | 221,942,473 | | | | 98.3 | | | | 3,893,869 | | | | 1.7 | |
| Michael C. Gitlin | | | 222,272,946 | | | | 98.4 | | | | 3,563,396 | | | | 1.6 | |
| Mary Davis Holt | | | 222,419,450 | | | | 98.5 | | | | 3,416,892 | | | | 1.5 | |
| R. Clark Hooper | | | 222,009,715 | | | | 98.3 | | | | 3,826,627 | | | | 1.7 | |
| Merit E. Janow | | | 222,314,200 | | | | 98.4 | | | | 3,522,142 | | | | 1.6 | |
| Laurel B. Mitchell | | | 222,371,331 | | | | 98.5 | | | | 3,465,011 | | | | 1.5 | |
| Margaret Spellings | | | 222,354,513 | | | | 98.5 | | | | 3,481,829 | | | | 1.5 | |
| Alexandra Trower | | | 222,520,335 | | | | 98.5 | | | | 3,316,007 | | | | 1.5 | |
| Karl J. Zeile | | | 222,226,786 | | | | 98.4 | | | | 3,609,556 | | | | 1.6 | |
| American Funds Tax-Exempt Funds | 87 |
Results of special meeting of shareholders
The Tax-Exempt Bond Fund of America
Held November 28, 2018
Shares outstanding (all classes) on August 31, 2018 (record date)
1,492,900,515
Total shares voting on November 28, 2018
1,356,001,587 (90.8% of shares outstanding)
The proposal: to elect board members
| | | | | | Percent | | | | | Percent |
| | | | | | of shares | | Votes | | | of shares |
| | | Votes for | | | voting for | | withheld | | | withheld |
| William H. Baribault | | | 1,336,135,312 | | | | 98.5 | % | | | 19,866,275 | | | | 1.5 | % |
| James G. Ellis | | | 1,336,430,669 | | | | 98.6 | | | | 19,570,918 | | | | 1.4 | |
| Nariman Farvardin | | | 1,336,617,020 | | | | 98.6 | | | | 19,384,567 | | | | 1.4 | |
| Michael C. Gitlin | | | 1,337,796,117 | | | | 98.7 | | | | 18,205,470 | | | | 1.3 | |
| Mary Davis Holt | | | 1,338,554,381 | | | | 98.7 | | | | 17,447,206 | | | | 1.3 | |
| R. Clark Hooper | | | 1,336,303,287 | | | | 98.5 | | | | 19,698,300 | | | | 1.5 | |
| Merit E. Janow | | | 1,336,970,182 | | | | 98.6 | | | | 19,031,405 | | | | 1.4 | |
| Laurel B. Mitchell | | | 1,338,659,475 | | | | 98.7 | | | | 17,342,112 | | | | 1.3 | |
| Margaret Spellings | | | 1,337,923,312 | | | | 98.7 | | | | 18,078,275 | | | | 1.3 | |
| Alexandra Trower | | | 1,338,654,203 | | | | 98.7 | | | | 17,347,384 | | | | 1.3 | |
| Karl J. Zeile | | | 1,337,720,703 | | | | 98.7 | | | | 18,280,884 | | | | 1.3 | |
| 88 | American Funds Tax-Exempt Funds |
Results of special meeting of shareholders
American High-Income Municipal Bond Fund
Held November 28, 2018
Shares outstanding (all classes) on August 31, 2018 (record date)
416,325,891
Total shares voting on November 28, 2018
375,527,633 (90.2% of shares outstanding)
The proposal: to elect board members
| | | | | | Percent | | | | | Percent |
| | | | | | of shares | | Votes | | | of shares |
| | | Votes for | | | voting for | | withheld | | | withheld |
| William H. Baribault | | | 368,897,945 | | | | 98.2 | % | | | 6,629,688 | | | | 1.8 | % |
| James G. Ellis | | | 368,024,759 | | | | 98.0 | | | | 7,502,874 | | | | 2.0 | |
| Nariman Farvardin | | | 369,540,504 | | | | 98.4 | | | | 5,987,129 | | | | 1.6 | |
| Michael C. Gitlin | | | 369,815,819 | | | | 98.5 | | | | 5,711,814 | | | | 1.5 | |
| Mary Davis Holt | | | 369,821,820 | | | | 98.5 | | | | 5,705,813 | | | | 1.5 | |
| R. Clark Hooper | | | 368,297,573 | | | | 98.1 | | | | 7,230,060 | | | | 1.9 | |
| Merit E. Janow | | | 369,056,829 | | | | 98.3 | | | | 6,470,804 | | | | 1.7 | |
| Laurel B. Mitchell | | | 369,886,084 | | | | 98.5 | | | | 5,641,549 | | | | 1.5 | |
| Margaret Spellings | | | 369,943,697 | | | | 98.5 | | | | 5,583,936 | | | | 1.5 | |
| Alexandra Trower | | | 369,531,355 | | | | 98.4 | | | | 5,996,278 | | | | 1.6 | |
| Karl J. Zeile | | | 369,623,993 | | | | 98.4 | | | | 5,903,640 | | | | 1.6 | |
| American Funds Tax-Exempt Funds | 89 |
Results of special meeting of shareholders
The Tax-Exempt Fund of California
Held November 28, 2018
Shares outstanding (all classes) on August 31, 2018 (record date)
130,046,199
Total shares voting on November 28, 2018
100,980,889 (77.7% of shares outstanding)
The proposal: to elect board members
| | | | | | Percent | | | | | Percent |
| | | | | | of shares | | Votes | | | of shares |
| | | Votes for | | | voting for | | withheld | | | withheld |
| William H. Baribault | | | 99,626,521 | | | | 98.7 | % | | | 1,354,368 | | | | 1.3 | % |
| James G. Ellis | | | 99,665,947 | | | | 98.7 | | | | 1,314,942 | | | | 1.3 | |
| Nariman Farvardin | | | 99,690,719 | | | | 98.7 | | | | 1,290,170 | | | | 1.3 | |
| Michael C. Gitlin | | | 99,902,740 | | | | 98.9 | | | | 1,078,149 | | | | 1.1 | |
| Mary Davis Holt | | | 99,866,857 | | | | 98.9 | | | | 1,114,032 | | | | 1.1 | |
| R. Clark Hooper | | | 99,392,867 | | | | 98.4 | | | | 1,588,022 | | | | 1.6 | |
| Merit E. Janow | | | 99,436,539 | | | | 98.5 | | | | 1,544,350 | | | | 1.5 | |
| Laurel B. Mitchell | | | 99,857,990 | | | | 98.9 | | | | 1,122,899 | | | | 1.1 | |
| Margaret Spellings | | | 99,730,058 | | | | 98.8 | | | | 1,250,831 | | | | 1.2 | |
| Alexandra Trower | | | 99,845,500 | | | | 98.9 | | | | 1,135,389 | | | | 1.1 | |
| Karl J. Zeile | | | 99,464,715 | | | | 98.5 | | | | 1,516,174 | | | | 1.5 | |
| 90 | American Funds Tax-Exempt Funds |
Results of special meeting of shareholders
American Funds Tax-Exempt Fund of New York
Held November 28, 2018
Shares outstanding (all classes) on August 31, 2018 (record date)
22,698,177
Total shares voting on November 28, 2018
14,724,985 (64.9% of shares outstanding)
The proposal: to elect board members
| | | | | | Percent | | | | | Percent |
| | | | | | of shares | | Votes | | | of shares |
| | | Votes for | | | voting for | | withheld | | | withheld |
| William H. Baribault | | | 14,197,507 | | | | 96.4 | % | | | 527,478 | | | | 3.6 | % |
| James G. Ellis | | | 14,243,161 | | | | 96.7 | | | | 481,824 | | | | 3.3 | |
| Nariman Farvardin | | | 14,243,161 | | | | 96.7 | | | | 481,824 | | | | 3.3 | |
| Michael C. Gitlin | | | 14,244,418 | | | | 96.7 | | | | 480,567 | | | | 3.3 | |
| Mary Davis Holt | | | 14,259,249 | | | | 96.8 | | | | 465,736 | | | | 3.2 | |
| R. Clark Hooper | | | 14,201,678 | | | | 96.4 | | | | 523,307 | | | | 3.6 | |
| Merit E. Janow | | | 14,243,161 | | | | 96.7 | | | | 481,824 | | | | 3.3 | |
| Laurel B. Mitchell | | | 14,259,249 | | | | 96.8 | | | | 465,736 | | | | 3.2 | |
| Margaret Spellings | | | 14,212,033 | | | | 96.5 | | | | 512,952 | | | | 3.5 | |
| Alexandra Trower | | | 14,259,249 | | | | 96.8 | | | | 465,736 | | | | 3.2 | |
| Karl J. Zeile | | | 14,238,990 | | | | 96.7 | | | | 485,995 | | | | 3.3 | |
| American Funds Tax-Exempt Funds | 91 |
This page was intentionally left blank.
| 92 | American Funds Tax-Exempt Funds |
Offices of the funds and of the investment adviser
Capital Research and Management Company
333 South Hope Street
Los Angeles, CA 90071-1406
6455 Irvine Center Drive
Irvine, CA 92618-4518
Transfer agent for shareholder accounts
American Funds Service Company
(Write to the address near you.)
P.O. Box 6007
Indianapolis, IN 46206-6007
P.O. Box 2280
Norfolk, VA 23501-2280
Counsel
Morgan, Lewis & Bockius LLP
One Federal Street
Boston, MA 02110-1726
Custodians of assets
Bank of New York Mellon
One Wall Street
New York, NY 10286
JPMorgan Chase Bank
270 Park Avenue
New York, NY 10017-2070
Independent registered public accounting firm
PricewaterhouseCoopers LLP
601 South Figueroa Street
Los Angeles, CA 90017-3874
Principal underwriter
American Funds Distributors, Inc.
333 South Hope Street
Los Angeles, CA 90071-1406
Investors should carefully consider investment objectives, risks, charges and expenses. This and other important information is contained in the funds’ prospectus and summary prospectus, which can be obtained from your financial professional and should be read carefully before investing. You may also call American Funds Service Company (AFS) at (800) 421-4225 or visit the American Funds website at americanfunds.com. Fund shares offered through American Funds Distributors, Inc.
“American Funds Proxy Voting Procedures and Principles” — which describes how we vote proxies relating to portfolio securities — is available on the American Funds website or upon request by calling AFS. Each fund files its proxy voting record with the U.S. Securities and Exchange Commission (SEC) for the 12 months ended June 30 by August 31. The proxy voting record is available free of charge on the SEC website at sec.gov and on the American Funds website.
Complete January 31, 2019, portfolios of American Funds Short-Term Tax-Exempt Bond Fund, Limited Term Tax-Exempt Bond Fund of America, The Tax-Exempt Bond Fund of America, American High-Income Municipal Bond Fund, The Tax-Exempt Fund of California and American Funds Tax-Exempt Fund of New York’s investments are available free of charge by calling AFS or visiting the SEC website (where they are part of Form N-CSR).
Each fund files a complete list of its portfolio holdings with the SEC for the first and third quarters of each fiscal year on Form N-Q. This filing is available free of charge on the SEC website. Additionally, the list of portfolio holdings is available by calling AFS.
This report is for the information of shareholders of American Funds Short-Term Tax-Exempt Bond Fund, Limited Term Tax-Exempt Bond Fund of America, The Tax-Exempt Bond Fund of America, American High-Income Municipal Bond Fund, The Tax-Exempt Fund of California and American Funds Tax-Exempt Fund of New York, but it also may be used as sales literature when preceded or accompanied by the current prospectus or summary prospectus, which gives details about charges, expenses, investment objectives and operating policies of the funds. If used as sales material after March 31, 2019, this report must be accompanied by an American Funds statistical update for the most recently completed calendar quarter.
Bloomberg® is a trademark of Bloomberg Finance L.P. (collectively with its affiliates, “Bloomberg”). Barclays® is a trademark of Barclays Bank Plc (collectively with its affiliates, “Barclays”), used under license. Neither Bloomberg nor Barclays approves or endorses this material, guarantees the accuracy or completeness of any information herein and, to the maximum extent allowed by law, neither shall have any liability or responsibility for injury or damages arising in connection therewith.
Standard & Poor’s 500 Composite Index (“Index”) is a product of S&P Dow Jones Indices LLC and/or its affiliates and has been licensed for use by Capital Group. Copyright © 2019 S&P Dow Jones Indices LLC, a division of S&P Global, and/or its affiliates. All rights reserved. Redistribution or reproduction in whole or in part is prohibited without written permission of S&P Dow Jones Indices LLC.
The Capital Advantage®
Since 1931, Capital Group, home of American Funds, has helped investors pursue long-term investment success. Our consistent approach — in combination with The Capital SystemSM— has resulted in a superior long-term track record.
| | Aligned with investor success |
| | We base our decisions on a long-term perspective, which we believe aligns our goals with the interests of our clients. Our portfolio managers average 27 years of investment experience, including 20 years at our company, reflecting a career commitment to our long-term approach.1 |
| | |
| | The Capital System |
| | The Capital System combines individual accountability with teamwork. Funds using The Capital System are divided into portions that are managed independently by investment professionals with diverse backgrounds, ages and investment approaches. An extensive global research effort is the backbone of our system. |
| | |
| | American Funds’ superior long-term track record |
| | Equity funds have beaten their Lipper peer indexes in 92% of 10-year periods and 99% of 20-year periods. Fixed income funds have beaten their Lipper indexes in 75% of 10-year periods and 80% of 20-year periods.2Fund management fees have been among the lowest in the industry.3 |
| | 1 | Portfolio manager experience as of December 31, 2018. |
| | 2 | Based on Class F-2 share results for rolling periods through December 31, 2018. Periods covered are the shorter of the fund’s lifetime or since the comparable Lipper index inception date (except Capital Income Builder and SMALLCAP World Fund, for which the Lipper average was used). Expenses differ for each share class, so results will vary. Class F-2 shares were first offered on August 1, 2008. Class F-2 share results prior to the date of first sale are hypothetical based on Class A share results without a sales charge, adjusted for typical estimated expenses. Results for certain funds with an inception date after August 1, 2008, also include hypothetical returns because those funds’ Class F-2 shares sold after the funds’ date of first offering. Please see americanfunds.com for more information on specific expense adjustments and the actual dates of first sale. |
| | 3 | On average, our management fees were in the lowest quintile 70% of the time, based on the 20-year period ended December 31, 2018, versus comparable Lipper categories, excluding funds of funds. |
All Capital Group trademarks referenced are registered trademarks owned by The Capital Group Companies, Inc. or an affiliated company. All other company and product names mentioned are the trademarks or registered trademarks of their respective companies.

ITEM 2 – Code of Ethics
Not applicable for filing of semi-annual reports to shareholders.
ITEM 3 – Audit Committee Financial Expert
Not applicable for filing of semi-annual reports to shareholders.
ITEM 4 – Principal Accountant Fees and Services
Not applicable for filing of semi-annual reports to shareholders.
ITEM 5 – Audit Committee of Listed Registrants
Not applicable to this Registrant, insofar as the Registrant is not a listed issuer as defined in Rule 10A-3 under the Securities Exchange Act of 1934.
ITEM 6 – Schedule of Investments

Limited Term Tax-Exempt Bond Fund of America®
Investment portfolio
January 31, 2019
unaudited
Bonds, notes & other debt instruments 95.05%
Alabama 1.16% | Principal amount
(000) | Value
(000) |
| 21st Century Auth., Tobacco Settlement Rev. Ref. Bonds, Series 2012-A, 5.00% 2020 | $4,000 | $4,142 |
| 21st Century Auth., Tobacco Settlement Rev. Ref. Bonds, Series 2012-A, 5.00% 2021 | 3,305 | 3,502 |
| Black Belt Energy Gas Dist., Gas Supply Rev. Bonds, Series 2017-A, 4.00% 2047 (put 2022) | 12,620 | 13,201 |
| Federal Aid Highway Fin. Auth., Federal Highway Grant Anticipation Bonds, Series 2012, 5.00% 2022 | 5,385 | 5,965 |
Federal Aid Highway Fin. Auth., Federal Highway Grant Anticipation Bonds, Series 2012,
5.00% 2023 (preref. 2022) | 2,500 | 2,787 |
| Federal Aid Highway Fin. Auth., Special Obligation Rev. Bonds, Series 2017-B, 5.00% 2026 | 2,500 | 3,023 |
| County of Jefferson, Limited Obligation Rev. Ref. Bonds, Series 2017, 5.00% 2020 | 2,250 | 2,361 |
| County of Jefferson, Limited Obligation Rev. Ref. Bonds, Series 2017, 5.00% 2025 | 3,000 | 3,498 |
| County of Jefferson, Limited Obligation Rev. Ref. Bonds, Series 2017, 5.00% 2026 | 1,000 | 1,181 |
| County of Jefferson, Limited Obligation Rev. Ref. Bonds, Series 2017, 5.00% 2027 | 2,000 | 2,370 |
City of Montgomery, Medical Clinic Board, Health Care Fac. Rev. Bonds (Jackson Hospital & Clinic),
Series 2016, 5.00% 2021 | 2,065 | 2,170 |
City of Montgomery, Medical Clinic Board, Health Care Fac. Rev. Bonds (Jackson Hospital & Clinic),
Series 2016, 5.00% 2023 | 1,125 | 1,230 |
| City of Pell, Special Care Facs. Fncg. Auth., Rev. Ref. Bonds (Noland Health Services, Inc.), Series 2012-A, 5.00% 2020 | 1,140 | 1,203 |
| | | 46,633 |
| Alaska 0.10% | | |
| Housing Fin. Corp., General Mortgage Rev. Bonds, Series 2016-A, 3.50% 2046 | 2,740 | 2,830 |
Borough of Matanuska-Susitna, G.O. School Bonds, Series 2009-A, Assured Guaranty insured,
5.00% 2029 (preref. 2019) | 1,035 | 1,049 |
| | | 3,879 |
| Arizona 0.67% | | |
| City of Glendale, Water and Sewer Rev. Ref. Obligations, Series 2012, 5.00% 2020 | 1,550 | 1,620 |
| City of Glendale, Water and Sewer Rev. Ref. Obligations, Series 2012, 5.00% 2021 | 1,000 | 1,074 |
| Health Facs. Auth., Rev. Bonds (Scottsdale Lincoln Hospitals Project), Series 2014-A, 5.00% 2024 | 1,000 | 1,156 |
Health Facs. Auth., Rev. Ref. Bonds (Phoenix Children’s Hospital), Series 2013-A-1,
(SIFMA Municipal Swap Index + 1.85%) 3.28% 2048 (put 2020)1 | 1,500 | 1,511 |
| Lottery Rev. Bonds, Series 2010-A, Assured Guaranty Municipal insured, 5.00% 2019 | 3,770 | 3,822 |
| County of Maricopa, Industrial Dev. Auth., Rev. Bonds (Banner Health), Series 2017-C, 5.00% 2048 (put 2024) | 2,000 | 2,308 |
| City of Phoenix, Civic Improvement Corp., Wastewater System Rev. Ref. Bonds, Series 2016, 5.00% 2019 | 2,000 | 2,027 |
| City of Phoenix, Civic Improvement Corp., Wastewater System Rev. Ref. Bonds, Series 2016, 5.00% 2028 | 2,000 | 2,379 |
| School Facs. Board, Certs. of Part., Series 2015-A, 5.00% 2021 | 1,500 | 1,624 |
| Board of Regents of the University of Arizona, Rev. Ref. Certs. of Part., Series 2012-C, 5.00% 2020 | 3,180 | 3,312 |
| County of Yavapai, Industrial Dev. Auth., Solid Waste Disposal Rev. Bonds (Waste Management, Inc. Project), Series 2003-A-2, AMT, 1.85% 2028 (put 2019) | 6,000 | 5,998 |
| | | 26,831 |
Limited Term Tax-Exempt Bond Fund of America — Page 1 of 37
unaudited
Bonds, notes & other debt instruments (continued)
Arkansas 0.05% | Principal amount
(000) | Value
(000) |
Dev. Fin. Auth., Health Care Rev. Bonds (Baptist Memorial Health Care), Series 2015-B-3,
(SIFMA Municipal Swap Index + 1.55%) 2.98% 2044 (put 2022)1 | $1,000 | $1,019 |
County of Pulaski, Hospital Rev. Bonds (Arkansas Children’s Hospital Project), Series 2009,
Assured Guaranty Municipal insured, 5.50% 2039 (preref. 2019) | 1,000 | 1,003 |
| | | 2,022 |
| California 6.30% | | |
| Alameda Corridor Transportation Auth., Rev. Ref. Bonds, Series 2013-A, 5.00% 2021 | 1,750 | 1,904 |
| Alameda Corridor Transportation Auth., Rev. Ref. Bonds, Series 2013-A, 5.00% 2025 | 1,300 | 1,483 |
Bay Area Toll Auth., San Francisco Bay Area Toll Bridge Rev. Bonds, Series 2006-C-1,
(SIFMA Municipal Swap Index + 0.90%) 2.33% 2045 (put 2023)1 | 11,500 | 11,594 |
Bay Area Toll Auth., San Francisco Bay Area Toll Bridge Rev. Bonds, Series 2007-C-1,
(SIFMA Municipal Swap Index + 0.90%) 2.33% 2047 (put 2023)1 | 3,500 | 3,528 |
Bay Area Toll Auth., San Francisco Bay Area Toll Bridge Rev. Bonds, Series 2007-E-3,
(SIFMA Municipal Swap Index + 0.70%) 2.13% 2047 (put 2019)1 | 1,000 | 1,001 |
Bay Area Toll Auth., San Francisco Bay Area Toll Bridge Rev. Bonds, Series 2008-B-1,
(SIFMA Municipal Swap Index + 1.10%) 2.53% 2045 (put 2024)1 | 2,500 | 2,546 |
Bay Area Toll Auth., San Francisco Bay Area Toll Bridge Rev. Bonds, Series 2014-G,
(SIFMA Municipal Swap Index + 0.60%) 2.03% 2034 (put 2020)1 | 2,500 | 2,503 |
Bay Area Toll Auth., San Francisco Bay Area Toll Bridge Rev. Bonds, Series 2014-H,
(SIFMA Municipal Swap Index + 0.70%) 2.13% 2034 (put 2021)1 | 10,480 | 10,509 |
Bay Area Toll Auth., San Francisco Bay Area Toll Bridge Rev. Bonds, Series 2017-D,
(3-month USD-LIBOR x 0.70 + 0.55%) 2.51% 2045 (put 2021)1 | 3,000 | 3,005 |
Capistrano Unified School Dist., School Facs. Improvement Dist. No. 1, G.O. Bonds, 1999 Election,
Series 2001-B, Assured Guaranty Municipal insured, 0% 2025 | 8,000 | 6,504 |
| City of Cerritos, Public Fncg. Auth., Tax Allocation Rev. Bonds (Cerritos Redev. Projects), Series 2002-A, AMBAC insured, 5.00% 2021 | 1,000 | 1,043 |
City of Chino, Public Fncg. Auth., Local Agcy. Rev. Ref. Bonds, Series 2015-A,
Assured Guaranty Municipal insured, 5.00% 2024 | 500 | 577 |
City of Chino, Public Fncg. Auth., Local Agcy. Rev. Ref. Bonds, Series 2015-A,
Assured Guaranty Municipal insured, 5.00% 2026 | 500 | 585 |
City of Chino, Public Fncg. Auth., Local Agcy. Rev. Ref. Bonds, Series 2015-A,
Assured Guaranty Municipal insured, 5.00% 2028 | 1,000 | 1,157 |
| City of Chula Vista, Municipal Fncg. Auth., Special Tax Rev. Ref. Bonds, Series 2015-A, 5.00% 2021 | 975 | 1,051 |
| Econ. Recovery Rev. Ref. Bonds, Series 2009-A, 5.00% 2019 (escrowed to maturity) | 3,000 | 3,044 |
| Educational Facs. Auth., Rev. Ref. Bonds (Chapman University), Series 2011, 5.00% 2020 | 1,640 | 1,705 |
City of El Centro, Fncg. Auth., Wastewater Rev. Ref. Bonds, Series 2014-A,
Assured Guaranty Municipal insured, 5.00% 2028 | 1,000 | 1,147 |
| City of Fontana, Community Facs. Dist. No. 22 (Sierra Hills South), Special Tax Bonds, Series 2014, 5.00% 2022 | 525 | 571 |
| G.O. Bonds, Series 2017, 5.00% 2028 | 7,000 | 8,492 |
| G.O. Rev. Ref. Bonds, Series 2012, 5.00% 2021 | 2,500 | 2,710 |
| G.O. Rev. Ref. Bonds, Series 2012, 5.00% 2023 | 6,500 | 7,243 |
Golden State Tobacco Securitization Corp., Enhanced Tobacco Settlement Asset-Backed Bonds,
Series 2005-A, AMBAC insured, 0% 2027 | 3,000 | 2,420 |
Golden State Tobacco Securitization Corp., Enhanced Tobacco Settlement Asset-Backed Bonds,
Series 2005-A, Assured Guaranty Municipal insured, 0% 2025 | 5,000 | 4,351 |
Golden State Tobacco Securitization Corp., Enhanced Tobacco Settlement Asset-Backed Bonds,
Series 2005-A, Assured Guaranty Municipal insured, 0% 2026 | 3,850 | 3,254 |
Golden State Tobacco Securitization Corp., Enhanced Tobacco Settlement Asset-Backed Bonds,
Series 2013-A, 5.00% 2020 | 6,100 | 6,365 |
City of Hawthorne, Successor Agcy. to the Redev. Agcy., Tax Allocation Rev. Ref. Bonds, Series 2016,
Assured Guaranty Municipal insured, 5.00% 2027 | 1,070 | 1,272 |
| Health Facs. Fncg. Auth., Rev. Green Bonds (Kaiser Permanente), Series 2017-C, 5.00% 2031 (put 2022) | 3,000 | 3,343 |
| Health Facs. Fncg. Auth., Rev. Ref. Bonds (Adventist Health System/West), Series 2016-A, 4.00% 2026 | 1,000 | 1,131 |
| Health Facs. Fncg. Auth., Rev. Ref. Bonds (St. Joseph Health System), Series 2009-C, 5.00% 2034 (put 2022) | 5,500 | 6,128 |
Limited Term Tax-Exempt Bond Fund of America — Page 2 of 37
unaudited
Bonds, notes & other debt instruments (continued)
California (continued) | Principal amount
(000) | Value
(000) |
| Health Facs. Fncg. Auth., Rev. Ref. Bonds (St. Joseph Health System), Series 2013-D, 5.00% 2043 (put 2020) | $1,200 | $1,264 |
Infrastructure and Econ. Dev. Bank, Rev. Bonds (The Colburn School), Series 2015-A,
(SIFMA Municipal Swap Index + 1.00%) 2.43% 2037 (put 2020)1 | 3,000 | 3,017 |
Infrastructure and Econ. Dev. Bank, Rev. Bonds (The Colburn School), Series 2015-B,
(SIFMA Municipal Swap Index + 1.20%) 2.63% 2037 (put 2022)1 | 5,500 | 5,619 |
Infrastructure and Econ. Dev. Bank, Rev. Ref. Bonds (J. Paul Getty Trust), Series 2013-A-2,
(1-month USD-LIBOR x 0.70 + 0.50%) 2.249% 2047 (put 2019)1 | 2,500 | 2,501 |
| Irvine Unified School Dist., Community Facs. Dist. No. 09-1, Special Tax Bonds, Series 2017-A, BAM insured, 5.00% 2025 | 1,875 | 2,112 |
| City of Jurupa, Public Fncg. Auth., Special Tax Rev. Bonds, Series 2013-A, 5.00% 2021 | 750 | 809 |
| City of Jurupa, Public Fncg. Auth., Special Tax Rev. Bonds, Series 2013-A, 5.00% 2022 | 1,000 | 1,106 |
| City of Lake Elsinore, Public Fncg. Auth., Local Agcy. Rev. Ref. Bonds, Series 2015, 5.00% 2026 | 3,590 | 4,031 |
| City of Lee Lake, Public Fncg. Auth., Special Tax Rev. Ref. Bonds, Series 2013-A, 5.00% 2019 | 1,805 | 1,837 |
| City of Lee Lake, Public Fncg. Auth., Special Tax Rev. Ref. Bonds, Series 2013-A, 5.00% 2022 | 1,090 | 1,217 |
City of Los Angeles, Community Facs. Dist. No. 4 (Playa Vista - Phase 1), Special Tax Rev. Ref. Bonds,
Series 2014, 5.00% 2025 | 1,250 | 1,451 |
City of Los Angeles, Dept. of Airports, Los Angeles International Airport, Rev. Bonds, Series 2016-B, AMT,
5.00% 2025 | 1,015 | 1,183 |
City of Los Angeles, Dept. of Airports, Los Angeles International Airport, Rev. Bonds, Series 2016-B, AMT,
5.00% 2026 | 1,375 | 1,627 |
City of Los Angeles, Dept. of Airports, Los Angeles International Airport, Rev. Bonds, Series 2016-B, AMT,
5.00% 2027 | 1,250 | 1,467 |
| City of Los Angeles, Dept. of Airports, Los Angeles International Airport, Rev. Bonds, Series 2018-D, AMT, 5.00% 2024 | 4,860 | 5,579 |
| City of Los Angeles, Harbor Dept., Rev. Ref. Bonds, Series 2016-A, AMT, 5.00% 2024 | 1,500 | 1,733 |
| City of Los Angeles, Multi Family Housing Rev. Bonds (Jordan Downs Phase 1B Apartments), Series 2018-A-2, 2.08% 2022 (put 2021) | 1,000 | 1,004 |
City of Los Angeles, Wastewater System Rev. Ref. Bonds, Series 2002-A, FGIC-National insured,
6.00% 2021 (escrowed to maturity) | 3,000 | 3,309 |
Menifee Union School Dist., Public Fncg. Auth., Special Tax Rev. Bonds, Series 2016-A, BAM insured,
5.00% 2029 | 400 | 465 |
Menifee Union School Dist., Public Fncg. Auth., Special Tax Rev. Bonds, Series 2016-A, BAM insured,
5.00% 2030 | 625 | 722 |
| City of Murrieta, Public Fncg. Auth., Special Tax Rev. Ref. Bonds, Series 2012, 5.00% 2020 | 1,000 | 1,048 |
| Napa Valley Community College Dist., G.O. Rev. Bonds, Series 2005-B, National insured, 0% 2027 | 2,175 | 1,748 |
| Northern California Power Agcy., Hydroelectric Project No. 1, Rev. Ref. Bonds, Series 2010-A, 5.00% 2020 | 2,000 | 2,029 |
City of Oakland, Successor Agcy. to the Redev. Agcy., Tax Allocation Rev. Ref. Bonds
(Central Dist. Redev. Project), Series 2013, 5.00% 2020 | 2,500 | 2,624 |
City of Oakland, Successor Agcy. to the Redev. Agcy., Tax Allocation Rev. Ref. Bonds
(Central Dist. Redev. Project), Series 2013, 5.00% 2021 | 2,000 | 2,162 |
| Port of Oakland, Rev. Ref. Bonds, Series 2012-P, AMT, 5.00% 2022 | 4,000 | 4,383 |
| Port of Oakland, Rev. Ref. Bonds, Series 2012-P, AMT, 5.00% 2023 | 2,750 | 3,009 |
| Palo Alto Unified School Dist., G.O. Bonds, Series 2008, 0% 2027 | 1,960 | 1,597 |
| Palomar Pomerado Health, G.O. Bonds, 2004 Election, Series 2007-A, National insured, 0% 2026 | 3,485 | 2,823 |
Pollution Control Fncg. Auth., Solid Waste Disposal Rev. Ref. Bonds (Republic Services, Inc. Project),
Series 2017-A-1, AMT, 2.30% 2042 (put 2019)2 | 2,750 | 2,750 |
Public Works Board, Lease Rev. Bonds (Judicial Council of California, Various Judicial Council Projects),
Series 2011-D, 5.00% 2019 | 2,000 | 2,056 |
| Public Works Board, Lease Rev. Bonds (Various Capital Projects), Series 2011-A, 5.00% 2019 | 2,000 | 2,045 |
| Regional Airports Improvement Corp., Facs. Lease Rev. Ref. Bonds (LAXFUEL Corp., Los Angeles International Airport), Series 2012, AMT, 5.00% 2020 | 1,645 | 1,692 |
| Regional Airports Improvement Corp., Facs. Lease Rev. Ref. Bonds (LAXFUEL Corp., Los Angeles International Airport), Series 2012, AMT, 5.00% 2021 | 1,700 | 1,801 |
| Rio Elementary School Dist., Community Facs. Dist. No. 1, Special Tax Bonds, Series 2016, BAM insured, 5.00% 2027 | 835 | 937 |
Limited Term Tax-Exempt Bond Fund of America — Page 3 of 37
unaudited
Bonds, notes & other debt instruments (continued)
California (continued) | Principal amount
(000) | Value
(000) |
| Rio Elementary School Dist., Community Facs. Dist. No. 1, Special Tax Bonds, Series 2016, BAM insured, 5.00% 2028 | $405 | $451 |
| County of Riverside, Public Fncg. Auth., Tax Allocation Rev. Bonds (Project Area No. 1, Desert Communities and Interstate 215 Corridor Projects), Series 2015-A, Assured Guaranty Municipal insured, 5.00% 2025 | 1,000 | 1,190 |
| County of Riverside, Public Fncg. Auth., Tax Allocation Rev. Bonds (Project Area No. 1, Desert Communities and Interstate 215 Corridor Projects), Series 2015-A, Assured Guaranty Municipal insured, 5.00% 2026 | 1,000 | 1,185 |
Riverside Unified School Dist., Fncg. Auth., Special Tax Rev. Ref. Bonds, Series 2015, BAM insured,
5.00% 2029 | 2,250 | 2,593 |
Riverside Unified School Dist., Fncg. Auth., Special Tax Rev. Ref. Bonds, Series 2015, BAM insured,
5.00% 2031 | 1,035 | 1,184 |
| City of Sacramento, Municipal Utility Dist., Electric Rev. Bonds, Series 1997-K, AMBAC insured, 5.80% 2019 | 3,000 | 3,054 |
City of Sacramento, North Natomas Community Drainage Facs. Dist. No. 97-1, Special Tax Bonds,
Series 2015, 5.00% 2027 | 1,500 | 1,725 |
City and County of San Francisco, Airport Commission, San Francisco International Airport,
Second Series Rev. Ref. Bonds, Series 2017-D, AMT, 5.00% 2024 | 5,900 | 6,767 |
City and County of San Francisco, Airport Commission, San Francisco International Airport,
Second Series Rev. Ref. Bonds, Series 2017-D, AMT, 5.00% 2025 | 5,000 | 5,825 |
City and County of San Francisco, Redev. Fin. Auth., Tax Allocation Rev. Bonds
(Mission Bay South Redev. Project), Series 2016-C, 5.00% 2027 | 1,470 | 1,754 |
City and County of San Francisco, Successor Agcy. to the Redev. Agcy., Community Facs. Dist. No. 6
(Mission Bay South Public Improvements), Special Tax Rev. Ref. Bonds, Series 2013-A, 5.00% 2019 | 1,115 | 1,132 |
City and County of San Francisco, Successor Agcy. to the Redev. Agcy., Community Facs. Dist. No. 6
(Mission Bay South Public Improvements), Special Tax Rev. Ref. Bonds, Series 2013-A, 5.00% 2022 | 1,000 | 1,099 |
| City of San Jose, Airport Rev. Ref. Bonds, Series 2011-A-1, AMT, 5.25% 2022 | 3,650 | 3,906 |
| City of San Jose, Airport Rev. Ref. Bonds, Series 2017-A, AMT, 5.00% 2022 | 1,930 | 2,102 |
| County of San Mateo, Community College Dist., G.O. Bonds, Capital Appreciation Bonds, 2005 Election, Series 2006-A, National insured, 0% 2027 | 1,500 | 1,215 |
City of Santa Fe Springs, Community Dev. Commission, Consolidated Redev. Project, Tax Allocation Bonds,
Capital Appreciation Bonds, Series 2006-A, National insured, 0% 2023 | 4,455 | 4,027 |
| Sonoma-Marin Area Rail Transit Dist., Measure Q Sales Tax Rev. Bonds, Series 2011-A, 5.00% 2022 | 2,795 | 3,096 |
| Southern California Public Power Auth., Transmission Project Rev. Ref. Bonds (Southern Transmission Project), Series 2009-A, 5.00% 2019 | 2,500 | 2,536 |
| Statewide Communities Dev. Auth., Insured Rev. Bonds (Viamonte Senior Living 1 Project), Series 2018-B, 3.00% 2025 | 1,300 | 1,321 |
| Statewide Communities Dev. Auth., Insured Rev. Bonds (Viamonte Senior Living 1 Project), Series 2018-B, 3.00% 2026 | 4,000 | 4,056 |
| Statewide Communities Dev. Auth., Pollution Control Rev. Ref. Bonds (Southern California Edison Company), Series 2006-D, 2.625% 2033 (put 2023) | 1,250 | 1,229 |
Statewide Communities Dev. Auth., Rev. Bonds (American Baptist Homes of the West), Series 2013-A,
5.00% 2023 | 1,300 | 1,399 |
Statewide Communities Dev. Auth., Rev. Bonds (American Baptist Homes of the West), Series 2015,
5.00% 2025 | 2,585 | 2,892 |
| Statewide Communities Dev. Auth., Rev. Bonds (Hebrew Home for Aged Disabled), Series 2016, 3.50% 2021 | 8,400 | 8,508 |
Sweetwater Union High School Dist., Capital Appreciation Bonds, Series 2004-C,
Assured Guaranty Municipal insured, 0% 2023 | 3,965 | 3,610 |
Temecula Valley Unified School Dist., Fncg. Auth., Special Tax Rev. Bonds, Series 2015, BAM insured,
5.00% 2023 | 300 | 342 |
Temecula Valley Unified School Dist., Fncg. Auth., Special Tax Rev. Bonds, Series 2015, BAM insured,
5.00% 2028 | 1,000 | 1,156 |
Temecula Valley Unified School Dist., Fncg. Auth., Special Tax Rev. Bonds, Series 2015, BAM insured,
5.00% 2029 | 500 | 576 |
Tobacco Securitization Auth. of Southern California, Tobacco Settlement Asset-Backed Rev. Ref. Bonds
(San Diego County Tobacco Asset Securitization Corp.), Series 2006-A, 4.75% 2025 | 3,155 | 3,155 |
Limited Term Tax-Exempt Bond Fund of America — Page 4 of 37
unaudited
Bonds, notes & other debt instruments (continued)
California (continued) | Principal amount
(000) | Value
(000) |
| Dept. of Veterans Affairs, Veterans G.O. Rev. Ref. Bonds, Series 2015-CM, AMT, 2.45% 2031 | $890 | $875 |
Dept. of Water Resources, Water System Rev. Bonds (Central Valley Project), Series AM,
5.00% 2019 | 2,000 | 2,059 |
| | | 252,942 |
| Colorado 2.54% | | |
| County of Arapahoe, Gardens of Havana Metropolitan Dist. No. 3, Special Rev. Ref. Bonds, Series 2017-A, 3.625% 2021 | 1,883 | 1,915 |
| City of Aurora, Cornerstar Metropolitan Dist., Limited Tax G.O. Rev. Ref. Bonds (Convertible to Unlimited Tax), Series 2017-A, 3.50% 2021 | 1,000 | 1,011 |
| Colorado Bridge Enterprise, Rev. Bonds (Central 70 Project), Series 2017, AMT, 4.00% 2025 | 3,505 | 3,814 |
| Colorado Bridge Enterprise, Rev. Bonds (Central 70 Project), Series 2017, AMT, 4.00% 2026 | 4,050 | 4,398 |
| City and County of Denver, Airport System Rev. Bonds, Series 2013-A, AMT, 5.00% 2021 | 1,000 | 1,080 |
| City and County of Denver, Airport System Rev. Bonds, Series 2013-A, AMT, 5.00% 2022 | 1,300 | 1,438 |
| City and County of Denver, Airport System Rev. Bonds, Series 2018-A, AMT, 5.00% 2026 | 10,000 | 11,805 |
| City and County of Denver, Airport System Rev. Ref. Bonds, Series 2010-A, 5.00% 2021 | 3,000 | 3,183 |
| City and County of Denver, Denver Convention Center Hotel Auth., Rev. Ref. Bonds, Series 2016, 5.00% 2026 | 2,500 | 2,809 |
| City and County of Denver, Denver Convention Center Hotel Auth., Rev. Ref. Bonds, Series 2016, 5.00% 2029 | 6,500 | 7,287 |
City and County of Denver, Dept. of Aviation (Denver International Airport), Rev. Bonds, Series 2016-B,
(1-month USD-LIBOR x 0.70 + 0.86%) 2.616% 2031 (put 2019)1 | 4,250 | 4,257 |
| City and County of Denver, Park Creek Metropolitan Dist., Limited Property Tax Supported Rev. Ref. Bonds, Series 2015-A, 5.00% 2023 | 1,400 | 1,569 |
| City and County of Denver, Park Creek Metropolitan Dist., Limited Property Tax Supported Rev. Ref. Bonds, Series 2015-A, 5.00% 2024 | 1,080 | 1,230 |
| City and County of Denver, Park Creek Metropolitan Dist., Limited Property Tax Supported Rev. Ref. Bonds, Series 2015-A, 5.00% 2025 | 3,835 | 4,405 |
| City of Denver, Urban Renewal Auth., Stapleton Tax Increment Rev. Bonds, Series 2013-A-1, 5.00% 2021 | 3,800 | 4,133 |
| City of Denver, Urban Renewal Auth., Stapleton Tax Increment Rev. Bonds, Series 2013-A-1, 5.00% 2022 | 4,000 | 4,449 |
E-470 Public Highway Auth., Rev. Bonds, Series 2017-B,
(1-month USD-LIBOR x 0.67 + 1.05%) 2.724% 2039 (put 2021)1 | 1,100 | 1,109 |
| Health Facs. Auth., Health Facs. Rev. and Rev. Ref. Bonds (Evangelical Lutheran Good Samaritan Society Project), Series 2015-A, 4.00% 2020 | 300 | 307 |
| Health Facs. Auth., Health Facs. Rev. and Rev. Ref. Bonds (Evangelical Lutheran Good Samaritan Society Project), Series 2015-A, 5.00% 2021 | 1,200 | 1,270 |
| Health Facs. Auth., Health Facs. Rev. and Rev. Ref. Bonds (Evangelical Lutheran Good Samaritan Society Project), Series 2015-A, 5.00% 2022 | 1,500 | 1,621 |
| Health Facs. Auth., Health Facs. Rev. and Rev. Ref. Bonds (Evangelical Lutheran Good Samaritan Society Project), Series 2015-A, 5.00% 2024 | 1,500 | 1,673 |
| Health Facs. Auth., Health Facs. Rev. and Rev. Ref. Bonds (Evangelical Lutheran Good Samaritan Society Project), Series 2015-A, 5.00% 2025 | 3,000 | 3,388 |
| Health Facs. Auth., Health Facs. Rev. and Rev. Ref. Bonds (Evangelical Lutheran Good Samaritan Society Project), Series 2015-A, 5.00% 2029 | 3,455 | 3,817 |
| Health Facs. Auth., Health Facs. Rev. and Rev. Ref. Bonds (Evangelical Lutheran Good Samaritan Society Project), Series 2017, 5.00% 2025 | 1,000 | 1,129 |
| Health Facs. Auth., Health Facs. Rev. and Rev. Ref. Bonds (Evangelical Lutheran Good Samaritan Society Project), Series 2017, 5.00% 2026 | 615 | 699 |
| Health Facs. Auth., Health Facs. Rev. and Rev. Ref. Bonds (Evangelical Lutheran Good Samaritan Society Project), Series 2017, 5.00% 2029 | 1,750 | 1,977 |
| Health Facs. Auth., Hospital Rev. Bonds (Adventist Health System/Sunbelt Obligated Group), Series 2016-C, 5.00% 2036 (put 2023) | 3,000 | 3,413 |
| Health Facs. Auth., Hospital Rev. Bonds (Adventist Health System/Sunbelt Obligated Group), Series 2018-B, 5.00% 2048 (put 2025) | 5,500 | 6,474 |
Health Facs. Auth., Hospital Rev. Ref. Bonds (Valley View Hospital Association Project), Series 2018,
2.80% 2042 (put 2023) | 1,850 | 1,881 |
| Health Facs. Auth., Rev. Bonds (Catholic Health Initiatives), Series 2014-B-3, 1.875% 2039 (put 2019) | 1,000 | 997 |
Limited Term Tax-Exempt Bond Fund of America — Page 5 of 37
unaudited
Bonds, notes & other debt instruments (continued)
Colorado (continued) | Principal amount
(000) | Value
(000) |
| Health Facs. Auth., Rev. Ref. Bonds (Covenant Retirement Communities, Inc.), Series 2015-A, 5.00% 2021 | $1,765 | $1,898 |
| Housing and Fin. Auth., Single Family Mortgage Bonds, Series 2017-C, Class I, 4.00% 2048 | 3,320 | 3,496 |
| Housing and Fin. Auth., Single Family Mortgage Bonds, Series 2018-C, Class I, 4.25% 2048 | 6,400 | 6,869 |
| City of Loveland, Centerra Metropolitan Dist. No. 1, Rev. Ref. Bonds, Series 2017, 5.00% 20202 | 1,000 | 1,037 |
| | | 101,838 |
| Connecticut 1.59% | | |
| Health and Educational Facs. Auth., Rev. Bonds (Quinnipiac University Issue), Series 2016-M, 5.00% 2024 | 1,645 | 1,868 |
| Health and Educational Facs. Auth., Rev. Bonds (Quinnipiac University Issue), Series 2016-M, 5.00% 2025 | 1,450 | 1,674 |
| Health and Educational Facs. Auth., Rev. Bonds (Yale University Issue), Series 2014-A, 1.30% 2048 (put 2020) | 7,000 | 6,969 |
Higher Education Supplemental Loan Auth., Rev. Bonds (Chesla Loan Program), Series 2017-A, AMT,
5.00% 2025 | 1,000 | 1,122 |
| Housing Fin. Auth., Housing Mortgage Fin. Program Bonds, Series 2014-C-1, 4.00% 2044 | 760 | 787 |
| Housing Fin. Auth., Housing Mortgage Fin. Program Bonds, Series 2016-A-1, 4.00% 2045 | 2,785 | 2,894 |
| Housing Fin. Auth., Housing Mortgage Fin. Program Bonds, Series 2016-B-2, AMT, 3.50% 2039 | 2,100 | 2,159 |
| Housing Fin. Auth., Housing Mortgage Fin. Program Bonds, Series 2016-E-1, 3.50% 2046 | 5,615 | 5,785 |
| Housing Fin. Auth., Housing Mortgage Fin. Program Bonds, Series 2016-F-2, AMT, 3.50% 2039 | 3,115 | 3,205 |
| Housing Fin. Auth., Housing Mortgage Fin. Program Bonds, Series 2017-A-1, 4.00% 2047 | 1,670 | 1,755 |
| Housing Fin. Auth., Housing Mortgage Fin. Program Bonds, Series 2017-C-1, 4.00% 2047 | 4,960 | 5,213 |
| Housing Fin. Auth., Housing Mortgage Fin. Program Bonds, Series 2017-D, 4.00% 2047 | 2,640 | 2,779 |
| Housing Fin. Auth., Housing Mortgage Fin. Program Bonds, Series 2018-A-2, AMT, 4.00% 2041 | 2,800 | 2,952 |
| Housing Fin. Auth., Housing Mortgage Fin. Program Bonds, Series 2018-C-1, 4.00% 2045 | 7,955 | 8,450 |
| Housing Fin. Auth., Housing Mortgage Fin. Program Rev. Ref. Bonds, Series 2012-F-2, AMT, 2.75% 2035 | 330 | 332 |
| Housing Fin. Auth., Housing Mortgage Fin. Program Rev. Ref. Bonds, Series 2015-A, 3.50% 2044 | 5,395 | 5,532 |
| Housing Fin. Auth., Housing Mortgage Fin. Program Rev. Ref. Bonds, Series 2015-C-1, 3.50% 2045 | 1,650 | 1,695 |
| Special Tax Obligation Rev. Ref. Bonds, Transportation Infrastructure Purposes, Series 2009-1, 5.00% 2019 | 8,550 | 8,550 |
| | | 63,721 |
| Delaware 0.00% | | |
| Housing Auth., Single Family Mortgage Rev. Ref. Bonds, Series 2009-A-1, 5.45% 2040 | 40 | 40 |
| District of Columbia 0.53% | | |
| G.O. Rev. Ref. Bonds, Series B, XLCA-Assured Guaranty Municipal insured, 5.25% 2020 | 2,000 | 2,093 |
| Hospital Rev. Ref. Bonds (Children’s Hospital Obligated Group Issue), Series 2015, 5.00% 2027 | 1,500 | 1,737 |
| Metropolitan Washington DC Airports Auth., Airport System Rev. Ref. Bonds, Series 2012-A, AMT, 5.00% 2020 | 3,000 | 3,154 |
| Metropolitan Washington DC Airports Auth., Airport System Rev. Ref. Bonds, Series 2015-B, AMT, 5.00% 2027 | 1,000 | 1,154 |
| Metropolitan Washington DC Airports Auth., Airport System Rev. Ref. Bonds, Series 2017, AMT, 5.00% 2026 | 5,000 | 5,897 |
| Washington Convention and Sports Auth., Dedicated Tax Rev. Ref. Bonds, Series 2018-A, 5.00% 2027 | 4,900 | 5,912 |
| Washington Convention and Sports Auth., Dedicated Tax Rev. Ref. Bonds, Series 2018-A, 5.00% 2028 | 1,250 | 1,498 |
| | | 21,445 |
| Florida 5.61% | | |
| Board of Education, Public Education Capital Outlay Rev. Ref. Bonds, Series 2014-B, 5.00% 2024 | 9,275 | 10,781 |
| County of Brevard, Educational Facs. Auth., Demand Rev. Bonds (Florida Institute of Technology Project), Series 2014, 5.00% 2023 | 1,100 | 1,225 |
County of Brevard, Health Facs. Auth., Rev. Ref. Bonds (Health First, Inc. Project), Series 2009,
7.00% 2039 (preref. 2019) | 1,000 | 1,008 |
| County of Broward, Airport System Rev. Bonds, Series 2017, AMT, 5.00% 2026 | 2,500 | 2,941 |
| County of Broward, Airport System Rev. Bonds, Series 2017, AMT, 5.00% 2027 | 1,500 | 1,777 |
| County of Broward, Airport System Rev. Ref. Bonds, Series 2012-P-1, AMT, 5.00% 2024 | 5,000 | 5,508 |
City of Cape Coral, Utility Improvement Rev. Ref. Assessment Bonds (Various Areas), Series 2017,
Assured Guaranty Municipal insured, 2.00% 2021 | 1,105 | 1,098 |
City of Cape Coral, Utility Improvement Rev. Ref. Assessment Bonds (Various Areas), Series 2017,
Assured Guaranty Municipal insured, 2.125% 2022 | 1,200 | 1,190 |
Limited Term Tax-Exempt Bond Fund of America — Page 6 of 37
unaudited
Bonds, notes & other debt instruments (continued)
Florida (continued) | Principal amount
(000) | Value
(000) |
City of Cape Coral, Utility Improvement Rev. Ref. Assessment Bonds (Various Areas), Series 2017,
Assured Guaranty Municipal insured, 5.67% 2028 (preref. 2019) | $2,000 | $2,071 |
| Citizens Property Insurance Corp., Coastal Account Secured Bonds, Series 2011-A-1, 5.00% 2019 | 5,000 | 5,054 |
| Citizens Property Insurance Corp., High-Risk Account Secured Rev. Ref. Bonds, Series 2015-A-1, 5.00% 2020 | 3,500 | 3,593 |
Citizens Property Insurance Corp., Personal Lines Account/Commercial Lines Account Secured Bonds,
Series 2012-A-1, 5.00% 2020 | 4,500 | 4,688 |
Citizens Property Insurance Corp., Personal Lines Account/Commercial Lines Account Secured Bonds,
Series 2012-A-1, 5.00% 2021 | 1,000 | 1,073 |
Citizens Property Insurance Corp., Personal Lines Account/Commercial Lines Account Secured Bonds,
Series 2012-A-1, 5.00% 2022 | 10,200 | 11,249 |
| Citizens Property Insurance Corp., Personal Lines Account/Commercial Lines Account Senior Secured Bonds, Series 2012-A-1, 5.00% 2019 | 3,600 | 3,639 |
County of Collier, Health Facs. Auth., Residential Care Fac. Rev. Bonds (Moorings Inc.), Series 2015-A,
5.00% 2023 | 400 | 441 |
County of Collier, Health Facs. Auth., Residential Care Fac. Rev. Bonds (Moorings Inc.), Series 2015-A,
5.00% 2024 | 500 | 559 |
County of Collier, Health Facs. Auth., Residential Care Fac. Rev. Bonds (Moorings Inc.), Series 2015-A,
5.00% 2025 | 330 | 375 |
County of Collier, Health Facs. Auth., Residential Care Fac. Rev. Bonds (Moorings Inc.), Series 2015-A,
5.00% 2026 | 350 | 395 |
County of Collier, Health Facs. Auth., Residential Care Fac. Rev. Bonds (Moorings Inc.), Series 2015-A,
5.00% 2027 | 240 | 269 |
County of Collier, Health Facs. Auth., Residential Care Fac. Rev. Bonds (Moorings Inc.), Series 2015-A,
5.00% 2028 | 445 | 497 |
| Board of Education, Lottery Rev. Ref. Bonds, Series 2019-A, 5.00% 2023 | 6,520 | 7,388 |
| Board of Education, Public Education Capital Outlay Rev. Ref. Bonds, Series 2017-C, 5.00% 2027 | 7,340 | 8,977 |
County of Escambia, Health Facs. Auth., Health Care Facs. Rev. Bonds (Baptist Hospital, Inc. Project),
Series 2010-A, 5.125% 2020 | 1,270 | 1,332 |
| Greater Orlando Aviation Auth., Airport Facs. Rev. Bonds, Series 2017-A, AMT, 5.00% 2025 | 1,000 | 1,160 |
| Greater Orlando Aviation Auth., Airport Facs. Rev. Bonds, Series 2017-A, AMT, 5.00% 2026 | 1,000 | 1,173 |
| Greater Orlando Aviation Auth., Airport Facs. Rev. Bonds, Series 2017-A, AMT, 5.00% 2027 | 500 | 592 |
| Greater Orlando Aviation Auth., Airport Facs. Rev. Ref. Bonds, Series 2012-A, AMT, 5.00% 2021 | 3,700 | 3,985 |
| Housing Fin. Corp., Homeowner Mortgage Rev. Bonds (Special Program), Series 2009-A-1, 5.00% 2028 | 25 | 25 |
| Housing Fin. Corp., Homeowner Mortgage Rev. Bonds (Special Program), Series 2015-A, 3.50% 2046 | 365 | 373 |
| Housing Fin. Corp., Homeowner Mortgage Rev. Bonds, Series 2015-1, 4.00% 2047 | 955 | 993 |
| Housing Fin. Corp., Homeowner Mortgage Rev. Bonds, Series 2016-2, 4.00% 2047 | 845 | 881 |
| Housing Fin. Corp., Homeowner Mortgage Rev. Bonds, Series 2017-1, 4.00% 2048 | 11,475 | 12,126 |
| Housing Fin. Corp., Homeowner Mortgage Rev. Bonds, Series 2018-2, 4.25% 2050 | 15,350 | 16,547 |
| City of Jacksonville, Better Jacksonville Sales Tax Rev. Ref. Bonds, Series 2011, 5.00% 2019 | 5,000 | 5,105 |
| JEA, Water and Sewer System Rev. Bonds, Series 2012-A, 5.00% 2032 (preref. 2021) | 3,085 | 3,300 |
| City of Miami Beach, Health Facs. Auth., Hospital Rev. Ref. Bonds (Mount Sinai Medical Center of Florida), Series 2012, 5.00% 2019 | 1,650 | 1,686 |
| City of Miami Beach, Health Facs. Auth., Hospital Rev. Ref. Bonds (Mount Sinai Medical Center of Florida), Series 2012, 5.00% 2021 | 1,000 | 1,073 |
| County of Miami-Dade, Aviation Rev. Bonds, Series 2010-A, 5.00% 2021 | 2,250 | 2,378 |
| County of Miami-Dade, Aviation Rev. Ref. Bonds, Series 2012-A, AMT, 5.00% 2020 | 2,000 | 2,094 |
| County of Miami-Dade, Aviation Rev. Ref. Bonds, Series 2012-A, AMT, 5.00% 2021 | 11,600 | 12,462 |
| County of Miami-Dade, Aviation Rev. Ref. Bonds, Series 2014, AMT, 5.00% 2023 | 945 | 1,059 |
| County of Miami-Dade, Aviation Rev. Ref. Bonds, Series 2014-A, AMT, 5.00% 2027 | 1,325 | 1,494 |
| County of Miami-Dade, Expressway Auth., Toll System Rev. Ref. Bonds, Series 2014-B, 5.00% 2022 | 1,750 | 1,931 |
County of Miami-Dade, Miami International Airport (Hub of the Americas), Aviation Rev. Ref. Bonds,
Series 2009-A, 5.75% 2022 | 1,500 | 1,541 |
County of Miami-Dade, Miami International Airport (Hub of the Americas), Aviation Rev. Ref. Bonds,
Series 2009-B, 5.75% 2021 | 2,000 | 2,055 |
| County of Miami-Dade, Transit System Sales Surtax Rev. Bonds, Series 2012, 5.00% 2019 | 1,250 | 1,267 |
Limited Term Tax-Exempt Bond Fund of America — Page 7 of 37
unaudited
Bonds, notes & other debt instruments (continued)
Florida (continued) | Principal amount
(000) | Value
(000) |
| County of Miami-Dade, Transit System Sales Surtax Rev. Bonds, Series 2012, 5.00% 2020 | $550 | $574 |
Municipal Power Agcy., All-Requirements Power Supply Project Rev. Bonds, Series 2009,
5.25% 2020 (preref. 2019) | 2,430 | 2,487 |
| Municipal Power Agcy., All-Requirements Power Supply Project Rev. Bonds, Series 2016-A, 5.00% 2024 | 2,300 | 2,674 |
| County of Orange, Health Facs. Auth., Health Care Facs. Rev. Ref. Bonds (Presbyterian Retirement Communities Project), Series 2016, 5.00% 2031 | 2,450 | 2,678 |
| City of Orlando, Utilities Commission, Utility System Rev. Ref. Bonds, Series 2017-A, 5.00% 2027 (put 2020) | 6,000 | 6,297 |
| Orlando-Orange Expressway Auth., Rev. Ref. Bonds, Series 2012, 5.00% 2019 | 1,250 | 1,267 |
| Orlando-Orange Expressway Auth., Rev. Ref. Bonds, Series 2012, 5.00% 2020 | 1,500 | 1,568 |
| Orlando-Orange Expressway Auth., Rev. Ref. Bonds, Series 2012-B, 5.00% 2020 | 1,000 | 1,045 |
| Orlando-Orange Expressway Auth., Rev. Ref. Bonds, Series 2012-B, 5.00% 2022 | 1,250 | 1,383 |
| Orlando-Orange Expressway Auth., Rev. Ref. Bonds, Series 2012-B, 5.00% 2023 | 1,500 | 1,696 |
County of Palm Beach, Health Facs. Auth., Rev. Bonds (Lifespace Communities, Inc.), Series 2015-C,
5.00% 2022 | 1,690 | 1,790 |
| County of Palm Beach, Solid Waste Auth., Improvement Rev. Ref. Bonds, Series 2011, 5.00% 2019 | 5,000 | 5,106 |
| Ports Fncg. Commission, Rev. Ref. Bonds (State Transportation Trust Fund), Series 2011-B, AMT, 5.00% 2021 | 2,500 | 2,684 |
| South Florida Water Management Dist., Certs. of Part., Series 2015, 5.00% 2026 | 2,000 | 2,375 |
| City of South Miami, Health Facs. Auth., Hospital Rev. Ref. Bonds (Baptist Health South Florida Obligated Group), Series 2017, 5.00% 2020 | 2,000 | 2,097 |
| City of South Miami, Health Facs. Auth., Hospital Rev. Ref. Bonds (Baptist Health South Florida Obligated Group), Series 2017, 5.00% 2021 | 1,250 | 1,343 |
| City of South Miami, Health Facs. Auth., Hospital Rev. Ref. Bonds (Baptist Health South Florida Obligated Group), Series 2017, 5.00% 2025 | 1,545 | 1,804 |
| City of South Miami, Health Facs. Auth., Hospital Rev. Ref. Bonds (Baptist Health South Florida Obligated Group), Series 2017, 5.00% 2026 | 1,000 | 1,182 |
| City of South Miami, Health Facs. Auth., Hospital Rev. Ref. Bonds (Baptist Health South Florida Obligated Group), Series 2017, 5.00% 2027 | 1,250 | 1,493 |
Southeast Overtown/Park West Community Redev. Agcy., Tax Increment Rev. Bonds, Series 2014-A-1,
5.00% 20202 | 1,000 | 1,033 |
Southeast Overtown/Park West Community Redev. Agcy., Tax Increment Rev. Bonds, Series 2014-A-1,
5.00% 20212 | 2,000 | 2,121 |
Southeast Overtown/Park West Community Redev. Agcy., Tax Increment Rev. Bonds, Series 2014-A-1,
5.00% 20222 | 2,000 | 2,170 |
Southeast Overtown/Park West Community Redev. Agcy., Tax Increment Rev. Bonds, Series 2014-A-1,
5.00% 20232 | 1,000 | 1,104 |
County of Sumter, Industrial Dev. Auth., Hospital Rev. Bonds (Central Florida Health Alliance Projects),
Series 2014-A, 5.00% 2021 | 500 | 534 |
County of Sumter, Industrial Dev. Auth., Hospital Rev. Bonds (Central Florida Health Alliance Projects),
Series 2014-A, 5.00% 2026 | 500 | 561 |
County of Sumter, Industrial Dev. Auth., Hospital Rev. Bonds (Central Florida Health Alliance Projects),
Series 2014-A, 5.00% 2027 | 330 | 368 |
| Dept. of Transportation, Right-of-Way Acquisition and Bridge Construction Rev. Ref. Bonds, Series 2012-A, 4.00% 2028 | 10,800 | 11,295 |
| Dept. of Transportation, Turnpike Rev. Ref. Bonds, Series 2019-A, 5.00% 2026 | 9,365 | 11,293 |
| Water Pollution Control Fncg. Corp., Water Pollution Control Rev. Bonds, Series 2008-A, 5.00% 2020 | 508 | 509 |
| | | 224,959 |
| Georgia 1.83% | | |
| City of Atlanta, Tax Allocation Rev. Ref. Bonds (Atlantic Station Project), Series 2017, 5.00% 2019 | 1,200 | 1,230 |
| City of Atlanta, Tax Allocation Rev. Ref. Bonds (Atlantic Station Project), Series 2017, 5.00% 2020 | 1,100 | 1,157 |
| City of Atlanta, Tax Allocation Rev. Ref. Bonds (Atlantic Station Project), Series 2017, 5.00% 2021 | 1,250 | 1,349 |
| City of Atlanta, Tax Allocation Rev. Ref. Bonds (Atlantic Station Project), Series 2017, 5.00% 2022 | 1,000 | 1,102 |
| City of Atlanta, Tax Allocation Rev. Ref. Bonds (Beltline Project), Series 2016-B, 5.00% 2023 | 1,270 | 1,408 |
| City of Atlanta, Tax Allocation Rev. Ref. Bonds (Beltline Project), Series 2016-B, 5.00% 2024 | 2,460 | 2,780 |
| City of Atlanta, Tax Allocation Rev. Ref. Bonds (Beltline Project), Series 2016-B, 5.00% 2025 | 2,620 | 3,013 |
Limited Term Tax-Exempt Bond Fund of America — Page 8 of 37
unaudited
Bonds, notes & other debt instruments (continued)
Georgia (continued) | Principal amount
(000) | Value
(000) |
| City of Atlanta, Tax Allocation Rev. Ref. Bonds (Beltline Project), Series 2016-D, 5.00% 2023 | $2,310 | $2,562 |
| City of Atlanta, Tax Allocation Rev. Ref. Bonds (Beltline Project), Series 2016-D, 5.00% 2025 | 2,895 | 3,330 |
| City of Atlanta, Water and Wastewater Rev. Ref. Bonds, Series 2013-B, 5.00% 2020 | 2,000 | 2,115 |
| County of Burke, Dev. Auth., Pollution Control Rev. Bonds (Georgia Power Company Plant Vogtle Project), Series 2012, 1.85% 2049 (put 2019) | 3,550 | 3,545 |
| G.O. Ref. Bonds, Series 2009-I, 5.00% 2019 | 2,000 | 2,028 |
| Housing and Fin. Auth., Single Family Mortgage Bonds, Series 2015-A-1, 3.50% 2045 | 625 | 642 |
| Housing and Fin. Auth., Single Family Mortgage Bonds, Series 2016-A-1, 3.50% 2046 | 1,160 | 1,194 |
| Main Street Natural Gas, Inc., Gas Project Rev. Bonds, Series 2006-B, 5.00% 2020 | 5,000 | 5,161 |
| Main Street Natural Gas, Inc., Gas Supply Rev. Bonds, Series 2018-A, 4.00% 2048 (put 2023) | 15,000 | 15,860 |
| Municipal Electric Auth., Power Rev. Bonds, Series 2018-HH, 5.00% 2029 | 2,000 | 2,319 |
| Municipal Electric Auth., Project One Bonds, Series 2011-A, 5.00% 2021 | 11,490 | 12,079 |
Private Colleges and Universities Auth., Rev. Bonds (The Savannah College of Art and Design Projects),
Series 2014, 5.00% 2022 | 1,050 | 1,147 |
Private Colleges and Universities Auth., Rev. Bonds (The Savannah College of Art and Design Projects),
Series 2014, 5.00% 2024 | 2,500 | 2,846 |
| Road and Tollway Auth., Federal Highway Grant Anticipation Rev. Bonds, Series 2009-A, 5.00% 2019 | 3,500 | 3,538 |
| Road and Tollway Auth., Federal Highway Grant Anticipation Rev. Ref. Bonds, Series 2017-B, 5.00% 2020 | 3,000 | 3,130 |
| | | 73,535 |
| Guam 0.21% | | |
| A.B. Won Pat International Airport Auth., General Rev. Bonds, Series 2013-C, AMT, 5.00% 2021 | 5,320 | 5,488 |
| A.B. Won Pat International Airport Auth., General Rev. Bonds, Series 2013-C, AMT, 6.25% 2034 | 500 | 569 |
| Waterworks Auth., Water and Wastewater System Rev. Bonds, Series 2010, 5.00% 2019 | 1,175 | 1,187 |
| Waterworks Auth., Water and Wastewater System Rev. Bonds, Series 2016, 5.00% 2026 | 965 | 1,094 |
| | | 8,338 |
| Hawaii 0.55% | | |
| Airports System Rev. Ref. Bonds, Series 2011, AMT, 5.00% 2019 | 3,345 | 3,387 |
| G.O. Bonds, Series 2011-DZ, 5.00% 2020 | 1,085 | 1,149 |
| G.O. Bonds, Series 2011-DZ, 5.00% 2020 (escrowed to maturity) | 800 | 847 |
| G.O. Rev. Ref. Bonds, Series 2011-EA, 5.00% 2019 | 1,000 | 1,028 |
City and County of Honolulu, G.O. Bonds (Honolulu Rail Transit Project), Series 2017-H,
(SIFMA Municipal Swap Index + 0.31%) 1.74% 2024 (put 2020)1 | 2,500 | 2,497 |
City and County of Honolulu, G.O. Bonds (Honolulu Rail Transit Project), Series 2017-H,
(SIFMA Municipal Swap Index + 0.32%) 1.75% 2025 (put 2020)1 | 4,500 | 4,496 |
City and County of Honolulu, G.O. Bonds (Honolulu Rail Transit Project), Series 2017-H,
(SIFMA Municipal Swap Index + 0.32%) 1.75% 2026 (put 2020)1 | 5,000 | 4,995 |
| City and County of Honolulu, G.O. Bonds, Series 2012-B, 5.00% 2021 | 1,250 | 1,361 |
City and County of Honolulu, Wastewater System Rev. Bonds (First Bond Resolution), Series 2015-B,
5.00% 2026 | 1,000 | 1,182 |
| Dept. of Transportation, Airports Division, Lease Rev. Certs. of Part., Series 2013, AMT, 5.00% 2023 | 1,000 | 1,117 |
| | | 22,059 |
| Idaho 0.28% | | |
Health Facs. Auth., Hospital Rev. Bonds (CHE Trinity Health Credit Group), Series 2013-ID,
1.70% 2048 (put 2019) | 4,500 | 4,500 |
Housing and Fin. Assn., Grant and Rev. Anticipation Bonds (Federal Highway Trust Fund),
Series 2009-A, 5.00% 2020 | 3,000 | 3,043 |
Housing and Fin. Assn., Grant and Rev. Anticipation Bonds (Federal Highway Trust Fund),
Series 2015-A, 5.00% 2025 | 1,500 | 1,756 |
Housing and Fin. Assn., Grant and Rev. Anticipation Bonds (Federal Highway Trust Fund),
Series 2015-A, 5.00% 2026 | 1,515 | 1,797 |
| | | 11,096 |
Limited Term Tax-Exempt Bond Fund of America — Page 9 of 37
unaudited
Bonds, notes & other debt instruments (continued)
Illinois 12.56% | Principal amount
(000) | Value
(000) |
| Build Illinois Bonds, Sales Tax Rev. Bonds, Series 2013, 5.00% 2020 | $1,000 | $1,033 |
| Build Illinois Bonds, Sales Tax Rev. Bonds, Series 2013, 5.00% 2024 | 4,230 | 4,536 |
| Build Illinois Bonds, Sales Tax Rev. Ref. Bonds, Second Series 2002, FGIC-National insured, 5.75% 2019 | 2,390 | 2,420 |
| Build Illinois Bonds, Sales Tax Rev. Ref. Bonds, Series 2010, 5.00% 2019 | 2,250 | 2,272 |
| Build Illinois Bonds, Sales Tax Rev. Ref. Bonds, Series 2010, 5.00% 2020 | 1,200 | 1,240 |
| Build Illinois Bonds, Sales Tax Rev. Ref. Bonds, Series 2016-C, 4.00% 2025 | 4,515 | 4,653 |
| Build Illinois Bonds, Sales Tax Rev. Ref. Bonds, Series 2016-C, 4.00% 2026 | 11,805 | 12,092 |
| Build Illinois Bonds, Sales Tax Rev. Ref. Bonds, Series 2016-D, 4.00% 2021 | 1,900 | 1,953 |
City of Chicago, Board of Education, Unlimited Tax G.O. Bonds (Dedicated Rev.),
Assured Guaranty Municipal insured, Series 2018-A, 5.00% 2023 | 900 | 992 |
| City of Chicago, Chicago Midway Airport, Rev. Ref. Bonds, Series 2014-A, AMT, 5.00% 2023 | 1,000 | 1,099 |
| City of Chicago, Chicago Midway Airport, Rev. Ref. Bonds, Series 2014-A, AMT, 5.00% 2024 | 8,975 | 10,045 |
| City of Chicago, Chicago Midway Airport, Rev. Ref. Bonds, Series 2016-A, AMT, 5.00% 2027 | 500 | 570 |
| City of Chicago, G.O. Rev. Ref. Bonds, Series 2015-C, 5.00% 2024 | 2,480 | 2,638 |
| City of Chicago, G.O. Rev. Ref. Bonds, Series 2015-C, 5.00% 2025 | 1,900 | 2,035 |
| City of Chicago, G.O. Rev. Ref. Bonds, Series 2015-C, 5.00% 2026 | 2,270 | 2,438 |
| City of Chicago, O’Hare International Airport, General Airport Rev. Bonds, Series 2012-B, AMT, 5.00% 2024 | 2,000 | 2,153 |
| City of Chicago, O’Hare International Airport, General Airport Rev. Bonds, Series 2013-A, AMT, 5.00% 2022 | 3,055 | 3,287 |
| City of Chicago, O’Hare International Airport, General Airport Rev. Bonds, Series 2017-D, 5.00% 2026 | 4,000 | 4,700 |
| City of Chicago, O’Hare International Airport, General Airport Rev. Bonds, Series 2017-D, 5.25% 2029 | 1,500 | 1,777 |
City of Chicago, O’Hare International Airport, General Airport Rev. Ref. Bonds, Series 2012-A, AMT,
5.00% 2025 | 6,170 | 6,632 |
City of Chicago, O’Hare International Airport, General Airport Rev. Ref. Bonds, Series 2013-A, AMT,
5.00% 2021 | 10,000 | 10,543 |
City of Chicago, O’Hare International Airport, General Airport Rev. Ref. Bonds, Series 2013-A, AMT,
5.00% 2023 | 5,000 | 5,488 |
City of Chicago, O’Hare International Airport, General Airport Rev. Ref. Bonds, Series 2018-A, AMT,
5.00% 2020 | 1,000 | 1,026 |
| City of Chicago, O’Hare International Airport, Passenger Fac. Charge Rev. Ref. Bonds, Series 2013-B, AMT, 5.00% 2022 | 3,000 | 3,227 |
| City of Chicago, Transit Auth., Capital Grant Receipts Rev. Bonds (Federal Transit Administration Section 5307 Guideway Modernization Formula Funds), Assured Guaranty insured, Series 2011, 5.00% 2022 | 1,400 | 1,489 |
| City of Chicago, Transit Auth., Sales Tax Receipts Rev. Bonds, Series 2011, 5.00% 2021 | 2,000 | 2,152 |
| City of Chicago, Wastewater Transmission Rev. Bonds, Series 2012, 5.00% 2021 | 850 | 895 |
| City of Chicago, Wastewater Transmission Rev. Ref. Bonds, Series 2008-C, 5.00% 2022 | 760 | 819 |
| City of Chicago, Wastewater Transmission Rev. Ref. Bonds, Series 2014, 5.00% 2022 | 1,100 | 1,187 |
| City of Chicago, Wastewater Transmission Rev. Ref. Bonds, Series 2014, 5.00% 2023 | 1,435 | 1,576 |
| City of Chicago, Wastewater Transmission Rev. Ref. Bonds, Series 2017-B, 5.00% 2024 | 1,500 | 1,674 |
| City of Chicago, Wastewater Transmission Rev. Ref. Bonds, Series 2017-B, 5.00% 2025 | 1,000 | 1,132 |
| City of Chicago, Wastewater Transmission Rev. Ref. Bonds, Series 2017-B, 5.00% 2026 | 1,165 | 1,335 |
| City of Chicago, Water Rev. Bonds, Series 1999, Assured Guaranty Municipal insured, 5.00% 2029 | 1,000 | 1,154 |
| City of Chicago, Water Rev. Bonds, Series 2000, 5.00% 2022 | 10,500 | 11,530 |
| City of Chicago, Water Rev. Bonds, Series 2004, 5.00% 2026 | 5,225 | 6,051 |
| City of Chicago, Water Rev. Bonds, Series 2004, 5.00% 2027 | 1,750 | 2,014 |
| City of Chicago, Water Rev. Ref. Bonds, Series 2012, 5.00% 2025 | 775 | 842 |
| City of Chicago, Water Rev. Ref. Bonds, Series 2014, 5.00% 2023 | 1,010 | 1,127 |
Counties of Cook, DuPage, Kane, Lake, McHenry and Will, Regional Transportation Auth., G.O. Bonds,
Series 2001-A, FGIC-National insured, 5.50% 2020 | 2,000 | 2,100 |
Counties of Cook, DuPage, Kane, Lake, McHenry and Will, Regional Transportation Auth., G.O. Bonds,
Series 2004-A, Assured Guaranty Municipal insured, 5.25% 2025 | 1,935 | 2,269 |
Counties of Cook, DuPage, Kane, Lake, McHenry and Will, Regional Transportation Auth., G.O. Bonds,
Series 2004-A, Assured Guaranty Municipal insured, 5.50% 2026 | 6,800 | 8,193 |
| Counties of Cook, DuPage, Kane, Lake, McHenry and Will, Regional Transportation Auth., G.O. Rev. Ref. Bonds, Series 1997, FGIC-National insured, 6.00% 2020 | 4,000 | 4,135 |
Limited Term Tax-Exempt Bond Fund of America — Page 10 of 37
unaudited
Bonds, notes & other debt instruments (continued)
Illinois (continued) | Principal amount
(000) | Value
(000) |
| Counties of Cook, DuPage, Kane, Lake, McHenry and Will, Regional Transportation Auth., G.O. Rev. Ref. Bonds, Series 1999, Assured Guaranty Municipal insured, 5.75% 2023 | $1,000 | $1,128 |
| County of Cook, G.O. Rev. Ref. Bonds, Series 2011-A, 5.00% 2019 | 2,500 | 2,559 |
| County of Cook, G.O. Rev. Ref. Bonds, Series 2016-A, 5.00% 2019 | 1,000 | 1,024 |
| County of Cook, G.O. Rev. Ref. Bonds, Series 2016-A, 5.00% 2022 | 1,000 | 1,095 |
| County of Cook, G.O. Rev. Ref. Bonds, Series 2016-A, 5.00% 2026 | 3,400 | 3,871 |
| County of Cook, G.O. Rev. Ref. Bonds, Series 2016-A, Assured Guaranty Municipal insured, 5.00% 2026 | 4,000 | 4,703 |
| Fin. Auth., National Rural Utilities Cooperative Fin. Corp., Guaranteed Solid Waste Disposal Rev. Bonds (Prairie Power, Inc. Project), Series 2008-A, 1.75% 2042 (put 2020) | 3,020 | 3,000 |
| Fin. Auth., Rev. Bonds (Advocate Health Care Network), Series 2010-D, 5.00% 2019 | 1,000 | 1,005 |
| Fin. Auth., Rev. Bonds (Advocate Health Care Network), Series 2014, 5.00% 2021 | 375 | 404 |
| Fin. Auth., Rev. Bonds (Art Institute of Chicago), Series 2009-A, 5.25% 2019 | 1,400 | 1,404 |
| Fin. Auth., Rev. Bonds (Central DuPage Health), Series 2009, 5.00% 2019 (escrowed to maturity) | 2,185 | 2,238 |
| Fin. Auth., Rev. Bonds (Clean Water Initiative Revolving Fund), Series 2016, 4.00% 2025 | 5,115 | 5,705 |
| Fin. Auth., Rev. Bonds (Clean Water Initiative Revolving Fund), Series 2016, 5.00% 2026 | 1,000 | 1,193 |
| Fin. Auth., Rev. Bonds (Clean Water Initiative Revolving Fund), Series 2016, 5.00% 2028 | 10,590 | 12,436 |
| Fin. Auth., Rev. Bonds (Clean Water Initiative Revolving Fund), Series 2017, 5.00% 2027 | 2,000 | 2,414 |
| Fin. Auth., Rev. Bonds (Clean Water Initiative Revolving Fund), Series 2017, 5.00% 2028 | 1,920 | 2,290 |
| Fin. Auth., Rev. Bonds (Clean Water Initiative Revolving Fund), Series 2017, 5.00% 2029 | 2,000 | 2,368 |
| Fin. Auth., Rev. Bonds (Clean Water Initiative Revolving Fund), Series 2017, 5.00% 2032 | 6,605 | 7,651 |
| Fin. Auth., Rev. Bonds (Lifespace Communities), Series 2015-A, 5.00% 2020 | 290 | 298 |
| Fin. Auth., Rev. Bonds (Lifespace Communities), Series 2015-A, 5.00% 2022 | 200 | 213 |
| Fin. Auth., Rev. Bonds (Lifespace Communities), Series 2015-A, 5.00% 2026 | 540 | 592 |
| Fin. Auth., Rev. Bonds (Lifespace Communities), Series 2015-A, 5.00% 2028 | 1,060 | 1,152 |
| Fin. Auth., Rev. Bonds (Mercy Health Corp.), Series 2016, 5.00% 2025 | 5,530 | 6,422 |
| Fin. Auth., Rev. Bonds (Mercy Health Corp.), Series 2016, 5.00% 2027 | 5,000 | 5,738 |
| Fin. Auth., Rev. Bonds (Northwest Community Hospital), Series 2016-A, 5.00% 2026 | 1,080 | 1,265 |
| Fin. Auth., Rev. Bonds (Northwest Community Hospital), Series 2016-A, 5.00% 2027 | 1,000 | 1,161 |
| Fin. Auth., Rev. Bonds (Northwestern Memorial Healthcare), Series 2017-B, 5.00% 2057 (put 2022) | 8,045 | 8,960 |
| Fin. Auth., Rev. Bonds (Presbyterian Homes Obligated Group), Series 2016-A, 5.00% 2024 | 1,920 | 2,143 |
Fin. Auth., Rev. Bonds (Presbyterian Homes Obligated Group), Series 2016-B,
(1-month USD-LIBOR x 0.70 + 1.35%) 3.113% 2036 (put 2021)1 | 2,275 | 2,283 |
| Fin. Auth., Rev. Bonds (Presence Health Network Obligated Group), Series 2016-C, 4.00% 2024 | 4,000 | 4,381 |
| Fin. Auth., Rev. Bonds (Presence Health Network Obligated Group), Series 2016-C, 5.00% 2022 | 1,500 | 1,639 |
| Fin. Auth., Rev. Bonds (Presence Health Network Obligated Group), Series 2016-C, 5.00% 2023 | 1,545 | 1,729 |
| Fin. Auth., Rev. Bonds (Presence Health Network Obligated Group), Series 2016-C, 5.00% 2024 | 1,425 | 1,629 |
| Fin. Auth., Rev. Bonds (Presence Health Network Obligated Group), Series 2016-C, 5.00% 2025 | 850 | 989 |
| Fin. Auth., Rev. Bonds (Presence Health Network Obligated Group), Series 2016-C, 5.00% 2026 | 1,065 | 1,259 |
| Fin. Auth., Rev. Bonds (Presence Health Network Obligated Group), Series 2016-C, 5.00% 2027 | 8,640 | 10,328 |
| Fin. Auth., Rev. Bonds (Rehabilitation Institute of Chicago), Series 2013-A, 5.00% 2022 | 1,665 | 1,818 |
| Fin. Auth., Rev. Bonds (Rush University Medical Center Obligated Group), Series 2015-A, 5.00% 2028 | 4,000 | 4,538 |
| Fin. Auth., Rev. Bonds (Rush University Medical Center Obligated Group), Series 2015-A, 5.00% 2029 | 9,500 | 10,742 |
| Fin. Auth., Rev. Bonds (Swedish Covenant Hospital), Series 2016-A, 5.25% 2028 | 1,020 | 1,172 |
| Fin. Auth., Rev. Ref. Bonds (Advocate Health Care Network), Series 2008-A-3, 5.00% 2030 (put 2019) | 6,000 | 6,045 |
| Fin. Auth., Rev. Ref. Bonds (Loyola University of Chicago), Series 2012-B, 5.00% 2023 | 1,970 | 2,154 |
| Fin. Auth., Rev. Ref. Bonds (OSF Healthcare System), Series 2015-A, 5.00% 2023 | 750 | 848 |
| Fin. Auth., Rev. Ref. Bonds (OSF Healthcare System), Series 2015-A, 5.00% 2026 | 1,165 | 1,347 |
| Fin. Auth., Rev. Ref. Bonds (OSF Healthcare System), Series 2015-A, 5.00% 2029 | 1,500 | 1,703 |
| Fin. Auth., Rev. Ref. Bonds (Provena Health), Series 2009-A, 7.75% 2034 (preref. 2019) | 990 | 1,021 |
| Fin. Auth., Rev. Ref. Bonds (Provena Health), Series 2009-A, 7.75% 2034 (preref. 2019) | 10 | 10 |
| G.O. Bonds, Series 2013, 5.00% 2022 | 1,250 | 1,324 |
| G.O. Bonds, Series 2017-B, 5.00% 2019 | 10,000 | 10,196 |
| G.O. Bonds, Series 2017-D, BAM insured, 5.00% 2020 | 9,000 | 9,353 |
| G.O. Bonds, Series 2017-D, BAM insured, 5.00% 2024 | 5,000 | 5,381 |
| G.O. Rev. Ref. Bonds, Series 2012, 5.00% 2019 | 5,200 | 5,268 |
Limited Term Tax-Exempt Bond Fund of America — Page 11 of 37
unaudited
Bonds, notes & other debt instruments (continued)
Illinois (continued) | Principal amount
(000) | Value
(000) |
City of Granite, Solid Waste Disposal Rev. Bonds (Waste Management, Inc. Project), Series 2002-A,
AMT, 2.25% 2027 (put 2019) | $20,000 | $20,000 |
| Housing Dev. Auth., Homeowner Mortgage Rev. Bonds, Series 2016-B, AMT, 3.50% 2046 | 2,955 | 3,042 |
| Housing Dev. Auth., Homeowner Mortgage Rev. Bonds, Series 2016-C, 3.50% 2046 | 5,650 | 5,853 |
| Housing Dev. Auth., Homeowner Mortgage Rev. Bonds, Series 2018-A-1, 4.00% 2048 | 8,440 | 8,970 |
Housing Dev. Auth., Multi Family Housing Rev. Notes (Marshall Field Garden Apartment Homes), Series 2015,
(SIFMA Municipal Swap Index + 1.00%) 2.43% 2050 (put 2025)1 | 11,625 | 11,534 |
| Housing Dev. Auth., Rev. Bonds, Series 2016-A, 4.00% 2046 | 2,170 | 2,271 |
| Housing Dev. Auth., Rev. Bonds, Series 2017-B, 4.00% 2048 | 2,240 | 2,370 |
Board of Trustees of the Illinois State University, Auxiliary Facs. System Rev. Bonds, Series 2016,
Assured Guaranty Municipal insured, 5.00% 2023 | 2,700 | 2,953 |
Metropolitan Pier and Exposition Auth., McCormick Place Expansion Project Rev. Bonds,
Series 2002-A, Assured Guaranty Municipal insured, 5.50% 2023 | 5,000 | 5,508 |
Metropolitan Pier and Exposition Auth., McCormick Place Expansion Project Rev. Ref. Bonds,
Series 2012-B, 5.00% 2020 | 3,905 | 4,053 |
Metropolitan Pier and Exposition Auth., McCormick Place Expansion Project Rev. Ref. Bonds,
Series 2012-B, 5.00% 2026 | 2,230 | 2,324 |
Metropolitan Pier and Exposition Auth., McCormick Place Expansion Project Rev. Ref. Bonds,
Series 2012-B, 5.00% 2028 | 1,000 | 1,037 |
Metropolitan Pier and Exposition Auth., McCormick Place Expansion Project Rev. Ref. Bonds,
Series 2017-B, 5.00% 2025 | 665 | 719 |
Metropolitan Pier and Exposition Auth., McCormick Place Expansion Project Rev. Ref. Bonds,
Series 2017-B, 5.00% 2026 | 1,000 | 1,084 |
Metropolitan Water Reclamation Dist. of Greater Chicago, Unlimited Tax G.O. Rev. Ref. Bonds,
Series 2016-A, 5.00% 2025 | 2,000 | 2,342 |
Metropolitan Water Reclamation Dist. of Greater Chicago, Unlimited Tax G.O. Rev. Ref. Bonds,
Series 2016-A, 5.00% 2026 | 2,500 | 2,959 |
| Municipal Electric Agcy., Power Supply System Rev. Ref. Bonds, Series 2015-A, 5.00% 2027 | 3,000 | 3,472 |
| Railsplitter Tobacco Settlement Auth., Tobacco Settlement Rev. Bonds, Series 2010, 5.125% 2019 | 6,500 | 6,564 |
| Railsplitter Tobacco Settlement Auth., Tobacco Settlement Rev. Bonds, Series 2010, 5.25% 2020 | 6,525 | 6,786 |
| Railsplitter Tobacco Settlement Auth., Tobacco Settlement Rev. Bonds, Series 2010, 5.375% 2021 | 1,000 | 1,071 |
Railsplitter Tobacco Settlement Auth., Tobacco Settlement Rev. Bonds, Series 2010,
5.50% 2023 (preref. 2021) | 12,925 | 14,021 |
| Railsplitter Tobacco Settlement Auth., Tobacco Settlement Rev. Bonds, Series 2017, 5.00% 2023 | 4,800 | 5,326 |
| Railsplitter Tobacco Settlement Auth., Tobacco Settlement Rev. Bonds, Series 2017, 5.00% 2024 | 5,000 | 5,646 |
| Railsplitter Tobacco Settlement Auth., Tobacco Settlement Rev. Bonds, Series 2017, 5.00% 2025 | 5,000 | 5,721 |
| Regional Transportation Auth., G.O. Rev. Ref. Bonds, Series 2017-A, 5.00% 2027 | 10,000 | 11,835 |
| Regional Transportation Auth., G.O. Rev. Ref. Bonds, Series 2017-A, 5.00% 2028 | 10,000 | 11,827 |
| Sales Tax Securitization Corp., Sales Tax Rev. Ref. Bonds, Series 2017-A, 5.00% 2023 | 2,900 | 3,158 |
| Sales Tax Securitization Corp., Sales Tax Securitization Bonds, Series 2017-A, 5.00% 2027 | 3,000 | 3,410 |
| Sales Tax Securitization Corp., Sales Tax Securitization Bonds, Series 2018-C, 5.00% 2027 | 3,000 | 3,410 |
Southwestern Illinois Dev. Auth., Health Fac. Rev. Bonds (Memorial Group, Inc.), Series 2013,
7.125% 2043 (preref. 2023) | 2,500 | 3,090 |
Southwestern Illinois Dev. Auth., Health Fac. Rev. Bonds (Memorial Group, Inc.), Series 2013,
7.25% 2036 (preref. 2023) | 3,080 | 3,824 |
| Toll Highway Auth., Toll Highway Rev. Bonds, Series 2014-A, 5.00% 2021 | 1,250 | 1,359 |
| Toll Highway Auth., Toll Highway Rev. Bonds, Series 2014-D, 5.00% 2024 | 4,375 | 4,994 |
| Toll Highway Auth., Toll Highway Rev. Bonds, Series 2016-B, 5.00% 2027 | 950 | 1,123 |
| Toll Highway Auth., Toll Highway Rev. Ref. Bonds, Series 2019-A, 5.00% 2025 | 1,680 | 1,951 |
| Toll Highway Auth., Toll Highway Rev. Ref. Bonds, Series 2019-A, 5.00% 2026 | 4,000 | 4,717 |
| Toll Highway Auth., Toll Highway Rev. Ref. Bonds, Series 2019-A, 5.00% 2027 | 1,500 | 1,794 |
| Toll Highway Auth., Toll Highway Rev. Ref. Bonds, Series 2019-A, 5.00% 2028 | 2,000 | 2,409 |
| Board of Trustees of the University of Illinois, Auxiliary Facs. System Rev. Bonds, Series 2011-A, 5.00% 2019 | 770 | 774 |
Board of Trustees of the University of Illinois, Auxiliary Facs. System Rev. Ref. Bonds, Series 2005-A,
National insured, 5.50% 2023 | 2,700 | 3,069 |
Limited Term Tax-Exempt Bond Fund of America — Page 12 of 37
unaudited
Bonds, notes & other debt instruments (continued)
Illinois (continued) | Principal amount
(000) | Value
(000) |
| Village of Volo, Special Service Areas Nos. 3 and 6 (Symphony Meadows/Lancaster Falls Projects), Special Tax Rev. Ref. Bonds, Series 2016, Assured Guaranty Municipal insured, 3.00% 2020 | $624 | $628 |
United City of Yorkville, Special Service Area Nos. 2005-108 and 2005-109, Special Tax Rev. Ref. Bonds,
Series 2016, Assured Guaranty Municipal insured, 2.375% 2022 | 554 | 551 |
United City of Yorkville, Special Service Area Nos. 2005-108 and 2005-109, Special Tax Rev. Ref. Bonds,
Series 2016, Assured Guaranty Municipal insured, 2.625% 2023 | 1,106 | 1,105 |
United City of Yorkville, Special Service Area Nos. 2005-108 and 2005-109, Special Tax Rev. Ref. Bonds,
Series 2016, Assured Guaranty Municipal insured, 3.00% 2021 | 991 | 1,001 |
| | | 503,767 |
| Indiana 1.56% | | |
Dev. Fin. Auth., Solid Waste Disposal Rev. Bonds (Waste Management, Inc. Project), Series 2001, AMT,
2.95% 2031 (put 2021) | 1,000 | 1,000 |
| Fin. Auth., Hospital Rev. Ref. Bonds (Community Health Network Project), Series 2012-A, 5.00% 2020 | 1,460 | 1,516 |
| Fin. Auth., Hospital Rev. Ref. Bonds (Indiana University Health Obligated Group), Series 2011-N, 5.00% 2020 | 5,000 | 5,172 |
| Fin. Auth., Hospital Rev. Ref. Bonds (Indiana University Health Obligated Group), Series 2016-A, 5.00% 2022 | 4,440 | 4,959 |
| Fin. Auth., Hospital Rev. Ref. Bonds (Indiana University Health Obligated Group), Series 2016-A, 5.00% 2023 | 1,500 | 1,713 |
| Fin. Auth., Hospital Rev. Ref. Bonds (Indiana University Health Obligated Group), Series 2016-A, 5.00% 2024 | 1,000 | 1,167 |
| Fin. Auth., Hospital Rev. Ref. Bonds (Indiana University Health Obligated Group), Series 2016-A, 5.00% 2025 | 2,000 | 2,374 |
| Fin. Auth., Hospital Rev. Ref. Bonds (Parkview Health System Obligated Group), Series 2012-A, 5.00% 2021 | 1,940 | 2,071 |
| Fin. Auth., Hospital Rev. Ref. Bonds (Parkview Health System Obligated Group), Series 2012-A, 5.00% 2022 | 1,940 | 2,124 |
Fin. Auth., Hospital Rev. Ref. Bonds (Parkview Health System Obligated Group), Series 2012-A,
5.00% 2021 (escrowed to maturity) | 60 | 64 |
Fin. Auth., Hospital Rev. Ref. Bonds (Parkview Health System Obligated Group), Series 2012-A,
5.00% 2022 (escrowed to maturity) | 60 | 66 |
| Fin. Auth., Hospital Rev. Ref. Bonds (Parkview Health), Series 2017-A, 5.00% 2025 | 1,200 | 1,404 |
| Fin. Auth., Hospital Rev. Ref. Bonds (Parkview Health), Series 2017-A, 5.00% 2026 | 1,365 | 1,616 |
| Fin. Auth., Hospital Rev. Ref. Bonds (Parkview Health), Series 2017-A, 5.00% 2027 | 700 | 836 |
| Fin. Auth., Rev. Ref. Bonds (Community Foundation of Northwest Indiana Obligated Group), Series 2015, 5.00% 2026 | 500 | 576 |
| Fin. Auth., Rev. Ref. Bonds (Community Foundation of Northwest Indiana Obligated Group), Series 2015, 5.00% 2027 | 500 | 573 |
| Fin. Auth., Rev. Ref. Bonds (Community Foundation of Northwest Indiana Obligated Group), Series 2015, 5.00% 2028 | 500 | 570 |
| Fin. Auth., Wastewater Utility Rev. Bonds (CWA Auth. Project), Series 2011-B, 5.00% 2019 | 1,000 | 1,021 |
| Gary/Chicago International Airport Auth., Airport Dev. Zone Rev. Bonds, Series 2014, AMT, 5.50% 2025 | 3,630 | 3,641 |
Health Facs. Fncg. Auth., Rev. Bonds (Ascension Health Senior Credit Group), Series 2001-A-2,
4.00% 2036 (put 2019) | 6,200 | 6,211 |
Health Facs. Fncg. Auth., Rev. Bonds (Ascension Health Senior Credit Group), Series 2005-A-1,
2.80% 2027 (put 2019) | 1,525 | 1,531 |
| Housing and Community Dev. Auth., Single Family Mortgage Rev. Bonds, Series 2016-A-2, AMT, 3.50% 2038 | 1,885 | 1,932 |
| Housing and Community Dev. Auth., Single Family Mortgage Rev. Bonds, Series 2017-A-2, AMT, 4.00% 2039 | 1,515 | 1,571 |
| Housing and Community Dev. Auth., Single Family Mortgage Rev. Bonds, Series 2019-A, 4.25% 2048 | 2,000 | 2,159 |
Indianapolis Local Public Improvement Bond Bank, Ref. Bonds (Indianapolis Airport Auth. Project),
Series 2014-D, AMT, 5.00% 2022 | 2,000 | 2,163 |
County of Jasper, Pollution Control Rev. Ref. Bonds (Northern Indiana Public Service Co. Project),
Series 1988-C, National insured, 5.85% 2019 | 2,000 | 2,011 |
| Municipal Power Agcy., Power Supply System Rev. Bonds, Series 2016-C, 5.00% 2025 | 1,000 | 1,168 |
| City of Rockport, Pollution Control Rev. Ref. Bonds (Indiana Michigan Power Co. Project), Series 2002-A, 2.75% 2025 | 1,500 | 1,479 |
| City of Rockport, Pollution Control Rev. Ref. Bonds (Indiana Michigan Power Co. Project), Series 2008-D, 2.05% 2025 (put 2021) | 1,200 | 1,196 |
| City of Rockport, Pollution Control Rev. Ref. Bonds (Indiana Michigan Power Co. Project), Series 2009-A, 3.05% 2025 | 2,000 | 2,007 |
Limited Term Tax-Exempt Bond Fund of America — Page 13 of 37
unaudited
Bonds, notes & other debt instruments (continued)
Indiana (continued) | Principal amount
(000) | Value
(000) |
City of Whiting, Environmental Facs. Rev. Bonds (BP Products North America Inc. Project), Series 2008,
1.85% 2044 (put 2019) | $4,500 | $4,493 |
City of Whiting, Environmental Facs. Rev. Bonds (BP Products North America Inc. Project), Series 2015,
AMT, 5.00% 2045 (put 2022) | 2,000 | 2,171 |
| | | 62,555 |
| Iowa 0.07% | | |
| Fin. Auth., Single Family Mortgage Bonds, Series 2015-A, AMT, 3.50% 2040 | 510 | 521 |
| Fin. Auth., Single Family Mortgage Bonds, Series 2017-A, 4.00% 2047 | 2,190 | 2,304 |
| | | 2,825 |
| Kansas 0.03% | | |
| Dev. Fin. Auth., Hospital Rev. Ref. Bonds (Adventist Health System/Sunbelt Obligated Group), Series 2009-D, 5.00% 2020 | 1,095 | 1,123 |
| Dev. Fin. Auth., Hospital Rev. Ref. Bonds (Adventist Health System/Sunbelt Obligated Group), Series 2009-D, 5.00% 2020 (preref. 2019) | 55 | 57 |
| | | 1,180 |
| Kentucky 0.32% | | |
| Asset/Liability Commission, Project Notes, Federal Highway Trust Fund, Series 2014-A, 5.00% 2024 | 3,000 | 3,449 |
| Health Facs. Auth., Rev. Bonds (Catholic Health Initiatives), Series 2014-B, 2.70% 2039 (put 2021) | 1,500 | 1,512 |
| Property and Buildings Commission, Rev. Ref. Bonds (Project No. 93), Assured Guaranty insured, Series 2009, 5.25% 2028 (preref. 2019) | 3,000 | 3,000 |
| Property and Buildings Commission, Rev. Ref. Bonds (Project No. 93), Assured Guaranty Municipal insured, Series 2009, 5.25% 2023 (preref. 2019) | 1,000 | 1,000 |
| Turnpike Auth., Econ. Dev. Road Rev. Bonds (Revitalization Projects), Series 2012-A, 5.00% 2019 | 4,000 | 4,052 |
| | | 13,013 |
| Louisiana 1.16% | | |
| Aviation Board, General Airport Rev. Bonds (North Terminal Project), Series 2015-B, AMT, 5.00% 2025 | 1,600 | 1,821 |
| Aviation Board, General Airport Rev. Ref. Bonds, Series 2017-D-2, AMT, 5.00% 2029 | 1,000 | 1,150 |
Citizens Property Insurance Corp., Assessment Rev. Ref. Bonds, Assured Guaranty Municipal insured,
Series 2012, 5.00% 2024 (preref. 2022) | 1,000 | 1,105 |
Citizens Property Insurance Corp., Assessment Rev. Ref. Bonds, Assured Guaranty Municipal insured,
Series 2015, 5.00% 2022 | 1,250 | 1,374 |
| Citizens Property Insurance Corp., Assessment Rev. Ref. Bonds, Series 2016-A, 5.00% 2025 | 5,400 | 6,323 |
| G.O. Bonds, Series 2011-A, 5.00% 2020 | 6,000 | 6,297 |
| Gasoline and Fuels Tax Rev. Ref. Bonds, Series 2012-A-1, 5.00% 2020 | 2,000 | 2,078 |
City of New Orleans, Regional Transit Auth., Sales Tax Rev. Bonds, Series 2010,
Assured Guaranty Municipal insured, 5.00% 2020 | 1,250 | 1,319 |
| City of New Orleans, Water Rev. and Rev. Ref. Bonds, Series 2014, 5.00% 2027 | 1,000 | 1,146 |
| City of New Orleans, Water Rev. and Rev. Ref. Bonds, Series 2014, 5.00% 2028 | 900 | 1,026 |
| Public Facs. Auth., Rev. Ref. Bonds (Ochsner Clinic Foundation Project), Series 2015, 5.00% 2021 | 445 | 473 |
Tobacco Settlement Fncg. Corp., Tobacco Settlement Asset-Backed Rev. Ref. Bonds, Series 2013-A,
5.00% 2020 | 5,430 | 5,610 |
Tobacco Settlement Fncg. Corp., Tobacco Settlement Asset-Backed Rev. Ref. Bonds, Series 2013-A,
5.00% 2021 | 1,000 | 1,056 |
Tobacco Settlement Fncg. Corp., Tobacco Settlement Asset-Backed Rev. Ref. Bonds, Series 2013-A,
5.00% 2022 | 7,235 | 7,780 |
Tobacco Settlement Fncg. Corp., Tobacco Settlement Asset-Backed Rev. Ref. Bonds, Series 2013-A,
5.00% 2023 | 2,160 | 2,356 |
Limited Term Tax-Exempt Bond Fund of America — Page 14 of 37
unaudited
Bonds, notes & other debt instruments (continued)
Louisiana (continued) | Principal amount
(000) | Value
(000) |
Tobacco Settlement Fncg. Corp., Tobacco Settlement Asset-Backed Rev. Ref. Bonds, Series 2013-A,
5.50% 2028 | $3,285 | $3,290 |
Tobacco Settlement Fncg. Corp., Tobacco Settlement Asset-Backed Rev. Ref. Bonds, Series 2013-A,
5.50% 2029 | 2,500 | 2,521 |
| | | 46,725 |
| Maine 0.33% | | |
| Housing Auth., Mortgage Purchase Bonds, Series 2016-B-1, 3.50% 2046 | 1,635 | 1,678 |
| Housing Auth., Mortgage Purchase Bonds, Series 2016-C, 3.50% 2046 | 1,040 | 1,072 |
| Housing Auth., Mortgage Purchase Bonds, Series 2018-F, 4.25% 2048 | 4,110 | 4,429 |
| Housing Auth., Mortgage Purchase Bonds, Series 2019-A, 4.00% 2049 | 3,375 | 3,603 |
| Housing Auth., Mortgage Purchase Rev. Ref. Bonds, Series 2013-B, 4.00% 2043 | 390 | 401 |
| Housing Auth., Mortgage Purchase Rev. Ref. Bonds, Series 2015-B, 3.50% 2040 | 790 | 810 |
| Housing Auth., Mortgage Purchase Rev. Ref. Bonds, Series 2015-E-1, AMT, 3.50% 2035 | 1,200 | 1,230 |
| | | 13,223 |
| Maryland 1.23% | | |
Community Dev. Administration, Dept. of Housing and Community Dev., Residential Rev. Bonds,
Series 2014-B, AMT, 3.25% 2044 | 530 | 539 |
Community Dev. Administration, Dept. of Housing and Community Dev., Residential Rev. Bonds,
Series 2014-C, 4.00% 2044 | 115 | 120 |
Econ. Dev. Corp., Rev. Ref. Bonds (Constellation Energy Group, Inc. Project), Series 2006-B,
2.55% 2025 (put 2020) | 2,365 | 2,359 |
Econ. Dev. Corp., Student Housing Rev. Ref. Bonds (Frostburg State University Project), Series 2013,
5.00% 2023 | 1,000 | 1,081 |
| G.O. Bonds, State and Local Facs. Loan of 2014, First Series A, 5.00% 2019 | 1,050 | 1,053 |
| Health and Higher Educational Facs. Auth., Rev. Bonds (Anne Arundel Health System Issue), Series 2009-A, 6.75% 2039 (preref. 2019) | 1,000 | 1,020 |
| Health and Higher Educational Facs. Auth., Rev. Bonds (Anne Arundel Health System Issue), Series 2010, 5.00% 2028 (preref. 2019) | 3,000 | 3,040 |
| Health and Higher Educational Facs. Auth., Rev. Bonds (Anne Arundel Health System Issue), Series 2010, 5.00% 2040 (preref. 2019) | 1,315 | 1,332 |
| Health and Higher Educational Facs. Auth., Rev. Ref. Bonds (MedStar Health Issue), Series 2015, 5.00% 2027 | 5,000 | 5,735 |
County of Montgomery, Housing Opportunities Commission, Single Family Housing Rev. Bonds,
Series 2017-A, 4.00% 2048 | 3,110 | 3,277 |
| Transportation Auth., Airport Parking Rev. Ref. Bonds (Baltimore/Washington International Thurgood Marshall Airport Projects), Series 2012-B, AMT, 5.00% 2020 | 8,150 | 8,409 |
| Transportation Auth., Airport Parking Rev. Ref. Bonds (Baltimore/Washington International Thurgood Marshall Airport Projects), Series 2012-B, AMT, 5.00% 2021 | 7,565 | 7,994 |
| Washington Suburban Sanitary Dist., Consolidated Public Improvement Bonds, Series 2018, 5.00% 2031 | 11,000 | 13,335 |
| | | 49,294 |
| Massachusetts 2.65% | | |
| Dev. Fin. Agcy., Rev. Bonds (Berkshire Health Systems Issue), Series 2012-G, 5.00% 2020 | 1,205 | 1,267 |
| Dev. Fin. Agcy., Rev. Bonds (Berkshire Health Systems Issue), Series 2012-G, 5.00% 2021 | 1,500 | 1,620 |
| Dev. Fin. Agcy., Rev. Bonds (Boston Medical Center Issue), Series 2012-C, 5.25% 2025 | 2,390 | 2,623 |
| Dev. Fin. Agcy., Rev. Bonds (CareGroup Obligated Group), Series 2016-I, 5.00% 2025 | 2,500 | 2,868 |
| Dev. Fin. Agcy., Rev. Bonds (CareGroup Obligated Group), Series 2016-I, 5.00% 2026 | 1,000 | 1,161 |
| Dev. Fin. Agcy., Rev. Bonds (Partners HealthCare System Issue), Series 2012-L, 5.00% 2031 (preref. 2021) | 3,130 | 3,364 |
| Dev. Fin. Agcy., Rev. Bonds (Partners HealthCare System Issue), Series 2017-S-2, 5.00% 2038 (put 2025) | 5,000 | 5,800 |
| Dev. Fin. Agcy., Rev. Bonds (Partners HealthCare System Issue), Series 2017-S-4, 5.00% 2038 (put 2024) | 2,500 | 2,846 |
| Dev. Fin. Agcy., Rev. Bonds (UMass Memorial Health Care Obligated Group Issue), Series 2016-I, 5.00% 2024 | 2,000 | 2,269 |
| Dev. Fin. Agcy., Rev. Bonds (UMass Memorial Health Care Obligated Group Issue), Series 2016-I, 5.00% 2025 | 1,275 | 1,468 |
| Dev. Fin. Agcy., Rev. Bonds (UMass Memorial Health Care Obligated Group Issue), Series 2016-I, 5.00% 2026 | 1,150 | 1,341 |
| Dev. Fin. Agcy., Rev. Bonds (UMass Memorial Health Care Obligated Group Issue), Series 2016-I, 5.00% 2027 | 1,150 | 1,329 |
Limited Term Tax-Exempt Bond Fund of America — Page 15 of 37
unaudited
Bonds, notes & other debt instruments (continued)
Massachusetts (continued) | Principal amount
(000) | Value
(000) |
| Dev. Fin. Agcy., Rev. Ref. Bonds (Suffolk University Issue), Series 2017, 5.00% 2025 | $1,500 | $1,703 |
| Dev. Fin. Agcy., Rev. Ref. Bonds (Tufts Medical Center Issue), Series 2011-I, 6.875% 2041 | 1,020 | 1,109 |
| Dev. Fin. Agcy., Rev. Ref. Bonds (Tufts Medical Center Issue), Series 2011-I, 6.875% 2041 (preref. 2021) | 1,395 | 1,527 |
| Educational Fncg. Auth., Education Loan Rev. Bonds, Series 2012-J, AMT, 5.00% 2020 | 3,635 | 3,778 |
| Educational Fncg. Auth., Education Loan Rev. Bonds, Series 2014-I, AMT, 5.00% 2022 | 3,000 | 3,236 |
| Educational Fncg. Auth., Education Loan Rev. Bonds, Series 2014-I, AMT, 5.00% 2023 | 3,000 | 3,307 |
| Educational Fncg. Auth., Education Loan Rev. Bonds, Series 2014-I, AMT, 5.00% 2025 | 3,000 | 3,422 |
| Educational Fncg. Auth., Education Loan Rev. Bonds, Series 2016-J, AMT, 3.50% 2033 | 3,945 | 3,956 |
| Educational Fncg. Auth., Education Loan Rev. Bonds, Series 2016-J, AMT, 5.00% 2024 | 4,000 | 4,540 |
| Educational Fncg. Auth., Education Loan Rev. Bonds, Series 2017-A, AMT, 3.625% 2032 | 3,960 | 4,015 |
| Educational Fncg. Auth., Education Loan Rev. Bonds, Series 2017-A, AMT, 5.00% 2022 | 1,000 | 1,091 |
| Educational Fncg. Auth., Education Loan Rev. Bonds, Series 2017-A, AMT, 5.00% 2023 | 2,500 | 2,785 |
| G.O. Bonds, Consolidated Loan, Series 2014-D-2, 1.70% 2043 (put 2022) | 4,000 | 3,969 |
Health and Educational Facs. Auth., Rev. Bonds (Partners HealthCare System Issue), Series 2010-J-1,
5.25% 2029 (preref. 2019) | 1,000 | 1,015 |
| Housing Fin. Agcy., Construction Loan Notes, Series 2017-B, 2.05% 2021 | 3,000 | 3,005 |
Housing Fin. Agcy., Multi Family Housing Rev. Bonds (Conduit-Chestnut Park Project), Series 2018-A,
2.40% 2023 (put 2021) | 2,070 | 2,085 |
| Housing Fin. Agcy., Single Family Housing Rev. Bonds, Series 167, 4.00% 2043 | 510 | 526 |
| Housing Fin. Agcy., Single Family Housing Rev. Bonds, Series 181, 4.00% 2044 | 1,265 | 1,315 |
| Housing Fin. Agcy., Single Family Housing Rev. Bonds, Series 183, 3.50% 2046 | 2,955 | 3,036 |
| Housing Fin. Agcy., Single Family Housing Rev. Bonds, Series 190, 4.00% 2048 | 9,800 | 10,344 |
| Housing Fin. Agcy., Single Family Housing Rev. Ref. Bonds, Series 171, 4.00% 2044 | 455 | 469 |
| Housing Fin. Agcy., Single Family Housing Rev. Ref. Bonds, Series 177, AMT, 4.00% 2039 | 1,955 | 2,023 |
| Housing Fin. Agcy., Single Family Housing Rev. Ref. Bonds, Series 188, AMT, 4.00% 2043 | 4,290 | 4,501 |
| Port Auth., Rev. Bonds, Series 2012-A, AMT, 5.00% 2021 | 305 | 327 |
| Port Auth., Rev. Bonds, Series 2017-A, AMT, 5.00% 2025 | 5,000 | 5,845 |
| Port Auth., Rev. Bonds, Series 2017-A, AMT, 5.00% 2026 | 2,510 | 2,977 |
| Special Obligation Dedicated Tax Rev. Ref. Bonds, Series 2005, FGIC-National insured, 5.00% 2020 | 2,580 | 2,656 |
| | | 106,518 |
| Michigan 3.73% | | |
| Building Auth., Rev. Ref. Bonds (Facs. Program), Series 2015-I, 5.00% 2023 | 3,000 | 3,388 |
| Building Auth., Rev. Ref. Bonds (Facs. Program), Series 2015-I, 5.00% 2026 | 800 | 949 |
City of Detroit, Water and Sewerage Dept., Sewage Disposal System Rev. Ref. Bonds,
Series 2004-A, Assured Guaranty Municipal Insured, 5.25% 2020 | 150 | 157 |
Detroit School Dist., Unlimited Tax G.O. School Building and Site Improvement Rev. Ref. Bonds,
Series 2012-A, 5.00% 2019 | 1,200 | 1,209 |
| Fin. Auth., Hospital Rev. Ref. Bonds (Oakwood Obligated Group), Series 2012, 5.00% 2022 | 5,000 | 5,546 |
Fin. Auth., Local Government Loan Program Rev. Bonds (Detroit Water and Sewerage Dept., Sewage Disposal System Rev. and Rev. Ref. Local Project Bonds), Series 2014-C-3, Assured Guaranty Municipal insured,
5.00% 2022 | 5,000 | 5,509 |
Fin. Auth., Local Government Loan Program Rev. Bonds (Detroit Water and Sewerage Dept., Sewage Disposal System Rev. and Rev. Ref. Local Project Bonds), Series 2014-C-3, Assured Guaranty Municipal insured,
5.00% 2023 | 1,215 | 1,370 |
Fin. Auth., Local Government Loan Program Rev. Bonds (Detroit Water and Sewerage Dept., Sewage Disposal System Rev. and Rev. Ref. Local Project Bonds), Series 2014-C-3, Assured Guaranty Municipal insured,
5.00% 2024 | 4,000 | 4,605 |
| Fin. Auth., Local Government Loan Program Rev. Bonds (Detroit Water and Sewerage Dept., Sewage Disposal System Rev. and Rev. Ref. Local Project Bonds), Series 2014-C-5, National insured, 5.00% 2020 | 6,970 | 7,266 |
| Fin. Auth., Local Government Loan Program Rev. Bonds (Detroit Water and Sewerage Dept., Sewage Disposal System Rev. Ref. Local Project Bonds), Series 2015-C, 5.00% 2027 | 1,750 | 1,997 |
| Fin. Auth., Student Loan Rev. Ref. Bonds, Series 25-A, AMT, 5.00% 2020 | 1,750 | 1,832 |
| Fin. Auth., Student Loan Rev. Ref. Bonds, Series 25-A, AMT, 5.00% 2021 | 1,650 | 1,766 |
Limited Term Tax-Exempt Bond Fund of America — Page 16 of 37
unaudited
Bonds, notes & other debt instruments (continued)
Michigan (continued) | Principal amount
(000) | Value
(000) |
County of Genesee, Water Supply System G.O. Limited Tax Rev. Ref. Bonds, Series 2014, BAM insured,
5.00% 2022 | $515 | $569 |
County of Genesee, Water Supply System G.O. Limited Tax Rev. Ref. Bonds, Series 2014, BAM insured,
5.00% 2023 | 500 | 563 |
County of Genesee, Water Supply System G.O. Limited Tax Rev. Ref. Bonds, Series 2014, BAM insured,
5.00% 2024 | 850 | 964 |
| Grant Anticipation Rev. Ref. Bonds, Series 2016, 5.00% 2024 | 4,500 | 5,172 |
| Great Lakes Water Auth., Water Supply System Rev. Ref. Bonds, Series 2016-C, 5.00% 2028 | 2,000 | 2,349 |
| Great Lakes Water Auth., Water Supply System Rev. Ref. Bonds, Series 2016-C, 5.00% 2029 | 2,000 | 2,340 |
| Hospital Fin. Auth., Hospital Rev. and Rev. Ref. Bonds (Trinity Health Credit Group), Series 2017-A, 5.00% 2021 | 500 | 543 |
| Hospital Fin. Auth., Hospital Rev. and Rev. Ref. Bonds (Trinity Health Credit Group), Series 2017-A, 5.00% 2024 | 1,000 | 1,159 |
| Hospital Fin. Auth., Hospital Rev. and Rev. Ref. Bonds (Trinity Health Credit Group), Series 2017-A, 5.00% 2025 | 1,000 | 1,179 |
| Hospital Fin. Auth., Hospital Rev. and Rev. Ref. Bonds (Trinity Health Credit Group), Series 2017-A, 5.00% 2026 | 1,000 | 1,195 |
Hospital Fin. Auth., Hospital Rev. Ref. Bonds (Ascension Health Senior Credit Group), Series 2010-B,
5.00% 2019 | 2,000 | 2,050 |
Hospital Fin. Auth., Hospital Rev. Ref. Bonds (Ascension Health Senior Credit Group), Series 2010-F-2,
1.90% 2047 (put 2021) | 1,850 | 1,842 |
| Hospital Fin. Auth., Hospital Rev. Ref. Bonds (Beaumont Health Credit Group), Series 2015, 5.00% 2025 | 4,000 | 4,594 |
| Hospital Fin. Auth., Hospital Rev. Ref. Bonds (Henry Ford Health System), Series 2016, 5.00% 2027 | 4,000 | 4,675 |
| Hospital Fin. Auth., Hospital Rev. Ref. Bonds (McLaren Health Care), Series 2012-A, 5.00% 2021 | 2,000 | 2,142 |
Hospital Fin. Auth., Hospital Rev. Ref. Bonds (McLaren Health Care), Series 2015-D-2,
(1-month USD-LIBOR x 0.68 + 0.75%) 2.449% 2038 (put 2020)1 | 2,000 | 2,009 |
| Hospital Fin. Auth., Hospital Rev. Ref. Bonds (Trinity Health Credit Group), Series 2008-C, 5.00% 2022 | 700 | 779 |
| Housing Dev. Auth., Single Family Mortgage Rev. Bonds, Series 2014, 4.00% 2044 | 955 | 991 |
| Housing Dev. Auth., Single Family Mortgage Rev. Bonds, Series 2016-A, 4.00% 2046 | 785 | 820 |
| Housing Dev. Auth., Single Family Mortgage Rev. Bonds, Series 2016-B, 3.50% 2047 | 16,910 | 17,489 |
| Housing Dev. Auth., Single Family Mortgage Rev. Bonds, Series 2017-B, 3.50% 2048 | 2,945 | 3,058 |
| Housing Dev. Auth., Single Family Mortgage Rev. Bonds, Series 2018-A, 4.00% 2048 | 4,435 | 4,703 |
| Housing Dev. Auth., Single Family Mortgage Rev. Bonds, Series 2018-C, 4.25% 2049 | 16,820 | 18,076 |
City of Saginaw, Hospital Fin. Auth., Hospital Rev. Ref. Bonds (Covenant Medical Center, Inc.),
Series 2010-H, 5.00% 2020 | 2,400 | 2,493 |
County of Wayne, Airport Auth., Airport Rev. Ref. Bonds (Detroit Metropolitan Wayne County Airport),
Series 2011-A, AMT, 5.00% 2019 | 1,000 | 1,025 |
County of Wayne, Airport Auth., Airport Rev. Ref. Bonds (Detroit Metropolitan Wayne County Airport),
Series 2011-A, AMT, 5.00% 2020 | 10,000 | 10,557 |
County of Wayne, Airport Auth., Airport Rev. Ref. Bonds (Detroit Metropolitan Wayne County Airport),
Series 2011-A, AMT, 5.00% 2021 | 8,240 | 8,892 |
County of Wayne, Airport Auth., Airport Rev. Ref. Bonds (Detroit Metropolitan Wayne County Airport),
Series 2011-A, AMT, Assured Guaranty Municipal insured, 4.00% 2020 | 4,000 | 4,151 |
County of Wayne, Airport Auth., Airport Rev. Ref. Bonds (Detroit Metropolitan Wayne County Airport),
Series 2011-B, 5.00% 2019 | 1,000 | 1,027 |
County of Wayne, Airport Auth., Airport Rev. Ref. Bonds (Detroit Metropolitan Wayne County Airport),
Series 2012-D, AMT, 5.00% 2019 | 3,560 | 3,651 |
County of Wayne, Airport Auth., Airport Rev. Ref. Bonds (Detroit Metropolitan Wayne County Airport),
Series 2015-F, AMT, 5.00% 2025 | 1,500 | 1,737 |
County of Wayne, Airport Auth., Airport Rev. Ref. Bonds (Detroit Metropolitan Wayne County Airport),
Series 2015-F, AMT, 5.00% 2026 | 1,000 | 1,154 |
| | | 149,542 |
| Minnesota 1.60% | | |
| G.O. Bonds, Series 2017-A, 5.00% 2024 | 9,000 | 10,558 |
| G.O. Bonds, Series 2018-A, 5.00% 2027 | 7,360 | 9,051 |
| Housing Fin. Agcy., Homeownership Fin. Bonds (GNMA and FNMA Pass-Through Program), Series 2017-G, 2.65% 20473 | 9,486 | 9,173 |
| Housing Fin. Agcy., Residential Housing Fin. Bonds, Series 2012-D, 4.00% 2040 | 180 | 184 |
Limited Term Tax-Exempt Bond Fund of America — Page 17 of 37
unaudited
Bonds, notes & other debt instruments (continued)
Minnesota (continued) | Principal amount
(000) | Value
(000) |
| Housing Fin. Agcy., Residential Housing Fin. Bonds, Series 2013-A, AMT, 3.00% 2031 | $585 | $591 |
| Housing Fin. Agcy., Residential Housing Fin. Bonds, Series 2014-B, 4.00% 2038 | 190 | 198 |
| Housing Fin. Agcy., Residential Housing Fin. Bonds, Series 2014-C, AMT, 4.00% 2045 | 1,945 | 2,029 |
| Housing Fin. Agcy., Residential Housing Fin. Bonds, Series 2015-A, AMT, 4.00% 2041 | 3,755 | 3,895 |
| Housing Fin. Agcy., Residential Housing Fin. Bonds, Series 2015-B, 3.50% 2046 | 3,300 | 3,407 |
| Housing Fin. Agcy., Residential Housing Fin. Bonds, Series 2015-E, AMT, 3.50% 2046 | 675 | 694 |
| Housing Fin. Agcy., Residential Housing Fin. Bonds, Series 2016-E, 4.00% 2047 | 1,115 | 1,163 |
| Housing Fin. Agcy., Residential Housing Fin. Bonds, Series 2017-E, 4.00% 2048 | 5,375 | 5,675 |
| Housing Fin. Agcy., Residential Housing Fin. Bonds, Series 2018-B, 4.00% 2048 | 3,000 | 3,187 |
| Housing Fin. Agcy., Residential Housing Fin. Bonds, Series 2018-E, 4.25% 2049 | 13,240 | 14,261 |
| | | 64,066 |
| Mississippi 0.29% | | |
Dev. Bank, Special Obligation Bonds (Municipal Energy Agcy. of Mississippi Power Supply Project),
Series 2015-A, Assured Guaranty Municipal insured, 5.00% 2025 | 1,245 | 1,428 |
Dev. Bank, Special Obligation Bonds (Municipal Energy Agcy. of Mississippi Power Supply Project),
Series 2015-A, Assured Guaranty Municipal insured, 5.00% 2026 | 1,045 | 1,216 |
Dev. Bank, Special Obligation Rev. Ref. Bonds (Madison County Highway Ref. Project), Series 2013-C,
5.00% 2020 | 1,750 | 1,801 |
| Gaming Tax Rev. Bonds, Series 2019-A, 5.00% 2024 | 1,000 | 1,152 |
| Gaming Tax Rev. Ref. Bonds, Series 2015-E, 5.00% 2026 | 2,925 | 3,411 |
| Home Corp., Single Family Mortgage Rev. Bonds, Series 2017-C, AMT, 4.00% 2046 | 2,360 | 2,471 |
| | | 11,479 |
| Missouri 0.60% | | |
Health and Educational Facs. Auth., Health Facs. Rev. Bonds (Saint Luke’s Health System, Inc.),
Series 2016, 5.00% 2025 | 1,500 | 1,761 |
Housing Dev. Commission, Single Family Mortgage Rev. Bonds (First Place Homeownership Loan Program),
Series 2016-B, 3.50% 2041 | 3,705 | 3,822 |
Housing Dev. Commission, Single Family Mortgage Rev. Bonds (First Place Homeownership Loan Program),
Series 2017-B, 3.25% 20473 | 6,739 | 6,706 |
Housing Dev. Commission, Single Family Mortgage Rev. Bonds (First Place Homeownership Loan Program),
Series 2017-C, 3.30% 20473 | 7,083 | 7,063 |
Housing Dev. Commission, Single Family Mortgage Rev. Bonds (First Place Homeownership Loan Program),
Series 2018-A, 4.25% 2049 | 1,785 | 1,918 |
Housing Dev. Commission, Single Family Mortgage Rev. Bonds (Special Homeownership Loan Program),
Series 2015-B-2, 4.00% 2045 | 2,680 | 2,806 |
| | | 24,076 |
| Montana 0.17% | | |
| Board of Housing, Single Family Mortgage Bonds, Series 2015-B-2, AMT, 3.50% 2042 | 620 | 635 |
| Board of Housing, Single Family Mortgage Bonds, Series 2016-A-2, 3.50% 2044 | 1,585 | 1,636 |
| Board of Housing, Single Family Mortgage Bonds, Series 2019-A, 4.25% 2045 | 4,155 | 4,484 |
| | | 6,755 |
| Nebraska 1.06% | | |
| Central Plains Energy Project, Gas Supply Rev. Ref. Bonds, Series 2014, 5.00% 2039 (put 2019) | 11,850 | 12,125 |
| County of Douglas, Hospital Auth. No. 2 (Methodist Health System), Health Facs. Rev. Ref. Bonds, Series 2015, 5.00% 2026 | 1,155 | 1,322 |
| Investment Fin. Auth., Single Family Housing Rev. Bonds, Series 2013-A, 3.00% 2043 | 615 | 621 |
| Investment Fin. Auth., Single Family Housing Rev. Bonds, Series 2013-C, 4.50% 2043 | 55 | 55 |
| Investment Fin. Auth., Single Family Housing Rev. Bonds, Series 2013-E, 3.00% 2043 | 80 | 81 |
| Investment Fin. Auth., Single Family Housing Rev. Bonds, Series 2013-E, 3.00% 2043 | 10 | 10 |
| Investment Fin. Auth., Single Family Housing Rev. Bonds, Series 2014-A, 4.00% 2044 | 1,025 | 1,064 |
| Investment Fin. Auth., Single Family Housing Rev. Bonds, Series 2015-A, 3.50% 2045 | 2,705 | 2,782 |
Limited Term Tax-Exempt Bond Fund of America — Page 18 of 37
unaudited
Bonds, notes & other debt instruments (continued)
Nebraska (continued) | Principal amount
(000) | Value
(000) |
| Investment Fin. Auth., Single Family Housing Rev. Bonds, Series 2015-C, 3.50% 2045 | $5,585 | $5,720 |
| Investment Fin. Auth., Single Family Housing Rev. Bonds, Series 2016-C, 3.50% 2046 | 3,000 | 3,098 |
| Investment Fin. Auth., Single Family Housing Rev. Bonds, Series 2016-C, 3.50% 2046 | 2,860 | 2,922 |
| Investment Fin. Auth., Single Family Housing Rev. Bonds, Series 2017-B, AMT, 3.50% 2040 | 5,195 | 5,370 |
| Investment Fin. Auth., Single Family Housing Rev. Bonds, Series 2018-A, 4.00% 2048 | 2,145 | 2,274 |
| Investment Fin. Auth., Single Family Housing Rev. Bonds, Series 2018-C, 4.00% 2048 | 3,835 | 4,077 |
| Public Power Dist., General Rev. Ref. Bonds, Series 2012-A, 4.00% 2020 | 1,000 | 1,021 |
| | | 42,542 |
| Nevada 2.03% | | |
| Clark County School Dist., Limited Tax G.O. Building and Rev. Ref. Bonds, Series 2017-A, 5.00% 2026 | 1,000 | 1,174 |
| Clark County School Dist., Limited Tax G.O. Building and Rev. Ref. Bonds, Series 2017-C, 5.00% 2024 | 2,500 | 2,858 |
| Clark County School Dist., Limited Tax G.O. Building and Rev. Ref. Bonds, Series 2017-C, 5.00% 2027 | 2,075 | 2,461 |
| Clark County School Dist., Limited Tax Various Purpose G.O. Bonds, Series 2016-F, 5.00% 2026 | 2,470 | 2,899 |
| County of Clark, Airport System Rev. Ref. Bonds, Series 2017-C, AMT, 5.00% 2021 | 3,500 | 3,736 |
| County of Clark, Highway Rev. Ref. Bonds (Motor Vehicle Fuel Tax), Series 2011, 5.00% 2020 | 12,320 | 12,881 |
County of Clark, Pollution Control Rev. Ref. Bonds (Southern California Edison Company),
Series 2010, 1.875% 2031 (put 2020) | 14,035 | 13,918 |
| County of Clark, Rev. Ref. Bonds (Jet Aviation Fuel Tax), Series 2013-A, AMT, 5.00% 2021 | 1,035 | 1,105 |
| County of Clark, Rev. Ref. Bonds (Jet Aviation Fuel Tax), Series 2013-A, AMT, 5.00% 2022 | 2,810 | 3,071 |
| County of Clark, Rev. Ref. Bonds (Jet Aviation Fuel Tax), Series 2013-A, AMT, 5.00% 2023 | 1,000 | 1,109 |
| County of Clark, Rev. Ref. Bonds (Jet Aviation Fuel Tax), Series 2013-A, AMT, 5.00% 2027 | 2,500 | 2,740 |
| County of Clark, Sales and Excise Tax Rev. Improvement and Rev. Ref. Bonds (Streets and Highway Projects), Series 2010-B, 5.00% 2019 | 3,000 | 3,041 |
| County of Clark, Special Improvement Dist. No. 121 (Southern Highlands Area), Local Improvement Rev. Ref. Bonds, Series 2016, 2.25% 2019 | 1,000 | 998 |
Dept. of Business and Industry, Solid Waste Disposal Rev. Bonds (Republic Services, Inc. Project), Series 2001,
AMT, 2.50% 2026 (put 2019)2 | 10,000 | 10,008 |
| City of Henderson, Local Improvement Dist. No. T-14 (Anthem), Local Improvement Bonds, Series 2017, 2.375% 2022 | 1,100 | 1,104 |
| City of Henderson, Local Improvement Dist. No. T-14 (Anthem), Local Improvement Bonds, Series 2017, 2.50% 2019 | 360 | 360 |
| City of Henderson, Local Improvement Dist. No. T-14 (Anthem), Local Improvement Bonds, Series 2017, 2.50% 2023 | 1,150 | 1,156 |
City of Henderson, Local Improvement Dist. No. T-17 (Madeira Canyon), Local Improvement Bonds,
Series 2017, 2.00% 2019 | 245 | 245 |
City of Henderson, Local Improvement Dist. No. T-17 (Madeira Canyon), Local Improvement Bonds,
Series 2017, 2.00% 2022 | 980 | 966 |
City of Henderson, Local Improvement Dist. No. T-17 (Madeira Canyon), Local Improvement Bonds,
Series 2017, 2.25% 2024 | 565 | 557 |
City of Henderson, Local Improvement Dist. No. T-17 (Madeira Canyon), Local Improvement Bonds,
Series 2017, 2.50% 2025 | 590 | 585 |
| City of Las Vegas, Redev. Agcy., Tax Increment Rev. Ref. Bonds, Series 2016, 5.00% 2025 | 2,185 | 2,528 |
| City of Las Vegas, Redev. Agcy., Tax Increment Rev. Ref. Bonds, Series 2016, 5.00% 2027 | 1,200 | 1,388 |
| Las Vegas Valley Water Dist., Limited Tax G.O. Rev. Ref. Bonds, Series 2011-C, 5.00% 2019 | 4,860 | 4,913 |
| City of North Las Vegas, Special Improvement Dist. No. 60 (Aliante), Local Improvement Rev. Ref. Bonds, Series 2016, 2.125% 2020 | 1,720 | 1,728 |
| City of North Las Vegas, Special Improvement Dist. No. 60 (Aliante), Local Improvement Rev. Ref. Bonds, Series 2016, 2.25% 2019 | 1,225 | 1,229 |
County of Washoe, Gas and Water Facs. Rev. Ref. Bonds (Sierra Pacific Power Company Projects),
Series 2016-B, 3.00% 2036 (put 2022) | 1,500 | 1,539 |
| County of Washoe, Gas Facs. Rev. Ref. Bonds (Sierra Pacific Power Company Projects), Series 2016-A, AMT, 1.50% 2031 (put 2019) | 1,000 | 998 |
| | | 81,295 |
Limited Term Tax-Exempt Bond Fund of America — Page 19 of 37
unaudited
Bonds, notes & other debt instruments (continued)
New Hampshire 0.16% | Principal amount
(000) | Value
(000) |
| Health and Education Facs. Auth., Rev. Bonds (Elliot Hospital Issue), Series 2016, 5.00% 2019 | $600 | $610 |
| Health and Education Facs. Auth., Rev. Bonds (Elliot Hospital Issue), Series 2016, 5.00% 2024 | 1,250 | 1,403 |
| Health and Education Facs. Auth., Rev. Bonds (Elliot Hospital Issue), Series 2016, 5.00% 2025 | 1,250 | 1,420 |
| Health and Education Facs. Auth., Rev. Bonds (Elliot Hospital Issue), Series 2016, 5.00% 2026 | 1,250 | 1,432 |
| Health and Education Facs. Auth., Rev. Bonds (Elliot Hospital Issue), Series 2016, 5.00% 2027 | 1,250 | 1,423 |
| | | 6,288 |
| New Jersey 3.28% | | |
| Econ. Dev. Auth., Rev. Ref. Bonds (Provident Group - Montclair Properties LLC - Montclair State University Student Housing Project), Series 2017, Assured Guaranty Municipal insured, 5.00% 2023 | 1,000 | 1,110 |
| Econ. Dev. Auth., Rev. Ref. Bonds (Provident Group - Montclair Properties LLC - Montclair State University Student Housing Project), Series 2017, Assured Guaranty Municipal insured, 5.00% 2024 | 1,000 | 1,130 |
| Econ. Dev. Auth., Rev. Ref. Bonds (Provident Group - Montclair Properties LLC - Montclair State University Student Housing Project), Series 2017, Assured Guaranty Municipal insured, 5.00% 2026 | 1,000 | 1,160 |
| Econ. Dev. Auth., School Facs. Construction Bonds, Series 2017-DDD, 5.00% 2024 | 1,500 | 1,666 |
| Econ. Dev. Auth., School Facs. Construction Bonds, Series 2017-DDD, 5.00% 2025 | 1,000 | 1,123 |
| Econ. Dev. Auth., School Facs. Construction Bonds, Series 2017-DDD, 5.00% 2026 | 1,000 | 1,132 |
| Econ. Dev. Auth., School Facs. Construction Rev. Ref. Bonds, Series 2014-PP, 5.00% 2019 | 4,000 | 4,044 |
| Econ. Dev. Auth., School Facs. Construction Rev. Ref. Bonds, Series 2015-XX, 5.00% 2024 | 2,990 | 3,320 |
| Econ. Dev. Auth., School Facs. Construction Rev. Ref. Bonds, Series 2015-XX, 5.00% 2025 | 8,000 | 8,984 |
Educational Facs. Auth., Rev. and Rev. Ref. Bonds (Ramapo College of New Jersey Issue),
Series 2017-A, Assured Guaranty Municipal insured, 5.00% 2026 | 1,375 | 1,632 |
Educational Facs. Auth., Rev. and Rev. Ref. Bonds (Ramapo College of New Jersey Issue),
Series 2017-A, Assured Guaranty Municipal insured, 5.00% 2027 | 1,000 | 1,196 |
| Educational Facs. Auth., Rev. and Rev. Ref. Bonds (Stockton University Issue), Series 2016-A, 5.00% 2025 | 3,000 | 3,415 |
Educational Facs. Auth., Rev. and Rev. Ref. Bonds (Stockton University Issue), Series 2016-A,
Assured Guaranty Municipal insured, 5.00% 2026 | 2,885 | 3,319 |
Educational Facs. Auth., Rev. Ref. Bonds (Rowan University Issue), Series 2016-C,
Assured Guaranty Municipal insured, 5.00% 2024 | 2,645 | 3,040 |
| Health Care Facs. Fncg. Auth., Rev. Bonds (Princeton HealthCare System Issue), Series 2016-A, 5.00% 2025 | 1,340 | 1,576 |
| Health Care Facs. Fncg. Auth., Rev. Bonds (Princeton HealthCare System Issue), Series 2016-A, 5.00% 2027 | 1,250 | 1,481 |
Health Care Facs. Fncg. Auth., Rev. Bonds (St. Joseph’s Healthcare System Obligated Group Issue),
Series 2016, 4.00% 2019 | 1,210 | 1,218 |
Health Care Facs. Fncg. Auth., Rev. Bonds (St. Joseph’s Healthcare System Obligated Group Issue),
Series 2016, 5.00% 2022 | 1,500 | 1,621 |
Health Care Facs. Fncg. Auth., Rev. Ref. Bonds (Hackensack Meridian Health Obligated Group Issue),
Series 2017-A, 5.00% 2022 | 2,000 | 2,206 |
Health Care Facs. Fncg. Auth., Rev. Ref. Bonds (Hackensack Meridian Health Obligated Group Issue),
Series 2017-A, 5.00% 2025 | 1,000 | 1,174 |
Health Care Facs. Fncg. Auth., Rev. Ref. Bonds (Hackensack Meridian Health Obligated Group Issue),
Series 2017-A, 5.00% 2026 | 900 | 1,072 |
Health Care Facs. Fncg. Auth., Rev. Ref. Bonds (Hackensack Meridian Health Obligated Group Issue),
Series 2017-A, 5.00% 2027 | 1,150 | 1,385 |
| Higher Education Student Assistance Auth., Student Loan Rev. Bonds, Series 2012-1-A, AMT, 5.00% 2021 | 4,000 | 4,288 |
| Higher Education Student Assistance Auth., Student Loan Rev. Bonds, Series 2013-1-A, AMT, 5.00% 2019 | 1,000 | 1,022 |
| Higher Education Student Assistance Auth., Student Loan Rev. Bonds, Series 2016-1-A, AMT, 5.00% 2026 | 1,905 | 2,170 |
| Higher Education Student Assistance Auth., Student Loan Rev. Ref. Bonds, Series 2010-1-A, 5.25% 2019 | 1,000 | 1,027 |
| Higher Education Student Assistance Auth., Student Loan Rev. Ref. Bonds, Series 2011-1, AMT, 5.00% 2019 | 2,500 | 2,555 |
Housing and Mortgage Fin. Agcy., Multi Family Housing Conduit Rev. Bonds (Georgia King Village Project),
Series 2018-E, 2.45% 2021 (put 2020) | 2,815 | 2,837 |
| Housing and Mortgage Fin. Agcy., Single Family Housing Rev. Bonds, Series 2018-A, 4.50% 2048 | 9,835 | 10,650 |
| Rutgers State University, G.O. Bonds (State University of New Jersey), Series 2009-F, 5.00% 2019 | 1,000 | 1,008 |
| County of Salem, Pollution Control Fncg. Auth., Pollution Control Rev. Bonds (Philadelphia Electric Company Project), Series 1993-A, AMT, 2.50% 2025 (put 2019) | 7,850 | 7,848 |
| South Jersey Transportation Auth., Transportation System Rev. Bonds, Series 2012, 5.00% 2020 | 1,500 | 1,566 |
Limited Term Tax-Exempt Bond Fund of America — Page 20 of 37
unaudited
Bonds, notes & other debt instruments (continued)
New Jersey (continued) | Principal amount
(000) | Value
(000) |
| South Jersey Transportation Auth., Transportation System Rev. Bonds, Series 2012, 5.00% 2022 | $5,200 | $5,621 |
| South Jersey Transportation Auth., Transportation System Rev. Bonds, Series 2012-A, 5.00% 2023 | 1,500 | 1,616 |
| South Jersey Transportation Auth., Transportation System Rev. Bonds, Series 2012-A, 5.00% 2024 | 2,500 | 2,688 |
| Tobacco Settlement Fncg. Corp., Tobacco Settlement Bonds, Series 2018-A, 5.00% 2026 | 3,000 | 3,458 |
| Tobacco Settlement Fncg. Corp., Tobacco Settlement Bonds, Series 2018-A, 5.00% 2027 | 3,140 | 3,647 |
| Tobacco Settlement Fncg. Corp., Tobacco Settlement Bonds, Series 2018-A, 5.00% 2028 | 3,000 | 3,506 |
| Tobacco Settlement Fncg. Corp., Tobacco Settlement Bonds, Series 2018-A, 5.00% 2029 | 3,450 | 3,992 |
| Transit Corp., Grant Anticipation Notes (Federal Transit Administration Section 5307 Urbanized Area Formula Funds), Series 2014-A, 5.00% 2019 | 1,000 | 1,019 |
| Transit Corp., Grant Anticipation Notes (Federal Transit Administration Section 5307 Urbanized Area Formula Funds), Series 2014-A, 5.00% 2020 | 4,000 | 4,192 |
Transportation Trust Fund Auth., Federal Highway Reimbursement Rev. Ref. Bonds, Series 2018-A,
5.00% 2028 | 3,000 | 3,385 |
| Transportation Trust Fund Auth., Transportation System Rev. Ref. Bonds, Series 2006-A, 5.50% 2021 | 4,070 | 4,411 |
| Transportation Trust Fund Auth., Transportation System Rev. Ref. Bonds, Series 2015-AA, 5.00% 2023 | 1,000 | 1,095 |
Turnpike Auth., Turnpike Rev. Bonds, Series 2017-C-5,
(1-month USD-LIBOR x 0.70 + 0.46%) 2.223% 2028 (put 2021)1 | 10,000 | 10,024 |
| | | 131,629 |
| New Mexico 0.40% | | |
| City of Farmington, Pollution Control Rev. Ref. Bonds (Southern California Edison Company Four Corners Project), Series 2011, 1.875% 2029 (put 2020) | 3,000 | 2,975 |
| Mortgage Fin. Auth., Single Family Mortgage Program Bonds, Series 2009-B-2, Class I, 5.65% 2039 | 20 | 20 |
| Mortgage Fin. Auth., Single Family Mortgage Program Bonds, Series 2009-C-2, Class I, 5.70% 2040 | 55 | 55 |
| Mortgage Fin. Auth., Single Family Mortgage Program Bonds, Series 2016-A-2, Class I, AMT, 3.50% 2046 | 3,750 | 3,867 |
| Mortgage Fin. Auth., Single Family Mortgage Program Bonds, Series 2017-B-2, Class I, AMT, 3.75% 2048 | 1,525 | 1,594 |
| Mortgage Fin. Auth., Single Family Mortgage Program Bonds, Series 2019-A-1, Class I, 4.25% 2050 | 7,175 | 7,744 |
| | | 16,255 |
| New York 8.29% | | |
| Dormitory Auth., Income Tax Rev. Bonds, Series 2009-A, 5.00% 2034 (preref. 2019) | 500 | 501 |
Dormitory Auth., Mental Health Services Facs. Improvement Rev. Ref. Bonds, Series 2010-A,
5.00% 2019 | 2,995 | 3,047 |
Dormitory Auth., Mental Health Services Facs. Improvement Rev. Ref. Bonds, Series 2010-A,
5.00% 2019 (escrowed to maturity) | 5 | 5 |
| Dormitory Auth., School Dist. Rev. Bond Fncg. Program Rev. Bonds, Series 2016-A, 5.00% 2024 | 5,000 | 5,819 |
| Dormitory Auth., School Dist. Rev. Bond Fncg. Program Rev. Bonds, Series 2017-F, 5.00% 2024 | 2,500 | 2,906 |
| Dormitory Auth., School Dist. Rev. Bond Fncg. Program Rev. Bonds, Series 2017-F, 5.00% 2025 | 750 | 890 |
| Dormitory Auth., State Personal Income Tax Rev. Bonds (Education), Series 2009-A, 5.00% 2020 (preref. 2019) | 2,000 | 2,008 |
| Dormitory Auth., State Personal Income Tax Rev. Bonds (General Purpose), Series 2016-D, 5.00% 2025 | 5,000 | 5,882 |
| Dormitory Auth., State Personal Income Tax Rev. Bonds (General Purpose), Series 2017-B, 5.00% 2030 | 9,040 | 10,797 |
| Dormitory Auth., State Personal Income Tax Rev. Bonds (General Purpose), Series 2018-A, 5.00% 2028 | 1,500 | 1,846 |
| Dormitory Auth., State Personal Income Tax Rev. Bonds (General Purpose), Series 2018-A, 5.00% 2030 | 12,000 | 14,549 |
| Dormitory Auth., State Personal Income Tax Rev. Ref. Bonds (General Purpose), Series 2012-A, 5.00% 2022 | 2,000 | 2,244 |
| Energy Research and Dev. Auth., Pollution Control Rev. Bonds (New York State Electric & Gas Corp. Project), Series 2004-A, AMT, 2.375% 2027 (put 2020) | 3,000 | 3,009 |
| County of Erie, Industrial Dev. Agcy., School Fac. Rev. Bonds (City School Dist. of the City of Buffalo Project), Series 2011-A, 5.00% 2020 | 4,780 | 4,981 |
| County of Erie, Industrial Dev. Agcy., School Fac. Rev. Ref. Bonds (City School Dist. of the City of Buffalo Project), Series 2012-A, 5.00% 2020 | 2,770 | 2,887 |
| Town of Hempstead, Local Dev. Corp., Rev. Bonds (Hofstra University Project), Series 2011, 5.00% 2025 | 1,670 | 1,790 |
| Housing Fin. Agcy., Affordable Housing Rev. Green Bonds, Series 2018-H, 2.75% 2022 | 5,000 | 5,030 |
| Long Island Power Auth., Electric System General Rev. Bonds, Series 2009-A, 5.25% 2020 (preref. 2019) | 1,230 | 1,237 |
| Long Island Power Auth., Electric System General Rev. Bonds, Series 2009-A, 5.25% 2020 (preref. 2019) | 775 | 780 |
Limited Term Tax-Exempt Bond Fund of America — Page 21 of 37
unaudited
Bonds, notes & other debt instruments (continued)
New York (continued) | Principal amount
(000) | Value
(000) |
Long Island Power Auth., Electric System General Rev. Bonds, Series 2014-C,
(1-month USD-LIBOR x 0.70 + 0.75%) 2.513% 2033 (put 2023)1 | $7,700 | $7,716 |
| Long Island Power Auth., Electric System General Rev. Ref. Bonds, Series 2009-A, 5.25% 2021 (preref. 2019) | 2,000 | 2,012 |
Metropolitan Transportation Auth., Dedicated Tax Fund Rev. Ref. Bonds, Series 2008-A-2B,
(SIFMA Municipal Swap Index + 0.58%) 2.01% 2031 (put 2019)1 | 1,500 | 1,500 |
| Metropolitan Transportation Auth., Hudson Rail Yards Trust Obligations, Series 2016-A, 5.00% 2046 | 4,330 | 4,409 |
| Metropolitan Transportation Auth., Transportation Rev. Bonds, Series 2012-E, 5.00% 2020 | 3,250 | 3,434 |
| Metropolitan Transportation Auth., Transportation Rev. Bonds, Series 2014-C, 5.00% 2024 | 5,000 | 5,741 |
Metropolitan Transportation Auth., Transportation Rev. Bonds, Series 2014-D-2,
(SIFMA Municipal Swap Index + 0.45%) 1.88% 2044 (put 2022)1 | 7,750 | 7,669 |
| Metropolitan Transportation Auth., Transportation Rev. Bonds, Series 2015-A-1, 5.00% 2027 | 3,150 | 3,591 |
Metropolitan Transportation Auth., Transportation Rev. Bonds, Series 2015-A-2,
(SIFMA Municipal Swap Index + 0.58%) 2.01% 2039 (put 2020)1 | 5,500 | 5,495 |
| Metropolitan Transportation Auth., Transportation Rev. Bonds, Series 2017-C-2A, 4.00% 2019 | 18,000 | 18,118 |
Metropolitan Transportation Auth., Transportation Rev. Bonds,
Series 2003-B, FGIC-National insured, 5.25% 2020 | 5,500 | 5,835 |
Metropolitan Transportation Auth., Transportation Rev. Ref. Bonds, Series 2002-D-2A,
Assured Guaranty Municipal insured, (1-month USD-LIBOR x 0.69 + 0.68%) 2.418% 2032 (put 2021)1 | 1,400 | 1,408 |
| Metropolitan Transportation Auth., Transportation Rev. Ref. Bonds, Series 2012-D, 5.00% 2020 | 7,000 | 7,396 |
| Mortgage Agcy., Homeowner Mortgage Rev. Bonds, Series 191, AMT, 3.50% 2034 | 230 | 234 |
| Mortgage Agcy., Homeowner Mortgage Rev. Bonds, Series 195, 4.00% 2046 | 3,090 | 3,221 |
| Mortgage Agcy., Homeowner Mortgage Rev. Bonds, Series 197, 3.50% 2044 | 7,930 | 8,183 |
| Mortgage Agcy., Homeowner Mortgage Rev. Bonds, Series 200, 3.50% 2045 | 4,145 | 4,267 |
| Mortgage Agcy., Homeowner Mortgage Rev. Bonds, Series 203, 3.50% 2047 | 6,740 | 6,976 |
| Mortgage Agcy., Homeowner Mortgage Rev. Bonds, Series 206, AMT, 4.00% 2037 | 2,595 | 2,720 |
| Mortgage Agcy., Homeowner Mortgage Rev. Bonds, Series 48, 2.625% 2041 | 185 | 186 |
| Mortgage Agcy., Homeowner Mortgage Rev. Bonds, Series 52, AMT, 3.50% 2030 | 1,470 | 1,506 |
| County of Nassau, G.O. General Improvement Bonds, Series 2016-B, 5.00% 2024 | 4,000 | 4,623 |
| New York City G.O. Bonds, Fiscal 2012, Series 2012-I, 5.00% 2020 | 5,000 | 5,249 |
| New York City G.O. Bonds, Fiscal 2014, Series 2014-G, 5.00% 2023 | 1,500 | 1,709 |
| New York City G.O. Bonds, Fiscal 2015, Series 2015-A, 5.00% 2025 | 3,000 | 3,479 |
| New York City G.O. Bonds, Fiscal 2015, Series 2015-C, 5.00% 2028 | 1,000 | 1,159 |
| New York City G.O. Bonds, Fiscal 2017, Series 2017-C, 5.00% 2026 | 3,500 | 4,219 |
| New York City G.O. Bonds, Fiscal 2017, Series 2017-C, 5.00% 2027 | 5,000 | 6,041 |
| New York City G.O. Bonds, Fiscal 2017, Series 2017-C, 5.00% 2028 | 4,300 | 5,157 |
| New York City G.O. Bonds, Fiscal 2018, Series 2018-A, 5.00% 2026 | 5,000 | 6,027 |
| New York City Health and Hospitals Corp., Health System Rev. Ref. Bonds, Series 2008-A, 5.50% 2019 | 2,000 | 2,002 |
| New York City Health and Hospitals Corp., Health System Rev. Ref. Bonds, Series 2010-A, 5.00% 2021 | 1,500 | 1,550 |
| New York City Housing Dev. Corp., Multi Family Housing Rev. Bonds (Sustainable Neighborhood Bonds), Series 2018-L-2, 2.75% 2050 (put 2023) | 5,150 | 5,183 |
New York City Housing Dev. Corp., Multi Family Housing Rev. Bonds (Sustainable Neighborhood Bonds),
Series 2017-G-2-A, 2.00% 2057 (put 2021) | 6,250 | 6,231 |
New York City Housing Dev. Corp., Multi Family Housing Rev. Bonds (Sustainable Neighborhood Bonds),
Series 2018-C-2-A, 2.35% 2022 | 7,500 | 7,542 |
| New York City Transitional Fin. Auth., Future Tax Secured Bonds, Fiscal 2015, Series 2015-C, 5.00% 2025 | 2,420 | 2,861 |
| New York City Transitional Fin. Auth., Future Tax Secured Bonds, Fiscal 2015, Series 2015-C, 5.00% 2027 | 5,000 | 5,841 |
New York City Transitional Fin. Auth., Future Tax Secured Multi-Modal Rev. Ref. Bonds,
Fiscal 2003, Series 2011-B, 5.00% 2022 | 1,750 | 1,863 |
New York City Transitional Fin. Auth., Future Tax Secured Rev. Ref. Bonds, Fiscal 2003, Series 2003-A-1,
5.00% 2022 | 1,305 | 1,420 |
Niagara Frontier Transportation Auth., Airport Rev. Ref. Bonds (Buffalo Niagara International Airport),
Series 2014-A, AMT, 4.00% 2022 | 5,185 | 5,460 |
Niagara Frontier Transportation Auth., Airport Rev. Ref. Bonds (Buffalo Niagara International Airport),
Series 2014-A, AMT, 5.00% 2020 | 2,500 | 2,581 |
Limited Term Tax-Exempt Bond Fund of America — Page 22 of 37
unaudited
Bonds, notes & other debt instruments (continued)
New York (continued) | Principal amount
(000) | Value
(000) |
Niagara Frontier Transportation Auth., Airport Rev. Ref. Bonds (Buffalo Niagara International Airport),
Series 2014-A, AMT, 5.00% 2023 | $2,195 | $2,429 |
| Port Auth., Consolidated Rev. Ref. Bonds, Series 167, AMT, 5.00% 2020 | 4,790 | 5,031 |
| Port Auth., Consolidated Rev. Ref. Bonds, Series 167, AMT, 5.00% 2021 | 3,420 | 3,630 |
| Port Auth., Consolidated Rev. Ref. Bonds, Series 169, AMT, 5.00% 2020 | 5,000 | 5,264 |
| Port Auth., Consolidated Rev. Ref. Bonds, Series 172, AMT, 5.00% 2022 | 2,210 | 2,414 |
| Port Auth., Consolidated Rev. Ref. Bonds, Series 186, AMT, 5.00% 2023 | 5,000 | 5,655 |
| Public Housing Capital Fund Rev. Trust I, Trust Certificates, Series 2012, 4.50% 20222,3 | 1,473 | 1,482 |
| County of Suffolk, Econ. Dev. Corp., Rev. Ref. Bonds (Catholic Health Services of Long Island Obligated Group Project), Series 2011, 5.00% 2019 | 3,000 | 3,037 |
| County of Suffolk, Rev. Ref. Bonds, Series 2017-B, Assured Guaranty Municipal insured, 4.00% 2021 | 3,505 | 3,697 |
| Thruway Auth., General Rev. Bonds, Series I, 5.00% 2020 | 2,000 | 2,059 |
| Thruway Auth., General Rev. Bonds, Series I, 5.00% 2021 | 4,000 | 4,248 |
| Thruway Auth., Personal Income Tax Rev. Bonds (Transportation), Series 2009-A, 5.00% 2021 (preref. 2019) | 1,000 | 1,004 |
Transportation Dev. Corp., Special Fac. Rev. Ref. Bonds (Terminal One Group Association, LP Project),
Series 2015, AMT, 5.00% 2020 | 2,500 | 2,569 |
Transportation Dev. Corp., Special Fac. Rev. Ref. Bonds (Terminal One Group Association, LP Project),
Series 2015, AMT, 5.00% 2021 | 1,250 | 1,326 |
Transportation Dev. Corp., Special Fac. Rev. Ref. Bonds (Terminal One Group Association, LP Project),
Series 2015, AMT, 5.00% 2022 | 2,000 | 2,152 |
Transportation Dev. Corp., Special Fac. Rev. Ref. Bonds (Terminal One Group Association, LP Project),
Series 2015, AMT, 5.00% 2023 | 1,045 | 1,147 |
Transportation Dev. Corp., Special Facs. Rev. Bonds (Delta Air Lines, Inc. LaGuardia Airport Terminals C & D
Redev. Project), Series 2018, AMT, 5.00% 2025 | 10,000 | 11,283 |
| Urban Dev. Corp., State Personal Income Tax Rev. Bonds (General Purpose), Series 2013-C, 5.00% 2021 | 5,000 | 5,345 |
| Urban Dev. Corp., State Personal Income Tax Rev. Bonds (General Purpose), Series 2013-C, 5.00% 2024 | 6,725 | 7,569 |
| Urban Dev. Corp., State Personal Income Tax Rev. Bonds (General Purpose), Series 2014-A, 5.00% 2029 | 1,500 | 1,709 |
| Urban Dev. Corp., State Personal Income Tax Rev. Bonds (General Purpose), Series 2016-A, 5.00% 2025 | 2,000 | 2,356 |
| Urban Dev. Corp., State Personal Income Tax Rev. Bonds (General Purpose), Series 2016-A, 5.00% 2028 | 4,510 | 5,321 |
| | | 332,749 |
| North Carolina 0.47% | | |
| Housing Fin. Agcy., Home Ownership Rev. Bonds, Series 40, 4.25% 2047 | 1,000 | 1,076 |
| Housing Fin. Agcy., Home Ownership Rev. Ref. Bonds, Series 37-A, AMT, 3.50% 2039 | 3,965 | 4,067 |
| Housing Fin. Agcy., Home Ownership Rev. Ref. Bonds, Series 38-B, 4.00% 2047 | 2,940 | 3,097 |
| Housing Fin. Agcy., Home Ownership Rev. Ref. Bonds, Series 39-B, 4.00% 2048 | 2,920 | 3,101 |
| Municipal Power Agcy. No. 1, Catawba Electric Rev. Ref. Bonds, Series 2010-A, 5.00% 2021 | 2,500 | 2,572 |
University of North Carolina at Chapel Hill, General Rev. Bonds, Series 2012-B,
(1-month USD-LIBOR x 0.67 + 0.40%) 2.088% 2041 (put 2022)1 | 4,850 | 4,833 |
| | | 18,746 |
| North Dakota 0.66% | | |
County of Burleigh, Health Care Rev. Bonds (St. Alexius Medical Center Project), Series 2014-A,
5.00% 2023 (preref. 2021) | 1,435 | 1,542 |
Housing Fin. Agcy., Homeownership Rev. Bonds (Home Mortgage Fin. Program), Series 2016-D,
3.50% 2046 | 5,940 | 6,149 |
Housing Fin. Agcy., Housing Fin. Program Bonds (Home Mortgage Fin. Program), Series 2012-A,
3.75% 2042 | 725 | 743 |
Housing Fin. Agcy., Housing Fin. Program Bonds (Home Mortgage Fin. Program), Series 2014-A,
4.00% 2034 | 425 | 440 |
Housing Fin. Agcy., Housing Fin. Program Bonds (Home Mortgage Fin. Program), Series 2015-A,
4.00% 2038 | 590 | 611 |
Housing Fin. Agcy., Housing Fin. Program Bonds (Home Mortgage Fin. Program), Series 2015-B,
4.00% 2036 | 445 | 463 |
Limited Term Tax-Exempt Bond Fund of America — Page 23 of 37
unaudited
Bonds, notes & other debt instruments (continued)
North Dakota (continued) | Principal amount
(000) | Value
(000) |
Housing Fin. Agcy., Housing Fin. Program Bonds (Home Mortgage Fin. Program), Series 2015-D,
4.00% 2046 | $5,080 | $5,295 |
Housing Fin. Agcy., Housing Fin. Program Bonds (Home Mortgage Fin. Program), Series 2016-B,
AMT, 4.00% 2047 | 1,190 | 1,245 |
Housing Fin. Agcy., Housing Fin. Program Bonds (Home Mortgage Fin. Program), Series 2017-D,
4.00% 2048 | 6,135 | 6,472 |
Housing Fin. Agcy., Housing Fin. Program Bonds (Home Mortgage Fin. Program), Series 2017-F,
4.00% 2048 | 960 | 1,015 |
Housing Fin. Agcy., Housing Fin. Program Bonds (Home Mortgage Fin. Program), Series 2019-A,
4.25% 2049 | 2,155 | 2,326 |
| | | 26,301 |
| Ohio 2.52% | | |
| County of Allen, Hospital Facs. Rev. Bonds (Mercy Health), Series 2017-B, 5.00% 2047 (put 2022) | 9,425 | 10,330 |
| County of Allen, Hospital Facs. Rev. Ref. and Improvement Bonds (Catholic Health Partners), Series 2012-A, 5.00% 2022 | 3,300 | 3,606 |
County of Allen, Hospital Facs. Rev. Ref. Bonds (Catholic Healthcare Partners), Series 2010-B,
5.00% 2019 | 2,500 | 2,546 |
American Municipal Power, Inc., Combined Hydroelectric Project Rev. Bonds, Series 2018-A,
2.25% 2048 (put 2021) | 2,300 | 2,306 |
| City of Cleveland, Airport System Rev. Ref. Bonds, Series 2011-A, 5.00% 2020 | 3,540 | 3,639 |
City of Cleveland, Airport System Rev. Ref. Bonds, Series 2011-A, Assured Guaranty Municipal insured,
5.00% 2021 | 2,345 | 2,483 |
City of Cleveland, Airport System Rev. Ref. Bonds, Series 2016-B, Assured Guaranty Municipal insured,
5.00% 2024 | 1,075 | 1,220 |
| County of Cuyahoga, Hospital Rev. Bonds (MetroHealth System), Series 2017, 5.00% 2025 | 950 | 1,057 |
| County of Cuyahoga, Hospital Rev. Bonds (MetroHealth System), Series 2017, 5.00% 2026 | 1,000 | 1,123 |
| County of Cuyahoga, Hospital Rev. Bonds (MetroHealth System), Series 2017, 5.00% 2027 | 1,500 | 1,693 |
| G.O. Rev. Ref. Bonds, Common Schools Bonds, Series 2017-B, 5.00% 2025 | 6,000 | 7,163 |
| County of Hamilton, Healthcare Facs. Rev. Bonds (Christ Hospital Project), Series 2012, 5.00% 2020 | 2,360 | 2,454 |
| County of Hamilton, Healthcare Facs. Rev. Bonds (Christ Hospital Project), Series 2012, 5.00% 2021 | 1,000 | 1,067 |
| Hospital Rev. Ref. Bonds (Cleveland Clinic Health System Obligated Group), Series 2017-A, 5.00% 2028 | 3,595 | 4,363 |
| Housing Fin. Agcy., Residential Mortgage Rev. Bonds (Mortgage-Backed Securities Program), Series 2016-D, 4.00% 2047 | 4,920 | 5,136 |
| Housing Fin. Agcy., Residential Mortgage Rev. Bonds (Mortgage-Backed Securities Program), Series 2016-K, 3.50% 2046 | 3,830 | 3,957 |
| Housing Fin. Agcy., Residential Mortgage Rev. Bonds (Mortgage-Backed Securities Program), Series 2017-D, 4.00% 2048 | 8,565 | 9,026 |
| Housing Fin. Agcy., Residential Mortgage Rev. Bonds (Mortgage-Backed Securities Program), Series 2019-A, 4.50% 2049 | 6,665 | 7,271 |
| Housing Fin. Agcy., Residential Mortgage Rev. Bonds, Series 2017-B, AMT, 4.50% 2047 | 2,365 | 2,518 |
| Housing Fin. Agcy., Single Family Mortgage Rev. Bonds, Series 2010-1, 5.00% 2028 | 190 | 193 |
| Kent State University, Rev. General Receipts Bonds, Series 2016, 4.00% 2024 | 5,000 | 5,479 |
| Private Activity Bonds (Portsmouth Bypass Project), Series 2015, AMT, 5.00% 2023 | 1,295 | 1,417 |
| Private Activity Bonds (Portsmouth Bypass Project), Series 2015, AMT, 5.00% 2023 | 1,000 | 1,088 |
| Private Activity Bonds (Portsmouth Bypass Project), Series 2015, AMT, 5.00% 2024 | 1,360 | 1,509 |
Private Activity Bonds (Portsmouth Bypass Project), Series 2015, AMT,
Assured Guaranty Municipal insured, 5.00% 2026 | 850 | 970 |
Private Activity Bonds (Portsmouth Bypass Project), Series 2015, AMT,
Assured Guaranty Municipal insured, 5.00% 2027 | 500 | 568 |
| Public Facs. Commission, Higher Education G.O. Bonds, Series 2015-C, 5.00% 2028 | 9,000 | 10,479 |
| Turnpike Rev. Ref. Bonds, Series 2009-A, 5.00% 2020 | 1,000 | 1,001 |
Limited Term Tax-Exempt Bond Fund of America — Page 24 of 37
unaudited
Bonds, notes & other debt instruments (continued)
Ohio (continued) | Principal amount
(000) | Value
(000) |
| Water Dev. Auth., Solid Waste Disposal Rev. Bonds (Waste Management Inc. Project), Series 2002, AMT, 3.25% 2022 | $3,500 | $3,577 |
Water Dev. Auth., Water Pollution Control Loan Fund Rev. Notes, Series 2017-B,
(SIFMA Municipal Swap Index + 0.22%) 1.65% 20201 | 2,000 | 1,993 |
| | | 101,232 |
| Oklahoma 0.04% | | |
Trustees of the Tulsa Airports Improvement Trust, General Airport Rev. Bonds,
Series 2015-A, AMT, BAM insured, 5.00% 2021 | 1,355 | 1,445 |
| Oregon 0.43% | | |
| Administrative Services Dept., Certs. of Part., Series 2009-A, 5.00% 2020 (preref. 2019) | 2,500 | 2,521 |
| G.O. Bonds (Veteran’s Welfare Bonds Series 94), Series 2014-H, 4.00% 2044 | 900 | 923 |
Housing and Community Services Dept., Mortgage Rev. Bonds (Single Family Mortgage Program),
Series 2016-A, 4.00% 2047 | 800 | 837 |
Housing and Community Services Dept., Mortgage Rev. Bonds (Single Family Mortgage Program),
Series 2017-A, 4.00% 2047 | 6,640 | 7,004 |
Housing and Community Services Dept., Mortgage Rev. Bonds (Single Family Mortgage Program),
Series 2018-A, 4.50% 2049 | 1,900 | 2,054 |
Housing and Community Services Dept., Mortgage Rev. Bonds (Single Family Mortgage Program),
Series 2018-D, 4.75% 2050 | 2,600 | 2,856 |
| Port of Portland, Portland International Airport Rev. Bonds, Subseries 20-C, AMT, 5.00% 2021 | 1,000 | 1,045 |
| | | 17,240 |
| Pennsylvania 5.68% | | |
| County of Allegheny, Airport Auth., Airport Rev. Bonds, Series 2012-A-1, AMT, 5.00% 2024 | 1,025 | 1,101 |
| County of Allegheny, Hospital Dev. Auth. Rev. Bonds (Allegheny Health Network Obligated Group Issue), Series 2018-A, 5.00% 2026 | 3,115 | 3,603 |
| Delaware River Port Auth., Port Dist. Project Rev. Ref. Bonds, Series 2012, 5.00% 2022 | 1,300 | 1,409 |
| East Hempfield Township, Industrial Dev. Auth., Rev. and Rev. Ref. Bonds (Willow Valley Communities Project), Series 2016, 5.00% 2021 | 650 | 699 |
| East Hempfield Township, Industrial Dev. Auth., Rev. and Rev. Ref. Bonds (Willow Valley Communities Project), Series 2016, 5.00% 2022 | 500 | 549 |
| East Hempfield Township, Industrial Dev. Auth., Rev. and Rev. Ref. Bonds (Willow Valley Communities Project), Series 2016, 5.00% 2024 | 1,000 | 1,135 |
| East Hempfield Township, Industrial Dev. Auth., Rev. and Rev. Ref. Bonds (Willow Valley Communities Project), Series 2016, 5.00% 2025 | 1,000 | 1,149 |
| East Hempfield Township, Industrial Dev. Auth., Rev. and Rev. Ref. Bonds (Willow Valley Communities Project), Series 2016, 5.00% 2026 | 500 | 573 |
| Econ. Dev. Fncg. Auth., Private Activity Rev. Bonds (The Pennsylvania Rapid Bridge Replacement Project), Series 2015, AMT, 5.00% 2024 | 9,180 | 10,255 |
| Econ. Dev. Fncg. Auth., Private Activity Rev. Bonds (The Pennsylvania Rapid Bridge Replacement Project), Series 2015, AMT, 5.00% 2024 | 4,900 | 5,514 |
| Econ. Dev. Fncg. Auth., Private Activity Rev. Bonds (The Pennsylvania Rapid Bridge Replacement Project), Series 2015, AMT, 5.00% 2025 | 5,985 | 6,775 |
| Econ. Dev. Fncg. Auth., Private Activity Rev. Bonds (The Pennsylvania Rapid Bridge Replacement Project), Series 2015, AMT, 5.00% 2026 | 2,315 | 2,642 |
| Econ. Dev. Fncg. Auth., Private Activity Rev. Bonds (The Pennsylvania Rapid Bridge Replacement Project), Series 2015, AMT, 5.00% 2026 | 1,775 | 2,031 |
| Econ. Dev. Fncg. Auth., Solid Waste Disposal Rev. Bonds (Waste Management, Inc. Project), Series 2017-A, AMT, 1.70% 2037 (put 2020) | 4,000 | 3,962 |
| Econ. Dev. Fncg. Auth., Solid Waste Rev. Ref. Bonds (Republic Services, Inc. Project), Series 2010-A, AMT, 2.40% 2019 (put 2019) | 1,875 | 1,875 |
| Econ. Dev. Fncg. Auth., Unemployment Compensation Rev. Bonds, Series 2012-B, 5.00% 2020 | 5,000 | 5,071 |
Limited Term Tax-Exempt Bond Fund of America — Page 25 of 37
unaudited
Bonds, notes & other debt instruments (continued)
Pennsylvania (continued) | Principal amount
(000) | Value
(000) |
| Fncg. Auth., Rev. Bonds (Tobacco Master Settlement Payment), Series 2018, 5.00% 2020 | $1,000 | $1,039 |
| Fncg. Auth., Rev. Bonds (Tobacco Master Settlement Payment), Series 2018, 5.00% 2021 | 1,625 | 1,733 |
| Fncg. Auth., Rev. Bonds (Tobacco Master Settlement Payment), Series 2018, 5.00% 2023 | 2,250 | 2,501 |
| G.O. Rev. Ref. Bonds, Second Series 2009, 5.00% 2020 | 2,000 | 2,090 |
| Higher Educational Facs. Auth., Student Housing Rev. Bonds (University Properties, Inc. Student Housing Project at East Stroudsburg University of Pennsylvania), Series 2010, 5.25% 2019 | 700 | 707 |
| Housing Fin. Agcy., Single Family Mortgage Rev. Bonds, Series 2015-117-A, AMT, 3.50% 2040 | 390 | 399 |
| Housing Fin. Agcy., Single Family Mortgage Rev. Bonds, Series 2015-118-A, AMT, 3.50% 2040 | 4,695 | 4,790 |
| Housing Fin. Agcy., Single Family Mortgage Rev. Bonds, Series 2016-119, 3.50% 2041 | 615 | 631 |
| Housing Fin. Agcy., Single Family Mortgage Rev. Bonds, Series 2016-120, 3.50% 2046 | 6,155 | 6,330 |
| Housing Fin. Agcy., Single Family Mortgage Rev. Bonds, Series 2016-121, 3.50% 2046 | 9,045 | 9,311 |
| Housing Fin. Agcy., Single Family Mortgage Rev. Bonds, Series 2017-122, 4.00% 2046 | 8,560 | 8,968 |
| Housing Fin. Agcy., Single Family Mortgage Rev. Bonds, Series 2017-123-A, AMT, 4.00% 2039 | 4,025 | 4,178 |
| Housing Fin. Agcy., Single Family Mortgage Rev. Bonds, Series 2019-128-A, AMT, 4.75% 2033 | 9,235 | 9,958 |
| Industrial Dev. Auth., Temple University Rev. Bonds, Series 2016-1, 5.00% 2028 | 1,000 | 1,155 |
County of Montgomery, Higher Education and Health Auth., Hospital Rev. Bonds
(Abington Memorial Hospital Obligated Group), Series 2012-A, 5.00% 2031 (preref. 2022) | 1,900 | 2,093 |
County of Montgomery, Higher Education and Health Auth., Rev. Bonds, Series 2018-A,
2.15% 2051 (put 2023)1 | 2,800 | 2,800 |
| County of Montgomery, Industrial Dev. Auth., Health Systems Rev. Bonds (Albert Einstein Healthcare Network Issue), Series 2015-A, 5.00% 2021 | 2,000 | 2,093 |
| County of Montgomery, Industrial Dev. Auth., Health Systems Rev. Bonds (Albert Einstein Healthcare Network Issue), Series 2015-A, 5.25% 2026 | 1,000 | 1,131 |
| County of Montgomery, Industrial Dev. Auth., Pollution Control Rev. Ref. Bonds (PECO Energy Company Project), Series 1994-B, 2.55% 2029 (Put 2020) | 1,025 | 1,022 |
| County of Montgomery, Industrial Dev. Auth., Pollution Control Rev. Ref. Bonds (PECO Energy Company Project), Series 1999-A, 2.50% 2030 (put 2020) | 3,000 | 2,993 |
| County of Montgomery, Industrial Dev. Auth., Pollution Control Rev. Ref. Bonds (PECO Energy Company Project), Series 2001-A, AMT, 2.70% 2034 (put 2020) | 4,000 | 3,991 |
| County of Montgomery, Industrial Dev. Auth., Retirement Communities Rev. Bonds (ACTS Retirement-Life Communities, Inc. Obligated Group), Series 2009-A-1, 5.50% 2019 (escrowed to maturity) | 975 | 1,004 |
| County of Montgomery, Industrial Dev. Auth., Retirement Communities Rev. Ref. Bonds (ACTS Retirement-Life Communities, Inc. Obligated Group), Series 2012, 5.00% 2023 | 2,400 | 2,590 |
| County of Montgomery, Industrial Dev. Auth., Retirement Communities Rev. Ref. Bonds (ACTS Retirement-Life Communities, Inc. Obligated Group), Series 2012, 5.00% 2024 | 1,000 | 1,075 |
County of Montour, Geisinger Auth. Health System Rev. Bonds (Geisinger Health System), Series 2014-B,
(1-month USD-LIBOR x 0.67 + 1.07%) 2.754% 2028 (put 2024)1 | 7,000 | 7,121 |
| County of Northampton, General Purpose Auth., Hospital Rev. Bonds (St. Luke’s University Health Network Project), Series 2018-B, (1-month USD-LIBOR x 0.70 + 1.04%) 2.804% 2048 (put 2022)1 | 2,075 | 2,082 |
| City of Philadelphia, Airport Rev. and Rev. Ref. Bonds, Series 2017-B, AMT, 5.00% 2022 | 1,300 | 1,421 |
| City of Philadelphia, Airport Rev. and Rev. Ref. Bonds, Series 2017-B, AMT, 5.00% 2023 | 1,100 | 1,226 |
| City of Philadelphia, Airport Rev. and Rev. Ref. Bonds, Series 2017-B, AMT, 5.00% 2025 | 1,700 | 1,963 |
| City of Philadelphia, Airport Rev. and Rev. Ref. Bonds, Series 2017-B, AMT, 5.00% 2026 | 2,950 | 3,444 |
| City of Philadelphia, Hospitals and Higher Education Facs. Auth., Hospital Rev. Bonds (Temple University Health System Obligated Group), Series 2017, 5.00% 2023 | 1,000 | 1,092 |
| City of Philadelphia, Hospitals and Higher Education Facs. Auth., Hospital Rev. Bonds (Temple University Health System Obligated Group), Series 2017, 5.00% 2024 | 2,000 | 2,214 |
| City of Philadelphia, Hospitals and Higher Education Facs. Auth., Hospital Rev. Bonds (Temple University Health System Obligated Group), Series 2017, 5.00% 2025 | 2,000 | 2,238 |
| Philadelphia School Dist., G.O. Bonds, Series 2016-F, 5.00% 2024 | 5,000 | 5,666 |
| Philadelphia School Dist., G.O. Bonds, Series 2016-F, 5.00% 2025 | 3,000 | 3,441 |
City of Pittsburgh, Urban Redev. Auth., Rev. Bonds (Crawford Square Apartments Project), Series 2018,
2.25% 2020 (put 2020) | 3,240 | 3,246 |
Public School Building Auth., School Lease Rev. Bonds (Philadelphia School Dist. Project), Series 2012,
5.00% 2019 | 1,000 | 1,005 |
Limited Term Tax-Exempt Bond Fund of America — Page 26 of 37
unaudited
Bonds, notes & other debt instruments (continued)
Pennsylvania (continued) | Principal amount
(000) | Value
(000) |
Public School Building Auth., School Lease Rev. Bonds (Philadelphia School Dist. Project), Series 2012,
5.00% 2021 | $2,000 | $2,120 |
Public School Building Auth., School Lease Rev. Bonds (Philadelphia School Dist. Project), Series 2012,
5.00% 2022 | 2,250 | 2,439 |
Public School Building Auth., School Lease Rev. Bonds (Philadelphia School Dist. Project), Series 2012,
5.00% 2023 | 4,250 | 4,592 |
Saint Mary Hospital Auth., Hospital Rev. and Rev. Ref. Bonds (Trinity Health Credit Group), Series 2019-PA,
5.00% 2029 | 1,000 | 1,205 |
Saint Mary Hospital Auth., Hospital Rev. and Rev. Ref. Bonds (Trinity Health Credit Group), Series 2019-PA,
5.00% 2031 | 3,745 | 4,432 |
Saint Mary Hospital Auth., Hospital Rev. and Rev. Ref. Bonds (Trinity Health Credit Group), Series 2019-PA,
5.00% 2032 | 2,555 | 3,002 |
| Susquehanna Area Regional Airport Auth., Airport System Rev. Bonds, Series 2012-A, AMT, 5.00% 2020 | 1,000 | 1,021 |
| Susquehanna Area Regional Airport Auth., Airport System Rev. Bonds, Series 2012-A, AMT, 5.00% 2021 | 2,840 | 2,964 |
| Susquehanna Area Regional Airport Auth., Airport System Rev. Bonds, Series 2012-A, AMT, 5.00% 2022 | 5,355 | 5,703 |
| Transportation Auth., Rev. Ref. Bonds, Series 2017, 5.00% 2028 | 1,475 | 1,790 |
Turnpike Commission, Turnpike Rev. Bonds, Series 2005-A, Assured Guaranty Municipal insured,
5.25% 2025 | 1,500 | 1,787 |
Turnpike Commission, Turnpike Rev. Bonds, Series 2014-B-1,
(SIFMA Municipal Swap Index + 0.70%) 2.13% 20191 | 2,000 | 2,002 |
Turnpike Commission, Turnpike Rev. Bonds, Series 2014-B-1,
(SIFMA Municipal Swap Index + 0.98%) 2.41% 20211 | 8,775 | 8,867 |
| Turnpike Commission, Turnpike Rev. Bonds, Series 2016, 5.00% 2022 | 5,000 | 5,470 |
| Turnpike Commission, Turnpike Rev. Bonds, Series 2016-A-1, 5.00% 2027 | 1,060 | 1,232 |
| Turnpike Commission, Turnpike Rev. Bonds, Series 2017-A-1, 5.00% 2028 | 1,500 | 1,780 |
| Turnpike Commission, Turnpike Rev. Ref. Bonds, Series 2019, 5.00% 2030 | 1,250 | 1,480 |
| Turnpike Commission, Turnpike Rev. Ref. Bonds, Series 2019, 5.00% 2031 | 5,315 | 6,242 |
County of York, Industrial Dev. Auth., Pollution Control Rev. Ref. Bonds
(Philadelphia Electric Co. Project), Series 1993-A, 2.55% 2036 (put 2020) | 10,700 | 10,657 |
| | | 227,869 |
| Puerto Rico 0.10% | | |
| Industrial, Tourist, Educational, Medical and Environmental Control Facs. Fncg. Auth., Hospital Rev. and Rev. Ref. Bonds (Hospital Auxilio Mutuo Obligated Group Project), Series 2011-A, 5.00% 2020 | 3,845 | 3,956 |
| Rhode Island 0.86% | | |
| Commerce Corp., Grant Anticipation Rev. Ref. Bonds (Dept. of Transportation), Series 2016-A, 5.00% 2022 | 1,000 | 1,101 |
| Commerce Corp., Grant Anticipation Rev. Ref. Bonds (Dept. of Transportation), Series 2016-A, 5.00% 2023 | 2,500 | 2,812 |
| Health and Educational Building Corp., Hospital Fncg. Rev. Ref. Bonds (Lifespan Obligated Group Issue), Series 2016, 5.00% 2024 | 2,350 | 2,639 |
Health and Educational Building Corp., Hospital Fncg. Rev. Ref. Bonds (Lifespan Obligated Group Issue),
Series 2016, 5.00% 2023 | 2,000 | 2,209 |
| Health and Educational Building Corp., Providence Public Schools Rev. Bond Fncg. Program, Rev. Ref. Bonds (Providence Public Buildings Auth. Issue), Series 2015, Assured Guaranty Municipal insured, 5.00% 2026 | 2,000 | 2,314 |
| Housing and Mortgage Fin. Corp., Homeownership Opportunity Bonds, Series 66-A-1, 4.00% 2033 | 850 | 878 |
| Housing and Mortgage Fin. Corp., Homeownership Opportunity Bonds, Series 66-A-2, 4.00% 2032 | 625 | 640 |
| Housing and Mortgage Fin. Corp., Homeownership Opportunity Bonds, Series 68-C, AMT, 3.50% 2039 | 3,235 | 3,316 |
| Student Loan Auth., Student Loan Program Rev. Bonds, Series 2014-A, AMT, 5.00% 2019 | 900 | 920 |
| Student Loan Auth., Student Loan Program Rev. Bonds, Series 2014-A, AMT, 5.00% 2020 | 1,250 | 1,308 |
| Student Loan Auth., Student Loan Program Rev. Bonds, Series 2014-A, AMT, 5.00% 2021 | 1,400 | 1,496 |
| Student Loan Auth., Student Loan Program Rev. Bonds, Series 2015-A, AMT, 3.50% 2025 | 3,000 | 3,073 |
| Student Loan Auth., Student Loan Program Rev. Bonds, Series 2015-A, AMT, 3.625% 2026 | 1,000 | 1,026 |
| Student Loan Auth., Student Loan Program Rev. Bonds, Series 2016-A, AMT, 3.00% 2026 | 4,000 | 4,016 |
| Student Loan Auth., Student Loan Program Rev. Bonds, Series 2016-A, AMT, 5.00% 2019 | 400 | 409 |
Limited Term Tax-Exempt Bond Fund of America — Page 27 of 37
unaudited
Bonds, notes & other debt instruments (continued)
Rhode Island (continued) | Principal amount
(000) | Value
(000) |
| Student Loan Auth., Student Loan Program Rev. Bonds, Series 2017-A, AMT, 4.00% 2025 | $2,005 | $2,137 |
| Student Loan Auth., Student Loan Program Rev. Bonds, Series 2017-A, AMT, 4.00% 2026 | 4,000 | 4,232 |
| | | 34,526 |
| South Carolina 1.21% | | |
| Housing Fin. and Dev. Auth., Mortgage Rev. Bonds, Series 2016-B-2, AMT, 4.00% 2043 | 1,895 | 1,981 |
| Housing Fin. and Dev. Auth., Mortgage Rev. Bonds, Series 2017-A, 4.00% 2047 | 3,220 | 3,374 |
| Housing Fin. and Dev. Auth., Mortgage Rev. Bonds, Series 2017-B, 4.00% 2047 | 1,905 | 2,006 |
| Housing Fin. and Dev. Auth., Mortgage Rev. Bonds, Series 2018-A, 4.50% 2048 | 3,170 | 3,431 |
| Housing Fin. and Dev. Auth., Mortgage Rev. Ref. Bonds, Series 2016-A, 4.00% 2036 | 2,020 | 2,120 |
| Jobs-Econ. Dev. Auth., Hospital Rev. Ref. Bonds (Palmetto Health), Series 2013-A, 5.25% 2024 (preref. 2023) | 3,120 | 3,577 |
| Public Service Auth., Rev. Obligations (Santee Cooper), Series 2012-A, 5.00% 2021 | 515 | 553 |
| Public Service Auth., Rev. Obligations (Santee Cooper), Series 2012-D, 5.00% 2026 | 5,000 | 5,357 |
| Public Service Auth., Rev. Obligations (Santee Cooper), Series 2012-D, 5.00% 2028 | 6,305 | 6,717 |
| Public Service Auth., Rev. Obligations (Santee Cooper), Series 2014-C, 5.00% 2022 | 4,250 | 4,660 |
| Public Service Auth., Rev. Obligations (Santee Cooper), Series 2015-C, 5.00% 2021 | 4,395 | 4,721 |
| Public Service Auth., Rev. Obligations (Santee Cooper), Series 2015-C, 5.00% 2022 | 1,000 | 1,096 |
| Public Service Auth., Rev. Obligations (Santee Cooper), Series 2016-A, 5.00% 2028 | 2,455 | 2,772 |
Public Service Auth., Rev. Ref. Obligations (Santee Cooper), Series 2011-B,
4.00% 2019 (escrowed to maturity) | 1,000 | 1,019 |
| County of Richland, Environmental Improvement Rev. Ref. Bonds, Series 2014-A, AMT, 3.875% 2023 | 4,900 | 5,115 |
| | | 48,499 |
| South Dakota 0.42% | | |
| Housing Dev. Auth., Homeownership Mortgage Bonds, Series 2013-A, AMT, 3.00% 2030 | 385 | 389 |
| Housing Dev. Auth., Homeownership Mortgage Bonds, Series 2013-E, AMT, 4.00% 2044 | 395 | 408 |
| Housing Dev. Auth., Homeownership Mortgage Bonds, Series 2014-E, 4.00% 2044 | 235 | 244 |
| Housing Dev. Auth., Homeownership Mortgage Bonds, Series 2015-D, 4.00% 2045 | 845 | 877 |
| Housing Dev. Auth., Homeownership Mortgage Bonds, Series 2016-B, 3.50% 2046 | 1,070 | 1,103 |
| Housing Dev. Auth., Homeownership Mortgage Bonds, Series 2016-D, 3.50% 2046 | 9,565 | 9,879 |
| Housing Dev. Auth., Homeownership Mortgage Bonds, Series 2018-B, 4.50% 2048 | 3,225 | 3,511 |
| Housing Dev. Auth., Homeownership Mortgage Rev. Ref. Bonds, Series 2012-D, AMT, 4.00% 2029 | 580 | 593 |
| | | 17,004 |
| Tennessee 1.13% | | |
| G.O. Rev. Ref. Bonds, Series 2018-A, 5.00% 2025 | 7,585 | 8,958 |
| Housing Dev. Agcy., Homeownership Program Bonds, Series 2015-A, 3.50% 2045 | 610 | 631 |
| Housing Dev. Agcy., Homeownership Program Rev. Ref. Bonds, Series 2011-1-A, AMT, 4.50% 2031 | 780 | 807 |
| Housing Dev. Agcy., Homeownership Program Rev. Ref. Bonds, Series 2012-1-A, AMT, 4.50% 2038 | 290 | 299 |
| Housing Dev. Agcy., Housing Fin. Program Bonds, Series 2010-A-1, 5.00% 2027 | 15 | 15 |
| Housing Dev. Agcy., Residential Fin. Program Bonds, Series 2013-1-C, 3.00% 2038 | 1,305 | 1,322 |
| Housing Dev. Agcy., Residential Fin. Program Bonds, Series 2013-2-A, AMT, 4.00% 2043 | 765 | 791 |
| Housing Dev. Agcy., Residential Fin. Program Bonds, Series 2014-2-A, AMT, 4.00% 2045 | 265 | 275 |
| Housing Dev. Agcy., Residential Fin. Program Bonds, Series 2014-2-C, 4.00% 2045 | 490 | 510 |
| Housing Dev. Agcy., Residential Fin. Program Bonds, Series 2015-2-A, AMT, 4.00% 2046 | 680 | 709 |
| Housing Dev. Agcy., Residential Fin. Program Bonds, Series 2016-1-A, AMT, 3.50% 2047 | 1,570 | 1,617 |
| Housing Dev. Agcy., Residential Fin. Program Bonds, Series 2016-1-B, 3.50% 2047 | 180 | 186 |
| Housing Dev. Agcy., Residential Fin. Program Bonds, Series 2017-1, 4.00% 2042 | 3,180 | 3,350 |
| Housing Dev. Agcy., Residential Fin. Program Bonds, Series 2017-2A, AMT, 4.00% 2042 | 3,230 | 3,394 |
| Housing Dev. Agcy., Residential Fin. Program Bonds, Series 2017-B-2, 4.00% 2042 | 2,395 | 2,523 |
| County of Knox, Health, Educational and Housing Fac. Board, Hospital Rev. Ref. Bonds (Covenant Health), Series 2012-A, 5.00% 2020 | 1,220 | 1,253 |
| County of Knox, Health, Educational and Housing Fac. Board, Hospital Rev. Ref. Bonds (Covenant Health), Series 2012-A, 5.00% 2022 | 3,320 | 3,598 |
Limited Term Tax-Exempt Bond Fund of America — Page 28 of 37
unaudited
Bonds, notes & other debt instruments (continued)
Tennessee (continued) | Principal amount
(000) | Value
(000) |
| County of Knox, Health, Educational and Housing Fac. Board, Hospital Rev. Ref. Bonds (Covenant Health), Series 2012-A, 5.00% 2023 | $1,000 | $1,108 |
| City of Memphis, Airport Auth., Airport Rev. Ref. Bonds, Series 2010-B, AMT, 5.50% 2019 | 2,500 | 2,536 |
| Metropolitan Government of Nashville and Davidson County, G.O. Improvement Bonds, Series 2013-A, 5.00% 2026 (preref. 2023) | 8,785 | 9,870 |
| Tennessee Energy Acquisition Corp., Gas Project Rev. Bonds, Series 2006-C, 5.00% 2021 | 1,580 | 1,657 |
| | | 45,409 |
| Texas 9.66% | | |
| Abilene Independent School Dist., Unlimited Tax School Building Bonds, Series 2019, 5.00% 2025 | 2,000 | 2,349 |
| Alamo Community College Dist., Limited Tax and Rev. Ref. Bonds, Series 2017, 5.00% 2028 | 8,625 | 10,427 |
| Arlington Higher Education Fin. Corp., Education Rev. Bonds (Uplift Education), Series 2016-A, 2.75% 2026 | 890 | 850 |
| Austin Convention Enterprises, Convention Center Hotel Rev. Ref. Bonds, Series 2017-A, 5.00% 2026 | 1,200 | 1,369 |
| City of Austin, Water and Wastewater System Rev. Ref. Bonds, Series 2015-A, 5.00% 2022 | 2,800 | 3,131 |
| City of Austin, Water and Wastewater System Rev. Ref. Bonds, Series 2015-A, 5.00% 2030 | 2,960 | 3,447 |
| City of Austin, Water and Wastewater System Rev. Ref. Bonds, Series 2017, 5.00% 2026 | 1,625 | 1,960 |
County of Bexar, Combination Tax and Rev. Certificates of Obligation, Series 2013-B,
5.00% 2025 (preref. 2023) | 4,710 | 5,344 |
| City of Brownsville, Utilities System Rev. Ref. Bonds, Series 2015, 5.00% 2021 | 1,500 | 1,617 |
| Canyon Independent School Dist., Unlimited Tax School Building Bonds, Series 2019, 5.00% 2024 | 1,390 | 1,599 |
| Canyon Independent School Dist., Unlimited Tax School Building Bonds, Series 2019, 5.00% 2025 | 1,875 | 2,201 |
| Canyon Independent School Dist., Unlimited Tax School Building Bonds, Series 2019, 5.00% 2026 | 3,940 | 4,709 |
| Canyon Independent School Dist., Unlimited Tax School Building Bonds, Series 2019, 5.00% 2027 | 2,145 | 2,597 |
| Carroll Independent School Dist., Rev. Ref. Bonds., Series 2019, 5.00% 2026 | 1,000 | 1,193 |
| Central Texas Regional Mobility Auth., Rev. Ref. Bonds, Series 2010, 5.75% 2020 | 1,000 | 1,032 |
| Central Texas Regional Mobility Auth., Rev. Ref. Bonds, Series 2015-B, 5.00% 2045 (put 2021) | 1,900 | 1,974 |
| Central Texas Regional Mobility Auth., Rev. Ref. Bonds, Series 2016, 5.00% 2024 | 1,000 | 1,122 |
| Central Texas Regional Mobility Auth., Rev. Ref. Bonds, Series 2016, 5.00% 2025 | 1,000 | 1,141 |
| Central Texas Regional Mobility Auth., Rev. Ref. Bonds, Series 2016, 5.00% 2026 | 1,500 | 1,737 |
| Clear Creek Independent School Dist., Unlimited Tax School Building Bonds, Series 2018, 5.00% 2027 | 3,000 | 3,628 |
Clear Creek Independent School Dist., Unlimited Tax School Building Bonds,
Series 2013-B, 3.00% 2032 (put 2019) | 2,015 | 2,028 |
| Clifton Higher Education Fin. Corp., Education Rev. Bonds (Idea Public Schools), Series 2018, 5.00% 2025 | 1,490 | 1,751 |
| Corpus Christi Independent School Dist., Unlimited Tax School Building Bonds, Series 2009, 5.00% 2019 | 2,070 | 2,107 |
| Cypress-Fairbanks Independent School Dist., Unlimited Tax Rev. Ref. Bonds, Series 2019, 5.00% 2024 | 3,100 | 3,572 |
Cities of Dallas and Fort Worth, Dallas/Fort Worth International Airport, Joint Rev. Improvement Bonds,
Series 2013-A, AMT, 5.00% 2026 | 1,000 | 1,095 |
| Cities of Dallas and Fort Worth, Dallas/Fort Worth International Airport, Joint Rev. Ref. Bonds, Series 2011-C, 5.00% 2022 | 1,430 | 1,516 |
| Cities of Dallas and Fort Worth, Dallas/Fort Worth International Airport, Joint Rev. Ref. Bonds, Series 2012-B, 5.00% 2021 | 2,500 | 2,654 |
| Cities of Dallas and Fort Worth, Dallas/Fort Worth International Airport, Joint Rev. Ref. Bonds, Series 2013-E, AMT, 5.00% 2020 | 5,000 | 5,270 |
| Cities of Dallas and Fort Worth, Dallas/Fort Worth International Airport, Joint Rev. Ref. Bonds, Series 2014-A, AMT, 5.25% 2026 | 2,000 | 2,260 |
| City of Dallas, Waterworks and Sewer System Rev. Ref. Bonds, Series 2016-A, 5.00% 2028 | 8,125 | 9,670 |
| Dallas Area Rapid Transit Rev. Bonds, Series 2009-A, 5.00% 2022 (preref. 2019) | 2,500 | 2,528 |
| City of Denton, Utility System Rev. Bonds, Series 2017, 5.00% 2028 | 7,320 | 8,693 |
| Denton Independent School Dist., Unlimited Tax Rev. Ref. Bonds, Series 2015, 5.00% 2026 | 5,000 | 5,827 |
| Dickinson Independent School Dist., Unlimited Tax Rev. Ref. Bonds, Series 2013, 1.35% 2037 (put 2017) | 3,000 | 2,995 |
| Fort Bend Independent School Dist., Unlimited Tax Rev. Ref. Bonds, Series 2017-E, 5.00% 2027 | 6,945 | 8,409 |
Fort Worth Independent School Dist., Unlimited Tax Rev. Ref. and School Building Bonds, Series 2006,
5.00% 2029 (preref. 2019) | 1,175 | 1,176 |
| Frisco Independent School Dist., Unlimited Tax Rev. Ref. Bonds, Series 2016, 5.00% 2026 | 4,615 | 5,479 |
| G.O. Bonds, College Student Loan Bonds, Series 2011-A, AMT, 5.00% 2019 | 1,700 | 1,726 |
Limited Term Tax-Exempt Bond Fund of America — Page 29 of 37
unaudited
Bonds, notes & other debt instruments (continued)
Texas (continued) | Principal amount
(000) | Value
(000) |
| Grand Parkway Transportation Corp., Bond Anticipation Notes, Series 2018, 5.00% 2023 | $7,000 | $7,776 |
| County of Harris, Cultural Education Facs. Fin. Corp., Hospital Rev. Bonds (Memorial Hermann Health System), Series 2014-A, 5.00% 2025 | 2,850 | 3,292 |
| County of Harris, Cultural Education Facs. Fin. Corp., Hospital Rev. Ref. Bonds (Memorial Hermann Health System), Series 2013-B, (SIFMA Municipal Swap Index + 0.90%) 2.33% 20221 | 1,885 | 1,904 |
County of Harris, Cultural Education Facs. Fin. Corp., Medical Facs. Rev. Ref. Bonds (Baylor College of
Medicine), Series 2015, (1-month USD-LIBOR x 0.70 + 0.80%) 2.564% 2045 (put 2020)1 | 3,000 | 3,000 |
| County of Harris, Metropolitan Transit Auth., Sales and Use Tax Rev. Ref. Bonds, Series 2016-A, 5.00% 2027 | 1,500 | 1,807 |
County of Harris, Sports Auth., Rev. Ref. Bonds, Series 2014-A, Assured Guaranty Municipal insured,
5.00% 2024 | 4,000 | 4,635 |
| County of Harris, Toll Road Rev. Bonds, Series 2009-A, 5.00% 2020 | 1,255 | 1,278 |
County of Harris, Toll Road Rev. Ref. Bonds, Series 2012-B,
(SIFMA Municipal Swap Index + 0.45%) 1.88% 20211 | 3,075 | 3,071 |
| County of Harris, Toll Road Rev. Ref. Bonds, Series 2016-A, 5.00% 2027 | 1,500 | 1,784 |
| City of Houston, Airport System Rev. and Rev. Ref. Bonds, Series 2018-A, AMT, 5.00% 2028 | 1,000 | 1,196 |
| City of Houston, Airport System Rev. Ref. Bonds, Series 2011-A, AMT, 5.00% 2019 | 10,000 | 10,130 |
| City of Houston, Airport System Rev. Ref. Bonds, Series 2011-B, 5.00% 2025 | 1,000 | 1,072 |
| City of Houston, Airport System Rev. Ref. Bonds, Series 2018-C, AMT, 5.00% 2026 | 5,010 | 5,874 |
City of Houston, Combined Utility System Rev. Ref. Bonds, Series 2018-C,
(1-month USD-LIBOR x 0.70 + 0.36%) 2.109% 2034 (put 2021)1 | 4,350 | 4,332 |
| City of Houston, Combined Utility System, Rev. and Rev. Ref. Bonds, Series 2016-B, 5.00% 2025 | 3,905 | 4,647 |
| City of Houston, Combined Utility System, Rev. and Rev. Ref. Bonds, Series 2016-B, 5.00% 2027 | 4,500 | 5,393 |
| City of Houston, Downtown Redev. Auth., Tax Increment Contract Rev. Ref. Bonds, Series 2015, BAM insured, 5.00% 2027 | 2,010 | 2,341 |
City of Houston, Higher Education Fin. Corp., Higher Education Rev. Bonds
(Rice University Project), Series 2010-A, 5.00% 2040 (preref. 2020) | 3,275 | 3,411 |
| City of Houston, Public Improvement Rev. Ref. Bonds, Series 2009-A, 5.00% 2020 | 270 | 271 |
| City of Houston, Public Improvement Rev. Ref. Bonds, Series 2009-A, 5.00% 2020 (preref. 2019) | 2,230 | 2,236 |
| City of Houston, Public Improvement Rev. Ref. Bonds, Series 2017-A, 5.00% 2022 | 2,250 | 2,466 |
| City of Houston, Public Improvement Rev. Ref. Bonds, Series 2017-A, 5.00% 2024 | 1,500 | 1,723 |
Houston Independent School Dist., Limited Tax Schoolhouse Bonds, Series 2014-A-1B,
2.20% 2039 (put 2020) | 8,680 | 8,713 |
| Houston Independent School Dist., Limited Tax Schoolhouse Bonds, Series 2017, 3.00% 2021 | 10,580 | 10,851 |
| City of Kerrville, Health Facs. Dev. Corp., Hospital Rev. Bonds (Peterson Regional Medical Center Project), Series 2015, 5.00% 2021 | 800 | 851 |
| City of Kerrville, Health Facs. Dev. Corp., Hospital Rev. Bonds (Peterson Regional Medical Center Project), Series 2015, 5.00% 2022 | 1,000 | 1,088 |
| Lake Travis Independent School Dist., Unlimited Tax School Building Bonds, Series 2019, 5.00% 2025 | 1,050 | 1,237 |
| Lake Travis Independent School Dist., Unlimited Tax School Building Bonds, Series 2019, 5.00% 2026 | 1,110 | 1,331 |
| Love Field Airport Modernization Corp., General Airport Rev. Bonds, Series 2017, AMT, 5.00% 2026 | 1,000 | 1,171 |
| Lower Colorado River Auth., Transmission Contract Rev. Ref. Bonds (LCRA Transmission Services Corp. Project), Series 2011-B, 5.00% 2019 | 5,000 | 5,046 |
| Lower Colorado River Auth., Transmission Contract Rev. Ref. Bonds (LCRA Transmission Services Corp. Project), Series 2018, 5.00% 2024 | 2,250 | 2,570 |
| Lufkin Independent School Dist., Unlimited Tax Rev. Ref. Bonds, Series 2018, 5.00% 2027 | 2,095 | 2,560 |
| Mansfield Independent School Dist., Unlimited Tax Rev.Ref. Bonds, Series 2010, 5.00% 2020 | 5,890 | 6,090 |
| County of Matagorda, Navigation Dist. No. 1 (Central Power and Light Company Project), Pollution Control Rev. Ref. Bonds, Series 1996, AMT, 1.75% 2030 (put 2020) | 3,600 | 3,560 |
Municipal Gas Acquisition and Supply Corp. II, Gas Supply Rev. Bonds, Series 2007-B,
(SIFMA Municipal Swap Index + 0.55%) 1.98% 20271 | 2,820 | 2,773 |
| Municipal Gas Acquisition and Supply Corp. III, Gas Supply Rev. Bonds, Series 2012, 5.00% 2021 | 4,000 | 4,303 |
| Municipal Gas Acquisition and Supply Corp. III, Gas Supply Rev. Bonds, Series 2012, 5.00% 2022 | 2,800 | 3,068 |
| Municipal Gas Acquisition and Supply Corp. III, Gas Supply Rev. Bonds, Series 2012, 5.00% 2023 | 2,000 | 2,188 |
| New Hope Cultural Education Facs. Fin. Corp., Hospital Rev. Bonds (Children’s Health System of Texas Project), Series 2017-A, 5.00% 2028 | 1,500 | 1,793 |
Limited Term Tax-Exempt Bond Fund of America — Page 30 of 37
unaudited
Bonds, notes & other debt instruments (continued)
Texas (continued) | Principal amount
(000) | Value
(000) |
| New Hope Cultural Education Facs. Fin. Corp., Retirement Fac. Rev. Bonds (Westminster Project), Series 2016, 5.00% 2022 | $645 | $693 |
| New Hope Cultural Education Facs. Fin. Corp., Retirement Fac. Rev. Bonds (Westminster Project), Series 2016, 5.00% 2023 | 500 | 544 |
| New Hope Cultural Education Facs. Fin. Corp., Retirement Fac. Rev. Bonds (Westminster Project), Series 2016, 5.00% 2024 | 625 | 684 |
| New Hope Cultural Education Facs. Fin. Corp., Retirement Fac. Rev. Bonds (Westminster Project), Series 2016, 5.00% 2027 | 1,000 | 1,097 |
| New Hope Cultural Education Facs. Fin. Corp., Retirement Fac. Rev. Bonds (Westminster Project), Series 2016, 5.00% 2028 | 1,260 | 1,375 |
| New Hope Cultural Education Facs. Fin. Corp., Student Housing Rev. Bonds (CHF-Collegiate Housing Stephenville III, LLC - Tarleton State University Project), Series 2015-A, 5.00% 2030 | 800 | 861 |
| North East Independent School Dist., Unlimited Tax Rev. Ref. Bonds, Series 2017, 2.375% 2047 (put 2022) | 3,500 | 3,548 |
| North Texas Tollway Auth., System Rev. Ref. Bonds, Series 2014-A, 5.00% 2022 | 1,000 | 1,092 |
| North Texas Tollway Auth., System Rev. Ref. Bonds, Series 2014-A, 5.00% 2023 | 2,000 | 2,236 |
North Texas Tollway Auth., System Rev. Ref. Bonds, Series 2014-C,
(SIFMA Municipal Swap Index + 0.67%) 2.10% 2038 (put 2020)1 | 3,900 | 3,898 |
| North Texas Tollway Auth., System Rev. Ref. Bonds, Series 2016-A, 5.00% 2026 | 1,600 | 1,812 |
| North Texas Tollway Auth., System Rev. Ref. Bonds, Series 2016-A, 5.00% 2027 | 1,000 | 1,129 |
| North Texas Tollway Auth., System Rev. Ref. Bonds, Series 2016-A, 5.00% 2028 | 2,000 | 2,325 |
| City of Olmos Park, Higher Education Facs. Corp., Higher Education Rev. Improvement and Ref. Bonds (University of the Incarnate Word Project), Series 2012, 5.00% 2022 | 2,000 | 2,209 |
| City of Olmos Park, Higher Education Facs. Corp., Higher Education Rev. Improvement and Ref. Bonds (University of the Incarnate Word Project), Series 2012, 5.00% 2023 | 1,500 | 1,658 |
| Public Fin. Auth., G.O. Rev. Ref. Bonds, Series 2018-A, 5.00% 2022 | 4,445 | 4,956 |
| City of San Antonio, Airport System Rev. Ref. Bonds, Series 2012, AMT, 4.00% 2021 | 1,000 | 1,045 |
| City of San Antonio, Electric and Gas Systems Rev. Ref. Bonds, Series 2009-A, 5.25% 2025 (preref. 2019) | 1,000 | 1,000 |
| City of San Antonio, Electric and Gas Systems Rev. Ref. Bonds, Series 2015-A, 2.25% 2033 (put 2019) | 16,000 | 16,053 |
| City of San Antonio, Electric and Gas Systems Rev. Ref. Bonds, Series 2015-C, 3.00% 2045 (put 2019) | 4,000 | 4,038 |
| City of San Antonio, Electric and Gas Systems Rev. Ref. Bonds, Series 2015-D, 3.00% 2045 (put 2020) | 3,000 | 3,060 |
| City of San Antonio, Electric and Gas Systems Rev. Ref. Bonds, Series 2018, 2.75% 2048 (put 2022) | 1,675 | 1,710 |
City of San Antonio, Passenger Fac. Charge and Airport System Rev. Ref. Bonds, Series 2012, AMT,
5.00% 2020 | 1,680 | 1,750 |
City of San Antonio, Passenger Fac. Charge and Airport System Rev. Ref. Bonds, Series 2012, AMT,
5.00% 2021 | 1,770 | 1,889 |
| Spring Independent School Dist., Unlimited Tax School Building Bonds, Series 2019, 5.00% 2024 | 1,500 | 1,748 |
| Spring Independent School Dist., Unlimited Tax School Building Bonds, Series 2019, 5.00% 2031 | 1,385 | 1,665 |
| County of Tarrant, Cultural Education Facs. Fin. Corp., Hospital Rev. Bonds (Baylor Scott & White Health Project), Series 2016-A, 5.00% 2029 | 5,020 | 5,840 |
| County of Tarrant, Health Facs. Dev. Corp., Hospital Rev. Bonds (Cook Children’s Medical Center Project), Series 2010-A, 4.50% 2022 | 500 | 511 |
| Tarrant Regional Water Dist., Water Control and Improvement Dist., Water Rev. Ref. and Improvement Bonds, Series 2009, 5.00% 2020 (preref. 2019) | 1,710 | 1,714 |
Board of Regents of the Texas A&M University System, Rev. Fncg. System Bonds, Series 2015-B,
5.00% 2025 (preref. 2023) | 1,585 | 1,794 |
Board of Regents of the Texas State University System, Rev. Fncg. System Rev. and Rev. Ref. Bonds,
Series 2017-A, 5.00% 2026 | 1,250 | 1,495 |
Board of Regents of the Texas State University System, Rev. Fncg. System Rev. Bonds, Series 2009,
5.00% 2021 (preref. 2019) | 1,000 | 1,004 |
Board of Regents of the Texas State University System, Rev. Fncg. System Rev. Bonds, Series 2009,
5.25% 2027 (preref. 2019) | 1,035 | 1,039 |
| Transportation Commission, Central Texas Turnpike System Rev. Ref. Bonds, Series 2015-C, 5.00% 2025 | 1,000 | 1,123 |
| Transportation Commission, G.O. Mobility Fund and Rev. Ref. Bonds, Series 2015-A, 5.00% 2025 | 6,000 | 7,146 |
| Board of Regents of the University of Houston System, Consolidated Rev. and Rev. Ref. Bonds, Series 2009, 5.00% 2020 | 2,200 | 2,206 |
Limited Term Tax-Exempt Bond Fund of America — Page 31 of 37
unaudited
Bonds, notes & other debt instruments (continued)
Texas (continued) | Principal amount
(000) | Value
(000) |
| Board of Regents of the University of Houston System, Consolidated Rev. and Rev. Ref. Bonds, Series 2017-A, 5.00% 2024 | $7,500 | $8,624 |
| Board of Regents of the University of Houston System, Consolidated Rev. and Rev. Ref. Bonds, Series 2017-A, 5.00% 2026 | 2,620 | 3,129 |
| Board of Regents of the University of Houston System, Consolidated Rev. and Rev. Ref. Bonds, Series 2017-C, 5.00% 2028 | 2,500 | 2,939 |
| Board of Regents of the University of North Texas System, Rev. Fncg. System Rev. Ref. and Improvement Bonds, Series 2017-A, 5.00% 2024 | 1,665 | 1,921 |
| Board of Regents of the University of North Texas System, Rev. Fncg. System Rev. Ref. and Improvement Bonds, Series 2017-A, 5.00% 2025 | 1,255 | 1,477 |
| Board of Regents of the University of Texas System, Rev. Fncg. System Bonds, Series 2016-J, 5.00% 2025 | 5,000 | 5,954 |
| Water Dev. Board, State Revolving Rev. Fund, Rev. Bonds, Series 2018, 5.00% 2030 | 2,760 | 3,306 |
Water Dev. Board, State Water Implementation Rev. Fund, Rev. Bonds (Master Trust), Series 2018-A,
5.00% 2023 | 4,085 | 4,618 |
Water Dev. Board, State Water Implementation Rev. Fund, Rev. Bonds (Master Trust), Series 2018-A,
5.00% 2023 | 3,595 | 4,114 |
Water Dev. Board, State Water Implementation Rev. Fund, Rev. Bonds (Master Trust), Series 2018-A,
5.00% 2029 | 6,935 | 8,440 |
| | | 387,484 |
| Utah 0.14% | | |
| Housing Corp., Single Family Mortgage Bonds, Class III, Series 2015-D-2, 4.00% 2045 | 4,280 | 4,485 |
| Transit Auth., Sales Tax Rev. Bonds, Series 2015-A, 5.00% 2025 | 1,000 | 1,176 |
| | | 5,661 |
| Vermont 0.23% | | |
| Housing Fin. Agcy., Multiple Purpose Bonds, Series 2017-A, AMT, 4.00% 2047 | 3,040 | 3,188 |
| Housing Fin. Agcy., Multiple Purpose Bonds, Series 2018-A, 4.00% 2048 | 1,600 | 1,694 |
| Municipal Bond Bank, Rev. Ref. Bonds, Series 2009-1, 5.00% 2023 (preref. 2019) | 875 | 899 |
| Student Assistance Corp., Education Loan Rev. Bonds, Series 2017-A, AMT, 5.00% 2022 | 400 | 431 |
| Student Assistance Corp., Education Loan Rev. Bonds, Series 2017-A, AMT, 5.00% 2023 | 1,150 | 1,256 |
| Student Assistance Corp., Education Loan Rev. Bonds, Series 2017-A, AMT, 5.00% 2024 | 850 | 939 |
| Student Assistance Corp., Education Loan Rev. Bonds, Series 2017-A, AMT, 5.00% 2025 | 875 | 978 |
| | | 9,385 |
| Virginia 1.14% | | |
College Building Auth., Educational Facs. Rev. Bonds (21st Century College and Equipment Programs),
Series 2012-B, 5.00% 2019 | 1,200 | 1,200 |
| Commonwealth Transportation Board, Federal Transportation Grant Anticipation Rev. and Rev. Ref. Notes, Series 2017, 5.00% 2026 | 7,930 | 9,529 |
| G.O. Bonds, Series 2015-A, 5.00% 2026 | 11,795 | 14,018 |
| Town of Farmville, Industrial Dev. Auth., Educational Facs. Rev. Ref. Bonds (Longwood University Student Housing Project), Series 2018-A, 5.00% 2030 | 1,000 | 1,103 |
| City of Richmond, Public Utility Rev. and Rev. Ref. Bonds, Series 2016-A, 5.00% 2028 | 5,500 | 6,518 |
| County of Sussex, Industrial Dev. Auth., Solid Waste Disposal Rev. Bonds (Atlantic Waste Disposal, Inc. Project), Series 2003-A, AMT, 2.375% 2028 (put 2019) | 2,000 | 2,002 |
County of Wise, Industrial Dev. Auth., Solid Waste and Sewage Disposal Rev. Bonds
(Virginia Electric and Power Co. Project), Series 2009-A, 2.15% 2040 (put 2020) | 11,500 | 11,489 |
| | | 45,859 |
| Washington 3.49% | | |
| Econ. Dev. Fin. Auth., Solid Waste Disposal Rev. Bonds (Waste Management, Inc. Project), Series 2008, 2.125% 20202 | 4,250 | 4,232 |
| Federal Highway Grant Anticipation Rev. Bonds (SR 520 Corridor Program), Series 2012-F, 5.00% 2020 | 5,000 | 5,255 |
| Federal Highway Grant Anticipation Rev. Bonds (SR 520 Corridor Program), Series 2014-C, 5.00% 2019 | 1,000 | 1,019 |
Limited Term Tax-Exempt Bond Fund of America — Page 32 of 37
unaudited
Bonds, notes & other debt instruments (continued)
Washington (continued) | Principal amount
(000) | Value
(000) |
| G.O. Bonds, Series 2012-D, 5.00% 2023 | $5,015 | $5,488 |
| G.O. Bonds, Series 2016-A-1, 5.00% 2026 | 10,950 | 12,963 |
| G.O. Bonds, Series 2017-D, 5.00% 2027 | 7,000 | 8,492 |
| G.O. Bonds, Series 2017-D, 5.00% 2028 | 5,000 | 6,025 |
| G.O. Bonds, Series 2018-C, 5.00% 2027 | 7,500 | 9,099 |
| G.O. Rev. Ref. Bonds, Series 2016-R-B, 5.00% 2029 | 10,000 | 11,722 |
| G.O. Rev. Ref. Bonds, Series 2018-R-D, 5.00% 2027 | 10,000 | 12,219 |
County of Grant, Public Utility Dist. No. 2, Electric System Rev. Ref. Bonds, Series 2017-N,
2.00% 2044 (put 2020) | 5,000 | 4,997 |
Health Care Facs. Auth., Rev. Bonds (Catholic Health Initiatives), Series 2013-B-1,
(SIFMA Municipal Swap Index + 1.00%) 2.43% 2035 (put 2021)1 | 15,100 | 15,144 |
Health Care Facs. Auth., Rev. Bonds (Fred Hutchinson Cancer Research Center), Series 2017-B,
(1-month USD-LIBOR x 0.67 + 1.10%) 2.774% 2042 (put 2022)1 | 2,250 | 2,276 |
| Health Care Facs. Auth., Rev. Ref. Bonds (PeaceHealth), Series 2014-A, 5.00% 2026 | 1,000 | 1,130 |
Health Care Facs. Auth., Rev. Ref. Bonds (Providence Health & Services), Series 2012-B,
5.00% 2042 (put 2021) | 1,000 | 1,080 |
| Health Care Facs. Auth., Rev. Ref. Bonds (Providence St. Joseph Health), Series 2018-B, 5.00% 2027 | 2,000 | 2,411 |
| Health Care Facs. Auth., Rev. Ref. Bonds (Seattle Children’s Hospital), Series 2010-B, 5.00% 2021 | 1,235 | 1,299 |
| Housing Fin. Commission, Homeownership Program Bonds, Series 2011-A, 4.50% 2029 | 190 | 194 |
| Housing Fin. Commission, Nonprofit Housing Rev. and Rev. Ref. Bonds (Horizon House Project), Series 2017, 5.00% 20222 | 540 | 571 |
| Housing Fin. Commission, Nonprofit Housing Rev. and Rev. Ref. Bonds (Horizon House Project), Series 2017, 5.00% 20242 | 610 | 662 |
| Housing Fin. Commission, Nonprofit Housing Rev. and Rev. Ref. Bonds (Horizon House Project), Series 2017, 5.00% 20262 | 1,325 | 1,466 |
| Housing Fin. Commission, Single Family Program Bonds, Series 2014-2A-R, AMT, 3.50% 2044 | 390 | 398 |
| Housing Fin. Commission, Single Family Program Rev. Ref. Bonds, Series 2015-A-R, AMT, 3.50% 2038 | 860 | 879 |
City of Seattle, Municipal Light and Power Improvement and Rev. Ref. Bonds, Series 2018-C-2,
(SIFMA Municipal Swap Index + 0.49%) 1.92% 2046 (put 2023)1 | 4,500 | 4,504 |
| Port of Seattle, Intermediate Lien Rev. Bonds, Series 2017-C, AMT, 5.00% 2026 | 2,500 | 2,917 |
| Port of Seattle, Rev. Bonds, Series 2017-C, AMT, 5.00% 2025 | 2,500 | 2,886 |
| Port of Seattle, Rev. Bonds, Series 2017-C, AMT, 5.00% 2027 | 2,500 | 2,942 |
| Port of Seattle, Rev. Bonds, Series 2018-A, AMT, 5.00% 2025 | 5,250 | 6,060 |
| Port of Seattle, Rev. Bonds, Series 2018-A, AMT, 5.00% 2028 | 4,750 | 5,575 |
| Port of Seattle, Rev. Ref. Bonds, Series 2015-C, AMT, 5.00% 2029 | 1,000 | 1,131 |
| Port of Seattle, Special Fac. Rev. Ref. Bonds (SEATAC Fuel Facs. LLC), Series 2013, AMT, 5.00% 2022 | 1,000 | 1,094 |
| Port of Seattle, Special Fac. Rev. Ref. Bonds (SEATAC Fuel Facs. LLC), Series 2013, AMT, 5.00% 2023 | 1,100 | 1,226 |
| County of Skagit, Public Hospital Dist. No. 1 (Skagit Regional Health), Hospital Rev. Improvement and Rev. Ref. Bonds, Series 2016, 4.00% 2026 | 2,300 | 2,489 |
| | | 139,845 |
| West Virginia 0.52% | | |
Econ. Dev. Auth., Solid Waste Disposal Facs. Rev. Bonds (Appalachian Power Co. - AMOS Project),
Series 2009-B, 2.625% 2042 (put 2022) | 6,250 | 6,214 |
Econ. Dev. Auth., Solid Waste Disposal Facs. Rev. Bonds (Appalachian Power Co. - AMOS Project),
Series 2011-A, AMT, 1.70% 2041 (put 2020) | 2,900 | 2,846 |
Econ. Dev. Auth., Solid Waste Disposal Facs. Rev. Ref. Bonds (Appalachian Power Co. - AMOS Project),
Series 2015-A, 1.90% 2040 (put 2019) | 1,000 | 999 |
Econ. Dev. Auth., Solid Waste Disposal Facs. Rev. Ref. Bonds (Wheeling Power Co. - Mitchell Project),
Series 2013-A, AMT, 3.00% 2037 (put 2022) | 5,200 | 5,175 |
Limited Term Tax-Exempt Bond Fund of America — Page 33 of 37
unaudited
Bonds, notes & other debt instruments (continued)
West Virginia (continued) | Principal amount
(000) | Value
(000) |
County of Harrison, Solid Waste Disposal Rev. Ref. Bonds (Monongahela Power Company Project),
Series 2018-A, AMT, 3.00% 2037 (put 2021) | $4,000 | $3,981 |
Hospital Fin. Auth., Hospital Rev. Ref. and Improvement Rev. Bonds
(Cabell Huntington Hospital Obligated Group), Series 2018-A, 5.00% 2029 | 1,335 | 1,572 |
| | | 20,787 |
| Wisconsin 3.33% | | |
| G.O. Bonds, Series 2013-A, 5.00% 2025 (preref. 2022) | 9,250 | 10,199 |
| G.O. Bonds, Series 2015-A, 5.00% 2031 (preref. 2023) | 12,385 | 14,007 |
| G.O. Rev. Ref. Bonds, Series 2017-3, 5.00% 2030 | 5,000 | 5,979 |
Health and Educational Facs. Auth., Health Facs. Rev. Bonds (SSM Health Care), Series 2018-B,
5.00% 2038 (put 2023) | 11,000 | 12,069 |
Health and Educational Facs. Auth., Rev. Bonds (Advocate Aurora Health Care Credit Group),
Series 2018-C-3, (SIFMA Municipal Swap Index + 0.55%) 1.98% 2054 (put 2023)1 | 5,200 | 5,188 |
Health and Educational Facs. Auth., Rev. Bonds (Advocate Aurora Health Care Credit Group),
Series 2018-C-4, (SIFMA Municipal Swap Index + 0.65%) 2.08% 2054 (put 2024)1 | 4,000 | 4,004 |
| Health and Educational Facs. Auth., Rev. Bonds (Ascension Health Senior Credit Group), Series 2013-B-1, 1.375% 2038 (put 2019) | 5,105 | 5,076 |
| Health and Educational Facs. Auth., Rev. Bonds (Ascension Health Senior Credit Group), Series 2013-B-3, 5.00% 2043 (put 2020) | 10,310 | 10,694 |
Health and Educational Facs. Auth., Rev. Bonds (Marshfield Clinic Health System, Inc.), Series 2016-B,
5.00% 2026 | 1,000 | 1,161 |
Health and Educational Facs. Auth., Rev. Bonds (Marshfield Clinic Health System, Inc.), Series 2016-B,
5.00% 2027 | 1,000 | 1,153 |
Health and Educational Facs. Auth., Rev. Ref. Bonds (Aurora Health Care, Inc.), Series 2012-A,
5.00% 2021 (escrowed to maturity) | 7,765 | 8,375 |
Health and Educational Facs. Auth., Rev. Ref. Bonds (Ministry Health Care, Inc.), Series 2012-C,
5.00% 2021 (escrowed to maturity) | 1,200 | 1,296 |
| Health and Educational Facs. Auth., Rev. Ref. Bonds (ProHealth Care, Inc. Obligated Group), Series 2015, 5.00% 2031 | 1,650 | 1,837 |
| Health and Educational Facs. Auth., Rev. Ref. Bonds (Thedacare, Inc.), Series 2015, 5.00% 2026 | 1,170 | 1,338 |
| Housing and Econ. Dev. Auth., Home Ownership Mortgage Rev. Bonds, Series 2017-A, 2.69% 20473 | 6,967 | 6,731 |
| Housing and Econ. Dev. Auth., Home Ownership Rev. Bonds, Series 2015-A, AMT, 4.00% 2045 | 4,595 | 4,756 |
| Housing and Econ. Dev. Auth., Home Ownership Rev. Bonds, Series 2016-A, AMT, 3.50% 2046 | 6,935 | 7,112 |
| Housing and Econ. Dev. Auth., Home Ownership Rev. Bonds, Series 2017-C, 4.00% 2048 | 6,380 | 6,705 |
| Housing and Econ. Dev. Auth., Home Ownership Rev. Bonds, Series 2018-B, 4.00% 2048 | 3,575 | 3,766 |
| Housing and Econ. Dev. Auth., Housing Rev. Bonds, Series 2017-A, 1.95% 2047 (put 2020) | 5,000 | 4,991 |
| County of Milwaukee, Airport Rev. Ref. Bonds, Series 2010-B, AMT, 5.00% 2020 | 1,500 | 1,538 |
| County of Milwaukee, Airport Rev. Ref. Bonds, Series 2016-A, AMT, 5.00% 2023 | 1,475 | 1,659 |
| County of Milwaukee, Airport Rev. Ref. Bonds, Series 2016-A, AMT, 5.00% 2024 | 1,550 | 1,773 |
Public Fin. Auth., Tax Increment Fin. Grant Rev. Bonds (Statler Hilton & Dallas Central Library),
Series 2016, 0% 2027 | 1,000 | 681 |
| Transportation Rev. Ref. Bonds, Series 2017-2, 5.00% 2022 | 10,450 | 11,598 |
| | | 133,686 |
| Wyoming 0.08% | | |
| Community Dev. Auth., Housing Rev. Bonds, Series 2015-3, 3.00% 2044 | 495 | 502 |
| Community Dev. Auth., Housing Rev. Bonds, Series 2015-6, 4.00% 2045 | 2,815 | 2,914 |
| | | 3,416 |
| Total bonds, notes & other debt instruments(cost: $3,782,084,000) | | 3,813,464 |
Limited Term Tax-Exempt Bond Fund of America — Page 34 of 37
unaudited
| Short-term securities 6.66% | Principal amount
(000) | Value
(000) |
| State of Colorado, General Fund Tax and Rev. Anticipation Notes, Series 2018, 4.00% 6/26/2019 | $2,000 | $2,017 |
| State of Connecticut, Health and Educational Facs. Auth., IAM Commercial Paper (Yale University Issue), Series 2019-S-1, 1.77% 2/1/2019 | 4,000 | 4,000 |
| State of Connecticut, Health and Educational Facs. Auth., IAM Commercial Paper (Yale University Issue), Series 2019-S-2, 1.76% 2/1/2019 | 2,000 | 2,000 |
| State of Florida, County of Alachua, Health Facs. Auth., IAM Commercial Paper (Shands HealthCare Project), Series 2008-A, 1.64% 2/5/2019 | 5,000 | 5,000 |
| State of Florida, Fin. Auth., Econ. Dev. Rev. Ref. Bonds (Republic Services, Inc. Project), Series 2010-A AMT, 2.35% 2034 (put 2019) | 5,000 | 5,000 |
| State of Florida, City of Jacksonville, Health Care Facs., IAM Commercial Paper (Mayo Clinic), Series 2019, 1.80% 2/4/2019 | 3,000 | 3,000 |
State of Illinois, Fin. Auth., Demand Rev. Bonds (University of Chicago Medical Center), Series 2010-A,
1.57% 20441 | 14,150 | 14,150 |
State of Indiana, Fin. Auth., Econ. Dev. Rev. Bonds (Republic Services, Inc. Project), Series 2012,
AMT, 2.35% 2037 (put 2019)4 | 5,000 | 5,000 |
State of Louisiana, Parish of East Baton Rouge, Pollution Control Rev. Ref. Bonds (ExxonMobil Project),
Series 1993, 1.60% 20221 | 5,000 | 5,000 |
State of Louisiana, Public Facs. Auth., Rev. Bonds (Air Products and Chemicals Project), Series 2008-A,
1.58% 20431 | 100 | 100 |
State of Maryland, County of Baltimore, Consolidated Public Improvement Bonds, Series 2018,
4.00% 3/18/2019 | 6,150 | 6,170 |
State of Maryland, Health and Higher Educational Facs. Auth., IAM Commercial Paper
(Johns Hopkins Hospital Issue), Series 2019-B, 1.63% 3/5/2019 | 7,235 | 7,235 |
| State of Massachusetts, G.O. Rev. Anticipation Notes, Series 2018-A, 4.00% 4/25/2019 | 21,000 | 21,114 |
| State of Massachusetts, G.O. Rev. Anticipation Notes, Series 2018-C, 4.00% 6/20/2019 | 8,000 | 8,073 |
State of Michigan, Strategic Fund, Demand Limited Obligation Rev. Bonds
(Air Products and Chemicals, Inc. Project), Series 2007, 1.58% 20421 | 20,520 | 20,520 |
| State of Minnesota, City of Rochester, Health Care Facs. Rev. Bonds (Mayo Clinic), Series 2016, 1.41% 20471 | 3,350 | 3,350 |
State of Mississippi, Business Fin. Corp., Gulf Opportunity Zone Industrial Dev. Rev. Bonds
(Chevron U.S.A. Inc. Project), Series 2009-D, 1.60% 20301 | 2,300 | 2,300 |
State of Mississippi, Business Fin. Corp., Gulf Opportunity Zone Industrial Dev. Rev. Bonds
(Chevron U.S.A. Inc. Project), Series 2010-J, 1.60% 20351 | 2,500 | 2,500 |
State of Mississippi, Business Fin. Corp., Gulf Opportunity Zone Industrial Dev. Rev. Bonds
(Chevron U.S.A. Inc. Project), Series 2011-F, 1.60% 20351 | 3,000 | 3,000 |
State of Mississippi, Business Fin. Corp., Gulf Opportunity Zone Industrial Dev. Rev. Bonds
(Chevron U.S.A. Inc. Project), Series 2011-G, 1.60% 20351 | 1,000 | 1,000 |
State of New York, Metropolitan Transportation Auth., Transportation Rev. Bond Anticipation Notes,
Series 2018-A-1, 4.00% 8/15/2019 | 8,500 | 8,598 |
| State of New York, New York City G.O. Bonds, Fiscal 2006, Series 2006-H-1, 1.63% 20361 | 8,850 | 8,850 |
| State of New York, New York City G.O. Bonds, Fiscal 2008, Series 2008-J-5, 1.60% 20281 | 300 | 300 |
| State of New York, New York City G.O. Bonds, Fiscal 2013, Series 2013-F-3, 1.60% 20421 | 18,700 | 18,700 |
| State of New York, New York City G.O. Bonds, Fiscal 2014, Series 2014-D-3, 1.63% 20381 | 5,870 | 5,870 |
| State of New York, New York City Municipal Water Fin. Auth., Water and Sewer System Second General Resolution Rev. Bonds, Fiscal 2008, Series 2008-B-3, 1.60% 20251 | 8,400 | 8,400 |
| State of New York, New York City Municipal Water Fin. Auth., Water and Sewer System Second General Resolution Rev. Bonds, Fiscal 2011, Series 2011-FF-1, 1.60% 20441 | 5,000 | 5,000 |
State of New York, New York City Transitional Fin. Auth., Future Tax Secured Bonds,
Fiscal 2003, Series 2003-C-5, 1.60% 20311 | 5,000 | 5,000 |
State of New York, New York City Transitional Fin. Auth., Future Tax Secured Bonds,
Fiscal 2010, Series 2010-G-5, 1.67% 20341 | 1,000 | 1,000 |
State of New York, New York City Transitional Fin. Auth., Future Tax Secured Rev. Ref. Bonds,
Fiscal 2015, Series 2015-E-4, 1.60% 20451 | 1,300 | 1,300 |
State of New York, New York City Transitional Fin. Auth., Future Tax Secured Rev. Ref. Bonds,
Fiscal 2016, Series 2016-E-4, 1.63% 20451 | 6,130 | 6,130 |
Limited Term Tax-Exempt Bond Fund of America — Page 35 of 37
unaudited
| Short-term securities (continued) | Principal amount
(000) | Value
(000) |
State of New York, New York City Transitional Fin. Auth., Recovery Bonds, Fiscal 2003, Series 2003-1-C,
1.63% 20221 | $7,610 | $7,610 |
| State of Pennsylvania, Econ. Dev. Fncg. Auth., Solid Waste Disposal Rev. Bonds (Republic Services, Inc. Project), Series 2014, AMT, 2.40% 2044 (put 2019) | 10,250 | 10,256 |
State of Tennessee, City of Lewisburg, Industrial Dev. Board, Solid Waste Disposal Rev. Ref. Bonds
(Waste Management, Inc. of Tennessee Project), Series 2012, AMT, 2.15% 2035 (put 2019) | 9,490 | 9,490 |
State of Tennessee, County of Montgomery, Public Building Auth., Pooled Fncg. Rev. Bonds
(Tennessee County Loan Pool), Series 2004, Bank of America LOC, 1.62% 20341 | 1,525 | 1,525 |
State of Texas, County of Harris, Cultural Education Facs. Fin. Corp., Special Facs. Rev. Ref. Bonds
(Medical Center), Series 2008-A, JPMorgan Chase LOC, 1.60% 20311 | 4,000 | 4,000 |
| State of Texas, City of Houston, Anticipation Rev. and Tax Notes, Series 2018, 4.00% 6/28/2019 | 5,000 | 5,046 |
State of Texas, County of Jefferson, Port Arthur Navigation Dist., Pollution Control Rev. Ref. Bonds
(Texaco Inc. Project), Series 1994, 1.60% 20241 | 15,100 | 15,100 |
State of Texas, Lower Neches Valley Auth. Industrial Dev. Corp., Rev. Bonds (ExxonMobil Project),
Series 2011, 1.60% 20381 | 300 | 300 |
State of Texas, Port Arthur Navigation Dist. Industrial Dev. Corp., Rev. Bonds (Air Products Project),
Series 2005, 1.58% 20401 | 4,000 | 4,000 |
| State of Texas, Tax and Rev. Anticipation Notes, Series 2018, 4.00% 8/29/2019 | 3,695 | 3,744 |
| State of Wyoming, County of Lincoln, Pollution Control Rev. Ref. Bonds (ExxonMobil Project), Series 2014, 1.60% 20441 | 11,000 | 11,000 |
| State of Wyoming, County of Uinta, Wyoming Pollution Control Rev. Ref. Bonds (Chevron U.S.A. Inc. Project), Series 1992, 1.60% 20221 | 5,200 | 5,200 |
| Total short-term securities(cost: $266,934,000) | | 266,948 |
| Total investment securities 101.71%(cost: $4,049,018,000) | | 4,080,412 |
| Other assets less liabilities (1.71%) | | (68,426) |
| Net assets 100.00% | | $4,011,986 |
Futures contracts
| Contracts | Type | Number of
contracts | Expiration | Notional
amount5
(000) | Value at
1/31/20196
(000) | Unrealized
appreciation
(depreciation)
at 1/31/2019
(000) |
| 2 Year U.S. Treasury Note Futures | Long | 364 | April 2019 | $72,800 | $77,288 | $373 |
| 5 Year U.S. Treasury Note Futures | Long | 1,622 | April 2019 | 162,200 | 186,302 | 1,414 |
| 10 Year Ultra U.S. Treasury Note Futures | Short | 475 | March 2019 | (47,500) | (62,077) | (347) |
| | | | | | | $1,440 |
| 1 | Coupon rate may change periodically. For short-term securities, the date of the next scheduled coupon rate change is considered to be the maturity date. |
| 2 | Acquired in a transaction exempt from registration under Rule 144A of the Securities Act of 1933. May be resold in the U.S. in transactions exempt from registration, normally to qualified institutional buyers. The total value of all such securities was $28,636,000, which represented .71% of the net assets of the fund. |
| 3 | Principal payments may be made periodically. Therefore, the effective maturity date may be earlier than the stated maturity date. |
| 4 | For short-term securities, the mandatory put date is considered to be the maturity date. |
| 5 | Notional amount is calculated based on the number of contracts and notional contract size. |
| 6 | Value is calculated based on the notional amount and current market price. |
Limited Term Tax-Exempt Bond Fund of America — Page 36 of 37
unaudited
| Key to abbreviations and symbol | |
| Agcy. = Agency | Fncg. = Financing |
| AMT = Alternative Minimum Tax | G.O. = General Obligation |
| Auth. = Authority | LIBOR = London Interbank Offered Rate |
| Certs. of Part. = Certificates of Participation | LOC = Letter of Credit |
| Dept. = Department | Preref. = Prerefunded |
| Dev. = Development | Redev. = Redevelopment |
| Dist. = District | Ref. = Refunding |
| Econ. = Economic | Rev. = Revenue |
| Fac. = Facility | SIFMA = Securities Industry and Financial Markets Association |
| Facs. = Facilities | USD/$ = U.S. dollars |
| Fin. = Finance | |
Additional financial disclosures are included in the fund’s current shareholder report and should be read in conjunction with this report.
Investments are not FDIC-insured, nor are they deposits of or guaranteed by a bank or any other entity, so they may lose value.
Investors should carefully consider investment objectives, risks, charges and expenses. This and other important information is contained in the fund prospectus and summary prospectus, which can be obtained from your financial professional and should be read carefully before investing. You may also call American Funds Service Company (AFS) at (800) 421-4225 or visit the American Funds website at americanfunds.com. Fund shares offered through American Funds Distributors, Inc.
All Capital Group trademarks referenced are registered trademarks owned by The Capital Group Companies, Inc. or an affiliated company. All other company and product names mentioned are the trademarks or registered trademarks of their respective companies.
©2019 Capital Group. All rights reserved.
| MFGEFPX-043-0319O-S66081 | Limited Term Tax-Exempt Bond Fund of America — Page 37 of 37 |
ITEM 7 – Disclosure of Proxy Voting Policies and Procedures for Closed-End Management Investment Companies
Not applicable to this Registrant, insofar as the Registrant is not a closed-end management investment company.
ITEM 8 – Portfolio Managers of Closed-End Management Investment Companies
Not applicable to this Registrant, insofar as the Registrant is not a closed-end management investment company.
ITEM 9 – Purchases of Equity Securities by Closed-End Management Investment Company and Affiliated Purchasers
Not applicable to this Registrant, insofar as the Registrant is not a closed-end management investment company.
ITEM 10 – Submission of Matters to a Vote of Security Holders
There have been no material changes to the procedures by which shareholders may recommend nominees to the Registrant’s board of trustees since the Registrant last submitted a proxy statement to its shareholders. The procedures are as follows. The Registrant has a nominating and governance committee comprised solely of persons who are not considered ‘‘interested persons’’ of the Registrant within the meaning of the Investment Company Act of 1940, as amended. The committee periodically reviews such issues as the board’s composition, responsibilities, committees, compensation and other relevant issues, and recommends any appropriate changes to the full board of trustees. While the committee normally is able to identify from its own resources an ample number of qualified candidates, it will consider shareholder suggestions of persons to be considered as nominees to fill future vacancies on the board. Such suggestions must be sent in writing to the nominating and governance committee of the Registrant, c/o the Registrant’s Secretary, and must be accompanied by complete biographical and occupational data on the prospective nominee, along with a written consent of the prospective nominee for consideration of his or her name by the nominating and governance committee.
ITEM 11 – Controls and Procedures
| (a) | The Registrant’s Principal Executive Officer and Principal Financial Officer have concluded, based on their evaluation of the Registrant’s disclosure controls and procedures (as such term is defined in Rule 30a-3 under the Investment Company Act of 1940), that such controls and procedures are adequate and reasonably designed to achieve the purposes described in paragraph (c) of such rule. |
| | |
| (b) | Effective May 28, 2018, the Limited Term Tax-Exempt Bond Fund of America’s investment adviser implemented a new fixed income order management, trading, and compliance system. In connection with introducing this new system, additional automated and manual controls were implemented and some existing controls were modified. None of these changes were in response to any identified deficiency or weakness in the Limited Term Tax-Exempt Bond Fund of America’s internal control over financial reporting. |
ITEM 12 – Exhibits
| (a)(1) | Not applicable for filing of semi-annual reports to shareholders. |
| | |
| (a)(2) | The certifications required by Rule 30a-2 of the Investment Company Act of 1940 and Sections 302 and 906 of the Sarbanes-Oxley Act of 2002 are attached as exhibits hereto. |
SIGNATURES
Pursuant to the requirements of the Securities Exchange Act of 1934 and the Investment Company Act of 1940, the Registrant has duly caused this report to be signed on its behalf by the undersigned, thereunto duly authorized.
| | LIMITED TERM TAX-EXEMPT BOND FUND OF AMERICA |
| | |
| | By__/s/ Kristine M. Nishiyama____________________ |
| | Kristine M. Nishiyama, Executive Vice President and Principal Executive Officer |
| | |
| | Date: March 29, 2019 |
Pursuant to the requirements of the Securities Exchange Act of 1934 and the Investment Company Act of 1940, this report has been signed below by the following persons on behalf of the Registrant and in the capacities and on the dates indicated.
| By__/s/ Kristine M. Nishiyama_________________ |
Kristine M. Nishiyama, Executive Vice President and Principal Executive Officer |
| |
| Date: March 29, 2019 |
| By ___/s/ Brian C. Janssen __________ |
Brian C. Janssen, Treasurer and Principal Financial Officer |
| |
| Date: March 29, 2019 |