UNITED STATES
SECURITIES AND EXCHANGE COMMISSION
Washington, D.C. 20549
FORM N-CSR
Certified Shareholder Report of
Registered Management Investment Companies
Investment Company Act File Number: 811-07888
Limited Term Tax-Exempt Bond Fund of America
(Exact Name of Registrant as Specified in Charter)
333 South Hope Street
Los Angeles, California 90071
(Address of Principal Executive Offices)
Registrant's telephone number, including area code: (949) 975-5000
Date of fiscal year end: July 31
Date of reporting period: January 31, 2020
Brian C. Janssen
Limited Term Tax-Exempt Bond Fund of America
6455 Irvine Center Drive
Irvine, California 92620
(Name and Address of Agent for Service)
ITEM 1 – Reports to Stockholders
American Funds Short-Term Tax-Exempt Bond Fund®
Limited Term Tax-Exempt Bond Fund of America®
The Tax-Exempt Bond Fund of America®
American High-Income Municipal Bond Fund®
The Tax-Exempt Fund of California®
American Funds Tax-Exempt Fund of New York® Semi-annual reports for the six months ended January 31, 2020 |  |

Invest in
municipal bonds
for tax-advantaged
income
Beginning January 1, 2021, as permitted by regulations adopted by the U.S. Securities and Exchange Commission, we intend to no longer mail paper copies of the fund’s shareholder reports, unless specifically requested from American Funds or your financial intermediary, such as a broker-dealer or bank. Instead, the reports will be made available on the Capital Group website (capitalgroup.com); you will be notified by mail and provided with a website link to access the report each time a report is posted. If you have already elected to receive shareholder reports electronically, you will not be affected by this change and do not need to take any action. If you prefer to receive shareholder reports and other communications electronically, you may update your mailing preferences with your financial intermediary, or enroll in e-delivery at capitalgroup.com (for accounts held directly with the fund).
You may elect to receive paper copies of all future reports free of charge. If you invest through a financial intermediary, you may contact your financial intermediary to request that you continue to receive paper copies of your shareholder reports. If you invest directly with the fund, you may inform American Funds that you wish to continue receiving paper copies of your shareholder reports by contacting us at (800) 421-4225. Your election to receive paper reports will apply to all funds held with American Funds or through your financial intermediary.
American Funds Short-Term Tax-Exempt Bond Fund seeks to provide current income exempt from regular federal income tax, consistent with the maturity and quality standards described in the prospectus, and to preserve capital.
Limited Term Tax-Exempt Bond Fund of America seeks to provide current income exempt from regular federal income tax, consistent with the maturity and quality standards described in the prospectus, and to preserve capital.
The Tax-Exempt Bond Fund of America seeks to provide a high level of current income exempt from federal income tax, consistent with the preservation of capital.
American High-Income Municipal Bond Fund seeks to provide a high level of current income exempt from regular federal income tax.
The Tax-Exempt Fund of California seeks to provide a high level of current income exempt from regular federal and California state income taxes. Its secondary objective is preservation of capital.
American Funds Tax-Exempt Fund of New York seeks to provide a high level of current income exempt from regular federal, New York state and New York City income taxes. Its secondary objective is preservation of capital.
Each fund is one of more than 40 offered by Capital Group, home of American Funds, one of the nation’s largest mutual fund families. For nearly 90 years, Capital Group has invested with a long-term focus based on thorough research and attention to risk.
Fund results shown in this report, unless otherwise indicated, are for Class A shares at net asset value. If a sales charge had been deducted (maximum 2.50% for American Funds Short-Term Tax-Exempt Bond Fund and Limited Term Tax-Exempt Bond Fund of America; 3.75% for The Tax-Exempt Bond Fund of America, American High-Income Municipal Bond Fund, The Tax-Exempt Fund of California and American Funds Tax-Exempt Fund of New York), the results would have been lower. Results are for past periods and are not predictive of results for future periods. Current and future results may be lower or higher than those shown. Share prices and returns will vary, so investors may lose money. Investing for short periods makes losses more likely. For current information and month-end results, visit capitalgroup.com.
Here are the total returns on a $1,000 investment with all distributions reinvested for periods ended December 31, 2019 (the most recent calendar quarter-end), and the total annual fund operating expense ratios as of the prospectus dated October 1, 2019 (as supplemented to date):
| | | Cumulative total returns | | Average annual total returns | | Gross |
| Class A shares | | 1 year | | 5 years | | 10 years/Lifetime1 | | expense ratios2 |
| | | | | | | | | |
| Reflecting 2.50% maximum sales charge | | | | | | | | | | | | | | | | |
| American Funds Short-Term Tax-Exempt Bond Fund | | | 0.53 | % | | | 0.69 | % | | | 1.09 | % | | | 0.59 | % |
| Limited Term Tax-Exempt Bond Fund of America | | | 2.03 | | | | 1.40 | | | | 2.50 | | | | 0.62 | |
| | | | | | | | | | | | | | | | | |
| Reflecting 3.75% maximum sales charge | | | | | | | | | | | | | | | | |
| The Tax-Exempt Bond Fund of America | | | 3.15 | | | | 2.57 | | | | 4.03 | | | | 0.54 | |
| American High-Income Municipal Bond Fund | | | 4.80 | | | | 4.13 | | | | 5.83 | | | | 0.70 | |
| The Tax-Exempt Fund of California | | | 3.26 | | | | 2.62 | | | | 4.55 | | | | 0.61 | |
| American Funds Tax-Exempt Fund of New York | | | 2.99 | | | | 2.29 | | | | 3.44 | | | | 0.67 | 3 |
| 1 | Applicable only to American Funds Tax-Exempt Fund of New York, which began operations on 11/1/10. All other funds reflect 10-year results. |
| 2 | Restated to reflect current fees. |
| 3 | The net expense ratio for American Funds Tax-Exempt Fund of New York is 0.64% as of the prospectus dated October 1, 2019. |
For other share class results, visit capitalgroup.com.
Investment results assume all distributions are reinvested and reflect applicable fees and expenses. When applicable, investment results reflect fee waivers and/or expense reimbursements, without which results would have been lower. The investment adviser is currently reimbursing a portion of other expenses for American Funds Tax-Exempt Fund of New York. Investment results and the net expense ratio reflect the reimbursement, without which the results would have been lower and the expense ratio would have been higher. This reimbursement will be in effect through at least October 1, 2020, unless modified or terminated by the fund’s board. The adviser may elect at its discretion to extend, modify or terminate the reimbursement at that time. Visit capitalgroup.com for more information.
A summary of each fund’s 30-day yield can be found on page 1.
Investments are not FDIC-insured, nor are they deposits of or guaranteed by a bank or any other entity, so they may lose value.
| | Contents |
| | |
| 1 | Funds’ 30-day yields |
| 2 | Results at a glance |
| | Investment portfolios |
| 3 | American Funds Short-Term Tax-Exempt Bond Fund |
| 10 | Limited Term Tax-Exempt Bond Fund of America |
| 17 | The Tax-Exempt Bond Fund of America |
| 36 | American High-Income Municipal Bond Fund |
| 54 | The Tax-Exempt Fund of California |
| 70 | American Funds Tax-Exempt Fund of New York |
| 78 | Financial statements |
Fellow investors:
Shown in the following tables are the 30-day yields and 12-month distribution rates as of February 29, 2020, as well as the results for the six months ended January 31, 2020, for the six American Funds tax-exempt municipal bond funds. Also shown are the results of the funds’ primary benchmarks and peer groups. For additional information about the funds, their investment results, holdings and portfolio managers, visit capitalgroup.com/individual/products/mutual-funds.html.
Funds’ 30-day yields
Below is a summary of each fund’s 30-day yield and 12-month distribution rate for Class A shares as of February 29, 2020. Both measures reflect the 2.50%/3.75% maximum sales charge. Each fund’s 30-day yield is calculated in accordance with the U.S. Securities and Exchange Commission (SEC) formula.The SEC yield reflects the rate at which each fund is earning income on its current portfolio of securities while the distribution rate reflects the funds’ past dividends paid to shareholders. Accordingly, the funds’ SEC yields and distribution rates may differ.
| | | SEC | | 12-month |
| Class A shares | | 30-day yield | | distribution rate |
| | | | | |
| Reflecting 2.50% maximum sales charge | | | | | | | | |
| American Funds Short-Term Tax-Exempt Bond Fund | | | 0.60 | % | | | 1.41 | % |
| Limited Term Tax-Exempt Bond Fund of America | | | 0.78 | | | | 1.72 | |
| | | | | | | | | |
| Reflecting 3.75% maximum sales charge | | | | | | | | |
| The Tax-Exempt Bond Fund of America | | | 1.17 | | | | 2.42 | |
| American High-Income Municipal Bond Fund | | | 1.85 | | | | 3.13 | |
| The Tax-Exempt Fund of California | | | 0.76 | | | | 2.40 | |
| American Funds Tax-Exempt Fund of New York | | | 0.96 | * | | | 2.30 | |
| * | The SEC 30-day yield for American Funds Tax-Exempt Fund of New York is 0.97% with the fund’s reimbursement. |
The return of principal for bond funds and for funds with significant underlying bond holdings is not guaranteed. Fund shares are subject to the same interest rate, inflation and credit risks associated with the underlying bond holdings. Income may be subject to state or local income taxes and/or federal alternative minimum taxes. Also, certain other income (such as distributions from gains on the sale of certain bonds purchased at less than par value, for The Tax-Exempt Bond Fund of America), as well as capital gain distributions, may be taxable. High-yield/lower rated bonds are subject to greater fluctuations in value and risk of loss of income and principal than investment-grade/ higher rated bonds. The Tax-Exempt Fund of California and American Funds Tax-Exempt Fund of New York are more susceptible to factors adversely affecting issuers of each state’s tax-exempt securities than a more widely diversified municipal bond fund. Refer to the funds’ prospectus and the Risk Factors section of this report for more information on these and other risks associated with investing in the funds.
| American Funds Tax-Exempt Funds | 1 |
Results at a glance
For periods ended January 31, 2020, with distributions reinvested
| | | Cumulative total returns | | Average annual total returns |
| | | 6 months | | 1 year | | 5 years | | 10 years | | Lifetime* |
| | | | | | | | | | | |
American Funds Short-Term Tax-Exempt Bond Fund
(Class A shares) | | | 1.09 | % | | | 3.21 | % | | | 1.20 | % | | | 1.37 | % | | | 1.43 | % |
| Bloomberg Barclays Municipal Short 1–5 Years Index | | | 1.29 | | | | 3.78 | | | | 1.65 | | | | 1.81 | | | | 1.91 | |
| Lipper Short Municipal Debt Funds Average | | | 1.01 | | | | 2.83 | | | | 1.13 | | | | 1.21 | | | | 1.32 | |
| | | | | | | | | | | | | | | | | | | | | |
Limited Term Tax-Exempt Bond Fund of America
(Class A shares) | | | 1.84 | | | | 5.07 | | | | 1.92 | | | | 2.79 | | | | 3.84 | |
| Bloomberg Barclays Municipal Short-Intermediate 1–10 Years Index | | | 2.02 | | | | 5.59 | | | | 2.36 | | | | 2.92 | | | | 4.11 | |
| Lipper Short-Intermediate Municipal Debt Funds Average | | | 1.81 | | | | 4.86 | | | | 1.79 | | | | 2.23 | | | | 3.43 | |
| | | | | | | | | | | | | | | | | | | | | |
The Tax-Exempt Bond Fund of America
(Class A shares) | | | 3.09 | | | | 8.25 | | | | 3.39 | | | | 4.54 | | | | 6.37 | |
| Bloomberg Barclays Municipal Bond Index | | | 3.33 | | | | 8.65 | | | | 3.53 | | | | 4.47 | | | | — | † |
| Lipper General & Insured Municipal Debt Funds Average | | | 3.38 | | | | 8.92 | | | | 3.35 | | | | 4.40 | | | | 6.19 | |
| | | | | | | | | | | | | | | | | | | | | |
American High-Income Municipal Bond Fund
(Class A shares) | | | 3.91 | | | | 10.14 | | | | 4.93 | | | | 6.31 | | | | 5.64 | |
| Bloomberg Barclays Municipal Bond Index | | | 3.33 | | | | 8.65 | | | | 3.53 | | | | 4.47 | | | | 5.35 | |
| Bloomberg Barclays High Yield Municipal Bond Index | | | 5.66 | | | | 12.65 | | | | 6.07 | | | | 7.25 | | | | — | † |
| Lipper High Yield Municipal Debt Funds Average | | | 4.18 | | | | 10.55 | | | | 4.67 | | | | 5.81 | | | | 5.18 | |
| | | | | | | | | | | | | | | | | | | | | |
The Tax-Exempt Fund of California
(Class A shares) | | | 3.15 | | | | 8.54 | | | | 3.45 | | | | 5.05 | | | | 5.49 | |
| Bloomberg Barclays California Municipal Index | | | 3.38 | | | | 8.89 | | | | 3.53 | | | | 4.97 | | | | — | † |
| Lipper California Municipal Debt Funds Average | | | 3.58 | | | | 9.39 | | | | 3.58 | | | | 5.00 | | | | 5.53 | |
| | | | | | | | | | | | | | | | | | | | | |
American Funds Tax-Exempt Fund of New York
(Class A shares) | | | 3.05 | | | | 8.30 | | | | 3.08 | | | | — | | | | 4.04 | |
| Bloomberg Barclays New York Municipal Index | | | 3.03 | | | | 8.20 | | | | 3.38 | | | | — | | | | 3.99 | |
| Lipper New York Municipal Debt Funds Average | | | 3.32 | | | | 8.86 | | | | 3.34 | | | | — | | | | 3.81 | |
| * | Since 8/7/09 (American Funds Short-Term Tax-Exempt Bond Fund), 10/6/93 (Limited Term Tax-Exempt Bond Fund of America), 10/3/79 (The Tax-Exempt Bond Fund of America), 9/26/94 (American High-Income Municipal Bond Fund), 10/28/86 (The Tax-Exempt Fund of California) and 11/1/10 (American Funds Tax-Exempt Fund of New York). |
| † | This index did not exist at the fund’s inception. |
The market indexes are unmanaged and, therefore, have no expenses. Investors cannot invest directly in an index. Bloomberg Barclays source: Bloomberg Index Services Ltd. Lipper averages reflect the current composition of all eligible mutual funds (all share classes) within a given category. Lipper source: Refinitiv Lipper. Lipper categories are dynamic and averages may have few funds, especially over longer periods. To see the number of funds included in the Lipper category for each fund’s lifetime, please view the Quarterly Statistical Update, available at capitalgroup.com.
| 2 | American Funds Tax-Exempt Funds |
| American Funds Short-Term Tax-Exempt Bond Fund | unaudited |
Summary investment portfolioJanuary 31, 2020
| Portfolio quality summary* | Percent of net assets |
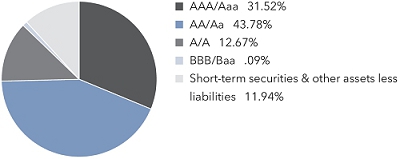
| * | Bond ratings, which typically range from AAA/Aaa (highest) to D (lowest), are assigned by credit rating agencies such as Standard & Poor’s, Moody’s and/or Fitch as an indication of an issuer’s creditworthiness. In assigning a credit rating to a security, the fund looks specifically to the ratings assigned to the issuer of the security by Standard & Poor’s, Moody’s and/or Fitch. If agency ratings differ, the security will be considered to have received the highest of those ratings, consistent with the fund’s investment policies. |
| Bonds, notes & other debt instruments 88.06% | Principal amount
(000) | | | Value
(000) | |
| Alabama 0.88% | | | | | | |
| Black Belt Energy Gas Dist., Gas Supply Rev. Bonds, Series 2017-A, 4.00% 2047 (put 2022) | | $ | 5,500 | | | $ | 5,866 | |
| Other securities | | | | | | | 4,882 | |
| | | | | | | | 10,748 | |
| | | | | | | | | |
| Colorado 1.97% | | | | | | | | |
| Housing and Fin. Auth., Single Family Mortgage Bonds, Series 2019-C, Class I, 4.25% 2049 | | | 6,265 | | | | 6,939 | |
| Other securities | | | | | | | 17,080 | |
| | | | | | | | 24,019 | |
| | | | | | | | | |
| Connecticut 2.17% | | | | | | | | |
| Health and Educational Facs. Auth., Rev. Bonds (Quinnipiac University Issue), Series 2016-M, 5.00% 2022 | | | 750 | | | | 818 | |
| Health and Educational Facs. Auth., Rev. Bonds (Yale University Issue), Series 1997-T-2, 1.65% 2029 (put 2020)1 | | | 500 | | | | 500 | |
| Health and Educational Facs. Auth., Rev. Bonds (Yale University Issue), Series 1999-U-1, 2.00% 2033 (put 2022) | | | 1,000 | | | | 1,020 | |
| Health and Educational Facs. Auth., Rev. Bonds (Yale University Issue), Series 2014-A, 1.10% 2048 (put 2023) | | | 2,290 | | | | 2,297 | |
| Health and Educational Facs. Auth., Rev. Bonds (Yale University Issue), Series 2015-A, 2.05% 2035 (put 2021) | | | 3,750 | | | | 3,808 | |
| Health and Educational Facs. Auth., Rev. Bonds (Yale University Issue), Series 2017-B-1, 5.00% 2037 (put 2020)1 | | | 3,825 | | | | 3,889 | |
| Other securities | | | | | | | 14,182 | |
| | | | | | | | 26,514 | |
| | | | | | | | | |
| Florida 5.46% | | | | | | | | |
| County of Broward, Airport System Rev. Bonds, Series 2017, AMT, 5.00% 2020 | | | 1,000 | | | | 1,026 | |
| County of Broward, Airport System Rev. Bonds, Series 2017, AMT, 5.00% 2023 | | | 1,100 | | | | 1,253 | |
| County of Broward, Airport System Rev. Bonds, Series 2019-A, AMT, 5.00% 2023 | | | 1,250 | | | | 1,424 | |
| County of Broward, Airport System Rev. Bonds, Series 2019-A, AMT, 5.00% 2024 | | | 1,300 | | | | 1,526 | |
| County of Broward, Airport System Rev. Bonds, Series 2019-A, AMT, 5.00% 2025 | | | 2,125 | | | | 2,563 | |
| County of Broward, Airport System Rev. Bonds, Series 2019-A, AMT, 5.00% 2026 | | | 1,415 | | | | 1,745 | |
| County of Broward, Airport System Rev. Bonds, Series 2019-A, AMT, 5.00% 2027 | | | 1,850 | | | | 2,322 | |
| County of Broward, Airport System Rev. Bonds, Series 2019-B, AMT, 5.00% 2026 | | | 1,000 | | | | 1,233 | |
| County of Broward, Airport System Rev. Ref. Bonds, Series 2015-A, AMT, 5.00% 2021 | | | 1,000 | | | | 1,065 | |
| Greater Orlando Aviation Auth., Airport Facs. Rev. Bonds, Series 2019-A, AMT, 5.00% 2024 | | | 5,000 | | | | 5,881 | |
| Housing Fin. Corp., Homeowner Mortgage Rev. Bonds, Series 2018-2, 4.25% 2050 | | | 5,215 | | | | 5,777 | |
| JEA, Electric System Rev. Bonds, Series 2012-B, 5.00% 2026 (preref. 2021) | | | 4,650 | | | | 4,965 | |
| Other securities | | | | | | | 35,853 | |
| | | | | | | | 66,633 | |
| American Funds Tax-Exempt Funds | 3 |
American Funds Short-Term Tax-Exempt Bond Fund
| Bonds, notes & other debt instruments(continued) | Principal amount
(000) | | | Value
(000) | |
| Georgia 1.87% | | | | | | | | |
| City of East Point, Housing Auth., Multi Family Housing Rev. Bonds (Hillcrest Senior Apartments Projects), Series 2018, 2.25% 2022 (put 2021)1 | | $ | 6,470 | | | $ | 6,561 | |
| Other securities | | | | | | | 16,247 | |
| | | | | | | | 22,808 | |
| | | | | | | | | |
| Illinois 5.72% | | | | | | | | |
| Build Illinois Bonds, Sales Tax Rev. Bonds, Series 2013, 5.00% 2020 | | | 6,310 | | | | 6,389 | |
| Fin. Auth., National Rural Utilities Cooperative Fin. Corp., Guaranteed Solid Waste Disposal Rev. Bonds (Prairie Power, Inc. Project), Series 2008-A, 1.75% 2042 (put 2020) | | | 3,230 | | | | 3,235 | |
| Fin. Auth., Rev. Bonds (Clean Water Initiative Revolving Fund), Series 2017, 5.00% 2023 | | | 1,000 | | | | 1,118 | |
| Fin. Auth., Rev. Bonds (University of Chicago), Series 2014-A, 5.00% 2021 | | | 1,545 | | | | 1,649 | |
| Fin. Auth., Rev. Green Bonds (Clean Water Initiative Revolving Fund), Series 2019, 5.00% 2021 | | | 1,180 | | | | 1,249 | |
| Fin. Auth., Rev. Ref. Bonds (OSF Healthcare System), Series 2015-A, 5.00% 2020 | | | 2,410 | | | | 2,484 | |
| Housing Dev. Auth., Multi Family Housing Rev. Notes (Marshall Field Garden Apartment Homes), Series 2015, (SIFMA Municipal Swap Index + 1.00%) 1.94% 2050 (put 2025)2 | | | 5,625 | | | | 5,664 | |
| Other securities | | | | | | | 47,968 | |
| | | | | | | | 69,756 | |
| | | | | | | | | |
| Indiana 1.02% | | | | | | | | |
| Indianapolis Local Public Improvement Bond Bank, Rev. Ref. Bonds (Indianapolis Airport Auth. Project), Series 2019-D, AMT, 5.00% 2025 | | | 5,000 | | | | 5,888 | |
| Other securities | | | | | | | 6,538 | |
| | | | | | | | 12,426 | |
| | | | | | | | | |
| Iowa 0.46% | | | | | | | | |
| Fin. Auth., State Revolving Fund Rev. Bonds, Series 2011, 5.00% 2026 (preref. 2021) | | | 4,960 | | | | 5,267 | |
| Other securities | | | | | | | 366 | |
| | | | | | | | 5,633 | |
| | | | | | | | | |
| Kentucky 0.62% | | | | | | | | |
| Housing Corp., Housing Rev. Bonds (Jefferson Green Apartments Project), Series 2018, 2.20% 2022 (put 2021) | | | 4,825 | | | | 4,876 | |
| Other securities | | | | | | | 2,742 | |
| | | | | | | | 7,618 | |
| | | | | | | | | |
| Louisiana 0.96% | | | | | | | | |
| Tobacco Settlement Fncg. Corp., Tobacco Settlement Asset-Backed Rev. Ref. Bonds, Series 2013-A, 5.00% 2021 | | | 4,705 | | | | 4,925 | |
| Other securities | | | | | | | 6,780 | |
| | | | | | | | 11,705 | |
| | | | | | | | | |
| Michigan 2.11% | | | | | | | | |
| Housing Dev. Auth., Single Family Mortgage Rev. Bonds, Series 2014-A, 4.00% 2044 | | | 520 | | | | 547 | |
| Housing Dev. Auth., Single Family Mortgage Rev. Bonds, Series 2016-B, 3.50% 2047 | | | 945 | | | | 1,003 | |
| Housing Dev. Auth., Single Family Mortgage Rev. Bonds, Series 2017-B, 3.50% 2048 | | | 3,080 | | | | 3,288 | |
| Housing Dev. Auth., Single Family Mortgage Rev. Bonds, Series 2018-A, 4.00% 2048 | | | 2,460 | | | | 2,677 | |
| Housing Dev. Auth., Single Family Mortgage Rev. Bonds, Series 2018-C, 4.25% 2049 | | | 6,775 | | | | 7,493 | |
| Other securities | | | | | | | 10,727 | |
| | | | | | | | 25,735 | |
| | | | | | | | | |
| Minnesota 2.21% | | | | | | | | |
| Housing Fin. Agcy., Residential Housing Fin. Bonds, Series 2018-E, 4.25% 2049 | | | 4,505 | | | | 4,985 | |
| Other securities | | | | | | | 21,929 | |
| | | | | | | | 26,914 | |
| | | | | | | | | |
| Missouri 1.34% | | | | | | | | |
| City of Kirkwood, Industrial Dev. Auth., Retirement Community Rev. Bonds (Aberdeen Heights Project), Series 2010-A, 8.25% 2039 (preref. 2020) | | | 11,000 | | | | 11,222 | |
| Other securities | | | | | | | 5,145 | |
| | | | | | | | 16,367 | |
| 4 | American Funds Tax-Exempt Funds |
American Funds Short-Term Tax-Exempt Bond Fund
| | Principal amount
(000) | | | Value
(000) | |
| Montana 0.66% | | | | | | | | |
| Fin. Auth., Rev. Bonds (Billings Clinic Obligated Group), Series 2018-C, (SIFMA Municipal Swap Index + 0.55%) 1.49% 2037 (put 2023)2 | | $ | 4,980 | | | $ | 4,975 | |
| Other securities | | | | | | | 3,041 | |
| | | | | | | | 8,016 | |
| | | | | | | | | |
| Nevada 1.38% | | | | | | | | |
| Housing Division, Single Family Mortgage Rev. Bonds, Series 2019-C, 1.20% 2051 (put 2020) | | | 6,725 | | | | 6,726 | |
| Other securities | | | | | | | 10,094 | |
| | | | | | | | 16,820 | |
| | | | | | | | | |
| New Jersey 2.39% | | | | | | | | |
| Housing and Mortgage Fin. Agcy., Single Family Housing Rev. Bonds, Series 2018-A, 4.50% 2048 | | | 5,510 | | | | 6,160 | |
| Other securities | | | | | | | 22,993 | |
| | | | | | | | 29,153 | |
| | | | | | | | | |
| New York 6.17% | | | | | | | | |
| Metropolitan Transportation Auth., Transportation Rev. Bonds, Series 2014-C, 5.00% 2020 | | | 2,000 | | | | 2,062 | |
| Metropolitan Transportation Auth., Transportation Rev. Bonds, Series 2014-D-2, (SIFMA Municipal Swap Index + 0.45%) 1.39% 2044 (put 2022)2 | | | 4,000 | | | | 4,003 | |
| Metropolitan Transportation Auth., Transportation Rev. Bonds, Series 2015-A-2, (SIFMA Municipal Swap Index + 0.58%) 1.52% 2039 (put 2020)2 | | | 6,250 | | | | 6,251 | |
| Metropolitan Transportation Auth., Transportation Rev. Ref. Bonds, Series 2002-D-2A, Assured Guaranty Municipal insured, (1-month USD-LIBOR x 0.69 + 0.68%) 1.908% 2032 (put 2021)2 | | | 4,000 | | | | 4,011 | |
| New York City Housing Dev. Corp., Multi Family Housing Rev. Bonds (Sustainable Neighborhood Bonds), Series 2017-C-2, 1.70% 2021 | | | 5,250 | | | | 5,251 | |
| New York City Transitional Fin. Auth., Future Tax Secured Bonds, Fiscal 2012, Series 2012-E-1, 5.00% 2023 | | | 1,125 | | | | 1,219 | |
| New York City Transitional Fin. Auth., Recovery Bonds, Fiscal 2020, Series 2002-1, 5.00% 2021 | | | 3,500 | | | | 3,751 | |
| Other securities | | | | | | | 48,742 | |
| | | | | | | | 75,290 | |
| | | | | | | | | |
| North Carolina 3.06% | | | | | | | | |
| G.O. Public Improvement Bonds (Connect NC), Series 2019-B, 5.00% 2021 | | | 6,225 | | | | 6,567 | |
| G.O. Public Improvement Bonds, Series 2010-A, 5.00% 2020 | | | 1,500 | | | | 1,515 | |
| G.O. Rev. Ref. Bonds, Series 2013-D, 4.00% 2020 | | | 3,835 | | | | 3,875 | |
| G.O. Rev. Ref. Bonds, Series 2013-D, 4.00% 2021 | | | 1,000 | | | | 1,042 | |
| G.O. Rev. Ref. Bonds, Series 2013-E, 5.00% 2020 | | | 3,525 | | | | 3,561 | |
| Housing Fin. Agcy., Home Ownership Rev. Ref. Bonds, Series 38-B, 4.00% 2047 | | | 4,870 | | | | 5,255 | |
| Raleigh-Durham Airport Auth., Airport Rev. Ref. Bonds, Series 2020-A, AMT, 5.00% 2021 | | | 5,000 | | | | 5,231 | |
| University of North Carolina at Chapel Hill, General Rev. Bonds, Series 2012-B, (1-month USD-LIBOR x 0.67 + 0.40%) 1.593% 2041 (put 2022)2 | | | 5,030 | | | | 5,039 | |
| Other securities | | | | | | | 5,187 | |
| | | | | | | | 37,272 | |
| | | | | | | | | |
| Oregon 1.75% | | | | | | | | |
| Housing and Community Services Dept., Housing Dev. Rev. Bonds (SHA RAD Group II Apartment Projects), Series 2019-P, 1.45% 2023 (put 2022) | | | 2,115 | | | | 2,129 | |
| Housing and Community Services Dept., Housing Dev. Rev. Bonds (The Henry Apartments Project), Series 2018-J, 2.20% 2021 (put 2020) | | | 7,075 | | | | 7,130 | |
| Housing and Community Services Dept., Mortgage Rev. Bonds (Single Family Mortgage Program), Series 2017-A, 4.00% 2047 | | | 1,955 | | | | 2,114 | |
| Housing and Community Services Dept., Mortgage Rev. Bonds (Single Family Mortgage Program), Series 2018-D, 4.75% 2050 | | | 2,270 | | | | 2,554 | |
| Other securities | | | | | | | 7,445 | |
| | | | | | | | 21,372 | |
| American Funds Tax-Exempt Funds | 5 |
American Funds Short-Term Tax-Exempt Bond Fund
| Bonds, notes & other debt instruments(continued) | Principal amount
(000) | | | Value
(000) | |
| Pennsylvania 3.94% | | | | | | | | |
| Housing Fin. Agcy., Single Family Mortgage Rev. Bonds, Series 2015-117-A, AMT, 3.50% 2040 | | $ | 875 | | | $ | 913 | |
| Housing Fin. Agcy., Single Family Mortgage Rev. Bonds, Series 2015-118-A, AMT, 3.50% 2040 | | | 3,360 | | | | 3,473 | |
| Housing Fin. Agcy., Single Family Mortgage Rev. Bonds, Series 2016-119, 3.50% 2041 | | | 465 | | | | 485 | |
| Housing Fin. Agcy., Single Family Mortgage Rev. Bonds, Series 2016-120, 3.50% 2046 | | | 555 | | | | 582 | |
| Housing Fin. Agcy., Single Family Mortgage Rev. Bonds, Series 2017-122, 4.00% 2046 | | | 3,230 | | | | 3,460 | |
| Housing Fin. Agcy., Single Family Mortgage Rev. Bonds, Series 2017-123-A, AMT, 4.00% 2039 | | | 1,175 | | | | 1,240 | |
| Housing Fin. Agcy., Single Family Mortgage Rev. Bonds, Series 2019-128-A, AMT, 4.75% 2033 | | | 1,465 | | | | 1,618 | |
| Housing Fin. Agcy., Special Limited Obligation, Multi Family Housing Dev. Bonds (Central Pennsylvania Dev.), Series 2018, 2.45% 2022 (put 2021) | | | 5,000 | | | | 5,093 | |
| Turnpike Commission, Turnpike Rev. Bonds (Motor License Fund), Series 2012-A, 5.00% 2025 (preref. 2021) | | | 1,165 | | | | 1,253 | |
| Turnpike Commission, Turnpike Rev. Bonds (Motor License Fund), Series 2012-A, 5.00% 2027 (preref. 2021) | | | 2,380 | | | | 2,560 | |
| Turnpike Commission, Turnpike Rev. Bonds, Series 2011-E, 5.00% 2026 (preref. 2021) | | | 1,000 | | | | 1,075 | |
| Turnpike Commission, Turnpike Rev. Bonds, Series 2011-E, 5.00% 2030 (preref. 2021) | | | 480 | | | | 516 | |
| Turnpike Commission, Turnpike Rev. Bonds, Series 2014-B-1, (SIFMA Municipal Swap Index + 0.98%) 1.92% 20212 | | | 1,100 | | | | 1,110 | |
| Turnpike Commission, Turnpike Rev. Bonds, Series 2016, 5.00% 2021 | | | 2,000 | | | | 2,104 | |
| Turnpike Commission, Turnpike Rev. Bonds, Series 2018-B, (SIFMA Municipal Swap Index + 0.50%) 1.44% 20212 | | | 3,000 | | | | 3,006 | |
| Turnpike Commission, Turnpike Rev. Bonds, Series 2019-A, 5.00% 2025 | | | 500 | | | | 611 | |
| Turnpike Commission, Turnpike Rev. Bonds, Series 2019-A, 5.00% 2026 | | | 400 | | | | 501 | |
| Other securities | | | | | | | 18,465 | |
| | | | | | | | 48,065 | |
| | | | | | | | | |
| South Carolina 1.64% | | | | | | | | |
| City of Charleston, Waterworks and Sewer System Capital Improvement Bonds, Series 2006-B, 1.521% 2035 (put 2022)2 | | | 5,000 | | | | 5,007 | |
| Other securities | | | | | | | 14,978 | |
| | | | | | | | 19,985 | |
| | | | | | | | | |
| Texas 16.53% | | | | | | | | |
| City of Dallas, Housing Fin. Corp., Multi Family Rev. Bonds (Palladium Redbird), Series 2019, 1.50% 2023 (put 2022) | | | 6,000 | | | | 6,038 | |
| City of Dallas, Waterworks and Sewer System Rev. Ref. Bonds, Series 2015-A, 5.00% 2029 | | | 3,910 | | | | 4,737 | |
| G.O. Bonds, College Student Loan Bonds, Series 2013-B, AMT, 5.25% 2022 | | | 3,155 | | | | 3,490 | |
| G.O. Bonds, Water Financial Assistance Bonds (Water Infrastructure Fund), Series 2011-B, 5.00% 2021 | | | 1,830 | | | | 1,943 | |
| G.O. Bonds, Water Financial Assistance Rev. Ref. Bonds (Water Infrastructure Fund), Series 2019-E-1, 5.00% 2021 | | | 1,000 | | | | 1,062 | |
| G.O. Bonds, Water Financial Assistance Rev. Ref. Bonds, Series 2019-C-1, 5.00% 2021 | | | 1,000 | | | | 1,062 | |
| County of Harris, Toll Road Rev. Ref. Bonds, Series 2012-B, (SIFMA Municipal Swap Index + 0.45%) 1.45% 2021 | | | 6,035 | | | | 6,057 | |
| County of Harris, Unlimited Tax Rev. Ref. Bonds, Series 2019-A, 5.00% 2021 | | | 3,000 | | | | 3,205 | |
| County of Harris, Unlimited Tax Rev. Ref. Bonds, Series 2019-B, 5.00% 2021 | | | 2,965 | | | | 3,152 | |
| City of Houston, Combined Utility System Rev. Ref. Bonds, Series 2018-C, (1-month USD-LIBOR x 0.70 + 0.36%) 1.515% 2034 (put 2021)2 | | | 5,650 | | | | 5,656 | |
| City of Houston, Higher Education Fin. Corp., Higher Education Rev. Bonds (Rice University Project), Series 2010-A, 5.00% 2040 (preref. 2020) | | | 5,410 | | | | 5,472 | |
| North Texas Tollway Auth., Special Projects System Rev. Bonds, Series 2011-D, 5.00% 2029 (preref. 2021) | | | 5,000 | | | | 5,318 | |
| Public Fin. Auth., G.O. Rev. Ref. Bonds, Series 2011, 5.00% 2020 | | | 1,145 | | | | 1,176 | |
| Other securities | | | | | | | 153,327 | |
| | | | | | | | 201,695 | |
| 6 | American Funds Tax-Exempt Funds |
American Funds Short-Term Tax-Exempt Bond Fund
| | Principal amount
(000) | | | Value
(000) | |
| Washington 3.61% | | | | | | | | |
| Central Puget Sound Regional Transit Auth., Sales Tax Improvement Green Bonds, Series 2015-S-2B, (SIFMA Municipal Swap Index + 0.45%) 1.39% 2045 (put 2023)2 | | $ | 6,150 | | | $ | 6,152 | |
| Federal Highway Grant Anticipation Rev. Bonds (SR 520 Corridor Program), Series 2012-F, 5.00% 2021 | | | 5,000 | | | | 5,324 | |
| G.O. Bonds, Series 2010-E, 5.00% 2022 (preref. 2020) | | | 1,035 | | | | 1,035 | |
| G.O. Bonds, Series 2011-B, 5.25% 2036 (preref. 2021) | | | 2,030 | | | | 2,118 | |
| G.O. Rev. Ref. Bonds, Series 2012-R-C, 5.00% 2020 | | | 990 | | | | 1,007 | |
| G.O. Rev. Ref. Bonds, Series 2018-R-C, 5.00% 2021 | | | 5,000 | | | | 5,311 | |
| G.O. Rev. Ref. Bonds, Series 2020-R-A, 5.00% 2022 | | | 1,300 | | | | 1,403 | |
| Motor Vehicle Fuel Tax G.O. Bonds, Series 2012-E, 5.00% 2021 | | | 500 | | | | 521 | |
| Motor Vehicle Fuel Tax G.O. Bonds, Series 2014-E, 5.25% 2022 | | | 3,125 | | | | 3,397 | |
| Other securities | | | | | | | 17,819 | |
| | | | | | | | 44,087 | |
| | | | | | | | | |
| Wisconsin 2.46% | | | | | | | | |
| G.O. Bonds, Series 2013-A, 5.00% 2025 (preref. 2022) | | | 5,000 | | | | 5,462 | |
| G.O. Bonds, Series 2015-A, 5.00% 2031 (preref. 2023) | | | 5,000 | | | | 5,655 | |
| Other securities | | | | | | | 18,860 | |
| | | | | | | | 29,977 | |
| | | | | | | | | |
| Other states & U.S. territories 17.68% | | | | | | | | |
| Other securities | | | | | | | 215,985 | |
| | | | | | | | | |
| Total bonds, notes & other debt instruments (cost: $1,059,627,000) | | | | | | | 1,074,593 | |
| | | | | | | | | |
| Short-term securities 15.13% | | | | | | | | |
| State of Arizona, Industrial Dev. Auth., Hospital Rev. Ref. Bonds (Phoenix Children’s Hospital), Series 2019-B, 1.20% 20482 | | | 18,500 | | | | 18,500 | |
| State of Illinois, Fin. Auth., Demand Rev. Bonds (University of Chicago Medical Center), Series 2011-A, 1.18% 20442 | | | 3,500 | | | | 3,500 | |
| State of Louisiana, Public Facs. Auth., Rev. Bonds (Air Products and Chemicals Project), Series 2008, 1.18% 20432 | | | 6,500 | | | | 6,500 | |
| State of Louisiana, Public Facs. Auth., Rev. Bonds (Air Products and Chemicals Project), Series 2008-A, 1.20% 20432 | | | 1,000 | | | | 1,000 | |
| State of Michigan, Strategic Fund, Demand Limited Obligation Rev. Bonds, (Air Products and Chemicals, Inc. Project), Series 2007, 1.20% 20422 | | | 7,000 | | | | 7,000 | |
| State of Mississippi, Business Fin. Corp., Gulf Opportunity Zone Industrial Dev. Rev. Bonds (Chevron U.S.A. Inc. Project), Series 2007-A, 1.19% 20302 | | | 7,000 | | | | 7,000 | |
| State of Mississippi, Business Fin. Corp., Gulf Opportunity Zone Industrial Dev. Rev. Bonds (Chevron U.S.A. Inc. Project), Series 2007-B, 1.20% 20302 | | | 1,200 | | | | 1,200 | |
| State of Mississippi, Business Fin. Corp., Gulf Opportunity Zone Industrial Dev. Rev. Bonds (Chevron U.S.A. Inc. Project), Series 2007-D, 1.19% 20302 | | | 5,500 | | | | 5,500 | |
| State of Mississippi, Business Fin. Corp., Gulf Opportunity Zone Industrial Dev. Rev. Bonds (Chevron U.S.A. Inc. Project), Series 2009-F, 1.20% 20302 | | | 1,400 | | | | 1,400 | |
| State of Mississippi, Business Fin. Corp., Gulf Opportunity Zone Industrial Dev. Rev. Bonds (Chevron U.S.A. Inc. Project), Series 2010-I, 1.20% 20352 | | | 3,000 | | | | 3,000 | |
| State of Mississippi, Business Fin. Corp., Gulf Opportunity Zone Industrial Dev. Rev. Bonds (Chevron U.S.A. Inc. Project), Series 2010-J, 1.19% 20352 | | | 12,000 | | | | 12,000 | |
| State of New York, Metropolitan Transportation Auth., Transportation Rev. Bond Anticipation Notes, Series 2019-A, 4.00% 2/3/2020 | | | 1,500 | | | | 1,500 | |
| State of New York, Metropolitan Transportation Auth., Transportation Rev. Bond Anticipation Notes, Series 2019-D-1, 5.00% 2022 | | | 2,020 | | | | 2,217 | |
| State of New York, Metropolitan Transportation Auth., Transportation Rev. Bond Anticipation Notes, Series 2020-A-2S, 4.00% 2022 | | | 2,920 | | | | 3,086 | |
| State of New York, New York City Municipal Water Fin. Auth., Water and Sewer System Second General Resolution Rev. Bonds, Fiscal 2014, Series 2013-AA-2, 1.18% 20502 | | | 4,000 | | | | 4,000 | |
| State of New York, New York City Municipal Water Fin. Auth., Water and Sewer System Second General Resolution Rev. Bonds, Fiscal 2016, Series 2016-AA-1, 1.18% 20482 | | | 12,860 | | | | 12,860 | |
| State of New York, New York City Transitional Fin. Auth., Future Tax Secured Bonds, Fiscal 2019, Series 2019-A-4, 1.18% 20452 | | | 18,620 | | | | 18,620 | |
| American Funds Tax-Exempt Funds | 7 |
American Funds Short-Term Tax-Exempt Bond Fund
| Short-term securities(continued) | Principal amount
(000) | | | Value
(000) | |
| State of Tennessee, City of Clarksville, Public Building Auth., Pooled Fncg. Rev. Bonds, | | | | | | | | |
| Series 2003, Bank of America LOC, 1.22% 20332 | | $ | 6,950 | | | $ | 6,950 | |
| State of Texas, Tax and Rev. Anticipation Notes, Series 2019, 4.00% 8/27/2020 | | | 11,545 | | | | 11,741 | |
| State of Texas, Board of Regents of the University of Texas System, IAM Commercial Paper, | | | | | | | | |
| Series 2020, 1.00% 5/19/2020 | | | 2,000 | | | | 2,000 | |
| State of Texas, Board of Regents of the University of Texas System, IAM Commercial Paper, | | | | | | | | |
| Series 2020, 1.20% 2/6/2020 | | | 4,500 | | | | 4,500 | |
| State of Texas, County of York, Natural Rural Utilities Corp., Pollution Control Rev. IAM | | | | | | | | |
| Commercial Paper, Series 2000, 1.27% 2/3/2020 | | | 5,000 | | | | 5,000 | |
| State of Wisconsin, Public Fin. Auth., Solid Waste Disposal Rev. Ref. Bonds | | | | | | | | |
| (Waste Management, Inc. Project), Series 2017-A-1, AMT, 1.45% 2023 (put 2020)3 | | | 1,000 | | | | 1,000 | |
| State of Wisconsin, Public Fin. Auth., Solid Waste Disposal Rev. Ref. Bonds | | | | | | | | |
| (Waste Management, Inc. Project), Series 2017-A-2, AMT, 1.53% 2025 (put 2020)3 | | | 6,000 | | | | 6,000 | |
| Other securities | | | | | | | 38,565 | |
| | | | | | | | | |
| Total short-term securities (cost: $184,578,000) | | | | | | | 184,639 | |
| Total investment securities 103.19% (cost: $1,244,205,000) | | | | | | | 1,259,232 | |
| Other assets less liabilities (3.19)% | | | | | | | (38,933 | ) |
| | | | | | | | | |
| Net assets 100.00% | | | | | | $ | 1,220,299 | |
This summary investment portfolio is designed to streamline the report and help investors better focus on the fund’s principal holdings. See the inside back cover for details on how to obtain a complete schedule of portfolio holdings.
“Other securities” includes all issues that are not disclosed separately in the summary investment portfolio. “Other securities” also includes securities (with an aggregate value of $6,617,000, which represented .54% of the net assets of the fund) which were acquired in transactions exempt from registration under Rule 144A of the Securities Act of 1933 and may be resold in the U.S. in transactions exempt from registration, normally to qualified institutional buyers.
| 8 | American Funds Tax-Exempt Funds |
American Funds Short-Term Tax-Exempt Bond Fund
Futures contracts
| | | | | | | | | | | | | | | Unrealized | |
| | | | | | | | | Notional | | | Value at | | | appreciation | |
| | | | | Number of | | | | amount | 4 | | 1/31/2020 | 5 | | at 1/31/2020 | |
| Contracts | | Type | | contracts | | Expiration | | (000) | | | (000) | | | (000) | |
| 2 Year U.S. Treasury Note Futures | | Long | | 506 | | April 2020 | | $ | 101,200 | | | $ | 109,478 | | | $ | 428 | |
| 5 Year U.S. Treasury Note Futures | | Long | | 522 | | April 2020 | | | 52,200 | | | | 62,807 | | | | 779 | |
| | | | | | | | | | | | | | | | | $ | 1,207 | |
| 1 | Step bond; coupon rate may change at a later date. |
| 2 | Coupon rate may change periodically. Reference rate and spread are as of the most recent information available. Some coupon rates are determined by the issuer or agent based on current market conditions; therefore, the reference rate and spread are not available. For short-term securities, the date of the next scheduled coupon rate change is considered to be the maturity date. |
| 3 | For short-term securities, the mandatory put date is considered to be the maturity date. |
| 4 | Notional amount is calculated based on the number of contracts and notional contract size. |
| 5 | Value is calculated based on the notional amount and current market price. |
Key to abbreviations and symbol
Agcy. = Agency
AMT = Alternative Minimum Tax
Auth. = Authority
Certs. of Part. = Certificates of Participation
Dept. = Department
Dev. = Development
Dist. = District
Econ. = Economic
Fac. = Facility
Facs. = Facilities
Fin. = Finance
Fncg. = Financing
G.O. = General Obligation
IAM = Interest at Maturity
LIBOR = London Interbank Offered Rate
LOC = Letter of Credit
Preref. = Prerefunded
Redev. = Redevelopment
Ref. = Refunding
Rev. = Revenue
SIFMA = Securities Industry and Financial Markets Association
USD/$ = U.S. dollars
See notes to financial statements.
| American Funds Tax-Exempt Funds | 9 |
| Limited Term Tax-Exempt Bond Fund of America | unaudited |
Summary investment portfolioJanuary 31, 2020
| Portfolio quality summary* | Percent of net assets |
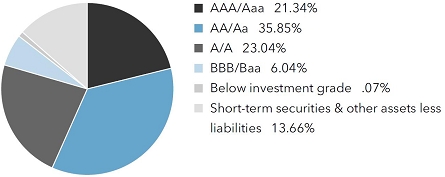
| * | Bond ratings, which typically range from AAA/Aaa (highest) to D (lowest), are assigned by credit rating agencies such as Standard & Poor’s, Moody’s and/or Fitch as an indication of an issuer’s creditworthiness. In assigning a credit rating to a security, the fund looks specifically to the ratings assigned to the issuer of the security by Standard & Poor’s, Moody’s and/or Fitch. If agency ratings differ, the security will be considered to have received the highest of those ratings, consistent with the fund’s investment policies. |
| Bonds, notes & other debt instruments 86.34% | Principal amount
(000) | | | Value
(000) | |
| Alabama 0.89% | | | | | | |
| Black Belt Energy Gas Dist., Gas Supply Rev. Bonds, Series 2017-A, 4.00% 2047 (put 2022) | | $ | 12,620 | | | $ | 13,461 | |
| Other securities | | | | | | | 27,488 | |
| | | | | | | | 40,949 | |
| | | | | | | | | |
| California 3.77% | | | | | | | | |
| Statewide Communities Dev. Auth., Rev. Bonds (Kaiser Permanente), Series 2004-M, 5.00% 2038 (put 2029) | | | 9,700 | | | | 13,061 | |
| Other securities | | | | | | | 160,390 | |
| | | | | | | | 173,451 | |
| | | | | | | | | |
| Colorado 3.13% | | | | | | | | |
| City and County of Denver, Dept. of Aviation, Airport System Rev. Bonds, Series 2018-A, AMT, 5.00% 2026 | | | 15,000 | | | | 18,575 | |
| City and County of Denver, Dept. of Aviation, Airport System Rev. Bonds, Series 2018-A, AMT, 5.00% 2032 | | | 10,000 | | | | 12,613 | |
| Housing and Fin. Auth., Single Family Mortgage Bonds, Series 2019-E, Class I, 4.25% 2049 | | | 12,505 | | | | 13,792 | |
| Other securities | | | | | | | 99,296 | |
| | | | | | | | 144,276 | |
| | | | | | | | | |
| Connecticut 1.92% | | | | | | | | |
| Health and Educational Facs. Auth., Rev. Bonds (Yale University Issue), Series 2014-A, 1.10% 2048 (put 2023) | | | 14,355 | | | | 14,400 | |
| Other securities | | | | | | | 73,851 | |
| | | | | | | | 88,251 | |
| | | | | | | | | |
| Florida 5.36% | | | | | | | | |
| Greater Orlando Aviation Auth., Airport Facs. Rev. Bonds, Series 2019-A, AMT, 5.00% 2028 | | | 15,000 | | | | 19,302 | |
| Housing Fin. Corp., Homeowner Mortgage Rev. Bonds, Series 2018-2, 4.25% 2050 | | | 15,440 | | | | 17,104 | |
| County of Miami-Dade, Aviation Rev. Ref. Bonds, Series 2012-A, AMT, 5.00% 2021 | | | 11,600 | | | | 12,389 | |
| Other securities | | | | | | | 198,095 | |
| | | | | | | | 246,890 | |
| | | | | | | | | |
| Georgia 2.68% | | | | | | | | |
| G.O. Bonds, Series 2019-A, 5.00% 2028 | | | 11,000 | | | | 14,490 | |
| Main Street Natural Gas, Inc., Gas Supply Rev. Bonds, Series 2018-A, 4.00% 2048 (put 2023) | | | 15,000 | | | | 16,437 | |
| Other securities | | | | | | | 92,421 | |
| | | | | | | | 123,348 | |
| 10 | American Funds Tax-Exempt Funds |
Limited Term Tax-Exempt Bond Fund of America
| | Principal amount
(000) | | | Value
(000) | |
| Illinois 9.76% | | | | | | |
| Build Illinois Bonds, Sales Tax Rev. Bonds, Series 2013, 5.00% 2020 | | $ | 1,000 | | | $ | 1,013 | |
| Build Illinois Bonds, Sales Tax Rev. Bonds, Series 2013, 5.00% 2024 | | | 4,230 | | | | 4,663 | |
| Build Illinois Bonds, Sales Tax Rev. Ref. Bonds, Series 2010, 5.00% 2020 | | | 1,200 | | | | 1,215 | |
| Build Illinois Bonds, Sales Tax Rev. Ref. Bonds, Series 2016-C, 4.00% 2025 | | | 4,515 | | | | 5,006 | |
| Build Illinois Bonds, Sales Tax Rev. Ref. Bonds, Series 2016-C, 4.00% 2026 | | | 11,805 | | | | 13,304 | |
| Build Illinois Bonds, Sales Tax Rev. Ref. Bonds, Series 2016-D, 4.00% 2021 | | | 1,900 | | | | 1,957 | |
| Fin. Auth., National Rural Utilities Cooperative Fin. Corp., Guaranteed Solid Waste Disposal Rev. Bonds (Prairie Power, Inc. Project), Series 2008-A, 1.75% 2042 (put 2020) | | | 2,940 | | | | 2,945 | |
| Fin. Auth., Rev. Bonds (Advocate Health Care Network), Series 2014, 5.00% 2021 | | | 375 | | | | 397 | |
| Fin. Auth., Rev. Bonds (Clean Water Initiative Revolving Fund), Series 2016, 4.00% 2026 | | | 1,100 | | | | 1,275 | |
| Fin. Auth., Rev. Bonds (Clean Water Initiative Revolving Fund), Series 2016, 5.00% 2026 | | | 1,000 | | | | 1,230 | |
| Fin. Auth., Rev. Bonds (Clean Water Initiative Revolving Fund), Series 2016, 5.00% 2028 | | | 10,590 | | | | 12,914 | |
| Fin. Auth., Rev. Bonds (Clean Water Initiative Revolving Fund), Series 2017, 5.00% 2027 | | | 2,000 | | | | 2,516 | |
| Fin. Auth., Rev. Bonds (Lifespace Communities, Inc.), Series 2015-A, 5.00% 2020 | | | 500 | | | | 504 | |
| Fin. Auth., Rev. Bonds (Lifespace Communities, Inc.), Series 2015-A, 5.00% 2022 | | | 200 | | | | 214 | |
| Fin. Auth., Rev. Bonds (Lifespace Communities, Inc.), Series 2015-A, 5.00% 2026 | | | 540 | | | | 619 | |
| Fin. Auth., Rev. Bonds (Lifespace Communities, Inc.), Series 2015-A, 5.00% 2028 | | | 1,060 | | | | 1,207 | |
| Fin. Auth., Rev. Bonds (Northwest Community Hospital), Series 2016-A, 5.00% 2026 | | | 1,080 | | | | 1,324 | |
| Fin. Auth., Rev. Bonds (Northwest Community Hospital), Series 2016-A, 5.00% 2027 | | | 1,000 | | | | 1,215 | |
| Fin. Auth., Rev. Bonds (Northwestern Memorial Healthcare), Series 2017-B, 5.00% 2057 (put 2022) | | | 4,865 | | | | 5,399 | |
| Fin. Auth., Rev. Bonds (Presbyterian Homes Obligated Group), Series 2016-A, 5.00% 2020 | | | 800 | | | | 807 | |
| Fin. Auth., Rev. Bonds (Presbyterian Homes Obligated Group), Series 2016-A, 5.00% 2024 | | | 1,920 | | | | 2,198 | |
| Fin. Auth., Rev. Bonds (Presbyterian Homes Obligated Group), Series 2016-B, (1-month USD-LIBOR x 0.70 + 1.35%) 2.596% 2036 (put 2021)1 | | | 2,275 | | | | 2,279 | |
| Fin. Auth., Rev. Bonds (Presence Health Network), Series 2016-C, 4.00% 2024 | | | 4,000 | | | | 4,477 | |
| Fin. Auth., Rev. Bonds (Presence Health Network), Series 2016-C, 5.00% 2023 | | | 1,545 | | | | 1,731 | |
| Fin. Auth., Rev. Bonds (Presence Health Network), Series 2016-C, 5.00% 2024 | | | 1,425 | | | | 1,651 | |
| Fin. Auth., Rev. Bonds (Presence Health Network), Series 2016-C, 5.00% 2025 | | | 950 | | | | 1,136 | |
| Fin. Auth., Rev. Bonds (Presence Health Network), Series 2016-C, 5.00% 2026 | | | 1,215 | | | | 1,496 | |
| Fin. Auth., Rev. Bonds (Presence Health Network), Series 2016-C, 5.00% 2027 | | | 8,640 | | | | 10,885 | |
| Fin. Auth., Rev. Bonds (Rehabilitation Institute of Chicago), Series 2013-A, 5.00% 2022 | | | 1,665 | | | | 1,811 | |
| Fin. Auth., Rev. Bonds (Rush University Medical Center Obligated Group), Series 2015-A, 5.00% 2028 | | | 4,000 | | | | 4,742 | |
| Fin. Auth., Rev. Bonds (Rush University Medical Center Obligated Group), Series 2015-A, 5.00% 2029 | | | 9,500 | | | | 11,224 | |
| Fin. Auth., Rev. Bonds (Swedish Covenant Hospital), Series 2016-A, 5.25% 2028 | | | 1,020 | | | | 1,229 | |
| Fin. Auth., Rev. Green Bonds (Clean Water Initiative Revolving Fund), Series 2019, 5.00% 2021 | | | 4,170 | | | | 4,413 | |
| Fin. Auth., Rev. Ref. Bonds (Loyola University of Chicago), Series 2012-B, 5.00% 2023 | | | 1,970 | | | | 2,158 | |
| Fin. Auth., Rev. Ref. Bonds (OSF Healthcare System), Series 2015-A, 5.00% 2023 | | | 750 | | | | 854 | |
| Fin. Auth., Rev. Ref. Bonds (OSF Healthcare System), Series 2015-A, 5.00% 2026 | | | 1,165 | | | | 1,403 | |
| Fin. Auth., Rev. Ref. Bonds (OSF Healthcare System), Series 2015-A, 5.00% 2029 | | | 1,500 | | | | 1,782 | |
| G.O. Bonds, Series 2013, 5.00% 2022 | | | 1,310 | | | | 1,413 | |
| G.O. Bonds, Series 2017-A, 5.00% 2021 | | | 3,500 | | | | 3,716 | |
| G.O. Bonds, Series 2017-D, BAM insured, 5.00% 2020 | | | 9,885 | | | | 10,154 | |
| G.O. Bonds, Series 2017-D, BAM insured, 5.00% 2021 | | | 20,015 | | | | 21,197 | |
| G.O. Bonds, Series 2017-D, BAM insured, 5.00% 2024 | | | 5,500 | | | | 6,260 | |
| G.O. Rev. Ref. Bonds, Series 2012, 5.00% 2020 | | | 3,000 | | | | 3,054 | |
| Railsplitter Tobacco Settlement Auth., Tobacco Settlement Rev. Bonds, Series 2010, 5.50% 2023 (preref. 2021) | | | 13,235 | | | | 14,040 | |
| Toll Highway Auth., Toll Highway Rev. Bonds, Series 2019-C, 5.00% 2028 | | | 11,035 | | | | 14,077 | |
| Other securities | | | | | | | 260,108 | |
| | | | | | | | 449,212 | |
| | | | | | | | | |
| Massachusetts 2.54% | | | | | | | | |
| Dev. Fin. Agcy., Rev. Bonds (Berkshire Health Systems Issue), Series 2012-G, 5.00% 2020 | | | 1,205 | | | | 1,237 | |
| Dev. Fin. Agcy., Rev. Bonds (Berkshire Health Systems Issue), Series 2012-G, 5.00% 2021 | | | 1,500 | | | | 1,601 | |
| Dev. Fin. Agcy., Rev. Bonds (Beth Israel Lahey Health Issue), Series 2019-K, 5.00% 2026 | | | 1,000 | | | | 1,230 | |
| Dev. Fin. Agcy., Rev. Bonds (Beth Israel Lahey Health Issue), Series 2019-K, 5.00% 2027 | | | 1,500 | | | | 1,884 | |
| Dev. Fin. Agcy., Rev. Bonds (Beth Israel Lahey Health Issue), Series 2019-K, 5.00% 2028 | | | 1,200 | | | | 1,535 | |
| Dev. Fin. Agcy., Rev. Bonds (Boston Medical Center Issue), Series 2012-C, 5.25% 2025 | | | 2,390 | | | | 2,612 | |
| Dev. Fin. Agcy., Rev. Bonds (CareGroup Obligated Group Issue), Series 2016-I, 5.00% 2025 | | | 2,500 | | | | 3,000 | |
| Dev. Fin. Agcy., Rev. Bonds (CareGroup Obligated Group Issue), Series 2016-I, 5.00% 2026 | | | 1,000 | | | | 1,230 | |
| American Funds Tax-Exempt Funds | 11 |
Limited Term Tax-Exempt Bond Fund of America
| Bonds, notes & other debt instruments (continued) | Principal amount
(000) | | | Value
(000) | |
| Massachusetts (continued) | | | | | | |
| Dev. Fin. Agcy., Rev. Bonds (Harvard University Issue), Series 2010-B-2, 5.25% 2034 (preref. 2021) | | $ | 1,855 | | | $ | 1,936 | |
| Dev. Fin. Agcy., Rev. Bonds (Mass General Brigham Issue), Series 2020-A-2, 5.00% 2023 | | | 6,725 | | | | 7,655 | |
| Dev. Fin. Agcy., Rev. Bonds (Partners HealthCare System Issue), Series 2012-L, 5.00% 2031 (preref. 2021) | | | 3,130 | | | | 3,311 | |
| Dev. Fin. Agcy., Rev. Bonds (Partners HealthCare System Issue), Series 2017-S-2, 5.00% 2038 (put 2025) | | | 5,000 | | | | 5,964 | |
| Dev. Fin. Agcy., Rev. Bonds (Partners HealthCare System Issue), Series 2017-S-4, 5.00% 2038 (put 2024) | | | 2,500 | | | | 2,891 | |
| Dev. Fin. Agcy., Rev. Bonds (UMass Memorial Health Care Obligated Group Issue), Series 2016-I, 5.00% 2024 | | | 2,000 | | | | 2,335 | |
| Dev. Fin. Agcy., Rev. Bonds (UMass Memorial Health Care Obligated Group Issue), Series 2016-I, 5.00% 2025 | | | 1,275 | | | | 1,534 | |
| Dev. Fin. Agcy., Rev. Bonds (UMass Memorial Health Care Obligated Group Issue), Series 2016-I, 5.00% 2026 | | | 1,150 | | | | 1,420 | |
| Dev. Fin. Agcy., Rev. Bonds (UMass Memorial Health Care Obligated Group Issue), Series 2016-I, 5.00% 2027 | | | 1,150 | | | | 1,421 | |
| Dev. Fin. Agcy., Rev. Ref. Bonds (Suffolk University Issue), Series 2017, 5.00% 2025 | | | 1,500 | | | | 1,796 | |
| Dev. Fin. Agcy., Rev. Ref. Bonds (Suffolk University Issue), Series 2019, 5.00% 2021 | | | 575 | | | | 607 | |
| Dev. Fin. Agcy., Rev. Ref. Bonds (Suffolk University Issue), Series 2019, 5.00% 2022 | | | 400 | | | | 437 | |
| Dev. Fin. Agcy., Rev. Ref. Bonds (Suffolk University Issue), Series 2019, 5.00% 2023 | | | 425 | | | | 480 | |
| Dev. Fin. Agcy., Rev. Ref. Bonds (Suffolk University Issue), Series 2019, 5.00% 2024 | | | 350 | | | | 408 | |
| Dev. Fin. Agcy., Rev. Ref. Bonds (Tufts Medical Center Issue), Series 2011-I, 6.875% 2041 (preref. 2021) | | | 1,395 | | | | 1,471 | |
| Dev. Fin. Agcy., Rev. Ref. Bonds (Tufts Medical Center Issue), Series 2011-I, 6.875% 2041 (preref. 2021) | | | 1,020 | | | | 1,076 | |
| Other securities | | | | | | | 68,054 | |
| | | | | | | | 117,125 | |
| | | | | | | | | |
| Michigan 2.99% | | | | | | | | |
| Housing Dev. Auth., Single Family Mortgage Rev. Bonds, Series 2014-A, 4.00% 2044 | | | 750 | | | | 789 | |
| Housing Dev. Auth., Single Family Mortgage Rev. Bonds, Series 2016-A, 4.00% 2046 | | | 635 | | | | 677 | |
| Housing Dev. Auth., Single Family Mortgage Rev. Bonds, Series 2016-B, 3.50% 2047 | | | 14,040 | | | | 14,897 | |
| Housing Dev. Auth., Single Family Mortgage Rev. Bonds, Series 2017-B, 3.50% 2048 | | | 2,660 | | | | 2,840 | |
| Housing Dev. Auth., Single Family Mortgage Rev. Bonds, Series 2018-A, 4.00% 2048 | | | 4,090 | | | | 4,451 | |
| Housing Dev. Auth., Single Family Mortgage Rev. Bonds, Series 2018-C, 4.25% 2049 | | | 16,960 | | | | 18,758 | |
| Housing Dev. Auth., Single Family Mortgage Rev. Bonds, Series 2019-A, 4.25% 2049 | | | 7,735 | | | | 8,636 | |
| Other securities | | | | | | | 86,574 | |
| | | | | | | | 137,622 | |
| | | | | | | | | |
| Minnesota 1.16% | | | | | | | | |
| Housing Fin. Agcy., Residential Housing Fin. Bonds, Series 2018-E, 4.25% 2049 | | | 12,935 | | | | 14,313 | |
| Other securities | | | | | | | 39,086 | |
| | | | | | | | 53,399 | |
| | | | | | | | | |
| Nevada 1.39% | | | | | | | | |
| County of Clark, Pollution Control Rev. Ref. Bonds (Southern California Edison Co.), Series 2010, 1.875% 2031 (put 2020) | | | 14,035 | | | | 14,046 | |
| Other securities | | | | | | | 50,077 | |
| | | | | | | | 64,123 | |
| | | | | | | | | |
| New York 5.77% | | | | | | | | |
| Dormitory Auth., State Personal Income Tax Rev. Bonds (General Purpose), Series 2018-A, 5.00% 2030 | | | 12,000 | | | | 15,658 | |
| Metropolitan Transportation Auth., Transportation Rev. Bonds, Series 2003-B, FGIC-National insured, 5.25% 2020 | | | 5,500 | | | | 5,682 | |
| Metropolitan Transportation Auth., Transportation Rev. Bonds, Series 2012-E, 5.00% 2020 | | | 3,250 | | | | 3,351 | |
| Metropolitan Transportation Auth., Transportation Rev. Bonds, Series 2014-C, 5.00% 2024 | | | 5,000 | | | | 5,935 | |
| Metropolitan Transportation Auth., Transportation Rev. Bonds, Series 2014-D-2, (SIFMA Municipal Swap Index + 0.45%) 1.39% 2044 (put 2022)1 | | | 7,750 | | | | 7,755 | |
| Metropolitan Transportation Auth., Transportation Rev. Bonds, Series 2015-A-1, 5.00% 2027 | | | 3,150 | | | | 3,766 | |
| Metropolitan Transportation Auth., Transportation Rev. Bonds, Series 2015-A-2, (SIFMA Municipal Swap Index + 0.58%) 1.52% 2039 (put 2020)1 | | | 5,500 | | | | 5,501 | |
| 12 | American Funds Tax-Exempt Funds |
Limited Term Tax-Exempt Bond Fund of America
| | Principal amount
(000) | | | Value
(000) | |
| Metropolitan Transportation Auth., Transportation Rev. Ref. Bonds, Series 2002-D-2A, Assured Guaranty Municipal insured, (1-month USD-LIBOR x 0.69 + 0.68%) 1.908% 2032 (put 2021)1 | | $ | 1,400 | | | $ | 1,404 | |
| Mortgage Agcy., Homeowner Mortgage Rev. Bonds, Series 217, 4.00% 2049 | | | 11,605 | | | | 12,826 | |
| New York City G.O. Bonds, Fiscal 1994, Series 1994-A-4, 5.00% 2021 | | | 2,420 | | | | 2,570 | |
| New York City G.O. Bonds, Fiscal 2014, Series 2014-G, 5.00% 2023 | | | 1,500 | | | | 1,713 | |
| New York City G.O. Bonds, Fiscal 2014, Series 2014-I-1, 5.00% 2021 | | | 1,445 | | | | 1,509 | |
| New York City G.O. Bonds, Fiscal 2015, Series 2015-C, 5.00% 2028 | | | 1,000 | | | | 1,191 | |
| New York City G.O. Bonds, Fiscal 2017, Series 2017-C, 5.00% 2028 | | | 4,300 | | | | 5,428 | |
| New York City G.O. Bonds, Fiscal 2020, Series 2019-B-1, 5.00% 2022 | | | 1,140 | | | | 1,264 | |
| New York City Transitional Fin. Auth., Future Tax Secured Bonds, Fiscal 2012, Series 2012-E-1, 5.00% 2023 | | | 1,200 | | | | 1,300 | |
| New York City Transitional Fin. Auth., Future Tax Secured Bonds, Fiscal 2015, Series 2015-C, 5.00% 2027 | | | 5,000 | | | | 6,026 | |
| New York City Transitional Fin. Auth., Future Tax Secured Multi-Modal Rev. Ref. Bonds, Fiscal 2003, Series 2003-B, 5.00% 2022 | | | 1,750 | | | | 1,822 | |
| New York City Transitional Fin. Auth., Future Tax Secured Rev. Ref. Bonds, Fiscal 2003, Series 2003-A-1, 5.00% 2022 | | | 1,305 | | | | 1,400 | |
| New York City Transitional Fin. Auth., Recovery Bonds, Fiscal 2020, Series 2002-1, 5.00% 2021 | | | 13,445 | | | | 14,410 | |
| Other securities | | | | | | | 165,080 | |
| | | | | | | | 265,591 | |
| | | | | | | | | |
| North Carolina 1.43% | | | | | | | | |
| G.O. Public Improvement Bonds (Connect NC), Series 2019-B, 5.00% 2021 | | | 13,835 | | | | 14,595 | |
| G.O. Rev. Ref. Bonds, Series 2013-E, 5.00% 2020 | | | 14,110 | | | | 14,252 | |
| Other securities | | | | | | | 37,018 | |
| | | | | | | | 65,865 | |
| | | | | | | | | |
| Pennsylvania 4.71% | | | | | | | | |
| Econ. Dev. Fncg. Auth., Private Activity Rev. Bonds (The Pennsylvania Rapid Bridge Replacement Project), Series 2015, AMT, 5.00% 2024 | | | 9,180 | | | | 10,453 | |
| Econ. Dev. Fncg. Auth., Private Activity Rev. Bonds (The Pennsylvania Rapid Bridge Replacement Project), Series 2015, AMT, 5.00% 2024 | | | 4,900 | | | | 5,654 | |
| Econ. Dev. Fncg. Auth., Private Activity Rev. Bonds (The Pennsylvania Rapid Bridge Replacement Project), Series 2015, AMT, 5.00% 2025 | | | 5,985 | | | | 6,993 | |
| Econ. Dev. Fncg. Auth., Private Activity Rev. Bonds (The Pennsylvania Rapid Bridge Replacement Project), Series 2015, AMT, 5.00% 2026 | | | 2,315 | | | | 2,772 | |
| Econ. Dev. Fncg. Auth., Private Activity Rev. Bonds (The Pennsylvania Rapid Bridge Replacement Project), Series 2015, AMT, 5.00% 2026 | | | 1,775 | | | | 2,120 | |
| Econ. Dev. Fncg. Auth., Solid Waste Disposal Rev. Bonds (Waste Management, Inc. Project), Series 2017-A, AMT, 1.70% 2037 (put 2020) | | | 4,000 | | | | 4,009 | |
| Other securities | | | | | | | 184,640 | |
| | | | | | | | 216,641 | |
| | | | | | | | | |
| Texas 11.42% | | | | | | | | |
| County of Harris, Toll Road Rev. Ref. Bonds, Series 2012-B, (SIFMA Municipal Swap Index + 0.45%) 1.45% 2021 | | | 12,505 | | | | 12,550 | |
| Other securities | | | | | | | 513,136 | |
| | | | | | | | 525,686 | |
| | | | | | | | | |
| Virginia 1.50% | | | | | | | | |
| G.O. Bonds, Series 2015-A, 5.00% 2026 | | | 11,795 | | | | 14,378 | |
| Other securities | | | | | | | 54,719 | |
| | | | | | | | 69,097 | |
| | | | | | | | | |
| Washington 2.76% | | | | | | | | |
| G.O. Bonds, Series 2010-E, 5.00% 2022 (preref. 2020) | | | 5 | | | | 5 | |
| G.O. Bonds, Series 2012-D, 5.00% 2023 | | | 5,015 | | | | 5,423 | |
| G.O. Bonds, Series 2017-D, 5.00% 2028 | | | 5,000 | | | | 6,299 | |
| G.O. Bonds, Series 2019-C, 5.00% 2031 | | | 5,000 | | | | 6,518 | |
| G.O. Rev. Ref. Bonds, Series 2012-R-C, 5.00% 2020 | | | 4,680 | | | | 4,760 | |
| G.O. Rev. Ref. Bonds, Series 2016-R-B, 5.00% 2029 | | | 10,205 | | | | 12,474 | |
| American Funds Tax-Exempt Funds | 13 |
Limited Term Tax-Exempt Bond Fund of America
| Bonds, notes & other debt instruments (continued) | Principal amount
(000) | | | Value
(000) | |
| Washington (continued) | | | | | | |
| G.O. Rev. Ref. Bonds, Series 2020-R-A, 5.00% 2022 | | $ | 1,595 | | | $ | 1,721 | |
| G.O. Rev. Ref. Bonds, Series 2020-R-A, 5.00% 2026 | | | 2,500 | | | | 3,092 | |
| G.O. Rev. Ref. Bonds, Series 2020-R-B, 5.00% 2022 | | | 2,750 | | | | 2,967 | |
| G.O. Rev. Ref. Bonds, Series 2020-R-B, 5.00% 2026 | | | 2,500 | | | | 3,092 | |
| Health Care Facs. Auth., Rev. Bonds (Catholic Health Initiatives), Series 2013-B-1, (SIFMA Municipal Swap Index + 1.00%) 1.94% 2035 (put 2021)1 | | | 15,100 | | | | 15,123 | |
| Motor Vehicle Fuel Tax G.O. Bonds, Series 2012-E, 5.00% 2021 | | | 1,120 | | | | 1,166 | |
| Other securities | | | | | | | 64,169 | |
| | | | | | | | 126,809 | |
| | | | | | | | | |
| Wisconsin 2.88% | | | | | | | | |
| G.O. Bonds, Series 2015-A, 5.00% 2031 (preref. 2023) | | | 12,385 | | | | 14,008 | |
| Health and Educational Facs. Auth., Health Facs. Rev. Bonds (SSM Health Care), Series 2018-B, 5.00% 2038 (put 2023) | | | 11,000 | | | | 12,079 | |
| Health and Educational Facs. Auth., Rev. Bonds (Advocate Aurora Health Care Credit Group), Series 2018-C-3, (SIFMA Municipal Swap Index + 0.55%) 1.49% 2054 (put 2023)1 | | | 5,200 | | | | 5,231 | |
| Health and Educational Facs. Auth., Rev. Bonds (Advocate Aurora Health Care Credit Group), Series 2018-C-4, (SIFMA Municipal Swap Index + 0.65%) 1.59% 2054 (put 2024)1 | | | 4,000 | | | | 4,042 | |
| Health and Educational Facs. Auth., Rev. Bonds (Ascension Health Alliance Senior Credit Group), Series 2013-B-3, 5.00% 2043 (put 2020) | | | 10,310 | | | | 10,443 | |
| Health and Educational Facs. Auth., Rev. Bonds (Ascension Health Alliance Senior Credit Group), Series 2013-B-5, 5.00% 2033 (put 2024) | | | 4,565 | | | | 5,383 | |
| Health and Educational Facs. Auth., Rev. Bonds (Ascension Health Alliance Senior Credit Group), Series 2019-A, 5.00% 2021 | | | 2,435 | | | | 2,610 | |
| Health and Educational Facs. Auth., Rev. Bonds (Children’s Hospital of Wisconsin, Inc.), Series 2008-B, 5.375% 2037 (preref. 2020) | | | 2,000 | | | | 2,003 | |
| Health and Educational Facs. Auth., Rev. Bonds (Marshfield Clinic Health System, Inc.), Series 2016-B, 5.00% 2026 | | | 1,000 | | | | 1,212 | |
| Health and Educational Facs. Auth., Rev. Bonds (Marshfield Clinic Health System, Inc.), Series 2016-B, 5.00% 2027 | | | 1,000 | | | | 1,205 | |
| Health and Educational Facs. Auth., Rev. Ref. Bonds (ProHealth Care, Inc. Obligated Group), Series 2015, 5.00% 2031 | | | 1,650 | | | | 1,898 | |
| Housing and Econ. Dev. Auth., Home Ownership Rev. Bonds, Series 2019-A, 4.25% 2049 | | | 18,015 | | | | 20,089 | |
| Other securities | | | | | | | 52,359 | |
| | | | | | | | 132,562 | |
| | | | | | | | | |
| Other states & U.S. territories 20.28% | | | | | | | | |
| Other securities | | | | | | | 933,677 | |
| | | | | | | | | |
| Total bonds, notes & other debt instruments (cost: $3,841,828,000) | | | | | | | 3,974,574 | |
| | | | | | | | | |
| Short-term securities 15.95% | | | | | | | | |
| State of Alaska, City of Valdez, Marine Terminal Rev. Ref. Bonds (Exxon Pipeline Co. Project), Series 1985, 1.19% 20251 | | | 14,000 | | | | 14,000 | |
| State of Alaska, City of Valdez, Marine Terminal Rev. Ref. Bonds (Exxon Pipeline Co. Project), Series 1993-B, 1.18% 20331 | | | 5,000 | | | | 5,000 | |
| State of California, Pollution Control Fncg. Auth., Solid Waste Disposal Rev. Ref. Bonds (Republic Services, Inc. Project), Series 2010-A, AMT, 1.45% 2023 (put 2020)2,3 | | | 18,600 | | | | 18,600 | |
| State of Florida, City of Gainesville, Utilities System Rev. Bonds, Series 2019-C, 1.18% 20471 | | | 12,500 | | | | 12,500 | |
| State of Louisiana, Parish of East Baton Rouge, Industrial Dev. Board, Gulf Opportunity Zone Rev. Bonds (ExxonMobil Project), Series 2010-B, 1.19% 20401 | | | 10,885 | | | | 10,885 | |
| State of Louisiana, Parish of East Baton Rouge, Industrial Dev. Board, Gulf Opportunity Zone Rev. Bonds (ExxonMobil Project), Series 2011, 1.19% 20511 | | | 5,120 | | | | 5,120 | |
| State of Louisiana, Parish of East Baton Rouge, Pollution Control Rev. Ref. Bonds (ExxonMobil Project), Series 1993, 1.19% 20221 | | | 23,470 | | | | 23,470 | |
| State of Louisiana, Parish of East Baton Rouge, Pollution Control Rev. Ref. Bonds (ExxonMobil Project), Series 2010-A, 1.19% 20351 | | | 1,500 | | | | 1,500 | |
| State of Louisiana, Public Facs. Auth., Rev. Bonds (Air Products and Chemicals Project), Series 2008, 1.18% 20431 | | | 3,490 | | | | 3,490 | |
| 14 | American Funds Tax-Exempt Funds |
Limited Term Tax-Exempt Bond Fund of America
| | Principal amount
(000) | | | Value
(000) | |
| State of Louisiana, Public Facs. Auth., Rev. Bonds (Air Products and Chemicals Project), Series 2008-A, 1.20% 20431 | | $ | 27,500 | | | $ | 27,500 | |
| State of Mississippi, Business Fin. Corp., Gulf Opportunity Zone Industrial Dev. Rev. Bonds (Chevron U.S.A. Inc. Project), Series 2007-A, 1.19% 20301 | | | 52,000 | | | | 52,000 | |
| State of Mississippi, Business Fin. Corp., Gulf Opportunity Zone Industrial Dev. Rev. Bonds (Chevron U.S.A. Inc. Project), Series 2007-D, 1.19% 20301 | | | 9,650 | | | | 9,650 | |
| State of Mississippi, Business Fin. Corp., Gulf Opportunity Zone Industrial Dev. Rev. Bonds (Chevron U.S.A. Inc. Project), Series 2007-E, 1.20% 20301 | | | 2,500 | | | | 2,500 | |
| State of Mississippi, Business Fin. Corp., Gulf Opportunity Zone Industrial Dev. Rev. Bonds (Chevron U.S.A. Inc. Project), Series 2009-D, 1.19% 20301 | | | 3,050 | | | | 3,050 | |
| State of Mississippi, Business Fin. Corp., Gulf Opportunity Zone Industrial Dev. Rev. Bonds (Chevron U.S.A. Inc. Project), Series 2010-G, 1.20% 20351 | | | 2,500 | | | | 2,500 | |
| State of Mississippi, Business Fin. Corp., Gulf Opportunity Zone Industrial Dev. Rev. Bonds (Chevron U.S.A. Inc. Project), Series 2010-J, 1.19% 20351 | | | 12,750 | | | | 12,750 | |
| State of New Hampshire, National Fin. Auth., Exempt Facs. Rev. Ref. Bonds (Emerald Renewable Diesel LLC Project), Series 2019, AMT, 2.00% 2049 (put 2020)2,3 | | | 15,200 | | | | 15,257 | |
| State of New York, Metropolitan Transportation Auth., Transportation Rev. Bond Anticipation Notes, Series 2018-B-1, 5.00% 5/15/2020 | | | 2,000 | | | | 2,022 | |
| State of New York, Metropolitan Transportation Auth., Transportation Rev. Bond Anticipation Notes, Series 2019-B-1, 5.00% 2022 | | | 1,750 | | | | 1,905 | |
| State of New York, Metropolitan Transportation Auth., Transportation Rev. Bond Anticipation Notes, Series 2019-D-1, 5.00% 2022 | | | 13,070 | | | | 14,343 | |
| State of New York, Metropolitan Transportation Auth., Transportation Rev. Bond Anticipation Notes, Series 2019-D-2, 4.00% 7/1/2020 | | | 4,000 | | | | 4,047 | |
| State of New York, Metropolitan Transportation Auth., Transportation Rev. Bond Anticipation Notes, Series 2020-A-2S, 4.00% 2022 | | | 18,765 | | | | 19,829 | |
| State of New York, New York City G.O. Bonds, Fiscal 2008, Series 2008-L-5, 1.18% 20351 | | | 16,315 | | | | 16,315 | |
| State of New York, New York City G.O. Bonds, Fiscal 2013, Series 2013-F-3, 1.18% 20421 | | | 46,345 | | | | 46,345 | |
| State of New York, New York City Municipal Water Fin. Auth., Water and Sewer System Second General Resolution Rev. Bonds, Fiscal 2007, Series 2006-CC-1, 0.94% 20381 | | | 10,000 | | | | 10,000 | |
| State of New York, New York City Municipal Water Fin. Auth., Water and Sewer System Second General Resolution Rev. Bonds, Fiscal 2011, Series 2011-FF-1, 1.18% 20441 | | | 2,500 | | | | 2,500 | |
| State of New York, New York City Municipal Water Fin. Auth., Water and Sewer System Second General Resolution Rev. Bonds, Fiscal 2014, Series 2013-AA-2, 1.18% 20501 | | | 12,000 | | | | 12,000 | |
| State of New York, New York City Municipal Water Fin. Auth., Water and Sewer System Second General Resolution Rev. Bonds, Fiscal 2016, Series 2016-AA-1, 1.18% 20481 | | | 7,150 | | | | 7,150 | |
| State of New York, New York City Transitional Fin. Auth., Future Tax Secured Bonds, Fiscal 2019, Series 2019-A-4, 1.18% 20451 | | | 24,000 | | | | 24,000 | |
| State of New York, New York City Transitional Fin. Auth., Future Tax Secured Rev. Ref. Bonds, Fiscal 2015, Series 2015-E-4, 1.18% 20451 | | | 3,000 | | | | 3,000 | |
| State of Ohio, Hospital Rev. Bonds (Cleveland Clinic Health System Obligated Group), Series 2019-F, 1.13% 20521 | | | 23,780 | | | | 23,780 | |
| State of Pennsylvania, Econ. Dev. Fncg. Auth., Solid Waste Disposal Rev. Bonds, (Republic Services, Inc. Project), Series 2014, AMT, 1.35% 2044 (put 2020)2 | | | 10,950 | | | | 10,954 | |
| State of Pennsylvania, Econ. Dev. Fncg. Auth., Solid Waste Disposal Rev. Bonds, (Waste Management, Inc. Project), Series 2013, AMT, 1.45% 2045 (put 2020)2 | | | 15,255 | | | | 15,255 | |
| State of South Carolina, Jobs-Econ. Dev. Auth., Hospital Rev. Bonds (Prisma Health Obligated Group), Series 2018-B, 1.15% 20481 | | | 47,875 | | | | 47,875 | |
| State of Texas, Gulf Coast Waste Disposal Auth., Pollution Control Rev. Ref. Bonds (Exxon Project), Series 1989, 1.19% 20241 | | | 2,000 | | | | 2,000 | |
| State of Texas, Gulf Coast Waste Disposal Auth., Pollution Control Rev. Ref. Bonds (Exxon Project), Series 1995, 1.19% 6/1/20201 | | | 14,800 | | | | 14,800 | |
| State of Texas, Lower Neches Valley Auth. Industrial Dev. Corp., Rev. Bonds (ExxonMobil Project), Series 2011, 1.17% 20381 | | | 24,595 | | | | 24,595 | |
| State of Wisconsin, Public Fin. Auth., Solid Waste Disposal Rev. Ref. Bonds (Waste Management, Inc. Project), Series 2017-A-1, AMT, 1.45% 2023 (put 2020)2 | | | 11,500 | | | | 11,500 | |
| State of Wisconsin, Public Fin. Auth., Solid Waste Disposal Rev. Ref. Bonds (Waste Management, Inc. Project), Series 2017-A-2, AMT, 1.53% 2025 (put 2020)2 | | | 4,000 | | | | 4,000 | |
| American Funds Tax-Exempt Funds | 15 |
Limited Term Tax-Exempt Bond Fund of America
| Short-term securities (continued) | Principal amount
(000) | | | Value
(000) | |
| State of Wyoming, County of Sublette, Pollution Control Rev. Ref. Bonds (ExxonMobil Project), Series 2014, 1.19% 20441 | | $ | 15,000 | | | $ | 15,000 | |
| State of Wyoming, County of Sublette, Pollution Control Rev. Ref. Bonds (ExxonMobil Project), Series 2014, AMT, 1.24% 20441 | | | 17,850 | | | | 17,850 | |
| Other securities | | | | | | | 163,521 | |
| | | | | | | | | |
| Total short-term securities (cost: $733,760,000) | | | | | | | 734,358 | |
| Total investment securities 102.29% (cost: $4,575,588,000) | | | | | | | 4,708,932 | |
| Other assets less liabilities (2.29)% | | | | | | | (105,428 | ) |
| | | | | | | | | |
| Net assets 100.00% | | | | | | $ | 4,603,504 | |
This summary investment portfolio is designed to streamline the report and help investors better focus on the fund’s principal holdings. See the inside back cover for details on how to obtain a complete schedule of portfolio holdings.
“Other securities” includes all issues that are not disclosed separately in the summary investment portfolio.
Futures contracts
| | | | | | | | | | | | | | | Unrealized | |
| | | | | | | | | | | | | | | appreciation | |
| | | | | | | | | Notional | | | Value at | | | (depreciation) | |
| | | | | Number of | | | | amount | 4 | | 1/31/2020 | 5 | | at 1/31/2020 | |
| Contracts | | Type | | contracts | | Expiration | | (000) | | | (000) | | | (000) | |
| 2 Year U.S. Treasury Note Futures | | Long | | 1,673 | | April 2020 | | $ | 334,600 | | | $ | 361,969 | | | | $ | 1,358 | |
| 5 Year U.S. Treasury Note Futures | | Long | | 2,438 | | April 2020 | | | 243,800 | | | | 293,341 | | | | | 3,637 | |
| 10 Year Ultra U.S. Treasury Note Futures | | Short | | 201 | | March 2020 | | | (20,100 | ) | | | (29,277 | ) | | | | (724 | ) |
| | | | | | | | | | | | | | | | | | $ | 4,271 | |
| 1 | Coupon rate may change periodically. Reference rate and spread are as of the most recent information available. Some coupon rates are determined by the issuer or agent based on current market conditions; therefore, the reference rate and spread are not available. For short-term securities, the date of the next scheduled coupon rate change is considered to be the maturity date. |
| 2 | For short-term securities, the mandatory put date is considered to be the maturity date. |
| 3 | Acquired in a transaction exempt from registration under Rule 144A of the Securities Act of 1933. May be resold in the U.S. in transactions exempt from registration, normally to qualified institutional buyers. The total value of all such securities, including those in “Other securities,” was $49,400,000, which represented 1.07% of the net assets of the fund. |
| 4 | Notional amount is calculated based on the number of contracts and notional contract size. |
| 5 | Value is calculated based on the notional amount and current market price. |
Key to abbreviations and symbol
Agcy. = Agency
AMT = Alternative Minimum Tax
Auth. = Authority
Certs. of Part. = Certificates of Participation
Dept. = Department
Dev. = Development
Dist. = District
Econ. = Economic
Fac. = Facility
Facs. = Facilities
Fin. = Finance
Fncg. = Financing
G.O. = General Obligation
IAM = Interest at Maturity
LIBOR = London Interbank Offered Rate
LOC = Letter of Credit
Preref. = Prerefunded
Redev. = Redevelopment
Ref. = Refunding
Rev. = Revenue
SIFMA = Securities Industry and Financial Markets Association
USD/$ = U.S. dollars
See notes to financial statements.
| 16 | American Funds Tax-Exempt Funds |
| The Tax-Exempt Bond Fund of America | unaudited |
| Summary investment portfolioJanuary 31, 2020 | |
| Portfolio quality summary* | Percent of net assets |
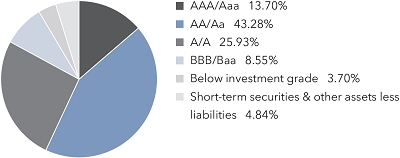
| * | Bond ratings, which typically range from AAA/Aaa (highest) to D (lowest), are assigned by credit rating agencies such as Standard & Poor’s, Moody’s and/or Fitch as an indication of an issuer’s creditworthiness. In assigning a credit rating to a security, the fund looks specifically to the ratings assigned to the issuer of the security by Standard & Poor’s, Moody’s and/or Fitch. If agency ratings differ, the security will be considered to have received the highest of those ratings, consistent with the fund’s investment policies. |
| Bonds, notes & other debt instruments 95.16% | Principal amount
(000) | | | Value
(000) | |
| Alabama 1.07% | | | | | | | | |
| Black Belt Energy Gas Dist., Gas Supply Rev. Bonds, Series 2017-A, 4.00% 2047 (put 2022) | | $ | 38,750 | | | $ | 41,332 | |
| Other securities | | | | | | | 220,581 | |
| | | | | | | | 261,913 | |
| | | | | | | | | |
| California 6.21% | | | | | | | | |
| G.O. Rev. Ref. Bonds, Series 2007, Assured Guaranty Municipal insured, 5.25% 2032 | | | 39,545 | | | | 56,349 | |
| Health Facs. Fncg. Auth., Rev. Bonds (Kaiser Permanente), Series 2017-A-2, 5.00% 2047 | | | 36,640 | | | | 57,599 | |
| Other securities | | | | | | | 1,402,644 | |
| | | | | | | | 1,516,592 | |
| | | | | | | | | |
| Colorado 2.34% | | | | | | | | |
| Health Facs. Auth., Health Care Facs. Rev. Bonds (American Baptist Homes of the Midwest Obligated Group), Series 2013, 8.00% 2043 | | | 6,300 | | | | 7,152 | |
| Health Facs. Auth., Health Facs. Rev. and Rev. Ref. Bonds (Evangelical Lutheran Good Samaritan Society Project), Series 2015-A, 5.00% 2023 (escrowed to maturity) | | | 2,000 | | | | 2,269 | |
| Health Facs. Auth., Health Facs. Rev. and Rev. Ref. Bonds (Evangelical Lutheran Good Samaritan Society Project), Series 2015-A, 5.00% 2026 (preref. 2025) | | | 100 | | | | 121 | |
| Health Facs. Auth., Health Facs. Rev. and Rev. Ref. Bonds (Evangelical Lutheran Good Samaritan Society Project), Series 2015-A, 5.00% 2029 | | | 1,500 | | | | 1,817 | |
| Health Facs. Auth., Health Facs. Rev. and Rev. Ref. Bonds (Evangelical Lutheran Good Samaritan Society Project), Series 2015-A, 5.00% 2030 (preref. 2025) | | | 2,190 | | | | 2,653 | |
| Health Facs. Auth., Health Facs. Rev. and Rev. Ref. Bonds (Evangelical Lutheran Good Samaritan Society Project), Series 2015-A, 5.00% 2031 | | | 3,250 | | | | 3,938 | |
| Health Facs. Auth., Health Facs. Rev. and Rev. Ref. Bonds (Evangelical Lutheran Good Samaritan Society Project), Series 2015-A, 5.00% 2032 | | | 1,000 | | | | 1,212 | |
| Health Facs. Auth., Health Facs. Rev. and Rev. Ref. Bonds (Evangelical Lutheran Good Samaritan Society Project), Series 2015-A, 5.00% 2033 | | | 1,600 | | | | 1,938 | |
| Health Facs. Auth., Health Facs. Rev. and Rev. Ref. Bonds (Evangelical Lutheran Good Samaritan Society Project), Series 2015-A, 5.00% 2040 | | | 2,500 | | | | 3,029 | |
| Health Facs. Auth., Health Facs. Rev. and Rev. Ref. Bonds (Evangelical Lutheran Good Samaritan Society Project), Series 2015-A, 5.00% 2045 (preref. 2025) | | | 5,500 | | | | 6,663 | |
| Health Facs. Auth., Health Facs. Rev. and Rev. Ref. Bonds (Evangelical Lutheran Good Samaritan Society Project), Series 2017, 5.00% 2032 | | | 3,460 | | | | 4,427 | |
| Health Facs. Auth., Health Facs. Rev. and Rev. Ref. Bonds (Evangelical Lutheran Good Samaritan Society Project), Series 2017, 5.00% 2033 | | | 6,910 | | | | 8,841 | |
| Health Facs. Auth., Health Facs. Rev. and Rev. Ref. Bonds (Evangelical Lutheran Good Samaritan Society Project), Series 2017, 5.00% 2037 (preref. 2027) | | | 2,020 | | | | 2,584 | |
| Health Facs. Auth., Health Facs. Rev. Bonds (Evangelical Lutheran Good Samaritan Society Project), Series 2012, 5.00% 2033 (preref. 2022) | | | 6,175 | | | | 6,759 | |
| Health Facs. Auth., Health Facs. Rev. Bonds (Evangelical Lutheran Good Samaritan Society Project), Series 2012, 5.00% 2042 (preref. 2022) | | | 29,780 | | | | 32,597 | |
| Health Facs. Auth., Health Facs. Rev. Bonds (Evangelical Lutheran Good Samaritan Society Project), Series 2013, 5.625% 2043 (preref. 2023) | | | 2,485 | | | | 2,870 | |
| American Funds Tax-Exempt Funds | 17 |
The Tax-Exempt Bond Fund of America
| Bonds, notes & other debt instruments(continued) | Principal amount
(000) | | | Value
(000) | |
| Colorado (continued) | | | | | | | | |
| Health Facs. Auth., Hospital Rev. Bonds (Adventist Health System/Sunbelt Obligated Group), Series 2016-A, 5.00% 2041 | | $ | 3,130 | | | $ | 3,719 | |
| Health Facs. Auth., Hospital Rev. Bonds (Adventist Health System/Sunbelt Obligated Group), Series 2016-C, 5.00% 2036 (put 2026) | | | 6,200 | | | | 7,752 | |
| Health Facs. Auth., Hospital Rev. Bonds (Adventist Health System/Sunbelt Obligated Group), Series 2018-A, 5.00% 2048 | | | 11,855 | | | | 14,422 | |
| Health Facs. Auth., Hospital Rev. Bonds (Adventist Health System/Sunbelt Obligated Group), Series 2018-B, 5.00% 2048 (put 2025) | | | 22,500 | | | | 27,469 | |
| Health Facs. Auth., Hospital Rev. Bonds (Children’s Hospital Colorado Project), Series 2013-A, 5.00% 2033 | | | 12,000 | | | | 13,615 | |
| Health Facs. Auth., Hospital Rev. Ref. Bonds (Valley View Hospital Association Project), Series 2018, 2.80% 2042 (put 2023) | | | 3,800 | | | | 3,955 | |
| Health Facs. Auth., Rev. Bonds (Catholic Health Initiatives), Series 2009-B-1, 5.00% 2027 (preref. 2022) | | | 1,000 | | | | 1,109 | |
| Health Facs. Auth., Rev. Bonds (Catholic Health Initiatives), Series 2015-C-4, (1-month USD-LIBOR + 1.25%) 2.46% 2039 (put 2020)1 | | | 5,000 | | | | 5,010 | |
| Health Facs. Auth., Rev. Bonds (CommonSpirit Health), Series 2019-B-2, 4.00% 2049 | | | 2,000 | | | | 2,224 | |
| Health Facs. Auth., Rev. Bonds (Covenant Retirement Communities, Inc.), Series 2018, 5.00% 2048 | | | 1,050 | | | | 1,236 | |
| Health Facs. Auth., Rev. Bonds (Senior Residences Project), Series 2012, 7.00% 20422 | | | 2,500 | | | | 1,651 | |
| Health Facs. Auth., Rev. Bonds (Senior Residences Project), Series 2012, 7.125% 20472 | | | 2,665 | | | | 1,758 | |
| Health Facs. Auth., Rev. Bonds (Total Longterm Care National Obligated Group Project), Series 2011, 5.00% 2021 (escrowed to maturity) | | | 235 | | | | 246 | |
| Health Facs. Auth., Rev. Ref. and Improvement Bonds (Christian Living Neighborhoods Project), Series 2019, 4.00% 2024 | | | 270 | | | | 291 | |
| Health Facs. Auth., Rev. Ref. and Improvement Bonds (Christian Living Neighborhoods Project), Series 2019, 4.00% 2023 | | | 610 | | | | 646 | |
| Health Facs. Auth., Rev. Ref. and Improvement Bonds (Frasier Meadows Retirement Community Project), Series 2017-A, 5.25% 2028 | | | 305 | | | | 364 | |
| Health Facs. Auth., Rev. Ref. and Improvement Bonds (Frasier Meadows Retirement Community Project), Series 2017-A, 5.25% 2037 | | | 500 | | | | 579 | |
| Health Facs. Auth., Rev. Ref. Bonds (Christian Living Neighborhoods Project), Series 2016, 5.00% 2025 | | | 565 | | | | 638 | |
| Health Facs. Auth., Rev. Ref. Bonds (Covenant Retirement Communities, Inc.), Series 2012-A, 5.00% 2033 | | | 8,765 | | | | 9,517 | |
| Health Facs. Auth., Rev. Ref. Bonds (Covenant Retirement Communities, Inc.), Series 2013-A, 5.50% 2028 | | | 1,050 | | | | 1,207 | |
| Health Facs. Auth., Rev. Ref. Bonds (Covenant Retirement Communities, Inc.), Series 2013-A, 5.75% 2036 | | | 4,010 | | | | 4,628 | |
| Health Facs. Auth., Rev. Ref. Bonds (Covenant Retirement Communities, Inc.), Series 2015-A, 5.00% 2022 | | | 470 | | | | 518 | |
| Health Facs. Auth., Rev. Ref. Bonds (Covenant Retirement Communities, Inc.), Series 2015-A, 5.00% 2028 | | | 1,065 | | | | 1,243 | |
| Health Facs. Auth., Rev. Ref. Bonds (Covenant Retirement Communities, Inc.), Series 2015-A, 5.00% 2035 | | | 3,500 | | | | 4,010 | |
| Health Facs. Auth., Rev. Ref. Bonds (Sisters of Charity of Leavenworth Health System), Series 2013-A, 5.00% 2044 | | | 10,000 | | | | 11,187 | |
| Health Facs. Auth., Rev. Ref. Bonds (Sisters of Charity of Leavenworth Health System), Series 2019-A, 4.00% 2036 | | | 5,750 | | | | 6,741 | |
| Health Facs. Auth., Rev. Ref. Bonds (Sisters of Charity of Leavenworth Health System), Series 2019-A, 4.00% 2037 | | | 4,000 | | | | 4,663 | |
| Health Facs. Auth., Rev. Ref. Bonds (Sisters of Charity of Leavenworth Health System), Series 2019-A, 4.00% 2038 | | | 5,800 | | | | 6,743 | |
| Health Facs. Auth., Rev. Ref. Bonds (Sisters of Charity of Leavenworth Health System), Series 2019-A, 5.00% 2032 | | | 4,000 | | | | 5,281 | |
| Health Facs. Auth., Rev. Ref. Bonds (Sisters of Charity of Leavenworth Health System), Series 2019-B, 4.00% 2040 | | | 29,570 | | | | 34,206 | |
| Other securities | | | | | | | 305,286 | |
| | | | | | | | 570,784 | |
| 18 | American Funds Tax-Exempt Funds |
The Tax-Exempt Bond Fund of America
| | Principal amount
(000) | | | Value
(000) | |
| Florida 6.45% | | | | | | | | |
| Central Florida Expressway Auth., Rev. Bonds, Series 2019-B, 5.00% 2044 | | $ | 32,000 | | | $ | 39,945 | |
| County of Miami-Dade, Water and Sewer System Rev. Ref. Bonds, Series 2019-B, 4.00% 2049 | | | 38,000 | | | | 43,464 | |
| Tampa-Hillsborough County Expressway Auth., Rev. Ref. Bonds, Series 2017-B, 4.00% 2042 | | | 49,670 | | | | 56,154 | |
| Other securities | | | | | | | 1,437,245 | |
| | | | | | | | 1,576,808 | |
| | | | | | | | | |
| Georgia 2.59% | | | | | | | | |
| City of Atlanta, Airport Passenger Fac. Charge and General Rev. Bonds, Series 2019-C, 5.00% 2039 | | | 30,530 | | | | 38,888 | |
| Municipal Electric Auth., Plant Vogtle Units 3 and 4 Project J Bonds, Series 2019-A, 5.00% 2049 | | | 73,560 | | | | 86,420 | |
| Other securities | | | | | | | 506,544 | |
| | | | | | | | 631,852 | |
| | | | | | | | | |
| Illinois 12.94% | | | | | | | | |
| Build Illinois Bonds, Sales Tax Rev. Bonds, Series 2002, FGIC-National insured, 6.00% 2023 | | | 1,000 | | | | 1,137 | |
| Build Illinois Bonds, Sales Tax Rev. Bonds, Series 2010, 5.00% 2021 | | | 5,750 | | | | 5,999 | |
| Build Illinois Bonds, Sales Tax Rev. Bonds, Series 2018-B, 5.00% 2033 | | | 3,500 | | | | 4,153 | |
| Build Illinois Bonds, Sales Tax Rev. Ref. Bonds, Series 2010, 5.00% 2020 | | | 5,200 | | | | 5,265 | |
| Build Illinois Bonds, Sales Tax Rev. Ref. Bonds, Series 2013, 5.00% 2026 | | | 11,040 | | | | 12,137 | |
| Build Illinois Bonds, Sales Tax Rev. Ref. Bonds, Series 2016-C, 4.00% 2024 | | | 3,070 | | | | 3,345 | |
| Build Illinois Bonds, Sales Tax Rev. Ref. Bonds, Series 2016-C, 4.00% 2027 | | | 13,430 | | | | 15,094 | |
| Build Illinois Bonds, Sales Tax Rev. Ref. Bonds, Series 2016-D, 5.00% 2025 | | | 2,135 | | | | 2,477 | |
| Build Illinois Bonds, Sales Tax Rev. Ref. Bonds, Series 2016-D, 5.00% 2026 | | | 1,010 | | | | 1,199 | |
| Build Illinois Bonds, Sales Tax Rev. Ref. Bonds, Series 2016-D, 5.00% 2027 | | | 1,275 | | | | 1,509 | |
| Build Illinois Bonds, Sales Tax Rev. Ref. Bonds, Series 2016-D, 5.00% 2029 | | | 7,000 | | | | 8,203 | |
| City of Chicago, Board of Education, Unlimited Tax G.O. Bonds (Dedicated Rev.), Series 2011-A, 5.50% 2039 | | | 50 | | | | 53 | |
| City of Chicago, Board of Education, Unlimited Tax G.O. Bonds (Dedicated Rev.), Series 2015-C, 5.25% 2039 | | | 5,000 | | | | 5,624 | |
| City of Chicago, Board of Education, Unlimited Tax G.O. Bonds (Dedicated Rev.), Series 2016-B, 6.50% 2046 | | | 1,350 | | | | 1,664 | |
| City of Chicago, Board of Education, Unlimited Tax G.O. Bonds (Dedicated Rev.), Series 2017-A, 7.00% 20463 | | | 21,050 | | | | 27,326 | |
| City of Chicago, Board of Education, Unlimited Tax G.O. Bonds (Dedicated Rev.), Series 2017-F, 5.00% 2020 | | | 2,000 | | | | 2,053 | |
| City of Chicago, Board of Education, Unlimited Tax G.O. Bonds (Dedicated Rev.), Series 2018-D, 5.00% 2046 | | | 6,000 | | | | 7,008 | |
| City of Chicago, Board of Education, Unlimited Tax G.O. Rev. Ref. Bonds (Dedicated Rev.), Capital Appreciation Bonds, Series 1998-B-1, FGIC insured, 0% 2028 | | | 5,695 | | | | 4,638 | |
| City of Chicago, Board of Education, Unlimited Tax G.O. Rev. Ref. Bonds (Dedicated Rev.), Series 2005-A, AMBAC insured, 5.50% 2024 | | | 3,000 | | | | 3,490 | |
| City of Chicago, Board of Education, Unlimited Tax G.O. Rev. Ref. Bonds (Dedicated Rev.), Series 2017-B, 7.00% 20423 | | | 13,115 | | | | 17,126 | |
| City of Chicago, Board of Education, Unlimited Tax G.O. Rev. Ref. Bonds (Dedicated Rev.), Series 2017-C, 5.00% 2020 | | | 5,865 | | | | 6,022 | |
| City of Chicago, Board of Education, Unlimited Tax G.O. Rev. Ref. Bonds (Dedicated Rev.), Series 2017-C, 5.00% 2021 | | | 3,000 | | | | 3,169 | |
| City of Chicago, Board of Education, Unlimited Tax G.O. Rev. Ref. Bonds (Dedicated Rev.), Series 2017-C, 5.00% 2023 | | | 1,000 | | | | 1,114 | |
| City of Chicago, Board of Education, Unlimited Tax G.O. Rev. Ref. Bonds (Dedicated Rev.), Series 2017-C, 5.00% 2025 | | | 1,000 | | | | 1,169 | |
| City of Chicago, Board of Education, Unlimited Tax G.O. Rev. Ref. Bonds (Dedicated Rev.), Series 2017-C, 5.00% 2026 | | | 7,070 | | | | 8,421 | |
| City of Chicago, Board of Education, Unlimited Tax G.O. Rev. Ref. Bonds (Dedicated Rev.), Series 2017-C, 5.00% 2027 | | | 3,500 | | | | 4,222 | |
| City of Chicago, Board of Education, Unlimited Tax G.O. Rev. Ref. Bonds (Dedicated Rev.), Series 2017-C, 5.00% 2030 | | | 10,000 | | | | 11,960 | |
| City of Chicago, Board of Education, Unlimited Tax G.O. Rev. Ref. Bonds (Dedicated Rev.), Series 2017-C, 5.00% 2034 | | | 11,000 | | | | 13,022 | |
| City of Chicago, Board of Education, Unlimited Tax G.O. Rev. Ref. Bonds (Dedicated Rev.), Series 2017-D, 5.00% 2021 | | | 1,300 | | | | 1,373 | |
| American Funds Tax-Exempt Funds | 19 |
The Tax-Exempt Bond Fund of America
| Bonds, notes & other debt instruments(continued) | Principal amount
(000) | | | Value
(000) | |
| Illinois (continued) | | | | | | | | |
| City of Chicago, Board of Education, Unlimited Tax G.O. Rev. Ref. Bonds (Dedicated Rev.), Series 2017-D, 5.00% 2031 | | $ | 4,000 | | | $ | 4,770 | |
| City of Chicago, Board of Education, Unlimited Tax G.O. Rev. Ref. Bonds (Dedicated Rev.), Series 2017-G, 5.00% 2034 | | | 10,000 | | | | 11,838 | |
| City of Chicago, Board of Education, Unlimited Tax G.O. Rev. Ref. Bonds (Dedicated Rev.), Series 2017-G, 5.00% 2044 | | | 1,000 | | | | 1,156 | |
| City of Chicago, Board of Education, Unlimited Tax G.O. Rev. Ref. Bonds (Dedicated Rev.), Series 2017-H, 5.00% 2036 | | | 2,000 | | | | 2,355 | |
| City of Chicago, Board of Education, Unlimited Tax G.O. Rev. Ref. Bonds (Dedicated Rev.), Series 2017-H, 5.00% 2046 | | | 20,000 | | | | 23,061 | |
| City of Chicago, Board of Education, Unlimited Tax G.O. Rev. Ref. Bonds (Dedicated Rev.), Series 2018-A, Assured Guaranty Municipal insured, 4.00% 2020 | | | 2,250 | | | | 2,292 | |
| City of Chicago, Board of Education, Unlimited Tax G.O. Rev. Ref. Bonds (Dedicated Rev.), Series 2018-A, Assured Guaranty Municipal insured, 5.00% 2025 | | | 1,500 | | | | 1,776 | |
| City of Chicago, Board of Education, Unlimited Tax G.O. Rev. Ref. Bonds (Dedicated Rev.), Series 2018-A, Assured Guaranty Municipal insured, 5.00% 2026 | | | 3,000 | | | | 3,573 | |
| City of Chicago, Board of Education, Unlimited Tax G.O. Rev. Ref. Bonds (Dedicated Rev.), Series 2018-A, Assured Guaranty Municipal insured, 5.00% 2027 | | | 1,500 | | | | 1,810 | |
| City of Chicago, Board of Education, Unlimited Tax G.O. Rev. Ref. Bonds (Dedicated Rev.), Series 2018-A, Assured Guaranty Municipal insured, 5.00% 2028 | | | 3,500 | | | | 4,381 | |
| City of Chicago, Board of Education, Unlimited Tax G.O. Rev. Ref. Bonds (Dedicated Rev.), Series 2018-A, Assured Guaranty Municipal insured, 5.00% 2029 | | | 1,000 | | | | 1,222 | |
| City of Chicago, Board of Education, Unlimited Tax G.O. Rev. Ref. Bonds (Dedicated Rev.), Series 2018-A, Assured Guaranty Municipal insured, 5.00% 2030 | | | 1,000 | | | | 1,238 | |
| City of Chicago, Board of Education, Unlimited Tax G.O. Rev. Ref. Bonds (Dedicated Rev.), Series 2018-A, Assured Guaranty Municipal insured, 5.00% 2030 | | | 1,000 | | | | 1,215 | |
| City of Chicago, Board of Education, Unlimited Tax G.O. Rev. Ref. Bonds (Dedicated Rev.), Series 2018-A, Assured Guaranty Municipal insured, 5.00% 2031 | | | 2,000 | | | | 2,469 | |
| City of Chicago, Board of Education, Unlimited Tax G.O. Rev. Ref. Bonds (Dedicated Rev.), Series 2018-A, Assured Guaranty Municipal insured, 5.00% 2032 | | | 2,000 | | | | 2,462 | |
| City of Chicago, Board of Education, Unlimited Tax G.O. Rev. Ref. Bonds (Dedicated Rev.), Series 2018-A, Assured Guaranty Municipal insured, 5.00% 2034 | | | 1,140 | | | | 1,371 | |
| City of Chicago, Board of Education, Unlimited Tax G.O. Rev. Ref. Bonds (Dedicated Rev.), Series 2018-A, Assured Guaranty Municipal insured, 5.00% 2035 | | | 1,000 | | | | 1,199 | |
| City of Chicago, Board of Education, Unlimited Tax G.O. Rev. Ref. Bonds (Dedicated Rev.), Series 2018-C, Assured Guaranty Municipal insured, 5.00% 2020 | | | 1,520 | | | | 1,561 | |
| City of Chicago, Board of Education, Unlimited Tax G.O. Rev. Ref. Bonds (Dedicated Rev.), Series 2018-C, Assured Guaranty Municipal insured, 5.00% 2023 | | | 6,000 | | | | 6,683 | |
| City of Chicago, Board of Education, Unlimited Tax G.O. Rev. Ref. Bonds (Dedicated Rev.), Series 2018-C, Assured Guaranty Municipal insured, 5.00% 2028 | | | 13,455 | | | | 16,840 | |
| City of Chicago, Board of Education, Unlimited Tax G.O. Rev. Ref. Bonds (Dedicated Rev.), Series 2018-C, Assured Guaranty Municipal insured, 5.00% 2029 | | | 7,000 | | | | 8,714 | |
| City of Chicago, G.O. Bonds (Neighborhoods Alive 21 Program), Series 2002-B, 5.00% 2024 | | | 1,285 | | | | 1,441 | |
| City of Chicago, G.O. Bonds, Series 2003-B, 5.00% 2024 | | | 2,000 | | | | 2,243 | |
| City of Chicago, G.O. Bonds, Series 2007-C, National insured, 5.00% 2029 | | | 890 | | | | 892 | |
| City of Chicago, G.O. Bonds, Series 2015-A, 5.25% 2028 | | | 2,000 | | | | 2,313 | |
| City of Chicago, G.O. Bonds, Series 2015-A, 5.50% 2033 | | | 3,000 | | | | 3,486 | |
| City of Chicago, G.O. Bonds, Series 2019-A, 5.00% 2044 | | | 5,000 | | | | 5,876 | |
| City of Chicago, G.O. Bonds, Series 2019-A, 5.50% 2035 | | | 2,000 | | | | 2,507 | |
| City of Chicago, G.O. Project and Rev. Ref. Bonds, Series 2003-B, 5.00% 2022 | | | 1,320 | | | | 1,407 | |
| City of Chicago, G.O. Project and Rev. Ref. Bonds, Series 2003-B, 5.00% 2026 | | | 1,795 | | | | 2,068 | |
| City of Chicago, G.O. Project and Rev. Ref. Bonds, Series 2005-D, 5.50% 2034 | | | 3,675 | | | | 4,267 | |
| City of Chicago, G.O. Project and Rev. Ref. Bonds, Series 2014-A, 5.00% 2023 | | | 825 | | | | 903 | |
| City of Chicago, G.O. Project and Rev. Ref. Bonds, Series 2014-A, 5.25% 2030 | | | 5,490 | | | | 6,174 | |
| City of Chicago, G.O. Project and Rev. Ref. Bonds, Series 2017-A, 5.625% 2029 | | | 5,755 | | | | 7,091 | |
| City of Chicago, G.O. Project and Rev. Ref. Bonds, Series 2017-A, 5.625% 2030 | | | 3,000 | | | | 3,681 | |
| City of Chicago, G.O. Project and Rev. Ref. Bonds, Series 2017-A, 6.00% 2038 | | | 20,000 | | | | 24,726 | |
| City of Chicago, G.O. Rev. Ref. Bonds, Series 2008-C, 5.00% 2034 | | | 1,120 | | | | 1,122 | |
| City of Chicago, G.O. Rev. Ref. Bonds, Series 2009-A, Assured Guaranty Municipal insured, 5.00% 2026 | | | 4,750 | | | | 4,759 | |
| City of Chicago, G.O. Rev. Ref. Bonds, Series 2015-C, 5.00% 2024 | | | 5,020 | | | | 5,630 | |
| City of Chicago, G.O. Rev. Ref. Bonds, Series 2015-C, 5.00% 2025 | | | 4,000 | | | | 4,589 | |
| City of Chicago, G.O. Rev. Ref. Bonds, Series 2015-C, 5.00% 2027 | | | 2,000 | | | | 2,340 | |
| 20 | American Funds Tax-Exempt Funds |
The Tax-Exempt Bond Fund of America
| | Principal amount
(000) | | | Value
(000) | |
| City of Chicago, G.O. Rev. Ref. Bonds, Series 2015-C, 5.00% 2038 | | $ | 4,730 | | | $ | 5,374 | |
| City of Chicago, G.O. Rev. Ref. Bonds, Series 2020-A, 5.00% 2025 | | | 5,000 | | | | 5,736 | |
| City of Chicago, G.O. Rev. Ref. Bonds, Series 2020-A, 5.00% 2026 | | | 5,000 | | | | 5,856 | |
| City of Chicago, G.O. Rev. Ref. Bonds, Series 2020-A, 5.00% 2028 | | | 8,000 | | | | 9,689 | |
| City of Chicago, G.O. Rev. Ref. Bonds, Series 2020-A, 5.00% 2029 | | | 11,450 | | | | 14,087 | |
| City of Chicago, G.O. Rev. Ref. Bonds, Series 2020-A, 5.00% 2030 | | | 4,000 | | | | 4,984 | |
| City of Chicago, O’Hare International Airport, General Airport Rev. Bonds, Series 2018-B, 5.00% 2053 | | | 35,025 | | | | 42,843 | |
| City of Chicago, School Reform Board of Trustees of the Board of Education, Unlimited Tax G.O. Bonds (Dedicated Tax Rev.), Capital Appreciation Bonds, Series 1998-B-1, National insured, 0% 2022 | | | 3,185 | | | | 3,032 | |
| City of Chicago, School Reform Board of Trustees of the Board of Education, Unlimited Tax G.O. Bonds (Dedicated Tax Rev.), Capital Appreciation Bonds, Series 1998-B-1, National insured, 0% 2031 | | | 7,175 | | | | 5,271 | |
| City of Chicago, School Reform Board of Trustees of the Board of Education, Unlimited Tax G.O. Bonds (Dedicated Tax Rev.), Capital Appreciation Bonds, Series 1999-A, National insured, 0% 2022 | | | 2,285 | | | | 2,175 | |
| City of Chicago, School Reform Board of Trustees of the Board of Education, Unlimited Tax G.O. Bonds (Dedicated Tax Rev.), Capital Appreciation Bonds, Series 1999-A, National insured, 0% 2023 | | | 2,625 | | | | 2,446 | |
| City of Chicago, School Reform Board of Trustees of the Board of Education, Unlimited Tax G.O. Bonds (Dedicated Tax Rev.), Capital Appreciation Bonds, Series 1999-A, National insured, 0% 2029 | | | 5,240 | | | | 4,123 | |
| City of Chicago, School Reform Board of Trustees of the Board of Education, Unlimited Tax G.O. Bonds (Dedicated Tax Rev.), Capital Appreciation Bonds, Series 1999-A, National insured, 0% 2031 | | | 4,000 | | | | 2,938 | |
| City of Chicago, School Reform Board of Trustees of the Board of Education, Unlimited Tax G.O. Bonds (Dedicated Tax Rev.), Series 2012-A, 5.00% 2042 | | | 9,815 | | | | 10,628 | |
| City of Chicago, School Reform Board of Trustees of the Board of Education, Unlimited Tax G.O. Bonds (Dedicated Tax Rev.), Series 2016-A, 7.00% 2044 | | | 21,945 | | | | 27,068 | |
| City of Chicago, Transit Auth., Sales Tax Receipts Rev. Bonds, Series 2017, Assured Guaranty Municipal insured, 5.00% 2051 | | | 33,585 | | | | 39,044 | |
| City of Chicago, Wastewater Transmission Rev. Bonds, Series 2012, 5.00% 2042 | | | 7,775 | | | | 8,217 | |
| City of Chicago, Wastewater Transmission Rev. Ref. Bonds, Capital Appreciation Bonds, Series 1998-A, National insured, 0% 2025 | | | 210 | | | | 192 | |
| City of Chicago, Wastewater Transmission Rev. Ref. Bonds, Capital Appreciation Bonds, Series 1998-A, National insured, 0% 2026 | | | 20 | | | | 18 | |
| City of Chicago, Wastewater Transmission Rev. Ref. Bonds, Capital Appreciation Bonds, Series 1998-A, National insured, 0% 2027 | | | 1,760 | | | | 1,529 | |
| City of Chicago, Wastewater Transmission Rev. Ref. Bonds, Capital Appreciation Bonds, Series 1998-A, National insured, 0% 2028 | | | 3,345 | | | | 2,812 | |
| City of Chicago, Wastewater Transmission Rev. Ref. Bonds, Series 2001, Assured Guaranty Municipal insured, 5.50% 2030 | | | 800 | | | | 1,014 | |
| City of Chicago, Wastewater Transmission Rev. Ref. Bonds, Series 2008-C, 5.00% 2021 | | | 1,000 | | | | 1,034 | |
| City of Chicago, Wastewater Transmission Rev. Ref. Bonds, Series 2008-C, 5.00% 2023 | | | 1,975 | | | | 2,183 | |
| City of Chicago, Wastewater Transmission Rev. Ref. Bonds, Series 2008-C, 5.00% 2024 | | | 2,500 | | | | 2,841 | |
| City of Chicago, Wastewater Transmission Rev. Ref. Bonds, Series 2008-C, 5.00% 2025 | | | 4,500 | | | | 5,241 | |
| City of Chicago, Wastewater Transmission Rev. Ref. Bonds, Series 2008-C, 5.00% 2027 | | | 1,000 | | | | 1,156 | |
| City of Chicago, Wastewater Transmission Rev. Ref. Bonds, Series 2008-C, 5.00% 2030 | | | 1,000 | | | | 1,144 | |
| City of Chicago, Wastewater Transmission Rev. Ref. Bonds, Series 2008-C, 5.00% 2031 | | | 2,500 | | | | 2,848 | |
| City of Chicago, Wastewater Transmission Rev. Ref. Bonds, Series 2008-C, 5.00% 2032 | | | 3,000 | | | | 3,410 | |
| City of Chicago, Wastewater Transmission Rev. Ref. Bonds, Series 2008-C, 5.00% 2033 | | | 2,000 | | | | 2,269 | |
| City of Chicago, Wastewater Transmission Rev. Ref. Bonds, Series 2008-C, 5.00% 2039 | | | 1,000 | | | | 1,121 | |
| City of Chicago, Wastewater Transmission Rev. Ref. Bonds, Series 2014, 5.00% 2023 | | | 100 | | | | 111 | |
| City of Chicago, Wastewater Transmission Rev. Ref. Bonds, Series 2017-A, 5.00% 2047 | | | 21,165 | | | | 24,174 | |
| City of Chicago, Wastewater Transmission Rev. Ref. Bonds, Series 2017-B, 5.00% 2031 | | | 5,000 | | | | 5,949 | |
| City of Chicago, Wastewater Transmission Rev. Ref. Bonds, Series 2017-B, 5.00% 2032 | | | 7,600 | | | | 9,022 | |
| City of Chicago, Wastewater Transmission Rev. Ref. Bonds, Series 2017-B, 5.00% 2034 | | | 9,000 | | | | 10,640 | |
| City of Chicago, Wastewater Transmission Rev. Ref. Bonds, Series 2017-B, 5.00% 2038 | | | 3,915 | | | | 4,557 | |
| City of Chicago, Water Rev. Bonds, Series 2004, 5.00% 2023 | | | 1,750 | | | | 1,980 | |
| City of Chicago, Water Rev. Bonds, Series 2004, 5.00% 2024 | | | 1,000 | | | | 1,161 | |
| City of Chicago, Water Rev. Bonds, Series 2004, 5.00% 2025 | | | 10,275 | | | | 12,259 | |
| City of Chicago, Water Rev. Bonds, Series 2004, 5.00% 2026 | | | 2,125 | | | | 2,593 | |
| City of Chicago, Water Rev. Bonds, Series 2012, 4.00% 2020 | | | 625 | | | | 638 | |
| American Funds Tax-Exempt Funds | 21 |
The Tax-Exempt Bond Fund of America
| Bonds, notes & other debt instruments(continued) | Principal amount
(000) | | | Value
(000) | |
| Illinois (continued) | | | | | | | | |
| City of Chicago, Water Rev. Bonds, Series 2012, 5.00% 2026 | | $ | 965 | | | $ | 1,061 | |
| City of Chicago, Water Rev. Bonds, Series 2014, 5.00% 2022 | | | 530 | | | | 583 | |
| City of Chicago, Water Rev. Bonds, Series 2014, 5.00% 2030 | | | 4,750 | | | | 5,443 | |
| City of Chicago, Water Rev. Bonds, Series 2014, 5.00% 2031 | | | 5,135 | | | | 5,873 | |
| City of Chicago, Water Rev. Ref. Bonds, Series 2012, 5.00% 2042 | | | 21,875 | | | | 23,566 | |
| City of Chicago, Water Rev. Ref. Bonds, Series 2014, 5.00% 2039 | | | 7,500 | | | | 8,465 | |
| City of Chicago, Water Rev. Ref. Bonds, Series 2014, 5.00% 2044 | | | 3,000 | | | | 3,365 | |
| Civic Center Bonds, Special State Obligation Bonds, Series 1991, AMBAC insured, 6.25% 2020 | | | 920 | | | | 946 | |
| Fin. Auth., Academic Fac. Lease Rev. Bonds (Provident Group - UIUC Properties LLC - University of Illinois at Urbana-Champaign Project), Series 2019-A, 5.00% 2032 | | | 580 | | | | 738 | |
| Fin. Auth., Academic Fac. Lease Rev. Bonds (Provident Group - UIUC Properties LLC - University of Illinois at Urbana-Champaign Project), Series 2019-A, 5.00% 2037 | | | 780 | | | | 978 | |
| Fin. Auth., Academic Fac. Lease Rev. Bonds (Provident Group - UIUC Properties LLC - University of Illinois at Urbana-Champaign Project), Series 2019-A, 5.00% 2038 | | | 760 | | | | 950 | |
| Fin. Auth., Academic Fac. Lease Rev. Bonds (Provident Group - UIUC Properties LLC - University of Illinois at Urbana-Champaign Project), Series 2019-A, 5.00% 2044 | | | 3,250 | | | | 4,001 | |
| Fin. Auth., Academic Fac. Lease Rev. Bonds (Provident Group - UIUC Properties LLC - University of Illinois at Urbana-Champaign Project), Series 2019-A, 5.00% 2049 | | | 5,455 | | | | 6,672 | |
| Fin. Auth., Academic Fac. Lease Rev. Bonds (Provident Group - UIUC Properties LLC - University of Illinois at Urbana-Champaign Project), Series 2019-A, 5.00% 2051 | | | 1,000 | | | | 1,217 | |
| Fin. Auth., Charter School Rev. Ref. and Improvement Rev. Bonds (Chicago International Charter School Project), Series 2017, 5.00% 2037 | | | 1,000 | | | | 1,141 | |
| Fin. Auth., Health Facs. Rev. Bonds (UnityPoint Health), Series 2016-D, 4.00% 2046 | | | 2,000 | | | | 2,147 | |
| Fin. Auth., National Rural Utilities Cooperative Fin. Corp., Guaranteed Solid Waste Disposal Rev. Bonds (Prairie Power, Inc. Project), Series 2008-A, 1.75% 2042 (put 2020) | | | 50 | | | | 50 | |
| Fin. Auth., Rev. Bonds (Advocate Health Care Network), Series 2008-A-3, 5.00% 2030 | | | 3,000 | | | | 3,643 | |
| Fin. Auth., Rev. Bonds (Advocate Health Care Network), Series 2012, 5.00% 2042 (preref. 2022) | | | 5,315 | | | | 5,818 | |
| Fin. Auth., Rev. Bonds (Advocate Health Care Network), Series 2015-B, 5.00% 2027 | | | 990 | | | | 1,173 | |
| Fin. Auth., Rev. Bonds (Art Institute of Chicago), Series 2012-A, 5.00% 2034 | | | 4,920 | | | | 5,289 | |
| Fin. Auth., Rev. Bonds (Art Institute of Chicago), Series 2012-A, 5.00% 2034 (preref. 2022) | | | 30 | | | | 33 | |
| Fin. Auth., Rev. Bonds (Art Institute of Chicago), Series 2016, 4.00% 2038 | | | 3,850 | | | | 4,257 | |
| Fin. Auth., Rev. Bonds (Art Institute of Chicago), Series 2016, 5.00% 2030 | | | 2,500 | | | | 2,998 | |
| Fin. Auth., Rev. Bonds (Clean Water Initiative Revolving Fund), Series 2016, 4.00% 2025 | | | 2,680 | | | | 3,120 | |
| Fin. Auth., Rev. Bonds (Clean Water Initiative Revolving Fund), Series 2016, 4.00% 2026 | | | 5,300 | | | | 6,144 | |
| Fin. Auth., Rev. Bonds (Clean Water Initiative Revolving Fund), Series 2016, 5.00% 2027 | | | 5,000 | | | | 6,125 | |
| Fin. Auth., Rev. Bonds (Clean Water Initiative Revolving Fund), Series 2016, 5.00% 2028 | | | 6,410 | | | | 7,804 | |
| Fin. Auth., Rev. Bonds (Clean Water Initiative Revolving Fund), Series 2016, 5.00% 2029 | | | 8,315 | | | | 10,109 | |
| Fin. Auth., Rev. Bonds (Clean Water Initiative Revolving Fund), Series 2016, 5.00% 2029 | | | 2,700 | | | | 3,276 | |
| Fin. Auth., Rev. Bonds (Clean Water Initiative Revolving Fund), Series 2016, 5.00% 2030 | | | 6,200 | | | | 7,508 | |
| Fin. Auth., Rev. Bonds (Clean Water Initiative Revolving Fund), Series 2016, 5.00% 2031 | | | 3,580 | | | | 4,315 | |
| Fin. Auth., Rev. Bonds (Clean Water Initiative Revolving Fund), Series 2017, 5.00% 2026 | | | 4,875 | | | | 5,997 | |
| Fin. Auth., Rev. Bonds (Clean Water Initiative Revolving Fund), Series 2017, 5.00% 2029 | | | 4,000 | | | | 4,997 | |
| Fin. Auth., Rev. Bonds (Clean Water Initiative Revolving Fund), Series 2017, 5.00% 2029 | | | 2,000 | | | | 2,493 | |
| Fin. Auth., Rev. Bonds (Clean Water Initiative Revolving Fund), Series 2017, 5.00% 2030 | | | 7,420 | | | | 9,228 | |
| Fin. Auth., Rev. Bonds (Clean Water Initiative Revolving Fund), Series 2017, 5.00% 2030 | | | 3,500 | | | | 4,344 | |
| Fin. Auth., Rev. Bonds (Clean Water Initiative Revolving Fund), Series 2017, 5.00% 2031 | | | 7,080 | | | | 8,758 | |
| Fin. Auth., Rev. Bonds (Clean Water Initiative Revolving Fund), Series 2017, 5.00% 2032 | | | 5,005 | | | | 6,177 | |
| Fin. Auth., Rev. Bonds (Clean Water Initiative Revolving Fund), Series 2017, 5.00% 2033 | | | 5,000 | | | | 6,157 | |
| Fin. Auth., Rev. Bonds (Clean Water Initiative Revolving Fund), Series 2017, 5.00% 2034 | | | 5,000 | | | | 6,139 | |
| Fin. Auth., Rev. Bonds (Clean Water Initiative Revolving Fund), Series 2017, 5.00% 2035 | | | 8,180 | | | | 10,023 | |
| Fin. Auth., Rev. Bonds (Clean Water Initiative Revolving Fund), Series 2017, 5.00% 2036 | | | 700 | | | | 855 | |
| Fin. Auth., Rev. Bonds (DePaul University), Series 2011-A, 6.125% 2040 (preref. 2021) | | | 10,000 | | | | 10,597 | |
| Fin. Auth., Rev. Bonds (DePaul University), Series 2016, 5.00% 2030 | | | 1,000 | | | | 1,215 | |
| Fin. Auth., Rev. Bonds (DePaul University), Series 2016, 5.00% 2032 | | | 1,000 | | | | 1,208 | |
| Fin. Auth., Rev. Bonds (DePaul University), Series 2016, 5.00% 2033 | | | 1,150 | | | | 1,387 | |
| Fin. Auth., Rev. Bonds (DePaul University), Series 2016, 5.00% 2034 | | | 1,310 | | | | 1,577 | |
| Fin. Auth., Rev. Bonds (DePaul University), Series 2016, 5.00% 2036 | | | 1,000 | | | | 1,199 | |
| Fin. Auth., Rev. Bonds (DePaul University), Series 2016, 5.00% 2041 | | | 3,500 | | | | 4,149 | |
| Fin. Auth., Rev. Bonds (Edward-Elmhurst Healthcare), Series 2017-A, 5.00% 2027 | | | 925 | | | | 1,128 | |
| Fin. Auth., Rev. Bonds (Edward-Elmhurst Healthcare), Series 2017-A, 5.00% 2028 | | | 1,480 | | | | 1,797 | |
| Fin. Auth., Rev. Bonds (Edward-Elmhurst Healthcare), Series 2017-A, 5.00% 2029 | | | 3,000 | | | | 3,631 | |
| Fin. Auth., Rev. Bonds (Edward-Elmhurst Healthcare), Series 2017-A, 5.00% 2030 | | | 5,100 | | | | 6,144 | |
| 22 | American Funds Tax-Exempt Funds |
The Tax-Exempt Bond Fund of America
| | Principal amount
(000) | | | Value
(000) | |
| Fin. Auth., Rev. Bonds (Edward-Elmhurst Healthcare), Series 2017-A, 5.00% 2031 | | $ | 3,000 | | | $ | 3,599 | |
| Fin. Auth., Rev. Bonds (Edward-Elmhurst Healthcare), Series 2017-A, 5.00% 2032 | | | 2,500 | | | | 2,989 | |
| Fin. Auth., Rev. Bonds (Edward-Elmhurst Healthcare), Series 2017-A, 5.00% 2033 | | | 9,000 | | | | 10,734 | |
| Fin. Auth., Rev. Bonds (Edward-Elmhurst Healthcare), Series 2017-A, 5.00% 2034 | | | 3,000 | | | | 3,568 | |
| Fin. Auth., Rev. Bonds (Edward-Elmhurst Healthcare), Series 2017-A, 5.00% 2035 | | | 6,710 | | | | 7,955 | |
| Fin. Auth., Rev. Bonds (Edward-Elmhurst Healthcare), Series 2017-A, 5.00% 2036 | | | 7,000 | | | | 8,271 | |
| Fin. Auth., Rev. Bonds (Friendship Village Schaumburg), Series 2017, 5.125% 2045 | | | 2,225 | | | | 2,247 | |
| Fin. Auth., Rev. Bonds (Lifespace Communities, Inc.), Series 2015-A, 5.00% 2020 | | | 695 | | | | 701 | |
| Fin. Auth., Rev. Bonds (Lifespace Communities, Inc.), Series 2015-A, 5.00% 2024 | | | 245 | | | | 275 | |
| Fin. Auth., Rev. Bonds (Lifespace Communities, Inc.), Series 2015-A, 5.00% 2025 | | | 760 | | | | 872 | |
| Fin. Auth., Rev. Bonds (Lifespace Communities, Inc.), Series 2015-A, 5.00% 2030 | | | 1,180 | | | | 1,332 | |
| Fin. Auth., Rev. Bonds (Lifespace Communities, Inc.), Series 2015-A, 5.00% 2035 | | | 1,350 | | | | 1,514 | |
| Fin. Auth., Rev. Bonds (Lutheran Life Communities Obligated Group), Series 2019-A, 4.00% 2022 | | | 390 | | | | 405 | |
| Fin. Auth., Rev. Bonds (Mercy Health Corp.), Series 2016, 4.00% 2036 | | | 2,420 | | | | 2,632 | |
| Fin. Auth., Rev. Bonds (Mercy Health Corp.), Series 2016, 5.00% 2026 | | | 3,000 | | | | 3,614 | |
| Fin. Auth., Rev. Bonds (Mercy Health Corp.), Series 2016, 5.00% 2046 | | | 39,370 | | | | 45,278 | |
| Fin. Auth., Rev. Bonds (Northwest Community Hospital), Series 2016-A, 4.00% 2037 | | | 11,520 | | | | 12,638 | |
| Fin. Auth., Rev. Bonds (Northwest Community Hospital), Series 2016-A, 4.00% 2038 | | | 6,140 | | | | 6,718 | |
| Fin. Auth., Rev. Bonds (Northwest Community Hospital), Series 2016-A, 5.00% 2026 | | | 2,000 | | | | 2,451 | |
| Fin. Auth., Rev. Bonds (Northwest Community Hospital), Series 2016-A, 5.00% 2032 | | | 3,290 | | | | 3,901 | |
| Fin. Auth., Rev. Bonds (Northwest Community Hospital), Series 2016-A, 5.00% 2033 | | | 1,425 | | | | 1,683 | |
| Fin. Auth., Rev. Bonds (Northwest Community Hospital), Series 2016-A, 5.00% 2034 | | | 3,240 | | | | 3,817 | |
| Fin. Auth., Rev. Bonds (Northwest Community Hospital), Series 2016-A, 5.00% 2035 | | | 3,335 | | | | 3,921 | |
| Fin. Auth., Rev. Bonds (Northwestern Memorial Healthcare), Series 2017-A, 5.00% 2030 | | | 1,000 | | | | 1,264 | |
| Fin. Auth., Rev. Bonds (Northwestern Memorial Healthcare), Series 2017-A, 5.00% 2042 | | | 7,000 | | | | 8,510 | |
| Fin. Auth., Rev. Bonds (Northwestern Memorial Healthcare), Series 2017-B, 5.00% 2057 (put 2022) | | | 9,600 | | | | 10,655 | |
| Fin. Auth., Rev. Bonds (OSF Healthcare System), Series 2012-A, 5.00% 2028 | | | 2,275 | | | | 2,456 | |
| Fin. Auth., Rev. Bonds (OSF Healthcare System), Series 2016, 3.25% 2039 | | | 4,000 | | | | 4,062 | |
| Fin. Auth., Rev. Bonds (OSF Healthcare System), Series 2016, 5.00% 2028 | | | 2,450 | | | | 2,947 | |
| Fin. Auth., Rev. Bonds (Presbyterian Homes Obligated Group), Series 2016-A, 5.00% 2020 | | | 855 | | | | 863 | |
| Fin. Auth., Rev. Bonds (Presbyterian Homes Obligated Group), Series 2016-A, 5.00% 2025 | | | 2,345 | | | | 2,760 | |
| Fin. Auth., Rev. Bonds (Presbyterian Homes Obligated Group), Series 2016-A, 5.00% 2027 | | | 5,000 | | | | 6,063 | |
| Fin. Auth., Rev. Bonds (Presbyterian Homes Obligated Group), Series 2016-A, 5.00% 2028 | | | 3,250 | | | | 3,927 | |
| Fin. Auth., Rev. Bonds (Presbyterian Homes Obligated Group), Series 2016-A, 5.00% 2030 | | | 1,165 | | | | 1,393 | |
| Fin. Auth., Rev. Bonds (Presbyterian Homes Obligated Group), Series 2016-A, 5.00% 2031 | | | 1,125 | | | | 1,340 | |
| Fin. Auth., Rev. Bonds (Presbyterian Homes Obligated Group), Series 2016-B, (1-month USD-LIBOR x 0.70 + 1.35%) 2.596% 2036 (put 2021)1 | | | 1,775 | | | | 1,778 | |
| Fin. Auth., Rev. Bonds (Presence Health Network), Series 2016-C, 4.00% 2041 | | | 17,970 | | | | 19,896 | |
| Fin. Auth., Rev. Bonds (Presence Health Network), Series 2016-C, 4.00% 2041 (preref. 2027) | | | 730 | | | | 870 | |
| Fin. Auth., Rev. Bonds (Presence Health Network), Series 2016-C, 4.00% 2041 (preref. 2027) | | | 5 | | | | 6 | |
| Fin. Auth., Rev. Bonds (Presence Health Network), Series 2016-C, 5.00% 2027 | | | 1,875 | | | | 2,362 | |
| Fin. Auth., Rev. Bonds (Presence Health Network), Series 2016-C, 5.00% 2028 | | | 5,000 | | | | 6,251 | |
| Fin. Auth., Rev. Bonds (Presence Health Network), Series 2016-C, 5.00% 2029 | | | 2,000 | | | | 2,489 | |
| Fin. Auth., Rev. Bonds (Presence Health Network), Series 2016-C, 5.00% 2030 | | | 7,615 | | | | 9,410 | |
| Fin. Auth., Rev. Bonds (Presence Health Network), Series 2016-C, 5.00% 2031 | | | 3,000 | | | | 3,692 | |
| Fin. Auth., Rev. Bonds (Presence Health Network), Series 2016-C, 5.00% 2033 | | | 2,500 | | | | 3,060 | |
| Fin. Auth., Rev. Bonds (Presence Health Network), Series 2016-C, 5.00% 2034 | | | 1,895 | | | | 2,305 | |
| Fin. Auth., Rev. Bonds (Presence Health Network), Series 2016-C, 5.00% 2036 | | | 1,145 | | | | 1,382 | |
| Fin. Auth., Rev. Bonds (Presence Health Network), Series 2016-C, 5.00% 2041 | | | 2,000 | | | | 2,383 | |
| Fin. Auth., Rev. Bonds (Rehabilitation Institute of Chicago), Series 2013-A, 6.00% 2043 | | | 2,700 | | | | 3,047 | |
| Fin. Auth., Rev. Bonds (Rush University Medical Center Obligated Group), Series 2015-A, 5.00% 2030 | | | 5,000 | | | | 5,887 | |
| Fin. Auth., Rev. Bonds (Rush University Medical Center Obligated Group), Series 2015-A, 5.00% 2034 | | | 2,500 | | | | 2,911 | |
| Fin. Auth., Rev. Bonds (Rush University Medical Center Obligated Group), Series 2015-A, 5.00% 2038 | | | 7,825 | | | | 8,992 | |
| Fin. Auth., Rev. Bonds (Rush University Medical Center Obligated Group), Series 2015-B, 5.00% 2034 | | | 2,595 | | | | 3,022 | |
| Fin. Auth., Rev. Bonds (The Admiral at the Lake Project), Series 2010-A, 8.00% 2046 (preref. 2020) | | | 3,500 | | | | 3,568 | |
| Fin. Auth., Rev. Bonds (The Cable Foundation), Series 2016-A, 5.00% 2045 | | | 26,575 | | | | 30,732 | |
| American Funds Tax-Exempt Funds | 23 |
The Tax-Exempt Bond Fund of America
| Bonds, notes & other debt instruments(continued) | Principal amount
(000) | | | Value
(000) | |
| Illinois (continued) | | | | | | | | |
| Fin. Auth., Rev. Bonds (Trinity Health Credit Group), Series 2011-IL, 5.00% 2030 (preref. 2021) | | $ | 725 | | | $ | 778 | |
| Fin. Auth., Rev. Bonds (University of Chicago Medical Center), Series 2016-A, 5.00% 2026 | | | 1,610 | | | | 1,983 | |
| Fin. Auth., Rev. Bonds (University of Chicago Medical Center), Series 2016-B, 5.00% 2035 | | | 5,150 | | | | 6,161 | |
| Fin. Auth., Rev. Green Bonds (Clean Water Initiative Revolving Fund), Series 2019, 5.00% 2034 | | | 8,780 | | | | 11,339 | |
| Fin. Auth., Rev. Green Bonds (Clean Water Initiative Revolving Fund), Series 2019, 5.00% 2036 | | | 7,000 | | | | 8,989 | |
| Fin. Auth., Rev. Green Bonds (Clean Water Initiative Revolving Fund), Series 2019, 5.00% 2037 | | | 8,000 | | | | 10,238 | |
| Fin. Auth., Rev. Ref. Bonds (Advocate Health Care Network), Series 2014, 5.00% 2033 | | | 8,500 | | | | 10,014 | |
| Fin. Auth., Rev. Ref. Bonds (Anne & Robert H. Lurie Children’s Hospital), Series 2017, 4.00% 2037 | | | 2,500 | | | | 2,793 | |
| Fin. Auth., Rev. Ref. Bonds (Anne & Robert H. Lurie Children’s Hospital), Series 2017, 5.00% 2034 | | | 1,000 | | | | 1,226 | |
| Fin. Auth., Rev. Ref. Bonds (Anne & Robert H. Lurie Children’s Hospital), Series 2017, 5.00% 2035 | | | 5,900 | | | | 7,209 | |
| Fin. Auth., Rev. Ref. Bonds (Art Institute of Chicago), Series 2010-A, 5.25% 2040 | | | 5,350 | | | | 5,366 | |
| Fin. Auth., Rev. Ref. Bonds (Ascension Health Senior Credit Group), Series 2012-A, 5.00% 2042 (preref. 2021) | | | 7,500 | | | | 8,046 | |
| Fin. Auth., Rev. Ref. Bonds (Benedictine University), Series 2017, 5.00% 2027 | | | 1,095 | | | | 1,255 | |
| Fin. Auth., Rev. Ref. Bonds (Benedictine University), Series 2017, 5.00% 2038 | | | 1,000 | | | | 1,107 | |
| Fin. Auth., Rev. Ref. Bonds (Bradley University Project), Series 2017-C, 5.00% 2028 | | | 1,860 | | | | 2,278 | |
| Fin. Auth., Rev. Ref. Bonds (Christian Homes, Inc.), Series 2016, 5.00% 2040 | | | 1,275 | | | | 1,375 | |
| Fin. Auth., Rev. Ref. Bonds (DePaul University), Series 2013, 5.00% 2024 | | | 600 | | | | 683 | |
| Fin. Auth., Rev. Ref. Bonds (DePaul University), Series 2016-A, 4.00% 2040 | | | 7,500 | | | | 8,339 | |
| Fin. Auth., Rev. Ref. Bonds (DePaul University), Series 2016-A, 5.00% 2030 | | | 1,000 | | | | 1,214 | |
| Fin. Auth., Rev. Ref. Bonds (DePaul University), Series 2016-A, 5.00% 2035 | | | 1,000 | | | | 1,201 | |
| Fin. Auth., Rev. Ref. Bonds (Field Museum of Natural History), Series 2019, 1.71% 2034 (put 2022)1 | | | 31,825 | | | | 31,920 | |
| Fin. Auth., Rev. Ref. Bonds (Loyola University of Chicago), Series 2012-B, 5.00% 2025 | | | 3,000 | | | | 3,262 | |
| Fin. Auth., Rev. Ref. Bonds (Loyola University of Chicago), Series 2012-B, 5.00% 2026 | | | 1,535 | | | | 1,665 | |
| Fin. Auth., Rev. Ref. Bonds (Loyola University of Chicago), Series 2012-B, 5.00% 2042 | | | 9,385 | | | | 10,086 | |
| Fin. Auth., Rev. Ref. Bonds (OSF Healthcare System), Series 2010-A, 6.00% 2039 | | | 1,765 | | | | 1,793 | |
| Fin. Auth., Rev. Ref. Bonds (OSF Healthcare System), Series 2010-A, 6.00% 2039 (preref. 2020) | | | 9,475 | | | | 9,608 | |
| Fin. Auth., Rev. Ref. Bonds (OSF Healthcare System), Series 2012-A, 5.00% 2022 | | | 1,290 | | | | 1,400 | |
| Fin. Auth., Rev. Ref. Bonds (OSF Healthcare System), Series 2015-A, 5.00% 2031 | | | 3,500 | | | | 4,126 | |
| Fin. Auth., Rev. Ref. Bonds (OSF Healthcare System), Series 2015-A, 5.00% 2032 | | | 3,500 | | | | 4,113 | |
| Fin. Auth., Rev. Ref. Bonds (OSF Healthcare System), Series 2015-A, 5.00% 2034 | | | 2,600 | | | | 3,043 | |
| Fin. Auth., Rev. Ref. Bonds (OSF Healthcare System), Series 2015-A, 5.00% 2045 | | | 26,890 | | | | 30,871 | |
| Fin. Auth., Rev. Ref. Bonds (Provena Health), Series 2010-A, 6.00% 2028 (preref. 2020) | | | 14,000 | | | | 14,171 | |
| Fin. Auth., Rev. Ref. Bonds (Silver Cross Hospital and Medical Centers), Series 2015-C, 4.125% 2037 | | | 1,000 | | | | 1,065 | |
| Fin. Auth., Rev. Ref. Bonds (Silver Cross Hospital and Medical Centers), Series 2015-C, 5.00% 2035 | | | 6,745 | | | | 7,745 | |
| Fin. Auth., Rev. Ref. Bonds (Silver Cross Hospital and Medical Centers), Series 2015-C, 5.00% 2044 | | | 10,885 | | | | 12,292 | |
| Fin. Auth., Rev. Ref. Bonds (Southern Illinois Healthcare Enterprises, Inc.), Series 2017-C, 5.00% 2026 | | | 650 | | | | 786 | |
| Fin. Auth., Rev. Ref. Bonds (Southern Illinois Healthcare Enterprises, Inc.), Series 2017-C, 5.00% 2032 | | | 1,600 | | | | 1,917 | |
| Fin. Auth., Rev. Ref. Bonds (University of Chicago Medical Center), Series 2009-B, 5.00% 2025 | | | 6,975 | | | | 7,121 | |
| Fin. Auth., Rev. Ref. Bonds (University of Chicago Medical Center), Series 2009-B, 5.00% 2025 (preref. 2020) | | | 3,525 | | | | 3,601 | |
| Fin. Auth., Rev. Ref. Bonds (University of Chicago Medical Center), Series 2009-B, 5.00% 2026 | | | 2,660 | | | | 2,715 | |
| Fin. Auth., Rev. Ref. Bonds (University of Chicago Medical Center), Series 2009-B, 5.00% 2026 (preref. 2020) | | | 1,340 | | | | 1,369 | |
| Fin. Auth., Student Housing and Academic Fac. Rev. Bonds (CHF-Chicago, LLC – University of Illinois at Chicago Project), Series 2017-A, 5.00% 2047 | | | 1,200 | | | | 1,369 | |
| Fin. Auth., Student Housing Rev. Bonds (CHF-Cook, LLC - Northeastern Illinois University Project), Series 2015-A, 5.00% 2035 | | | 2,235 | | | | 2,267 | |
| 24 | American Funds Tax-Exempt Funds |
The Tax-Exempt Bond Fund of America
| | Principal amount
(000) | | | Value
(000) | |
| Fin. Auth., Student Housing Rev. Bonds (CHF-Cook, LLC - Northeastern Illinois University Project), Series 2015-A, 5.00% 2047 | | $ | 1,265 | | | $ | 1,266 | |
| Fin. Auth., Student Housing Rev. Bonds (CHF-DeKalb II, LLC - Northern Illinois University Project), Series 2011, 6.875% 2043 | | | 40,015 | | | | 42,243 | |
| Fin. Auth., Student Housing Rev. Bonds (CHF-Normal, LLC - Illinois State University Project), Series 2011, 6.75% 2031 (preref. 2021) | | | 1,000 | | | | 1,067 | |
| Fin. Auth., Student Housing Rev. Bonds (CHF-Normal, LLC - Illinois State University Project), Series 2011, 7.00% 2043 (preref. 2021) | | | 12,500 | | | | 13,364 | |
| G.O. Bonds, Series 2010, Assured Guaranty Municipal insured, 5.00% 2022 | | | 320 | | | | 321 | |
| G.O. Bonds, Series 2012, 5.00% 2035 | | | 1,000 | | | | 1,055 | |
| G.O. Bonds, Series 2013-A, Assured Guaranty Municipal insured, 5.00% 2022 | | | 980 | | | | 1,049 | |
| G.O. Bonds, Series 2014, 5.00% 2020 | | | 5,540 | | | | 5,540 | |
| G.O. Bonds, Series 2014, 5.00% 2021 | | | 1,415 | | | | 1,465 | |
| G.O. Bonds, Series 2014, 5.00% 2024 | | | 2,000 | | | | 2,236 | |
| G.O. Bonds, Series 2014, 5.00% 2039 | | | 6,275 | | | | 6,856 | |
| G.O. Bonds, Series 2014, Assured Guaranty Municipal insured, 5.00% 2024 | | | 2,795 | | | | 3,152 | |
| G.O. Bonds, Series 2014, Assured Guaranty Municipal insured, 5.00% 2026 | | | 2,000 | | | | 2,250 | |
| G.O. Bonds, Series 2014, Assured Guaranty Municipal insured, 5.00% 2039 | | | 5,100 | | | | 5,598 | |
| G.O. Bonds, Series 2016, 5.00% 2028 | | | 4,840 | | | | 5,675 | |
| G.O. Bonds, Series 2016, 5.00% 2033 | | | 7,200 | | | | 8,381 | |
| G.O. Bonds, Series 2016, 5.00% 2034 | | | 1,925 | | | | 2,237 | |
| G.O. Bonds, Series 2016, 5.00% 2037 | | | 7,500 | | | | 8,652 | |
| G.O. Bonds, Series 2016, 5.00% 2038 | | | 14,000 | | | | 16,114 | |
| G.O. Bonds, Series 2016, Assured Guaranty Municipal insured, 5.00% 2030 | �� | | 7,700 | | | | 8,897 | |
| G.O. Bonds, Series 2016, Assured Guaranty Municipal insured, 5.00% 2041 | | | 2,000 | | | | 2,259 | |
| G.O. Bonds, Series 2017-A, 5.00% 2023 | | | 3,000 | | | | 3,353 | |
| G.O. Bonds, Series 2017-A, 5.00% 2036 | | | 11,500 | | | | 13,567 | |
| G.O. Bonds, Series 2017-C, 5.00% 2029 | | | 18,250 | | | | 21,729 | |
| G.O. Bonds, Series 2017-D, 5.00% 2022 | | | 20 | | | | 22 | |
| G.O. Bonds, Series 2017-D, 5.00% 2023 | | | 10,270 | | | | 11,428 | |
| G.O. Bonds, Series 2017-D, BAM insured, 5.00% 2020 | | | 4,150 | | | | 4,263 | |
| G.O. Bonds, Series 2017-D, BAM insured, 5.00% 2021 | | | 37,530 | | | | 39,745 | |
| G.O. Bonds, Series 2017-D, BAM insured, 5.00% 2024 | | | 8,000 | | | | 9,105 | |
| G.O. Bonds, Series 2017-D, BAM insured, 5.00% 2026 | | | 35,355 | | | | 41,872 | |
| G.O. Bonds, Series 2017-D, BAM insured, 5.00% 2028 | | | 13,470 | | | | 16,134 | |
| G.O. Bonds, Series 2018-A, 5.00% 2020 | | | 6,000 | | | | 6,054 | |
| G.O. Bonds, Series 2018-B, 5.00% 2025 | | | 5,000 | | | | 5,778 | |
| G.O. Bonds, Series 2019-B, 4.00% 2038 | | | 2,000 | | | | 2,211 | |
| G.O. Rev. Ref. Bonds, Series 2007, 5.25% 2021 | | | 2,415 | | | | 2,499 | |
| G.O. Rev. Ref. Bonds, Series 2012, 4.00% 2025 | | | 1,360 | | | | 1,424 | |
| G.O. Rev. Ref. Bonds, Series 2012, 5.00% 2020 | | | 5,000 | | | | 5,091 | |
| G.O. Rev. Ref. Bonds, Series 2012, Assured Guaranty Municipal insured, 5.00% 2025 | | | 4,540 | | | | 4,893 | |
| G.O. Rev. Ref. Bonds, Series 2016, 5.00% 2020 | | | 5,220 | | | | 5,282 | |
| G.O. Rev. Ref. Bonds, Series 2016, 5.00% 2020 | | | 2,105 | | | | 2,105 | |
| G.O. Rev. Ref. Bonds, Series 2016, 5.00% 2027 | | | 8,250 | | | | 9,876 | |
| G.O. Rev. Ref. Bonds, Series 2016, 5.00% 2028 | | | 3,000 | | | | 3,573 | |
| G.O. Rev. Ref. Bonds, Series 2018-A, 5.00% 2024 | | | 2,000 | | | | 2,279 | |
| G.O. Rev. Ref. Bonds, Series 2018-A, 5.00% 2025 | | | 1,320 | | | | 1,540 | |
| G.O. Rev. Ref. Bonds, Series 2018-A, 5.00% 2026 | | | 3,500 | | | | 4,166 | |
| G.O. Rev. Ref. Bonds, Series 2018-A, 5.00% 2027 | | | 3,000 | | | | 3,630 | |
| G.O. Rev. Ref. Bonds, Series 2018-A, 5.00% 2028 | | | 6,000 | | | | 7,365 | |
| G.O. Rev. Ref. Bonds, Series 2018-B, 5.00% 2033 | | | 2,565 | | | | 3,079 | |
| Toll Highway Auth., Toll Highway Rev. Bonds, Series 2013-A, 5.00% 2038 | | | 34,430 | | | | 37,880 | |
| Other securities | | | | | | | 1,308,441 | |
| | | | | | | | 3,162,246 | |
| | | | | | | | | |
| Kansas 0.65% | | | | | | | | |
| University of Kansas Hospital Auth., Health Facs. and Improvement Rev. Bonds (University of Kansas Health System), Series 2017-A, 5.00% 2047 | | | 44,740 | | | | 53,196 | |
| Other securities | | | | | | | 106,567 | |
| | | | | | | | 159,763 | |
| American Funds Tax-Exempt Funds | 25 |
The Tax-Exempt Bond Fund of America
| Bonds, notes & other debt instruments(continued) | Principal amount
(000) | | | Value
(000) | |
| Massachusetts 1.35% | | | | | | | | |
| Special Obligation Dedicated Tax Rev. Ref. Bonds, Series 2005, FGIC National insured, 5.50% 2034 | | $ | 51,335 | | | $ | 72,703 | |
| Other securities | | | | | | | 256,772 | |
| | | | | | | | 329,475 | |
| | | | | | | | | |
| Michigan 4.21% | | | | | | | | |
| Fin. Auth., Distributable State Aid Rev. Bonds (Charter County of Wayne Criminal Justice Center Project), Series 2018, 5.00% 2036 | | | 2,500 | | | | 3,143 | |
| Fin. Auth., Distributable State Aid Rev. Bonds (Charter County of Wayne Criminal Justice Center Project), Series 2018, 5.00% 2037 | | | 1,000 | | | | 1,249 | |
| Fin. Auth., Distributable State Aid Rev. Bonds (Charter County of Wayne Criminal Justice Center Project), Series 2018, 5.00% 2038 | | | 1,000 | | | | 1,245 | |
| Fin. Auth., Distributable State Aid Rev. Bonds (Charter County of Wayne Criminal Justice Center Project), Series 2018, 5.00% 2043 | | | 3,500 | | | | 4,302 | |
| Fin. Auth., Hospital Rev. and Rev. Ref. Bonds (Trinity Health Credit Group), Series 2015, 5.00% 2030 (preref. 2022) | | | 5,000 | | | | 5,467 | |
| Fin. Auth., Hospital Rev. and Rev. Ref. Bonds (Trinity Health Credit Group), Series 2015, 5.50% 2026 | | | 750 | | | | 924 | |
| Fin. Auth., Hospital Rev. and Rev. Ref. Bonds (Trinity Health Credit Group), Series 2017, 5.00% 2028 | | | 2,000 | | | | 2,525 | |
| Fin. Auth., Hospital Rev. and Rev. Ref. Bonds (Trinity Health Credit Group), Series 2017, 5.00% 2046 | | | 6,455 | | | | 7,804 | |
| Fin. Auth., Hospital Rev. and Rev. Ref. Bonds (Trinity Health Credit Group), Series 2017-A, 4.00% 2036 | | | 32,480 | | | | 37,237 | |
| Fin. Auth., Hospital Rev. and Rev. Ref. Bonds (Trinity Health Credit Group), Series 2017-A, 4.00% 2040 | | | 22,030 | | | | 24,984 | |
| Fin. Auth., Hospital Rev. and Rev. Ref. Bonds (Trinity Health Credit Group), Series 2017-A, 5.00% 2034 | | | 2,500 | | | | 3,138 | |
| Fin. Auth., Hospital Rev. and Rev. Ref. Bonds (Trinity Health Credit Group), Series 2017-A, 5.00% 2035 | | | 4,000 | | | | 5,008 | |
| Fin. Auth., Hospital Rev. and Rev. Ref. Bonds (Trinity Health Credit Group), Series 2017-A, 5.00% 2037 | | | 5,000 | | | | 6,224 | |
| Fin. Auth., Hospital Rev. and Rev. Ref. Bonds (Trinity Health Credit Group), Series 2017-A, 5.00% 2047 (preref. 2022) | | | 32,440 | | | | 36,113 | |
| Fin. Auth., Hospital Rev. and Rev. Ref. Bonds (Trinity Health Credit Group), Series 2019-1, 5.00% 2048 | | | 6,560 | | | | 8,155 | |
| Fin. Auth., Hospital Rev. and Rev. Ref. Bonds (Trinity Health Credit Group), Series 2019-2, 5.00% 2044 (put 2025) | | | 5,000 | | | | 5,921 | |
| Fin. Auth., Hospital Rev. and Rev. Ref. Bonds (Trinity Health Credit Group), Series 2019-MI-A, 4.00% 2049 | | | 7,500 | | | | 8,572 | |
| Fin. Auth., Hospital Rev. Bonds (Trinity Health Credit Group), Series 2011, 5.00% 2039 | | | 3,390 | | | | 3,643 | |
| Fin. Auth., Hospital Rev. Ref. Bonds (Beaumont Health Credit Group), Series 2016-A, 5.00% 2044 | | | 15,010 | | | | 17,372 | |
| Fin. Auth., Hospital Rev. Ref. Bonds (Crittenton Hospital Medical Center), Series 2012-A, 5.00% 2039 (preref. 2022) | | | 8,315 | | | | 9,091 | |
| Fin. Auth., Hospital Rev. Ref. Bonds (Henry Ford Health System), Series 2016, 4.00% 2035 | | | 3,595 | | | | 4,026 | |
| Fin. Auth., Hospital Rev. Ref. Bonds (Henry Ford Health System), Series 2016, 5.00% 2031 | | | 4,300 | | | | 5,284 | |
| Fin. Auth., Hospital Rev. Ref. Bonds (Henry Ford Health System), Series 2016, 5.00% 2032 | | | 1,500 | | | | 1,834 | |
| Fin. Auth., Hospital Rev. Ref. Bonds (Henry Ford Health System), Series 2016, 5.00% 2034 | | | 1,540 | | | | 1,879 | |
| Fin. Auth., Hospital Rev. Ref. Bonds (Henry Ford Health System), Series 2019-A, 5.00% 2048 | | | 2,500 | | | | 3,083 | |
| Fin. Auth., Hospital Rev. Ref. Bonds (McLaren Health Care), Series 2015-D-1, (1-month USD-LIBOR x 0.68 + 0.40%) 1.522% 2030 (put 2021)1 | | | 13,965 | | | | 13,991 | |
| Fin. Auth., Hospital Rev. Ref. Bonds (McLaren Health Care), Series 2015-D-2, (1-month USD-LIBOR x 0.68 + 0.75%) 1.872% 2038 (put 2020)1 | | | 6,000 | | | | 6,008 | |
| Fin. Auth., Hospital Rev. Ref. Bonds (McLaren Health Care), Series 2019-A, 4.00% 2044 | | | 8,450 | | | | 9,648 | |
| Fin. Auth., Hospital Rev. Ref. Bonds (McLaren Health Care), Series 2019-A, 4.00% 2047 | | | 3,300 | | | | 3,747 | |
| Fin. Auth., Hospital Rev. Ref. Bonds (MidMichigan Health Credit Group), Series 2014, 5.00% 2039 | | | 1,000 | | | | 1,127 | |
| Fin. Auth., Hospital Rev. Ref. Bonds (Oakwood Obligated Group), Series 2012, 5.00% 2024 | | | 9,145 | | | | 10,129 | |
| Fin. Auth., Hospital Rev. Ref. Bonds (Oakwood Obligated Group), Series 2012, 5.00% 2027 | | | 3,000 | | | | 3,315 | |
| Fin. Auth., Hospital Rev. Ref. Bonds (Sparrow Obligated Group), Series 2015, 5.00% 2029 | | | 3,000 | | | | 3,529 | |
| Fin. Auth., Hospital Rev. Ref. Bonds (Sparrow Obligated Group), Series 2015, 5.00% 2031 | | | 1,500 | | | | 1,754 | |
| Fin. Auth., Hospital Rev. Ref. Bonds (Sparrow Obligated Group), Series 2015, 5.00% 2033 | | | 1,500 | | | | 1,747 | |
| Fin. Auth., Hospital Rev. Ref. Bonds (Sparrow Obligated Group), Series 2015, 5.00% 2034 | | | 1,500 | | | | 1,743 | |
| 26 | American Funds Tax-Exempt Funds |
The Tax-Exempt Bond Fund of America
| | Principal amount
(000) | | | Value
(000) | |
| Fin. Auth., Hospital Rev. Ref. Bonds (Sparrow Obligated Group), Series 2015, 5.00% 2045 | | $ | 1,000 | | | $ | 1,139 | |
| Fin. Auth., Local Government Loan Program Rev. Bonds (Detroit Fin. Recovery Income Tax Local Project Bonds), Series 2014-F-1, 4.50% 2029 | | | 2,150 | | | | 2,400 | |
| Fin. Auth., Local Government Loan Program Rev. Bonds (Detroit Water and Sewerage Dept., Sewage Disposal System Rev. and Rev. Ref. Local Project Bonds), Series 2014-C-1, 5.00% 2044 | | | 6,050 | | | | 6,512 | |
| Fin. Auth., Local Government Loan Program Rev. Bonds (Detroit Water and Sewerage Dept., Sewage Disposal System Rev. and Rev. Ref. Local Project Bonds), Series 2014-C-3, Assured Guaranty Municipal insured, 5.00% 2023 | | | 8,000 | | | | 9,085 | |
| Fin. Auth., Local Government Loan Program Rev. Bonds (Detroit Water and Sewerage Dept., Sewage Disposal System Rev. Ref. Local Project Bonds), Series 2014-C-3, Assured Guaranty Municipal insured, 5.00% 2032 | | | 1,500 | | | | 1,738 | |
| Fin. Auth., Local Government Loan Program Rev. Bonds (Detroit Water and Sewerage Dept., Sewage Disposal System Rev. Ref. Local Project Bonds), Series 2015-C, 5.00% 2028 | | | 1,415 | | | | 1,681 | |
| Fin. Auth., Local Government Loan Program Rev. Bonds (Detroit Water and Sewerage Dept., Sewage Disposal System Rev. Ref. Local Project Bonds), Series 2015-C, 5.00% 2032 | | | 1,355 | | | | 1,592 | |
| Fin. Auth., Local Government Loan Program Rev. Bonds (Detroit Water and Sewerage Dept., Sewage Disposal System Rev. Ref. Local Project Bonds), Series 2015-C, 5.00% 2033 | | | 2,565 | | | | 3,009 | |
| Fin. Auth., Local Government Loan Program Rev. Bonds (Detroit Water and Sewerage Dept., Sewage Disposal System Rev. Ref. Local Project Bonds), Series 2015-C, 5.00% 2034 | | | 3,000 | | | | 3,514 | |
| Fin. Auth., Local Government Loan Program Rev. Bonds (Detroit Water and Sewerage Dept., Sewage Disposal System Rev. Ref. Local Project Bonds), Series 2015-C, 5.00% 2035 | | | 3,000 | | | | 3,508 | |
| Fin. Auth., Local Government Loan Program Rev. Bonds (Detroit Water and Sewerage Dept., Water Supply System Rev. Ref. Local Project Bonds), Series 2014-D-4, 5.00% 2034 | | | 1,425 | | | | 1,633 | |
| Housing Dev. Auth., Single Family Mortgage Rev. Bonds, Series 2018-A, 4.00% 2048 | | | 33,565 | | | | 36,529 | |
| City of Lansing, Board of Water and Light, Utility System Rev. Bonds, Series 2019-A, 5.00% 2044 | | | 44,000 | | | | 55,095 | |
| City of Lansing, Board of Water and Light, Utility System Rev. Bonds, Series 2019-A, 5.00% 2048 | | | 40,000 | | | | 49,796 | |
| Tobacco Settlement Fin. Auth., Tobacco Settlement Asset-Backed Rev. Bonds, Series 2008-A, 6.875% 2042 | | | 8,180 | | | | 8,269 | |
| Other securities | | | | | | | 578,615 | |
| | | | | | | | 1,029,076 | |
| | | | | | | | | |
| Mississippi 0.33% | | | | | | | | |
| Business Fin. Corp. Rev. Bonds (Mississippi Power Co. Project), Series 2010, 2.75% 2040 (put 2021) | | | 2,750 | | | | 2,800 | |
| Other securities | | | | | | | 77,395 | |
| | | | | | | | 80,195 | |
| | | | | | | | | |
| Nevada 1.52% | | | | | | | | |
| Las Vegas Convention and Visitors Auth., Convention Center Expansion Rev. Bonds, Series 2018-B, 5.00% 2043 | | | 34,565 | | | | 42,332 | |
| Other securities | | | | | | | 328,722 | |
| | | | | | | | 371,054 | |
| | | | | | | | | |
| New Jersey 2.03% | | | | | | | | |
| Housing and Mortgage Fin. Agcy., Single Family Housing Rev. Bonds, Series 2018-A, 4.50% 2048 | | | 37,470 | | | | 41,887 | |
| Other securities | | | | | | | 453,565 | |
| | | | | | | | 495,452 | |
| American Funds Tax-Exempt Funds | 27 |
The Tax-Exempt Bond Fund of America
| Bonds, notes & other debt instruments(continued) | Principal amount
(000) | | | Value
(000) | |
| New York 7.54% | | | | | | | | |
| Brooklyn Arena Local Dev. Corp., PILOT Rev. Ref. Bonds (Barclays Center), Series 2016-A, Assured Guaranty Municipal insured, 5.00% 2042 | | $ | 41,405 | | | $ | 47,542 | |
| Dormitory Auth., Mental Health Facs. Improvement Rev. Bonds, Series 2010-A, 5.00% 2021 | | | 5,000 | | | | 5,113 | |
| Dormitory Auth., Rev. Bonds (Fordham University), Series 2011-A, 5.50% 2036 (preref. 2021) | | | 650 | | | | 694 | |
| Dormitory Auth., Rev. Bonds (Icahn School of Medicine at Mount Sinai), Series 2015-A, 5.00% 2031 | | | 1,000 | | | | 1,181 | |
| Dormitory Auth., Rev. Bonds (Icahn School of Medicine at Mount Sinai), Series 2015-A, 5.00% 2033 | | | 7,500 | | | | 8,823 | |
| Dormitory Auth., Rev. Bonds (Icahn School of Medicine at Mount Sinai), Series 2015-A, 5.00% 2040 | | | 500 | | | | 579 | |
| Dormitory Auth., Rev. Bonds (Langone Hospitals Obligated Group), Series 2020-A, 4.00% 2053 | | | 3,250 | | | | 3,749 | |
| Dormitory Auth., Rev. Bonds (Montefiore Obligated Group), Series 2018-A, 5.00% 2030 | | | 1,000 | | | | 1,255 | |
| Dormitory Auth., Rev. Bonds (New York University), Series 1998-A, National insured, 5.75% 2027 | | | 9,710 | | | | 11,760 | |
| Dormitory Auth., Rev. Bonds (New York University), Series 2018-A, 5.00% 2031 | | | 1,000 | | | | 1,301 | |
| Dormitory Auth., Rev. Bonds (New York University), Series 2018-A, 5.00% 2036 | | | 1,500 | | | | 1,918 | |
| Dormitory Auth., Rev. Bonds (New York University), Series 2018-A, 5.00% 2038 | | | 2,000 | | | | 2,537 | |
| Dormitory Auth., Rev. Bonds (North Shore-Long Island Jewish Obligated Group), Series 2011-A, 5.00% 2032 (preref. 2021) | | | 11,000 | | | | 11,564 | |
| Dormitory Auth., Rev. Bonds (NYU Hospitals Center), Series 2014, 5.00% 2036 | | | 650 | | | | 750 | |
| Dormitory Auth., Rev. Bonds (Orange Regional Medical Center Obligated Group), Series 2015, 5.00% 20313 | | | 500 | | | | 578 | |
| Dormitory Auth., Rev. Bonds (State University of New York Dormitory Facs.), Series 2019-A, 4.00% 2038 | | | 1,070 | | | | 1,250 | |
| Dormitory Auth., Rev. Bonds (State University of New York Dormitory Facs.), Series 2019-A, 4.00% 2043 | | | 1,200 | | | | 1,382 | |
| Dormitory Auth., Rev. Bonds (State University of New York Dormitory Facs.), Series 2019-A, 4.00% 2049 | | | 2,625 | | | | 2,995 | |
| Dormitory Auth., Rev. Ref. Bonds (Mount Sinai Hospital Obligated Group), Series 2010-A, 5.00% 2026 (preref. 2020) | | | 1,250 | | | | 1,271 | |
| Dormitory Auth., School Dist. Rev. Bond Fncg. Program Rev. Bonds, Series 2012-F, Assured Guaranty Municipal insured, 5.00% 2020 | | | 1,100 | | | | 1,130 | |
| Dormitory Auth., School Dist. Rev. Bond Fncg. Program Rev. Bonds, Series 2016-E, BAM insured, 5.00% 2026 | | | 1,000 | | | | 1,256 | |
| Dormitory Auth., School Dist. Rev. Bond Fncg. Program Rev. Bonds, Series 2018-A, 5.00% 2022 | | | 5,000 | | | | 5,545 | |
| Dormitory Auth., Secured Hospital Rev. Ref. Bonds (Interfaith Medical Center), Series 2007, 5.00% 2020 | | | 3,400 | | | | 3,403 | |
| Dormitory Auth., State Personal Income Tax Rev. Bonds (Education), Series 2014-C, Group A, 5.00% 2024 | | | 5,000 | | | | 5,840 | |
| Dormitory Auth., State Personal Income Tax Rev. Bonds (General Purpose), Series 2011-A, 5.00% 2033 | | | 8,760 | | | | 9,151 | |
| Dormitory Auth., State Personal Income Tax Rev. Bonds (General Purpose), Series 2011-C, 5.00% 2041 | | | 1,890 | | | | 1,974 | |
| Dormitory Auth., State Personal Income Tax Rev. Bonds (General Purpose), Series 2014-A, 5.00% 2030 | | | 2,500 | | | | 2,898 | |
| Dormitory Auth., State Personal Income Tax Rev. Bonds (General Purpose), Series 2015-A, 5.00% 2034 | | | 4,390 | | | | 5,204 | |
| Dormitory Auth., State Personal Income Tax Rev. Bonds (General Purpose), Series 2017-A, 5.00% 2032 | | | 1,500 | | | | 1,863 | |
| Dormitory Auth., State Personal Income Tax Rev. Bonds (General Purpose), Series 2017-B, 5.00% 2035 | | | 17,005 | | | | 21,250 | |
| Dormitory Auth., State Personal Income Tax Rev. Bonds (General Purpose), Series 2018-A, 5.00% 2040 | | | 2,000 | | | | 2,506 | |
| Dormitory Auth., State Personal Income Tax Rev. Bonds (General Purpose), Series 2019-A, 5.00% 2037 | | | 1,500 | | | | 1,919 | |
| Dormitory Auth., State Personal Income Tax Rev. Bonds (General Purpose), Series 2019-A, 5.00% 2042 | | | 5,000 | | | | 6,293 | |
| Dormitory Auth., State Personal Income Tax Rev. Bonds (General Purpose), Series 2019-A, 5.00% 2043 | | | 10,100 | | | | 12,685 | |
| Dormitory Auth., State Personal Income Tax Rev. Bonds (General Purpose), Series 2019-A, 5.00% 2047 | | | 13,000 | | | | 16,209 | |
| 28 | American Funds Tax-Exempt Funds |
The Tax-Exempt Bond Fund of America
| | Principal amount
(000) | | | Value
(000) | |
| Dormitory Auth., State Personal Income Tax Rev. Bonds (General Purpose), Series 2019-D, 4.00% 2038 | | $ | 4,000 | | | $ | 4,743 | |
| Dormitory Auth., State Personal Income Tax Rev. Bonds (General Purpose), Series 2019-D, 4.00% 2040 | | | 12,475 | | | | 14,695 | |
| Dormitory Auth., State Personal Income Tax Rev. Bonds (General Purpose), Series 2019-D, 4.00% 2047 | | | 40,000 | | | | 46,372 | |
| Dormitory Auth., State Sales Tax Rev. Bonds, Series 2017-B, 5.00% 2033 | | | 3,000 | | | | 3,741 | |
| Dormitory Auth., State Sales Tax Rev. Bonds, Series 2018-A, 5.00% 2034 | | | 10,000 | | | | 12,722 | |
| Long Island Power Auth., Electric System General Rev. Bonds, Series 2015-C, (1-month USD-LIBOR x 0.70 + 0.75%) 1.996% 2033 (put 2023)1 | | | 62,600 | | | | 63,128 | |
| Metropolitan Transportation Auth., Dedicated Tax Fund Green Bonds, Series 2016-B-1, 5.00% 2036 | | | 5,000 | | | | 6,175 | |
| Metropolitan Transportation Auth., Dedicated Tax Fund Rev. Ref. Bonds, Series 2002-B-3D, (SIFMA Municipal Swap Index + 1.00%) 1.94% 20201 | | | 11,100 | | | | 11,156 | |
| Metropolitan Transportation Auth., Transportation Rev. Bonds, Series 2003-B, FGIC-National insured, 5.25% 2021 | | | 5,000 | | | | 5,376 | |
| Metropolitan Transportation Auth., Transportation Rev. Bonds, Series 2011-D, 5.00% 2036 (preref. 2021) | | | 6,000 | | | | 6,457 | |
| Metropolitan Transportation Auth., Transportation Rev. Bonds, Series 2014-B, 5.00% 2044 | | | 13,000 | | | | 14,684 | |
| Metropolitan Transportation Auth., Transportation Rev. Bonds, Series 2014-D-2, (SIFMA Municipal Swap Index + 0.45%) 1.39% 2044 (put 2022)1 | | | 7,500 | | | | 7,505 | |
| Metropolitan Transportation Auth., Transportation Rev. Bonds, Series 2015-A-1, 5.00% 2045 | | | 23,845 | | | | 27,654 | |
| Metropolitan Transportation Auth., Transportation Rev. Bonds, Series 2015-A-2, (SIFMA Municipal Swap Index + 0.58%) 1.52% 2039 (put 2020)1 | | | 13,000 | | | | 13,001 | |
| Metropolitan Transportation Auth., Transportation Rev. Bonds, Series 2015-C-1, 5.00% 2035 | | | 6,000 | | | | 7,154 | |
| Metropolitan Transportation Auth., Transportation Rev. Green Bonds, Series 2017-A-1, 5.00% 2032 | | | 1,500 | | | | 1,865 | |
| Metropolitan Transportation Auth., Transportation Rev. Green Bonds, Series 2019-B, 5.00% 2052 | | | 4,000 | | | | 4,897 | |
| Metropolitan Transportation Auth., Transportation Rev. Green Bonds, Series 2020-A-1, 4.00% 2053 | | | 2,000 | | | | 2,264 | |
| Metropolitan Transportation Auth., Transportation Rev. Ref. Bonds, Series 2002-D-1, 5.00% 2025 (escrowed to maturity) | | | 4,545 | | | | 5,041 | |
| Metropolitan Transportation Auth., Transportation Rev. Ref. Bonds, Series 2002-D-2A, Assured Guaranty Municipal insured, (1-month USD-LIBOR x 0.69 + 0.68%) 1.908% 2032 (put 2021)1 | | | 2,000 | | | | 2,006 | |
| Metropolitan Transportation Auth., Transportation Rev. Ref. Bonds, Series 2002-D-2B, Assured Guaranty Municipal insured, (1-month USD-LIBOR x 0.69 + 0.30%) 1.528% 2032 (put 2021)1 | | | 15,000 | | | | 14,976 | |
| Metropolitan Transportation Auth., Transportation Rev. Ref. Bonds, Series 2005-D-1, (1-month USD-LIBOR x 0.67 + 0.65%) 1.843% 2035 (put 2021)1 | | | 4,790 | | | | 4,795 | |
| Metropolitan Transportation Auth., Transportation Rev. Ref. Bonds, Series 2011-C, 5.00% 2023 | | | 3,405 | | | | 3,648 | |
| Metropolitan Transportation Auth., Transportation Rev. Ref. Bonds, Series 2011-C, 5.00% 2023 (preref. 2021) | | | 1,595 | | | | 1,716 | |
| Metropolitan Transportation Auth., Transportation Rev. Ref. Bonds, Series 2012-D, 5.00% 2024 | | | 8,000 | | | | 8,890 | |
| Metropolitan Transportation Auth., Transportation Rev. Ref. Bonds, Series 2012-D, 5.00% 2029 | | | 7,000 | | | | 7,758 | |
| Metropolitan Transportation Auth., Transportation Rev. Ref. Bonds, Series 2012-D, 5.00% 2032 | | | 3,105 | | | | 3,435 | |
| Metropolitan Transportation Auth., Transportation Rev. Ref. Bonds, Series 2012-F, 5.00% 2030 | | | 10,000 | | | | 11,076 | |
| Metropolitan Transportation Auth., Transportation Rev. Ref. Bonds, Series 2014-A-2, 5.00% 2028 (preref. 2023) | | | 3,000 | | | | 3,479 | |
| Metropolitan Transportation Auth., Transportation Rev. Ref. Bonds, Series 2016-B, 5.00% 2037 | | | 1,495 | | | | 1,802 | |
| Metropolitan Transportation Auth., Transportation Rev. Ref. Bonds, Series 2017-D, 5.00% 2035 | | | 4,885 | | | | 6,060 | |
| Metropolitan Transportation Auth., Transportation Rev. Ref. Green Bonds, Capital Appreciation Bonds, Series 2017-C-2, 0% 2027 | | | 1,500 | | | | 1,313 | |
| Metropolitan Transportation Auth., Transportation Rev. Ref. Green Bonds, Capital Appreciation Bonds, Series 2017-C-2, 0% 2029 | | | 1,500 | | | | 1,239 | |
| American Funds Tax-Exempt Funds | 29 |
The Tax-Exempt Bond Fund of America
| Bonds, notes & other debt instruments(continued) | Principal amount
(000) | | | Value
(000) | |
| New York (continued) | | | | | | | | |
| Metropolitan Transportation Auth., Transportation Rev. Ref. Green Bonds, Capital Appreciation Bonds, Series 2017-C-2, 0% 2032 | | $ | 5,000 | | | $ | 3,769 | |
| Metropolitan Transportation Auth., Transportation Rev. Ref. Green Bonds, Series 2017-A-2, 5.00% 2030 | | | 1,000 | | | | 1,244 | |
| Metropolitan Transportation Auth., Transportation Rev. Ref. Green Bonds, Series 2017-B, 5.00% 2024 | | | 4,330 | | | | 5,139 | |
| Metropolitan Transportation Auth., Transportation Rev. Ref. Green Bonds, Series 2017-C-1, 4.00% 2034 | | | 2,500 | | | | 2,889 | |
| Metropolitan Transportation Auth., Transportation Rev. Ref. Green Bonds, Series 2017-C-1, 4.00% 2035 | | | 5,000 | | | | 5,754 | |
| Metropolitan Transportation Auth., Transportation Rev. Ref. Green Bonds, Series 2017-C-1, 4.00% 2036 | | | 3,000 | | | | 3,441 | |
| Metropolitan Transportation Auth., Transportation Rev. Ref. Green Bonds, Series 2017-C-1, 5.00% 2026 | | | 11,500 | | | | 14,362 | |
| Metropolitan Transportation Auth., Transportation Rev. Ref. Green Bonds, Series 2017-C-1, 5.00% 2028 | | | 5,500 | | | | 7,054 | |
| Metropolitan Transportation Auth., Transportation Rev. Ref. Green Bonds, Series 2017-C-1, 5.00% 2029 | | | 6,000 | | | | 7,618 | |
| Metropolitan Transportation Auth., Transportation Rev. Ref. Green Bonds, Series 2017-C-1, 5.00% 2030 | | | 1,000 | | | | 1,259 | |
| Metropolitan Transportation Auth., Transportation Rev. Ref. Green Bonds, Series 2017-C-1, 5.00% 2031 | | | 1,000 | | | | 1,253 | |
| Metropolitan Transportation Auth., Transportation Rev. Ref. Green Bonds, Series 2017-C-1, 5.00% 2033 | | | 1,000 | | | | 1,246 | |
| Metropolitan Transportation Auth., Transportation Rev. Ref. Green Bonds, Series 2019-A-2, 5.00% 2045 | | | 20,000 | | | | 24,460 | |
| New York City G.O. Bonds, Fiscal 2006, Series 2006-J-2, Assured Guaranty Municipal insured, 1.19% 20361 | | | 2,625 | | | | 2,625 | |
| New York City G.O. Bonds, Fiscal 2013, Series 2013-F-1, 5.00% 2037 | | | 3,000 | | | | 3,341 | |
| New York City G.O. Bonds, Fiscal 2013, Series 2013-H, 5.00% 2023 | | | 2,475 | | | | 2,827 | |
| New York City G.O. Bonds, Fiscal 2013, Series 2013-J, 5.00% 2023 | | | 500 | | | | 571 | |
| New York City G.O. Bonds, Fiscal 2014, Series 2014-G, 5.00% 2023 | | | 2,500 | | | | 2,856 | |
| New York City G.O. Bonds, Fiscal 2014, Series 2014-J, 5.00% 2030 | | | 2,000 | | | | 2,348 | |
| New York City G.O. Bonds, Fiscal 2015, Series 2015-A, 5.00% 2024 | | | 5,500 | | | | 6,499 | |
| New York City G.O. Bonds, Fiscal 2015, Series 2015-C, 5.00% 2028 | | | 1,000 | | | | 1,191 | |
| New York City G.O. Bonds, Fiscal 2015, Series 2015-C, 5.00% 2030 | | | 10,000 | | | | 11,856 | |
| New York City G.O. Bonds, Fiscal 2015, Series 2015-C, 5.00% 2032 | | | 3,500 | | | | 4,133 | |
| New York City G.O. Bonds, Fiscal 2015, Series 2015-C, 5.00% 2033 | | | 1,000 | | | | 1,179 | |
| New York City G.O. Bonds, Fiscal 2015, Series 2015-D, 5.00% 2030 | | | 2,560 | | | | 3,035 | |
| New York City G.O. Bonds, Fiscal 2016, Series 2016-A, 5.00% 2026 | | | 8,000 | | | | 9,756 | |
| New York City G.O. Bonds, Fiscal 2017, Series 2017-A-1, 5.00% 2030 | | | 740 | | | | 913 | |
| New York City G.O. Bonds, Fiscal 2017, Series 2017-A-1, 5.00% 2037 | | | 2,000 | | | | 2,435 | |
| New York City G.O. Bonds, Fiscal 2017, Series 2017-B-1, 5.00% 2032 | | | 1,500 | | | | 1,856 | |
| New York City G.O. Bonds, Fiscal 2017, Series 2017-B-1, 5.00% 2034 | | | 1,000 | | | | 1,234 | |
| New York City G.O. Bonds, Fiscal 2017, Series 2017-B-1, 5.00% 2037 | | | 2,500 | | | | 3,067 | |
| New York City G.O. Bonds, Fiscal 2017, Series 2017-B-1, 5.00% 2038 | | | 1,500 | | | | 1,838 | |
| New York City G.O. Bonds, Fiscal 2017, Series 2017-B-1, 5.00% 2041 | | | 1,500 | | | | 1,838 | |
| New York City G.O. Bonds, Fiscal 2017, Series 2017-C, 5.00% 2026 | | | 5,000 | | | | 6,273 | |
| New York City G.O. Bonds, Fiscal 2017, Series 2017-C, 5.00% 2028 | | | 2,200 | | | | 2,777 | |
| New York City G.O. Bonds, Fiscal 2018, Series 2018-A, 5.00% 2026 | | | 10,000 | | | | 12,547 | |
| New York City G.O. Bonds, Fiscal 2018, Series 2018-A, 5.00% 2027 | | | 1,500 | | | | 1,927 | |
| New York City G.O. Bonds, Fiscal 2018, Series 2018-A, 5.00% 2028 | | | 1,000 | | | | 1,280 | |
| New York City G.O. Bonds, Fiscal 2018, Series 2018-B-1, 5.00% 2035 | | | 2,950 | | | | 3,683 | |
| New York City G.O. Bonds, Fiscal 2018, Series 2018-C, 5.00% 2026 | | | 1,500 | | | | 1,882 | |
| New York City G.O. Bonds, Fiscal 2018, Series 2018-C, 5.00% 2029 | | | 4,800 | | | | 6,195 | |
| New York City G.O. Bonds, Fiscal 2018, Series 2018-C, 5.00% 2030 | | | 8,075 | | | | 10,377 | |
| New York City G.O. Bonds, Fiscal 2018, Series 2018-C, 5.00% 2031 | | | 3,620 | | | | 4,623 | |
| New York City G.O. Bonds, Fiscal 2018, Series 2018-E-1, 5.00% 2032 | | | 2,575 | | | | 3,277 | |
| New York City G.O. Bonds, Fiscal 2018, Series 2018-E-1, 5.00% 2037 | | | 6,345 | | | | 7,939 | |
| New York City G.O. Bonds, Fiscal 2018, Series 2018-E-1, 5.00% 2044 | | | 5,000 | | | | 6,137 | |
| New York City G.O. Bonds, Fiscal 2018, Series 2018-F-1, 5.00% 2037 | | | 2,000 | | | | 2,507 | |
| New York City G.O. Bonds, Fiscal 2019, Series 2019-D-1, 5.00% 2037 | | | 5,000 | | | | 6,346 | |
| New York City G.O. Bonds, Fiscal 2019, Series 2019-E, 5.00% 2033 | | | 1,000 | | | | 1,294 | |
| New York City G.O. Bonds, Fiscal 2019, Series 2019-E, 5.00% 2034 | | | 2,250 | | | | 2,900 | |
| 30 | American Funds Tax-Exempt Funds |
The Tax-Exempt Bond Fund of America
| | Principal amount
(000) | | | Value
(000) | |
| New York City G.O. Bonds, Fiscal 2020, Series 2019-A-1, 5.00% 2041 | | $ | 13,900 | | | $ | 17,676 | |
| New York City G.O. Bonds, Fiscal 2020, Series 2019-A-1, 5.00% 2043 | | | 10,000 | | | | 12,645 | |
| New York City G.O. Bonds, Fiscal 2020, Series 2019-B-1, 4.00% 2039 | | | 1,000 | | | | 1,177 | |
| New York City G.O. Bonds, Fiscal 2020, Series 2019-B-1, 4.00% 2040 | | | 2,500 | | | | 2,936 | |
| New York City G.O. Bonds, Fiscal 2020, Series 2019-B-1, 5.00% 2036 | | | 10,000 | | | | 12,974 | |
| New York City G.O. Bonds, Fiscal 2020, Series 2019-B-1, 5.00% 2038 | | | 7,500 | | | | 9,654 | |
| New York City G.O. Bonds, Fiscal 2020, Series 2019-B-1, 5.00% 2039 | | | 6,810 | | | | 8,735 | |
| New York City G.O. Bonds, Fiscal 2020, Series 2019-B-1, 5.00% 2042 | | | 6,000 | | | | 7,633 | |
| New York City G.O. Bonds, Fiscal 2020, Series 2019-B-1, 5.00% 2043 | | | 5,000 | | | | 6,341 | |
| New York City Transitional Fin. Auth., Building Aid Rev. Bonds, Fiscal 2012, Series 2012-S-1A, 5.00% 2032 | | | 6,400 | | | | 6,777 | |
| New York City Transitional Fin. Auth., Building Aid Rev. Bonds, Fiscal 2013, Series 2013-S-1, 5.00% 2033 | | | 1,825 | | | | 1,998 | |
| New York City Transitional Fin. Auth., Building Aid Rev. Bonds, Fiscal 2018, Series 2018-S-1, 5.00% 2035 | | | 3,295 | | | | 4,105 | |
| New York City Transitional Fin. Auth., Building Aid Rev. Bonds, Fiscal 2018, Series 2018-S-2, 5.00% 2034 | | | 4,000 | | | | 5,076 | |
| New York City Transitional Fin. Auth., Building Aid Rev. Bonds, Fiscal 2018, Series 2018-S-3, 5.00% 2033 | | | 4,320 | | | | 5,509 | |
| New York City Transitional Fin. Auth., Building Aid Rev. Bonds, Fiscal 2018, Series 2018-S-3, 5.00% 2037 | | | 10,000 | | | | 12,567 | |
| New York City Transitional Fin. Auth., Building Aid Rev. Bonds, Fiscal 2018, Series 2018-S-3, 5.00% 2038 | | | 4,000 | | | | 5,007 | |
| New York City Transitional Fin. Auth., Building Aid Rev. Bonds, Fiscal 2018, Series 2018-S-4A, 5.00% 2034 | | | 4,000 | | | | 5,076 | |
| New York City Transitional Fin. Auth., Building Aid Rev. Bonds, Fiscal 2018, Series 2018-S-4A, 5.00% 2035 | | | 3,000 | | | | 3,737 | |
| New York City Transitional Fin. Auth., Building Aid Rev. Bonds, Fiscal 2018, Series 2018-S-4A, 5.00% 2037 | | | 19,250 | | | | 24,191 | |
| New York City Transitional Fin. Auth., Building Aid Rev. Bonds, Fiscal 2019, Series 2019-S-1, 4.00% 2037 | | | 5,135 | | | | 5,963 | |
| New York City Transitional Fin. Auth., Building Aid Rev. Bonds, Fiscal 2019, Series 2019-S-3, 5.00% 2035 | | | 5,000 | | | | 6,325 | |
| New York City Transitional Fin. Auth., Future Tax Secured Bonds, Fiscal 2013, Series 2013-F-1, 5.00% 2020 | | | 100 | | | | 100 | |
| New York City Transitional Fin. Auth., Future Tax Secured Bonds, Fiscal 2013, Series 2013-F-1, 5.00% 2028 | | | 1,500 | | | | 1,680 | |
| New York City Transitional Fin. Auth., Future Tax Secured Bonds, Fiscal 2013, Series 2013-F-1, 5.00% 2036 | | | 1,000 | | | | 1,114 | |
| New York City Transitional Fin. Auth., Future Tax Secured Bonds, Fiscal 2013, Series 2020-A-2, 5.00% 2040 | | | 55,000 | | | | 69,925 | |
| New York City Transitional Fin. Auth., Future Tax Secured Bonds, Fiscal 2015, Series 2015-C, 5.00% 2027 | | | 5,000 | | | | 6,026 | |
| New York City Transitional Fin. Auth., Future Tax Secured Bonds, Fiscal 2017, Series 2017-A-1, 5.00% 2035 | | | 1,000 | | | | 1,222 | |
| New York City Transitional Fin. Auth., Future Tax Secured Bonds, Fiscal 2017, Series 2017-C, 5.00% 2031 | | | 3,750 | | | | 4,708 | |
| New York City Transitional Fin. Auth., Future Tax Secured Bonds, Fiscal 2017, Series 2017-E-1, 5.00% 2043 | | | 2,500 | | | | 3,029 | |
| New York City Transitional Fin. Auth., Future Tax Secured Bonds, Fiscal 2017, Series 2017-F-1, 5.00% 2034 | | | 5,000 | | | | 6,240 | |
| New York City Transitional Fin. Auth., Future Tax Secured Bonds, Fiscal 2017, Series 2017-F-1, 5.00% 2035 | | | 5,000 | | | | 6,227 | |
| New York City Transitional Fin. Auth., Future Tax Secured Bonds, Fiscal 2017, Series 2017-F-1, 5.00% 2039 | | | 1,750 | | | | 2,151 | |
| New York City Transitional Fin. Auth., Future Tax Secured Bonds, Fiscal 2018, Series 2018-A-2, 5.00% 2035 | | | 10,000 | | | | 12,526 | |
| New York City Transitional Fin. Auth., Future Tax Secured Bonds, Fiscal 2018, Series 2018-B-1, 5.00% 2033 | | | 10,000 | | | | 12,579 | |
| New York City Transitional Fin. Auth., Future Tax Secured Bonds, Fiscal 2018, Series 2018-B-1, 5.00% 2045 | | | 2,500 | | | | 3,053 | |
| New York City Transitional Fin. Auth., Future Tax Secured Bonds, Fiscal 2019, Series 2019-A-1, 5.00% 2023 | | | 4,300 | | | | 4,909 | |
| American Funds Tax-Exempt Funds | 31 |
The Tax-Exempt Bond Fund of America
| Bonds, notes & other debt instruments(continued) | Principal amount
(000) | | | Value
(000) | |
| New York (continued) | | | | | | | | |
| New York City Transitional Fin. Auth., Future Tax Secured Bonds, Fiscal 2019, Series 2019-A-1, 5.00% 2035 | | $ | 6,000 | | | $ | 7,640 | |
| New York City Transitional Fin. Auth., Future Tax Secured Bonds, Fiscal 2019, Series 2019-A-1, 5.00% 2037 | | | 3,000 | | | | 3,789 | |
| New York City Transitional Fin. Auth., Future Tax Secured Bonds, Fiscal 2019, Series 2019-A-1, 5.00% 2038 | | | 9,660 | | | | 12,146 | |
| New York City Transitional Fin. Auth., Future Tax Secured Bonds, Fiscal 2019, Series 2019-C-1, 5.00% 2034 | | | 5,000 | | | | 6,488 | |
| New York City Transitional Fin. Auth., Future Tax Secured Bonds, Fiscal 2020, Series 2019-B-1, 4.00% 2043 | | | 10,000 | | | | 11,666 | |
| New York City Transitional Fin. Auth., Future Tax Secured Rev. Ref. Bonds, Fiscal 2015, Series 2015-A-1, 5.00% 2037 | | | 2,500 | | | | 2,905 | |
| New York City Transitional Fin. Auth., Future Tax Secured Rev. Ref. Bonds, Fiscal 2015, Series 2015-E-1, 5.00% 2031 | | | 5,000 | | | | 5,946 | |
| New York City Transitional Fin. Auth., Future Tax Secured Rev. Ref. Bonds, Fiscal 2016, Series 2016-A-1, 5.00% 2034 | | | 8,000 | | | | 9,608 | |
| New York City Transitional Fin. Auth., Future Tax Secured Rev. Ref. Bonds, Fiscal 2016, Series 2016-A-1, 5.00% 2036 | | | 4,000 | | | | 4,792 | |
| New York City Transitional Fin. Auth., Future Tax Secured Rev. Ref. Bonds, Fiscal 2016, Series 2016-A-1, 5.00% 2037 | | | 2,000 | | | | 2,394 | |
| Other securities | | | | | | | 711,476 | |
| | | | | | | | 1,843,482 | |
| | | | | | | | | |
| North Carolina 0.82% | | | | | | | | |
| University of North Carolina at Chapel Hill, General Rev. Bonds, Series 2012-B, (1-month USD-LIBOR x 0.67 + 0.40%) 1.593% 2041 (put 2022)1 | | | 52,050 | | | | 52,147 | |
| Other securities | | | | | | | 149,162 | |
| | | | | | | | 201,309 | |
| | | | | | | | | |
| Pennsylvania 5.04% | | | | | | | | |
| Turnpike Commission, Turnpike Rev. Bonds, Series 2019-A, 5.00% 2049 | | | 37,915 | | | | 47,431 | |
| University of Pittsburgh - Of the Commonwealth System of Higher Education, PANTHERS, Series 2018, (SIFMA Municipal Swap Index + 0.24%) 1.18% 20211 | | | 42,235 | | | | 42,307 | |
| Other securities | | | | | | | 1,142,036 | |
| | | | | | | | 1,231,774 | |
| | | | | | | | | |
| South Carolina 1.37% | | | | | | | | |
| Jobs-Econ. Dev. Auth., Hospital Rev. Bonds (Prisma Health Obligated Group), Series 2018-A, 5.00% 2048 | | | 32,000 | | | | 37,893 | |
| Other securities | | | | | | | 296,165 | |
| | | | | | | | 334,058 | |
| | | | | | | | | |
| Texas 11.36% | | | | | | | | |
| Grand Parkway Transportation Corp., Grand Parkway System Toll Rev. Bonds, Series 2013-B, 5.00% 2053 | | | 32,800 | | | | 36,553 | |
| County of Harris, Toll Road Rev. Ref. Bonds, Series 2012-B, (SIFMA Municipal Swap Index + 0.45%) 1.45% 2021 | | | 46,595 | | | | 46,763 | |
| North Texas Tollway Auth., System Rev. Ref. Bonds, Series 2017-A, 5.00% 2043 | | | 43,195 | | | | 52,882 | |
| Water Dev. Board, State Water Implementation Rev. Fund, Rev. Bonds (Master Trust), Series 2019-A, 4.00% 2044 | | | 43,550 | | | | 50,703 | |
| Other securities | | | | | | | 2,590,249 | |
| | | | | | | | 2,777,150 | |
| | | | | | | | | |
| Utah 0.38% | | | | | | | | |
| Transit Auth., Sales Tax Rev. and Rev. Ref. Bonds, Series 2007-A, National insured, 5.00% 2035 | | | 38,270 | | | | 53,405 | |
| Other securities | | | | | | | 40,500 | |
| | | | | | | | 93,905 | |
| 32 | American Funds Tax-Exempt Funds |
The Tax-Exempt Bond Fund of America
| | Principal amount
(000) | | | Value
(000) | |
| Virginia 2.05% | | | | | | | | |
| City of Newport News, Industrial Dev. Auth., Health Systems Rev. Ref. Bonds (Custodial Receipts), Series 2015, 5.33% 20453 | | $ | 41,100 | | | $ | 45,406 | |
| Other securities | | | | | | | 455,136 | |
| | | | | | | | 500,542 | |
| | | | | | | | | |
| Washington 2.61% | | | | | | | | |
| Convention Center Public Facs. Dist., Lodging Tax Bonds, Series 2010-B, 5.00% 2043 | | | 35,000 | | | | 42,926 | |
| Health Care Facs. Auth., Rev. Bonds (Catholic Health Initiatives), Series 2013-B-1, (SIFMA Municipal Swap Index + 1.00%) 1.94% 2035 (put 2021)1 | | | 49,750 | | | | 49,825 | |
| Other securities | | | | | | | 545,943 | |
| | | | | | | | 638,694 | |
| | | | | | | | | |
| Other states & U.S. territories 22.30% | | | | | | | | |
| Other securities | | | | | | | 5,450,084 | |
| | | | | | | | | |
| Total bonds, notes & other debt instruments (cost: $21,831,950,000) | | | | | | | 23,256,208 | |
| | | | | | | | | |
| Short-term securities 5.35% | | | | | | | | |
| State of Alaska, City of Valdez, Marine Terminal Rev. Ref. Bonds (Exxon Pipeline Co. Project), Series 1985, 1.19% 20251 | | | 41,540 | | | | 41,540 | |
| State of Alaska, City of Valdez, Marine Terminal Rev. Ref. Bonds (ExxonMobil Project), Series 2001, 1.19% 20291 | | | 5,845 | | | | 5,845 | |
| State of Illinois, Fin. Auth., Demand Rev. Bonds (University of Chicago Medical Center), Series 2011-A, 1.18% 20441 | | | 22,200 | | | | 22,200 | |
| State of Illinois, Fin. Auth., Rev. Bonds (Lutheran Life Communities Obligated Group), Series 2019-A, 4.00% 11/1/2020 | | | 315 | | | | 319 | |
| State of Louisiana, Parish of East Baton Rouge, Industrial Dev. Board, Gulf Opportunity Zone Rev. Bonds (ExxonMobil Project), Series 2010-B, 1.19% 20401 | | | 42,100 | | | | 42,100 | |
| State of Louisiana, Parish of East Baton Rouge, Industrial Dev. Board, Gulf Opportunity Zone Rev. Bonds (ExxonMobil Project), Series 2011, 1.19% 20511 | | | 11,100 | | | | 11,100 | |
| State of Louisiana, Parish of East Baton Rouge, Pollution Control Rev. Ref. Bonds (ExxonMobil Project), Series 2010-A, 1.19% 20351 | | | 89,300 | | | | 89,300 | |
| State of Louisiana, Public Facs. Auth., Rev. Bonds (Air Products and Chemicals Project), Series 2006, 1.18% 20401 | | | 3,800 | | | | 3,800 | |
| State of Louisiana, Public Facs. Auth., Rev. Bonds (Air Products and Chemicals Project), Series 2007, 1.18% 20421 | | | 1,000 | | | | 1,000 | |
| State of Louisiana, Public Facs. Auth., Rev. Bonds (Air Products and Chemicals Project), Series 2008, 1.18% 20431 | | | 18,000 | | | | 18,000 | |
| State of Louisiana, Public Facs. Auth., Rev. Bonds (Air Products and Chemicals Project), Series 2008-A, 1.20% 20431 | | | 27,650 | | | | 27,650 | |
| State of Massachusetts, Health and Educational Facs. Auth., IAM Commercial Paper (Harvard University Issue), Series 2020-EE, 1.00% 5/18/2020 | | | 50,000 | | | | 50,000 | |
| State of Massachusetts, Health and Educational Facs. Auth., Rev. Bonds (Partners Healthcare System Issue), Series 2007-C, Assured Guaranty Municipal insured, 1.10% 20421 | | | 7,530 | | | | 7,530 | |
| State of Michigan, Fin. Auth., Hospital Rev. Bonds (CHE Trinity Health Credit Group), Series 2013-1, 1.16% 2034 (put 2020)4 | | | 5,250 | | | | 5,251 | |
| State of Michigan, Fin. Auth., State Aid Rev. Bonds, Series 2019-A, 2.00% 8/20/2020 | | | 6,500 | | | | 6,535 | |
| State of Mississippi, Business Fin. Corp., Gulf Opportunity Zone Industrial Dev. Rev. Bonds (Chevron U.S.A. Inc. Project), Series 2007-A, 1.19% 20301 | | | 79,500 | | | | 79,500 | |
| State of Mississippi, Business Fin. Corp., Gulf Opportunity Zone Industrial Dev. Rev. Bonds (Chevron U.S.A. Inc. Project), Series 2007-D, 1.19% 20301 | | | 30,030 | | | | 30,030 | |
| State of Mississippi, Business Fin. Corp., Gulf Opportunity Zone Industrial Dev. Rev. Bonds (Chevron U.S.A. Inc. Project), Series 2009-D, 1.19% 20301 | | | 34,000 | | | | 34,000 | |
| State of Mississippi, Business Fin. Corp., Gulf Opportunity Zone Industrial Dev. Rev. Bonds (Chevron U.S.A. Inc. Project), Series 2009-F, 1.20% 20301 | | | 3,300 | | | | 3,300 | |
| State of Mississippi, Business Fin. Corp., Gulf Opportunity Zone Industrial Dev. Rev. Bonds (Chevron U.S.A. Inc. Project), Series 2010-E, 0.89% 20301 | | | 2,200 | | | | 2,200 | |
| State of Mississippi, Business Fin. Corp., Gulf Opportunity Zone Industrial Dev. Rev. Bonds (Chevron U.S.A. Inc. Project), Series 2010-G, 1.20% 20351 | | | 1,300 | | | | 1,300 | |
| American Funds Tax-Exempt Funds | 33 |
The Tax-Exempt Bond Fund of America
| Short-term securities (continued) | Principal amount
(000) | | | Value
(000) | |
| State of Mississippi, Business Fin. Corp., Gulf Opportunity Zone Industrial Dev. Rev. Bonds (Chevron U.S.A. Inc. Project), Series 2010-J, 1.19% 20351 | | $ | 47,710 | | | $ | 47,710 | |
| State of Mississippi, Business Fin. Corp., Gulf Opportunity Zone Industrial Dev. Rev. Bonds (Chevron U.S.A. Inc. Project), Series 2010-L, 1.20% 20351 | | | 1,300 | | | | 1,300 | |
| State of Mississippi, Business Fin. Corp., Gulf Opportunity Zone Industrial Dev. Rev. Bonds (Chevron U.S.A. Inc. Project), Series 2011-E, 1.19% 20351 | | | 17,850 | | | | 17,850 | |
| State of Mississippi, Business Fin. Corp., Gulf Opportunity Zone Industrial Dev. Rev. Bonds (Chevron U.S.A. Inc. Project), Series 2011-F, 1.19% 20351 | | | 19,290 | | | | 19,290 | |
| State of Mississippi, Business Fin. Corp., Gulf Opportunity Zone Industrial Dev. Rev. Bonds (Chevron U.S.A. Inc. Project), Series 2011-G, 1.20% 20351 | | | 5,790 | | | | 5,790 | |
| State of New York, Dormitory Auth., IAM Commercial Paper, Series 2020, 1.00% 6/3/2020 | | | 6,700 | | | | 6,700 | |
| State of New York, Metropolitan Transportation Auth., Transportation Rev. Bond Anticipation Notes, Series 2018-B-1, 5.00% 5/15/2020 | | | 3,500 | | | | 3,538 | |
| State of New York, Metropolitan Transportation Auth., Transportation Rev. Bond Anticipation Notes, Series 2018-B-2, 5.00% 2021 | | | 5,000 | | | | 5,250 | |
| State of New York, Metropolitan Transportation Auth., Transportation Rev. Bond Anticipation Notes, Series 2019-B-1, 5.00% 2022 | | | 2,000 | | | | 2,177 | |
| State of New York, Metropolitan Transportation Auth., Transportation Rev. Bond Anticipation Notes, Series 2019-D-2, 4.00% 7/1/2020 | | | 3,615 | | | | 3,658 | |
| State of New York, Metropolitan Transportation Auth., Transportation Rev. Bond Anticipation Notes, Series 2019-E, 4.00% 9/1/2020 | | | 3,000 | | | | 3,050 | |
| State of New York, Metropolitan Transportation Auth., Transportation Rev. Bond Anticipation Notes, Series 2020-A-1, 5.00% 2023 | | | 515 | | | | 572 | |
| State of New York, Metropolitan Transportation Auth., Transportation Rev. Bond Anticipation Notes, Series 2020-A-2S, 4.00% 2022 | | | 8,000 | | | | 8,453 | |
| State of New York, Metropolitan Transportation Auth., Transportation Rev. Bonds, Series 2015-E-3, (SIFMA Municipal Swap Index + 1.70%) 1.17% 20501 | | | 40,440 | | | | 40,440 | |
| State of New York, New York City G.O. Bonds, Fiscal 2006, Series 2005-E-2, 1.18% 20341 | | | 12,535 | | | | 12,535 | |
| State of New York, New York City G.O. Bonds, Fiscal 2008, Series 2008-C-4, Assured Guaranty Municipal insured, 1.00% 20271 | | | 2,575 | | | | 2,575 | |
| State of New York, New York City G.O. Bonds, Fiscal 2008, Series 2008-J-5, 1.18% 20281 | | | 7,500 | | | | 7,500 | |
| State of New York, New York City G.O. Bonds, Fiscal 2008, Series 2008-L-3, 1.18% 20361 | | | 6,300 | | | | 6,300 | |
| State of New York, New York City G.O. Bonds, Fiscal 2013, Series 2013-F-3, 1.18% 20421 | | | 3,500 | | | | 3,500 | |
| State of New York, New York City Municipal Water Fin. Auth., Water and Sewer System Rev. Bonds, Fiscal 2000, Series 2000-C, 0.90% 20331 | | | 15,400 | | | | 15,400 | |
| State of New York, New York City Municipal Water Fin. Auth., Water and Sewer System Rev. Bonds, Fiscal 2012, Series 2012-B, 1.18% 20451 | | | 24,240 | | | | 24,240 | |
| State of New York, New York City Municipal Water Fin. Auth., Water and Sewer System Second General Resolution Rev. Bonds, Fiscal 2007, Series 2006-CC-1, 0.94% 20381 | | | 14,500 | | | | 14,500 | |
| State of New York, New York City Municipal Water Fin. Auth., Water and Sewer System Second General Resolution Rev. Bonds, Fiscal 2013, Series 2013-AA-2, 0.95% 20461 | | | 9,000 | | | | 9,000 | |
| State of New York, New York City Municipal Water Fin. Auth., Water and Sewer System Second General Resolution Rev. Bonds, Fiscal 2014, Series 2013-AA-2, 1.18% 20501 | | | 3,535 | | | | 3,535 | |
| State of New York, New York City Transitional Fin. Auth., Future Tax Secured Bonds, Fiscal 2016, Series 2016-A-4, 1.18% 20411 | | | 2,630 | | | | 2,630 | |
| State of New York, New York City Transitional Fin. Auth., Future Tax Secured Bonds, Fiscal 2019, Series 2019-A-4, 1.18% 20451 | | | 35,000 | | | | 35,000 | |
| State of Texas, Tax and Rev. Anticipation Notes, Series 2019, 4.00% 8/27/2020 | | | 59,950 | | | | 60,967 | |
| State of Texas, Board of Regents of the University of Texas System, IAM Commercial Paper, Series 2020, 1.00% 5/19/2020 | | | 10,000 | | | | 10,000 | |
| State of Texas, Board of Regents of the University of Texas System, IAM Commercial Paper, Series 2020, 1.14% 3/3/2020 | | | 25,000 | | | | 25,000 | |
| State of Texas, Board of Regents of the University of Texas System, IAM Commercial Paper, Series 2020, 1.20% 2/6/2020 | | | 10,000 | | | | 10,000 | |
| Other securities | | | | | | | 417,695 | |
| | | | | | | | | |
| Total short-term securities(cost: $1,306,743,000) | | | | | | | 1,308,655 | |
| Total investment securities 100.51% (cost: $23,138,693,000) | | | | | | | 24,564,863 | |
| Other assets less liabilities (0.51)% | | | | | | | (124,957 | ) |
| | | | | | | | | |
| Net assets 100.00% | | | | | | $ | 24,439,906 | |
| 34 | American Funds Tax-Exempt Funds |
The Tax-Exempt Bond Fund of America
This summary investment portfolio is designed to streamline the report and help investors better focus on the fund’s principal holdings. See the inside back cover for details on how to obtain a complete schedule of portfolio holdings.
“Other securities” includes all issues that are not disclosed separately in the summary investment portfolio. “Other securities” includes a security that was valued under fair value procedures adopted by authority of the board of trustees. The total value of the security that was valued under fair value procedures was $4,911,000, which represented .02% of the net assets of the fund.
Futures contracts
| | | | | | | | | | | | | | Unrealized | |
| | | | | | | | | | | | | | appreciation | |
| | | | | | | | | Notional | | | Value at | | (depreciation) | |
| | | | | Number of | | | | amount | 5 | | 1/31/2020 | 6 | at 1/31/2020 | |
| Contracts | | Type | | contracts | | Expiration | | (000) | | | (000) | | (000) | |
| 2 Year U.S. Treasury Note Futures | | Long | | 6,872 | | April 2020 | | $ | 1,374,400 | | | $ | 1,486,822 | | | $ | 4,694 | |
| 5 Year U.S. Treasury Note Futures | | Long | | 4,742 | | April 2020 | | | 474,200 | | | | 570,559 | | | | 4,071 | |
| 10 Year Ultra U.S. Treasury Note Futures | | Long | | 394 | | March 2020 | | | 39,400 | | | | 57,388 | | | | 1,421 | |
| 10 Year U.S. Treasury Note Futures | | Short | | 6,965 | | March 2020 | | | (696,500 | ) | | | (916,986 | ) | | | (14,233 | ) |
| 30 Year Ultra U.S. Treasury Bond Futures | | Short | | 572 | | March 2020 | | | (57,200 | ) | | | (110,789 | ) | | | (3,798 | ) |
| | | | | | | | | | | | | | | | | $ | (7,845 | ) |
| 1 | Coupon rate may change periodically. Reference rate and spread are as of the most recent information available. Some coupon rates are determined by the issuer or agent based on current market conditions; therefore, the reference rate and spread are not available. For short-term securities, the date of the next scheduled coupon rate change is considered to be the maturity date. |
| 2 | Scheduled interest and/or principal payment was not received. |
| 3 | Acquired in a transaction exempt from registration under Rule 144A of the Securities Act of 1933. May be resold in the U.S. in transactions exempt from registration, normally to qualified institutional buyers. The total value of all such securities, including those in “Other securities,” was $372,043,000, which represented 1.52% of the net assets of the fund. |
| 4 | For short-term securities, the mandatory put date is considered to be the maturity date. |
| 5 | Notional amount is calculated based on the number of contracts and notional contract size. |
| 6 | Value is calculated based on the notional amount and current market price. |
Key to abbreviations and symbol
Agcy. = Agency
Auth. = Authority
Certs. of Part. = Certificates of Participation
Dept. = Department
Dev. = Development
Dist. = District
Econ. = Economic
Fac. = Facility
Facs. = Facilities
Fin. = Finance
Fncg. = Financing
G.O. = General Obligation
IAM = Interest at Maturity
LIBOR = London Interbank Offered Rate
LOC = Letter of Credit
Preref. = Prerefunded
Redev. = Redevelopment
Ref. = Refunding
Rev. = Revenue
SIFMA = Securities Industry and Financial Markets Association
USD/$ = U.S. dollars
See notes to financial statements.
| American Funds Tax-Exempt Funds | 35 |
| American High-Income Municipal Bond Fund | unaudited |
Summary investment portfolioJanuary 31, 2020
| Portfolio quality summary* | Percent of net assets |
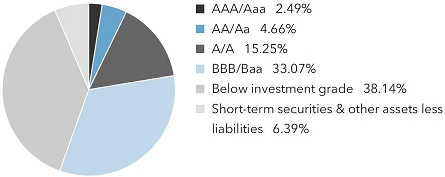
| * | Bond ratings, which typically range from AAA/Aaa (highest) to D (lowest), are assigned by credit rating agencies such as Standard & Poor’s, Moody’s and/or Fitch as an indication of an issuer’s creditworthiness. In assigning a credit rating to a security, the fund looks specifically to the ratings assigned to the issuer of the security by Standard & Poor’s, Moody’s and/or Fitch. If agency ratings differ, the security will be considered to have received the highest of those ratings, consistent with the fund’s investment policies. |
| Bonds, notes & other debt instruments 93.61% | Principal amount
(000) | | | Value
(000) | |
| Arizona 2.75% | | | | | | | | |
| Industrial Dev. Auth., Education Facs. Rev. Bonds (Leman Academy of Excellence - East Tucson and Central Tucson Projects), Series 2019-A, 5.00% 20391 | | $ | 3,500 | | | $ | 3,684 | |
| Industrial Dev. Auth., Education Facs. Rev. Bonds (Leman Academy of Excellence - East Tucson and Central Tucson Projects), Series 2019-A, 5.00% 20491 | | | 7,250 | | | | 7,577 | |
| Industrial Dev. Auth., Education Facs. Rev. Bonds (Leman Academy of Excellence - East Tucson and Central Tucson Projects), Series 2019-A, 5.00% 20541 | | | 6,000 | | | | 6,258 | |
| Industrial Dev. Auth., Education Rev. Bonds (Academies of Math & Science Projects), Series 2018-B, 5.50% 20381 | | | 1,200 | | | | 1,383 | |
| Industrial Dev. Auth., Education Rev. Bonds (Academies of Math & Science Projects), Series 2018-B, 5.625% 20481 | | | 2,500 | | | | 2,868 | |
| Industrial Dev. Auth., Education Rev. Bonds (Academies of Math & Science Projects), Series 2018-B, 5.75% 20531 | | | 3,750 | | | | 4,306 | |
| Industrial Dev. Auth., Education Rev. Bonds (Academies of Math & Science Projects), Series 2019, 5.00% 20541 | | | 1,000 | | | | 1,116 | |
| Industrial Dev. Auth., Education Rev. Bonds (Academies of Math & Science Projects), Series 2017-B, 5.125% 20471 | | | 2,230 | | | | 2,480 | |
| Industrial Dev. Auth., Education Rev. Bonds (Academies of Math & Science Projects), Series 2017-B, 5.25% 20511 | | | 570 | | | | 637 | |
| Industrial Dev. Auth., Education Rev. Bonds (Basis School Project), Series 2017-A, 5.125% 20371 | | | 1,500 | | | | 1,671 | |
| Industrial Dev. Auth., Education Rev. Bonds (Basis School Project), Series 2017-A, 5.25% 20471 | | | 2,450 | | | | 2,716 | |
| Industrial Dev. Auth., Education Rev. Bonds (Basis School Project), Series 2017-A, 5.375% 20501 | | | 6,160 | | | | 6,866 | |
| Industrial Dev. Auth., Education Rev. Bonds (Basis School Project), Series 2017-D, 5.00% 20371 | | | 675 | | | | 755 | |
| Industrial Dev. Auth., Education Rev. Bonds (Basis School Project), Series 2017-D, 5.00% 20471 | | | 1,035 | | | | 1,142 | |
| Industrial Dev. Auth., Education Rev. Bonds (Basis School Project), Series 2017-D, 5.00% 20511 | | | 3,450 | | | | 3,794 | |
| Industrial Dev. Auth., Education Rev. Bonds (Basis School Project), Series 2017-G, 4.00% 20271 | | | 2,600 | | | | 2,800 | |
| Industrial Dev. Auth., Education Rev. Bonds (Basis School Project), Series 2017-G, 5.00% 20471 | | | 2,125 | | | | 2,344 | |
| Industrial Dev. Auth., Education Rev. Bonds (Basis School Project), Series 2017-G, 5.00% 20511 | | | 1,550 | | | | 1,705 | |
| Industrial Dev. Auth., Education Rev. Bonds (Doral Academy of Nevada - Fire Mesa and Red Rock Campus Projects), Series 2019-A, 3.55% 20291 | | | 735 | | | | 774 | |
| Industrial Dev. Auth., Education Rev. Bonds (Doral Academy of Nevada - Fire Mesa and Red Rock Campus Projects), Series 2019-A, 5.00% 20391 | | | 1,325 | | | | 1,482 | |
| Industrial Dev. Auth., Education Rev. Bonds (Doral Academy of Nevada - Fire Mesa and Red Rock Campus Projects), Series 2019-A, 5.00% 20491 | | | 2,250 | | | | 2,488 | |
| Industrial Dev. Auth., Education Rev. Bonds (Leman Academy of Excellence Projects), Series 2017-A, 5.00% 20371 | | | 1,350 | | | | 1,398 | |
| 36 | American Funds Tax-Exempt Funds |
American High-Income Municipal Bond Fund
| | Principal amount
(000) | | | Value
(000) | |
| Industrial Dev. Auth., Education Rev. Bonds (Leman Academy of Excellence Projects), Series 2017-A, 5.25% 20471 | | $ | 4,830 | | | $ | 5,009 | |
| Industrial Dev. Auth., Education Rev. Bonds (Leman Academy of Excellence Projects), Series 2017-A, 5.25% 20521 | | | 2,500 | | | | 2,587 | |
| Industrial Dev. Auth., Education Rev. Bonds (Pinecrest Academy of Nevada - Horizon, Inspirada and St. Rose Campus Projects), Series 2018-A, 5.75% 20381 | | | 1,960 | | | | 2,254 | |
| Industrial Dev. Auth., Education Rev. Bonds (Pinecrest Academy of Nevada - Horizon, Inspirada and St. Rose Campus Projects), Series 2018-A, 5.75% 20481 | | | 3,230 | | | | 3,666 | |
| Industrial Dev. Auth., Education Rev. Bonds (Somerset Academy of Las Vegas - Lone Mountain Campus Projects), Series 2019-A, 3.75% 20291 | | | 565 | | | | 603 | |
| Industrial Dev. Auth., Education Rev. Bonds (Somerset Academy of Las Vegas - Lone Mountain Campus Projects), Series 2019-A, 5.00% 20391 | | | 440 | | | | 495 | |
| Industrial Dev. Auth., Education Rev. Bonds (Somerset Academy of Las Vegas - Lone Mountain Campus Projects), Series 2019-A, 5.00% 20491 | | | 700 | | | | 778 | |
| Industrial Dev. Auth., Municipal Certificates, Series 2019-2, Class X, 1.001% 20332 | | | 164,800 | | | | 11,552 | |
| Industrial Dev. Auth., Student Housing Rev. Bonds (Provident Group - NCCU Properties LLC - North Carolina Central University Project), Series 2019-A, BAM insured, 5.00% 2049 | | | 1,500 | | | | 1,807 | |
| Industrial Dev. Auth., Student Housing Rev. Bonds (Provident Group - NCCU Properties LLC - North Carolina Central University Project), Series 2019-A, BAM insured, 5.00% 2058 | | | 3,500 | | | | 4,164 | |
| Other securities | | | | | | | 145,791 | |
| | | | | | | | 238,950 | |
| | | | | | | | | |
| California 4.79% | | | | | | | | |
| Infrastructure and Econ. Dev. Bank, Rev. Ref. Bonds (Pacific Gas and Electric Co.), Series 2008-F, 1.75% 2026 (put 2022)3 | | | 29,370 | | | | 29,884 | |
| Other securities | | | | | | | 386,991 | |
| | | | | | | | 416,875 | |
| | | | | | | | | |
| Colorado 6.04% | | | | | | | | |
| Health Facs. Auth., Health Care Facs. Rev. Bonds (American Baptist Homes of the Midwest Obligated Group), Series 2013, 8.00% 2043 | | | 11,100 | | | | 12,600 | |
| Health Facs. Auth., Health Facs. Rev. and Rev. Ref. Bonds (Evangelical Lutheran Good Samaritan Society Project), Series 2015-A, 5.00% 2030 (preref. 2025) | | | 3,000 | | | | 3,635 | |
| Health Facs. Auth., Health Facs. Rev. and Rev. Ref. Bonds (Evangelical Lutheran Good Samaritan Society Project), Series 2015-A, 5.00% 2032 | | | 1,500 | | | | 1,817 | |
| Health Facs. Auth., Health Facs. Rev. and Rev. Ref. Bonds (Evangelical Lutheran Good Samaritan Society Project), Series 2015-A, 5.00% 2036 | | | 2,360 | | | | 2,859 | |
| Health Facs. Auth., Health Facs. Rev. and Rev. Ref. Bonds (Evangelical Lutheran Good Samaritan Society Project), Series 2015-A, 5.00% 2045 (preref. 2025) | | | 1,000 | | | | 1,212 | |
| Health Facs. Auth., Health Facs. Rev. and Rev. Ref. Bonds (Evangelical Lutheran Good Samaritan Society Project), Series 2017, 5.00% 2028 (preref. 2027) | | | 1,500 | | | | 1,919 | |
| Health Facs. Auth., Health Facs. Rev. and Rev. Ref. Bonds (Evangelical Lutheran Good Samaritan Society Project), Series 2017, 5.00% 2032 | | | 1,360 | | | | 1,740 | |
| Health Facs. Auth., Health Facs. Rev. and Rev. Ref. Bonds (Evangelical Lutheran Good Samaritan Society Project), Series 2017, 5.00% 2037 (preref. 2027) | | | 2,300 | | | | 2,943 | |
| Health Facs. Auth., Health Facs. Rev. and Rev. Ref. Bonds (Evangelical Lutheran Good Samaritan Society Project), Series 2017, 5.00% 2042 | | | 2,100 | | | | 2,687 | |
| Health Facs. Auth., Health Facs. Rev. and Rev. Ref. Bonds (Evangelical Lutheran Good Samaritan Society Project), Series 2017, 5.00% 2047 (preref. 2027) | | | 3,520 | | | | 4,503 | |
| Health Facs. Auth., Health Facs. Rev. Bonds (Evangelical Lutheran Good Samaritan Society Project), Series 2012, 5.00% 2042 (preref. 2022) | | | 10,425 | | | | 11,411 | |
| Health Facs. Auth., Health Facs. Rev. Bonds (Evangelical Lutheran Good Samaritan Society Project), Series 2013, 5.625% 2043 (preref. 2023) | | | 2,690 | | | | 3,106 | |
| Health Facs. Auth., Rev. Bonds (CommonSpirit Health), Series 2019-A-2, 5.00% 2044 | | | 2,500 | | | | 3,062 | |
| Health Facs. Auth., Rev. Bonds (CommonSpirit Health), Series 2019-B-2, 4.00% 2049 | | | 5,000 | | | | 5,561 | |
| Health Facs. Auth., Rev. Bonds (CommonSpirit Health), Series 2019-B-2, 5.00% 2049 (put 2026) | | | 5,000 | | | | 5,988 | |
| Health Facs. Auth., Rev. Bonds (Covenant Retirement Communities, Inc.), Series 2018, 5.00% 2048 | | | 2,480 | | | | 2,918 | |
| Health Facs. Auth., Rev. Bonds (Senior Residences Project), Series 2012, 7.00% 20423 | | | 2,500 | | | | 1,651 | |
| Health Facs. Auth., Rev. Bonds (Senior Residences Project), Series 2012, 7.125% 20473 | | | 5,500 | | | | 3,628 | |
| Health Facs. Auth., Rev. Ref. and Improvement Bonds (Christian Living Neighborhoods Project), Series 2019, 4.00% 2026 | | | 260 | | | | 288 | |
| American Funds Tax-Exempt Funds | 37 |
American High-Income Municipal Bond Fund
| Bonds, notes & other debt instruments (continued) | Principal amount
(000) | | | Value
(000) | |
| Colorado (continued) | | | | | | | | |
| Health Facs. Auth., Rev. Ref. and Improvement Bonds (Christian Living Neighborhoods Project), Series 2019, 4.00% 2027 | | $ | 590 | | | $ | 661 | |
| Health Facs. Auth., Rev. Ref. and Improvement Bonds (Christian Living Neighborhoods Project), Series 2019, 4.00% 2028 | | | 245 | | | | 277 | |
| Health Facs. Auth., Rev. Ref. and Improvement Bonds (Christian Living Neighborhoods Project), Series 2019, 4.00% 2029 | | | 600 | | | | 682 | |
| Health Facs. Auth., Rev. Ref. and Improvement Bonds (Christian Living Neighborhoods Project), Series 2019, 4.00% 2038 | | | 550 | | | | 595 | |
| Health Facs. Auth., Rev. Ref. and Improvement Bonds (Christian Living Neighborhoods Project), Series 2019, 5.00% 2038 | | | 1,500 | | | | 1,730 | |
| Health Facs. Auth., Rev. Ref. and Improvement Bonds (Frasier Meadows Retirement Community Project), Series 2017-A, 5.00% 2027 | | | 455 | | | | 538 | |
| Health Facs. Auth., Rev. Ref. and Improvement Bonds (Frasier Meadows Retirement Community Project), Series 2017-A, 5.25% 2031 | | | 2,395 | | | | 2,824 | |
| Health Facs. Auth., Rev. Ref. and Improvement Bonds (Frasier Meadows Retirement Community Project), Series 2017-A, 5.25% 2032 | | | 850 | | | | 998 | |
| Health Facs. Auth., Rev. Ref. and Improvement Bonds (Frasier Meadows Retirement Community Project), Series 2017-A, 5.25% 2037 | | | 2,300 | | | | 2,664 | |
| Health Facs. Auth., Rev. Ref. and Improvement Bonds (Frasier Meadows Retirement Community Project), Series 2017-A, 5.25% 2047 | | | 12,230 | | | | 13,889 | |
| Health Facs. Auth., Rev. Ref. and Improvement Bonds (Frasier Meadows Retirement Community Project), Series 2017-B, 3.125% 2027 | | | 1,250 | | | | 1,253 | |
| Health Facs. Auth., Rev. Ref. and Improvement Bonds (Frasier Meadows Retirement Community Project), Series 2017-B, 5.00% 2027 | | | 1,055 | | | | 1,146 | |
| Health Facs. Auth., Rev. Ref. Bonds (Christian Living Neighborhoods Project), Series 2016, 5.00% 2026 | | | 750 | | | | 844 | |
| Health Facs. Auth., Rev. Ref. Bonds (Christian Living Neighborhoods Project), Series 2016, 5.00% 2031 | | | 2,000 | | | | 2,231 | |
| Health Facs. Auth., Rev. Ref. Bonds (Christian Living Neighborhoods Project), Series 2016, 5.00% 2037 | | | 7,250 | | | | 8,004 | |
| Health Facs. Auth., Rev. Ref. Bonds (Covenant Retirement Communities, Inc.), Series 2012-A, 5.00% 2033 | | | 4,750 | | | | 5,158 | |
| Health Facs. Auth., Rev. Ref. Bonds (Covenant Retirement Communities, Inc.), Series 2013-A, 5.75% 2036 | | | 1,000 | | | | 1,154 | |
| Health Facs. Auth., Rev. Ref. Bonds (Covenant Retirement Communities, Inc.), Series 2015-A, 5.00% 2029 | | | 1,500 | | | | 1,743 | |
| Health Facs. Auth., Rev. Ref. Bonds (Covenant Retirement Communities, Inc.), Series 2015-A, 5.00% 2035 | | | 2,500 | | | | 2,864 | |
| Other securities | | | | | | | 402,453 | |
| | | | | | | | 525,236 | |
| | | | | | | | | |
| Florida 5.31% | | | | | | | | |
| County of Broward, Airport System Rev. Bonds, Series 2019-A, AMT, 4.00% 2044 | | | 29,215 | | | | 33,071 | |
| North Broward Hospital Dist., Rev. Bonds (Broward Health), Series 2017-B, 5.00% 2042 | | | 17,500 | | | | 20,857 | |
| Other securities | | | | | | | 408,323 | |
| | | | | | | | 462,251 | |
| | | | | | | | | |
| Georgia 2.22% | | | | | | | | |
| Municipal Electric Auth., Plant Vogtle Units 3 and 4 Project J Bonds, Series 2015-A, 5.00% 2060 | | | 6,740 | | | | 7,510 | |
| Municipal Electric Auth., Plant Vogtle Units 3 and 4 Project J Bonds, Series 2015-A, 5.50% 2060 | | | 19,100 | | | | 21,862 | |
| Municipal Electric Auth., Plant Vogtle Units 3 and 4 Project J Bonds, Series 2019-A, 5.00% 2049 | | | 22,835 | | | | 26,827 | |
| Municipal Electric Auth., Plant Vogtle Units 3 and 4 Project J Bonds, Series 2019-A, 5.00% 2059 | | | 13,200 | | | | 15,357 | |
| Municipal Electric Auth., Plant Vogtle Units 3 and 4 Project M Bonds, Series 2019-A, 5.00% 2063 | | | 6,425 | | | | 7,517 | |
| Municipal Electric Auth., Plant Vogtle Units 3 and 4 Project P Bonds, Series 2019-B, 5.00% 2048 | | | 5,000 | | | | 5,902 | |
| Municipal Electric Auth., Plant Vogtle Units 3 and 4 Project P Bonds, Series 2019-B, 5.00% 2059 | | | 8,300 | | | | 9,697 | |
| 38 | American Funds Tax-Exempt Funds |
American High-Income Municipal Bond Fund
| | Principal amount
(000) | | | Value
(000) | |
| Municipal Electric Auth., Project One Bonds, Series 2019-A, 4.00% 2049 | | $ | 4,200 | | | $ | 4,617 | |
| Municipal Electric Auth., Project One Bonds, Series 2019-A, 5.00% 2034 | | | 2,300 | | | | 2,855 | |
| Other securities | | | | | | | 91,042 | |
| | | | | | | | 193,186 | |
| |
| Illinois 14.84% | | | | | | | | |
| Build Illinois Bonds, Sales Tax Rev. Bonds, Series 2016-A, 4.00% 2028 | | | 4,685 | | | | 5,203 | |
| City of Chicago, Board of Education, Capital Improvement Tax Bonds (Dedicated Rev.), Series 2018, 5.00% 2034 | | | 1,535 | | | | 1,828 | |
| City of Chicago, Board of Education, Unlimited Tax G.O. Bonds (Dedicated Rev.), Series 2011-A, 5.50% 2039 | | | 1,625 | | | | 1,731 | |
| City of Chicago, Board of Education, Unlimited Tax G.O. Bonds (Dedicated Rev.), Series 2015-C, 5.25% 2039 | | | 8,890 | | | | 10,000 | |
| City of Chicago, Board of Education, Unlimited Tax G.O. Bonds (Dedicated Rev.), Series 2016-B, 6.50% 2046 | | | 7,910 | | | | 9,750 | |
| City of Chicago, Board of Education, Unlimited Tax G.O. Bonds (Dedicated Rev.), Series 2017-A, 7.00% 20461 | | | 26,470 | | | | 34,362 | |
| City of Chicago, Board of Education, Unlimited Tax G.O. Bonds (Dedicated Rev.), Series 2018-A, Assured Guaranty Municipal insured, 5.00% 2026 | | | 2,500 | | | | 3,021 | |
| City of Chicago, Board of Education, Unlimited Tax G.O. Bonds (Dedicated Rev.), Series 2018-A, Assured Guaranty Municipal insured, 5.00% 2033 | | | 1,000 | | | | 1,227 | |
| City of Chicago, Board of Education, Unlimited Tax G.O. Bonds (Dedicated Rev.), Series 2018-D, 5.00% 2046 | | | 2,000 | | | | 2,336 | |
| City of Chicago, Board of Education, Unlimited Tax G.O. Rev. Ref. Bonds (Dedicated Rev.), Capital Appreciation Bonds, Series 1998-B-1, FGIC insured, 0% 2028 | | | 5,780 | | | | 4,707 | |
| City of Chicago, Board of Education, Unlimited Tax G.O. Rev. Ref. Bonds (Dedicated Rev.), Capital Appreciation Bonds, Series 2019-A, 0% 2025 | | | 2,000 | | | | 1,758 | |
| City of Chicago, Board of Education, Unlimited Tax G.O. Rev. Ref. Bonds (Dedicated Rev.), Series 2005-A, AMBAC insured, 5.50% 2024 | | | 2,425 | | | | 2,821 | |
| City of Chicago, Board of Education, Unlimited Tax G.O. Rev. Ref. Bonds (Dedicated Rev.), Series 2017-B, 6.75% 20301 | | | 3,500 | | | | 4,645 | |
| City of Chicago, Board of Education, Unlimited Tax G.O. Rev. Ref. Bonds (Dedicated Rev.), Series 2017-B, 7.00% 20421 | | | 28,185 | | | | 36,805 | |
| City of Chicago, Board of Education, Unlimited Tax G.O. Rev. Ref. Bonds (Dedicated Rev.), Series 2017-C, 5.00% 2021 | | | 2,000 | | | | 2,113 | |
| City of Chicago, Board of Education, Unlimited Tax G.O. Rev. Ref. Bonds (Dedicated Rev.), Series 2017-C, 5.00% 2024 | | | 2,000 | | | | 2,283 | |
| City of Chicago, Board of Education, Unlimited Tax G.O. Rev. Ref. Bonds (Dedicated Rev.), Series 2017-C, 5.00% 2025 | | | 4,000 | | | | 4,676 | |
| City of Chicago, Board of Education, Unlimited Tax G.O. Rev. Ref. Bonds (Dedicated Rev.), Series 2017-C, 5.00% 2030 | | | 3,000 | | | | 3,588 | |
| City of Chicago, Board of Education, Unlimited Tax G.O. Rev. Ref. Bonds (Dedicated Rev.), Series 2017-D, 5.00% 2021 | | | 1,500 | | | | 1,585 | |
| City of Chicago, Board of Education, Unlimited Tax G.O. Rev. Ref. Bonds (Dedicated Rev.), Series 2017-F, 5.00% 2024 | | | 2,000 | | | | 2,283 | |
| City of Chicago, Board of Education, Unlimited Tax G.O. Rev. Ref. Bonds (Dedicated Rev.), Series 2017-G, 5.00% 2044 | | | 5,000 | | | | 5,781 | |
| City of Chicago, Board of Education, Unlimited Tax G.O. Rev. Ref. Bonds (Dedicated Rev.), Series 2017-H, 5.00% 2036 | | | 12,000 | | | | 14,132 | |
| City of Chicago, Board of Education, Unlimited Tax G.O. Rev. Ref. Bonds (Dedicated Rev.), Series 2017-H, 5.00% 2046 | | | 7,800 | | | | 8,994 | |
| City of Chicago, Board of Education, Unlimited Tax G.O. Rev. Ref. Bonds (Dedicated Rev.), Series 2018-A, Assured Guaranty Municipal insured, 5.00% 2029 | | | 1,750 | | | | 2,179 | |
| City of Chicago, Board of Education, Unlimited Tax G.O. Rev. Ref. Bonds (Dedicated Rev.), Series 2018-C, Assured Guaranty Municipal insured, 5.00% 2023 | | | 4,000 | | | | 4,455 | |
| City of Chicago, Board of Education, Unlimited Tax G.O. Rev. Ref. Bonds (Dedicated Rev.), Series 2018-C, Assured Guaranty Municipal insured, 5.00% 2028 | | | 2,250 | | | | 2,816 | |
| City of Chicago, Board of Education, Unlimited Tax G.O. Rev. Ref. Bonds (Dedicated Rev.), Series 2018-C, Assured Guaranty Municipal insured, 5.00% 2029 | | | 3,000 | | | | 3,735 | |
| City of Chicago, G.O. Bonds (City Colleges of Chicago Capital Improvement Project), Capital Appreciation Bonds, Series 1999, National insured, 0% 2034 | | | 490 | | | | 326 | |
| City of Chicago, G.O. Bonds (City Colleges of Chicago Capital Improvement Project), Capital Appreciation Bonds, Series 1999, National insured, 0% 2031 | | | 3,000 | | | | 2,220 | |
| City of Chicago, G.O. Bonds (Library), Series 2008-D, 5.00% 2039 | | | 265 | | | | 265 | |
| American Funds Tax-Exempt Funds | 39 |
American High-Income Municipal Bond Fund
| Bonds, notes & other debt instruments (continued) | Principal amount
(000) | | | Value
(000) | |
| Illinois (continued) | | | | | | | | |
| City of Chicago, G.O. Bonds (Neighborhoods Alive 21 Program), Series 2002-B, 5.50% 2034 | | $ | 500 | | | $ | 581 | |
| City of Chicago, G.O. Bonds, Series 2003-B, 5.00% 2024 | | | 1,000 | | | | 1,122 | |
| City of Chicago, G.O. Bonds, Series 2011-A, 5.25% 2035 | | | 500 | | | | 516 | |
| City of Chicago, G.O. Bonds, Series 2012-A, 5.00% 2033 | | | 585 | | | | 622 | |
| City of Chicago, G.O. Bonds, Series 2012-C, 5.00% 2023 | | | 360 | | | | 383 | |
| City of Chicago, G.O. Bonds, Series 2014-A, 5.25% 2029 | | | 3,895 | | | | 4,392 | |
| City of Chicago, G.O. Bonds, Series 2015-A, 5.25% 2028 | | | 3,230 | | | | 3,735 | |
| City of Chicago, G.O. Bonds, Series 2015-A, 5.50% 2034 | | | 200 | | | | 232 | |
| City of Chicago, G.O. Bonds, Series 2017-A, 5.75% 2033 | | | 465 | | | | 569 | |
| City of Chicago, G.O. Bonds, Series 2019-A, 5.50% 2035 | | | 7,200 | | | | 9,027 | |
| City of Chicago, G.O. Bonds, Series 2019-A, 5.50% 2049 | | | 10,000 | | | | 12,159 | |
| City of Chicago, G.O. Project and Rev. Ref. Bonds, Capital Appreciation Bonds, Series 2008-C, 0% 2031 | | | 2,105 | | | | 1,492 | |
| City of Chicago, G.O. Project and Rev. Ref. Bonds, Capital Appreciation Bonds, Series 2008-C, 0% 2032 | | | 725 | | | | 496 | |
| City of Chicago, G.O. Project and Rev. Ref. Bonds, Capital Appreciation Bonds, Series 2008-C, 0% 2030 | | | 8,000 | | | | 5,904 | |
| City of Chicago, G.O. Project and Rev. Ref. Bonds, Series 2003-B, 5.00% 2022 | | | 1,000 | | | | 1,066 | |
| City of Chicago, G.O. Project and Rev. Ref. Bonds, Series 2005-D, 5.50% 2037 | | | 260 | | | | 301 | |
| City of Chicago, G.O. Project and Rev. Ref. Bonds, Series 2014-A, 5.00% 2022 | | | 100 | | | | 107 | |
| City of Chicago, G.O. Project and Rev. Ref. Bonds, Series 2014-A, 5.00% 2035 | | | 1,600 | | | | 1,770 | |
| City of Chicago, G.O. Project and Rev. Ref. Bonds, Series 2014-A, 5.25% 2030 | | | 4,885 | | | | 5,494 | |
| City of Chicago, G.O. Project and Rev. Ref. Bonds, Series 2017-A, 5.625% 2029 | | | 6,500 | | | | 8,009 | |
| City of Chicago, G.O. Project and Rev. Ref. Bonds, Series 2017-A, 5.625% 2030 | | | 7,300 | | | | 8,957 | |
| City of Chicago, G.O. Project and Rev. Ref. Bonds, Series 2017-A, 6.00% 2038 | | | 11,170 | | | | 13,809 | |
| City of Chicago, G.O. Rev. Ref. Bonds, Series 2015-A, 5.375% 2029 | | | 1,000 | | | | 1,164 | |
| City of Chicago, G.O. Rev. Ref. Bonds, Series 2015-C, 5.00% 2024 | | | 3,020 | | | | 3,387 | |
| City of Chicago, G.O. Rev. Ref. Bonds, Series 2015-C, 5.00% 2027 | | | 3,105 | | | | 3,634 | |
| City of Chicago, G.O. Rev. Ref. Bonds, Series 2015-C, 5.00% 2035 | | | 1,670 | | | | 1,910 | |
| City of Chicago, G.O. Rev. Ref. Bonds, Series 2015-C, 5.00% 2038 | | | 3,500 | | | | 3,976 | |
| City of Chicago, G.O. Rev. Ref. Bonds, Series 2020-A, 5.00% 2027 | | | 10,200 | | | | 12,163 | |
| City of Chicago, G.O. Rev. Ref. Bonds, Series 2020-A, 5.00% 2029 | | | 4,800 | | | | 5,905 | |
| City of Chicago, G.O. Rev. Ref. Bonds, Series 2020-A, 5.00% 2030 | | | 12,150 | | | | 15,138 | |
| City of Chicago, G.O. Rev. Ref. Bonds, Series 2020-A, 5.00% 2031 | | | 1,460 | | | | 1,811 | |
| City of Chicago, G.O. Rev. Ref. Bonds, Series 2020-A, 5.00% 2032 | | | 1,300 | | | | 1,608 | |
| City of Chicago, Sales Tax Rev. Ref. Bonds, Series 2002, 5.00% 2032 (preref. 2025) | | | 145 | | | | 173 | |
| City of Chicago, School Reform Board of Trustees of the Board of Education, Unlimited Tax G.O. Bonds (Dedicated Tax Rev.), Capital Appreciation Bonds, Series 1998-B-1, National insured, 0% 2029 | | | 3,610 | | | | 2,841 | |
| City of Chicago, School Reform Board of Trustees of the Board of Education, Unlimited Tax G.O. Bonds (Dedicated Tax Rev.), Capital Appreciation Bonds, Series 1998-B-1, National insured, 0% 2031 | | | 6,305 | | | | 4,632 | |
| City of Chicago, School Reform Board of Trustees of the Board of Education, Unlimited Tax G.O. Bonds (Dedicated Tax Rev.), Capital Appreciation Bonds, Series 1999-A, National insured, 0% 2025 | | | 1,380 | | | | 1,227 | |
| City of Chicago, School Reform Board of Trustees of the Board of Education, Unlimited Tax G.O. Bonds (Dedicated Tax Rev.), Capital Appreciation Bonds, Series 1999-A, National insured, 0% 2031 | | | 3,670 | | | | 2,696 | |
| City of Chicago, School Reform Board of Trustees of the Board of Education, Unlimited Tax G.O. Bonds (Dedicated Tax Rev.), Series 2012-A, 5.00% 2042 | | | 8,635 | | | | 9,350 | |
| City of Chicago, School Reform Board of Trustees of the Board of Education, Unlimited Tax G.O. Bonds (Dedicated Tax Rev.), Series 2016-A, 7.00% 2044 | | | 15,225 | | | | 18,779 | |
| City of Chicago, School Reform Board of Trustees of the Board of Education, Unlimited Tax G.O. Bonds (Dedicated Tax Rev.), Capital Appreciation Bonds, Series 1999-A, National insured, 0% 2024 | | | 2,070 | | | | 1,886 | |
| City of Chicago, School Reform Board of Trustees of the Board of Education, Unlimited Tax G.O. Bonds (Dedicated Tax Rev.), Series 2011-A, 5.00% 2041 | | | 12,470 | | | | 13,156 | |
| City of Chicago, Transit Auth., Sales Tax Receipts Rev. Bonds, Series 2017, Assured Guaranty Municipal insured, 5.00% 2051 | | | 21,750 | | | | 25,285 | |
| City of Chicago, Wastewater Transmission Rev. Bonds, Series 2012, 5.00% 2042 | | | 6,000 | | | | 6,341 | |
| City of Chicago, Wastewater Transmission Rev. Bonds, Series 2014, 5.00% 2024 | | | 1,000 | | | | 1,137 | |
| City of Chicago, Wastewater Transmission Rev. Bonds, Series 2017-A, 5.00% 2037 | | | 3,000 | | | | 3,514 | |
| 40 | American Funds Tax-Exempt Funds |
American High-Income Municipal Bond Fund
| | Principal amount
(000) | | | Value
(000) | |
| City of Chicago, Wastewater Transmission Rev. Ref. Bonds, Capital Appreciation Bonds, Series 1998-A, National insured, 0% 2026 | | $ | 560 | | | $ | 500 | |
| City of Chicago, Wastewater Transmission Rev. Ref. Bonds, Capital Appreciation Bonds, Series 1998-A, National insured, 0% 2027 | | | 5,000 | | | | 4,342 | |
| City of Chicago, Wastewater Transmission Rev. Ref. Bonds, Series 2008-C, 5.00% 2023 | | | 1,000 | | | | 1,105 | |
| City of Chicago, Water Rev. Bonds, Series 2004, 5.00% 2023 | | | 2,575 | | | | 2,914 | |
| City of Chicago, Water Rev. Bonds, Series 2004, 5.00% 2024 | | | 2,000 | | | | 2,322 | |
| City of Chicago, Water Rev. Bonds, Series 2004, 5.00% 2027 | | | 1,750 | | | | 2,108 | |
| City of Chicago, Water Rev. Bonds, Series 2014, 5.00% 2022 | | | 250 | | | | 275 | |
| City of Chicago, Water Rev. Bonds, Series 2014, 5.00% 2033 | | | 6,200 | | | | 7,069 | |
| City of Chicago, Water Rev. Ref. Bonds, Series 2001, 5.75% 2030 | | | 3,000 | | | | 3,798 | |
| City of Chicago, Water Rev. Ref. Bonds, Series 2012, 5.00% 2042 | | | 4,370 | | | | 4,708 | |
| City of Chicago, Water Rev. Ref. Bonds, Series 2014, 5.00% 2029 | | | 1,605 | | | | 1,845 | |
| City of Chicago, Water Rev. Ref. Bonds, Series 2014, 5.00% 2044 | | | 500 | | | | 561 | |
| Fin. Auth., Charter School Rev. Ref. and Improvement Rev. Bonds (Chicago International Charter School Project), Series 2017, 5.00% 2037 | | | 2,030 | | | | 2,317 | |
| Fin. Auth., Charter School Rev. Ref. and Improvement Rev. Bonds (Chicago International Charter School Project), Series 2017, 5.00% 2047 | | | 3,180 | | | | 3,560 | |
| Fin. Auth., Rev. Bonds (Benedictine University Project), Series 2013-A, 6.25% 2033 | | | 4,010 | | | | 4,100 | |
| Fin. Auth., Rev. Bonds (Centegra Health System), Series 2014-A, 5.00% 2022 | | | 40 | | | | 44 | |
| Fin. Auth., Rev. Bonds (Centegra Health System), Series 2014-A, 5.00% 2042 | | | 1,000 | | | | 1,138 | |
| Fin. Auth., Rev. Bonds (Christian Homes, Inc.), Series 2010, 6.125% 2027 | | | 645 | | | | 652 | |
| Fin. Auth., Rev. Bonds (Clean Water Initiative Revolving Fund), Series 2017, 5.00% 2036 | | | 7,530 | | | | 9,195 | |
| Fin. Auth., Rev. Bonds (DePaul University), Series 2016, 5.00% 2041 | | | 1,000 | | | | 1,185 | |
| Fin. Auth., Rev. Bonds (Edward-Elmhurst Healthcare), Series 2017-A, 5.00% 2032 | | | 1,285 | | | | 1,536 | |
| Fin. Auth., Rev. Bonds (Edward-Elmhurst Healthcare), Series 2017-A, 5.00% 2035 | | | 3,750 | | | | 4,446 | |
| Fin. Auth., Rev. Bonds (Franciscan Communities, Inc.), Series 2013-A, 5.125% 2043 | | | 2,975 | | | | 3,156 | |
| Fin. Auth., Rev. Bonds (Franciscan Communities, Inc.), Series 2013-A, 5.125% 2043 (preref. 2023) | | | 430 | | | | 487 | |
| Fin. Auth., Rev. Bonds (Friendship Village Schaumburg), Series 2017, 5.125% 2045 | | | 6,775 | | | | 6,841 | |
| Fin. Auth., Rev. Bonds (Hospital Sisters Services, Inc. Obligated Group), Series 2012-C, 5.00% 2020 | | | 230 | | | | 235 | |
| Fin. Auth., Rev. Bonds (Lifespace Communities, Inc.), Series 2015-A, 5.00% 2026 | | | 255 | | | | 292 | |
| Fin. Auth., Rev. Bonds (Lifespace Communities, Inc.), Series 2015-A, 5.00% 2045 | | | 3,500 | | | | 3,868 | |
| Fin. Auth., Rev. Bonds (Lutheran Life Communities Obligated Group), Series 2019-A, 5.00% 2035 | | | 900 | | | | 999 | |
| Fin. Auth., Rev. Bonds (Lutheran Life Communities Obligated Group), Series 2019-A, 5.00% 2040 | | | 1,100 | | | | 1,208 | |
| Fin. Auth., Rev. Bonds (Lutheran Life Communities Obligated Group), Series 2019-A, 5.00% 2049 | | | 1,270 | | | | 1,378 | |
| Fin. Auth., Rev. Bonds (Mercy Health Corp.), Series 2016, 5.00% 2046 | | | 17,165 | | | | 19,741 | |
| Fin. Auth., Rev. Bonds (Northwest Community Hospital), Series 2016-A, 5.00% 2033 | | | 1,800 | | | | 2,126 | |
| Fin. Auth., Rev. Bonds (OSF Healthcare System), Series 2012-A, 5.00% 2028 | | | 1,500 | | | | 1,619 | |
| Fin. Auth., Rev. Bonds (OSF Healthcare System), Series 2015-A, 4.125% 2037 | | | 1,000 | | | | 1,105 | |
| Fin. Auth., Rev. Bonds (Presbyterian Homes Obligated Group), Series 2016-A, 5.00% 2025 | | | 1,135 | | | | 1,355 | |
| Fin. Auth., Rev. Bonds (Presbyterian Homes Obligated Group), Series 2016-A, 5.00% 2026 | | | 1,000 | | | | 1,221 | |
| Fin. Auth., Rev. Bonds (Presbyterian Homes Obligated Group), Series 2016-A, 5.00% 2026 | | | 1,000 | | | | 1,206 | |
| Fin. Auth., Rev. Bonds (Presbyterian Homes Obligated Group), Series 2016-A, 5.00% 2028 | | | 2,240 | | | | 2,706 | |
| Fin. Auth., Rev. Bonds (Presbyterian Homes Obligated Group), Series 2016-A, 5.00% 2029 | | | 3,090 | | | | 3,716 | |
| Fin. Auth., Rev. Bonds (Presbyterian Homes Obligated Group), Series 2016-A, 5.00% 2030 | | | 1,500 | | | | 1,793 | |
| Fin. Auth., Rev. Bonds (Presbyterian Homes Obligated Group), Series 2016-A, 5.00% 2031 | | | 2,270 | | | | 2,703 | |
| Fin. Auth., Rev. Bonds (Presbyterian Homes Obligated Group), Series 2016-B,(1-month USD-LIBOR x 0.70 + 1.35%) 2.596% 2036 (put 2021)2 | | | 800 | | | | 801 | |
| Fin. Auth., Rev. Bonds (Presence Health Network), Series 2016-C, 3.75% 2034 | | | 250 | | | | 275 | |
| Fin. Auth., Rev. Bonds (Presence Health Network), Series 2016-C, 4.00% 2041 | | | 1,675 | | | | 1,855 | |
| Fin. Auth., Rev. Bonds (Presence Health Network), Series 2016-C, 4.00% 2041 (preref. 2027) | | | 80 | | | | 95 | |
| Fin. Auth., Rev. Bonds (Presence Health Network), Series 2016-C, 4.00% 2041 (preref. 2027) | | | 5 | | | | 6 | |
| Fin. Auth., Rev. Bonds (Presence Health Network), Series 2016-C, 5.00% 2027 | | | 1,875 | | | | 2,362 | |
| Fin. Auth., Rev. Bonds (Presence Health Network), Series 2016-C, 5.00% 2029 | | | 9,000 | | | | 11,201 | |
| Fin. Auth., Rev. Bonds (Presence Health Network), Series 2016-C, 5.00% 2030 | | | 1,000 | | | | 1,236 | |
| Fin. Auth., Rev. Bonds (Presence Health Network), Series 2016-C, 5.00% 2032 | | | 4,500 | | | | 5,523 | |
| Fin. Auth., Rev. Bonds (Presence Health Network), Series 2016-C, 5.00% 2034 | | | 1,265 | | | | 1,539 | |
| Fin. Auth., Rev. Bonds (Presence Health Network), Series 2016-C, 5.00% 2036 | | | 3,605 | | | | 4,350 | |
| Fin. Auth., Rev. Bonds (Presence Health Network), Series 2016-C, 5.00% 2041 | | | 2,000 | | | | 2,383 | |
| American Funds Tax-Exempt Funds | 41 |
American High-Income Municipal Bond Fund
| Bonds, notes & other debt instruments (continued) | Principal amount
(000) | | | Value
(000) | |
| Illinois (continued) | | | | | | | | |
| Fin. Auth., Rev. Bonds (Rehabilitation Institute of Chicago), Series 2013-A, 6.00% 2043 | | $ | 2,300 | | | $ | 2,596 | |
| Fin. Auth., Rev. Bonds (Rosalind Franklin University Research Building Project), Series 2017-C, 5.00% 2046 | | | 900 | | | | 1,038 | |
| Fin. Auth., Rev. Bonds (Rosalind Franklin University Research Building Project), Series 2017-C, 5.00% 2049 | | | 1,250 | | | | 1,438 | |
| Fin. Auth., Rev. Bonds (Rush University Medical Center Obligated Group), Series 2015-A, 5.00% 2032 | | | 1,100 | | | | 1,288 | |
| Fin. Auth., Rev. Bonds (Rush University Medical Center Obligated Group), Series 2015-A, 5.00% 2038 | | | 1,500 | | | | 1,724 | |
| Fin. Auth., Rev. Bonds (Swedish Covenant Hospital), Series 2016-A, 5.00% 2032 | | | 2,000 | | | | 2,336 | |
| Fin. Auth., Rev. Bonds (Swedish Covenant Hospital), Series 2016-A, 5.00% 2033 | | | 2,000 | | | | 2,331 | |
| Fin. Auth., Rev. Bonds (Swedish Covenant Hospital), Series 2016-A, 5.00% 2035 | | | 2,000 | | | | 2,324 | |
| Fin. Auth., Rev. Bonds (Swedish Covenant Hospital), Series 2016-A, 5.00% 2037 | | | 1,800 | | | | 2,079 | |
| Fin. Auth., Rev. Bonds (The Cable Foundation), Series 2016-A, 5.00% 2045 | | | 6,880 | | | | 7,956 | |
| Fin. Auth., Rev. Ref. Bonds (Anne & Robert H. Lurie Children’s Hospital), Series 2017, 5.00% 2034 | | | 1,000 | | | | 1,226 | |
| Fin. Auth., Rev. Ref. Bonds (Benedictine University), Series 2017, 5.00% 2026 | | | 1,065 | | | | 1,207 | |
| Fin. Auth., Rev. Ref. Bonds (Benedictine University), Series 2017, 5.00% 2030 | | | 1,900 | | | | 2,147 | |
| Fin. Auth., Rev. Ref. Bonds (Benedictine University), Series 2017, 5.00% 2033 | | | 3,000 | | | | 3,362 | |
| Fin. Auth., Rev. Ref. Bonds (Benedictine University), Series 2017, 5.00% 2038 | | | 11,080 | | | | 12,262 | |
| Fin. Auth., Rev. Ref. Bonds (Bradley University Project), Series 2017-C, 5.00% 2032 | | | 1,250 | | | | 1,507 | |
| Fin. Auth., Rev. Ref. Bonds (Christian Homes, Inc.), Series 2016, 5.00% 2031 | | | 1,875 | | | | 2,058 | |
| Fin. Auth., Rev. Ref. Bonds (Christian Homes, Inc.), Series 2016, 5.00% 2036 | | | 1,000 | | | | 1,086 | |
| Fin. Auth., Rev. Ref. Bonds (Illinois Institute of Technology), Series 2019, 5.00% 2034 | | | 1,100 | | | | 1,336 | |
| Fin. Auth., Rev. Ref. Bonds (Illinois Institute of Technology), Series 2019, 5.00% 2036 | | | 1,000 | | | | 1,208 | |
| Fin. Auth., Rev. Ref. Bonds (Illinois Institute of Technology), Series 2019, 5.00% 2038 | | | 1,000 | | | | 1,201 | |
| Fin. Auth., Rev. Ref. Bonds (Illinois Institute of Technology), Series 2019, 5.00% 2040 | | | 1,500 | | | | 1,792 | |
| Fin. Auth., Rev. Ref. Bonds (OSF Healthcare System), Series 2010-A, 6.00% 2039 | | | 940 | | | | 955 | |
| Fin. Auth., Rev. Ref. Bonds (OSF Healthcare System), Series 2010-A, 6.00% 2039 (preref. 2020) | | | 5,135 | | | | 5,207 | |
| Fin. Auth., Rev. Ref. Bonds (OSF Healthcare System), Series 2015-A, 5.00% 2035 | | | 5,450 | | | | 6,366 | |
| Fin. Auth., Rev. Ref. Bonds (OSF Healthcare System), Series 2015-A, 5.00% 2045 | | | 2,000 | | | | 2,296 | |
| Fin. Auth., Rev. Ref. Bonds (OSF Healthcare System), Series 2018-A, 4.125% 2047 | | | 2,000 | | | | 2,254 | |
| Fin. Auth., Rev. Ref. Bonds (Provena Health), Series 2010-A, 6.00% 2028 (preref. 2020) | | | 1,250 | | | | 1,265 | |
| Fin. Auth., Rev. Ref. Bonds (Silver Cross Hospital and Medical Centers), Series 2015-C, 4.125% 2037 | | | 8,710 | | | | 9,276 | |
| Fin. Auth., Rev. Ref. Bonds (Silver Cross Hospital and Medical Centers), Series 2015-C, 5.00% 2035 | | | 3,950 | | | | 4,536 | |
| Fin. Auth., Rev. Ref. Bonds (Silver Cross Hospital and Medical Centers), Series 2015-C, 5.00% 2044 | | | 6,400 | | | | 7,227 | |
| Fin. Auth., Rev. Ref. Bonds (Southern Illinois Healthcare Enterprises, Inc.), Series 2017-C, 5.00% 2026 | | | 250 | | | | 302 | |
| Fin. Auth., Rev. Ref. Bonds (University of Chicago Medical Center), Series 2009-B, 5.00% 2025 | | | 1,995 | | | | 2,037 | |
| Fin. Auth., Rev. Ref. Bonds (University of Chicago Medical Center), Series 2009-B, 5.00% 2025 (preref. 2020) | | | 1,005 | | | | 1,027 | |
| Fin. Auth., Student Housing and Academic Fac. Rev. Bonds (CHF-Chicago, LLC - University of Illinois at Chicago Project), Series 2017-A, 5.00% 2047 | | | 2,365 | | | | 2,699 | |
| Fin. Auth., Student Housing Rev. Bonds (CHF-Cook, LLC - Northeastern Illinois University Project), Series 2015-A, 5.00% 2023 | | | 775 | | | | 797 | |
| Fin. Auth., Student Housing Rev. Bonds (CHF-Cook, LLC - Northeastern Illinois University Project), Series 2015-A, 5.00% 2024 | | | 815 | | | | 843 | |
| Fin. Auth., Student Housing Rev. Bonds (CHF-Cook, LLC - Northeastern Illinois University Project), Series 2015-A, 5.00% 2025 | | | 730 | | | | 758 | |
| Fin. Auth., Student Housing Rev. Bonds (CHF-Cook, LLC - Northeastern Illinois University Project), Series 2015-A, 5.00% 2030 | | | 3,965 | | | | 4,056 | |
| Fin. Auth., Student Housing Rev. Bonds (CHF-Cook, LLC - Northeastern Illinois University Project), Series 2015-A, 5.00% 2035 | | | 2,800 | | | | 2,840 | |
| Fin. Auth., Student Housing Rev. Bonds (CHF-Cook, LLC - Northeastern Illinois University Project), Series 2015-A, 5.00% 2047 | | | 12,500 | | | | 12,505 | |
| Fin. Auth., Student Housing Rev. Bonds (CHF-DeKalb II, LLC - Northern Illinois University Project), Series 2011, 5.125% 2020 | | | 2,275 | | | | 2,311 | |
| Fin. Auth., Student Housing Rev. Bonds (CHF-DeKalb II, LLC - Northern Illinois University Project), Series 2011, 5.75% 2021 | | | 2,000 | | | | 2,087 | |
| 42 | American Funds Tax-Exempt Funds |
American High-Income Municipal Bond Fund
| | Principal amount
(000) | | | Value
(000) | |
| Fin. Auth., Student Housing Rev. Bonds (CHF-DeKalb II, LLC - Northern Illinois University Project), Series 2011, 6.00% 2024 | | $ | 1,000 | | | $ | 1,049 | |
| Fin. Auth., Student Housing Rev. Bonds (CHF-DeKalb II, LLC - Northern Illinois University Project), Series 2011, 6.875% 2043 | | | 19,125 | | | | 20,190 | |
| Fin. Auth., Student Housing Rev. Bonds (CHF-Normal, LLC - Illinois State University Project), Series 2011, 7.00% 2043 (preref. 2021) | | | 4,265 | | | | 4,560 | |
| G.O. Bonds, Series 2010, Assured Guaranty Municipal insured, 5.00% 2022 | | | 50 | | | | 50 | |
| G.O. Bonds, Series 2012-A, 5.00% 2028 | | | 1,000 | | | | 1,056 | |
| G.O. Bonds, Series 2013, 5.00% 2021 | | | 875 | | | | 917 | |
| G.O. Bonds, Series 2013, 5.00% 2023 | | | 720 | | | | 796 | |
| G.O. Bonds, Series 2013, 5.50% 2026 | | | 2,000 | | | | 2,237 | |
| G.O. Bonds, Series 2013, 5.50% 2033 | | | 3,715 | | | | 4,102 | |
| G.O. Bonds, Series 2013, 5.50% 2038 | | | 1,000 | | | | 1,103 | |
| G.O. Bonds, Series 2014, 5.00% 2022 | | | 885 | | | | 943 | |
| G.O. Bonds, Series 2014, 5.00% 2024 | | | 3,000 | | | | 3,354 | |
| G.O. Bonds, Series 2014, 5.00% 2026 | | | 2,025 | | | | 2,265 | |
| G.O. Bonds, Series 2014, 5.00% 2027 | | | 2,000 | | | | 2,337 | |
| G.O. Bonds, Series 2014, 5.00% 2039 | | | 13,550 | | | | 14,804 | |
| G.O. Bonds, Series 2014, Assured Guaranty Municipal insured, 5.00% 2039 | | | 4,100 | | | | 4,500 | |
| G.O. Bonds, Series 2016, 5.00% 2025 | | | 1,000 | | | | 1,149 | |
| G.O. Bonds, Series 2016, 5.00% 2027 | | | 3,065 | | | | 3,635 | |
| G.O. Bonds, Series 2016, 5.00% 2028 | | | 1,500 | | | | 1,759 | |
| G.O. Bonds, Series 2016, 5.00% 2033 | | | 4,000 | | | | 4,656 | |
| G.O. Bonds, Series 2016, 5.00% 2038 | | | 1,000 | | | | 1,151 | |
| G.O. Bonds, Series 2016, Assured Guaranty Municipal insured, 5.00% 2030 | | | 3,000 | | | | 3,467 | |
| G.O. Bonds, Series 2016, Assured Guaranty Municipal insured, 5.00% 2041 | | | 2,125 | | | | 2,400 | |
| G.O. Bonds, Series 2017-A, 5.00% 2035 | | | 3,145 | | | | 3,719 | |
| G.O. Bonds, Series 2017-A, 5.00% 2036 | | | 3,000 | | | | 3,539 | |
| G.O. Bonds, Series 2017-C, 5.00% 2029 | | | 9,820 | | | | 11,692 | |
| G.O. Bonds, Series 2017-D, 5.00% 2027 | | | 23,990 | | | | 28,853 | |
| G.O. Bonds, Series 2017-D, BAM insured, 5.00% 2021 | | | 3,335 | | | | 3,532 | |
| G.O. Bonds, Series 2017-D, BAM insured, 5.00% 2026 | | | 11,980 | | | | 14,188 | |
| G.O. Bonds, Series 2017-D, BAM insured, 5.00% 2028 | | | 18,000 | | | | 21,560 | |
| G.O. Bonds, Series 2018-A, 5.00% 2020 | | | 2,650 | | | | 2,674 | |
| G.O. Bonds, Series 2019-B, 5.00% 2027 | | | 5,000 | | | | 6,042 | |
| G.O. Rev. Ref. Bonds, Series 2012, 4.00% 2025 | | | 405 | | | | 424 | |
| G.O. Rev. Ref. Bonds, Series 2012, Assured Guaranty Municipal insured, 5.00% 2025 | | | 4,250 | | | | 4,580 | |
| G.O. Rev. Ref. Bonds, Series 2016, 5.00% 2026 | | | 3,000 | | | | 3,527 | |
| G.O. Rev. Ref. Bonds, Series 2016, 5.00% 2028 | | | 3,000 | | | | 3,573 | |
| G.O. Rev. Ref. Bonds, Series 2016, Assured Guaranty Municipal insured, 4.00% 2030 | | | 750 | | | | 847 | |
| G.O. Rev. Ref. Bonds, Series 2018-A, 5.00% 2023 | | | 2,500 | | | | 2,781 | |
| G.O. Rev. Ref. Bonds, Series 2018-A, 5.00% 2025 | | | 3,750 | | | | 4,376 | |
| G.O. Rev. Ref. Bonds, Series 2018-A, 5.00% 2026 | | | 5,500 | | | | 6,546 | |
| G.O. Rev. Ref. Bonds, Series 2018-A, 5.00% 2027 | | | 2,000 | | | | 2,420 | |
| G.O. Rev. Ref. Bonds, Series 2018-A, 5.00% 2028 | | | 4,000 | | | | 4,910 | |
| G.O. Rev. Ref. Bonds, Series 2018-A, 5.00% 2029 | | | 2,000 | | | | 2,434 | |
| G.O. Rev. Ref. Bonds, Series 2018-B, 5.00% 2033 | | | 3,000 | | | | 3,601 | |
| Metropolitan Pier and Exposition Auth., Dedicated State Tax Rev. Bonds, Capital Appreciation Bonds, Series 1994, BAM insured, 0% 2028 | | | 3,185 | | | | 2,655 | |
| Metropolitan Pier and Exposition Auth., Dedicated State Tax Rev. Bonds, Capital Appreciation Bonds, Series 2002-A, National insured, 0% 2030 | | | 2,435 | | | | 1,882 | |
| Metropolitan Pier and Exposition Auth., Dedicated State Tax Rev. Bonds, Capital Appreciation Bonds, Series 2002-A, National insured, 0% 2030 (escrowed to maturity) | | | 130 | | | | 110 | |
| Metropolitan Pier and Exposition Auth., McCormick Place Expansion Project Bonds, Capital Appreciation Bonds, Series 2002-A, National insured, 0% 2032 | | | 8,860 | | | | 6,301 | |
| Metropolitan Pier and Exposition Auth., McCormick Place Expansion Project Bonds, Capital Appreciation Bonds, Series 2002-A, National insured, 0% 2033 | | | 10,230 | | | | 7,037 | |
| Metropolitan Pier and Exposition Auth., McCormick Place Expansion Project Bonds, Capital Appreciation Bonds, Series 2002-A, National insured, 0% 2034 | | | 10,000 | | | | 6,734 | |
| Metropolitan Pier and Exposition Auth., McCormick Place Expansion Project Bonds, Capital Appreciation Bonds, Series 2002-A, National insured, 0% 2039 | | | 3,800 | | | | 2,093 | |
| Metropolitan Pier and Exposition Auth., McCormick Place Expansion Project Bonds, Capital Appreciation Bonds, Series 2012-B, 0% 2050 | | | 3,830 | | | | 1,348 | |
| American Funds Tax-Exempt Funds | 43 |
American High-Income Municipal Bond Fund
| Bonds, notes & other debt instruments (continued) | Principal amount
(000) | | | Value
(000) | |
| Illinois (continued) | | | | | | | | |
| Metropolitan Pier and Exposition Auth., McCormick Place Expansion Project Bonds, Capital Appreciation Bonds, Series 2012-B, 0% 2051 | | $ | 13,350 | | | $ | 4,512 | |
| Metropolitan Pier and Exposition Auth., McCormick Place Expansion Project Bonds, Series 2012-A, 5.00% 2042 | | | 1,500 | | | | 1,606 | |
| Metropolitan Pier and Exposition Auth., McCormick Place Expansion Project Rev. Bonds, Series 2002-A, Assured Guaranty Municipal insured, 5.50% 2023 | | | 530 | | | | 573 | |
| Metropolitan Pier and Exposition Auth., McCormick Place Expansion Project Rev. Ref. Bonds, Capital Appreciation Bonds, Series 1996-A, National insured, 0% 2025 | | | 2,535 | | | | 2,297 | |
| Metropolitan Pier and Exposition Auth., McCormick Place Expansion Project Rev. Ref. Bonds, Capital Appreciation Bonds, Series 2010-B-1, Assured Guaranty Municipal insured, 0% 2027 | | | 3,500 | | | | 3,018 | |
| Metropolitan Pier and Exposition Auth., McCormick Place Expansion Project Rev. Ref. Bonds, Capital Appreciation Bonds, Series 2010-B-1, Assured Guaranty Municipal insured, 0% 2043 | | | 800 | | | | 411 | |
| Metropolitan Pier and Exposition Auth., McCormick Place Expansion Project Rev. Ref. Bonds, Capital Appreciation Bonds, Series 2010-B-1, Assured Guaranty Municipal insured, 0% 2044 | | | 25,395 | | | | 12,623 | |
| Metropolitan Pier and Exposition Auth., McCormick Place Expansion Project Rev. Ref. Bonds, Capital Appreciation Bonds, Series 2010-B-1, Assured Guaranty Municipal insured, 0% 2046 | | | 3,300 | | | | 1,534 | |
| Metropolitan Pier and Exposition Auth., McCormick Place Expansion Project Rev. Ref. Bonds, Capital Appreciation Bonds, Series 2017-A, 0% 2056 | | | 32,160 | | | | 9,131 | |
| Metropolitan Pier and Exposition Auth., McCormick Place Expansion Project Rev. Ref. Bonds, Capital Appreciation Bonds, Series 2017-A, Assured Guaranty Municipal insured, 0% 2056 | | | 6,000 | | | | 1,970 | |
| Metropolitan Pier and Exposition Auth., McCormick Place Expansion Project Rev. Ref. Bonds, Capital Appreciation Bonds, Series 2017-B, 0% 2054 | | | 27,760 | | | | 8,442 | |
| Metropolitan Pier and Exposition Auth., McCormick Place Expansion Project Rev. Ref. Bonds, Capital Appreciation Bonds, Series 2017-B, Assured Guaranty Municipal insured, 0% 2056 | | | 37,865 | | | | 12,429 | |
| Metropolitan Pier and Exposition Auth., McCormick Place Expansion Project Rev. Ref. Bonds, Series 2010-B-2, 5.00% 2050 | | | 5,850 | | | | 5,936 | |
| Metropolitan Pier and Exposition Auth., McCormick Place Expansion Project Rev. Ref. Bonds, Series 2012-B, 5.00% 2028 | | | 500 | | | | 536 | |
| Metropolitan Pier and Exposition Auth., McCormick Place Expansion Project Rev. Ref. Bonds, Series 2012-B, 5.00% 2052 | | | 1,470 | | | | 1,555 | |
| Metropolitan Pier and Exposition Auth., McCormick Place Expansion Project Rev. Ref. Bonds, Series 2015-B, 5.00% 2035 | | | 3,000 | | | | 3,456 | |
| Metropolitan Pier and Exposition Auth., McCormick Place Expansion Project Rev. Ref. Bonds, Series 2015-B, 5.00% 2040 | | | 4,000 | | | | 4,560 | |
| Metropolitan Pier and Exposition Auth., McCormick Place Expansion Project Rev. Ref. Bonds, Series 2020-A, 4.00% 2050 | | | 13,000 | | | | 14,322 | |
| Metropolitan Pier and Exposition Auth., McCormick Place Expansion Project Rev. Ref. Bonds, Series 2020-A, 5.00% 2050 | | | 5,000 | | | | 6,013 | |
| Other securities | | | | | | | 268,857 | |
| | | | | | | | 1,290,567 | |
| |
| Indiana 1.33% | | | | | | | | |
| Fin. Auth., Health System Rev. Bonds (Franciscan Alliance, Inc.), Series 2016-A, 5.00% 2051 | | | 1,500 | | | | 1,708 | |
| Fin. Auth., Hospital Rev. Bonds (Goshen Health), Series 2019-A, 4.00% 2043 | | | 2,000 | | | | 2,202 | |
| Fin. Auth., Hospital Rev. Ref. Bonds (Indiana University Health Obligated Group), Series 2011-N, 5.00% 2031 (preref. 2021) | | | 4,000 | | | | 4,174 | |
| Fin. Auth., Hospital Rev. Ref. Bonds (The Methodist Hospitals, Inc.), Series 2014-A, 5.00% 2028 | | | 2,500 | | | | 2,817 | |
| Fin. Auth., Midwestern Disaster Relief Rev. Bonds (Ohio Valley Electric Corp. Project), Series 2012-A, 5.00% 2032 | | | 17,560 | | | | 18,429 | |
| Fin. Auth., Midwestern Disaster Relief Rev. Bonds (Ohio Valley Electric Corp. Project), Series 2012-A, 5.00% 2039 | | | 10,100 | | | | 10,592 | |
| Fin. Auth., Private Activity Bonds (Ohio River Bridges East End Crossing Project), Series 2013-A, AMT, 5.00% 2035 | | | 3,000 | | | | 3,324 | |
| Fin. Auth., Private Activity Bonds (Ohio River Bridges East End Crossing Project), Series 2013-A, AMT, 5.00% 2044 | | | 7,225 | | | | 7,966 | |
| Fin. Auth., Private Activity Bonds (Ohio River Bridges East End Crossing Project), Series 2013-A, AMT, 5.00% 2048 | | | 3,250 | | | | 3,576 | |
| 44 | American Funds Tax-Exempt Funds |
American High-Income Municipal Bond Fund
| | Principal amount
(000) | | | Value
(000) | |
| Fin. Auth., Private Activity Bonds (Ohio River Bridges East End Crossing Project), Series 2013-A, AMT, 5.25% 2051 | | $ | 3,410 | | | $ | 3,803 | |
| Fin. Auth., Rev. Bonds (BHI Senior Living Obligated Group), Series 2016-A, 5.25% 2046 | | | 6,750 | | | | 7,776 | |
| Fin. Auth., Rev. Bonds (BHI Senior Living Obligated Group), Series 2018-A, 5.00% 2033 | | | 2,410 | | | | 2,809 | |
| Fin. Auth., Rev. Bonds (BHI Senior Living Obligated Group), Series 2018-A, 5.00% 2038 | | | 2,395 | | | | 2,766 | |
| Fin. Auth., Rev. Bonds (BHI Senior Living Obligated Group), Series 2018-A, 5.00% 2043 | | | 4,000 | | | | 4,579 | |
| Fin. Auth., Rev. Bonds (BHI Senior Living Obligated Group), Series 2018-A, 5.00% 2048 | | | 4,500 | | | | 5,131 | |
| Fin. Auth., Rev. Bonds (Greencroft Obligated Group), Series 2013-A, 5.75% 2028 | | | 255 | | | | 284 | |
| Fin. Auth., Rev. Bonds (Greencroft Obligated Group), Series 2013-A, 6.50% 2033 | | | 215 | | | | 244 | |
| Fin. Auth., Rev. Bonds (Greencroft Obligated Group), Series 2013-A, 7.00% 2043 | | | 3,710 | | | | 4,218 | |
| Fin. Auth., Rev. Ref. Bonds (Community Foundation of Northwest Indiana Obligated Group), Series 2015, 5.00% 2036 | | | 3,730 | | | | 4,306 | |
| Other securities | | | | | | | 25,049 | |
| | | | | | | | 115,753 | |
| | | | | | | | | |
| Mississippi 0.24% | | | | | | | | |
| Business Fin. Corp., Solid Waste Disposal, Rev. Bonds (Waste Pro USA, Inc. Project), Series 2017, AMT, 5.00% 2036 (put 2022)1 | | | 5,645 | | | | 6,045 | |
| Other securities | | | | | | | 14,455 | |
| | | | | | | | 20,500 | |
| | | | | | | | | |
| New Jersey 4.22% | | | | | | | | |
| Econ. Dev. Auth., Energy Fac. Rev. Bonds (UMM Energy Partners, LLC Project), Series 2012-A, AMT, 5.00% 2037 | | | 7,085 | | | | 7,558 | |
| Econ. Dev. Auth., Energy Fac. Rev. Bonds (UMM Energy Partners, LLC Project), Series 2012-A, AMT, 5.125% 2043 | | | 750 | | | | 800 | |
| Econ. Dev. Auth., Private Activity Bonds (Goethals Bridge Replacement Project), Series 2013, AMT, 5.375% 2043 | | | 7,725 | | | | 8,760 | |
| Econ. Dev. Auth., Private Activity Bonds (Goethals Bridge Replacement Project), Series 2013, AMT, 5.625% 2052 | | | 3,940 | | | | 4,473 | |
| Econ. Dev. Auth., Rev. Bonds (Foundation Academy Charter School Project), Series 2018-A, 5.00% 2050 | | | 1,100 | | | | 1,260 | |
| Econ. Dev. Auth., Rev. Bonds (Provident Group - Kean Properties LLC - Kean University Student Housing Project), Series 2017-A, 5.00% 2027 | | | 1,000 | | | | 1,169 | |
| Econ. Dev. Auth., Rev. Bonds (Provident Group - Kean Properties LLC - Kean University Student Housing Project), Series 2017-A, 5.00% 2037 | | | 1,250 | | | | 1,422 | |
| Econ. Dev. Auth., Rev. Bonds (Provident Group - Kean Properties LLC - Kean University Student Housing Project), Series 2017-A, 5.00% 2047 | | | 3,500 | | | | 3,910 | |
| Econ. Dev. Auth., Rev. Bonds (Provident Group - Kean Properties LLC - Kean University Student Housing Project), Series 2017-A, 5.00% 2050 | | | 1,590 | | | | 1,773 | |
| Econ. Dev. Auth., Rev. Bonds (Provident Group - Montclair Properties LLC - Montclair State University Student Housing Project), Series 2010-A, 5.875% 2042 (preref. 2020) | | | 2,500 | | | | 2,541 | |
| Econ. Dev. Auth., Rev. Ref. Bonds (Cranes Mill Project), Series 2018, 5.00% 2029 | | | 1,200 | | | | 1,425 | |
| Econ. Dev. Auth., Rev. Ref. Bonds (Cranes Mill Project), Series 2018, 5.00% 2034 | | | 2,025 | | | | 2,364 | |
| Econ. Dev. Auth., Rev. Ref. Bonds (Cranes Mill Project), Series 2018, 5.00% 2039 | | | 1,685 | | | | 1,948 | |
| Econ. Dev. Auth., Rev. Ref. Bonds (Cranes Mill Project), Series 2018, 5.00% 2049 | | | 3,810 | | | | 4,353 | |
| Econ. Dev. Auth., Rev. Ref. Bonds (Motor Vehicle Surcharges), Series 2017-A, BAM insured, 5.00% 2027 | | | 3,250 | | | | 4,000 | |
| Econ. Dev. Auth., Rev. Ref. Bonds (Provident Group - Montclair Properties LLC - Montclair State University Student Housing Project), Series 2017, Assured Guaranty Municipal insured, 5.00% 2037 | | | 2,750 | | | | 3,298 | |
| Econ. Dev. Auth., Rev. Ref. Bonds (Provident Group - Rowan Properties LLC - Rowan University Student Housing Project), Series 2015-A, 5.00% 2024 | | | 2,050 | | | | 2,272 | |
| Econ. Dev. Auth., Rev. Ref. Bonds (Provident Group - Rowan Properties LLC - Rowan University Student Housing Project), Series 2015-A, 5.00% 2030 | | | 1,000 | | | | 1,114 | |
| Econ. Dev. Auth., Rev. Ref. Bonds (Provident Group - Rowan Properties LLC - Rowan University Student Housing Project), Series 2015-A, 5.00% 2035 | | | 3,750 | | | | 4,135 | |
| Econ. Dev. Auth., Rev. Ref. Bonds (Provident Group - Rowan Properties LLC - Rowan University Student Housing Project), Series 2015-A, 5.00% 2048 | | | 2,150 | | | | 2,331 | |
| Econ. Dev. Auth., School Facs. Construction Bonds, Series 2015-WW, 5.25% 2033 | | | 2,500 | | | | 2,889 | |
| Econ. Dev. Auth., School Facs. Construction Bonds, Series 2016-AAA, 5.50% 2031 | | | 2,000 | | | | 2,424 | |
| Econ. Dev. Auth., School Facs. Construction Bonds, Series 2017-DDD, 5.00% 2034 | | | 1,500 | | | | 1,776 | |
| Econ. Dev. Auth., School Facs. Construction Bonds, Series 2017-DDD, 5.00% 2035 | | | 1,275 | | | | 1,506 | |
| Econ. Dev. Auth., School Facs. Construction Bonds, Series 2018-FFF, 5.00% 2026 | | | 3,235 | | | | 3,884 | |
| American Funds Tax-Exempt Funds | 45 |
American High-Income Municipal Bond Fund
| Bonds, notes & other debt instruments (continued) | Principal amount
(000) | | | Value
(000) | |
| New Jersey (continued) | | | | | | | | |
| Econ. Dev. Auth., School Facs. Construction Bonds, Series 2019-LLL, 4.00% 2044 | | $ | 3,500 | | | $ | 3,853 | |
| Econ. Dev. Auth., School Facs. Construction Rev. Bonds, Series 2013-NN, 5.00% 2024 | | | 2,000 | | | | 2,219 | |
| Econ. Dev. Auth., School Facs. Construction Rev. Ref. Bonds, Series 2013-I, (SIFMA Municipal Swap Index + 1.60%) 2.54% 20282 | | | 13,970 | | | | 14,313 | |
| Econ. Dev. Auth., School Facs. Construction Rev. Ref. Bonds, Series 2015-XX, 5.00% 2021 | | | 125 | | | | 131 | |
| Econ. Dev. Auth., School Facs. Construction Rev. Ref. Bonds, Series 2015-XX, 5.00% 2025 | | | 10,500 | | | | 12,362 | |
| Econ. Dev. Auth., School Facs. Rev. Bonds (Beloved Community Charter School), Series 2019-A, 4.00% 20291 | | | 670 | | | | 717 | |
| Econ. Dev. Auth., School Facs. Rev. Bonds (Beloved Community Charter School), Series 2019-A, 5.00% 20391 | | | 825 | | | | 902 | |
| Econ. Dev. Auth., School Facs. Rev. Bonds (Beloved Community Charter School), Series 2019-A, 5.00% 20491 | | | 930 | | | | 1,011 | |
| Econ. Dev. Auth., School Facs. Rev. Bonds (Beloved Community Charter School), Series 2019-A, 5.00% 20541 | | | 725 | | | | 782 | |
| Econ. Dev. Auth., Special Fac. Rev. Bonds (Continental Airlines, Inc. Project), Series 1999, AMT, 5.125% 2023 | | | 3,500 | | | | 3,763 | |
| Econ. Dev. Auth., Special Fac. Rev. Bonds (Continental Airlines, Inc. Project), Series 1999, AMT, 5.25% 2029 | | | 16,950 | | | | 18,543 | |
| Econ. Dev. Auth., Special Fac. Rev. Bonds (Continental Airlines, Inc. Project), Series 2000-B, AMT, 5.625% 2030 | | | 4,125 | | | | 4,761 | |
| Econ. Dev. Auth., Special Fac. Rev. Bonds (Continental Airlines, Inc. Project), Series 2003, AMT, 5.50% 2033 | | | 3,500 | | | | 3,921 | |
| Econ. Dev. Auth., Special Fac. Rev. Ref. Bonds (Continental Airlines, Inc. Project), Series 2012, AMT, 5.75% 2027 | | | 4,500 | | | | 4,959 | |
| Econ. Dev. Auth., Transit Transportation Project Bonds, Series 2020-A, 4.00% 2037 | | | 1,850 | | | | 2,072 | |
| Econ. Dev. Auth., Transit Transportation Project Bonds, Series 2020-A, 4.00% 2038 | | | 6,600 | | | | 7,368 | |
| Econ. Dev. Auth., Transit Transportation Project Bonds, Series 2020-A, 4.00% 2039 | | | 4,550 | | | | 5,065 | |
| Econ. Dev. Auth., Transit Transportation Project Bonds, Series 2020-A, 5.00% 2033 | | | 5,000 | | | | 6,195 | |
| Transportation Trust Fund Auth., Federal Highway Reimbursement Rev. Ref. Bonds, Series 2018-A, 5.00% 2023 | | | 1,000 | | | | 1,122 | |
| Transportation Trust Fund Auth., Federal Highway Reimbursement Rev. Ref. Bonds, Series 2018-A, 5.00% 2029 | | | 4,000 | | | | 4,751 | |
| Transportation Trust Fund Auth., Federal Highway Reimbursement Rev. Ref. Bonds, Series 2018-A, 5.00% 2031 | | | 4,500 | | | | 5,303 | |
| Transportation Trust Fund Auth., Transportation Program Bonds, Series 2019-BB, 5.00% 2035 | | | 2,345 | | | | 2,849 | |
| Transportation Trust Fund Auth., Transportation Program Bonds, Series 2019-BB, 5.00% 2044 | | | 4,000 | | | | 4,745 | |
| Transportation Trust Fund Auth., Transportation Program Bonds, Series 2019-BB, 5.00% 2050 | | | 2,500 | | | | 2,944 | |
| Transportation Trust Fund Auth., Transportation System Bonds, Capital Appreciation Bonds, Series 2006-C, AMBAC insured, 0% 2026 | | | 630 | | | | 552 | |
| Transportation Trust Fund Auth., Transportation System Bonds, Capital Appreciation Bonds, Series 2006-C, AMBAC insured, 0% 2035 | | | 3,375 | | | | 2,186 | |
| Transportation Trust Fund Auth., Transportation System Bonds, Capital Appreciation Bonds, Series 2006-C, AMBAC insured, 0% 2036 | | | 9,730 | | | | 6,055 | |
| Transportation Trust Fund Auth., Transportation System Bonds, Capital Appreciation Bonds, Series 2006-C, Assured Guaranty Municipal insured, 0% 2034 | | | 17,245 | | | | 11,994 | |
| Transportation Trust Fund Auth., Transportation System Bonds, Capital Appreciation Bonds, Series 2006-C, National insured, 0% 2031 | | | 12,480 | | | | 9,396 | |
| Transportation Trust Fund Auth., Transportation System Bonds, Capital Appreciation Bonds, Series 2008-A, 0% 2035 | | | 4,000 | | | | 2,551 | |
| Transportation Trust Fund Auth., Transportation System Bonds, Capital Appreciation Bonds, Series 2009-A, 0% 2039 | | | 10,855 | | | | 5,931 | |
| Transportation Trust Fund Auth., Transportation System Bonds, Capital Appreciation Bonds, Series 2009-A, BAM Insured, 0% 2038 | | | 3,985 | | | | 2,420 | |
| Transportation Trust Fund Auth., Transportation System Bonds, Capital Appreciation Bonds, Series 2009-C, BAM insured, 0% 2032 | | | 1,610 | | | | 1,191 | |
| Transportation Trust Fund Auth., Transportation System Bonds, Capital Appreciation Bonds, Series 2010-A, BAM insured, 0% 2027 | | | 8,245 | | | | 7,125 | |
| Transportation Trust Fund Auth., Transportation System Bonds, Capital Appreciation Bonds, Series 2010-B, 0% 2027 | | | 965 | | | | 815 | |
| Transportation Trust Fund Auth., Transportation System Bonds, Series 2005-B, National insured, 5.50% 2021 | | | 5,975 | | | | 6,446 | |
| 46 | American Funds Tax-Exempt Funds |
American High-Income Municipal Bond Fund
| | Principal amount | | | Value | |
| | | | (000) | | | | (000) | |
| Transportation Trust Fund Auth., Transportation System Bonds, Series 2018-A, 5.00% 2030 | | $ | 2,000 | | | $ | 2,458 | |
| Transportation Trust Fund Auth., Transportation System Bonds, Series 2018-A, 5.00% 2032 | | | 2,240 | | | | 2,737 | |
| Transportation Trust Fund Auth., Transportation System Bonds, Series 2019-A, 4.00% 2039 | | | 3,000 | | | | 3,342 | |
| Transportation Trust Fund Auth., Transportation System Bonds, Series 2019-A, 5.00% 2039 | | | 2,390 | | | | 2,910 | |
| Transportation Trust Fund Auth., Transportation System Bonds, Series 2019-AA, 5.00% 2046 | | | 2,000 | | | | 2,364 | |
| Transportation Trust Fund Auth., Transportation System Bonds, Series 2019-BB, 4.00% 2037 | | | 5,000 | | | | 5,560 | |
| Other securities | | | | | | | 103,312 | |
| | | | | | | | 367,381 | |
| |
| New York 3.26% | | | | | | | | |
| City of Glen Cove, Local Econ. Assistance Corp., Rev. Bonds (Garvies Point PublicImprovement Project), Convertible Capital Appreciation Bonds, Series 2016-C, 0% 2055 (5.62% on 1/1/2024)4 | | | 16,320 | | | | 16,228 | |
| Transportation Dev. Corp., Special Fac. Rev. Ref. Bonds (American Airlines, Inc. John F. Kennedy International Airport Project), Series 2016, AMT, 5.00% 2020 | | | 10,000 | | | | 10,169 | |
| Transportation Dev. Corp., Special Fac. Rev. Ref. Bonds (American Airlines, Inc. John F. Kennedy International Airport Project), Series 2016, AMT, 5.00% 2026 | | | 12,220 | | | | 12,831 | |
| Transportation Dev. Corp., Special Fac. Rev. Ref. Bonds (American Airlines, Inc. John F. Kennedy International Airport Project), Series 2016, AMT, 5.00% 2031 | | | 5,500 | | | | 5,757 | |
| Transportation Dev. Corp., Special Fac. Rev. Ref. Bonds (Terminal One Group Association, LP Project), Series 2015, AMT, 5.00% 2023 | | | 560 | | | | 616 | |
| Transportation Dev. Corp., Special Facs. Bonds (LaGuardia Airport Terminal B Redev. Project), Series 2016-A, AMT, 4.00% 2032 | | | 2,000 | | | | 2,192 | |
| Transportation Dev. Corp., Special Facs. Bonds (LaGuardia Airport Terminal B Redev. Project), Series 2016-A, AMT, 4.00% 2033 | | | 4,500 | | | | 4,925 | |
| Transportation Dev. Corp., Special Facs. Bonds (LaGuardia Airport Terminal B Redev. Project), Series 2016-A, AMT, 5.00% 2041 | | | 3,250 | | | | 3,711 | |
| Transportation Dev. Corp., Special Facs. Bonds (LaGuardia Airport Terminal B Redev. Project), Series 2016-A, AMT, 5.00% 2046 | | | 3,300 | | | | 3,747 | |
| Transportation Dev. Corp., Special Facs. Bonds (LaGuardia Airport Terminal B Redev. Project), Series 2016-A, AMT, 5.25% 2050 | | | 16,950 | | | | 19,368 | |
| Transportation Dev. Corp., Special Facs. Rev. Bonds (Delta Air Lines, Inc. LaGuardia Airport Terminals C & D Redev. Project), Series 2018, AMT 5.00% 2026 | | | 1,110 | | | | 1,329 | |
| Transportation Dev. Corp., Special Facs. Rev. Bonds (Delta Air Lines, Inc. LaGuardia Airport Terminals C & D Redev. Project), Series 2018, AMT 5.00% 2029 | | | 7,000 | | | | 8,682 | |
| Transportation Dev. Corp., Special Facs. Rev. Bonds (Delta Air Lines, Inc. LaGuardia Airport Terminals C & D Redev. Project), Series 2018, AMT 5.00% 2031 | | | 10,000 | | | | 12,307 | |
| Transportation Dev. Corp., Special Facs. Rev. Bonds (Delta Air Lines, Inc. LaGuardia Airport Terminals C & D Redev. Project), Series 2018, AMT, 4.00% 2036 | | | 5,000 | | | | 5,601 | |
| Transportation Dev. Corp., Special Facs. Rev. Bonds (Delta Air Lines, Inc. LaGuardia Airport Terminals C & D Redev. Project), Series 2018, AMT, 5.00% 2030 | | | 3,500 | | | | 4,319 | |
| Transportation Dev. Corp., Special Facs. Rev. Bonds (Delta Air Lines, Inc. LaGuardia Airport Terminals C & D Redev. Project), Series 2018, AMT, 5.00% 2032 | | | 9,000 | | | | 11,048 | |
| Other securities | | | | | | | 161,148 | |
| | | | | | | | 283,978 | |
| |
| Ohio 4.63% | | | | | | | | |
| Buckeye Tobacco Settlement Fncg. Auth., Tobacco Settlement Asset-Backed Bonds, Series 2007-A-2, 5.875% 2030 | | | 9,035 | | | | 9,080 | |
| Buckeye Tobacco Settlement Fncg. Auth., Tobacco Settlement Asset-Backed Bonds, Series 2007-A-2, 5.875% 2047 | | | 24,665 | | | | 24,771 | |
| Buckeye Tobacco Settlement Fncg. Auth., Tobacco Settlement Asset-Backed Bonds, Series 2007-A-2, 6.50% 2047 | | | 64,040 | | | | 65,167 | |
| Buckeye Tobacco Settlement Fncg. Auth., Tobacco Settlement Asset-Backed Bonds, Series 2007-A-3, 6.25% 20374 | | | 7,875 | | | | 8,206 | |
| Hospital Rev. Bonds (Aultman Health Foundation), Series 2018, 5.00% 20481 | | | 14,670 | | | | 16,324 | |
| County of Lucas, Hospital Rev. Bonds (Promedica Healthcare Obligated Group), Series 2018-A, 5.25% 2048 | | | 16,250 | | | | 19,229 | |
| American Funds Tax-Exempt Funds | 47 |
American High-Income Municipal Bond Fund
| Bonds, notes & other debt instruments (continued) | Principal amount
(000) | | | Value
(000) | |
| Ohio (continued) | | | | | | | | |
| Private Activity Bonds (Portsmouth Bypass Project), Series 2015, AMT, Assured Guaranty Municipal insured, 5.00% 2053 | | $ | 20,455 | | | $ | 23,037 | |
| Southeastern Ohio Port Auth., Hospital Facs. Rev. Ref. and Improvement Bonds (Memorial Health System Obligated Group Project), Series 2012, 6.00% 2042 | | | 14,450 | | | | 15,629 | |
| Other securities | | | | | | | 220,854 | |
| | | | | | | | 402,297 | |
| |
| Oklahoma 0.54% | | | | | | | | |
| Trustees of the Tulsa Municipal Airport Trust, American Airlines Inc. Rev. Ref. Bonds, Series 2001-B, AMT, 5.50% 2035 | | | 15,875 | | | | 17,538 | |
| Other securities | | | | | | | 29,125 | |
| | | | | | | | 46,663 | |
| |
| Pennsylvania 5.47% | | | | | | | | |
| Econ. Dev. Fncg. Auth., Exempt Facs. Rev. Ref. Bonds (National Gypsum Co.), Series 2014, AMT, 5.50% 2044 | | | 4,500 | | | | 4,829 | |
| Econ. Dev. Fncg. Auth., Exempt Facs. Rev. Ref. Bonds (PPL Energy Supply, LLC Project), Series 2009-B, 5.00% 2038 (put 2020) | | | 1,000 | | | | 1,015 | |
| Econ. Dev. Fncg. Auth., Exempt Facs. Rev. Ref. Bonds (PPL Energy Supply, LLC Project), Series 2009-C, 5.00% 2037 (put 2020) | | | 12,775 | | | | 12,961 | |
| Econ. Dev. Fncg. Auth., Private Activity Rev. Bonds (The Pennsylvania Rapid Bridge Replacement Project), Series 2015, AMT, 5.00% 2029 | | | 5,000 | | | | 5,924 | |
| Econ. Dev. Fncg. Auth., Private Activity Rev. Bonds (The Pennsylvania Rapid Bridge Replacement Project), Series 2015, AMT, 5.00% 2034 | | | 16,300 | | | | 19,098 | |
| Econ. Dev. Fncg. Auth., Private Activity Rev. Bonds (The Pennsylvania Rapid Bridge Replacement Project), Series 2015, AMT, 5.00% 2038 | | | 11,690 | | | | 13,580 | |
| Econ. Dev. Fncg. Auth., Private Activity Rev. Bonds (The Pennsylvania Rapid Bridge Replacement Project), Series 2015, AMT, 5.00% 2042 | | | 1,000 | | | | 1,151 | |
| Econ. Dev. Fncg. Auth., Solid Waste Disposal Rev. Bonds (CarbonLite P, LLC Project), Series 2019, AMT, 5.25% 20261 | | | 2,500 | | | | 2,609 | |
| Econ. Dev. Fncg. Auth., Solid Waste Disposal Rev. Bonds (CarbonLite P, LLC Project), Series 2019, AMT, 5.75% 20361 | | | 6,790 | | | | 7,339 | |
| Econ. Dev. Fncg. Auth., Solid Waste Disposal Rev. Bonds (Republic Services, Inc. Project), Series 2019-B-1, AMT, 1.95% 2049 (put 2020) | | | 2,750 | | | | 2,751 | |
| Econ. Dev. Fncg. Auth., Solid Waste Disposal Rev. Bonds (Waste Management, Inc. Project), Series 2011, AMT, 2.15% 2041 (put 2024) | | | 3,000 | | | | 3,101 | |
| Econ. Dev. Fncg. Auth., Solid Waste Disposal Rev. Green Bonds (Covanta Project), Series 2019, AMT, 3.25% 20391 | | | 5,750 | | | | 5,803 | |
| Econ. Dev. Fncg. Auth., Solid Waste Disposal Rev. Ref. Bonds (Republic Services, Inc. Project), Series 2019-A, AMT, 1.50% 2034 (put 2020) | | | 1,000 | | | | 1,000 | |
| County of Montgomery, Industrial Dev. Auth., Health Systems Rev. Bonds (Albert Einstein Healthcare Network Issue), Series 2015-A, 5.25% 2045 | | | 14,600 | | | | 16,477 | |
| Other securities | | | | | | | 378,473 | |
| | | | | | | | 476,111 | |
| |
| Puerto Rico 5.43% | | | | | | | | |
| Aqueduct and Sewer Auth., Rev. Bonds, Series 2012-A, 5.00% 2033 | | | 18,200 | | | | 19,451 | |
| Aqueduct and Sewer Auth., Rev. Bonds, Series 2012-A, 5.25% 2042 | | | 26,650 | | | | 28,615 | |
| Industrial, Tourist, Educational, Medical and Environmental Control Facs. Fncg. Auth., Hospital Rev. and Rev. Ref. Bonds (Hospital Auxilio Mutuo Obligated Group Project), Series 2011-A, 6.00% 2033 | | | 15,180 | | | | 15,834 | |
| Sales Tax Fncg. Corp., Sales Tax Rev. Bonds, Series 2018-A-1, 4.75% 2053 | | | 2,029 | | | | 2,250 | |
| Sales Tax Fncg. Corp., Sales Tax Rev. Restructured Bonds, Capital Appreciation Bonds, Series 2018-A-1, 0% 2024 | | | 301 | | | | 274 | |
| Sales Tax Fncg. Corp., Sales Tax Rev. Restructured Bonds, Capital Appreciation Bonds, Series 2018-A-1, 0% 2027 | | | 511 | | | | 431 | |
| Sales Tax Fncg. Corp., Sales Tax Rev. Restructured Bonds, Capital Appreciation Bonds, Series 2018-A-1, 0% 2029 | | | 498 | | | | 396 | |
| Sales Tax Fncg. Corp., Sales Tax Rev. Restructured Bonds, Capital Appreciation Bonds, Series 2018-A-1, 0% 2031 | | | 641 | | | | 474 | |
| Sales Tax Fncg. Corp., Sales Tax Rev. Restructured Bonds, Capital Appreciation Bonds, Series 2018-A-1, 0% 2033 | | | 723 | | | | 498 | |
| Sales Tax Fncg. Corp., Sales Tax Rev. Restructured Bonds, Capital Appreciation Bonds, Series 2018-A-1, 0% 2046 | | | 57,674 | | | | 16,923 | |
| 48 | American Funds Tax-Exempt Funds |
American High-Income Municipal Bond Fund
| | Principal amount
(000) | | | Value
(000) | |
| Sales Tax Fncg. Corp., Sales Tax Rev. Restructured Bonds, Capital Appreciation Bonds, Series 2018-A-1, 0% 2051 | | $ | 11,964 | | | $ | 2,544 | |
| Sales Tax Fncg. Corp., Sales Tax Rev. Restructured Bonds, Series 2018-A-1, 5.00% 2058 | | | 74,779 | | | | 84,268 | |
| Sales Tax Fncg. Corp., Sales Tax Rev. Restructured Bonds, Series 2019-A-2, 4.329% 2040 | | | 26,481 | | | | 28,816 | |
| Sales Tax Fncg. Corp., Sales Tax Rev. Restructured Bonds, Series 2019-A-2, 4.536% 2053 | | | 22 | | | | 24 | |
| Sales Tax Fncg. Corp., Sales Tax Rev. Restructured Bonds, Series 2019-A-2, 4.784% 2058 | | | 23,536 | | | | 26,112 | |
| Other securities | | | | | | | 245,428 | |
| | | | | | | | 472,338 | |
| | | | | | | | | |
| Rhode Island 0.86% | | | | | | | | |
| Tobacco Settlement Fin. Corp., Tobacco Settlement Asset-Backed Bonds, Capital Appreciation Bonds, Series 2007-A, 0% 2052 | | | 119,630 | | | | 17,269 | |
| Other securities | | | | | | | 57,924 | |
| | | | | | | | 75,193 | |
| | | | | | | | | |
| South Carolina 1.86% | | | | | | | | |
| Jobs-Econ. Dev. Auth., Econ. Dev. Rev. Bonds (Custodial Receipts), Series 2018, 5.00% 20411,4 | | | 12,495 | | | | 15,540 | |
| Public Service Auth., Rev. Obligations (Santee Cooper), Series 2011-C, 5.00% 2036 | | | 3,450 | | | | 3,671 | |
| Public Service Auth., Rev. Obligations (Santee Cooper), Series 2012-D, 5.00% 2043 | | | 6,420 | | | | 6,872 | |
| Public Service Auth., Rev. Obligations (Santee Cooper), Series 2013-E, 5.00% 2048 | | | 2,055 | | | | 2,282 | |
| Public Service Auth., Rev. Obligations (Santee Cooper), Series 2014-A, 5.00% 2049 | | | 1,000 | | | | 1,119 | |
| Public Service Auth., Rev. Obligations (Santee Cooper), Series 2014-A, 5.50% 2054 | | | 2,430 | | | | 2,768 | |
| Public Service Auth., Rev. Obligations (Santee Cooper), Series 2014-C, 5.00% 2046 | | | 100 | | | | 113 | |
| Public Service Auth., Rev. Obligations (Santee Cooper), Series 2015-A, 5.00% 2055 | | | 3,525 | | | | 4,010 | |
| Public Service Auth., Rev. Obligations (Santee Cooper), Series 2015-E, 5.25% 2055 | | | 10,280 | | | | 11,958 | |
| Public Service Auth., Rev. Obligations (Santee Cooper), Series 2016-A, 5.00% 2032 | | | 965 | | | | 1,159 | |
| Public Service Auth., Rev. Obligations (Santee Cooper), Series 2016-B, 5.00% 2035 | | | 250 | | | | 302 | |
| Public Service Auth., Rev. Obligations (Santee Cooper), Series 2016-B, 5.00% 2041 | | | 3,350 | | | | 3,989 | |
| Public Service Auth., Rev. Ref. Obligations (Santee Cooper), Series 2013-B, 5.125% 2043 | | | 2,215 | | | | 2,478 | |
| Public Service Auth., Rev. Ref. Obligations (Santee Cooper), Series 2014-B, 5.00% 2038 | | | 3,000 | | | | 3,395 | |
| Public Service Auth., Rev. Ref. Obligations (Santee Cooper), Series 2014-C, 5.00% 2039 | | | 100 | | | | 114 | |
| Public Service Auth., Rev. Ref. Obligations (Santee Cooper), Series 2015-A, 5.00% 2034 | | | 6,275 | | | | 7,501 | |
| Public Service Auth., Rev. Ref. Obligations (Santee Cooper), Series 2016-B,2.75% 2051 (3.00% on 12/1/2022)4 | | | 13,945 | | | | 13,910 | |
| Public Service Auth., Rev. Ref. Obligations (Santee Cooper), Series 2016-C, 5.00% 2031 | | | 2,010 | | | | 2,451 | |
| Other securities | | | | | | | 77,809 | |
| | | | | | | | 161,441 | |
| | | | | | | | | |
| Texas 5.40% | | | | | | | | |
| County of Harris, Cultural Education Facs. Fin. Corp., First Mortgage Rev. Bonds (Brazos Presbyterian Homes, Inc. Project), Series 2016, 5.00% 2048 | | | 22,705 | | | | 24,892 | |
| City of Houston, Airport System Special Facs. Rev. Bonds (United Airlines, Inc. Terminal Improvement Projects), Series 2018-C, AMT, 5.00% 2028 | | | 15,000 | | | | 18,416 | |
| Other securities | | | | | | | 426,416 | |
| | | | | | | | 469,724 | |
| | | | | | | | | |
| Utah 0.41% | | | | | | | | |
| Hideout Local Dist. No. 1, Special Assessment Bonds, Series 2017, 6.75% 20371 | | | 26,595 | | | | 27,940 | |
| Other securities | | | | | | | 7,996 | |
| | | | | | | | 35,936 | |
| | | | | | | | | |
| Virginia 2.20% | | | | | | | | |
| Town of Farmville, Industrial Dev. Auth., Educational Facs. Rev. Ref. Bonds (Longwood University Student Housing Project), Series 2018-A, 5.00% 2055 | | | 18,305 | | | | 21,095 | |
| City of Newport News, Industrial Dev. Auth., Health Systems Rev. Ref. Bonds (Custodial Receipts), Series 2015, 5.33% 20451 | | | 27,900 | | | | 30,823 | |
| Other securities | | | | | | | 139,829 | |
| | | | | | | | 191,747 | |
| American Funds Tax-Exempt Funds | 49 |
American High-Income Municipal Bond Fund
| Bonds, notes & other debt instruments (continued) | Principal amount
(000) | | | Value
(000) | |
| Wisconsin 2.43% | | | | | | | | |
| Public Fin. Auth., Airport Facs. Rev. Ref. Bonds (Transportation Infrastructure Properties, LLC Obligated Group), Series 2012-B, AMT, 5.00% 2022 | | $ | 45 | | | $ | 47 | |
| Public Fin. Auth., Airport Facs. Rev. Ref. Bonds (Transportation Infrastructure Properties, LLC Obligated Group), Series 2012-B, AMT, 5.00% 2042 | | | 450 | | | | 480 | |
| Public Fin. Auth., Charter School Rev. Bonds (American Preparatory Academy - Las Vegas 2 Project), Series 2019-A, 4.00% 20291 | | | 645 | | | | 691 | |
| Public Fin. Auth., Charter School Rev. Bonds (American Preparatory Academy - Las Vegas 2 Project), Series 2019-A, 5.00% 20391 | | | 1,380 | | | | 1,532 | |
| Public Fin. Auth., Charter School Rev. Bonds (American Preparatory Academy - Las Vegas 2 Project), Series 2019-A, 5.00% 20491 | | | 3,360 | | | | 3,683 | |
| Public Fin. Auth., Charter School Rev. Bonds (American Preparatory Academy - Las Vegas 2 Project), Series 2019-A, 5.00% 20541 | | | 1,605 | | | | 1,748 | |
| Public Fin. Auth., Charter School Rev. Bonds (American Preparatory Academy - Las Vegas Project), Series 2017-A, 5.375% 20471 | | | 5,125 | | | | 5,750 | |
| Public Fin. Auth., Charter School Rev. Bonds (American Preparatory Academy - Las Vegas Project), Series 2017-B, 5.375% 20521 | | | 2,000 | | | | 2,230 | |
| Public Fin. Auth., Charter School Rev. Bonds (Coral Academy of Science Reno), Series 2019-A, 5.00% 20391 | | | 710 | | | | 780 | |
| Public Fin. Auth., Charter School Rev. Bonds (Coral Academy of Science Reno), Series 2019-A, 5.00% 20501 | | | 1,950 | | | | 2,118 | |
| Public Fin. Auth., Education Rev. Bonds (North Carolina Leadership Academy), Series 2019-A, 5.00% 20391 | | | 820 | | | | 890 | |
| Public Fin. Auth., Education Rev. Bonds (North Carolina Leadership Academy), Series 2019-A, 5.00% 20491 | | | 520 | | | | 559 | |
| Public Fin. Auth., Education Rev. Bonds (North Carolina Leadership Academy), Series 2019-A, 5.00% 20541 | | | 1,365 | | | | 1,459 | |
| Public Fin. Auth., Exempt Facs. Rev. Ref. Bonds (Celanese Project), Series 2016-A, AMT, 5.00% 20241 | | | 1,605 | | | | 1,781 | |
| Public Fin. Auth., Exempt Facs. Rev. Ref. Bonds (Celanese Project), Series 2016-A, AMT, 5.00% 20251 | | | 1,000 | | | | 1,155 | |
| Public Fin. Auth., Exempt Facs. Rev. Ref. Bonds (National Gypsum Co.), Series 2014, AMT, 5.25% 2030 | | | 3,000 | | | | 3,323 | |
| Public Fin. Auth., Exempt Facs. Rev. Ref. Bonds (National Gypsum Co.), Series 2016, AMT, 4.00% 2035 | | | 9,200 | | | | 9,661 | |
| Public Fin. Auth., Limited Obligation Grant Rev. Bonds (American Dream at Meadowlands Project), Series 2017-A, 6.25% 20271 | | | 2,000 | | | | 2,316 | |
| Public Fin. Auth., Limited Obligation Grant Rev. Bonds (American Dream at Meadowlands Project), Series 2017-A, 6.75% 20311 | | | 2,750 | | | | 3,371 | |
| Public Fin. Auth., Limited Obligation PILOT Rev. Bonds (American Dream at Meadowlands Project), Series 2017, 7.00% 20501 | | | 4,000 | | | | 4,832 | |
| Public Fin. Auth., Retirement Community Rev. Bonds (Evergreens Obligated Group), Series 2019-A, 5.00% 2044 | | | 1,750 | | | | 2,026 | |
| Public Fin. Auth., Retirement Community Rev. Bonds (Evergreens Obligated Group), Series 2019-A, 5.00% 2049 | | | 1,500 | | | | 1,732 | |
| Public Fin. Auth., Retirement Fac. Rev. Bonds (Penick Village), Series 2019, 4.00% 20291 | | | 600 | | | | 637 | |
| Public Fin. Auth., Retirement Fac. Rev. Bonds (Penick Village), Series 2019, 5.00% 20391 | | | 775 | | | | 856 | |
| Public Fin. Auth., Retirement Fac. Rev. Bonds (Penick Village), Series 2019, 5.00% 20491 | | | 1,300 | | | | 1,425 | |
| Public Fin. Auth., Retirement Fac. Rev. Bonds (Penick Village), Series 2019, 5.00% 20541 | | | 1,360 | | | | 1,481 | |
| Public Fin. Auth., Retirement Facs. Rev. Bonds (Friends Homes), Series 2019, 4.00% 20291 | | | 1,250 | | | | 1,364 | |
| Public Fin. Auth., Retirement Facs. Rev. Bonds (Friends Homes), Series 2019, 5.00% 20391 | | | 2,230 | | | | 2,498 | |
| Public Fin. Auth., Retirement Facs. Rev. Bonds (Friends Homes), Series 2019, 5.00% 20491 | | | 6,000 | | | | 6,664 | |
| Public Fin. Auth., Retirement Facs. Rev. Bonds (Friends Homes), Series 2019, 5.00% 20541 | | | 1,920 | | | | 2,121 | |
| Public Fin. Auth., Rev. Bonds (Retirement Housing Foundation Obligated Group), Series 2017-B, 5.00% 2027 | | | 2,345 | | | | 2,824 | |
| Public Fin. Auth., Rev. Bonds (Roseman University of Health Sciences Project), Series 2012, 5.50% 2032 | | | 500 | | | | 531 | |
| Public Fin. Auth., Rev. Bonds (Roseman University of Health Sciences Project), Series 2012, 5.75% 2042 | | | 5,000 | | | | 5,298 | |
| Public Fin. Auth., Rev. Bonds (Roseman University of Health Sciences Project), Series 2015, 5.75% 2035 | | | 3,000 | | | | 3,425 | |
| Public Fin. Auth., Rev. Bonds (Roseman University of Health Sciences Project), Series 2015, 5.875% 2045 | | | 6,250 | | | | 7,077 | |
| Public Fin. Auth., Rev. Bonds (Wilson Preparatory Academy), Series 2019-A, 4.125% 20291 | | | 545 | | | | 575 | |
| Public Fin. Auth., Rev. Bonds (Wilson Preparatory Academy), Series 2019-A, 5.00% 20391 | | | 500 | | | | 531 | |
| 50 | American Funds Tax-Exempt Funds |
American High-Income Municipal Bond Fund
| | Principal amount
(000) | | | Value
(000) | |
| Public Fin. Auth., Rev. Bonds (Wilson Preparatory Academy), Series 2019-A, 5.00% 20491 | | $ | 1,100 | | | $ | 1,160 | |
| Public Fin. Auth., Senior Living Rev. Bonds (Mary’s Woods at Marylhurst Project), Series 2017-A, 5.00% 20301 | | | 300 | | | | 342 | |
| Public Fin. Auth., Senior Living Rev. Bonds (Mary’s Woods at Marylhurst Project), Series 2017-A, 5.00% 20321 | | | 1,280 | | | | 1,448 | |
| Public Fin. Auth., Senior Living Rev. Bonds (Mary’s Woods at Marylhurst Project), Series 2017-A, 5.25% 20371 | | | 650 | | | | 736 | |
| Public Fin. Auth., Senior Living Rev. Bonds (Mary’s Woods at Marylhurst Project), Series 2017-A, 5.25% 20421 | | | 250 | | | | 281 | |
| Public Fin. Auth., Senior Living Rev. Bonds (Mary’s Woods at Marylhurst Project), Series 2017-A, 5.25% 20471 | | | 900 | | | | 1,007 | |
| Public Fin. Auth., Senior Living Rev. Bonds (Mary’s Woods at Marylhurst Project), Series 2017-A, 5.25% 20521 | | | 2,300 | | | | 2,567 | |
| Public Fin. Auth., Senior Living Rev. Bonds (Rose Villa Project), Series 2014-A, 5.50% 20341 | | | 1,000 | | | | 1,100 | |
| Public Fin. Auth., Senior Living Rev. Bonds (Rose Villa Project), Series 2014-A, 5.75% 20441 | | | 1,800 | | | | 1,973 | |
| Public Fin. Auth., Senior Living Rev. Ref. Bonds (Fellowship Senior Living Project), Series 2019-A, 4.00% 2046 | | | 1,000 | | | | 1,064 | |
| Public Fin. Auth., Senior Living Rev. Ref. Bonds (Fellowship Senior Living Project), Series 2019-A, 4.00% 2052 | | | 2,000 | | | | 2,112 | |
| Public Fin. Auth., Solid Waste Disposal Rev. Ref. Bonds (Waste Management, Inc. Project), Series 2016-A-4, AMT, 2.00% 2033 (put 2021) | | | 1,500 | | | | 1,514 | |
| Public Fin. Auth., Student Housing Rev. Bonds (Beyond Boone, LLC - Appalachian State University Project), Series 2019-A, Assured Guaranty Municipal insured, 5.00% 2054 | | | 1,700 | | | | 2,007 | |
| Public Fin. Auth., Student Housing Rev. Bonds (CHF-Cullowhee, LLC - Western Carolina University Project), Series 2015, 5.00% 2035 | | | 1,000 | | | | 1,116 | |
| Public Fin. Auth., Student Housing Rev. Bonds (CHF-Cullowhee, LLC - Western Carolina University Project), Series 2015, 5.25% 2047 | | | 2,000 | | | | 2,217 | |
| Public Fin. Auth., Student Housing Rev. Bonds (CHF-Cullowhee, LLC - Western Carolina University Project), Series 2015-A, 5.00% 2030 | | | 2,140 | | | | 2,410 | |
| Public Fin. Auth., Student Housing Rev. Bonds (CHF-Wilmington, LLC - University of North Carolina Project), Series 2018, Assured Guaranty Municipal insured, 5.00% 2053 | | | 9,130 | | | | 10,768 | |
| Public Fin. Auth., Student Housing Rev. Bonds (NC A&T Real Estate Foundation, LLC Project), Series 2019-A, 5.00% 2034 | | | 4,135 | | | | 4,959 | |
| Public Fin. Auth., Student Housing Rev. Bonds (NC A&T Real Estate Foundation, LLC Project), Series 2019-A, 5.00% 2039 | | | 2,045 | | | | 2,420 | |
| Public Fin. Auth., Student Housing Rev. Bonds (NC A&T Real Estate Foundation, LLC Project), Series 2019-A, 5.00% 2044 | | | 1,350 | | | | 1,579 | |
| Public Fin. Auth., Student Housing Rev. Bonds (NC A&T Real Estate Foundation, LLC Project), Series 2019-A, 5.00% 2049 | | | 3,625 | | | | 4,216 | |
| Public Fin. Auth., Student Housing Rev. Bonds (NC A&T Real Estate Foundation, LLC Project), Series 2019-B, 5.00% 2034 | | | 1,295 | | | | 1,554 | |
| Public Fin. Auth., Student Housing Rev. Bonds (NC A&T Real Estate Foundation, LLC Project), Series 2019-B, 5.00% 2039 | | | 1,595 | | | | 1,887 | |
| Public Fin. Auth., Student Housing Rev. Bonds (NC A&T Real Estate Foundation, LLC Project), Series 2019-B, 5.00% 2049 | | | 1,340 | | | | 1,559 | |
| Other securities | | | | | | | 70,249 | |
| | | | | | | | 211,716 | |
| American Funds Tax-Exempt Funds | 51 |
American High-Income Municipal Bond Fund
| Bonds, notes & other debt instruments (continued) | Principal amount
(000) | | | Value
(000) | |
| Other states & U.S. territories 19.38% | | | | | | |
| Other securities | | | | | $ | 1,684,238 | |
| | | | | | | | |
| Total bonds, notes & other debt instruments(cost: $7,586,110,000) | | | | | | | 8,142,081 | |
| | | | | | | | | |
| Short-term securities 6.49% | | | | | | | | |
| State of Louisiana, Parish of East Baton Rouge, Industrial Dev. Board, Gulf Opportunity Zone Rev. Bonds (ExxonMobil Project), Series 2010-B, 1.19% 20402 | | $ | 23,700 | | | | 23,700 | |
| State of Louisiana, Parish of East Baton Rouge, Industrial Dev. Board, Gulf Opportunity Zone Rev. Bonds (ExxonMobil Project), Series 2011, 1.19% 20512 | | | 4,000 | | | | 4,000 | |
| State of Louisiana, Parish of East Baton Rouge, Pollution Control Rev. Ref. Bonds (ExxonMobil Project), Series 2010-A, 1.19% 20352 | | | 41,500 | | | | 41,500 | |
| State of Michigan, Strategic Fund, Demand Limited Obligation Rev. Bonds, (Air Products and Chemicals, Inc. Project), Series 2007, 1.20% 20422 | | | 33,500 | | | | 33,500 | |
| State of Mississippi, Business Fin. Corp., Gulf Opportunity Zone Industrial Dev. Rev. Bonds (Chevron U.S.A. Inc. Project), Series 2007-A, 1.19% 20302 | | | 20,500 | | | | 20,500 | |
| State of Mississippi, Business Fin. Corp., Gulf Opportunity Zone Industrial Dev. Rev. Bonds (Chevron U.S.A. Inc. Project), Series 2007-D, 1.19% 20302 | | | 25,900 | | | | 25,900 | |
| State of Mississippi, Business Fin. Corp., Gulf Opportunity Zone Industrial Dev. Rev. Bonds (Chevron U.S.A. Inc. Project), Series 2009-D, 1.19% 20302 | | | 10,700 | | | | 10,700 | |
| State of Mississippi, Business Fin. Corp., Gulf Opportunity Zone Industrial Dev. Rev. Bonds (Chevron U.S.A. Inc. Project), Series 2010-J, 1.19% 20352 | | | 18,000 | | | | 18,000 | |
| State of Mississippi, Business Fin. Corp., Gulf Opportunity Zone Industrial Dev. Rev. Bonds (Chevron U.S.A. Inc. Project), Series 2011-F, 1.19% 20352 | | | 6,900 | | | | 6,900 | |
| State of New York, New York City G.O. Bonds, Fiscal 2008, Series 2008-C-4, Assured Guaranty Municipal insured, 1.00% 20272 | | | 10,700 | | | | 10,700 | |
| State of New York, New York City G.O. Bonds, Fiscal 2008, Series 2008-L-5, 1.18% 20352 | | | 12,805 | | | | 12,805 | |
| State of New York, New York City G.O. Bonds, Fiscal 2013, Series 2013-F-3, 1.18% 20422 | | | 15,595 | | | | 15,595 | |
| State of New York, New York City Municipal Water Fin. Auth., Water and Sewer System Second General Resolution Rev. Bonds, Fiscal 2007, Series 2006-CC-1, 0.94% 20382 | | | 3,940 | | | | 3,940 | |
| State of New York, New York City Municipal Water Fin. Auth., Water and Sewer System Second General Resolution Rev. Bonds, Fiscal 2016, Series 2016-AA-1, 1.18% 20482 | | | 14,845 | | | | 14,845 | |
| State of New York, New York City Transitional Fin. Auth., Future Tax Secured Bonds, Fiscal 2019, Series 2019-A-4, 1.18% 20452 | | | 8,080 | | | | 8,080 | |
| State of New York, New York City Transitional Fin. Auth., Future Tax Secured Rev. Ref. Bonds, Fiscal 2015, Series 2015-E-4, 1.18% 20452 | | | 4,500 | | | | 4,500 | |
| State of New York, New York City Transitional Fin. Auth., Recovery Bonds, Fiscal 2003, Series 2002-1-C, 1.18% 20222 | | | 7,195 | | | | 7,195 | |
| State of New York, New York City Transitional Fin. Auth., Recovery Bonds, Fiscal 2003, Series 2002-1-C, 1.18% 20312 | | | 15,670 | | | | 15,670 | |
| State of Pennsylvania, Econ. Dev. Fncg. Auth., Solid Waste Disposal Rev. Bonds, (Republic Services, Inc. Project), Series 2014, AMT, 1.35% 2044 (put 2020)5 | | | 9,300 | | | | 9,304 | |
| State of Pennsylvania, Econ. Dev. Fncg. Auth., Solid Waste Disposal Rev. Bonds, (Waste Management, Inc. Project), Series 2013, AMT, 1.45% 2045 (put 2020)5 | | | 20,000 | | | | 20,000 | |
| State of South Carolina, Public Service Auth., IAM Commercial Paper (Santee Cooper), Series 2020-D, 1.21% 3/5/2020 | | | 10,103 | | | | 10,103 | |
| State of South Carolina, Public Service Auth., Rev. Obligations (Santee Cooper), Series 2019-A, 0.98% 20362 | | | 10,000 | | | | 10,000 | |
| State of Texas, County of Jefferson, Port Arthur Navigation Dist., Pollution Control Rev. Ref. Bonds (Texaco Inc. Project), Series 1994, 1.19% 20242 | | | 17,400 | | | | 17,400 | |
| State of Texas, Port Arthur Navigation Dist. Industrial Dev. Corp., Rev. Bonds, (Air Products Project), Series 2005, 1.20% 20402 | | | 2,700 | | | | 2,700 | |
| State of Texas, Tax and Rev. Anticipation Notes, Series 2019, 4.00% 8/27/2020 | | | 17,420 | | | | 17,716 | |
| State of Wisconsin, Public Fin. Auth., Solid Waste Disposal Rev. Ref. Bonds (Waste Management, Inc. Project), Series 2017-A-1, AMT, 1.45% 2023 (put 2020)5 | | | 5,000 | | | | 5,000 | |
| Other securities | | | | | | | 193,782 | |
| | | | | | | | | |
| Total short-term securities (cost: $563,958,000) | | | | | | | 564,035 | |
| Total investment securities 100.10% (cost: $8,150,068,000) | | | | | | | 8,706,116 | |
| Other assets less liabilities (0.10)% | | | | | | | (8,626 | ) |
| | | | | | | | | |
| Net assets 100.00% | | | | | | $ | 8,697,490 | |
| 52 | American Funds Tax-Exempt Funds |
American High-Income Municipal Bond Fund
This summary investment portfolio is designed to streamline the report and help investors better focus on the fund’s principal holdings. See the inside back cover for details on how to obtain a complete schedule of portfolio holdings.
“Other securities” includes all issues that are not disclosed separately in the summary investment portfolio. “Other securities” includes securities that were valued under fair value procedures adopted by authority of the board of trustees. The total value of securities that were valued under fair value procedures was $7,205,000, which represented .08% of the net assets of the fund. Some securities in “Other securities” (with an aggregate value of $1,832,000, an aggregate cost of $1,832,000, and which represented .02% of the net assets of the fund) were acquired from 9/26/2019 to 1/8/2020 through private placement transactions exempt from registration under the Securities Act of 1933, which may subject them to legal or contractual restrictions on resale.
Futures contracts
| | | | | | | | | | | | | | | Unrealized | |
| | | | | | | | | | | | | | | appreciation | |
| | | | | | | | | Notional | | | Value at | | | (depreciation) | |
| | | | | Number of | | | | amount | 6 | | 1/31/2020 | 7 | | at 1/31/2020 | |
| Contracts | | Type | | contracts | | Expiration | | (000) | | | (000) | | | (000) | |
| 2 Year U.S. Treasury Note Futures | | Long | | 1,917 | | April 2020 | | $ | 383,400 | | | $ | 414,761 | | | | $ | 1,346 | |
| 5 Year U.S. Treasury Note Futures | | Long | | 1,578 | | April 2020 | | | 157,800 | | | | 189,865 | | | | | 1,240 | |
| 10 Year U.S. Treasury Note Futures | | Short | | 1,628 | | March 2020 | | | (162,800 | ) | | | (214,336 | ) | | | | (3,100 | ) |
| 30 Year Ultra U.S. Treasury Bond Futures | | Short | | 165 | | March 2020 | | | (16,500 | ) | | | (31,959 | ) | | | | (1,067 | ) |
| | | | | | | | | | | | | | | | | | $ | (1,581 | ) |
| 1 | Acquired in a transaction exempt from registration under Rule 144A of the Securities Act of 1933. May be resold in the U.S. in transactions exempt from registration, normally to qualified institutional buyers. The total value of all such securities, including those in “Other securities,” was $1,150,491,000, which represented 13.23% of the net assets of the fund. |
| 2 | Coupon rate may change periodically. Reference rate and spread are as of the most recent information available. Some coupon rates are determined by the issuer or agent based on current market conditions; therefore, the reference rate and spread are not available. For short-term securities, the date of the next scheduled coupon rate change is considered to be the maturity date. |
| 3 | Scheduled interest and/or principal payment was not received. |
| 4 | Step bond; coupon rate may change at a later date. |
| 5 | For short-term securities, the mandatory put date is considered to be the maturity date. |
| 6 | Notional amount is calculated based on the number of contracts and notional contract size. |
| 7 | Value is calculated based on the notional amount and current market price. |
Key to abbreviations and symbol
Agcy. = Agency
AMT = Alternative Minimum Tax
Auth. = Authority
Certs. of Part. = Certificates of Participation
Dept. = Department
Dev. = Development
Dist. = District
Econ. = Economic
Fac. = Facility
Facs. = Facilities
Fin. = Finance
Fncg. = Financing
G.O. = General Obligation
IAM = Interest at Maturity
LIBOR = London Interbank Offered Rate
LOC = Letter of Credit
Preref. = Prerefunded
Redev. = Redevelopment
Ref. = Refunding
Rev. = Revenue
SIFMA = Securities Industry and Financial Markets Association
USD/$ = U.S. dollars
See notes to financial statements.
| American Funds Tax-Exempt Funds | 53 |
| The Tax-Exempt Fund of California | unaudited |
| Summary investment portfolioJanuary 31, 2020 | |
| | |
| Portfolio quality summary* | Percent of net assets |
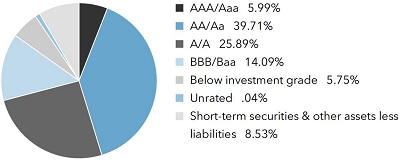
| * | Bond ratings, which typically range from AAA/Aaa (highest) to D (lowest), are assigned by credit rating agencies such as Standard & Poor’s, Moody’s and/or Fitch as an indication of an issuer’s creditworthiness. In assigning a credit rating to a security, the fund looks specifically to the ratings assigned to the issuer of the security by Standard & Poor’s, Moody’s and/or Fitch. If agency ratings differ, the security will be considered to have received the highest of those ratings, consistent with the fund’s investment policies. Securities in the “unrated” category (above) have not been rated by a rating agency; however, the investment adviser performs its own credit analysis and assigns comparable ratings that are used for compliance with the fund’s investment policies. |
| | |
| Bonds, notes & other debt instruments 91.47% | | Principal amount
(000) | | | Value
(000) | |
| California 89.53% | | | | | | | | |
| State issuers 33.72% | | | | | | | | |
| Educational Facs. Auth., Rev. Bonds (Art Center College of Design), Series 2018-A, 5.00% 2032 | | $ | 950 | | | $ | 1,203 | |
| Educational Facs. Auth., Rev. Bonds (Art Center College of Design), Series 2018-A, 5.00% 2033 | | | 1,515 | | | | 1,914 | |
| Educational Facs. Auth., Rev. Bonds (Art Center College of Design), Series 2018-A, 5.00% 2034 | | | 760 | | | | 959 | |
| Educational Facs. Auth., Rev. Bonds (Art Center College of Design), Series 2018-A, 5.00% 2035 | | | 1,300 | | | | 1,634 | |
| Educational Facs. Auth., Rev. Bonds (Art Center College of Design), Series 2018-A, 5.00% 2036 | | | 1,000 | | | | 1,253 | |
| Educational Facs. Auth., Rev. Bonds (Art Center College of Design), Series 2018-A, 5.00% 2037 | | | 1,265 | | | | 1,581 | |
| Educational Facs. Auth., Rev. Bonds (Art Center College of Design), Series 2018-A, 5.00% 2038 | | | 1,140 | | | | 1,421 | |
| Educational Facs. Auth., Rev. Bonds (Art Center College of Design), Series 2018-A, 5.00% 2044 | | | 4,000 | | | | 4,912 | |
| Educational Facs. Auth., Rev. Bonds (Chapman University), Series 2017-B, 4.00% 2047 | | | 10,575 | | | | 11,652 | |
| Educational Facs. Auth., Rev. Bonds (Pitzer College), Series 2009, 5.00% 2021 (preref. 2020) | | | 1,625 | | | | 1,636 | |
| Educational Facs. Auth., Rev. Bonds (Pitzer College), Series 2009, 6.00% 2040 (preref. 2020) | | | 1,400 | | | | 1,412 | |
| Educational Facs. Auth., Rev. Bonds (Stanford University), Series 2019-V-1, 5.00% 2049 | | | 2,545 | | | | 4,097 | |
| Educational Facs. Auth., Rev. Bonds (University of San Francisco), Series 2018-A, 5.00% 2053 | | | 3,985 | | | | 4,888 | |
| Educational Facs. Auth., Rev. Ref. Bonds (Chapman University), Series 2011, 5.00% 2026 | | | 3,000 | | | | 3,145 | |
| Educational Facs. Auth., Rev. Ref. Bonds (Chapman University), Series 2011, 5.00% 2031 | | | 11,795 | | | | 12,351 | |
| Educational Facs. Auth., Rev. Ref. Bonds (Chapman University), Series 2015, 5.00% 2032 | | | 2,500 | | | | 2,982 | |
| Educational Facs. Auth., Rev. Ref. Bonds (Loyola Marymount University), Capital Appreciation Bonds, Series 2001-A, National insured, 0% 2033 | | | 2,000 | | | | 1,479 | |
| Educational Facs. Auth., Rev. Ref. Bonds (Occidental College), Series 2013-A, 5.00% 2029 (preref. 2023) | | | 3,265 | | | | 3,766 | |
| Educational Facs. Auth., Rev. Ref. Bonds (University of the Pacific), Series 2015, 5.00% 2030 | | | 1,000 | | | | 1,218 | |
| Educational Facs. Auth., Rev. Ref. Bonds (University of the Pacific), Series 2015, 5.00% 2032 | | | 2,500 | | | | 3,030 | |
| G.O. Bonds, Series 2011, 5.25% 2028 | | | 2,000 | | | | 2,136 | |
| G.O. Bonds, Series 2013-B, (SIFMA Municipal Swap Index + 0.38%) 1.32% 2027 (put 2022)1 | | | 2,000 | | | | 2,006 | |
| G.O. Bonds, Series 2013-E, (1-month USD-LIBOR + 0.43%) 1.37% 2029 (put 2023)1 | | | 1,500 | | | | 1,507 | |
| G.O. Bonds, Series 2015, 5.25% 2032 | | | 5,000 | | | | 6,137 | |
| G.O. Rev. Ref. Bonds, Series 2007, Assured Guaranty Municipal insured, 5.25% 2032 | | | 10,000 | | | | 14,249 | |
| Golden State Tobacco Securitization Corp., Enhanced Tobacco Settlement Asset-Backed Bonds, Capital Appreciation Bonds, Series 2005-A, AMBAC insured, 0% 2027 | | | 3,460 | | | | 3,115 | |
| Golden State Tobacco Securitization Corp., Enhanced Tobacco Settlement Asset-Backed Bonds, Capital Appreciation Bonds, Series 2005-A, Assured Guaranty Municipal insured, 0% 2026 | | | 12,600 | | | | 11,644 | |
| | |
| 54 | American Funds Tax-Exempt Funds |
The Tax-Exempt Fund of California
| | | Principal amount
(000) | | | Value
(000) | |
| Golden State Tobacco Securitization Corp., Enhanced Tobacco Settlement Asset-Backed Bonds, Series 2015-A, 5.00% 2032 | | $ | 3,250 | | | $ | 3,873 | |
| Golden State Tobacco Securitization Corp., Enhanced Tobacco Settlement Asset-Backed Bonds, Series 2015-A, 5.00% 2033 | | | 1,950 | | | | 2,320 | |
| Golden State Tobacco Securitization Corp., Enhanced Tobacco Settlement Asset-Backed Bonds, Series 2015-A, 5.00% 2045 | | | 3,580 | | | | 4,175 | |
| Golden State Tobacco Securitization Corp., Enhanced Tobacco Settlement Asset-Backed Bonds, Series 2018-A, 5.00% 2022 | | | 2,550 | | | | 2,791 | |
| Golden State Tobacco Securitization Corp., Enhanced Tobacco Settlement Asset-Backed Bonds, Series 2018-A-1, 5.00% 2047 | | | 2,450 | | | | 2,568 | |
| Golden State Tobacco Securitization Corp., Enhanced Tobacco Settlement Asset-Backed Bonds, Series 2018-A-2, 5.00% 2047 | | | 4,250 | | | | 4,455 | |
| Health Facs. Fncg. Auth., Rev. Bonds (Cedars-Sinai Medical Center), Series 2016-A, 5.00% 2036 | | | 500 | | | | 617 | |
| Health Facs. Fncg. Auth., Rev. Bonds (Children’s Hospital of Orange County), Series 2011-A, 5.25% 2041 | | | 2,000 | | | | 2,142 | |
| Health Facs. Fncg. Auth., Rev. Bonds (El Camino Hospital), Series 2017, 5.00% 2042 | | | 2,500 | | | | 2,999 | |
| Health Facs. Fncg. Auth., Rev. Bonds (Episcopal Home Communities), Series 2002-B, 6.00% 2032 (preref. 2020) | | | 3,600 | | | | 3,600 | |
| Health Facs. Fncg. Auth., Rev. Bonds (Kaiser Permanente), Series 2017-A-2, 4.00% 2044 | | | 12,940 | | | | 14,889 | |
| Health Facs. Fncg. Auth., Rev. Bonds (Kaiser Permanente), Series 2017-A-2, 5.00% 2047 | | | 1,500 | | | | 2,358 | |
| Health Facs. Fncg. Auth., Rev. Bonds (Lucile Salter Packard Children’s Hospital at Stanford), Series 2014-A, 5.00% 2043 | | | 1,000 | | | | 1,137 | |
| Health Facs. Fncg. Auth., Rev. Bonds (Lucile Salter Packard Children’s Hospital at Stanford), Series 2016-B, 5.00% 2055 | | | 2,000 | | | | 2,358 | |
| Health Facs. Fncg. Auth., Rev. Bonds (Lucile Salter Packard Children’s Hospital at Stanford), Series 2017-A, 5.00% 2042 | | | 1,475 | | | | 1,816 | |
| Health Facs. Fncg. Auth., Rev. Bonds (Lucile Salter Packard Children’s Hospital at Stanford), Series 2017-A, 5.00% 2056 | | | 2,000 | | | | 2,412 | |
| Health Facs. Fncg. Auth., Rev. Bonds (Presbyterian Homes and Services, Inc.), Series 2015, 5.00% 2022 | | | 100 | | | | 110 | |
| Health Facs. Fncg. Auth., Rev. Bonds (Presbyterian Homes and Services, Inc.), Series 2015, 5.00% 2031 | | | 400 | | | | 479 | |
| Health Facs. Fncg. Auth., Rev. Bonds (Presbyterian Homes and Services, Inc.), Series 2015, 5.00% 2039 | | | 400 | | | | 470 | |
| Health Facs. Fncg. Auth., Rev. Bonds (Providence St. Joseph Health), Series 2016-A, 4.00% 2034 | | | 500 | | | | 574 | |
| Health Facs. Fncg. Auth., Rev. Bonds (Providence St. Joseph Health), Series 2016-A, 4.00% 2036 | | | 650 | | | | 743 | |
| Health Facs. Fncg. Auth., Rev. Bonds (Providence St. Joseph Health), Series 2016-B-2, 4.00% 2036 (put 2024) | | | 2,000 | | | | 2,281 | |
| Health Facs. Fncg. Auth., Rev. Bonds (Rady Children’s Hospital - San Diego), Series 2011, 5.25% 2041 | | | 5,000 | | | | 5,332 | |
| Health Facs. Fncg. Auth., Rev. Bonds (Sutter Health), Series 2011-D, 5.25% 2031 | | | 2,000 | | | | 2,136 | |
| Health Facs. Fncg. Auth., Rev. Bonds (Sutter Health), Series 2018-A, 5.00% 2035 | | | 1,500 | | | | 1,896 | |
| Health Facs. Fncg. Auth., Rev. Bonds (Sutter Health), Series 2018-A, 5.00% 2036 | | | 2,000 | | | | 2,516 | |
| Health Facs. Fncg. Auth., Rev. Bonds (Sutter Health), Series 2018-A, 5.00% 2037 | | | 1,000 | | | | 1,249 | |
| Health Facs. Fncg. Auth., Rev. Green Bonds (Kaiser Permanente), Series 2017-C, 5.00% 2031 (put 2022) | | | 1,000 | | | | 1,110 | |
| Health Facs. Fncg. Auth., Rev. Ref. Bonds (Catholic Healthcare West), Series 2011-A, 5.25% 2041 | | | 2,000 | | | | 2,081 | |
| Health Facs. Fncg. Auth., Rev. Ref. Bonds (Cedars-Sinai Medical Center), Series 2015, 5.00% 2030 | | | 500 | | | | 614 | |
| Health Facs. Fncg. Auth., Rev. Ref. Bonds (Cedars-Sinai Medical Center), Series 2015, 5.00% 2031 | | | 1,300 | | | | 1,593 | |
| Health Facs. Fncg. Auth., Rev. Ref. Bonds (El Camino Hospital), Series 2015-A, 5.00% 2030 | | | 3,000 | | | | 3,575 | |
| Health Facs. Fncg. Auth., Rev. Ref. Bonds (El Camino Hospital), Series 2015-A, 5.00% 2040 | | | 8,700 | | | | 10,064 | |
| Health Facs. Fncg. Auth., Rev. Ref. Bonds (Memorial Health Services), Series 2012-A, 5.00% 2033 | | | 1,000 | | | | 1,104 | |
| Health Facs. Fncg. Auth., Rev. Ref. Bonds (Stanford Health Care), Series 2017-A, 5.00% 2034 | | | 9,000 | | | | 11,399 | |
| Health Facs. Fncg. Auth., Rev. Ref. Bonds (Stanford Hospital and Clinics), Series 2010-B, 5.25% 2031 (preref. 2020) | | | 4,475 | | | | 4,634 | |
| Health Facs. Fncg. Auth., Rev. Ref. Bonds (Sutter Health), Series 2008-A, 5.25% 2022 | | | 1,700 | | | | 1,743 | |
| Health Facs. Fncg. Auth., Rev. Ref. Bonds (Sutter Health), Series 2016-A, 5.00% 2034 | | | 2,000 | | | | 2,426 | |
| | |
| American Funds Tax-Exempt Funds | 55 |
The Tax-Exempt Fund of California
| Bonds, notes & other debt instruments (continued) | | Principal amount
(000) | | | Value
(000) | |
| California (continued) | | | | | | | | |
| State issuers (continued) | | | | | | | | |
| Health Facs. Fncg. Auth., Rev. Ref. Bonds (Sutter Health), Series 2016-A, 5.00% 2035 | | $ | 2,000 | | | $ | 2,422 | |
| Health Facs. Fncg. Auth., Rev. Ref. Bonds (Sutter Health), Series 2016-B, 4.00% 2038 | | | 4,165 | | | | 4,745 | |
| Health Facs. Fncg. Auth., Rev. Ref. Bonds (Sutter Health), Series 2016-B, 5.00% 2035 | | | 1,000 | | | | 1,236 | |
| Health Facs. Fncg. Auth., Rev. Ref. Bonds (Sutter Health), Series 2016-B, 5.00% 2046 | | | 8,740 | | | | 10,477 | |
| Housing Fin. Agcy., Municipal Certificates, Series 2019-A-1, 4.25% 2035 | | | 17,858 | | | | 21,768 | |
| Housing Fin. Agcy., Municipal Certificates, Series 2019-A-2, 4.00% 2033 | | | 6,000 | | | | 7,096 | |
| Housing Fin. Agcy., Municipal Certificates, Series 2019-X-1, 0.30% 20351 | | | 14,300 | | | | 356 | |
| Imperial Irrigation Dist., Electric System Rev. Ref. Bonds, Series 2017, 4.00% 2036 | | | 6,915 | | | | 8,060 | |
| Imperial Irrigation Dist., Electric System Rev. Ref. Bonds, Series 2017, 4.00% 2041 | | | 7,200 | | | | 8,265 | |
| Infrastructure and Econ. Dev. Bank, Charter School Rev. Bonds (Equitable School Revolving Fund), Series 2019-B, 5.00% 2039 | | | 300 | | | | 378 | |
| Infrastructure and Econ. Dev. Bank, Charter School Rev. Bonds (Equitable School Revolving Fund), Series 2019-B, 5.00% 2044 | | | 350 | | | | 435 | |
| Infrastructure and Econ. Dev. Bank, Charter School Rev. Bonds (Equitable School Revolving Fund), Series 2019-B, 5.00% 2049 | | | 540 | | | | 667 | |
| Infrastructure and Econ. Dev. Bank, Rev. Bonds (Performing Arts Center of Los Angeles County), Series 2007, 5.00% 2027 | | | 1,000 | | | | 1,003 | |
| Infrastructure and Econ. Dev. Bank, Rev. Bonds (Performing Arts Center of Los Angeles County), Series 2007, 5.00% 2037 | | | 1,500 | | | | 1,505 | |
| Infrastructure and Econ. Dev. Bank, Rev. Bonds (Stanford Consortium Project), Series 2016-A, 5.00% 2030 | | | 1,080 | | | | 1,338 | |
| Infrastructure and Econ. Dev. Bank, Rev. Bonds (Stanford Consortium Project), Series 2016-A, 5.00% 2031 | | | 1,230 | | | | 1,519 | |
| Infrastructure and Econ. Dev. Bank, Rev. Bonds (Stanford Consortium Project), Series 2016-A, 5.00% 2032 | | | 1,140 | | | | 1,405 | |
| Infrastructure and Econ. Dev. Bank, Rev. Bonds (Stanford Consortium Project), Series 2016-A, 5.00% 2033 | | | 1,105 | | | | 1,359 | |
| Infrastructure and Econ. Dev. Bank, Rev. Bonds (The Colburn School), Series 2015-B, (SIFMA Municipal Swap Index + 1.20%) 2.14% 2037 (put 2022)1 | | | 8,500 | | | | 8,633 | |
| Infrastructure and Econ. Dev. Bank, Rev. Bonds (The Colburn School), Series 2019, 1.75% 2055 (put 2026) | | | 8,000 | | | | 8,219 | |
| Infrastructure and Econ. Dev. Bank, Rev. Ref. Bonds (Academy of Sciences, San Francisco), Series 2018-C, (3-month USD-LIBOR x 0.70 + 0.38%) 1.535% 2047 (put 2021)1 | | | 4,925 | | | | 4,933 | |
| Infrastructure and Econ. Dev. Bank, Rev. Ref. Bonds (J. Paul Getty Trust), Series 2013-A-2, (3-month USD-LIBOR x 0.70 + 0.33%) 1.576% 2047 (put 2022)1 | | | 3,000 | | | | 3,007 | |
| Infrastructure and Econ. Dev. Bank, Rev. Ref. Bonds (Segerstrom Center for the Arts), Series 2016-B, 5.00% 2023 | | | 1,000 | | | | 1,138 | |
| Infrastructure and Econ. Dev. Bank, Rev. Ref. Bonds (Segerstrom Center for the Arts), Series 2017, 5.00% 2028 | | | 2,000 | | | | 2,572 | |
| Municipal Fin. Auth., Educational Rev. Bonds (American Heritage Education Foundation Project), Series 2016-A, 5.00% 2036 | | | 500 | | | | 583 | |
| Municipal Fin. Auth., Educational Rev. Bonds (American Heritage Education Foundation Project), Series 2016-A, 5.00% 2046 | | | 2,745 | | | | 3,148 | |
| Municipal Fin. Auth., Insured Senior Living Rev. Ref. Bonds (Pilgrim Place in Claremont), Series 2016-A, 5.00% 2031 | | | 500 | | | | 622 | |
| Municipal Fin. Auth., Jurupa Lease Rev. Ref. Bonds (Wineville Unified School Dist.), Series 2015-A, BAM insured, 5.00% 2042 | | | 4,500 | | | | 5,237 | |
| Municipal Fin. Auth., Rev. Bonds (Biola University), Series 2013, 5.00% 2042 | | | 1,000 | | | | 1,105 | |
| Municipal Fin. Auth., Rev. Bonds (California Baptist University), Series 2015-A, 5.375% 20402 | | | 2,335 | | | | 2,719 | |
| Municipal Fin. Auth., Rev. Bonds (California Baptist University), Series 2015-A, 5.50% 20452 | | | 2,800 | | | | 3,260 | |
| Municipal Fin. Auth., Rev. Bonds (California Baptist University), Series 2016-A, 4.00% 20212 | | | 600 | | | | 617 | |
| Municipal Fin. Auth., Rev. Bonds (California Baptist University), Series 2016-A, 5.00% 20362 | | | 3,500 | | | | 4,075 | |
| Municipal Fin. Auth., Rev. Bonds (California Baptist University), Series 2016-A, 5.00% 20462 | | | 750 | | | | 860 | |
| Municipal Fin. Auth., Rev. Bonds (California Lutheran University), Series 2018, 5.00% 2027 | | | 300 | | | | 376 | |
| Municipal Fin. Auth., Rev. Bonds (California Lutheran University), Series 2018, 5.00% 2028 | | | 150 | | | | 192 | |
| Municipal Fin. Auth., Rev. Bonds (California Lutheran University), Series 2018, 5.00% 2029 | | | 225 | | | | 287 | |
| Municipal Fin. Auth., Rev. Bonds (California Lutheran University), Series 2018, 5.00% 2030 | | | 225 | | | | 284 | |
| Municipal Fin. Auth., Rev. Bonds (California Lutheran University), Series 2018, 5.00% 2031 | | | 200 | | | | 252 | |
| Municipal Fin. Auth., Rev. Bonds (California Lutheran University), Series 2018, 5.00% 2032 | | | 225 | | | | 282 | |
| Municipal Fin. Auth., Rev. Bonds (California Lutheran University), Series 2018, 5.00% 2033 | | | 225 | | | | 281 | |
| Municipal Fin. Auth., Rev. Bonds (Caritas Mobile Home Park), Series 2014-A, 5.25% 2049 | | | 1,750 | | | | 1,956 | |
| Municipal Fin. Auth., Rev. Bonds (Caritas Mobile Home Park), Series 2014-B, 5.875% 2049 | | | 490 | | | | 539 | |
| | |
| 56 | American Funds Tax-Exempt Funds |
The Tax-Exempt Fund of California
| | | Principal amount
(000) | | | Value
(000) | |
| Municipal Fin. Auth., Rev. Bonds (Channing House Project), Series 2017-A, 5.00% 2033 | | $ | 1,000 | | | $ | 1,238 | |
| Municipal Fin. Auth., Rev. Bonds (Community Medical Centers), Series 2017-A, 5.00% 2022 | | | 1,300 | | | | 1,405 | |
| Municipal Fin. Auth., Rev. Bonds (Community Medical Centers), Series 2017-A, 5.00% 2027 | | | 690 | | | | 864 | |
| Municipal Fin. Auth., Rev. Bonds (Emerson College), Series 2017-B, 5.00% 2035 | | | 1,500 | | | | 1,852 | |
| Municipal Fin. Auth., Rev. Bonds (John Adams Academies Inc.), Series 2019-A, 5.00% 20392 | | | 915 | | | | 995 | |
| Municipal Fin. Auth., Rev. Bonds (John Adams Academies Inc.), Series 2019-A, 5.00% 20572 | | | 1,890 | | | | 2,007 | |
| Municipal Fin. Auth., Rev. Bonds (LINXS APM Project), Series 2018-A, AMT, 4.00% 2047 | | | 3,900 | | | | 4,292 | |
| Municipal Fin. Auth., Rev. Bonds (LINXS APM Project), Series 2018-A, AMT, 5.00% 2025 | | | 1,585 | | | | 1,883 | |
| Municipal Fin. Auth., Rev. Bonds (LINXS APM Project), Series 2018-A, AMT, 5.00% 2031 | | | 2,695 | | | | 3,339 | |
| Municipal Fin. Auth., Rev. Bonds (LINXS APM Project), Series 2018-A, AMT, 5.00% 2034 | | | 1,320 | | | | 1,624 | |
| Municipal Fin. Auth., Rev. Bonds (LINXS APM Project), Series 2018-A, AMT, 5.00% 2035 | | | 1,000 | | | | 1,227 | |
| Municipal Fin. Auth., Rev. Bonds (LINXS APM Project), Series 2018-A, AMT, 5.00% 2043 | | | 3,340 | | | | 4,015 | |
| Municipal Fin. Auth., Rev. Bonds (LINXS APM Project), Series 2018-A, AMT, 5.00% 2047 | | | 9,115 | | | | 10,896 | |
| Municipal Fin. Auth., Rev. Bonds (Mt. San Antonio Gardens Project), Series 2019, 4.00% 2020 | | | 260 | | | | 266 | |
| Municipal Fin. Auth., Rev. Bonds (Pomona College), Series 2017, 4.00% 2048 | | | 1,550 | | | | 1,768 | |
| Municipal Fin. Auth., Rev. Bonds (Retirement Housing Foundation Obligated Group), Series 2017-A, 5.00% 2029 | | | 390 | | | | 506 | |
| Municipal Fin. Auth., Rev. Bonds (Retirement Housing Foundation Obligated Group), Series 2017-A, 5.00% 2030 | | | 250 | | | | 328 | |
| Municipal Fin. Auth., Rev. Bonds (Retirement Housing Foundation Obligated Group), Series 2017-A, 5.00% 2031 | | | 1,250 | | | | 1,666 | |
| Municipal Fin. Auth., Rev. Bonds (Retirement Housing Foundation Obligated Group), Series 2017-A, 5.00% 2032 | | | 925 | | | | 1,251 | |
| Municipal Fin. Auth., Rev. Bonds (Social Bonds - HealthRIGHT 360), Series 2019-A, 5.00% 20392 | | | 1,250 | | | | 1,471 | |
| Municipal Fin. Auth., Rev. Bonds (Social Bonds - HealthRIGHT 360), Series 2019-A, 5.00% 20492 | | | 575 | | | | 662 | |
| Municipal Fin. Auth., Rev. Bonds (University of La Verne), Series 2010-A, 5.75% 2025 (preref. 2020) | | | 2,100 | | | | 2,134 | |
| Municipal Fin. Auth., Rev. Bonds (University of La Verne), Series 2010-A, 6.125% 2030 (preref. 2020) | | | 1,000 | | | | 1,018 | |
| Municipal Fin. Auth., Rev. Bonds (University of La Verne), Series 2017-A, 5.00% 2029 | | | 1,000 | | | | 1,248 | |
| Municipal Fin. Auth., Rev. Bonds (University of La Verne), Series 2017-A, 5.00% 2030 | | | 1,500 | | | | 1,858 | |
| Municipal Fin. Auth., Rev. Bonds (University of La Verne), Series 2017-A, 5.00% 2031 | | | 650 | | | | 799 | |
| Municipal Fin. Auth., Rev. Bonds (University of La Verne), Series 2017-A, 5.00% 2032 | | | 1,000 | | | | 1,227 | |
| Municipal Fin. Auth., Rev. Bonds (University of La Verne), Series 2017-A, 5.00% 2033 | | | 1,000 | | | | 1,224 | |
| Municipal Fin. Auth., Rev. Bonds (University of La Verne), Series 2017-A, 5.00% 2035 | | | 1,000 | | | | 1,219 | |
| Municipal Fin. Auth., Rev. Bonds (University of La Verne), Series 2017-A, 5.00% 2036 | | | 1,150 | | | | 1,399 | |
| Municipal Fin. Auth., Rev. Bonds (University of La Verne), Series 2017-A, 5.00% 2043 | | | 4,380 | | | | 5,228 | |
| Municipal Fin. Auth., Rev. Bonds (University of San Diego), Series 2019-A, 5.00% 2049 | | | 1,600 | | | | 2,021 | |
| Municipal Fin. Auth., Rev. Ref. Bonds (Azusa Pacific University Project), Series 2011-B, 8.00% 2041 (preref. 2021)2 | | | 4,150 | | | | 4,493 | |
| Municipal Fin. Auth., Rev. Ref. Bonds (Azusa Pacific University Project), Series 2015-B, 5.00% 2023 | | | 600 | | | | 659 | |
| Municipal Fin. Auth., Rev. Ref. Bonds (Azusa Pacific University Project), Series 2015-B, 5.00% 2024 | | | 600 | | | | 675 | |
| Municipal Fin. Auth., Rev. Ref. Bonds (Azusa Pacific University Project), Series 2015-B, 5.00% 2041 | | | 2,500 | | | | 2,770 | |
| Municipal Fin. Auth., Rev. Ref. Bonds (Biola University), Series 2017, 5.00% 2030 | | | 750 | | | | 922 | |
| Municipal Fin. Auth., Rev. Ref. Bonds (Biola University), Series 2017, 5.00% 2033 | | | 500 | | | | 610 | |
| Municipal Fin. Auth., Rev. Ref. Bonds (Biola University), Series 2017, 5.00% 2034 | | | 440 | | | | 535 | |
| Municipal Fin. Auth., Rev. Ref. Bonds (Biola University), Series 2017, 5.00% 2039 | | | 615 | | | | 739 | |
| Municipal Fin. Auth., Rev. Ref. Bonds (Eisenhower Medical Center), Series 2017-A, 5.00% 2033 | | | 650 | | | | 782 | |
| Municipal Fin. Auth., Rev. Ref. Bonds (Eisenhower Medical Center), Series 2017-A, 5.00% 2034 | | | 2,675 | | | | 3,214 | |
| Municipal Fin. Auth., Rev. Ref. Bonds (Eisenhower Medical Center), Series 2017-A, 5.00% 2035 | | | 2,000 | | | | 2,398 | |
| Municipal Fin. Auth., Rev. Ref. Bonds (Eisenhower Medical Center), Series 2017-A, 5.00% 2036 | | | 1,000 | | | | 1,196 | |
| Municipal Fin. Auth., Rev. Ref. Bonds (Eisenhower Medical Center), Series 2017-A, 5.00% 2037 | | | 1,250 | | | | 1,491 | |
| | |
| American Funds Tax-Exempt Funds | 57 |
The Tax-Exempt Fund of California
| Bonds, notes & other debt instruments (continued) | | Principal amount
(000) | | | Value
(000) | |
| California (continued) | | | | | | | | |
| State issuers (continued) | | | | | | | | |
| Municipal Fin. Auth., Rev. Ref. Bonds (Eisenhower Medical Center), Series 2017-A, 5.00% 2042 | | $ | 1,250 | | | $ | 1,474 | |
| Municipal Fin. Auth., Rev. Ref. Bonds (Eisenhower Medical Center), Series 2017-A, 5.00% 2047 | | | 1,000 | | | | 1,170 | |
| Municipal Fin. Auth., Rev. Ref. Bonds (Eisenhower Medical Center), Series 2017-B, 5.00% 2033 | | | 1,450 | | | | 1,745 | |
| Municipal Fin. Auth., Rev. Ref. Bonds (Eisenhower Medical Center), Series 2017-B, 5.00% 2034 | | | 600 | | | | 721 | |
| Municipal Fin. Auth., Rev. Ref. Bonds (Eisenhower Medical Center), Series 2017-B, 5.00% 2035 | | | 625 | | | | 749 | |
| Municipal Fin. Auth., Rev. Ref. Bonds (Eisenhower Medical Center), Series 2017-B, 5.00% 2036 | | | 600 | | | | 718 | |
| Municipal Fin. Auth., Rev. Ref. Bonds (Eisenhower Medical Center), Series 2017-B, 5.00% 2037 | | | 600 | | | | 716 | |
| Municipal Fin. Auth., Rev. Ref. Bonds (Eisenhower Medical Center), Series 2017-B, 5.00% 2042 | | | 1,000 | | | | 1,179 | |
| Municipal Fin. Auth., Rev. Ref. Bonds (Eisenhower Medical Center), Series 2017-B, 5.00% 2047 | | | 4,010 | | | | 4,692 | |
| Municipal Fin. Auth., Rev. Ref. Bonds (Harbor Regional Center Project), Series 2015, 5.00% 2032 | | | 1,500 | | | | 1,791 | |
| Municipal Fin. Auth., Rev. Ref. Bonds (Harbor Regional Center Project), Series 2015, 5.00% 2039 | | | 1,000 | | | | 1,173 | |
| Municipal Fin. Auth., Rev. Ref. Bonds (HumanGood Obligated Group), Series 2019-A, 4.00% 2031 | | | 1,000 | | | | 1,155 | |
| Municipal Fin. Auth., Rev. Ref. Bonds (HumanGood Obligated Group), Series 2019-A, 4.00% 2033 | | | 1,250 | | | | 1,434 | |
| Municipal Fin. Auth., Rev. Ref. Bonds (HumanGood Obligated Group), Series 2019-A, 4.00% 2034 | | | 750 | | | | 856 | |
| Municipal Fin. Auth., Rev. Ref. Bonds (HumanGood Obligated Group), Series 2019-A, 4.00% 2035 | | | 1,185 | | | | 1,348 | |
| Municipal Fin. Auth., Rev. Ref. Bonds (HumanGood Obligated Group), Series 2019-A, 4.00% 2036 | | | 2,000 | | | | 2,273 | |
| Municipal Fin. Auth., Rev. Ref. Bonds (HumanGood Obligated Group), Series 2019-A, 4.00% 2037 | | | 2,850 | | | | 3,226 | |
| Municipal Fin. Auth., Rev. Ref. Bonds (HumanGood Obligated Group), Series 2019-A, 4.00% 2039 | | | 2,750 | | | | 3,095 | |
| Municipal Fin. Auth., Rev. Ref. Bonds (HumanGood Obligated Group), Series 2019-A, 5.00% 2044 | | | 4,500 | | | | 5,329 | |
| Municipal Fin. Auth., Rev. Ref. Bonds (Inland Regional Center Project), Series 2015, 5.00% 2032 | | | 3,000 | | | | 3,546 | |
| Municipal Fin. Auth., Rev. Ref. Bonds (Inland Regional Center Project), Series 2015, 5.00% 2037 | | | 4,000 | | | | 4,670 | |
| Municipal Fin. Auth., Rev. Ref. Bonds (Inland Regional Center Project), Series 2015, 5.00% 2045 | | | 4,000 | | | | 4,607 | |
| Municipal Fin. Auth., Rev. Ref. Bonds (University of San Diego), Series 2011-B, 5.00% 2031 | | | 1,750 | | | | 1,873 | |
| Municipal Fin. Auth., Rev. Ref. Bonds (University of San Diego), Series 2012-A, 5.00% 2031 | | | 1,475 | | | | 1,640 | |
| Municipal Fin. Auth., Rev. Ref. Bonds (University of San Diego), Series 2012-A, 5.00% 2032 | | | 1,000 | | | | 1,112 | |
| Municipal Fin. Auth., Rev. Ref. Bonds (William Jessup University), Series 2019, 5.00% 2039 | | | 1,000 | | | | 1,165 | |
| Municipal Fin. Auth., Rev. Ref. Bonds (William Jessup University), Series 2019, 5.00% 2048 | | | 1,000 | | | | 1,148 | |
| Municipal Fin. Auth., Solid Waste Disposal Rev. Bonds (Waste Management, Inc. Project), Series 2017-A, AMT, 2.00% 2044 (put 2020) | | | 4,900 | | | | 4,930 | |
| Municipal Fin. Auth., Student Housing Rev. Bonds (CHF-Davis I, LLC - West Village Student Housing Project), Series 2018, 5.00% 2040 | | | 4,610 | | | | 5,619 | |
| Municipal Fin. Auth., Student Housing Rev. Bonds (CHF-Davis I, LLC - West Village Student Housing Project), Series 2018, 5.00% 2043 | | | 6,525 | | | | 7,895 | |
| Municipal Fin. Auth., Student Housing Rev. Bonds (CHF-Riverside I, LLC - UCR Student Housing Project), Series 2018, 5.00% 2043 | | | 2,000 | | | | 2,420 | |
| Municipal Fin. Auth., Student Housing Rev. Bonds (CHF-Riverside I, LLC - UCR Student Housing Project), Series 2018, 5.00% 2052 | | | 7,500 | | | | 8,978 | |
| Municipal Fin. Auth., Student Housing Rev. Bonds (CHF-Riverside II, LLC - UCR Student Housing Project), Series 2019, 5.00% 2049 | | | 2,510 | | | | 3,066 | |
| Municipal Fin. Auth., Student Housing Rev. Bonds (CHF-Riverside II, LLC - UCR Student Housing Project), Series 2019, 5.00% 2052 | | | 3,500 | | | | 4,259 | |
| | |
| 58 | American Funds Tax-Exempt Funds |
The Tax-Exempt Fund of California
| | | Principal amount
(000) | | | Value
(000) | |
| Pollution Control Fncg. Auth., Rev. Bonds (San Jose Water Co. Project), Series 2016, AMT, 4.75% 2046 | | $ | 11,475 | | | $ | 13,148 | |
| School Fin. Auth., Charter School Rev. Bonds (Classical Academies Project), Series 2013-A-1, 7.375% 2043 (preref. 2022) | | | 3,400 | | | | 3,954 | |
| School Fin. Auth., Charter School Rev. Bonds (Classical Academies Project), Series 2017-A, 4.00% 20272 | | | 750 | | | | 822 | |
| School Fin. Auth., Charter School Rev. Bonds (Classical Academies Project), Series 2017-A, 5.00% 20322 | | | 2,500 | | | | 2,933 | |
| School Fin. Auth., Charter School Rev. Bonds (Classical Academies Project), Series 2017-A, 5.00% 20372 | | | 1,485 | | | | 1,719 | |
| School Fin. Auth., Charter School Rev. Bonds (Classical Academies Project), Series 2017-A, 5.00% 20442 | | | 805 | | | | 920 | |
| School Fin. Auth., Charter School Rev. Bonds (Downtown College Prep Obligated Group), Series 2016, 4.75% 20362 | | | 1,365 | | | | 1,484 | |
| School Fin. Auth., Charter School Rev. Bonds (Equitas Academy - Obligated Group), Series 2018-A, 5.00% 20352 | | | 500 | | | | 573 | |
| School Fin. Auth., Charter School Rev. Bonds (Equitas Academy Obligated Group), Series 2018-A, 5.00% 20292 | | | 3,345 | | | | 3,909 | |
| School Fin. Auth., Charter School Rev. Bonds (Equitas Academy Obligated Group), Series 2018-A, 5.00% 20412 | | | 3,000 | | | | 3,390 | |
| School Fin. Auth., Charter School Rev. Bonds (Equitas Academy Obligated Group), Series 2018-A, 5.00% 20482 | | | 2,795 | | | | 3,139 | |
| School Fin. Auth., Charter School Rev. Bonds (Larchmont Charter School Project), Series 2018-A, 5.00% 20552 | | | 1,000 | | | | 1,090 | |
| School Fin. Auth., Charter School Rev. Bonds (Rocketship Education Obligated Group), Series 2016-A, 5.00% 20362 | | | 1,000 | | | | 1,079 | |
| School Fin. Auth., Charter School Rev. Bonds (Rocketship Education Obligated Group), Series 2016-A, 5.00% 20462 | | | 750 | | | | 803 | |
| School Fin. Auth., Charter School Rev. Bonds (Rocketship Education Obligated Group), Series 2017-A, 5.00% 20342 | | | 750 | | | | 821 | |
| School Fin. Auth., Charter School Rev. Bonds (Rocketship Public Schools Obligated Group), Series 2017-G, 5.00% 20302 | | | 315 | | | | 352 | |
| School Fin. Auth., Charter School Rev. Bonds (Rocketship Public Schools Obligated Group), Series 2017-G, 5.00% 20472 | | | 250 | | | | 273 | |
| School Fin. Auth., Educational Facs. Rev. Bonds (River Springs Charter School Project), Series 2015-A, 6.375% 20462 | | | 4,300 | | | | 5,057 | |
| School Fin. Auth., Educational Facs. Rev. Bonds (River Springs Charter School Project), Series 2017-A, 5.00% 20302 | | | 1,950 | | | | 2,251 | |
| School Fin. Auth., Educational Facs. Rev. Bonds (River Springs Charter School Project), Series 2017-A, 5.00% 20372 | | | 2,105 | | | | 2,402 | |
| School Fin. Auth., School Fac. Rev. Bonds (Granada Hills Charter Obligated Group), Series 2019, 5.00% 20432 | | | 1,750 | | | | 2,024 | |
| School Fin. Auth., School Fac. Rev. Bonds (Granada Hills Charter Obligated Group), Series 2019, 5.00% 20492 | | | 1,900 | | | | 2,188 | |
| School Fin. Auth., School Fac. Rev. Bonds (Granada Hills Charter Obligated Group), Series 2019, 5.00% 20542 | | | 5,000 | | | | 5,730 | |
| School Fin. Auth., School Fac. Rev. Bonds (KIPP LA Projects), Series 2017-A, 5.00% 20372 | | | 675 | | | | 810 | |
| School Fin. Auth., School Fac. Rev. Bonds (KIPP SoCal Projects), Series 2019-A, 5.00% 20542 | | | 2,150 | | | | 2,592 | |
| School Fin. Auth., School Fac. Rev. Ref. Bonds (High Tech High Learning Project), Series 2017-A, 5.00% 20372 | | | 1,455 | | | | 1,720 | |
| School Fin. Auth., School Fac. Rev. Ref. Bonds (High Tech High Learning Project), Series 2017-A, 5.00% 20492 | | | 5,400 | | | | 6,274 | |
| Statewide Communities Dev. Auth., Health Fac. Rev. Ref. Bonds (Los Angeles Jewish Home for the Aging), Series 2019-A, 4.00% 2024 | | | 300 | | | | 345 | |
| Statewide Communities Dev. Auth., Health Fac. Rev. Ref. Bonds (Los Angeles Jewish Home for the Aging), Series 2019-A, 4.00% 2025 | | | 275 | | | | 325 | |
| Statewide Communities Dev. Auth., Health Fac. Rev. Ref. Bonds (Los Angeles Jewish Home for the Aging), Series 2019-A, 4.00% 2026 | | | 395 | | | | 475 | |
| Statewide Communities Dev. Auth., Health Fac. Rev. Ref. Bonds (Los Angeles Jewish Home for the Aging), Series 2019-A, 5.00% 2034 | | | 750 | | | | 991 | |
| Statewide Communities Dev. Auth., Health Fac. Rev. Ref. Bonds (Los Angeles Jewish Home for the Aging), Series 2019-A, 5.00% 2037 | | | 735 | | | | 960 | |
| Statewide Communities Dev. Auth., Health Fac. Rev. Ref. Bonds (Los Angeles Jewish Home for the Aging), Series 2019-B, 5.00% 2031 | | | 1,300 | | | | 1,740 | |
| | |
| American Funds Tax-Exempt Funds | 59 |
The Tax-Exempt Fund of California
| Bonds, notes & other debt instruments (continued) | | Principal amount
(000) | | | Value
(000) | |
| California (continued) | | | | | | | | |
| State issuers (continued) | | | | | | | | |
| Statewide Communities Dev. Auth., Health Fac. Rev. Ref. Bonds (Los Angeles Jewish Home for the Aging), Series 2019-B, 5.00% 2032 | | $ | 500 | | | $ | 666 | |
| Statewide Communities Dev. Auth., Health Fac. Rev. Ref. Bonds (Los Angeles Jewish Home for the Aging), Series 2019-B, 5.00% 2033 | | | 1,000 | | | | 1,326 | |
| Statewide Communities Dev. Auth., Hospital Rev. Ref. Bonds (Methodist Hospital of Southern California), Series 2018, 5.00% 2030 | | | 2,585 | | | | 3,218 | |
| Statewide Communities Dev. Auth., Hospital Rev. Ref. Bonds (Methodist Hospital of Southern California), Series 2018, 5.00% 2038 | | | 1,000 | | | | 1,209 | |
| Statewide Communities Dev. Auth., Hospital Rev. Ref. Bonds (Methodist Hospital of Southern California), Series 2018, 5.00% 2043 | | | 2,000 | | | | 2,389 | |
| Statewide Communities Dev. Auth., Hospital Rev. Ref. Bonds (Methodist Hospital of Southern California), Series 2018, 5.00% 2048 | | | 1,500 | | | | 1,779 | |
| Statewide Communities Dev. Auth., Multi Family Housing Rev. Bonds (La Mesa Springs Apartments), Series 2019-E, 1.78% 2021 (put 2020) | | | 7,000 | | | | 7,052 | |
| Statewide Communities Dev. Auth., Multi Family Housing Rev. Bonds (Miramar Tower Apartments), Series 2019-M, 1.30% 2022 (put 2021) | | | 1,500 | | | | 1,504 | |
| Statewide Communities Dev. Auth., Multi Family Housing Rev. Bonds (Robert Farrell Manor and Western Gardens Apartments), Series 2019-T-1, 1.25% 2021 (put 2021) | | | 2,310 | | | | 2,317 | |
| Statewide Communities Dev. Auth., Pollution Control Rev. Ref. Bonds (Southern California Edison Co.), Series 2006-A, 1.90% 2028 | | | 1,250 | | | | 1,252 | |
| Statewide Communities Dev. Auth., Pollution Control Rev. Ref. Bonds (Southern California Edison Co.), Series 2010-A, 4.50% 2029 | | | 2,905 | | | | 2,967 | |
| Statewide Communities Dev. Auth., Rev. Bonds (Adventist Health System/West), Series 2015-A, 5.00% 2031 | | | 2,000 | | | | 2,418 | |
| Statewide Communities Dev. Auth., Rev. Bonds (Adventist Health System/West), Series 2015-A, 5.00% 2032 | | | 2,115 | | | | 2,548 | |
| Statewide Communities Dev. Auth., Rev. Bonds (Adventist Health System/West), Series 2015-A, 5.00% 2035 | | | 3,000 | | | | 3,595 | |
| Statewide Communities Dev. Auth., Rev. Bonds (Adventist Health System/West), Series 2018-A, 4.00% 2042 | | | 1,240 | | | | 1,376 | |
| Statewide Communities Dev. Auth., Rev. Bonds (Adventist Health System/West), Series 2018-A, 5.00% 2032 | | | 1,000 | | | | 1,260 | |
| Statewide Communities Dev. Auth., Rev. Bonds (Adventist Health System/West), Series 2018-A, 5.00% 2033 | | | 1,150 | | | | 1,445 | |
| Statewide Communities Dev. Auth., Rev. Bonds (Adventist Health System/West), Series 2018-A, 5.00% 2035 | | | 1,465 | | | | 1,833 | |
| Statewide Communities Dev. Auth., Rev. Bonds (American Baptist Homes of the West), Series 2015, 5.00% 2020 | | | 15 | | | | 15 | |
| Statewide Communities Dev. Auth., Rev. Bonds (American Baptist Homes of the West), Series 2015, 5.00% 2021 | | | 335 | | | | 357 | |
| Statewide Communities Dev. Auth., Rev. Bonds (American Baptist Homes of the West), Series 2015, 5.00% 2022 | | | 270 | | | | 298 | |
| Statewide Communities Dev. Auth., Rev. Bonds (American Baptist Homes of the West), Series 2015, 5.00% 2026 | | | 75 | | | | 90 | |
| Statewide Communities Dev. Auth., Rev. Bonds (American Baptist Homes of the West), Series 2015, 5.00% 2045 | | | 1,700 | | | | 1,932 | |
| Statewide Communities Dev. Auth., Rev. Bonds (Buck Institute for Research on Aging), Series 2014, Assured Guaranty Municipal insured, 5.00% 2049 | | | 5,250 | | | | 6,013 | |
| Statewide Communities Dev. Auth., Rev. Bonds (Covenant Retirement Communities, Inc.), Series 2013-C, 5.625% 2036 | | | 2,000 | | | | 2,307 | |
| Statewide Communities Dev. Auth., Rev. Bonds (Front Porch Communities and Services), Series 2017-A, 5.00% 2029 | | | 405 | | | | 503 | |
| Statewide Communities Dev. Auth., Rev. Bonds (Front Porch Communities and Services), Series 2017-A, 5.00% 2047 | | | 1,815 | | | | 2,147 | |
| Statewide Communities Dev. Auth., Rev. Bonds (Hebrew Home for Aged Disabled), Series 2016, 5.00% 2036 | | | 3,500 | | | | 4,281 | |
| Statewide Communities Dev. Auth., Rev. Bonds (Huntington Memorial Hospital), Series 2014, 5.00% 2044 | | | 8,500 | | | | 9,647 | |
| Statewide Communities Dev. Auth., Rev. Bonds (Huntington Memorial Hospital), Series 2018, 4.00% 2048 | | | 500 | | | | 547 | |
| Statewide Communities Dev. Auth., Rev. Bonds (Kaiser Permanente), Series 2004-L, 5.00% 2038 (put 2029) | | | 5,000 | | | | 6,732 | |
| | |
| 60 | American Funds Tax-Exempt Funds |
The Tax-Exempt Fund of California
| | | Principal amount
(000) | | | Value
(000) | |
| Statewide Communities Dev. Auth., Rev. Bonds (Kaiser Permanente), Series 2004-M, 5.00% 2038 (put 2029) | | $ | 4,000 | | | $ | 5,386 | |
| Statewide Communities Dev. Auth., Rev. Bonds (Kaiser Permanente), Series 2012-A, 5.00% 2042 | | | 6,500 | | | | 7,052 | |
| Statewide Communities Dev. Auth., Rev. Bonds (Lancer Educational Student Housing Project), Series 2019-A, 5.00% 20342 | | | 100 | | | | 121 | �� |
| Statewide Communities Dev. Auth., Rev. Bonds (Lancer Educational Student Housing Project), Series 2019-A, 5.00% 20392 | | | 105 | | | | 126 | |
| Statewide Communities Dev. Auth., Rev. Bonds (Lancer Educational Student Housing Project), Series 2019-A, 5.00% 20512 | | | 1,590 | | | | 1,871 | |
| Statewide Communities Dev. Auth., Rev. Bonds (Lancer Plaza Project), Series 2013, 5.625% 2033 | | | 1,350 | | | | 1,533 | |
| Statewide Communities Dev. Auth., Rev. Bonds (Lancer Plaza Project), Series 2013, 5.875% 2043 | | | 935 | | | | 1,057 | |
| Statewide Communities Dev. Auth., Rev. Bonds (Loma Linda University Medical Center), Series 2014-A, 5.25% 2044 | | | 2,925 | | | | 3,315 | |
| Statewide Communities Dev. Auth., Rev. Bonds (Loma Linda University Medical Center), Series 2016-A, 5.25% 20562 | | | 1,400 | | | | 1,595 | |
| Statewide Communities Dev. Auth., Rev. Bonds (Loma Linda University Medical Center), Series 2018-A, 5.50% 20582 | | | 1,000 | | | | 1,189 | |
| Statewide Communities Dev. Auth., Rev. Bonds (Redlands Community Hospital), Series 2016, 5.00% 2029 | | | 625 | | | | 760 | |
| Statewide Communities Dev. Auth., Rev. Bonds (Redlands Community Hospital), Series 2016, 5.00% 2031 | | | 1,135 | | | | 1,371 | |
| Statewide Communities Dev. Auth., Rev. Bonds (Redlands Community Hospital), Series 2016, 5.00% 2032 | | | 1,500 | | | | 1,807 | |
| Statewide Communities Dev. Auth., Rev. Bonds (Terraces at San Joaquin Gardens Project), Series 2012-A, 6.00% 2042 | | | 1,750 | | | | 1,964 | |
| Statewide Communities Dev. Auth., Rev. Bonds (Terraces at San Joaquin Gardens Project), Series 2012-A, 6.00% 2047 | | | 2,000 | | | | 2,239 | |
| Statewide Communities Dev. Auth., Rev. Bonds (Viamonte Senior Living 1 Project), Series 2018-B, 3.00% 2025 | | | 1,500 | | | | 1,528 | |
| Statewide Communities Dev. Auth., Rev. Bonds (Viamonte Senior Living 1 Project), Series 2018-B, 3.00% 2026 | | | 4,000 | | | | 4,072 | |
| Statewide Communities Dev. Auth., Rev. Ref. Bonds (California Baptist University), Series 2017-A, 5.00% 20322 | | | 2,025 | | | | 2,426 | |
| Statewide Communities Dev. Auth., Rev. Ref. Bonds (California Baptist University), Series 2017-A, 5.00% 20412 | | | 11,920 | | | | 13,987 | |
| Statewide Communities Dev. Auth., Rev. Ref. Bonds (Cottage Health System Obligated Group), Series 2010, 5.00% 2040 | | | 2,000 | | | | 2,049 | |
| Statewide Communities Dev. Auth., Rev. Ref. Bonds (Enloe Medical Center), Series 2015, 5.00% 2031 | | | 1,000 | | | | 1,216 | |
| Statewide Communities Dev. Auth., Rev. Ref. Bonds (Enloe Medical Center), Series 2015, 5.00% 2034 | | | 500 | | | | 603 | |
| Statewide Communities Dev. Auth., Rev. Ref. Bonds (Enloe Medical Center), Series 2015, 5.00% 2035 | | | 5,050 | | | | 6,084 | |
| Statewide Communities Dev. Auth., Rev. Ref. Bonds (Episcopal Communities and Services), Series 2012, 5.00% 2032 | | | 700 | | | | 760 | |
| Statewide Communities Dev. Auth., Rev. Ref. Bonds (Episcopal Communities and Services), Series 2012, 5.00% 2047 | | | 2,100 | | | | 2,262 | |
| Statewide Communities Dev. Auth., Rev. Ref. Bonds (Huntington Memorial Hospital), Series 2014-B, 5.00% 2031 | | | 1,750 | | | | 2,029 | |
| Statewide Communities Dev. Auth., Rev. Ref. Bonds (Lancer Educational Student Housing Project), Series 2016-A, 4.00% 20262 | | | 3,385 | | | | 3,793 | |
| Statewide Communities Dev. Auth., Rev. Ref. Bonds (Lancer Educational Student Housing Project), Series 2016-A, 5.00% 20362 | | | 3,500 | | | | 4,015 | |
| Statewide Communities Dev. Auth., Rev. Ref. Bonds (Lancer Educational Student Housing Project), Series 2016-A, 5.00% 20462 | | | 2,250 | | | | 2,543 | |
| Statewide Communities Dev. Auth., Rev. Ref. Bonds (Rady Children’s Hospital), Series 2016-B, 5.00% 2027 | | | 640 | | | | 827 | |
| Statewide Communities Dev. Auth., Rev. Ref. Bonds (Trinity Health Credit Group), Series 2011, 5.00% 2041 | | | 1,500 | | | | 1,616 | |
| Statewide Communities Dev. Auth., Senior Living Health Fac. Rev. Bonds (Los Angeles Jewish Home for the Aging - Fountainview at Gonda), Series 2014-A, 5.00% 2044 | | | 1,000 | | | | 1,114 | |
| | |
| American Funds Tax-Exempt Funds | 61 |
The Tax-Exempt Fund of California
| Bonds, notes & other debt instruments (continued) | | Principal amount
(000) | | | Value
(000) | |
| California (continued) | | | | | | | | |
| State issuers (continued) | | | | | | | | |
| Statewide Communities Dev. Auth., Student Housing Rev. Bonds (Custodial Receipts), Series 2017, 4.305% 2032 | | $ | 10,075 | | | $ | 11,380 | |
| Statewide Communities Dev. Auth., Student Housing Rev. Ref. Bonds (CHF-Irvine, LLC - University of California, Irvine East Campus Apartments), Series 2016, 5.00% 2029 | | | 1,000 | | | | 1,203 | |
| Statewide Communities Dev. Auth., Student Housing Rev. Ref. Bonds (CHF-Irvine, LLC - University of California, Irvine East Campus Apartments), Series 2016, 5.00% 2030 | | | 1,500 | | | | 1,794 | |
| Statewide Communities Dev. Auth., Student Housing Rev. Ref. Bonds (CHF-Irvine, LLC - University of California, Irvine East Campus Apartments), Series 2016, 5.00% 2035 | | | 1,250 | | | | 1,479 | |
| Statewide Communities Dev. Auth., Student Housing Rev. Ref. Bonds (CHF-Irvine, LLC - University of California, Irvine East Campus Apartments, Phase I), Series 2011, 5.375% 2038 | | | 1,260 | | | | 1,331 | |
| Regents of the University of California, General Rev. Bonds, Series 2018-AZ, 5.00% 2048 | | | 10,230 | | | | 12,753 | |
| Regents of the University of California, Limited Project Rev. Bonds, Series 2016-K, 5.00% 2034 | | | 750 | | | | 923 | |
| Regents of the University of California, Limited Project Rev. Bonds, Series 2016-K, 5.00% 2035 | | | 3,750 | | | | 4,609 | |
| Regents of the University of California, Limited Project Rev. Ref. Bonds, Series 2018-O, 5.00% 2048 | | | 1,900 | | | | 2,362 | |
| Regents of the University of California, Medical Center Pooled Rev. Bonds, Series 2016-L, 4.00% 2038 | | | 1,000 | | | | 1,131 | |
| Dept. of Veterans Affairs, Veterans G.O. Bonds, Series 2018-CR, 4.00% 2048 | | | 17,440 | | | | 19,108 | |
| Dept. of Veterans Affairs, Veterans G.O. Bonds, Series 2019-CS, 4.00% 2049 | | | 15,955 | | | | 17,679 | |
| Dept. of Veterans Affairs, Veterans G.O. Rev. Ref. Bonds, Series 2015-CM, AMT, 2.45% 2031 | | | 3,045 | | | | 3,088 | |
| Dept. of Veterans Affairs, Veterans G.O. Rev. Ref. Bonds, Series 2016-CN, 3.50% 2045 | | | 6,580 | | | | 6,913 | |
| Dept. of Water Resources, Water System Rev. Bonds (Central Valley Project), Series 2016-AW, 4.00% 2035 | | | 20,840 | | | | 24,378 | |
| Other securities | | | | | | | 97,305 | |
| | | | | | | | 965,425 | |
| | | | | | | | | |
| City, county & other issuers 55.81% | | | | | | | | |
| Bay Area Toll Auth., San Francisco Bay Area Toll Bridge Rev. Bonds, Series 2006-C-1, (SIFMA Municipal Swap Index + 0.90%) 1.84% 2045 (put 2023)1 | | | 1,400 | | | | 1,423 | |
| Bay Area Toll Auth., San Francisco Bay Area Toll Bridge Rev. Bonds, Series 2008-B-1, (SIFMA Municipal Swap Index + 1.10%) 2.04% 2045 (put 2024)1 | | | 7,900 | | | | 8,105 | |
| Bay Area Toll Auth., San Francisco Bay Area Toll Bridge Rev. Bonds, Series 2014-H, (SIFMA Municipal Swap Index + 0.70%) 1.64% 2034 (put 2021)1 | | | 2,825 | | | | 2,837 | |
| Bay Area Toll Auth., San Francisco Bay Area Toll Bridge Rev. Bonds, Series 2017-D, (3-month USD-LIBOR x 0.70 + 0.55%) 1.886% 2045 (put 2021)1 | | | 2,100 | | | | 2,106 | |
| Bay Area Toll Auth., San Francisco Bay Area Toll Bridge Rev. Bonds, Series 2017-F-1, 5.00% 2056 | | | 3,510 | | | | 4,234 | |
| Bay Area Toll Auth., San Francisco Bay Area Toll Bridge Rev. Bonds, Series 2019-S-8, 5.00% 2056 | | | 20,000 | | | | 25,356 | |
| Bay Area Toll Auth., San Francisco Bay Area Toll Bridge Rev. Bonds, Series 2019-S-H, 5.00% 2044 | | | 1,000 | | | | 1,271 | |
| Bay Area Toll Auth., San Francisco Bay Area Toll Bridge Rev. Ref. Bonds, Series 2014-F-1, 5.00% 2054 | | | 1,475 | | | | 1,735 | |
| Brentwood Unified School Dist., G.O. Bonds, 2016 Election, Series 2019, 4.00% 2048 | | | 9,940 | | | | 11,263 | |
| County of Contra Costa, Transportation Auth., Sales Tax Rev. Ref. Bonds, Series 2018-A, (1-month USD-LIBOR x 0.70 + 0.25%) 1.496% 2034 (put 2021)1 | | | 11,675 | | | | 11,693 | |
| City of Elk Grove, Fin. Auth., Special Tax Rev. Bonds, Series 2015, BAM insured, 5.00% 2032 | | | 1,000 | | | | 1,193 | |
| City of Elk Grove, Fin. Auth., Special Tax Rev. Bonds, Series 2015, BAM insured, 5.00% 2033 | | | 1,000 | | | | 1,190 | |
| City of Elk Grove, Fin. Auth., Special Tax Rev. Bonds, Series 2015, BAM insured, 5.00% 2034 | | | 1,000 | | | | 1,185 | |
| City of Elk Grove, Fin. Auth., Special Tax Rev. Bonds, Series 2015, BAM insured, 5.00% 2035 | | | 1,000 | | | | 1,184 | |
| City of Elk Grove, Fin. Auth., Special Tax Rev. Bonds, Series 2016, 4.00% 2020 | | | 250 | | | | 254 | |
| City of Elk Grove, Fin. Auth., Special Tax Rev. Bonds, Series 2016, 4.00% 2032 | | | 2,500 | | | | 2,788 | |
| City of Elk Grove, Fin. Auth., Special Tax Rev. Bonds, Series 2016, 5.00% 2041 | | | 4,680 | | | | 5,460 | |
| City of Elk Grove, Fin. Auth., Special Tax Rev. Bonds, Series 2016, 5.00% 2046 | | | 8,065 | | | | 9,359 | |
| City of Elk Grove, Fin. Auth., Special Tax Rev. Bonds, Series 2018, 5.00% 2033 | | | 945 | | | | 1,121 | |
| City of Elk Grove, Fin. Auth., Special Tax Rev. Bonds, Series 2018, 5.00% 2035 | | | 1,150 | | | | 1,358 | |
| City of Elk Grove, Fin. Auth., Special Tax Rev. Bonds, Series 2018, 5.00% 2043 | | | 1,040 | | | | 1,210 | |
| City of Elk Grove, Fin. Auth., Special Tax Rev. Bonds, Series 2018, 5.00% 2048 | | | 2,500 | | | | 2,895 | |
| | |
| 62 | American Funds Tax-Exempt Funds |
The Tax-Exempt Fund of California
| | | Principal amount
(000) | | | Value
(000) | |
| Folsom Cordova Unified School Dist., School Facs. Improvement Dist. No. 3, G.O. Bonds, 2007 Election, Series 2019-D, Assured Guaranty Municipal insured, 4.00% 2040 | | $ | 8,715 | | | $ | 9,829 | |
| Hayward Unified School Dist., G.O. Bonds, 2019 Election, Series 2019-A, BAM insured, 5.00% 2044 | | | 8,000 | | | | 9,928 | |
| City of Irvine, Community Facs. Dist. No. 2013-3 (Great Park), Improvement Area No. 1, Special Tax Bonds, Series 2014, 5.00% 2044 | | | 2,705 | | | | 3,024 | |
| City of Irvine, Community Facs. Dist. No. 2013-3 (Great Park), Improvement Area No. 1, Special Tax Bonds, Series 2014, 5.00% 2049 | | | 1,000 | | | | 1,114 | |
| City of Irvine, Community Facs. Dist. No. 2013-3 (Great Park), Improvement Area No. 4, Special Tax Bonds, Series 2016, 4.00% 2028 | | | 825 | | | | 915 | |
| City of Irvine, Community Facs. Dist. No. 2013-3 (Great Park), Improvement Area No. 4, Special Tax Bonds, Series 2016, 4.00% 2031 | | | 400 | | | | 440 | |
| City of Irvine, Community Facs. Dist. No. 2013-3 (Great Park), Improvement Area No. 4, Special Tax Bonds, Series 2016, 4.00% 2033 | | | 1,615 | | | | 1,773 | |
| City of Irvine, Community Facs. Dist. No. 2013-3 (Great Park), Improvement Area No. 8, Special Tax Bonds, Series 2018, 5.00% 2035 | | | 550 | | | | 651 | |
| City of Irvine, Community Facs. Dist. No. 2013-3 (Great Park), Improvement Area No. 8, Special Tax Bonds, Series 2018, 5.00% 2037 | | | 650 | | | | 766 | |
| City of Irvine, Community Facs. Dist. No. 2013-3 (Great Park), Improvement Area No. 8, Special Tax Bonds, Series 2018, 5.00% 2038 | | | 1,000 | | | | 1,176 | |
| City of Irvine, Community Facs. Dist. No. 2013-3 (Great Park), Improvement Area No. 8, Special Tax Bonds, Series 2018, 5.00% 2043 | | | 2,670 | | | | 3,116 | |
| City of Irvine, Community Facs. Dist. No. 2013-3 (Great Park), Improvement Area No. 8, Special Tax Bonds, Series 2018, 5.00% 2048 | | | 5,250 | | | | 6,103 | |
| City of Irvine, Community Facs. Dist. No. 2013-3 (Great Park), Improvement Area No. 8, Special Tax Bonds, Series 2018, Assured Guaranty Municipal insured, 5.00% 2051 | | | 1,250 | | | | 1,496 | |
| City of Irvine, Reassessment Dist. No. 12-1, Limited Obligation Improvement Bonds, Series 2012, 4.00% 2020 | | | 1,000 | | | | 1,019 | |
| City of Irvine, Reassessment Dist. No. 12-1, Limited Obligation Improvement Bonds, Series 2013, 5.00% 2024 | | | 825 | | | | 943 | |
| City of Irvine, Reassessment Dist. No. 12-1, Limited Obligation Improvement Bonds, Series 2013, 5.00% 2025 | | | 710 | | | | 812 | |
| City of Irvine, Reassessment Dist. No. 12-1, Limited Obligation Improvement Bonds, Series 2013, 5.00% 2028 | | | 1,050 | | | | 1,188 | |
| City of Irvine, Reassessment Dist. No. 12-1, Limited Obligation Improvement Bonds, Series 2015, 5.00% 2024 | | | 2,250 | | | | 2,662 | |
| City of Irvine, Reassessment Dist. No. 12-1, Limited Obligation Improvement Bonds, Series 2015, 5.00% 2029 | | | 2,600 | | | | 3,058 | |
| City of Irvine, Reassessment Dist. No. 12-1, Limited Obligation Improvement Bonds, Series 2015, 5.00% 2030 | | | 1,700 | | | | 1,990 | |
| City of Irvine, Reassessment Dist. No. 12-1, Limited Obligation Improvement Bonds, Series 2015, 5.00% 2031 | | | 1,500 | | | | 1,750 | |
| City of Irvine, Reassessment Dist. No. 15-2, Limited Obligation Improvement Bonds, Series 2015, 5.00% 2032 | | | 800 | | | | 931 | |
| City of Irvine, Reassessment Dist. No. 15-2, Limited Obligation Improvement Bonds, Series 2015, 5.00% 2042 | | | 1,000 | | | | 1,144 | |
| City of Irvine, Reassessment Dist. No. 19-1, Limited Obligation Improvement Bonds, Series 2019, 4.00% 2036 | | | 1,840 | | | | 2,185 | |
| City of Irvine, Reassessment Dist. No. 19-1, Limited Obligation Improvement Bonds, Series 2019, 4.00% 2037 | | | 1,285 | | | | 1,518 | |
| City of Irvine, Reassessment Dist. No. 19-1, Limited Obligation Improvement Bonds, Series 2019, 5.00% 2026 | | | 330 | | | | 415 | |
| City of Irvine, Reassessment Dist. No. 19-1, Limited Obligation Improvement Bonds, Series 2019, 5.00% 2027 | | | 375 | | | | 483 | |
| City of Irvine, Reassessment Dist. No. 19-1, Limited Obligation Improvement Bonds, Series 2019, 5.00% 2028 | | | 525 | | | | 689 | |
| City of Irvine, Reassessment Dist. No. 19-1, Limited Obligation Improvement Bonds, Series 2019, 5.00% 2029 | | | 500 | | | | 670 | |
| City of Irvine, Reassessment Dist. No. 19-1, Limited Obligation Improvement Bonds, Series 2019, 5.00% 2030 | | | 350 | | | | 466 | |
| City of Irvine, Reassessment Dist. No. 19-1, Limited Obligation Improvement Bonds, Series 2019, 5.00% 2031 | | | 635 | | | | 842 | |
| City of Irvine, Reassessment Dist. No. 19-1, Limited Obligation Improvement Bonds, Series 2019, 5.00% 2032 | | | 680 | | | | 896 | |
| | |
| American Funds Tax-Exempt Funds | 63 |
The Tax-Exempt Fund of California
| Bonds, notes & other debt instruments (continued) | | Principal amount
(000) | | | Value
(000) | |
| California (continued) | | | | | | | | |
| City, county & other issuers (continued) | | | | | | | | |
| City of Irvine, Reassessment Dist. No. 19-1, Limited Obligation Improvement Bonds, Series 2019, 5.00% 2034 | | $ | 1,155 | | | $ | 1,506 | |
| City of Irvine, Reassessment Dist. No. 19-1, Limited Obligation Improvement Bonds, Series 2019, 5.00% 2044 | | | 1,000 | | | | 1,262 | |
| Irvine Unified School Dist., Community Facs. Dist. No. 01-1, Special Tax Rev. Ref. Bonds, Series 2015, BAM insured, 5.00% 2031 | | | 2,000 | | | | 2,340 | |
| Irvine Unified School Dist., Community Facs. Dist. No. 09-1, Special Tax Bonds, Series 2017-A, BAM insured, 5.00% 2023 | | | 1,000 | | | | 1,125 | |
| Irvine Unified School Dist., Community Facs. Dist. No. 09-1, Special Tax Bonds, Series 2017-A, BAM insured, 5.00% 2024 | | | 2,000 | | | | 2,315 | |
| Irvine Unified School Dist., Community Facs. Dist. No. 09-1, Special Tax Bonds, Series 2017-A, BAM insured, 5.00% 2029 | | | 200 | | | | 246 | |
| Irvine Unified School Dist., Community Facs. Dist. No. 09-1, Special Tax Bonds, Series 2017-A, BAM insured, 5.00% 2030 | | | 370 | | | | 454 | |
| Irvine Unified School Dist., Community Facs. Dist. No. 09-1, Special Tax Bonds, Series 2017-A, BAM insured, 5.00% 2031 | | | 420 | | | | 513 | |
| Irvine Unified School Dist., Community Facs. Dist. No. 09-1, Special Tax Bonds, Series 2017-A, BAM insured, 5.00% 2032 | | | 450 | | | | 548 | |
| Irvine Unified School Dist., Community Facs. Dist. No. 09-1, Special Tax Bonds, Series 2017-B, BAM insured, 5.00% 2032 | | | 175 | | | | 213 | |
| Irvine Unified School Dist., Community Facs. Dist. No. 09-1, Special Tax Bonds, Series 2017-B, BAM insured, 5.00% 2033 | | | 245 | | | | 298 | |
| Irvine Unified School Dist., Community Facs. Dist. No. 09-1, Special Tax Bonds, Series 2017-B, BAM insured, 5.00% 2034 | | | 250 | | | | 303 | |
| Irvine Unified School Dist., Community Facs. Dist. No. 09-1, Special Tax Bonds, Series 2017-B, BAM insured, 5.00% 2035 | | | 250 | | | | 302 | |
| Irvine Unified School Dist., Community Facs. Dist. No. 09-1, Special Tax Bonds, Series 2017-B, BAM insured, 5.00% 2036 | | | 350 | | | | 422 | |
| Irvine Unified School Dist., Community Facs. Dist. No. 09-1, Special Tax Bonds, Series 2017-B, BAM insured, 5.00% 2037 | | | 270 | | | | 324 | |
| Irvine Unified School Dist., Community Facs. Dist. No. 09-1, Special Tax Bonds, Series 2017-B, BAM insured, 5.00% 2042 | | | 1,000 | | | | 1,190 | |
| Irvine Unified School Dist., Community Facs. Dist. No. 09-1, Special Tax Bonds, Series 2017-C, BAM insured, 4.00% 2053 | | | 1,250 | | | | 1,374 | |
| Irvine Unified School Dist., Community Facs. Dist. No. 09-1, Special Tax Bonds, Series 2017-C, BAM insured, 5.00% 2042 | | | 1,000 | | | | 1,190 | |
| Irvine Unified School Dist., Community Facs. Dist. No. 09-1, Special Tax Bonds, Series 2017-D, BAM insured, 5.00% 2057 | | | 1,665 | | | | 1,949 | |
| Irvine Unified School Dist., Community Facs. Dist. No. 09-1, Special Tax Bonds, Series 2018-A, BAM insured, 5.00% 2039 | | | 820 | | | | 981 | |
| Irvine Unified School Dist., Community Facs. Dist. No. 09-1, Special Tax Bonds, Series 2018-A, BAM insured, 5.00% 2040 | | | 810 | | | | 967 | |
| Irvine Unified School Dist., Community Facs. Dist. No. 09-1, Special Tax Bonds, Series 2018-A, BAM insured, 5.00% 2045 | | | 1,500 | | | | 1,780 | |
| Irvine Unified School Dist., Community Facs. Dist. No. 09-1, Special Tax Bonds, Series 2019-A, 4.00% 2038 | | | 550 | | | | 632 | |
| Irvine Unified School Dist., Community Facs. Dist. No. 09-1, Special Tax Bonds, Series 2019-A, 4.00% 2039 | | | 635 | | | | 728 | |
| Irvine Unified School Dist., Community Facs. Dist. No. 09-1, Special Tax Bonds, Series 2019-A, 5.00% 2032 | | | 365 | | | | 463 | |
| Irvine Unified School Dist., Community Facs. Dist. No. 09-1, Special Tax Bonds, Series 2019-A, 5.00% 2034 | | | 435 | | | | 549 | |
| Irvine Unified School Dist., Community Facs. Dist. No. 09-1, Special Tax Bonds, Series 2019-A, 5.00% 2035 | | | 250 | | | | 314 | |
| Irvine Unified School Dist., Community Facs. Dist. No. 09-1, Special Tax Bonds, Series 2019-A, 5.00% 2036 | | | 270 | | | | 338 | |
| Irvine Unified School Dist., Community Facs. Dist. No. 09-1, Special Tax Bonds, Series 2019-A, BAM insured, 4.00% 2044 | | | 1,200 | | | | 1,402 | |
| Irvine Unified School Dist., Community Facs. Dist. No. 09-1, Special Tax Bonds, Series 2019-A, BAM insured, 4.00% 2049 | | | 3,000 | | | | 3,479 | |
| Irvine Unified School Dist., Community Facs. Dist. No. 09-1, Special Tax Bonds, Series 2019-A, BAM insured, 4.00% 2054 | | | 6,670 | | | | 7,584 | |
| | |
| 64 | American Funds Tax-Exempt Funds |
The Tax-Exempt Fund of California
| | | Principal amount
(000) | | | Value
(000) | |
| City of Los Angeles, Dept. of Airports, Los Angeles International Airport, Rev. Bonds, Series 2010-B, 5.00% 2035 | | $ | 1,000 | | | $ | 1,012 | |
| City of Los Angeles, Dept. of Airports, Los Angeles International Airport, Rev. Bonds, Series 2015-A, AMT, 5.00% 2027 | | | 1,250 | | | | 1,491 | |
| City of Los Angeles, Dept. of Airports, Los Angeles International Airport, Rev. Bonds, Series 2015-A, AMT, 5.00% 2029 | | | 1,560 | | | | 1,852 | |
| City of Los Angeles, Dept. of Airports, Los Angeles International Airport, Rev. Bonds, Series 2016-A, AMT, 4.00% 2034 | | | 1,000 | | | | 1,131 | |
| City of Los Angeles, Dept. of Airports, Los Angeles International Airport, Rev. Bonds, Series 2016-A, AMT, 5.00% 2035 | | | 1,000 | | | | 1,205 | |
| City of Los Angeles, Dept. of Airports, Los Angeles International Airport, Rev. Bonds, Series 2016-A, AMT, 5.00% 2042 | | | 1,000 | | | | 1,188 | |
| City of Los Angeles, Dept. of Airports, Los Angeles International Airport, Rev. Bonds, Series 2016-B, AMT, 5.00% 2029 | | | 1,450 | | | | 1,772 | |
| City of Los Angeles, Dept. of Airports, Los Angeles International Airport, Rev. Bonds, Series 2016-B, AMT, 5.00% 2031 | | | 2,395 | | | | 2,909 | |
| City of Los Angeles, Dept. of Airports, Los Angeles International Airport, Rev. Bonds, Series 2016-B, AMT, 5.00% 2033 | | | 500 | | | | 605 | |
| City of Los Angeles, Dept. of Airports, Los Angeles International Airport, Rev. Bonds, Series 2017-A, AMT, 5.00% 2030 | | | 1,000 | | | | 1,248 | |
| City of Los Angeles, Dept. of Airports, Los Angeles International Airport, Rev. Bonds, Series 2017-A, AMT, 5.00% 2032 | | | 1,000 | | | | 1,240 | |
| City of Los Angeles, Dept. of Airports, Los Angeles International Airport, Rev. Bonds, Series 2017-A, AMT, 5.00% 2033 | | | 1,000 | | | | 1,237 | |
| City of Los Angeles, Dept. of Airports, Los Angeles International Airport, Rev. Bonds, Series 2017-A, AMT, 5.00% 2034 | | | 1,250 | | | | 1,544 | |
| City of Los Angeles, Dept. of Airports, Los Angeles International Airport, Rev. Bonds, Series 2017-A, AMT, 5.00% 2035 | | | 1,000 | | | | 1,233 | |
| City of Los Angeles, Dept. of Airports, Los Angeles International Airport, Rev. Bonds, Series 2017-A, AMT, 5.00% 2036 | | | 1,400 | | | | 1,721 | |
| City of Los Angeles, Dept. of Airports, Los Angeles International Airport, Rev. Bonds, Series 2017-A, AMT, 5.00% 2037 | | | 1,260 | | | | 1,545 | |
| City of Los Angeles, Dept. of Airports, Los Angeles International Airport, Rev. Bonds, Series 2018-A, AMT, 5.00% 2033 | | | 1,255 | | | | 1,580 | |
| City of Los Angeles, Dept. of Airports, Los Angeles International Airport, Rev. Bonds, Series 2018-A, AMT, 5.00% 2036 | | | 1,345 | | | | 1,682 | |
| City of Los Angeles, Dept. of Airports, Los Angeles International Airport, Rev. Bonds, Series 2018-A, AMT, 5.00% 2037 | | | 1,450 | | | | 1,808 | |
| City of Los Angeles, Dept. of Airports, Los Angeles International Airport, Rev. Bonds, Series 2018-A, AMT, 5.00% 2044 | | | 2,880 | | | | 3,529 | |
| City of Los Angeles, Dept. of Airports, Los Angeles International Airport, Rev. Bonds, Series 2018-B, AMT, 5.00% 2032 | | | 5,000 | | | | 6,325 | |
| City of Los Angeles, Dept. of Airports, Los Angeles International Airport, Rev. Bonds, Series 2018-C, AMT, 5.00% 2032 | | | 3,450 | | | | 4,333 | |
| City of Los Angeles, Dept. of Airports, Los Angeles International Airport, Rev. Bonds, Series 2018-D, AMT, 5.00% 2033 | | | 5,880 | | | | 7,562 | |
| City of Los Angeles, Dept. of Airports, Los Angeles International Airport, Rev. Bonds, Series 2019-A, AMT, 5.00% 2031 | | | 2,345 | | | | 3,036 | |
| City of Los Angeles, Dept. of Airports, Los Angeles International Airport, Rev. Ref. Bonds, Series 2010-A, 5.00% 2029 | | | 2,000 | | | | 2,024 | |
| City of Los Angeles, Dept. of Water and Power, Power System Rev. Bonds, Series 2019-A, 5.00% 2045 | | | 2,000 | | | | 2,535 | |
| City of Los Angeles, Dept. of Water and Power, Power System Rev. Bonds, Series 2019-A, 5.00% 2049 | | | 5,000 | | | | 6,300 | |
| Oakland Unified School Dist., G.O. Bonds, 2006 Election, Series 2016-A, 5.00% 2026 | | | 6,250 | | | | 7,797 | |
| Oakland Unified School Dist., G.O. Bonds, 2012 Election, Series 2013, 6.625% 2038 (preref. 2021) | | | 1,200 | | | | 1,306 | |
| Oakland Unified School Dist., G.O. Bonds, 2012 Election, Series 2015-A, 5.00% 2030 | | | 1,250 | | | | 1,495 | |
| Oakland Unified School Dist., G.O. Bonds, 2012 Election, Series 2015-A, 5.00% 2031 | | | 1,500 | | | | 1,789 | |
| Oakland Unified School Dist., G.O. Bonds, 2012 Election, Series 2015-A, 5.00% 2040 | | | 5,550 | | | | 6,510 | |
| Oakland Unified School Dist., G.O. Bonds, 2012 Election, Series 2019-A, Assured Guaranty Municipal insured, 3.00% 2040 | | | 6,000 | | | | 6,242 | |
| Oakland Unified School Dist., G.O. Bonds, 2012 Election, Series 2019-A, Assured Guaranty Municipal insured, 5.00% 2027 | | | 1,340 | | | | 1,721 | |
| | |
| American Funds Tax-Exempt Funds | 65 |
The Tax-Exempt Fund of California
| Bonds, notes & other debt instruments (continued) | | Principal amount
(000) | | | Value
(000) | |
| California (continued) | | | | | | | | |
| City, county & other issuers (continued) | | | | | | | | |
| Oakland Unified School Dist., G.O. Rev. Ref. Bonds (Measure J), Series 2017-C, 5.00% 2031 | | $ | 2,015 | | | $ | 2,527 | |
| Oakland Unified School Dist., G.O. Rev. Ref. Bonds (Measure J), Series 2017-C, 5.00% 2035 | | | 3,245 | | | | 4,013 | |
| Oakland Unified School Dist., G.O. Rev. Ref. Bonds (Measure J), Series 2017-C, 5.00% 2036 | | | 2,000 | | | | 2,464 | |
| Oakland Unified School Dist., G.O. Rev. Ref. Bonds, 2012 Election, Series 2019-A, Assured Guaranty Municipal insured, 4.00% 2035 | | | 1,000 | | | | 1,162 | |
| Oakland Unified School Dist., G.O. Rev. Ref. Bonds, Series 2015, Assured Guaranty Municipal insured, 5.00% 2024 | | | 2,225 | | | | 2,629 | |
| Oakland Unified School Dist., G.O. Rev. Ref. Bonds, Series 2016, 5.00% 2027 | | | 2,000 | | | | 2,483 | |
| Oakland Unified School Dist., G.O. Rev. Ref. Bonds, Series 2016, 5.00% 2031 | | | 2,145 | | | | 2,622 | |
| City of Oroville, Hospital Rev. Bonds (Oroville Hospital), Series 2019, 5.25% 2049 | | | 7,210 | | | | 8,654 | |
| Peninsula Corridor Joint Powers Board, Farebox Rev. Bonds, Series 2019-A, 5.00% 2049 | | | 9,035 | | | | 10,687 | |
| County of Sacramento, Sanitation Dist. Fncg. Auth., Rev. Ref. Bonds (Sacramento Regional County Sanitation Dist.), Series 2007-B, FGIC-National insured, (3-month USD-LIBOR + 0.53%) 1.812% 20351 | | | 13,500 | | | | 13,056 | |
| City of San Buenaventura, Rev. Bonds (Community Memorial Health System), Series 2011, 7.50% 2041 | | | 10,825 | | | | 11,891 | |
| County of San Diego, Regional Airport Auth., Airport Rev. and Rev. Ref. Bonds, Series 2019-A, 4.00% 2037 | | | 1,000 | | | | 1,201 | |
| County of San Diego, Regional Airport Auth., Airport Rev. and Rev. Ref. Bonds, Series 2019-A, 5.00% 2049 | | | 2,000 | | | | 2,539 | |
| County of San Diego, Regional Airport Auth., Airport Rev. Bonds, Series 2010-A, 5.00% 2028 | | | 1,000 | | | | 1,018 | |
| County of San Diego, Regional Airport Auth., Airport Rev. Bonds, Series 2013-B, AMT, 5.00% 2043 | | | 2,000 | | | | 2,226 | |
| County of San Diego, Regional Airport Auth., Airport Rev. Bonds, Series 2017-A, 5.00% 2035 | | | 1,000 | | | | 1,260 | |
| County of San Diego, Regional Airport Auth., Airport Rev. Bonds, Series 2017-B, AMT, 5.00% 2047 | | | 1,000 | | | | 1,202 | |
| County of San Diego, Regional Airport Auth., Airport Rev. Bonds, Series 2017-B, AMT, 5.00% 2029 | | | 1,980 | | | | 2,475 | |
| County of San Diego, Regional Airport Auth., Airport Rev. Bonds, Series 2017-B, AMT, 5.00% 2035 | | | 2,495 | | | | 3,066 | |
| County of San Diego, Regional Airport Auth., Airport Rev. Bonds, Series 2017-B, AMT, 5.00% 2036 | | | 750 | | | | 919 | |
| County of San Diego, Regional Airport Auth., Airport Rev. Bonds, Series 2017-B, AMT, 5.00% 2037 | | | 750 | | | | 917 | |
| County of San Diego, Regional Airport Auth., Airport Rev. Bonds, Series 2017-B, AMT, 5.00% 2042 | | | 1,500 | | | | 1,816 | |
| County of San Diego, Regional Airport Auth., Airport Rev. Bonds, Series 2019-B, AMT, 5.00% 2026 | | | 760 | | | | 937 | |
| County of San Diego, Regional Airport Auth., Airport Rev. Bonds, Series 2019-B, AMT, 5.00% 2027 | | | 750 | | | | 946 | |
| County of San Diego, Regional Airport Auth., Airport Rev. Bonds, Series 2019-B, AMT, 5.00% 2028 | | | 1,000 | | | | 1,286 | |
| County of San Diego, Regional Airport Auth., Airport Rev. Bonds, Series 2019-B, AMT, 5.00% 2029 | | | 1,255 | | | | 1,644 | |
| County of San Diego, Regional Airport Auth., Airport Rev. Bonds, Series 2019-B, AMT, 5.00% 2030 | | | 1,785 | | | | 2,325 | |
| County of San Diego, Regional Airport Auth., Airport Rev. Bonds, Series 2019-B, AMT, 5.00% 2049 | | | 7,750 | | | | 9,634 | |
| City and County of San Francisco, Airport Commission, San Francisco International Airport, Second Series Rev. Bonds, Series 2010-F, 5.00% 2040 | | | 2,995 | | | | 3,024 | |
| City and County of San Francisco, Airport Commission, San Francisco International Airport, Second Series Rev. Bonds, Series 2010-F, 5.00% 2040 (preref. 2020) | | | 5 | | | | 5 | |
| City and County of San Francisco, Airport Commission, San Francisco International Airport, Second Series Rev. Bonds, Series 2016-B, AMT, 5.00% 2046 | | | 4,000 | | | | 4,746 | |
| City and County of San Francisco, Airport Commission, San Francisco International Airport, Second Series Rev. Bonds, Series 2019-A, AMT, 5.00% 2049 | | | 10,000 | | | | 12,366 | |
| City and County of San Francisco, Airport Commission, San Francisco International Airport, Second Series Rev. Bonds, Series 2019-E, AMT, 4.00% 2050 | | | 2,000 | | | | 2,258 | |
| City and County of San Francisco, Airport Commission, San Francisco International Airport, Second Series Rev. Bonds, Series 2019-E, AMT, 5.00% 2036 | | | 2,250 | | | | 2,865 | |
| | |
| 66 | American Funds Tax-Exempt Funds |
The Tax-Exempt Fund of California
| | | Principal amount
(000) | | | Value
(000) | |
| City and County of San Francisco, Airport Commission, San Francisco International Airport, Second Series Rev. Bonds, Series 2019-E, AMT, 5.00% 2050 | | $ | 3,500 | | | $ | 4,322 | |
| City and County of San Francisco, Airport Commission, San Francisco International Airport, Second Series Rev. Bonds, Series 2019-F, 5.00% 2050 | | | 2,000 | | | | 2,514 | |
| City and County of San Francisco, Airport Commission, San Francisco International Airport, Second Series Rev. Bonds, Series 2019-H, AMT, 5.00% 2026 | | | 5,545 | | | | 6,825 | |
| City and County of San Francisco, Airport Commission, San Francisco International Airport, Second Series Rev. Ref. Bonds, Series 2011-F, AMT, 5.00% 2028 | | | 2,630 | | | | 2,762 | |
| City and County of San Francisco, Airport Commission, San Francisco International Airport, Second Series Rev. Ref. Bonds, Series 2012-A, AMT, 5.00% 2028 | | | 1,000 | | | | 1,090 | |
| City and County of San Francisco, Airport Commission, San Francisco International Airport, Second Series Rev. Ref. Bonds, Series 2012-A, AMT, 5.00% 2030 | | | 1,000 | | | | 1,087 | |
| City and County of San Francisco, Airport Commission, San Francisco International Airport, Second Series Rev. Ref. Bonds, Series 2016-A, 5.00% 2029 | | | 1,375 | | | | 1,709 | |
| City and County of San Francisco, Airport Commission, San Francisco International Airport, Second Series Rev. Ref. Bonds, Series 2017-A, AMT, 5.00% 2042 | | | 2,000 | | | | 2,410 | |
| City and County of San Francisco, Airport Commission, San Francisco International Airport, Second Series Rev. Ref. Bonds, Series 2017-A, AMT, 5.00% 2047 | | | 3,000 | | | | 3,588 | |
| City and County of San Francisco, Airport Commission, San Francisco International Airport, Second Series Rev. Ref. Bonds, Series 2017-D, AMT, 5.00% 2027 | | | 1,000 | | | | 1,259 | |
| City and County of San Francisco, Airport Commission, San Francisco International Airport, Second Series Rev. Ref. Bonds, Series 2019-A, AMT, 5.00% 2036 | | | 4,230 | | | | 5,386 | |
| City and County of San Francisco, Airport Commission, San Francisco International Airport, Second Series Rev. Ref. Bonds, Series 2019-A, AMT, 5.00% 2044 | | | 3,500 | | | | 4,359 | |
| City and County of San Francisco, Airport Commission, San Francisco International Airport, Second Series Rev. Ref. Bonds, Series 2019-H, AMT, 5.00% 2025 | | | 3,995 | | | | 4,784 | |
| City and County of San Francisco, Airport Commission, San Francisco International Airport, Special Facs. Lease Rev. Bonds (SFO Fuel Co. LLC), Series 2019-A, AMT, 5.00% 2027 | | | 2,000 | | | | 2,495 | |
| City of San Jose, Airport Rev. Ref. Bonds, Series 2011-A-1, AMT, 5.50% 2030 | | | 8,000 | | | | 8,379 | |
| City of San Jose, Airport Rev. Ref. Bonds, Series 2011-A-2, 5.25% 2034 | | | 4,900 | | | | 5,119 | |
| City of San Jose, Airport Rev. Ref. Bonds, Series 2017-A, AMT, 5.00% 2020 | | | 2,080 | | | | 2,086 | |
| City of San Jose, Airport Rev. Ref. Bonds, Series 2017-A, AMT, 5.00% 2035 | | | 2,000 | | | | 2,433 | |
| City of San Jose, Airport Rev. Ref. Bonds, Series 2017-A, AMT, 5.00% 2037 | | | 1,000 | | | | 1,211 | |
| City of San Jose, Airport Rev. Ref. Bonds, Series 2017-A, AMT, 5.00% 2041 | | | 1,500 | | | | 1,800 | |
| City of San Jose, Airport Rev. Ref. Bonds, Series 2017-A, AMT, 5.00% 2047 | | | 10,000 | | | | 11,897 | |
| Stockton Unified School Dist., G.O. Rev. Ref. Bonds, Series 2016, 5.00% 2031 | | | 7,800 | | | | 9,417 | |
| City of Whittier, Health Fac. Rev. Bonds (PIH Health), Series 2014, 5.00% 2044 | | | 10,000 | | | | 11,163 | |
| Other securities | | | | | | | 1,086,416 | |
| | | | | | | | 1,598,184 | |
| | | | | | | | | |
| Guam 0.47% | | | | | | | | |
| Other securities | | | | | | | 13,564 | |
| | | | | | | | | |
| Puerto Rico 0.80% | | | | | | | | |
| Industrial, Tourist, Educational, Medical and Environmental Control Facs. Fncg. Auth., Hospital Rev. and Rev. Ref. Bonds (Hospital Auxilio Mutuo Obligated Group Project), Series 2011-A, 6.00% 2033 | | | 7,900 | | | | 8,240 | |
| Other securities | | | | | | | 14,541 | |
| | | | | | | | 22,781 | |
| | | | | | | | | |
| United States 0.67% | | | | | | | | |
| Freddie Mac, Multi Family Mortgage Bonds, Series 2019-ML-05, Class CA, 3.35% 2033 | | | 15,420 | | | | 17,009 | |
| Other securities | | | | | | | 2,162 | |
| | | | | | | | 19,171 | |
| | | | | | | | | |
| Total bonds, notes & other debt instruments(cost: $2,450,656,000) | | | | | | | 2,619,125 | |
| | |
| American Funds Tax-Exempt Funds | 67 |
The Tax-Exempt Fund of California
| Short-term securities 7.74% | | Principal amount
(000) | | | Value
(000) | |
| Fin. Auth., Recovery Zone Fac. Bonds (Chevron U.S.A. Inc. Project), Series 2010-A, 1.16% 20351 | | $ | 32,765 | | | $ | 32,765 | |
| G.O. Bonds, Series 2004-B-6, 1.07% 20341 | | | 2,000 | | | | 2,000 | |
| City of Los Angeles, Dept. of Water and Power, Power System Demand Rev. Bonds, Series 2002-A-1, 1.12% 20351 | | | 9,335 | | | | 9,335 | |
| City of Los Angeles, Dept. of Water and Power, Power System Demand Rev. Bonds, Series 2002-A-6, 1.16% 20351 | | | 2,000 | | | | 2,000 | |
| City of Los Angeles, Dept. of Water and Power, Power System Demand Rev. Bonds, Series 2002-A-7, 1.16% 20351 | | | 8,000 | | | | 8,000 | |
| City of Los Angeles, Dept. of Water and Power, Water System Bonds, Series 2019-A, 1.15% 20491 | | | 16,000 | | | | 16,000 | |
| County of Los Angeles, Tax and Rev. Anticipation Notes, Series 2019, 5.00% 6/30/2020 | | | 18,600 | | | | 18,919 | |
| Metropolitan Water Dist. of Southern California, Water Rev. Ref. Bonds, Series 2000-B-3, 1.16% 20351 | | | 3,000 | | | | 3,000 | |
| Metropolitan Water Dist. of Southern California, Water Rev. Ref. Bonds, Series 2016-B-1, 1.12% 20371 | | | 18,165 | | | | 18,165 | |
| Metropolitan Water Dist. of Southern California, Water Rev. Ref. Bonds, Series 2016-B-2, 1.12% 20371 | | | 21,210 | | | | 21,210 | |
| Municipal Fin. Auth., Exempt Facs. Rev. Ref. Bonds (ExxonMobil Project), Series 2007, AMT, 1.19% 20291 | | | 2,960 | | | | 2,960 | |
| Municipal Fin. Auth., Pollution Control Rev. Ref. Bonds (Chevron U.S.A. Inc. Project), Series 2005, 1.16% 20251 | | | 7,650 | | | | 7,650 | |
| Statewide Communities Dev. Auth., Pollution Control Rev. Ref. Bonds (Chevron U.S.A. Inc. Project), Series 2002, 1.16% 20241 | | | 12,035 | | | | 12,035 | |
| City of Stockton, Public Fncg. Auth., Wastewater Bond Anticipation Notes, Series 2019, 1.40% 2022 | | | 9,750 | | | | 9,774 | |
| Regents of the University of California, General Rev. Bonds, Series 2013-AL-1, 1.12% 20481 | | | 12,880 | | | | 12,880 | |
| Regents of the University of California, IAM Commercial Paper, Series 2020-A, 0.82% 5/11/2020 | | | 3,000 | | | | 3,000 | |
| Regents of the University of California, IAM Commercial Paper, Series 2020-A, 1.12% 2/20/2020 | | | 2,600 | | | | 2,600 | |
| Regents of the University of California, IAM Commercial Paper, Series 2020-A, 1.12% 2/20/2020 | | | 2,250 | | | | 2,250 | |
| Dept. of Water Resources, Water System Rev. IAM Commercial Paper, Series 2020-1, 0.77% 2/19/2020 | | | 6,000 | | | | 6,000 | |
| Dept. of Water Resources, Water System Rev. IAM Commercial Paper, Series 2020-2, 0.80% 2/28/2020 | | | 15,000 | | | | 15,000 | |
| Dept. of Water Resources, Water System Rev. IAM Commercial Paper, Series 2020-2, 0.80% 3/4/2020 | | | 2,000 | | | | 2,000 | |
| Other securities | | | | | | | 14,192 | |
| | | | | | | | | |
| Total short-term securities (cost: $221,583,000) | | | | | | | 221,735 | |
| Total investment securities 99.21% (cost: $2,672,239,000) | | | | | | | 2,840,860 | |
| Other assets less liabilities 0.79% | | | | | | | 22,560 | |
| | | | | | | | | |
| Net assets 100.00% | | | | | | $ | 2,863,420 | |
This summary investment portfolio is designed to streamline the report and help investors better focus on the fund’s principal holdings. See the inside back cover for details on how to obtain a complete schedule of portfolio holdings.
“Other securities” includes all issues that are not disclosed separately in the summary investment portfolio.
| 68 | American Funds Tax-Exempt Funds |
The Tax-Exempt Fund of California
Futures contracts
| Contracts | | Type | | Number of
contracts | | Expiration | | Notional
amount
(000) | 3 | | Value at
1/31/2020
(000) | 4 | Unrealized
appreciation
(depreciation)
at 1/31/2020
(000) | |
| 2 Year U.S. Treasury Note Futures | | Long | | 175 | | April 2020 | | $ | 35,000 | | | $ | 37,863 | | | $ | 137 | |
| 5 Year U.S. Treasury Note Futures | | Long | | 1,575 | | April 2020 | | | 157,500 | | | | 189,505 | | | | 1,909 | |
| 10 Year Ultra U.S. Treasury Note Futures | | Short | | 111 | | March 2020 | | | (11,100 | ) | | | (16,168 | ) | | | (387 | ) |
| | | | | | | | | | | | | | | | | $ | 1,659 | |
| | |
| 1 | Coupon rate may change periodically. Reference rate and spread are as of the most recent information available. Some coupon rates are determined by the issuer or agent based on current market conditions; therefore, the reference rate and spread are not available. For short-term securities, the date of the next scheduled coupon rate change is considered to be the maturity date. |
| 2 | Acquired in a transaction exempt from registration under Rule 144A of the Securities Act of 1933. May be resold in the U.S. in transactions exempt from registration, normally to qualified institutional buyers. The total value of all such securities was $113,830,000, which represented 3.98% of the net assets of the fund. |
| 3 | Notional amount is calculated based on the number of contracts and notional contract size. |
| 4 | Value is calculated based on the notional amount and current market price. |
Key to abbreviations and symbol
Agcy. = Agency
AMT = Alternative Minimum Tax
Auth. = Authority
Certs. of Part. = Certificates of Participation
Dept. = Department
Dev. = Development
Dist. = District
Econ. = Economic
Fac. = Facility
Facs. = Facilities
Fin. = Finance
Fncg. = Financing
G.O. = General Obligation
IAM = Interest at Maturity
LIBOR = London Interbank Offered Rate
LOC = Letter of Credit
Preref. = Prerefunded
Redev. = Redevelopment
Ref. = Refunding
Rev. = Revenue
SIFMA = Securities Industry and Financial Markets Association
USD/$ = U.S. dollars
See notes to financial statements.
| American Funds Tax-Exempt Funds | 69 |
| American Funds Tax-Exempt Fund of New York | unaudited |
| Summary investment portfolioJanuary 31, 2020 | |
| | |
| Portfolio quality summary* | Percent of net assets |

| * | Bond ratings, which typically range from AAA/Aaa (highest) to D (lowest), are assigned by credit rating agencies such as Standard & Poor’s, Moody’s and/or Fitch as an indication of an issuer’s creditworthiness. In assigning a credit rating to a security, the fund looks specifically to the ratings assigned to the issuer of the security by Standard & Poor’s, Moody’s and/or Fitch. If agency ratings differ, the security will be considered to have received the highest of those ratings, consistent with the fund’s investment policies. |
| | |
| Bonds, notes & other debt instruments 96.66% | | Principal amount
(000) | | | Value
(000) | |
| New York 93.48% | | | | | | | | |
| State issuers 47.86% | | | | | | | | |
| Convention Center Dev. Corp., Rev. Bonds (Hotel Unit Fee Secured), Capital Appreciation Bonds, Series 2016-B, 0% 2048 | | $ | 3,540 | | | $ | 1,567 | |
| Dormitory Auth., Lease Rev. Bonds (State University of New York Dormitory Facs.), Series 2010-A, 5.00% 2035 | | | 1,000 | | | | 1,018 | |
| Dormitory Auth., Rev. Bonds (Catholic Health System Obligated Group), Series 2019-A, 4.00% 2037 | | | 1,000 | | | | 1,146 | |
| Dormitory Auth., Rev. Bonds (Culinary Institute of America), Series 2013, 5.50% 2033 | | | 500 | | | | 568 | |
| Dormitory Auth., Rev. Bonds (Fordham University), Series 2011-A, 5.50% 2036 (preref. 2021) | | | 1,000 | | | | 1,067 | |
| Dormitory Auth., Rev. Bonds (Fordham University), Series 2017, 4.00% 2034 | | | 885 | | | | 1,028 | |
| Dormitory Auth., Rev. Bonds (Icahn School of Medicine at Mount Sinai), Series 2015-A, 5.00% 2031 | | | 500 | | | | 591 | |
| Dormitory Auth., Rev. Bonds (Icahn School of Medicine at Mount Sinai), Series 2015-A, 5.00% 2035 | | | 1,000 | | | | 1,172 | |
| Dormitory Auth., Rev. Bonds (Icahn School of Medicine at Mount Sinai), Series 2015-A, 5.00% 2040 | | | 250 | | | | 289 | |
| Dormitory Auth., Rev. Bonds (Langone Hospitals Obligated Group), Series 2020-A, 4.00% 2053 | | | 1,250 | | | | 1,442 | |
| Dormitory Auth., Rev. Bonds (Memorial Sloan-Kettering Cancer Center), Series 2017-1, 5.00% 2027 | | | 750 | | | | 966 | |
| Dormitory Auth., Rev. Bonds (Montefiore Obligated Group), Series 2018-A, 5.00% 2030 | | | 785 | | | | 985 | |
| Dormitory Auth., Rev. Bonds (Montefiore Obligated Group), Series 2018-A, 5.00% 2031 | | | 500 | | | | 624 | |
| Dormitory Auth., Rev. Bonds (New School), Series 2015-A, 5.00% 2032 | | | 1,000 | | | | 1,195 | |
| Dormitory Auth., Rev. Bonds (New School), Series 2016-A, 5.00% 2035 | | | 500 | | | | 604 | |
| Dormitory Auth., Rev. Bonds (New York University), Series 2018-A, 5.00% 2032 | | | 500 | | | | 648 | |
| Dormitory Auth., Rev. Bonds (New York University), Series 2019-A, 5.00% 2049 | | | 1,500 | | | | 1,904 | |
| Dormitory Auth., Rev. Bonds (North Shore-Long Island Jewish Obligated Group), Series 2011-A, 5.00% 2032 (preref. 2021) | | | 1,500 | | | | 1,577 | |
| Dormitory Auth., Rev. Bonds (Northwell Health Obligated Group), Series 2019-B-3, 5.00% 2048 (put 2026) | | | 1,000 | | | | 1,203 | |
| Dormitory Auth., Rev. Bonds (NYU Hospitals Center), Series 2011-A, 6.00% 2040 (preref. 2020) | | | 1,000 | | | | 1,021 | |
| Dormitory Auth., Rev. Bonds (NYU Hospitals Center), Series 2014, 5.00% 2022 | | | 200 | | | | 220 | |
| Dormitory Auth., Rev. Bonds (NYU Hospitals Center), Series 2014, 5.00% 2034 | | | 1,000 | | | | 1,159 | |
| Dormitory Auth., Rev. Bonds (NYU Hospitals Center), Series 2016-A, 5.00% 2033 | | | 400 | | | | 484 | |
| Dormitory Auth., Rev. Bonds (Orange Regional Medical Center Obligated Group), Series 2015, 5.00% 20321 | | | 600 | | | | 692 | |
| Dormitory Auth., Rev. Bonds (Orange Regional Medical Center Obligated Group), Series 2015, 5.00% 20401 | | | 1,000 | | | | 1,140 | |
| Dormitory Auth., Rev. Bonds (Orange Regional Medical Center Obligated Group), Series 2017, 5.00% 20311 | | | 1,000 | | | | 1,203 | |
| | |
| 70 | American Funds Tax-Exempt Funds |
American Funds Tax-Exempt Fund of New York
| | | Principal amount
(000) | | | Value
(000) | |
| Dormitory Auth., Rev. Bonds (Orange Regional Medical Center Obligated Group), Series 2017, 5.00% 20351 | | $ | 1,000 | | | $ | 1,192 | |
| Dormitory Auth., Rev. Bonds (Skidmore College), Series 2011-A, 5.50% 2041 | | | 1,110 | | | | 1,180 | |
| Dormitory Auth., Rev. Bonds (State University of New York Dormitory Facs.), Series 2017-A, 5.00% 2030 | | | 750 | | | | 947 | |
| Dormitory Auth., Rev. Bonds (State University of New York Dormitory Facs.), Series 2017-A, 5.00% 2032 | | | 500 | | | | 627 | |
| Dormitory Auth., Rev. Bonds (State University of New York Dormitory Facs.), Series 2019-A, 4.00% 2049 | | | 1,000 | | | | 1,141 | |
| Dormitory Auth., Rev. Bonds (Touro College and University System Obligated Group), Series 2014-A, 5.50% 2039 | | | 1,000 | | | | 1,134 | |
| Dormitory Auth., Rev. Bonds (Touro College and University System Obligated Group), Series 2017, 5.00% 2038 | | | 500 | | | | 581 | |
| Dormitory Auth., Rev. Ref. Bonds (Mount Sinai School of Medicine of New York University), Series 2010-A, 5.00% 2021 | | | 1,000 | | | | 1,016 | |
| Dormitory Auth., School Dist. Rev. Bond Fncg. Program Rev. Bonds, Series 2011-A, 5.00% 2024 | | | 25 | | | | 27 | |
| Dormitory Auth., School Dist. Rev. Bond Fncg. Program Rev. Bonds, Series 2011-A, 5.00% 2024 (preref. 2021) | | | 475 | | | | 508 | |
| Dormitory Auth., School Dist. Rev. Bond Fncg. Program Rev. Bonds, Series 2013-E, Assured Guaranty Municipal insured, 5.00% 2022 | | | 1,000 | | | | 1,112 | |
| Dormitory Auth., State Personal Income Tax Rev. Bonds (Education), Series 2014-E, 5.00% 2032 | | | 750 | | | | 888 | |
| Dormitory Auth., State Personal Income Tax Rev. Bonds (General Purpose), Series 2015-E, 5.00% 2020 | | | 35 | | | | 35 | |
| Dormitory Auth., State Personal Income Tax Rev. Bonds (General Purpose), Series 2017-B, 5.00% 2041 | | | 750 | | | | 921 | |
| Dormitory Auth., State Personal Income Tax Rev. Bonds (General Purpose), Series 2017-B, 5.00% 2042 | | | 1,130 | | | | 1,383 | |
| Dormitory Auth., State Personal Income Tax Rev. Bonds (General Purpose), Series 2018-A, 5.25% 2037 | | | 1,000 | | | | 1,290 | |
| Dormitory Auth., State Personal Income Tax Rev. Bonds (General Purpose), Series 2019-A, 5.00% 2028 | | | 1,000 | | | | 1,304 | |
| Dormitory Auth., State Personal Income Tax Rev. Bonds (General Purpose), Series 2019-A, 5.00% 2040 | | | 1,865 | | | | 2,362 | |
| Dormitory Auth., State Personal Income Tax Rev. Bonds (General Purpose), Series 2019-A, 5.00% 2044 | | | 1,000 | | | | 1,254 | |
| Dormitory Auth., State Personal Income Tax Rev. Bonds (General Purpose), Series 2019-A, 5.00% 2047 | | | 1,500 | | | | 1,870 | |
| Dormitory Auth., State Personal Income Tax Rev. Bonds (General Purpose), Series 2019-D, 4.00% 2038 | | | 1,500 | | | | 1,778 | |
| Dormitory Auth., State Sales Tax Rev. Bonds, Series 2013-A, 5.00% 2020 | | | 520 | | | | 523 | |
| Dormitory Auth., State Sales Tax Rev. Bonds, Series 2013-A, 5.00% 2020 (escrowed to maturity) | | | 480 | | | | 482 | |
| Dormitory Auth., State Sales Tax Rev. Bonds, Series 2017-B, 5.00% 2033 | | | 1,000 | | | | 1,247 | |
| Dormitory Auth., State Sales Tax Rev. Bonds, Series 2018-A, 5.00% 2039 | | | 1,650 | | | | 2,062 | |
| Dormitory Auth., State Sales Tax Rev. Bonds, Series 2018-E, 5.00% 2048 | | | 1,500 | | | | 1,864 | |
| Environmental Facs. Corp., Rev. Green Bonds (Revolving Funds), Series 2016-B, 4.00% 2036 | | | 1,950 | | | | 2,240 | |
| Environmental Facs. Corp., Solid Waste Disposal Rev. Bonds (Casella Waste Systems, Inc. Project), Series 2014-R-2, AMT, 3.125% 2044 (put 2026)1 | | | 500 | | | | 520 | |
| Environmental Facs. Corp., Solid Waste Disposal Rev. Bonds (Casella Waste Systems, Inc. Project), Series 2017, AMT, 3.75% 20441 | | | 1,000 | | | | 1,024 | |
| Liberty Dev. Corp., Liberty Rev. Bonds (Goldman Sachs Headquarters Issue), Series 2005, 5.25% 2035 | | | 1,250 | | | | 1,763 | |
| Liberty Dev. Corp., Liberty Rev. Ref. Bonds (3 World Trade Center Project), Series 2014, Class 2, 5.15% 20341 | | | 1,250 | | | | 1,410 | |
| Liberty Dev. Corp., Liberty Rev. Ref. Bonds (3 World Trade Center Project), Series 2014, Class 2, 5.375% 20401 | | | 350 | | | | 397 | |
| Liberty Dev. Corp., Liberty Rev. Ref. Bonds (3 World Trade Center Project), Series 2014, Class 3, 7.25% 20441 | | | 375 | | | | 447 | |
| Liberty Dev. Corp., Liberty Rev. Ref. Bonds (4 World Trade Center Project), Series 2011, 5.00% 2031 | | | 1,500 | | | | 1,606 | |
| | |
| American Funds Tax-Exempt Funds | 71 |
American Funds Tax-Exempt Fund of New York
| Bonds, notes & other debt instruments(continued) | | Principal amount
(000) | | | Value
(000) | |
| New York (continued) | | | | | | | | |
| State issuers (continued) | | | | | | | | |
| Long Island Power Auth., Electric System General Rev. Bonds, Series 2011-A, 5.00% 2038 (preref. 2021) | | $ | 510 | | | $ | 537 | |
| Long Island Power Auth., Electric System General Rev. Bonds, Series 2015-B, 5.00% 2035 | | | 1,215 | | | | 1,439 | |
| Long Island Power Auth., Electric System General Rev. Bonds, Series 2015-B, 5.00% 2038 | | | 750 | | | | 883 | |
| Long Island Power Auth., Electric System General Rev. Bonds, Series 2015-C, (1-month USD-LIBOR x 0.70 + 0.75%) 1.996% 2033 (put 2023)2 | | | 1,500 | | | | 1,513 | |
| Long Island Power Auth., Electric System General Rev. Bonds, Series 2017, 5.00% 2035 | | | 1,000 | | | | 1,239 | |
| Long Island Power Auth., Electric System General Rev. Bonds, Series 2017, 5.00% 2047 | | | 3,225 | | | | 3,896 | |
| Long Island Power Auth., Electric System General Rev. Bonds, Series 2018, 5.00% 2036 | | | 500 | | | | 628 | |
| Metropolitan Transportation Auth., Dedicated Tax Fund Rev. Ref. Bonds, Series 2002-B-3D, (SIFMA Municipal Swap Index + 1.00%) 1.94% 20202 | | | 2,000 | | | | 2,010 | |
| Metropolitan Transportation Auth., Transportation Rev. Bonds, Series 2014-D-1, 5.00% 2039 | | | 250 | | | | 288 | |
| Metropolitan Transportation Auth., Transportation Rev. Bonds, Series 2015-A-2, (SIFMA Municipal Swap Index + 0.58%) 1.52% 2039 (put 2020)2 | | | 500 | | | | 500 | |
| Metropolitan Transportation Auth., Transportation Rev. Bonds, Series 2015-C-1, 5.00% 2035 | | | 1,750 | | | | 2,087 | |
| Metropolitan Transportation Auth., Transportation Rev. Bonds, Series 2015-C-1, 5.25% 2030 | | | 280 | | | | 342 | |
| Metropolitan Transportation Auth., Transportation Rev. Green Bonds, Series 2016-A-2, 5.00% 2026 | | | 560 | | | | 699 | |
| Metropolitan Transportation Auth., Transportation Rev. Green Bonds, Series 2017-A-1, 5.00% 2027 | | | 700 | | | | 892 | |
| Metropolitan Transportation Auth., Transportation Rev. Green Bonds, Series 2017-A-1, 5.25% 2057 | | | 750 | | | | 908 | |
| Metropolitan Transportation Auth., Transportation Rev. Green Bonds, Series 2019-B, 5.00% 2052 | | | 1,000 | | | | 1,224 | |
| Metropolitan Transportation Auth., Transportation Rev. Ref. Bonds, Series 2002-D-2A, Assured Guaranty Municipal insured, (1-month USD-LIBOR x 0.69 + 0.68%) 1.908% 2032 (put 2021)2 | | | 600 | | | | 602 | |
| Metropolitan Transportation Auth., Transportation Rev. Ref. Green Bonds, Capital Appreciation Bonds, Series 2017-C-2, 0% 2029 | | | 1,500 | | | | 1,239 | |
| Metropolitan Transportation Auth., Transportation Rev. Ref. Green Bonds, Series 2017-C-1, 4.00% 2034 | | | 1,000 | | | | 1,156 | |
| Metropolitan Transportation Auth., Transportation Rev. Ref. Green Bonds, Series 2017-C-1, 5.00% 2026 | | | 565 | | | | 706 | |
| Metropolitan Transportation Auth., Transportation Rev. Ref. Green Bonds, Series 2017-C-1, 5.00% 2028 | | | 750 | | | | 962 | |
| Mortgage Agcy., Homeowner Mortgage Rev. Bonds, Series 178, 3.50% 2043 | | | 225 | | | | 235 | |
| Mortgage Agcy., Homeowner Mortgage Rev. Bonds, Series 191, AMT, 3.50% 2034 | | | 205 | | | | 213 | |
| Mortgage Agcy., Homeowner Mortgage Rev. Bonds, Series 194, AMT, 3.50% 2035 | | | 360 | | | | 374 | |
| Mortgage Agcy., Homeowner Mortgage Rev. Bonds, Series 195, 4.00% 2046 | | | 1,240 | | | | 1,318 | |
| Mortgage Agcy., Homeowner Mortgage Rev. Bonds, Series 197, 3.50% 2044 | | | 625 | | | | 659 | |
| Mortgage Agcy., Homeowner Mortgage Rev. Bonds, Series 200, 3.50% 2045 | | | 230 | | | | 242 | |
| Mortgage Agcy., Homeowner Mortgage Rev. Bonds, Series 203, 3.50% 2047 | | | 835 | | | | 885 | |
| Mortgage Agcy., Homeowner Mortgage Rev. Bonds, Series 206, AMT, 4.00% 2037 | | | 570 | | | | 610 | |
| Mortgage Agcy., Homeowner Mortgage Rev. Bonds, Series 213, 4.25% 2047 | | | 485 | | | | 535 | |
| Mortgage Agcy., Homeowner Mortgage Rev. Bonds, Series 217, 4.00% 2049 | | | 995 | | | | 1,100 | |
| Mortgage Agcy., Homeowner Mortgage Rev. Bonds, Series 46, 5.00% 2029 | | | 10 | | | | 10 | |
| Mortgage Agcy., Homeowner Mortgage Rev. Bonds, Series 48, 2.625% 2041 | | | 875 | | | | 894 | |
| Mortgage Agcy., Homeowner Mortgage Rev. Bonds, Series 52, AMT, 3.50% 2030 | | | 630 | | | | 658 | |
| Mortgage Agcy., Homeowner Mortgage Rev. Bonds, Series 54, 4.00% 2047 | | | 1,425 | | | | 1,529 | |
| Mortgage Agcy., Homeowner Mortgage Rev. Ref. Bonds, Series 45, 4.50% 2029 | | | 30 | | | | 30 | |
| Port Auth., Consolidated Bonds, Series 166, 5.00% 2031 | | | 1,000 | | | | 1,039 | |
| Port Auth., Consolidated Bonds, Series 205, 5.00% 2047 | | | 1,000 | | | | 1,224 | |
| Port Auth., Consolidated Bonds, Series 212, 4.00% 2038 | | | 1,000 | | | | 1,186 | |
| Port Auth., Consolidated Bonds, Series 217, 5.00% 2044 | | | 1,500 | | | | 1,917 | |
| Port Auth., Consolidated Rev. Ref. Bonds, Series 167, AMT, 5.00% 2025 | | | 1,000 | | | | 1,044 | |
| Port Auth., Consolidated Rev. Ref. Bonds, Series 172, AMT, 5.00% 2034 | | | 500 | | | | 540 | |
| Port Auth., Consolidated Rev. Ref. Bonds, Series 186, AMT, 5.00% 2044 | | | 500 | | | | 571 | |
| Port Auth., Special Project Bonds (John. F. Kennedy International Air Terminal LLC Project), Series 8, 5.00% 2020 | | | 350 | | | | 361 | |
| Power Auth., Rev. Ref. Bonds, Series 2011-A, 5.00% 2038 | | | 1,500 | | | | 1,603 | |
| Transportation Dev. Corp., Special Fac. Rev. Ref. Bonds (American Airlines, Inc. John F. Kennedy International Airport Project), Series 2016, AMT, 5.00% 2020 | | | 1,970 | | | | 2,003 | |
| | |
| 72 | American Funds Tax-Exempt Funds |
American Funds Tax-Exempt Fund of New York
| | | Principal amount
(000) | | | Value
(000) | |
| Transportation Dev. Corp., Special Fac. Rev. Ref. Bonds (American Airlines, Inc. John F. Kennedy International Airport Project), Series 2016, AMT, 5.00% 2021 | | $ | 610 | | | $ | 641 | |
| Transportation Dev. Corp., Special Fac. Rev. Ref. Bonds (American Airlines, Inc. John F. Kennedy International Airport Project), Series 2016, AMT, 5.00% 2026 | | | 500 | | | | 525 | |
| Transportation Dev. Corp., Special Fac. Rev. Ref. Bonds (American Airlines, Inc. John F. Kennedy International Airport Project), Series 2016, AMT, 5.00% 2031 | | | 2,500 | | | | 2,617 | |
| Transportation Dev. Corp., Special Fac. Rev. Ref. Bonds (Terminal One Group Association, LP Project), Series 2015, AMT, 5.00% 2021 | | | 280 | | | | 289 | |
| Transportation Dev. Corp., Special Fac. Rev. Ref. Bonds (Terminal One Group Association, LP Project), Series 2015, AMT, 5.00% 2022 | | | 1,000 | | | | 1,067 | |
| Transportation Dev. Corp., Special Fac. Rev. Ref. Bonds (Terminal One Group Association, LP Project), Series 2015, AMT, 5.00% 2023 | | | 500 | | | | 550 | |
| Transportation Dev. Corp., Special Facs. Bonds (LaGuardia Airport Terminal B Redev. Project), Series 2016-A, AMT, 5.00% 2034 | | | 500 | | | | 577 | |
| Transportation Dev. Corp., Special Facs. Bonds (LaGuardia Airport Terminal B Redev. Project), Series 2016-A, AMT, 5.00% 2046 | | | 1,000 | | | | 1,136 | |
| Transportation Dev. Corp., Special Facs. Bonds (LaGuardia Airport Terminal B Redev. Project), Series 2016-A, AMT, 5.25% 2050 | | | 500 | | | | 571 | |
| Transportation Dev. Corp., Special Facs. Rev. Bonds (Delta Air Lines, Inc. LaGuardia Airport Terminals C & D Redev. Project), Series 2018, AMT, 4.00% 2036 | | | 500 | | | | 560 | |
| Transportation Dev. Corp., Special Facs. Rev. Bonds (Delta Air Lines, Inc. LaGuardia Airport Terminals C & D Redev. Project), Series 2018, AMT, 5.00% 2030 | | | 2,145 | | | | 2,647 | |
| Transportation Dev. Corp., Special Facs. Rev. Bonds (Delta Air Lines, Inc. LaGuardia Airport Terminals C & D Redev. Project), Series 2018, AMT, 5.00% 2036 | | | 1,045 | | | | 1,271 | |
| Triborough Bridge and Tunnel Auth., General Rev. Bonds (MTA Bridges and Tunnels), Series 2018-A, 5.00% 2030 | | | 650 | | | | 898 | |
| Triborough Bridge and Tunnel Auth., General Rev. Bonds (MTA Bridges and Tunnels), Series 2018-A, 5.00% 2046 | | | 1,000 | | | | 1,228 | |
| Urban Dev. Corp., State Personal Income Tax Rev. Bonds (General Purpose), Series 2014-A, 5.00% 2027 | | | 750 | | | | 873 | |
| Urban Dev. Corp., State Personal Income Tax Rev. Bonds (General Purpose), Series 2016-A, 5.00% 2026 | | | 1,500 | | | | 1,867 | |
| Urban Dev. Corp., State Personal Income Tax Rev. Bonds (General Purpose), Series 2016-A, 5.00% 2032 | | | 1,000 | | | | 1,218 | |
| Urban Dev. Corp., State Personal Income Tax Rev. Bonds (General Purpose), Series 2019-A, 5.00% 2036 | | | 1,500 | | | | 1,901 | |
| Urban Dev. Corp., State Personal Income Tax Rev. Bonds (General Purpose), Series 2019-A, 5.00% 2042 | | | 1,345 | | | | 1,672 | |
| Urban Dev. Corp., State Sales Tax Rev. Bonds (Bidding Group 3), Series 2019-A, 4.00% 2043 | | | 1,785 | | | | 2,078 | |
| Utility Debt Securitization Auth., Restructuring Bonds, Series 2016-A, 5.00% 2035 | | | 1,170 | | | | 1,438 | |
| Utility Debt Securitization Auth., Restructuring Bonds, Series 2017, 5.00% 2040 | | | 750 | | | | 944 | |
| Utility Debt Securitization Auth., Restructuring Bonds, Series 2017, 5.00% 2041 | | | 1,500 | | | | 1,883 | |
| Other securities | | | | | | | 8,474 | |
| | | | | | | | 145,103 | |
| | | | | | | | | |
| City, county & other issuers 45.62% | | | | | | | | |
| Buffalo and Erie County Industrial Land Dev. Corp., Rev. Bonds (Buffalo State College Foundation Housing Corp. Project), Series 2011-A, 5.375% 2041 | | | 1,400 | | | | 1,474 | |
| Buffalo and Erie County Industrial Land Dev. Corp., Rev. Bonds (Catholic Health System Obligated Group Project), Series 2015, 5.00% 2023 | | | 1,600 | | | | 1,807 | |
| Buffalo and Erie County Industrial Land Dev. Corp., Rev. Bonds (Catholic Health System Obligated Group Project), Series 2015, 5.00% 2024 | | | 275 | | | | 321 | |
| Buffalo and Erie County Industrial Land Dev. Corp., Rev. Bonds (Catholic Health System Obligated Group Project), Series 2015, 5.00% 2040 | | | 1,050 | | | | 1,213 | |
| Buffalo and Erie County Industrial Land Dev. Corp., Rev. Bonds (Catholic Health System Obligated Group Project), Series 2015, 5.25% 2035 | | | 500 | | | | 591 | |
| Buffalo and Erie County Industrial Land Dev. Corp., Rev. Bonds (Tapestry Charter School Project), Series 2017-A, 5.00% 2047 | | | 500 | | | | 554 | |
| Build NYC Resource Corp., Rev. Bonds (Bronx Charter School for Excellence Project), Series 2013-A, 4.00% 2021 | | | 525 | | | | 539 | |
| Build NYC Resource Corp., Rev. Bonds (Bronx Charter School for Excellence Project), Series 2013-A, 4.00% 2022 | | | 545 | | | | 570 | |
| | |
| American Funds Tax-Exempt Funds | 73 |
American Funds Tax-Exempt Fund of New York
| Bonds, notes & other debt instruments(continued) | | Principal amount
(000) | | | Value
(000) | |
| New York (continued) | | | | | | | | |
| City, county & other issuers (continued) | | | | | | | | |
| Build NYC Resource Corp., Rev. Bonds (Bronx Charter School for Excellence Project), Series 2013-A, 5.50% 2043 | | $ | 1,500 | | | $ | 1,627 | |
| Build NYC Resource Corp., Rev. Bonds (YMCA of Greater New York Project), Series 2015, 5.00% 2040 | | | 500 | | | | 577 | |
| Build NYC Resource Corp., Rev. Ref. Bonds (Albert Einstein School of Medicine, Inc. Project), Series 2015, 5.50% 20451 | | | 300 | | | | 348 | |
| Build NYC Resource Corp., Solid Waste Disposal Rev. Bonds (Pratt Paper (NY), Inc. Project), Series 2014, AMT, 4.50% 20251 | | | 450 | | | | 489 | |
| Build NYC Resource Corp., Solid Waste Disposal Rev. Bonds (Pratt Paper (NY), Inc. Project), Series 2014, AMT, 5.00% 20351 | | | 950 | | | | 1,063 | |
| Village of Dobbs Ferry, Local Dev. Corp., Rev. Bonds (Mercy College Project), Series 2014, 5.00% 2039 | | | 1,625 | | | | 1,855 | |
| County of Dutchess, Local Dev. Corp., Rev. Bonds (Health Quest Systems, Inc. Project), Series 2016-B, 4.00% 2041 | | | 750 | | | | 829 | |
| County of Dutchess, Local Dev. Corp., Rev. Bonds (Nuvance Health Issue), Series 2019-B, 4.00% 2049 | | | 1,000 | | | | 1,129 | |
| County of Dutchess, Local Dev. Corp., Rev. Bonds (Nuvance Health Issue), Series 2019-B, 5.00% 2032 | | | 905 | | | | 1,148 | |
| County of Dutchess, Local Dev. Corp., Rev. Ref. Bonds (Health Quest Systems, Inc. Project), Series 2010, 5.75% 2030 | | | 500 | | | | 510 | |
| County of Dutchess, Local Dev. Corp., Rev. Ref. Bonds (Health Quest Systems, Inc. Project), Series 2010, 5.75% 2040 | | | 1,000 | | | | 1,019 | |
| County of Dutchess, Local Dev. Corp., Rev. Ref. Bonds (Health Quest Systems, Inc. Project), Series 2014-A, 5.00% 2028 | | | 430 | | | | 506 | |
| Town of Hempstead, Local Dev. Corp., Rev. Bonds (Hofstra University Project), Series 2011, 5.00% 2027 | | | 800 | | | | 844 | |
| Town of Hempstead, Local Dev. Corp., Rev. Bonds (Hofstra University Project), Series 2011, 5.00% 2041 | | | 800 | | | | 841 | |
| Town of Hempstead, Local Dev. Corp., Rev. Ref. Bonds (Molloy College Project), Series 2017, 5.00% 2033 | | | 480 | | | | 576 | |
| Town of Hempstead, Local Dev. Corp., Rev. Ref. Bonds (Molloy College Project),Series 2017, 5.00% 2034 | | | 810 | | | | 971 | |
| Town of Hempstead, Local Dev. Corp., Rev. Ref. Bonds (Molloy College Project), Series 2017, 5.00% 2037 | | | 630 | | | | 750 | |
| Hudson Yards Infrastructure Corp., Rev. Bonds, Fiscal 2012, Series 2012-A, 5.25% 2047 | | | 955 | | | | 995 | |
| Hudson Yards Infrastructure Corp., Rev. Bonds, Fiscal 2012, Series 2012-A, 5.25% 2047 (preref. 2021) | | | 45 | | | | 47 | |
| Hudson Yards Infrastructure Corp., Rev. Bonds, Fiscal 2012, Series 2012-A, 5.75% 2047 | | | 435 | | | | 456 | |
| Hudson Yards Infrastructure Corp., Rev. Bonds, Fiscal 2012, Series 2012-A, 5.75% 2047 (preref. 2021) | | | 565 | | | | 594 | |
| Hudson Yards Infrastructure Corp., Rev. Bonds, Fiscal 2017, Series 2017-A, 5.00% 2033 | | | 2,700 | | | | 3,370 | |
| Hudson Yards Infrastructure Corp., Rev. Bonds, Fiscal 2017, Series 2017-A, 5.00% 2035 | | | 1,000 | | | | 1,242 | |
| County of Monroe, Industrial Dev. Corp., Rev. Bonds (St. Anns of Greater Rochester, Inc.), Series 2019, 5.00% 2050 | | | 1,500 | | | | 1,664 | |
| County of Nassau, G.O. Bonds, Series 2014-A, 5.00% 2028 | | | 1,250 | | | | 1,447 | |
| County of Nassau, G.O. Bonds, Series 2016-B, 5.00% 2025 | | | 1,000 | | | | 1,218 | |
| County of Nassau, G.O. General Improvement Bonds, Series 2017-A, 5.00% 2030 | | | 1,000 | | | | 1,239 | |
| County of Nassau, G.O. General Improvement Bonds, Series 2018-B, Assured Guaranty Municipal insured, 5.00% 2035 | | | 750 | | | | 942 | |
| County of Nassau, G.O. General Improvement Bonds, Series 2019-A, Assured Guaranty Municipal insured, 5.00% 2032 | | | 750 | | | | 967 | |
| County of Nassau, G.O. General Improvement Rev. Ref. Bonds, Series 2016-A, 5.00% 2027 | | | 500 | | | | 611 | |
| County of Nassau, G.O. General Improvement Rev. Ref. Bonds, Series 2016-A, 5.00% 2030 | | | 1,795 | | | | 2,166 | |
| New York City G.O. Bonds, Fiscal 2015, Series 2015-C, 5.00% 2033 | | | 1,000 | | | | 1,179 | |
| New York City G.O. Bonds, Fiscal 2016, Series 2016-A, 5.00% 2026 | | | 1,000 | | | | 1,219 | |
| New York City G.O. Bonds, Fiscal 2016, Series 2016-C, 5.00% 2031 | | | 1,000 | | | | 1,212 | |
| New York City G.O. Bonds, Fiscal 2017, Series 2017-A-1, 5.00% 2034 | | | 1,000 | | | | 1,224 | |
| New York City G.O. Bonds, Fiscal 2018, Series 2018-A, 5.00% 2027 | | | 1,500 | | | | 1,927 | |
| New York City G.O. Bonds, Fiscal 2018, Series 2018-C, 5.00% 2031 | | | 1,000 | | | | 1,277 | |
| New York City G.O. Bonds, Fiscal 2018, Series 2018-C, 5.00% 2032 | | | 1,720 | | | | 2,183 | |
| New York City G.O. Bonds, Fiscal 2018, Series 2018-E-1, 5.00% 2037 | | | 1,150 | | | | 1,439 | |
| New York City G.O. Bonds, Fiscal 2019, Series 2019-D-1, 5.00% 2037 | | | 750 | | | | 952 | |
| New York City G.O. Bonds, Fiscal 2020, Series 2019-A-1, 5.00% 2041 | | | 1,595 | | | | 2,028 | |
| | |
| 74 | American Funds Tax-Exempt Funds |
American Funds Tax-Exempt Fund of New York
| | | Principal amount
(000) | | | Value
(000) | |
| New York City G.O. Bonds, Fiscal 2020, Series 2019-B-1, 4.00% 2040 | | $ | 2,500 | | | $ | 2,936 | |
| New York City Housing Dev. Corp., Multi Family Housing Rev. Bonds (8 Spruce Street), Series 2014-E, 3.50% 2048 | | | 1,670 | | | | 1,757 | |
| New York City Housing Dev. Corp., Multi Family Housing Rev. Bonds (8 Spruce Street), Series 2014-F, 4.50% 2048 | | | 500 | | | | 534 | |
| New York City Housing Dev. Corp., Multi Family Housing Rev. Bonds (Sustainable Neighborhood Bonds), Series 2015-H, 2.95% 2045 (put 2026) | | | 750 | | | | 804 | |
| New York City Housing Dev. Corp., Multi Family Housing Rev. Bonds (Sustainable Neighborhood Bonds), Series 2017-A-1-A, 3.80% 2037 | | | 885 | | | | 963 | |
| New York City Housing Dev. Corp., Multi Family Housing Rev. Bonds (Sustainable Neighborhood Bonds), Series 2017-C-2, 1.70% 2021 | | | 400 | | | | 400 | |
| New York City Housing Dev. Corp., Multi Family Housing Rev. Bonds (Sustainable Neighborhood Bonds), Series 2017-G-2-A, 2.00% 2057 (put 2021) | | | 750 | | | | 753 | |
| New York City Housing Dev. Corp., Multi Family Housing Rev. Bonds (Sustainable Neighborhood Bonds), Series 2018-L-2, 2.75% 2050 (put 2023) | | | 500 | | | | 522 | |
| New York City Housing Dev. Corp., Multi Family Housing Rev. Bonds (Sustainable Neighborhood Bonds), Series 2019-E-2, 1.75% 2059 (put 2023) | | | 1,000 | | | | 1,011 | |
| New York City Municipal Water Fin. Auth., Water and Sewer System Rev. Bonds, Series 2011-EE, 5.375% 2043 | | | 590 | | | | 612 | |
| New York City Municipal Water Fin. Auth., Water and Sewer System Second General Resolution Rev. Bonds, Fiscal 2015, Series 2015-EE, 5.00% 2045 | | | 500 | | | | 573 | |
| New York City Municipal Water Fin. Auth., Water and Sewer System Second General Resolution Rev. Bonds, Fiscal 2015, Series 2015-HH, 5.00% 2039 | | | 500 | | | | 592 | |
| New York City Municipal Water Fin. Auth., Water and Sewer System Second General Resolution Rev. Bonds, Fiscal 2017, Series 2017-DD, 5.00% 2047 | | | 1,055 | | | | 1,284 | |
| New York City Municipal Water Fin. Auth., Water and Sewer System Second General Resolution Rev. Bonds, Fiscal 2017, Series 2017-EE, 5.00% 2033 | | | 750 | | | | 942 | |
| New York City Municipal Water Fin. Auth., Water and Sewer System Second General Resolution Rev. Bonds, Fiscal 2018, Series 2018-BB-1, 5.00% 2046 | | | 1,250 | | | | 1,525 | |
| New York City Municipal Water Fin. Auth., Water and Sewer System Second General Resolution Rev. Bonds, Fiscal 2018, Series 2018-EE, 5.00% 2040 | | | 2,000 | | | | 2,497 | |
| New York City Municipal Water Fin. Auth., Water and Sewer System Second General Resolution Rev. Bonds, Fiscal 2019, Series 2019-DD-1, 5.25% 2049 | | | 1,500 | | | | 1,884 | |
| New York City Municipal Water Fin. Auth., Water and Sewer System Second General Resolution Rev. Bonds, Fiscal 2019, Series 2019-FF-2, 5.00% 2040 | | | 1,000 | | | | 1,276 | |
| New York City Municipal Water Fin. Auth., Water and Sewer System Second General Resolution Rev. Ref. Bonds, Fiscal 2017, Series 2017-EE, 5.00% 2036 | | | 750 | | | | 936 | |
| New York City Transitional Fin. Auth., Building Aid Rev. Bonds, Fiscal 2018, Series 2018-S-2, 5.00% 2036 | | | 590 | | | | 732 | |
| New York City Transitional Fin. Auth., Building Aid Rev. Bonds, Fiscal 2018, Series 2018-S-4A, 5.00% 2037 | | | 750 | | | | 942 | |
| New York City Transitional Fin. Auth., Building Aid Rev. Bonds, Fiscal 2019, Series 2019-S-1, 5.00% 2043 | | | 1,000 | | | | 1,236 | |
| New York City Transitional Fin. Auth., Building Aid Rev. Bonds, Fiscal 2019, Series 2019-S-3, 5.00% 2036 | | | 1,000 | | | | 1,261 | |
| New York City Transitional Fin. Auth., Future Tax Secured Bonds, Fiscal 2011, Series 2011-C, 5.25% 2025 | | | 700 | | | | 723 | |
| New York City Transitional Fin. Auth., Future Tax Secured Bonds, Fiscal 2017, Series 2017-C, 5.00% 2032 | | | 1,000 | | | | 1,252 | |
| New York City Transitional Fin. Auth., Future Tax Secured Bonds, Fiscal 2017, Series 2017-E-1, 5.00% 2043 | | | 1,000 | | | | 1,211 | |
| New York City Transitional Fin. Auth., Future Tax Secured Bonds, Fiscal 2017, Series 2017-F-1, 5.00% 2039 | | | 750 | | | | 922 | |
| New York City Transitional Fin. Auth., Future Tax Secured Bonds, Fiscal 2017, Series 2017-F-1, 5.00% 2042 | | | 1,000 | | | | 1,220 | |
| New York City Transitional Fin. Auth., Future Tax Secured Bonds, Fiscal 2018, Series 2018-A-3, 4.00% 2042 | | | 1,080 | | | | 1,228 | |
| New York City Transitional Fin. Auth., Future Tax Secured Bonds, Fiscal 2019, Series 2019-A-1, 5.00% 2036 | | | 2,380 | | | | 3,016 | |
| New York City Transitional Fin. Auth., Future Tax Secured Bonds, Fiscal 2019,Series 2019-C-1, 5.00% 2034 | | | 750 | | | | 973 | |
| New York City Transitional Fin. Auth., Future Tax Secured Bonds, Fiscal 2020, Series 2019-B-1, 4.00% 2040 | | | 1,500 | | | | 1,760 | |
| | |
| American Funds Tax-Exempt Funds | 75 |
American Funds Tax-Exempt Fund of New York
| Bonds, notes & other debt instruments(continued) | | Principal amount
(000) | | | Value
(000) | |
| New York (continued) | | | | | | | | |
| City, county & other issuers (continued) | | | | | | | | |
| New York City Transitional Fin. Auth., Future Tax Secured Rev. Ref. Bonds, Fiscal 2016, Series 2016-C, 5.00% 2026 | | $ | 1,000 | | | $ | 1,228 | |
| Niagara Frontier Transportation Auth., Airport Rev. Ref. Bonds (Buffalo Niagara International Airport), Series 2014-A, AMT, 5.00% 2027 | | | 600 | | | | 688 | |
| Niagara Frontier Transportation Auth., Airport Rev. Ref. Bonds (Buffalo Niagara International Airport), Series 2014-A, AMT, 5.00% 2028 | | | 500 | | | | 572 | |
| Niagara Frontier Transportation Auth., Airport Rev. Ref. Bonds (Buffalo Niagara International Airport), Series 2014-A, AMT, 5.00% 2029 | | | 700 | | | | 799 | |
| Niagara Frontier Transportation Auth., Airport Rev. Ref. Bonds (Buffalo Niagara International Airport), Series 2019-A, AMT, 5.00% 2031 | | | 1,000 | | | | 1,257 | |
| County of Onondaga, Resource Recovery Agcy., Rev. Ref. Bonds, Series 2015-A, AMT, Assured Guaranty Municipal insured, 5.00% 2030 | | | 1,750 | | | | 2,030 | |
| Town of Southold, Local Dev. Corp., Rev. Bonds (Peconic Landing at Southold, Inc. Project), Series 2015, 5.00% 2045 | | | 1,500 | | | | 1,646 | |
| City of Troy, Capital Resource Corp., Rev. Ref. Bonds (Rensselaer Polytechnic Institute Project), Series 2020-A, 5.00% 2038 | | | 1,500 | | | | 1,886 | |
| County of Westchester, Local Dev. Corp., Rev. Bonds (Purchase Housing Corp. II Project), Series 2017, 5.00% 2037 | | | 1,000 | | | | 1,194 | |
| County of Westchester, Local Dev. Corp., Rev. Bonds (Purchase Housing Corp. II Project), Series 2017, 5.00% 2047 | | | 1,000 | | | | 1,174 | |
| County of Westchester, Local Dev. Corp., Rev. Bonds (Westchester Medical Center Obligated Group Project), Series 2016, 5.00% 2034 | | | 1,150 | | | | 1,333 | |
| County of Westchester, Local Dev. Corp., Rev. Bonds (Westchester Medical Center Obligated Group Project), Series 2016, 5.00% 2046 | | | 1,000 | | | | 1,137 | |
| County of Westchester, Local Dev. Corp., Rev. Ref. Bonds (Pace University), Series 2014-A, 5.50% 2042 | | | 450 | | | | 515 | |
| Other securities | | | | | | | 30,834 | |
| | | | | | | | 138,319 | |
| | | | | | | | | |
| Guam 1.28% | | | | | | | | |
| Other securities | | | | | | | 3,881 | |
| | | | | | | | | |
| Puerto Rico 1.90% | | | | | | | | |
| Other securities | | | | | | | 5,762 | |
| | | | | | | | | |
| Total bonds, notes & other debt instruments(cost: $275,003,000) | | | | | | | 293,065 | |
| | | | | | | | | |
| Short-term securities 3.90% | | | | | | | | |
| Dormitory Auth., Rev. Bonds (Fordham University), Series 2008-A-2, Bank of America LOC, 0.81% 20322 | | | 2,000 | | | | 2,000 | |
| Environmental Facs. Corp., Solid Waste Disposal Rev. Ref. Bonds (Waste Management, Inc. Project), Series 2012, AMT, 1.45% 2030 (put 2020)3 | | | 1,000 | | | | 1,000 | |
| Metropolitan Transportation Auth., Transportation Rev. Bonds, Series 2015-E-3, (SIFMA Municipal Swap Index + 1.70%) 1.17% 20502 | | | 1,000 | | | | 1,000 | |
| New York City G.O. Bonds, Fiscal 2008, Series 2008-C-4, Assured Guaranty Municipal insured, 1.00% 20272 | | | 1,000 | | | | 1,000 | |
| City of Syracuse, Industrial Dev. Agcy., Civic Fac. Rev. Bonds (Syracuse University Project), Series 2008-A-1, 1.15% 20372 | | | 1,030 | | | | 1,030 | |
| City of Syracuse, Industrial Dev. Agcy., Civic Fac. Rev. Bonds (Syracuse University Project), Series 2008-A-2, JPMorgan Chase LOC, 1.15% 20372 | | | 3,795 | | | | 3,795 | |
| Triborough Bridge and Tunnel Auth., General Rev. Bonds (MTA Bridges and Tunnels), Series 2003-B-1, 1.17% 20332 | | | 2,000 | | | | 2,000 | |
| | | | | | | | | |
| Total short-term securities (cost: $11,825,000) | | | | | | | 11,825 | |
| Total investment securities 100.56% (cost: $286,828,000) | | | | | | | 304,890 | |
| Other assets less liabilities (0.56)% | | | | | | | (1,686 | ) |
| | | | | | | | | |
| Net assets 100.00% | | | | | | $ | 303,204 | |
| | |
| 76 | American Funds Tax-Exempt Funds |
American Funds Tax-Exempt Fund of New York
This summary investment portfolio is designed to streamline the report and help investors better focus on the fund’s principal holdings. See the inside back cover for details on how to obtain a complete schedule of portfolio holdings.
“Other securities” includes all issues that are not disclosed separately in the summary investment portfolio.
| 1 | Acquired in a transaction exempt from registration under Rule 144A of the Securities Act of 1933. May be resold in the U.S. in transactions exempt from registration, normally to qualified institutional buyers. The total value of all such securities, including those in “Other securities,” was $11,669,000, which represented 3.85% of the net assets of the fund. |
| 2 | Coupon rate may change periodically. Reference rate and spread are as of the most recent information available. Some coupon rates are determined by the issuer or agent based on current market conditions; therefore, the reference rate and spread are not available. For short-term securities, the date of the next scheduled coupon rate change is considered to be the maturity date. |
| 3 | For short-term securities, the mandatory put date is considered to be the maturity date. |
Key to abbreviations and symbol
Agcy. = Agency
AMT = Alternative Minimum Tax
Auth. = Authority
Certs. of Part. = Certificates of Participation
Dept. = Department
Dev. = Development
Dist. = District
Econ. = Economic
Fac. = Facility
Facs. = Facilities
Fin. = Finance
Fncg. = Financing
G.O. = General Obligation
IAM = Interest at Maturity
LIBOR = London Interbank Offered Rate
LOC = Letter of Credit
Preref. = Prerefunded
Redev. = Redevelopment
Ref. = Refunding
Rev. = Revenue
SIFMA = Securities Industry and Financial Markets Association
USD/$ = U.S. dollars
| American Funds Tax-Exempt Funds | 77 |
Financial statements
Statements of assets and liabilities
at January 31, 2020
| | | American Funds
Short-Term
Tax-Exempt Bond Fund | | | Limited Term
Tax-Exempt Bond
Fund of America | |
| Assets: | | | | | | | | |
| Investment securities in unaffiliated issuers, at value | | $ | 1,259,232 | | | $ | 4,708,932 | |
| Cash | | | 859 | | | | 851 | |
| Cash collateral pledged for futures contracts | | | 663 | | | | 2,374 | |
| Receivables for: | | | | | | | | |
| Sales of investments | | | 2,434 | | | | 10,676 | |
| Sales of fund’s shares | | | 2,945 | | | | 15,546 | |
| Interest | | | 9,957 | | | | 36,166 | |
| Variation margin on futures contracts | | | 259 | | | | 1,021 | |
| | | | 1,276,349 | | | | 4,775,566 | |
| Liabilities: | | | | | | | | |
| Payables for: | | | | | | | | |
| Purchases of investments | | | 53,703 | | | | 162,794 | |
| Repurchases of fund’s shares | | | 1,819 | | | | 6,956 | |
| Dividends on fund’s shares | | | 38 | | | | 396 | |
| Investment advisory services | | | 351 | | | | 833 | |
| Services provided by related parties | | | 104 | | | | 842 | |
| Trustees’ deferred compensation | | | 35 | | | | 142 | |
| Variation margin on futures contracts | | | — | | | | 97 | |
| Other | | | — | * | | | 2 | |
| | | | 56,050 | | | | 172,062 | |
| Net assets at January 31, 2020 | | $ | 1,220,299 | | | $ | 4,603,504 | |
| | | | | | | | | |
| Net assets consist of: | | | | | | | | |
| Capital paid in on shares of beneficial interest | | $ | 1,205,071 | | | $ | 4,456,796 | |
| Total distributable earnings | | | 15,228 | | | | 146,708 | |
| Net assets at January 31, 2020 | | $ | 1,220,299 | | | $ | 4,603,504 | |
| Investment securities in unaffiliated issuers, at cost | | $ | 1,244,205 | | | $ | 4,575,588 | |
| | |
| * | Amount less than one thousand. |
See notes to financial statements.
| 78 | American Funds Tax-Exempt Funds |
unaudited
(dollars in thousands)
The Tax-Exempt
Bond Fund
of America | | | American
High-Income
Municipal Bond Fund | | | The Tax-Exempt
Fund of
California | | | American Funds
Tax-Exempt Fund
of New York | |
| | | | | | | | | | | | | | |
| $ | 24,564,863 | | | $ | 8,706,116 | | | $ | 2,840,860 | | | $ | 304,890 | |
| | 285 | | | | 2,124 | | | | 499 | | | | 638 | |
| | 6,530 | | | | 1,515 | | | | 1,090 | | | | 10 | |
| | | | | | | | | | | | | | |
| | 14,093 | | | | 11,554 | | | | 3,969 | | | | — | |
| | 61,439 | | | | 17,279 | | | | 5,800 | | | | 402 | |
| | 204,011 | | | | 73,390 | | | | 32,051 | | | | 2,899 | |
| | 3,032 | | | | 856 | | | | 474 | | | | — | |
| | 24,854,253 | | | | 8,812,834 | | | | 2,884,743 | | | | 308,839 | |
| | | | | | | | | | | | | | |
| | 372,834 | | | | 99,581 | | | | 15,708 | | | | 3,240 | |
| | 29,443 | | | | 10,202 | | | | 3,762 | | | | 2,164 | |
| | 2,283 | | | | 1,408 | | | | 579 | | | | 97 | |
| | 3,937 | | | | 1,951 | | | | 651 | | | | 75 | |
| | 2,446 | | | | 1,419 | | | | 410 | | | | 57 | |
| | 734 | | | | 142 | | | | 137 | | | | 2 | |
| | 2,662 | | | | 637 | | | | 75 | | | | — | |
| | 8 | | | | 4 | | | | 1 | | | | — | * |
| | 414,347 | | | | 115,344 | | | | 21,323 | | | | 5,635 | |
| $ | 24,439,906 | | | $ | 8,697,490 | | | $ | 2,863,420 | | | $ | 303,204 | |
| | | | | | | | | | | | | | |
| $ | 23,012,532 | | | $ | 8,130,125 | | | $ | 2,692,350 | | | $ | 284,794 | |
| | 1,427,374 | | | | 567,365 | | | | 171,070 | | | | 18,410 | |
| $ | 24,439,906 | | | $ | 8,697,490 | | | $ | 2,863,420 | | | $ | 303,204 | |
| $ | 23,138,693 | | | $ | 8,150,068 | | | $ | 2,672,239 | | | $ | 286,828 | |
| | |
| American Funds Tax-Exempt Funds | 79 |
Statements of assets and liabilities
at January 31, 2020
| | | | | American Funds
Short-Term
Tax-Exempt Bond Fund | | | Limited Term
Tax-Exempt Bond
Fund of America | |
| Shares of beneficial interest issued and outstanding (no stated par value) — unlimited shares authorized | | | | | | | | |
| | | | | | | | | | | |
| Class A: | | Net assets | | $ | 817,034 | | | $ | 3,261,511 | |
| | | Shares outstanding | | | 79,831 | | | | 203,494 | |
| | | Net asset value per share | | $ | 10.23 | | | $ | 16.03 | |
| Class C: | | Net assets | | | | | | $ | 17,233 | |
| | | Shares outstanding | | | Not applicable | | | | 1,075 | |
| | | Net asset value per share | | | | | | $ | 16.03 | |
| Class T: | | Net assets | | $ | 10 | | | $ | 10 | |
| | | Shares outstanding | | | 1 | | | | 1 | |
| | | Net asset value per share | | $ | 10.23 | | | $ | 16.03 | |
| Class F-1: | | Net assets | | $ | 5,988 | | | $ | 65,903 | |
| | | Shares outstanding | | | 585 | | | | 4,112 | |
| | | Net asset value per share | | $ | 10.23 | | | $ | 16.03 | |
| Class F-2: | | Net assets | | $ | 205,553 | | | $ | 580,824 | |
| | | Shares outstanding | | | 20,084 | | | | 36,239 | |
| | | Net asset value per share | | $ | 10.23 | | | $ | 16.03 | |
| Class F-3: | | Net assets | | $ | 53,113 | | | $ | 354,815 | |
| | | Shares outstanding | | | 5,190 | | | | 22,138 | |
| | | Net asset value per share | | $ | 10.23 | | | $ | 16.03 | |
| Class R-6: | | Net assets | | $ | 138,601 | | | $ | 323,208 | |
| | | Shares outstanding | | | 13,542 | | | | 20,166 | |
| | | Net asset value per share | | $ | 10.23 | | | $ | 16.03 | |
See notes to financial statements.
| 80 | American Funds Tax-Exempt Funds |
unaudited
(dollars and shares in thousands, except per-share amounts)
The Tax-Exempt
Bond Fund
of America | | | American
High-Income
Municipal Bond Fund | | | The Tax-Exempt
Fund of
California | | | American Funds
Tax-Exempt Fund
of New York | |
| | | | | | | | | | | | | | | |
| $ | 12,052,556 | | | $ | 5,130,822 | | | $ | 1,942,723 | | | $ | 222,032 | |
| | 890,582 | | | | 307,561 | | | | 105,982 | | | | 19,788 | |
| $ | 13.53 | | | $ | 16.68 | | | $ | 18.33 | | | $ | 11.22 | |
| $ | 424,051 | | | $ | 247,348 | | | $ | 70,496 | | | $ | 11,731 | |
| | 31,334 | | | | 14,827 | | | | 3,846 | | | | 1,045 | |
| $ | 13.53 | | | $ | 16.68 | | | $ | 18.33 | | | $ | 11.22 | |
| $ | 10 | | | $ | 11 | | | $ | 10 | | | $ | 10 | |
| | 1 | | | | 1 | | | | 1 | | | | 1 | |
| $ | 13.53 | | | $ | 16.68 | | | $ | 18.33 | | | $ | 11.22 | |
| $ | 352,382 | | | $ | 189,365 | | | $ | 75,179 | | | $ | 2,251 | |
| | 26,038 | | | | 11,351 | | | | 4,101 | | | | 201 | |
| $ | 13.53 | | | $ | 16.68 | | | $ | 18.33 | | | $ | 11.22 | |
| $ | 3,232,824 | | | $ | 1,270,216 | | | $ | 471,823 | | | $ | 33,357 | |
| | 238,878 | | | | 76,142 | | | | 25,740 | | | | 2,973 | |
| $ | 13.53 | | | $ | 16.68 | | | $ | 18.33 | | | $ | 11.22 | |
| $ | 7,563,981 | | | $ | 1,045,340 | | | $ | 303,189 | | | $ | 33,823 | |
| | 558,914 | | | | 62,662 | | | | 16,540 | | | | 3,014 | |
| $ | 13.53 | | | $ | 16.68 | | | $ | 18.33 | | | $ | 11.22 | |
| $ | 814,102 | | | $ | 814,388 | | | | | | | | | |
| | 60,155 | | | | 48,818 | | | | Not applicable | | | | Not applicable | |
| $ | 13.53 | | | $ | 16.68 | | | | | | | | | |
| | | | | | | | | | | | | | | |
| American Funds Tax-Exempt Funds | 81 |
Statements of operations
for the six months ended January 31, 2020
| | | American Funds
Short-Term
Tax-Exempt Bond Fund | | | Limited Term
Tax-Exempt Bond
Fund of America | |
| Investment income: | | | | | | | | |
| Income: | | | | | | | | |
| Interest | | $ | 11,643 | | | $ | 51,158 | |
| Fees and expenses*: | | | | | | | | |
| Investment advisory services | | | 2,025 | | | | 4,883 | |
| Distribution services | | | 606 | | | | 4,904 | |
| Transfer agent services | | | 218 | | | | 894 | |
| Administrative services | | | 178 | | | | 663 | |
| Reports to shareholders | | | 13 | | | | 56 | |
| Registration statement and prospectus | | | 102 | | | | 230 | |
| Trustees’ compensation | | | 5 | | | | 22 | |
| Auditing and legal | | | 41 | | | | 55 | |
| Custodian | | | 1 | | | | 6 | |
| Federal, state and local taxes | | | 3 | | | | 1 | |
| Other | | | 1 | | | | 3 | |
| Total fees and expenses before reimbursements | | | 3,193 | | | | 11,717 | |
| Miscellaneous fee reimbursements | | | 68 | | | | — | |
| Total fees and expenses after reimbursements | | | 3,125 | | | | 11,717 | |
| Net investment income | | | 8,518 | | | | 39,441 | |
| | | |
| Net realized gain (loss) and unrealized appreciation: | | | | | | | | |
| Net realized gain (loss) on: | | | | | | | | |
| Investments in unaffiliated issuers | | | 2,165 | | | | 13,170 | |
| Futures contracts | | | (48 | ) | | | (2,354 | ) |
| | | | 2,117 | | | | 10,816 | |
| Net unrealized appreciation (depreciation) on: | | | | | | | | |
| Investments in unaffiliated issuers | | | 1,699 | | | | 25,054 | |
| Futures contracts | | | 1,198 | | | | 6,066 | |
| | | | 2,897 | | | | 31,120 | |
| Net realized gain (loss) and unrealized appreciation | | | 5,014 | | | | 41,936 | |
| | | | | | | | | |
| Net increase in net assets resulting from operations | | $ | 13,532 | | | $ | 81,377 | |
| | |
| * | Additional information related to class-specific fees and expenses is included in the notes to financial statements. |
| † | Amount less than one thousand. |
See notes to financial statements.
| 82 | American Funds Tax-Exempt Funds |
unaudited
(dollars in thousands)
The Tax-Exempt
Bond Fund
of America | | | American
High-Income
Municipal Bond Fund | | | The Tax-Exempt
Fund of
California | | | American Funds
Tax-Exempt Fund
of New York | |
| | | | | | | | | | | | | | | |
| $ | 347,657 | | | $ | 170,355 | | | $ | 41,636 | | | $ | 4,453 | |
| | | | | | | | | | | | | | | |
| | 22,553 | | | | 11,034 | | | | 3,770 | | | | 431 | |
| | 16,714 | | | | 8,771 | | | | 2,777 | | | | 326 | |
| | 3,812 | | | | 1,883 | | | | 426 | | | | 48 | |
| | 3,439 | | | | 1,231 | | | | 409 | | | | 44 | |
| | 292 | | | | 119 | | | | 23 | | | | 3 | |
| | 730 | | | | 389 | | | | 112 | | | | 74 | |
| | 116 | | | | 30 | | | | 17 | | | | 1 | |
| | 99 | | | | 62 | | | | 74 | | | | 51 | |
| | 26 | | | | 12 | | | | 3 | | | | — | † |
| | 936 | | | | 914 | | | | 504 | | | | — | † |
| | 9 | | | | 75 | | | | 2 | | | | — | † |
| | 48,726 | | | | 24,520 | | | | 8,117 | | | | 978 | |
| | — | | | | — | | | | — | | | | 84 | |
| | 48,726 | | | | 24,520 | | | | 8,117 | | | | 894 | |
| | 298,931 | | | | 145,835 | | | | 33,519 | | | | 3,559 | |
| | | | | | | | | | | | | | | |
| | 15,224 | | | | 6,688 | | | | 11,806 | | | | 216 | |
| | (19,340 | ) | | | (1,928 | ) | | | (1,444 | ) | | | (9 | ) |
| | (4,116 | ) | | | 4,760 | | | | 10,362 | | | | 207 | |
| | | | | | | | | | | | | | | |
| | 433,119 | | | | 171,649 | | | | 39,095 | | | | 5,073 | |
| | 1,342 | | | | (1,216 | ) | | | 2,825 | | | | 2 | |
| | 434,461 | | | | 170,433 | | | | 41,920 | | | | 5,075 | |
| | 430,345 | | | | 175,193 | | | | 52,282 | | | | 5,282 | |
| $ | 729,276 | | | $ | 321,028 | | | $ | 85,801 | | | $ | 8,841 | |
| | |
| American Funds Tax-Exempt Funds | 83 |
Statements of changes in net assets
| | | American Funds
Short-Term
Tax-Exempt Bond Fund | | | Limited Term
Tax-Exempt Bond
Fund of America | | | The Tax-Exempt
Bond Fund
of America | |
| | | Six months
ended
January 31,
2020* | | | Year ended
July 31,
2019 | | | Six months
ended
January 31,
2020* | | | Year ended
July 31,
2019 | | | Six months
ended
January 31,
2020* | | | Year ended
July 31,
2019 | |
| Operations: | | | | | | | | | | | | | | | | | | | | | | | | |
| Net investment income | | $ | 8,518 | | | $ | 17,329 | | | $ | 39,441 | | | $ | 82,425 | | | $ | 298,931 | | | $ | 574,456 | |
| Net realized gain (loss) | | | 2,117 | | | | 62 | | | | 10,816 | | | | 13,065 | | | | (4,116 | ) | | | 11,303 | |
| Net unrealized appreciation | | | 2,897 | | | | 18,116 | | | | 31,120 | | | | 94,262 | | | | 434,461 | | | | 726,430 | |
| Net increase in net assets resulting from operations | | | 13,532 | | | | 35,507 | | | | 81,377 | | | | 189,752 | | | | 729,276 | | | | 1,312,189 | |
| | | | | | | | | | | | | | | | | | | | | | | | | |
| Distributions paid or accrued to shareholders | | | (8,471 | ) | | | (17,259 | ) | | | (54,423 | ) | | | (82,197 | ) | | | (297,617 | ) | | | (570,280 | ) |
| | | | | | | | | | | | | | | | | | | | | | | | | |
| Net capital share transactions | | | 74,860 | | | | 143,943 | | | | 323,742 | | | | 179,942 | | | | 2,362,610 | | | | 1,875,666 | |
| | | | | | | | | | | | | | | | | | | | | | | | | |
| Total increase in net assets | | | 79,921 | | | | 162,191 | | | | 350,696 | | | | 287,497 | | | | 2,794,269 | | | | 2,617,575 | |
| | | | | | | | | | | | | | | | | | | | | | | | | |
| Net assets: | | | | | | | | | | | | | | | | | | | | | | | | |
| Beginning of period | | | 1,140,378 | | | | 978,187 | | | | 4,252,808 | | | | 3,965,311 | | | | 21,645,637 | | | | 19,028,062 | |
| End of period | | $ | 1,220,299 | | | $ | 1,140,378 | | | $ | 4,603,504 | | | $ | 4,252,808 | | | $ | 24,439,906 | | | $ | 21,645,637 | |
See notes to financial statements.
| 84 | American Funds Tax-Exempt Funds |
(dollars in thousands)
American
High-Income
Municipal Bond Fund | | | The Tax-Exempt
Fund of
California | | | American Funds
Tax-Exempt Fund
of New York | |
Six months
ended
January 31,
2020* | | | Year ended
July 31,
2019 | | | Six months
ended
January 31,
2020* | | | Year ended
July 31,
2019 | | | Six months
ended
January 31,
2020* | | | Year ended
July 31,
2019 | |
| | | | | | | | | | | | | | | | | | | | | | | |
| $ | 145,835 | | | $ | 257,928 | | | $ | 33,519 | | | $ | 67,429 | | | $ | 3,559 | | | $ | 6,510 | |
| | 4,760 | | | | (4,530 | ) | | | 10,362 | | | | 4,454 | | | | 207 | | | | 73 | |
| | 170,433 | | | | 249,037 | | | | 41,920 | | | | 82,681 | | | | 5,075 | | | | 9,697 | |
| | 321,028 | | | | 502,435 | | | | 85,801 | | | | 154,564 | | | | 8,841 | | | | 16,280 | |
| | (144,221 | ) | | | (253,695 | ) | | | (47,698 | ) | | | (66,970 | ) | | | (3,529 | ) | | | (6,466 | ) |
| | 768,429 | | | | 1,012,098 | | | | 248,436 | | | | 233,925 | | | | 22,938 | | | | 26,639 | |
| | 945,236 | | | | 1,260,838 | | | | 286,539 | | | | 321,519 | | | | 28,250 | | | | 36,453 | |
| | | | | | | | | | | | | | | | | | | | | | | |
| | 7,752,254 | | | | 6,491,416 | | | | 2,576,881 | | | | 2,255,362 | | | | 274,954 | | | | 238,501 | |
| $ | 8,697,490 | | | $ | 7,752,254 | | | $ | 2,863,420 | | | $ | 2,576,881 | | | $ | 303,204 | | | $ | 274,954 | |
| | |
| American Funds Tax-Exempt Funds | 85 |
| Notes to financial statements | unaudited |
1. Organization
American Funds Short-Term Tax-Exempt Bond Fund, Limited Term Tax-Exempt Bond Fund of America, The Tax-Exempt Bond Fund of America, American High-Income Municipal Bond Fund, The Tax-Exempt Fund of California, which is presently the only series of The American Funds Tax-Exempt Series II, and American Funds Tax-Exempt Fund of New York (each a “fund” or collectively, the “funds”), are registered under the Investment Company Act of 1940 as open-end, diversified management investment companies.
Each fund’s investment objectives are as follows:
American Funds Short-Term Tax-Exempt Bond Fund— Seeks to provide current income exempt from regular federal income tax, consistent with the maturity and quality standards described in the prospectus, and to preserve capital.
Limited Term Tax-Exempt Bond Fund of America— Seeks to provide current income exempt from regular federal income tax, consistent with the maturity and quality standards described in the prospectus, and to preserve capital.
The Tax-Exempt Bond Fund of America— Seeks to provide a high level of current income exempt from federal income tax, consistent with the preservation of capital.
American High-Income Municipal Bond Fund— Seeks to provide a high level of current income exempt from regular federal income tax.
The Tax-Exempt Fund of California— Seeks to provide a high level of current income exempt from regular federal and California state income taxes. Its secondary objective is preservation of capital.
American Funds Tax-Exempt Fund of New York— Seeks to provide a high level of current income exempt from regular federal, New York state and New York City income taxes. Its secondary objective is preservation of capital.
American Funds Short-Term Tax-Exempt Bond Fund has six share classes consisting of five retail share classes (Classes A and T, as well as three F share classes, F-1, F-2 and F-3) and one share class that is only available to the American Funds Portfolio Series (Class R-6). Limited Term Tax-Exempt Bond Fund of America, The Tax-Exempt Bond Fund of America and American High-Income Municipal Bond Fund each have seven share classes consisting of six retail share classes (Classes A, C and T, as well as three F share classes, F-1, F-2 and F-3) and one share class that is only available to the American Funds Portfolio Series (Class R-6). The Tax-Exempt Fund of California and American Funds Tax-Exempt Fund of New York each have six retail share classes (Classes A, C and T, as well as three F share classes, F-1, F-2 and F-3). Some share classes are only available to limited categories of investors. The funds’ share classes are described further in the following table:
| Share class | | Initial sales charge | | Contingent deferred sales
charge upon redemption | | Conversion feature | |
| Class A | | Up to 2.50% for American Funds Short-Term Tax-Exempt Bond Fund and Limited Term Tax-Exempt Bond Fund of America; up to 3.75% for all other funds | | None (except 1% for certain redemptions within 18 months of purchase without an initial sales charge) | | None | |
| Class C* | | None | | 1% for redemptions within one year of purchase | | Class C converts to Class F-1 after 10 years | |
| Class T† | | Up to 2.50% | | None | | None | |
| Classes F-1, F-2 and F-3 | | None | | None | | None | |
| Class R-6 | | None | | None | | None | |
| * | Class C shares are not available for purchase in Limited Term Tax-Exempt Bond Fund of America. |
| † | Class T shares are not available for purchase. |
Holders of all share classes of each fund have equal pro rata rights to the assets, dividends and liquidation proceeds of each fund held. Each share class of each fund has identical voting rights, except for the exclusive right to vote on matters affecting only its class. Share classes have different fees and expenses (“class-specific fees and expenses”), primarily due to different arrangements for distribution, transfer agent and administrative services. Differences in class-specific fees and expenses will result in differences in net investment income and, therefore, the payment of different per-share dividends by each share class of each fund.
| 86 | American Funds Tax-Exempt Funds |
2. Significant accounting policies
Each fund is an investment company that applies the accounting and reporting guidance issued in Topic 946 by the U.S. Financial Accounting Standards Board. Each fund’s financial statements have been prepared to comply with U.S. generally accepted accounting principles (“U.S. GAAP”). These principles require the funds’ investment adviser to make estimates and assumptions that affect reported amounts and disclosures. Actual results could differ from those estimates. Subsequent events, if any, have been evaluated through the date of issuance in the preparation of the financial statements. The funds follow the significant accounting policies described in this section, as well as the valuation policies described in the next section on valuation.
Security transactions and related investment income— Security transactions are recorded by the funds as of the date the trades are executed with brokers. Realized gains and losses from security transactions are determined based on the specific identified cost of the securities. In the event a security is purchased with a delayed payment date, the funds will segregate liquid assets sufficient to meet their payment obligations. Interest income is recognized on an accrual basis. Market discounts, premiums and original issue discounts on fixed-income securities are amortized daily over the expected life of the security.
Class allocations —Income, fees and expenses (other than class-specific fees and expenses) are allocated daily among the various share classes of each fund based on the relative value of their settled shares. Realized and unrealized gains and losses are allocated daily among the various share classes of each fund based on their relative net assets. Class-specific fees and expenses, such as distribution, transfer agent and administrative services, are charged directly to the respective share class of each fund.
Distributions paid or accrued to shareholders— Income dividends are declared daily after the determination of each fund’s net investment income and are paid to shareholders monthly. Capital gain distributions are recorded on each fund’s ex-dividend date.
3. Valuation
Capital Research and Management Company (“CRMC”), the funds’ investment adviser, values each fund’s investments at fair value as defined by U.S. GAAP. The net asset value of each share class of each fund is generally determined as of approximately 4:00 p.m. New York time each day the New York Stock Exchange is open.
Methods and inputs— The funds’ investment adviser uses the following methods and inputs to establish the fair value of each fund’s assets and liabilities. Use of particular methods and inputs may vary over time based on availability and relevance as market and economic conditions evolve.
Fixed-income securities, including short-term securities, are generally valued at prices obtained from one or more pricing vendors. Vendors value such securities based on one or more of the following inputs: benchmark yields, transactions, bids, offers, quotations from dealers and trading systems, new issues, spreads and other relationships observed in the markets among comparable securities; and proprietary pricing models such as yield measures calculated using factors such as cash flows, financial or collateral performance and other reference data. For certain distressed securities, valuations may include cash flows or liquidation values using a net present value calculation based on inputs that include, but are not limited to, financial statements and debt contracts.
When the funds’ investment adviser deems it appropriate to do so (such as when vendor prices are unavailable or not deemed to be representative), fixed-income securities will be valued in good faith at the mean quoted bid and ask prices that are reasonably and timely available (or bid prices, if ask prices are not available) or at prices for securities of comparable maturity, quality and type. Some securities may be valued based on their effective maturity or average life, which may be shorter than the stated maturity.
Exchange-traded futures are generally valued at the official settlement price of the exchange or market on which such instruments are traded, as of the close of business on the day the futures are being valued.
Securities and other assets for which representative market quotations are not readily available or are considered unreliable by the funds’ investment adviser are fair valued as determined in good faith under fair valuation guidelines adopted by authority of each fund’s board of trustees as further described. The investment adviser follows fair valuation guidelines, consistent with U.S. Securities and Exchange Commission rules and guidance, to consider relevant principles and factors when making fair value determinations. The investment adviser considers relevant indications of value that are reasonably and timely available to it in determining the fair value to be assigned to a particular security, such as the type and cost of the security; contractual or legal restrictions on resale of the security; relevant financial or business developments of the issuer; actively traded similar or related securities; conversion or exchange rights on the security; related corporate actions; significant events occurring after the close of trading in the security; and changes in overall market conditions. In addition, the closing prices of equity securities that trade in markets outside U.S. time zones may be adjusted to reflect significant events that occur after the close of local trading but before the net asset value of each share class of the fund is determined. Fair valuations and valuations of investments that are not actively trading involve judgment and may differ materially from valuations that would have been used had greater market activity occurred.
| American Funds Tax-Exempt Funds | 87 |
Processes and structure— Each fund’s board of trustees has delegated authority to the funds’ investment adviser to make fair value determinations, subject to board oversight. The investment adviser has established a Joint Fair Valuation Committee (the “Fair Valuation Committee”) to administer, implement and oversee the fair valuation process, and to make fair value decisions. The Fair Valuation Committee regularly reviews its own fair value decisions, as well as decisions made under its standing instructions to the investment adviser’s valuation teams. The Fair Valuation Committee reviews changes in fair value measurements from period to period and may, as deemed appropriate, update the fair valuation guidelines to better reflect the results of back testing and address new or evolving issues. The Fair Valuation Committee reports any changes to the fair valuation guidelines to the boards of trustees. Each fund’s board and audit committee also regularly review reports that describe fair value determinations and methods.
The funds’ investment adviser has also established a Fixed-Income Pricing Review Group to administer and oversee the fixed-income valuation process, including the use of fixed-income pricing vendors. This group regularly reviews pricing vendor information and market data. Pricing decisions, processes and controls over security valuation are also subject to additional internal reviews, including an annual control self-evaluation program facilitated by the investment adviser’s compliance group.
Classifications— The funds’ investment adviser classifies each fund’s assets and liabilities into three levels based on the inputs used to value the assets or liabilities. Level 1 values are based on quoted prices in active markets for identical securities. Level 2 values are based on significant observable market inputs, such as quoted prices for similar securities and quoted prices in inactive markets. Certain securities trading outside the U.S. may transfer between Level 1 and Level 2 due to valuation adjustments resulting from significant market movements following the close of local trading. Level 3 values are based on significant unobservable inputs that reflect the investment adviser’s determination of assumptions that market participants might reasonably use in valuing the securities. The valuation levels are not necessarily an indication of the risk or liquidity associated with the underlying investment. For example, U.S. government securities are reflected as Level 2 because the inputs used to determine fair value may not always be quoted prices in an active market.
The following tables present the funds’ valuation levels as of January 31, 2020 (dollars in thousands):
American Funds Short-Term Tax-Exempt Bond Fund
| | | Investment securities | |
| | | Level 1 | | | Level 2 | | | Level 3 | | | Total | |
| Assets: | | | | | | | | | | | | | | | | |
| Bonds, notes & other debt instruments: | | | | | | | | | | | | | | | | |
| Texas | | $ | — | | | $ | 201,695 | | | $ | — | | | $ | 201,695 | |
| New York | | | — | | | | 75,290 | | | | — | | | | 75,290 | |
| Illinois | | | — | | | | 69,756 | | | | — | | | | 69,756 | |
| Florida | | | — | | | | 66,633 | | | | — | | | | 66,633 | |
| Pennsylvania | | | — | | | | 48,065 | | | | — | | | | 48,065 | |
| Washington | | | — | | | | 44,087 | | | | — | | | | 44,087 | |
| North Carolina | | | — | | | | 37,272 | | | | — | | | | 37,272 | |
| Wisconsin | | | — | | | | 29,977 | | | | — | | | | 29,977 | |
| New Jersey | | | — | | | | 29,153 | | | | — | | | | 29,153 | |
| Minnesota | | | — | | | | 26,914 | | | | — | | | | 26,914 | |
| Other | | | — | | | | 445,751 | | | | — | | | | 445,751 | |
| Short-term securities | | | — | | | | 184,639 | | | | — | | | | 184,639 | |
| Total | | $ | — | | | $ | 1,259,232 | | | $ | — | | | $ | 1,259,232 | |
| | | | | | | | | | |
| | | Other investments* | |
| | | Level 1 | | | Level 2 | | | Level 3 | | | Total | |
| Assets: | | | | | | | | | | | | | | | | |
| Unrealized appreciation on futures contracts | | $ | 1,207 | | | $ | — | | | $ | — | | | $ | 1,207 | |
| | |
| 88 | American Funds Tax-Exempt Funds |
Limited Term Tax-Exempt Bond Fund of America
| | | Investment securities | |
| | | Level 1 | | | Level 2 | | | Level 3 | | | Total | |
| Assets: | | | | | | | | | | | | | | | | |
| Bonds, notes & other debt instruments: | | | | | | | | | | | | | | | | |
| Texas | | $ | — | | | $ | 525,686 | | | $ | — | | | $ | 525,686 | |
| Illinois | | | — | | | | 449,212 | | | | — | | | | 449,212 | |
| New York | | | — | | | | 265,591 | | | | — | | | | 265,591 | |
| Florida | | | — | | | | 246,890 | | | | — | | | | 246,890 | |
| Pennsylvania | | | — | | | | 216,641 | | | | — | | | | 216,641 | |
| California | | | — | | | | 173,451 | | | | — | | | | 173,451 | |
| Colorado | | | — | | | | 144,276 | | | | — | | | | 144,276 | |
| New Jersey | | | — | | | | 143,357 | | | | — | | | | 143,357 | |
| Michigan | | | — | | | | 137,622 | | | | — | | | | 137,622 | |
| Wisconsin | | | — | | | | 132,562 | | | | — | | | | 132,562 | |
| Other | | | — | | | | 1,539,286 | | | | — | | | | 1,539,286 | |
| Short-term securities | | | — | | | | 734,358 | | | | — | | | | 734,358 | |
| Total | | $ | — | | | $ | 4,708,932 | | | $ | — | | | $ | 4,708,932 | |
| | | | | | | | | | |
| | | Other investments* | |
| | | Level 1 | | | Level 2 | | | Level 3 | | | Total | |
| Assets: | | | | | | | | | | | | | | | | |
| Unrealized appreciation on futures contracts | | $ | 4,995 | | | $ | — | | | $ | — | | | $ | 4,995 | |
| Liabilities: | | | | | | | | | | | | | | | | |
| Unrealized depreciation on futures contracts | | | (724 | ) | | | — | | | | — | | | | (724 | ) |
| Total | | $ | 4,271 | | | $ | — | | | $ | — | | | $ | 4,271 | |
The Tax-Exempt Bond Fund of America
| | | Investment securities | |
| | | Level 1 | | | Level 2 | | | Level 3 | | | Total | |
| Assets: | | | | | | | | | | | | | | | | |
| Bonds, notes & other debt instruments: | | | | | | | | | | | | | | | | |
| Illinois | | $ | — | | | $ | 3,162,246 | | | $ | — | | | $ | 3,162,246 | |
| Texas | | | — | | | | 2,777,150 | | | | — | | | | 2,777,150 | |
| New York | | | — | | | | 1,843,482 | | | | — | | | | 1,843,482 | |
| Florida | | | — | | | | 1,571,897 | | | | 4,911 | | | | 1,576,808 | |
| California | | | — | | | | 1,516,592 | | | | — | | | | 1,516,592 | |
| Pennsylvania | | | — | | | | 1,231,774 | | | | — | | | | 1,231,774 | |
| Michigan | | | — | | | | 1,029,076 | | | | — | | | | 1,029,076 | |
| Washington | | | — | | | | 638,694 | | | | — | | | | 638,694 | |
| Georgia | | | — | | | | 631,852 | | | | — | | | | 631,852 | |
| Ohio | | | — | | | | 595,409 | | | | — | | | | 595,409 | |
| Other | | | — | | | | 8,253,125 | | | | — | | | | 8,253,125 | |
| Short-term securities | | | — | | | | 1,308,655 | | | | — | | | | 1,308,655 | |
| Total | | $ | — | | | $ | 24,559,952 | | | $ | 4,911 | | | $ | 24,564,863 | |
| | | | | | | | | | |
| | | Other investments* | |
| | | Level 1 | | | Level 2 | | | Level 3 | | | Total | |
| Assets: | | | | | | | | | | | | | | | | |
| Unrealized appreciation on futures contracts | | $ | 10,186 | | | $ | — | | | $ | — | | | $ | 10,186 | |
| Liabilities: | | | | | | | | | | | | | | | | |
| Unrealized depreciation on futures contracts | | | (18,031 | ) | | | — | | | | — | | | | (18,031 | ) |
| Total | | $ | (7,845 | ) | | $ | — | | | $ | — | | | $ | (7,845 | ) |
See end of tables for footnote.
| American Funds Tax-Exempt Funds | 89 |
American High-Income Municipal Bond Fund
| | | Investment securities | |
| | | Level 1 | | | Level 2 | | | Level 3 | | | Total | |
| Assets: | | | | | | | | | | | | | | | | |
| Bonds, notes & other debt instruments: | | | | | | | | | | | | | | | | |
| Illinois | | $ | — | | | $ | 1,290,567 | | | $ | — | | | $ | 1,290,567 | |
| Colorado | | | — | | | | 525,236 | | | | — | | | | 525,236 | |
| Pennsylvania | | | — | | | | 476,111 | | | | — | | | | 476,111 | |
| Puerto Rico | | | — | | | | 472,338 | | | | — | | | | 472,338 | |
| Texas | | | — | | | | 469,724 | | | | — | | | | 469,724 | |
| Florida | | | — | | | | 457,276 | | | | 4,975 | | | | 462,251 | |
| California | | | — | | | | 416,875 | | | | — | | | | 416,875 | |
| Ohio | | | — | | | | 402,297 | | | | — | | | | 402,297 | |
| New Jersey | | | — | | | | 367,381 | | | | — | | | | 367,381 | |
| New York | | | — | | | | 283,978 | | | | — | | | | 283,978 | |
| Other | | | — | | | | 2,973,093 | | | | 2,230 | | | | 2,975,323 | |
| Short-term securities | | | — | | | | 564,035 | | | | — | | | | 564,035 | |
| Total | | $ | — | | | $ | 8,698,911 | | | $ | 7,205 | | | $ | 8,706,116 | |
| | | | | | | | | | |
| | | Other investments* | |
| | | Level 1 | | | Level 2 | | | Level 3 | | | Total | |
| Assets: | | | | | | | | | | | | | | | | |
| Unrealized appreciation on futures contracts | | $ | 2,586 | | | $ | — | | | $ | — | | | $ | 2,586 | |
| Liabilities: | | | | | | | | | | | | | | | | |
| Unrealized depreciation on futures contracts | | | (4,167 | ) | | | — | | | | — | | | | (4,167 | ) |
| Total | | $ | (1,581 | ) | | $ | — | | | $ | — | | | $ | (1,581 | ) |
The Tax-Exempt Fund of California
| | | Investment securities | |
| | | Level 1 | | | Level 2 | | | Level 3 | | | Total | |
| Assets: | | | | | | | | | | | | | | | | |
| Bonds, notes & other debt instruments: | | | | | | | | | | | | | | | | |
| State issuers | | $ | — | | | $ | 965,425 | | | $ | — | | | $ | 965,425 | |
| City, county & other issuers | | | — | | | | 1,598,184 | | | | — | | | | 1,598,184 | |
| Guam | | | — | | | | 13,564 | | | | — | | | | 13,564 | |
| Puerto Rico | | | — | | | | 22,781 | | | | — | | | | 22,781 | |
| United States | | | — | | | | 19,171 | | | | — | | | | 19,171 | |
| Short-term securities | | | — | | | | 221,735 | | | | — | | | | 221,735 | |
| Total | | $ | — | | | $ | 2,840,860 | | | $ | — | | | $ | 2,840,860 | |
| | | | | | | | | | |
| | | Other investments* | |
| | | Level 1 | | | Level 2 | | | Level 3 | | | Total | |
| Assets: | | | | | | | | | | | | | | | | |
| Unrealized appreciation on futures contracts | | $ | 2,046 | | | $ | — | | | $ | — | | | $ | 2,046 | |
| Liabilities: | | | | | | | | | | | | | | | | |
| Unrealized depreciation on futures contracts | | | (387 | ) | | | — | | | | — | | | | (387 | ) |
| Total | | $ | 1,659 | | | $ | — | | | $ | — | | | $ | 1,659 | |
| | |
| * | Futures contracts are not included in the investment portfolio. |
American Funds Tax-Exempt Fund of New York
At January 31, 2020, all of the fund’s investment securities were classified as Level 2.
| 90 | American Funds Tax-Exempt Funds |
4. Risk factors
Investing in each fund may involve certain risks including, but not limited to, those described below.
Market conditions— The prices of, and the income generated by, the securities held by the funds may decline — sometimes rapidly or unpredictably — due to various factors, including events or conditions affecting the general economy or particular industries; overall market changes; local, regional or global political, social or economic instability; governmental, governmental agency or central bank responses to economic conditions; and currency exchange rate, interest rate and commodity price fluctuations.
Issuer risks— The prices of, and the income generated by, securities held by the funds may decline in response to various factors directly related to the issuers of such securities, including reduced demand for an issuer’s goods or services, poor management performance, major litigation related to the issuer, changes in government regulations affecting the issuer or its competitive environment and strategic initiatives such as mergers, acquisitions or dispositions and the market response to any such initiatives.
Investing in municipal securities— The yield and/or value of the funds’ investments in municipal securities may be adversely affected by events tied to the municipal securities markets, which can be very volatile and significantly impacted by unfavorable legislative or political developments and negative changes in the financial conditions of municipal securities issuers and the economy. To the extent the funds invest in obligations of a municipal issuer, the volatility, credit quality and performance of the funds may be adversely impacted by local political and economic conditions of the issuer. For example, a credit rating downgrade, bond default or bankruptcy involving an issuer within a particular state or territory could affect the market values and marketability of many or all municipal obligations of that state or territory. Income from municipal securities held by the funds could also be declared taxable because of changes in tax laws or interpretations by taxing authorities or as a result of noncompliant conduct of a municipal issuer. Additionally, the relative amount of publicly available information about municipal securities is generally less than that for corporate securities.
Investing in debt instruments— The prices of, and the income generated by, bonds and other debt securities held by the funds may be affected by changing interest rates and by changes in the effective maturities and credit ratings of these securities.
Rising interest rates will generally cause the prices of bonds and other debt securities to fall. A general rise in interest rates may cause investors to sell debt securities on a large scale, which could also adversely affect the price and liquidity of debt securities and could also result in increased redemptions from the funds. Falling interest rates may cause an issuer to redeem, call or refinance a debt security before its stated maturity, which may result in the funds failing to recoup the full amount of its initial investment and having to reinvest the proceeds in lower yielding securities. Longer maturity debt securities generally have greater sensitivity to changes in interest rates and may be subject to greater price fluctuations than shorter maturity debt securities.
Bonds and other debt securities are also subject to credit risk, which is the possibility that the credit strength of an issuer or guarantor will weaken or be perceived to be weaker, and/or an issuer of a debt security will fail to make timely payments of principal or interest and the security will go into default. A downgrade or default affecting any of the fund’s securities could cause the value of the fund’s shares to decrease. Lower quality debt securities generally have higher rates of interest and may be subject to greater price fluctuations than higher quality debt securities. Credit risk is gauged, in part, by the credit ratings of the debt securities in which the funds invest. However, ratings are only the opinions of the rating agencies issuing them and are not guarantees as to credit quality or an evaluation of market risk. The funds’ investment adviser relies on its own credit analysts to research issuers and issues in seeking to assess credit and default risks.
Liquidity risk— Certain fund holdings may be or become difficult or impossible to sell, particularly during times of market turmoil. Liquidity may be impacted by the lack of an active market for a holding, legal or contractual restrictions on resale, or the reduced number and capacity of market participants to make a market in such holding. Market prices for less liquid or illiquid holdings may be volatile, and reduced liquidity may have an adverse impact on the market price of such holdings. Additionally, the sale of less liquid or illiquid holdings may involve substantial delays (including delays in settlement) and additional costs and the fund may be unable to sell such holdings when necessary to meet its liquidity needs or may be forced to sell at a loss.
Credit and liquidity support— Changes in the credit quality of banks and financial institutions providing credit and liquidity support features with respect to securities held by the funds could cause the values of these securities to decline.
| American Funds Tax-Exempt Funds | 91 |
Investing in lower rated debt instruments— Lower rated bonds and other lower rated debt securities generally have higher rates of interest and involve greater risk of default or price declines due to changes in the issuer’s creditworthiness than those of higher quality debt securities. The market prices of these securities may fluctuate more than the prices of higher quality debt securities and may decline significantly in periods of general economic difficulty. These risks may be increased with respect to investments in junk bonds.
Investing in similar municipal bonds— Investing significantly in municipal obligations of multiple issuers in the same state or backed by revenues of similar types of projects or industries may make the funds more susceptible to certain economic, political or regulatory occurrences. As a result, the potential for fluctuations in the funds’ share price may increase.
Risks of investing in municipal bonds of issuers within the state of California— Because The Tax-Exempt Fund of California invests primarily in securities of issuers within the state of California, the fund is more susceptible to factors adversely affecting issuers of California securities than a comparable municipal bond mutual fund that does not concentrate its investments in a single state. For example, in the past, California voters have passed amendments to the state’s constitution and other measures that limit the taxing and spending authority of California governmental entities, and future voter initiatives may adversely affect California municipal bonds.
Risks of investing in municipal bonds of issuers within the state of New York— Because American Funds Tax-Exempt Fund of New York invests primarily in securities of issuers within the state of New York, the fund is more susceptible to factors adversely affecting issuers of New York securities than a comparable municipal bond mutual fund that does not concentrate its investments in a single state. For example, such factors may include political policy changes, tax base erosion, state constitutional limits on tax increases, budget deficits and other financial or economic difficulties, and changes in the credit ratings assigned to New York’s municipal issuers. New York’s economy and finances may be especially vulnerable to changes in the performance of the financial services sector, which historically has been volatile.
Management— The investment adviser to the funds actively manages the funds’ investments. Consequently, the funds are subject to the risk that the methods and analyses, including models, tools and data, employed by the investment adviser in this process may be flawed or incorrect and may not produce the desired results. This could cause the funds to lose value or their investment results to lag relevant benchmarks or other funds with similar objectives.
5. Certain investment techniques
Unfunded commitments— American High-Income Municipal Bond Fund has participated in transactions that involve unfunded commitments, which may obligate the fund to purchase new or additional bonds if certain contingencies are met. As of January 31, 2020, the maximum exposure of unfunded bond commitments for American High-Income Municipal Bond Fund was $2,077,000, which would represent .02% of the net assets of the fund should such commitments become due.
Futures contracts— Each fund has entered into futures contracts, which provide for the future sale by one party and purchase by another party of a specified amount of a specific financial instrument for a specified price, date, time and place designated at the time the contract is made. Futures contracts are used to strategically manage the fund’s interest rate sensitivity by increasing or decreasing the duration of the fund or a portion of the fund’s portfolio.
Upon entering into futures contracts, and to maintain the fund’s open positions in futures contracts, each fund is required to deposit with a futures broker, known as a futures commission merchant (“FCM”), in a segregated account in the name of the FCM an amount of cash, U.S. government securities or other liquid securities, known as initial margin. The margin required for a particular futures contract is set by the exchange on which the contract is traded to serve as collateral, and may be significantly modified from time to time by the exchange during the term of the contract.
On a daily basis, each fund pays or receives variation margin based on the increase or decrease in the value of the futures contracts and records variation margin on futures contracts in the statement of assets and liabilities. In addition, each fund segregates liquid assets equivalent to each fund’s outstanding obligations under the contract in excess of the initial margin and variation margin, if any. Futures contracts may involve a risk of loss in excess of the variation margin shown on each fund’s statement of assets and liabilities. Each fund records realized gains or losses at the time the futures contract is closed or expires. Net realized gains or losses and net unrealized appreciation or depreciation from futures contracts are recorded in each fund’s statement of operations.
| 92 | American Funds Tax-Exempt Funds |
The following table presents the average month-end notional amount of futures contracts while held for each fund (dollars in thousands):
| | Futures
contracts | |
| American Funds Short-Term Tax-Exempt Bond Fund | $ 210,592 | |
| Limited Term Tax-Exempt Bond Fund of America | 706,658 | |
| The Tax-Exempt Bond Fund of America | 2,350,867 | |
| American High-Income Municipal Bond Fund | 665,217 | |
| The Tax-Exempt Fund of California | 287,664 | |
| American Funds Tax-Exempt Fund of New York | 2,500 | * |
| * | No contracts were held at the end of the reporting period; amount represents the average month-end notional amount of contracts while they were held. |
The following tables identify the location of and fair value amounts on the funds’ statements of assets and liabilities and the effect on the funds’ statements of operations resulting from the funds’ use of futures contracts as of, or for the six months ended, January 31, 2020 (dollars in thousands):
American Funds Short-Term Tax-Exempt Bond Fund
| | | | | Assets | | | Liabilities | |
| Contracts | | Risk type | | Location on statement of
assets and liabilities | | Value | | | Location on statement of
assets and liabilities | | Value | |
| Futures | | Interest | | Unrealized appreciation* | | $ | 1,207 | | | Unrealized depreciation* | | $ | — | |
| |
| | | | | Net realized loss | | | Net unrealized appreciation | |
| Contracts | | Risk type | | Location on statement of
operations | | | Value | | | Location on statement of
operations | | | Value | |
| Futures | | Interest | | Net realized loss on futures contracts | | $ | (48 | ) | | Net unrealized appreciation on futures contracts | | $ | 1,198 | |
| | | | | | | | | | | | | | | |
| Limited Term Tax-Exempt Bond Fund of America |
| | | | | | | | | | | | | | | |
| | | | | Assets | | | Liabilities | |
| Contracts | | Risk type | | Location on statement of
assets and liabilities | | | Value | | | Location on statement of
assets and liabilities | | | Value | |
| Futures | | Interest | | Unrealized appreciation* | | $ | 4,995 | | | Unrealized depreciation* | | $ | 724 | |
| |
| | | | | Net realized loss | | | Net unrealized appreciation | |
| Contracts | | Risk type | | Location on statement of
operations | | | Value | | | Location on statement of
operations | | | Value | |
| Futures | | Interest | | Net realized loss on futures contracts | | $ | (2,354 | ) | | Net unrealized appreciation on futures contracts | | $ | 6,066 | |
| | | | | | | | | | | | | | | |
| The Tax-Exempt Bond Fund of America |
| | | | | | | | | | | | | | | |
| | | | | Assets | | | Liabilities | |
| Contracts | | Risk type | | Location on statement of
assets and liabilities | | | Value | | | Location on statement of
assets and liabilities | | | Value | |
| Futures | | Interest | | Unrealized appreciation* | | $ | 10,186 | | | Unrealized depreciation* | | $ | 18,031 | |
| |
| | | | | Net realized loss | | | Net unrealized appreciation | |
| Contracts | | Risk type | | Location on statement of
operations | | | Value | | | Location on statement of
operations | | | Value | |
| Futures | | Interest | | Net realized loss on futures contracts | | $ | (19,340 | ) | | Net unrealized appreciation on futures contracts | | $ | 1,342 | |
See end of tables for footnote.
| American Funds Tax-Exempt Funds | 93 |
American High-Income Municipal Bond Fund
| | | | | Assets | | | Liabilities | |
| Contracts | | Risk type | | Location on statement of
assets and liabilities | | Value | | | Location on statement of
assets and liabilities | | Value | |
| Futures | | Interest | | Unrealized appreciation* | | $ | 2,586 | | | Unrealized depreciation* | | $ | 4,167 | |
| |
| | | | | Net realized loss | | | Net unrealized depreciation | |
| Contracts | | Risk type | | Location on statement of
operations | | | Value | | | Location on statement of
operations | | | Value | |
| Futures | | Interest | | Net realized loss on futures contracts | | $ | (1,928 | ) | | Net unrealized depreciation on futures contracts | | $ | (1,216 | ) |
The Tax-Exempt Fund of California
| | | | | Assets | | | Liabilities | |
| Contracts | | Risk type | | Location on statement of
assets and liabilities | | | Value | | | Location on statement of
assets and liabilities | | | Value | |
| Futures | | Interest | | Unrealized appreciation* | | $ | 2,046 | | | Unrealized depreciation* | | $ | 387 | |
| |
| | | | | Net realized loss | | | Net unrealized appreciation | |
| Contracts | | Risk type | | Location on statement of
operations | | | Value | | | Location on statement of
operations | | | Value | |
| Futures | | Interest | | Net realized loss on futures contracts | | $ | (1,444 | ) | | Net unrealized appreciation on futures contracts | | $ | 2,825 | |
American Funds Tax-Exempt Fund of New York
| | | | | Net realized loss | | | Net unrealized appreciation | |
| Contracts | | Risk type | | Location on statement of
operations | | | Value | | | Location on statement of
operations | | | Value | |
| Futures | | Interest | | Net realized loss on futures contracts | | $ | (9 | ) | | Net unrealized appreciation on futures contracts | | $ | 2 | |
| * | Includes cumulative appreciation/depreciation on futures contracts as reported in the applicable table following each fund’s investment portfolio. Only current day’s variation margin is reported within each fund’s statement of assets and liabilities. |
Collateral— Each fund participates in a collateral program due to each fund’s use of futures contracts that calls for each fund to either receive or pledge highly liquid assets, such as cash or U.S. government securities, as collateral for initial and variation margin by contract. The purpose of the collateral is to cover potential losses that could occur in the event that either party cannot meet its contractual obligation. Non-cash collateral pledged by each fund, if any, is disclosed in each fund’s investment portfolio, and cash collateral pledged by each fund, if any, is held in a segregated account with each fund’s custodian, which is reflected as pledged cash collateral in each fund’s statement of assets and liabilities.
| 94 | American Funds Tax-Exempt Funds |
6. Taxation and distributions
Federal income taxation— Each fund complies with the requirements under Subchapter M of the Internal Revenue Code applicable to mutual funds and intends to distribute substantially all of its net tax-exempt income and net capital gains each year. Generally, income earned by each fund is exempt from federal income taxes; however, each fund may earn taxable income from certain investments. The funds are not subject to income taxes to the extent such taxable income and net capital gains are distributed. To the extent the funds recognize taxable income, the funds may pay tax on such income in lieu of making distributions; amounts paid are included within federal, state and local taxes on the funds’ statements of operations.
As of and during the period ended January 31, 2020, none of the funds had a liability for any unrecognized tax benefits. Each fund recognizes interest and penalties, if any, related to unrecognized tax benefits as income tax expense in their respective statements of operations. During the period, none of the funds incurred any significant interest or penalties.
Each fund’s tax returns are not subject to examination by federal, state and, if applicable, non-U.S. tax authorities after the expiration of each jurisdiction’s statute of limitations, which is generally three years after the date of filing but can be extended in certain jurisdictions.
Distributions— Distributions paid to shareholders are based on each fund’s net investment income and net realized gains determined on a tax basis, which may differ from net investment income and net realized gains for financial reporting purposes. These differences are due primarily to different treatment for items such as short-term capital gains and losses; capital losses related to sales of certain securities within 30 days of purchase; deferred expenses; cost of investments sold; net capital losses; amortization of premiums and discounts and income on certain investments. The fiscal year in which amounts are distributed may differ from the year in which the net investment income and net realized gains are recorded by the funds for financial reporting purposes.
Additional tax basis disclosures for each fund are as follows (dollars in thousands):
| | | American
Funds
Short-Term
Tax-Exempt
Bond Fund | | Limited Term
Tax-Exempt
Bond Fund
of America | | The
Tax-Exempt
Bond Fund
of America | | American
High-Income
Municipal
Bond Fund | | The
Tax-Exempt
Fund of
California | | American
Funds
Tax-Exempt
Fund of
New York |
| As of July 31, 2019 | | | | | | | | | | | | | | | | | | | | | | | | |
| Undistributed ordinary income | | $ | — | | | $ | 7,876 | | | $ | — | | | $ | — | | | $ | — | | | $ | — | |
| Undistributed tax-exempt income | | | 99 | | | | 574 | | | | 3,740 | | | | 2,766 | | | | 1,048 | | | | 124 | |
| Undistributed long-term capital gains | | | — | | | | 3,228 | | | | — | | | | — | | | | 2,323 | | | | — | |
| Capital loss carryforward* | | | (3,213 | ) | | | — | | | | (4,085 | ) | | | (6,497 | ) | | | — | | | | (5 | ) |
| As of January 31, 2020 | | | | | | | | | | | | | | | | | | | | | | | | |
| Gross unrealized appreciation on investments | | | 16,322 | | | | 138,842 | | | | 1,459,829 | | | | 603,483 | | | | 171,972 | | | | 18,186 | |
| Gross unrealized depreciation on investments | | | (75 | ) | | | (824 | ) | | | (31,013 | ) | | | (26,166 | ) | | | (1,022 | ) | | | — | |
| Net unrealized appreciation on investments | | | 16,247 | | | | 138,018 | | | | 1,428,816 | | | | 577,317 | | | | 170,950 | | | | 18,186 | |
| Cost of investments | | | 1,244,192 | | | | 4,575,185 | | | | 23,128,202 | | | | 8,127,218 | | | | 2,671,569 | | | | 286,704 | |
| * | Capital loss carryforwards will be used to offset any capital gains realized by the funds in the current year or in subsequent years. The funds will not make distributions from capital gains while a capital loss carryforward remains. |
| American Funds Tax-Exempt Funds | 95 |
The tax character of distributions paid or accrued to shareholders was as follows (dollars in thousands):
American Funds Short-Term Tax-Exempt Bond Fund
| | | Six months ended January 31, 2020 | | | Year ended July 31, 2019 | |
| Share class | | Tax-exempt
income | | | Ordinary
income | | | Long-term
capital gains | | | Total
distributions
paid or
accrued | | | Tax-exempt
income | | | Ordinary
income | | | Long-term
capital gains | | | Total
distributions
paid or
accrued | |
| Class A | | $ | 5,488 | | | $ | — | | | $ | — | | | $ | 5,488 | | | $ | 11,676 | | | $ | — | | | $ | — | | | $ | 11,676 | |
| Class T | | | — | * | | | — | | | | — | | | | — | * | | | — | * | | | — | | | | — | | | | — | * |
| Class F-1 | | | 41 | | | | — | | | | — | | | | 41 | | | | 90 | | | | — | | | | — | | | | 90 | |
| Class F-2 | | | 1,492 | | | | — | | | | — | | | | 1,492 | | | | 2,521 | | | | — | | | | — | | | | 2,521 | |
| Class F-3 | | | 401 | | | | — | | | | — | | | | 401 | | | | 825 | | | | — | | | | — | | | | 825 | |
| Class R-6 | | | 1,049 | | | | — | | | | — | | | | 1,049 | | | | 2,147 | | | | — | | | | — | | | | 2,147 | |
| Total | | $ | 8,471 | | | $ | — | | | $ | — | | | $ | 8,471 | | | $ | 17,259 | | | $ | — | | | $ | — | | | $ | 17,259 | |
Limited Term Tax-Exempt Bond Fund of America
| | | Six months ended January 31, 2020 | | | Year ended July 31, 2019 | |
| Share class | | Tax-exempt
income | | | Ordinary
income | | | Long-term
capital gains | | | Total
distributions
paid or
accrued | | | Tax-exempt
income | | | Ordinary
income | | | Long-term
capital gains | | | Total
distributions
paid or
accrued | |
| Class A | | $ | 26,868 | | | $ | 6,786 | | | $ | 4,004 | | | $ | 37,658 | | | $ | 58,861 | | | $ | — | | | $ | — | | | $ | 58,861 | |
| Class C | | | 86 | | | | 36 | | | | 21 | | | | 143 | | | | 241 | | | | — | | | | — | | | | 241 | |
| Class T | | | — | * | | | — | * | | | — | * | | | — | * | | | — | * | | | — | | | | — | | | | — | * |
| Class F-1 | | | 528 | | | | 135 | | | | 80 | | | | 743 | | | | 1,133 | | | | — | | | | — | | | | 1,133 | |
| Class F-2 | | | 5,260 | | | | 1,194 | | | | 704 | | | | 7,158 | | | | 9,544 | | | | — | | | | — | | | | 9,544 | |
| Class F-3 | | | 3,329 | | | | 721 | | | | 425 | | | | 4,475 | | | | 5,689 | | | | — | | | | — | | | | 5,689 | |
| Class R-6 | | | 3,184 | | | | 668 | | | | 394 | | | | 4,246 | | | | 6,729 | | | | — | | | | — | | | | 6,729 | |
| Total | | $ | 39,255 | | | $ | 9,540 | | | $ | 5,628 | | | $ | 54,423 | | | $ | 82,197 | | | $ | — | | | $ | — | | | $ | 82,197 | |
The Tax-Exempt Bond Fund of America
| | | Six months ended January 31, 2020 | | | Year ended July 31, 2019 | |
| Share class | | Tax-exempt
income | | | Ordinary
income | | | Long-term
capital gains | | | Total
distributions
paid or
accrued | | | Tax-exempt
income | | | Ordinary
income | | | Long-term
capital gains | | | Total
distributions
paid or
accrued | |
| Class A | | $ | 142,357 | | | $ | — | | | $ | — | | | $ | 142,357 | | | $ | 285,802 | | | $ | — | | | $ | — | | | $ | 285,802 | |
| Class C | | | 3,662 | | | | — | | | | — | | | | 3,662 | | | | 8,239 | | | | — | | | | — | | | | 8,239 | |
| Class T | | | — | * | | | — | | | | — | | | | — | * | | | — | * | | | — | | | | — | | | | — | * |
| Class F-1 | | | 4,160 | | | | — | | | | — | | | | 4,160 | | | | 9,154 | | | | — | | | | — | | | | 9,154 | |
| Class F-2 | | | 40,194 | | | | — | | | | — | | | | 40,194 | | | | 70,312 | | | | — | | | | — | | | | 70,312 | |
| Class F-3 | | | 96,974 | | | | — | | | | — | | | | 96,974 | | | | 178,363 | | | | — | | | | — | | | | 178,363 | |
| Class R-6 | | | 10,270 | | | | — | | | | — | | | | 10,270 | | | | 18,410 | | | | — | | | | — | | | | 18,410 | |
| Total | | $ | 297,617 | | | $ | — | | | $ | — | | | $ | 297,617 | | | $ | 570,280 | | | $ | — | | | $ | — | | | $ | 570,280 | |
| 96 | American Funds Tax-Exempt Funds |
American High-Income Municipal Bond Fund
| | | Six months ended January 31, 2020 | | | Year ended July 31, 2019 | |
| Share class | | Tax-exempt
income | | | Ordinary
income | | | Long-term
capital gains | | | Total
distributions
paid or
accrued | | | Tax-exempt
income | | | Ordinary
income | | | Long-term
capital gains | | | Total
distributions
paid or
accrued | |
| Class A | | $ | 79,545 | | | $ | — | | | $ | 4,226 | | | $ | 83,771 | | | $ | 151,825 | | | $ | — | | | $ | — | | | $ | 151,825 | |
| Class C | | | 3,109 | | | | — | | | | 207 | | | | 3,316 | | | | 6,528 | | | | — | | | | — | | | | 6,528 | |
| Class T | | | — | * | | | — | | | | — | * | | | — | * | | | — | * | | | — | | | | — | | | | — | * |
| Class F-1 | | | 2,987 | | | | — | | | | 158 | | | | 3,145 | | | | 6,426 | | | | — | | | | — | | | | 6,426 | |
| Class F-2 | | | 20,666 | | | | — | | | | 1,027 | | | | 21,693 | | | | 36,440 | | | | — | | | | — | | | | 36,440 | |
| Class F-3 | | | 17,455 | | | | — | | | | 852 | | | | 18,307 | | | | 28,978 | | | | — | | | | — | | | | 28,978 | |
| Class R-6 | | | 13,328 | | | | — | | | | 661 | | | | 13,989 | | | | 23,498 | | | | — | | | | — | | | | 23,498 | |
| Total | | $ | 137,090 | | | $ | — | | | $ | 7,131 | | | $ | 144,221 | | | $ | 253,695 | | | $ | — | | | $ | — | | | $ | 253,695 | |
The Tax-Exempt Fund of California
| | | Six months ended January 31, 2020 | | | Year ended July 31, 2019 | |
| Share class | | Tax-exempt
income | | | Ordinary
income | | | Long-term
capital gains | | | Total
distributions
paid or
accrued | | | Tax-exempt
income | | | Ordinary
income | | | Long-term
capital gains | | | Total
distributions
paid or
accrued | |
| Class A | | $ | 22,871 | | | $ | 1,734 | | | $ | 7,730 | | | $ | 32,335 | | | $ | 47,435 | | | $ | — | | | $ | — | | | $ | 47,435 | |
| Class C | | | 595 | | | | 63 | | | | 282 | | | | 940 | | | | 1,394 | | | | — | | | | — | | | | 1,394 | |
| Class T | | | — | * | | | — | * | | | — | * | | | — | * | | | — | * | | | — | | | | — | | | | — | * |
| Class F-1 | | | 864 | | | | 68 | | | | 301 | | | | 1,233 | | | | 1,952 | | | | — | | | | — | | | | 1,952 | |
| Class F-2 | | | 5,744 | | | | 415 | | | | 1,851 | | | | 8,010 | | | | 10,366 | | | | — | | | | — | | | | 10,366 | |
| Class F-3 | | | 3,727 | | | | 266 | | | | 1,187 | | | | 5,180 | | | | 5,823 | | | | — | | | | — | | | | 5,823 | |
| Total | | $ | 33,801 | | | $ | 2,546 | | | $ | 11,351 | | | $ | 47,698 | | | $ | 66,970 | | | $ | — | | | $ | — | | | $ | 66,970 | |
American Funds Tax-Exempt Fund of New York
| | | Six months ended January 31, 2020 | | | Year ended July 31, 2019 | |
| Share class | | Tax-exempt
income | | | Ordinary
income | | | Long-term
capital gains | | | Total
distributions
paid or
accrued | | | Tax-exempt
income | | | Ordinary
income | | | Long-term
capital gains | | | Total
distributions
paid or
accrued | |
| Class A | | $ | 2,543 | | | $ | — | | | $ | — | | | $ | 2,543 | | | $ | 4,715 | | | $ | — | | | $ | — | | | $ | 4,715 | |
| Class C | | | 98 | | | | — | | | | — | | | | 98 | | | | 201 | | | | — | | | | — | | | | 201 | |
| Class T | | | — | * | | | — | | | | — | | | | — | * | | | — | * | | | — | | | | — | | | | — | * |
| Class F-1 | | | 26 | | | | — | | | | — | | | | 26 | | | | 50 | | | | — | | | | — | | | | 50 | |
| Class F-2 | | | 419 | | | | — | | | | — | | | | 419 | | | | 687 | | | | — | | | | — | | | | 687 | |
| Class F-3 | | | 443 | | | | — | | | | — | | | | 443 | | | | 813 | | | | — | | | | — | | | | 813 | |
| Total | | $ | 3,529 | | | $ | — | | | $ | — | | | $ | 3,529 | | | $ | 6,466 | | | $ | — | | | $ | — | | | $ | 6,466 | |
| * | Amount less than one thousand. |
7. Fees and transactions with related parties
CRMC, the funds’ investment adviser, is the parent company of American Funds Distributors®, Inc. (“AFD”), the principal underwriter of the funds’ shares, and American Funds Service Company® (“AFS”), the funds’ transfer agent. CRMC, AFD and AFS are considered related parties to each fund.
Investment advisory services— Each fund has an investment advisory and service agreement with CRMC that provides for monthly fees accrued daily. These fees are based on annual rates that generally decrease as net asset levels increase. The agreement for each fund, except American Funds Short-Term Tax-Exempt Bond Fund, also provides for monthly fees accrued daily based on a series of decreasing rates on each fund’s monthly gross income.
| American Funds Tax-Exempt Funds | 97 |
The range of rates, net asset levels, gross income levels and annualized rates of average net assets for each fund are as follows:
| | | Rates | | | Net asset level
(in billions) | | Rates | | | Monthly gross income | | Annualized
rates for the
six months
ended | |
| Fund | | Beginning
with | | | Ending
with | | | Up to | | In excess
of | | Beginning
with | | | Ending
with | | | Up to | | In excess
of | | January 31,
2020 | |
| American Funds Short-Term Tax-Exempt Bond Fund | | | .341 | % | | | | | | | all | | | | | | | | | | | | | | | | | | | | .341 | % |
| Limited Term Tax-Exempt Bond Fund of America | | | .300 | | | | .150 | % | | $ | .06 | | $ | 1.0 | | | 3.00 | % | | | 2.50 | % | | $ | 3,333,333 | | $ | 3,333,333 | | | .220 | |
| The Tax-Exempt Bond Fund of America | | | .300 | | | | .110 | | | | .06 | | | 21.0 | | | 3.00 | | | | 2.00 | | | | 3,333,333 | | | 8,333,333 | | | .196 | |
| American High-Income Municipal Bond Fund | | | .300 | | | | .140 | | | | .06 | | | 6.0 | | | 3.00 | | | | 2.50 | | | | 3,333,333 | | | 3,333,333 | | | .268 | |
| The Tax-Exempt Fund of California | | | .300 | | | | .180 | | | | .06 | | | 1.0 | | | 3.00 | | | | 2.50 | | | | 3,333,333 | | | 3,333,333 | | | .276 | |
| American Funds Tax-Exempt Fund of New York | | | .204 | | | | | | | | all | | | | | | 3.00 | | | | 2.50 | | | | 3,333,333 | | | 3,333,333 | | | .295 | |
Class-specific fees and expenses— Expenses that are specific to individual share classes are accrued directly to the respective share class of each fund. The principal class-specific fees and expenses are described below:
Distribution services— Each fund has plans of distribution for all share classes, except Class F-2, F-3 and R-6 shares, if applicable. Under the plans, each fund’s board of trustees approves certain categories of expenses that are used to finance activities primarily intended to sell fund shares and service existing accounts. The plans provide for payments based on an annualized percentage of average daily net assets. In some cases, the boards of trustees have limited the amounts that may be paid to less than the maximum allowed by the plans. All share classes with a plan may use the allotted percentage of average daily net assets to pay service fees, or to compensate AFD for paying service fees, to firms that have entered into agreements with AFD to provide certain shareholder services. The remaining amounts available to be paid under each plan are paid to dealers to compensate them for their sales activities.
| | | American Funds Short-Term
Tax-Exempt Bond Fund | | | Limited Term Tax-Exempt
Bond Fund of America | | | The Tax-Exempt Bond Fund
of America | |
| Share class | | Currently
approved limits | | | Plan limits | | | Currently
approved limits | | | Plan limits | | | Currently
approved limits | | | Plan limits | |
| Class A | | | 0.15 | % | | | 0.15 | % | | | 0.30 | % | | | 0.30 | % | | | 0.25 | % | | | 0.25 | % |
| Class C | | | Not applicable | | | | Not applicable | | | | 1.00 | | | | 1.00 | | | | 1.00 | | | | 1.00 | |
| Classes T and F-1 | | | 0.25 | | | | 0.50 | | | | 0.25 | | | | 0.50 | | | | 0.25 | | | | 0.50 | |
| | | | | | | | | | |
| | | American High-Income
Municipal Bond Fund | | | The Tax-Exempt Fund
of California | | | American Funds Tax-Exempt
Fund of New York | |
| Share class | | Currently
approved limits | | | Plan limits | | | Currently
approved limits | | | Plan limits | | | Currently
approved limits | | | Plan limits | |
| Class A | | | 0.30 | % | | | 0.30 | % | | | 0.25 | % | | | 0.25 | % | | | 0.25 | % | | | 0.30 | % |
| Class C | | | 1.00 | | | | 1.00 | | | | 1.00 | | | | 1.00 | | | | 1.00 | | | | 1.00 | |
| Classes T and F-1 | | | 0.25 | | | | 0.50 | | | | 0.25 | | | | 0.50 | | | | 0.25 | | | | 0.50 | |
For Class A shares, distribution-related expenses include the reimbursement of dealer and wholesaler commissions paid by AFD for certain shares sold without a sales charge. This share class of each fund reimburses AFD for amounts billed within the prior 15 months but only to the extent that the overall annual expense limit is not exceeded. As of January 31, 2020, unreimbursed expenses subject to reimbursement for Class A shares of each fund were as follows (dollars in thousands):
| Fund | Class A |
| American Funds Short-Term Tax-Exempt Bond Fund | $ 1,329 |
| Limited-Term Tax-Exempt Bond Fund of America | 917 |
| The Tax-Exempt Bond Fund of America | 10,729 |
| American High-Income Municipal Bond Fund | 1,024 |
| The Tax-Exempt Fund of California | 2,174 |
| American Funds Tax-Exempt Fund of New York | 165 |
| 98 | American Funds Tax-Exempt Funds |
Transfer agent services— Each fund has a shareholder services agreement with AFS under which each fund compensates AFS for providing transfer agent services to each of the funds’ share classes. These services include recordkeeping, shareholder communications and transaction processing. In addition, each fund reimburses AFS for amounts paid to third parties for performing transfer agent services on behalf of its respective fund shareholders.
Administrative services— Each fund has an administrative services agreement with CRMC under which each fund compensates CRMC for providing administrative services to each of the funds’ share classes. Administrative services are provided by CRMC and its affiliates to help assist third parties providing non-distribution services to fund shareholders. These services include providing in depth information on each fund and market developments that impact each fund’s investments. Administrative services also include, but are not limited to, coordinating, monitoring and overseeing third parties that provide services to each fund’s shareholders. The agreement provides each fund the ability to charge an administrative services fee at the annual rate of 0.05% of the daily net assets attributable to each share class of each fund. Currently the funds pay an administrative services fee at the annual rate of 0.03% of the daily net assets attributable to each share class of each fund for CRMC’s provision of administrative services.
For the six months ended January 31, 2020, class-specific expenses under the agreements for each fund were as follows (dollars in thousands):
American Funds Short-Term Tax-Exempt Bond Fund
| Share class | | Distribution
services | | | Transfer agent
services | | | Administrative
services | |
| Class A | | $598 | | | $149 | | | $119 | |
| Class T | | — | | | — | * | | — | * |
| Class F-1 | | 8 | | | 4 | | | 1 | |
| Class F-2 | | Not applicable | | | 64 | | | 30 | |
| Class F-3 | | Not applicable | | | 1 | | | 8 | |
| Class R-6 | | Not applicable | | | — | * | | 20 | |
| Total class-specific expenses | | $606 | | | $218 | | | $178 | |
| |
| The Tax-Exempt Bond Fund of America |
| |
| Share class | | Distribution
services | | | Transfer agent
services | | | Administrative
services | |
| Class A | | $14,277 | | | $1,854 | | | $1,713 | |
| Class C | | 2,015 | | | 68 | | | 62 | |
| Class T | | — | | | — | * | | — | * |
| Class F-1 | | 422 | | | 201 | | | 52 | |
| Class F-2 | | Not applicable | | | 1,616 | | | 452 | |
| Class F-3 | | Not applicable | | | 73 | | | 1,049 | |
| Class R-6 | | Not applicable | | | — | * | | 111 | |
| Total class-specific expenses | | $16,714 | | | $3,812 | | | $3,439 | |
| |
| The Tax-Exempt Fund of California |
| |
| Share class | | Distribution
services | | | Transfer agent
services | | | Administrative
services | |
| Class A | | $2,336 | | | $184 | | | $280 | |
| Class C | | 350 | | | 7 | | | 11 | |
| Class T | | — | | | — | * | | — | * |
| Class F-1 | | 91 | | | 41 | | | 11 | |
| Class F-2 | | Not applicable | | | 193 | | | 66 | |
| Class F-3 | | Not applicable | | | 1 | | | 41 | |
| Total class-specific expenses | | $2,777 | | | $426 | | | $409 | |
| |
| Limited Term Tax-Exempt Bond Fund of America |
| |
| Share class | | Distribution
services | | | Transfer agent
services | | | Administrative
services | |
| Class A | | $4,740 | | | $581 | | | $474 | |
| Class C | | 85 | | | 3 | | | 3 | |
| Class T | | — | | | — | * | | — | * |
| Class F-1 | | 79 | | | 37 | | | 9 | |
| Class F-2 | | Not applicable | | | 270 | | | 81 | |
| Class F-3 | | Not applicable | | | 3 | | | 49 | |
| Class R-6 | | Not applicable | | | — | * | | 47 | |
| Total class-specific expenses | | $4,904 | | | $894 | | | $663 | |
| |
| American High-Income Municipal Bond Fund |
| |
| Share class | | Distribution
services | | | Transfer agent
services | | | Administrative
services | |
| Class A | | $7,327 | | | $1,073 | | | $733 | |
| Class C | | 1,214 | | | 54 | | | 36 | |
| Class T | | — | | | — | * | | — | * |
| Class F-1 | | 230 | | | 108 | | | 28 | |
| Class F-2 | | Not applicable | | | 633 | | | 177 | |
| Class F-3 | | Not applicable | | | 15 | | | 146 | |
| Class R-6 | | Not applicable | | | — | * | | 111 | |
| Total class-specific expenses | | $8,771 | | | $1,883 | | | $1,231 | |
| |
| American Funds Tax-Exempt Fund of New York |
| |
| Share class | | Distribution
services | | | Transfer agent
services | | | Administrative
services | |
| Class A | | $265 | | | $29 | | | $32 | |
| Class C | | 59 | | | 2 | | | 2 | |
| Class T | | — | | | — | * | | — | * |
| Class F-1 | | 2 | | | 1 | | | — | * |
| Class F-2 | | Not applicable | | | 16 | | | 5 | |
| Class F-3 | | Not applicable | | | — | * | | 5 | |
| Total class-specific expenses | | $326 | | | $48 | | | $44 | |
| * | Amount less than one thousand. |
| American Funds Tax-Exempt Funds | 99 |
Miscellaneous fee reimbursements— CRMC has agreed to reimburse a portion of miscellaneous fees and expenses of American Funds Short-Term Tax-Exempt Bond Fund and American Funds Tax-Exempt Fund of New York. Miscellaneous expenses exclude investment advisory services and distribution services fees. These reimbursements may be adjusted or discontinued by CRMC, subject to any restrictions in the series’ prospectus. For the six months ended January 31, 2020, total fees and expenses reimbursed by CRMC were $68,000 and $84,000 for American Funds Short-Term Tax-Exempt Bond Fund and American Funds Tax-Exempt Fund of New York, respectively. Fees and expenses in each fund’s statement of operations are presented gross of any reimbursements from CRMC.
Trustees’ deferred compensation— Trustees who are unaffiliated with CRMC may elect to defer the cash payment of part or all of their compensation. These deferred amounts, which remain as liabilities of each fund, are treated as if invested in shares of the funds or other American Funds. These amounts represent general, unsecured liabilities of each fund and vary according to the total returns of the selected funds. Trustees’ compensation in the funds’ statements of operations reflects the current fees (either paid in cash or deferred) and a net increase in the value of the following deferred amounts (dollars in thousands):
| Fund | | Current fees | | | Increase in value of
deferred amounts | | | Total trustees’
compensation | |
| American Funds Short-Term Tax-Exempt Bond Fund | | $ | 2 | | | $ | 3 | | | $ | 5 | |
| Limited Term Tax-Exempt Bond Fund of America | | | 12 | | | | 10 | | | | 22 | |
| The Tax-Exempt Bond Fund of America | | | 59 | | | | 57 | | | | 116 | |
| American High-Income Municipal Bond Fund | | | 20 | | | | 10 | | | | 30 | |
| The Tax-Exempt Fund of California | | | 7 | | | | 10 | | | | 17 | |
| American Funds Tax-Exempt Fund of New York | | | 1 | | | | — | * | | | 1 | |
| * Amount less than one thousand. | |
Affiliated officers and trustees— Officers and certain trustees of the funds are or may be considered to be affiliated with CRMC, AFD and AFS. No affiliated officers or trustees received any compensation directly from the funds.
Security transactions with related funds— Each fund may purchase securities from, or sell securities to, other CRMC-managed funds (or funds managed by certain affiliates of CRMC) under procedures adopted by each fund’s board of trustees. The funds involved in such transactions are considered related by virtue of having a common investment adviser (or affiliated investment advisers), common trustees and/or common officers. When such transactions occur, each transaction is executed at the current market price of the security and no brokerage commissions or fees are paid in accordance with Rule 17a-7 of the 1940 Act.
Interfund lending— Pursuant to an exemptive order issued by the SEC, the funds, along with other CRMC-managed funds (or funds managed by certain affiliates of CRMC), may participate in an interfund lending program. The program provides an alternate credit facility that permits the funds to lend or borrow cash for temporary purposes directly to or from one another, subject to the conditions of the exemptive order. None of the funds lent or borrowed cash during the six months ended January 31, 2020.
8. Committed line of credit
American High-Income Municipal Bond Fund participates with other funds managed by CRMC (or funds managed by certain affiliates of CRMC) in a $1.5 billion credit facility (the “line of credit”) to be utilized for temporary purposes to support shareholder redemptions. The fund has agreed to pay commitment fees on its pro-rata portion of the line of credit, which are reflected in other expenses in the fund’s statement of operations. The fund did not borrow on this line of credit at any time during the six months ended January 31, 2020.
| 100 | American Funds Tax-Exempt Funds |
9. Capital share transactions
Capital share transactions in the funds were as follows (dollars and shares in thousands):
American Funds Short-Term Tax-Exempt Bond Fund
| | | Sales* | | | Reinvestments of distributions | | | Repurchases* | | | Net increase
(decrease) | |
| Share class | | Amount | | | Shares | | | Amount | | | Shares | | | Amount | | | Shares | | | Amount | | | Shares | |
| |
| Six months ended January 31, 2020 |
| |
| Class A | | $ | 133,541 | | | | 13,108 | | | $ | 5,377 | | | | 528 | | | $ | (92,462 | ) | | | (9,071 | ) | | $ | 46,456 | | | | 4,565 | |
| Class T | | | — | | | | — | | | | — | | | | — | | | | — | | | | — | | | | — | | | | — | |
| Class F-1 | | | 515 | | | | 50 | | | | 40 | | | | 4 | | | | (1,477 | ) | | | (145 | ) | | | (922 | ) | | | (91 | ) |
| Class F-2 | | | 42,793 | | | | 4,201 | | | | 1,420 | | | | 139 | | | | (21,840 | ) | | | (2,143 | ) | | | 22,373 | | | | 2,197 | |
| Class F-3 | | | 14,606 | | | | 1,434 | | | | 398 | | | | 39 | | | | (14,579 | ) | | | (1,431 | ) | | | 425 | | | | 42 | |
| Class R-6 | | | 11,926 | | | | 1,170 | | | | 1,049 | | | | 103 | | | | (6,447 | ) | | | (633 | ) | | | 6,528 | | | | 640 | |
| Total net increase (decrease) | | $ | 203,381 | | | | 19,963 | | | $ | 8,284 | | | | 813 | | | $ | (136,805 | ) | | | (13,423 | ) | | $ | 74,860 | | | | 7,353 | |
| |
| Year ended July 31, 2019 |
| | | | | | | | | | | | | | | | | | | | | | | | | | | | | | | | | |
| Class A | | $ | 446,679 | | | | 44,559 | | | $ | 11,322 | | | | 1,124 | | | $ | (454,662 | ) | | | (45,326 | ) | | $ | 3,339 | | | | 357 | |
| Class T | | | — | | | | — | | | | — | | | | — | | | | — | | | | — | | | | — | | | | — | |
| Class F-1 | | | 1,942 | | | | 194 | | | | 89 | | | | 9 | | | | (2,196 | ) | | | (219 | ) | | | (165 | ) | | | (16 | ) |
| Class F-2 | | | 183,142 | | | | 18,317 | | | | 2,421 | | | | 240 | | | | (59,423 | ) | | | (5,910 | ) | | | 126,140 | | | | 12,647 | |
| Class F-3 | | | 48,796 | | | | 4,855 | | | | 787 | | | | 78 | | | | (42,824 | ) | | | (4,276 | ) | | | 6,759 | | | | 657 | |
| Class R-6 | | | 23,958 | | | | 2,386 | | | | 2,147 | | | | 214 | | | | (18,235 | ) | | | (1,816 | ) | | | 7,870 | | | | 784 | |
| Total net increase (decrease) | | $ | 704,517 | | | | 70,311 | | | $ | 16,766 | | | | 1,665 | | | $ | (577,340 | ) | | | (57,547 | ) | | $ | 143,943 | | | | 14,429 | |
Limited Term Tax-Exempt Bond Fund of America
| | | Sales* | | | Reinvestments of
distributions | | | Repurchases* | | | Net increase
(decrease) | |
| Share class | | Amount | | | Shares | | | Amount | | | Shares | | | Amount | | | Shares | | | Amount | | | Shares | |
| |
| Six months ended January 31, 2020 |
| |
| Class A | | $ | 400,986 | | | | 25,154 | | | $ | 36,615 | | | | 2,299 | | | $ | (255,333 | ) | | | (16,015 | ) | | $ | 182,268 | | | | 11,438 | |
| Class C | | | 2,275 | | | | 143 | | | | 143 | | | | 9 | | | | (2,849 | ) | | | (179 | ) | | | (431 | ) | | | (27 | ) |
| Class T | | | — | | | | — | | | | — | | | | — | | | | — | | | | — | | | | — | | | | — | |
| Class F-1 | | | 10,771 | | | | 676 | | | | 717 | | | | 45 | | | | (6,348 | ) | | | (398 | ) | | | 5,140 | | | | 323 | |
| Class F-2 | | | 134,780 | | | | 8,452 | | | | 6,487 | | | | 407 | | | | (64,169 | ) | | | (4,026 | ) | | | 77,098 | | | | 4,833 | |
| Class F-3 | | | 76,057 | | | | 4,772 | | | | 4,386 | | | | 276 | | | | (35,244 | ) | | | (2,212 | ) | | | 45,199 | | | | 2,836 | |
| Class R-6 | | | 26,534 | | | | 1,664 | | | | 4,246 | | | | 267 | | | | (16,312 | ) | | | (1,023 | ) | | | 14,468 | | | | 908 | |
| Total net increase (decrease) | | $ | 651,403 | | | | 40,861 | | | $ | 52,594 | | | | 3,303 | | | $ | (380,255 | ) | | | (23,853 | ) | | $ | 323,742 | | | | 20,311 | |
| | | | | | | | | | | | | | | | | | | | | | | | | | | | | | | | | |
| Year ended July 31, 2019 | |
| | |
| Class A | | $ | 817,031 | | | | 52,517 | | | $ | 56,604 | | | | 3,625 | | | $ | (947,434 | ) | | | (61,011 | ) | | $ | (73,799 | ) | | | (4,869 | ) |
| Class C | | | 5,804 | | | | 374 | | | | 237 | | | | 15 | | | | (9,333 | ) | | | (599 | ) | | | (3,292 | ) | | | (210 | ) |
| Class T | | | — | | | | — | | | | — | | | | — | | | | — | | | | — | | | | — | | | | — | |
| Class F-1 | | | 12,716 | | | | 814 | | | | 1,084 | | | | 69 | | | | (18,544 | ) | | | (1,193 | ) | | | (4,744 | ) | | | (310 | ) |
| Class F-2 | | | 337,537 | | | | 21,741 | | | | 8,588 | | | | 550 | | | | (211,713 | ) | | | (13,615 | ) | | | 134,412 | | | | 8,676 | |
| Class F-3 | | | 224,267 | | | | 14,414 | | | | 4,980 | | | | 318 | | | | (116,914 | ) | | | (7,517 | ) | | | 112,333 | | | | 7,215 | |
| Class R-6 | | | 52,433 | | | | 3,374 | | | | 6,729 | | | | 431 | | | | (44,130 | ) | | | (2,837 | ) | | | 15,032 | | | | 968 | |
| Total net increase (decrease) | | $ | 1,449,788 | | | | 93,234 | | | $ | 78,222 | | | | 5,008 | | | $ | (1,348,068 | ) | | | (86,772 | ) | | $ | 179,942 | | | | 11,470 | |
See end of tables for footnote.
| American Funds Tax-Exempt Funds | 101 |
The Tax-Exempt Bond Fund of America
| | | Sales* | | | Reinvestments of
distributions | | | Repurchases* | | | Net increase
(decrease) | |
| Share class | | Amount | | | Shares | | | Amount | | | Shares | | | Amount | | | Shares | | | Amount | | | Shares | |
| |
| Six months ended January 31, 2020 |
| |
| Class A | | $ | 1,402,076 | | | | 104,907 | | | $ | 135,369 | | | | 10,115 | | | $ | (565,772 | ) | | | (42,334 | ) | | $ | 971,673 | | | | 72,688 | |
| Class C | | | 59,225 | | | | 4,432 | | | | 3,533 | | | | 264 | | | | (53,356 | ) | | | (3,992 | ) | | | 9,402 | | | | 704 | |
| Class T | | | — | | | | — | | | | — | | | | — | | | | — | | | | — | | | | — | | | | — | |
| Class F-1 | | | 41,581 | | | | 3,111 | | | | 3,958 | | | | 296 | | | | (37,292 | ) | | | (2,794 | ) | | | 8,247 | | | | 613 | |
| Class F-2 | | | 622,481 | | | | 46,557 | | | | 38,076 | | | | 2,845 | | | | (261,439 | ) | | | (19,568 | ) | | | 399,118 | | | | 29,834 | |
| Class F-3 | | | 1,155,379 | | | | 86,542 | | | | 95,782 | | | | 7,156 | | | | (391,327 | ) | | | (29,271 | ) | | | 859,834 | | | | 64,427 | |
| Class R-6 | | | 104,482 | | | | 7,836 | | | | 10,270 | | | | 767 | | | | (416 | ) | | | (31 | ) | | | 114,336 | | | | 8,572 | |
| Total net increase (decrease) | | $ | 3,385,224 | | | | 253,385 | | | $ | 286,988 | | | | 21,443 | | | $ | (1,309,602 | ) | | | (97,990 | ) | | $ | 2,362,610 | | | | 176,838 | |
| |
| Year ended July 31, 2019 |
| | | | | | | | | | | | | | | | | | | | | | | | | | | | | | | | | |
| Class A | | $ | 1,913,815 | | | | 148,284 | | | $ | 270,339 | | | | 20,936 | | | $ | (1,793,783 | ) | | | (140,013 | ) | | $ | 390,371 | | | | 29,207 | |
| Class C | | | 69,698 | | | | 5,391 | | | | 7,921 | | | | 614 | | | | (116,360 | ) | | | (9,053 | ) | | | (38,741 | ) | | | (3,048 | ) |
| Class T | | | — | | | | — | | | | — | | | | — | | | | — | | | | — | | | | — | | | | — | |
| Class F-1 | | | 66,051 | | | | 5,127 | | | | 8,750 | | | | 678 | | | | (118,439 | ) | | | (9,234 | ) | | | (43,638 | ) | | | (3,429 | ) |
| Class F-2 | | | 1,319,680 | | | | 102,510 | | | | 66,204 | | | | 5,123 | | | | (877,784 | ) | | | (68,563 | ) | | | 508,100 | | | | 39,070 | |
| Class F-3 | | | 2,078,370 | | | | 161,360 | | | | 175,472 | | | | 13,579 | | | | (1,306,234 | ) | | | (101,826 | ) | | | 947,608 | | | | 73,113 | |
| Class R-6 | | | 108,442 | | | | 8,367 | | | | 18,410 | | | | 1,425 | | | | (14,886 | ) | | | (1,168 | ) | | | 111,966 | | | | 8,624 | |
| Total net increase (decrease) | | $ | 5,556,056 | | | | 431,039 | | | $ | 547,096 | | | | 42,355 | | | $ | (4,227,486 | ) | | | (329,857 | ) | | $ | 1,875,666 | | | | 143,537 | |
American High-Income Municipal Bond Fund
| | | Sales* | | | Reinvestments of
distributions | | | Repurchases* | | | Net increase
(decrease) | |
| Share class | | Amount | | | Shares | | | Amount | | | Shares | | | Amount | | | Shares | | | Amount | | | Shares | |
| | | | | | | | | | | | | | | | | | | | | | | | | | | | | | | | | |
| Six months ended January 31, 2020 |
| | | | | | | | | | | | | | | | | | | | | | | | | | | | | | | | | |
| Class A | | $ | 572,093 | | | | 34,715 | | | $ | 79,991 | | | | 4,848 | | | $ | (263,557 | ) | | | (15,996 | ) | | $ | 388,527 | | | | 23,567 | |
| Class C | | | 32,374 | | | | 1,965 | | | | 3,159 | | | | 192 | | | | (31,499 | ) | | | (1,912 | ) | | | 4,034 | | | | 245 | |
| Class T | | | — | | | | — | | | | — | | | | — | | | | — | | | | — | | | | — | | | | — | |
| Class F-1 | | | 23,412 | | | | 1,422 | | | | 3,060 | | | | 185 | | | | (21,277 | ) | | | (1,291 | ) | | | 5,195 | | | | 316 | |
| Class F-2 | | | 241,008 | | | | 14,620 | | | | 19,404 | | | | 1,177 | | | | (129,271 | ) | | | (7,848 | ) | | | 131,141 | | | | 7,949 | |
| Class F-3 | | | 168,241 | | | | 10,212 | | | | 17,896 | | | | 1,085 | | | | (58,699 | ) | | | (3,560 | ) | | | 127,438 | | | | 7,737 | |
| Class R-6 | | | 98,129 | | | | 5,967 | | | | 13,990 | | | | 848 | | | | (25 | ) | | | (1 | ) | | | 112,094 | | | | 6,814 | |
| Total net increase (decrease) | | $ | 1,135,257 | | | | 68,901 | | | $ | 137,500 | | | | 8,335 | | | $ | (504,328 | ) | | | (30,608 | ) | | $ | 768,429 | | | | 46,628 | |
| |
| Year ended July 31, 2019 |
| | | | | | | | | | | | | | | | | | | | | | | | | | | | | | | | | |
| Class A | | $ | 966,900 | | | | 61,009 | | | $ | 144,057 | | | | 9,079 | | | $ | (684,496 | ) | | | (43,449 | ) | | $ | 426,461 | | | | 26,639 | |
| Class C | | | 50,981 | | | | 3,214 | | | | 6,195 | | | | 390 | | | | (53,367 | ) | | | (3,374 | ) | | | 3,809 | | | | 230 | |
| Class T | | | — | | | | — | | | | — | | | | — | | | | — | | | | — | | | | — | | | | — | |
| Class F-1 | | | 48,091 | | | | 3,037 | | | | 6,254 | | | | 395 | | | | (87,411 | ) | | | (5,545 | ) | | | (33,066 | ) | | | (2,113 | ) |
| Class F-2 | | | 563,308 | | | | 35,694 | | | | 32,471 | | | | 2,046 | | | | (317,468 | ) | | | (20,134 | ) | | | 278,311 | | | | 17,606 | |
| Class F-3 | | | 331,973 | | | | 20,911 | | | | 25,362 | | | | 1,597 | | | | (134,406 | ) | | | (8,510 | ) | | | 222,929 | | | | 13,998 | |
| Class R-6 | | | 102,098 | | | | 6,412 | | | | 23,498 | | | | 1,480 | | | | (11,942 | ) | | | (764 | ) | | | 113,654 | | | | 7,128 | |
| Total net increase (decrease) | | $ | 2,063,351 | | | | 130,277 | | | $ | 237,837 | | | | 14,987 | | | $ | (1,289,090 | ) | | | (81,776 | ) | | $ | 1,012,098 | | | | 63,488 | |
| 102 | American Funds Tax-Exempt Funds |
The Tax-Exempt Fund of California
| | | Sales* | | | Reinvestments of
distributions | | | Repurchases* | | | Net increase
(decrease) | |
| Share class | | Amount | | | Shares | | | Amount | | | Shares | | | Amount | | | Shares | | | Amount | | | Shares | |
| |
| Six months ended January 31, 2020 |
| |
| Class A | | $ | 195,638 | | | | 10,755 | | | $ | 30,057 | | | | 1,656 | | | $ | (93,040 | ) | | | (5,118 | ) | | $ | 132,655 | | | | 7,293 | |
| Class C | | | 9,283 | | | | 511 | | | | 911 | | | | 50 | | | | (9,853 | ) | | | (541 | ) | | | 341 | | | | 20 | |
| Class T | | | — | | | | — | | | | — | | | | — | | | | — | | | | — | | | | — | | | | — | |
| Class F-1 | | | 6,645 | | | | 365 | | | | 1,150 | | | | 63 | | | | (5,301 | ) | | | (291 | ) | | | 2,494 | | | | 137 | |
| Class F-2 | | | 95,231 | | | | 5,237 | | | | 7,048 | | | | 388 | | | | (47,931 | ) | | | (2,637 | ) | | | 54,348 | | | | 2,988 | |
| Class F-3 | | | 63,666 | | | | 3,503 | | | | 5,166 | | | | 285 | | | | (10,234 | ) | | | (563 | ) | | | 58,598 | | | | 3,225 | |
| Total net increase (decrease) | | $ | 370,463 | | | | 20,371 | | | $ | 44,332 | | | | 2,442 | | | $ | (166,359 | ) | | | (9,150 | ) | | $ | 248,436 | | | | 13,663 | |
| |
| Year ended July 31, 2019 |
| | | | | | | | | | | | | | | | | | | | | | | | | | | | | | | | | |
| Class A | | $ | 354,297 | | | | 20,195 | | | $ | 43,242 | | | | 2,463 | | | $ | (351,468 | ) | | | (20,231 | ) | | $ | 46,071 | | | | 2,427 | |
| Class C | | | 11,571 | | | | 657 | | | | 1,339 | | | | 76 | | | | (17,470 | ) | | | (1,000 | ) | | | (4,560 | ) | | | (267 | ) |
| Class T | | | — | | | | — | | | | — | | | | — | | | | — | | | | — | | | | — | | | | — | |
| Class F-1 | | | 10,762 | | | | 614 | | | | 1,815 | | | | 104 | | | | (18,340 | ) | | | (1,050 | ) | | | (5,763 | ) | | | (332 | ) |
| Class F-2 | | | 241,537 | | | | 13,875 | | | | 9,002 | | | | 512 | | | | (111,887 | ) | | | (6,404 | ) | | | 138,652 | | | | 7,983 | |
| Class F-3 | | | 105,180 | | | | 5,967 | | | | 5,174 | | | | 294 | | | | (50,829 | ) | | | (2,924 | ) | | | 59,525 | | | | 3,337 | |
| Total net increase (decrease) | | $ | 723,347 | | | | 41,308 | | | $ | 60,572 | | | | 3,449 | | | $ | (549,994 | ) | | | (31,609 | ) | | $ | 233,925 | | | | 13,148 | |
American Funds Tax-Exempt Fund of New York
| | | Sales* | | | Reinvestments of
distributions | | | Repurchases* | | | Net increase
(decrease) | |
| Share class | | Amount | | | Shares | | | Amount | | | Shares | | | Amount | | | Shares | | | Amount | | | Shares | |
| |
| Six months ended January 31, 2020 |
| |
| Class A | | $ | 26,503 | | | | 2,391 | | | $ | 2,049 | | | | 185 | | | $ | (10,515 | ) | | | (947 | ) | | $ | 18,037 | | | | 1,629 | |
| Class C | | | 1,516 | | | | 137 | | | | 92 | | | | 8 | | | | (1,666 | ) | | | (151 | ) | | | (58 | ) | | | (6 | ) |
| Class T | | | — | | | | — | | | | — | | | | — | | | | — | | | | — | | | | — | | | | — | |
| Class F-1 | | | 2,544 | | | | 229 | | | | 21 | | | | 2 | | | | (2,333 | ) | | | (209 | ) | | | 232 | | | | 22 | |
| Class F-2 | | | 7,268 | | | | 656 | | | | 403 | | | | 36 | | | | (3,624 | ) | | | (327 | ) | | | 4,047 | | | | 365 | |
| Class F-3 | | | 3,299 | | | | 297 | | | | 443 | | | | 40 | | | | (3,062 | ) | | | (275 | ) | | | 680 | | | | 62 | |
| Total net increase (decrease) | | $ | 41,130 | | | | 3,710 | | | $ | 3,008 | | | | 271 | | | $ | (21,200 | ) | | | (1,909 | ) | | $ | 22,938 | | | | 2,072 | |
| | | | | | | | | | | | | | | | | | | | | | | | | | | | | | | | | |
| Year ended July 31, 2019 |
| | | | | | | | | | | | | | | | | | | | | | | | | | | | | | | | | |
| Class A | | $ | 43,401 | | | | 4,058 | | | $ | 3,742 | | | | 349 | | | $ | (36,741 | ) | | | (3,477 | ) | | $ | 10,402 | | | | 930 | |
| Class C | | | 1,713 | | | | 160 | | | | 190 | | | | 18 | | | | (2,452 | ) | | | (231 | ) | | | (549 | ) | | | (53 | ) |
| Class T | | | — | | | | — | | | | — | | | | — | | | | — | | | | — | | | | — | | | | — | |
| Class F-1 | | | 409 | | | | 38 | | | | 38 | | | | 4 | | | | (561 | ) | | | (53 | ) | | | (114 | ) | | | (11 | ) |
| Class F-2 | | | 21,136 | | | | 2,004 | | | | 685 | | | | 64 | | | | (10,147 | ) | | | (952 | ) | | | 11,674 | | | | 1,116 | |
| Class F-3 | | | 16,808 | | | | 1,584 | | | | 570 | | | | 53 | | | | (12,152 | ) | | | (1,148 | ) | | | 5,226 | | | | 489 | |
| Total net increase (decrease) | | $ | 83,467 | | | | 7,844 | | | $ | 5,225 | | | | 488 | | | $ | (62,053 | ) | | | (5,861 | ) | | $ | 26,639 | | | | 2,471 | |
| * | Includes exchanges between share classes of the fund. |
| American Funds Tax-Exempt Funds | 103 |
10. Investment transactions
Each fund made purchases and sales of investment securities, excluding short-term securities and U.S. government obligations, if any, during the six months ended January 31, 2020, as follows (dollars in thousands):
| Fund | | Purchases | | | Sales | |
| American Funds Short-Term Tax-Exempt Bond Fund | | $ | 377,732 | | | $ | 340,351 | |
| Limited Term Tax-Exempt Bond Fund of America | | | 1,153,585 | | | | 1,069,762 | |
| The Tax-Exempt Bond Fund of America | | | 4,212,109 | | | | 1,794,163 | |
| American High-Income Municipal Bond Fund | | | 1,551,040 | | | | 828,746 | |
| The Tax-Exempt Fund of California | | | 488,380 | | | | 345,692 | |
| American Funds Tax-Exempt Fund of New York | | | 43,947 | | | | 13,809 | |
| 104 | American Funds Tax-Exempt Funds |
11. Ownership concentration
At January 31, 2020, CRMC held aggregate ownership of 11% of the outstanding shares of American Funds Tax-Exempt Fund of New York. The ownership represents the seed money invested in the fund when it began operations on November 1, 2010. In addition, American Funds Tax-Exempt Preservation Portfolio held 11% of the outstanding shares of American Funds Short-Term Tax-Exempt Bond Fund. CRMC is the investment adviser to both of the funds.
| American Funds Tax-Exempt Funds | 105 |
Financial highlights
American Funds Short-Term Tax-Exempt Bond Fund
| | | | | | Income from investment operations1 | | | | | | | | | | | | | | | | | | | | | | |
| Period ended | | Net asset
value,
beginning
of period | | | Net
investment
income | | | Net gains
(losses) on
securities
(both
realized and
unrealized) | | | Total from
investment
operations | | | Dividends
(from net
investment
income) | | | Net asset
value,
end
of period | | | Total
return2,3 | | | Net assets,
end of period
(in millions) | | | Ratio of
expenses to
average net
assets before
reimbursements | | | Ratio of
expenses to
average net
assets after
reimbursements2 | | | Ratio of
net income
to average
net assets2 | |
| Class A: | | | | | | | | | | | | | | | | | | | | | | | | | | | | | | | | | | | | | | | | | | | | |
| 1/31/20204,5 | | $ | 10.19 | | | $ | .07 | | | $ | .04 | | | $ | .11 | | | $ | (.07 | ) | | $ | 10.23 | | | | 1.09 | %6 | | $ | 817 | | | | .58 | %7 | | | .57 | %7 | | | 1.38 | %7 |
| 7/31/2019 | | | 10.04 | | | | .16 | | | | .15 | | | | .31 | | | | (.16 | ) | | | 10.19 | | | | 3.09 | | | | 767 | | | | .59 | | | | .59 | | | | 1.56 | |
| 7/31/2018 | | | 10.15 | | | | .13 | | | | (.11 | ) | | | .02 | | | | (.13 | ) | | | 10.04 | | | | .24 | | | | 752 | | | | .58 | | | | .58 | | | | 1.33 | |
| 7/31/2017 | | | 10.22 | | | | .12 | | | | (.07 | ) | | | .05 | | | | (.12 | ) | | | 10.15 | | | | .46 | | | | 739 | | | | .59 | | | | .59 | | | | 1.15 | |
| 7/31/2016 | | | 10.17 | | | | .10 | | | | .05 | | | | .15 | | | | (.10 | ) | | | 10.22 | | | | 1.51 | | | | 688 | | | | .59 | | | | .59 | | | | 1.02 | |
| 7/31/2015 | | | 10.25 | | | | .11 | | | | (.08 | ) | | | .03 | | | | (.11 | ) | | | 10.17 | | | | .26 | | | | 653 | | | | .58 | | | | .58 | | | | 1.04 | |
| Class T: | | | | | | | | | | | | | | | | | | | | | | | | | | | | | | | | | | | | | | | | | | | | |
| 1/31/20204,5 | | | 10.19 | | | | .08 | | | | .04 | | | | .12 | | | | (.08 | ) | | | 10.23 | | | | 1.17 | 6,8 | | | — | 9 | | | .43 | 7,8 | | | .42 | 7,8 | | | 1.54 | 7,8 |
| 7/31/2019 | | | 10.04 | | | | .17 | | | | .15 | | | | .32 | | | | (.17 | ) | | | 10.19 | | | | 3.20 | 8 | | | — | 9 | | | .47 | 8 | | | .47 | 8 | | | 1.67 | 8 |
| 7/31/2018 | | | 10.15 | | | | .15 | | | | (.11 | ) | | | .04 | | | | (.15 | ) | | | 10.04 | | | | .36 | 8 | | | — | 9 | | | .47 | 8 | | | .47 | 8 | | | 1.44 | 8 |
| 7/31/20174,10 | | | 10.11 | | | | .04 | | | | .04 | | | | .08 | | | | (.04 | ) | | | 10.15 | | | | .82 | 6,8 | | | — | 9 | | | .15 | 6,8 | | | .15 | 6,8 | | | .42 | 6,8 |
| Class F-1: | | | | | | | | | | | | | | | | | | | | | | | | | | | | | | | | | | | | | | | | | | | | |
| 1/31/20204,5 | | | 10.19 | | | | .06 | | | | .04 | | | | .10 | | | | (.06 | ) | | | 10.23 | | | | .99 | 6 | | | 6 | | | | .78 | 7 | | | .76 | 7 | | | 1.20 | 7 |
| 7/31/2019 | | | 10.04 | | | | .13 | | | | .15 | | | | .28 | | | | (.13 | ) | | | 10.19 | | | | 2.85 | | | | 7 | | | | .81 | | | | .81 | | | | 1.34 | |
| 7/31/2018 | | | 10.15 | | | | .11 | | | | (.11 | ) | | | — | 11 | | | (.11 | ) | | | 10.04 | | | | .02 | | | | 7 | | | | .80 | | | | .80 | | | | 1.10 | |
| 7/31/2017 | | | 10.22 | | | | .09 | | | | (.07 | ) | | | .02 | | | | (.09 | ) | | | 10.15 | | | | .23 | | | | 9 | | | | .82 | | | | .82 | | | | .92 | |
| 7/31/2016 | | | 10.17 | | | | .08 | | | | .05 | | | | .13 | | | | (.08 | ) | | | 10.22 | | | | 1.29 | | | | 13 | | | | .81 | | | | .81 | | | | .80 | |
| 7/31/2015 | | | 10.25 | | | | .08 | | | | (.08 | ) | | | — | 11 | | | (.08 | ) | | | 10.17 | | | | .05 | | | | 9 | | | | .80 | | | | .80 | | | | .83 | |
| Class F-2: | | | | | | | | | | | | | | | | | | | | | | | | | | | | | | | | | | | | | | | | | | | | |
| 1/31/20204,5 | | | 10.19 | | | | .08 | | | | .04 | | | | .12 | | | | (.08 | ) | | | 10.23 | | | | 1.15 | 6 | | | 205 | | | | .46 | 7 | | | .45 | 7 | | | 1.50 | 7 |
| 7/31/2019 | | | 10.04 | | | | .17 | | | | .15 | | | | .32 | | | | (.17 | ) | | | 10.19 | | | | 3.17 | | | | 182 | | | | .49 | | | | .49 | | | | 1.67 | |
| 7/31/2018 | | | 10.15 | | | | .14 | | | | (.11 | ) | | | .03 | | | | (.14 | ) | | | 10.04 | | | | .28 | | | | 52 | | | | .54 | | | | .54 | | | | 1.37 | |
| 7/31/2017 | | | 10.22 | | | �� | .12 | | | | (.07 | ) | | | .05 | | | | (.12 | ) | | | 10.15 | | | | .49 | | | | 47 | | | | .57 | | | | .57 | | | | 1.17 | |
| 7/31/2016 | | | 10.17 | | | | .11 | | | | .05 | | | | .16 | | | | (.11 | ) | | | 10.22 | | | | 1.55 | | | | 80 | | | | .56 | | | | .56 | | | | 1.06 | |
| 7/31/2015 | | | 10.25 | | | | .11 | | | | (.08 | ) | | | .03 | | | | (.11 | ) | | | 10.17 | | | | .29 | | | | 64 | | | | .55 | | | | .55 | | | | 1.08 | |
| 106 | American Funds Tax-Exempt Funds |
American Funds Short-Term Tax-Exempt Bond Fund
| | | | | | Income from investment operations1 | | | | | | | | | | | | | | | | | | | | | | |
| Period ended | | Net asset
value,
beginning
of period | | | Net
investment
income | | | Net gains
(losses) on
securities
(both
realized and
unrealized) | | | Total from
Investment
operations | | | Dividends
(from net
investment
income) | | | Net asset
value,
end
of period | | | Total
return2,3 | | | Net assets,
end of period
(in millions) | | | Ratio of
expenses to
average net
assets before
reimbursements | | | Ratio of
expenses to
average net
assets after
reimbursements2 | | | Ratio of
net income
to average
net assets2 | |
| Class F-3: | | | | | | | | | | | | | | | | | | | | | | | | | | | | | | | | | | | | | | | | | | | | |
| 1/31/20204,5 | | $ | 10.19 | | | $ | .08 | | | $ | .04 | | | $ | .12 | | | $ | (.08 | ) | | $ | 10.23 | | | | 1.18 | %6 | | $ | 53 | | | | .40 | %7 | | | .39 | %7 | | | 1.57 | %7 |
| 7/31/2019 | | | 10.04 | | | | .17 | | | | .15 | | | | .32 | | | | (.17 | ) | | | 10.19 | | | | 3.23 | | | | 52 | | | | .44 | | | | .44 | | | | 1.71 | |
| 7/31/2018 | | | 10.15 | | | | .15 | | | | (.11 | ) | | | .04 | | | | (.15 | ) | | | 10.04 | | | | .38 | | | | 45 | | | | .44 | | | | .44 | | | | 1.45 | |
| 7/31/20174,12 | | | 10.07 | | | | .07 | | | | .08 | | | | .15 | | | | (.07 | ) | | | 10.15 | | | | 1.49 | 6 | | | 77 | | | | .47 | 7 | | | .47 | 7 | | | 1.35 | 7 |
| Class R-6: | | | | | | | | | | | | | | | | | | | | | | | | | | | | | | | | | | | | | | | | | | | | |
| 1/31/20204,5 | | | 10.19 | | | | .08 | | | | .04 | | | | .12 | | | | (.08 | ) | | | 10.23 | | | | 1.19 | 6 | | | 139 | | | | .40 | 7 | | | .39 | 7 | | | 1.57 | 7 |
| 7/31/2019 | | | 10.04 | | | | .17 | | | | .15 | | | | .32 | | | | (.17 | ) | | | 10.19 | | | | 3.24 | | | | 132 | | | | .43 | | | | .43 | | | | 1.71 | |
| 7/31/2018 | | | 10.15 | | | | .15 | | | | (.11 | ) | | | .04 | | | | (.15 | ) | | | 10.04 | | | | .38 | | | | 122 | | | | .44 | | | | .44 | | | | 1.48 | |
| 7/31/20174,13 | | | 10.09 | | | | .05 | | | | .06 | | | | .11 | | | | (.05 | ) | | | 10.15 | | | | 1.20 | 6 | | | 127 | | | | .17 | 6 | | | .17 | 6 | | | .51 | 6 |
| | | Six months
ended | | | | | | | | | |
| | | January 31, | | Year ended July 31, |
| | | 20204,5,6 | | 2019 | | 2018 | | 2017 | | 2016 | | 2015 |
| Portfolio turnover rate for all share classes | | | 32 | % | | | 50 | % | | | 34 | % | | | 26 | % | | | 21 | % | | | 38 | % |
| 1 | Based on average shares outstanding. |
| 2 | This column reflects the impact, if any, of certain reimbursements from CRMC. During one of the periods shown, CRMC reimbursed a portion of miscellaneous fees and expenses. |
| 3 | Total returns exclude any applicable sales charges, including contingent deferred sales charges. |
| 4 | Based on operations for a period that is less than a full year. |
| 5 | Unaudited. |
| 6 | Not annualized. |
| 7 | Annualized. |
| 8 | All or a significant portion of assets in this class consisted of seed capital invested by CRMC and/or its affiliates. Fees for distribution services are not charged or accrued on these seed capital assets. If such fees were paid by the fund on seed capital assets, fund expenses would have been higher and net income and total return would have been lower. |
| 9 | Amount less than $1 million. |
| 10 | Class T shares began investment operations on April 7, 2017. |
| 11 | Amount less than $.01. |
| 12 | Class F-3 shares began investment operations on January 27, 2017. |
| 13 | Class R-6 shares began investment operations on March 17, 2017. |
See notes to financial statements.
| American Funds Tax-Exempt Funds | 107 |
Financial highlights(continued)
Limited Term Tax-Exempt Bond Fund of America
| | | | | | Income (loss) from
investment operations1 | | | Dividends and distributions | | | | | | | | | | | | | | | | |
| Period ended | | Net asset
value,
beginning
of period | | | Net
investment
income | | | Net gains
(losses) on
securities
(both
realized and
unrealized) | | | Total from
investment
operations | | | Dividends
(from net
investment
income) | | | Distributions
(from capital
gains) | | | Total
dividends
and
distributions | | | Net asset
value,
end
of period | | | Total
return2 | | | Net assets,
end of period
(in millions) | | | Ratio of
expenses to
average
net assets | | | Ratio of
net income
to average
net assets | |
| Class A: | | | | | | | | | | | | | | | | | | | | | | | | | | | | | | | | | | | | | | | | | | | | | | | | |
| 1/31/20203,4 | | $ | 15.93 | | | $ | .14 | | | $ | .15 | | | $ | .29 | | | $ | (.14 | ) | | $ | (.05 | ) | | $ | (.19 | ) | | $ | 16.03 | | | | 1.84 | %5 | | $ | 3,262 | | | | .60 | %6 | | | 1.70 | %6 |
| 7/31/2019 | | | 15.52 | | | | .31 | | | | .41 | | | | .72 | | | | (.31 | ) | | | — | | | | (.31 | ) | | | 15.93 | | | | 4.71 | | | | 3,060 | | | | .59 | | | | 2.00 | |
| 7/31/2018 | | | 15.77 | | | | .31 | | | | (.25 | ) | | | .06 | | | | (.31 | ) | | | — | | | | (.31 | ) | | | 15.52 | | | | .40 | | | | 3,057 | | | | .59 | | | | 2.00 | |
| 7/31/2017 | | | 16.04 | | | | .32 | | | | (.27 | ) | | | .05 | | | | (.32 | ) | | | — | | | | (.32 | ) | | | 15.77 | | | | .34 | | | | 3,038 | | | | .59 | | | | 2.04 | |
| 7/31/2016 | | | 15.92 | | | | .35 | | | | .12 | | | | .47 | | | | (.35 | ) | | | — | | | | (.35 | ) | | | 16.04 | | | | 2.97 | | | | 3,055 | | | | .59 | | | | 2.17 | |
| 7/31/2015 | | | 16.10 | | | | .38 | | | | (.18 | ) | | | .20 | | | | (.38 | ) | | | — | | | | (.38 | ) | | | 15.92 | | | | 1.23 | | | | 2,670 | | | | .57 | | | | 2.36 | |
| Class C: | | | | | | | | | | | | | | | | | | | | | | | | | | | | | | | | | | | | | | | | | | | | | | | | |
| 1/31/20203,4 | | | 15.93 | | | | .08 | | | | .15 | | | | .23 | | | | (.08 | ) | | | (.05 | ) | | | (.13 | ) | | | 16.03 | | | | 1.48 | 5 | | | 17 | | | | 1.30 | 6 | | | 1.01 | 6 |
| 7/31/2019 | | | 15.52 | | | | .20 | | | | .41 | | | | .61 | | | | (.20 | ) | | | — | | | | (.20 | ) | | | 15.93 | | | | 3.94 | | | | 18 | | | | 1.33 | | | | 1.27 | |
| 7/31/2018 | | | 15.77 | | | | .20 | | | | (.25 | ) | | | (.05 | ) | | | (.20 | ) | | | — | | | | (.20 | ) | | | 15.52 | | | | (.34 | ) | | | 20 | | | | 1.34 | | | | 1.26 | |
| 7/31/2017 | | | 16.04 | | | | .20 | | | | (.27 | ) | | | (.07 | ) | | | (.20 | ) | | | — | | | | (.20 | ) | | | 15.77 | | | | (.40 | ) | | | 25 | | | | 1.33 | | | | 1.30 | |
| 7/31/2016 | | | 15.92 | | | | .23 | | | | .12 | | | | .35 | | | | (.23 | ) | | | — | | | | (.23 | ) | | | 16.04 | | | | 2.20 | | | | 30 | | | | 1.33 | | | | 1.43 | |
| 7/31/2015 | | | 16.10 | | | | .26 | | | | (.18 | ) | | | .08 | | | | (.26 | ) | | | — | | | | (.26 | ) | | | 15.92 | | | | .47 | | | | 30 | | | | 1.33 | | | | 1.60 | |
| Class T: | | | | | | | | | | | | | | | | | | | | | | | | | | | | | | | | | | | | | | | | | | | | | | | | |
| 1/31/20203,4 | | | 15.93 | | | | .16 | | | | .15 | | | | .31 | | | | (.16 | ) | | | (.05 | ) | | | (.21 | ) | | | 16.03 | | | | 1.99 | 5,7 | | | — | 8 | | | .30 | 6,7 | | | 2.01 | 6,7 |
| 7/31/2019 | | | 15.52 | | | | .35 | | | | .41 | | | | .76 | | | | (.35 | ) | | | — | | | | (.35 | ) | | | 15.93 | | | | 4.99 | 7 | | | — | 8 | | | .33 | 7 | | | 2.27 | 7 |
| 7/31/2018 | | | 15.77 | | | | .36 | | | | (.25 | ) | | | .11 | | | | (.36 | ) | | | — | | | | (.36 | ) | | | 15.52 | | | | .68 | 7 | | | — | 8 | | | .33 | 7 | | | 2.26 | 7 |
| 7/31/20173,9 | | | 15.68 | | | | .12 | | | | .09 | | | | .21 | | | | (.12 | ) | | | — | | | | (.12 | ) | | | 15.77 | | | | 1.32 | 5,7 | | | — | 8 | | | .10 | 5,7 | | | .74 | 5,7 |
| Class F-1: | | | | | | | | | | | | | | | | | | | | | | | | | | | | | | | | | | | | | | | | | | | | | | | | |
| 1/31/20203,4 | | | 15.93 | | | | .13 | | | | .15 | | | | .28 | | | | (.13 | ) | | | (.05 | ) | | | (.18 | ) | | | 16.03 | | | | 1.82 | 5 | | | 66 | | | | .63 | 6 | | | 1.68 | 6 |
| 7/31/2019 | | | 15.52 | | | | .30 | | | | .41 | | | | .71 | | | | (.30 | ) | | | — | | | | (.30 | ) | | | 15.93 | | | | 4.63 | | | | 60 | | | | .67 | | | | 1.93 | |
| 7/31/2018 | | | 15.77 | | | | .30 | | | | (.25 | ) | | | .05 | | | | (.30 | ) | | | — | | | | (.30 | ) | | | 15.52 | | | | .33 | | | | 64 | | | | .66 | | | | 1.93 | |
| 7/31/2017 | | | 16.04 | | | | .31 | | | | (.27 | ) | | | .04 | | | | (.31 | ) | | | — | | | | (.31 | ) | | | 15.77 | | | | .26 | | | | 83 | | | | .67 | | | | 1.96 | |
| 7/31/2016 | | | 15.92 | | | | .33 | | | | .12 | | | | .45 | | | | (.33 | ) | | | — | | | | (.33 | ) | | | 16.04 | | | | 2.88 | | | | 90 | | | | .67 | | | | 2.09 | |
| 7/31/2015 | | | 16.10 | | | | .36 | | | | (.18 | ) | | | .18 | | | | (.36 | ) | | | — | | | | (.36 | ) | | | 15.92 | | | | 1.13 | | | | 84 | | | | .67 | | | | 2.27 | |
| 108 | American Funds Tax-Exempt Funds |
Limited Term Tax-Exempt Bond Fund of America
| | | | | | Income (loss) from
investment operations1 | | | Dividends and distributions | | | | | | | | | | | | | | | | |
| Period ended | | Net asset
value,
beginning
of period | | | Net
investment
income | | | Net gains
(losses) on
securities
(both
realized and
unrealized) | | | Total from
investment
operations | | | Dividends
(from net
investment
income) | | | Distributions
(from capital
gains) | | | Total
dividend
and
distributions | | | Net asset
value,
end
of period | | | Total
return2 | | | Net assets,
end of period
(in millions) | | | Ratio of
expenses to
average
net assets | | | Ratio of
net income
to average
net assets | |
| Class F-2: | | | | | | | | | | | | | | | | | | | | | | | | | | | | | | | | | | | | | | | | | | | | | | | | |
| 1/31/20203,4 | | $ | 15.93 | | | $ | .16 | | | $ | .15 | | | $ | .31 | | | $ | (.16 | ) | | $ | (.05 | ) | | $ | (.21 | ) | | $ | 16.03 | | | | 1.96 | %5 | | $ | 581 | | | | .37 | %6 | | | 1.94 | %6 |
| 7/31/2019 | | | 15.52 | | | | .34 | | | | .41 | | | | .75 | | | | (.34 | ) | | | — | | | | (.34 | ) | | | 15.93 | | | | 4.91 | | | | 500 | | | | .39 | | | | 2.20 | |
| 7/31/2018 | | | 15.77 | | | | .34 | | | | (.25 | ) | | | .09 | | | | (.34 | ) | | | — | | | | (.34 | ) | | | 15.52 | | | | .58 | | | | 353 | | | | .41 | | | | 2.18 | |
| 7/31/2017 | | | 16.04 | | | | .35 | | | | (.27 | ) | | | .08 | | | | (.35 | ) | | | — | | | | (.35 | ) | | | 15.77 | | | | .51 | | | | 309 | | | | .42 | | | | 2.22 | |
| 7/31/2016 | | | 15.92 | | | | .38 | | | | .12 | | | | .50 | | | | (.38 | ) | | | — | | | | (.38 | ) | | | 16.04 | | | | 3.15 | | | | 291 | | | | .41 | | | | 2.34 | |
| 7/31/2015 | | | 16.10 | | | | .40 | | | | (.18 | ) | | | .22 | | | | (.40 | ) | | | — | | | | (.40 | ) | | | 15.92 | | | | 1.39 | | | | 208 | | | | .41 | | | | 2.52 | |
| Class F-3: | | | | | | | | | | | | | | | | | | | | | | | | | | | | | | | | | | | | | | | | | | | | | | | | |
| 1/31/20203,4 | | | 15.93 | | | | .16 | | | | .15 | | | | .31 | | | | (.16 | ) | | | (.05 | ) | | | (.21 | ) | | | 16.03 | | | | 2.01 | 5 | | | 355 | | | | .27 | 6 | | | 2.04 | 6 |
| 7/31/2019 | | | 15.52 | | | | .36 | | | | .41 | | | | .77 | | | | (.36 | ) | | | — | | | | (.36 | ) | | | 15.93 | | | | 5.02 | | | | 308 | | | | .30 | | | | 2.29 | |
| 7/31/2018 | | | 15.77 | | | | .36 | | | | (.25 | ) | | | .11 | | | | (.36 | ) | | | — | | | | (.36 | ) | | | 15.52 | | | | .70 | | | | 187 | | | | .30 | | | | 2.29 | |
| 7/31/20173,10 | | | 15.59 | | | | .19 | | | | .18 | | | | .37 | | | | (.19 | ) | | | — | | | | (.19 | ) | | | 15.77 | | | | 2.37 | 5 | | | 112 | | | | .30 | 6 | | | 2.36 | 6 |
| Class R-6: | | | | | | | | | | | | | | | | | | | | | | | | | | | | | | | | | | | | | | | | | | | | | | | | |
| 1/31/20203,4 | | | 15.93 | | | | .16 | | | | .15 | | | | .31 | | | | (.16 | ) | | | (.05 | ) | | | (.21 | ) | | | 16.03 | | | | 2.01 | 5 | | | 323 | | | | .27 | 6 | | | 2.04 | 6 |
| 7/31/2019 | | | 15.52 | | | | .36 | | | | .41 | | | | .77 | | | | (.36 | ) | | | — | | | | (.36 | ) | | | 15.93 | | | | 5.02 | | | | 307 | | | | .29 | | | | 2.30 | |
| 7/31/2018 | | | 15.77 | | | | .36 | | | | (.25 | ) | | | .11 | | | | (.36 | ) | | | — | | | | (.36 | ) | | | 15.52 | | | | .70 | | | | 284 | | | | .30 | | | | 2.29 | |
| 7/31/2017 | | | 16.04 | | | | .37 | | | | (.27 | ) | | | .10 | | | | (.37 | ) | | | — | | | | (.37 | ) | | | 15.77 | | | | .63 | | | | 296 | | | | .30 | | | | 2.33 | |
| 7/31/2016 | | | 15.92 | | | | .39 | | | | .12 | | | | .51 | | | | (.39 | ) | | | — | | | | (.39 | ) | | | 16.04 | | | | 3.26 | | | | 284 | | | | .30 | | | | 2.45 | |
| 7/31/2015 | | | 16.10 | | | | .42 | | | | (.18 | ) | | | .24 | | | | (.42 | ) | | | — | | | | (.42 | ) | | | 15.92 | | | | 1.50 | | | | 190 | | | | .31 | | | | 2.62 | |
| | | | | | | | | |
| | | Six months
ended | | | | | | |
| | | January 31, | | Year ended July 31, |
| | | 20203,4,5 | | 2019 | | 2018 | | 2017 | | 2016 | | 2015 |
| Portfolio turnover rate for all share classes | | 26% | | 42% | | 28% | | 27% | | 16% | | 19% |
| | |
| 1 | Based on average shares outstanding. |
| 2 | Total returns exclude any applicable sales charges, including contingent deferred sales charges. |
| 3 | Based on operations for a period that is less than a full year. |
| 4 | Unaudited. |
| 5 | Not annualized. |
| 6 | Annualized. |
| 7 | All or a significant portion of assets in this class consisted of seed capital invested by CRMC and/or its affiliates. Fees for distribution services are not charged or accrued on these seed capital assets. If such fees were paid by the fund on seed capital assets, fund expenses would have been higher and net income and total return would have been lower. |
| 8 | Amount less than $1 million. |
| 9 | Class T shares began investment operations on April 7, 2017. |
| 10 | Class F-3 shares began investment operations on January 27, 2017. |
See notes to financial statements.
| American Funds Tax-Exempt Funds | 109 |
Financial highlights (continued)
The Tax-Exempt Bond Fund of America
| | | | | | Income (loss) from investment operations1 | | | | | | | | | | | | | | | | | | | |
| Period ended | | Net asset
value,
beginning
of period | | | Net
investment
income | | | Net gains
(losses) on
securities
(both
realized and
unrealized) | | | Total from
investment
operations | | | Dividends
(from net
investment
income) | | | Net asset
value,
end
of period | | | Total
return2 | | | Net assets,
end of period
(in millions) | | | Ratio of
expenses
to average
net assets | | | Ratio of
net income
to average
net assets | |
| Class A: | | | | | | | | | | | | | | | | | | | | | | | | | | | | | | | | | | | | | | | | |
| 1/31/20203,4 | | $ | 13.29 | | | $ | .17 | | | $ | .24 | | | $ | .41 | | | $ | (.17 | ) | | $ | 13.53 | | | | 3.09 | %5 | | $ | 12,053 | | | | .53 | %6 | | | 2.50 | %6 |
| 7/31/2019 | | | 12.81 | | | | .37 | | | | .47 | | | | .84 | | | | (.36 | ) | | | 13.29 | | | | 6.71 | | | | 10,868 | | | | .52 | | | | 2.84 | |
| 7/31/2018 | | | 12.98 | | | | .38 | | | | (.17 | ) | | | .21 | | | | (.38 | ) | | | 12.81 | | | | 1.60 | | | | 10,102 | | | | .53 | | | | 2.91 | |
| 7/31/2017 | | | 13.40 | | | | .40 | | | | (.42 | ) | | | (.02 | ) | | | (.40 | ) | | | 12.98 | | | | (.09 | ) | | | 9,692 | | | | .53 | | | | 3.12 | |
| 7/31/2016 | | | 12.96 | | | | .41 | | | | .44 | | | | .85 | | | | (.41 | ) | | | 13.40 | | | | 6.69 | | | | 9,510 | | | | .54 | | | | 3.15 | |
| 7/31/2015 | | | 12.92 | | | | .42 | | | | .04 | | | | .46 | | | | (.42 | ) | | | 12.96 | | | | 3.62 | | | | 7,385 | | | | .54 | | | | 3.28 | |
| Class C: | | | | | | | | | | | | | | | | | | | | | | | | | | | | | | | | | | | | | | | | |
| 1/31/20203,4 | | | 13.29 | | | | .12 | | | | .24 | | | | .36 | | | | (.12 | ) | | | 13.53 | | | | 2.72 | 5 | | | 424 | | | | 1.25 | 6 | | | 1.78 | 6 |
| 7/31/2019 | | | 12.81 | | | | .27 | | | | .47 | | | | .74 | | | | (.26 | ) | | | 13.29 | | | | 5.88 | | | | 407 | | | | 1.31 | | | | 2.06 | |
| 7/31/2018 | | | 12.98 | | | | .27 | | | | (.17 | ) | | | .10 | | | | (.27 | ) | | | 12.81 | | | | .80 | | | | 432 | | | | 1.32 | | | | 2.12 | |
| 7/31/2017 | | | 13.40 | | | | .30 | | | | (.42 | ) | | | (.12 | ) | | | (.30 | ) | | | 12.98 | | | | (.88 | ) | | | 474 | | | | 1.32 | | | | 2.33 | |
| 7/31/2016 | | | 12.96 | | | | .31 | | | | .44 | | | | .75 | | | | (.31 | ) | | | 13.40 | | | | 5.85 | | | | 517 | | | | 1.33 | | | | 2.35 | |
| 7/31/2015 | | | 12.92 | | | | .32 | | | | .04 | | | | .36 | | | | (.32 | ) | | | 12.96 | | | | 2.80 | | | | 349 | | | | 1.33 | | | | 2.50 | |
| Class T: | | | | | | | | | | | | | | | | | | | | | | | | | | | | | | | | | | | | | | | | |
| 1/31/20203,4 | | | 13.29 | | | | .18 | | | | .24 | | | | .42 | | | | (.18 | ) | | | 13.53 | | | | 3.21 | 5,7 | | | — | 8 | | | .28 | 6,7 | | | 2.74 | 6,7 |
| 7/31/2019 | | | 12.81 | | | | .40 | | | | .47 | | | | .87 | | | | (.39 | ) | | | 13.29 | | | | 6.93 | 7 | | | — | 8 | | | .32 | 7 | | | 3.05 | 7 |
| 7/31/2018 | | | 12.98 | | | | .40 | | | | (.17 | ) | | | .23 | | | | (.40 | ) | | | 12.81 | | | | 1.83 | 7 | | | — | 8 | | | .32 | 7 | | | 3.12 | 7 |
| 7/31/20173,9 | | | 12.85 | | | | .14 | | | | .13 | | | | .27 | | | | (.14 | ) | | | 12.98 | | | | 2.07 | 5,7 | | | — | 8 | | | .10 | 5,7 | | | 1.06 | 5,7 |
| Class F-1: | | | | | | | | | | | | | | | | | | | | | | | | | | | | | | | | | | | | | | | | |
| 1/31/20203,4 | | | 13.29 | | | | .16 | | | | .24 | | | | .40 | | | | (.16 | ) | | | 13.53 | | | | 3.05 | 5 | | | 352 | | | | .61 | 6 | | | 2.42 | 6 |
| 7/31/2019 | | | 12.81 | | | | .36 | | | | .47 | | | | .83 | | | | (.35 | ) | | | 13.29 | | | | 6.58 | | | | 338 | | | | .64 | | | | 2.72 | |
| 7/31/2018 | | | 12.98 | | | | .36 | | | | (.17 | ) | | | .19 | | | | (.36 | ) | | | 12.81 | | | | 1.48 | | | | 370 | | | | .65 | | | | 2.80 | |
| 7/31/2017 | | | 13.40 | | | | .39 | | | | (.43 | ) | | | (.04 | ) | | | (.38 | ) | | | 12.98 | | | | (.22 | ) | | | 461 | | | | .66 | | | | 2.99 | |
| 7/31/2016 | | | 12.96 | | | | .39 | | | | .44 | | | | .83 | | | | (.39 | ) | | | 13.40 | | | | 6.53 | | | | 518 | | | | .67 | | | | 3.04 | |
| 7/31/2015 | | | 12.92 | | | | .41 | | | | .04 | | | | .45 | | | | (.41 | ) | | | 12.96 | | | | 3.49 | | | | 1,474 | | | | .67 | | | | 3.16 | |
| 110 | American Funds Tax-Exempt Funds |
The Tax-Exempt Bond Fund of America
| | | | | | Income (loss) from investment operations1 | | | | | | | | | | | | | | | | | | | |
| Period ended | | Net asset
value,
beginning
of period | | | Net
investment
income | | | Net gains
(losses) on
securities
(both
realized and
unrealized) | | | Total from
investment
operations | | | Dividends
(from net
investment
income) | | | Net asset
value,
end
of period | | | Total
return2 | | | Net assets,
end of period
(in millions) | | | Ratio of
expenses
to average
net assets | | | Ratio of
net income
to average
net assets | |
| Class F-2: | | | | | | | | | | | | | | | | | | | | | | | | | | | | | | | | | | | | | | | | |
| 1/31/20203,4 | | $ | 13.29 | | | $ | .18 | | | $ | .24 | | | $ | .42 | | | $ | (.18 | ) | | $ | 13.53 | | | | 3.18 | %5 | | $ | 3,233 | | | | .35 | %6 | | | 2.67 | %6 |
| 7/31/2019 | | | 12.81 | | | | .39 | | | | .47 | | | | .86 | | | | (.38 | ) | | | 13.29 | | | | 6.86 | | | | 2,778 | | | | .38 | | | | 2.98 | |
| 7/31/2018 | | | 12.98 | | | | .39 | | | | (.17 | ) | | | .22 | | | | (.39 | ) | | | 12.81 | | | | 1.74 | | | | 2,177 | | | | .39 | | | | 3.05 | |
| 7/31/2017 | | | 13.40 | | | | .42 | | | | (.42 | ) | | | — | 10 | | | (.42 | ) | | | 12.98 | | | | .03 | | | | 1,909 | | | | .41 | | | | 3.24 | |
| 7/31/2016 | | | 12.96 | | | | .43 | | | | .44 | | | | .87 | | | | (.43 | ) | | | 13.40 | | | | 6.84 | | | | 2,879 | | | | .40 | | | | 3.26 | |
| 7/31/2015 | | | 12.92 | | | | .44 | | | | .04 | | | | .48 | | | | (.44 | ) | | | 12.96 | | | | 3.76 | | | | 990 | | | | .41 | | | | 3.42 | |
| Class F-3: | | | | | | | | | | | | | | | | | | | | | | | | | | | | | | | | | | | | | | | | |
| 1/31/20203,4 | | | 13.29 | | | | .19 | | | | .24 | | | | .43 | | | | (.19 | ) | | | 13.53 | | | | 3.23 | 5 | | | 7,564 | | | | .25 | 6 | | | 2.78 | 6 |
| 7/31/2019 | | | 12.81 | | | | .41 | | | | .47 | | | | .88 | | | | (.40 | ) | | | 13.29 | | | | 6.97 | | | | 6,570 | | | | .27 | | | | 3.09 | |
| 7/31/2018 | | | 12.98 | | | | .41 | | | | (.17 | ) | | | .24 | | | | (.41 | ) | | | 12.81 | | | | 1.84 | | | | 5,397 | | | | .28 | | | | 3.11 | |
| 7/31/20173,11 | | | 12.75 | | | | .22 | | | | .23 | | | | .45 | | | | (.22 | ) | | | 12.98 | | | | 3.54 | 5 | | | 1,555 | | | | .29 | 6 | | | 3.34 | 6 |
| Class R-6: | | | | | | | | | | | | | | | | | | | | | | | | | | | | | | | | | | | | | | | | |
| 1/31/20203,4 | | | 13.29 | | | | .19 | | | | .24 | | | | .43 | | | | (.19 | ) | | | 13.53 | | | | 3.23 | 5 | | | 814 | | | | .25 | 6 | | | 2.78 | 6 |
| 7/31/2019 | | | 12.81 | | | | .41 | | | | .47 | | | | .88 | | | | (.40 | ) | | | 13.29 | | | | 6.97 | | | | 685 | | | | .27 | | | | 3.09 | |
| 7/31/2018 | | | 12.98 | | | | .41 | | | | (.17 | ) | | | .24 | | | | (.41 | ) | | | 12.81 | | | | 1.85 | | | | 550 | | | | .28 | | | | 3.15 | |
| 7/31/2017 | | | 13.40 | | | | .44 | | | | (.43 | ) | | | .01 | | | | (.43 | ) | | | 12.98 | | | | .15 | | | | 380 | | | | .29 | | | | 3.36 | |
| 7/31/2016 | | | 12.96 | | | | .44 | | | | .44 | | | | .88 | | | | (.44 | ) | | | 13.40 | | | | 6.95 | | | | 391 | | | | .29 | | | | 3.39 | |
| 7/31/2015 | | | 12.92 | | | | .46 | | | | .04 | | | | .50 | | | | (.46 | ) | | | 12.96 | | | | 3.86 | | | | 270 | | | | .30 | | | | 3.52 | |
| | | | | | | | | |
| | | Six months
ended | | | | | | |
| | | January 31, | | Year ended July 31, |
| | | 20203,4,5 | | 2019 | | 2018 | | 2017 | | 2016 | | 2015 |
| Portfolio turnover rate for all share classes | | 8% | | 20% | | 17% | | 20% | | 13% | | 14% |
| | |
| 1 | Based on average shares outstanding. |
| 2 | Total returns exclude any applicable sales charges, including contingent deferred sales charges. |
| 3 | Based on operations for a period that is less than a full year. |
| 4 | Unaudited. |
| 5 | Not annualized. |
| 6 | Annualized. |
| 7 | All or a significant portion of assets in this class consisted of seed capital invested by CRMC and/or its affiliates. Fees for distribution services are not charged or accrued on these seed capital assets. If such fees were paid by the fund on seed capital assets, fund expenses would have been higher and net income and total return would have been lower. |
| 8 | Amount less than $1 million. |
| 9 | Class T shares began investment operations on April 7, 2017. |
| 10 | Amount less than $.01. |
| 11 | Class F-3 shares began investment operations on January 27, 2017. |
See notes to financial statements.
| American Funds Tax-Exempt Funds | 111 |
Financial highlights (continued)
American High-Income Municipal Bond Fund
| | | | | | Income (loss) from
investment operations1 | | | Dividends and distributions | | | | | | | | | | | | | | | | |
| Period ended | | Net asset
value,
beginning
of period | | | Net
investment
income | | | Net gains
(losses) on
securities
(both
realized and
unrealized) | | | Total from
investment
operations | | | Dividends
(from net
investment
income) | | | Distributions
(from capital
gains) | | | Total
dividend
and
distributions | | | Net asset
value,
end
of period | | | Total
return2 | | | Net assets,
end of period
(in millions) | | | Ratio of
expenses to
average
net assets | | | Ratio of
net income
to average
net assets | |
| Class A: | | | | | | | | | | | | | | | | | | | | | | | | | | | | | | | | | | | | | | | | | | | | | | | | |
| 1/31/20203,4 | | $ | 16.33 | | | $ | .29 | | | $ | .34 | | | $ | .63 | | | $ | (.27 | ) | | $ | (.01 | ) | | $ | (.28 | ) | | $ | 16.68 | | | | 3.91 | %5 | | $ | 5,131 | | | | .68 | %6 | | | 3.46 | %6 |
| 7/31/2019 | | | 15.78 | | | | .58 | | | | .54 | | | | 1.12 | | | | (.57 | ) | | | — | | | | (.57 | ) | | | 16.33 | | | | 7.28 | | | | 4,637 | | | | .68 | | | | 3.67 | |
| 7/31/2018 | | | 15.73 | | | | .59 | | | | .04 | | | | .63 | | | | (.58 | ) | | | — | | | | (.58 | ) | | | 15.78 | | | | 4.05 | | | | 4,062 | | | | .69 | | | | 3.72 | |
| 7/31/2017 | | | 16.21 | | | | .60 | | | | (.49 | ) | | | .11 | | | | (.59 | ) | | | — | | | | (.59 | ) | | | 15.73 | | | | .76 | | | | 3,645 | | | | .67 | | | | 3.86 | |
| 7/31/2016 | | | 15.40 | | | | .63 | | | | .79 | | | | 1.42 | | | | (.61 | ) | | | — | | | | (.61 | ) | | | 16.21 | | | | 9.45 | | | | 3,519 | | | | .67 | | | | 4.02 | |
| 7/31/2015 | | | 15.22 | | | | .64 | | | | .17 | | | | .81 | | | | (.63 | ) | | | — | | | | (.63 | ) | | | 15.40 | | | | 5.34 | | | | 2,700 | | | | .68 | | | | 4.13 | |
| Class C: | | | | | | | | | | | | | | | | | | | | | | | | | | | | | | | | | | | | | | | | | | | | | | | | |
| 1/31/20203,4 | | | 16.33 | | | | .23 | | | | .34 | | | | .57 | | | | (.21 | ) | | | (.01 | ) | | | (.22 | ) | | | 16.68 | | | | 3.55 | 5 | | | 247 | | | | 1.38 | 6 | | | 2.76 | 6 |
| 7/31/2019 | | | 15.78 | | | | .47 | | | | .54 | | | | 1.01 | | | | (.46 | ) | | | — | | | | (.46 | ) | | | 16.33 | | | | 6.49 | | | | 238 | | | | 1.41 | | | | 2.94 | |
| 7/31/2018 | | | 15.73 | | | | .47 | | | | .04 | | | | .51 | | | | (.46 | ) | | | — | | | | (.46 | ) | | | 15.78 | | | | 3.29 | | | | 227 | | | | 1.43 | | | | 2.97 | |
| 7/31/2017 | | | 16.21 | | | | .48 | | | | (.49 | ) | | | (.01 | ) | | | (.47 | ) | | | — | | | | (.47 | ) | | | 15.73 | | | | — | | | | 229 | | | | 1.43 | | | | 3.10 | |
| 7/31/2016 | | | 15.40 | | | | .52 | | | | .79 | | | | 1.31 | | | | (.50 | ) | | | — | | | | (.50 | ) | | | 16.21 | | | | 8.62 | | | | 247 | | | | 1.43 | | | | 3.26 | |
| 7/31/2015 | | | 15.22 | | | | .52 | | | | .17 | | | | .69 | | | | (.51 | ) | | | — | | | | (.51 | ) | | | 15.40 | | | | 4.55 | | | | 182 | | | | 1.44 | | | | 3.37 | |
| Class T: | | | | | | | | | | | | | | | | | | | | | | | | | | | | | | | | | | | | | | | | | | | | | | | | |
| 1/31/20203,4 | | | 16.33 | | | | .31 | | | | .34 | | | | .65 | | | | (.29 | ) | | | (.01 | ) | | | (.30 | ) | | | 16.68 | | | | 4.07 | 5,7 | | | — | 8 | | | .38 | 6,7 | | | 3.76 | 6,7 |
| 7/31/2019 | | | 15.78 | | | | .62 | | | | .54 | | | | 1.16 | | | | (.61 | ) | | | — | | | | (.61 | ) | | | 16.33 | | | | 7.55 | 7 | | | — | 8 | | | .42 | 7 | | | 3.93 | 7 |
| 7/31/2018 | | | 15.73 | | | | .63 | | | | .04 | | | | .67 | | | | (.62 | ) | | | — | | | | (.62 | ) | | | 15.78 | | | | 4.34 | 7 | | | — | 8 | | | .43 | 7 | | | 3.98 | 7 |
| 7/31/20173,9 | | | 15.50 | | | | .20 | | | | .23 | | | | .43 | | | | (.20 | ) | | | — | | | | (.20 | ) | | | 15.73 | | | | 2.77 | 5,7 | | | — | 8 | | | .12 | 5,7 | | | 1.28 | 5,7 |
| Class F-1: | | | | | | | | | | | | | | | | | | | | | | | | | | | | | | | | | | | | | | | | | | | | | | | | |
| 1/31/20203,4 | | | 16.33 | | | | .29 | | | | .34 | | | | .63 | | | | (.27 | ) | | | (.01 | ) | | | (.28 | ) | | | 16.68 | | | | 3.90 | 5 | | | 189 | | | | .70 | 6 | | | 3.44 | 6 |
| 7/31/2019 | | | 15.78 | | | | .57 | | | | .54 | | | | 1.11 | | | | (.56 | ) | | | — | | | | (.56 | ) | | | 16.33 | | | | 7.21 | | | | 180 | | | | .74 | | | | 3.61 | |
| 7/31/2018 | | | 15.73 | | | | .58 | | | | .04 | | | | .62 | | | | (.57 | ) | | | — | | | | (.57 | ) | | | 15.78 | | | | 3.99 | | | | 208 | | | | .75 | | | | 3.65 | |
| 7/31/2017 | | | 16.21 | | | | .59 | | | | (.49 | ) | | | .10 | | | | (.58 | ) | | | — | | | | (.58 | ) | | | 15.73 | | | | .68 | | | | 234 | | | | .75 | | | | 3.77 | |
| 7/31/2016 | | | 15.40 | | | | .62 | | | | .79 | | | | 1.41 | | | | (.60 | ) | | | — | | | | (.60 | ) | | | 16.21 | | | | 9.37 | | | | 282 | | | | .74 | | | | 3.95 | |
| 7/31/2015 | | | 15.22 | | | | .62 | | | | .17 | | | | .79 | | | | (.61 | ) | | | — | | | | (.61 | ) | | | 15.40 | | | | 5.27 | | | | 207 | | | | .75 | | | | 4.06 | |
| | |
| 112 | American Funds Tax-Exempt Funds |
American High-Income Municipal Bond Fund
| | | | | | Income (loss) from
investment operations1 | | | Dividends and distributions | | | | | | | | | | | | | | | | |
| Period ended | | Net asset
value,
beginning
of period | | | Net
investment
income | | | Net gains
(losses) on
securities
(both
realized and
unrealized) | | | Total from
investment
operations | | | Dividends
(from net
investment
income) | | | Distributions
(from capital
gains) | | | Total
dividends
and
distributions | | | Net asset
value,
end
of period | | | Total
return2 | | | Net assets,
end of period
(in millions) | | | Ratio of
expenses to
average
net assets | | | Ratio of
net income
to average
net assets | |
| Class F-2: | | | | | | | | | | | | | | | | | | | | | | | | | | | | | | | | | | | | | | | | | | | | | | | | |
| 1/31/20203,4 | | $ | 16.33 | | | $ | .31 | | | $ | .34 | | | $ | .65 | | | $ | (.29 | ) | | $ | (.01 | ) | | $ | (.30 | ) | | $ | 16.68 | | | | 4.04 | %5 | | $ | 1,270 | | | | .44 | %6 | | | 3.70 | %6 |
| 7/31/2019 | | | 15.78 | | | | .61 | | | | .54 | | | | 1.15 | | | | (.60 | ) | | | — | | | | (.60 | ) | | | 16.33 | | | | 7.49 | | | | 1,114 | | | | .47 | | | | 3.87 | |
| 7/31/2018 | | | 15.73 | | | | .62 | | | | .04 | | | | .66 | | | | (.61 | ) | | | — | | | | (.61 | ) | | | 15.78 | | | | 4.26 | | | | 798 | | | | .49 | | | | 3.91 | |
| 7/31/2017 | | | 16.21 | | | | .63 | | | | (.49 | ) | | | .14 | | | | (.62 | ) | | | — | | | | (.62 | ) | | | 15.73 | | | | .93 | | | | 605 | | | | .50 | | | | 4.05 | |
| 7/31/2016 | | | 15.40 | | | | .66 | | | | .79 | | | | 1.45 | | | | (.64 | ) | | | — | | | | (.64 | ) | | | 16.21 | | | | 9.65 | | | | 775 | | | | .48 | | | | 4.18 | |
| 7/31/2015 | | | 15.22 | | | | .66 | | | | .17 | | | | .83 | | | | (.65 | ) | | | — | | | | (.65 | ) | | | 15.40 | | | | 5.53 | | | | 321 | | | | .49 | | | | 4.32 | |
| Class F-3: | | | | | | | | | | | | | | | | | | | | | | | | | | | | | | | | | | | | | | | | | | | | | | | | |
| 1/31/20203,4 | | | 16.33 | | | | .32 | | | | .34 | | | | .66 | | | | (.30 | ) | | | (.01 | ) | | | (.31 | ) | | | 16.68 | | | | 4.09 | 5 | | | 1,045 | | | | .34 | 6 | | | 3.80 | 6 |
| 7/31/2019 | | | 15.78 | | | | .63 | | | | .54 | | | | 1.17 | | | | (.62 | ) | | | — | | | | (.62 | ) | | | 16.33 | | | | 7.60 | | | | 897 | | | | .37 | | | | 3.97 | |
| 7/31/2018 | | | 15.73 | | | | .64 | | | | .04 | | | | .68 | | | | (.63 | ) | | | — | | | | (.63 | ) | | | 15.78 | | | | 4.37 | | | | 646 | | | | .38 | | | | 4.02 | |
| 7/31/20173,10 | | | 15.30 | | | | .32 | | | | .43 | | | | .75 | | | | (.32 | ) | | | — | | | | (.32 | ) | | | 15.73 | | | | 4.96 | 5 | | | 421 | | | | .37 | 6 | | | 4.04 | 6 |
| Class R-6: | | | | | | | | | | | | | | | | | | | | | | | | | | | | | | | | | | | | | | | | | | | | | | | | |
| 1/31/20203,4 | | | 16.33 | | | | .32 | | | | .34 | | | | .66 | | | | (.30 | ) | | | (.01 | ) | | | (.31 | ) | | | 16.68 | | | | 4.09 | 5 | | | 815 | | | | .34 | 6 | | | 3.81 | 6 |
| 7/31/2019 | | | 15.78 | | | | .63 | | | | .54 | | | | 1.17 | | | | (.62 | ) | | | — | | | | (.62 | ) | | | 16.33 | | | | 7.61 | | | | 686 | | | | .37 | | | | 3.98 | |
| 7/31/2018 | | | 15.73 | | | | .64 | | | | .04 | | | | .68 | | | | (.63 | ) | | | — | | | | (.63 | ) | | | 15.78 | | | | 4.37 | | | | 550 | | | | .38 | | | | 4.02 | |
| 7/31/2017 | | | 16.21 | | | | .64 | | | | (.49 | ) | | | .15 | | | | (.63 | ) | | | — | | | | (.63 | ) | | | 15.73 | | | | 1.05 | | | | 380 | | | | .38 | | | | 4.16 | |
| 7/31/2016 | | | 15.40 | | | | .68 | | | | .79 | | | | 1.47 | | | | (.66 | ) | | | — | | | | (.66 | ) | | | 16.21 | | | | 9.76 | | | | 269 | | | | .38 | | | | 4.31 | |
| 7/31/2015 | | | 15.22 | | | | .68 | | | | .17 | | | | .85 | | | | (.67 | ) | | | — | | | | (.67 | ) | | | 15.40 | | | | 5.64 | | | | 188 | | | | .39 | | | | 4.42 | |
| | | | | | | | | |
| | | Six months
ended | | | | | | |
| | | January 31, | | Year ended July 31, |
| | | 20203,4,5 | | 2019 | | 2018 | | 2017 | | 2016 | | 2015 |
| Portfolio turnover rate for all share classes | | 11% | | 20% | | 24% | | 30% | | 21% | | 23% |
| | |
| 1 | Based on average shares outstanding. |
| 2 | Total returns exclude any applicable sales charges, including contingent deferred sales charges. |
| 3 | Based on operations for a period that is less than a full year. |
| 4 | Unaudited. |
| 5 | Not annualized. |
| 6 | Annualized. |
| 7 | All or a significant portion of assets in this class consisted of seed capital invested by CRMC and/or its affiliates. Fees for distribution services are not charged or accrued on these seed capital assets. If such fees were paid by the fund on seed capital assets, fund expenses would have been higher and net income and total return would have been lower. |
| 8 | Amount less than $1 million. |
| 9 | Class T shares began investment operations on April 7, 2017. |
| 10 | Class F-3 shares began investment operations on January 27, 2017. |
See notes to financial statements.
| American Funds Tax-Exempt Funds | 113 |
Financial highlights (continued)
The Tax-Exempt Fund of California
| | | | | | Income (loss) from
investment operations1 | | | Dividends and distributions | | | | | | | | | | | | | | | | |
| Period ended | | Net asset
value,
beginning
of period | | | Net
investment
income | | | Net gains
(losses) on
securities
(both
realized and
unrealized) | | | Total from
investment
operations | | | Dividends
(from net
investment
income) | | | Distributions
(from capital
gains) | | | Total
dividend
and
distributions | | | Net asset
value,
end
of period | | | Total
return2 | | | Net assets,
end of period
(in millions) | | | Ratio of
expenses to
average
net assets | | | Ratio of
net income
to average
net assets | |
| Class A: | | | | | | | | | | | | | | | | | | | | | | | | | | | | | | | | | | | | | | | | | | | | | | | | |
| 1/31/20203,4 | | $ | 18.08 | | | $ | .22 | | | $ | .34 | | | $ | .56 | | | $ | (.22 | ) | | $ | (.09 | ) | | $ | (.31 | ) | | $ | 18.33 | | | | 3.15 | %5 | | $ | 1,943 | | | | .63 | %6 | | | 2.42 | %6 |
| 7/31/2019 | | | 17.43 | | | | .50 | | | | .65 | | | | 1.15 | | | | (.50 | ) | | | — | | | | (.50 | ) | | | 18.08 | | | | 6.73 | | | | 1,784 | | | | .59 | | | | 2.88 | |
| 7/31/2018 | | | 17.63 | | | | .51 | | | | (.20 | ) | | | .31 | | | | (.51 | ) | | | — | | | | (.51 | ) | | | 17.43 | | | | 1.77 | | | | 1,678 | | | | .61 | | | | 2.90 | |
| 7/31/2017 | | | 18.21 | | | | .54 | | | | (.59 | ) | | | (.05 | ) | | | (.53 | ) | | | — | | | | (.53 | ) | | | 17.63 | | | | (.22 | ) | | | 1,641 | | | | .60 | | | | 3.05 | |
| 7/31/2016 | | | 17.62 | | | | .57 | | | | .58 | | | | 1.15 | | | | (.56 | ) | | | — | | | | (.56 | ) | | | 18.21 | | | | 6.65 | | | | 1,678 | | | | .60 | | | | 3.17 | |
| 7/31/2015 | | | 17.52 | | | | .60 | | | | .09 | | | | .69 | | | | (.59 | ) | | | — | | | | (.59 | ) | | | 17.62 | | | | 3.98 | | | | 1,386 | | | | .62 | | | | 3.38 | |
| Class C: | | | | | | | | | | | | | | | | | | | | | | | | | | | | | | | | | | | | | | | | | | | | | | | | |
| 1/31/20203,4 | | | 18.08 | | | | .16 | | | | .34 | | | | .50 | | | | (.16 | ) | | | (.09 | ) | | | (.25 | ) | | | 18.33 | | | | 2.76 | 5 | | | 70 | | | | 1.38 | 6 | | | 1.67 | 6 |
| 7/31/2019 | | | 17.43 | | | | .36 | | | | .65 | | | | 1.01 | | | | (.36 | ) | | | — | | | | (.36 | ) | | | 18.08 | | | | 5.90 | | | | 69 | | | | 1.38 | | | | 2.10 | |
| 7/31/2018 | | | 17.63 | | | | .37 | | | | (.20 | ) | | | .17 | | | | (.37 | ) | | | — | | | | (.37 | ) | | | 17.43 | | | | .97 | | | | 71 | | | | 1.40 | | | | 2.11 | |
| 7/31/2017 | | | 18.21 | | | | .40 | | | | (.59 | ) | | | (.19 | ) | | | (.39 | ) | | | — | | | | (.39 | ) | | | 17.63 | | | | (1.00 | ) | | | 83 | | | | 1.39 | | | | 2.26 | |
| 7/31/2016 | | | 17.62 | | | | .43 | | | | .58 | | | | 1.01 | | | | (.42 | ) | | | — | | | | (.42 | ) | | | 18.21 | | | | 5.82 | | | | 97 | | | | 1.39 | | | | 2.38 | |
| 7/31/2015 | | | 17.52 | | | | .46 | | | | .09 | | | | .55 | | | | (.45 | ) | | | — | | | | (.45 | ) | | | 17.62 | | | | 3.16 | | | | 78 | | | | 1.40 | | | | 2.59 | |
| Class T: | | | | | | | | | | | | | | | | | | | | | | | | | | | | | | | | | | | | | | | | | | | | | | | | |
| 1/31/20203,4 | | | 18.08 | | | | .25 | | | | .34 | | | | .59 | | | | (.25 | ) | | | (.09 | ) | | | (.34 | ) | | | 18.33 | | | | 3.27 | 5,7 | | | — | 8 | | | .40 | 6,7 | | | 2.65 | 6,7 |
| 7/31/2019 | | | 17.43 | | | | .54 | | | | .65 | | | | 1.19 | | | | (.54 | ) | | | — | | | | (.54 | ) | | | 18.08 | | | | 6.95 | 7 | | | — | 8 | | | .39 | 7 | | | 3.09 | 7 |
| 7/31/2018 | | | 17.63 | | | | .54 | | | | (.20 | ) | | | .34 | | | | (.54 | ) | | | — | | | | (.54 | ) | | | 17.43 | | | | 1.98 | 7 | | | — | 8 | | | .40 | 7 | | | 3.10 | 7 |
| 7/31/20173,9 | | | 17.42 | | | | .18 | | | | .21 | | | | .39 | | | | (.18 | ) | | | — | | | | (.18 | ) | | | 17.63 | | | | 2.24 | 5,7 | | | — | 8 | | | .12 | 5,7 | | | 1.02 | 5,7 |
| Class F-1: | | | | | | | | | | | | | | | | | | | | | | | | | | | | | | | | | | | | | | | | | | | | | | | | |
| 1/31/20203,4 | | | 18.08 | | | | .22 | | | | .34 | | | | .56 | | | | (.22 | ) | | | (.09 | ) | | | (.31 | ) | | | 18.33 | | | | 3.10 | 5 | | | 75 | | | | .72 | 6 | | | 2.33 | 6 |
| 7/31/2019 | | | 17.43 | | | | .48 | | | | .65 | | | | 1.13 | | | | (.48 | ) | | | — | | | | (.48 | ) | | | 18.08 | | | | 6.59 | | | | 72 | | | | .72 | | | | 2.76 | |
| 7/31/2018 | | | 17.63 | | | | .49 | | | | (.20 | ) | | | .29 | | | | (.49 | ) | | | — | | | | (.49 | ) | | | 17.43 | | | | 1.64 | | | | 75 | | | | .73 | | | | 2.77 | |
| 7/31/2017 | | | 18.21 | | | | .51 | | | | (.58 | ) | | | (.07 | ) | | | (.51 | ) | | | — | | | | (.51 | ) | | | 17.63 | | | | (.35 | ) | | | 76 | | | | .73 | | | | 2.93 | |
| 7/31/2016 | | | 17.62 | | | | .55 | | | | .58 | | | | 1.13 | | | | (.54 | ) | | | — | | | | (.54 | ) | | | 18.21 | | | | 6.52 | | | | 83 | | | | .73 | | | | 3.04 | |
| 7/31/2015 | | | 17.52 | | | | .58 | | | | .09 | | | | .67 | | | | (.57 | ) | | | — | | | | (.57 | ) | | | 17.62 | | | | 3.85 | | | | 63 | | | | .74 | | | | 3.26 | |
| | |
| 114 | American Funds Tax-Exempt Funds |
The Tax-Exempt Fund of California
| | | | | | Income (loss) from
investment operations1 | | | Dividends and distributions | | | | | | | | | | | | | | | | |
| Period ended | | Net asset
value,
beginning
of period | | | Net
investment
income | | | Net gains
(losses) on
securities
(both
realized and
unrealized) | | | Total from
investment
operations | | | Dividends
(from net
investment
income) | | | Distributions
(from capital
gains) | | | Total
dividends
and
distributions | | | Net asset
value,
end
of period | | | Total
return2 | | | Net assets,
end of period
(in millions) | | | Ratio of
expenses to
average
net assets | | | Ratio of
net income
to average
net assets | |
| Class F-2: | | | | | | | | | | | | | | | | | | | | | | | | | | | | | | | | | | | | | | | | | | | | | | | | |
| 1/31/20203,4 | | $ | 18.08 | | | $ | .24 | | | $ | .34 | | | $ | .58 | | | $ | (.24 | ) | | $ | (.09 | ) | | $ | (.33 | ) | | $ | 18.33 | | | | 3.25 | %5 | | $ | 472 | | | | .45 | %6 | | | 2.60 | %6 |
| 7/31/2019 | | | 17.43 | | | | .53 | | | | .65 | | | | 1.18 | | | | (.53 | ) | | | — | | | | (.53 | ) | | | 18.08 | | | | 6.88 | | | | 411 | | | | .45 | | | | 3.02 | |
| 7/31/2018 | | | 17.63 | | | | .53 | | | | (.20 | ) | | | .33 | | | | (.53 | ) | | | — | | | | (.53 | ) | | | 17.43 | | | | 1.89 | | | | 257 | | | | .48 | | | | 3.03 | |
| 7/31/2017 | | | 18.21 | | | | .56 | | | | (.59 | ) | | | (.03 | ) | | | (.55 | ) | | | — | | | | (.55 | ) | | | 17.63 | | | | (.09 | ) | | | 200 | | | | .48 | | | | 3.18 | |
| 7/31/2016 | | | 17.62 | | | | .60 | | | | .58 | | | | 1.18 | | | | (.59 | ) | | | — | | | | (.59 | ) | | | 18.21 | | | | 6.79 | | | | 213 | | | | .48 | | | | 3.29 | |
| 7/31/2015 | | | 17.52 | | | | .62 | | | | .09 | | | | .71 | | | | (.61 | ) | | | — | | | | (.61 | ) | | | 17.62 | | | | 4.10 | | | | 134 | | | | .49 | | | | 3.51 | |
| Class F-3: | | | | | | | | | | | | | | | | | | | | | | | | | | | | | | | | | | | | | | | | | | | | | | | | |
| 1/31/20203,4 | | | 18.08 | | | | .25 | | | | .34 | | | | .59 | | | | (.25 | ) | | | (.09 | ) | | | (.34 | ) | | | 18.33 | | | | 3.29 | 5 | | | 303 | | | | .36 | 6 | | | 2.69 | 6 |
| 7/31/2019 | | | 17.43 | | | | .55 | | | | .64 | | | | 1.19 | | | | (.54 | ) | | | — | | | | (.54 | ) | | | 18.08 | | | | 6.98 | | | | 241 | | | | .36 | | | | 3.11 | |
| 7/31/2018 | | | 17.63 | | | | .55 | | | | (.20 | ) | | | .35 | | | | (.55 | ) | | | — | | | | (.55 | ) | | | 17.43 | | | | 2.01 | | | | 174 | | | | .37 | | | | 3.13 | |
| 7/31/20173,10 | | | 17.27 | | | | .29 | | | | .36 | | | | .65 | | | | (.29 | ) | | | — | | | | (.29 | ) | | | 17.63 | | | | 3.79 | 5 | | | 124 | | | | .38 | 6 | | | 3.25 | 6 |
| | | | | | | | | |
| | | Six months
ended
January 31, | | Year ended July 31, |
| | | 20203,4,5 | | 2019 | | 2018 | | 2017 | | 2016 | | 2015 |
| Portfolio turnover rate for all share classes | | 13% | | 27% | | 14% | | 21% | | 11% | | 17% |
| | |
| 1 | Based on average shares outstanding. |
| 2 | Total returns exclude any applicable sales charges, including contingent deferred sales charges. |
| 3 | Based on operations for a period that is less than a full year. |
| 4 | Unaudited. |
| 5 | Not annualized. |
| 6 | Annualized. |
| 7 | All or a significant portion of assets in this class consisted of seed capital invested by CRMC and/or its affiliates. Fees for distribution services are not charged or accrued on these seed capital assets. If such fees were paid by the fund on seed capital assets, fund expenses would have been higher and net income and total return would have been lower. |
| 8 | Amount less than $1 million. |
| 9 | Class T shares began investment operations on April 7, 2017. |
| 10 | Class F-3 shares began investment operations on January 27, 2017. |
See notes to financial statements.
| American Funds Tax-Exempt Funds | 115 |
Financial highlights (continued)
American Funds Tax-Exempt Fund of New York
| | | | | | Income (loss) from investment operations1 | | | | | | | | | | | | | | | | | | | | | | |
| Period ended | | Net asset
value,
beginning
of period | | | Net
investment
income | | | Net gains
(losses) on
securities
(both
realized and
unrealized) | | | Total from
investment
operations | | | Dividends
(from net
investment
income) | | | Net asset
value,
end
of period | | | Total
return2,3 | | | Net assets,
end of period
(in millions) | | | Ratio of
expenses to
average net
assets before
reimbursements | | | Ratio of
expenses to
average net
assets after
reimbursements3 | | | Ratio of
net income
to average
net assets3 | |
| Class A: | | | | | | | | | | | | | | | | | | | | | | | | | | | | | | | | | | | | | | | | | | | | |
| 1/31/20204,5 | | $ | 11.02 | | | $ | .14 | | | $ | .19 | | | $ | .33 | | | $ | (.13 | ) | | $ | 11.22 | | | | 3.05 | %6 | | $ | 222 | | | | .69 | %7 | | | .63 | %7 | | | 2.42 | %7 |
| 7/31/2019 | | | 10.61 | | | | .28 | | | | .41 | | | | .69 | | | | (.28 | ) | | | 11.02 | | | | 6.57 | | | | 200 | | | | .67 | | | | .67 | | | | 2.60 | |
| 7/31/2018 | | | 10.80 | | | | .27 | | | | (.19 | ) | | | .08 | | | | (.27 | ) | | | 10.61 | | | | .75 | 8 | | | 183 | | | | .72 | 8 | | | .69 | 8 | | | 2.52 | 8 |
| 7/31/2017 | | | 11.12 | | | | .27 | | | | (.32 | ) | | | (.05 | ) | | | (.27 | ) | | | 10.80 | | | | (.39 | )8 | | | 169 | | | | .74 | 8 | | | .69 | 8 | | | 2.55 | 8 |
| 7/31/2016 | | | 10.66 | | | | .28 | | | | .45 | | | | .73 | | | | (.27 | ) | | | 11.12 | | | | 6.95 | 8 | | | 161 | | | | .72 | 8 | | | .69 | 8 | | | 2.54 | 8 |
| 7/31/2015 | | | 10.58 | | | | .32 | | | | .07 | | | | .39 | | | | (.31 | ) | | | 10.66 | | | | 3.65 | 8 | | | 124 | | | | .72 | 8 | | | .67 | 8 | | | 2.91 | 8 |
| Class C: | | | | | | | | | | | | | | | | | | | | | | | | | | | | | | | | | | | | | | | | | | | | |
| 1/31/20204,5 | | | 11.02 | | | | .10 | | | | .19 | | | | .29 | | | | (.09 | ) | | | 11.22 | | | | 2.66 | 6 | | | 12 | | | | 1.44 | 7 | | | 1.38 | 7 | | | 1.67 | 7 |
| 7/31/2019 | | | 10.61 | | | | .19 | | | | .41 | | | | .60 | | | | (.19 | ) | | | 11.02 | | | | 5.74 | | | | 12 | | | | 1.46 | | | | 1.45 | | | | 1.81 | |
| 7/31/2018 | | | 10.80 | | | | .19 | | | | (.19 | ) | | | — | 9 | | | (.19 | ) | | | 10.61 | | | | (.04 | ) | | | 12 | | | | 1.52 | | | | 1.48 | | | | 1.73 | |
| 7/31/2017 | | | 11.12 | | | | .19 | | | | (.32 | ) | | | (.13 | ) | | | (.19 | ) | | | 10.80 | | | | (1.17 | ) | | | 12 | | | | 1.52 | | | | 1.48 | | | | 1.76 | |
| 7/31/2016 | | | 10.66 | | | | .20 | | | | .45 | | | | .65 | | | | (.19 | ) | | | 11.12 | | | | 6.11 | | | | 14 | | | | 1.51 | | | | 1.48 | | | | 1.75 | |
| 7/31/2015 | | | 10.58 | | | | .23 | | | | .07 | | | | .30 | | | | (.22 | ) | | | 10.66 | | | | 2.79 | | | | 10 | | | | 1.56 | | | | 1.50 | | | | 2.07 | |
| Class T: | | | | | | | | | | | | | | | | | | | | | | | | | | | | | | | | | | | | | | | | | | | | |
| 1/31/20204,5 | | | 11.02 | | | | .16 | | | | .19 | | | | .35 | | | | (.15 | ) | | | 11.22 | | | | 3.17 | 6,8 | | | — | 10 | | | .44 | 7,8 | | | .39 | 7,8 | | | 2.65 | 7,8 |
| 7/31/2019 | | | 10.61 | | | | .30 | | | | .41 | | | | .71 | | | | (.30 | ) | | | 11.02 | | | | 6.78 | 8 | | | — | 10 | | | .47 | 8 | | | .46 | 8 | | | 2.79 | 8 |
| 7/31/2018 | | | 10.80 | | | | .29 | | | | (.19 | ) | | | .10 | | | | (.29 | ) | | | 10.61 | | | | .98 | 8 | | | — | 10 | | | .52 | 8 | | | .48 | 8 | | | 2.73 | 8 |
| 7/31/20174,11 | | | 10.68 | | | | .09 | | | | .13 | | | | .22 | | | | (.10 | ) | | | 10.80 | | | | 2.02 | 6,8 | | | — | 10 | | | .19 | 6,8 | | | .15 | 6,8 | | | .87 | 6,8 |
| Class F-1: | | | | | | | | | | | | | | | | | | | | | | | | | | | | | | | | | | | | | | | | | | | | |
| 1/31/20204,5 | | | 11.02 | | | | .14 | | | | .19 | | | | .33 | | | | (.13 | ) | | | 11.22 | | | | 3.04 | 6,8 | | | 2 | | | | .70 | 7,8 | | | .64 | 7,8 | | | 2.41 | 7,8 |
| 7/31/2019 | | | 10.61 | | | | .27 | | | | .41 | | | | .68 | | | | (.27 | ) | | | 11.02 | | | | 6.52 | 8 | | | 2 | | | | .72 | 8 | | | .71 | 8 | | | 2.55 | 8 |
| 7/31/2018 | | | 10.80 | | | | .26 | | | | (.19 | ) | | | .07 | | | | (.26 | ) | | | 10.61 | | | | .69 | 8 | | | 2 | | | | .79 | 8 | | | .75 | 8 | | | 2.45 | 8 |
| 7/31/2017 | | | 11.12 | | | | .27 | | | | (.32 | ) | | | (.05 | ) | | | (.27 | ) | | | 10.80 | | | | (.38 | )8 | | | 3 | | | | .73 | 8 | | | .68 | 8 | | | 2.56 | 8 |
| 7/31/2016 | | | 10.66 | | | | .29 | | | | .45 | | | | .74 | | | | (.28 | ) | | | 11.12 | | | | 7.02 | 8 | | | 2 | | | | .65 | 8 | | | .62 | 8 | | | 2.61 | 8 |
| 7/31/2015 | | | 10.58 | | | | .31 | | | | .07 | | | | .38 | | | | (.30 | ) | | | 10.66 | | | | 3.58 | 8 | | | 2 | | | | .80 | 8 | | | .74 | 8 | | | 2.83 | 8 |
| | |
| 116 | American Funds Tax-Exempt Funds |
American Funds Tax-Exempt Fund of New York
| | | | | | Income (loss) from investment operations1 | | | | | | | | | | | | | | | | | | | | | | |
| Period ended | | Net asset
value,
beginning
of period | | | Net
investment
income | | | Net gains
(losses) on
securities
(both
realized and
unrealized) | | | Total from
investment
operations | | | Dividends
(from net
investment
income) | | | Net asset
value,
end
of period | | | Total
return2,3 | | | Net assets,
end of period
(in millions) | | | Ratio of
expenses to
average net
assets before
reimbursements | | | Ratio of
expenses to
average net
assets after
reimbursements3 | | | Ratio of
net income
to average
net assets3 | |
| Class F-2: | | | | | | | | | | | | | | | | | | | | | | | | | | | | | | | | | | | | | | | | | | | | |
| 1/31/20204,5 | | $ | 11.02 | | | $ | .15 | | | $ | .19 | | | $ | .34 | | | $ | (.14 | ) | | $ | 11.22 | | | | 3.14 | %6 | | $ | 33 | | | | .51 | %7 | | | .46 | %7 | | | 2.59 | %7 |
| 7/31/2019 | | | 10.61 | | | | .29 | | | | .41 | | | | .70 | | | | (.29 | ) | | | 11.02 | | | | 6.74 | | | | 29 | | | | .51 | | | | .51 | | | | 2.75 | |
| 7/31/2018 | | | 10.80 | | | | .29 | | | | (.19 | ) | | | .10 | | | | (.29 | ) | | | 10.61 | | | | .89 | | | | 16 | | | | .59 | | | | .54 | | | | 2.67 | |
| 7/31/2017 | | | 11.12 | | | | .29 | | | | (.32 | ) | | | (.03 | ) | | | (.29 | ) | | | 10.80 | | | | (.26 | ) | | | 11 | | | | .58 | | | | .56 | | | | 2.68 | |
| 7/31/2016 | | | 10.66 | | | | .30 | | | | .45 | | | | .75 | | | | (.29 | ) | | | 11.12 | | | | 7.10 | | | | 31 | | | | .58 | | | | .55 | | | | 2.68 | |
| 7/31/2015 | | | 10.58 | | | | .33 | | | | .07 | | | | .40 | | | | (.32 | ) | | | 10.66 | | | | 3.77 | | | | 20 | | | | .61 | | | | .56 | | | | 3.02 | |
| Class F-3: | | | | | | | | | | | | | | | | | | | | | | | | | | | | | | | | | | | | | | | | | | | | |
| 1/31/20204,5 | | | 11.02 | | | | .16 | | | | .19 | | | | .35 | | | | (.15 | ) | | | 11.22 | | | | 3.19 | 6 | | | 34 | | | | .42 | 7 | | | .36 | 7 | | | 2.69 | 7 |
| 7/31/2019 | | | 10.61 | | | | .30 | | | | .41 | | | | .71 | | | | (.30 | ) | | | 11.02 | | | | 6.83 | | | | 32 | | | | .42 | | | | .42 | | | | 2.84 | |
| 7/31/2018 | | | 10.80 | | | | .30 | | | | (.19 | ) | | | .11 | | | | (.30 | ) | | | 10.61 | | | | 1.00 | | | | 26 | | | | .48 | | | | .44 | | | | 2.78 | |
| 7/31/20174,12 | | | 10.58 | | | | .15 | | | | .22 | | | | .37 | | | | (.15 | ) | | | 10.80 | | | | 3.54 | 6 | | | 16 | | | | .58 | 7 | | | .45 | 7 | | | 2.79 | 7 |
| | | | | | | | | | | | | |
| | | Six months
ended
January 31, | | Year ended July 31, |
| | | 20204,5,6 | | 2019 | | 2018 | | 2017 | | 2016 | | 2015 |
| Portfolio turnover rate for all share classes | | 5% | | 16% | | 21% | | 27% | | 14% | | 42% |
| | |
| 1 | Based on average shares outstanding. |
| 2 | Total returns exclude any applicable sales charges, including contingent deferred sales charges. |
| 3 | This column reflects the impact, if any, of certain reimbursements from CRMC. During the periods shown, CRMC reimbursed a portion of miscellaneous fees and expenses. |
| 4 | Based on operations for a period that is less than a full year. |
| 5 | Unaudited. |
| 6 | Not annualized. |
| 7 | Annualized. |
| 8 | All or a significant portion of assets in this class consisted of seed capital invested by CRMC and/or its affiliates. Fees for distribution services are not charged or accrued on these seed capital assets. If such fees were paid by the fund on seed capital assets, fund expenses would have been higher and net income and total return would have been lower. |
| 9 | Amount less than $.01. |
| 10 | Amount less than $1 million. |
| 11 | Class T shares began investment operations on April 7, 2017. |
| 12 | Class F-3 shares began investment operations on January 27, 2017. |
See notes to financial statements.
| American Funds Tax-Exempt Funds | 117 |
As a fund shareholder, you incur two types of costs: (1) transaction costs, such as initial sales charges on purchase payments and contingent deferred sales charges on redemptions (loads), and (2) ongoing costs, including management fees, distribution and service (12b-1) fees, and other expenses. This example is intended to help you understand your ongoing costs (in dollars) of investing in the fund so you can compare these costs with the ongoing costs of investing in other mutual funds. The example is based on an investment of $1,000 invested at the beginning of the period and held for the entire six-month period (August 1, 2019, through January 31, 2020).
Actual expenses:
The first line of each share class in the tables on the following pages provides information about actual account values and actual expenses. You may use the information in this line, together with the amount you invested, to estimate the expenses that you paid over the period. Simply divide your account value by $1,000 (for example, an $8,600 account value divided by $1,000 = 8.6), then multiply the result by the number in the first line under the heading titled “Expenses paid during period” to estimate the expenses you paid on your account during this period.
Hypothetical example for comparison purposes:
The second line of each share class in the tables on the following pages provides information about hypothetical account values and hypothetical expenses based on the actual expense ratio for the share class and an assumed rate of return of 5.00% per year before expenses, which is not the actual return of the share class. The hypothetical account values and expenses may not be used to estimate the actual ending account balance or expenses you paid for the period. You may use this information to compare the ongoing costs of investing in the fund and other funds. To do so, compare this 5.00% hypothetical example with the 5.00% hypothetical examples that appear in the shareholder reports of the other funds.
Notes:
Class F-1, F-2 and F-3 shareholders may be subject to fees charged by financial intermediaries, typically ranging from 0.75% to 1.50% of assets annually depending on services offered. You can estimate the impact of these fees by adding the amount of the fees to the total estimated expenses you paid on your account during the period as calculated above. In addition, your ending account value would be lower by the amount of these fees.
Note that the expenses shown in the table on the following pages are meant to highlight your ongoing costs only and do not reflect any transactional costs, such as sales charges (loads). Therefore, the second line of each share class in the table is useful in comparing ongoing costs only and will not help you determine the relative total costs of owning different funds. In addition, if these transactional costs were included, your costs would have been higher.
| 118 | American Funds Tax-Exempt Funds |
American Funds Short-Term Tax-Exempt Bond Fund
| | | Beginning
account value
8/1/2019 | | | Ending
account value
1/31/2020 | | | Expenses paid
during period* | | | Annualized
expense ratio | |
| Class A – actual return | | $ | 1,000.00 | | | $ | 1,010.91 | | | $ | 2.89 | | | | .57 | % |
| Class A – assumed 5% return | | | 1,000.00 | | | | 1,022.33 | | | | 2.91 | | | | .57 | |
| Class T – actual return | | | 1,000.00 | | | | 1,011.71 | | | | 2.13 | | | | .42 | |
| Class T – assumed 5% return | | | 1,000.00 | | | | 1,023.09 | | | | 2.14 | | | | .42 | |
| Class F-1 – actual return | | | 1,000.00 | | | | 1,009.94 | | | | 3.85 | | | | .76 | |
| Class F-1 – assumed 5% return | | | 1,000.00 | | | | 1,021.37 | | | | 3.87 | | | | .76 | |
| Class F-2 – actual return | | | 1,000.00 | | | | 1,011.53 | | | | 2.28 | | | | .45 | |
| Class F-2 – assumed 5% return | | | 1,000.00 | | | | 1,022.94 | | | | 2.29 | | | | .45 | |
| Class F-3 – actual return | | | 1,000.00 | | | | 1,011.84 | | | | 1.98 | | | | .39 | |
| Class F-3 – assumed 5% return | | | 1,000.00 | | | | 1,023.24 | | | | 1.99 | | | | .39 | |
| Class R-6 – actual return | | | 1,000.00 | | | | 1,011.87 | | | | 1.98 | | | | .39 | |
| Class R-6 – assumed 5% return | | | 1,000.00 | | | | 1,023.24 | | | | 1.99 | | | | .39 | |
Limited Term Tax-Exempt Bond Fund of America
| | | Beginning
account value
8/1/2019 | | | Ending
account value
1/31/2020 | | | Expenses paid
during period* | | | Annualized
expense ratio | |
| Class A – actual return | | $ | 1,000.00 | | | $ | 1,018.35 | | | $ | 3.05 | | | | .60 | % |
| Class A – assumed 5% return | | | 1,000.00 | | | | 1,022.18 | | | | 3.06 | | | | .60 | |
| Class C – actual return | | | 1,000.00 | | | | 1,014.80 | | | | 6.60 | | | | 1.30 | |
| Class C – assumed 5% return | | | 1,000.00 | | | | 1,018.65 | | | | 6.61 | | | | 1.30 | |
| Class T – actual return | | | 1,000.00 | | | | 1,019.89 | | | | 1.53 | | | | .30 | |
| Class T – assumed 5% return | | | 1,000.00 | | | | 1,023.69 | | | | 1.53 | | | | .30 | |
| Class F-1 – actual return | | | 1,000.00 | | | | 1,018.23 | | | | 3.20 | | | | .63 | |
| Class F-1 – assumed 5% return | | | 1,000.00 | | | | 1,022.03 | | | | 3.21 | | | | .63 | |
| Class F-2 – actual return | | | 1,000.00 | | | | 1,019.57 | | | | 1.88 | | | | .37 | |
| Class F-2 – assumed 5% return | | | 1,000.00 | | | | 1,023.34 | | | | 1.89 | | | | .37 | |
| Class F-3 – actual return | | | 1,000.00 | | | | 1,020.07 | | | | 1.37 | | | | .27 | |
| Class F-3 – assumed 5% return | | | 1,000.00 | | | | 1,023.84 | | | | 1.38 | | | | .27 | |
| Class R-6 – actual return | | | 1,000.00 | | | | 1,020.10 | | | | 1.37 | | | | .27 | |
| Class R-6 – assumed 5% return | | | 1,000.00 | | | | 1,023.84 | | | | 1.38 | | | | .27 | |
The Tax-Exempt Bond Fund of America
| | | Beginning
account value
8/1/2019 | | | Ending
account value
1/31/2020 | | | Expenses paid
during period* | | | Annualized
expense ratio | |
| Class A – actual return | | $ | 1,000.00 | | | $ | 1,030.89 | | | $ | 2.71 | | | | .53 | % |
| Class A – assumed 5% return | | | 1,000.00 | | | | 1,022.53 | | | | 2.70 | | | | .53 | |
| Class C – actual return | | | 1,000.00 | | | | 1,027.16 | | | | 6.39 | | | | 1.25 | |
| Class C – assumed 5% return | | | 1,000.00 | | | | 1,018.90 | | | | 6.36 | | | | 1.25 | |
| Class T – actual return | | | 1,000.00 | | | | 1,032.14 | | | | 1.43 | | | | .28 | |
| Class T – assumed 5% return | | | 1,000.00 | | | | 1,023.79 | | | | 1.43 | | | | .28 | |
| Class F-1 – actual return | | | 1,000.00 | | | | 1,030.46 | | | | 3.12 | | | | .61 | |
| Class F-1 – assumed 5% return | | | 1,000.00 | | | | 1,022.13 | | | | 3.11 | | | | .61 | |
| Class F-2 – actual return | | | 1,000.00 | | | | 1,031.78 | | | | 1.79 | | | | .35 | |
| Class F-2 – assumed 5% return | | | 1,000.00 | | | | 1,023.44 | | | | 1.79 | | | | .35 | |
| Class F-3 – actual return | | | 1,000.00 | | | | 1,032.34 | | | | 1.28 | | | | .25 | |
| Class F-3 – assumed 5% return | | | 1,000.00 | | | | 1,023.95 | | | | 1.28 | | | | .25 | |
| Class R-6 – actual return | | | 1,000.00 | | | | 1,032.34 | | | | 1.28 | | | | .25 | |
| Class R-6 – assumed 5% return | | | 1,000.00 | | | | 1,023.95 | | | | 1.28 | | | | .25 | |
See end of tables for footnote.
| American Funds Tax-Exempt Funds | 119 |
American High-Income Municipal Bond Fund
| | | Beginning
account value
8/1/2019 | | | Ending
account value
1/31/2020 | | | Expenses paid
during period* | | | Annualized
expense ratio | |
| Class A – actual return | | $ | 1,000.00 | | | $ | 1,039.13 | | | $ | 3.50 | | | | .68 | % |
| Class A – assumed 5% return | | | 1,000.00 | | | | 1,021.78 | | | | 3.47 | | | | .68 | |
| Class C – actual return | | | 1,000.00 | | | | 1,035.49 | | | | 7.08 | | | | 1.38 | |
| Class C – assumed 5% return | | | 1,000.00 | | | | 1,018.25 | | | | 7.02 | | | | 1.38 | |
| Class T – actual return | | | 1,000.00 | | | | 1,040.70 | | | | 1.95 | | | | .38 | |
| Class T – assumed 5% return | | | 1,000.00 | | | | 1,023.29 | | | | 1.94 | | | | .38 | |
| Class F-1 – actual return | | | 1,000.00 | | | | 1,039.01 | | | | 3.60 | | | | .70 | |
| Class F-1 – assumed 5% return | | | 1,000.00 | | | | 1,021.68 | | | | 3.57 | | | | .70 | |
| Class F-2 – actual return | | | 1,000.00 | | | | 1,040.38 | | | | 2.26 | | | | .44 | |
| Class F-2 – assumed 5% return | | | 1,000.00 | | | | 1,022.99 | | | | 2.24 | | | | .44 | |
| Class F-3 – actual return | | | 1,000.00 | | | | 1,040.92 | | | | 1.75 | | | | .34 | |
| Class F-3 – assumed 5% return | | | 1,000.00 | | | | 1,023.49 | | | | 1.73 | | | | .34 | |
| Class R-6 – actual return | | | 1,000.00 | | | | 1,040.93 | | | | 1.75 | | | | .34 | |
| Class R-6 – assumed 5% return | | | 1,000.00 | | | | 1,023.49 | | | | 1.73 | | | | .34 | |
The Tax-Exempt Fund of California
| | | Beginning
account value
8/1/2019 | | | Ending
account value
1/31/2020 | | | Expenses paid
during period* | | | Annualized
expense ratio | |
| Class A – actual return | | $ | 1,000.00 | | | $ | 1,031.52 | | | $ | 3.23 | | | | .63 | % |
| Class A – assumed 5% return | | | 1,000.00 | | | | 1,022.03 | | | | 3.21 | | | | .63 | |
| Class C – actual return | | | 1,000.00 | | | | 1,027.63 | | | | 7.05 | | | | 1.38 | |
| Class C – assumed 5% return | | | 1,000.00 | | | | 1,018.25 | | | | 7.02 | | | | 1.38 | |
| Class T – actual return | | | 1,000.00 | | | | 1,032.71 | | | | 2.05 | | | | .40 | |
| Class T – assumed 5% return | | | 1,000.00 | | | | 1,023.19 | | | | 2.04 | | | | .40 | |
| Class F-1 – actual return | | | 1,000.00 | | | | 1,031.04 | | | | 3.69 | | | | .72 | |
| Class F-1 – assumed 5% return | | | 1,000.00 | | | | 1,021.58 | | | | 3.67 | | | | .72 | |
| Class F-2 – actual return | | | 1,000.00 | | | | 1,032.46 | | | | 2.31 | | | | .45 | |
| Class F-2 – assumed 5% return | | | 1,000.00 | | | | 1,022.94 | | | | 2.29 | | | | .45 | |
| Class F-3 – actual return | | | 1,000.00 | | | | 1,032.90 | | | | 1.84 | | | | .36 | |
| Class F-3 – assumed 5% return | | | 1,000.00 | | | | 1,023.39 | | | | 1.84 | | | | .36 | |
American Funds Tax-Exempt Fund of New York
| | | Beginning
account value
8/1/2019 | | | Ending
account value
1/31/2020 | | | Expenses paid
during period* | | | Annualized
expense ratio | |
| Class A – actual return | | $ | 1,000.00 | | | $ | 1,030.49 | | | $ | 3.22 | | | | .63 | % |
| Class A – assumed 5% return | | | 1,000.00 | | | | 1,022.03 | | | | 3.21 | | | | .63 | |
| Class C – actual return | | | 1,000.00 | | | | 1,026.63 | | | | 7.05 | | | | 1.38 | |
| Class C – assumed 5% return | | | 1,000.00 | | | | 1,018.25 | | | | 7.02 | | | | 1.38 | |
| Class T – actual return | | | 1,000.00 | | | | 1,031.75 | | | | 2.00 | | | | .39 | |
| Class T – assumed 5% return | | | 1,000.00 | | | | 1,023.24 | | | | 1.99 | | | | .39 | |
| Class F-1 – actual return | | | 1,000.00 | | | | 1,030.44 | | | | 3.28 | | | | .64 | |
| Class F-1 – assumed 5% return | | | 1,000.00 | | | | 1,021.98 | | | | 3.26 | | | | .64 | |
| Class F-2 – actual return | | | 1,000.00 | | | | 1,031.41 | | | | 2.36 | | | | .46 | |
| Class F-2 – assumed 5% return | | | 1,000.00 | | | | 1,022.89 | | | | 2.35 | | | | .46 | |
| Class F-3 – actual return | | | 1,000.00 | | | | 1,031.93 | | | | 1.84 | | | | .36 | |
| Class F-3 – assumed 5% return | | | 1,000.00 | | | | 1,023.39 | | | | 1.84 | | | | .36 | |
| | |
| * | The “expenses paid during period” are equal to the “annualized expense ratio,” multiplied by the average account value over the period, multiplied by the number of days in the period, and divided by 365 (to reflect the one-half year period). |
| | |
| 120 | American Funds Tax-Exempt Funds |
Liquidity Risk Management Program
The funds have adopted a liquidity risk management program (the “program”). Each fund’s board has designated Capital Research and Management Company (“CRMC”) as the administrator of the program. Personnel of CRMC or its affiliates conduct the day-to-day operation of the program pursuant to policies and procedures administered by the Capital Group Liquidity Risk Management Committee.
Under the program, CRMC manages each fund’s liquidity risk, which is the risk that the fund could not meet shareholder redemption requests without significant dilution of remaining shareholders’ interests in the fund. This risk is managed by monitoring the degree of liquidity of each fund’s investments, limiting the amount of each fund’s illiquid investments, and utilizing various risk management tools and facilities available to each fund for meeting shareholder redemptions, among other means. CRMC’s process of determining the degree of liquidity of each fund’s investments is supported by one or more third-party liquidity assessment vendors.
Each fund’s board reviewed a report prepared by CRMC regarding the operation and effectiveness of the program for the period December 1, 2018, through September 30, 2019. No significant liquidity events impacting any of the funds were noted in the report. In addition, CRMC provided its assessment that the program had been effective in managing each fund’s liquidity risk.
| American Funds Tax-Exempt Funds | 121 |
This page was intentionally left blank.
| 122 | American Funds Tax-Exempt Funds |
This page was intentionally left blank.
| American Funds Tax-Exempt Funds | 123 |
Offices of the funds
STEX, LTEX, TEBF, AHIM, TEFCA
333 South Hope Street
Los Angeles, CA 90071-1406
TEFNY
6455 Irvine Center Drive
Irvine, CA 92618-4518
Investment adviser
Capital Research and Management Company
333 South Hope Street
Los Angeles, CA 90071-1406
Transfer agent for shareholder accounts
American Funds Service Company
(Write to the address near you.)
P.O. Box 6007
Indianapolis, IN 46206-6007
P.O. Box 2280
Norfolk, VA 23501-2280
Counsel
Morgan, Lewis & Bockius LLP
One Federal Street
Boston, MA 02110-1726
Custodians of assets
STEX, LTEX, TEBF, AHIM, TEFCA
JPMorgan Chase Bank
270 Park Avenue
New York, NY 10017-2070
TEFNY
Bank of New York Mellon
One Wall Street
New York, NY 10286
Independent registered public accounting firm
PricewaterhouseCoopers LLP
601 South Figueroa Street
Los Angeles, CA 90017-3874
Principal underwriter
American Funds Distributors, Inc.
333 South Hope Street
Los Angeles, CA 90071-1406
| 124 | American Funds Tax-Exempt Funds |
Investors should carefully consider investment objectives, risks, charges and expenses. This and other important information is contained in the funds’ prospectus and summary prospectus, which can be obtained from your financial professional and should be read carefully before investing. You may also call American Funds Service Company (AFS) at (800) 421-4225 or visit the Capital Group website at capitalgroup.com.
“American Funds Proxy Voting Procedures and Principles” — which describes how we vote proxies relating to portfolio securities — is available on our website or upon request by calling AFS. Each fund files its proxy voting record with the U.S. Securities and Exchange Commission (SEC) for the 12 months ended June 30 by August 31. The proxy voting record is available free of charge on the SEC website at sec.gov and on our website.
Complete January 31, 2020, portfolios of American Funds Short-Term Tax-Exempt Bond Fund, Limited Term Tax-Exempt Bond Fund of America, The Tax-Exempt Bond Fund of America, American High-Income Municipal Bond Fund, The Tax-Exempt Fund of California and American Funds Tax-Exempt Fund of New York’s investments are available free of charge by calling AFS or visiting the SEC website (where they are part of Form N-CSR).
Each fund files a complete list of its portfolio holdings with the SEC for the first and third quarters of each fiscal year on Form NPORT-P. This filing is available free of charge on the SEC website. Additionally, the list of portfolio holdings is available by calling AFS.
This report is for the information of shareholders of American Funds Short-Term Tax-Exempt Bond Fund, Limited Term Tax-Exempt Bond Fund of America, The Tax-Exempt Bond Fund of America, American High-Income Municipal Bond Fund, The Tax-Exempt Fund of California and American Funds Tax-Exempt Fund of New York, but it also may be used as sales literature when preceded or accompanied by the current prospectus or summary prospectus, which gives details about charges, expenses, investment objectives and operating policies of the funds. If used as sales material after March 31, 2020, this report must be accompanied by an American Funds statistical update for the most recently completed calendar quarter.
Bloomberg® is a trademark of Bloomberg Finance L.P. (collectively with its affiliates, “Bloomberg”). Barclays® is a trademark of Barclays Bank Plc (collectively with its affiliates, “Barclays”), used under license. Neither Bloomberg nor Barclays approves or endorses this material, guarantees the accuracy or completeness of any information herein and, to the maximum extent allowed by law, neither shall have any liability or responsibility for injury or damages arising in connection therewith.
American Funds Distributors, Inc., member FINRA.
The Capital Advantage®
Since 1931, Capital Group, home of American Funds, has helped investors pursue long-term investment success. Our consistent approach — in combination with The Capital SystemSM— has resulted in superior outcomes.
Aligned with investor success
We base our decisions on a long-term perspective, which we believe aligns our goals with the interests of our clients. Our portfolio managers average 28 years of investment experience, including 22 years at our company, reflecting a career commitment to our long-term approach.1
The Capital System
The Capital System combines individual accountability with teamwork. Funds using The Capital System are divided into portions that are managed independently by investment professionals with diverse backgrounds, ages and investment approaches. An extensive global research effort is the backbone of our system.
American Funds’ superior outcomes
Equity funds have beaten their Lipper peer indexes in 92% of 10-year periods and 99% of 20-year periods.2Fixed income funds have helped investors achieve diversification through attention to correlation between bonds and equities.3Fund management fees have been among the lowest in the industry.4
| | 1 | Portfolio manager experience as of December 31, 2019. |
| | 2 | Based on Class F-2 share results for rolling periods through December 31, 2019. Periods covered are the shorter of the fund’s lifetime or since the comparable Lipper index inception date (except Capital Income Builder and SMALLCAP World Fund, for which the Lipper average was used). Expenses differ for each share class, so results will vary. Visit capitalgroup.com for more information on specific expense adjustments and the actual dates of first sale. |
| | 3 | Based on Class F-2 share results, as of December 31, 2019. Fifteen of the 17 fixed income American Funds that have been in existence for the three-year period showed a three-year correlation below 0.2. Standard & Poor’s 500 Composite Index was used as an equity market proxy. Correlation based on monthly total returns. Correlation is a statistical measure of how two securities move in relation to each other. A correlation ranges from –1 to 1. A positive correlation close to 1 implies that as one security moves, either up or down, the other security will move in “lockstep,” in the same direction. A negative correlation close to –1 indicates that the securities have moved in the opposite direction. |
| | 4 | On average, our management fees were in the lowest quintile 65% of the time, based on the 20-year period ended December 31, 2019, versus comparable Lipper categories, excluding funds of funds. |
| | | |
| Class F-2 shares were first offered on August 1, 2008. Class F-2 share results prior to the date of first sale are hypothetical based on the results of the original share class of the fund without a sales charge, adjusted for typical estimated expenses. Results for certain funds with an inception date after August 1, 2008, also include hypothetical returns because those funds’ Class F-2 shares sold after the funds’ date of first offering. Visit capitalgroup.com for more information on specific expense adjustments and the actual dates of first sale. |
| | | |
| All Capital Group trademarks mentioned are owned by The Capital Group Companies, Inc., an affiliated company or fund. All other company and product names mentioned are the property of their respective companies. |

ITEM 2 – Code of Ethics
Not applicable for filing of semi-annual reports to shareholders.
ITEM 3 – Audit Committee Financial Expert
Not applicable for filing of semi-annual reports to shareholders.
ITEM 4 – Principal Accountant Fees and Services
Not applicable for filing of semi-annual reports to shareholders.
ITEM 5 – Audit Committee of Listed Registrants
Not applicable to this Registrant, insofar as the Registrant is not a listed issuer as defined in Rule 10A-3 under the Securities Exchange Act of 1934.
ITEM 6 – Schedule of Investments

Limited Term Tax-Exempt Bond Fund of America®
Investment portfolio
January 31, 2020
unaudited
Bonds, notes & other debt instruments 86.34%
Alabama 0.89% | Principal amount
(000) | Value
(000) |
| 21st Century Auth., Tobacco Settlement Rev. Ref. Bonds, Series 2012-A, 5.00% 2020 | $4,000 | $4,049 |
| 21st Century Auth., Tobacco Settlement Rev. Ref. Bonds, Series 2012-A, 5.00% 2021 | 3,305 | 3,467 |
| Black Belt Energy Gas Dist., Gas Supply Prepay Rev. Bonds (Project No. 4), Series 2019-A, 4.00% 2021 | 1,250 | 1,297 |
| Black Belt Energy Gas Dist., Gas Supply Prepay Rev. Bonds (Project No. 4), Series 2019-A, 4.00% 2022 | 1,650 | 1,755 |
| Black Belt Energy Gas Dist., Gas Supply Prepay Rev. Bonds (Project No. 4), Series 2019-A, 4.00% 2023 | 1,750 | 1,907 |
| Black Belt Energy Gas Dist., Gas Supply Rev. Bonds, Series 2017-A, 4.00% 2047 (put 2022) | 12,620 | 13,461 |
| Federal Aid Highway Fin. Auth., Special Obligation Rev. Bonds, Series 2017-B, 5.00% 2026 | 2,500 | 3,142 |
| County of Jefferson, Limited Obligation Rev. Ref. Bonds, Series 2017, 5.00% 2025 | 3,000 | 3,618 |
| County of Jefferson, Limited Obligation Rev. Ref. Bonds, Series 2017, 5.00% 2026 | 1,000 | 1,233 |
| County of Jefferson, Limited Obligation Rev. Ref. Bonds, Series 2017, 5.00% 2027 | 2,000 | 2,487 |
City of Montgomery, Medical Clinic Board, Health Care Fac. Rev. Bonds (Jackson Hospital & Clinic),
Series 2016, 5.00% 2021 | 2,065 | 2,132 |
City of Montgomery, Medical Clinic Board, Health Care Fac. Rev. Bonds (Jackson Hospital & Clinic),
Series 2016, 5.00% 2023 | 1,125 | 1,224 |
| City of Pell, Special Care Facs. Fncg. Auth., Rev. Ref. Bonds (Noland Health Services, Inc.), Series 2012-A, 5.00% 2020 | 1,140 | 1,177 |
| | | 40,949 |
| Alaska 0.34% | | |
| Housing Fin. Corp., Collateralized Bonds (Veterans Mortgage Program), Series 2019, 4.00% 2048 | 9,820 | 10,855 |
| Housing Fin. Corp., General Mortgage Rev. Bonds, Series 2016-A, 3.50% 2046 | 2,285 | 2,414 |
| International Airport System, Rev. Ref. Bonds, Series 2016-C, AMT, 5.00% 2021 | 2,000 | 2,132 |
| | | 15,401 |
| Arizona 0.92% | | |
| City of Glendale, Water and Sewer Rev. Ref. Obligations, Series 2012, 5.00% 2020 | 1,550 | 1,576 |
| Health Facs. Auth., Rev. Bonds (Scottsdale Lincoln Hospitals Project), Series 2014-A, 5.00% 2024 | 1,000 | 1,183 |
Industrial Dev. Auth., Charter School Rev. Bonds (Equitable School Revolving Fund), Series 2019-A,
National insured, 5.00% 2027 | 1,125 | 1,410 |
Industrial Dev. Auth., Charter School Rev. Bonds (Equitable School Revolving Fund), Series 2019-A,
National insured, 5.00% 2028 | 1,175 | 1,496 |
Industrial Dev. Auth., Charter School Rev. Bonds (Equitable School Revolving Fund), Series 2019-A,
National insured, 5.00% 2031 | 1,050 | 1,318 |
Industrial Dev. Auth., Student Housing Rev. Bonds (Provident Group - NCCU Properties LLC -
North Carolina Central University Project), Series 2019-A, BAM insured, 5.00% 2025 | 400 | 473 |
Industrial Dev. Auth., Student Housing Rev. Bonds (Provident Group - NCCU Properties LLC -
North Carolina Central University Project), Series 2019-A, BAM insured, 5.00% 2026 | 500 | 606 |
Industrial Dev. Auth., Student Housing Rev. Bonds (Provident Group - NCCU Properties LLC -
North Carolina Central University Project), Series 2019-A, BAM insured, 5.00% 2027 | 400 | 494 |
| County of Maricopa, Certs. of Part., Series 2020, 5.00% 2021 | 7,825 | 8,277 |
| County of Maricopa, Certs. of Part., Series 2020, 5.00% 2022 | 1,965 | 2,157 |
| County of Maricopa, Industrial Dev. Auth., Rev. Bonds (Banner Health), Series 2017-C, 5.00% 2048 (put 2024) | 2,000 | 2,359 |
| City of Phoenix, Civic Improvement Corp., Airport Rev. Bonds, Series 2019-B, AMT, 5.00% 2026 | 2,750 | 3,376 |
| City of Phoenix, Civic Improvement Corp., Airport Rev. Bonds, Series 2019-B, AMT, 5.00% 2027 | 3,100 | 3,882 |
| City of Phoenix, Civic Improvement Corp., Airport Rev. Bonds, Series 2019-B, AMT, 5.00% 2031 | 4,505 | 5,779 |
| City of Phoenix, Civic Improvement Corp., Airport Rev. Ref. Bonds, Series 2010-C, 5.00% 2024 (preref. 2020) | 2,000 | 2,034 |
Limited Term Tax-Exempt Bond Fund of America — Page 1 of 38
unaudited
Bonds, notes & other debt instruments (continued)
Arizona (continued) | Principal amount
(000) | Value
(000) |
| City of Phoenix, Civic Improvement Corp., Wastewater System Rev. Ref. Bonds, Series 2016, 5.00% 2028 | $2,000 | $2,482 |
| Board of Regents of the University of Arizona, Rev. Ref. Certs. of Part., Series 2012-C, 5.00% 2020 | 3,180 | 3,222 |
| | | 42,124 |
| Arkansas 0.02% | | |
Dev. Fin. Auth., Health Care Rev. Bonds (Baptist Memorial Health Care), Series 2015-B-3,
(SIFMA Municipal Swap Index + 1.55%) 2.49% 2044 (put 2022)1 | 1,000 | 1,014 |
| California 3.77% | | |
Bay Area Toll Auth., San Francisco Bay Area Toll Bridge Rev. Bonds, Series 2006-C-1,
(SIFMA Municipal Swap Index + 0.90%) 1.84% 2045 (put 2023)1 | 11,500 | 11,692 |
Bay Area Toll Auth., San Francisco Bay Area Toll Bridge Rev. Bonds, Series 2007-C-1,
(SIFMA Municipal Swap Index + 0.90%) 1.84% 2047 (put 2023)1 | 3,500 | 3,558 |
Bay Area Toll Auth., San Francisco Bay Area Toll Bridge Rev. Bonds, Series 2008-B-1,
(SIFMA Municipal Swap Index + 1.10%) 2.04% 2045 (put 2024)1 | 2,500 | 2,565 |
Bay Area Toll Auth., San Francisco Bay Area Toll Bridge Rev. Bonds, Series 2014-H,
(SIFMA Municipal Swap Index + 0.70%) 1.64% 2034 (put 2021)1 | 10,480 | 10,525 |
| City of Chula Vista, Municipal Fncg. Auth., Special Tax Rev. Ref. Bonds, Series 2015-A, 5.00% 2021 | 975 | 1,036 |
| Compton Unified School Dist., G.O. Bonds, 2015 Election, Series 2019-B, BAM insured, 5.00% 2026 | 750 | 940 |
| Compton Unified School Dist., G.O. Bonds, 2015 Election, Series 2019-B, BAM insured, 5.00% 2027 | 600 | 770 |
City of El Centro, Fncg. Auth., Wastewater Rev. Ref. Bonds, Series 2014-A,
Assured Guaranty Municipal insured, 5.00% 2028 | 1,000 | 1,170 |
| City of Fontana, Community Facs. Dist. No. 22 (Sierra Hills South), Special Tax Bonds, Series 2014, 5.00% 2022 | 525 | 572 |
Golden State Tobacco Securitization Corp., Enhanced Tobacco Settlement Asset-Backed Bonds,
Capital Appreciation Bonds, Series 2005-A, Assured Guaranty Municipal insured, 0% 2025 | 5,000 | 4,698 |
Golden State Tobacco Securitization Corp., Enhanced Tobacco Settlement Asset-Backed Bonds,
Capital Appreciation Bonds, Series 2005-A, Assured Guaranty Municipal insured, 0% 2026 | 3,850 | 3,558 |
| Health Facs. Fncg. Auth., Rev. Ref. Bonds (Adventist Health System/West), Series 2016-A, 4.00% 2026 | 1,000 | 1,181 |
| Health Facs. Fncg. Auth., Rev. Ref. Bonds (St. Joseph Health System), Series 2009-C, 5.00% 2034 (put 2022) | 5,545 | 6,157 |
Infrastructure and Econ. Dev. Bank, Rev. Bonds (The Colburn School), Series 2015-B,
(SIFMA Municipal Swap Index + 1.20%) 2.14% 2037 (put 2022)1 | 5,500 | 5,586 |
| Irvine Unified School Dist., Community Facs. Dist. No. 09-1, Special Tax Bonds, Series 2017-A, BAM insured, 5.00% 2025 | 1,875 | 2,228 |
| City of Jurupa, Public Fncg. Auth., Special Tax Rev. Bonds, Series 2013-A, 5.00% 2021 | 750 | 799 |
| City of Jurupa, Public Fncg. Auth., Special Tax Rev. Bonds, Series 2013-A, 5.00% 2022 | 1,000 | 1,106 |
| City of Lake Elsinore, Public Fncg. Auth., Local Agcy. Rev. Ref. Bonds, Series 2015, 5.00% 2026 | 3,590 | 4,246 |
| City of Los Angeles, Dept. of Airports, Los Angeles International Airport, Rev. Bonds, Series 2016-B, AMT, 5.00% 2025 | 1,015 | 1,221 |
| City of Los Angeles, Dept. of Airports, Los Angeles International Airport, Rev. Bonds, Series 2016-B, AMT, 5.00% 2026 | 1,965 | 2,429 |
| City of Los Angeles, Dept. of Airports, Los Angeles International Airport, Rev. Bonds, Series 2016-B, AMT, 5.00% 2027 | 1,250 | 1,538 |
| City of Los Angeles, Harbor Dept., Rev. Ref. Bonds, Series 2016-A, AMT, 5.00% 2024 | 1,500 | 1,758 |
| City of Los Angeles, Harbor Dept., Rev. Ref. Bonds, Series 2019-A, AMT, 5.00% 2023 | 3,000 | 3,406 |
| City of Los Angeles, Multi Family Housing Rev. Bonds (Jordan Downs Phase 1B Apartments), Series 2018-A-2, 2.08% 2022 (put 2021) | 1,000 | 1,009 |
Menifee Union School Dist., Public Fncg. Auth., Special Tax Rev. Bonds, Series 2016-A, BAM insured,
5.00% 2029 | 400 | 480 |
Menifee Union School Dist., Public Fncg. Auth., Special Tax Rev. Bonds, Series 2016-A, BAM insured,
5.00% 2030 | 625 | 745 |
| Municipal Fin. Auth., Student Housing Rev. Bonds (CHF-Riverside II, LLC - UCR Student Housing Project), Series 2019, 5.00% 2029 | 855 | 1,097 |
| City of Murrieta, Public Fncg. Auth., Special Tax Rev. Ref. Bonds, Series 2012, 5.00% 2020 | 1,000 | 1,023 |
Limited Term Tax-Exempt Bond Fund of America — Page 2 of 38
unaudited
Bonds, notes & other debt instruments (continued)
California (continued) | Principal amount
(000) | Value
(000) |
City of Oakland, Successor Agcy. to the Redev. Agcy., Tax Allocation Rev. Ref. Bonds
(Central Dist. Redev. Project), Series 2013, 5.00% 2020 | $2,500 | $2,560 |
City of Oakland, Successor Agcy. to the Redev. Agcy., Tax Allocation Rev. Ref. Bonds
(Central Dist. Redev. Project), Series 2013, 5.00% 2021 | 2,000 | 2,127 |
| Oakland Unified School Dist., G.O. Rev. Ref. Bonds, Series 2016, 5.00% 2023 | 2,190 | 2,493 |
| Oakland Unified School Dist., G.O. Rev. Ref. Bonds, Series 2016, 5.00% 2025 | 2,040 | 2,478 |
| Oakland Unified School Dist., G.O. Rev. Ref. Bonds, Series 2016, 5.00% 2028 | 1,810 | 2,244 |
| Port of Oakland, Rev. Ref. Bonds, Series 2012-P, AMT, 5.00% 2023 | 2,750 | 2,988 |
| Palo Alto Unified School Dist., G.O. Bonds, Capital Appreciation Bonds, Series 2008, 0% 2027 | 1,960 | 1,777 |
Palomar Pomerado Health, G.O. Bonds, Capital Appreciation Bonds, 2004 Election, Series 2007-A,
National insured, 0% 2026 | 3,485 | 3,133 |
| Regional Airports Improvement Corp., Facs. Lease Rev. Ref. Bonds (LAXFUEL Corp., Los Angeles International Airport), Series 2012, AMT, 5.00% 2021 | 1,700 | 1,762 |
| Rio Elementary School Dist., Community Facs. Dist. No. 1, Special Tax Bonds, Series 2016, BAM insured, 5.00% 2027 | 835 | 1,011 |
| Rio Elementary School Dist., Community Facs. Dist. No. 1, Special Tax Bonds, Series 2016, BAM insured, 5.00% 2028 | 405 | 489 |
Riverside Unified School Dist., Fncg. Auth., Special Tax Rev. Ref. Bonds, Series 2015, BAM insured,
5.00% 2029 | 2,250 | 2,667 |
Riverside Unified School Dist., Fncg. Auth., Special Tax Rev. Ref. Bonds, Series 2015, BAM insured,
5.00% 2031 | 1,035 | 1,222 |
City of Sacramento, Community Drainage Facs. Dist. No. 97-1 (North Natomas), Special Tax Bonds,
Series 2015, 5.00% 2027 | 1,500 | 1,802 |
City and County of San Francisco, Airport Commission, San Francisco International Airport,
Second Series Rev. Ref. Bonds, Series 2017-D, AMT, 5.00% 2024 | 5,900 | 6,855 |
City and County of San Francisco, Airport Commission, San Francisco International Airport,
Second Series Rev. Ref. Bonds, Series 2017-D, AMT, 5.00% 2025 | 5,000 | 5,987 |
City and County of San Francisco, Airport Commission, San Francisco International Airport,
Second Series Rev. Ref. Bonds, Series 2019-H, AMT, 5.00% 2025 | 6,000 | 7,185 |
City and County of San Francisco, Successor Agcy. to the Redev. Agcy., Community Facs. Dist. No. 6
(Mission Bay South Public Improvements), Special Tax Rev. Ref. Bonds, Series 2013-A, 5.00% 2022 | 1,000 | 1,090 |
| San Mateo Community College Dist., G.O. Bonds, Capital Appreciation Bonds, 2005 Election, Series 2006-A, National insured, 0% 2027 | 1,500 | 1,370 |
| City of Santa Fe Springs, Community Dev. Commission, Consolidated Redev. Project, Tax Allocation Bonds, Capital Appreciation Bonds, Series 2006-A, National insured, 0% 2023 | 4,455 | 4,257 |
Statewide Communities Dev. Auth., Multi Family Housing Rev. Bonds (Miramar Tower Apartments),
Series 2019-M, 1.30% 2022 (put 2021) | 4,275 | 4,287 |
Statewide Communities Dev. Auth., Pollution Control Rev. Ref. Bonds (Southern California Edison Co.),
Series 2006-D, 2.625% 2033 (put 2023) | 1,250 | 1,313 |
Statewide Communities Dev. Auth., Rev. Bonds (American Baptist Homes of the West), Series 2013-A,
5.00% 2023 | 1,065 | 1,160 |
Statewide Communities Dev. Auth., Rev. Bonds (American Baptist Homes of the West), Series 2015,
5.00% 2025 | 2,585 | 3,099 |
Statewide Communities Dev. Auth., Rev. Bonds (Hebrew Home for Aged Disabled), Series 2016,
3.50% 2021 | 1,815 | 1,827 |
| Statewide Communities Dev. Auth., Rev. Bonds (Kaiser Permanente), Series 2004-M, 5.00% 2038 (put 2029) | 9,700 | 13,061 |
Statewide Communities Dev. Auth., Rev. Bonds (Viamonte Senior Living 1 Project), Series 2018-B,
3.00% 2025 | 1,300 | 1,325 |
Statewide Communities Dev. Auth., Rev. Bonds (Viamonte Senior Living 1 Project), Series 2018-B,
3.00% 2026 | 4,000 | 4,072 |
Tobacco Securitization Auth. of Southern California, Tobacco Settlement Asset-Backed Rev. Ref. Bonds
(San Diego County Tobacco Asset Securitization Corp.), Series 2019-A, 5.00% 2030 | 1,820 | 2,324 |
Limited Term Tax-Exempt Bond Fund of America — Page 3 of 38
unaudited
Bonds, notes & other debt instruments (continued)
California (continued) | Principal amount
(000) | Value
(000) |
| Dept. of Veterans Affairs, Veterans G.O. Bonds, Series 2019-CS, 4.00% 2049 | $6,980 | $7,734 |
| Dept. of Veterans Affairs, Veterans G.O. Rev. Ref. Bonds, Series 2015-CM, AMT, 2.45% 2031 | 650 | 659 |
| | | 173,451 |
| Colorado 3.13% | | |
| County of Arapahoe, Gardens of Havana Metropolitan Dist. No. 3, Special Rev. Ref. Bonds, Series 2017-A, 3.625% 2021 | 1,350 | 1,381 |
| City of Aurora, Cornerstar Metropolitan Dist., Limited Tax G.O. Rev. Ref. Bonds (Convertible to Unlimited Tax), Series 2017-A, 3.50% 2021 | 920 | 938 |
| Colorado Bridge Enterprise, Rev. Bonds (Central 70 Project), Series 2017, AMT, 4.00% 2025 | 3,505 | 3,988 |
| Colorado Bridge Enterprise, Rev. Bonds (Central 70 Project), Series 2017, AMT, 4.00% 2026 | 4,050 | 4,640 |
| City of Colorado Springs, Utilities System Rev. Ref. Bonds, Series 2019-A, 5.00% 2027 | 1,250 | 1,617 |
| City and County of Denver, Denver Convention Center Hotel Auth., Rev. Ref. Bonds, Series 2016, 5.00% 2026 | 2,500 | 3,034 |
| City and County of Denver, Denver Convention Center Hotel Auth., Rev. Ref. Bonds, Series 2016, 5.00% 2029 | 6,500 | 7,736 |
| City and County of Denver, Dept. of Aviation, Airport System Rev. Bonds, Series 2018-A, AMT, 5.00% 2026 | 15,000 | 18,575 |
| City and County of Denver, Dept. of Aviation, Airport System Rev. Bonds, Series 2018-A, AMT, 5.00% 2032 | 10,000 | 12,613 |
| City and County of Denver, Dept. of Aviation, Airport System Rev. Bonds, Series 2019-C, 5.00% 2026 | 2,000 | 2,511 |
City and County of Denver, Dept. of Aviation, Airport System Rev. Bonds, Series 2019-D,
5.00% 2031 (put 2022) | 2,295 | 2,544 |
| City and County of Denver, Dept. of Aviation, Airport System Rev. Ref. Bonds, Series 2010-A, 5.00% 2021 | 3,000 | 3,097 |
| City and County of Denver, Park Creek Metropolitan Dist., Limited Property Tax Supported Rev. Ref. Bonds, Series 2015-A, 5.00% 2023 | 1,400 | 1,593 |
| City and County of Denver, Park Creek Metropolitan Dist., Limited Property Tax Supported Rev. Ref. Bonds, Series 2015-A, 5.00% 2024 | 1,080 | 1,267 |
| City and County of Denver, Park Creek Metropolitan Dist., Limited Property Tax Supported Rev. Ref. Bonds, Series 2015-A, 5.00% 2025 | 3,835 | 4,628 |
| City of Denver, Urban Renewal Auth., Stapleton Tax Increment Rev. Bonds, Series 2013-A-1, 5.00% 2021 | 3,800 | 4,079 |
| City of Denver, Urban Renewal Auth., Stapleton Tax Increment Rev. Bonds, Series 2013-A-1, 5.00% 2022 | 4,000 | 4,452 |
E-470 Public Highway Auth., Rev. Bonds, Capital Appreciation Bonds, Series 1997-B, National insured,
0% 2020 | 1,050 | 1,044 |
E-470 Public Highway Auth., Rev. Bonds, Series 2017-B,
(1-month USD-LIBOR x 0.67 + 1.05%) 2.155% 2039 (put 2021)1 | 1,100 | 1,109 |
| Health Facs. Auth., Health Facs. Rev. and Rev. Ref. Bonds (Evangelical Lutheran Good Samaritan Society Project), Series 2015-A, 4.00% 2020 (escrowed to maturity) | 300 | 303 |
| Health Facs. Auth., Health Facs. Rev. and Rev. Ref. Bonds (Evangelical Lutheran Good Samaritan Society Project), Series 2015-A, 5.00% 2021 (escrowed to maturity) | 1,200 | 1,265 |
| Health Facs. Auth., Health Facs. Rev. and Rev. Ref. Bonds (Evangelical Lutheran Good Samaritan Society Project), Series 2015-A, 5.00% 2022 (escrowed to maturity) | 1,500 | 1,642 |
| Health Facs. Auth., Health Facs. Rev. and Rev. Ref. Bonds (Evangelical Lutheran Good Samaritan Society Project), Series 2015-A, 5.00% 2024 (escrowed to maturity) | 1,500 | 1,761 |
| Health Facs. Auth., Health Facs. Rev. and Rev. Ref. Bonds (Evangelical Lutheran Good Samaritan Society Project), Series 2017, 5.00% 2025 (escrowed to maturity) | 1,000 | 1,212 |
| Health Facs. Auth., Health Facs. Rev. and Rev. Ref. Bonds (Evangelical Lutheran Good Samaritan Society Project), Series 2017, 5.00% 2026 (escrowed to maturity) | 615 | 767 |
| Health Facs. Auth., Health Facs. Rev. and Rev. Ref. Bonds (Evangelical Lutheran Good Samaritan Society Project), Series 2017, 5.00% 2029 | 1,750 | 2,239 |
Health Facs. Auth., Health Facs. Rev. and Rev. Ref. Bonds
(Evangelical Lutheran Good Samaritan Society Project), Series 2015-A, 5.00% 2029 | 3,455 | 4,186 |
| Health Facs. Auth., Hospital Rev. Bonds (Adventist Health System/Sunbelt Obligated Group), Series 2016-C, 5.00% 2036 (put 2023) | 3,000 | 3,443 |
| Health Facs. Auth., Hospital Rev. Bonds (Adventist Health System/Sunbelt Obligated Group), Series 2018-B, 5.00% 2048 (put 2025) | 5,500 | 6,715 |
Health Facs. Auth., Hospital Rev. Ref. Bonds (Valley View Hospital Association Project), Series 2018,
2.80% 2042 (put 2023) | 1,800 | 1,873 |
| Health Facs. Auth., Rev. Ref. Bonds (Covenant Retirement Communities, Inc.), Series 2015-A, 5.00% 2021 | 1,765 | 1,884 |
Limited Term Tax-Exempt Bond Fund of America — Page 4 of 38
unaudited
Bonds, notes & other debt instruments (continued)
Colorado (continued) | Principal amount
(000) | Value
(000) |
Health Facs. Auth., Rev. Ref. Bonds (Sisters of Charity of Leavenworth Health System), Series 2019-A,
5.00% 2026 | $3,000 | $3,671 |
Health Facs. Auth., Rev. Ref. Bonds (Sisters of Charity of Leavenworth Health System), Series 2019-A,
5.00% 2027 | 3,990 | 5,004 |
Housing and Fin. Auth., Multi Family Housing Bonds (South Range Crossings Project), Series 2017,
1.30% 2038 (put 2021) | 3,050 | 3,056 |
| Housing and Fin. Auth., Single Family Mortgage Bonds, Series 2017-C, Class I, 4.00% 2048 | 2,750 | 2,969 |
| Housing and Fin. Auth., Single Family Mortgage Bonds, Series 2018-C, Class I, 4.25% 2048 | 6,010 | 6,624 |
| Housing and Fin. Auth., Single Family Mortgage Bonds, Series 2019-E, Class I, 4.25% 2049 | 12,505 | 13,792 |
| City of Loveland, Centerra Metropolitan Dist. No. 1, Rev. Ref. Bonds, Series 2017, 5.00% 20202 | 1,000 | 1,024 |
| | | 144,276 |
| Connecticut 1.92% | | |
| Health and Educational Facs. Auth., Rev. Bonds (Quinnipiac University Issue), Series 2016-M, 5.00% 2024 | 1,645 | 1,916 |
| Health and Educational Facs. Auth., Rev. Bonds (Quinnipiac University Issue), Series 2016-M, 5.00% 2025 | 1,450 | 1,741 |
Health and Educational Facs. Auth., Rev. Bonds (Yale University Issue), Series 1997-T-2,
1.65% 2029 (put 2020)3 | 1,385 | 1,385 |
| Health and Educational Facs. Auth., Rev. Bonds (Yale University Issue), Series 2014-A, 1.10% 2048 (put 2023) | 14,355 | 14,400 |
| Health and Educational Facs. Auth., Rev. Bonds (Yale University Issue), Series 2015-A, 2.05% 2035 (put 2021) | 8,905 | 9,043 |
Health and Educational Facs. Auth., Rev. Bonds (Yale University Issue), Series 2017-A-2,
5.00% 2042 (put 2022) | 1,795 | 1,969 |
Health and Educational Facs. Auth., Rev. Bonds (Yale University Issue), Series 2017-B-1,
5.00% 2037 (put 2020)3 | 10,475 | 10,649 |
Higher Education Supplemental Loan Auth., Rev. Bonds (Chesla Loan Program), Series 2017-A, AMT,
5.00% 2025 | 1,000 | 1,188 |
| Housing Fin. Auth., Housing Mortgage Fin. Program Bonds, Series 2014-C-1, 4.00% 2044 | 570 | 598 |
| Housing Fin. Auth., Housing Mortgage Fin. Program Bonds, Series 2016-A-1, 4.00% 2045 | 2,155 | 2,276 |
| Housing Fin. Auth., Housing Mortgage Fin. Program Bonds, Series 2016-B-2, AMT, 3.50% 2039 | 1,675 | 1,759 |
| Housing Fin. Auth., Housing Mortgage Fin. Program Bonds, Series 2016-E-1, 3.50% 2046 | 7,440 | 7,832 |
| Housing Fin. Auth., Housing Mortgage Fin. Program Bonds, Series 2016-F-2, AMT, 3.50% 2039 | 2,540 | 2,673 |
| Housing Fin. Auth., Housing Mortgage Fin. Program Bonds, Series 2017-A-1, 4.00% 2047 | 1,400 | 1,505 |
| Housing Fin. Auth., Housing Mortgage Fin. Program Bonds, Series 2017-C-1, 4.00% 2047 | 4,230 | 4,545 |
| Housing Fin. Auth., Housing Mortgage Fin. Program Bonds, Series 2017-D-1, 4.00% 2047 | 2,305 | 2,480 |
| Housing Fin. Auth., Housing Mortgage Fin. Program Bonds, Series 2018-A-2, AMT, 4.00% 2041 | 2,585 | 2,793 |
| Housing Fin. Auth., Housing Mortgage Fin. Program Bonds, Series 2018-C-1, 4.00% 2045 | 7,425 | 8,131 |
| Housing Fin. Auth., Housing Mortgage Fin. Program Bonds, Series 2019-A-1, 4.00% 2045 | 5,000 | 5,512 |
| Housing Fin. Auth., Housing Mortgage Fin. Program Rev. Ref. Bonds, Series 2012-F-2, AMT, 2.75% 2035 | 225 | 230 |
| Housing Fin. Auth., Housing Mortgage Fin. Program Rev. Ref. Bonds, Series 2015-A, 3.50% 2044 | 4,110 | 4,281 |
| Housing Fin. Auth., Housing Mortgage Fin. Program Rev. Ref. Bonds, Series 2015-C-1, 3.50% 2045 | 1,285 | 1,345 |
| | | 88,251 |
| District of Columbia 1.29% | | |
| Hospital Rev. Ref. Bonds (Children’s Hospital Obligated Group Issue), Series 2015, 5.00% 2027 | 1,500 | 1,823 |
| Housing Fin. Agcy., Multi Family Housing Rev. Bonds (Providence Place Apartments Project), Series 2019-B, 1.25% 2023 (put 2022) | 1,700 | 1,704 |
| Income Tax Secured Rev. Bonds, Series 2011-A, 5.00% 2029 | 1,765 | 1,893 |
| Income Tax Secured Rev. Bonds, Series 2019-A, 5.00% 2030 | 4,185 | 5,596 |
| Income Tax Secured Rev. Ref. Bonds, Series 2019-C, 5.00% 2027 | 6,175 | 8,004 |
| Metropolitan Washington DC Airports Auth., Airport System Rev. Ref. Bonds, Series 2012-A, AMT, 5.00% 2020 | 3,000 | 3,078 |
| Metropolitan Washington DC Airports Auth., Airport System Rev. Ref. Bonds, Series 2015-B, AMT, 5.00% 2027 | 1,000 | 1,201 |
| Metropolitan Washington DC Airports Auth., Airport System Rev. Ref. Bonds, Series 2017, AMT, 5.00% 2026 | 5,000 | 6,180 |
| Metropolitan Washington DC Airports Auth., Airport System Rev. Ref. Bonds, Series 2019-A, AMT, 5.00% 2023 | 1,750 | 1,993 |
| Metropolitan Washington DC Airports Auth., Airport System Rev. Ref. Bonds, Series 2019-A, AMT, 5.00% 2024 | 2,000 | 2,348 |
| Metropolitan Washington DC Airports Auth., Airport System Rev. Ref. Bonds, Series 2020-A, AMT, 5.00% 2027 | 3,965 | 4,895 |
| Metropolitan Washington DC Airports Auth., Airport System Rev. Ref. Bonds, Series 2020-A, AMT, 5.00% 2028 | 1,945 | 2,446 |
Limited Term Tax-Exempt Bond Fund of America — Page 5 of 38
unaudited
Bonds, notes & other debt instruments (continued)
District of Columbia (continued) | Principal amount
(000) | Value
(000) |
| Metropolitan Washington DC Airports Auth., Airport System Rev. Ref. Bonds, Series 2020-A, AMT, 5.00% 2029 | $2,530 | $3,235 |
| Metropolitan Washington DC Airports Auth., Airport System Rev. Ref. Bonds, Series 2020-A, AMT, 5.00% 2030 | 5,500 | 7,130 |
| Washington Convention and Sports Auth., Dedicated Tax Rev. Ref. Bonds, Series 2018-A, 5.00% 2027 | 4,900 | 6,272 |
| Washington Convention and Sports Auth., Dedicated Tax Rev. Ref. Bonds, Series 2018-A, 5.00% 2028 | 1,250 | 1,591 |
| | | 59,389 |
| Florida 5.36% | | |
| County of Brevard, Educational Facs. Auth., Demand Rev. Bonds (Florida Institute of Technology Project), Series 2014, 5.00% 2023 | 1,100 | 1,233 |
| County of Broward, Airport System Rev. Bonds, Series 2017, AMT, 5.00% 2026 | 2,500 | 3,083 |
| County of Broward, Airport System Rev. Bonds, Series 2019-A, AMT, 5.00% 2028 | 1,500 | 1,916 |
| County of Broward, Airport System Rev. Bonds, Series 2019-A, AMT, 5.00% 2029 | 1,200 | 1,557 |
| County of Broward, Airport System Rev. Bonds, Series 2019-A, AMT, 5.00% 2030 | 2,150 | 2,772 |
| County of Broward, Airport System Rev. Bonds, Series 2019-B, AMT, 5.00% 2027 | 4,000 | 5,020 |
| County of Broward, Airport System Rev. Bonds, Series 2019-B, AMT, 5.00% 2028 | 5,000 | 6,387 |
| County of Broward, Airport System Rev. Bonds, Series 2019-B, AMT, 5.00% 2029 | 5,000 | 6,489 |
| County of Broward, Airport System Rev. Ref. Bonds, Series 2012-P-1, AMT, 5.00% 2024 | 5,030 | 5,538 |
County of Broward, Housing Fin. Auth., Multi Family Housing Rev. Bonds (Prospect Park Apartments),
Series 2019-C, 1.40% 2022 (put 2021) | 2,295 | 2,303 |
City of Cape Coral, Utility Improvement Rev. Ref. Assessment Bonds (Various Areas), Series 2017,
Assured Guaranty Municipal insured, 2.00% 2021 | 1,065 | 1,075 |
City of Cape Coral, Utility Improvement Rev. Ref. Assessment Bonds (Various Areas), Series 2017,
Assured Guaranty Municipal insured, 2.125% 2022 | 1,160 | 1,179 |
| Central Florida Expressway Auth., Rev. Bonds, Series 2019-B, 5.00% 2030 | 3,000 | 3,910 |
Citizens Property Insurance Corp., Personal Lines Account/Commercial Lines Account Secured Bonds,
Series 2012-A-1, 5.00% 2020 | 4,500 | 4,560 |
Citizens Property Insurance Corp., Personal Lines Account/Commercial Lines Account Secured Bonds,
Series 2012-A-1, 5.00% 2021 | 1,000 | 1,054 |
County of Collier, Health Facs. Auth., Residential Care Fac. Rev. Bonds (Moorings Inc.), Series 2015-A,
5.00% 2026 | 350 | 416 |
County of Collier, Health Facs. Auth., Residential Care Fac. Rev. Bonds (Moorings Inc.), Series 2015-A,
5.00% 2027 | 240 | 284 |
County of Collier, Health Facs. Auth., Residential Care Fac. Rev. Bonds (Moorings Inc.), Series 2015-A,
5.00% 2028 | 445 | 524 |
| Board of Education, Public Education Capital Outlay Rev. Ref. Bonds, Series 2019-A, 5.00% 2021 | 8,325 | 8,781 |
County of Escambia, Health Facs. Auth., Health Care Facs. Rev. Bonds (Baptist Hospital, Inc. Project),
Series 2010-A, 5.125% 2020 | 1,270 | 1,297 |
County of Escambia, Housing Fin. Auth, Multi Family Housing Rev. Bonds (Springhill Apartments),
Series 2019, 1.35% 2022 (put 2021) | 1,285 | 1,290 |
| Greater Orlando Aviation Auth., Airport Facs. Rev. Bonds, Series 2017-A, AMT, 5.00% 2025 | 1,000 | 1,208 |
| Greater Orlando Aviation Auth., Airport Facs. Rev. Bonds, Series 2017-A, AMT, 5.00% 2026 | 1,000 | 1,236 |
| Greater Orlando Aviation Auth., Airport Facs. Rev. Bonds, Series 2017-A, AMT, 5.00% 2027 | 500 | 630 |
| Greater Orlando Aviation Auth., Airport Facs. Rev. Bonds, Series 2019-A, AMT, 5.00% 2024 | 4,000 | 4,705 |
| Greater Orlando Aviation Auth., Airport Facs. Rev. Bonds, Series 2019-A, AMT, 5.00% 2025 | 8,000 | 9,679 |
| Greater Orlando Aviation Auth., Airport Facs. Rev. Bonds, Series 2019-A, AMT, 5.00% 2028 | 15,000 | 19,302 |
| Greater Orlando Aviation Auth., Airport Facs. Rev. Ref. Bonds, Series 2012-A, AMT, 5.00% 2021 | 3,700 | 3,954 |
Housing Fin. Auth., Multi Family Housing Rev. Bonds (Jubilee Courtyards Apartments), Series 2019,
1.45% 2022 (put 2021) | 1,250 | 1,254 |
| Housing Fin. Corp., Homeowner Mortgage Rev. Bonds (Special Program), Series 2015-A, 3.50% 2046 | 1,880 | 1,948 |
| Housing Fin. Corp., Homeowner Mortgage Rev. Bonds, Series 2015-1, 4.00% 2047 | 750 | 793 |
| Housing Fin. Corp., Homeowner Mortgage Rev. Bonds, Series 2016-2, 4.00% 2047 | 670 | 712 |
| Housing Fin. Corp., Homeowner Mortgage Rev. Bonds, Series 2017-1, 4.00% 2048 | 10,885 | 11,767 |
| Housing Fin. Corp., Homeowner Mortgage Rev. Bonds, Series 2018-2, 4.25% 2050 | 15,440 | 17,104 |
| Housing Fin. Corp., Multi Family Housing Rev. Bonds (Azure Estates), Series 2019-J, 1.45% 2023 (put 2022) | 9,160 | 9,220 |
Limited Term Tax-Exempt Bond Fund of America — Page 6 of 38
unaudited
Bonds, notes & other debt instruments (continued)
Florida (continued) | Principal amount
(000) | Value
(000) |
Housing Fin. Corp., Multi Family Housing Rev. Bonds (Pembroke Tower Apartments), Series 2019-G,
1.55% 2021 (put 2021) | $1,310 | $1,316 |
| County of Miami-Dade, Aviation Rev. Bonds, Series 2010-A, 5.00% 2021 | 2,250 | 2,312 |
| County of Miami-Dade, Aviation Rev. Ref. Bonds, Series 2012-A, AMT, 5.00% 2021 | 11,600 | 12,389 |
| County of Miami-Dade, Aviation Rev. Ref. Bonds, Series 2014, AMT, 5.00% 2023 | 945 | 1,078 |
| County of Miami-Dade, Aviation Rev. Ref. Bonds, Series 2014-A, AMT, 5.00% 2027 | 1,325 | 1,546 |
| County of Miami-Dade, Expressway Auth., Toll System Rev. Ref. Bonds, Series 2014-B, 5.00% 2022 | 1,750 | 1,908 |
| County of Miami-Dade, Expressway Auth., Toll System Rev. Ref. Bonds, Series 2014-B, 5.00% 2025 | 4,870 | 5,672 |
| County of Miami-Dade, Expressway Auth., Toll System Rev. Ref. Bonds, Series 2014-B, 5.00% 2026 | 7,530 | 8,742 |
| City of Miami Beach, Health Facs. Auth., Hospital Rev. Ref. Bonds (Mount Sinai Medical Center of Florida), Series 2012, 5.00% 2021 | 1,000 | 1,067 |
| Municipal Power Agcy., All-Requirements Power Supply Project Rev. Bonds, Series 2016-A, 5.00% 2024 | 2,300 | 2,725 |
| County of Orange, Health Facs. Auth., Health Care Facs. Rev. Ref. Bonds (Presbyterian Retirement Communities Project), Series 2016, 5.00% 2031 | 2,750 | 3,135 |
County of Orange, Housing Fin. Auth., Multi Family Housing Rev. Bonds (Willow Key Apartments),
Series 2019-A, 1.90% 2022 (put 2021) | 2,485 | 2,506 |
| City of Orlando, Utilities Commission, Utility System Rev. Ref. Bonds, Series 2017-A, 5.00% 2027 (put 2020) | 6,000 | 6,161 |
| Orlando-Orange Expressway Auth., Rev. Ref. Bonds, Series 2012, 5.00% 2020 | 1,560 | 1,586 |
| Orlando-Orange Expressway Auth., Rev. Ref. Bonds, Series 2012-B, 5.00% 2020 | 1,000 | 1,017 |
County of Palm Beach, Health Facs. Auth., Rev. Bonds (Lifespace Communities, Inc.), Series 2015-C,
5.00% 2022 | 1,715 | 1,834 |
County of Pinellas, Housing Fin. Auth., Multi Family Housing Rev. Bonds, Series 2019-B,
1.25% 2022 (put 2021) | 1,000 | 1,002 |
| Ports Fncg. Commission, Rev. Ref. Bonds (State Transportation Trust Fund), Series 2011-B, AMT, 5.00% 2021 | 2,500 | 2,628 |
| South Florida Water Management Dist., Certs. of Part., Series 2015, 5.00% 2026 | 2,000 | 2,474 |
| City of South Miami, Health Facs. Auth., Hospital Rev. Ref. Bonds (Baptist Health South Florida Obligated Group), Series 2017, 5.00% 2020 | 2,000 | 2,043 |
| City of South Miami, Health Facs. Auth., Hospital Rev. Ref. Bonds (Baptist Health South Florida Obligated Group), Series 2017, 5.00% 2021 | 1,250 | 1,326 |
| City of South Miami, Health Facs. Auth., Hospital Rev. Ref. Bonds (Baptist Health South Florida Obligated Group), Series 2017, 5.00% 2025 | 1,545 | 1,875 |
| City of South Miami, Health Facs. Auth., Hospital Rev. Ref. Bonds (Baptist Health South Florida Obligated Group), Series 2017, 5.00% 2026 | 1,000 | 1,247 |
| City of South Miami, Health Facs. Auth., Hospital Rev. Ref. Bonds (Baptist Health South Florida Obligated Group), Series 2017, 5.00% 2027 | 1,250 | 1,588 |
Southeast Overtown/Park West Community Redev. Agcy., Tax Increment Rev. Bonds, Series 2014-A-1,
5.00% 20202 | 1,000 | 1,003 |
Southeast Overtown/Park West Community Redev. Agcy., Tax Increment Rev. Bonds, Series 2014-A-1,
5.00% 20212 | 2,000 | 2,080 |
Southeast Overtown/Park West Community Redev. Agcy., Tax Increment Rev. Bonds, Series 2014-A-1,
5.00% 20222 | 2,000 | 2,152 |
Southeast Overtown/Park West Community Redev. Agcy., Tax Increment Rev. Bonds, Series 2014-A-1,
5.00% 20232 | 1,000 | 1,108 |
Counties of St. Johns and Duval, Tolomato Community Dev. Dist., Rev. Ref. Bonds, Series 2019-B,
Assured Guaranty Municipal insured, 2.00% 2021 | 935 | 941 |
Counties of St. Johns and Duval, Tolomato Community Dev. Dist., Rev. Ref. Bonds, Series 2019-B,
Assured Guaranty Municipal insured, 2.00% 2023 | 970 | 985 |
Counties of St. Johns and Duval, Tolomato Community Dev. Dist., Rev. Ref. Bonds, Series 2019-B,
Assured Guaranty Municipal insured, 2.00% 2024 | 995 | 1,013 |
Counties of St. Johns and Duval, Tolomato Community Dev. Dist., Rev. Ref. Bonds, Series 2019-B,
Assured Guaranty Municipal insured, 2.00% 2025 | 1,010 | 1,029 |
County of Sumter, Industrial Dev. Auth., Hospital Rev. Bonds (Central Florida Health Alliance Projects),
Series 2014-A, 5.00% 2021 | 500 | 526 |
County of Sumter, Industrial Dev. Auth., Hospital Rev. Bonds (Central Florida Health Alliance Projects),
Series 2014-A, 5.00% 2026 | 500 | 568 |
Limited Term Tax-Exempt Bond Fund of America — Page 7 of 38
unaudited
Bonds, notes & other debt instruments (continued)
Florida (continued) | Principal amount
(000) | Value
(000) |
County of Sumter, Industrial Dev. Auth., Hospital Rev. Bonds (Central Florida Health Alliance Projects),
Series 2014-A, 5.00% 2027 | $330 | $373 |
| Dept. of Transportation, Right-of-Way Acquisition and Bridge Construction Rev. Ref. Bonds, Series 2012-A, 4.00% 2028 | 10,800 | 11,263 |
| Dept. of Transportation, Turnpike Rev. Bonds, Series 2018-A, 5.00% 2026 | 4,000 | 5,008 |
| Dept. of Transportation, Turnpike Rev. Ref. Bonds, Series 2013-A, 5.00% 2021 | 5,180 | 5,484 |
| | | 246,890 |
| Georgia 2.68% | | |
| City of Atlanta, Tax Allocation Rev. Ref. Bonds (Atlantic Station Project), Series 2017, 5.00% 2020 | 1,100 | 1,134 |
| City of Atlanta, Tax Allocation Rev. Ref. Bonds (Atlantic Station Project), Series 2017, 5.00% 2021 | 1,250 | 1,336 |
| City of Atlanta, Tax Allocation Rev. Ref. Bonds (Atlantic Station Project), Series 2017, 5.00% 2022 | 1,000 | 1,103 |
| City of Atlanta, Tax Allocation Rev. Ref. Bonds (Beltline Project), Series 2016-B, 5.00% 2023 | 1,270 | 1,409 |
| City of Atlanta, Tax Allocation Rev. Ref. Bonds (Beltline Project), Series 2016-B, 5.00% 2024 | 2,460 | 2,810 |
| City of Atlanta, Tax Allocation Rev. Ref. Bonds (Beltline Project), Series 2016-B, 5.00% 2025 | 2,620 | 3,084 |
| City of Atlanta, Tax Allocation Rev. Ref. Bonds (Beltline Project), Series 2016-D, 5.00% 2023 | 2,310 | 2,563 |
| City of Atlanta, Tax Allocation Rev. Ref. Bonds (Beltline Project), Series 2016-D, 5.00% 2025 | 2,895 | 3,408 |
City of Atlanta, Urban Residential Fin. Auth., Multi Family Housing Rev. Bonds
(Herndon Square Senior Apartments Project), Series 2019, 1.36% 2022 (put 2021) | 1,220 | 1,225 |
County of Burke, Dev. Auth., Pollution Control Rev. Bonds (Georgia Power Co. Plant Vogtle Project),
Series 2013, 2.925% 2053 (put 2024) | 4,400 | 4,646 |
| City of East Point, Housing Auth., Multi Family Housing Rev. Bonds (Hillcrest Senior Apartments Projects), Series 2018, 2.25% 2022 (put 2021)3 | 7,680 | 7,788 |
| County of Forsyth, Water and Sewage Auth., Rev. Ref. and Improvement Rev. Bonds, Series 2019, 5.00% 2030 | 1,000 | 1,331 |
| County of Forsyth, Water and Sewage Auth., Rev. Ref. and Improvement Rev. Bonds, Series 2019, 5.00% 2031 | 1,000 | 1,323 |
| G.O. Bonds, Series 2011-C, 5.00% 2021 | 630 | 667 |
| G.O. Bonds, Series 2011-C, 5.00% 2022 (preref. 2021) | 1,340 | 1,418 |
| G.O. Bonds, Series 2013-D, 5.00% 2021 | 2,430 | 2,530 |
| G.O. Bonds, Series 2013-H, 5.00% 2021 | 1,745 | 1,877 |
| G.O. Bonds, Series 2019-A, 5.00% 2021 | 7,440 | 7,873 |
| G.O. Bonds, Series 2019-A, 5.00% 2028 | 11,000 | 14,490 |
| G.O. Rev. Ref. Bonds, Series 2009-I, 5.00% 2021 | 2,000 | 2,117 |
| Housing and Fin. Auth., Single Family Mortgage Bonds, Series 2015-A-1, 3.50% 2045 | 490 | 512 |
| Housing and Fin. Auth., Single Family Mortgage Bonds, Series 2016-A-1, 3.50% 2046 | 910 | 957 |
| Main Street Natural Gas, Inc., Gas Project Rev. Bonds, Series 2006-B, 5.00% 2020 | 9,000 | 9,038 |
| Main Street Natural Gas, Inc., Gas Supply Rev. Bonds, Series 2018-A, 4.00% 2048 (put 2023) | 15,000 | 16,437 |
| Main Street Natural Gas, Inc., Gas Supply Rev. Bonds, Series 2019-A, 5.00% 2021 | 820 | 859 |
| Municipal Electric Auth., Plant Vogtle Units 3 and 4 Project M Bonds, Series 2019-A, 5.00% 2025 | 1,000 | 1,173 |
| Municipal Electric Auth., Plant Vogtle Units 3 and 4 Project M Bonds, Series 2019-A, 5.00% 2027 | 1,000 | 1,224 |
| Municipal Electric Auth., Plant Vogtle Units 3 and 4 Project M Bonds, Series 2019-A, 5.00% 2029 | 880 | 1,101 |
| Municipal Electric Auth., Plant Vogtle Units 3 and 4 Project M Bonds, Series 2019-A, 5.00% 2030 | 885 | 1,101 |
| Municipal Electric Auth., Power Rev. Bonds, Series 2018-HH, 5.00% 2029 | 2,000 | 2,494 |
| Municipal Electric Auth., Project One Bonds, Series 2011-A, 5.00% 2021 | 11,490 | 11,891 |
| Municipal Electric Auth., Project One Bonds, Series 2019-A, 5.00% 2026 | 1,710 | 2,053 |
| Municipal Electric Auth., Project One Bonds, Series 2019-A, 5.00% 2027 | 1,020 | 1,248 |
| Municipal Electric Auth., Project One Bonds, Series 2019-A, 5.00% 2028 | 1,270 | 1,578 |
| Municipal Electric Auth., Project One Bonds, Series 2019-A, 5.00% 2029 | 270 | 341 |
| Municipal Electric Auth., Project One Bonds, Series 2019-A, 5.00% 2030 | 1,025 | 1,289 |
| Municipal Electric Auth., Project One Bonds, Series 2019-A, 5.00% 2031 | 1,390 | 1,739 |
Private Colleges and Universities Auth., Rev. Bonds (The Savannah College of Art and Design Projects),
Series 2014, 5.00% 2022 | 1,050 | 1,141 |
| Road and Tollway Auth., Federal Highway Grant Anticipation Rev. Ref. Bonds, Series 2017-B, 5.00% 2020 | 3,000 | 3,040 |
| | | 123,348 |
Limited Term Tax-Exempt Bond Fund of America — Page 8 of 38
unaudited
Bonds, notes & other debt instruments (continued)
Guam 0.12% | Principal amount
(000) | Value
(000) |
| A.B. Won Pat International Airport Auth., General Rev. Bonds, Series 2013-C, AMT, 6.25% 2034 | $500 | $579 |
A.B. Won Pat International Airport Auth., General Rev. Bonds, Series 2013-C, AMT,
5.00% 2021 (escrowed to maturity) | 3,385 | 3,529 |
| Waterworks Auth., Water and Wastewater System Rev. Bonds, Series 2016, 5.00% 2026 | 965 | 1,162 |
| | | 5,270 |
| Hawaii 0.56% | | |
| G.O. Bonds, Series 2011-DZ, 5.00% 2020 (escrowed to maturity) | 760 | 786 |
| G.O. Bonds, Series 2011-DZ, 5.00% 2020 (escrowed to maturity) | 40 | 41 |
| G.O. Bonds, Series 2011-DZ, 5.00% 2024 (preref. 2021) | 3,550 | 3,818 |
| G.O. Bonds, Series 2011-DZ, 5.00% 2026 (preref. 2021) | 4,980 | 5,355 |
| G.O. Bonds, Series 2011-DZ, 5.00% 2027 (preref. 2021) | 3,745 | 4,027 |
City and County of Honolulu, G.O. Bonds (Honolulu Rail Transit Project), Series 2017-H,
(SIFMA Municipal Swap Index + 0.31%) 1.25% 2024 (put 2020)1 | 2,500 | 2,500 |
City and County of Honolulu, G.O. Bonds (Honolulu Rail Transit Project), Series 2017-H,
(SIFMA Municipal Swap Index + 0.32%) 1.26% 2026 (put 2020)1 | 5,000 | 5,000 |
| City and County of Honolulu, Wastewater System Rev. Bonds (Second Bond Resolution), Series 2010-A, 5.00% 2024 (preref. 2020) | 3,115 | 3,168 |
| Dept. of Transportation, Airports Division, Lease Rev. Certs. of Part., Series 2013, AMT, 5.00% 2023 | 1,000 | 1,131 |
| | | 25,826 |
| Idaho 0.08% | | |
| Housing and Fin. Assn., Grant and Rev. Anticipation Bonds (Federal Highway Trust Fund), Series 2015-A, 5.00% 2025 | 1,500 | 1,809 |
| Housing and Fin. Assn., Grant and Rev. Anticipation Bonds (Federal Highway Trust Fund), Series 2015-A, 5.00% 2026 | 1,515 | 1,874 |
| | | 3,683 |
| Illinois 9.76% | | |
| Build Illinois Bonds, Sales Tax Rev. Bonds, Series 2013, 5.00% 2020 | 1,000 | 1,013 |
| Build Illinois Bonds, Sales Tax Rev. Bonds, Series 2013, 5.00% 2024 | 4,230 | 4,663 |
| Build Illinois Bonds, Sales Tax Rev. Ref. Bonds, Series 2010, 5.00% 2020 | 1,200 | 1,215 |
| Build Illinois Bonds, Sales Tax Rev. Ref. Bonds, Series 2016-C, 4.00% 2025 | 4,515 | 5,006 |
| Build Illinois Bonds, Sales Tax Rev. Ref. Bonds, Series 2016-C, 4.00% 2026 | 11,805 | 13,304 |
| Build Illinois Bonds, Sales Tax Rev. Ref. Bonds, Series 2016-D, 4.00% 2021 | 1,900 | 1,957 |
City of Chicago, Board of Education, Unlimited Tax G.O. Bonds (Dedicated Rev.), Series 2018-A,
Assured Guaranty Municipal insured, 5.00% 2023 | 900 | 1,011 |
| City of Chicago, Chicago Midway Airport, Rev. Ref. Bonds, Series 2014-A, AMT, 5.00% 2023 | 1,000 | 1,107 |
| City of Chicago, Chicago Midway Airport, Rev. Ref. Bonds, Series 2014-A, AMT, 5.00% 2024 | 8,975 | 10,241 |
| City of Chicago, Chicago Midway Airport, Rev. Ref. Bonds, Series 2016-A, AMT, 5.00% 2027 | 500 | 599 |
| City of Chicago, G.O. Rev. Ref. Bonds, Series 2015-C, 5.00% 2024 | 2,480 | 2,781 |
| City of Chicago, G.O. Rev. Ref. Bonds, Series 2015-C, 5.00% 2025 | 1,900 | 2,180 |
| City of Chicago, G.O. Rev. Ref. Bonds, Series 2015-C, 5.00% 2026 | 2,270 | 2,658 |
| City of Chicago, G.O. Rev. Ref. Bonds, Series 2020-A, 5.00% 2027 | 5,000 | 5,962 |
| City of Chicago, O’Hare International Airport, General Airport Rev. Bonds, Series 2012-B, AMT, 5.00% 2024 | 2,000 | 2,144 |
| City of Chicago, O’Hare International Airport, General Airport Rev. Bonds, Series 2013-A, AMT, 5.00% 2022 | 3,055 | 3,285 |
| City of Chicago, O’Hare International Airport, General Airport Rev. Bonds, Series 2017-D, 5.00% 2026 | 4,000 | 4,887 |
| City of Chicago, O’Hare International Airport, General Airport Rev. Bonds, Series 2017-D, 5.25% 2029 | 1,500 | 1,883 |
City of Chicago, O’Hare International Airport, General Airport Rev. Ref. Bonds, Series 2012-A, AMT,
5.00% 2025 | 6,170 | 6,615 |
City of Chicago, O’Hare International Airport, General Airport Rev. Ref. Bonds, Series 2013-A, AMT,
5.00% 2023 | 5,000 | 5,555 |
| City of Chicago, O’Hare International Airport, Passenger Fac. Charge Rev. Ref. Bonds, Series 2013-B, AMT, 5.00% 2022 | 3,000 | 3,226 |
Limited Term Tax-Exempt Bond Fund of America — Page 9 of 38
unaudited
Bonds, notes & other debt instruments (continued)
Illinois (continued) | Principal amount
(000) | Value
(000) |
| City of Chicago, Transit Auth., Capital Grant Receipts Rev. Bonds (Federal Transit Administration Section 5307 Guideway Modernization Formula Funds), Series 2011, Assured Guaranty insured, 5.00% 2022 | $1,400 | $1,475 |
| City of Chicago, Wastewater Transmission Rev. Bonds, Series 2012, 5.00% 2021 | 850 | 879 |
| City of Chicago, Wastewater Transmission Rev. Ref. Bonds, Series 2008-C, 5.00% 2022 | 760 | 814 |
| City of Chicago, Wastewater Transmission Rev. Ref. Bonds, Series 2014, 5.00% 2022 | 1,100 | 1,178 |
| City of Chicago, Wastewater Transmission Rev. Ref. Bonds, Series 2014, 5.00% 2023 | 1,435 | 1,586 |
| City of Chicago, Wastewater Transmission Rev. Ref. Bonds, Series 2017-B, 5.00% 2024 | 1,500 | 1,705 |
| City of Chicago, Wastewater Transmission Rev. Ref. Bonds, Series 2017-B, 5.00% 2025 | 1,000 | 1,165 |
| City of Chicago, Wastewater Transmission Rev. Ref. Bonds, Series 2017-B, 5.00% 2026 | 1,165 | 1,393 |
| City of Chicago, Water Rev. Bonds, Series 1999, Assured Guaranty Municipal insured, 5.00% 2029 | 1,000 | 1,205 |
| City of Chicago, Water Rev. Bonds, Series 2000, 5.00% 2022 | 10,500 | 11,545 |
| City of Chicago, Water Rev. Bonds, Series 2004, 5.00% 2026 | 5,225 | 6,376 |
| City of Chicago, Water Rev. Bonds, Series 2004, 5.00% 2027 | 1,750 | 2,108 |
| City of Chicago, Water Rev. Ref. Bonds, Series 2012, 5.00% 2025 | 775 | 854 |
| City of Chicago, Water Rev. Ref. Bonds, Series 2014, 5.00% 2023 | 1,010 | 1,145 |
Counties of Cook, DuPage, Kane, Lake, McHenry and Will, Regional Transportation Auth., G.O. Bonds,
Series 2001-A, FGIC-National insured, 5.50% 2020 | 2,000 | 2,037 |
Counties of Cook, DuPage, Kane, Lake, McHenry and Will, Regional Transportation Auth., G.O. Bonds,
Series 2004-A, Assured Guaranty Municipal insured, 5.25% 2025 | 1,935 | 2,341 |
Counties of Cook, DuPage, Kane, Lake, McHenry and Will, Regional Transportation Auth., G.O. Bonds,
Series 2004-A, Assured Guaranty Municipal insured, 5.50% 2026 | 6,800 | 8,556 |
Counties of Cook, DuPage, Kane, Lake, McHenry and Will, Regional Transportation Auth.,
G.O. Rev. Ref. Bonds, Series 1997, FGIC-National insured, 6.00% 2020 | 2,060 | 2,093 |
Counties of Cook, DuPage, Kane, Lake, McHenry and Will, Regional Transportation Auth.,
G.O. Rev. Ref. Bonds, Series 1999, Assured Guaranty Municipal insured, 5.75% 2023 | 1,000 | 1,118 |
| County of Cook, G.O. Rev. Ref. Bonds, Series 2016-A, 5.00% 2022 | 1,000 | 1,095 |
| County of Cook, G.O. Rev. Ref. Bonds, Series 2016-A, 5.00% 2026 | 3,400 | 4,134 |
| County of Cook, G.O. Rev. Ref. Bonds, Series 2016-A, Assured Guaranty Municipal insured, 5.00% 2026 | 4,000 | 4,902 |
| Fin. Auth., National Rural Utilities Cooperative Fin. Corp., Guaranteed Solid Waste Disposal Rev. Bonds (Prairie Power, Inc. Project), Series 2008-A, 1.75% 2042 (put 2020) | 2,940 | 2,945 |
| Fin. Auth., Rev. Bonds (Advocate Health Care Network), Series 2014, 5.00% 2021 | 375 | 397 |
| Fin. Auth., Rev. Bonds (Clean Water Initiative Revolving Fund), Series 2016, 4.00% 2026 | 1,100 | 1,275 |
| Fin. Auth., Rev. Bonds (Clean Water Initiative Revolving Fund), Series 2016, 5.00% 2026 | 1,000 | 1,230 |
| Fin. Auth., Rev. Bonds (Clean Water Initiative Revolving Fund), Series 2016, 5.00% 2028 | 10,590 | 12,914 |
| Fin. Auth., Rev. Bonds (Clean Water Initiative Revolving Fund), Series 2017, 5.00% 2027 | 2,000 | 2,516 |
| Fin. Auth., Rev. Bonds (Lifespace Communities, Inc.), Series 2015-A, 5.00% 2020 | 500 | 504 |
| Fin. Auth., Rev. Bonds (Lifespace Communities, Inc.), Series 2015-A, 5.00% 2022 | 200 | 214 |
| Fin. Auth., Rev. Bonds (Lifespace Communities, Inc.), Series 2015-A, 5.00% 2026 | 540 | 619 |
| Fin. Auth., Rev. Bonds (Lifespace Communities, Inc.), Series 2015-A, 5.00% 2028 | 1,060 | 1,207 |
| Fin. Auth., Rev. Bonds (Mercy Health Corp.), Series 2016, 5.00% 2025 | 5,530 | 6,647 |
| Fin. Auth., Rev. Bonds (Mercy Health Corp.), Series 2016, 5.00% 2027 | 5,000 | 5,988 |
| Fin. Auth., Rev. Bonds (Northwest Community Hospital), Series 2016-A, 5.00% 2026 | 1,080 | 1,324 |
| Fin. Auth., Rev. Bonds (Northwest Community Hospital), Series 2016-A, 5.00% 2027 | 1,000 | 1,215 |
| Fin. Auth., Rev. Bonds (Northwestern Memorial Healthcare), Series 2017-B, 5.00% 2057 (put 2022) | 4,865 | 5,399 |
| Fin. Auth., Rev. Bonds (Presbyterian Homes Obligated Group), Series 2016-A, 5.00% 2020 | 800 | 807 |
| Fin. Auth., Rev. Bonds (Presbyterian Homes Obligated Group), Series 2016-A, 5.00% 2024 | 1,920 | 2,198 |
Fin. Auth., Rev. Bonds (Presbyterian Homes Obligated Group), Series 2016-B,
(1-month USD-LIBOR x 0.70 + 1.35%) 2.596% 2036 (put 2021)1 | 2,275 | 2,279 |
| Fin. Auth., Rev. Bonds (Presence Health Network), Series 2016-C, 4.00% 2024 | 4,000 | 4,477 |
| Fin. Auth., Rev. Bonds (Presence Health Network), Series 2016-C, 5.00% 2023 | 1,545 | 1,731 |
| Fin. Auth., Rev. Bonds (Presence Health Network), Series 2016-C, 5.00% 2024 | 1,425 | 1,651 |
| Fin. Auth., Rev. Bonds (Presence Health Network), Series 2016-C, 5.00% 2025 | 950 | 1,136 |
| Fin. Auth., Rev. Bonds (Presence Health Network), Series 2016-C, 5.00% 2026 | 1,215 | 1,496 |
| Fin. Auth., Rev. Bonds (Presence Health Network), Series 2016-C, 5.00% 2027 | 8,640 | 10,885 |
| Fin. Auth., Rev. Bonds (Rehabilitation Institute of Chicago), Series 2013-A, 5.00% 2022 | 1,665 | 1,811 |
Limited Term Tax-Exempt Bond Fund of America — Page 10 of 38
unaudited
Bonds, notes & other debt instruments (continued)
Illinois (continued) | Principal amount
(000) | Value
(000) |
| Fin. Auth., Rev. Bonds (Rush University Medical Center Obligated Group), Series 2015-A, 5.00% 2028 | $4,000 | $4,742 |
| Fin. Auth., Rev. Bonds (Rush University Medical Center Obligated Group), Series 2015-A, 5.00% 2029 | 9,500 | 11,224 |
| Fin. Auth., Rev. Bonds (Swedish Covenant Hospital), Series 2016-A, 5.25% 2028 | 1,020 | 1,229 |
| Fin. Auth., Rev. Green Bonds (Clean Water Initiative Revolving Fund), Series 2019, 5.00% 2021 | 4,170 | 4,413 |
| Fin. Auth., Rev. Ref. Bonds (Loyola University of Chicago), Series 2012-B, 5.00% 2023 | 1,970 | 2,158 |
| Fin. Auth., Rev. Ref. Bonds (OSF Healthcare System), Series 2015-A, 5.00% 2023 | 750 | 854 |
| Fin. Auth., Rev. Ref. Bonds (OSF Healthcare System), Series 2015-A, 5.00% 2026 | 1,165 | 1,403 |
| Fin. Auth., Rev. Ref. Bonds (OSF Healthcare System), Series 2015-A, 5.00% 2029 | 1,500 | 1,782 |
| G.O. Bonds, Series 2013, 5.00% 2022 | 1,310 | 1,413 |
| G.O. Bonds, Series 2017-A, 5.00% 2021 | 3,500 | 3,716 |
| G.O. Bonds, Series 2017-D, BAM insured, 5.00% 2020 | 9,885 | 10,154 |
| G.O. Bonds, Series 2017-D, BAM insured, 5.00% 2021 | 20,015 | 21,197 |
| G.O. Bonds, Series 2017-D, BAM insured, 5.00% 2024 | 5,500 | 6,260 |
| G.O. Rev. Ref. Bonds, Series 2012, 5.00% 2020 | 3,000 | 3,054 |
| Housing Dev. Auth., Homeowner Mortgage Rev. Bonds, Series 2016-B, AMT, 3.50% 2046 | 2,465 | 2,617 |
| Housing Dev. Auth., Homeowner Mortgage Rev. Bonds, Series 2016-C, 3.50% 2046 | 4,775 | 5,096 |
| Housing Dev. Auth., Homeowner Mortgage Rev. Bonds, Series 2018-A-1, 4.00% 2048 | 7,515 | 8,264 |
| Housing Dev. Auth., Multi Family Housing Rev. Notes (Marshall Field Garden Apartment Homes), Series 2015, (SIFMA Municipal Swap Index + 1.00%) 1.94% 2050 (put 2025)1 | 3,625 | 3,650 |
| Housing Dev. Auth., Rev. Bonds, Series 2016-A, 4.00% 2046 | 1,685 | 1,801 |
| Housing Dev. Auth., Rev. Bonds, Series 2017-B, 4.00% 2048 | 1,915 | 2,077 |
| Housing Dev. Auth., Rev. Bonds, Series 2019-A, 4.25% 2049 | 6,200 | 6,907 |
| Housing Dev. Auth., Rev. Bonds, Series 2019-C, 4.00% 2049 | 1,950 | 2,165 |
Board of Trustees of Illinois State University, Auxiliary Facs. System Rev. Bonds, Series 2016,
Assured Guaranty Municipal insured, 5.00% 2023 | 2,700 | 2,973 |
| Metropolitan Pier and Exposition Auth., McCormick Place Expansion Project Rev. Bonds, Series 2002-A, Assured Guaranty Municipal insured, 5.50% 2023 | 4,295 | 4,645 |
| Metropolitan Pier and Exposition Auth., McCormick Place Expansion Project Rev. Ref. Bonds, Series 2012-B, 5.00% 2020 | 3,905 | 4,016 |
| Metropolitan Pier and Exposition Auth., McCormick Place Expansion Project Rev. Ref. Bonds, Series 2012-B, 5.00% 2026 | 2,230 | 2,392 |
| Metropolitan Pier and Exposition Auth., McCormick Place Expansion Project Rev. Ref. Bonds, Series 2012-B, 5.00% 2028 | 1,000 | 1,072 |
| Metropolitan Pier and Exposition Auth., McCormick Place Expansion Project Rev. Ref. Bonds, Series 2017-B, 5.00% 2025 | 665 | 786 |
| Metropolitan Pier and Exposition Auth., McCormick Place Expansion Project Rev. Ref. Bonds, Series 2017-B, 5.00% 2026 | 1,000 | 1,206 |
| Metropolitan Water Reclamation Dist. of Greater Chicago, Unlimited Tax G.O. Rev. Ref. Bonds, Series 2016-A, 5.00% 2025 | 2,000 | 2,431 |
| Metropolitan Water Reclamation Dist. of Greater Chicago, Unlimited Tax G.O. Rev. Ref. Bonds, Series 2016-A, 5.00% 2026 | 2,500 | 3,111 |
| Municipal Electric Agcy., Power Supply System Rev. Ref. Bonds, Series 2015-A, 5.00% 2027 | 3,000 | 3,585 |
| Railsplitter Tobacco Settlement Auth., Tobacco Settlement Rev. Bonds, Series 2010, 5.25% 2020 | 6,525 | 6,612 |
| Railsplitter Tobacco Settlement Auth., Tobacco Settlement Rev. Bonds, Series 2010, 5.375% 2021 | 1,015 | 1,071 |
| Railsplitter Tobacco Settlement Auth., Tobacco Settlement Rev. Bonds, Series 2010, 5.50% 2023 (preref. 2021) | 13,235 | 14,040 |
| Railsplitter Tobacco Settlement Auth., Tobacco Settlement Rev. Bonds, Series 2017, 5.00% 2023 | 4,800 | 5,397 |
| Railsplitter Tobacco Settlement Auth., Tobacco Settlement Rev. Bonds, Series 2017, 5.00% 2024 | 5,000 | 5,804 |
| Railsplitter Tobacco Settlement Auth., Tobacco Settlement Rev. Bonds, Series 2017, 5.00% 2025 | 5,000 | 5,982 |
| Sales Tax Securitization Corp., Sales Tax Securitization Bonds, Series 2017-A, 5.00% 2027 | 3,000 | 3,694 |
| Sales Tax Securitization Corp., Sales Tax Securitization Bonds, Series 2020-A, 5.00% 2027 | 2,000 | 2,462 |
| Sales Tax Securitization Corp., Sales Tax Securitization Rev. Ref. Bonds, Series 2017-A, 5.00% 2023 | 2,900 | 3,211 |
Southwestern Illinois Dev. Auth., Health Fac. Rev. Bonds (Memorial Group, Inc.), Series 2013,
7.125% 2043 (preref. 2023) | 2,500 | 3,061 |
Southwestern Illinois Dev. Auth., Health Fac. Rev. Bonds (Memorial Group, Inc.), Series 2013,
7.25% 2036 (preref. 2023) | 3,080 | 3,785 |
Limited Term Tax-Exempt Bond Fund of America — Page 11 of 38
unaudited
Bonds, notes & other debt instruments (continued)
Illinois (continued) | Principal amount
(000) | Value
(000) |
| Toll Highway Auth., Toll Highway Rev. Bonds, Series 2014-A, 5.00% 2021 | $1,260 | $1,353 |
| Toll Highway Auth., Toll Highway Rev. Bonds, Series 2014-D, 5.00% 2024 | 4,375 | 5,041 |
| Toll Highway Auth., Toll Highway Rev. Bonds, Series 2016-B, 5.00% 2027 | 950 | 1,174 |
| Toll Highway Auth., Toll Highway Rev. Bonds, Series 2016-B, 5.00% 2033 | 1,000 | 1,214 |
| Toll Highway Auth., Toll Highway Rev. Bonds, Series 2019-C, 5.00% 2028 | 11,035 | 14,077 |
| Toll Highway Auth., Toll Highway Rev. Bonds, Series 2019-C, 5.00% 2029 | 4,560 | 5,941 |
| Toll Highway Auth., Toll Highway Rev. Bonds, Series 2019-C, 5.00% 2030 | 1,000 | 1,327 |
| Toll Highway Auth., Toll Highway Rev. Ref. Bonds, Series 2019-A, 5.00% 2025 | 1,680 | 1,999 |
| Toll Highway Auth., Toll Highway Rev. Ref. Bonds, Series 2019-A, 5.00% 2026 | 4,000 | 4,892 |
| Toll Highway Auth., Toll Highway Rev. Ref. Bonds, Series 2019-A, 5.00% 2027 | 1,500 | 1,874 |
| Toll Highway Auth., Toll Highway Rev. Ref. Bonds, Series 2019-A, 5.00% 2028 | 2,000 | 2,551 |
Board of Trustees of the University of Illinois, Auxiliary Facs. System Rev. Ref. Bonds, Series 2005-A,
National insured, 5.50% 2023 | 2,700 | 3,067 |
Village of Volo, Special Service Areas Nos. 3 and 6 (Symphony Meadows/Lancaster Falls Projects),
Special Tax Rev. Ref. Bonds, Series 2016, Assured Guaranty Municipal insured, 3.00% 2020 | 624 | 625 |
United City of Yorkville, Special Service Area Nos. 2005-108 and 2005-109, Special Tax Rev. Ref. Bonds,
Series 2016, Assured Guaranty Municipal insured, 2.375% 2022 | 554 | 562 |
United City of Yorkville, Special Service Area Nos. 2005-108 and 2005-109, Special Tax Rev. Ref. Bonds,
Series 2016, Assured Guaranty Municipal insured, 2.625% 2023 | 1,105 | 1,134 |
United City of Yorkville, Special Service Area Nos. 2005-108 and 2005-109, Special Tax Rev. Ref. Bonds,
Series 2016, Assured Guaranty Municipal insured, 3.00% 2021 | 991 | 1,008 |
| | | 449,212 |
| Indiana 1.46% | | |
Dev. Fin. Auth., Solid Waste Disposal Rev. Bonds (Waste Management, Inc. Project), Series 2001, AMT,
2.95% 2031 (put 2021) | 1,000 | 1,027 |
| Fin. Auth., Health System Rev. Bonds (Indiana University Health), Series 2019-C, 5.00% 2023 | 2,825 | 3,258 |
| Fin. Auth., Hospital Rev. Bonds (Community Health Network Project), Series 2012-A, 5.00% 2042 | 8,835 | 9,732 |
| Fin. Auth., Hospital Rev. Ref. Bonds (Community Health Network Project), Series 2012-A, 5.00% 2020 | 1,460 | 1,474 |
| Fin. Auth., Hospital Rev. Ref. Bonds (Indiana University Health Obligated Group), Series 2016-A, 5.00% 2023 | 1,500 | 1,730 |
| Fin. Auth., Hospital Rev. Ref. Bonds (Indiana University Health Obligated Group), Series 2016-A, 5.00% 2024 | 1,000 | 1,191 |
| Fin. Auth., Hospital Rev. Ref. Bonds (Parkview Health System), Series 2012-A, 5.00% 2022 | 1,940 | 2,115 |
Fin. Auth., Hospital Rev. Ref. Bonds (Parkview Health System), Series 2012-A,
5.00% 2021 (escrowed to maturity) | 60 | 63 |
Fin. Auth., Hospital Rev. Ref. Bonds (Parkview Health System), Series 2012-A,
5.00% 2022 (escrowed to maturity) | 60 | 65 |
| Fin. Auth., Hospital Rev. Ref. Bonds (Parkview Health System), Series 2017-A, 5.00% 2026 | 1,365 | 1,711 |
| Fin. Auth., Hospital Rev. Ref. Bonds (Parkview Health System), Series 2017-A, 5.00% 2027 | 700 | 896 |
| Fin. Auth., Rev. Ref. Bonds (Community Foundation of Northwest Indiana Obligated Group), Series 2015, 5.00% 2026 | 500 | 592 |
| Fin. Auth., Rev. Ref. Bonds (Community Foundation of Northwest Indiana Obligated Group), Series 2015, 5.00% 2027 | 500 | 590 |
| Fin. Auth., Rev. Ref. Bonds (Community Foundation of Northwest Indiana Obligated Group), Series 2015, 5.00% 2028 | 500 | 588 |
| Fin. Auth., State Revolving Fund Green Bonds, Series 2019-E, 5.00% 2023 | 2,000 | 2,245 |
| Fin. Auth., State Revolving Fund Green Bonds, Series 2019-E, 5.00% 2027 | 2,250 | 2,855 |
| Gary/Chicago International Airport Auth., Airport Dev. Zone Rev. Bonds, Series 2014, AMT, 5.50% 2025 | 3,630 | 3,644 |
| Housing and Community Dev. Auth., Single Family Mortgage Rev. Bonds, Series 2016-A-2, AMT, 3.50% 2038 | 1,435 | 1,500 |
| Housing and Community Dev. Auth., Single Family Mortgage Rev. Bonds, Series 2017-A-2, AMT, 4.00% 2039 | 1,190 | 1,252 |
| Housing and Community Dev. Auth., Single Family Mortgage Rev. Bonds, Series 2019-A, 4.25% 2048 | 1,995 | 2,216 |
| Housing and Community Dev. Auth., Single Family Mortgage Rev. Bonds, Series 2020-A, 3.75% 2049 | 1,320 | 1,468 |
Indianapolis Local Public Improvement Bond Bank, Rev. Ref. Bonds (Indianapolis Airport Auth. Project),
Series 2014-D, AMT, 5.00% 2022 | 2,000 | 2,145 |
Indianapolis Local Public Improvement Bond Bank, Rev. Ref. Bonds (Indianapolis Airport Auth. Project),
Series 2019-D, AMT, 5.00% 2025 | 2,870 | 3,380 |
Limited Term Tax-Exempt Bond Fund of America — Page 12 of 38
unaudited
Bonds, notes & other debt instruments (continued)
Indiana (continued) | Principal amount
(000) | Value
(000) |
Indianapolis Local Public Improvement Bond Bank, Rev. Ref. Bonds (Indianapolis Airport Auth. Project),
Series 2019-D, AMT, 5.00% 2026 | $6,550 | $7,923 |
| City of Rockport, Pollution Control Rev. Ref. Bonds (Indiana Michigan Power Co. Project), Series 2002-A, 2.75% 2025 | 1,500 | 1,612 |
| City of Rockport, Pollution Control Rev. Ref. Bonds (Indiana Michigan Power Co. Project), Series 2008-D, 2.05% 2025 (put 2021) | 1,615 | 1,632 |
| City of Rockport, Pollution Control Rev. Ref. Bonds (Indiana Michigan Power Co. Project), Series 2009-A, 3.05% 2025 | 2,000 | 2,180 |
County of Warrick, Multi Family Housing Rev. Bonds (Newburgh Assisted Living Project), Series 2019,
1.625% 2022 (put 2021) | 4,250 | 4,278 |
| City of Whiting, Environmental Facs. Rev. Bonds (BP Products North America, Inc. Project), Series 2015, AMT, 5.00% 2045 (put 2022) | 3,290 | 3,614 |
| | | 66,976 |
| Iowa 0.12% | | |
| Fin. Auth., Rev. Bonds (Lifespace Communities, Inc.), Series 2019-A-2, 2.875% 2049 | 445 | 450 |
| Fin. Auth., Single Family Mortgage Bonds (Mortgage-Backed Securities Program), Series 2019-A, 4.00% 2047 | 4,150 | 4,696 |
| Fin. Auth., Single Family Mortgage Bonds, Series 2015-A, AMT, 3.50% 2040 | 350 | 361 |
| | | 5,507 |
| Kansas 0.08% | | |
University of Kansas Hospital Auth., Health Facs. and Improvement Rev. Bonds
(University of Kansas Health System), Series 2019-B, 5.00% 2027 | 1,315 | 1,642 |
City of Wichita, Hospital Facs. Rev. Ref. and Improvement Bonds (Christi Health, Inc.), Series 2011-A,
5.00% 2020 (escrowed to maturity) | 2,170 | 2,239 |
| | | 3,881 |
| Kentucky 0.37% | | |
| Asset/Liability Commission, Project Notes, Federal Highway Trust Fund, Series 2014-A, 5.00% 2024 | 3,000 | 3,525 |
| Health Facs. Auth., Rev. Bonds (Catholic Health Initiatives), Series 2014-B, 2.70% 2039 (put 2021) | 1,500 | 1,538 |
Housing Corp., Housing Rev. Bonds (Jefferson Green Apartments Project), Series 2018,
2.20% 2022 (put 2021) | 1,470 | 1,486 |
| County of Owen, Water Facs. Rev. Ref. Bonds (Kentucky - American Water Company Project), Series 2019, 2.45% 2039 (put 2029) | 5,250 | 5,482 |
Property and Buildings Commission, Project No. 122, Commonwealth Rev. Ref. Bonds, Series 2020-C,
5.00% 2021 | 4,850 | 5,131 |
| | | 17,162 |
| Louisiana 1.27% | | |
| Aviation Board, General Airport Rev. Bonds (North Terminal Project), Series 2015-B, AMT, 5.00% 2025 | 1,600 | 1,875 |
| Aviation Board, General Airport Rev. Ref. Bonds, Series 2017-D-2, AMT, 5.00% 2029 | 1,000 | 1,216 |
Citizens Property Insurance Corp., Assessment Rev. Ref. Bonds, Series 2012,
Assured Guaranty Municipal insured, 5.00% 2024 (preref. 2022) | 1,000 | 1,094 |
Citizens Property Insurance Corp., Assessment Rev. Ref. Bonds, Series 2015,
Assured Guaranty Municipal insured, 5.00% 2022 | 1,250 | 1,365 |
| Citizens Property Insurance Corp., Assessment Rev. Ref. Bonds, Series 2016-A, 5.00% 2025 | 5,400 | 6,523 |
| Gasoline and Fuels Tax Rev. Ref. Bonds, Series 2012-A-1, 5.00% 2020 | 2,000 | 2,020 |
| Housing Corp., Single Family Mortgage Bonds (Home Ownership Program), Series 2019-A-1, 4.50% 2049 | 5,865 | 6,598 |
Parish of Jefferson, Sales Tax Rev. Ref. Bonds, Series 2019-B, Assured Guaranty Municipal insured,
5.00% 2027 | 2,600 | 3,309 |
| City of New Orleans, Water Rev. and Rev. Ref. Bonds, Series 2014, 5.00% 2027 | 1,000 | 1,197 |
| City of New Orleans, Water Rev. and Rev. Ref. Bonds, Series 2014, 5.00% 2028 | 900 | 1,074 |
Offshore Terminal Auth., Deepwater Port Rev. Bonds (Loop LLC Project), Series 2007-A,
1.65% 2027 (put 2023) | 6,020 | 6,101 |
Limited Term Tax-Exempt Bond Fund of America — Page 13 of 38
unaudited
Bonds, notes & other debt instruments (continued)
Louisiana (continued) | Principal amount
(000) | Value
(000) |
Offshore Terminal Auth., Deepwater Port Rev. Bonds (Loop LLC Project), Series 2013-A,
1.65% 2033 (put 2023) | $665 | $674 |
| Public Facs. Auth., Rev. Ref. Bonds (Ochsner Clinic Foundation Project), Series 2015, 5.00% 2021 | 445 | 466 |
City of Shreveport, Water and Sewer Rev. Bonds, Series 2019-B, Assured Guaranty Municipal insured,
3.00% 2022 | 195 | 205 |
City of Shreveport, Water and Sewer Rev. Bonds, Series 2019-B, Assured Guaranty Municipal insured,
4.00% 2023 | 175 | 193 |
City of Shreveport, Water and Sewer Rev. Bonds, Series 2019-B, Assured Guaranty Municipal insured,
4.00% 2025 | 255 | 295 |
City of Shreveport, Water and Sewer Rev. Bonds, Series 2019-B, Assured Guaranty Municipal insured,
5.00% 2024 | 135 | 159 |
City of Shreveport, Water and Sewer Rev. Bonds, Series 2019-B, Assured Guaranty Municipal insured,
5.00% 2026 | 240 | 297 |
Tobacco Settlement Fncg. Corp., Tobacco Settlement Asset-Backed Rev. Ref. Bonds, Series 2013-A,
5.00% 2020 | 5,430 | 5,487 |
Tobacco Settlement Fncg. Corp., Tobacco Settlement Asset-Backed Rev. Ref. Bonds, Series 2013-A,
5.00% 2021 | 5,915 | 6,192 |
Tobacco Settlement Fncg. Corp., Tobacco Settlement Asset-Backed Rev. Ref. Bonds, Series 2013-A,
5.00% 2022 | 7,235 | 7,826 |
Tobacco Settlement Fncg. Corp., Tobacco Settlement Asset-Backed Rev. Ref. Bonds, Series 2013-A,
5.00% 2023 | 2,160 | 2,411 |
Tobacco Settlement Fncg. Corp., Tobacco Settlement Asset-Backed Rev. Ref. Bonds, Series 2013-A,
5.50% 2029 | 2,015 | 2,019 |
| | | 58,596 |
| Maine 0.20% | | |
| Housing Auth., Mortgage Purchase Bonds, Series 2016-B-1, 3.50% 2046 | 3,015 | 3,142 |
| Housing Auth., Mortgage Purchase Bonds, Series 2016-C, 3.50% 2046 | 755 | 794 |
| Housing Auth., Mortgage Purchase Bonds, Series 2019-A, 4.00% 2049 | 3,375 | 3,718 |
| Housing Auth., Mortgage Purchase Rev. Ref. Bonds, Series 2013-B, 4.00% 2043 | 250 | 259 |
| Housing Auth., Mortgage Purchase Rev. Ref. Bonds, Series 2015-B, 3.50% 2040 | 510 | 530 |
| Housing Auth., Mortgage Purchase Rev. Ref. Bonds, Series 2015-E-1, AMT, 3.50% 2035 | 885 | 925 |
| | | 9,368 |
| Maryland 1.34% | | |
| County of Baltimore, Rev. Bonds (Riverwood Village, Inc. Fac.), Series 2020, 4.00% 2022 | 830 | 878 |
| County of Baltimore, Rev. Bonds (Riverwood Village, Inc. Fac.), Series 2020, 4.00% 2023 | 815 | 886 |
Community Dev. Administration, Dept. of Housing and Community Dev., Residential Rev. Bonds,
Series 2014-B, AMT, 3.25% 2044 | 430 | 443 |
Community Dev. Administration, Dept. of Housing and Community Dev., Residential Rev. Bonds,
Series 2014-C, 4.00% 2044 | 95 | 100 |
Community Dev. Administration, Dept. of Housing and Community Dev., Residential Rev. Bonds,
Series 2019-A, 4.25% 2049 | 6,885 | 7,670 |
Community Dev. Administration, Dept. of Housing and Community Dev., Residential Rev. Bonds,
Series 2019-C, 3.50% 2050 | 2,550 | 2,791 |
Econ. Dev. Corp., Rev. Ref. Bonds (Constellation Energy Group, Inc. Project), Series 2006-B,
2.55% 2025 (put 2020) | 2,365 | 2,377 |
Econ. Dev. Corp., Student Housing Rev. Ref. Bonds (Frostburg State University Project), Series 2013,
5.00% 2023 | 1,000 | 1,083 |
| G.O. Bonds, State and Local Facs. Loan of 2015, Series 2017-A-1, 5.00% 2022 | 5,905 | 6,421 |
| G.O. Rev. Ref. Bonds, State and Local Facs. Loan of 2017, Series 2017-C-1, 5.00% 2020 | 1,160 | 1,184 |
| Health and Higher Educational Facs. Auth., Rev. Bonds (Doctors Community Hospital Issue), Series 2010, 5.75% 2038 (preref. 2020) | 2,000 | 2,040 |
| Health and Higher Educational Facs. Auth., Rev. Ref. Bonds (MedStar Health Issue), Series 2015, 5.00% 2027 | 5,000 | 5,910 |
Limited Term Tax-Exempt Bond Fund of America — Page 14 of 38
unaudited
Bonds, notes & other debt instruments (continued)
Maryland (continued) | Principal amount
(000) | Value
(000) |
County of Montgomery, Housing Opportunities Commission, Program Rev. Bonds, Series 2019-A,
4.00% 2049 | $4,415 | $4,923 |
County of Montgomery, Housing Opportunities Commission, Single Family Housing Rev. Bonds,
Series 2017-A, 4.00% 2048 | 2,670 | 2,887 |
| Dept. of Transportation, Consolidated Transportation Bonds, Series 2013, 5.00% 2024 (preref. 2021) | 5,650 | 5,892 |
| Transportation Auth., Airport Parking Rev. Ref. Bonds (Baltimore/Washington International Thurgood Marshall Airport Projects), Series 2012-B, AMT, 5.00% 2020 | 8,150 | 8,175 |
| Transportation Auth., Airport Parking Rev. Ref. Bonds (Baltimore/Washington International Thurgood Marshall Airport Projects), Series 2012-B, AMT, 5.00% 2021 | 7,565 | 7,890 |
| | | 61,550 |
| Massachusetts 2.54% | | |
| Dev. Fin. Agcy., Rev. Bonds (Berkshire Health Systems Issue), Series 2012-G, 5.00% 2020 | 1,205 | 1,237 |
| Dev. Fin. Agcy., Rev. Bonds (Berkshire Health Systems Issue), Series 2012-G, 5.00% 2021 | 1,500 | 1,601 |
| Dev. Fin. Agcy., Rev. Bonds (Beth Israel Lahey Health Issue), Series 2019-K, 5.00% 2026 | 1,000 | 1,230 |
| Dev. Fin. Agcy., Rev. Bonds (Beth Israel Lahey Health Issue), Series 2019-K, 5.00% 2027 | 1,500 | 1,884 |
| Dev. Fin. Agcy., Rev. Bonds (Beth Israel Lahey Health Issue), Series 2019-K, 5.00% 2028 | 1,200 | 1,535 |
| Dev. Fin. Agcy., Rev. Bonds (Boston Medical Center Issue), Series 2012-C, 5.25% 2025 | 2,390 | 2,612 |
| Dev. Fin. Agcy., Rev. Bonds (CareGroup Obligated Group Issue), Series 2016-I, 5.00% 2025 | 2,500 | 3,000 |
| Dev. Fin. Agcy., Rev. Bonds (CareGroup Obligated Group Issue), Series 2016-I, 5.00% 2026 | 1,000 | 1,230 |
| Dev. Fin. Agcy., Rev. Bonds (Harvard University Issue), Series 2010-B-2, 5.25% 2034 (preref. 2021) | 1,855 | 1,936 |
| Dev. Fin. Agcy., Rev. Bonds (Mass General Brigham Issue), Series 2020-A-2, 5.00% 2023 | 6,725 | 7,655 |
| Dev. Fin. Agcy., Rev. Bonds (Partners HealthCare System Issue), Series 2012-L, 5.00% 2031 (preref. 2021) | 3,130 | 3,311 |
| Dev. Fin. Agcy., Rev. Bonds (Partners HealthCare System Issue), Series 2017-S-2, 5.00% 2038 (put 2025) | 5,000 | 5,964 |
| Dev. Fin. Agcy., Rev. Bonds (Partners HealthCare System Issue), Series 2017-S-4, 5.00% 2038 (put 2024) | 2,500 | 2,891 |
| Dev. Fin. Agcy., Rev. Bonds (UMass Memorial Health Care Obligated Group Issue), Series 2016-I, 5.00% 2024 | 2,000 | 2,335 |
| Dev. Fin. Agcy., Rev. Bonds (UMass Memorial Health Care Obligated Group Issue), Series 2016-I, 5.00% 2025 | 1,275 | 1,534 |
| Dev. Fin. Agcy., Rev. Bonds (UMass Memorial Health Care Obligated Group Issue), Series 2016-I, 5.00% 2026 | 1,150 | 1,420 |
| Dev. Fin. Agcy., Rev. Bonds (UMass Memorial Health Care Obligated Group Issue), Series 2016-I, 5.00% 2027 | 1,150 | 1,421 |
| Dev. Fin. Agcy., Rev. Ref. Bonds (Suffolk University Issue), Series 2017, 5.00% 2025 | 1,500 | 1,796 |
| Dev. Fin. Agcy., Rev. Ref. Bonds (Suffolk University Issue), Series 2019, 5.00% 2021 | 575 | 607 |
| Dev. Fin. Agcy., Rev. Ref. Bonds (Suffolk University Issue), Series 2019, 5.00% 2022 | 400 | 437 |
| Dev. Fin. Agcy., Rev. Ref. Bonds (Suffolk University Issue), Series 2019, 5.00% 2023 | 425 | 480 |
| Dev. Fin. Agcy., Rev. Ref. Bonds (Suffolk University Issue), Series 2019, 5.00% 2024 | 350 | 408 |
| Dev. Fin. Agcy., Rev. Ref. Bonds (Tufts Medical Center Issue), Series 2011-I, 6.875% 2041 (preref. 2021) | 1,395 | 1,471 |
| Dev. Fin. Agcy., Rev. Ref. Bonds (Tufts Medical Center Issue), Series 2011-I, 6.875% 2041 (preref. 2021) | 1,020 | 1,076 |
| Educational Fncg. Auth., Education Loan Rev. Bonds, Series 2012-J, AMT, 5.00% 2020 | 3,635 | 3,694 |
| Educational Fncg. Auth., Education Loan Rev. Bonds, Series 2014-I, AMT, 5.00% 2022 | 3,000 | 3,218 |
| Educational Fncg. Auth., Education Loan Rev. Bonds, Series 2014-I, AMT, 5.00% 2023 | 3,000 | 3,321 |
| Educational Fncg. Auth., Education Loan Rev. Bonds, Series 2014-I, AMT, 5.00% 2025 | 3,000 | 3,519 |
| Educational Fncg. Auth., Education Loan Rev. Bonds, Series 2016-J, AMT, 3.50% 2033 | 3,285 | 3,459 |
| Educational Fncg. Auth., Education Loan Rev. Bonds, Series 2016-J, AMT, 5.00% 2024 | 4,000 | 4,633 |
| Educational Fncg. Auth., Education Loan Rev. Bonds, Series 2017-A, AMT, 3.625% 2032 | 3,290 | 3,448 |
| Educational Fncg. Auth., Education Loan Rev. Bonds, Series 2017-A, AMT, 5.00% 2022 | 1,000 | 1,090 |
| Educational Fncg. Auth., Education Loan Rev. Bonds, Series 2017-A, AMT, 5.00% 2023 | 2,500 | 2,812 |
| Educational Fncg. Auth., Education Loan Rev. Bonds, Series 2019-B, AMT, 3.00% 2035 | 5,225 | 5,538 |
| Housing Fin. Agcy., Construction Loan Notes, Series 2017-B, 2.05% 2021 | 2,750 | 2,751 |
Housing Fin. Agcy., Multi Family Conduit Rev. Bonds (Chestnut Park Project), Series 2018-A,
2.40% 2023 (put 2021) | 2,070 | 2,111 |
| Housing Fin. Agcy., Single Family Housing Rev. Bonds, Series 167, 4.00% 2043 | 350 | 364 |
| Housing Fin. Agcy., Single Family Housing Rev. Bonds, Series 181, 4.00% 2044 | 965 | 1,022 |
| Housing Fin. Agcy., Single Family Housing Rev. Bonds, Series 183, 3.50% 2046 | 1,100 | 1,154 |
| Housing Fin. Agcy., Single Family Housing Rev. Bonds, Series 190, 4.00% 2048 | 8,485 | 9,166 |
| Housing Fin. Agcy., Single Family Housing Rev. Bonds, Series 2007, 4.00% 2049 | 1,345 | 1,488 |
| Housing Fin. Agcy., Single Family Housing Rev. Ref. Bonds, Series 171, 4.00% 2044 | 320 | 334 |
Limited Term Tax-Exempt Bond Fund of America — Page 15 of 38
unaudited
Bonds, notes & other debt instruments (continued)
Massachusetts (continued) | Principal amount
(000) | Value
(000) |
| Housing Fin. Agcy., Single Family Housing Rev. Ref. Bonds, Series 177, AMT, 4.00% 2039 | $1,510 | $1,594 |
| Housing Fin. Agcy., Single Family Housing Rev. Ref. Bonds, Series 188, AMT, 4.00% 2043 | 3,615 | 3,886 |
| Port Auth., Rev. Bonds, Series 2012-A, AMT, 5.00% 2021 | 305 | 322 |
| Port Auth., Rev. Bonds, Series 2017-A, AMT, 5.00% 2025 | 5,000 | 6,023 |
| Port Auth., Rev. Bonds, Series 2017-A, AMT, 5.00% 2026 | 2,510 | 3,107 |
| | | 117,125 |
| Michigan 2.99% | | |
| Building Auth., Rev. Ref. Bonds (Facs. Program), Series 2015-I, 5.00% 2023 | 3,000 | 3,388 |
City of Detroit, Water and Sewerage Dept., Sewage Disposal System Rev. Ref. Bonds, Series 2004-A,
Assured Guaranty Municipal Insured, 5.25% 2020 | 150 | 153 |
| Fin. Auth., Hospital Rev. and Rev. Ref. Bonds (Trinity Health Credit Group), Series 2017-A, 5.00% 2024 | 1,000 | 1,187 |
| Fin. Auth., Hospital Rev. and Rev. Ref. Bonds (Trinity Health Credit Group), Series 2017-A, 5.00% 2025 | 1,000 | 1,224 |
| Fin. Auth., Hospital Rev. and Rev. Ref. Bonds (Trinity Health Credit Group), Series 2017-A, 5.00% 2026 | 1,000 | 1,255 |
| Fin. Auth., Hospital Rev. Ref. Bonds (Beaumont Health Credit Group), Series 2015, 5.00% 2025 | 3,000 | 3,524 |
| Fin. Auth., Hospital Rev. Ref. Bonds (Henry Ford Health System), Series 2016, 5.00% 2027 | 5,095 | 6,353 |
Fin. Auth., Hospital Rev. Ref. Bonds (McLaren Health Care), Series 2015-D-2,
(1-month USD-LIBOR x 0.68 + 0.75%) 1.872% 2038 (put 2020)1 | 2,000 | 2,002 |
| Fin. Auth., Hospital Rev. Ref. Bonds (Oakwood Obligated Group), Series 2012, 5.00% 2022 | 2,500 | 2,771 |
| Fin. Auth., Local Government Loan Program Rev. Bonds (Detroit Water and Sewerage Dept., Sewage Disposal System Rev. and Rev. Ref. Local Project Bonds), Series 2014-C-3, Assured Guaranty Municipal insured, 5.00% 2022 | 5,000 | 5,482 |
| Fin. Auth., Local Government Loan Program Rev. Bonds (Detroit Water and Sewerage Dept., Sewage Disposal System Rev. and Rev. Ref. Local Project Bonds), Series 2014-C-3, Assured Guaranty Municipal insured, 5.00% 2023 | 1,215 | 1,380 |
| Fin. Auth., Local Government Loan Program Rev. Bonds (Detroit Water and Sewerage Dept., Sewage Disposal System Rev. and Rev. Ref. Local Project Bonds), Series 2014-C-5, National insured, 5.00% 2020 | 6,970 | 7,087 |
| Fin. Auth., Local Government Loan Program Rev. Bonds (Detroit Water and Sewerage Dept., Sewage Disposal System Rev. Ref. Local Project Bonds), Series 2015-C, 5.00% 2027 | 1,750 | 2,086 |
| Fin. Auth., Student Loan Rev. Ref. Bonds, Series 25-A, AMT, 5.00% 2020 | 1,750 | 1,797 |
| Fin. Auth., Student Loan Rev. Ref. Bonds, Series 25-A, AMT, 5.00% 2021 | 1,650 | 1,752 |
County of Genesee, Water Supply System Limited Tax G.O. Rev. Ref. Bonds, Series 2014, BAM insured,
5.00% 2022 | 515 | 568 |
County of Genesee, Water Supply System Limited Tax G.O. Rev. Ref. Bonds, Series 2014, BAM insured,
5.00% 2023 | 500 | 569 |
County of Genesee, Water Supply System Limited Tax G.O. Rev. Ref. Bonds, Series 2014, BAM insured,
5.00% 2024 | 850 | 982 |
| Great Lakes Water Auth., Water Supply System Rev. Ref. Bonds, Series 2016-C, 5.00% 2027 | 4,185 | 5,135 |
| Great Lakes Water Auth., Water Supply System Rev. Ref. Bonds, Series 2016-C, 5.00% 2028 | 2,000 | 2,441 |
| Great Lakes Water Auth., Water Supply System Rev. Ref. Bonds, Series 2016-C, 5.00% 2029 | 2,000 | 2,433 |
Hospital Fin. Auth., Hospital Rev. Ref. Bonds (Ascension Health Senior Credit Group), Series 2010-F-2,
1.90% 2047 (put 2021) | 1,850 | 1,868 |
| Hospital Fin. Auth., Hospital Rev. Ref. Bonds (Trinity Health Credit Group), Series 2008-C, 5.00% 2022 | 700 | 779 |
| Housing Dev. Auth., Single Family Mortgage Rev. Bonds, Series 2014-A, 4.00% 2044 | 750 | 789 |
| Housing Dev. Auth., Single Family Mortgage Rev. Bonds, Series 2016-A, 4.00% 2046 | 635 | 677 |
| Housing Dev. Auth., Single Family Mortgage Rev. Bonds, Series 2016-B, 3.50% 2047 | 14,040 | 14,897 |
| Housing Dev. Auth., Single Family Mortgage Rev. Bonds, Series 2017-B, 3.50% 2048 | 2,660 | 2,840 |
| Housing Dev. Auth., Single Family Mortgage Rev. Bonds, Series 2018-A, 4.00% 2048 | 4,090 | 4,451 |
| Housing Dev. Auth., Single Family Mortgage Rev. Bonds, Series 2018-C, 4.25% 2049 | 16,960 | 18,758 |
| Housing Dev. Auth., Single Family Mortgage Rev. Bonds, Series 2019-A, 4.25% 2049 | 7,735 | 8,636 |
| Board of Trustees of Michigan State University, Rev. Bonds, Series 2019-B, 5.00% 2031 | 2,460 | 3,202 |
| City of Saginaw, Hospital Fin. Auth., Hospital Rev. Ref. Bonds (Covenant Medical Center, Inc.), Series 2010-H, 5.00% 2020 | 2,400 | 2,437 |
Strategic Fund, Limited Obligation Rev. Bonds (Consumers Energy Co. Project), Series 2019, AMT,
1.80% 2049 (put 2024) | 4,290 | 4,367 |
Limited Term Tax-Exempt Bond Fund of America — Page 16 of 38
unaudited
Bonds, notes & other debt instruments (continued)
Michigan (continued) | Principal amount
(000) | Value
(000) |
County of Wayne, Airport Auth., Airport Rev. Ref. Bonds (Detroit Metropolitan Wayne County Airport),
Series 2011-A, AMT, 5.00% 2020 | $5,000 | $5,163 |
County of Wayne, Airport Auth., Airport Rev. Ref. Bonds (Detroit Metropolitan Wayne County Airport),
Series 2011-A, AMT, 5.00% 2021 | 10,240 | 10,954 |
County of Wayne, Airport Auth., Airport Rev. Ref. Bonds (Detroit Metropolitan Wayne County Airport),
Series 2015-F, AMT, 5.00% 2025 | 2,500 | 3,030 |
County of Wayne, Airport Auth., Airport Rev. Ref. Bonds (Detroit Metropolitan Wayne County Airport),
Series 2015-F, AMT, 5.00% 2026 | 1,000 | 1,205 |
| | | 137,622 |
| Minnesota 1.16% | | |
City of Brooklyn Center, Multi Family Housing Dev. Bonds (Unity Place Project), Series 2019,
1.95% 2021 (put 2020) | 1,350 | 1,354 |
| G.O. Bonds, Series 2017-A, 5.00% 2020 | 1,050 | 1,079 |
| G.O. Bonds, Trunk Highway Bonds, Series 2019-B, 5.00% 2020 | 2,980 | 3,041 |
| Housing Fin. Agcy., Residential Housing Fin. Bonds, Series 2012-D, 4.00% 2040 | 90 | 92 |
| Housing Fin. Agcy., Residential Housing Fin. Bonds, Series 2013-A, AMT, 3.00% 2031 | 395 | 405 |
| Housing Fin. Agcy., Residential Housing Fin. Bonds, Series 2014-B, 4.00% 2038 | 145 | 154 |
| Housing Fin. Agcy., Residential Housing Fin. Bonds, Series 2014-C, AMT, 4.00% 2045 | 1,545 | 1,644 |
| Housing Fin. Agcy., Residential Housing Fin. Bonds, Series 2015-A, AMT, 4.00% 2041 | 2,895 | 3,049 |
| Housing Fin. Agcy., Residential Housing Fin. Bonds, Series 2015-B, 3.50% 2046 | 2,645 | 2,801 |
| Housing Fin. Agcy., Residential Housing Fin. Bonds, Series 2015-E, AMT, 3.50% 2046 | 520 | 547 |
| Housing Fin. Agcy., Residential Housing Fin. Bonds, Series 2016-E, 4.00% 2047 | 870 | 926 |
| Housing Fin. Agcy., Residential Housing Fin. Bonds, Series 2017-E, 4.00% 2048 | 4,735 | 5,138 |
| Housing Fin. Agcy., Residential Housing Fin. Bonds, Series 2018-B, 4.00% 2048 | 2,800 | 3,055 |
| Housing Fin. Agcy., Residential Housing Fin. Bonds, Series 2018-E, 4.25% 2049 | 12,935 | 14,313 |
| Housing Fin. Agcy., Residential Housing Fin. Bonds, Series 2019-B, 4.25% 2049 | 4,865 | 5,439 |
| City of Minneapolis, Metropolitan Airports Commission, Airport Rev. and Rev. Ref. Bonds, Series 2019-B, AMT, 5.00% 2021 | 5,000 | 5,180 |
| Regents of the University of Minnesota, G.O. Bonds, Series 2011-D, 5.00% 2028 (preref. 2021) | 1,180 | 1,268 |
| Regents of the University of Minnesota, G.O. Rev. Ref. Bonds, Series 2017B, 5.00% 2021 | 3,640 | 3,914 |
| | | 53,399 |
| Mississippi 0.28% | | |
Dev. Bank, Special Obligation Bonds (Municipal Energy Agcy. of Mississippi Power Supply Project),
Series 2015-A, Assured Guaranty Municipal insured, 5.00% 2025 | 1,245 | 1,471 |
Dev. Bank, Special Obligation Bonds (Municipal Energy Agcy. of Mississippi Power Supply Project),
Series 2015-A, Assured Guaranty Municipal insured, 5.00% 2026 | 1,045 | 1,266 |
| Gaming Tax Rev. Bonds, Series 2019-A, 5.00% 2024 | 1,000 | 1,179 |
| Gaming Tax Rev. Ref. Bonds, Series 2015-E, 5.00% 2026 | 2,925 | 3,543 |
| Home Corp., Single Family Mortgage Rev. Bonds, Series 2017-C, AMT, 4.00% 2046 | 1,975 | 2,113 |
| Home Corp., Single Family Mortgage Rev. Bonds, Series 2019-A, 4.00% 2048 | 3,095 | 3,414 |
| | | 12,986 |
| Missouri 0.32% | | |
| Health and Educational Facs. Auth., Health Facs. Rev. Bonds (Saint Luke’s Health System, Inc.), Series 2016, 5.00% 2025 | 1,500 | 1,829 |
| Housing Dev. Commission, Single Family Mortgage Rev. Bonds (First Place Homeownership Loan Program), Series 2016-B, 3.50% 2041 | 3,085 | 3,244 |
| Housing Dev. Commission, Single Family Mortgage Rev. Bonds (First Place Homeownership Loan Program), Series 2017-B, 3.25% 2047 | 3,049 | 3,260 |
| Housing Dev. Commission, Single Family Mortgage Rev. Bonds (First Place Homeownership Loan Program), Series 2018-A, 4.25% 2049 | 1,635 | 1,807 |
Limited Term Tax-Exempt Bond Fund of America — Page 17 of 38
unaudited
Bonds, notes & other debt instruments (continued)
Missouri (continued) | Principal amount
(000) | Value
(000) |
| Housing Dev. Commission, Single Family Mortgage Rev. Bonds (First Place Homeownership Loan Program), Series 2019-A, 4.25% 2047 | $1,945 | $2,171 |
| Housing Dev. Commission, Single Family Mortgage Rev. Bonds (Special Homeownership Loan Program), Series 2015-B-2, 4.00% 2045 | 2,160 | 2,311 |
| | | 14,622 |
| Montana 0.14% | | |
| Board of Housing, Single Family Mortgage Bonds, Series 2015-B-2, AMT, 3.50% 2042 | 475 | 497 |
| Board of Housing, Single Family Mortgage Bonds, Series 2016-A-2, 3.50% 2044 | 1,305 | 1,380 |
| Board of Housing, Single Family Mortgage Bonds, Series 2019-A, 4.25% 2045 | 4,125 | 4,579 |
| | | 6,456 |
| Nebraska 0.66% | | |
| County of Douglas, Hospital Auth. No. 2 (Methodist Health System), Health Facs. Rev. Ref. Bonds, Series 2015, 5.00% 2026 | 1,155 | 1,384 |
| Investment Fin. Auth., Single Family Housing Rev. Bonds, Series 2013-A, 3.00% 2043 | 405 | 413 |
| Investment Fin. Auth., Single Family Housing Rev. Bonds, Series 2013-E, 3.00% 2043 | 40 | 40 |
| Investment Fin. Auth., Single Family Housing Rev. Bonds, Series 2014-A, 4.00% 2044 | 790 | 833 |
| Investment Fin. Auth., Single Family Housing Rev. Bonds, Series 2015-A, 3.50% 2045 | 2,120 | 2,227 |
| Investment Fin. Auth., Single Family Housing Rev. Bonds, Series 2015-C, 3.50% 2045 | 4,220 | 4,391 |
| Investment Fin. Auth., Single Family Housing Rev. Bonds, Series 2016-C, 3.50% 2046 | 2,470 | 2,617 |
| Investment Fin. Auth., Single Family Housing Rev. Bonds, Series 2016-C, 3.50% 2046 | 2,315 | 2,378 |
| Investment Fin. Auth., Single Family Housing Rev. Bonds, Series 2017-B, AMT, 3.50% 2040 | 4,510 | 4,785 |
| Investment Fin. Auth., Single Family Housing Rev. Bonds, Series 2018-A, 4.00% 2048 | 1,955 | 2,125 |
| Investment Fin. Auth., Single Family Housing Rev. Bonds, Series 2018-C, 4.00% 2048 | 3,595 | 3,929 |
| Investment Fin. Auth., Single Family Housing Rev. Bonds, Series 2019-B, AMT, 4.00% 2049 | 4,955 | 5,433 |
| | | 30,555 |
| Nevada 1.39% | | |
| Clark County School Dist., Limited Tax G.O. Building and Rev. Ref. Bonds, Series 2017-A, 5.00% 2026 | 2,460 | 3,051 |
| Clark County School Dist., Limited Tax G.O. Building and Rev. Ref. Bonds, Series 2017-C, 5.00% 2024 | 2,500 | 2,931 |
| Clark County School Dist., Limited Tax G.O. Building and Rev. Ref. Bonds, Series 2017-C, 5.00% 2027 | 3,045 | 3,841 |
Clark County School Dist., Limited Tax G.O. Building Bonds, Series 2018-A,
Assured Guaranty Municipal insured, 5.00% 2027 | 4,000 | 5,061 |
| Clark County School Dist., Limited Tax Various Purpose G.O. Bonds, Series 2016-F, 5.00% 2026 | 2,470 | 3,063 |
| County of Clark, Airport System Rev. Ref. Bonds, Series 2017-C, AMT, 5.00% 2021 | 3,500 | 3,699 |
County of Clark, Las Vegas-McCarran International Airport, Passenger Fac. Charge Rev. Ref. Bonds,
Series 2019-E, 5.00% 2029 | 5,000 | 6,617 |
County of Clark, Pollution Control Rev. Ref. Bonds (Southern California Edison Co.), Series 2010,
1.875% 2031 (put 2020) | 14,035 | 14,046 |
| County of Clark, Rev. Ref. Bonds (Jet Aviation Fuel Tax), Series 2013-A, AMT, 5.00% 2021 | 1,035 | 1,094 |
| County of Clark, Rev. Ref. Bonds (Jet Aviation Fuel Tax), Series 2013-A, AMT, 5.00% 2022 | 2,810 | 3,069 |
| County of Clark, Rev. Ref. Bonds (Jet Aviation Fuel Tax), Series 2013-A, AMT, 5.00% 2023 | 1,000 | 1,109 |
| County of Clark, Rev. Ref. Bonds (Jet Aviation Fuel Tax), Series 2013-A, AMT, 5.00% 2027 | 2,500 | 2,764 |
| City of Henderson, Local Improvement Dist. No. T-14 (Anthem), Local Improvement Bonds, Series 2017, 2.375% 2022 | 1,035 | 1,056 |
| City of Henderson, Local Improvement Dist. No. T-14 (Anthem), Local Improvement Bonds, Series 2017, 2.50% 2023 | 1,085 | 1,119 |
City of Henderson, Local Improvement Dist. No. T-17 (Madeira Canyon), Local Improvement Bonds,
Series 2017, 2.00% 2022 | 955 | 969 |
City of Henderson, Local Improvement Dist. No. T-17 (Madeira Canyon), Local Improvement Bonds,
Series 2017, 2.25% 2024 | 550 | 567 |
City of Henderson, Local Improvement Dist. No. T-17 (Madeira Canyon), Local Improvement Bonds,
Series 2017, 2.50% 2025 | 580 | 607 |
| Housing Division, Single Family Mortgage Rev. Bonds, Series 2019-A, 4.00% 2049 | 2,000 | 2,219 |
Limited Term Tax-Exempt Bond Fund of America — Page 18 of 38
unaudited
Bonds, notes & other debt instruments (continued)
Nevada (continued) | Principal amount
(000) | Value
(000) |
| City of Las Vegas, Redev. Agcy., Tax Increment Rev. Ref. Bonds, Series 2016, 5.00% 2025 | $2,185 | $2,595 |
| City of Las Vegas, Redev. Agcy., Tax Increment Rev. Ref. Bonds, Series 2016, 5.00% 2027 | 1,200 | 1,443 |
| City of North Las Vegas, Special Improvement Dist. No. 60 (Aliante), Local Improvement Rev. Ref. Bonds, Series 2016, 2.125% 2020 | 1,625 | 1,640 |
| County of Washoe, Gas and Water Facs. Rev. Ref. Bonds (Sierra Pacific Power Co. Projects), Series 2016-B, 3.00% 2036 (put 2022) | 1,500 | 1,563 |
| | | 64,123 |
| New Hampshire 0.13% | | |
| Health and Education Facs. Auth., Rev. Bonds (Elliot Hospital Issue), Series 2016, 5.00% 2024 | 1,250 | 1,460 |
| Health and Education Facs. Auth., Rev. Bonds (Elliot Hospital Issue), Series 2016, 5.00% 2025 | 1,250 | 1,501 |
| Health and Education Facs. Auth., Rev. Bonds (Elliot Hospital Issue), Series 2016, 5.00% 2026 | 1,250 | 1,536 |
| Health and Education Facs. Auth., Rev. Bonds (Elliot Hospital Issue), Series 2016, 5.00% 2027 | 1,250 | 1,522 |
| | | 6,019 |
| New Jersey 3.11% | | |
| Econ. Dev. Auth., Rev. Ref. Bonds (Provident Group - Montclair Properties LLC - Montclair State University Student Housing Project), Series 2017, Assured Guaranty Municipal insured, 5.00% 2023 | 1,000 | 1,121 |
| Econ. Dev. Auth., Rev. Ref. Bonds (Provident Group - Montclair Properties LLC - Montclair State University Student Housing Project), Series 2017, Assured Guaranty Municipal insured, 5.00% 2024 | 1,000 | 1,157 |
| Econ. Dev. Auth., Rev. Ref. Bonds (Provident Group - Montclair Properties LLC - Montclair State University Student Housing Project), Series 2017, Assured Guaranty Municipal insured, 5.00% 2026 | 1,000 | 1,219 |
| Econ. Dev. Auth., School Facs. Construction Bonds, Series 2017-DDD, 5.00% 2024 | 1,500 | 1,727 |
| Econ. Dev. Auth., School Facs. Construction Bonds, Series 2017-DDD, 5.00% 2025 | 1,000 | 1,177 |
| Econ. Dev. Auth., School Facs. Construction Bonds, Series 2017-DDD, 5.00% 2026 | 1,000 | 1,201 |
| Econ. Dev. Auth., School Facs. Construction Rev. Ref. Bonds, Series 2015-XX, 5.00% 2024 | 2,990 | 3,442 |
| Econ. Dev. Auth., School Facs. Construction Rev. Ref. Bonds, Series 2015-XX, 5.00% 2025 | 8,000 | 9,418 |
Econ. Dev. Auth., Transportation Project Sublease Rev. Ref. Bonds (New Jersey Transit Corp. Projects),
Series 2017-B, 5.00% 2026 | 4,800 | 5,806 |
| Educational Facs. Auth., Rev. and Rev. Ref. Bonds (Ramapo College of New Jersey Issue), Series 2017-A, Assured Guaranty Municipal insured, 5.00% 2026 | 1,375 | 1,699 |
| Educational Facs. Auth., Rev. and Rev. Ref. Bonds (Ramapo College of New Jersey Issue), Series 2017-A, Assured Guaranty Municipal insured, 5.00% 2027 | 1,000 | 1,259 |
Educational Facs. Auth., Rev. and Rev. Ref. Bonds (Stockton University Issue), Series 2016-A,
Assured Guaranty Municipal insured, 5.00% 2025 | 3,000 | 3,553 |
Educational Facs. Auth., Rev. and Rev. Ref. Bonds (Stockton University Issue), Series 2016-A,
Assured Guaranty Municipal insured, 5.00% 2026 | 2,885 | 3,492 |
| Health Care Facs. Fncg. Auth., Rev. Bonds (Princeton HealthCare System Issue), Series 2016-A, 5.00% 2025 | 1,340 | 1,620 |
| Health Care Facs. Fncg. Auth., Rev. Bonds (Princeton HealthCare System Issue), Series 2016-A, 5.00% 2027 | 1,250 | 1,550 |
Health Care Facs. Fncg. Auth., Rev. Bonds (St. Joseph’s Healthcare System Obligated Group Issue),
Series 2016, 5.00% 2022 | 1,500 | 1,625 |
Health Care Facs. Fncg. Auth., Rev. Ref. Bonds (Hackensack Meridian Health Obligated Group Issue),
Series 2017-A, 5.00% 2025 | 1,000 | 1,210 |
Health Care Facs. Fncg. Auth., Rev. Ref. Bonds (Hackensack Meridian Health Obligated Group Issue),
Series 2017-A, 5.00% 2026 | 900 | 1,119 |
Health Care Facs. Fncg. Auth., Rev. Ref. Bonds (Hackensack Meridian Health Obligated Group Issue),
Series 2017-A, 5.00% 2027 | 1,150 | 1,462 |
| Higher Education Student Assistance Auth., Student Loan Rev. Bonds, Series 2012-1-A, AMT, 5.00% 2021 | 4,000 | 4,281 |
| Higher Education Student Assistance Auth., Student Loan Rev. Bonds, Series 2016-1-A, AMT, 5.00% 2026 | 1,905 | 2,280 |
Housing and Mortgage Fin. Agcy., Multi Family Conduit Rev. Bonds (Georgia King Village Project),
Series 2018-E, 2.45% 2021 (put 2020) | 2,815 | 2,839 |
Housing and Mortgage Fin. Agcy., Multi Family Conduit Rev. Bonds (Pilgram Baptist Village I & II),
Series 2019-E, 1.50% 2022 (put 2021) | 4,175 | 4,198 |
| Housing and Mortgage Fin. Agcy., Multi Family Conduit Rev. Bonds (Riverside Village Family Apartments Phase 1 Project), Series 2019-F, 1.35% 2022 | 2,215 | 2,228 |
Limited Term Tax-Exempt Bond Fund of America — Page 19 of 38
unaudited
Bonds, notes & other debt instruments (continued)
New Jersey (continued) | Principal amount
(000) | Value
(000) |
| Housing and Mortgage Fin. Agcy., Single Family Housing Rev. Bonds, Series 2018-A, 4.50% 2048 | $8,815 | $9,854 |
| Housing and Mortgage Fin. Agcy., Single Family Housing Rev. Bonds, Series 2019-C, 4.75% 2050 | 7,000 | 7,935 |
| South Jersey Transportation Auth., Transportation System Rev. Ref. Bonds, Series 2012, 5.00% 2020 | 1,500 | 1,542 |
| South Jersey Transportation Auth., Transportation System Rev. Ref. Bonds, Series 2012, 5.00% 2022 | 5,200 | 5,721 |
| South Jersey Transportation Auth., Transportation System Rev. Ref. Bonds, Series 2012-A, 5.00% 2023 | 1,500 | 1,650 |
| South Jersey Transportation Auth., Transportation System Rev. Ref. Bonds, Series 2012-A, 5.00% 2024 | 2,500 | 2,749 |
| Tobacco Settlement Fncg. Corp., Tobacco Settlement Bonds, Series 2018-A, 5.00% 2022 | 2,440 | 2,643 |
| Tobacco Settlement Fncg. Corp., Tobacco Settlement Bonds, Series 2018-A, 5.00% 2026 | 3,000 | 3,613 |
| Tobacco Settlement Fncg. Corp., Tobacco Settlement Bonds, Series 2018-A, 5.00% 2027 | 3,140 | 3,859 |
| Tobacco Settlement Fncg. Corp., Tobacco Settlement Bonds, Series 2018-A, 5.00% 2028 | 3,000 | 3,752 |
| Tobacco Settlement Fncg. Corp., Tobacco Settlement Bonds, Series 2018-A, 5.00% 2029 | 3,450 | 4,292 |
| Transit Corp., Grant Anticipation Notes (Federal Transit Administration Section 5307 Urbanized Area Formula Funds), Series 2014-A, 5.00% 2020 | 4,000 | 4,096 |
Transportation Trust Fund Auth., Federal Highway Reimbursement Rev. Ref. Bonds, Series 2018-A,
5.00% 2028 | 3,000 | 3,578 |
| Transportation Trust Fund Auth., Transportation System Bonds, Series 2011-A, 5.50% 2041 (preref. 2021) | 8,825 | 9,378 |
| Transportation Trust Fund Auth., Transportation System Bonds, Series 2019-A, 5.00% 2028 | 2,000 | 2,488 |
| Transportation Trust Fund Auth., Transportation System Rev. Ref. Bonds, Series 2006-A, 5.50% 2021 | 4,070 | 4,391 |
| Transportation Trust Fund Auth., Transportation System Rev. Ref. Bonds, Series 2015-AA, 5.00% 2023 | 1,000 | 1,120 |
Turnpike Auth., Turnpike Rev. Bonds, Series 2017-C-5,
(1-month USD-LIBOR x 0.70 + 0.46%) 1.706% 2028 (put 2021)1 | 10,000 | 10,013 |
| | | 143,357 |
| New Mexico 0.50% | | |
| City of Farmington, Pollution Control Rev. Ref. Bonds (Southern California Edison Co. Four Corners Project), Series 2005-B, 1.875% 2029 (put 2020) | 480 | 480 |
| City of Farmington, Pollution Control Rev. Ref. Bonds (Southern California Edison Co. Four Corners Project), Series 2011, 1.875% 2029 (put 2020) | 3,000 | 3,002 |
Hospital Equipment Loan Council, Hospital System Rev. Bonds (Presbyterian Healthcare Services),
Series 2019-A, 5.00% 2029 | 1,195 | 1,563 |
Hospital Equipment Loan Council, Hospital System Rev. Bonds (Presbyterian Healthcare Services),
Series 2019-A, 5.00% 2030 | 1,110 | 1,440 |
| Mortgage Fin. Auth., Single Family Mortgage Program Bonds, Series 2016-A-2, Class I, AMT, 3.50% 2046 | 2,965 | 3,135 |
| Mortgage Fin. Auth., Single Family Mortgage Program Bonds, Series 2017-B-2, Class I, AMT, 3.75% 2048 | 1,355 | 1,458 |
| Mortgage Fin. Auth., Single Family Mortgage Program Bonds, Series 2019-A-1, Class I, 4.25% 2050 | 6,950 | 7,724 |
| Mortgage Fin. Auth., Single Family Mortgage Program Bonds, Series 2019-C-1, Class I, 4.00% 2050 | 3,765 | 4,174 |
| | | 22,976 |
| New York 5.77% | | |
| Dormitory Auth., State Personal Income Tax Rev. Bonds (General Purpose), Series 2017-A, 5.00% 2022 | 4,415 | 4,781 |
| Dormitory Auth., State Personal Income Tax Rev. Bonds (General Purpose), Series 2017-B, 5.00% 2030 | 9,040 | 11,484 |
| Dormitory Auth., State Personal Income Tax Rev. Bonds (General Purpose), Series 2018-A, 5.00% 2030 | 12,000 | 15,658 |
| Energy Research and Dev. Auth., Pollution Control Rev. Bonds (New York State Electric & Gas Corp. Project), Series 2004-A, AMT, 2.375% 2027 (put 2020) | 3,000 | 3,008 |
| County of Erie, Industrial Dev. Agcy., School Fac. Rev. Bonds (City School Dist. of the City of Buffalo Project), Series 2011-A, 5.00% 2020 | 4,780 | 4,829 |
| County of Erie, Industrial Dev. Agcy., School Fac. Rev. Ref. Bonds (City School Dist. of the City of Buffalo Project), Series 2012-A, 5.00% 2020 | 2,770 | 2,798 |
| Town of Hempstead, Local Dev. Corp., Rev. Bonds (Hofstra University Project), Series 2011, 5.00% 2025 | 1,670 | 1,761 |
Housing Fin. Agcy., Affordable Housing Rev. Green Bonds (Climate Bond Certified), Series 2019-P,
1.55% 2023 | 5,330 | 5,350 |
| Housing Fin. Agcy., Affordable Housing Rev. Green Bonds, Series 2018-H, 2.75% 2022 | 5,000 | 5,007 |
Long Island Power Auth., Electric System General Rev. Bonds, Series 2014-C,
(1-month USD-LIBOR x 0.70 + 0.75%) 1.996% 2033 (put 2023)1 | 7,700 | 7,765 |
| Metropolitan Transportation Auth., Hudson Rail Yards Trust Obligations, Series 2016-A, 5.00% 2046 | 2,180 | 2,184 |
Limited Term Tax-Exempt Bond Fund of America — Page 20 of 38
unaudited
Bonds, notes & other debt instruments (continued)
New York (continued) | Principal amount
(000) | Value
(000) |
Metropolitan Transportation Auth., Transportation Rev. Bonds, Series 2003-B, FGIC-National insured,
5.25% 2020 | $5,500 | $5,682 |
| Metropolitan Transportation Auth., Transportation Rev. Bonds, Series 2012-E, 5.00% 2020 | 3,250 | 3,351 |
| Metropolitan Transportation Auth., Transportation Rev. Bonds, Series 2014-C, 5.00% 2024 | 5,000 | 5,935 |
Metropolitan Transportation Auth., Transportation Rev. Bonds, Series 2014-D-2,
(SIFMA Municipal Swap Index + 0.45%) 1.39% 2044 (put 2022)1 | 7,750 | 7,755 |
| Metropolitan Transportation Auth., Transportation Rev. Bonds, Series 2015-A-1, 5.00% 2027 | 3,150 | 3,766 |
Metropolitan Transportation Auth., Transportation Rev. Bonds, Series 2015-A-2,
(SIFMA Municipal Swap Index + 0.58%) 1.52% 2039 (put 2020)1 | 5,500 | 5,501 |
Metropolitan Transportation Auth., Transportation Rev. Ref. Bonds, Series 2002-D-2A,
Assured Guaranty Municipal insured, (1-month USD-LIBOR x 0.69 + 0.68%) 1.908% 2032 (put 2021)1 | 1,400 | 1,404 |
| Mortgage Agcy., Homeowner Mortgage Rev. Bonds, Series 191, AMT, 3.50% 2034 | 150 | 156 |
| Mortgage Agcy., Homeowner Mortgage Rev. Bonds, Series 195, 4.00% 2046 | 2,525 | 2,684 |
| Mortgage Agcy., Homeowner Mortgage Rev. Bonds, Series 197, 3.50% 2044 | 6,965 | 7,347 |
| Mortgage Agcy., Homeowner Mortgage Rev. Bonds, Series 200, 3.50% 2045 | 3,670 | 3,853 |
| Mortgage Agcy., Homeowner Mortgage Rev. Bonds, Series 203, 3.50% 2047 | 5,900 | 6,255 |
| Mortgage Agcy., Homeowner Mortgage Rev. Bonds, Series 206, AMT, 4.00% 2037 | 2,415 | 2,585 |
| Mortgage Agcy., Homeowner Mortgage Rev. Bonds, Series 217, 4.00% 2049 | 11,605 | 12,826 |
| Mortgage Agcy., Homeowner Mortgage Rev. Bonds, Series 48, 2.625% 2041 | 160 | 163 |
| Mortgage Agcy., Homeowner Mortgage Rev. Bonds, Series 52, AMT, 3.50% 2030 | 1,290 | 1,347 |
| New York City G.O. Bonds, Fiscal 1994, Series 1994-A-4, 5.00% 2021 | 2,420 | 2,570 |
| New York City G.O. Bonds, Fiscal 2014, Series 2014-G, 5.00% 2023 | 1,500 | 1,713 |
| New York City G.O. Bonds, Fiscal 2014, Series 2014-I-1, 5.00% 2021 | 1,445 | 1,509 |
| New York City G.O. Bonds, Fiscal 2015, Series 2015-C, 5.00% 2028 | 1,000 | 1,191 |
| New York City G.O. Bonds, Fiscal 2017, Series 2017-C, 5.00% 2028 | 4,300 | 5,428 |
| New York City G.O. Bonds, Fiscal 2020, Series 2019-B-1, 5.00% 2022 | 1,140 | 1,264 |
| New York City Housing Dev. Corp., Multi Family Housing Rev. Bonds (Sustainable Neighborhood Bonds), Series 2017-G-2-A, 2.00% 2057 (put 2021) | 6,250 | 6,278 |
| New York City Housing Dev. Corp., Multi Family Housing Rev. Bonds (Sustainable Neighborhood Bonds), Series 2018-L-2, 2.75% 2050 (put 2023) | 5,150 | 5,382 |
| New York City Housing Dev. Corp., Multi Family Housing Rev. Bonds (Sustainable Neighborhood Bonds), Series 2019-E-2, 1.75% 2059 (put 2023) | 3,500 | 3,539 |
| New York City Transitional Fin. Auth., Future Tax Secured Bonds, Fiscal 2012, Series 2012-E-1, 5.00% 2023 | 1,200 | 1,300 |
| New York City Transitional Fin. Auth., Future Tax Secured Bonds, Fiscal 2015, Series 2015-C, 5.00% 2027 | 5,000 | 6,026 |
New York City Transitional Fin. Auth., Future Tax Secured Multi-Modal Rev. Ref. Bonds, Fiscal 2003,
Series 2003-B, 5.00% 2022 | 1,750 | 1,822 |
New York City Transitional Fin. Auth., Future Tax Secured Rev. Ref. Bonds, Fiscal 2003, Series 2003-A-1,
5.00% 2022 | 1,305 | 1,400 |
| New York City Transitional Fin. Auth., Recovery Bonds, Fiscal 2020, Series 2002-1, 5.00% 2021 | 13,445 | 14,410 |
Niagara Frontier Transportation Auth., Airport Rev. Ref. Bonds (Buffalo Niagara International Airport),
Series 2014-A, AMT, 4.00% 2022 | 5,185 | 5,491 |
Niagara Frontier Transportation Auth., Airport Rev. Ref. Bonds (Buffalo Niagara International Airport),
Series 2014-A, AMT, 5.00% 2020 | 2,500 | 2,516 |
Niagara Frontier Transportation Auth., Airport Rev. Ref. Bonds (Buffalo Niagara International Airport),
Series 2014-A, AMT, 5.00% 2023 | 2,195 | 2,447 |
| Port Auth., Consolidated Bonds, Series 207, AMT, 5.00% 2022 | 1,000 | 1,102 |
| Port Auth., Consolidated Rev. Ref. Bonds, Series 167, AMT, 5.00% 2020 | 4,790 | 4,911 |
| Port Auth., Consolidated Rev. Ref. Bonds, Series 169, AMT, 5.00% 2020 | 5,000 | 5,143 |
| Port Auth., Consolidated Rev. Ref. Bonds, Series 186, AMT, 5.00% 2023 | 5,000 | 5,705 |
| Public Housing Capital Fund Rev. Trust I, Trust Certificates, Series 2012, 4.50% 20222 | 1,078 | 1,093 |
Transportation Dev. Corp., Special Fac. Rev. Ref. Bonds (Terminal One Group Association, LP Project),
Series 2015, AMT, 5.00% 2021 | 1,250 | 1,292 |
Transportation Dev. Corp., Special Fac. Rev. Ref. Bonds (Terminal One Group Association, LP Project),
Series 2015, AMT, 5.00% 2022 | 2,000 | 2,134 |
Limited Term Tax-Exempt Bond Fund of America — Page 21 of 38
unaudited
Bonds, notes & other debt instruments (continued)
New York (continued) | Principal amount
(000) | Value
(000) |
Transportation Dev. Corp., Special Fac. Rev. Ref. Bonds (Terminal One Group Association, LP Project),
Series 2015, AMT, 5.00% 2023 | $1,045 | $1,150 |
| Transportation Dev. Corp., Special Facs. Rev. Bonds (Delta Air Lines, Inc. LaGuardia Airport Terminals C & D Redev. Project), Series 2018, AMT, 5.00% 2025 | 10,000 | 11,667 |
| City of Troy, Capital Resource Corp., Rev. Ref. Bonds (Rensselaer Polytechnic Institute Project), Series 2020-A, 5.00% 2027 | 1,250 | 1,534 |
| City of Troy, Capital Resource Corp., Rev. Ref. Bonds (Rensselaer Polytechnic Institute Project), Series 2020-A, 5.00% 2030 | 1,220 | 1,571 |
| Urban Dev. Corp., State Personal Income Tax Rev. Bonds (General Purpose), Series 2013-A-1, 5.00% 2020 | 5,525 | 5,551 |
| Urban Dev. Corp., State Personal Income Tax Rev. Bonds (General Purpose), Series 2013-A-2, 5.00% 2020 | 7,290 | 7,324 |
| Urban Dev. Corp., State Personal Income Tax Rev. Bonds (General Purpose), Series 2013-C, 5.00% 2024 | 6,725 | 7,582 |
| Urban Dev. Corp., State Personal Income Tax Rev. Bonds (General Purpose), Series 2014-A, 5.00% 2020 | 1,000 | 1,005 |
| Urban Dev. Corp., State Personal Income Tax Rev. Bonds (General Purpose), Series 2014-A, 5.00% 2029 | 1,500 | 1,741 |
| Urban Dev. Corp., State Personal Income Tax Rev. Bonds (General Purpose), Series 2016-A, 5.00% 2028 | 4,510 | 5,565 |
| | | 265,591 |
| North Carolina 1.43% | | |
| G.O. Public Improvement Bonds (Connect NC), Series 2019-B, 5.00% 2021 | 13,835 | 14,595 |
| G.O. Rev. Ref. Bonds, Series 2013-D, 4.00% 2021 | 2,355 | 2,453 |
| G.O. Rev. Ref. Bonds, Series 2013-E, 5.00% 2020 | 14,110 | 14,252 |
| Grant Anticipation Rev. Vehicle Bonds, Series 2019, 5.00% 2023 | 6,370 | 7,160 |
| Housing Fin. Agcy., Home Ownership Rev. Bonds, Series 40, 4.25% 2047 | 975 | 1,077 |
| Housing Fin. Agcy., Home Ownership Rev. Bonds, Series 41, 4.00% 2050 | 3,085 | 3,409 |
| Housing Fin. Agcy., Home Ownership Rev. Ref. Bonds, Series 37-A, AMT, 3.50% 2039 | 3,075 | 3,221 |
| Housing Fin. Agcy., Home Ownership Rev. Ref. Bonds, Series 38-B, 4.00% 2047 | 2,535 | 2,736 |
| Housing Fin. Agcy., Home Ownership Rev. Ref. Bonds, Series 39-B, 4.00% 2048 | 2,730 | 2,982 |
| Raleigh-Durham Airport Auth., Airport Rev. Ref. Bonds, Series 2020-A, AMT, 5.00% 2021 | 1,080 | 1,130 |
| Raleigh-Durham Airport Auth., Airport Rev. Ref. Bonds, Series 2020-A, AMT, 5.00% 2022 | 1,540 | 1,672 |
| Raleigh-Durham Airport Auth., Airport Rev. Ref. Bonds, Series 2020-A, AMT, 5.00% 2023 | 1,700 | 1,909 |
| Raleigh-Durham Airport Auth., Airport Rev. Ref. Bonds, Series 2020-A, AMT, 5.00% 2030 | 850 | 1,124 |
| Raleigh-Durham Airport Auth., Airport Rev. Ref. Bonds, Series 2020-A, AMT, 5.00% 2031 | 1,370 | 1,798 |
University of North Carolina at Chapel Hill, General Rev. Bonds, Series 2012-B,
(1-month USD-LIBOR x 0.67 + 0.40%) 1.593% 2041 (put 2022)1 | 4,850 | 4,859 |
| University of North Carolina at Greensboro, General Rev. Ref. Bonds, Series 2011, 5.00% 2036 (preref. 2021) | 1,420 | 1,488 |
| | | 65,865 |
| North Dakota 0.54% | | |
County of Burleigh, Health Care Rev. Bonds (St. Alexius Medical Center Project), Series 2014-A,
5.00% 2023 (preref. 2021) | 1,435 | 1,516 |
| Housing Fin. Agcy., Homeownership Rev. Bonds (Home Mortgage Fin. Program), Series 2016-D, 3.50% 2046 | 4,940 | 5,264 |
| Housing Fin. Agcy., Housing Fin. Program Bonds (Home Mortgage Fin. Program), Series 2012-A, 3.75% 2042 | 500 | 517 |
| Housing Fin. Agcy., Housing Fin. Program Bonds (Home Mortgage Fin. Program), Series 2014-A, 4.00% 2034 | 310 | 326 |
| Housing Fin. Agcy., Housing Fin. Program Bonds (Home Mortgage Fin. Program), Series 2015-A, 4.00% 2038 | 445 | 468 |
| Housing Fin. Agcy., Housing Fin. Program Bonds (Home Mortgage Fin. Program), Series 2015-B, 4.00% 2036 | 345 | 365 |
| Housing Fin. Agcy., Housing Fin. Program Bonds (Home Mortgage Fin. Program), Series 2015-D, 4.00% 2046 | 4,030 | 4,281 |
Housing Fin. Agcy., Housing Fin. Program Bonds (Home Mortgage Fin. Program), Series 2016-B, AMT,
4.00% 2047 | 965 | 1,032 |
| Housing Fin. Agcy., Housing Fin. Program Bonds (Home Mortgage Fin. Program), Series 2017-D, 4.00% 2048 | 5,455 | 5,904 |
| Housing Fin. Agcy., Housing Fin. Program Bonds (Home Mortgage Fin. Program), Series 2017-F, 4.00% 2048 | 865 | 939 |
| Housing Fin. Agcy., Housing Fin. Program Bonds (Home Mortgage Fin. Program), Series 2019-A, 4.25% 2049 | 2,150 | 2,387 |
| Housing Fin. Agcy., Housing Fin. Program Bonds (Home Mortgage Fin. Program), Series 2019-F, 3.75% 2050 | 1,670 | 1,852 |
| | | 24,851 |
Limited Term Tax-Exempt Bond Fund of America — Page 22 of 38
unaudited
Bonds, notes & other debt instruments (continued)
Ohio 2.39% | Principal amount
(000) | Value
(000) |
Air Quality Dev. Auth., Air Quality Rev. Ref. Bonds (American Electric Co. Project), Series 2005-A, AMT,
2.10% 2029 (put 2024) | $7,500 | $7,642 |
| County of Allen, Hospital Facs. Rev. Bonds (Mercy Health), Series 2017-B, 5.00% 2047 (put 2022) | 9,425 | 10,245 |
| County of Allen, Hospital Facs. Rev. Ref. and Improvement Bonds (Catholic Health Partners), Series 2012-A, 5.00% 2022 | 3,300 | 3,584 |
American Municipal Power, Inc., Combined Hydroelectric Project Rev. Bonds, Series 2018-A,
2.25% 2048 (put 2021) | 2,300 | 2,322 |
City of Cleveland, Airport System Rev. Bonds, Series 2016-A, Assured Guaranty Municipal insured,
5.00% 2026 | 1,850 | 2,197 |
City of Cleveland, Airport System Rev. Ref. Bonds, Series 2011-A, Assured Guaranty Municipal insured,
5.00% 2021 | 2,345 | 2,433 |
| County of Cuyahoga, Hospital Rev. Bonds (MetroHealth System), Series 2017, 5.00% 2025 | 950 | 1,097 |
| County of Cuyahoga, Hospital Rev. Bonds (MetroHealth System), Series 2017, 5.00% 2026 | 1,000 | 1,182 |
| County of Cuyahoga, Hospital Rev. Bonds (MetroHealth System), Series 2017, 5.00% 2027 | 1,500 | 1,807 |
| County of Hamilton, Healthcare Facs. Rev. Bonds (Christ Hospital Project), Series 2012, 5.00% 2020 | 2,360 | 2,390 |
| County of Hamilton, Healthcare Facs. Rev. Bonds (Christ Hospital Project), Series 2012, 5.00% 2021 | 1,000 | 1,051 |
Housing Fin. Agcy., Multi Family Housing Rev. Bonds (Neilan Park Apartments Program), Series 2019,
1.75% 2022 (put 2021) | 1,210 | 1,220 |
| Housing Fin. Agcy., Residential Mortgage Rev. Bonds (Mortgage-Backed Securities Program), Series 2016-D, 4.00% 2047 | 3,790 | 4,038 |
| Housing Fin. Agcy., Residential Mortgage Rev. Bonds (Mortgage-Backed Securities Program), Series 2016-K, 3.50% 2046 | 3,130 | 3,319 |
| Housing Fin. Agcy., Residential Mortgage Rev. Bonds (Mortgage-Backed Securities Program), Series 2017-D, 4.00% 2048 | 7,505 | 8,088 |
| Housing Fin. Agcy., Residential Mortgage Rev. Bonds (Mortgage-Backed Securities Program), Series 2019-A, 4.50% 2049 | 3,145 | 3,529 |
| Housing Fin. Agcy., Residential Mortgage Rev. Bonds (Mortgage-Backed Securities Program), Series 2020-A, 3.75% 2050 | 5,030 | 5,644 |
| Housing Fin. Agcy., Residential Mortgage Rev. Bonds, Series 2017-B, AMT, 4.50% 2047 | 1,935 | 2,099 |
| Housing Fin. Agcy., Single Family Mortgage Rev. Bonds, Series 2010-1, 5.00% 2028 | 5 | 5 |
| Kent State University, Rev. General Receipts Bonds, Series 2016, 4.00% 2024 | 5,000 | 5,626 |
| Major New State Infrastructure Project Rev. Bonds, Series 2019-1, 5.00% 2028 | 6,300 | 8,293 |
| Major New State Infrastructure Project Rev. Bonds, Series 2019-1, 5.00% 2029 | 2,825 | 3,787 |
| Private Activity Bonds (Portsmouth Bypass Project), Series 2015, AMT, Assured Guaranty Municipal insured, 5.00% 2024 | 1,360 | 1,589 |
| Private Activity Bonds (Portsmouth Bypass Project), Series 2015, AMT, Assured Guaranty Municipal insured, 5.00% 2023 | 1,295 | 1,470 |
| Private Activity Bonds (Portsmouth Bypass Project), Series 2015, AMT, Assured Guaranty Municipal insured, 5.00% 2023 | 1,000 | 1,118 |
| Private Activity Bonds (Portsmouth Bypass Project), Series 2015, AMT, Assured Guaranty Municipal insured, 5.00% 2026 | 850 | 1,007 |
| Private Activity Bonds (Portsmouth Bypass Project), Series 2015, AMT, Assured Guaranty Municipal insured, 5.00% 2027 | 500 | 590 |
| Public Facs. Commission, Higher Education G.O. Bonds, Series 2015-C, 5.00% 2028 | 9,000 | 10,831 |
| Turnpike and Infrastructure Commission, Rev. Ref. Bonds, Series 1998-A, National insured, 5.50% 2026 | 6,500 | 8,079 |
| Water Dev. Auth., Solid Waste Disposal Rev. Bonds (Waste Management, Inc. Project), Series 2002, AMT, 3.25% 2022 | 3,500 | 3,685 |
| | | 109,967 |
| Oklahoma 0.03% | | |
Trustees of the Tulsa Airports Improvement Trust, General Airport Rev. Bonds, Series 2015-A, AMT,
BAM insured, 5.00% 2021 | 1,355 | 1,422 |
Limited Term Tax-Exempt Bond Fund of America — Page 23 of 38
unaudited
Bonds, notes & other debt instruments (continued)
Oregon 0.33% | Principal amount
(000) | Value
(000) |
| G.O. Bonds (Veteran’s Welfare Bonds Series 94), Series 2014-H, 4.00% 2044 | $610 | $630 |
| Housing and Community Services Dept., Housing Dev. Rev. Bonds (SHA RAD Group II Apartment Projects), Series 2019-P, 1.45% 2023 (put 2022) | 1,400 | 1,409 |
Housing and Community Services Dept., Mortgage Rev. Bonds (Single Family Mortgage Program),
Series 2015-A, 3.50% 2036 | 3,100 | 3,255 |
Housing and Community Services Dept., Mortgage Rev. Bonds (Single Family Mortgage Program),
Series 2016-A, 4.00% 2047 | 655 | 699 |
Housing and Community Services Dept., Mortgage Rev. Bonds (Single Family Mortgage Program),
Series 2017-A, 4.00% 2047 | 5,865 | 6,342 |
Housing and Community Services Dept., Mortgage Rev. Bonds (Single Family Mortgage Program),
Series 2018-A, 4.50% 2049 | 1,835 | 2,025 |
| Port of Portland, Portland International Airport Rev. Bonds, Series 2010-20-C, AMT, 5.00% 2021 | 1,000 | 1,017 |
| | | 15,377 |
| Pennsylvania 4.71% | | |
| County of Allegheny, Airport Auth., Airport Rev. Bonds, Series 2012-A-1, AMT, 5.00% 2024 | 1,025 | 1,100 |
| County of Allegheny, Hospital Dev. Auth., UPMC Rev. Bonds, Series 2019-A, 5.00% 2022 | 1,000 | 1,099 |
| County of Chester, G.O. Bonds, Series 2011, 5.00% 2032 (preref. 2021) | 2,505 | 2,690 |
| Delaware River Joint Toll Bridge Commission, Bridge System Rev. Bonds, Series 2019-A, 5.00% 2029 | 1,000 | 1,332 |
| Delaware River Port Auth., Port Dist. Project Rev. Ref. Bonds, Series 2012, 5.00% 2022 | 1,300 | 1,395 |
| Delaware River Port Auth., Rev. Ref. Bonds (Port Dist. Project), Series 2012, 5.00% 2021 | 3,180 | 3,292 |
| East Hempfield Township, Industrial Dev. Auth., Rev. and Rev. Ref. Bonds (Willow Valley Communities Project), Series 2016, 5.00% 2021 | 650 | 697 |
| East Hempfield Township, Industrial Dev. Auth., Rev. and Rev. Ref. Bonds (Willow Valley Communities Project), Series 2016, 5.00% 2022 | 500 | 554 |
| Econ. Dev. Fncg. Auth., Private Activity Rev. Bonds (The Pennsylvania Rapid Bridge Replacement Project), Series 2015, AMT, 5.00% 2024 | 9,180 | 10,453 |
| Econ. Dev. Fncg. Auth., Private Activity Rev. Bonds (The Pennsylvania Rapid Bridge Replacement Project), Series 2015, AMT, 5.00% 2024 | 4,900 | 5,654 |
| Econ. Dev. Fncg. Auth., Private Activity Rev. Bonds (The Pennsylvania Rapid Bridge Replacement Project), Series 2015, AMT, 5.00% 2025 | 5,985 | 6,993 |
| Econ. Dev. Fncg. Auth., Private Activity Rev. Bonds (The Pennsylvania Rapid Bridge Replacement Project), Series 2015, AMT, 5.00% 2026 | 2,315 | 2,772 |
| Econ. Dev. Fncg. Auth., Private Activity Rev. Bonds (The Pennsylvania Rapid Bridge Replacement Project), Series 2015, AMT, 5.00% 2026 | 1,775 | 2,120 |
Econ. Dev. Fncg. Auth., Solid Waste Disposal Rev. Bonds,
(Waste Management, Inc. Project), Series 2017-A, AMT, 1.70% 2037 (put 2020) | 4,000 | 4,009 |
| Fncg. Auth., Rev. Bonds (Tobacco Master Settlement Payment), Series 2018, 5.00% 2020 | 1,000 | 1,013 |
| Fncg. Auth., Rev. Bonds (Tobacco Master Settlement Payment), Series 2018, 5.00% 2021 | 1,625 | 1,706 |
| Fncg. Auth., Rev. Bonds (Tobacco Master Settlement Payment), Series 2018, 5.00% 2023 | 2,250 | 2,524 |
| General Auth. of Southcentral Pennsylvania, Rev. Bonds (Wellspan Health Obligated Group), Series 2019-B, (SIFMA Municipal Swap Index + 0.60%) 1.54% 2049 (put 2024)1 | 4,520 | 4,520 |
Higher Educational Facs. Auth., Health System Rev. Bonds (University of Pennsylvania Health System),
Series 2019, 5.00% 2027 | 1,200 | 1,525 |
Higher Educational Facs. Auth., Health System Rev. Bonds (University of Pennsylvania Health System),
Series 2019, 5.00% 2028 | 1,300 | 1,685 |
| Housing Fin. Agcy., Single Family Mortgage Rev. Bonds, Series 2015-117-A, AMT, 3.50% 2040 | 295 | 308 |
| Housing Fin. Agcy., Single Family Mortgage Rev. Bonds, Series 2015-118-A, AMT, 3.50% 2040 | 3,430 | 3,545 |
| Housing Fin. Agcy., Single Family Mortgage Rev. Bonds, Series 2016-119, 3.50% 2041 | 460 | 480 |
| Housing Fin. Agcy., Single Family Mortgage Rev. Bonds, Series 2016-120, 3.50% 2046 | 4,805 | 5,039 |
| Housing Fin. Agcy., Single Family Mortgage Rev. Bonds, Series 2016-121, 3.50% 2046 | 7,210 | 7,577 |
| Housing Fin. Agcy., Single Family Mortgage Rev. Bonds, Series 2017-122, 4.00% 2046 | 6,950 | 7,445 |
| Housing Fin. Agcy., Single Family Mortgage Rev. Bonds, Series 2017-123-A, AMT, 4.00% 2039 | 3,320 | 3,504 |
| Housing Fin. Agcy., Single Family Mortgage Rev. Bonds, Series 2019-128-A, AMT, 4.75% 2033 | 8,390 | 9,265 |
Limited Term Tax-Exempt Bond Fund of America — Page 24 of 38
unaudited
Bonds, notes & other debt instruments (continued)
Pennsylvania (continued) | Principal amount
(000) | Value
(000) |
| County of Lehigh, General Purpose Auth., Hospital Rev. Bonds (Lehigh Valley Health Network), Series 2019-A, 5.00% 2025 | $1,000 | $1,203 |
| County of Lehigh, General Purpose Auth., Hospital Rev. Bonds (Lehigh Valley Health Network), Series 2019-A, 5.00% 2026 | 1,920 | 2,368 |
County of Luzerne, Industrial Dev. Auth., Rev. Ref. Bonds (Pennsylvania-American Water Co. Project),
Series 2019, 2.45% 2039 (put 2029) | 4,500 | 4,694 |
County of Montgomery, Higher Education and Health Auth., Hospital Rev. Bonds
(Abington Memorial Hospital Obligated Group), Series 2012-A, 5.00% 2031 (preref. 2022) | 1,900 | 2,077 |
County of Montgomery, Higher Education and Health Auth., Rev. Bonds, Series 2018-A,
1.66% 2051 (put 2023)1 | 2,800 | 2,800 |
County of Montgomery, Industrial Dev. Auth., Health Systems Rev. Bonds
(Albert Einstein Healthcare Network Issue), Series 2015-A, 5.00% 2021 | 2,000 | 2,066 |
County of Montgomery, Industrial Dev. Auth., Health Systems Rev. Bonds
(Albert Einstein Healthcare Network Issue), Series 2015-A, 5.25% 2026 | 1,000 | 1,167 |
| County of Montgomery, Industrial Dev. Auth., Pollution Control Rev. Ref. Bonds (PECO Energy Co. Project), Series 1994-B, 2.55% 2029 (Put 2020) | 1,025 | 1,030 |
| County of Montgomery, Industrial Dev. Auth., Pollution Control Rev. Ref. Bonds (PECO Energy Co. Project), Series 1999-A, 2.50% 2030 (put 2020) | 3,000 | 3,007 |
| County of Montgomery, Industrial Dev. Auth., Pollution Control Rev. Ref. Bonds (PECO Energy Co. Project), Series 2001-A, AMT, 2.70% 2034 (put 2020) | 6,900 | 6,917 |
County of Montgomery, Industrial Dev. Auth., Retirement Communities Rev. Ref. Bonds
(ACTS Retirement-Life Communities, Inc. Obligated Group), Series 2012, 5.00% 2023 | 2,400 | 2,599 |
County of Montgomery, Industrial Dev. Auth., Retirement Communities Rev. Ref. Bonds
(ACTS Retirement-Life Communities, Inc. Obligated Group), Series 2012, 5.00% 2024 | 1,000 | 1,084 |
County of Northampton, General Purpose Auth., Hospital Rev. Bonds
(St. Luke’s University Health Network Project), Series 2018-B,
(1-month USD-LIBOR x 0.70 + 1.04%) 2.286% 2048 (put 2022)1 | 2,075 | 2,094 |
| City of Philadelphia, Airport Rev. and Rev. Ref. Bonds, Series 2017-B, AMT, 5.00% 2022 | 1,300 | 1,421 |
| City of Philadelphia, Airport Rev. and Rev. Ref. Bonds, Series 2017-B, AMT, 5.00% 2023 | 1,100 | 1,242 |
| City of Philadelphia, Airport Rev. and Rev. Ref. Bonds, Series 2017-B, AMT, 5.00% 2025 | 1,700 | 2,036 |
| City of Philadelphia, Airport Rev. and Rev. Ref. Bonds, Series 2017-B, AMT, 5.00% 2026 | 2,950 | 3,617 |
City of Philadelphia, Hospitals and Higher Education Facs. Auth., Hospital Rev. Bonds
(Temple University Health System Obligated Group), Series 2017, 5.00% 2023 | 1,000 | 1,109 |
City of Philadelphia, Hospitals and Higher Education Facs. Auth., Hospital Rev. Bonds
(Temple University Health System Obligated Group), Series 2017, 5.00% 2024 | 2,000 | 2,276 |
City of Philadelphia, Hospitals and Higher Education Facs. Auth., Hospital Rev. Bonds
(Temple University Health System Obligated Group), Series 2017, 5.00% 2025 | 2,000 | 2,329 |
| City of Philadelphia, Industrial Dev. Auth., Rev. Bonds (Temple University), Series 2016-1, 5.00% 2028 | 1,000 | 1,184 |
| Philadelphia School Dist., G.O. Bonds, Series 2016-F, 5.00% 2024 | 5,000 | 5,834 |
| Philadelphia School Dist., G.O. Bonds, Series 2016-F, 5.00% 2025 | 3,000 | 3,605 |
| Philadelphia School Dist., G.O. Bonds, Series 2019-A, National insured, 5.00% 2025 | 1,200 | 1,442 |
| Philadelphia School Dist., G.O. Bonds, Series 2019-A, National insured, 5.00% 2026 | 2,000 | 2,453 |
| Philadelphia School Dist., G.O. Green Bonds, Series 2019-B, 5.00% 2028 | 3,740 | 4,742 |
| Philadelphia School Dist., G.O. Rev. Ref. Bonds, Series 2020, 5.00% 2021 | 2,195 | 2,297 |
City of Pittsburgh, Urban Redev. Auth., Rev. Bonds (Crawford Square Apartments Project), Series 2018,
2.25% 2020 (put 2020) | 3,240 | 3,242 |
Public School Building Auth., School Lease Rev. Bonds (Philadelphia School Dist. Project), Series 2012,
5.00% 2021 | 3,000 | 3,130 |
Public School Building Auth., School Lease Rev. Bonds (Philadelphia School Dist. Project), Series 2012,
5.00% 2022 | 2,250 | 2,431 |
| Saint Mary Hospital Auth., Hospital Rev. and Rev. Ref. Bonds (Trinity Health Credit Group), Series 2019-PA, 5.00% 2029 | 1,000 | 1,305 |
| Susquehanna Area Regional Airport Auth., Airport System Rev. Bonds, Series 2012-A, AMT, 5.00% 2021 | 2,840 | 2,928 |
| Susquehanna Area Regional Airport Auth., Airport System Rev. Bonds, Series 2012-A, AMT, 5.00% 2022 | 5,355 | 5,696 |
| Transportation Auth., Rev. Ref. Bonds, Series 2017, 5.00% 2028 | 1,475 | 1,883 |
Limited Term Tax-Exempt Bond Fund of America — Page 25 of 38
unaudited
Bonds, notes & other debt instruments (continued)
Pennsylvania (continued) | Principal amount
(000) | Value
(000) |
| Turnpike Commission, Turnpike Rev. Bonds, Series 2011-E, 5.00% 2026 (preref. 2021) | $1,805 | $1,940 |
| Turnpike Commission, Turnpike Rev. Bonds, Series 2011-E, 5.00% 2030 (preref. 2021) | 1,130 | 1,214 |
Turnpike Commission, Turnpike Rev. Bonds, Series 2014-B-1,
(SIFMA Municipal Swap Index + 0.98%) 1.92% 20211 | 8,775 | 8,858 |
| Turnpike Commission, Turnpike Rev. Bonds, Series 2016, 5.00% 2022 | 5,000 | 5,443 |
| Turnpike Commission, Turnpike Rev. Bonds, Series 2016-A-1, 5.00% 2027 | 1,060 | 1,307 |
| Turnpike Commission, Turnpike Rev. Bonds, Series 2017-A-1, 5.00% 2028 | 1,500 | 1,908 |
| Turnpike Commission, Turnpike Rev. Ref. Bonds, Series 2019, 5.00% 2030 | 1,250 | 1,609 |
County of York, Industrial Dev. Auth., Pollution Control Rev. Ref. Bonds (Philadelphia Electric Co. Project),
Series 1993-A, 2.55% 2036 (put 2020) | 10,700 | 10,758 |
| | | 216,641 |
| Puerto Rico 0.09% | | |
| Industrial, Tourist, Educational, Medical and Environmental Control Facs. Fncg. Auth., Hospital Rev. and Rev. Ref. Bonds (Hospital Auxilio Mutuo Obligated Group Project), Series 2011-A, 5.00% 2020 | 3,845 | 3,889 |
| Rhode Island 0.62% | | |
| Commerce Corp., Grant Anticipation Rev. Ref. Bonds (Dept. of Transportation), Series 2016-A, 5.00% 2022 | 1,000 | 1,094 |
| Commerce Corp., Grant Anticipation Rev. Ref. Bonds (Dept. of Transportation), Series 2016-A, 5.00% 2023 | 2,500 | 2,831 |
| Health and Educational Building Corp., Hospital Fncg. Rev. Ref. Bonds (Lifespan Obligated Group Issue), Series 2016, 5.00% 2023 | 2,000 | 2,236 |
| Health and Educational Building Corp., Hospital Fncg. Rev. Ref. Bonds (Lifespan Obligated Group Issue), Series 2016, 5.00% 2024 | 2,350 | 2,704 |
| Health and Educational Building Corp., Providence Public Schools Rev. Bond Fncg. Program, Rev. Ref. Bonds (Providence Public Buildings Auth. Issue), Series 2015, Assured Guaranty Municipal insured, 5.00% 2026 | 2,000 | 2,378 |
| Housing and Mortgage Fin. Corp., Homeownership Opportunity Bonds, Series 66-A-1, 4.00% 2033 | 635 | 662 |
| Housing and Mortgage Fin. Corp., Homeownership Opportunity Bonds, Series 66-A-2, 4.00% 2032 | 420 | 432 |
| Housing and Mortgage Fin. Corp., Homeownership Opportunity Bonds, Series 68-C, AMT, 3.50% 2039 | 2,510 | 2,627 |
| Student Loan Auth., Student Loan Program Rev. Bonds, Series 2014-A, AMT, 5.00% 2020 | 1,250 | 1,289 |
| Student Loan Auth., Student Loan Program Rev. Bonds, Series 2014-A, AMT, 5.00% 2021 | 1,400 | 1,495 |
| Student Loan Auth., Student Loan Program Rev. Bonds, Series 2015-A, AMT, 3.50% 2025 | 3,000 | 3,158 |
| Student Loan Auth., Student Loan Program Rev. Bonds, Series 2015-A, AMT, 3.625% 2026 | 1,000 | 1,052 |
| Student Loan Auth., Student Loan Program Rev. Bonds, Series 2017-A, AMT, 4.00% 2025 | 2,005 | 2,236 |
| Student Loan Auth., Student Loan Program Rev. Bonds, Series 2017-A, AMT, 4.00% 2026 | 4,000 | 4,437 |
| | | 28,631 |
| South Carolina 0.99% | | |
County of Charleston, G.O. Capital Improvement Transportation Sales Tax Bonds, Series 2011,
5.00% 2024 (preref. 2021) | 1,255 | 1,345 |
| City of Columbia, Waterworks and Sewer System Rev. Bonds, Series 2019-A, 5.00% 2027 | 450 | 570 |
| City of Columbia, Waterworks and Sewer System Rev. Bonds, Series 2019-A, 5.00% 2029 | 500 | 663 |
| Housing Fin. and Dev. Auth., Mortgage Rev. Bonds, Series 2016-B-2, AMT, 4.00% 2043 | 1,535 | 1,637 |
| Housing Fin. and Dev. Auth., Mortgage Rev. Bonds, Series 2017-A, 4.00% 2047 | 2,710 | 2,898 |
| Housing Fin. and Dev. Auth., Mortgage Rev. Bonds, Series 2017-B, 4.00% 2047 | 1,670 | 1,800 |
| Housing Fin. and Dev. Auth., Mortgage Rev. Bonds, Series 2018-A, 4.50% 2048 | 2,980 | 3,296 |
| Housing Fin. and Dev. Auth., Mortgage Rev. Ref. Bonds, Series 2016-A, 4.00% 2036 | 1,630 | 1,756 |
| Public Service Auth., Rev. Obligations (Santee Cooper), Series 2012-A, 5.00% 2021 | 515 | 551 |
| Public Service Auth., Rev. Obligations (Santee Cooper), Series 2012-D, 5.00% 2026 | 2,650 | 2,882 |
| Public Service Auth., Rev. Obligations (Santee Cooper), Series 2012-D, 5.00% 2026 (preref. 2022) | 2,350 | 2,569 |
| Public Service Auth., Rev. Obligations (Santee Cooper), Series 2012-D, 5.00% 2028 | 3,225 | 3,496 |
| Public Service Auth., Rev. Obligations (Santee Cooper), Series 2012-D, 5.00% 2028 (preref. 2022) | 3,080 | 3,368 |
| Public Service Auth., Rev. Obligations (Santee Cooper), Series 2014-C, 5.00% 2022 | 4,250 | 4,712 |
| Public Service Auth., Rev. Obligations (Santee Cooper), Series 2015-C, 5.00% 2021 | 4,430 | 4,743 |
| Public Service Auth., Rev. Obligations (Santee Cooper), Series 2015-C, 5.00% 2022 | 1,000 | 1,109 |
Limited Term Tax-Exempt Bond Fund of America — Page 26 of 38
unaudited
Bonds, notes & other debt instruments (continued)
South Carolina (continued) | Principal amount
(000) | Value
(000) |
| Public Service Auth., Rev. Obligations (Santee Cooper), Series 2016-A, 5.00% 2028 | $2,455 | $2,986 |
| County of Richland, Environmental Improvement Rev. Ref. Bonds, Series 2014-A, AMT, 3.875% 2023 | 4,900 | 5,246 |
| | | 45,627 |
| South Dakota 0.43% | | |
| Housing Dev. Auth., Homeownership Mortgage Bonds, Series 2013-A, AMT, 3.00% 2030 | 310 | 317 |
| Housing Dev. Auth., Homeownership Mortgage Bonds, Series 2013-E, AMT, 4.00% 2044 | 310 | 324 |
| Housing Dev. Auth., Homeownership Mortgage Bonds, Series 2014-E, 4.00% 2044 | 205 | 216 |
| Housing Dev. Auth., Homeownership Mortgage Bonds, Series 2015-D, 4.00% 2045 | 745 | 792 |
| Housing Dev. Auth., Homeownership Mortgage Bonds, Series 2016-B, 3.50% 2046 | 900 | 949 |
| Housing Dev. Auth., Homeownership Mortgage Bonds, Series 2016-D, 3.50% 2046 | 8,775 | 9,276 |
| Housing Dev. Auth., Homeownership Mortgage Bonds, Series 2018-B, 4.50% 2048 | 3,160 | 3,533 |
| Housing Dev. Auth., Homeownership Mortgage Bonds, Series 2019-B, 4.00% 2049 | 2,185 | 2,409 |
| Housing Dev. Auth., Homeownership Mortgage Rev. Ref. Bonds, Series 2012-D, AMT, 4.00% 2029 | 440 | 452 |
| Housing Dev. Auth., Multi Family Rev. Bonds (Meadowland Apartments), Series 2019, 1.54% 2022 (put 2021) | 1,500 | 1,505 |
| | | 19,773 |
| Tennessee 0.65% | | |
Town of Greeneville, Health and Educational Facs. Board, Multi Family Housing Rev. Bonds
(People RD Portfolio Project), Series 2019, 1.45% 2022 (put 2021) | 1,505 | 1,511 |
| Housing Dev. Agcy., Homeownership Program Bonds, Series 2015-A, 3.50% 2045 | 505 | 536 |
| Housing Dev. Agcy., Homeownership Program Rev. Ref. Bonds, Series 2011-1-A, AMT, 4.50% 2031 | 45 | 46 |
| Housing Dev. Agcy., Homeownership Program Rev. Ref. Bonds, Series 2012-1-A, AMT, 4.50% 2038 | 185 | 192 |
| Housing Dev. Agcy., Residential Fin. Program Bonds, Series 2013-1-C, 3.00% 2038 | 945 | 971 |
| Housing Dev. Agcy., Residential Fin. Program Bonds, Series 2013-2-A, AMT, 4.00% 2043 | 580 | 607 |
| Housing Dev. Agcy., Residential Fin. Program Bonds, Series 2014-2-A, AMT, 4.00% 2045 | 210 | 222 |
| Housing Dev. Agcy., Residential Fin. Program Bonds, Series 2014-2-C, 4.00% 2045 | 395 | 418 |
| Housing Dev. Agcy., Residential Fin. Program Bonds, Series 2015-2-A, 3.75% 2050 | 3,505 | 3,908 |
| Housing Dev. Agcy., Residential Fin. Program Bonds, Series 2015-2-A, AMT, 4.00% 2046 | 535 | 570 |
| Housing Dev. Agcy., Residential Fin. Program Bonds, Series 2016-1-A, AMT, 3.50% 2047 | 1,265 | 1,336 |
| Housing Dev. Agcy., Residential Fin. Program Bonds, Series 2016-1-B, 3.50% 2047 | 145 | 154 |
| Housing Dev. Agcy., Residential Fin. Program Bonds, Series 2017-1, 4.00% 2042 | 2,700 | 2,915 |
| Housing Dev. Agcy., Residential Fin. Program Bonds, Series 2017-2A, AMT, 4.00% 2042 | 2,780 | 2,990 |
| Housing Dev. Agcy., Residential Fin. Program Bonds, Series 2017-2-B, 4.00% 2042 | 2,060 | 2,227 |
| Housing Dev. Agcy., Residential Fin. Program Bonds, Series 2019-1, 4.25% 2050 | 2,980 | 3,319 |
| County of Knox, Health, Educational and Housing Fac. Board, Collateralized Multi Family Housing Rev. Bonds (Clear Springs Apartments Project), Series 2019, 1.80% 2022 (put 2021) | 725 | 731 |
| County of Knox, Health, Educational and Housing Fac. Board, Hospital Rev. Ref. Bonds (Covenant Health), Series 2012-A, 5.00% 2022 | 3,320 | 3,559 |
| County of Knox, Health, Educational and Housing Fac. Board, Hospital Rev. Ref. Bonds (Covenant Health), Series 2012-A, 5.00% 2023 | 1,000 | 1,108 |
| City of Lewisburg, Industrial Dev. Board, Multi Family Housing Bonds (Lewisburg Summit Apartments Project), Series 2019, 1.55% 2022 (put 2022) | 870 | 878 |
| Tennessee Energy Acquisition Corp., Gas Project Rev. Bonds, Series 2006-C, 5.00% 2021 | 1,580 | 1,640 |
| | | 29,838 |
| Texas 11.42% | | |
| Abilene Independent School Dist., Unlimited Tax School Building Bonds, Series 2019, 5.00% 2025 | 2,000 | 2,399 |
| Alamo Community College Dist., Limited Tax and Rev. Ref. Bonds, Series 2017, 5.00% 2028 | 8,625 | 10,975 |
Aldine Independent School Dist., Unlimited Tax School Building and Rev. Ref. Bonds, Series 2013,
5.00% 2020 | 1,495 | 1,497 |
| Arlington Higher Education Fin. Corp., Education Rev. Bonds (KIPP Texas, Inc.), Series 2019, 5.00% 2027 | 1,310 | 1,653 |
Arlington Higher Education Fin. Corp., Education Rev. Bonds (Riverwalk Education Foundation, Inc.),
Series 2019, 5.00% 2027 | 500 | 629 |
Limited Term Tax-Exempt Bond Fund of America — Page 27 of 38
unaudited
Bonds, notes & other debt instruments (continued)
Texas (continued) | Principal amount
(000) | Value
(000) |
Arlington Higher Education Fin. Corp., Education Rev. Bonds (Riverwalk Education Foundation, Inc.),
Series 2019, 5.00% 2030 | $850 | $1,105 |
Arlington Higher Education Fin. Corp., Education Rev. Bonds (Riverwalk Education Foundation, Inc.),
Series 2019, 5.00% 2031 | 630 | 816 |
| Arlington Higher Education Fin. Corp., Education Rev. Bonds (Uplift Education), Series 2016-A, 2.75% 2026 | 790 | 812 |
| Arlington Higher Education Fin. Corp., Education Rev. Bonds (Uplift Education), Series 2019-A, 4.00% 2033 | 585 | 673 |
| Arlington Higher Education Fin. Corp., Education Rev. Bonds (Uplift Education), Series 2019-A, 4.00% 2034 | 605 | 694 |
| Austin Convention Enterprises, Convention Center Hotel Rev. Ref. Bonds, Series 2017-A, 5.00% 2026 | 1,200 | 1,431 |
| City of Austin, Water and Wastewater System Rev. Ref. Bonds, Series 2015-A, 5.00% 2030 | 2,960 | 3,583 |
| City of Austin, Water and Wastewater System Rev. Ref. Bonds, Series 2017, 5.00% 2026 | 1,625 | 2,038 |
County of Bexar, Combination Tax and Rev. Certificates of Obligation, Series 2013-B,
5.00% 2025 (preref. 2023) | 4,710 | 5,358 |
County of Bexar, Combination Tax and Rev. Certificates of Obligation, Series 2013-B,
5.00% 2043 (preref. 2023) | 1,500 | 1,707 |
| County of Bexar, Hospital Dist., Certificates of Obligation, Series 2020, 2.00% 2022 | 1,150 | 1,176 |
| County of Bexar, Hospital Dist., Certificates of Obligation, Series 2020, 5.00% 2023 | 710 | 796 |
| County of Bexar, Hospital Dist., Limited Tax Rev. Ref. Bonds, Series 2019, 5.00% 2025 | 1,260 | 1,508 |
| County of Bexar, Hospital Dist., Limited Tax Rev. Ref. Bonds, Series 2019, 5.00% 2026 | 4,455 | 5,482 |
| County of Bexar, Hospital Dist., Limited Tax Rev. Ref. Bonds, Series 2019, 5.00% 2031 | 2,000 | 2,537 |
| County of Bexar, Hospital Dist., Limited Tax Rev. Ref. Bonds, Series 2020, 5.00% 2022 | 1,000 | 1,083 |
| County of Bexar, Hospital Dist., Limited Tax Rev. Ref. Bonds, Series 2020, 5.00% 2023 | 900 | 1,009 |
| Birdville Independent School Dist., Unlimited Tax School Building Bonds, Series 2020, 5.00% 2023 | 2,385 | 2,667 |
| Boerne Independent School Dist., Unlimited Tax Rev. Ref. Bonds, Series 2019, 5.00% 2029 | 1,305 | 1,719 |
Boerne Public Fac. Corp., Housing Rev. Bonds (LIV at Boerne Senior Apartments), Series 2018,
2.75% 2022 (put 2021) | 1,205 | 1,239 |
| Brazosport Independent School Dist., Unlimited Tax School Building Bonds, Series 2019, 5.00% 2022 | 1,760 | 1,907 |
| Brazosport Independent School Dist., Unlimited Tax School Building Bonds, Series 2019, 5.00% 2025 | 6,500 | 7,777 |
| Brazosport Independent School Dist., Unlimited Tax School Building Bonds, Series 2019, 5.00% 2030 | 2,650 | 3,491 |
| City of Brownsville, Utilities System Rev. Ref. Bonds, Series 2015, 5.00% 2021 | 1,500 | 1,593 |
| Canyon Independent School Dist., Unlimited Tax School Building Bonds, Series 2019, 5.00% 2024 | 1,390 | 1,613 |
| Canyon Independent School Dist., Unlimited Tax School Building Bonds, Series 2019, 5.00% 2025 | 1,875 | 2,244 |
| Canyon Independent School Dist., Unlimited Tax School Building Bonds, Series 2019, 5.00% 2026 | 3,940 | 4,856 |
| Canyon Independent School Dist., Unlimited Tax School Building Bonds, Series 2019, 5.00% 2027 | 2,145 | 2,707 |
Capital Area Housing Fin. Corp., Multi Family Housing Rev. Bonds
(Mission Trail at El Camino Real Apartments), Series 2019, 2.10% 2037 (put 2022) | 2,995 | 3,037 |
| Carroll Independent School Dist., Unlimited Tax Rev. Ref. Bonds, Series 2019, 5.00% 2026 | 1,000 | 1,233 |
| Central Texas Regional Mobility Auth., Rev. Ref. Bonds, Series 2015-B, 5.00% 2045 (put 2021) | 1,900 | 1,929 |
| Central Texas Regional Mobility Auth., Rev. Ref. Bonds, Series 2016, 5.00% 2024 | 1,000 | 1,148 |
| Central Texas Regional Mobility Auth., Rev. Ref. Bonds, Series 2016, 5.00% 2025 | 1,000 | 1,185 |
| Central Texas Regional Mobility Auth., Rev. Ref. Bonds, Series 2016, 5.00% 2026 | 1,500 | 1,830 |
| Clear Creek Independent School Dist., Unlimited Tax School Building Bonds, Series 2018, 5.00% 2027 | 3,000 | 3,798 |
| Clifton Higher Education Fin. Corp., Education Rev. Bonds (Idea Public Schools), Series 2018, 5.00% 2025 | 1,490 | 1,801 |
| Clifton Higher Education Fin. Corp., Education Rev. Bonds (Idea Public Schools), Series 2019, 5.00% 2026 | 3,800 | 4,707 |
| Clifton Higher Education Fin. Corp., Education Rev. Bonds (Idea Public Schools), Series 2019, 5.00% 2028 | 2,535 | 3,265 |
| Conroe Independent School Dist., Unlimited Rev. Ref. Bonds, Series 2019, 5.00% 2022 | 1,660 | 1,798 |
| Corpus Christi Independent School Dist., Unlimited Tax School Building and Rev. Ref. Bonds, Series 2019, 5.00% 2027 | 1,000 | 1,281 |
| Crowley Independent School Dist., Unlimited Tax School Building Bonds, Series 2019, 5.00% 2031 | 785 | 1,014 |
| Cypress-Fairbanks Independent School Dist., Unlimited Tax Rev. Ref. Bonds, Series 2016, 5.00% 2025 | 2,125 | 2,553 |
| Cypress-Fairbanks Independent School Dist., Unlimited Tax Rev. Ref. Bonds, Series 2019, 5.00% 2024 | 3,100 | 3,604 |
| Cypress-Fairbanks Independent School Dist., Unlimited Tax School Building and Rev. Ref. Bonds, Series 2016, 5.00% 2021 | 1,585 | 1,653 |
Cypress-Fairbanks Independent School Dist., Unlimited Tax School Building Bonds, Series 2015-B-2,
2.125% 2040 (put 2021) | 3,000 | 3,053 |
Limited Term Tax-Exempt Bond Fund of America — Page 28 of 38
unaudited
Bonds, notes & other debt instruments (continued)
Texas (continued) | Principal amount
(000) | Value
(000) |
Cities of Dallas and Fort Worth, Dallas/Fort Worth International Airport, Joint Rev. Improvement Bonds,
Series 2013-A, AMT, 5.00% 2026 | $1,000 | $1,105 |
| Cities of Dallas and Fort Worth, Dallas/Fort Worth International Airport, Joint Rev. Ref. Bonds, Series 2011-C, 5.00% 2022 | 1,430 | 1,475 |
| Cities of Dallas and Fort Worth, Dallas/Fort Worth International Airport, Joint Rev. Ref. Bonds, Series 2012-B, 5.00% 2021 | 2,500 | 2,577 |
| Cities of Dallas and Fort Worth, Dallas/Fort Worth International Airport, Joint Rev. Ref. Bonds, Series 2014-A, AMT, 5.25% 2026 | 2,000 | 2,299 |
City of Dallas, Housing Fin. Corp., Multi Family Rev. Bonds (Palladium Redbird), Series 2019,
1.50% 2023 (put 2022) | 2,500 | 2,516 |
City of Dallas, Housing Fin. Corp., Multi Family Rev. Notes (Estates at Shiloh), Series 2019,
1.51% 2037 (put 2023) | 4,885 | 4,923 |
| Dallas Independent School Dist., Unlimited Tax School Building Bonds, Series 2019-B, 5.00% 2022 | 2,000 | 2,167 |
| Deer Park Independent School Dist., Unlimited Tax Rev. Ref. Bonds, Series 2019, 5.00% 2030 | 3,605 | 4,724 |
| City of Denton, Utility System Rev. Bonds, Series 2017, 5.00% 2028 | 7,320 | 9,143 |
Eagle Mountain-Saginaw Independent School Dist., Unlimited Tax School Building Bonds, Series 2019,
5.00% 2028 | 1,000 | 1,300 |
Eagle Mountain-Saginaw Independent School Dist., Unlimited Tax School Building Bonds, Series 2019,
5.00% 2030 | 1,000 | 1,289 |
| Fort Bend Independent School Dist., Unlimited Tax Rev. Ref. Bonds, Series 2017-D, 1.50% 2042 (put 2021) | 2,875 | 2,896 |
| Fort Bend Independent School Dist., Unlimited Tax Rev. Ref. Bonds, Series 2017-E, 5.00% 2027 | 6,955 | 8,805 |
| Frisco Independent School Dist., Unlimited Tax School Building and Rev. Ref. Bonds, Series 2019, 5.00% 2021 | 4,640 | 4,934 |
G.O. Bonds, Water Financial Assistance Rev. Ref. Bonds (Water Infrastructure Fund), Series 2019-E-1,
5.00% 2021 | 3,060 | 3,249 |
G.O. Bonds, Water Financial Assistance Rev. Ref. Bonds (Water Infrastructure Fund), Series 2019-E-2,
2.25% 2029 | 9,500 | 9,555 |
| G.O. Bonds, Water Financial Assistance Rev. Ref. Bonds, Series 2019-C-1, 5.00% 2021 | 1,500 | 1,593 |
| Galena Park Independent School Dist., Unlimited Tax School Building Bonds, Series 2019, 5.00% 2027 | 1,500 | 1,911 |
Hallsville Independent School Dist., Unlimited Tax School Building and Rev. Ref. Bonds, Series 2020,
5.00% 2022 | 3,000 | 3,248 |
| County of Harris, Cultural Education Facs. Fin. Corp., Hospital Rev. Bonds (Memorial Hermann Health System), Series 2014-A, 5.00% 2025 | 2,850 | 3,359 |
| County of Harris, Cultural Education Facs. Fin. Corp., Hospital Rev. Bonds (Memorial Hermann Health System), Series 2020, 5.00% 2023 | 1,000 | 1,119 |
County of Harris, Cultural Education Facs. Fin. Corp., Hospital Rev. Bonds (Texas Children’s Hospital),
Series 2019-B, 5.00% 2041 (put 2024) | 4,440 | 5,231 |
| County of Harris, Cultural Education Facs. Fin. Corp., Hospital Rev. Ref. Bonds (Memorial Hermann Health System), Series 2013-B, (SIFMA Municipal Swap Index + 0.90%) 1.84% 20221 | 1,885 | 1,907 |
| County of Harris, Flood Control Dist., Contract Tax Rev. Ref. Bonds, Series 2019-A, 5.00% 2022 | 5,435 | 6,026 |
County of Harris, Sports Auth., Rev. Ref. Bonds, Series 2014-A, Assured Guaranty Municipal insured,
5.00% 2024 | 3,000 | 3,544 |
County of Harris, Toll Road Rev. Ref. Bonds, Series 2012-B,
(SIFMA Municipal Swap Index + 0.45%) 1.45% 2021 | 12,505 | 12,550 |
| County of Harris, Toll Road Rev. Ref. Bonds, Series 2016-A, 5.00% 2027 | 1,500 | 1,868 |
| County of Harris, Unlimited Tax Rev. Ref. Bonds, Series 2019-A, 5.00% 2021 | 2,000 | 2,137 |
| Dept. of Housing and Community Affairs, Residential Mortgage Rev. Bonds, Series 2019-A, 4.75% 2049 | 1,960 | 2,220 |
| City of Houston, Airport System Rev. and Rev. Ref. Bonds, Series 2018-A, AMT, 5.00% 2028 | 1,000 | 1,277 |
| City of Houston, Airport System Rev. Ref. Bonds, Series 2011-B, 5.00% 2025 | 1,000 | 1,057 |
| City of Houston, Airport System Rev. Ref. Bonds, Series 2018-C, AMT, 5.00% 2026 | 5,010 | 6,164 |
| City of Houston, Combined Utility System Rev. and Rev. Ref. Bonds, Series 2016-B, 5.00% 2025 | 3,430 | 4,210 |
| City of Houston, Combined Utility System Rev. and Rev. Ref. Bonds, Series 2016-B, 5.00% 2027 | 4,500 | 5,631 |
| City of Houston, Combined Utility System Rev. Ref. Bonds, Series 2015-A, 5.00% 2036 | 3,315 | 3,951 |
City of Houston, Combined Utility System Rev. Ref. Bonds, Series 2018-C,
(1-month USD-LIBOR x 0.70 + 0.36%) 1.515% 2034 (put 2021)1 | 4,350 | 4,355 |
| City of Houston, Combined Utility System Rev. Ref. Bonds, Series 2019-B, 5.00% 2028 | 500 | 656 |
Limited Term Tax-Exempt Bond Fund of America — Page 29 of 38
unaudited
Bonds, notes & other debt instruments (continued)
Texas (continued) | Principal amount
(000) | Value
(000) |
| City of Houston, Combined Utility System Rev. Ref. Bonds, Series 2019-B, 5.00% 2029 | $490 | $654 |
| City of Houston, Combined Utility System Rev. Ref. Bonds, Series 2019-B, 5.00% 2030 | 650 | 862 |
| City of Houston, Downtown Redev. Auth., Tax Increment Contract Rev. Ref. Bonds, Series 2015, BAM insured, 5.00% 2027 | 2,010 | 2,427 |
City of Houston, Higher Education Fin. Corp., Higher Education Rev. Bonds (Rice University Project),
Series 2010-A, 5.00% 2040 (preref. 2020) | 3,275 | 3,313 |
City of Houston, Memorial City Redev. Auth., Tax Increment Contract Rev. and Rev. Ref. Bonds, Series 2019,
Assured Guaranty Municipal insured, 5.00% 2028 | 1,000 | 1,264 |
| City of Houston, Public Improvement Rev. Ref. Bonds, Series 2017-A, 5.00% 2022 | 2,255 | 2,446 |
Houston Independent School Dist., Limited Tax Schoolhouse Bonds, Series 2014-A-1B,
2.20% 2039 (put 2020) | 8,920 | 8,955 |
| Houston Independent School Dist., Limited Tax Schoolhouse Bonds, Series 2017, 3.00% 2021 | 10,580 | 10,815 |
Hurst-Euless-Bedford Independent School Dist., Unlimited Tax School Building Bonds, Series 2019,
4.00% 2021 | 1,495 | 1,567 |
Hurst-Euless-Bedford Independent School Dist., Unlimited Tax School Building Bonds, Series 2019,
5.00% 2026 | 1,250 | 1,565 |
| Katy Independent School Dist., Unlimited Tax Rev. Ref. Bonds, Series 2019-B, 5.00% 2022 | 3,480 | 3,770 |
| Katy Independent School Dist., Unlimited Tax Rev. Ref. Bonds, Series 2019-B, 5.00% 2027 | 6,000 | 7,587 |
| Katy Independent School Dist., Unlimited Tax Rev. Ref. Bonds, Series 2019-B, 5.00% 2030 | 3,130 | 4,114 |
| City of Kerrville, Health Facs. Dev. Corp., Hospital Rev. Bonds (Peterson Regional Medical Center Project), Series 2015, 5.00% 2021 | 800 | 845 |
| City of Kerrville, Health Facs. Dev. Corp., Hospital Rev. Bonds (Peterson Regional Medical Center Project), Series 2015, 5.00% 2022 | 1,000 | 1,092 |
| Kileen Independent School Dist., Unlimited Tax Rev. Ref. Bonds, Series 2019, 5.00% 2022 | 3,350 | 3,629 |
| Lake Travis Independent School Dist., Unlimited Tax School Building Bonds, Series 2019, 5.00% 2025 | 1,050 | 1,263 |
| Lake Travis Independent School Dist., Unlimited Tax School Building Bonds, Series 2019, 5.00% 2026 | 1,110 | 1,375 |
| Love Field Airport Modernization Corp., General Airport Rev. Bonds, Series 2017, AMT, 5.00% 2026 | 1,000 | 1,238 |
| Lower Colorado River Auth., Rev. Ref. Bonds, Series 2020, 5.00% 2027 | 6,975 | 8,810 |
| Lower Colorado River Auth., Rev. Ref. Bonds, Series 2020, 5.00% 2030 | 1,900 | 2,530 |
| Lower Colorado River Auth., Rev. Ref. Bonds, Series 2020, 5.00% 2031 | 3,000 | 3,981 |
Lower Colorado River Auth., Transmission Contract Rev. Ref. Bonds
(LCRA Transmission Services Corp. Project), Series 2018, 5.00% 2024 | 2,250 | 2,628 |
| Lufkin Independent School Dist., Unlimited Tax Rev. Ref. Bonds, Series 2018, 5.00% 2027 | 2,095 | 2,678 |
| Mansfield Independent School Dist., Unlimited Tax Rev. Ref. Bonds, Series 2010, 5.00% 2020 | 5,890 | 5,897 |
County of Matagorda, Navigation Dist. No. 1, Pollution Control Rev. Ref. Bonds
(Central Power and Light Co. Project), Series 1996, AMT, 1.75% 2030 (put 2020) | 3,600 | 3,610 |
Municipal Gas Acquisition and Supply Corp. II, Gas Supply Rev. Bonds, Series 2007-B,
(SIFMA Municipal Swap Index + 0.55%) 1.49% 20271 | 2,620 | 2,599 |
| Municipal Gas Acquisition and Supply Corp. III, Gas Supply Rev. Bonds, Series 2012, 5.00% 2021 | 4,000 | 4,279 |
| Municipal Gas Acquisition and Supply Corp. III, Gas Supply Rev. Bonds, Series 2012, 5.00% 2022 | 2,800 | 3,098 |
| Municipal Gas Acquisition and Supply Corp. III, Gas Supply Rev. Bonds, Series 2012, 5.00% 2023 | 2,000 | 2,217 |
New Braunfels Independent School Dist., Unlimited Tax School Building and Rev. Ref. Bonds,
Capital Appreciation Bonds, Series 2020, 0% 2023 | 5,305 | 5,141 |
New Hope Cultural Education Facs. Fin. Corp., Hospital Rev. Bonds
(Children’s Health System of Texas Project), Series 2017-A, 5.00% 2028 | 1,500 | 1,895 |
| New Hope Cultural Education Facs. Fin. Corp., Retirement Fac. Rev. Bonds (Westminster Project), Series 2016, 5.00% 2022 | 645 | 700 |
| New Hope Cultural Education Facs. Fin. Corp., Retirement Fac. Rev. Bonds (Westminster Project), Series 2016, 5.00% 2023 | 500 | 557 |
| New Hope Cultural Education Facs. Fin. Corp., Retirement Fac. Rev. Bonds (Westminster Project), Series 2016, 5.00% 2024 | 625 | 714 |
| New Hope Cultural Education Facs. Fin. Corp., Retirement Fac. Rev. Bonds (Westminster Project), Series 2016, 5.00% 2027 | 1,230 | 1,415 |
| New Hope Cultural Education Facs. Fin. Corp., Retirement Fac. Rev. Bonds (Westminster Project), Series 2016, 5.00% 2028 | 1,440 | 1,650 |
Limited Term Tax-Exempt Bond Fund of America — Page 30 of 38
unaudited
Bonds, notes & other debt instruments (continued)
Texas (continued) | Principal amount
(000) | Value
(000) |
| New Hope Cultural Education Facs. Fin. Corp., Student Housing Rev. Bonds (CHF-Collegiate Housing Stephenville III, LLC - Tarleton State University Project), Series 2015-A, 5.00% 2030 | $800 | $896 |
| North East Independent School Dist., Unlimited Tax Rev. Ref. Bonds, Series 2015, 5.00% 2026 | 5,000 | 6,067 |
| North East Independent School Dist., Unlimited Tax Rev. Ref. Bonds, Series 2017, 2.375% 2047 (put 2022) | 3,500 | 3,607 |
| North Texas Tollway Auth., System Rev. Ref. Bonds, Series 2016-A, 5.00% 2026 | 1,600 | 1,849 |
| North Texas Tollway Auth., System Rev. Ref. Bonds, Series 2016-A, 5.00% 2027 | 1,000 | 1,153 |
| North Texas Tollway Auth., System Rev. Ref. Bonds, Series 2016-A, 5.00% 2028 | 2,000 | 2,432 |
| North Texas Tollway Auth., System Rev. Ref. Bonds, Series 2019-A, 5.00% 2027 | 1,000 | 1,253 |
| North Texas Tollway Auth., System Rev. Ref. Bonds, Series 2019-A, 5.00% 2028 | 3,315 | 4,243 |
| North Texas Tollway Auth., System Rev. Ref. Bonds, Series 2019-A, 5.00% 2029 | 2,000 | 2,606 |
| Northside Independent School Dist., Unlimited Tax Rev. Ref. Bonds, Series 2019-B, 5.00% 2028 | 2,525 | 3,242 |
| Northside Independent School Dist., Unlimited Tax School Building Bonds, Series 2007-A, 5.00% 2021 | 2,780 | 2,932 |
| Northwest Independent School Dist., Unlimited Tax Bonds, Series 2019, 5.00% 2023 | 530 | 595 |
| County of Nueces, Limited Tax Rev. Ref. Bonds, Series 2019, 5.00% 2029 | 740 | 957 |
| Pasadena Independent School Dist., Unlimited Tax Rev. Ref. Bonds, Series 2019, 5.00% 2029 | 1,825 | 2,409 |
| Pflugerville Independent School Dist., Unlimited Tax School Building Bonds, Series 2019-A, 5.00% 2022 | 3,170 | 3,434 |
| Pflugerville Independent School Dist., Unlimited Tax School Building Bonds, Series 2019-A, 5.00% 2023 | 1,715 | 1,925 |
Plainview Independent School Dist., Unlimited Tax School Building Bonds, Series 2020-B,
1.50% 2050 (put 2023) | 8,000 | 8,123 |
| Plano Independent School Dist., Unlimited Tax School Building Bonds, Series 2016, 5.00% 2021 | 5,465 | 5,698 |
| Public Fin. Auth., G.O. Rev. Ref. Bonds, Series 2011, 5.00% 2020 | 3,955 | 4,063 |
| Richardson Independent School Dist., Unlimited Tax School Building Bonds, Series 2017, 5.00% 2020 | 1,000 | 1,001 |
| Richardson Independent School Dist., Unlimited Tax School Building Bonds, Series 2019, 5.00% 2020 | 2,000 | 2,003 |
| City of San Antonio, Airport System Rev. Ref. Bonds, Series 2012, AMT, 4.00% 2021 | 1,000 | 1,041 |
| City of San Antonio, Airport System Rev. Ref. Bonds, Series 2019-A, AMT, 5.00% 2028 | 1,250 | 1,592 |
| City of San Antonio, Electric and Gas Systems Rev. Ref. Bonds, Series 2015-D, 3.00% 2045 (put 2020) | 3,075 | 3,125 |
| City of San Antonio, Electric and Gas Systems Rev. Ref. Bonds, Series 2018, 2.75% 2048 (put 2022) | 1,675 | 1,751 |
City of San Antonio, Passenger Fac. Charge and Airport System Rev. Ref. Bonds, Series 2012, AMT,
5.00% 2020 | 1,680 | 1,707 |
City of San Antonio, Passenger Fac. Charge and Airport System Rev. Ref. Bonds, Series 2012, AMT,
5.00% 2021 | 1,770 | 1,866 |
City of San Antonio, Passenger Fac. Charge and Airport System Rev. Ref. Bonds, Series 2019-A, AMT,
5.00% 2029 | 1,000 | 1,295 |
| City of San Antonio, Water System Rev. Ref. Bonds, Series 2019-C, 5.00% 2025 | 875 | 1,060 |
| City of San Antonio, Water System Rev. Ref. Bonds, Series 2019-C, 5.00% 2026 | 1,000 | 1,245 |
| City of San Antonio, Water System Rev. Ref. Bonds, Series 2019-C, 5.00% 2027 | 1,000 | 1,274 |
| Spring Branch Independent School Dist., Unlimited Tax Schoolhouse Bonds, Series 2019, 5.00% 2027 | 1,725 | 2,189 |
| Spring Independent School Dist., Unlimited Tax School Building Bonds, Series 2019, 5.00% 2024 | 1,500 | 1,772 |
| Spring Independent School Dist., Unlimited Tax School Building Bonds, Series 2019, 5.00% 2031 | 1,385 | 1,781 |
County of Tarrant, Cultural Education Facs. Fin. Corp., Hospital Rev. Bonds
(Baylor Scott & White Health Project), Series 2016-A, 5.00% 2029 | 5,020 | 6,099 |
| County of Tarrant, Health Facs. Dev. Corp., Hospital Rev. Bonds (Cook Children’s Medical Center Project), Series 2010-A, 4.50% 2022 | 500 | 501 |
| Texas City Independent School Dist., Unlimited Tax School Building Rev. Ref. Bonds, Series 2019, 5.00% 2025 | 1,500 | 1,827 |
Board of Regents of Texas A&M University System, Permanent University Fund Bonds, Series 2012-A,
5.00% 2021 | 1,500 | 1,587 |
Board of Regents of Texas A&M University System, Rev. Fncg. System Bonds, Series 2015-B,
5.00% 2025 (preref. 2023) | 1,600 | 1,815 |
| Board of Regents of Texas State University System, Rev. Fncg. System Rev. and Rev. Ref. Bonds, Series 2017-A, 5.00% 2026 | 1,425 | 1,762 |
| Transportation Commission, Central Texas Turnpike System Rev. Ref. Bonds, Series 2015-C, 5.00% 2025 | 1,000 | 1,173 |
Transportation Commission, First Tier Rev. Ref. Put Bonds (State Highway Fund), Series 2016-B,
4.00% 2026 (put 2021) | 2,000 | 2,102 |
Trinity River Auth., Regional Wastewater System Rev. Improvement and Rev. Ref. Bonds, Series 2019,
5.00% 2021 | 1,000 | 1,060 |
Limited Term Tax-Exempt Bond Fund of America — Page 31 of 38
unaudited
Bonds, notes & other debt instruments (continued)
Texas (continued) | Principal amount
(000) | Value
(000) |
Trinity River Auth., Regional Wastewater System Rev. Improvement and Rev. Ref. Bonds, Series 2019,
5.00% 2022 | $1,250 | $1,377 |
Trinity River Auth., Regional Wastewater System Rev. Improvement and Rev. Ref. Bonds, Series 2019,
5.00% 2027 | 1,250 | 1,603 |
| United Independent School Dist., Unlimited Tax School Building Bonds, Series 2019, 5.00% 2025 | 1,030 | 1,250 |
| United Independent School Dist., Unlimited Tax School Building Bonds, Series 2019, 5.00% 2026 | 1,420 | 1,768 |
| United Independent School Dist., Unlimited Tax School Building Bonds, Series 2019, 5.00% 2027 | 1,490 | 1,893 |
| Board of Regents of the University of Houston System, Consolidated Rev. and Rev. Ref. Bonds, Series 2017-A, 5.00% 2026 | 2,620 | 3,232 |
| Board of Regents of the University of Houston System, Consolidated Rev. and Rev. Ref. Bonds, Series 2017-C, 5.00% 2028 | 2,500 | 3,055 |
| Board of Regents of the University of North Texas System, Rev. Fncg. System Rev. Ref. and Improvement Bonds, Series 2017-A, 5.00% 2024 | 1,665 | 1,942 |
| Board of Regents of the University of North Texas System, Rev. Fncg. System Rev. Ref. and Improvement Bonds, Series 2017-A, 5.00% 2025 | 1,255 | 1,512 |
| Board of Regents of the University of Texas System, Rev. Fncg. System Bonds, Series 2016-J, 5.00% 2020 | 1,500 | 1,533 |
Board of Regents of the University of Texas System, Rev. Fncg. System Rev. Ref. Bonds, Series 2016-I,
5.00% 2021 | 5,670 | 6,029 |
| Water Dev. Board, State Revolving Fund, Rev. Bonds, Series 2018, 5.00% 2030 | 2,760 | 3,493 |
Water Dev. Board, State Water Implementation Rev. Fund, Rev. Bonds (Master Trust), Series 2018-A,
5.00% 2023 | 4,085 | 4,615 |
Water Dev. Board, State Water Implementation Rev. Fund, Rev. Bonds (Master Trust), Series 2018-A,
5.00% 2023 | 3,595 | 4,133 |
Water Dev. Board, State Water Implementation Rev. Fund, Rev. Bonds (Master Trust), Series 2018-A,
5.00% 2029 | 6,935 | 8,965 |
Water Dev. Board, State Water Implementation Rev. Fund, Rev. Bonds (Master Trust), Series 2019-A,
5.00% 2026 | 2,195 | 2,765 |
Water Dev. Board, State Water Implementation Rev. Fund, Rev. Bonds (Master Trust), Series 2019-A,
5.00% 2026 | 1,850 | 2,301 |
| County of Williamson, Limited Tax Rev. Ref. and Park Bonds, Series 2020, 5.00% 2023 | 1,590 | 1,783 |
| County of Williamson, Unlimited Tax Road Bonds, Series 2020, 4.00% 2023 | 2,300 | 2,511 |
| | | 525,686 |
| Utah 0.08% | | |
| Housing Corp., Single Family Mortgage Bonds, Class III, Series 2015-D-2, 4.00% 2045 | 3,480 | 3,731 |
| Vermont 0.21% | | |
| Housing Fin. Agcy., Multiple Purpose Bonds, Series 2017-A, AMT, 4.00% 2047 | 2,620 | 2,821 |
| Housing Fin. Agcy., Multiple Purpose Bonds, Series 2018-A, 4.00% 2048 | 1,470 | 1,595 |
| Student Assistance Corp., Education Loan Rev. Bonds, Series 2017-A, AMT, 5.00% 2022 | 400 | 434 |
| Student Assistance Corp., Education Loan Rev. Bonds, Series 2017-A, AMT, 5.00% 2023 | 1,150 | 1,286 |
| Student Assistance Corp., Education Loan Rev. Bonds, Series 2017-A, AMT, 5.00% 2024 | 850 | 977 |
| Student Assistance Corp., Education Loan Rev. Bonds, Series 2017-A, AMT, 5.00% 2025 | 875 | 1,032 |
| Student Assistance Corp., Education Loan Rev. Bonds, Series 2019-A, AMT, 5.00% 2025 | 1,300 | 1,533 |
| | | 9,678 |
| Virginia 1.50% | | |
College Building Auth., Educational Facs. Rev. Bonds (21st Century College and Equipment Programs),
Series 2013-A, 5.00% 2024 (preref. 2023) | 2,650 | 2,975 |
College Building Auth., Educational Facs. Rev. Bonds (21st Century College and Equipment Programs),
Series 2017-A, 5.00% 2020 | 1,320 | 1,320 |
College Building Auth., Educational Facs. Rev. Bonds (21st Century College and Equipment Programs),
Series 2019-A, 5.00% 2020 | 10,215 | 10,215 |
Limited Term Tax-Exempt Bond Fund of America — Page 32 of 38
unaudited
Bonds, notes & other debt instruments (continued)
Virginia (continued) | Principal amount
(000) | Value
(000) |
Town of Farmville, Industrial Dev. Auth., Educational Facs. Rev. Ref. Bonds
(Longwood University Student Housing Project), Series 2018-A, 5.00% 2030 | $1,000 | $1,212 |
| G.O. Bonds, Series 2015-A, 5.00% 2026 | 11,795 | 14,378 |
| G.O. Bonds, Series 2016-B, 5.00% 2021 | 3,080 | 3,250 |
| G.O. Rev. Ref. Bonds, Series 2013-B, 5.00% 2021 | 4,900 | 5,170 |
| G.O. Rev. Ref. Bonds, Series 2019-B, 5.00% 2021 | 7,035 | 7,423 |
Town of Louisa, Industrial Dev. Auth., Pollution Control Rev. Ref. Bonds
(Virginia Electric and Power Co. Project), Series 2008-A, 1.90% 2035 (put 2023) | 3,000 | 3,064 |
| City of Richmond, Public Utility Rev. and Rev. Ref. Bonds, Series 2016-A, 5.00% 2028 | 5,500 | 6,756 |
County of Wise, Industrial Dev. Auth., Solid Waste and Sewage Disposal Rev. Bonds
(Virginia Electric and Power Co. Project), Series 2009-A, 2.15% 2040 (put 2020) | 11,500 | 11,570 |
County of Wise, Industrial Dev. Auth., Solid Waste and Sewage Disposal Rev. Bonds
(Virginia Electric and Power Co. Project), Series 2010-A, 1.875% 2040 (put 2020) | 1,760 | 1,764 |
| | | 69,097 |
| Washington 2.76% | | |
| Econ. Dev. Fin. Auth., Solid Waste Disposal Rev. Bonds (Waste Management, Inc. Project), Series 2008, 2.125% 20202 | 4,250 | 4,254 |
| Energy Northwest, Columbia Generating Station Electric Rev. Ref. Bonds, Series 2014-A, 5.00% 2021 | 2,250 | 2,380 |
| G.O. Bonds, Series 2010-E, 5.00% 2022 (preref. 2020) | 5 | 5 |
| G.O. Bonds, Series 2012-D, 5.00% 2023 | 5,015 | 5,423 |
| G.O. Bonds, Series 2017-D, 5.00% 2028 | 5,000 | 6,299 |
| G.O. Bonds, Series 2019-C, 5.00% 2031 | 5,000 | 6,518 |
| G.O. Rev. Ref. Bonds, Series 2012-R-C, 5.00% 2020 | 4,680 | 4,760 |
| G.O. Rev. Ref. Bonds, Series 2016-R-B, 5.00% 2029 | 10,205 | 12,474 |
| G.O. Rev. Ref. Bonds, Series 2020-R-A, 5.00% 2022 | 1,595 | 1,721 |
| G.O. Rev. Ref. Bonds, Series 2020-R-A, 5.00% 2026 | 2,500 | 3,092 |
| G.O. Rev. Ref. Bonds, Series 2020-R-B, 5.00% 2022 | 2,750 | 2,967 |
| G.O. Rev. Ref. Bonds, Series 2020-R-B, 5.00% 2026 | 2,500 | 3,092 |
County of Grant, Public Utility Dist. No. 2, Electric System Rev. Ref. Bonds, Series 2017-N,
2.00% 2044 (put 2020) | 5,000 | 5,021 |
Health Care Facs. Auth., Rev. Bonds (Catholic Health Initiatives), Series 2013-B-1,
(SIFMA Municipal Swap Index + 1.00%) 1.94% 2035 (put 2021)1 | 15,100 | 15,123 |
| Health Care Facs. Auth., Rev. Bonds (Kadlec Regional Medical Center), Series 2012, 5.00% 2042 (preref. 2021) | 2,805 | 3,012 |
| Health Care Facs. Auth., Rev. Ref. Bonds (PeaceHealth), Series 2014-A, 5.00% 2026 | 1,000 | 1,161 |
Health Care Facs. Auth., Rev. Ref. Bonds (Providence Health & Services), Series 2012-B,
5.00% 2042 (put 2021) | 1,000 | 1,065 |
| Health Care Facs. Auth., Rev. Ref. Bonds (Providence St. Joseph Health), Series 2018-B, 5.00% 2027 | 2,000 | 2,538 |
| Housing Fin. Commission, Homeownership Program Bonds, Series 2011-A, 4.50% 2029 | 80 | 81 |
| Housing Fin. Commission, Nonprofit Housing Rev. and Rev. Ref. Bonds (Horizon House Project), Series 2017, 5.00% 20222 | 540 | 575 |
| Housing Fin. Commission, Nonprofit Housing Rev. and Rev. Ref. Bonds (Horizon House Project), Series 2017, 5.00% 20242 | 610 | 688 |
| Housing Fin. Commission, Nonprofit Housing Rev. and Rev. Ref. Bonds (Horizon House Project), Series 2017, 5.00% 20262 | 1,325 | 1,566 |
| Housing Fin. Commission, Single Family Program Bonds, Series 2014-2A-R, AMT, 3.50% 2044 | 275 | 284 |
| Housing Fin. Commission, Single Family Program Bonds, Series 2019-1-N, 4.00% 2049 | 3,315 | 3,659 |
| Housing Fin. Commission, Single Family Program Rev. Ref. Bonds, Series 2015-A-R, AMT, 3.50% 2038 | 635 | 660 |
| Motor Vehicle Fuel Tax G.O. Bonds, Series 2012-E, 5.00% 2021 | 1,120 | 1,166 |
| City of Seattle, Municipal Light and Power Improvement Rev. Ref. Bonds, Series 2010-B, 5.00% 2021 | 2,205 | 2,205 |
City of Seattle, Municipal Light and Power Improvement Rev. Ref. Bonds, Series 2018-C-2,
(SIFMA Municipal Swap Index + 0.49%) 1.43% 2046 (put 2023)1 | 4,500 | 4,518 |
| Port of Seattle, Rev. Bonds, Series 2017-C, AMT, 5.00% 2025 | 2,500 | 2,978 |
| Port of Seattle, Rev. Bonds, Series 2017-C, AMT, 5.00% 2026 | 2,500 | 3,050 |
| Port of Seattle, Rev. Bonds, Series 2017-C, AMT, 5.00% 2027 | 2,500 | 3,120 |
Limited Term Tax-Exempt Bond Fund of America — Page 33 of 38
unaudited
Bonds, notes & other debt instruments (continued)
Washington (continued) | Principal amount
(000) | Value
(000) |
| Port of Seattle, Rev. Bonds, Series 2018-A, AMT, 5.00% 2025 | $5,250 | $6,254 |
| Port of Seattle, Rev. Bonds, Series 2018-A, AMT, 5.00% 2028 | 4,750 | 5,891 |
| Port of Seattle, Rev. Ref. Bonds, Series 2012-B, AMT, 5.00% 2022 | 1,825 | 1,999 |
| Port of Seattle, Rev. Ref. Bonds, Series 2015-C, AMT, 5.00% 2029 | 1,000 | 1,160 |
| Port of Seattle, Special Fac. Rev. Ref. Bonds (SEATAC Fuel Facs. LLC), Series 2013, AMT, 5.00% 2022 | 1,000 | 1,089 |
| Port of Seattle, Special Fac. Rev. Ref. Bonds (SEATAC Fuel Facs. LLC), Series 2013, AMT, 5.00% 2023 | 1,100 | 1,238 |
County of Skagit, Public Hospital Dist. No. 1 (Skagit Regional Health),
Hospital Rev. Improvement and Rev. Ref. Bonds, Series 2016, 4.00% 2026 | 2,300 | 2,647 |
| Spokane School Dist., Unlimited Tax G.O. Bonds, Series 2011, 5.00% 2030 (preref. 2021) | 1,000 | 1,076 |
| | | 126,809 |
| West Virginia 0.44% | | |
Econ. Dev. Auth., Solid Waste Disposal Facs. Rev. Bonds (Appalachian Power Co. - Amos Project),
Series 2009-B, 2.625% 2042 (put 2022) | 6,250 | 6,446 |
Econ. Dev. Auth., Solid Waste Disposal Facs. Rev. Bonds (Appalachian Power Co. - Amos Project),
Series 2011-A, AMT, 1.70% 2041 (put 2020) | 2,900 | 2,906 |
Econ. Dev. Auth., Solid Waste Disposal Facs. Rev. Ref. Bonds (Appalachian Power Co. - Amos Project),
Series 2015-A, 2.55% 2040 (put 2024) | 1,250 | 1,312 |
Econ. Dev. Auth., Solid Waste Disposal Facs. Rev. Ref. Bonds (Wheeling Power Co. - Mitchell Project),
Series 2013-A, AMT, 3.00% 2037 (put 2022) | 5,200 | 5,383 |
| County of Harrison, Solid Waste Disposal Rev. Ref. Bonds (Monongahela Power Co. Project), Series 2018-A, AMT, 3.00% 2037 (put 2021) | 4,000 | 4,105 |
| | | 20,152 |
| Wisconsin 2.88% | | |
| G.O. Bonds, Series 2013-A, 5.00% 2025 (preref. 2022) | 9,250 | 10,105 |
| G.O. Bonds, Series 2015-A, 5.00% 2031 (preref. 2023) | 12,385 | 14,008 |
Health and Educational Facs. Auth., Health Facs. Rev. Bonds (SSM Health Care), Series 2018-B,
5.00% 2038 (put 2023) | 11,000 | 12,079 |
Health and Educational Facs. Auth., Rev. Bonds (Advocate Aurora Health Care Credit Group),
Series 2018-C-3, (SIFMA Municipal Swap Index + 0.55%) 1.49% 2054 (put 2023)1 | 5,200 | 5,231 |
Health and Educational Facs. Auth., Rev. Bonds (Advocate Aurora Health Care Credit Group),
Series 2018-C-4, (SIFMA Municipal Swap Index + 0.65%) 1.59% 2054 (put 2024)1 | 4,000 | 4,042 |
Health and Educational Facs. Auth., Rev. Bonds (Ascension Health Alliance Senior Credit Group),
Series 2013-B-3, 5.00% 2043 (put 2020) | 10,310 | 10,443 |
Health and Educational Facs. Auth., Rev. Bonds (Ascension Health Alliance Senior Credit Group),
Series 2013-B-5, 5.00% 2033 (put 2024) | 4,565 | 5,383 |
Health and Educational Facs. Auth., Rev. Bonds (Ascension Health Alliance Senior Credit Group),
Series 2019-A, 5.00% 2021 | 2,435 | 2,610 |
Health and Educational Facs. Auth., Rev. Bonds (Children’s Hospital of Wisconsin, Inc.), Series 2008-B,
5.375% 2037 (preref. 2020) | 2,000 | 2,003 |
Health and Educational Facs. Auth., Rev. Bonds (Marshfield Clinic Health System, Inc.), Series 2016-B,
5.00% 2026 | 1,000 | 1,212 |
Health and Educational Facs. Auth., Rev. Bonds (Marshfield Clinic Health System, Inc.), Series 2016-B,
5.00% 2027 | 1,000 | 1,205 |
| Health and Educational Facs. Auth., Rev. Ref. Bonds (ProHealth Care, Inc. Obligated Group), Series 2015, 5.00% 2031 | 1,650 | 1,898 |
| Housing and Econ. Dev. Auth., Home Ownership Mortgage Rev. Bonds, Series 2017-A, 2.69% 2047 | 6,365 | 6,618 |
| Housing and Econ. Dev. Auth., Home Ownership Rev. Bonds, Series 2015-A, AMT, 4.00% 2045 | 4,090 | 4,301 |
| Housing and Econ. Dev. Auth., Home Ownership Rev. Bonds, Series 2016-A, AMT, 3.50% 2046 | 5,570 | 5,830 |
| Housing and Econ. Dev. Auth., Home Ownership Rev. Bonds, Series 2017-C, 4.00% 2048 | 5,665 | 6,082 |
| Housing and Econ. Dev. Auth., Home Ownership Rev. Bonds, Series 2018-B, 4.00% 2048 | 3,240 | 3,489 |
| Housing and Econ. Dev. Auth., Home Ownership Rev. Bonds, Series 2019-A, 4.25% 2049 | 18,015 | 20,089 |
| Housing and Econ. Dev. Auth., Housing Rev. Bonds, Series 2017-A, 1.95% 2047 (put 2020) | 3,625 | 3,629 |
| County of Milwaukee, Airport Rev. Ref. Bonds, Series 2016-A, AMT, 5.00% 2023 | 1,475 | 1,692 |
Limited Term Tax-Exempt Bond Fund of America — Page 34 of 38
unaudited
Bonds, notes & other debt instruments (continued)
Wisconsin (continued) | Principal amount
(000) | Value
(000) |
| County of Milwaukee, Airport Rev. Ref. Bonds, Series 2016-A, AMT, 5.00% 2024 | $1,550 | $1,833 |
| Public Fin. Auth., Solid Waste Disposal Rev. Ref. Bonds (Waste Management, Inc. Project), Series 2017-A-3, AMT, 1.53% 2027 (put 2021) | 8,000 | 8,000 |
| Public Fin. Auth., Student Housing Rev. Bonds (Beyond Boone, LLC - Appalachian State University Project), Series 2019-A, Assured Guaranty Municipal insured, 5.00% 2030 | 630 | 780 |
| | | 132,562 |
| Wyoming 0.17% | | |
| Community Dev. Auth., Housing Rev. Bonds, Series 2015-3, 3.00% 2044 | 370 | 382 |
| Community Dev. Auth., Housing Rev. Bonds, Series 2015-6, 4.00% 2045 | 2,140 | 2,248 |
| Community Dev. Auth., Housing Rev. Bonds, Series 2019-1, 4.00% 2048 | 4,905 | 5,393 |
| | | 8,023 |
| Total bonds, notes & other debt instruments(cost: $3,841,828,000) | | 3,974,574 |
| Short-term securities 15.95% | | |
| State of Alaska, City of Valdez, Marine Terminal Rev. Ref. Bonds (Exxon Pipeline Co. Project), Series 1985, 1.19% 20251 | 14,000 | 14,000 |
| State of Alaska, City of Valdez, Marine Terminal Rev. Ref. Bonds (Exxon Pipeline Co. Project), Series 1993-B, 1.18% 20331 | 5,000 | 5,000 |
State of California, Pollution Control Fncg. Auth., Solid Waste Disposal Rev. Ref. Bonds
(Republic Services, Inc. Project), Series 2010-A, AMT, 1.45% 2023 (put 2020)2,4 | 18,600 | 18,600 |
| State of California, City of Stockton, Public Fncg. Auth., Wastewater Bond Anticipation Notes, Series 2019, 1.40% 2022 | 2,000 | 2,005 |
| State of Florida, City of Gainesville, Utilities System Rev. Bonds, Series 2019-C, 1.18% 20471 | 12,500 | 12,500 |
State of Florida, Mission Econ. Dev. Corp., Solid Waste Disposal Rev. Ref. Bonds
(Republic Services, Inc. Project), Series 2012, AMT, 1.55% 2026 (put 2020)4 | 2,500 | 2,500 |
| State of Idaho, Health Facs. Auth., Hospital Rev. Bonds (CHE Trinity Health Credit Group), Series 2013-ID, 1.75% 2048 (put 2020)4 | 2,310 | 2,310 |
| State of Idaho, Tax Anticipation Notes, Series 2019, 3.00% 6/30/2020 | 6,000 | 6,049 |
| State of Illinois, City of Chicago, G.O. Rev. Ref. Bonds, Series 2020-A, 5.00% 1/1/2021 | 300 | 310 |
| State of Indiana, Bond Bank, Advanced Funding Program Notes, Series 2020-A, 3.00% 1/11/2021 | 3,000 | 3,047 |
State of Indiana, Indianapolis Local Public Improvement Bond Bank, Notes
(Fieldhouse Project), Series 2019-B, 1.45% 2021 | 5,075 | 5,076 |
| State of Louisiana, Parish of East Baton Rouge, Industrial Dev. Board, Gulf Opportunity Zone Rev. Bonds (ExxonMobil Project), Series 2010-B, 1.19% 20401 | 10,885 | 10,885 |
| State of Louisiana, Parish of East Baton Rouge, Industrial Dev. Board, Gulf Opportunity Zone Rev. Bonds (ExxonMobil Project), Series 2011, 1.19% 20511 | 5,120 | 5,120 |
State of Louisiana, Parish of East Baton Rouge, Pollution Control Rev. Ref. Bonds (ExxonMobil Project),
Series 1993, 1.19% 20221 | 23,470 | 23,470 |
State of Louisiana, Parish of East Baton Rouge, Pollution Control Rev. Ref. Bonds (ExxonMobil Project),
Series 2010-A, 1.19% 20351 | 1,500 | 1,500 |
State of Louisiana, Public Facs. Auth., Rev. Bonds (Air Products and Chemicals Project), Series 2008,
1.18% 20431 | 3,490 | 3,490 |
State of Louisiana, Public Facs. Auth., Rev. Bonds (Air Products and Chemicals Project), Series 2008-A,
1.20% 20431 | 27,500 | 27,500 |
State of Maryland, County of Baltimore, Rev. Bonds (Riverwood Village, Inc. Fac.), Series 2020,
4.00% 1/1/2021 | 650 | 668 |
State of Maryland, Community Dev. Administration, Dept. of Housing and Community Dev.,
Multi Family Housing Dev. Rev. Bonds (Somerset Extension), Series 2019-H, 1.795% 2022 | 2,445 | 2,457 |
State of Massachusetts, City of Boston, Water and Sewer Utility IAM Commercial Paper, Series 2020-A,
1.20% 3/3/2020 | 1,000 | 1,000 |
| State of Massachusetts, Health and Educational Facs. Auth., IAM Commercial Paper (Harvard University Issue), Series 2020-EE, 1.00% 5/18/2020 | 10,000 | 10,000 |
Limited Term Tax-Exempt Bond Fund of America — Page 35 of 38
unaudited
| Short-term securities (continued) | Principal amount
(000) | Value
(000) |
| State of Michigan, Fin. Auth., State Aid Rev. Bonds, Series 2019-A, 2.00% 8/20/2020 | $3,000 | $3,016 |
State of Michigan, Strategic Fund, Demand Limited Obligation Rev. Bonds,
(Air Products and Chemicals, Inc. Project), Series 2007, 1.20% 20421 | 9,630 | 9,630 |
State of Mississippi, Business Fin. Corp., Gulf Opportunity Zone Industrial Dev. Rev. Bonds
(Chevron U.S.A. Inc. Project), Series 2007-A, 1.19% 20301 | 52,000 | 52,000 |
State of Mississippi, Business Fin. Corp., Gulf Opportunity Zone Industrial Dev. Rev. Bonds
(Chevron U.S.A. Inc. Project), Series 2007-D, 1.19% 20301 | 9,650 | 9,650 |
State of Mississippi, Business Fin. Corp., Gulf Opportunity Zone Industrial Dev. Rev. Bonds
(Chevron U.S.A. Inc. Project), Series 2007-E, 1.20% 20301 | 2,500 | 2,500 |
State of Mississippi, Business Fin. Corp., Gulf Opportunity Zone Industrial Dev. Rev. Bonds
(Chevron U.S.A. Inc. Project), Series 2009-D, 1.19% 20301 | 3,050 | 3,050 |
State of Mississippi, Business Fin. Corp., Gulf Opportunity Zone Industrial Dev. Rev. Bonds
(Chevron U.S.A. Inc. Project), Series 2010-G, 1.20% 20351 | 2,500 | 2,500 |
State of Mississippi, Business Fin. Corp., Gulf Opportunity Zone Industrial Dev. Rev. Bonds
(Chevron U.S.A. Inc. Project), Series 2010-J, 1.19% 20351 | 12,750 | 12,750 |
State of New Hampshire, Health and Education Facs. Auth., Rev. Ref. Bonds (Dartmouth College Issue),
Series 2007-B, 1.18% 20411 | 6,000 | 6,000 |
State of New Hampshire, National Fin. Auth., Exempt Facs. Rev. Ref. Bonds
(Emerald Renewable Diesel LLC Project), Series 2019, AMT, 2.00% 2049 (put 2020)2,4 | 15,200 | 15,257 |
State of New York, Metropolitan Transportation Auth., Transportation Rev. Bond Anticipation Notes,
Series 2018-B-1, 5.00% 5/15/2020 | 2,000 | 2,022 |
State of New York, Metropolitan Transportation Auth., Transportation Rev. Bond Anticipation Notes,
Series 2019-B-1, 5.00% 2022 | 1,750 | 1,905 |
State of New York, Metropolitan Transportation Auth., Transportation Rev. Bond Anticipation Notes,
Series 2019-D-1, 5.00% 2022 | 13,070 | 14,343 |
State of New York, Metropolitan Transportation Auth., Transportation Rev. Bond Anticipation Notes,
Series 2019-D-2, 4.00% 7/1/2020 | 4,000 | 4,047 |
State of New York, Metropolitan Transportation Auth., Transportation Rev. Bond Anticipation Notes,
Series 2020-A-2S, 4.00% 2022 | 18,765 | 19,829 |
| State of New York, New York City G.O. Bonds, Fiscal 2008, Series 2008-L-5, 1.18% 20351 | 16,315 | 16,315 |
| State of New York, New York City G.O. Bonds, Fiscal 2013, Series 2013-F-3, 1.18% 20421 | 46,345 | 46,345 |
| State of New York, New York City Municipal Water Fin. Auth., Water and Sewer System Second General Resolution Rev. Bonds, Fiscal 2007, Series 2006-CC-1, 0.94% 20381 | 10,000 | 10,000 |
| State of New York, New York City Municipal Water Fin. Auth., Water and Sewer System Second General Resolution Rev. Bonds, Fiscal 2011, Series 2011-FF-1, 1.18% 20441 | 2,500 | 2,500 |
| State of New York, New York City Municipal Water Fin. Auth., Water and Sewer System Second General Resolution Rev. Bonds, Fiscal 2014, Series 2013-AA-2, 1.18% 20501 | 12,000 | 12,000 |
| State of New York, New York City Municipal Water Fin. Auth., Water and Sewer System Second General Resolution Rev. Bonds, Fiscal 2016, Series 2016-AA-1, 1.18% 20481 | 7,150 | 7,150 |
State of New York, New York City Transitional Fin. Auth., Future Tax Secured Bonds, Fiscal 2019,
Series 2019-A-4, 1.18% 20451 | 24,000 | 24,000 |
| State of New York, New York City Transitional Fin. Auth., Future Tax Secured Rev. Ref. Bonds, Fiscal 2015, Series 2015-E-4, 1.18% 20451 | 3,000 | 3,000 |
| State of New York, Triborough Bridge and Tunnel Auth., General Rev. Bonds (MTA Bridges and Tunnels), Series 2003-B-1, 1.17% 20331 | 5,660 | 5,660 |
| State of New York, Triborough Bridge and Tunnel Auth., General Rev. Ref. Bonds (MTA Bridges and Tunnels), Series 2005-B-4C, 1.18% 20311 | 6,100 | 6,100 |
State of Ohio, County of Franklin, Rev. Bonds (CHE Trinity Health Credit Group), Series 2013-OH,
1.25% 2046 (put 2020)4 | 4,180 | 4,180 |
State of Ohio, Hospital Rev. Bonds (Cleveland Clinic Health System Obligated Group), Series 2019-F,
1.13% 20521 | 23,780 | 23,780 |
State of Pennsylvania, Econ. Dev. Fncg. Auth., Solid Waste Disposal Rev. Bonds,
(Republic Services, Inc. Project), Series 2014, AMT, 1.35% 2044 (put 2020)4 | 10,950 | 10,954 |
State of Pennsylvania, Econ. Dev. Fncg. Auth., Solid Waste Disposal Rev. Bonds,
(Waste Management, Inc. Project), Series 2013, AMT, 1.45% 2045 (put 2020)4 | 15,255 | 15,255 |
Limited Term Tax-Exempt Bond Fund of America — Page 36 of 38
unaudited
| Short-term securities (continued) | Principal amount
(000) | Value
(000) |
State of South Carolina, Jobs-Econ. Dev. Auth., Hospital Rev. Bonds (Prisma Health Obligated Group),
Series 2018-B, 1.15% 20481 | $47,875 | $47,875 |
| State of South Carolina, Public Service Auth., Rev. Obligations (Santee Cooper), Series 2019-A, 0.98% 20361 | 2,000 | 2,000 |
State of Tennessee, City of Lewisburg, Industrial Dev. Board, Solid Waste Disposal Rev. Ref. Bonds
(Waste Management, Inc. of Tennessee Project), Series 2012, AMT, 1.95% 2035 (put 2020)4 | 3,875 | 3,875 |
State of Tennessee, County of Montgomery, Public Building Auth., Pooled Fncg. Rev. Bonds
(Tennessee County Loan Pool), Series 2004, Bank of America LOC, 1.22% 20341 | 1,230 | 1,230 |
| State of Texas, Grand Parkway Transportation Corp., Bond Anticipation Notes, Series 2018, 5.00% 2023 | 7,000 | 7,792 |
State of Texas, Gulf Coast Waste Disposal Auth., Pollution Control Rev. Ref. Bonds (Exxon Project),
Series 1989, 1.19% 20241 | 2,000 | 2,000 |
State of Texas, Gulf Coast Waste Disposal Auth., Pollution Control Rev. Ref. Bonds (Exxon Project),
Series 1995, 1.19% 6/1/20201 | 14,800 | 14,800 |
| State of Texas, County of Harris, Cultural Education Facs. Fin. Corp., Hospital Rev. Bonds (Memorial Hermann Health System), Series 2019-C-1, (SIFMA Municipal Swap Index + 0.42%) 1.36% 2049 (put 2022)1,4 | 7,200 | 7,201 |
| State of Texas, County of Harris, Flood Control Dist., IAM Commercial Paper, Series 2020-H, 1.05% 5/5/2020 | 3,725 | 3,725 |
| State of Texas, County of Harris, Flood Control Dist., IAM Commercial Paper, Series 2020-H, 1.20% 3/12/2020 | 4,100 | 4,100 |
State of Texas, County of Harris, Industrial Dev. Corp., Pollution Control Rev. Bonds (Exxon Project),
Series 1984-A, 1.19% 20241 | 5,300 | 5,300 |
| State of Texas, City of Houston, Tax and Rev. Anticipation Notes, Series 2019, 5.00% 6/26/2020 | 4,500 | 4,571 |
| State of Texas, Lower Neches Valley Auth. Industrial Dev. Corp., Rev. Bonds (ExxonMobil Project), Series 2011, 1.17% 20381 | 24,595 | 24,595 |
State of Texas, Port Arthur Navigation Dist. Industrial Dev. Corp., Rev. Bonds, (Air Products Project),
Series 2005, 1.20% 20401 | 11,500 | 11,500 |
| State of Texas, Tax and Rev. Anticipation Notes, Series 2019, 4.00% 8/27/2020 | 11,710 | 11,909 |
| State of Texas, Regents of the University of Colorado, University Enterprise Rev. IAM Commercial Paper, Series 2020-A-1, 1.06% 6/3/2020 | 4,810 | 4,810 |
| State of Texas, Board of Regents of the University of Texas System, IAM Commercial Paper, Series 2020, 1.00% 5/19/2020 | 5,000 | 5,000 |
| State of Texas, Board of Regents of the University of Texas System, IAM Commercial Paper, Series 2020, 1.20% 2/6/2020 | 5,500 | 5,500 |
| State of Texas, County of York, Natural Rural Utilities Corp., Pollution Control Rev. IAM Commercial Paper, Series 2000, 1.27% 2/3/2020 | 10,000 | 10,000 |
| State of Wisconsin, Public Fin. Auth., Solid Waste Disposal Rev. Ref. Bonds (Waste Management, Inc. Project), Series 2017-A-1, AMT, 1.45% 2023 (put 2020)4 | 11,500 | 11,500 |
| State of Wisconsin, Public Fin. Auth., Solid Waste Disposal Rev. Ref. Bonds (Waste Management, Inc. Project), Series 2017-A-2, AMT, 1.53% 2025 (put 2020)4 | 4,000 | 4,000 |
| State of Wyoming, County of Sublette, Pollution Control Rev. Ref. Bonds (ExxonMobil Project), Series 2014, 1.19% 20441 | 15,000 | 15,000 |
| State of Wyoming, County of Sublette, Pollution Control Rev. Ref. Bonds (ExxonMobil Project), Series 2014, AMT, 1.24% 20441 | 17,850 | 17,850 |
State of Wyoming, County of Uinta, Pollution Control Rev. Ref. Bonds (Chevron U.S.A. Inc. Project),
Series 1992, 1.19% 20221 | 5,000 | 5,000 |
| Total short-term securities(cost: $733,760,000) | | 734,358 |
| Total investment securities 102.29%(cost: $4,575,588,000) | | 4,708,932 |
| Other assets less liabilities (2.29%) | | (105,428) |
| Net assets 100.00% | | $4,603,504 |
Limited Term Tax-Exempt Bond Fund of America — Page 37 of 38
unaudited
Futures contracts
| Contracts | Type | Number of
contracts | Expiration | Notional
amount5
(000) | Value at
1/31/20206
(000) | Unrealized
appreciation
(depreciation)
at 1/31/2020
(000) |
| 2 Year U.S. Treasury Note Futures | Long | 1,673 | April 2020 | $334,600 | $361,969 | $1,358 |
| 5 Year U.S. Treasury Note Futures | Long | 2,438 | April 2020 | 243,800 | 293,341 | 3,637 |
| 10 Year Ultra U.S. Treasury Note Futures | Short | 201 | March 2020 | (20,100) | (29,277) | (724) |
| | | | | | | $4,271 |
| 1 | Coupon rate may change periodically. Reference rate and spread are as of the most recent information available. Some coupon rates are determined by the issuer or agent based on current market conditions; therefore, the reference rate and spread are not available. For short-term securities, the date of the next scheduled coupon rate change is considered to be the maturity date. |
| 2 | Acquired in a transaction exempt from registration under Rule 144A of the Securities Act of 1933. May be resold in the U.S. in transactions exempt from registration, normally to qualified institutional buyers. The total value of all such securities was $49,400,000, which represented 1.07% of the net assets of the fund. |
| 3 | Step bond; coupon rate may change at a later date. |
| 4 | For short-term securities, the mandatory put date is considered to be the maturity date. |
| 5 | Notional amount is calculated based on the number of contracts and notional contract size. |
| 6 | Value is calculated based on the notional amount and current market price. |
| Key to abbreviations and symbol | |
| Agcy. = Agency | Fncg. = Financing |
| AMT = Alternative Minimum Tax | G.O. = General Obligation |
| Auth. = Authority | IAM = Interest at Maturity |
| Certs. of Part. = Certificates of Participation | LIBOR = London Interbank Offered Rate |
| Dept. = Department | LOC = Letter of Credit |
| Dev. = Development | Preref. = Prerefunded |
| Dist. = District | Redev. = Redevelopment |
| Econ. = Economic | Ref. = Refunding |
| Fac. = Facility | Rev. = Revenue |
| Facs. = Facilities | SIFMA = Securities Industry and Financial Markets Association |
| Fin. = Finance | USD/$ = U.S. dollars |
Additional financial disclosures are included in the fund’s current shareholder report and should be read in conjunction with this report.
Investments are not FDIC-insured, nor are they deposits of or guaranteed by a bank or any other entity, so they may lose value.
Investors should carefully consider investment objectives, risks, charges and expenses. This and other important information is contained in the fund prospectus and summary prospectus, which can be obtained from your financial professional and should be read carefully before investing. You may also call American Funds Service Company (AFS) at (800) 421-4225 or visit the Capital Group website at capitalgroup.com.
All Capital Group trademarks mentioned are owned by The Capital Group Companies, Inc., an affiliated company or fund. All other company and product names mentioned are the property of their respective companies.
American Funds Distributors, Inc., member FINRA.
© 2020 Capital Group. All rights reserved.
| MFGEFPX-043-0320O-S73168 | Limited Term Tax-Exempt Bond Fund of America — Page 38 of 38 |
ITEM 7 – Disclosure of Proxy Voting Policies and Procedures for Closed-End Management Investment Companies
Not applicable to this Registrant, insofar as the Registrant is not a closed-end management investment company.
ITEM 8 – Portfolio Managers of Closed-End Management Investment Companies
Not applicable to this Registrant, insofar as the Registrant is not a closed-end management investment company.
ITEM 9 – Purchases of Equity Securities by Closed-End Management Investment Company and Affiliated Purchasers
Not applicable to this Registrant, insofar as the Registrant is not a closed-end management investment company.
ITEM 10 – Submission of Matters to a Vote of Security Holders
There have been no material changes to the procedures by which shareholders may recommend nominees to the Registrant’s board of trustees since the Registrant last submitted a proxy statement to its shareholders. The procedures are as follows. The Registrant has a nominating and governance committee comprised solely of persons who are not considered ‘‘interested persons’’ of the Registrant within the meaning of the Investment Company Act of 1940, as amended. The committee periodically reviews such issues as the board’s composition, responsibilities, committees, compensation and other relevant issues, and recommends any appropriate changes to the full board of trustees. While the committee normally is able to identify from its own resources an ample number of qualified candidates, it will consider shareholder suggestions of persons to be considered as nominees to fill future vacancies on the board. Such suggestions must be sent in writing to the nominating and governance committee of the Registrant, c/o the Registrant’s Secretary, and must be accompanied by complete biographical and occupational data on the prospective nominee, along with a written consent of the prospective nominee for consideration of his or her name by the nominating and governance committee.
ITEM 11 – Controls and Procedures
| (a) | The Registrant’s Principal Executive Officer and Principal Financial Officer have concluded, based on their evaluation of the Registrant’s disclosure controls and procedures (as such term is defined in Rule 30a-3 under the Investment Company Act of 1940), that such controls and procedures are adequate and reasonably designed to achieve the purposes described in paragraph (c) of such rule. |
| | |
| (b) | There were no changes in the Registrant’s internal controls over financial reporting (as defined in Rule 30a-3(d) under the Investment Company Act of 1940) that occurred during the Registrant’s semi-annual period covered by this report that has materially affected, or is reasonably likely to materially affect, the Registrant’s internal control over financial reporting. |
ITEM 12 – Exhibits
| (a)(1) | Not applicable for filing of semi-annual reports to shareholders. |
| | |
| (a)(2) | The certifications required by Rule 30a-2 of the Investment Company Act of 1940 and Sections 302 and 906 of the Sarbanes-Oxley Act of 2002 are attached as exhibits hereto. |
SIGNATURES
Pursuant to the requirements of the Securities Exchange Act of 1934 and the Investment Company Act of 1940, the Registrant has duly caused this report to be signed on its behalf by the undersigned, thereunto duly authorized.
| | LIMITED TERM TAX-EXEMPT BOND FUND OF AMERICA |
| | |
| | By__/s/ Kristine M. Nishiyama____________________ |
| | Kristine M. Nishiyama, Executive Vice President and Principal Executive Officer |
| | |
| | Date: March 31, 2020 |
Pursuant to the requirements of the Securities Exchange Act of 1934 and the Investment Company Act of 1940, this report has been signed below by the following persons on behalf of the Registrant and in the capacities and on the dates indicated.
| By__/s/ Kristine M. Nishiyama_________________ |
Kristine M. Nishiyama, Executive Vice President and Principal Executive Officer |
| |
| Date: March 31, 2020 |
| By ___/s/ Brian C. Janssen __________ |
Brian C. Janssen, Treasurer and Principal Financial Officer |
| |
| Date: March 31, 2020 |